unece training workshop on dissemination of mdg indicators and statistical information
DESCRIPTION
Measuring and Communicating Data Quality. UNECE Training Workshop on Dissemination of MDG Indicators and Statistical Information Astana, Kazakhstan 23 – 25 November 2009 Steven Vale, UNECE. Contents. What is quality? How can we measure quality? How should we report and communicate quality?. - PowerPoint PPT PresentationTRANSCRIPT

United Nations Economic Commission for EuropeStatistical DivisionUnited Nations Economic Commission for EuropeStatistical Division
UNECE Training Workshop on Dissemination ofMDG Indicators and Statistical Information
Astana, Kazakhstan 23 – 25 November 2009
Steven Vale, UNECE
Measuring and Communicating Data Quality

Steven Vale - UNECE Statistical Division Slide 2
What is quality?
How can we measure quality?
How should we report and communicate quality?
Contents

Steven Vale - UNECE Statistical Division Slide 3
Which is the Best Quality?

Steven Vale - UNECE Statistical Division Slide 4
Definition of Quality
International StandardISO 9000/2005 defines quality as;
'The degree to which a set of inherent characteristics fulfils requirements.’
Steven Vale - UNECE Statistical Division Slide 5
What Does This Mean?Whose requirements?
• The user of the goods or servicesA set of inherent characteristics?
• Users judge quality against a set of criteria reflecting the different characteristics of the goods or services
So quality is all about providing goods and services that meet the needs of users (customers)
Steven Vale - UNECE Statistical Division Slide 6
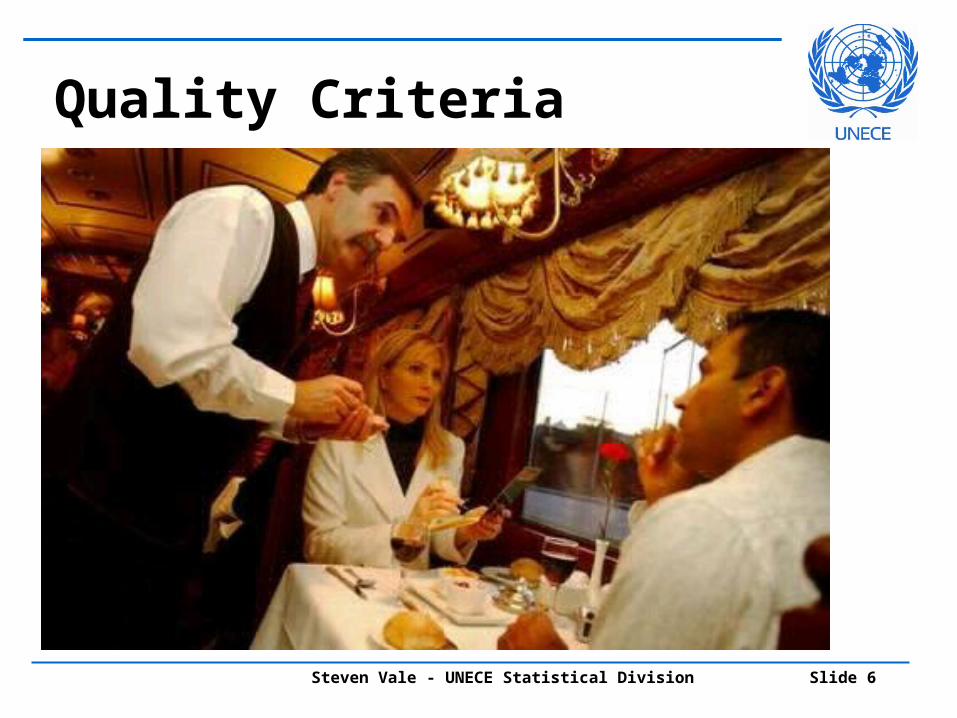
Quality Criteria
Steven Vale - UNECE Statistical Division Slide 7
Quality Criteria for StatisticsDifferent statistical organisations use
different criteria - but lists of criteria are quite similar
UNECE list:Relevance ComparabilityAccuracy ClarityTimeliness AccessibilityPunctuality

Steven Vale - UNECE Statistical Division Slide 8
RelevanceAre the statistics that are produced
needed?Are the statistics that are needed
produced?Do the concepts, definitions and
classifications meet user needs?

Steven Vale - UNECE Statistical Division Slide 9
Accuracy
The closeness of statistical estimates to true values
In the past: Quality = AccuracyNow accuracy is just one part of
quality
Steven Vale - UNECE Statistical Division Slide 10
TimelinessThe length of time between data
being made available and the event or phenomenon they describe
PunctualityThe time lag between the actual
delivery date and the promised delivery date

Steven Vale - UNECE Statistical Division Slide 11
ComparabilityThe extent to which differences are
real, or due to methodological or measurement differences• Comparability over time• Comparability through space (e.g.
between countries / regions)• Comparability between statistical domains
(sometimes referred to as coherence)

Steven Vale - UNECE Statistical Division Slide 12
AccessibilityThe ways in which users can obtain or
benefit from statistical services (pricing, format, location, language etc.)
ClarityThe availability of additional material
(e.g. metadata, charts etc.) to allow users to understand outputs better

Steven Vale - UNECE Statistical Division Slide 13
Importance of AccessibilityNot just about making data available on
the Internet or in a book• Passive accessibility
Accessibility is about bringing data to users in an understandable way, opening a dialogue with those users, and ensuring that their information needs are met• Active accessibility

Steven Vale - UNECE Statistical Division Slide 14
Accessibility Should Include:
CommunicatingMarketingInterpreting“Story-telling”InformingEducating

Steven Vale - UNECE Statistical Division Slide 15
Accessibility and VisualizationGood visualizations make data accessible
to many more usersBad visualizations are unhelpful /
misleading“Self-service” visualization needs to be
simple, with guidance to help users get meaningful results
“Ready-made” visualizations can be more complex, tailored to specific data sets
Steven Vale - UNECE Statistical Division Slide 16
Is it more cost-effective to:• develop “ready-made” graphics, or• offer users more “self-service” functionality?
Many users don’t have the time or knowledge to produce good visualizations
Advanced users have access to their own visualization and analysis tools
Accessibility and Visualization
Steven Vale - UNECE Statistical Division Slide 17
Importance of ClarityClarity is all about explaining dataDo current explanatory notes help?
• Often written by specialists for specialists• Full of jargon• Too long• Too boring!
Simplified, plain-text versions needed

Steven Vale - UNECE Statistical Division Slide 18
Other ConsiderationsCost / efficiencyIntegrity / trustReputation of the organizationProfessionalism
• Adherence to international standards (e.g. UN Fundamental Principles of Official Statistics)

Steven Vale - UNECE Statistical Division Slide 19
Quality is not just about outputs
To have good outputs we need to have good inputs and processes, so we need to think about the quality of these as well
Input Process Output
Steven Vale - UNECE Statistical Division Slide 20
Quality of Inputs
TimelinessCompleteness – are there any
missing units or variables?Comparability with other sourcesQuality check survey?Knowledge of the source is vital!
Steven Vale - UNECE Statistical Division Slide 21
Quality of Processing
Quality of matching / linkingOutlier detection and treatmentQuality of data editingQuality of imputationKeep raw data / metadata to refer
back to if necessary
Steven Vale - UNECE Statistical Division Slide 22
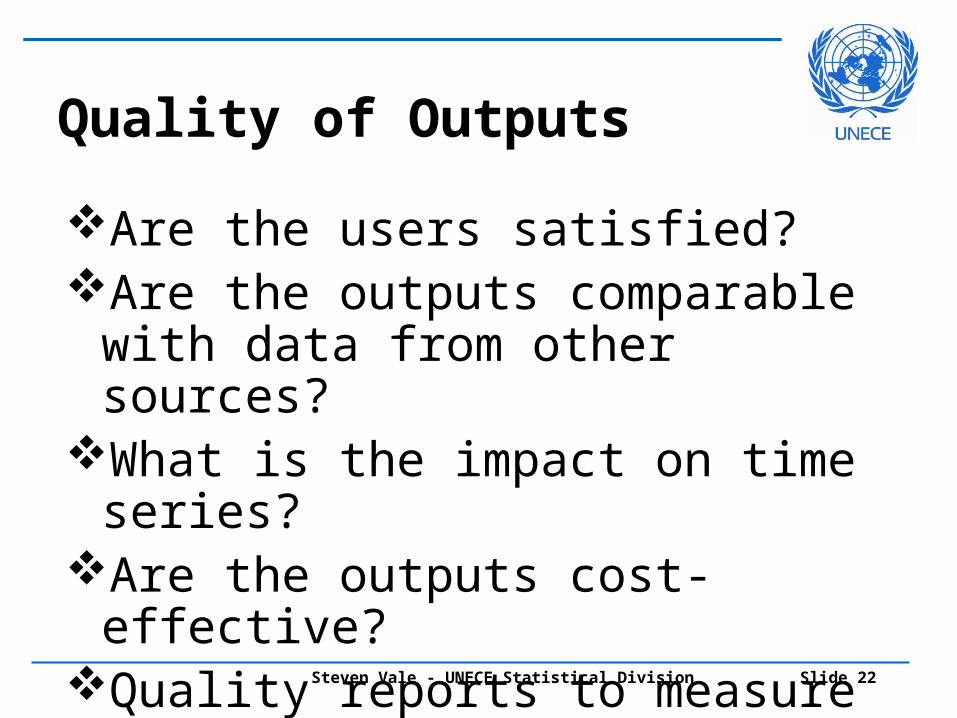
Quality of Outputs
Are the users satisfied?Are the outputs comparable with
data from other sources?What is the impact on time series?Are the outputs cost-effective?Quality reports to measure and
communicate differences?
Steven Vale - UNECE Statistical Division Slide 23
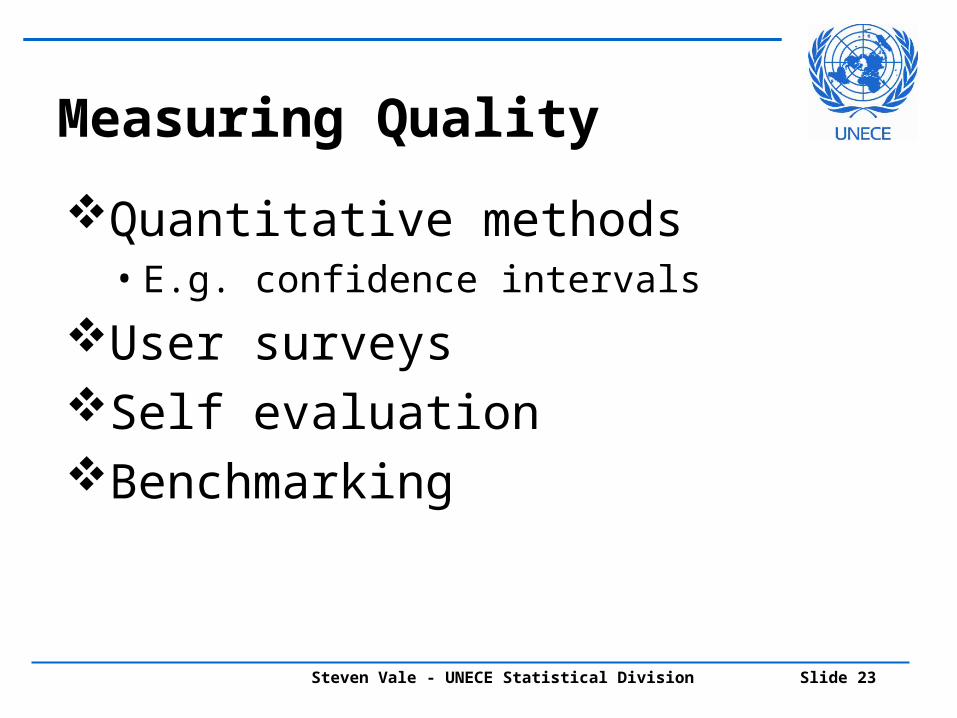
Measuring QualityQuantitative methods
• E.g. confidence intervalsUser surveysSelf evaluationBenchmarking

Steven Vale - UNECE Statistical Division Slide 24
Quantitative Measures
The tops of the bars indicate estimated values and the red lines represent the confidence intervals surrounding them.

Steven Vale - UNECE Statistical Division Slide 25
UNECE Database User Survey
Launched each autumn on database web site
10 questions150 responses
(target 100)

Steven Vale - UNECE Statistical Division Slide 26
Design a user survey with up to 10 questions for users of your web site
20 minutes
Exercise

Steven Vale - UNECE Statistical Division Slide 27
1. Type of user
2. Frequency of use
3. Location (country)
4. Type of data
5. Database relevance
6. Timeliness
UNECE User Survey Questions
Steven Vale - UNECE Statistical Division Slide 28
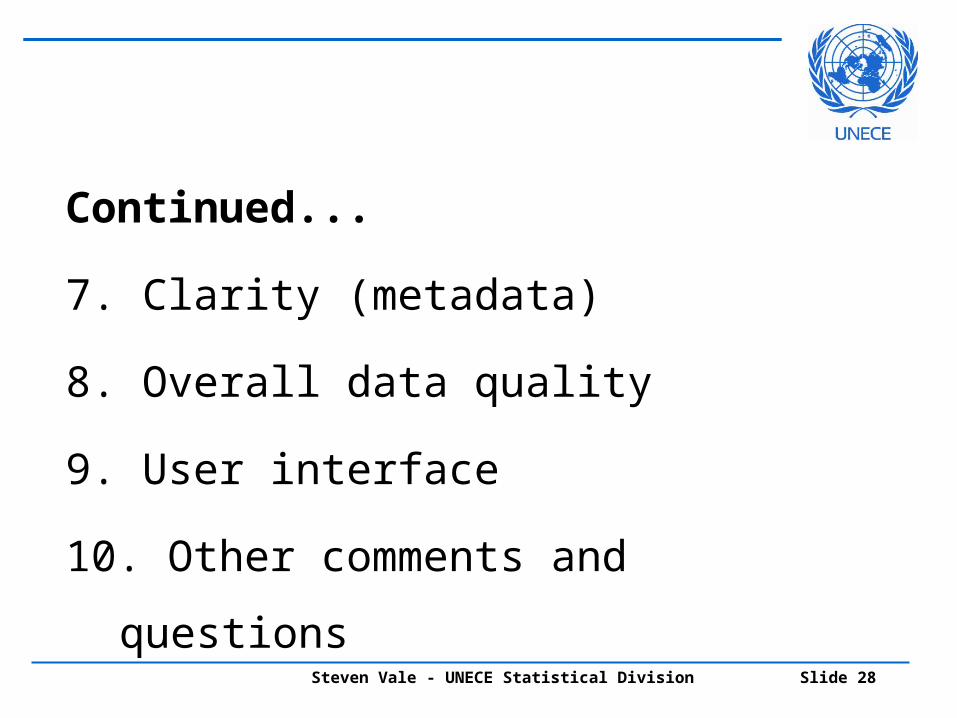
Continued...
7. Clarity (metadata)
8. Overall data quality
9. User interface
10. Other comments and questions

Results:Type ofuser
International organization
/ NGO
Student
Academic / research
National government
National Statistical
OfficeOtherIndividual
Private businessMedia

Results:Frequencyof use

Results:Location
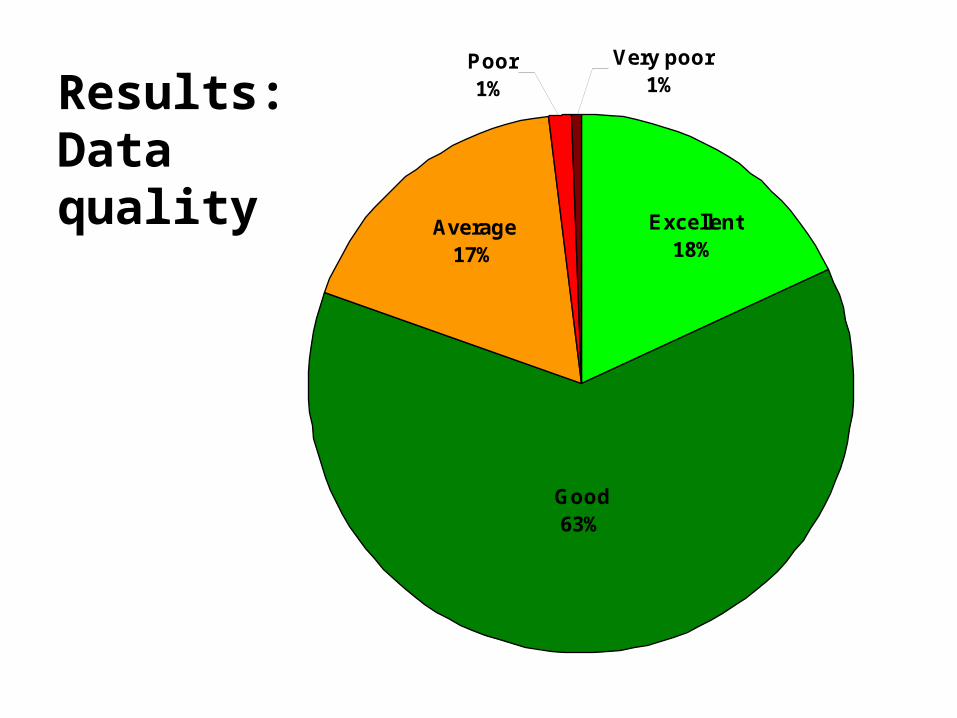
Results:Data quality
Poor1%
Very poor1%
Average17%
Excellent18%
Good63%

Results:Userinterface
Poor1%
Very poor1%
Average23%
Excellent15%
Good60%

Steven Vale - UNECE Statistical Division Slide 34
Improving Our ServicesBetter timeliness of dataNew “Country Overview” data cube to give
quick access to key indicatorsMore content in RussianImproved user interfaceMore and better metadataStatistical literacy

Steven Vale - UNECE Statistical Division Slide 35
Relatively quick and cheapIs it sufficiently objective?Needs a standard framework to ensure
comparability of quality assessments• Eurostat DESAP check list:
http://epp.eurostat.ec.europa.eu/portal/page/portal/quality/documents/desap%20G0-LEG-20031010-EN.pdf
Self-evaluation

Steven Vale - UNECE Statistical Division Slide 36
Comparing data values or data production processes between two sources
Differences can be studied to try to find ways to improve quality
Benchmarking
Steven Vale - UNECE Statistical Division Slide 37
Benchmarking Between Countries Fairly cheap and easy way to get ideas
on how to improve statistical processes Mutual benefit - “win - win” Helps to improve international
cooperation May lead to joint development projects

Steven Vale - UNECE Statistical Division Slide 38
Quality Reports• Summary – “traffic light” indicator
Red – Serious quality issues, read thequality report before using
Orange – Caution, do not use for important decisions without reading the quality report
Green – Good quality• Intermediate – short quality report
(1000 words maximum)• Detailed – full quality report
Communicating Quality

Steven Vale - UNECE Statistical Division Slide 39
Should cover all components of quality
Should be written for the user
Should be easily accessible
Should follow a standard template
Detailed Quality Reports
Steven Vale - UNECE Statistical Division Slide 40
Exercise
What should be covered in a detailed quality report?• List the topics that should be included
10 minutes

Steven Vale - UNECE Statistical Division Slide 41
Introduction to the statistical process and its outputs
RelevanceAccuracyTimelinessPunctualityAccessibilityClarity
ESQR Contents (1)

Steven Vale - UNECE Statistical Division Slide 42
ComparabilityTrade-offs between quality componentsAssessment of User Needs and
PerceptionsPerformance, Cost and Respondent
BurdenConfidentiality, Transparency and SecurityConclusion
ESQR Contents (2)

Steven Vale - UNECE Statistical Division Slide 43
Quality is all about meeting user needsThere are many different aspects to
quality, some of which may be in conflict• E.g. Timeliness versus Accuracy
There are various ways of measuring quality; user views are important
Quality should be communicated to users in a way they can understand
Summary

Steven Vale - UNECE Statistical Division Slide 44
Which is the Best Quality?
It depends what the user needs!

Steven Vale - UNECE Statistical Division Slide 45
Questions?