unemployment and income distribution - reserve … and income distribution ann harding and sue...
TRANSCRIPT

Unemployment and Income Distribution
Ann Harding and Sue Richardson*
1. IntroductionUnemployment is widely regarded as the foremost economic problem currently
facing the Australian economy. Among its many evils, high unemployment – especiallylong-term unemployment – has become a major source of poverty. The unemployed havenow replaced the aged as the predominant group in poverty in Australia (King 1997). Italso contributes to the rising levels of anxiety about the increasing risks faced byemployed people of involuntary loss of their jobs.1 Psychologists have concluded thatthe pain of unemployment arises from two sources: ‘lack of money and lack of structureand purpose in life’ (Feather 1997, p. 39). Detailed interviews with unemployed peoplehave ‘revealed again and again the limiting effects of loss of income and shortage ofmoney on many aspects of family life and the negative effects of relative poverty onpsychological well-being … In the absence of financial strain, the negative effects ofunemployment were halved’ (Feather 1997, p. 40).2
The persistence of high levels of unemployment in Australia and in many Europeancountries has been attributed to ‘structural rigidities that reduce employment opportunitiesfor low-skill workers’ (OECD 1996, p. 22). ‘Structural rigidities’ include minimumwage laws, which are claimed to prevent the wage structure from responding to declinesin the relative demand for low-skill workers. Advocates of this view draw attention tothe fact that a number of countries which have had relative success in reducingunemployment also operate relatively unregulated labour markets and have experiencedsubstantial rises in inequality in the distribution of earnings, partly because of falls in payat the bottom. The United States, Canada, the United Kingdom and New Zealand aregiven as examples.3 The experience of these countries is contrasted with those of manyin the European Union, which have avoided the rising inequality but also have high andpersistent unemployment. Australia has experienced rising inequality, but not as muchas in the first group of countries and its wage structure is still relatively compressed. It
* The work on poverty rates was supported by ARC Grant No. A79803294.
1. See Richardson (1998) for evidence of both the rising risk and the rising feelings of insecurity in theemployed workforce.
2. Recent work by Theodossiou (1998) concludes that the psychological health of unemployed people issignificantly worse than that of low-paid workers, with middle-aged people and women less psychologicallydamaged by unemployment than younger and older age groups and men.
3. Gregory (1996) has shown that low-wage jobs grew proportionately as fast in Australia as in the US,despite the fact that in Australia, the minimum levels of wages were higher both relatively and absolutelythan in the US. Hancock (1998) quotes data that show that there is no correlation between the degree ofdispersion in the wage structure and the employment to population ratio among OECD countries.

140 Ann Harding and Sue Richardson
has also experienced high and persistent unemployment, but below that of many of theEuropean countries.
A summary view of the issues may be expressed as follows. Unemployment is, formost, a psychologically distressing state. Much, though not all, of the distress comesfrom the low income which it entails. The unemployed are much poorer than arelow-wage workers. Unemployment is persisting because wages are prevented fromfalling to levels that would substantially increase demand for low-skill workers.Australia should therefore respond to its high unemployment by reducing minimumwages and other conditions on the employment of low-skill workers.
While the authors do not necessarily share this view of the world, it provides thebackground against which this paper has been framed. Section 2 of the paper recountsbriefly what is known about the changes in income and earnings inequality in Australiaover recent decades. The focus then moves to an analysis of the incomes and poverty ratesof the unemployed, based on the 1994/95 income survey data produced by the AustralianBureau of Statistics. Section 3 describes key characteristics of this data and themethodology. Section 4 paints a picture of the incomes and other characteristics of theunemployed and contrasts this with the characteristics of wage and salary earners.Section 5 examines the poverty rates of the unemployed and other groups within theAustralian population. Section 6 contrasts the incomes of unemployed individuals andfamilies with those of their peers within the labour force and with those of the populationmore generally. Section 7 compares the incomes of the unemployed with the incomes oflow-wage workers. Section 8 concludes and also speculates about whether a wage cut forlow-wage workers would appear likely to reduce overall inequality and the extent of lowincomes.
2. Earnings and Income Distribution TrendsA substantial number of studies have found an increase in the inequality of the
distribution of earnings in Australia during the past two decades or so. For example,Borland and Wilkins (1996) concluded that earnings dispersion had increased for maleand female full-time employees between 1975 and 1994, and that real earnings had fallenfor male employees with earnings below the 30th percentile during the same period. Inmore recent work, Borland and Kennedy (1998) have again found an increase in earningsinequality for full-time employees between 1982 and 1994. Interestingly, they concludethat rates of return to education appear to have fallen, and that the growth in inequalityhas been due to increases in earnings inequality within groups of workers with the sameeducational attainment and potential years of labour market experience.
Harding (1997) also found a rise in earnings inequality between 1982 and 1994, withdeclines in the real earnings of both male and female full-time employees with earningsbelow 50 per cent of the full-time median wage – but very sharp real increases for thosewith earnings above 11/2 times the median wage. Other studies have also pointed togrowing earnings inequality (Gregory 1993; King et al. 1992).
How does the rate of growth in earnings inequality in Australia compare with that ofother industrialised countries? A range of studies have suggested that the growth inearnings inequality has been much sharper in the US and the UK but has been lower in

141Unemployment and Income Distribution
Sweden, Finland, France and Germany. The Australian experience appears to matchwith a group of countries (including Canada, Israel and the Netherlands) where increasesin earnings dispersion have been significant, but not as substantial as in the UK and theUS (Gottschalk and Joyce 1997; Borland and Wilkins 1996).
Has growing inequality in the distribution of earnings among individuals alsotranslated into growing inequality in the distribution of income among families?Although earnings are important – because they are the key component of the averagefamily’s income – most analysts of income inequality look at trends in the distributionof disposable income, which is the amount of income families have left to spend afterpaying income tax. A number of studies of income distribution trends in the 1980s inAustralia concluded that the distribution of disposable income among families hadbecome more unequal (Saunders 1993; Harding 1996; EPAC 1995). However, a morerecent study spanning a longer time period indicated that there had been no change in thedegree of inequality of disposable income between 1982 and 1994, according toaggregate measures of inequality (Harding 1997). This apparent stability in overallinequality, however, disguised real income increases for those families at the top andbottom of the income distribution – and real income losses for the middle 40 per cent ofAustralians.
A recent international study of 15 countries during the 1980s and the early 1990s,concluded that the increase in disposable-income inequality had been relatively high inAustralia in comparison with other countries (Gottschalk and Smeeding 1997, p. 27).This study concluded that the percentage increase in the Gini coefficient for Australiahad only been exceeded by that for the UK, Sweden and Denmark. However, data forAustralia were only available until 1989 and, as suggested above, it is possible that thistrend may not have continued during the 1990s. As in Australia, a number of internationalstudies have also pointed to the ‘disappearing middle class’ (Burkhauser et al. 1996,although see also Wolfson 1997).
3. Data and MethodologyThe data used for this study came from the 1994/95 Survey of Income and Housing
Costs (SIHC) confidentialised unit-record file, issued by the Australian Bureau ofStatistics. The survey contained individual records for almost 14 000 adults aged 15 ormore, belonging to 8 675 income units living in private dwellings. It should beappreciated that this is not a large sample size, and that relatively large sampling erroris associated with estimates for small population subgroups. All records are weighted bythe ABS, so that the results can be grossed up to arrive at estimates for the wholepopulation.
The SIHC was conducted continuously throughout 1994/95, and the estimates forcurrent weekly income can thus refer to any month during this financial year. Theperiod-income estimates refer to annual income during the 1993/94 financial year. Tomaintain comparability with earlier studies of low-wage workers undertaken by theauthors, negative income-unit incomes were reset to zero and income units with zeroannual incomes were excluded entirely. Income units regarded by the ABS as being outof scope for period-income analysis were also excluded.

142 Ann Harding and Sue Richardson
The measure of gross weekly cash income is defined as regular and recurring cashreceipts before the deduction of tax or any other items. It includes wages and salaries,investment income, and government cash transfers such as unemployment payments.Receipts excluded from income because they were not regular and recurring includedincome-in-kind, inheritances and capital gains and losses. Income tax was imputed bythe ABS.
A decision has to be made about how widely income is assumed to be shared betweenindividuals. The income unit used in this study is the ABS income unit, which is arestricted family grouping which assumes that income is shared between partners incouple families and between parents and dependent children. Dependent children aredefined as children aged less than 15 years or full-time students aged 15–24 years andstill living at home. An unemployed 17-year-old son still living in the parental home istherefore defined as a separate income unit. The four types of income units are thussingle-person units, couples with or without dependent children, and sole-parent incomeunits. Because ‘income unit’ is an unwieldy term, the term ‘family’ is used throughoutthe rest of this paper instead of ‘ABS income unit’.
When comparing the living standards of the unemployed with those of the rest of thepopulation, it is important to take account of differences in family size and composition.Thus, most people would not assume that a single wage and salary earner with an incomeof $300 a week experiences the same standard of living as an unemployed couple withsix children with a family income of $300. One standard method is to use equivalencescales, which estimate how much more (or less) income families with variouscharacteristics require to achieve the same standard of living as a ‘benchmark’ family.In this study, the OECD equivalence scales were applied to the after-income-tax incomesof income units, in order to better assess the relative living standards of the unemployed.The scales used attribute a value of 1.0 to the reference person in the income unit, 0.7 tothe second person, and 0.5 to third and subsequent persons. Thus, an income unitconsisting of a couple with two dependent children was assumed to need 2.7 times asmuch income as a single person in order to achieve the same standard of living. Thisequivalence scale can be criticised on the grounds that it takes no account of thedifferential costs facing those in different labour-market or housing-tenure states. It hasthe advantage, however, of being relatively transparent.
Section 5 examines the poverty rates of the unemployed. Poverty was defined as asituation where the income of the income unit fell below half equivalent median currentdisposable income. (Disposable income means after the payment of income tax.) Two‘poverty’ measures were constructed, based on the median incomes of the entirepopulation, and of only those living in income units with a member in the labour force.It should be appreciated that this is an entirely arbitrary definition of poverty (althoughit is one that has been used in a number of international studies). In the Australian context,this measure should arguably be regarded as a measure of inequality rather than ofpoverty, and the term ‘poverty’ is used mainly as a shorthand method of saying ‘incomebelow half equivalent median current disposable income’.
In Section 6, the income distribution for unemployed and other persons is analysed.In order to allocate every person in the population to a decile of income, each individualwas assumed to enjoy a standard of living measured by the equivalent disposable income

143Unemployment and Income Distribution
of the income unit to which they belonged. When constructing the deciles, children wereincluded: the bottom decile thus consists of the 10 per cent of the population with thelowest equivalent incomes, rather than the 10 per cent of persons aged 15 or more withthe lowest incomes (in other words, allocation to deciles was based on ‘personweighting’).
Unemployed persons were basically defined as persons aged 15 or more who were notemployed during the reference week and had actively looked for full- or part-time workat any time in the four weeks up to the end of the reference week, or who were waitingto be called back to a job from which they had been stood down without pay for less thanfour weeks up to the end of the reference week, for reasons other than bad weather or plantbreakdown. This definition is the same as that used in the ABS Labour Force Surveyseries. In this study, long-term unemployed are categorised as those who have beenunemployed continuously for 39 weeks or more.
4. Incomes and Other Characteristics of the UnemployedThere has been extensive analysis of the characteristics of the unemployed. For
example, as shown in the Appendix, the unemployed tend to be younger, migrants andless well educated (see also ABS 1993). The Appendix enables us to see the familyrelationships of unemployed people and to compare these with wage earners. About onethird of unemployed men are husbands with dependent children and this is reasonablysimilar to the proportion of this group among wage earners. Wives with dependentchildren, in contrast, are somewhat under-represented among the unemployed. It maywell be that women with dependent children who cannot find a job simply withdraw fromthe workforce and are numbered among the hidden unemployed. Children living at homeare prominent among the unemployed – both those who are full-time students and thelarger number who are not.4
Table 1 provides related and additional information on the unemployed which isderived from the Survey of Income and Housing unit-record data for 1994–95. Theadvantage of this data set is that it enables us to examine not just the characteristics, butalso the income – both personal and family – of unemployed workers, and to comparetheir situation with others, such as workers.
Table 1 provides information on all unemployed workers, on those who have beenunemployed for 39 weeks or more (described as long-term unemployed), and on all wageand salary earners. The data are disaggregated by gender. We caution readers, however,that the sample size becomes unreliably small when we disaggregate the long-termunemployed in particular. The absolute number of men and women within the ABSsample in each of the employment categories is shown in the second row. The estimatednumber they represent for the whole population is shown in the first row. For example,we estimate that there were 107 000 long-term unemployed women in 1994/95, and thisestimate is based on 108 observations from the unit-record data set.
4. Those who met the definition of unemployment outlined in Section 3 were counted by the ABS asunemployed, even if they were engaged in full-time study.

144 Ann Harding and Sue RichardsonT
able
1: I
ncom
e an
d O
ther
Cha
ract
eris
tics
of U
nem
ploy
ed a
nd W
age
and
Sal
ary
Ear
ners
1994
/95
Une
mpl
oyed
Long
-ter
m u
nem
ploy
edA
ll w
age
and
sala
ry w
orke
rs
Fem
ale
Mal
eA
llF
emal
eM
ale
All
Fem
ale
Mal
eA
ll
Num
ber
wei
ghte
d (’0
00)
298
437
735
107
214
321
2 87
93
795
6 67
4
Num
ber
of u
nwei
ghte
d ob
serv
atio
nsin
sam
ple
surv
ey30
043
073
010
819
530
32
923
3 70
06
623
Prin
cipa
l sou
rce
of curr
ent f
amily
inco
me
(per
cen
t):N
o in
com
e4(a
)5(a
)4
1(a)
2(a)
2(a)
00
0W
age
and
sala
ry31
1421
15(a)
1012
9397
95O
wn
busi
ness
22(a)
21(a
)1(a
)1(a
)4
12
Gov
ernm
ent c
ash
bene
fits
5873
6778
8482
31
2O
ther
5(a)
65
5(a)
3(a)
3(a)
1(a)
11
Prin
cipa
l sou
rce
of p
erio
d (a
nnua
l) fa
mily
inco
me
(per
cen
t):N
o in
com
e0(a
)2(a
)1(a
)0(a
)1(a
)1(a
)0(a
)0(a
)0(a
)
Wag
e an
d sa
lary
4939
4323
1920
9093
92O
wn
busi
ness
4(a)
2(a)
31(a
)0
04
23
Gov
ernm
ent c
ash
bene
fits
4553
5073
7775
44
4O
ther
2(a)
4(a)
33(a
)3(a
)3(a
)1
11
Ave
rage
per
sona
l inc
ome
from
gov
t cas
h be
nefit
s$9
1$1
21$1
09$1
23$1
49$1
41$1
1$8
$10
Ave
rage
gro
ss p
erso
nal i
ncom
e$9
6$1
39$1
22$1
29$1
61$1
50$4
61$6
72$5
81
Ave
rage
fam
ily in
com
e fr
om g
ovt c
ash
bene
fits
$129
$175
$156
$163
$207
$192
$22
$21
$21
Ave
rage
gro
ss fa
mily
inco
me
$472
$304
$372
$384
$298
$326
$941
$903
$920
Ave
rage
equ
ival
ent d
ispo
sabl
e fa
mily
inco
me
$314
$256
$279
$298
$264
$276
$684
$674
$678
Pro
port
ion
of a
ll pe
rson
s re
ceiv
ing
unem
ploy
men
t allo
wan
ces
UA
(pe
r ce
nt)
4067
5663
8074
––
–
Pro
port
ion
of m
arrie
d pe
rson
sre
ceiv
ing
UA
(per
cen
t)22
7152
4080
69–
––
Ave
rage
UA
rec
eive
d by
all
unem
ploy
ed$5
3$9
9$8
1$8
7$1
20$1
10–
––
Ave
rage
UA
for
only
thos
e re
ceiv
ing
UA
$135
$148
$144
$139
$151
$148
––
–
(a)
Den
otes
less
than
20
000
wei
ghte
d ob
serv
atio
ns, o
r a
sam
plin
g er
ror
grea
ter
than
app
roxi
mat
ely
25 p
er c
ent.

145Unemployment and Income Distribution
One of the most striking – but not unexpected – results in Table 1 is that theunemployed have much lower personal and family incomes than their wage and salaryearner peers. For example, the average personal income of the unemployed of $122 aweek is about one-fifth of the average $581 received by wage and salary earners.Interestingly, the personal current incomes of the long-term unemployed are higher thanthe personal incomes of all unemployed ($150 versus $122 a week). In part this reflectsthe waiting periods associated with the receipt of unemployment allowances from thegovernment. While three-quarters of the long-term unemployed receive unemploymentallowances, only just over half of all the unemployed do so (Table 1).
There is less disparity between the gross incomes of the families in which theunemployed and wage and salary earners live, with wage and salary families enjoyingincomes about 2.5 times greater than those of families with an unemployed member.Gross family income, however, tells us little about relative living standards, largelybecause it takes no account of the number of people each family has to feed and house.‘Equivalent disposable family income’ moves us closer towards a comparable measureof living standards, and indicates that the average equivalent income of wage and salaryfamilies of $678 is about 2.4 times higher than the average income of unemployedfamilies.
Among unemployed individuals, there are marked differences in both personal andfamily incomes by gender. The personal incomes of unemployed men are about45 per cent higher than those of unemployed women, presumably because a greaterproportion of unemployed women live in families where their husband earns an income– thereby rendering them ineligible for unemployment assistance, which is means-testedon a family basis. On the other hand, the family incomes of unemployed women are about50 per cent higher than those of unemployed men, again reflecting the increasedprobability of a second income earner in the family for women (Figure 1).
These differences in personal and family income by gender are both less marked forthe long-term unemployed, as a result of long-term unemployed women being less likelyto live in a family where the husband earns a reasonable income. As Table 1 indicates,being married makes little difference to the probability of receiving unemploymentassistance for men: for example, 80 per cent of both married and all long-termunemployed men receive some unemployment assistance from the government. Incontrast, being married has a substantial negative impact on the likelihood of unemployedwomen receiving unemployment allowance – but this impact is much less for long-termunemployed women.
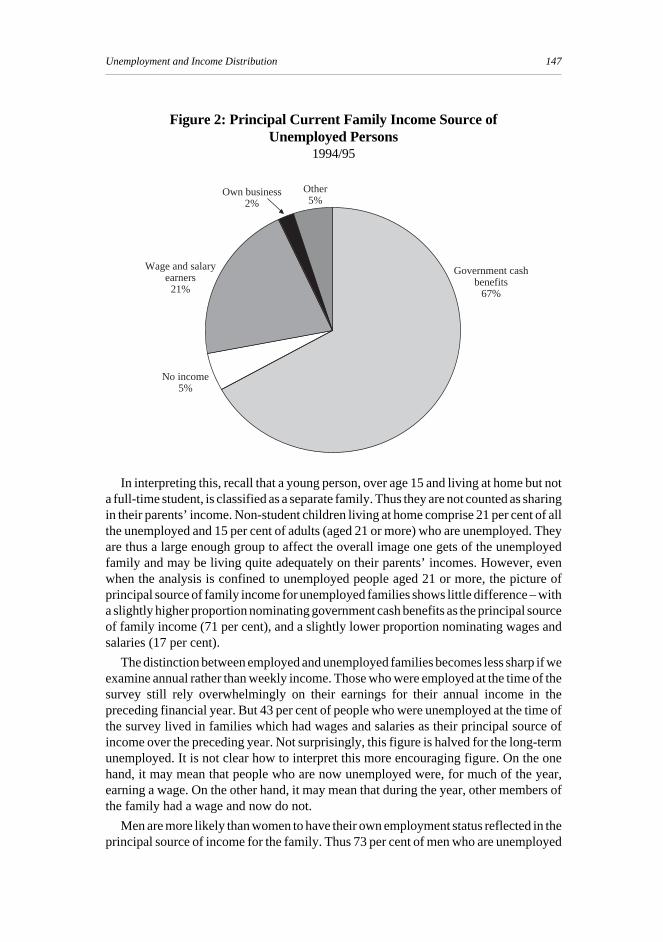
Table 1 shows that the sources of income for the family in which unemployed peoplelive are quite different from the sources of income for employees. Not surprisingly,wages and salaries are the overwhelming source of current family income for employees.Income from self-employment, from government cash benefits and from all othersources (e.g. interest and dividends) together are the main source of current weeklyincome for just 5 per cent of the families which have a wage earner: the other 95 per centrely primarily on wages. In contrast, only about 21 per cent of the unemployed and12 per cent of the long-term unemployed live in families which rely principally on wageand salary income. Instead, they mostly rely on government cash welfare benefits – themore so if they are long-term unemployed (Figure 2). Four out of five of the long-term

146 Ann Harding and Sue Richardson
unemployed lived in families which had government benefits as their principal sourceof income in the survey week. This contrasts starkly with the overwhelming reliance ofemployees on wages and salaries.
There is no inevitability about these figures. A person who is classified as employedmay be working only a few hours a week and live in a family in which they and othermembers draw social welfare payments or are self-employed. The earned wage may thencontribute only a small fraction of the family income.5 And a person who is unemployedmay live in a family in which other members have full-time jobs, and hence the family’smain source of income is from the wages earned. What the figures tell us is that thepreceding relations are not common. People who are employed, even part-time,overwhelmingly live in families which support themselves from their own earnings.People who are unemployed do not. Unemployed and employed people are not much tobe found in the same family. This separation of employed and unemployed families is,however, more true for men than it is for women. One-third of unemployed women livein families where wages are the principal source of current income, whereas for men thissituation is only half as common.
Figure 1: Average Personal and Gross Family Incomes of Unemployedand Long-term Unemployed Persons
By gender; 1994/95
0
50
100
150
200
250
300
350
400
450
0
50
100
150
200
250
300
350
400
450
$/week
Women Men Long-term,women
Long-term,men
$/weekPersonal income
Family income
5. For example, in a married couple family a person earning minimum wages would have to work almost20 hours a week to contribute an amount which is more than half their combined unemployment benefit– i.e. to have wages as their principal source of income.
147Unemployment and Income Distribution
In interpreting this, recall that a young person, over age 15 and living at home but nota full-time student, is classified as a separate family. Thus they are not counted as sharingin their parents’ income. Non-student children living at home comprise 21 per cent of allthe unemployed and 15 per cent of adults (aged 21 or more) who are unemployed. Theyare thus a large enough group to affect the overall image one gets of the unemployedfamily and may be living quite adequately on their parents’ incomes. However, evenwhen the analysis is confined to unemployed people aged 21 or more, the picture ofprincipal source of family income for unemployed families shows little difference – witha slightly higher proportion nominating government cash benefits as the principal sourceof family income (71 per cent), and a slightly lower proportion nominating wages andsalaries (17 per cent).
The distinction between employed and unemployed families becomes less sharp if weexamine annual rather than weekly income. Those who were employed at the time of thesurvey still rely overwhelmingly on their earnings for their annual income in thepreceding financial year. But 43 per cent of people who were unemployed at the time ofthe survey lived in families which had wages and salaries as their principal source ofincome over the preceding year. Not surprisingly, this figure is halved for the long-termunemployed. It is not clear how to interpret this more encouraging figure. On the onehand, it may mean that people who are now unemployed were, for much of the year,earning a wage. On the other hand, it may mean that during the year, other members ofthe family had a wage and now do not.
Men are more likely than women to have their own employment status reflected in theprincipal source of income for the family. Thus 73 per cent of men who are unemployed
Figure 2: Principal Current Family Income Source ofUnemployed Persons
1994/95
Government cashbenefits
67%
No income5%
Wage and salaryearners
21%
Own business2%
Other5%

148 Ann Harding and Sue Richardson
live in income units which rely on government cash benefits, whereas this figure forunemployed women was 58 per cent. This is despite the fact that unemployed men aremore likely to be married than are unemployed women: a woman has a greater likelihoodof being a single parent and thus the only income earner for her income unit (Appendix).
Not only are government cash benefits the principal source of income for the majorityof families in which there is an unemployed person, but these benefits provide almost allof the personal income of unemployed people (Table 1 and Figure 3). Indeed, for thelong-term unemployed they provide 94 per cent of their personal income. And this isdespite the fact that only about half of unemployed people and three-quarters of thelong-term unemployed actually receive an unemployment allowance.6 In strikingcontrast, government cash benefits provide on average only 2 per cent of the currentpersonal income of people who have jobs. The welfare system is very tightly targeted andits beneficiaries are mostly those – individuals and families – who do not earn an incomefor themselves.
The figure for the average contribution of cash welfare payments to the incomes ofemployed families conceals the fact that for some such families these payments areindeed quite important. In their submission to the 1998 ‘Safety Net Review’ before the
Figure 3: Government Cash Benefits as a Proportion of Personal andFamily Income
1994/95
0
10
20
30
40
50
60
70
80
90
100
0
10
20
30
40
50
60
70
80
90
100
0
10
20
30
40
50
60
70
80
90
100
0
10
20
30
40
50
60
70
80
90
100
Per
cent
of
gros
s in
com
e
Female Male All Female Male All Female Male AllLong-term unemployedUnemployed Wage and salary earners
Personal income
Family income
6. Unemployed families with children usually receive family payments, in addition to any unemploymentallowances.

149Unemployment and Income Distribution
Australian Industrial Relations Commission, the Joint Governments show that forpeople who live in employed families, cash welfare payments are equal to 20 per cent ofthe private income of people in the bottom quintile of the income distribution. This dropsto 5 per cent for the second quintile and to virtually zero for the remaining families (JointGovernments 1998, p. 185, Table 11.1). Again, the cash benefits received are tightlytargeted to those at the bottom. But this does suggest that the difference betweenunemployed and low income employed families in their sources of income may not beas great as they appear to be when we look only at the average situation of all employedpeople.
In addition, it should be emphasised that this analysis has only taken account of thecash benefits received by unemployed families from the government. Families alsoreceive significant non-cash benefits from government, principally via their usage ofpublicly funded health, education and housing services. The above report, for example,also showed that the bottom quintile of wage and salary earner households received anestimated $252 a week in health, education and housing non-cash benefits – about2.7 times as much as the $93 received by the top quintile of households (JointGovernments 1998, p.187). While these figures did not deal with unemployed households,the results are suggestive (see also Johnson et al. 1995; Harding 1995a).
Whereas government cash benefits provide about the same proportion of own incomefor unemployed men and women (around 89 per cent for all, and 94 per cent for long-termunemployed), there is a substantial gender difference when we look at the contributionof these benefits to the income of the whole family. For unemployed women, governmentcash benefits contribute less than 30 per cent of the income of the family in which theylive. For unemployed men the figure is 58 per cent. Although the percentages are higher,the gender pattern is similar for the long-term unemployed. This again implies thatwomen are more likely than men to have another person in the income unit who is earningan income.
The data also enable us to observe the socioeconomic status of the geographic area inwhich workers and the unemployed live. Gregory and Hunter (1995) have shown thatthere has been a large increase in the geographic concentration of advantage anddisadvantage, so we would expect unemployed workers, especially the long-termunemployed, to be heavily concentrated in the bottom deciles of the ranking of areas bysocioeconomic status. Figure 4 shows the distribution of all wage earners, of allunemployed workers, and of long-term unemployed workers by SEIFA decile – ageographic measure of socioeconomic status constructed by the ABS.7 It shows thatthere is a concentration of unemployed workers in the lower SES deciles, and that thisis more severe for the long-term unemployed than for all unemployed. If you arelong-term unemployed, the chance that you live in an area which ranks in the lowest two
7. SEIFA deciles are computed by the ABS and included in the data set as a variable which may be associatedwith each individual. They are based on indicators of income, education, rented dwellings, lack of fluencyin English, and high unemployment for residents of geographic areas. Decile 1 represents the 10 per centof geographic areas which have the lowest average socioeconomic status of residents. The data arereported only for NSW, QLD, Victoria and WA, as sample numbers are too small in the other regions topreserve confidentiality. About 15 per cent of the sample is thus excluded.

150 Ann Harding and Sue Richardson
deciles is more than twice that of an employed person. The chance that you live in oneof the top two decile areas is less than half that of an employed person. But still,16 per cent of the unemployed (10 per cent of the long-term unemployed) live in the top20 per cent of areas. This compares with 26 per cent of employees.
We may conclude that the unemployed are not a random sample of the workforce, butneither are they remarkably different from it. While young people are noticeablyover-represented among the unemployed, unemployment – and especially long-termunemployment – can strike at any age. One-third of the unemployed and 44 per cent ofthe long-term unemployed are aged 35–54, and the age distribution of unemployment isremarkably similar for men and women.
The unemployed are more different in their education and ethnicity. They are muchmore likely than the workforce at large to have no post-school qualifications and to beimmigrants. They are also less likely to be married (even if we confine the comparisonto those over the age of 21). Whereas almost two-thirds of all employees are married, lessthan one-half of the unemployed are.
But the most distinctive thing about the unemployed is their source of income. Eventhough only 70 per cent of men and less than half of women who are unemployed receiveunemployment allowances, government cash benefits provide most of their personalincome and often the majority of the total income of the families in which they reside.The dominance of social welfare payments is even greater for the long-term unemployed.The contrast with those who have jobs – including part-time jobs – is striking. For both
Figure 4: SEIFA Decile of Unemployed and Wage and Salary Earners1994/95
1 2 3 4 5 6 7 8 9 101 2 3 4 5 6 7 8 9 100
2
4
6
8
10
12
14
16
18
0
2
4
6
8
10
12
14
16
18
0
2
4
6
8
10
12
14
16
18
0
2
4
6
8
10
12
14
16
18
Geographic socioeconomic status decileGeographic socioeconomic status decile
Unemployed
%%
Long-term unemployed
Wage and salary earners

151Unemployment and Income Distribution
individuals who have jobs and their families, government cash payments are a tiny partof their overall income.
5. Unemployment and PovertyFrom the evidence of the previous section we can be confident that, on average,
unemployed people have low incomes. Because of the means-tested character of theAustralian social welfare system, it is inevitable that people who rely upon it mostly haverelatively low incomes (even if it is possible for their asset position to be moderatelycomfortable). Table 2 displays a summary set of information, which examines the extentto which unemployed people and their families are in poverty. As noted earlier, we haveselected a totally arbitrary measure of poverty – half the equivalent median currentdisposable income of families – and enquire whether unemployed people aredisproportionately found to have incomes below this level. This question has a numberof dimensions.
Income is, in all cases, expressed as the current equivalent disposable income ofincome units, adjusted by the OECD equivalence scale. We compute two incomedistributions: one contains the whole population; the other contains only people who livein income units which have at least one person in the labour force, termed the labour-force distribution, for convenience. Unemployed people, as well as the self-employedand employees, are included as part of the labour force. The rationale for lookingseparately at the distribution of income among the labour force is that we would expectthat people who seek to, and indeed do, support themselves with paid work wouldgenerally have a higher income than people who rely predominantly on social welfarepayments. A high proportion of income units which are out of the labour force do indeedrely on social welfare payments for their income – sole parents, the aged and invalids forexample. We wish on the one hand to compare the situation of the unemployed with theirpeers – those who are in the labour force. We wish also to assess their fortunes in relationto the whole population, including the other groups who rely on social welfare payments.The two distributions have different median incomes: the median for those in the labourforce being higher than the median for all people in the population ($494 and $426 a weekrespectively). An unemployed family is defined as one which contains an unemployedperson aged 15 or over.
Table 2 shows the percentage of various population groups that are in poverty. Itshows that only 8 per cent of adults aged 15 or more are in poverty when theentire-population poverty line is used. And that 12 per cent are in poverty when the higherpoverty line for those in the labour force is used. It is also clear that unemployed personslive in families with higher poverty rates. Just under 28 per cent of all unemployedpersons live in families that are in poverty using the population poverty line, rising to45 per cent using the labour-force poverty line. Given that there is only $34 a weekdifference between these two poverty lines, this dramatic increase in recorded povertyunderlines the extreme sensitivity of such head-count measures of poverty to smallchanges in the poverty line. This is caused by the bunching of large numbers of socialsecurity recipients around these particular poverty lines. This bunching effect alsoappears to underlie the changes in the poverty rate for the long-term unemployed, whichincreases from 20 to 42 per cent as the poverty line increases from the general population

152 Ann Harding and Sue Richardson
poverty line to the labour-force poverty line. The poverty rate among families thatdeclare at least $1 of wage and salary income is only 2 per cent using the populationpoverty line. This doubles to 4 per cent using the labour-force poverty line.
Children are particularly at risk. Three out of every ten children living in a family withan unemployed member are in poverty, compared with only one out of every ten childrenin Australia. When the higher labour-force poverty line is used, fully one-half of childrenliving in unemployed families are in poverty. Recall that one-third of unemployed menare fathers with dependent children. Poverty rates are, however, very low among childrenliving in families with some wage and salary income. Using the population poverty line,poverty rates for such children are only 3 per cent. In other words, dependent childrenliving in families with at least one unemployed member have nine times as much risk ofbeing in poverty as those living in families with some wage and salary income.
Table 2: Poverty Rates for Various Groups using Two Poverty LinesPer cent; 1994/95
Entire-population Labour-forcepoverty line poverty line
Persons aged 15+:
Unemployed 28 45
Long-term unemployed 20 42
Wage and salary earners 2 4
All 8 12
Dependent children in:
Unemployed families 27 50
Long-term unemployed families 27 50
Wage and salary families 3 6
All families 12 19
6. The Unemployed and Income DistributionIn this section we explore the question of where the unemployed, grouped in a variety
of ways, lie in the overall distribution of income. Income is again defined as theequivalent disposable income of the family and this income is attributed to each personwithin the income unit (including children under age 16). Again two different overallincome distributions are used. In one, the whole population is ranked from lowestequivalent income to highest. In the other, only people who live in income units whichcontain a person who is in the labour force are included.
Figure 5 shows where unemployed people are to be found in the overall distributionof income for the entire population. Deciles of the income distribution are measured onthe horizontal axis, ranked from lowest to highest. On the vertical axis is measured theproportion of the relevant group which has an income located in each decile. If everyone

153Unemployment and Income Distribution
had the same income, 10 per cent of each group would be found in each decile. A linemarking this equal distribution is included in the figure for reference. As Figure 5 shows,the unemployed are heavily concentrated in the bottom third of the overall incomedistribution. Just over two-thirds of male unemployed and over half of female unemployedare in the bottom two deciles (see also Table 3). As suggested earlier, unemployed menare clustered at the bottom of the distribution to a greater extent than unemployedwomen.
Figure 5: Distribution of Unemployed People by Decile of EquivalentCurrent Disposable Income
By gender; 1994/95
1 2 3 4 5 6 7 8 9 101 2 3 4 5 6 7 8 9 100
5
10
15
20
25
30
35
0
5
10
15
20
25
30
35
0
5
10
15
20
25
30
35
0
5
10
15
20
25
30
35
Women all unemployed
%%
All unemployed
Men all unemployed
Decile of equivalent current disposable income for entire population
Does the picture vary by age or for those with dependent children? The circumstancesof the long-term unemployed are shown in Figure 6. In drawing conclusions from thisinformation it is important to recall that, in the sample with which we deal, there wereonly 303 people in this category. Further division into deciles reduces the number ofrespondents in the higher deciles to a handful. Our interest, however, is principally inwhether the long-term unemployed look different from other unemployed people in theextent to which they are concentrated at the bottom of the income distribution. Theprecise proportion in each decile above the fifth is not of much concern. Relative to allunemployed and to adult unemployed, the long-term unemployed are more denselyclustered in the second decile, and a little less densely clustered in the first decile. Butthe differences are small and if the information were displayed as quintiles rather than

154 Ann Harding and Sue Richardson
deciles, would not be noticeable. The overall conclusion must be that the incomesituation of the long-term unemployed is little different from that of unemployed peoplein general.
This may be interpreted as an outcome of the way that ‘unemployment insurance’operates in the Australian social welfare system. The level of benefit to which along-term unemployed person is entitled is the same as that due to any unemployedperson in the same family and private income circumstances. Thus, the big difference inincome is associated with movement between employment and unemployment, ratherthan with the duration of unemployment. Indeed, the short-term unemployed may for atime have lower incomes than equally situated long-term unemployed, as they wait tobecome eligible for benefits and as they use up initial cash reserves which bar them fromeligibility. Recall that only 56 per cent of all unemployed receive an unemploymentbenefit whereas 74 per cent of long-term unemployed do.
The broad equality of circumstances of the long-term unemployed and the short-termunemployed can be attributed to the fact that Australia does not have an unemploymentinsurance scheme which provides benefits for some defined period which are related toprevious earnings. Rather, benefits are determined, whatever the duration ofunemployment, by an assessment of current income, assets and dependents. As theAppendix shows, the family circumstances of the long-term unemployed are notstrikingly different from those of all unemployed workers.
Figure 6: Distribution of Unemployed People by Decile of EquivalentCurrent Disposable Income
By age, presence of children and length of time unemployed; 1994/95
1 2 3 4 5 6 7 8 9 101 2 3 4 5 6 7 8 9 100
5
10
15
20
25
30
35
40
45
0
5
10
15
20
25
30
35
40
45
0
5
10
15
20
25
30
35
40
45
0
5
10
15
20
25
30
35
40
45Long-term
unemployed
%%
Youthunemployed
Adultunemployed
Unemployedwith children
Decile of equivalent current disposable income for entire population

155Unemployment and Income Distribution
Figure 6 also looks at the unemployed disaggregated into yet further groups. The newgroups are youth – aged 15–20 – and those with dependent children. Most of thedifference between the series is found in the first three deciles, although for both youthand those with children, 20 per cent are found in the top half of the income distributionwhereas only half this number of all the adult unemployed are.8
Almost half of all unemployed youth are in the bottom decile of the distribution ofequivalent disposable income unit income, for all people. This suggests intensedisadvantage. But it may not be all it seems. Recall that a person living with his or herparents who is over age 15 and not a full-time student is classified as an independentincome unit. The provision of board and even cash gifts by parents does not count as partof the income of the young person. Twenty per cent of both all unemployed and thelong-term unemployed are living at home with their parents. We do not know the amountof support they receive, but it almost certainly includes housing and most probablyincludes rather more than that.
The unemployed with dependent children are, like all the other groups, heavilyconcentrated at the bottom of the income distribution, but not quite so severely as thelong-term, all, and all adult unemployed. Although it is not evident in the figure, this isbecause unemployed women with dependent children are much more evenly spreadacross the income distribution than are any other group that we looked at. Abouttwo-fifths are still in the bottom quintile, but almost one-third are in the top half of theincome distribution (Table 3). The comparable figures for men with dependent childrenare 71 per cent and 11 per cent.
8. In the case of youth, this is partly attributable to unemployed 15–24 year olds being counted as part of theirparents’ income unit if they are also full-time students. Thus, some such parents obviously have highincomes.
Table 3: Proportion of Unemployed People in the Top and BottomQuintiles of the Income Distribution
For labour force For all people
Bottom Top Top Bottom Top Topquintile quintile half quintile quintile half
All unemployed 71 2 8 63 2 12
Males 78 2 6 70 2 9
Females 63 2 10 54 2 19
Adults (21 yrs+) 74 1 6 64 1 10
Youth (<21 yrs) 65 6 15 62 6 21
Long-term 78 1 7 68 1 7
With children 64 4 12 58 4 20
Men 75 3 7 71 3 11
Women 50 5 17 41 5 29

156 Ann Harding and Sue Richardson
All of these graphs have examined the income distribution of the unemployed relativeto that of the entire population, with one-tenth of the population being found in each ofthe deciles considered above. The percentage of variously defined unemployed groupsto be found in the bottom and top quintile, and the top half of the distributions for allpeople and for people who live in families with a member in the labour force are to befound in Table 3. Not surprisingly, if deciles are constructed for only those families witha member in the labour force, the unemployed appear to be even more heavilyconcentrated at the bottom of the income distribution.
An alternative way of looking at these issues is to examine the unemployed as aproportion of those in each decile. Figure 7 shows that the unemployed make up aboutone-fifth of all of those persons aged 15 or more who are in the bottom decile ofequivalent family income for the entire population. Wage and salary earners with verylow family incomes make up another 10 per cent of all those in the bottom decile. Personswho are not in the labour force are the most important group at the very bottom of theincome distribution, contributing half of the bottom decile. And those who fall into the‘Other’ category (principally the self-employed) make up the final 20 per cent.
As one would expect, as family income increases, a rapidly rising proportion of peopleaged 15 and over are wage and salary earners. About 85 per cent of persons in the topdecile of family income are wage and salary earners, while less than 1 per cent areunemployed people married to a high income spouse (or living with high incomeparents). Figure 7 again underlines that the unemployed people are concentrated at thelower tail of the income spectrum.
Figure 7: Proportion of Persons Aged 15 or More with SpecifiedLabour Force Status, by Decile of Family Equivalent
Current Disposable Income1994/95
1 2 3 4 5 6 7 8 9 101 2 3 4 5 6 7 8 9 100
10
20
30
40
50
60
70
80
90
0
10
20
30
40
50
60
70
80
90
0
10
20
30
40
50
60
70
80
90
0
10
20
30
40
50
60
70
80
90
Per
cen
t of
each
dec
ile
Per
cen
t of
each
dec
ile
Other
Wage and salaryearners
Not in thelabour force
Unemployed
Decile of equivalent current disposable income for entire population

157Unemployment and Income Distribution
The clear conclusion from this section is thus that unemployed people areoverwhelmingly found at the bottom of the income distribution. It does not matter whichgroup you look at or which income measure is used. Among the modest differencesdetected, the principal one is that this relative income disadvantage is particularlypronounced for adult men, with and without dependent children.
7. Low-wage Workers and the UnemployedThere is considerable interest in the question of whether low-wage workers are
relatively badly off in terms of their personal and family incomes and how they compareon this dimension with unemployed workers. The interest arises in part from the idea thatit may be possible to reduce the wages of the low paid and in so doing, generate extraemployment for people who are currently unemployed – or reduce the flow of newadditions to the unemployment pool. This possible trade-off has been confronted in avery direct way by the Australian Industrial Relations Commission, in its so-called‘living wage’ cases. These were conducted in 1997 and 1998 and were directed to settingaward rates of pay for people who had not participated in enterprise or other bargains.In its submission to the 1998 ‘living wage’ case, the Joint Governments (1998) said:
‘…Large real increases in award rates are likely to have an adverse effect on employment. Thisobviously does not serve the needs of the low paid. No one should ever lose sight of the fact thatthe majority of people in poverty are not employed. Anyone who is serious about reducinginequality and poverty should primarily devote their attention to measures which will reduceunemployment’ (p. 178).
Figure 8 traces the income distribution for the unemployed, low- and minimum-wageworkers, and all wage and salary earners. Low-wage workers are defined as adultsearning less than $10 an hour and juniors earning less than $6 an hour, while minimum-wageearners are defined as adults earning less than $8.50 an hour. The income distribution isfor the whole population. The general picture is similar if the distribution for those in thelabour force is used. It is clear that unemployed people are more heavily concentrated inthe bottom deciles, and are more rarely found in the upper deciles than are minimum-wageearners. Unemployed workers are substantially over-represented in the first threedeciles, as was shown previously. In contrast, minimum-wage earners are over-representedin the middle deciles, four to six. This occurs for two reasons. The first is that theminimum wage used in this paper – in effect the then prevailing Federal minimum – isenough to put a full-time worker who has no or few dependents in these middle deciles.The second is that minimum-wage workers often live in families in which there is morethan one income earner. Multiple-income earners are much more common amonglow-wage families than among unemployed ones.
The majority of low-wage earners are found further up the income distribution thanminimum-wage earners, with about half being concentrated in deciles six to eight. Onceagain, wage earners generally are better off than low-wage earners, with aboutthree-quarters of all wage earners receiving a family income which places them in the topfour deciles of the income distribution.
We conclude from this section that the evidence strongly supports the view that theunemployed are indeed financially very disadvantaged. They comprise a high proportionof people in the lowest deciles of the income distribution and are heavily concentrated

158 Ann Harding and Sue Richardson
in these deciles. These conclusions apply with less force to women than to men, but applyto them nonetheless. Every way that we have looked at it, unemployed workers are muchlower in the income distribution than are most low-wage workers – although there aresome low-wage workers who are in the lowest deciles and these should not be forgotten.
8. ConclusionAs in other English-speaking countries, the distribution of earned income in Australia
has become more unequal in the past decade. Wages and salaries and income frominterest, dividends and rent are, separately and together, now less evenly spread acrossthe population than they were (Harding 1997). One reason is a rise in the dispersion ofpay, with jobs which pay a lot and jobs which pay a little, growing relative to jobs withmiddle-level rates of pay. A second reason is the growth in unemployment, includinglong-term unemployment. It is likely that a third reason is the continuing trend towardspeople living in smaller and smaller families, including single parent families(Harding 1995b). In theory, this last development should not affect inequality in ourincome measure because the equivalence scale is intended to capture the economies ofshared living arrangements. But it is a crude and simple scale and undoubtedly doesinjustice to the many ways that sharing accommodation, recreation, transport and so onreduces the per person cost of living.
Figure 8: Distribution of Unemployed People, Low, Minimum andAll Wage Earners, by Decile of Equivalent
Current Disposable Income1994/95
1 2 3 4 5 6 7 8 9 101 2 3 4 5 6 7 8 9 100
5
10
15
20
25
30
35
0
5
10
15
20
25
30
35
0
5
10
15
20
25
30
35
0
5
10
15
20
25
30
35
1994/95
All wage earners
Minimum wage
Low wage
All unemployed
% %
Decile of equivalent current disposable income for entire population

159Unemployment and Income Distribution
It is also worth noting that the degree of inequality is exaggerated in our data becauseyoung people living at home, who are not full-time students, are treated as if they dependfully on their own income, which clearly they do not. For young men in particular, thereare many such people among the low-wage and unemployed groups. The simple fact thatthese young adults live at home with their parents suggests strongly that for many ofthem, it is cheaper to do so than to live separately; yet treating them as independentincome units implies that they live separately.
The detailed examination of the unemployed presented above enables us to draw apicture of this disadvantaged group. The young are over-represented, but all age groupscontribute significantly to the unemployment pool. Migrants, the relatively uneducatedand single people are prominent. Many are young people still living – probablyreluctantly – at home, a majority of whom are not full-time students. Less than half ofall young unemployed receive unemployment allowances (42 per cent), although thisrises to 69 per cent of the long-term young unemployed. For the unemployed generally,the comparable figures are 56 and 74 per cent. Yet government cash benefits provide90 per cent of the personal income of the unemployed and, for adults, a significantproportion of family income. This is in striking contrast to the families which have a wageearner: for them, government cash benefits on average provide just 2 per cent of theirincome.
The major contribution of this paper is to examine, and display, the income situationof the unemployed. It has been known for some time that the personal incomes of theunemployed are quite low. This is no surprise, since they have little income other thanthat provided by a modest and tightly targeted social welfare system. What is new is theevidence that not only are the personal incomes of the unemployed low, but so also arethe disposable incomes of the families in which they live. Overwhelmingly, unemployedpeople do not live in families in which there is significant wage or other private incomefor other family members. They and their families rely heavily on the social welfaresystem for their income. Since the social welfare system in Australia is of the safety-netkind, providing just enough to enable recipients to make ends meet, it is inevitable thatunemployed people and their families have low incomes.
It also follows that they have lower incomes than do families which, by virtue of theirwage income, are excluded from eligibility for social welfare assistance. In order tomaintain some financial reward to employment as opposed to unemployment, it isnecessary to set the level of benefits received by most unemployed people below thesums that could be earned at a low wage by a person working more than a few hours perweek. And this has been done, even if imperfectly. It is striking that among workers, atiny proportion of their income, on average, comes from government cash benefits. Thisdoes not deny that for some employed families, government assistance for children issignificant. But on average it is not. People who rely upon wages and salaries have higherincomes than people who rely upon social welfare payments. This is the intention of thedesign of the social welfare system, and it works.
Unemployed workers and their families have two to three times the average person’schance of having a very low income. They are also clustered heavily at the bottom of thedistribution of equivalent disposable family income: about two-thirds are in the bottomtwo deciles of the overall distribution. They comprise a large proportion of people in the

160 Ann Harding and Sue Richardson
workforce who have very low incomes. They are substantially worse off in these respectsthan are people who earn low wages.
It is undoubtedly true, then, that unemployed people mostly have lower equivalentfamily incomes than do wage earners, even low-wage earners. It follows that aredistribution from low-wage earners to unemployed people would make the overalldistribution of income more equal. But it does not necessarily follow that a cut in thewages of the low paid is thereby egalitarian.
First, if one simply wants to increase the incomes of the unemployed and theirfamilies, a ‘tax’ on low-wage workers is a much less equitable way to finance this thanis a tax on all wage and salary earners.
Second, a cut in the wages of the low paid is helpful to the unemployed only if it causesa substantial increase in the number of low-wage jobs and of all jobs. The evidence onthe likely response of employment to a cut in low wages is scarce in Australia. But at thevery least, the overseas evidence must cause some pessimism that the employmentresponse would be large. If it is small, then all low-wage workers would be worse off asa result of a cut in their wages, while some previously unemployed workers would bebetter off and most would not be affected.
Third, an increase in the number of low-wage jobs does not mean a commensurate fallin the numbers of people who are unemployed. Many such jobs would go to people whopreviously were out of the labour force.
Fourth, a cut in the level of low wages would exacerbate the already severe problemof high effective marginal tax rates for people on the borders between the social welfaresystem and paid employment (Beer and Harding 1997). The differences between paidwork and unemployment assistance would diminish. It is likely that this would producepressure to lower the level of social welfare benefits, both in order to maintain anincentive to work and in order to maintain the socially preferred position that people whohave paid work generally have higher incomes than people who are reliant on socialwelfare. Since the level of social welfare payments for all forms of social assistance – tosingle parents, full-time students and the aged for example – are set at a common level,a cut in the level of benefits for unemployed people could bring pressure to cut the levelsof all related benefits. (An alternative solution might be to increase the earnings of thosein low-paid employment, via earnings credits or wages top-ups, rather than decreasingthe payments of those on benefits.)
Overall, therefore, the impact on income inequality of cuts in real wages is unclear.While some proportion of the unemployed might gain jobs, existing low-wage earnerscould expect their earnings to decline. It is also not clear what the consequent effectsmight be upon the social security system.9
9. These issues were more comprehensively examined in work by us and other authors at the conference‘Fairly Efficient? Equity and Productivity in the Australian Labour Market’ held at the ANU,16–17 June 1998.

161Unemployment and Income Distribution
Unemployed Long-term unemployed All wage and salary workersFemale Male All Female Male All Female Male All
Number weighted(’000) 298 437 735 107 214 321 2 879 3 795 6 674
Number of unweightedobservations in samplesurvey 300 430 730 108 195 303 2 923 3 700 6 623
Age:
15–20 28 20 23 17(a) 14 15 11 9 10
21–24 11 13 12 10(a) 12 11 12 10 11
25–34 22 25 24 25 21 23 25 26 26
35–54 34 33 33 43 41 41 47 46 46
55–64 5(a) 9 7 6(a) 12 10 5 8 7
Total 100 100 100 100 100 100 100 100 100
Education qualifications:
Degree 7(a) 6 6 9(a) 5(a) 6 15 15 15
Undergrad diploma 3(a) 2(a) 2(a) 0(a) 1(a) 1(a) 6 2 4
Associate diploma 3(a) 4(a) 4 4(a) 3(a) 3(a) 5 8 6
Skilled vocational 10 17 14 7(a) 13 11 11 25 19
Basic vocational 6(a) 3(a) 5 5(a) 3(a) 3(a) 7 2 4
No qualifications 63 64 64 74 72 73 53 46 49
At school 8 4(a) 6 1(a) 3(a) 2(a) 3 2 2
Total 100 100 100 100 100 100 100 100 100
Marital status:
Married 39 44 42 39 52 48 61 62 62
Never married 45 47 46 31 38 36 31 32 31
Separated,widowed etc. 16 9 12 30 10 16 8 6 7
Total 100 100 100 100 100 100 100 100 100
Year of arrival(for migrants only):
Before 1976 27 46 39 24 47 39 53 57 56
1976–80 9 12 11 12 13 11 11 10 10
1981–85 32 13 21 23 18 20 12 10 11
1986–90 14 19 17 20 12 15 17 17 17
1991–94 18 10 12 21 10 15 7 6 6
Total 100 100 100 100 100 100 100 100 100
continued
Selected Characteristics of the Unemployed and of Wage and Salary EarnersPer cent
Appendix

162 Ann Harding and Sue Richardson
Unemployed Long-term unemployed All wage and salary workersFemale Male All Female Male All Female Male All
Family relationship:
Husband anddependent children – 30 18 – 32 22 – 37 21
Wife anddependent children 20 – 10 25 – 8 34 – 15
Other husband – 14 8 – 19 12 – 24 14
Other wife 15 – 6 14(a) – 5(a) 27 – 12
Lone parent anddependent children 9 2(a) 5 7(a) 3(a) 5(a) 4 1 2
Full-time studentchild aged 15–24 13 8 10 2(a) 3(a) 2(a) 5 3 4
Other child aged 15+ 18 22 21 19 19 19 12 14 13
Unrelated group 6(a) 8 7 6(a) 7(a) 7 7 9 8
Live alone 8 14 11 11(a) 15 14 8 9 9
Other 7 3(a) 5 15(a) 3(a) 7 3 2 2
Total 100 100 100 100 100 100 100 100 100
Length of timeunemployed:
1 to < 39 weeks 64 51 56
39 to < 52 weeks 5 7 6
52 to < 104 weeks 12 14 13
104 weeks+ 19 28 24
(a) Denotes less than 20 000 weighted observations, or a sampling error greater than approximately 25 per cent.
Selected Characteristics of the Unemployed and of Wage and Salary Earners (continued)Per cent

163Unemployment and Income Distribution
ReferencesAustralian Bureau of Statistics (ABS) (1993), ‘Australia’s Long-term Unemployed: A Statistical
Profile’, ABS cat. no. 6255.0.
Beer, G. and A. Harding (1997), ‘Effective Tax Rates’, Income Distribution Report, NationalCentre for Social and Economic Modelling, University of Canberra, No. 7.
Borland, J. and S. Kennedy (1998), ‘Earnings Inequality in Australia in the 1980s and the 1990s’,mimeo, Australian National University, February.
Borland, J. and R. Wilkins (1996), ‘Earnings Inequality in Australia’, Economic Record, 72(216),pp. 7–23.
Burkhauser, R., A. Crews, M. Daly and S. Jenkins (1996), ‘Where in the World is the Middle Class?A Cross-national Comparison of the Vanishing Middle Class Using Kernel DensityEstimates’, University of Essex, ESRC Research Centre on Micro-social Change WorkingPaper No. 96-8.
Economic Planning Advisory Commission (EPAC) (1995), Income Distribution in Australia:Recent Trends and Research, AGPS, Canberra.
Feather, N. (1997), ‘Economic Deprivation and the Psychological Impact of Unemployment’,Australian Psychologist, 32(1), pp. 37–45.
Gottschalk, P. and M. Joyce (1997), ‘Cross-national Differences in the Rise of Earnings Inequality– Market and Non-market Factors’, Luxembourg Income Study Working Paper No. 160.
Gottschalk, P. and T. Smeeding (1997), ‘Empirical Evidence on Income Inequality in IndustrialisedCountries’, Luxembourg Income Study Working Paper No. 154.
Gregory, R. (1993), ‘Aspects of Australian and US Living Standards: The Disappointing Decades1970–1990’, Economic Record, 69(204), pp. 61–76.
Gregory, R. (1996), ‘Wage Deregulation, Low Paid Workers and Full Employment’, in P. Sheehan,B. Grewal and M. Kumnick (eds), Dialogues on Australia’s Future, Centre for StrategicEconomic Studies, Victoria University, Melbourne, pp. 81–102.
Gregory, R. and B. Hunter (1995), ‘The Macro-economy and the Growth of Ghettos and UrbanPoverty in Australia’, Australian National University Centre for Economic Policy ResearchDiscussion Paper No. 325.
Hancock, K. (1998), ‘The Needs of the Low Paid’, in Wealth, Work and Well-being, Academy ofthe Social Sciences in Australia, Canberra, Occasional Paper No. 1, pp. 1–26.
Harding, A. (1995a), ‘The Social Wage and Income Distribution: the Impact of Health, Educationand Housing Outlays in 1994’, Australian Economic Review, 28(3), pp. 71–86.
Harding, A. (1995b), ‘The Impact of Family, Demographic and Labour Force Change UponIncome Inequality in Australia, 1982–93’, Australian Journal of Social Research, 1(1),pp. 47–70.
Harding, A. (1996), ‘Recent Trends in Income Inequality in Australia’, in P. Sheehan, B. Grewaland M. Kumnick (eds), Dialogues on Australia’s Future, Centre for Strategic EconomicStudies, Victoria University, Melbourne, pp. 283–306.
Harding, A. (1997), ‘The Suffering Middle: Trends in Income Inequality in Australia 1982 to1993/94’, Australian Economic Review, 30(4), pp. 341–358.
Johnson, D., I. Manning and O. Hellwig (1995), Trends in the Distribution of Cash and Non-cashBenefits – An Overview, Report to the Department of the Prime Minister and Cabinet, AGPS,Canberra.
Joint Governments (1998), ‘Safety Net Review – Wages’, Department of Workplace Relations andSmall Business, Canberra.

164 Ann Harding and Sue Richardson
King, A. (1997), ‘The Changing Face of Australian Poverty: A Comparison of 1996 Estimates andthe 1972–73 Finding from the Commission of Inquiry’, National Centre for Social andEconomic Modelling Discussion Paper No. 23.
King, J., S. Rimmer and R. Rimmer (1992), ‘The Law of the Shrinking Middle: Inequality ofEarnings in Australia 1975–1989’, Scottish Journal of Political Economy, 39(4),pp. 391–412.
OECD (1996), Employment Outlook, OECD, Paris.
Richardson, S. (1998), ‘Who Gets Minimum Wages?’, Australian National University Centre forEconomic Policy Research Discussion Paper No. 386.
Saunders, P. (1993), ‘Economic Adjustment and Distributional Change: Income Inequality inAustralia in the Eighties’, Social Policy Research Centre Discussion Paper No. 47.
Theodossiou, I. (1998), ‘The Effects of Low-pay and Unemployment on Psychological Well-being:A Logistic Regression Approach’, Journal of Health Economics, 17(1), pp. 85–104.
Wolfson, M. (1997), ‘Divergent Inequalities – Theory and Empirical Results’, Review of Incomeand Wealth, 43(4), pp. 401–422.