unemployment insurance administrative funding formulation to allocation target allocation process...
TRANSCRIPT
Unemployment InsuranceAdministrative Funding
Formulation to Allocation
Target Allocation
Process Overview
US Department of Labor
Employment and Training Administration
Division of Fiscal and Actuarial Services

Presentation Topics
• Funding Background
• Formulation for State Administration
• Resource Justification Model
• Allocation

UI Administrative Funding
• Title III Section 302(a) Social Security Act: Secretary of Labor shall certify to the Secretary of Treasury such amounts as necessary for “proper and efficient administration” of each State’s law.
Social Security Act Title III
(http://www.socialsecurity.gov/OP_Home/ssact/title03/0300.htm#ft1)

Budget Timeline for FY 200Z
Initial Budget Formulation
ETA Request to DOL
DOL Request to OMB
Budget Hearings w/OMB
OMB Passback
Final Workload Projections
President’s Budget Request
Planning Targets
States Submit SQSP
Final Allocations
FY 200Z
June JulySept.
Oct.
Nov. Jan.Feb.
June
Aug. Oct.
200X
200Y
Initial Workload Projection
Jan.

Budget Formulation
• Workload Driven.
• Workloads projected using statistical methods & Administration’s economic assumptions
• Key workload item: Continued Claims.

Budget Formulation• Base and Above Base
• Projected Continued Claims divided by 52 is designated the Average Weekly Insured Unemployment (AWIU) trigger.
• Funding in President’s Request considered adequate to process workloads up to the trigger.
• Funds automatically made available for AWIU above the trigger at rate of $28.6 M per 100,000 AWIU & pro-rated (amounts developed in the 1990s).

Budget Formulation• Congress obligated to use CBO’s economic
assumptions for scoring.
• CBO AWIU projections typically different due primarily to different economic assumptions and projecting methodology.
• Funding gap created when CBO’s AWIU
projection higher than Administration’s since Congress typically accepts the dollars requested or something lower.

Budget Formulation
Funding gap example:
• For FY 2008, dollars funded AWIU of 2.4M while trigger was set at 2.786M.
– Initial budget request included an AWIU of 2.62M however a continuing resolution held the AWIU at the FY 2007 level of 2.4M
Budget Formulation
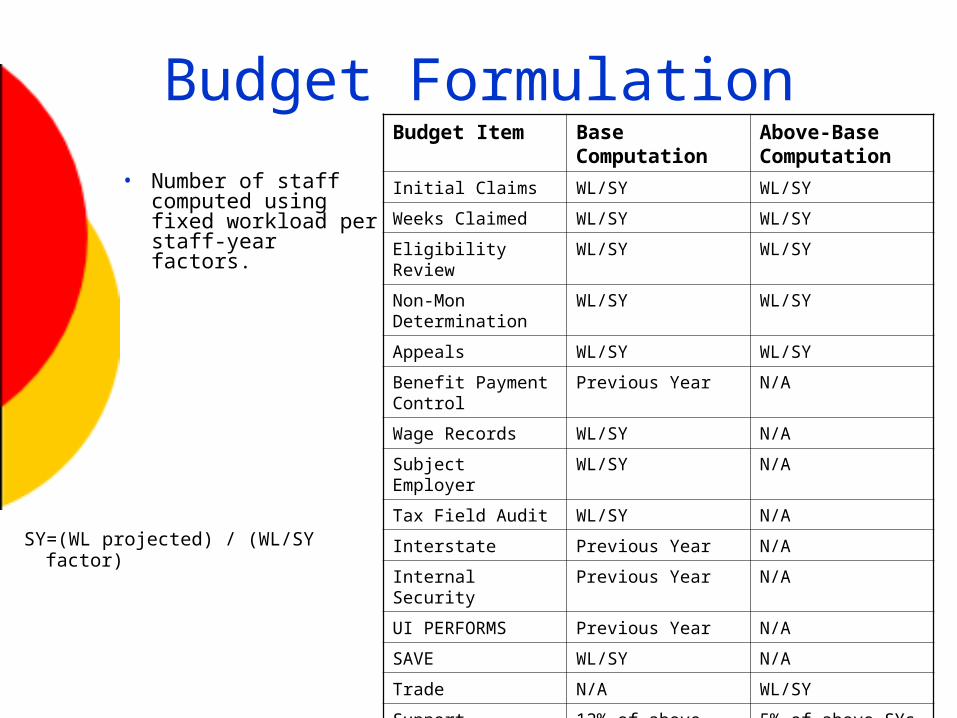
• Number of staff computed using fixed workload per staff-year factors.
Budget Item Base Computation
Above-Base Computation
Initial Claims WL/SY WL/SY
Weeks Claimed WL/SY WL/SY
Eligibility Review WL/SY WL/SY
Non-Mon Determination
WL/SY WL/SY
Appeals WL/SY WL/SY
Benefit Payment Control
Previous Year N/A
Wage Records WL/SY N/A
Subject Employer WL/SY N/A
Tax Field Audit WL/SY N/A
Interstate Previous Year N/A
Internal Security Previous Year N/A
UI PERFORMS Previous Year N/A
SAVE WL/SY N/A
Trade N/A WL/SY
Support 12% of above SYs 5% of above SYs
AS&T 9% of above Sys including Support
2.5% of above Sys including Support
SY=(WL projected) / (WL/SY factor)

Budget Formulation
• Staff costs = (SY) X Cost per SY– Note: In FY2010, inflation included for 1st time
since 1995
• Other activities, e.g., non-personal services (utilities, facilities, etc.), overhead, support, & postage, are established percentages of staff costs.
• Key result: total dollars for state administration.

Allocating Base Funds
• What are the primary drivers of the base allocation?
• Where does the data that drives the base allocations come from?

Budget Allocation
Staff Year Costs
NPS Costs
+
Projected State level Workload
Workload Staff Year
Levels
Non Workload Staff Year
Levels
+
Total Available for Allocation

Allocating Base Funds
Two key features of allocation:
• Based on cost of doing business and appropriation.
• Goal: provide funding that allows roughly equal level of service across all states and recognize need for productivity incentives.

Allocating Base Funds
• Funding provided in two parts: Base & Above Base– Base – costs associated with processing
an AWIU of 2.3M
Initial Claims 16.75M Weeks Claimed 119.6M Non-monetary determinations 7.000M Appeals 1.128 M All subject employers (200X) 7.674M All wage records (200X) 641.146M

Allocating Base Funds
• Base funding determined by applying formulation methodology to base workloads.
• Above-base – claims activity above 2.3M AWIU
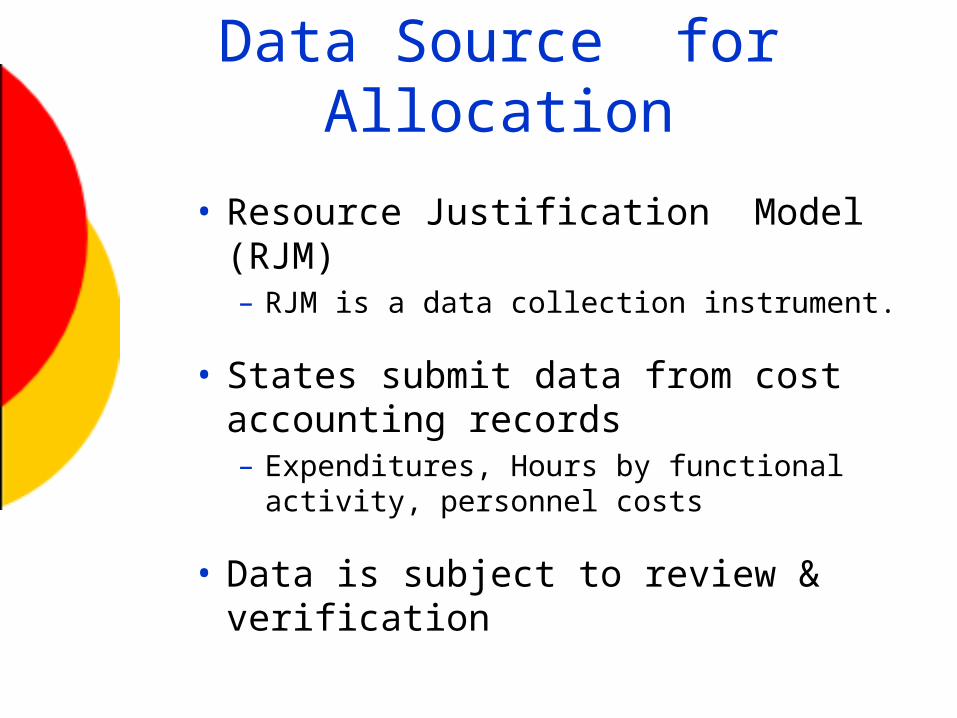
Data Source for Allocation
• Resource Justification Model (RJM)– RJM is a data collection instrument.
• States submit data from cost accounting records– Expenditures, Hours by functional activity,
personnel costs
• Data is subject to review & verification

RJM - Objectives
• Demonstrate true funding need.
• Use data to allow for fair and equitable allocation of available funds.
RJM Website
(http://www.ows.doleta.gov/rjm/)

RJM – Use of Data
• Actual cost data for most recent year available are the starting point for determining base allocations.
• Shows how much and on what activities states spent money.
• Supplements to the federal grant not considered in allocation formula.

Allocating Base Funds
Availability by activity
• Allocated base funds assigned to functional activities according to proportions reflected in RJM data collection.
– Claims activities – Non-personal services– Tax/Wage Records– Support– AS&T– BPC/UIP
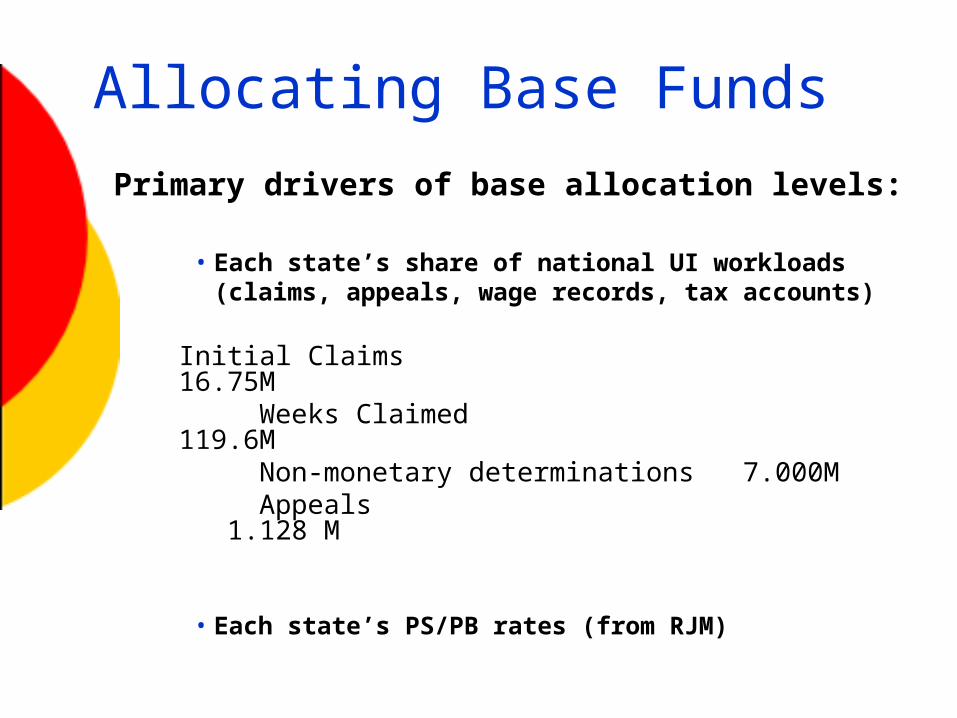
Allocating Base Funds
Primary drivers of base allocation levels:
• Each state’s share of national UI workloads (claims, appeals, wage records, tax accounts)
Initial Claims 16.75M Weeks Claimed 119.6M Non-monetary determinations 7.000M Appeals 1.128 M
• Each state’s PS/PB rates (from RJM)

Allocating Base Funds
Primary drivers of base allocation levels:
• Time allowed for processing each budgeted workload item (MPUs, which are calculated from RJM data)
– 3-year average
• Non-personal services spending (from RJM)
– 3-year average

FY 200Z Targets
Inflated FY0X Rates
(Derived from RJM Data)
Unreduced Total Percent Shortfall Targets
Workload SY 1,395,198,145 56.9% -161,884,626 1,233, 313,519
[Appeals 214,568,805 8.8% -25,188,923 189,379,882]
Support SY 311,900,446 12.7% -36,189,865 275,710,581
AS&T SY 214,325,600 8.7% -24,857,601 189,467,999
NPS $ 529,661,418 21.6% -61,456,195 468,205,223
Sub. TOTAL 2,451,085,609 100.0% -284,388,287 2,166,697,322
BPC/UIP SY 138,409,793 0.0% 0 138,409,793
TOTAL 2,589,495,402 100.0% -284,388,287 2,305,107,115

Allocations
• Staff years =
• Cost =
• MPU reduction algorithm– MPU values are an average of the most recent
three years of actual data.
Workload x MPU
Minutes Worked Per Year Per Staff
Staff Years x PS/PB rates

AP SY 2428.1 2428.100 Total 1,128,000alpha 0.782784 Maximum 212,151
MPU Workloadhours Reduction Ajustment Total
wkld worked MPU SY (madj) (wadj) Reduction MPU SY SY CumUS 1,128,000 2750.6 2428.1 VI 87 1687.34 563.048 0.5 276.598 0.7501 207.476 355.572 0.3 0.3VT 1548 1732.75 489.310 7.3 218.877 0.7518 164.557 324.753 4.8 5.1SD 1195 1799.13 415.479 4.6 161.083 0.7514 121.039 294.440 3.3 8.4PR 5541 1584.80 405.275 23.6 153.095 0.7565 115.821 289.454 16.9 25.3WI 18775 1756.93 393.998 70.2 144.268 0.7721 111.393 282.605 50.3 75.6ND 1354 1877.26 393.581 4.7 143.941 0.7516 108.186 285.395 3.4 79.0NY 38786 1608.65 348.818 140.2 108.902 0.7957 86.654 262.164 105.4 184.4CO 15334 1760.58 347.378 50.4 107.774 0.7681 82.778 264.600 38.4 222.8OH 20397 1754.44 339.418 65.8 101.544 0.7740 78.598 260.820 50.5 273.3WY 1155 1782.00 335.239 3.6 98.272 0.7514 73.838 261.401 2.8 276.2ME 5597 1711.46 333.855 18.2 97.189 0.7566 73.533 260.322 14.2 290.3UT 6645 1787.01 331.386 20.5 95.256 0.7578 72.188 259.198 16.1 306.4MT 912 1761.91 322.458 2.8 88.268 0.7511 66.295 256.163 2.2 308.6PA 63820 1605.99 305.911 202.6 75.315 0.8252 62.150 243.761 161.4 470.1MA 22385 1649.46 304.377 68.8 74.114 0.7764 57.541 246.836 55.8 525.9WV 4405 1601.73 288.646 13.2 61.800 0.7552 46.671 241.975 11.1 537.0OR 17223 1745.34 288.439 47.4 61.638 0.7703 47.479 240.960 39.6 576.6AK 1984 1638.51 282.217 5.7 56.767 0.7523 42.708 239.509 4.8 581.4DC 2400 1698.46 280.501 6.6 55.424 0.7528 41.725 238.776 5.6 587.1AZ 16689 1830.01 274.072 41.7 50.392 0.7697 38.785 235.287 35.8 622.8MI 27503 1710.68 271.725 72.8 48.555 0.7824 37.990 233.735 62.6 685.5SC 12732 1619.56 265.860 34.8 43.963 0.7650 33.632 232.228 30.4 715.9HI 2587 1658.52 265.352 6.9 43.566 0.7530 32.807 232.545 6.0 721.9CA 212151 1718.29 260.648 536.4 39.884 1.0000 39.884 220.764 454.3 1176.2RI 4534 1491.16 260.044 13.2 39.411 0.7553 29.769 230.275 11.7 1187.9KS 10567 1768.29 258.654 25.8 38.323 0.7625 29.219 229.435 22.9 1210.7MN 15664 1725.80 249.175 37.7 30.903 0.7685 23.747 225.428 34.1 1244.8MS 11706 1800.63 247.150 26.8 29.318 0.7638 22.393 224.757 24.4 1269.2NH 3384 1597.62 246.371 8.7 28.708 0.7540 21.645 224.726 7.9 1277.1GA 37780 1798.72 244.581 85.6 27.307 0.7945 21.696 222.885 78.0 1355.1WA 23505 1762.77 237.809 52.8 22.006 0.7777 17.114 220.695 49.0 1404.2NV 9319 1938.55 236.419 18.9 20.918 0.7610 15.918 220.501 17.7 1421.9ID 3558 1750.46 232.426 7.9 17.792 0.7542 13.419 219.007 7.4 1429.3AL 14699 1739.82 231.401 32.6 16.990 0.7673 13.036 218.365 30.7 1460.0NJ 37963 1448.53 230.392 100.6 16.200 0.7947 12.874 217.518 95.0 1555.0MO 26758 1714.20 230.315 59.9 16.139 0.7815 12.613 217.702 56.6 1611.7IA 12386 1764.77 229.324 26.8 15.364 0.7646 11.747 217.577 25.5 1637.1DE 4327 1650.00 228.702 10.0 14.877 0.7551 11.233 217.469 9.5 1646.6NE 4050 1748.83 224.872 8.7 11.879 0.7548 8.966 215.906 8.3 1655.0TX 82092 1691.92 223.233 180.5 10.596 0.8467 8.972 214.261 173.3 1828.2NC 37676 1785.35 222.429 78.2 9.966 0.7944 7.917 214.512 75.4 1903.7CT 16498 1735.16 220.771 35.0 8.669 0.7694 6.670 214.101 33.9 1937.6KY 18277 1669.21 218.780 39.9 7.110 0.7715 5.486 213.294 38.9 1976.5NM 6941 1831.64 209.697 13.2 0.000 0.7582 0.0000 209.697 13.2 1989.8LA 18594 1775.19 209.639 36.6 0.000 0.7719 0.0000 209.639 36.6 2026.4AR 11702 1798.22 209.123 22.7 0.000 0.7638 0.0000 209.123 22.7 2049.1TN 17246 1666.96 204.711 35.3 0.000 0.7703 0.0000 204.711 35.3 2084.4VA 16041 1775.64 201.938 30.4 0.000 0.7689 0.0000 201.938 30.4 2114.8MD 25411 1668.45 197.857 50.2 0.000 0.7799 0.0000 197.857 50.2 2165.0IN 22750 1710.79 187.792 41.6 0.000 0.7768 0.0000 187.792 41.6 2206.6FL 68180 1848.48 185.903 114.3 0.000 0.8303 0.0000 185.903 114.3 2320.9IL 55232 1606.75 161.826 92.7 0.000 0.8151 0.0000 161.826 92.7 2413.6OK 9955 1737.70 151.903 14.5 0.000 0.7617 0.0000 151.903 14.5 2428.1
Unreduced Reduced
MPU Reduction Process - Appeals 1 madj = (mpu_st – mpu_high10) * alpha 2 wadj = .75 + ( AP_st / (AP_highst*4))
1 2

Allocations
• Support and AS&T percentages are reduced by the same algorithm used for MPU values.
• BPC, UIP staff years taken after adjustment for state dollars.

Allocations
• Total Allocation
(Reduced SYs x Inflated PSPB rates) + Reduced NPS
• SYs for BPC & UIP are not reduced
• NPS is decreased across-the-board to equal availability.

Allocations
• Stop-loss is -5% of total dollars from previous year’s base allocation.
• Stop-gain is not pre-determined. – Has been as low as 4.56% and as
high as 7.71%
Bottom Line Authority
• States have authority to move allocated resources among activities.
• Cannot move resources in such a way as to increase above base payment.