unemployment rate, gender inequality … rate, gender inequality and economic growth ... port...
TRANSCRIPT

Global Journal of Human Resource Management
Vol.5, No.5, pp.12-41, June 2017
___Published by European Centre for Research Training and Development UK (www.eajournals.org)
12 ISSN 2053-5686(Print), ISSN 2053-5694(Online)
UNEMPLOYMENT RATE, GENDER INEQUALITY AND ECONOMIC GROWTH
IN NIGERIA “A SHORT-RUN IMPACT ANALYSIS”
Dennis Brown Ewubare1 and Anuli Regina Ogbuagu2
1Department of Agriculture and Applied Economics/ Ext, Rivers State University of Science
and Technology, Port Harcourt, Nigeria
2Department of Economics and Development Studies, Federal University, Ndufu -Alike
Ikwo, Ebonyi State
ABSTRACT: This paper examines the short-run impact of gender inequality (proxy by
primary and secondary school enrollment) and economic growth (real gross domestic product)
on unemployment rate in Nigeria, and also the study determines how much of the forecast error
variance of unemployment can be explained by exogenous shocks from variables (gender
inequality, economic growth, and population growth rate). Thus, the study using Engel
Granger Error Correction Model and Dynamic Stochastic Variance Decomposition Model on
a time series data collected from Central Bank of Nigeria Statistical Bulletin. The error
correction results in both model 1 and model 2 are robust and consistent with their signs; the
impact of gender inequality is positive in both short run models, but significant only in model
1 before the control variables were introduced. Again, the variance decomposition result
indicates that gender Inequality emits the highest impulse on the rate of unemployment at
34.735% on average of the ten periods. While economic growth has a negative impact on the
rate of unemployment for the two models and exerted only 8.438% impulse on average. The
variance decomposition results also showed that unemployment rate transmitted on average of
78.453% impulse on itself for the 10periods under review. Exchange rate, inflation rate, and
gross capital formation emitted 28.68%, 10.78%, and 6.81% respectively on average on
unemployment rate. Finally, population growth rate transmitted 5.59% impulse on
unemployment. There is a long run relationship between the variables and the speed of
adjustment towards equilibrium is 52%. Thus, we conclude that gender inequality is a strong
factor of unemployment and policy makers and government should embark on developing laws
that will reduce/eradicate gender disparity in Nigeria.
KEYWORDS: Unemployment, Gender Inequality, Economic Growth, Error Correction
Model, Variance Decomposition.
INTRODUCTION
Unemployment is one of the developmental problems that face every developing country in
the 21 century and globally. A cursory view of the unemployment problem in Nigeria which
has been high and rising in the face of declining economic growth, increasing population rate
that is most times divided along gender lines is a case of great economic concern. In Nigeria,
the labour market is characterized by high rate of unemployment, low wages and poor working
condition. The incident of unemployment rate in Nigeria is alarming, the population of
unemployed Nigerian increased by 518 000 to over 1.45million from 2015 to 2016 (National
Bureau of Statistic 2016) and among the causes are epileptic electric power supply, poor quality
of education, lack of skills, negligence of Agriculture as a source of income and corruption

Global Journal of Human Resource Management
Vol.5, No.5, pp.12-41, June 2017
___Published by European Centre for Research Training and Development UK (www.eajournals.org)
13 ISSN 2053-5686(Print), ISSN 2053-5694(Online)
among others. These situations have a ripple effect on the aggregate economy; it has caused an
increase in crime rate, threat to peace and stability, reduction in investment and migration, and
most importantly decline in economic growth and its determinants.
The relationship between unemployment and economic growth cannot be over emphasized and
when x-rayed it involves a direct relationship with the factors of growth, the determinants of
economic growth have been widely debated in developed and developing countries and the
conclusion have been dissenting among economic theories and policy makers. The most
significant and conventional theory developed by Harrold - Domar stresses that economic
growth depends on the level of national savings and the productivity of capital investment
(known as the capital-output ratio). To avoid the limitation of this model, an exogenous model
developed by Solow – Swan emerged and incorporated new term productivity (technical
progress). The Solow – Swan affirmed that growth is determined by changes in the capital
investment, labour force growth and depreciation in the short run while in the long run, growth
is achieved through technical progress. Another group of theorist, Arrow (1962), Uzawa
(1965), Romer (1986), Lucas (1988) and Rebelo (1991) argued that the factors of growth are
endogenously determined and investment in human capital, innovations, and knowledge are
significant and relevant for growth to take place, while emphasizing on the externalities and
spill-over effects of a knowledge based economy and macro-policies that encourages subsidies
for research and development in the education of the labour force. Here education becomes the
key to empowerment of the labour force on skill and knowledge to reduce unemployment rate.
Again, the classical theorist maintain that the economy is always capable of achieving the
natural level of real GDP or output when the economy’s resources are fully utilized, there exists
a gap and flexibility of wage rate that keeps the labour market. Keynesian theory, stress that
change in aggregate demand whether anticipated or unanticipated have their greatest short-run
effect on real output and employment, not on prices. While Okun’s law investigates the
statistical relationship between unemployment rate and economic growth rate of its economy
with the intentions of revealing how much of a country’s GDP may be lost when the
unemployment rate is above natural rate and established that there is a negative relationship
between unemployment and output (conditional on the labour force). In the same vein, many
research have been conducted to ascertain the correlation between economic growth and
unemployment: (Moosa 1996, Ahmed and Abdelaziz 2002, Geldenhuys 2007) found positive
correlation between unemployment and growth, while Iran et al (2010) and Tirelli (2001) found
no relationship between the variables. Li (2001) indicate that the link between growth and
unemployment depends on the labour market institution and Brecher et al (2002) also affirm
that labour market forces may reduce unemployment rate.
The puzzle here is can gender disparity be a factor of unemployment. Gender equality is a key
factor in contributing to the economic growth of a nation especially in developing nations
where women contributions in informal sector is unbeatable, while gender inequality holds
back growth of individuals, development of countries, to the disadvantage of men and women.
The discrimination against women remains a common occurrence today and serves to hinder
economic prosperity. According to report by the National Bureau of Statistic 2015, women
constitute roughly half of Nigerian’s population; the percentage population of women against
men is 49.4% (female) to 50.6% (male). And half of the population of work force in Nigeria
consists of female workers. However, the type of work as well as the condition under which
women work and access opportunities for improvements differs from men. Women are often
disadvantaged in access to employment opportunities, access to finance and conditions of work

Global Journal of Human Resource Management
Vol.5, No.5, pp.12-41, June 2017
___Published by European Centre for Research Training and Development UK (www.eajournals.org)
14 ISSN 2053-5686(Print), ISSN 2053-5694(Online)
based on their family functionalities. Also, women are disadvantage in education, for example;
the literacy rate of male population is 69.17% while that of female is 49.68%. And it is recorded
that the illiterate rate of male is 17,549.004 against a high rate of female illiterate 27,677.301.
Besides, despite significant progress in female labour force participation over the past decades,
there exist pervasive and persistent gender differences across different sectors of the economy;
the Labour Force Participation Rate (LFPR) of age 15 – 64 years for women was 65.1% against
71.4% for men in 2015. There are obvious labour segregation, inequality due to under
investment in human capital (schooling and training), differential income roles, and
comparative biological advantages in entry level, entry barriers, preferences and prejudices in
Nigeria labour sector. Gender equality through empowerment of women is the primary factors
that promote economic growth and there is a decline in growth, when women are not fully
participating in labour force in Nigeria only half of the able population is being utilize and thus
economic resources are not fully utilized and there is a decline in productivity and this result
to unemployment.
Therefore, this paper seeks to answer obvious questions; (a) is there short run relationship
between unemployment rate, gender inequality and economic growth in Nigeria, (b) What is
the response of unemployment to unit external shocks to gender inequality, economic growth
and gross fixed capital formation?
The prime objectives of this study are; (a) to ascertain the short run impact of gender inequality
and economic growth on unemployment rate in Nigeria from 1980 to 2014, (b) to check the
response of unemployment to external shocks from gender inequality, economic growth and
gross fixed capital formation.
LITERATURE REVIEW
Concept of Unemployment
International Labour Organization (ILO) defined unemployment as the number of the
economically active population who are without work but available and seeking work,
including people who have lost their jobs and those who have voluntarily left work.
Unemployment is defined by the Bureau of Labour Statistics (BLS) as people who do not have
a Job, or people who have actively looked-for work in the past four weeks, and are currently
available for work. Unemployment is a phenomenon that transpires when a person who is
actively searching for employment is unable to find work. It is calculated by dividing the
number of people who are unemployed by the total work force and represented as a percentage.
It is often used as a measure of the health of the economy. The ILO categorized the
unemployment as the number of persons who are either out of work, want a job, and are actively
searching for work in the last
four weeks and are available to start work in the next two weeks or are out of work, have found
a job, and are waiting to start it in the next two weeks.
There are three classes of unemployment which include: cyclical unemployment, structural and
frictional unemployment. Cyclical unemployment is the type of unemployment that occurs due
to business cycle downturn. The main cause of the cyclical unemployment is a fall in aggregate
demand or decline on the total spending in an economy (Egunjobi 2012). Cyclical

Global Journal of Human Resource Management
Vol.5, No.5, pp.12-41, June 2017
___Published by European Centre for Research Training and Development UK (www.eajournals.org)
15 ISSN 2053-5686(Print), ISSN 2053-5694(Online)
unemployment is a factor of overall unemployment that relates to the cyclical trends in growth
and production and it has direct relationships with business cycle fluctuation. It always
presents in economic recession or period of very low productivity, when there is insufficient
aggregate demand.
Structural Unemployment is usually referred to as long-term unemployment, which arises due
to changes in the structure of the economy and technology advancement. It is due to
insufficiencies in the labour market, it can also occur due to mismatch in skill or geographical
location. For example, structural unemployment could be due to occupational immobility,
geographical and technological changes. While Frictional Unemployment results from lack of
information and changes in the supply of labour when wage rates are flexible. This type
includes the unemployment of persons who temporarily lose jobs or decide to change job as
well as new entrants into labour market. There is always likely to be frictional unemployment
in an economy as people take time to find a job that is suited to their skills. Other concepts of
unemployment include seasonal unemployment, this type occurs in seasonal trading or
weather/climates changes. Also, we have disguised /hidden unemployment and voluntary
unemployment.
Theories of Unemployment
Classical Theory of unemployment
Theoretically there are fundamental ideas by the classical and the Keynesian on what causes
unemployment in an economic system. In the classical view, unemployment occurs when real
wage is kept above the market clearing wage rate, leading to a surplus of labour supplied. Here
unemployment is also known as real wage unemployment. It is because of the real wage being
too high in an economy; firms cannot profitably engage labour as a result of increase in the
wage rate.
Figure 2.1; Shows the Classical model of unemployment
Source: Author’s design 2017
Q1
Wage
Rate
Quantity of Labour
W1
W2
Supply
Q3 Q2
Unemployment rate
Demand
Global Journal of Human Resource Management
Vol.5, No.5, pp.12-41, June 2017
___Published by European Centre for Research Training and Development UK (www.eajournals.org)
16 ISSN 2053-5686(Print), ISSN 2053-5694(Online)
In an economic system labour is supplied by household and demanded by firms. In the above
diagram, supply curve and the demand curve indicates the quantity supplied and demanded at
a revealing wage rate. In the diagram, the point of equilibrium is indicated where demand curve
intersect supply curve at the wage rate W1. At the equilibrium wage rate W1, the firms are
willing to employ the entire labourer available in the labour market Q2. But as the wage rate
moves up to w2, there is a decline in the quantity of the labourer from Q2 to Q1 and supply of
labours increases from Q2 to Q3. Therefore, the quantity supply of labourer increases more
than the quantity demanded by the firms and this results in unemployment. At the point W2,
the real wage is higher than the market equilibrium wage rate (W1).
The classicalist believe that unemployment will occur when rigidities are present in the wage
structure and interferences occur to hinder the free working of the market system, may be as a
result of the trade union activities or minimum wage legislation (Egunjobi 2012). Jhigan
(2004) argues that there are many more labourers seeking unemployment at the going wage
than there are jobs available, as such the involuntary unemployment is prevalent. However,
there are short coming on classical model especially in the developing countries where wages
are not flexible downward because they are largely determined by institutional forces including
trade union pressures (Egunjobi 2012).
Keynesian Theory of unemployment
Keynes emphasizes that the equilibrium is determined by aggregate demand and it is cyclical
in nature. During recession or economic downturn, unemployment arises out of imperfections
of the free market economy. Now demand falls short of the supply and there is fall in production
and workers are laid off their jobs. The new Keynesian school of thought believes employment
arises involuntarily and unemployment arises due to economic recession. During this period,
the firm lay off their worker due to fall in aggregate demand. But classical view maintained
that unemployment is voluntary, and could be cleared by natural market forces, while Keynes
believed that government interference is beneficial to an economy. Keynes establishes the
theory of involuntary unemployment by rejecting classical assumption of wage price
flexibility. He assumed that money wage is rigid or inflexible in the downward direction. There
are two reasons for wage inflexibility; money illusion and institutional reasons. He argued that
labour supply function focused on money wage rather than real wage.
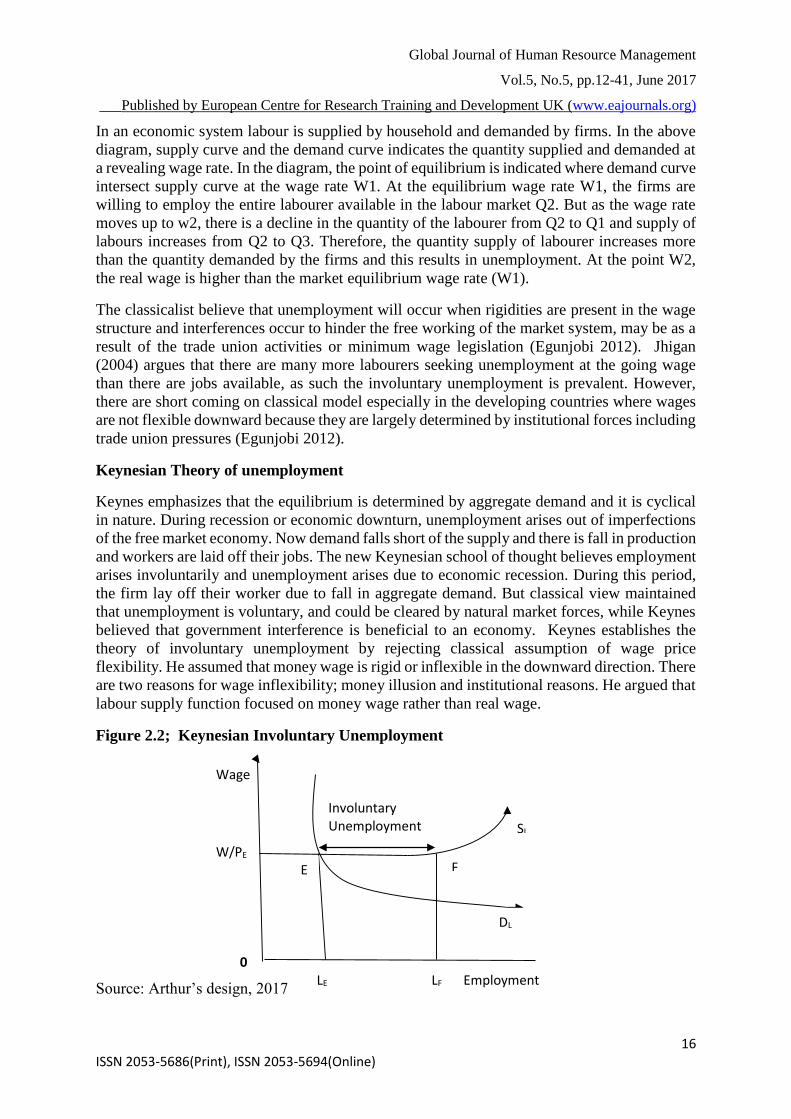
Figure 2.2; Keynesian Involuntary Unemployment
Source: Arthur’s design, 2017
W/PE E F
LE LF
SL
Wage
Involuntary Unemployment
0
DL
Employment

Global Journal of Human Resource Management
Vol.5, No.5, pp.12-41, June 2017
___Published by European Centre for Research Training and Development UK (www.eajournals.org)
17 ISSN 2053-5686(Print), ISSN 2053-5694(Online)
The Keynesian labour supply assumed to be a function of money wage rate because of the rigid
wage rate, the labour supply is perfectly elastic. Let us assume that there is a fixed wage, W,
the supply curve is horizontal in the area above the wage rate (W), and wages are free to rise.
The labour supply must be positive sloping, however, equilibrium in the labour market is
established when labour demand curve intersects the labour supply curve. Point E represent
underemployment equilibrium and a corresponding required real wage (W/PE), at this wage
rate Lf are waiting to work while LE people are employed.
Economic Effect of unemployment
There are so many factors that can cause unemployment in an economic system, and this is
linked to the types and forms of unemployment. And being out of job is a situation that posses
an economic problem not only upon the individual but also to the society and country at large.
Unemployment posses financial cost on the national budgets; that is in advanced countries
where unemployment benefits are being paid by the government. The nation suffers because
the greater the number of the unemployed the greater the national budget will be and this add
to the national cost.
It leads to the reduction in the spending power of the unemployed, as well as decrease in the
spending power of the employed, due to increased taxes and insecurity about their work.
It can lead to recession; unemployment can be harmful to health, mental state, standard of
living. It causes crime, insecurity and violence. And a prolonged unemployment status can
lead to an erosion of skills, skeptism and pessimism about the value of education and training
among others.
Gender Inequality: Concepts and Theories
Gender inequality is referred to unequal treatment or perception of individuals based on their
gender; it is more than a guess for equal pay, for equal work. Following the report of Gender
Inequality Index (GII) (2015), Gender Inequality remains a major restriction to Human
Development all over the world. Many theoretical and empirical literatures have covered many
areas on gender issues, indicating how sensitive the issues of gender differences are in
relationship with labour market.
Theories of Gender Inequality
There are many answer to the question why gender inequality exists, example, gender
inequality is viewed from many perspectives, the functionalists view, the conflict perspective
and the feminists theory of gender inequality.
Functionalist theory was developed by Talcott Parsons in the 1940s and 1950s. The theory
argued that gender inequality is an efficient way to create division of labour to maximize
resources and achieve efficiency. The theory suggests that gender inequality exists in different
part of the economy and is a social system in which a particular segment of the population is
clearly responsible for certain act of labour and another is clearly responsible for other acts.
The theory applied division of labour to view predefined gender roles as complementary.
Women are responsible for cares of home while men provide for the family.
On the other hand, the conflict theory perspective by Frederich Engels, compared the family
structure to the relationship between the bourgeoisie and the proletariat. The theory sees society

Global Journal of Human Resource Management
Vol.5, No.5, pp.12-41, June 2017
___Published by European Centre for Research Training and Development UK (www.eajournals.org)
18 ISSN 2053-5686(Print), ISSN 2053-5694(Online)
as a platform where social groups struggle for dominance. He argues that gender is best
understood as men attempt to maintain power and privileges to the detriment of women. The
men are seen as the bourgeoisie while women are seen as the subordinate group. Therefore,
social problems exist when dominant group exploit or oppress the subordinate.
Then the Feminist theory perceive gender inequality from many perspectives; namely liberal
feminism, socialist feminism, radical, and multi-radical feminism. The feminist theory is an
ideology that opposed gender disparity and male dominance by opposing the functionalist and
the conflicts view of gender inequality. The belief that simultaneous actions bring justice,
fairness, and equity to all people regardless of gender and helps in the development of a society
in which women and men are equal in all areas of life. Feminists attempts to understand the
nature of women in society in order to bring about social changes that will liberate women
from being oppressed and bring parity between women and men.
Thus, Gender inequality is defined by the Feminist theory as disparity that exist among
individuals based exclusively on their gender rather than objective differences in skills,
abilities, or other characteristics. By African culture and economic disposition, women have
been referred to as “minor sex” and this continue to generate conflicts at home and work place.
This maxim that have been accorded to female child, have been debated over decades. And
based on this cultural heritage: the inequality between male and female exist in political sector,
work life and economic affairs, sex and discrimination in employment, occupational gender
segregation by gender, wage pay gap/ income disparity, social life and education.
Understanding the causes and effect of gender inequality is a subject of intense study. Many
empirical literatures have affirmed that, the education of the female child is and still remain the
only sure way to bridge the disparity that exists in the work place and homes. Mat Sui (2013)
affirmed that investment in female education can yield growth premiums in GDP trends and
that narrowing gender gap in employment through education can boost per capita income.
While IMF (2016) posits that better opportunities provided through higher levels of school
enrollment for girls can contribute to broader economic development (IMF 2016).
Women and Labour Market Segmentation
Labour market is segmented if it consists of various sub-groups with little or no crossover
capability. There are two sectors of labour market segmentation; primary and secondary sector.
The primary sector consists of higher- grade, higher status, better paid jobs with the best terms
and conditions. Which means it requires or need long-on the job training in firm-specific skills,
and it guarantee job security and promotional prospects and high reward. While the secondary
market is mostly low skilled workers that require relatively little training, there is no barrier to
job mobility because the wages are low and the terms of conditions of the job are poor. There
is no job security and no promotional prospect. Both primary and secondary labour market
possesses different wages with different employment characteristic. Unfortunately, the
secondary sector is dominated by female workers, due to limitations for them to access the
primary sector.
In recent time, it is often difficult to think of women as oppressed minority. They are seen in
all the social stratification (primary and secondary sector), women are no longer regulated to
positions of wives, mothers, secretary but good number have gone through education and are
doctors, engineers, lawyers, nuclear physicists as well as truck drivers. Despite this
development, women are still underrepresented when compared to their majority status in the
population. They receive unequal treatment when compared to men. A report published by

Global Journal of Human Resource Management
Vol.5, No.5, pp.12-41, June 2017
___Published by European Centre for Research Training and Development UK (www.eajournals.org)
19 ISSN 2053-5686(Print), ISSN 2053-5694(Online)
Center for American Women in Politics (2013) shows that out of 535 members of 113th
congress only 98 are women. In 2012, median income for year – round male workers was
$50,955 as against $39,977 for female workers (Us Census Bureau 2012).
In Nigeria one of the major Millennium Development goal is to promote gender equality and
empower women and reduce the pay wage gap that exist in the labour market. This can be done
if only women are empowered through education. Ntuli (2007) affirms an expansion in the
labour force participation of women in South Africa from 38 percent in 1995 to 46 percent in
2004. Beside the analyses of women's participation rates in labour force by race show that the
rates for Africans are still lower than those of Whites. For instance, in 1995 African women
had a participation rate of 34 percent and it rose to 43 percent in 2004 while the corresponding
rates for White women were 52 percent and 59 percent respectively (Center for American
Women in Politics, 2013).
Anugwom (2009) examined the implication of the growing educational opportunities for
women in Nigeria. He argues that the number of women who have acquired tertiary education
is inconsistent to the number involved in the labour market. This causes low capacity utilization
and a negative return to investment in human resources. Lee and James (2007) show that
shareholder responses to the appointment of female CEOs were more negative than for their
male counterparts. Additionally, while investors demand greater diversity, they simultaneously
punish it by reducing holdings in firms appointing female directors. Parrotta et al (2011) using
a matched employer-employee data-set analyzed how work force diversity in cultural
background, education and demographic characteristics affects productivity of firms in
Denmark. They found that labour diversity in education significantly enhances productivity
and adds value while diversity in ethnicity and demographics induces negative effects on firm
productivity.
Women in Nigeria are predominantly engaged in subsistence agriculture and less likely than
men to be engaged in professional, technical and managerial fields and even in governance.
Women lag behind men in employment status, educational attainment, literacy and exposure.
All these factors mitigate women involvement in socio-political development of Nigeria.
Figure 2.4 below is a reinforcement of the existence of gender inequality in Nigeria. It shows
the disparity in percentage in the employment rate of men and women from age 15 – 49 in
2013
Figure 2.4
Source: Women’s Empowerment and Demographic and Health Outcomes (2013)
0
20
40
60
80
100
120
15-19 20-24 25-19 30-34 35-39 40-44 45-49
Percentage employed Men and Women in Nigeria 2013
(12months)
Male
Female

Global Journal of Human Resource Management
Vol.5, No.5, pp.12-41, June 2017
___Published by European Centre for Research Training and Development UK (www.eajournals.org)
20 ISSN 2053-5686(Print), ISSN 2053-5694(Online)
The employment rate of male from age 15-19 was 87.6% against 31.4% for female, while age
20-24, 25-29, 45-49; the percentage employed men figure rose from 97.6%, to 99.0% and
declined 98.6% against 32.5%, 41.0%, and 45.3% for women respectively.
Education and Gender Inequality: The Nigerian scenario
Human capital is a stock of knowledge and characteristic acquired by an individual that
contributes to his/her productivity. Labour economics views human capital as a set of
skills/characteristic that increases workers productivity. While Bowles-Ginitis sees human
capital as the capacity to work in organization, obey orders, adapt to life in a
hierarchical/capitalist society. This view maintains that the role of schooling is to instill in
individual the correct ideology and approach towards life. Investments in human capital are
inputs in education, health care, professional qualification and other activities which allow
people to be more economically efficient.
Psacharopoulos and Woodhall (1977), states that human capital theory rest on the assumption
that formal education is highly instrumental and necessary to improve the production capacity
of a population. In the same hand, Becker (1993) confirms that education and training is the
important components of investing in human capital and income of better educated and trained
persons are usually higher than average wage rate. Lucas (1988), Romer (1990), Barro and
Lee (1993) using endogenous growth model has shown a positive correlation between human
capital development and economic growth through improving physical capital. They conclude
that human capital development through education and training contributes to economic
development by impacting on general attitudes, specific skills, reducing fertility and improving
living standard.
Education is the basic Human Right according to Universal Declaration on Human Rights in
1948. Education bestows on women a disposition for a lifelong acquisition of knowledge,
value, attitudes and competence and skills (Aliu, 2001). The socioeconomic development of
any nation depends on the education of the women and there is strong correlation that exists
between enrollment of girls in primary school and productivity. To ensure equal access to
education at all level, the Nigerian National policy on education states that access to basic
education is the right of all Nigeria children regardless of gender, religion, and disposition and
disability.
Nevertheless, there has been disparity in primary and secondary education in Nigeria since the
pre-colonial era. Girls enrollment in basic education has been very low, before 1920- primary
and secondary education was within the scope of Christian organization, out of 25 secondary
schools only three 3 were girls. In 1949, the colonial government gave subventions to voluntary
associations involved in education out of 57secondary School; only 8 were exclusively for
girls.
The first national plan for basic education was announced in may 1961 in collaboration with
the United Nation‘s Universal Declaration of Human Rights and UNESCOs educational plans
for Nigeria in Addis Ababa Ethiopia. The main objective was to achieve 100% universal
primary education in Nigeria in the year 1980. Nigeria has had basic plans and policies geared
towards eradication of illiteracy in Nigeria, in 1970, the United Nation implemented free and
compulsory Universal Primary Education (UPE). There have been many conferences and
researches internationally and nationally on empowering girl child through education.

Global Journal of Human Resource Management
Vol.5, No.5, pp.12-41, June 2017
___Published by European Centre for Research Training and Development UK (www.eajournals.org)
21 ISSN 2053-5686(Print), ISSN 2053-5694(Online)
Taking lead from the cultural disposition, there has been more boys than girls participation in
education in Nigeria until 1970. According to Aromolaran and Adebayo (2004) from 1970 to
1994, the enrollment of girls in primary education has steadily increased from 30% to 80%.
But still there exists obvious difference between enrollment of males and females in all levels
of education in Nigeria. The Bureau of Statistics (2014), National literacy survey posit that the
literacy rate of male and female in Nigeria is 70.1% and 50.4% respectively, again showing the
gender inequality exists. Issues of gender disparity in education and employment have been a
theme of debate for so long. In Nigeria, there are obviously gender disparity between the
education of boys and girls. And this because of cultural values and traditions, cost of education
and colonial policies among others. To correct this, many policies have emerged and the most
recent is the 2015 Millennium Development Goals which have a target on gender parity.
Bakare (2015) affirmed that despite on-going policies and encouragement from the
government, improvements to female education across African continent have been slow.
Literacy rate is the most crucial factor of human development because specialized training for
literate persons is less costly. The Neoclassical theory of economic growth emphasized on the
technical progress as an important factor of growth; which is exogenously determined. But
human development (education and training) are endogenously determined. Therefore, without
education we cannot achieve technical progress because education is wealth. Educated women
have equal opportunity in employment, high standard of living, high life expectancy, and better
chances in most spheres of life.
Table2.1: Nigeria’s GDI Value (2015)
Description Female Male
Life expectancy at birth 53.1 52.4
Expected year of schooling 8.2 9.8
Mean year of schooling 4.9 7.1
GNI per capita 4,052 6,585
Human Development Index Value 0.466 0.556
Labour Force Participation Rate (% age 15 …) 48.2 63.7
Domestic Work (% of total employment) 0.6 0.4
Data Source: Nigerian HDI (2015)
The above table 2.1 shows inequality in various human developments indicator for female
and male in Nigeria for 2015.

Global Journal of Human Resource Management
Vol.5, No.5, pp.12-41, June 2017
___Published by European Centre for Research Training and Development UK (www.eajournals.org)
22 ISSN 2053-5686(Print), ISSN 2053-5694(Online)
Figure 2.5: Shows the percentage difference in literacy rate of men (72.1%) and women
(50.4%).
EMPIRICAL LITERATURE
There are different strands of empirical literature reviewed to achieve our objectives in this
study;
Empirical Literature on the Relationship between Unemployment and Economic Growth
Obviously there has been a relationship between economic growth and unemployment rate,
Economist Arthur Okun unveils this in 1960s which later become Okun’s law. Okun’s law
investigates the statistical relationship between a country’s unemployment rate and the growth
rate of the economy. He tried to study how much of the country’s gross domestic product
(GDP) may be lost when the unemployment rate is above its natural rate.
Since output depends on the amount of labour used in the production process, so there is a
positive relationship between output and employment and invariably there exist a negative and
inverse relationship between unemployment and output growth (and it is conditional on labour
force). According to Okun, to achieve 1% decline in unemployment rate annually, real GDP
must grow approximately at 2% faster than the rate of growth of potential GDP over that period.
That is if the potential rate of GDP growth is 2%, Okun’s law says that GDP must grow at 4%
rate for one year to achieve 1% reduction in the rate of unemployment.
Moosa (1996) carried out a study to validate Okun’s law for Canada, Italy, UK, US, France,
Germany, Japan, using Harvey’s structural time series model and found that Okun’s coefficient
is high in North America and lower in Japan. Ahmed and Abdelaziz (2014) investigate the
validity of Okun’s law in Sudan using cointegration analysis and discovered long-run
relationship between real GDP Growth and unemployment rate. And the findings detected a
negative and statically significant relationship between the two variables. Also, using a
different method to calculate Okun’s coefficient Marinkov and Geldenhuys (2007) found
support for negative relationship between unemployment and economic growth in South
Africa. Al-Habees and Ruinman (2012) apply Okun’s law to study the relationship between
unemployment and economic growth in Jordan and some Arab countries to evaluate the reasons
for high unemployment rates.
72.1%Men
50.4%Women
Fig 1a; Total Literacy in Nigeria (percentage)
Source: Nigeria Demographic Profile
2014

Global Journal of Human Resource Management
Vol.5, No.5, pp.12-41, June 2017
___Published by European Centre for Research Training and Development UK (www.eajournals.org)
23 ISSN 2053-5686(Print), ISSN 2053-5694(Online)
In Asian countries, Iran et al (2010) employ Engel Granger Cointegration method and Error
Correction model for short –run analysis and found no support for no relationship between
output and employment.
Campbell and Chol-Won Li (2001) using efficiency wage model identified five channels
through which the productivity slowdown can affect workers’ effort incentives and he found
that the link between growth and unemployment depends on labour market institutions. While
Parello (2009) introduces an efficiency wage and unemployment in a model of growth with
endogenous technical changes under two objectives, the study provides an analytical model of
growth which can be viewed as an alternative to the standard models of growth and search
employment. On the other hand, they analyzed the steady state effect of labour market policies
on equilibrium unemployment and long-run economic growth, the result indicates a positive
relationship between growth and employment, the effectiveness of any labour market policy
aimed at improving the performance of the labour market crucially depends on how individual
discount future income. While Brecher et al (2002) using a dynamic efficiency wage model
with labour augmenting technical progress, study the long-run relationship between
unemployment and growth. The study assumed that the rate of productivity is either exogenous
or endogenously determined, and concludes that there is an exogenous increase in the growth
rate which may raise the rate of efficiency wage unemployment while a permanent increase in
the labour force may reduce the unemployment rate in the endogenous-growth case. Meckel
(2004) extends his previous model by introducing skilled and unskilled labour to analyze
whether the emergency of growth – employment trade off is skill linked to intersectional wage
differentials. He finds that the importance of wage differentials for the growth – unemployment
trade off remains when differential between skilled and unskilled labour and that higher
minimum wages for unskilled labour increases growth and unemployment of the unskilled
while reducing the unemployment of skilled labour.
Likewise, Benigno et al (2015) proposes a theory of low-frequency movements in
unemployment based on asymmetric real wage rigidities. The study predicts that long-run
unemployment increases with a fall in long-run productivity and a rise in the variance of
productivity growth. Chen, Rezai and Semmler (2007) study the nexus between productivity
growth and unemployment using disaggregated data on productivity growth into short and long
-run component, they employed a maximum likelihood estimation (MLE), structural vector
autoregression (SVAR) and non-parametric time varying estimation. They find productivity
growth effect on unemployment positive in the short run, while in the long run productivity
growth reduces unemployment and Tirelli (2001) finds a negative correlation between growth
and unemployment.
Empirical Study on Gender Inequality Relationship with employment and economic
growth
Khera (2016) using a dynamic stochastic general equilibrium model for India evaluates the
impact of gender targeted policies on female labour force participation, female formal
employment, gender wage gap, as well as aggregate economic outcomes. He discovers that
policies that increases female labour participation and output and lack of sufficient formal job
creation due to labour market rigidities leads to an increase in unemployment, informality and
further widens gaps in formal employment and wages. Lorgelly and Owen (2002) build gender
inequality into Solow framework but treating male and female education as separate factors of
production. Their model was tested by regressing education gender differentials on steady state
levels of output per worker; they found that continued higher rates of gender inequality are

Global Journal of Human Resource Management
Vol.5, No.5, pp.12-41, June 2017
___Published by European Centre for Research Training and Development UK (www.eajournals.org)
24 ISSN 2053-5686(Print), ISSN 2053-5694(Online)
associated with lower levels of steady state output per worker. While Azid et al. (2001)
analyzed economic behavior of the female workers involved in the business of embroidery
Pakistan and they indicate that the factors influencing female participation in cottage industry
are number of children, age, education, poverty status and all have a positive and significant
impact on female labor force participation. In the same way, Naqvi and Shahnaz (2002) argued
that the number of children in a household and the presence of a female household head are
negatively linked to women’s economic participation. Although women’s age and education
level have a positive correlation on female labour force participation, and marital status has
negative impact on women participation. Older women, better educated women, women who
are household heads, and women from smaller, financially stronger urban families are more
likely to choose to participate, while younger women, poorly educated women, and women
from larger families are more likely to be compelled to participate in the labor market.
Ruwanpura (2004) took another dimension theoretical to review the quality of women’s
employment in the South Asian and African regions and affirms that geographical areas is a
strong factor in Women labour Participation. Again, in a study on Ghana, Sackey (2005) finds
that both primary and post-primary schooling have a positive impact on female labour force
participation and a negative impact on fertility. In addition, the gender gaps in education have
narrowed over the years and it is important for government policies to ensure that the gains of
female education are sustained. Education is thus an important determinant of female human
capital and productive employment. In addition, Olusoji (2006) considered the determinants of
female labour participation in Nigeria, to include differences in hours put in by both women in
formal and informal sectors, family size, relationship with household head, and sector of
participation, education and location. Ntuli (2007) utilises a decomposition technique devised
by Even and Macpherson (1995) on a survey data to examine the determinants of the low-level
participation of an African woman in labour force. The result indicates that education is the
prime factor, among other factors like non-labour income, marriage, fertility and geographical
variations in economic development persistently stifled participation. It is argued that the
perceived change in participation is due to emigration and changes in human capital and
financial endowments. Secondly 9 percent of the observed shifts in the participation rates from
1995-2004 is due to disparities in characteristics while differences in coefficients account for
109 percent of the shifts.
In Pakistan, Faridi et al (2009) employ logistic regression technique in a cross-sectional date,
argues that the analysis of labour market participation is useful for formulating employment
and human resource development policies. Females form almost more than half of the total
population in Pakistan. The study endeavors to estimate the various factors which affect the
women work participation, the result shows educational attainment levels to be significant
determinant. Female’s labour force participation rises with increasing level of education.
Presence of children in early age groups reduces the female labour force participation. In the
same way, the results of the study conclude that female education is necessary for better
employment opportunities. Fadayomi and Ogunrinola (2013) examin empirically, the
influence of household structure on labor market participation in Nigeria. The study establishes
the relative importance of the household structure in influencing labor force participation of
household members while the other traditional economic and socio-demographic variables
conform to apriori expectations. While in a separate study, Faridi and Ayesha (2014) evaluates
the factors that affect educated women’s decision to participate in the labor force, and found a
positive effect of age, levels of education, husband’s education level, marital status, family
structure, and family expenditure. The presence of an educated father, being an educated

Global Journal of Human Resource Management
Vol.5, No.5, pp.12-41, June 2017
___Published by European Centre for Research Training and Development UK (www.eajournals.org)
25 ISSN 2053-5686(Print), ISSN 2053-5694(Online)
married woman, location, distance from the district headquarters, the husband’s employment
status and income, and ownership of assets significantly reduces women’s labor force
participation. The results of the earnings equation show that variables such as women who live
in an urban area and their level of education and experience are associated with a substantial
increase in earnings with each additional year. The number of children has a negative and
significant impact on women’s earnings. The hours-of-work model shows that age and the
number of completed years of education have a positive effect on working hours, while the
number of dependents and the number of hours spent on household activities have a negative
effect on working hours. Also, Iweagu et al (2015) uses the logistic regression on a house hold
survey data of employment to explore the determinants of labour force participation separately
for urban and rural sectors of Nigeria. The study discovered that the determinants of female
labour participation were not the same in urban and rural areas. The results imply that marital
status, religion, poverty rate and per capita income were significant determinants in the rural
sector, while age and literacy rate were the significant determinants in the urban sector.
Likewise, Gaywan and Adeboyo (2015), using a logistic model with geo-additive predictors
examined the determinants and geographical variations of employment of women, diffuse
priors were assumed for modeling fixed effects, Bayesian p-spine for the nonlinear smooth
functions and intrinsic conditional autoregressive prior for the spatial effects. Results showed
that while a north-south divide existed in the likelihood of women engaging in all-year
employment against not working, an east-west divide was found in seasonal/occasional jobs.
Model Specification
Many literatures have modeled the relationship between unemployment and economic growth.
But this study follows the work of Al-Habees and Rumman (2012), the study examines
relationship between unemployment and real GDP in Jordan and some Arab countries using
the law of Arthur Okun. Okun (1962) affirms that unemployment is a negative proportion
(decline) against the nature of actual economic growth rate.
U = A + B (Y – Y*) …………………………. (1)
According to Al – Habees and Rummen (2012), the above equation supposes to determine the
natural percentage of unemployment determined by Okun with 3% on determining the potential
growth rate (Y*) and changes over time, using dynamic analysis we have;
Y + ΔU = α + bΔε …………………………. (2)
Where
ΔU = change in the rate of unemployment
Y = economic growth changes
b = flexibility between growth and unemployment
ε = the error rate
Variables α, b are the parameters that specify the percentage of natural growth or actual one
which reflects rate of unemployment when declined.
Y* = α/b

Global Journal of Human Resource Management
Vol.5, No.5, pp.12-41, June 2017
___Published by European Centre for Research Training and Development UK (www.eajournals.org)
26 ISSN 2053-5686(Print), ISSN 2053-5694(Online)
α/b is the rate needed to maintain the unemployment rate unchanged, which ensures stability
of the employment rate. The influence between the growth and unemployment begin when
there is a higher growth rate than the real potential rate.
b = ΔU/ΔY
b refers to the relationship between the unemployment and growth and it determines the rate
of unemployment change with every change in the unitary economy growth (Al-Habees and
Rumman, 2012).
Thus, our empirical model is specified below;
UNEMt = 𝜷𝟎 + 𝜷𝟏RGDPt + 𝜷𝟐GENIQt +𝛽3𝐺𝐹𝐶𝐹 + µt …………………………. (3)
The above model was developed to achieve our first objective, and our variables are UNEM
(unemployment rate), RGDP (Real GDP), GENIQ (gender inequality), GFCF (gross fixed
capital formation), µt (the error term), t is the time period and 𝜷(s) are the parameter estimate.
Methodology and Time Series Property of Data Used
Regression Analysis/ Spurious Regression Problem
Completely unrelated time series may appear to be related using conventional testing
procedures.
Suppose yt = рyt-1+ vt where vt iid N(0,σ2, v) ……… (5)
xt = рxt-1+ εt where εt iid N(0,σ2, Σ) …………. (6)
with vt and εt independent, ie. E (vt εs ) = 0 for all t and s
when р=1, yt and xt are random walks:
yt = yt-1+ vt and xt-1+ εt ………………… (7)
If we run a regression between yt and xt : yt = α + β xt + u t ……………. (8)
Despite lack of causal relationship, we are likely to find a significant t-ratio for the null H0:
β=0. A simulation study would show that (reject H0 using 5% level test) >75% (Granger 1983,
Engel and Granger 1987)
The problem is that the t-test of β=0 is not N(0,1) even asymptotically. The standard asymptotic
distribution theory does not apply when variables have unit root.
Cointegrating Regression and Granger Theorem
Unit Root Test of the Error Term (U) Using Augmented Dickey Fuller Test
Using Engel-Granger Critical Values for the Unit Root testing at 5% which is equal to (-3.34).
Here we are concerned with testing for cointegration of the error term in a system. If resid is
found 1(1) and have a long run relationship, and there must be some force which pulls the
equilibrium error term back to zero. (Granger 1983, Engel and Granger 1987)

Global Journal of Human Resource Management
Vol.5, No.5, pp.12-41, June 2017
___Published by European Centre for Research Training and Development UK (www.eajournals.org)
27 ISSN 2053-5686(Print), ISSN 2053-5694(Online)
Therefore we estimate the long run equation: yt = ɗ0 + ɗ1 xt + u t …………….. (9)
The OLS residuals from the above equation are a measure of the disequilibrium:
ȗ t = yt - ɗ0 - ɗ1 xt ………………… (10)
A test of cointegration is a test of whether ȗ t is stationary. This is determined by ADF tests on
the residuals. If cointegration holds, the OLS estimator is said to be super consistent. Implying
that there is no need to include 1(0) variables in the cointegrating equation (Granger 1983,
Engel and Granger 1987)
Error Correction Model
If the variables are cointegrated, we can run error correction model (ECM) as below;
D(Yt) = β1 + β2 D(Xt) + β3ut-1 + v …………………… (11)
where ut-1 is the one period lag residual of the model, v is the white noise error term and β1 is
the intercept while β2and β3 are the coefficients.
Variance Decomposition for Objective 2
The variance decomposition indicates the amount of information each variable contributes to
the other variables in the autoregression model. It determines how much of the forecast error
variance of each of the variables can be explained by exogenous shocks to the other variables.
Yt = v + A 1Y t-1 + … + u t ………………. (12)
In econometrics variance decomposition is used to support or aid in the interpretation of a
vector autoregression (VAR) model once it is fitted (Levine 2004 in Ogbuagu and Ewubare
2014).
Econometric Procedural (Test)
Breusch-Godfrey Serial Correlation LM test; test for autocorrelation.
Arch LM Test for Heteroscedasticity
And Jarque – Bera to check whether the residuals are normally distributed
Presentation of Result and Interpretation
Table 3.1 Correlation Matrix
C D(RGDP) D(GENIQ) D(GFCF) U(-1)
C 0.101570 7.78E-05 -0.736991 0.002132 0.004291
D(RGDP) 7.78E-05 0.001978 -0.096209 -0.001009 0.000832
D(GENIQ) -0.736991 -0.096209 148.2247 -0.041569 -0.639457
D(GFCF) 0.002132 -0.001009 -0.041569 0.008471 -0.001106
U(-1) 0.004291 0.000832 -0.639457 -0.001106 0.025905
The result of the correlation matrix indicates a very poor linear relationship existing between

Global Journal of Human Resource Management
Vol.5, No.5, pp.12-41, June 2017
___Published by European Centre for Research Training and Development UK (www.eajournals.org)
28 ISSN 2053-5686(Print), ISSN 2053-5694(Online)
the dependent (unemployment) and the independent variable (economic growth, gender
inequality and gross fixed capital formation.) as shown in the table above.
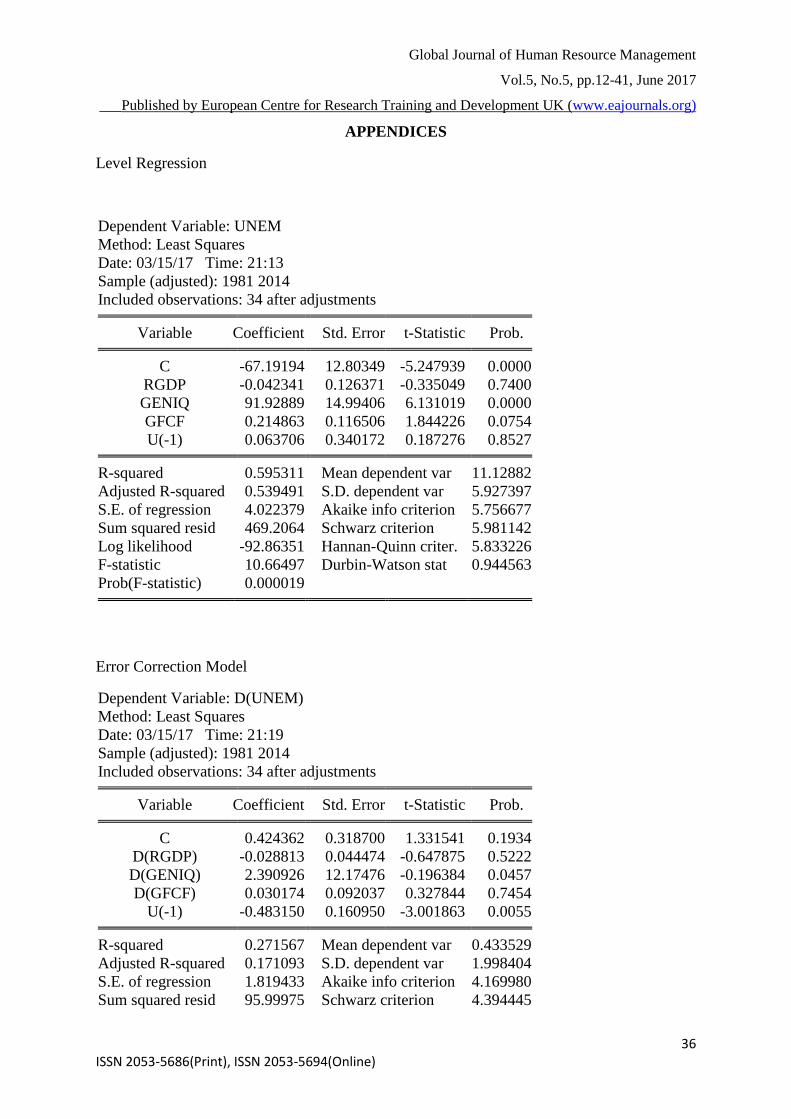
OLS Regression at Level to check the spurious Nature of our model 1 and the result is
presented below;
Table 3.2 Dependent Variable: UNEM
Method: Least Squares
Variable Coefficient Std. Error t-Statistic Prob.
C -67.19194 12.80349 -5.247939 0.0000
RGDP -0.042341 0.126371 -0.335049 0.7400
GENIQ 91.92889 14.99406 6.131019 0.0000
GFCF 0.214863 0.116506 1.844226 0.0754
U(-1) 0.063706 0.340172 0.187276 0.8527
R-squared 0.595311 Mean dependent var 11.12882
Adjusted R-squared 0.539491 S.D. dependent var 5.927397
S.E. of regression 4.022379 Akaike info criterion 5.756677
Sum squared resid 469.2064 Schwarz criterion 5.981142
Log likelihood -92.86351 Hannan-Quinn criter. 5.833226
F-statistic 10.66497 Durbin-Watson stat 0.944563
Prob(F-statistic) 0.000019
The result in the above table indicates that there is no spurious regression since the R2
coefficient (0.595311) is less than the Durbin-Watson stat (0.681549). And the result showed
that gender inequality significantly and positively affects the rate of unemployment at levels.
While economic growth has a negative insignificant impact on the rate of unemployment, gross
investment has positive significant impact on the rate of unemployment.
Unit Root Result of the Error Term (U) Using Augmented Dickey Fuller Test
Using Engel-Granger Critical Values for the Unit Root testing at 5% which is equal to (-3.34).
Table 3.3
tstatistics Constant Constant &linear trend None
Level -2.423563 -2.761927 -2.463960
1st differenced -6.544694 -6.569530 -6.64376
Author’s Computation 2017
The results in table 3.3 as presented above confirms that the error term is not stationary at level
since tstatistics is less than the Engel-Granger Critical value at 5%, also at first differenced as
the tstatistics values are all greater than the Engel-Granger Critical value at 5%, therefore our
variables in model are stationary at first differenced. Our variables are co integrated, which
means that they have long-run relationship.

Global Journal of Human Resource Management
Vol.5, No.5, pp.12-41, June 2017
___Published by European Centre for Research Training and Development UK (www.eajournals.org)
29 ISSN 2053-5686(Print), ISSN 2053-5694(Online)
Table 3.4 ERROR CORRECTION Result for MODEL
Dependent Variable: D(UNEM) Method: Least Squares
Variable Coefficient Std. Error t-Statistic Prob.
C 0.424362 0.318700 1.331541 0.1934
D(RGDP) -0.028813 0.044474 -0.647875 0.5222
D(GENIQ) 2.390926 12.17476 -0.196384 0.0457
D(GFCF) 0.030174 0.092037 0.327844 0.7454
U(-1) -0.483150 0.160950 -3.001863 0.0055
R-squared 0.271567 Mean dependent var 0.433529
Adjusted R-squared 0.171093 S.D. dependent var 1.998404
S.E. of regression 1.819433 Akaike info criterion 4.169980
Sum squared resid 95.99975 Schwarz criterion 4.394445
Log likelihood -65.88966 Hannan-Quinn criter. 4.246529
F-statistic 2.702870 Durbin-Watson stat 1.638103
Prob(F-statistic) 0.049909
Author’s Computation 2017
From the above result, gender inequality has a positive and significant impact on the rate of
unemployment with the coefficient of (2.3909), while economic growth has a negative but
insignificant impact on the rate of unemployment. The signs of our variables conform to the
approri expectation, from our economic theory we are expecting that the rate of an economy’s
growth will be able to reduce unemployment rate because growth causes increase in
productivity and once an economy is productivity, more labour will be employed, thereby
reducing the rate of unemployed. Though, in this case the negative impact of economic growth
in Nigeria have no significant value on the unemployment rate. Gender inequality is found
positive and significant showing that it is a strong factor of unemployment. The long-run
coefficient U(-1) is negative and significant, indicating that there is long-run relationship
between the variables under review and the speed of adjustment towards the equilibrium is
52%. Finally only 27% of the variation in unemployment is explained by economic growth,
gender inequality and gross fixed capital formation.
Econometric Procedural (Test)
Table 3.5; Normality Test using Jarque-Bera
0
1
2
3
4
5
6
7
8
-4 -3 -2 -1 0 1 2 3 4
Series: Residuals
Sample 1981 2014
Observations 34
Mean 1.50e-16
Median -0.078994
Maximum 3.932753
Minimum -4.063348
Std. Dev. 1.705603
Skewness -0.108085
Kurtosis 3.381084
Jarque-Bera 0.271936
Probability 0.872871
Source; Author’s computation, 2017

Global Journal of Human Resource Management
Vol.5, No.5, pp.12-41, June 2017
___Published by European Centre for Research Training and Development UK (www.eajournals.org)
30 ISSN 2053-5686(Print), ISSN 2053-5694(Online)
The normality test shows that the model is normally distributed.
Table 3.6; Breusch-Godfrey Serial Correlation LM Test:
F-statistic 1.128081 Prob. F(2,27) 0.3384
Obs*R-squared 2.621995 Prob. Chi-Square(2) 0.2696
The Beusch-Godfrey Serial Correlation results shows that there is no
serial correlation.
Table 3.7; Heteroskedasticity Test: Breusch-Pagan-Godfrey
F-statistic 0.337049 Prob. F(4,29) 0.8507
Obs*R-squared 1.510423 Prob. Chi-Square(4) 0.8248
Scaled explained SS 1.308222 Prob. Chi-Square(4) 0.8600
While the Breusch-Pagan-Godfry test indicates no autocorrelation in the model
Table 3.8; Summary of the Variance Decomposition Result
Period UNEM/UNEM RGDP/UNEM GENIQ/UNEM GFCF/UNEM
1 100.0000 0.994808 6.118690 0.001967
0.056744 2 97.59091 1.891946 7.708178
3 91.66172 1.994093 20.10422 0.067796
1.035790 4 89.44239 2.117571 30.05920
5 88.53806 2.117938 38.17371 2.704816
6 87.74994 2.251654 43.55360 5.042145
7 87.22607 2.417546 46.92644 7.666724
8 86.85423 2.574814 49.11599 10.07492
9 86.50149 2.708014 50.84284 12.11415
10 86.15046 2.791016 52.40312 13.89546
Source; Arthur’s Computation 2017
From the above table 3.8, it is noted that Unemployment rate transmitted an average of
90.1711% impulse on itself for the 10periods under review on average rate. On average
economic growth emitted 2.1859% impulse on unemployment rate for the 10 periods, while
gender inequality discharges 34.50% impulses on unemployment. And gross fixed capital
formation emitted 0.3869%, emitted impulse on unemployment.
CONCLUSION/POLICY IMPLICATION
The objectives of this paper is of two folds; to examine the short-run impact of gender
inequality, economic growth and gross fixed capital formation on unemployment, secondly to
check the variance decomposition of unemployment to external shocks from gender inequality,
economic growth and gross fixed capital formation.

Global Journal of Human Resource Management
Vol.5, No.5, pp.12-41, June 2017
___Published by European Centre for Research Training and Development UK (www.eajournals.org)
31 ISSN 2053-5686(Print), ISSN 2053-5694(Online)
From our model gender inequality has a positive and significant impact on the rate of
unemployment with the coefficient of (2.3909), meaning that the inequality that exist between
male and female enrollment in primary and secondary education is a problem because it
constitute 239 per cent increase in the rate of unemployment for the period under review, while
economic growth has a negative but insignificant impact on the rate of unemployment. The
sign of our variables conforms to the approri expectation, from our economic theory we are
expecting that the rate of an economy’s growth will be able to reduce unemployment rate
because growth causes increase in productivity and once an economy is productivity, more
labour will be employed, thereby reducing the rate of unemployed. Though in this case, the
negative impact of economic growth in Nigeria have no significant impact because the trends
of economic growth in Nigeria have not been inclusive. And this result agrees with the previous
work of (Iran et al 2010, Ahmed and Abdelaziz 2014, Tirelli 2001).
Gender inequality is found positive and significant showing that it is a strong factor of
unemployment especially in less developed countries like Nigeria where female gender are
marginalized in labour force market and mostly in education.
Critical look on the results in table 3.2 and table 3.4, the impact signs of economic growth,
gender inequality and gross fixed capital formation are consistent and robust.
The long-run coefficient U(-1) is negative and significant, indicating that there is long-run
relationship between the variables under review and the speed of adjustment towards the
equilibrium is 52%. Finally only 48% of the variation in unemployment is explained by
economic growth, gender inequality and gross fixed capital formation.
Again, from variance decomposition model, it is only gender inequality that transmitted high
external shocks on the rate of unemployment at about 34.50% on the average of 10 periods
under review. This shows that the issue of inequality still perverse in spite of millennial policies
developed towards tackling gender imbalance in the system. . In Nigeria, there are obviously
gender disparity between the education of boys and girls. And this is as a result of cultural
values and traditions, cost of education and colonial policies among others. To correct this,
many policies have emerged and the most recent is the 2015 Millennium Development Goals
which have a target on gender parity. And again, problem of unemployment and its
determinant are diverse. Especially in the case of Nigeria, it is very important to look at
institutional framework disposition; the issues of corruption, religious/political instability, and
terrorism (Boko Haram) are all strong factors of unemployment to be examined.
Policy Recommendation
Unemployment and gender inequality are not new phenomenon, there have been policies and
programs geared towards tackling these issues because theories and researches have affirmed
that the effect slows rate of growth through decline in productivity. Thus, from our findings,
this paper recommends;
1) Public sector reforms should play an important role in promoting gender equality via
labour market regulations, social protection programs and public investment in
infrastructure that will help reduce women’s care burden
2) There should be labour force laws to ensure a reduced wage gap, and gender
stratification in the labour market

Global Journal of Human Resource Management
Vol.5, No.5, pp.12-41, June 2017
___Published by European Centre for Research Training and Development UK (www.eajournals.org)
32 ISSN 2053-5686(Print), ISSN 2053-5694(Online)
3) Policies that will help women’s full representation in labour market and parliaments
should be encouraged to help reposition women for national development
4) Infrastructural imbalance and political/religious problem are all strong factor of
unemployment in Nigeria, therefore there is need for the government to develop
policies and laws to ensure stable environment.
5) Exchange rate policy should be reexamined if Nigeria will record increase in foreign
investment which is very important for economic growth.
Further Research
This paper has tried to evaluate extensively the impact of gender inequality on unemployment
rate with time series secondary data (gross primary and secondary school enrollment rate) from
1980 – 2015, using Engel Granger Error Correction Model and the Dynamic Stochastic
Variance Decomposition Model.
But the issues of gender inequality as it relates to unemployment is a complex one, therefore
we suggest that further studies should consider using primary data (questionnaire) to allow an
inclusive detail aspect of gender issues as it relates to employment especially in the rural areas.
REFERENCE
Ahmed H. and Abdelaziz A. (2014). “Economic Growth and Unemployment in Sudan; An
Empirical
Al Habees M. and Rumman M. (2012) “The Relationship between Unemployment and
Economic Growth in Jordan
Aliu, S, (2001). "The Competitive Drive, New Technologies and Employment: The Human
Capital Link". A Paper
Analysis”. ResearchGate, 13: pp 342 – 355
and some Arab Countries. World Applied Sciences Journal 18(5); pp 673 – 680.
Anugwom E. (2009), “Women Education and Work in Nigeria” Education Research and
Review, vol 4(4): pp 127
Anugwom. E. (2009). Women, Education and Work in Nigeria; Educational research review,
4(4): pp 127-134
Aromolaran, Adebayo B., Female Schooling, Non-Market Productivity, and Labor Market
Participation in
Arrow (1962) “Endogenous Growth Theory” Available;
at SSRN: http://ssrn.com/abstract=493763
Azid, T., Aslam, M. and Chaudary, M. O. (2001), “Poverty, Female Labour Force
Participation, and Cottage
Bakare (2015), “Female Education”. Pearson Nigeria; Available pearsonnigeria.com/press-
centre/female-education.
Barro J, and Jong-Wha Lee. (1993). “International Comparison of Educational Attainment”
Journal of Monetary
Benigno P., Ricci LL, and Surico P. (2015) “Unemployment and Productivity in the Long-run:
The Role of
Bowen W.G and T.A Finegan (1969). The Economics of Labor Force Participation, Princeton,
Princeton University
Global Journal of Human Resource Management
Vol.5, No.5, pp.12-41, June 2017
___Published by European Centre for Research Training and Development UK (www.eajournals.org)
33 ISSN 2053-5686(Print), ISSN 2053-5694(Online)
Brecher, R. Chen, Z. and Choudhri U. (2002). Unemployment and Growth in the Long-Run:
An
Chen, P., Rezai, A. and Semmler, W. (2007): Productivity Growth and Unemployment in the
Short and
Doi:10.5829/idosi.wasj.2012.18.05.16712
Econometrica, 55 pp 251-276
Economic Research Consortium, pp 234 - 258.
Economic Society, pp 51 – 82. ISBN: 978 – 2984-63-9
Economics:32 (3); pp 363-394.
Efficiency-Wage Model with Optimal Savings. International Economic Review: 43 (3); pp.
875-
Egunjobi t. (2013) “Unemployment and Poverty: Nigerian Evidence” 53rd Annual
Conference Paper of the Nigeria
Engel R. and Granger, C. (1987). Cointegration and Error Correction: Representation,
Estimation and Testing,
Even E. and Macpherson D. (1990). “ Plant Size and the Decline of Unionism” Journal of
Economic Letters 32(4):
Executive Appointments. Strategic Management Journal, 28(3): pp 227-241.
Faridi MZ, Malik S, Ahmed RI (2010) Impact of education and health on employment in
Faridi MZ, Malik S, Ahmed RI (2010) Impact of education and health on employment in
Faridi MZ, Malik S, Ahmed RI (2010) Impact of education and health on employment in
Faridi Z. , Malik S. and Ahmed R. (2010). “Impact of Education and Health on Employment
in Pakistan: A Case
Faridi Zahir and Rashid Ayesha (2014). “The Correlates of Women’s Labour Force
Participation in Parkistan. A
Gayawan Ezra and Adeboyo S. (2015). “Spatial Analysis of Women Employment Status in
Nigeria. CBN Journal
Gender Inequality Index 2015, Available: http://hdr.undp.org/en/content/gender-inequality-
index
Granger, C. (1983). “Cointegrated Variables and Error-Correcting Models, Unpublished
Discussion Paper, 83-13,
Holland 22: 3-42
http://www.globalpartnership.org/blog/education-and-income-inequality-importance-basic-
education
http://www.hetwebsite.net/het/essays/growth/endogenous.htm. Date Sourced January 12,
2017
http://www.imf.org/external/pubs/ft/weo/2016/02/
http://www.nigerianstat.gov.ng/report/397
Human Development Report (2010), the real Wealth of Nations Pathway to Human
Development. Retrieved from:
ILO (2016). Women at Work: Trends 2016 International Labour Office – Geneva: ILO, 2016
in Nigeria. The Rural / Urban Dichotomy.” Journal of Economics and Sustainable
Development, 6(10): 212 – 219
Industry: A case study of cloth embroidery in Rural Multan”, The Pakistan Development
Review, 40:4, pp 1105-
International Labour Organisation (ILO) 2015. Available:
http://www.ilo.org/global/research/global
International Monetary Fund (2016). World Economic Outlook (WEO) October (2016).
Available:

Global Journal of Human Resource Management
Vol.5, No.5, pp.12-41, June 2017
___Published by European Centre for Research Training and Development UK (www.eajournals.org)
34 ISSN 2053-5686(Print), ISSN 2053-5694(Online)
Iweagu H., Yuni D, Nwokolo C, and Anderiyangtso B. (2015). “Determinants of Female
Labour Force Paticipation
Jhighan, M. (2004). The Economics of Development and Planning, 37th Edition. Vrinda
Publication India
John Maynard Keynes (2011).” The Concise Encyclopedia of Economics. The Library of
Economics and Liberty. N.d. Web. February 2,
Journal of Economic Literature.35 (2):688-726.
Khera Purva (2016). “Macroeconomic Impacts of Gender Inequality and Informality in India”
International
Labour Studies Geneva Disscusion Paper, DP/151/2004, Pages 1
Lee, P. M. & James, E. H. (2007). She’-E-Os: Gender Effects and Investor Reactions to the
Announcements of Top
Letter, Economic Research Publication
Levine Ross, (2004) “ International financial liberalization and economic growth: Views and
agenda.”
Long Run. SCPEA Working Paper 2007-8, Schwartz Center of Economic Policy Analysis.
Lorgelly P. Knowles S and Owen (2002). “Are Educational Gender Gaps a Brake on Economic
Development?
Lucass R. Jr. (1988). “On The Mechanics of Economics Development”. Journal of Monetary
Economics, North
Macroeconomic Volatility. The Review of Economic and Statistics 97(3) pp 698-709, doi:
10:1162/REST_a_0050
Meckl, J. (2004), "Accumulation of technological knowledge, wage differentials, and
unemployment". Journal of Macroeconomics 26 65-82.
Micro Study. The Labour Journal of Economics: 19(2) pp 155 – 184
Monetary Fund (IMF) Working Paper (WP/16/16)
Moosa I. (1996). “ A Cross- Country Comparison of Okun’s Coefficient” Journal
ofComparative Economics, 24:pp
Naqvi, Z. F., & Shahnaz, L. (2002). How do women decide to work in Pakistan? Pakistan
Development Review,
National Bureau of Staistics (2016). Unemployment and Underemployment. Available:
National Bureau of Staistics 2014. Available: https://knoema.com/atlas/sources/National-
Bureau-of-StatisticsNigeria
Nigeria (January 2004). Yale University Economic Growth Center Discussion Paper No. 879;
pp 1 – 75. Available
Nigerian Human Development Index, 2014, Available:
http://hdr.undp.org/en/countries/profiles/NGA
Nigerian Human Development Index, 2015. Available:
http://hdr.undp.org/en/countries/profiles/NGA
Ntuli, M. (2007). “Determinants of South African Women’s Labour Force Participation 1995
– 2004” Social
of Applied Statistic 6(2) pp 1-17
Okun, Arthur, 1962. Potential GNP: its Measurement and Significance, in Statistics Section,
American
Pakistan: A case Study. European Journal of Economics, Finance and Administrative
Sciences
Pakistan: A case Study. European Journal of Economics, Finance and Administrative
Sciences

Global Journal of Human Resource Management
Vol.5, No.5, pp.12-41, June 2017
___Published by European Centre for Research Training and Development UK (www.eajournals.org)
35 ISSN 2053-5686(Print), ISSN 2053-5694(Online)
Pakistan: A case Study. European Journal of Economics, Finance and Administrative
Sciences
Parello C. (2009). “ A Schumpeterian Growth Model with Equilibrium Unemployment.
Available;
Parrotta.P, Possoli D. and Pytlikovo M. 92011). “Does Labour Diversity Affect Firm
Productivity?” Available;
PP 393-398
presented at the Second Tripartite Conference of Manpower Planners. Chelsea Hotel, Abuja
Press.
Psacharopoulos, G. And Woodhall, M. (1997) Education for Development: An Analysis of
Investment Choice. New
Rebello S. (1991). “Long Run Policy Analysis and Long Run Growth” Journal of Political
Economy 99(3):500. doi:
reports/weso/2015/lang--en/index.htm
Romer, Paul M. (1990). Endogenous Technological Change .Journal of Political Economy
98(5) part II: S71
Ruwanpara Kanchana (2004). “Quality of Women’s Employment, A Focus on the South.
International Institute for
S102.
Sackey, H. A. (2005). Female labor force participation in Ghana: The effects of education.
Nairobi: African
Science Research Network IZA DP No 3119. Available: Available:
http://ssrn.com/abstract=1031715 A
Some Cross Country Empirical Evidence, Oxford University Paper 54(1), 118-149
Standford.edu/entries/feminism-globalization/pagetopright.
Stanford Encyclopedia of Philosophy (2014), “ Feminist Perspective on Globalization.
Available:
Statistical Association, Washington DC.
Study of European” Journal of Economics, Finance, and Administrative Science: 18; pp 58-
68.
Trehen B. (2001). “Unemployment and Productivity” Federal Reserve Bank od San Francisco
(FRBSF) Economic
University of California, San Diego
Uzawa H. (1965) “Optimum Technical Change in an Aggregate Model of Economic Growth”.
International Economic Review 6(1): 18-31: doi: 10.2307/2525621
www.dipecodir.it/upload/file/parello/docs/metroeconomica/%202nd%Review.pdf
www.norface-migration.org/publ-uploads/NDP_22_11.pdf
York Oxford University Press
Global Journal of Human Resource Management
Vol.5, No.5, pp.12-41, June 2017
___Published by European Centre for Research Training and Development UK (www.eajournals.org)
36 ISSN 2053-5686(Print), ISSN 2053-5694(Online)
APPENDICES
Level Regression
Dependent Variable: UNEM
Method: Least Squares
Date: 03/15/17 Time: 21:13
Sample (adjusted): 1981 2014
Included observations: 34 after adjustments
Variable Coefficient Std. Error t-Statistic Prob.
C -67.19194 12.80349 -5.247939 0.0000
RGDP -0.042341 0.126371 -0.335049 0.7400
GENIQ 91.92889 14.99406 6.131019 0.0000
GFCF 0.214863 0.116506 1.844226 0.0754
U(-1) 0.063706 0.340172 0.187276 0.8527
R-squared 0.595311 Mean dependent var 11.12882
Adjusted R-squared 0.539491 S.D. dependent var 5.927397
S.E. of regression 4.022379 Akaike info criterion 5.756677
Sum squared resid 469.2064 Schwarz criterion 5.981142
Log likelihood -92.86351 Hannan-Quinn criter. 5.833226
F-statistic 10.66497 Durbin-Watson stat 0.944563
Prob(F-statistic) 0.000019
Error Correction Model
Dependent Variable: D(UNEM)
Method: Least Squares
Date: 03/15/17 Time: 21:19
Sample (adjusted): 1981 2014
Included observations: 34 after adjustments
Variable Coefficient Std. Error t-Statistic Prob.
C 0.424362 0.318700 1.331541 0.1934
D(RGDP) -0.028813 0.044474 -0.647875 0.5222
D(GENIQ) 2.390926 12.17476 -0.196384 0.0457
D(GFCF) 0.030174 0.092037 0.327844 0.7454
U(-1) -0.483150 0.160950 -3.001863 0.0055
R-squared 0.271567 Mean dependent var 0.433529
Adjusted R-squared 0.171093 S.D. dependent var 1.998404
S.E. of regression 1.819433 Akaike info criterion 4.169980
Sum squared resid 95.99975 Schwarz criterion 4.394445
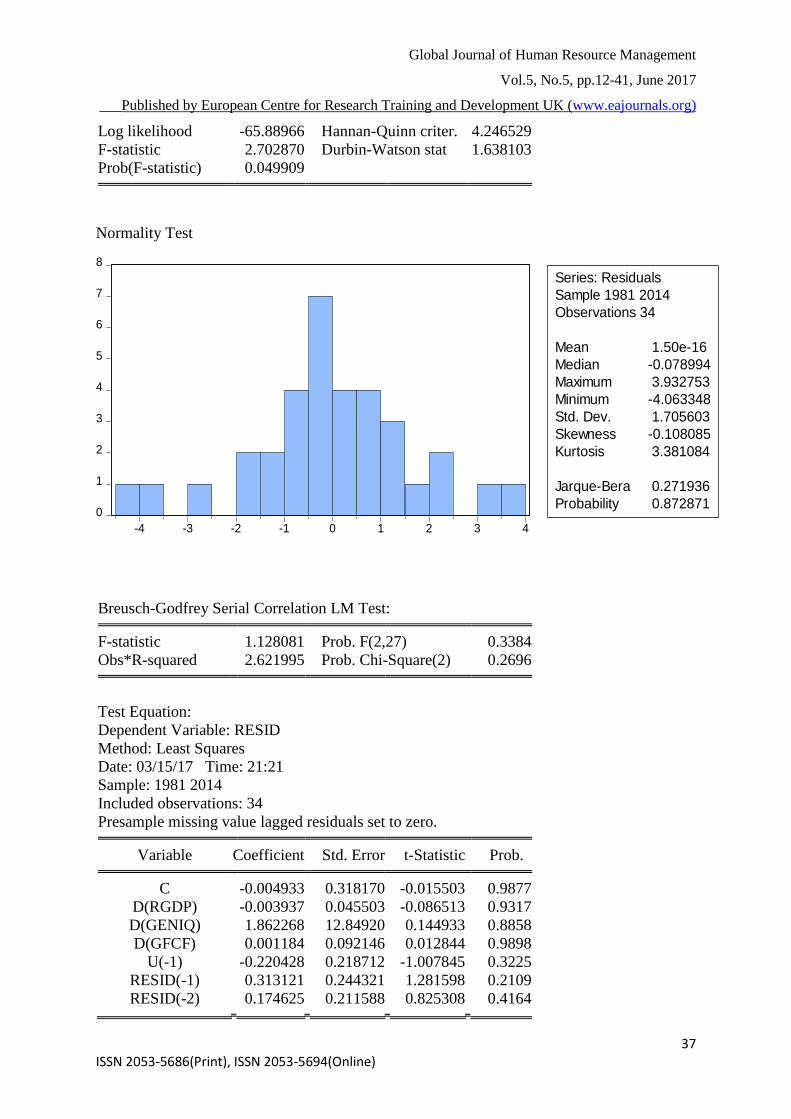
Global Journal of Human Resource Management
Vol.5, No.5, pp.12-41, June 2017
___Published by European Centre for Research Training and Development UK (www.eajournals.org)
37 ISSN 2053-5686(Print), ISSN 2053-5694(Online)
Log likelihood -65.88966 Hannan-Quinn criter. 4.246529
F-statistic 2.702870 Durbin-Watson stat 1.638103
Prob(F-statistic) 0.049909
Normality Test
0
1
2
3
4
5
6
7
8
-4 -3 -2 -1 0 1 2 3 4
Series: Residuals
Sample 1981 2014
Observations 34
Mean 1.50e-16
Median -0.078994
Maximum 3.932753
Minimum -4.063348
Std. Dev. 1.705603
Skewness -0.108085
Kurtosis 3.381084
Jarque-Bera 0.271936
Probability 0.872871
Breusch-Godfrey Serial Correlation LM Test:
F-statistic 1.128081 Prob. F(2,27) 0.3384
Obs*R-squared 2.621995 Prob. Chi-Square(2) 0.2696
Test Equation:
Dependent Variable: RESID
Method: Least Squares
Date: 03/15/17 Time: 21:21
Sample: 1981 2014
Included observations: 34
Presample missing value lagged residuals set to zero.
Variable Coefficient Std. Error t-Statistic Prob.
C -0.004933 0.318170 -0.015503 0.9877
D(RGDP) -0.003937 0.045503 -0.086513 0.9317
D(GENIQ) 1.862268 12.84920 0.144933 0.8858
D(GFCF) 0.001184 0.092146 0.012844 0.9898
U(-1) -0.220428 0.218712 -1.007845 0.3225
RESID(-1) 0.313121 0.244321 1.281598 0.2109
RESID(-2) 0.174625 0.211588 0.825308 0.4164

Global Journal of Human Resource Management
Vol.5, No.5, pp.12-41, June 2017
___Published by European Centre for Research Training and Development UK (www.eajournals.org)
38 ISSN 2053-5686(Print), ISSN 2053-5694(Online)
R-squared 0.077117 Mean dependent var 1.50E-16
Adjusted R-squared -0.127968 S.D. dependent var 1.705603
S.E. of regression 1.811450 Akaike info criterion 4.207373
Sum squared resid 88.59649 Schwarz criterion 4.521624
Log likelihood -64.52535 Hannan-Quinn criter. 4.314542
F-statistic 0.376027 Durbin-Watson stat 1.918958
Prob(F-statistic) 0.887772
Heteroskedasticity Test: Breusch-Pagan-Godfrey
F-statistic 0.337049 Prob. F(4,29) 0.8507
Obs*R-squared 1.510423 Prob. Chi-Square(4) 0.8248
Scaled explained SS 1.308222 Prob. Chi-Square(4) 0.8600
Test Equation:
Dependent Variable: RESID^2
Method: Least Squares
Date: 03/15/17 Time: 21:22
Sample: 1981 2014
Included observations: 34
Variable Coefficient Std. Error t-Statistic Prob.
C 2.881494 0.807789 3.567139 0.0013
D(RGDP) -0.006360 0.112724 -0.056423 0.9554
D(GENIQ) -14.54468 30.85857 -0.471334 0.6409
D(GFCF) 0.046108 0.233280 0.197650 0.8447
U(-1) -0.344583 0.407950 -0.844669 0.4052
R-squared 0.044424 Mean dependent var 2.823522
Adjusted R-squared -0.087379 S.D. dependent var 4.422431
S.E. of regression 4.611599 Akaike info criterion 6.030079
Sum squared resid 616.7386 Schwarz criterion 6.254544
Log likelihood -97.51135 Hannan-Quinn criter. 6.106628
F-statistic 0.337049 Durbin-Watson stat 2.363245
Prob(F-statistic) 0.850719
Vector Autoregression Estimates
Date: 03/15/17 Time: 21:40
Sample (adjusted): 1982 2014
Included observations: 33 after adjustments
Standard errors in ( ) & t-statistics in [ ]

Global Journal of Human Resource Management
Vol.5, No.5, pp.12-41, June 2017
___Published by European Centre for Research Training and Development UK (www.eajournals.org)
39 ISSN 2053-5686(Print), ISSN 2053-5694(Online)
UNEM RGDP GENIQ GFCF
UNEM(-1) 0.813411 0.265168 0.001025 -0.125635
(0.18420) (0.42139) (0.00202) (0.19284)
[ 4.41589] [ 0.62927] [ 0.50757] [-0.65151]
UNEM(-2) 0.019299 -0.288854 0.003884 0.167459
(0.18620) (0.42597) (0.00204) (0.19493)
[ 0.10365] [-0.67811] [ 1.90199] [ 0.85906]
RGDP(-1) -0.005103 0.276381 -0.000347 0.064169
(0.07227) (0.16532) (0.00079) (0.07566)
[-0.07061] [ 1.67176] [-0.43789] [ 0.84817]
RGDP(-2) 0.146922 -0.138634 -0.001213 -0.062366
(0.06294) (0.14399) (0.00069) (0.06589)
[ 2.33430] [-0.96283] [-1.75667] [-0.94650]
GENIQ(-1) 19.83015 -29.34840 0.280527 26.31922
(15.2623) (34.9148) (0.16738) (15.9778)
[ 1.29929] [-0.84057] [ 1.67596] [ 1.64724]
GENIQ(-2) 0.181118 63.32737 0.068717 -17.42676
(13.9142) (31.8309) (0.15260) (14.5665)
[ 0.01302] [ 1.98949] [ 0.45031] [-1.19636]
GFCF(-1) -0.018239 -0.461252 0.000891 0.926478
(0.12064) (0.27597) (0.00132) (0.12629)
[-0.15119] [-1.67138] [ 0.67350] [ 7.33607]
GFCF(-2) 0.060979 0.160459 -0.003657 -0.189019
(0.13768) (0.31496) (0.00151) (0.14413)
[ 0.44291] [ 0.50946] [-2.42170] [-1.31142]
C -15.47617 -19.57748 0.533067 -4.968536
(11.5830) (26.4978) (0.12703) (12.1260)
[-1.33612] [-0.73883] [ 4.19632] [-0.40974]
R-squared 0.921793 0.483211 0.879319 0.887599
Adj. R-squared 0.895724 0.310948 0.839093 0.850132
Sum sq. resids 89.43150 468.0272 0.010757 98.01325
S.E. equation 1.930366 4.416009 0.021171 2.020863
F-statistic 35.35964 2.805080 21.85901 23.69015
Log likelihood -63.27490 -90.58328 85.64919 -64.78679
Akaike AIC 4.380297 6.035350 -4.645406 4.471927
Schwarz SC 4.788435 6.443489 -4.237267 4.880065
Mean dependent 11.24788 4.864242 0.826667 12.18333
S.D. dependent 5.977876 5.319907 0.052777 5.220142

Global Journal of Human Resource Management
Vol.5, No.5, pp.12-41, June 2017
___Published by European Centre for Research Training and Development UK (www.eajournals.org)
40 ISSN 2053-5686(Print), ISSN 2053-5694(Online)
Determinant resid covariance (dof
adj.) 0.118764
Determinant resid covariance 0.033226
Log likelihood -131.1267
Akaike information criterion 10.12889
Schwarz criterion 11.76145
Variance Decomposition of UNEM RGDP GENIQ GFCF
Variance Decomposition of UNEM
Period SE. UNEM RGDP GENIQ GFCF
1 1.930366 100.0000 0.000000 0.000000 0.000000
2 2.584875 97.59091 0.020687 2.368406 0.019993
3 3.107938 91.66172 4.504635 3.718897 0.114745
4 3.538572 89.44239 6.446449 3.994286 0.116872
5 3.905760 88.53806 6.376126 4.694809 0.391006
6 4.225537 87.74994 6.210520 5.353543 0.685994
7 4.518305 87.22607 6.061148 5.669378 1.043403
8 4.793615 86.85423 5.863818 5.792499 1.489456
9 5.052014 86.50149 5.714511 5.846460 1.937536
10 5.293288 86.15046 5.644307 5.866531 2.338702
Variance Decomposition of RGDP
Period SE UNEM RGDP GENIQ GFCF
1 4.416009 0.994808 99.00519 0.000000 0.000000
2 4.713663 1.891946 92.04066 2.222182 3.845211
3 4.856809 1.994093 87.05082 4.253208 6.701881
4 4.891131 2.117571 85.85901 5.343154 6.680269
5 4.898491 2.117938 85.62362 5.388045 6.870398
6 4.926217 2.251654 85.06654 5.328225 7.353580
7 4.941601 2.417546 84.62616 5.295265 7.661032
8 4.950430 2.574814 84.33468 5.286293 7.804214
9 4.957645 2.708014 84.13138 5.275074 7.885535
10 4.962083 2.791016 84.02075 5.266754 7.921481
Variance Decomposition of GENIQ
Period SE UNEM RGDP GENIQ
GFCF
1 0.021171 6.118690 2.162238 91.71907 0.000000
2 0.022301 7.708178 2.008789 89.64197 0.641065
3 0.025676 20.10422 6.285107 69.50130 4.109377
4 0.028599 30.05920 6.643162 56.32265 6.974984
5 0.031066 38.17371 5.827682 47.78451 8.214101
6 0.033341 43.55360 6.245650 41.53181 8.668936

Global Journal of Human Resource Management
Vol.5, No.5, pp.12-41, June 2017
___Published by European Centre for Research Training and Development UK (www.eajournals.org)
41 ISSN 2053-5686(Print), ISSN 2053-5694(Online)
7 0.035238 46.92644 6.899823 37.44067 8.733064
8 0.036754 49.11599 7.370531 34.92434 8.589133
9 0.038020 50.84284 7.492652 33.22214 8.442370
10 0.039147 52.40312 7.370529 31.86495 8.361394
Variance Decomposition GFCF
Period SE UNEM RGDP GENIQ GFCF
1 2.020863 0.001967 0.334709 1.333098 98.33023
2 2.884548 0.056744 2.844148 7.410987 89.68812
3 3.201195 0.067796 2.491487 7.263441 90.17728
4 3.317295 1.035790 2.946272 7.471286 88.54665
5 3.384008 2.704816 3.213035 7.489052 86.59310
6 3.434982 5.042145 3.118500 7.340563 84.49879
7 3.487587 7.666724 3.131635 7.156503 82.04514
8 3.540609 10.07492 3.285178 7.028325 79.61158
9 3.590939 12.11415 3.503782 6.986207 77.39586
10 3.637587 13.89546 3.664732 7.006568 75.43324
Cholesky Ordering: UNEM RGDP, GENIQ GFCF