unep, still pictures · in water resource planning, development and management ... significantly...
TRANSCRIPT
Global overview
ResourcesThe total volume of water on Earth is about 1 400million km3 of which only 2.5 per cent, or about 35million km3, is freshwater (see table opposite). Mostfreshwater occurs in the form of permanent ice orsnow, locked up in Antarctica and Greenland, or indeep groundwater aquifers. The principal sources ofwater for human use are lakes, rivers, soil moistureand relatively shallow groundwater basins. The usableportion of these sources is only about 200 000 km3 ofwater — less than 1 per cent of all freshwater andonly 0.01 per cent of all water on Earth. Much of thisavailable water is located far from human populations,further complicating issues of water use.
The replenishment of freshwater depends onevaporation from the surface of the oceans. About505 000 km3, or a layer 1.4 metres thick, evaporatesfrom the oceans annually. Another 72 000 km3
evaporates from the land. About 80 per cent of allprecipitation, or about 458 000 km3/year, falls on theoceans and the remaining 119 000 km3/year on land.The difference between precipitation on land surfaces
and evaporation from those surfaces (119 000 km3
minus 72 000 km3 annually) is run-off andgroundwater recharge — approximately 47 000 km3
annually (Gleick 1993). The figure opposite shows oneestimate of the average annual water balance of majorcontinental areas, including precipitation, evaporationand run-off. More than one-half of all run-off occurs inAsia and South America, and a large fraction occurs ina single river, the Amazon, which carries more than6 000 km3 of water a year (Shiklomanov 1999).
Water scarcityAbout one-third of the world’s population lives incountries suffering from moderate-to-high waterstress — where water consumption is more than 10per cent of renewable freshwater resources. Some 80countries, constituting 40 per cent of the world’spopulation, were suffering from serious watershortages by the mid-1990s (CSD 1997a) and it isestimated that in less than 25 years two-thirds of theworld’s people will be living in water-stressedcountries (CSD 1997b). By 2020, water use isexpected to increase by 40 per cent, and 17 per centmore water will be required for food production to
1 5 0 STATE OF THE ENVIRONMENT AND POLICY RETROSPECTIVE: 1972–2002
Freshwater
UN
EP, Still Pictures

meet the needs of the growing population (WorldWater Council 2000a).
The three major factors causing increasing waterdemand over the past century are population growth,industrial development and the expansion of irrigatedagriculture. Agriculture accounted for most freshwaterwithdrawal in developing economies in the past twodecades. Planners have always assumed that growingdemand would be met by taming more of thehydrological cycle through building moreinfrastructure. The damming of rivers has traditionallybeen one of the main ways to ensure adequate waterresources for irrigation, hydropower generation anddomestic use. About 60 per cent of the world’s largest227 rivers have been strongly or moderatelyfragmented by dams, diversions or canals, with effectson freshwater ecosystems (WCD 2000). Thisinfrastructure has provided important benefits in theform, for example, of increased food production andhydroelectricity. There have also been major costs.Over the past 50 years, dams have transformed theworld’s rivers, displacing some 40-80 million people indifferent parts of the world (WCD 2000), and causingirreversible changes in many of the ecosystemsclosely associated with them.
Emphasis on water supply, coupled with weakenforcement of regulations, has limited theeffectiveness of water resource management,particularly in developing regions. Policy-makers havenow shifted from entirely supply solutions to demandmanagement, highlighting the importance of using acombination of measures to ensure adequate suppliesof water for different sectors. Measures includeimproving water use efficiency, pricing policies andprivatization. There is also a new emphasis onintegrated water resources management (IWRM),which takes into account all the different stakeholdersin water resource planning, development andmanagement (CSD 1997b).
Irrigated agricultureAgriculture accounts for more than 70 per cent offreshwater drawn from lakes, rivers and undergroundsources. Most is used for irrigation which providesabout 40 per cent of world food production (CSD 1997a).Over the past 30 years, the area of land under irrigationhas increased from less than 200 million ha to more than270 million ha (FAO 2001). During the same period,global water withdrawals rose from about 2 500 km3 to
FRESHWATER 1 5 1
volume % of % of(1 000 km3) total water total freshwater
Salt water
Oceans 1 338 000 96.54
Saline/brackish groundwater 12 870 0.93
Salt water lakes 85 0.006
Inland waters
Glaciers, permanent snow cover 24 064 1.74 68.7
Fresh groundwater 10 530 0.76 30.06
Ground ice, permafrost 300 0.022 0.86
Freshwater lakes 91 0.007 0.26
Soil moisture 16.5 0.001 0.05
Atmospheric water vapour 12.9 0.001 0.04
Marshes, wetlands* 11.5 0.001 0.03
Rivers 2.12 0.0002 0.006
Incorporated in biota* 1.12 0.0001 0.003
Total water 1 386 000 100
Total freshwater 35 029 100
Source: Shiklomanov 1993
Notes: totals may not add exactly due to rounding
* Marshes, wetlands and water incorporated in biota are often mixed salt and freshwater
Major stocks of water
evaporationrun-off
35 000
30 000
25 000
10 000
5 000
0
15 000
20 000
Europe Asia Africa NorthAmerica
SouthAmerica
Australia/Oceania
Antarctica
2 970
5 320
14 100
18 100 17 700
8 180
10 100
12 200
16 200
2 510
4 570
32 200
8 290
22 300
18 300
28 400
7 080
2 310
4 600
Precipitation, evaporation and run-off by region (km3/year)
Height of bars shows total precipitation; darker areas represent evaporation while lighter areas showrun-off. Total annual precipitation on land is 119 000 km3, of which 72 000 km3 evaporates, leavingsome 47 000 km3 of run-off Notes: regions do not correspond exactly to GEO regions; run-off includes flows to groundwater, inland basins, and iceflows of AntarcticaSource: Shiklomanov 1993

more than 3 500 km3 (Shiklomanov 1999). Poormanagement has resulted in the salinization of about 20per cent of the world’s irrigated land, with an additional1.5 million ha affected annually (CSD 1997a),significantly reducing crop production (WCD 2000). Thecountries most severely affected are mainly in arid andsemi-arid regions.
Response measures have included national actionprogrammes, water policy review and reform,promotion of increased water-use efficiency, and
irrigation technology transfer. At the global level, FAOinitiated a global information system, AQUASTAT, in1993 which provides data on the use of water inagriculture (FAO 2001).
Water and sanitationFor many of the world’s poorer populations, one of thegreatest environmental threats to health remains thecontinued use of untreated water. While thepercentage of people served with improved watersupplies increased from 79 per cent (4.1 billion) in1990 to 82 per cent (4.9 billion) in 2000, 1.1 billionpeople still lack access to safe drinking water and 2.4billion lack access to improved sanitation (WHO andUNICEF 2000). Most of these people are in Africa andAsia. Lack of access to safe water supply andsanitation results in hundreds of millions of cases ofwater-related diseases, and more than 5 milliondeaths, every year (see box right). There are alsolarge, but poorly quantified adverse impacts oneconomic productivity in many developing countries.
The importance of meeting basic human needs forwater has always played a major role in water policy.One of the earliest comprehensive water conferenceswas held in 1977 in Mar del Plata, Argentina. Thefocus on human needs led to the InternationalDrinking Water Supply and Sanitation Decade(1981–90) and the efforts of the United Nations andother international organizations to provide basic
1 5 2 STATE OF THE ENVIRONMENT AND POLICY RETROSPECTIVE: 1972–2002
<1.0
1.0 to 2.0
>2.0 to 5.0
>5.0 to 10.0
>10.0 to 20.0
>20.0
catastrophically low
very low
low
medium
high
very high
Water availability by sub-region in 2000 (1 000 m3 per capita/year)
Map shows wateravailabilitymeasured interms of 1 000m3 per capita/year
Source: compiledfrom UNDP, UNEP,World Bank andWRI 2000 andUnited NationsPopulation Division2001
1970
150
200
250
300
0
2000
1972
1974
1976
1978
1980
1982
1984
1986
1988
1990
1992
1994
1996
1998
2 574
3 5803 760
3 940
3 200
irrigated area (million ha)
water withdrawals (km3/year)
Global irrigated area and water withdrawals
Since 1970 global water withdrawals have mirrored the rise in irrigated area. Some 70 per cent ofwithdrawals are for agriculture, mostly for irrigation which provides 40 per cent of the world’s food
Source: FAO 2001, Shiklomanov 1999

water services (UN 2000). The concept of meetingbasic water needs was reaffirmed during the 1992Earth Summit in Rio de Janeiro and expanded toinclude ecological water needs. A recent UnitedNations report (UN 1999) recognized that all peoplerequire access to adequate amounts of safe water, fordrinking, sanitation and hygiene. Most recently, theSecond World Water Forum and MinisterialConference in The Hague in 2000 (see box belowright) produced a strong statement from more than100 ministers in support of re-emphasizing basichuman needs as a priority for nations, internationalorganizations and donors.
Providing urban dwellers with safe water andsanitation services has remained a particularchallenge. Some 170 million developing country urbandwellers were provided with safe water and 70 millionwith appropriate sanitation during the first half of the1990s but this had limited impact because about 300million more urban residents still lacked access to safewater supply, while nearly 600 million lacked adequatesanitation by the end of 1994 (CSD 1997b). However,a major area of success in many developing countriesis related to investments in wastewater treatmentover the past 30 years which have ‘halted the declinein – or actually improved – the quality of surfacewater’ (World Water Council 2000b).
Water quality Water quality problems can often be as severe asthose of water availability but less attention has beenpaid to them, particularly in developing regions.Sources of pollution include untreated sewage,chemical discharges, petroleum leaks and spills,dumping in old mines and pits, and agricultural
chemicals that are washed off or seep downward fromfarm fields. More than half of the world’s major riversare ‘seriously depleted and polluted, degrading andpoisoning the surrounding ecosystems, threateningthe health and livelihood of people who depend onthem’ (World Commission on Water 1999).
In the 1990s, many new efforts were made tomonitor water quality and institute better policies andprogrammes (Meybeck, Chapman and Helmer 1990).For example, water quality monitoring programmeshave been established for many international riverbasins, including the Danube, the Rhine, the Mekong,the Plate and the Nile. The UNEP-Global EnvironmentMonitoring System (GEMS) Water Programme alsoprovides water quality data and information for bothassessment and management purposes.
Groundwater About 2 billion people, approximately one-third of theworld’s population, depend on groundwater supplies,withdrawing about 20 per cent of global water (600-700 km3) annually — much of it from shallow aquifers(UNDP and others 2000). Many rural dwellers dependentirely on groundwater.
The issues of groundwater use and quality haveuntil recently received far less attention (particularlyin some developing regions) than surface water, anddata on groundwater stocks and flows are even lessreliable. However, in Europe, much attention has beenpaid to groundwater quality because many settlementsdepend on such resources for water supply. Generally,groundwater resources are vulnerable to a variety ofthreats, including overuse and contamination (seetable on page 154).
When use exceeds natural recharge over a longperiod, groundwater levels drop. Parts of India, China,
FRESHWATER 1 5 3
● two billion people are at risk from malaria alone, with100 million people affected at any one time, and 1-2million deaths annually
● about 4 billion cases of diarrhoea and 2.2 milliondeaths annually: this is the equivalent of 20 jumbo jetscrashing every day
● intestinal worms infect about 10 per cent of thepopulation of the developing world
● about 6 million are blind from trachoma
● 200 million people are affected with schistosomiasis
Sources: CSD 1997a, WHO and UNICEF 2000
The costs of water-related diseases
To address issues plaguing the provision of water supply and sanitation to thedeveloping world, the Water Supply and Sanitation Collaborative Council (WSSCC)presented the following global targets, called Vision 21, at the Second World WaterForum at The Hague in March 2000:
● by 2015, reduce by one-half the proportion of people without access tohygienic sanitation facilities;
● by 2015, reduce by one-half the proportion of people without sustainableaccess to adequate quantities of affordable and safe water;
● by 2025, provide water, sanitation and hygiene for all.
Source: WSSCC 2000
Vision 21: global targets for water supply and sanitation

West Asia, the former Soviet Union, the westernUnited States and the Arabian Peninsula areexperiencing declining water tables, limiting theamount that can be used and raising the costs ofpumping to farmers (Postel 1997, UNEP 1999).Overpumping of groundwater can lead to salt-waterintrusion in coastal areas. In Madras, India, forexample, saltwater intrusion has moved 10 km inland,contaminating wells (UNEP 1996).
Concern over growing problems related togroundwater resources has galvanized theinternational community, governments and otherstakeholders to start addressing them. For example,
the Second World Water Forum in March 2000organized a special workshop on groundwater. Some ofthe recommendations arising from the workshopincluded the need to raise public awareness and‘improve information availability, quality andaccessibility to stakeholders, technical specialists andpolicy-makers’ (World Water Forum 2000).
Transboundary water managementWater is widely shared among nations, regions, ethnicgroups and communities. A total of 261 rivers (seegraphic left), covering 45.3 per cent of the total landarea (excluding Antarctica), are shared by two or morecountries (Wolf and others 1999), makingtransboundary water resources management one ofthe most important water issues today.
Disputes over shared water resources have a longhistory. Water has been used as a tool and weapon ofconflict, access to water has been a source of disputeand contention, and major water development projects(for example dam construction) have led to violenceand civil strife (Gleick 1998). But shared waters canalso be a source of cooperation. This is particularlyevident today with the increase in the number ofinitiatives related to river basin management regimesand institutions committed to bilateral and/ormultilateral management of transboundary waterresources. This can be traced back to the 1966Helsinki Rules which laid the foundation forinternational principles for shared watercourses and
1 5 4 STATE OF THE ENVIRONMENT AND POLICY RETROSPECTIVE: 1972–2002
Problem Causes Concerns
Anthropogenic pollution Inadequate protection of vulnerable aquifers Pathogens, nitrates, ammonium salts, chlorine, against human-made discharges sulphates, boron, heavy metals, DOC, aromatic and leachates from: and halogenated hydrocarbons● urban and industrial activities;● intensification of agricultural cultivation nitrates, chlorine, pesticides
Naturally occurring contamination Related to pH-Eh evolution of groundwater Mainly iron, fluorine and sometimes arsenic,and dissolution of minerals (aggravated by iodine, manganese, aluminium, magnesium, anthropogenic pollution and/or uncontrolled sulphates, selenium and nitrates (from paleo-exploitation) recharge)
Well-head contamination Inadequate well design and construction Mainly pathogensallowing direct intrusion of polluted surface water or shallow groundwater
Source: Foster, Lawrence and Morris 1998
Groundwater quality problems
Africa
North andCentral
America
SouthAmerica
Asia
Europe 71
53
38
39
60
Numbers of international river basins
A total of 261 river basins are shared by two or more countries
Notes: regions do not correspond exactly to GEO regions; the Jurado, shared by Colombiaand Panama, is included in South AmericaSource: Wolf and others 1999

influenced many specific river treaties. The Ruleswere subsequently followed up by variousinternational efforts, including particularly the work ofthe UN International Law Commission, which led in1997 to the United Nations Convention on the Law ofthe Non-Navigational Uses of InternationalWatercourses. The impact of this new convention isalready being felt with the 14-member SouthernAfrican Development Community (SADC) adaptingmany of its principles in its revised protocol on sharedwatercourses.
The recognition of river basin organization overthe past 30 years has also resulted in theestablishment of the International Network of BasinOrganizations (INBO) in 1996 (see box), while otherinitiatives include the 1998 International Conferenceon Water and Sustainable Development, whichdeclared that ‘a common vision of riverine countries isneeded for the efficient management and effectiveprotection of transborder water resources’. Theconference’s priority action programme (Bernard1999) emphasized the need to:
● facilitate the exchange of accurate and harmonizedinformation among riverine countries;
● promote consultation at all levels, especially withinpertinent international institutions andmechanisms; and
● define medium-range priority action programmesof common interest to improve water managementand decrease pollution.
Water and ecosystemsWater development projects during the 20th centuryhave had significant impacts on freshwater ecosystemsby eliminating marshes and wetlands, removing waterfor other uses, altering flows, and contaminating waterwith industrial and human wastes. In many rivers andlakes, ecosystem functions have been lost or impaired.In some areas, growing water demand has led toreductions in the volume of large rivers, affectingriverine and adjacent coastal areas (CSD 1997a).Reproductive failures and death in various wildlifespecies, particularly at higher levels in the food chain,have been reported as a result of high withdrawals ofwater (CSD 1997a).
Wetlands are an important freshwater ecosysteminfluencing not only species distribution andbiodiversity in general but also human settlements
and activities. They provide natural flood control,carbon storage, natural water purification, and goodssuch as fish, shellfish, timber and fibre (UNDP, UNEP,World Bank and WRI 2000). While information on thereal extent of wetlands globally remains unreliable,recent estimates show that they may cover at least12.8 million km2 (Finlayson and others 1999). Humanactivities, including agriculture and settlements, havecaused serious damage to freshwater ecosystems andcontributed to the loss of about 50 per cent of theworld’s wetlands during the 20th century (Finlaysonand others 1999). This damage to ecosystems reduceswater quality and quantity, leading to a reduction inthe effective availability of water for human use.
The total area of wetlands lost during the past 30years is difficult to assess because of paucity of dataand lack of accurate global information on the originalextent of wetlands (UNDP and others 2000). However,a 1992 review of Ramsar sites (wetlands designated as‘important’ under the Convention on Wetlands ofInternational Importance Especially as WaterfowlHabitat) showed that 84 per cent were eitherthreatened or experiencing ecological changes (Duganand Jones 1993).
There has recently been a marked shift in waterpolicy as policy-makers recognize that ecosystemsrequire adequate water supplies to sustain normalfunctions and biodiversity conservation. Since 1992,new water policies have been developed that addressthe goal of preserving and allocating water for theenvironment — a change since the 1972 Stockholm
FRESHWATER 1 5 5
The International Network of Basin Organizations had a total of 125 memberorganizations in 49 countries in 1998. Its objectives are to:
● establish a network of organizations interested in global river basinmanagement, and facilitate exchanges of experiences and expertise amongthem;
● promote the principles and means of sound water management in sustainabledevelopment cooperation programmes;
● facilitate the implementation of tools for institutional and financial management,for programming and for the organization of data banks;
● promote information and training programmes for the different actors involved inwater management including local elected officials, users’ representatives andthe executives and staff of member organizations;
● encourage education of the population, the young in particular; and
● evaluate ongoing actions and disseminate their results.
Source: INBO 2001
The International Network of Basin Organizations

Conference which focused mainly on protecting air andwater quality, and paid no attention to water forecosystems. Although large projects involving damsare becoming less common due to limited sites, risingcosts and general opposition, 349 dams more than 60metres high were under construction in 1998 (UNDPand others 2000, WCD 2000). The remaining largefree-flowing rivers are now found only in the tundraregions of North America and the Russian Federation,and in smaller basins in Africa and Latin America.There is now a growing emphasis on increasing water-use efficiency and increased productivity with thelimited resources available (Postel 1997, Postel 1999,Gleick 1998). Throughout the world there are greatopportunities to meet human needs with less water by:
● using existing technology (such as drip irrigation,low-flow toilets, and better industrial processes);
● changing irrigation technology;● finding and stopping wasteful leaks;
● changing wasteful practices (such as irrigatingduring the day, using potable water for landscapeirrigation);
● charging proper prices for water; and ● changing human activities (shifting to more water-
efficient crops, changing industrial processes awayfrom water-intensive production).
Policies and institutions for water managementThe Commission for Sustainable Development (CSD)has reported that many countries lack adequatelegislation and policies for efficient and equitableallocation and use of water resources. Progress is,however, being made with the review of nationallegislation and enactment of new laws and regulations.
Concern has also been expressed about thegrowing incapacity of national hydrological services andagencies, particularly in developing countries, toassess their respective water resources. Manyagencies have experienced reductions in observationnetworks and staff despite increases in water demand.A number of response measures have been undertakenincluding the World Hydrological Cycle ObservingSystem (WHYCOS), which has been implemented inseveral regions. Its main objective is to contribute tothe improvement of national and regional waterresource assessment capabilities (CSD 1997b).
Many different kinds of organizations play a role inwater policy decisions, from national governments tolocal community groups. Over the past decades,however, there has been a growing emphasis onincreasing the participation and responsibility of small,local groups and an acknowledgement that communitieshave an important role to play in water policy.
The Ministerial Declaration at The Hague inMarch 2000 (see box) called for ‘Governing waterwisely: to ensure good governance, so that theinvolvement of the public and the interests of allstakeholders are included in the management of waterresources’ (World Water Forum 2000).
The private sector has recently begun to expand itsrole in water management. The 1990s saw a rapidincrease in the rate and extent of privatization ofpreviously publicly managed water systems. Privatewater companies are increasingly serving the needs ofgrowing cities by taking over contracts from publicagencies to build, own and operate some or even all of amunicipal system. At the same time, concerns have
1 5 6 STATE OF THE ENVIRONMENT AND POLICY RETROSPECTIVE: 1972–2002
Some 120 ministers of water attending the Second World Water Forum held at TheHague in March 2000 adopted a declaration aimed at achieving world watersecurity. The declaration noted the following as the main challenges of this newcentury:
● Meeting basic needs: to recognize that access to safe and sufficient water andsanitation are basic human needs and are essential to health and well-being,and to empower people, especially women, through a participatory process ofwater management.
● Securing the food supply: to enhance food security, particularly of the poor andvulnerable, through the more efficient mobilization and use, and the moreequitable allocation of water for food production.
● Protecting ecosystems: to ensure the integrity of ecosystems throughsustainable water resources management.
● Sharing water resources: to promote peaceful cooperation and developsynergies between different uses of water at all levels, whenever possible,within and, in the case of boundary and transboundary water resources,between states concerned, through sustainable river basin management or otherappropriate approaches.
● Managing risks: to provide security from floods, droughts, pollution and otherwater-related hazards.
● Valuing water: to manage water in a way that reflects its economic, social,environmental and cultural values for all its uses, and to move towards pricingwater services to reflect the cost of their provision. This approach should takeaccount of the need for equity and the basic needs of the poor and thevulnerable.
● Governing water wisely: to ensure good governance, so that the involvement ofthe public and the interests of all stakeholders are included in the managementof water resources.
Source: World Water Forum 2000
Ministerial Declaration on Water Security in the 21st Century
FRESHWATER 1 5 7
Bernard, A. (1999). International CooperationThrough River Basin Commissions. RamsarConvention Bureauhttp://www.ramsar.org/cop7_doc_20.2_e.htm [Geo-2-116]
CSD (1997a). Comprehensive Assessment of theFreshwater Resources of the World. Report of theSecretary-General. United Nations Economic andSocial Councilhttp://www.un.org/documents/ecosoc/cn17/1997/ecn171997-9.htm [Geo-2-117]
CSD (1997b). Overall Progress Achieved Since theUnited Nations Conference on Environment andDevelopment. Report of the Secretary-General.Addendum - Protection of the Quality and Supplyof Freshwater Resources: Application of IntegratedApproaches to the Development, Management andUse of Water Resources. United Nations Economicand Social Councilhttp://www.un.org/documents/ecosoc/cn17/1997/ecn171997-2add17.htm [Geo-2-118]
Dugan, P.J. and Jones, T. (1993). EcologicalChanges in Wetlands: A Global Overview. In M.Moser, R.C. Prentice and J. van Vessems (eds.),Waterfowl and Wetland Conservation in the1990s: A Global Perspective. Slimbridge, UnitedKingdom, International Waterfowl and WetlandsResearch Bureau
FAO (2001). AQUASTAT — FAO’s informationsystem on water and agriculturehttp://www.fao.org/waicent/faoinfo/agricult/agl/aglw/aquastatweb/main/html/background.htm [Geo-2-119]
Finlayson, C.M., Davidson, N.C., Spiers, A.G. andStevenson, N.J. (1999). Global wetland inventory -current status and future priorities. Marine andFreshwater Research 50, 8, 717–28
Foster, S., Lawrence, A. and Morris, B. (1998).Groundwater in Urban Development: AssessingManagement Needs and Formulating PolicyStrategies. Washington DC, World Bank
Gleick, P.H. (1993). Water in Crisis: A Guide tothe World’s Freshwater Resources. New York,Oxford University Press
Gleick, P.H. (1998). The World’s Water 1998-1999. Washington DC, Island Press
INBO (2001). INBO Home Page. InternationalNetwork of Basin Organizationshttp://www.oieau.fr/riob/friobang.htm [Geo-2-120]
Meybeck, M., Chapman, D. and Helmer, R.(1990). Global Freshwater Quality: A FirstAssessment. Cambridge, Massachusetts, BasilBlackwell
Postel, S. (1997). Pillar of Sand: Can theIrrigation Miracle Last? New York, W.W. Nortonand Company
Postel, S. (1999). Last Oasis: Facing WaterScarcity. New York, W.W. Norton and Company
Shiklomanov, I.A. (1993). World freshwaterresources. In P. H. Gleick (ed.), Water in Crisis: AGuide to the World’s Freshwater Resources. NewYork, Oxford University Press
Shiklomanov, I.A. (1999). World Water Resourcesand their Use. Database on CD Rom. Paris,UNESCO
UNDP, UNEP, World Bank and WRI (2000). WorldResources 2000-2001. Washington DC, WorldResources Institute
UNEP (1996). Groundwater: A ThreatenedResource. Nairobi, UNEP
UNEP (1999). GEO-2000. United NationsEnvironment Programme. London and New York,Earthscan
UN (1999). Comprehensive Assessment of theFreshwater Resources of the World. Report of theSecretary-General. United Nations Division forSustainable Developmenthttp://www.un.org/esa/sustdev/freshwat.htm [Geo-2-121]
UN (2000). Drinking Water Supply and SanitationUpdate. Report No UNE/CN 17/2000/13. NewYork, Commission on Sustainable Development
United Nations Population Division (2001). WorldPopulation Prospects 1950-2050 (The 2000Revision). New York, United Nationswww.un.org/esa/population/publications/wpp2000/wpp2000h.pdf
WCD (2000). Dams and Development: A NewFramework for Decision-Making. The Report of theWorld Commission on Dams. London, Earthscanhttp://www.damsreport.org/wcd_overview.htm[Geo-2-122]
WHO and UNICEF (2000). Global Water Supplyand Sanitation Assessment 2000 Report. Genevaand New York, World Health Organization andUnited Nations Children’s Fundhttp://www.who.int/water_sanitation_health/Globassessment/GlasspdfTOC.htm [Geo-2-123]
World Commission on Water (1999). World’sRivers in Crisis - Some Are Dying; Others CouldDie. World Water Councilhttp://www.worldwatercouncil.org/Vision/6902B03438178538C125683A004BE974.htm [Geo-2-124]
World Water Council (2000a). World Water VisionCommission Report: A Water Secure World. Visionfor Water, Life and the Environment. World WaterCouncilhttp://www.worldwatercouncil.org/Vision/Documents/CommissionReport.pdf [Geo-2-125]
World Water Council (2000b). World Water Vision:Making Water Everyone’s Business. London,Earthscan
World Water Forum (2000). MinisterialDeclaration of The Hague on Water Security in the21st Century. World Water Forumhttp://www.worldwaterforum.net/index2.html [Geo-2-126]
WSSCC (2000). Vision 21: A Shared Vision forWater Supply, Sanitation and Hygiene and aFramework for Future Action. Geneva, WorldHealth Organization
been growing about how best to ensure equitable accessto water for the poor, finance projects and share risks.
ConclusionThe development of water supply infrastructuredominated policy options for most of the two decadesfollowing 1972 but many innovative approaches towater resources management were introduced in the1990s.
Major policy trends in this period include:● recognition of both the social and economic value
of water;● emphasis on efficient allocation of water;● recognition of catchment management as critical to
effective management of water resources;● greater cooperation by river basin states to ensure
equitable distribution of resources;● improved data collection;● recognition of the role of all stakeholders in water
management;● adoption of integrated water resources
management as a strategic policy initiative; and● recognition of growing water scarcity due to
various factors, including population and industrialgrowth, and increased pollution.
While developed countries have made significant stridesin addressing water quality issues, the situation hasactually worsened in developing countries, with many ofthem experiencing rising water demand and pollution.More countries are facing water stress or scarcity.
References: Chapter 2, freshwater, global overview

Freshwater: Africa
Africa’s renewable water resources average 4 050km3/year, providing in the year 2000 an average ofabout 5 000 m3 per capita/year — significantly lessthan the world average of 7 000 m3 per capita/year andless than one-quarter of the South American averageof 23 000 m3 per capita/year (Shiklomanov 1999 andUnited Nations Population Division 2001).
However, the distribution of both surface waterand groundwater is uneven. For example, theDemocratic Republic of Congo is the wettest country,with average annual internal renewable waterresources of 935 km3 compared to the region’s driestcountry Mauritania, where the annual average is 0.4km3 (UNDP, UNEP, World Bank and WRI 2000). Thespatial distribution of water resources in the regiondoes not coincide with the highest populationdensities, resulting in many areas (particularly urbancentres) being water stressed or dependent onexternal sources of water.
At least 13 countries suffered water stress orscarcity (less than 1 700 m3 per capita/year and lessthan 1 000 m3 per capita/year respectively) in 1990and the number is projected to double by 2025 (PAI1995). This presents a major challenge to waterplanners in terms of supply and distribution.
Groundwater is a major source of water in theregion, contributing 15 per cent of Africa’s resources(Lake and Souré 1997). The major aquifers are foundin the northern Sahara, Nubia, Sahel and Chad basinsas well as the Kgalagadi (Kalahari). Groundwater isused for domestic and agricultural consumption inmany areas, particularly the more arid sub-regionswhere surface water resources are limited. However,
areas heavily dependent on groundwater reserves arealso at risk of water shortages, as water is extractedfar more rapidly than it is recharged.
Variability of water resources Africa experiences large spatial variations in rainfall,with 95 per cent of the total falling in the central andsouthwestern wet equatorial zone (Lake and Souré1997). Severe droughts have been recorded in theSahel and in the Northern, Eastern and Southern sub-regions over the past 30 years.
As a result, a number of inter-basin water transferschemes have been developed. For example, in SouthAfrica where 60 per cent of the run-off originates fromone-fifth of the land area, large volumes of water aretransported by inter-basin transfer schemes to majorindustrial centres such as Johannesburg (Goldblatt andothers 2000). However, these schemes can exertsignificant pressure on the environment as reducednatural flows impact on downstream ecosystems.
Responses to water shortage in the Seychelles andMauritius include desalinization, water rationing bythe hotel and manufacturing industries, and recyclingof domestic wastewater. These measures are expectedto produce savings of about 240 million m3/year in thelong-term (Government of Mauritius and ERM 1998).In Egypt, severe water shortages have also promptedschemes to recycle agricultural drainage water tomeet growing agricultural demand.
As in other regions, the major factors influencingwater availability in Africa include growing domesticconsumption for drinking water and sanitation,irrigated agriculture and industrialization (which also isa source of pollution and affects water quality). Lossesfrom domestic water distribution systems account forsignificant wastage. Similarly, many irrigation systemsare outdated. In South Africa, up to 50 per cent ofirrigation water is lost due to leakages (Global WaterPartnership 2000). In some countries, however, effortsare being made to improve water use efficiency.
Access to safe water and sanitationSome 62 per cent of Africans had access to animproved water supply in 2000. Even so, ruralAfricans spend much time searching for water and 28per cent of the global population without access toimproved water supplies live in Africa. Women areparticularly affected as they are often responsible forthe family’s water needs. Urban areas are better
1 5 8 STATE OF THE ENVIRONMENT AND POLICY RETROSPECTIVE: 1972–2002
Over the past 30 years, the surface area of LakeChad has varied considerably — from 25 000 to2 000 km2 — due to rainfall variability over thepast 30 years. The lake supports globallyimportant wildlife, particularly migratory birds.The economic activities of about 20 million peopleare based on the lake's resources. A new GEF-funded project in the Lake Chad Basin aims todecrease environmental degradation by improving
cooperation between interested and affected parties, with the benefits from project-related activities accruing to the local communities.Source: Coe and Foley 2001
Rainfall variability in the Lake Chad basin
Lake Chad in 1973 and 1997;red colour denotes vegetation onthe lake bed
Source: NASA 2001
1973 1997

supplied, with 85 per cent of the population havingaccess to improved water supplies. In rural areas, theaverage is 47 per cent, with 99 per cent of the ruralpopulation in Eritrea having no sanitation coverage.The total African population with access to improvedsanitation was 60 per cent in 2000. Again, urbanpopulations fared better, with an average 84 per centhaving improved sanitation compared to an average 45per cent in rural areas (WHO and UNICEF 2000).
Poor water supply and sanitation lead to high ratesof water-related diseases such as ascariasis, cholera,diarrhoea, dracunculiasis, dysentery, eye infections,hookworm, scabies, schistosomiasis and trachoma.About 3 million people in Africa die annually as a resultof water-related diseases (Lake and Souré 1997). In1998, 72 per cent of all reported cholera cases in theworld were in Africa.
Poor water supply and sanitation lead tocontamination of surface and groundwater, withsubsequent effects on plant, animal and humancommunities. The economic costs can be high. InMalawi, for example, the total cost associated withwater degradation was estimated at US$2.1 million in1994 (DREA Malawi 1994). These costs included theneed for water treatment, the development of humanresources and reduced labour productivity. Meetingbasic water and sanitation needs is also expensive. InNigeria, a recent study estimates the future cost ofwater supply and environmental sanitation to be
US$9.12 billion during 2001–10 (Adedipe, Braid andIliyas 2000).
Governments are trying to improve the situationwith environmental management policies that includewaste management and urban planning, and by makingenvironmental impact assessments compulsory forlarge projects. One of the major regional policyinitiatives was the 1980 Lagos Plan of Action, whichurged member states to formulate master plans in thesectors of water supply and agriculture (OAU 1980).The Plan was influenced by the 1977 United NationsWater Conference’s Mar del Plata Action Plan and the1978 African regional meeting on water-related issues.Despite these initiatives, a lack of human and financialresources, and equipment for implementation andenforcement, still limit progress.
Deteriorating water qualityFreshwater and groundwater pollution is a growingconcern in many areas, further limiting access to safewater. Poor water quality leads not only to water-related diseases but also reduces agriculturalproduction, which means that more foodstuffs andagricultural products must be imported. Poor waterquality also limits economic development options,such as water-intensive industries and tourism, asituation that is potentially disastrous to developingcountries in Africa.
To counter this problem, many countries haveestablished or enforced effluent water standards andrehabilitated wastewater treatment facilities. Otherresponses include schemes in Central Africa forpurification and decontamination of freshwatersystems, and public awareness campaigns. Although
FRESHWATER 1 5 9
sanitationwater supply
Water supply and sanitation coverage: Africa
In the year2000, 62 percent of Africanshad access toimproved watersupplies and 60per cent tosanitation — butcoverage waspoor in largeareas of thecontinent
Source: WHO andUNICEF 2000
A study launched in Cairo in 1995 has shown thatwastewater treatment can address not only the Egyptiancity’s water pollution problems but also open newopportunities for business and agriculture. The Greater CairoWastewater Project will produce about 0.4 million tonnes ofsludge or biosolids annually from wastewater treatment.
The study was initiated under the MediterraneanEnvironmental Technical Assistance Programme funded bythe European Investment Bank and promoted by the CairoWastewater Organization. Initial results show that sludge canbe effective in growing wheat, berseem clover, forage maizeand grape vines. Digested sludge offers significant nitrogenfertilizer replacement value to farmers; no harmful effects ofbiosolids on crops were detected in field trials; and thebenefits of spreading biosolids on newly reclaimed soils areexpected to increase with cumulative applications. Farmers inEgypt are prepared to pay for bio-solids due to the scarcity ofmanure and the high costs of inorganic fertilizers.
Source: UNCSD 1999
Sludge disposal in Cairo
0%–25%
26%–50%
51%–75%76%–90%
91%–100%
missing data

only recently implemented, these responses havebeen locally successful in improving access to drinkingwater and raising awareness.
In Eastern and Southern Africa, the widespreadinvasion of the water hyacinth (Eichornia crassipes) is afurther cause of deteriorating water quality. The waterhyacinth forms dense mats that block water channels,disrupting flow patterns. Decaying mats of the weedgenerate bad odours and lead to eutrophication of thewater body. Areas afflicted by the water hyacinthinclude Lakes Victoria and Kariba, and some rivers.Affected countries have begun biological and chemicalcontrol programmes, in addition to mechanicalclearance, with some success (Global Water Partnership2000). Watercourses in West Africa are similarlythreatened by Salvinia molesta and Typha species.
WetlandsWetland habitats in Africa cover about 1.2 million km2
(Finlayson and others 1999). However, wetlands arethreatened by both pollution and reclamation.
Loss of wetlands in Southern Africa is thought tohave contributed to the severity of the flooding in1999-2000, which affected 30 000 families and 34 000hectares of farmland (Mpofu 2000). To prevent further
wetland degradation, 27 African countries had signedand ratified the 1987 Ramsar Convention as ofDecember 1998, placing 75 sites covering some 14million ha under protection (Frazier 1999).
Integrated water resources managementA shift towards integrated water resourcesmanagement (IWRM) is one of the new policyinitiatives that have been adopted in Africa to addressthe issues raised above. Integrated water resourcesmanagement is not limited to the national level butalso includes basins shared by two or more states. TheNile Basin Initiative, launched in 1999, is a jointprogramme of action between 10 Nile countries. Theobjectives are to ensure sustainable resourcedevelopment, security, cooperation and economicintegration. In Southern Africa, the eight basin statesof the Zambezi have been cooperating under theZambezi River System Action Plan but efforts toestablish a Zambezi Basin Commission have beenslow. Another example of regional cooperation is inthe Lake Victoria area, where in 1995 a GEF-fundedproject was established to focus primarily on fisheriesmanagement, pollution control, control of invasiveweeds, and catchment land use management.
1 6 0 STATE OF THE ENVIRONMENT AND POLICY RETROSPECTIVE: 1972–2002
Adedipe, N.O., Braid, E.J., and Iliyas, M.H.(2000). Development of Strategy/Action Plan andImplementation Guidelines for the National WaterSupply and Sanitation Policy. Abuja, UNICEF andNigerian Federal Ministry of Water Resources
Coe, M. and Foley, J. (2001). Human and NaturalImpacts on the Water Resources of the Lake ChadBasin. Journal of Geophysical Research 27February 2001, Vol. 106, No. D4
DREA Malawi (1994). National EnvironmentalAction Plan Vol. 1. Lilongwe, Malawi Departmentof Research and Environmental Affairs
Finlayson, C.M., Davidson, N.C., Spiers, A.G., andStevenson, N.J. (1999). Global wetland inventory:current status and future priorities. MarineFreshwater Resources 50, 717–27
Frazier, S. (ed., 1999). A Directory of Wetlands ofInternational Importance. Wageningen, WetlandsInternational and Ramsar Convention Bureau
Global Water Partnership (2000). Southern AfricanVision for Water, Life and the Environment in the21st Century and Strategic Framework for ActionStatement. Global Water Partnership SouthernAfrica Technical Advisory Committeehttp://www.gwpsatac.org.zw/vision/chapter10.html[Geo-2-101]
Goldblatt, M., Ndamba, J., van der Merwe, B.,Gomes, F., Haasbroek, B. and Arntzen, J. ( 2000).Water Demand Management: Towards Developing
Effective Strategies for Southern Africa. Harare,IUCN ROSA
Government of Mauritius and ERM (1998).Mauritius NEAP II: Strategy Options Report. PortLouis, Government of Mauritius and EnvironmentalResources Management
Government of Mauritius (1994). National PhysicalDevelopment Plan. Port Louis, Ministry of Housing,Lands and Country Planning
Lake, W. B. and Souré, M. (1997). Water andDevelopment in Africa. International DevelopmentInformation Centre http://www.acdi–cida.gc.ca/xpress/dex/dex9709.htm[Geo-2-103]
Mpofu, B. (2000). Assessment of SeedRequirements in Southern African CountriesRavaged by Floods and Drought 1999/2000Season. SADC Food Security Programme, Food,Agriculture and Natural Resourceshttp://www.sadc-fanr.org.zw/sssd/mozcalrep.htm[Geo-2-104]
NASA 2001. A Shadow of a Lake: Africa’sdisappearing Lake Chad. NASA Goddard SpaceFlight Centerhttp://www.gsfc.nasa.gov/gsfc/earth/environ/lakechad/chad.htm [Geo-2-327]
OAU (1980). Lagos Plan of Action for theEconomic Development of Africa: 1980-2000.Addis Ababa, Organization of African Unity
PAI (1995). Sustaining Water: An Update.Washington DC, Population Action International,Population and Environment Programme
Shiklomanov, I.A. (1999). World Water Resources:Modern Assessment and Outlook for the 21stCentury. St Petersburg, Federal Service of Russiafor Hydrometeorology and Environment Monitoring,State Hydrological Institute
UNCSD (1999). Cairo Sludge Disposal Study.United Nations Commission on SustainableDevelopmenthttp://www.un.org/esa/sustdev/success/cairo_st.htm[Geo-2-105]
UNDP, UNEP, World Bank and WRI (2000). WorldResources 2000-2001. Washington DC, WorldResources Institute
United Nations Population Division (2001). WorldPopulation Prospects 1950-2050 (The 2000Revision). New York, United Nations
WHO and UNICEF (2000). Global Water Supplyand Sanitation Assessment 2000 Report. Genevaand New York, World Health Organization andUnited Nations Children’s Fundhttp://www.who.int/water_sanitation_health/Globassessment/Glassessment6.pdf [Geo-2-111]
WMO (1997). Comprehensive Assessment of theFreshwater Resources of the World: assessment ofwater resources and water availability in theworld. Geneva, WMO
References: Chapter 2, freshwater, Africa
Freshwater: Asia and the Pacific
The Asia and the Pacific Region accounts for about 36per cent of global run-off. Even so, water scarcity andpollution are key issues and the region has the lowestper capita availability of freshwater: renewable waterresources amounted to about 3 690 m3 per capita/yearin mid-1999 for the 30 largest countries in the regionfor which records are available (UNDP, UNEP, WorldBank and WRI 2000 and United Nations PopulationDivision 2001). In absolute terms, China, India andIndonesia have the largest water resources, more thanone-half of the region’s total. Several countries,including Bangladesh, India, Pakistan and the Republicof Korea, already suffer from water scarcity or waterstress. More will do so as populations andconsumption increase. Agriculture is the biggestconsumer (86 per cent), with smaller amounts goingto industry (8 per cent) and domestic use (6 per cent)(compiled from UNDP, UNEP, World Bank and WRI2000).
Water scarcityMany countries do not have sufficient water to meetdemand, with the result that aquifer depletion due tooverextraction is common. Moreover, the scarcity ofwater is accompanied by a deterioration in the qualityof available water due to pollution and environmentaldegradation. Dams and reservoirs coupled withdeforestation in some watersheds have reducedstream water levels, lowered water tables, degradedriparian wetlands and diminished freshwater aquaticdiversity. Excessive demand for groundwater incoastal cities such as Bangkok, Dhaka, Jakarta,Karachi and Manila has led to saline intrusion andground subsidence.
Government policies and strategies havetraditionally been concerned with increasing supply.However, policies have recently become increasinglyfocused on an integrated approach to water resourcemanagement by emphasizing demand managementmeasures such as efficient water use, conservationand protection, institutional arrangements, legal,regulatory and economic instruments, publicinformation and inter-agency cooperation. Commonelements in the national policies and strategies nowbeing adopted include integration of water resourcesdevelopment and management into socio-economicdevelopment; assessment and monitoring of water
resources; protection of water and associatedresources; provision of safe drinking water supply andsanitation; conservation and sustainable use of waterfor food production and other economic activities;institutional and legislative development; and publicparticipation.
In India, a new irrigation management policy aimsto improve water application efficiency through theuse of modern technologies such as drip/sprinklerirrigation and better on-farm irrigation measures. Inthe Republic of Korea, where agriculture uses morethan 50 per cent of water resources, the government’swater resources development plan for the 21stcentury highlights measures that relate to increasedfood production with efficient water use (Kwun 1999).Decentralized water management is also being
encouraged in countries such as China where city orprovincial authorities are authorized to manage waterresources. In India, multidisciplinary units in charge ofdeveloping comprehensive water plans have beenestablished in some states. Stakeholder participationhas reduced operational costs in countries such asPakistan by involving communities in the developmentof water supply, sanitation, and water pollutionprevention facilities and their maintenance.
Progress has also been made in adopting a basin-wide approach. The Indus Basin water-sharing accord
FRESHWATER 1 6 1
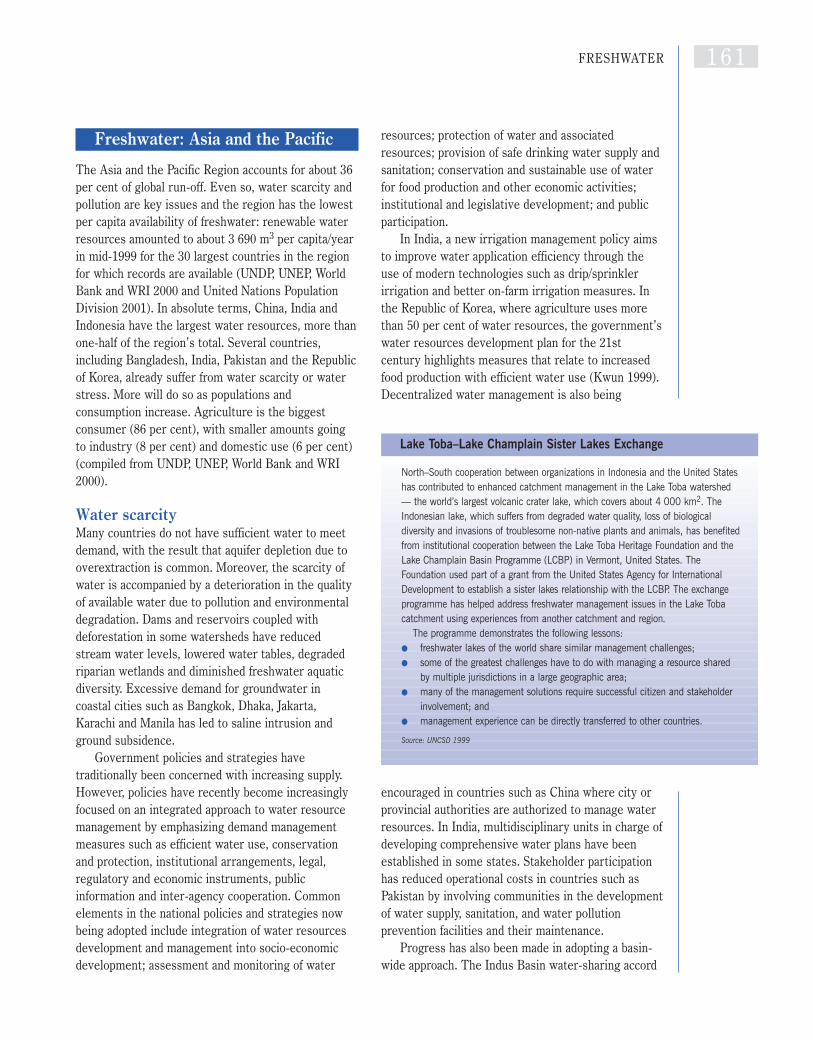
North–South cooperation between organizations in Indonesia and the United Stateshas contributed to enhanced catchment management in the Lake Toba watershed— the world’s largest volcanic crater lake, which covers about 4 000 km2. TheIndonesian lake, which suffers from degraded water quality, loss of biologicaldiversity and invasions of troublesome non-native plants and animals, has benefitedfrom institutional cooperation between the Lake Toba Heritage Foundation and theLake Champlain Basin Programme (LCBP) in Vermont, United States. TheFoundation used part of a grant from the United States Agency for InternationalDevelopment to establish a sister lakes relationship with the LCBP. The exchangeprogramme has helped address freshwater management issues in the Lake Tobacatchment using experiences from another catchment and region.
The programme demonstrates the following lessons:● freshwater lakes of the world share similar management challenges;● some of the greatest challenges have to do with managing a resource shared
by multiple jurisdictions in a large geographic area;● many of the management solutions require successful citizen and stakeholder
involvement; and● management experience can be directly transferred to other countries.
Source: UNCSD 1999
Lake Toba–Lake Champlain Sister Lakes Exchange
between India and Pakistan, the acclaimed WaterSharing Treaty between India and Bangladesh, theIndia–Bhutan cooperation on hydropower developmentand India–Nepal cooperation in harnessingtransboundary rivers are examples of transboundarycooperation on water management in South Asia.
A major challenge is to change the fragmentedsub-sectoral approaches to water management thathave caused conflict and competition in the past, andto design and implement integrated mechanisms,particularly for projects that transcend sub-sectors.
Water pollutionOver the years, water pollution has emerged as amajor issue. Pollutants include pathogens, organicmatter, nutrients, heavy metals and toxic chemicals,sediments and suspended solids, silt and salts.
South Asia — particularly India — and SoutheastAsia are facing severe water pollution problems.Rivers such as the Yellow (China), Ganges (India), andAmu and Syr Darya (Central Asia) top the list of theworld’s most polluted rivers (World Commission onWater 1999). In cities in the developing countries ofthe region, most water bodies are now heavilypolluted with domestic sewage, industrial effluents,chemicals and solid wastes. Most rivers in Nepal’surban areas have been polluted and their waters arenow unfit for human use, while drinking water inKathmandu is contaminated with coliform bacteria,iron, ammonia and other contaminants (UNEP 2001).
Water pollution has affected human health. In thePacific Islands, especially in some atoll communities,use of polluted groundwater for drinking and cookinghas led to health problems such as diarrhoea,
hepatitis, and occasional outbreaks of typhoid andcholera. Groundwater in districts of West Bengal,India, and in some villages in Bangladesh, for example,is contaminated with arsenic at levels as much as 70times higher than the national drinking water standardof 0.05 mg/litre. While pollution is a factor, arseniccontamination is also due to natural phenomena.According to one report, ‘With the majority of thecountry’s 68 000 villages potentially at risk, UNscientists estimate that the arsenic may soon bekilling 20 000 Bangladeshis a year’ (Pierce 2001).
Inadequate water supply and poor sanitation causemore than 500 000 infant deaths a year as well as ahuge burden of illness and disability in the region(UNEP 1999). Some 8–9 per cent of the totalDisability Adjusted Life Years (DALYs) are due todiseases related to inadequate water supply and poorsanitation in India and other countries (World Bank2000). Cholera is prevalent in many countries,particularly those where sanitation facilities are poorsuch as Afghanistan, China and India (WHO 2000).
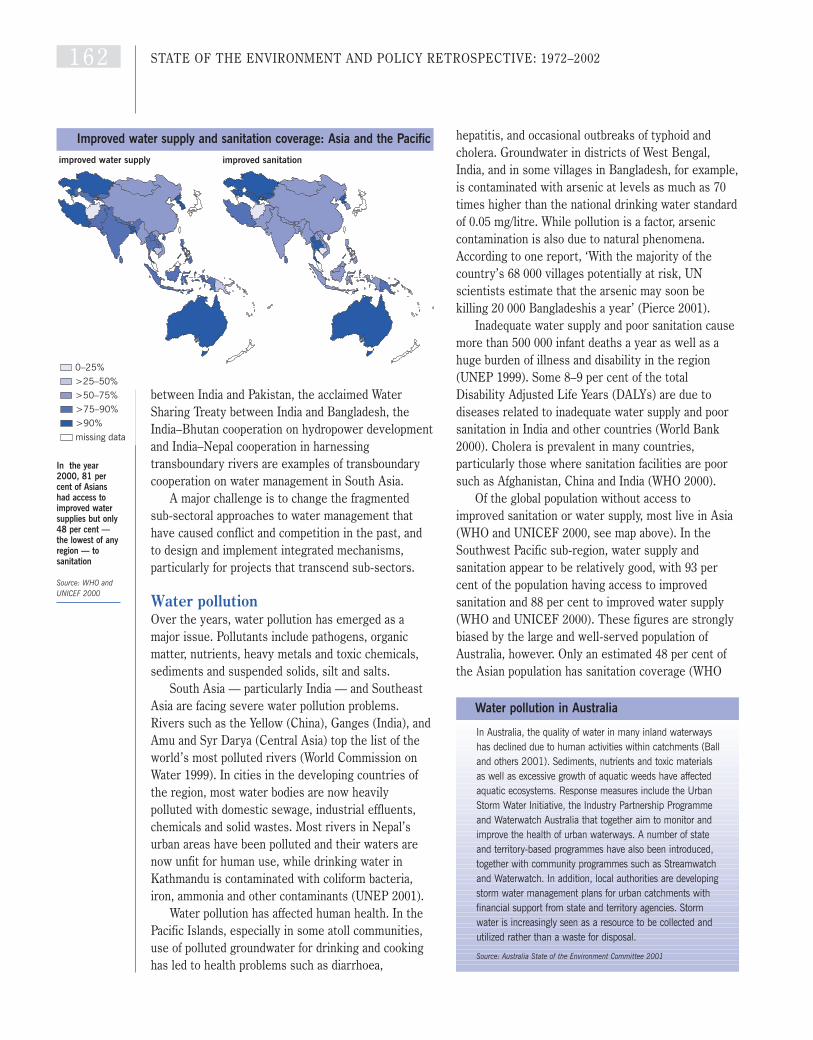
Of the global population without access toimproved sanitation or water supply, most live in Asia(WHO and UNICEF 2000, see map above). In theSouthwest Pacific sub-region, water supply andsanitation appear to be relatively good, with 93 percent of the population having access to improvedsanitation and 88 per cent to improved water supply(WHO and UNICEF 2000). These figures are stronglybiased by the large and well-served population ofAustralia, however. Only an estimated 48 per cent ofthe Asian population has sanitation coverage (WHO
1 6 2 STATE OF THE ENVIRONMENT AND POLICY RETROSPECTIVE: 1972–2002
In Australia, the quality of water in many inland waterwayshas declined due to human activities within catchments (Balland others 2001). Sediments, nutrients and toxic materialsas well as excessive growth of aquatic weeds have affectedaquatic ecosystems. Response measures include the UrbanStorm Water Initiative, the Industry Partnership Programmeand Waterwatch Australia that together aim to monitor andimprove the health of urban waterways. A number of stateand territory-based programmes have also been introduced,together with community programmes such as Streamwatchand Waterwatch. In addition, local authorities are developingstorm water management plans for urban catchments withfinancial support from state and territory agencies. Stormwater is increasingly seen as a resource to be collected andutilized rather than a waste for disposal.
Source: Australia State of the Environment Committee 2001
Water pollution in Australia
0 25%
improved water supply improved sanitation
Improved water supply and sanitation coverage: Asia and the Pacific
In the year2000, 81 percent of Asianshad access toimproved watersupplies but only48 per cent —the lowest of anyregion — tosanitation
Source: WHO andUNICEF 2000
0–25%
>25–50%
>50–75%
>75–90%
>90%
missing data
and UNICEF 2000) — less than in any other region ofthe world. The situation is worse in rural areas, whereonly 31 per cent of the population have improvedsanitation, compared to 78 per cent coverage in urbanareas.
During the past decade, several countries havestarted to address the water quality problem byimplementing large-scale programmes and action plansto rehabilitate degraded streams and depleted aquifers.These programmes are typically given legislative orstatutory authority such as that provided by Thailand’sNational Water Quality Act, the Philippine WaterQuality Code, India’s Environment Protection Act,China’s Water Law and the Republic of Korea’s WaterQuality Preservation Act (UNESCAP 1999). Successstories with respect to rehabilitation and protection ofwater quality of rivers come from those countrieswhere water policies promote a multisectoral andmultidisciplinary approach to the management ofwater resources.
Clean-up campaigns for rivers, canals, lakes andother water bodies have become widespread. The
programmes have often been successful in improvingwater quality and, occasionally, have led to theadoption of new water quality standards and water useregulations. They have also increased awareness ofthe need to reduce pollutant loads through wastewatertreatment, reuse and recycling of sewage andindustrial wastewater, introduction of low-costtechnologies, and strict control of industrial andmunicipal effluent. There have been a number ofsuccesses in water reuse and recycling in theindustrialized countries of the region.
Water quality has been improved in China, Japan,the Republic of Korea and Singapore as a result ofinitiatives to address water pollution. In Japan, thegovernment has set environmental quality standardsand made remarkable improvements: in 1991, 99.8 percent of water samples met standards for heavy metalsand toxins in Japan (RRI 2000). In 2000, the rate ofindustrial wastewater treatment across China was 94.7per cent (SEPA 2001). Action in Singapore means thatSingaporeans can now enjoy drinkable piped waterstraight from the tap.
FRESHWATER 1 6 3
Australia State of the Environment Committee(2001). Coasts and Oceans, Australian State of theEnvironment Report 2001 (Theme Report).Canberra, CSIRO Publishing on behalf of theDepartment of the Environment and Heritage
Kwun, S. (1999). Water for Food and RuralDevelopment, Country Paper of the Republic ofKorea Regional Consultation Meeting for ICIDVisionfor Subsector. Kuala Lumpur, 17–19 May 1999
Pierce, F. (2001). Death in a Glass of Water. TheIndependent. 19 January 2001http://www.independent.co.uk/story.jsp?story=51508 [Geo-2-106]
RRI (2000). Japan Environmental Policy. ResourceRenewal Institutehttp://www.rri.org/envatlas/asia/japan/jp-conc.html#Water [Geo-2-107]
SEPA (2001). Report of the State of theEnvironment in China 2000. Beijing, StateEnvironmental Protection Administration
UNCSD (1999). Lake Toba–Lake Champlain SisterLakes Exchange. United Nations Commission onSustainable Developmenthttp://www.un.org/esa/sustdev/success/watenfed.htm[Geo-2-108]
UNDP, UNEP, World Bank and WRI (2000). WorldResources 2000-2001. Washington DC, WorldResources Institute
UNEP (1999). GEO-2000. United NationsEnvironment Programme. London and New York,Earthscan
UNEP (2001). Nepal: State of the Environment2001. Bangkok, MoPE/HMGN/ICIMOD/SACEP/NORAD/UNEP
UNESCAP (1999). ESCAP Population Data Sheet,Population and Development Indicators for Asiaand the Pacific, 1999. Bangkok, United NationsEconomic and Social Commission for Asia and thePacific
United Nations Population Division (2001). WorldPopulation Prospects 1950-2050 (The 2000Revision). New York, United Nationswww.un.org/esa/population/publications/wpp2000/wpp2000h.pdf
WHO (2000). Communicable Disease Surveillanceand Response. Global Cholera Update. WorldHealth Organization http://www.who.int/emc/diseases/cholera/choltbl1999.html [Geo-2-109]
WHO and UNICEF (2000). Global Water Supplyand Sanitation Assessment 2000 Report. Genevaand New York, World Health Organization andUnited Nations Children’s Fundhttp://www.who.int/water_sanitation_health/Globassessment/Glassessment7.pdf [Geo-2-112]
World Commission on Water (1999). World’sRivers in Crisis - Some Are Dying; Others CouldDie. World Water Councilhttp://www.worldwatercouncil.org/Vision/6902B03438178538C125683A004BE974.htm [Geo-2-110]
World Bank (2000). Health and Environment.Environment Strategy Paper. World Bankhttp://lnweb18.worldbank.org/essd/essd.nsf/GlobalView/HealthandENV.pdf/$File/HealthandENV.pdf[Geo-2-113]
References: Chapter 2, freshwater, Asia and the Pacific
Freshwater: Europe
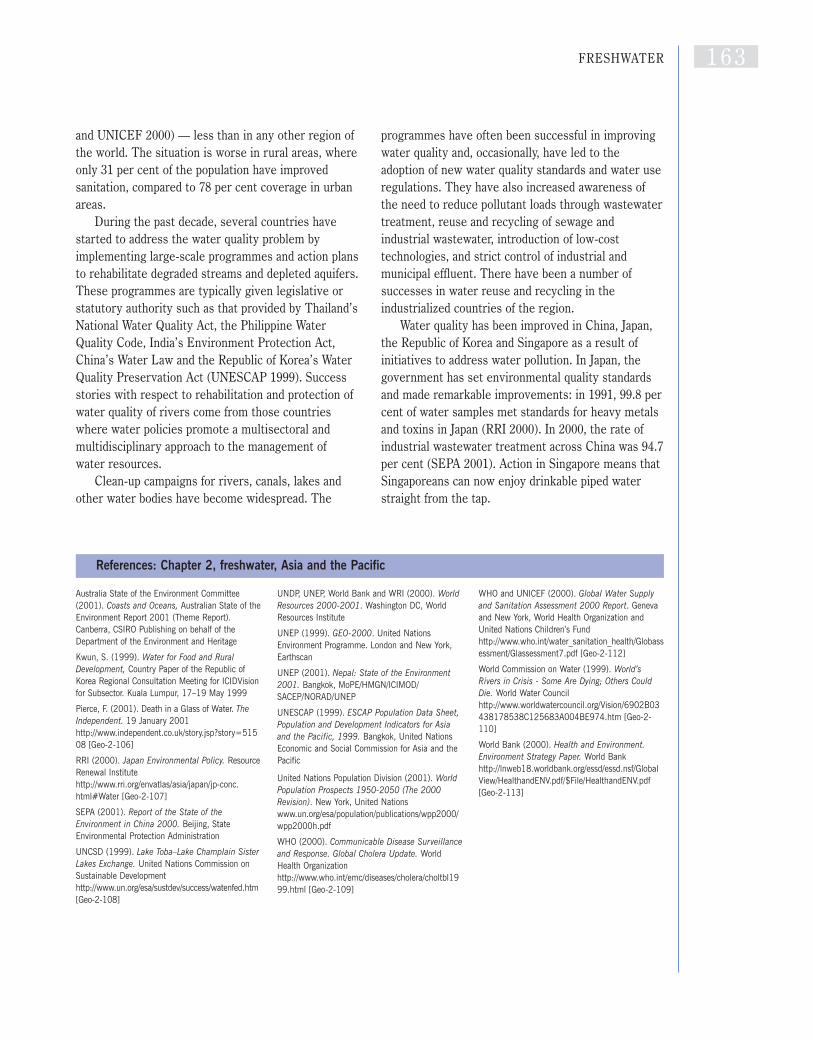
Water resources are unevenly distributed in Europe.Annual average run-off ranges from 3 000 mm inwestern Norway to 100-400 mm over much of centralEurope and less than 25 mm in central and southernSpain (ETC/WTR 2001). Traditionally, most Europeancountries rely more on surface water than ongroundwater, which is often used only for public watersupply (EEA 1999a, Eurostat 1997). Data for assessingwater quantity trends are rather poor but relativelygood for water quality. Water pollution is a seriousissue throughout Europe. Though some progress hasbeen made in pollution reduction in Western Europe,the situation is less promising in Central and EasternEurope (CEE).
Water quantityEurope abstracts a relatively small portion of its totalrenewable water resources. Western Europeabstracts, on average, around 20 per cent (EEA1999b), although this ranges from less than 5 per centin the northern countries to more than 40 per cent inBelgium, Germany and the Netherlands. The RussianFederation, with 9 per cent of the world’s waterresources, abstracts less than 2 per cent annually(RFEP 2000). However, water quantity problems dooccur in areas with low rainfall and high populationdensity, and in large land areas under irrigatedagriculture, especially in Mediterranean countries and in CEE.
In the central part of Western Europe, most of the
water supply is used as a coolant in energy production.This water is returned to its source more or lessunchanged and can be re-used. In southern countriesof Western Europe, where water resources are lessabundant, agriculture consumes far more than theother sectors — about 80 per cent, compared to 20per cent for urban and industrial use (ETC/WTR2001). Some 80 per cent of the water used forirrigation evaporates.
The amount of water abstracted for public watersupply in Western Europe fell by 8–10 per centbetween 1985 and 1995 as a result of improvedindustrial and domestic water use efficiency(ETC/WTR 2001). However, a significant increase inagricultural water use occurred in southern Europebecause irrigated farmland has increased by nearly 20per cent since the mid-1980s. In CEE, there has beena marked decline in water consumption for industrialpurposes due to economic restructuring but thedemand from urban areas and for irrigated agricultureis growing steadily (EEA 1998).
There is little legislation controlling water use inEurope. Traditionally, quantity problems have beendealt with by increasing storage capacities throughreservoirs and water transfer schemes. However,demand reduction measures are now in place inseveral countries in Western Europe. These, togetherwith greater awareness of water use in general, havereduced public consumption. The domestic andindustrial sectors have become increasingly water-efficient. Examples of water conservation measuresinclude: metering; increased charges and taxes;restrictions on garden watering; reducing leakage;user education and widespread use of more efficientappliances such as low and dual flush toilets, andwashing machines that consume less water.
Abstraction charges and pricing mechanisms arevaluable for improving the sustainability of water usein agriculture and deserve more attention becausewater prices for agricultural use are often lower thanfor other users. For instance, a recent study (Planistat1998) found that in the French Adour-Garonne basin,the drinking water supply is almost entirely self-financing (about 98 per cent) but the irrigation tariffcovers only 30–40 per cent of the total cost of theservices. Other agricultural reforms include plantingcrops with lower water demands and introducing moreefficient irrigation systems. In CEE, all these lessconventional measures are being applied but a major
1 6 4 STATE OF THE ENVIRONMENT AND POLICY RETROSPECTIVE: 1972–2002
Water stressoccurs in parts ofEurope, notablyin the irrigatedareas of CEE andthe highlyindustrializedcountries ofWestern Europe
Source: compiledfrom UNDP, UNEP,World Bank andWRI 2000
Water stress in Europe (withdrawals as % of renewable resources)
<10%
10–20%
20–40%>40%
no data

challenge will be to reduce leakage — lossessometimes exceed 50 per cent (EEA 1998).
Water qualityOverloading with organic matter, nitrogen andphosphorus in the 1970s and 1980s resulted ineutrophication of seas, lakes, rivers and groundwaterthroughout Europe. The main source of nitrogen isfertilizers in run-off from agricultural land. Mostphosphorus comes from households and industrywastewater, though in areas with intensive agriculturein Western Europe, phosphorus from agricultureapproaches 50 per cent of the total load (EEA 2001).In Western Europe, fertilizer consumption has fallensince the mid-1980s but eutrophication has continueddue to increased nutrient run-off from intensivelivestock production. In CEE, use of agrochemicalshas declined markedly since the early 1990s, resultingin a reduction of nitrogen-phosphorus fertilizer use byabout 50 per cent (Czech Republic 1999, Republic ofHungary 1999).
Pollution of groundwater is another seriousproblem, mainly associated with nitrates andpesticides from agriculture (EEA 1998). In theRussian Federation alone, more than 2 700 sources ofgroundwater were identified as polluted in 1999(RFEP 2000).
Phosphorus discharges from urban wastewatertreatment plants in Western Europe have fallensignificantly (50–80 per cent) since the early 1980s,largely due to the huge increase in treatment ofwastewater (ETC/WTR 2001) and wide-scaleintroduction of phosphorus-free detergents. By theend of the 1990s, 90 per cent of Western Europeanswere connected to sewers and 70 per cent towastewater treatment plants (ETC/WTR 2001). InCEE, however, 30–40 per cent of households were notyet connected to sewers by 1990 and treatment wasinadequate (EEA 1999c). Since 1990, most AccessionCountries have started to invest heavily in sewagecollection and treatment but its high cost is one of themajor financial issues in the accession process(Republic of Slovenia 1999). In the Eastern Europeancountries of the former Soviet Union, little has beendone to improve wastewater treatment.
Many lakes that had high phosphorusconcentrations in the early 1980s have lowerconcentrations today. However, only slight changes inphosphorus concentrations have been observed in
initially less-affected lakes (EEA 2000). This is mainlydue to accumulation and (delayed) release ofphosphorus from lake bottoms or continuedcontamination from small, scattered dwellings andfrom agricultural sources. Overall, water quality inmany European lakes is still poor (ETC/WTR 2001).Heavy pollution in Western European rivers such asthe Rhine has declined significantly since 1980(ETC/WTR 2001) but improvements have been lesssignificant in southern and Central Europe. In EasternEurope, the situation is different. In the RussianFederation and Ukraine, the two most industrializedcountries of the former Soviet Union, discharge ofpolluted water into rivers increased in the second halfof the 1980s and in the 1990s, despite an allegedclean-up campaign for the Volga and Ural rivers asearly as 1972 (see box above).
Poor water quality impacts human health. InEurope, however, outbreaks of water-borne diseasesaffecting less than 20 per cent of the suppliedpopulation are rarely detected. Even so, occasionaloutbreaks of water-borne diseases such as gastro-intestinal infections, affecting much of the population,are reported across Europe, even from countries withhigh standards of supply (WHO 1999). Lead from olddistribution pipes and, in Eastern Europe,contaminated wells can affect the neuro-behaviouraldevelopment of children (EEA/WHO 1999).
At sub-regional level, various EU Directives tacklewater quality issues. Implementation of the DrinkingWater and Nitrate Directives has been unsatisfactory inmost member states, although the Urban WastewaterTreatment Directive has led to a decrease in organicmatter discharges by two-thirds and in nutrients byone-half (ETC/WTR 2001). Further improvements arelikely as more countries invest in new infrastructure to
FRESHWATER 1 6 5
In the early 1970s, funds of 1.2 billion roubles were allocated for a clean-up planfor the Volga and the Ural rivers (Bush 1972) — one of the first publicly announcedprojects to clean up industrial rivers and safeguard the water supply. Manyministries were charged with negligence or slowness in implementing measures tocorrect the problem and with failing to make full use of the capital investmentallotted for water protection measures. The authorities were given until 1980 toimplement the measures needed to ensure a complete end to the discharge ofuntreated wastewater into the Volga-Ural river basins. However, by the end of the1980s, the pollution level of the Volga and its tributaries was still assessed as‘extremely high’, and it continued to increase in the 1990s.
Source: Interstate Statistical Committee 1999
How the Volga and the Ural were not cleaned up
comply with the objectives of the Directive. The samewill be true for Accession Countries in Central Europe.
The mixed success of these measures can berelated to the absence of integrated policies for watermanagement. Policy development currently focuses onsustainable watershed management and freshwaterprotection through integration of quantity and qualityaspects. Integration may be improved by the WaterFramework Directive which aims to achieve goodsurface water status in all European water bodies by2015 and addresses the issue of integratedmanagement of water resources at the catchmentlevel (EEA 1999a).
Policy and legislative framework There are many multilateral and bilateral agreementsfor the management of transboundary waters. At thepan-European level, the 1992 UNECE Convention ofthe Protection and Use of Transboundary Watercoursesand International Lakes strengthens national measures,obliging parties to prevent, control and reduce waterpollution from point and non-point sources. It alsoincludes provisions for monitoring, research anddevelopment, consultations, warning and alarmsystems, mutual assistance, institutional arrangements,and the exchange and protection of information, as wellas public access to information. A Protocol on Water
and Health is awaiting entry into force. At the watershed level, transboundary initiatives
include the Convention on Cooperation for theProtection and Sustainable Use of the River Danubeand the new Convention for the Protection of theRhine. The Danube Convention pledges thesignatories to work together to conserve, improve andrationally use the surface and ground waters in theDanube Catchment basin; to control hazardsoriginating from accidents in the river area; and tocontribute to reducing the pollution loads of the BlackSea from sources in the catchment area. The newRhine Convention, adopted at the January 2001Conference of Rhine Ministers, will be the basis forinternational cooperation of the riparian countries andthe EU, replacing the Agreement on the InternationalCommission for the Protection of the Rhine againstPollution (Bern 1963) and the 1976 Convention for theProtection of the Rhine against Chemical Pollution.The new convention fixes targets for internationalcooperation for sustainable development of the Rhine,further improvement of its ecological state, holisticflood protection and defence. In addition to aspects ofwater quality and quantity, including flood-relatedproblems, groundwater problems in relation to theRhine will in future be included in the convention’sprovisions (ICPR 2001).
1 6 6 STATE OF THE ENVIRONMENT AND POLICY RETROSPECTIVE: 1972–2002
Bush, K. (1972). Steps towards Pollution Controlin the USSR. Radio Liberty Research, 6 April1972, pp.1-7
Czech Republic (1999). State EnvironmentalPolicy. Prague, Ministry of the Environment
EEA (1998). Europe´s Environment: The SecondAssessment. Copenhagen, European EnvironmentAgency
EEA (1999a). Groundwater Quality and Quantityin Europe. Environmental Assessment ReportNo.3. Copenhagen, European Environment Agency
EEA (1999b). Sustainable Water Use in Europe –Sectoral Use of Water. Environmental AssessmentReport No.1. Copenhagen, European EnvironmentAgency
EEA (1999c). Environment in the European Unionat the Turn of the Century. EnvironmentalAssessment Report No.2. Copenhagen, EuropeanEnvironment Agency
EEA (2000). Environmental Signals 2000.Environmental Assessment Report No. 6.Copenhagen, European Environment Agency
EEA (2001). Environmental Signals 2001.Environmental Assessment Report No. 8.Copenhagen, European Environment Agency
EEA and WHO (1999). Children in TheirEnvironment: Vulnerable, Valuable, and at Risk.Background briefing for the 3rd EuropeanMinisterial Conference on Environment and Health,Copenhagen, World Health Organization RegionalOffice for Europe and European EnvironmentAgency
ETC/WTR (2001). European Topic Centre on Waterhttp://water.eionet.eu.int/Databases [Geo-2-114]
Eurostat (1997). Estimations of Renewable WaterResources in the European Union. Luxembourg,Statistical Office of the European Communities
ICPR (2001). Home Page. InternationalCommission for the Protection of the Rhinehttp://iksr.firmen-netz.de/icpr/ [Geo-2-115]
Interstate Statistical Committee (1999) OfficialStatistics of CIS countries. CD-ROM. Moscow,Interstate Statistical Committee of theCommonwealth of Independent States
Planistat (1998). A Study on Water Economics –Integrated Report. A study for the EuropeanCommission – DG XI.B.1. Paris, Planistat Group
Republic of Hungary (1999). NationalEnvironmental Programme 1997-2002 Budapest,Ministry of Environment.
Republic of Slovenia (1999). National ISPAStrategy of the Republic of Slovenia:Environmental Sector. Llubljana, Ministry ofEnvironment and Physical Planning
RFEP (2000). Government Report on the State ofthe Environment in the Russian Federation in1999. Moscow, State Committee of the RussianFederation on Environmental Protection
UNDP, UNEP, World Bank and WRI (2000). WorldResources 2000-2001. Washington DC, WorldResources Institute
United Nations Population Division (2001). WorldPopulation Prospects 1950-2050 (The 2000Revision). New York, United Nationswww.un.org/esa/population/publications/wpp2000/wpp2000h.pdf
WHO (1999). Overview of Environment andHealth in Europe in the 1990s. Report preparedfor the 3rd European Conference on Environmentand Health. Geneva, World Health Organization
References: Chapter 2, freshwater, Europe
Freshwater: Latin America and the Caribbean
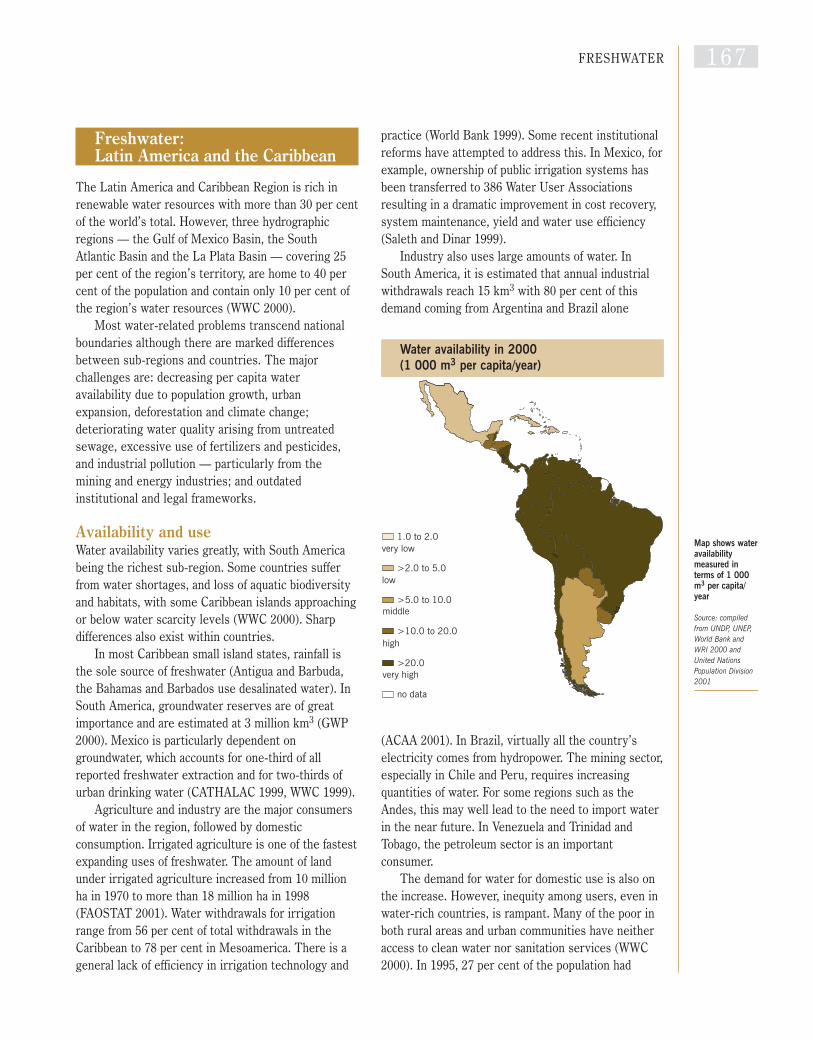
The Latin America and Caribbean Region is rich inrenewable water resources with more than 30 per centof the world’s total. However, three hydrographicregions — the Gulf of Mexico Basin, the SouthAtlantic Basin and the La Plata Basin — covering 25per cent of the region’s territory, are home to 40 percent of the population and contain only 10 per cent ofthe region’s water resources (WWC 2000).
Most water-related problems transcend nationalboundaries although there are marked differencesbetween sub-regions and countries. The majorchallenges are: decreasing per capita wateravailability due to population growth, urbanexpansion, deforestation and climate change;deteriorating water quality arising from untreatedsewage, excessive use of fertilizers and pesticides,and industrial pollution — particularly from themining and energy industries; and outdatedinstitutional and legal frameworks.
Availability and use Water availability varies greatly, with South Americabeing the richest sub-region. Some countries sufferfrom water shortages, and loss of aquatic biodiversityand habitats, with some Caribbean islands approachingor below water scarcity levels (WWC 2000). Sharpdifferences also exist within countries.
In most Caribbean small island states, rainfall isthe sole source of freshwater (Antigua and Barbuda,the Bahamas and Barbados use desalinated water). InSouth America, groundwater reserves are of greatimportance and are estimated at 3 million km3 (GWP2000). Mexico is particularly dependent ongroundwater, which accounts for one-third of allreported freshwater extraction and for two-thirds ofurban drinking water (CATHALAC 1999, WWC 1999).
Agriculture and industry are the major consumersof water in the region, followed by domesticconsumption. Irrigated agriculture is one of the fastestexpanding uses of freshwater. The amount of landunder irrigated agriculture increased from 10 millionha in 1970 to more than 18 million ha in 1998(FAOSTAT 2001). Water withdrawals for irrigationrange from 56 per cent of total withdrawals in theCaribbean to 78 per cent in Mesoamerica. There is ageneral lack of efficiency in irrigation technology and
practice (World Bank 1999). Some recent institutionalreforms have attempted to address this. In Mexico, forexample, ownership of public irrigation systems hasbeen transferred to 386 Water User Associationsresulting in a dramatic improvement in cost recovery,system maintenance, yield and water use efficiency(Saleth and Dinar 1999).
Industry also uses large amounts of water. InSouth America, it is estimated that annual industrialwithdrawals reach 15 km3 with 80 per cent of thisdemand coming from Argentina and Brazil alone
(ACAA 2001). In Brazil, virtually all the country’selectricity comes from hydropower. The mining sector,especially in Chile and Peru, requires increasingquantities of water. For some regions such as theAndes, this may well lead to the need to import waterin the near future. In Venezuela and Trinidad andTobago, the petroleum sector is an importantconsumer.
The demand for water for domestic use is also onthe increase. However, inequity among users, even inwater-rich countries, is rampant. Many of the poor inboth rural areas and urban communities have neitheraccess to clean water nor sanitation services (WWC2000). In 1995, 27 per cent of the population had
FRESHWATER 1 6 7
1.0 to 2.0
>2.0 to 5.0
>5.0 to 10.0
>10.0 to 20.0
>20.0
no data
very low
low
middle
high
very high
Map shows wateravailabilitymeasured interms of 1 000m3 per capita/year
Source: compiledfrom UNDP, UNEP,World Bank andWRI 2000 andUnited NationsPopulation Division2001
Water availability in 2000 (1 000 m3 per capita/year)

either no domestic water supply or no easy access toit. In the same year, 41 per cent of the water wasuntreated and 31 per cent of the population had nosewage services (PAHO 1998). By 2000, 85 per centof the population had an improved water supply and 78per cent had improved sanitation coverage — but thisstill meant that 78 million people had no access toimproved water supply and 117 million had no accessto improved sanitation services (WHO and UNICEF2000). Large disparities also exist between rural and
urban areas. Natural disasters provide an additional,unexpected factor that can seriously undermine effortsto improve water and sanitation services.
Attempts have been made to improve water supplyand sanitation in many urban areas and to set tariffsthat reflect the real value of water. Although theefficiency of privatization and the use of economicinstruments such as water pricing remain highlycontentious (WWC 2000), some countries, such asJamaica, have started using economic instruments(UNECLAC 2000).
Limited information on water utilityinfrastructure and operation is a major constraint ingovernment efforts to improve regulations related tothe urban water sector. While the role ofgovernments has shifted from provider of a waterservice to regulator representing the public, manygovernments still do not have sufficient informationon water utility operation, and this limits theirregulatory functions. Although the rate oftechnological change in the water sector is generallyslower than in other sectors, the need to transfertechnology is critical to efforts to save water andintroduce improved control strategies.
To increase the efficiency of the sanitation sector,as well as to attract capital, national and internationalinitiatives have been suggested, including the creationof local or regional markets such as the GuaraniAquifer project (see box on page 169). In Brazil, therehave been notable advances in legislation, especiallywith a 1997 federal law that put in place a nationalwater resources policy and established a nationalwater resources management system.
Water qualityWater pollution problems in Latin America and theCaribbean did not become a serious issue until the1970s. Over the past 30 years, however, there hasbeen a significant decrease in the quality of surfacewater and groundwater. Agriculture and the release ofuntreated urban and industrial sewage have becomethe major sources of pollution.
The excessive use of fertilizers in agriculture hasenhanced algal growth and eutrophication in lakes,dams and coastal lagoons. Rising levels of nitrateshave been observed in rivers, including the Amazonand the Orinoco, as well as in underground sources inthe region. In Costa Rica, levels of nitratesapproaching or surpassing international guidelines
1 6 8 STATE OF THE ENVIRONMENT AND POLICY RETROSPECTIVE: 1972–2002
Community participation, a cost-sharing and cost-recoverysystem, hygiene education and training have contributed toimproving water supply and sanitation in many peri-urbancommunities in the Honduran capital of Tegucigalpa. Rapidurbanization over the past 20 years increased Tegucigalpa’spopulation to 850 000, with more than half of the peopleliving in 225 peri-urban communities. Surface water isalmost non-existent, and groundwater is often too deep andpolluted. The provision of basic services such as water andsewage systems is difficult and costly.
The programme on water supply for peri-urbansettlements, which is a partnership involving UNICEF, withthe National Autonomous Water and Sewage Authority(SANAA) Executive Unit for Settlements in Development(UEBD) and communities, provided water supply to150 000 people in 80 communities and sanitation coverageto about 5 000 in four communities between 1987 and1996. One of the strengths of the programme is communityparticipation and investment. The community has to providelabour and construction materials, contribute financiallythrough water tariffs and recover the full investment cost.The community must establish a Water Board to collecttariffs, administer the water system and take care of theoperation and simple maintenance activities. A cost-sharingand cost-recovery system exists and this includes the use ofa revolving fund: the community’s contribution is about 40per cent of the cost of the water system, while SANAA andUNICEF contribute 25 per cent and 35 per cent respectively.
Source: UNCSD 1999
The Tegucigalpa Model: water supply for peri-urban settlements
‘In 1998, Hurricane Mitch caused US$58 million of damage inHonduras alone. The devastation included the destruction of85 000 latrines and 1 683 rural water mains. As a result, 75 percent of the population — about 4.5 million people — lost accessto drinking water. Devastation such as that caused by HurricaneMitch may last for months or even years.’ — WHO and UNICEF 2000

have been found in both metropolitan and ruralsources (Observatorio del Desarrollo 2001).
Untreated sewage from urban centres remains amajor cause of pollution. In the region as a whole, onlyabout 13 per cent of collected sewage receives anykind of treatment (PAHO 1998). Increasing pollutionfrom urban run-off and the release of untreatedsewage into water bodies serving urban areas hasadded to the difficulties of meeting the increasing
demand for water in cities, especially those located inareas such as Lima and Mexico City where water isscarce (WWC 2000).
Industrial activities, and the resulting pollution,have contributed substantially to water qualityproblems. Animal waste from tanneries,slaughterhouses and meat packing plants, for example,pollutes aquifers with coliform bacteria (WWC 2000).
Another water quality problem that is becomingmore prevalent, especially in the Caribbean, is thesalinization of water in coastal areas due tooverextraction. This is particularly severe given therising demand for water in the Caribbean, mainly toservice the tourism industry (UNEP 1999).
Institutional and legal frameworks In most countries, water resources continue to bemanaged on a sectoral basis with little integrationeither between sectors or with other environmentalmanagement procedures. Such an approach ignoresvital interactions with much wider ecosystems andother functions, and ecological services related towater. There has been a trend towards transferringwater services from the public to the private sectorduring the past decade and to decentralizing legal andadministrative responsibilities. As a result, laws andregulations designed to protect freshwater resourcesare often lacking or poorly enforced (WWC 2000).
FRESHWATER 1 6 9
ACAA ( 2001). Usos e Impactos Atlas Continentaldel Agua en Americahttp://www.atlaslatinoamerica.org/usos_impac/amer_sur.htm
CATHALAC (1999). Vision on Water, Life and theEnvironment for the 21st Century. RegionalConsultations. Central America and Caribbean.Panama City, Water Centre for the Humid Tropicsof Latin America and the Caribbean (CATHALAC).
FAOSTAT (2001). FAOSTAT Statistical Database.Food and Agriculture Organizationhttp://www.fao.org/ [Geo-2-068]
GWP (2000). Water for the 21st Century: Visionto Action – South America. Stockholm, GlobalWater Partnership South American TechnicalAdvisory Committee
Observatorio del Desarrollo (2001). El agua enCosta Rica: abundante pero vulnerable BoletínInformación para la Toma de Decisiones, Año 3,No. 6, Abril-Mayo
PAHO (1998). Health in the Americas. Volume I,PAHO Scientific Publication No. 569. WashingtonDC, Pan American Health Organization
Saleth, R.M. and Dinar, A. (1999). WaterChallenge and Institutional Response (A Cross-Country Perspective), Policy Research WorkingPaper 2045. Washington DC, World BankDevelopment Research Group Rural Developmentand Rural Development Department
UNCSD (1999). The Tegucigalpa Model: WaterSupply for Peri-urban Settlements. United NationsCommission for Sustainable Developmenthttp://www.un.org/esa/sustdev/success/tegu_mod.htm
UNDP, UNEP, World Bank and WRI (2000). WorldResources 2000-2001. Washington DC, WorldResources Institute
UNECLAC (2000). Water Utility Regulation:Issues and Options for Latin America and theCaribbean. ECLAC, LC/R. 2032. Santiago de Chile,United Nations Economic Commission for LatinAmerica and the Caribbean
UNEP (1999). Caribbean Environment Outlook.Nairobi, United Nations Environment Programme
WHO and UNICEF (2000). Global Water Supplyand Sanitation Assessment 2000 Report. Genevaand New York, World Health Organization andUnited Nations Children’s Fundhttp://www.who.int/water_sanitation_health/Globassessment/GlasspdfTOC.htm
World Bank (1999). Annual Review – EnvironmentMatters, Washington DC, World Bank
World Bank (2001). World Development Indicators2001. Washington DC, World Bankhttp://www.worldbank.org/data/wdi2001/pdfs/tab3_8.pdf [Geo-2-024]
WWC (1999). Vision on Water, Life and theEnvironment for the 21st Century. RegionalConsultations: North America. Marseille, WorldWater Council
WWC (2000). Water in the Americas for theTwenty First Century, Roundtable Meeting of theAmericas, July 26-28 2000, Final Report,Montreal, World Water Council
References: Chapter 2, freshwater, Latin America and the Caribbean
The Guarani Aquifer System is one of the world’s largestaquifers, covering about 1.2 million km2 in the southeast ofSouth America. The permanent reserves of the system inBrazil are conservatively estimated at about 48 000 km3
with an annual recharge of 160 km3. Groundwaterextraction of about 20 per cent of current annual rechargerates would be enough to supply 300 litres per day percapita to 360 million inhabitants.
Argentina, Brazil, Paraguay and Uruguay are workingtogether to develop an integrated plan for the protection andsustainable management of the system under a project fundedby the Global Environment Facility and the World Bank — theProject for Environmental Protection and SustainableDevelopment of the Guarani Aquifer System. The Organizationof American States, other international donors and agenciesare also participating. Success would be an important steptowards ensuring long-term availability of freshwater andaquifer resources for people in these countries.
The Guarani Aquifer System
1 7 0 STATE OF THE ENVIRONMENT AND POLICY RETROSPECTIVE: 1972–2002
North America
North America holds about 13 per cent of the world’srenewable freshwater (excluding glaciers and icecaps). At the end of the 1990s, North Americans used1 693 cubic metres of water per person per year(Gleick 1998), more than in any other region. In theUnited States, recent conservation measures have ledto declines in consumption: during 1980–95, waterwithdrawals declined by nearly 10 per cent while thepopulation increased by 16 per cent (Solley, Pierce andPerlman 1998). In Canada, on the other hand, waterwithdrawal increased by 80 per cent during 1972–91while the population grew by 3 per cent (EC 2001a).
Although point source water pollution has beenreduced in the United States since the 1970s, non-
point sources, such as agricultural run-off and urbanstorm drainage, have grown causing serious pollutionproblems. Nutrient enrichment problems are ofparticular concern.
Most of the continent’s (unfrozen) freshwaterresources lie in groundwater. Groundwatercontamination and declining aquifer levels are nowpriority issues (Rogers 1996, EC 1999a).
Thirty years ago, one of the gravest issues facingNorth America’s freshwater resources was theprecarious state of the Great Lakes Basin. The clean-up effort is a notable story of cooperation amongnations and local users.
GroundwaterBy the mid-1990s, groundwater was supplying up to50 per cent of the North American population andmore than 90 per cent of rural dwellers (EPA 1998,Statistics Canada 2000).
The many hazardous compounds used in industryand agriculture are now threatening groundwaterquality. Contaminants from non-point sources arepresent in many shallow wells throughout largeregions of North America (Moody 1996). Agricultureis the worst offender, with artificial fertilizer use inthe region increasing from 15 to 22.25 million tonnes ayear over the past 30 years (IIFA 2001).
Although nitrogen contamination rarely exceedslevels of potential health risk, it is a chronic problemfor the population in the Prairie Provinces that rely onwells for water, and it affects groundwater to someextent in 49 US states (OECD 1996, Statistics Canada2000). Consumed in high concentrations, nitrates cancause infant methaemoglobinaemia or blue-babysyndrome (Sampat 2000).
During 1993–95, low concentrations of pesticideswere also detected in shallow groundwater in 54.4 percent of US sites tested. Although concentrations ofpesticides rarely exceed drinking water standards,some scientists suggest that their combined effects onhealth and the environment are not adequatelyassessed (Kolpin, Barbash and Gilliom 1998).
Underground storage tanks containing, forexample, petroleum products, acids, chemicals andindustrial solvents, are leading sources of groundwatercontamination (Sampat 2000). The tanks are ofteninappropriate containers for these substances or havebeen improperly installed. In 1998, more than 100 000petroleum tanks in the United States were found to beleaking. State Underground Tank Remediation Fundshave helped clean-up many US sites (US EPA 1998).
Septic tank systems, the largest source of wastedischarged to the land, contain many organiccontaminants and are suspected to be one of the keysources of rural well contamination. Between one-third and one-half of US septic systems may beoperating poorly (Moody 1996).
The long-term availability of groundwater in aridagricultural regions is a priority issue. In general,groundwater levels stopped declining during the 1980sbut depletion of stored groundwater still accounted forabout 10 per cent of all freshwater withdrawals in theUnited States in the mid-1990s (OECD 1996).Agriculture relied on groundwater resources for 62per cent of its irrigated farmland in 1990 (OECD 1996,Sampat 2000).
During the late 1980s and early 1990s, all USstates enacted groundwater legislation (TFGRR 1993,
A number of recent reports of localized well contamination have alerted the public tothe health risks associated with contaminated groundwater (EC 1999a). In May2000, for example, seven Canadians died and more than 2 000 became sick inWalkerton, Ontario, from E. coli contamination in the town’s water supply. Livestockmanure was one of the factors implicated in the accident, exacerbated by otherssuch as infrastructure failure, high-risk well location, human error and extremerainfall (ECO 2000).
The tragedy alerted the Canadian provinces to the need to correct serious drinkingwater problems related to contaminants from animal waste entering groundwatersupplies and, in the case of some, to the roles played by earlier budget cuts, staffreductions and greater reliance on municipalities for regulating environmentalservices (Gallon 2000).
Health risks from groundwater pollution
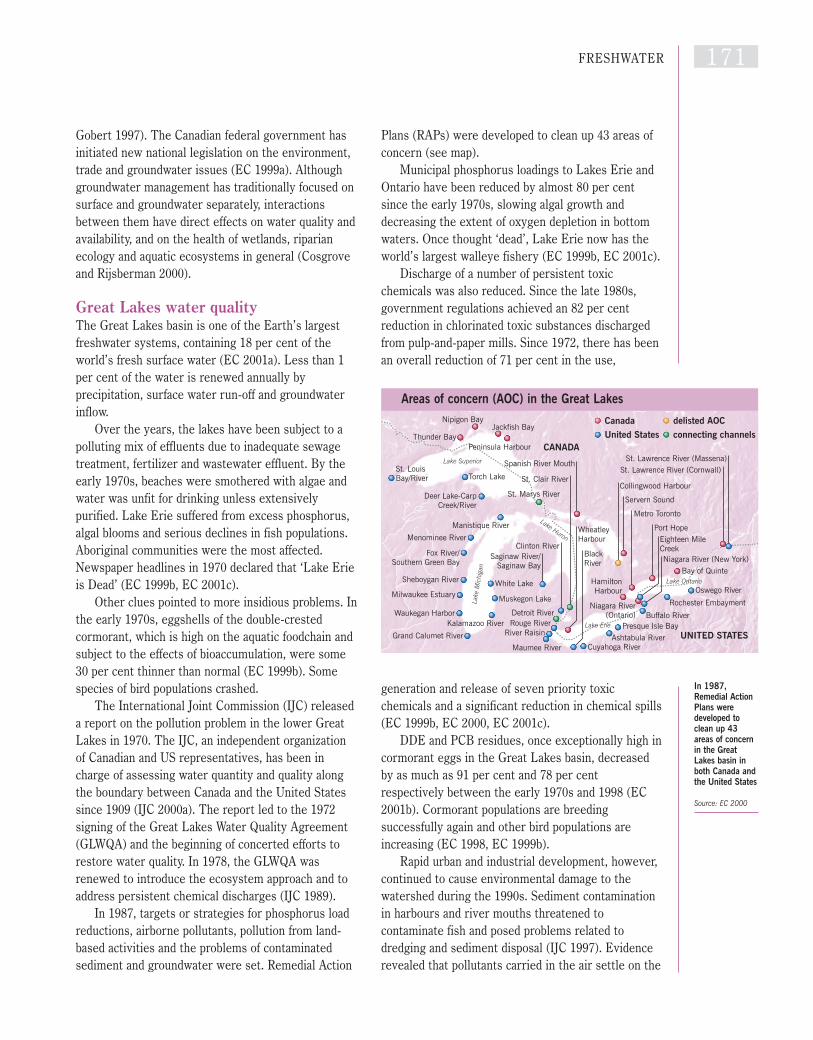
FRESHWATER 1 7 1
Gobert 1997). The Canadian federal government hasinitiated new national legislation on the environment,trade and groundwater issues (EC 1999a). Althoughgroundwater management has traditionally focused onsurface and groundwater separately, interactionsbetween them have direct effects on water quality andavailability, and on the health of wetlands, riparianecology and aquatic ecosystems in general (Cosgroveand Rijsberman 2000).
Great Lakes water qualityThe Great Lakes basin is one of the Earth’s largestfreshwater systems, containing 18 per cent of theworld’s fresh surface water (EC 2001a). Less than 1per cent of the water is renewed annually byprecipitation, surface water run-off and groundwaterinflow.
Over the years, the lakes have been subject to apolluting mix of effluents due to inadequate sewagetreatment, fertilizer and wastewater effluent. By theearly 1970s, beaches were smothered with algae andwater was unfit for drinking unless extensivelypurified. Lake Erie suffered from excess phosphorus,algal blooms and serious declines in fish populations.Aboriginal communities were the most affected.Newspaper headlines in 1970 declared that ‘Lake Erieis Dead’ (EC 1999b, EC 2001c).
Other clues pointed to more insidious problems. Inthe early 1970s, eggshells of the double-crestedcormorant, which is high on the aquatic foodchain andsubject to the effects of bioaccumulation, were some30 per cent thinner than normal (EC 1999b). Somespecies of bird populations crashed.
The International Joint Commission (IJC) releaseda report on the pollution problem in the lower GreatLakes in 1970. The IJC, an independent organizationof Canadian and US representatives, has been incharge of assessing water quantity and quality alongthe boundary between Canada and the United Statessince 1909 (IJC 2000a). The report led to the 1972signing of the Great Lakes Water Quality Agreement(GLWQA) and the beginning of concerted efforts torestore water quality. In 1978, the GLWQA wasrenewed to introduce the ecosystem approach and toaddress persistent chemical discharges (IJC 1989).
In 1987, targets or strategies for phosphorus loadreductions, airborne pollutants, pollution from land-based activities and the problems of contaminatedsediment and groundwater were set. Remedial Action
Plans (RAPs) were developed to clean up 43 areas ofconcern (see map).
Municipal phosphorus loadings to Lakes Erie andOntario have been reduced by almost 80 per centsince the early 1970s, slowing algal growth anddecreasing the extent of oxygen depletion in bottomwaters. Once thought ‘dead’, Lake Erie now has theworld’s largest walleye fishery (EC 1999b, EC 2001c).
Discharge of a number of persistent toxicchemicals was also reduced. Since the late 1980s,government regulations achieved an 82 per centreduction in chlorinated toxic substances dischargedfrom pulp-and-paper mills. Since 1972, there has beenan overall reduction of 71 per cent in the use,
generation and release of seven priority toxicchemicals and a significant reduction in chemical spills(EC 1999b, EC 2000, EC 2001c).
DDE and PCB residues, once exceptionally high incormorant eggs in the Great Lakes basin, decreasedby as much as 91 per cent and 78 per centrespectively between the early 1970s and 1998 (EC2001b). Cormorant populations are breedingsuccessfully again and other bird populations areincreasing (EC 1998, EC 1999b).
Rapid urban and industrial development, however,continued to cause environmental damage to thewatershed during the 1990s. Sediment contaminationin harbours and river mouths threatened tocontaminate fish and posed problems related todredging and sediment disposal (IJC 1997). Evidencerevealed that pollutants carried in the air settle on the
CANADA
UNITED STATES
Lake
Mic
higa
n
Lake Huron
Lake Superior
Lake Erie
Lake Ontario
Peninsula Harbour
Jackfish BayNipigon Bay
Thunder Bay
Torch LakeSt. LouisBay/River
Deer Lake-CarpCreek/River
St. Marys River
Spanish River Mouth
Manistique River
Menominee River
Fox River/Southern Green Bay
Sheboygan River
Milwaukee Estuary
Waukegan Harbor
Grand Calumet River
White Lake
Muskegon Lake
Kalamazoo River
Saginaw River/Saginaw Bay
Maumee River
River RaisinRouge RiverDetroit River
St. Clair River
WheatleyHarbour
BlackRiver
Clinton River
Cuyahoga RiverAshtabula River
Presque Isle BayBuffalo River
Rochester Embayment
Oswego River
St. Lawrence River (Massena)St. Lawrence River (Cornwall)
Bay of Quinte
Port HopeEighteen MileCreekNiagara River (New York)
Niagara River(Ontario)
HamiltonHarbour
Metro Toronto
Collingwood Harbour
Servern Sound
United States connecting channelsCanada delisted AOC
Areas of concern (AOC) in the Great Lakes
In 1987,Remedial ActionPlans weredeveloped toclean up 43areas of concernin the GreatLakes basin inboth Canada andthe United States
Source: EC 2000

1 7 2 STATE OF THE ENVIRONMENT AND POLICY RETROSPECTIVE: 1972–2002
lakes, contributing significantly to water pollution (USEPA 1997). Up to 96 per cent of PCBs in the GreatLakes come from the atmosphere (Bandemehr andHoff 1998). The Great Lakes Binational ToxicsStrategy was launched in 1997 to eliminate thesechemical contaminants (BNS 1999, EC 2000b).
Although exposure to persistent toxiccontaminants has decreased, some studies show thatchildren of mothers who ate large quantities of GreatLakes fish had development problems (Health Canada1997). Recent IJC reports warn of slow progress withsome problems, such as the clean-up of sediments
containing persistent toxic chemicals and exoticinvasive species (IJC 2000b).
The Great Lakes will face other environmentalchallenges in the future. Global warming could lowerlake levels by a metre or more by the middle of thiscentury, causing severe economic, environmental andsocial impacts. Water shortages throughout NorthAmerica may also increase pressure to divert orremove water in bulk from the lakes, threatening thesustainable use of surface and groundwater resources(IJC 2000c, IPCC 2001).
Bandemehr, A. and Hoff, R. (1998). Monitoring AirToxics: The Integrated Atmospheric DepositionNetwork of the Great Lakes (unpublished report tothe CEC Secretariat). Montreal, Commission forEnvironmental Cooperation
BNS (1999). The Great Lakes Binational ToxicsStrategy. Binational Toxics Strategyhttp://www.epa.gov/glnpo/p2/bns.html [Geo-2-129]
Cosgrove, William J. and Rijsberman, Frank R.(2000). World Water Vision: Making WaterEverybody’s Business. World Water Council.London, Earthscan
EC (1998). Toxic Contaminants in theEnvironment: Persistent Organochlorines.Environment Canada National EnvironmentalIndicator Series, State of the EnvironmentReporting Program. 98-1
EC (1999a). Groundwater — Nature’s HiddenTreasure: Freshwater Series A-5. EnvironmentCanada, Minister of Public Works and GovernmentServiceshttp://www.ec.gc.ca/water/en/info/pubs/FS/e_FSA5.htm [Geo-2-130]
EC (1999b). Rising to the Challenge: Celebratingthe 25th Anniversary of the Great Lakes WaterQuality Agreement. Ottawa, Environment Canada
EC (2000a). Binational Remedial Action Plans(RAPs). Environment Canadahttp://www.on.ec.gc.ca/glimr/raps/intro.html [Geo-2-131]
EC (2001a). The Management of Water.Environment Canadahttp://www.ec.gc.ca/water/index.htm
EC (2001b). Tracking Key Environmental Issues.Environment Canadahttp://www.ec.gc.ca/TKEI/air_water/watr_qual_e.cfm[Geo-2-132]
EC (2001c). Great Lakes Water QualityAgreement. Environment Canadahttp://www.ijc.org/agree/quality.html [Geo-2-134]
ECO (2000). Changing Perspectives: AnnualReport 1999/2000. Toronto, EnvironmentalCommissioner of Ontario
Gallon, Gary (2000). The Real Walkerton Villain.The Globe and Mail, 20 December 2000
Gleick, P.H. (1998). The World’s Water 1998-1999. Washington DC, Island Press
Gobert, Christopher (1997). GroundwaterContamination: A Look at the Federal Provisions.The Compleat Lawyer. Spring 1997http://www.abanet.org/genpractice/lawyer/complete/98julschneid.html [Geo-2-135]
Health Canada (1997). State of Knowledge Reporton Environmental Contaminants and HumanHealth in the Great Lakes Basin. Ottawa, Ministerof Public Works and Government Services
IIFA (2001). Fertilizer Nutrient Consumption, byRegion, 1970/71 to 1998/99. InternationalIndustry Fertilizer Associationhttp://www.fertilizer.org/ifa/ab_act_position3.asp[Geo-2-136]
IJC (1989). Great Lakes Water Quality Agreementof 1978. International Joint Commissionhttp://www.ijc.org/agree/quality.html [Geo-2-137]
IJC (1997). Overcoming Obstacles to SedimentRemediation in the Great Lakes Basin.International Joint Commissionhttp://www.ijc.org/boards/wqb/sedrem.html [Geo-2-138]
IJC (2000a). International Joint Commission:United States and Canadahttp://www.ijc.org/agree/water.html [Geo-2-139]
IJC (2000b). Open Letter to Great Lakes Leadersand the Great Lakes Community. Washington DCand Ottawa, International Joint Commission
IJC (2000c). Protection of the Waters of the GreatLakes: Final Report to the Governments of Canadaand the United States. International JointCommissionhttp://www.ijc.org/boards/cde/finalreport/finalreport.html [Geo-2-140]
IPCC (2001b). Climate Change 2001: Impacts,Adaptation and Vulnerability. Contribution ofWorking Group II to the Third Assessment Reportof the Intergovernmental Panel on Climate Change.Cambridge, United Kingdom, and New York, UnitedStates, Cambridge University Press
Kolpin, Dana W., Barbash, Jack E. and Gilliom,Robert J. (1998). Occurrence of Pesticides inShallow Ground Water of the United States: InitialResults from the National Water-QualityAssessment Program. Environmental Science andTechnology. 32, 1998http://water.wr.usgs.gov/pnsp/ja/est32/ [Geo-2-141]
Moody, David W. (1996). Sources and Extent ofGroundwater Contamination. North CarolinaCooperative Extension Service, Publication Number:AG-441-4http://www.p2pays.org/ref/01/00065.htm [Geo-2-142]
OECD (1996). Environmental PerformanceReviews: United States. Paris, Organization forEconomic Cooperation and Development
Rogers, Peter (1996). America’s Water: FederalRoles and Responsibilities. Cambridge,Massachusetts, MIT Press
Sampat, Payal (2000). Groundwater Shock: ThePolluting of the World’s Major Freshwater Stores.World Watch. 13, 1, 13-22
Solley, Wayne B., Pierce, Robert R. and Perlman,Howard A. (1998). Estimated Use of Water in theUnited States in 1995. US Department of Interior,US Geological Surveyhttp://water.usgs.gov/watuse/pdf1995/html/ [Geo-2-143]
Statistics Canada (2000). Human Activity and theEnvironment 2000. Ottawa, Minister of Industry
TFGRR (1993). Groundwater Issues and Researchin Canada: a report prepared for the CanadianGeoscience Council. Task Force on GroundwaterResources Researchhttp://wlapwww.gov.bc.ca/wat/gws/gissues.html[Geo-2-145]
US EPA (1997). Deposition of Air Pollutants to theGreat Waters: Second Report to Congress. EPA-453/R-977-011. Research Triangle Park, NorthCarolina, US Environmental Protection Agency
US EPA (1998). National Water Quality Inventory:1998 Report to Congress. US EnvironmentalProtection Agencyhttp://www.epa.gov/305b/98report/98summary.html [Geo-2-144]
References: Chapter 2, freshwater, North America

Freshwater: West Asia
The Arabian Peninsula is characterized by an aridclimate with annual rainfall of less than 100 mm.There are no reliable surface water supplies. The sub-region depends entirely on groundwater anddesalination plants to meet its water requirements.Large increases in demand have placed the meagreresources available under increasing pressure. TheMashriq sub-region is mostly arid and semi-arid.About 70 per cent of the sub-region receives less than250 mm of rain a year. The Mashriq has two sharedrivers originating outside the area, the Euphrates andTigris, and many smaller ones. Agreements orunderstandings about how to share these waterresources have been reached among Arab countriesbut agreements over the Euphrates are yet tomaterialize between Iraq and Syria on one side andTurkey on the other.
Increasing water demandThe major cause of the increasing demand for water israpid population growth. The region’s populationincreased from 37.3 million in 1972 to 97.7 million in2000 (United Nations Population Division 2001). Ahigh annual population growth rate of more than 3 percent in the Mashriq sub-region has seen the annualper capita share of available water resourcesdecreasing from 6 057 m3 in 1950 (Khouri 2000) to1 574 m3 in 2000 (see box above) .
Domestic water demand has also been rising dueto an increase in per capita consumption. In manycountries, water rationing is used to limit demand. Forexample, Jordan restricts water supplies in Amman toonly three days a week. In Damascus, water can beused for less than 12 hours a day.
Agriculture is the main user of water in West Asia,accounting for nearly 82 per cent of the total waterconsumed compared to 10 per cent and 8 per cent forthe domestic and industrial sectors, respectively. Inthe Arabian Peninsula, agriculture utilizes about 86per cent of the available water resources, and about 80per cent in the Mashriq (Khouri 2000). To satisfywater demand, especially for irrigation, groundwaterabstraction has increased dramatically during the pastthree decades.
In the Gulf Cooperation Council (GCC) countries,the total annual water supply increased from 6 km3 in1980 to 26 km3 in 1995, with 85 per cent of the water
used for agricultural purposes (Zubari 1997). In 1995,the GCC countries had water resources equivalent to466 m3/year per capita and a per capita water use of1 020 m3/year, producing an average annual waterdeficit of about 554 m3 per capita, provided mainly bymining groundwater reserves (Zubari 1997).
The water stress index in West Asia (expressed asa percentage of water used to available waterresources) is more than 100 per cent in five of theseven countries in the Arabian Peninsula, and iscritical in the remaining two. These countries havealready exhausted their renewable water resourcesand are now exploiting non-renewable reserves. In theMashriq, except in Jordan, the water stress index islower (see table above). While per capita waterresources in 9 of the 12 countries in West Asia arebelow 1 000 m3/year, they are also below 500 m3/year
FRESHWATER 1 7 3
conventional non-conventional
Mashriq
agricultural
municipal
industrial
95
8
12
5
80
Arabian Peninsula
85
113
15
86
Origins and usesof waterresources in theWest Asian sub-regions; theArabianPeninsulardepends mainlyon groundwater,the Mashriqcountries onsurface water —but both usemost of theirwater inagriculture
Source: Khouri2000
Water uses in West Asia
Mashriq Arabian Peninsula West Asia region
population 50.7 47.0 97.7(millions, 2000)
available water (km3/year) 79.9 15.3 95.2
water used (km3/year) 66.5 29.6 96.1
water stress index (%) 83.3 >100 >100
per capita available 1574 326 974(m3/year)
Source: ACSAD 2000 and United Nations Population Division 2001
Water stress index: West Asia
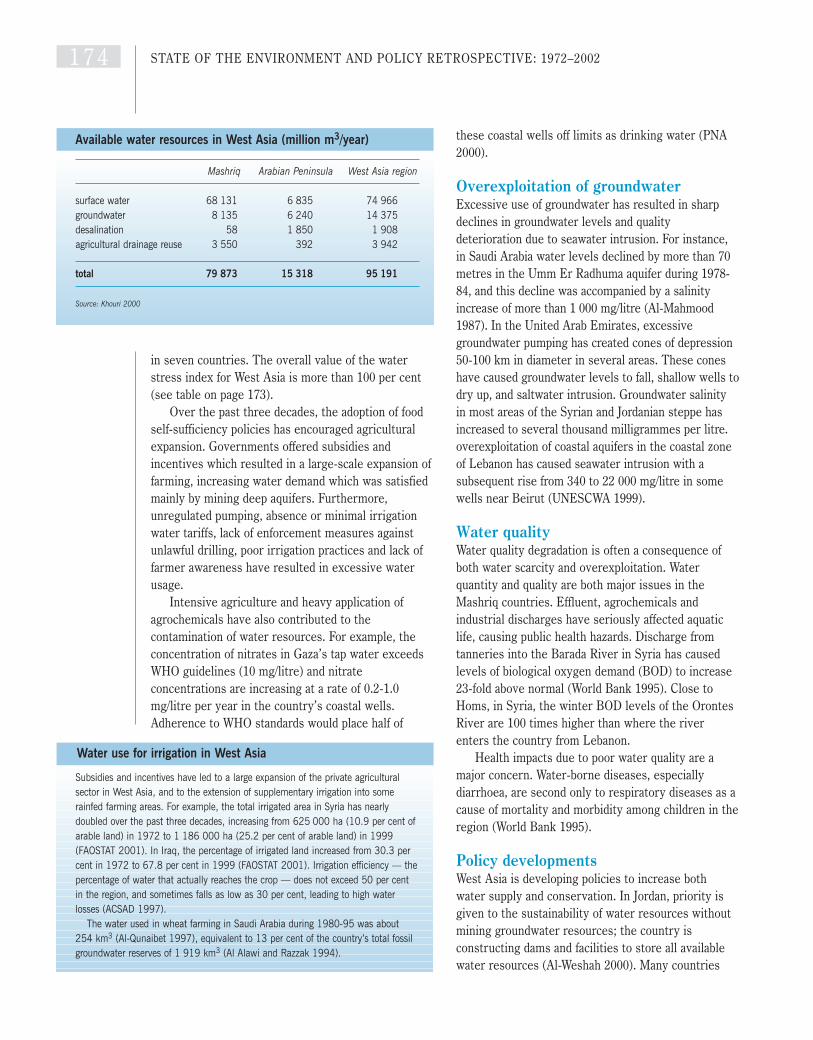
in seven countries. The overall value of the waterstress index for West Asia is more than 100 per cent(see table on page 173).
Over the past three decades, the adoption of foodself-sufficiency policies has encouraged agriculturalexpansion. Governments offered subsidies andincentives which resulted in a large-scale expansion offarming, increasing water demand which was satisfiedmainly by mining deep aquifers. Furthermore,unregulated pumping, absence or minimal irrigationwater tariffs, lack of enforcement measures againstunlawful drilling, poor irrigation practices and lack offarmer awareness have resulted in excessive waterusage.
Intensive agriculture and heavy application ofagrochemicals have also contributed to thecontamination of water resources. For example, theconcentration of nitrates in Gaza’s tap water exceedsWHO guidelines (10 mg/litre) and nitrateconcentrations are increasing at a rate of 0.2-1.0mg/litre per year in the country’s coastal wells.Adherence to WHO standards would place half of
these coastal wells off limits as drinking water (PNA2000).
Overexploitation of groundwaterExcessive use of groundwater has resulted in sharpdeclines in groundwater levels and qualitydeterioration due to seawater intrusion. For instance,in Saudi Arabia water levels declined by more than 70metres in the Umm Er Radhuma aquifer during 1978-84, and this decline was accompanied by a salinityincrease of more than 1 000 mg/litre (Al-Mahmood1987). In the United Arab Emirates, excessivegroundwater pumping has created cones of depression50-100 km in diameter in several areas. These coneshave caused groundwater levels to fall, shallow wells todry up, and saltwater intrusion. Groundwater salinityin most areas of the Syrian and Jordanian steppe hasincreased to several thousand milligrammes per litre.overexploitation of coastal aquifers in the coastal zoneof Lebanon has caused seawater intrusion with asubsequent rise from 340 to 22 000 mg/litre in somewells near Beirut (UNESCWA 1999).
Water qualityWater quality degradation is often a consequence ofboth water scarcity and overexploitation. Waterquantity and quality are both major issues in theMashriq countries. Effluent, agrochemicals andindustrial discharges have seriously affected aquaticlife, causing public health hazards. Discharge fromtanneries into the Barada River in Syria has causedlevels of biological oxygen demand (BOD) to increase23-fold above normal (World Bank 1995). Close toHoms, in Syria, the winter BOD levels of the OrontesRiver are 100 times higher than where the riverenters the country from Lebanon.
Health impacts due to poor water quality are amajor concern. Water-borne diseases, especiallydiarrhoea, are second only to respiratory diseases as acause of mortality and morbidity among children in theregion (World Bank 1995).
Policy developmentsWest Asia is developing policies to increase bothwater supply and conservation. In Jordan, priority isgiven to the sustainability of water resources withoutmining groundwater resources; the country isconstructing dams and facilities to store all availablewater resources (Al-Weshah 2000). Many countries
1 7 4 STATE OF THE ENVIRONMENT AND POLICY RETROSPECTIVE: 1972–2002
Subsidies and incentives have led to a large expansion of the private agriculturalsector in West Asia, and to the extension of supplementary irrigation into somerainfed farming areas. For example, the total irrigated area in Syria has nearlydoubled over the past three decades, increasing from 625 000 ha (10.9 per cent ofarable land) in 1972 to 1 186 000 ha (25.2 per cent of arable land) in 1999(FAOSTAT 2001). In Iraq, the percentage of irrigated land increased from 30.3 percent in 1972 to 67.8 per cent in 1999 (FAOSTAT 2001). Irrigation efficiency — thepercentage of water that actually reaches the crop — does not exceed 50 per centin the region, and sometimes falls as low as 30 per cent, leading to high waterlosses (ACSAD 1997).
The water used in wheat farming in Saudi Arabia during 1980-95 was about254 km3 (Al-Qunaibet 1997), equivalent to 13 per cent of the country’s total fossilgroundwater reserves of 1 919 km3 (Al Alawi and Razzak 1994).
Water use for irrigation in West Asia
Mashriq Arabian Peninsula West Asia region
surface water 68 131 6 835 74 966groundwater 8 135 6 240 14 375desalination 58 1 850 1 908agricultural drainage reuse 3 550 392 3 942
total 79 873 15 318 95 191
Source: Khouri 2000
Available water resources in West Asia (million m3/year)

have started to invest in more efficient irrigationtechnology. Improvements in irrigation efficiency inthe Jordan Valley increased average yields forvegetables from 8.3 tonnes per hectare in 1973 to 18.2tonnes per hectare in 1986 (World Bank 1995).Wastewater reuse is another important conservationtool for non-potable uses, including irrigation, and forreducing environmental degradation and improvingpublic health. Reuse of treated wastewater hasincreased in Mashriq countries from zero in 1973 toabout 51 million m3/year in 1991 (Sarraf 1997). Butcomprehensive water policies to manage waterresources are still lacking in many countries.
The problem of water scarcity and qualitydeterioration in the region is attributed to:
● fragmentation and weakness of water authorities,leading to inefficient water management and toconflicts over use between different sectors;
● rapid and unplanned urbanization, including ruralto urban migration;
● political and military conflicts negatively affectingthe development of the water sector;
● escalating sectoral water demands;● food self-sufficiency policies;● poor irrigation practices;● lack of sanitation causing pollution; and ● lack of mechanisms for strengthening water
legislation and enforcement procedures.
Lack of hydrographic data is a serious issue. Moststudies are based on short record data or even oneducated guesses.
In the past three decades, water authorities in theregion have concentrated their efforts on supplyaugmentation and, to a lesser extent, on demandmanagement and conservation. Although theireffectiveness is not yet proven, programmes related todemand management, conservation and protectionhave been implemented in both sub-regions. Theseprogrammes include the reduction of fuel andagricultural subsidies, metering of groundwater wells,future plans for an irrigation water tariff, subsidies formodern irrigation techniques, and public awarenesscampaigns.
In the GCC countries, these policies have beenonly partially successful in alleviating water scarcitycaused by increasing demand and food self-sufficiencypolicies. In fact, the food self-sufficiency policies of thepast three decades have not been successful. Thedeficit in food production is growing and is aggravatedby the scarcity of land and water resources that arealready overexploited. Water security will become oneof the major constraints to further development in theregion in the next 30 years unless there are majorchanges to agricultural and water policies.
FRESHWATER 1 7 5
ACSAD (1997). Water resources and theirutilization in the Arab world, 2nd Water ResourcesSeminar. Conference held in Kuwait, 8-10 March 1997
ACSAD (2000). Alternative Policy Study: WaterResource Management in West Asia. Nairobi,United Nations Environment Programmehttp://www.grida.no/geo2000/aps-wasia/index.htm[Geo-2-146]
Al-Alawi, Jamil and Abdul Razzak, M. (1994).Water in the Arabian Peninsula: Problems andPerspectives. In Peter Rogers and Peter Lydon(eds.). Water in the Arab World: Perspectives andPrognoses. Cambridge, Massachusetts, HarvardUniversity Press
Al-Mahmood, M.J. (1987). Hydrogeology of Al-Hassa Oasis. M.Sc. Thesis, Geology Department,College of Graduate Studies, King Fahd Universityof Petroleum and Minerals, Saudi Arabia
Al-Qunaibet, M.H. (1997). Water Security in theKingdom of Saudi Arabia. In Al-Zubari, W. andMohammed Al-Sofi (eds.). Proceedings of the 3rdGulf Water Conference, 8-13 March 1997,Muscat
Al-Weshah, R. (2000). Hydrology of Wadi Systemsin Jordan. Damascus, Arab Network on WadiHydrology, ACSAD/ UNESCO
FAOSTAT (2001). FAOSTAT Statistical Database.Food and Agriculture Organizationhttp://www.fao.org/ [Geo-2-068]
Khouri, J. (2000). Sustainable Management ofWadi Systems in the Arid and Semi Arid zones ofthe Arab Region. International Conference on WadiHydrology. Conference held in Sharm El-Sheikh,Egypt, 21-23 November 2000
PNA (2000). State of Environment, Palestine.Jerusalem, Ministry of Environmental Affairs,Palestine National Authority
Sarraf, S. (1997). Water Resources of the ArabCountries: A Review. In ACSAD, Water resourcesand their utilization in the Arab world, 2nd WaterResources Seminar. Conference held in Kuwait, 8-10 March 1997
UNESCWA (1999). Updating the Assessment ofWater Resources in ESCWA Member States,ESCWA/ ENR/ 1999/ WG.1/7. Beirut, UnitedNations Economic and Social Commission for WestAsia
United Nations Population Division (2001). WorldPopulation Prospects 1950-2050 (The 2000Revision). New York, United Nationswww.un.org/esa/population/publications/wpp2000/wpp2000h.pdf
World Bank (1995). Towards SustainableDevelopment: an Environmental Strategy for theMiddle East and North Africa Region. WashingtonDC, World Bank
Zubari, W.K. (1997). Towards the Establishment ofa Total Water Cycle Management and Re-useProgram in the GCC Countries. The 7th RegionalMeeting of the Arab International HydrologicalProgramme Committee, 8-12 September 1997,Rabat, Morocco
References: Chapter 2, freshwater, West Asia

Freshwater: the Polar Regions
ArcticThe Arctic holds much of the world’s freshwater supplyand its landscape is dominated by freshwater systems.The two main permanent ice fields are the ice pack ofthe Arctic Ocean (8 million km2) and the Greenland icecap (1.7 million km2), which together hold 10 per centof the world’s freshwater. The Greenland ice capproduces about 300 km3 of icebergs a year. The Arctichas several of the world’s largest rivers. They pour4 200 km3 of freshwater into the Arctic Ocean annuallyalong with about 221 million tonnes of sediment (Craneand Galasso 1999, AMAP 1997).
Low temperatures, low nutrient, short lightavailability and a brief growing season limit theprimary productivity of Arctic freshwater systems.This in turn restricts the animal life that can besupported. Nevertheless, the river systems are
heavily populated by several fish species such as theArctic charr, and the North Atlantic and Pink salmon.In recent years, the overall warming trend plusincreased recreational and commercial fisheries usehave put pressure on these populations. Accidental
introduction of alien species and increased fishfarming is another source of concern (Bernes 1996).Eutrophication is a recent problem in several lakes inScandinavia where human settlements have raisednutrient levels.
Northbound rivers are major pathways of pollutantsfrom sources far inland, especially in the RussianFederation. In the spring, these contaminants aredeposited into the freshwater systems and eventuallyinto the marine environment and can be transportedthousands of kilometres from their sources via theArctic’s marine circulation patterns. Contaminantsinclude chemicals from agricultural, industrial andpetroleum production, radionuclides from nucleartesting and military activities, and water soluble salts(Crane and Galasso 1999). The Arctic countries adopteda circumpolar Regional Programme of Action forProtection of the Arctic Marine Environment againstLand-based Activities (based on the Global Programmeof Action for the Protection of the Marine Environmentfrom Land-based Activities) as well as NationalProgrammes of Action in some countries, including theRussian Federation. These instruments are too recent toassess long-term effectiveness (PAME 1998).
Opposition to damming is strong in the Nordiccountries. During 1975-2001, the Cree people foughtthe government of Quebec over environmentaldamage to their lands. In a surprise move in October2001, however, the Cree reversed their stand andsigned an agreement in principle to allow thegovernment of Quebec to build another large powerdevelopment project on the Eastmain-Rupert riversystem in exchange for a cash settlement. In 2000, ahydroelectric power project that would have floodedan important wetland was rejected (Arctic Bulletin
1 7 6 STATE OF THE ENVIRONMENT AND POLICY RETROSPECTIVE: 1972–2002
Major river systems in the Arctic
Catchment areaof the ArcticOcean, showingmajor rivers withtheir annualdischarges incubic kilometres
Source: CAFF 2001
1 200
0
1970
1980
2000
1985
600
400
200
1975
1990
1995
800
1 000
The decline of Barrow’s Goldeneye
The decline of Barrow’s Goldeneye, Bucefala islandica, at Lake Myvatyn,Iceland, measured by numbers of males in the spring
Source: CAFF 2001
2001). In 2001, Iceland’s National Planning Agencyrejected plans for a hydroelectric power project thatwould have dammed two of the three main riversflowing from Europe’s largest glacier and destroyed avast wilderness.
Since the 1970s, surface air temperatures appear tohave increased on average 1.5°C per decade overcontinental Siberia and western portions of NorthAmerica, both of which are major sources of freshwaterinto the Arctic basin. The opposite trend is occurringin Greenland and Canada’s eastern Arctic where thereis a negative trend of –1°C per decade (AMAP 1997).The warming trend has resulted in thawing of thecontinuous permafrost in Alaska and northern Russia(Morison and others 2000, IPCC 2001).
Arctic countries have partially responded tothreats to their freshwater systems by establishingprotected areas and designating important wetlandareas under the Convention on Wetlands ofInternational Importance. Nearly half the protectedarea in the Arctic is the Greenland ice cap and glacierswhich store freshwater.
Antarctic Although the Antarctic ice cap is the world’s largestbody of freshwater, there are also seasonal streamsand rivers, and numerous lakes and ponds inAntarctica. Other sources of freshwater are capturedin the glaciers that occur in many coastal Antarcticregions. All these freshwater features are potentiallythreatened by pollution, including contaminates
introduced by Antarctic scientists and tourists. Freshwater lakes are found mainly in the coastal
regions, on many of the sub-Antarctic Islands, and inthe rare ice-free areas. Many are exposed to potentialcontamination from human activities. Observations atselected lakes, however, show that contaminationresulting from research activities and stationoperations is generally near or below detection levels.In the Larsemann Hills of East Antarctica, trace metalconcentrations appear to be higher in lakes situated inthe vicinity of stations than those further away. Theconcentration levels still complied with drinking waterstandards (Gasparon and Burgess 2000). It is expectedthat the Protocol on Environmental Protection to theAntarctic Treaty will minimize the impacts of humanactivities on these lakes.
In 1970, observations revealed the existence oflarge lakes under the ice sheet in the central regionsof the continent. Lake Vostok, which is about 220 kmlong, 70 km wide and holds about 2 000 km3 of water,is the largest of the approximately 70 sub-glacial lakesknown today (Dowdeswell and Siegert 1999). Theglobal significance of sub-glacial lakes is that theyhave not been exposed to the atmosphere for the past500 000 years and therefore maintain a unique archiveof the past environment. There are also indicationsthat Lake Vostok could contain viable micro-organisms(Karl and others 1999, Priscu and others 1999). Anumber of technologies for entering the lake withoutcontaminating it are being considered (RussianFederation 2001).
FRESHWATER 1 7 7
Arctic Bulletin (2001). WWF Arctic ProgrammeNo. 3.01, Oslo
AMAP (1977). Arctic Pollution Issues: A State ofthe Arctic Environment Report. Arctic CouncilArctic Monitoring and Assessment Programme,Oslo
Bernes, C. (1996). The Nordic Arctic Environment– Unspoilt, Exploited, Polluted? Nordic Council ofMinisters, Copenhagen
CAFF (2001). Arctic Flora and Fauna: Status andConservation. Conservation of Arctic Flora andFauna. Helsinki, Edita
Crane, K. and Galasso, J.L. (1999). ArcticEnvironmental Atlas. Office of Naval Research,Naval Research Laboratory, Washington DC
Dowdeswell, J.A. and Siegert, M.J. (1999). Thedimensions and topographic setting of Antarcticsubglacial lakes and implications for large-scalewater storage beneath continental sheets.Geological Society of America Bulletin 111, 2
Gasparon, M. and Burgess, J.S. (2000). Humanimpacts in Antarctica trace-element geochemistry offreshwater lakes in the Larsemann Hills, EastAntarctica. Environmental Geology 39 (9), 963–76
IPCC (2001). Climate Change 2001: TheScientific Basis. Contribution of Working Group Ito the Third Assessment Report of theIntergovernmental Panel on Climate Change.Cambridge, United Kingdom, and New York,United States, Cambridge University Press
Karl, D.M., Bird, D.F., Bjorkman, K., Houlihan, T.,Shackelford, R. and Tupas, L. (1999).Microorganisms in the accreted ice of Lake Vostok,Antarctica. Science 286 (5447), 2144–47
Morison, J., Aagaard, K. and Steele, M. (2000).Recent Environmental Changes in the Arctic: areview. Arctic (Arctic Journal of the ArcticInstitute of North America) 53, 4, December2000
PAME (1998). Regional Programme of Action forthe Protection of the Arctic Marine Environmentfrom Land-Based Activities. Arctic CouncilProgramme for the Protection of the Arctic MarineEnvironment
Priscu, J.C., Adams, E.E., Lyons, W.B., Voytek,M.A., Mogk, D.W., Brown, R.L., McKay, C.P.,Takacs, C.D., Welch, K.A., Wolf, C.F., Kirshtein,J.D., and Avci, R. (1999). Geomicrobiology ofsubglacial ice above Lake Vostok, Antarctica.Science 286 (5447), 2141–44
Russian Federation (2001). Expert Conclusions forthe Project ‘Justification and development of theecologically clean technology for penetrating thesubglacial Lake Vostok’. Working Paper 29, 4thAntarctic Treaty Consultative Meeting, 9-20 July2001, St. Petersburg
References: Chapter 2, freshwater, the Polar Regions

1 7 8 STATE OF THE ENVIRONMENT AND POLICY RETROSPECTIVE: 1972–2002
OUR CHANGING ENVIRONMENT: Three Gorges dam, China
The Three Gorges Dam is located northwest of Yichang city inHubei Province, China, a sub-tropical region that supportsevergreen and deciduous mixed forest.
In the images, vegetation appears natural green, waterbodies blue, bare land pink and built-up areas bluish-violet.
The images show the great changes that have taken place tofarmland and to the original bush forest. In the area round the
Three Gorges dam (dead centre of both images), a formerly vegetated area has been largelyreplaced by a man-made landscape. Soil erosion in this area has been intensified, as can be seen in the year 2000 image.
Imagery and text: China National Environmental Monitoring Centre
1987
2000

FRESHWATER 1 7 9
OUR CHANGING ENVIRONMENT: Jilin Province, China
Nenjiang plain is located in thenortheast of China, in the semi-aridmid-temperate zone. The plain isnowhere more than 100 metres abovesea level. Much of the region consistsof wetlands which are important for
protecting biodiversity and marshland resources. Theimages show the vast marshland zone to the east ofBaicheng City in Jinlin Province. Water bodies appearblue-black. The large area of water on the lower rightof the image is Yueliangpao. The two images showhow marshland has been lost and replaced byfarmland, which appears red in the image. alsoindicated the loss of biodiversity in this region. Landsalinization is beginning to occur along the banks ofthe river (white areas).
Imagery and text: China National Environmental Monitoring Centre
1987
2000