unfair and unclear - equality trust · research was conducted online by the equality trust in...
TRANSCRIPT
THE EFFECTS AND PERCEPTION OF THE UK TAX SYSTEM
Madeleine Power and Tim StaceyJune 2014
UNFAIR AND UNCLEAR

CONTENTS
Executive Summary 4
Introduction 6
Methodology 8
Key Findings 10
Public Perceptions of the Tax Distribution 11
Public Attitudes Towards the Tax Distribution 12
The Reality: The UK’s Current Tax Distribution 14
How Has the Tax Distribution Changed? 15
Individual Taxes 16
Indirect Taxes 21
The UK Tax System - Key Questions 23
Policy Recommendations 26
Conclusion 27
4 | Unfair and Unclear
EXECUTIVE SUMMARY
Tax has long been an important area of public and political debate in the UK. Who pays what, who avoids tax, and whether tax is ‘fair’ are questions that are regularly tackled in our press and in Parliament. But much of this debate is based upon a reductive and misleading account of tax. For example income tax is often used to describe overall tax, despite only accounting for just over a quarter of the total tax take, less than the combined tax take of VAT and National Insurance Contributions. In addition, people’s understanding of their own tax is often considered only in terms of their marginal tax rate.
Given these muddied waters, it is unclear how much the public really knows about what they and others are taxed. This report aims to not only clear these waters by determining people’s understanding of tax, but also discover what they believe people should be taxed, and how this compares to the UK’s current tax system.
Public polling conducted in partnership with Ipsos MORI reveals that:
1. Public perception of how the UK’s tax system affects households in different income groups contrasts sharply with the reality
2. The public believe the UK’s tax system is more progressive than it is, with nearly seven in ten people (68%) believing that households in the highest 10% income group pay more of their income in tax than those in the lowest 10%. In reality, the top 10% pay a smaller proportion of their income in tax than the bottom 10%
3. Public support for a more progressive1 tax system is high. Over eight in ten (82%) believe that households in the highest 10% income group should pay a greater proportion of their income in tax than those in the bottom 10%. An even greater majority (96%) would like the tax system to be more progressive than it currently is.
1 Definedasthelowest10%householdincomegrouppayingalowerproportionoftheirincomeintaxthantheaveragehousehold,whoin
turn pay a lower proportion than households in the highest 10% income group.
Unfair and Unclear | 5
Our analysis of the proportion of gross household income that households at each decile pay in all taxes shows that:
1. The current tax distribution in the UK is regressive.
2. A household in the bottom 10% pays 43% of its income in tax, while the average household and a household in the top 10% both pay 35% – 8 percentage points less than the bottom 10%.
3. The higher percentage paid by the poor (bottom 10%) is attributable to a number of taxes. While income tax and national insurance are broadly progressive, the bottom 10% of households pay roughly 23% of their gross household income in indirect taxes on consumption and more than four times as much of their income in council tax as the top 10%.
Thesefindingsshowthatthecurrenttaxsystemisnotfitforpurpose. Forthesystemtobetter acknowledge the preferences of the electorate, policy must aim for a tax system that is progressive.
Inviewofourfindingsinthisreport,wemakethefollowingrecommendations:
• Parties seeking to form the government from 2015 should commit to the principle that any changes in tax policy are progressive
• Council tax should be transformed into a progressive property tax by re-evaluating properties and creating new bands with higher rates for high value properties
• Government should look to reduce VAT when it has a budget surplus
• The upper limit of National Insurance should be raised to ensure that the tax is progressive across all deciles.
6 | Unfair and Unclear
INTRODUCTION
In recent months the UK’s economy has appeared to pick up. But although cautious optimism may have returned, another question is now being asked – who is benefitting from the recovery?
For many people real wages continue to stagnate, or even fall, but at the top a small number of the ‘super-wealthy’ have seen their incomes and wealth soar. Over the past year alone, the richest 100 people in the UK have seen their wealth increase by a staggering £40.1 billion to a total of £297.133 billion. This is equivalent to over £100 billion more than the wealth of the poorest 30% of the UK population. Such inequality is of growing concern to the British public2, and as others have proven, spiralling inequalities of income and wealth divide communities, damage health and place the economy in jeopardy3.
Tax is an important tool in reducing the worst excesses of rising inequality. When used well, taxandtransferscanreducetheincomedisparitysignificantly,forinstanceby38%inFinlandand 31% in Germany4. In the UK however, when all taxes are considered, our system is in fact regressive. Households in the lowest 10% income group are taxed proportionally more than those in the highest 10% income group.
Unsurprisingly, there is considerable public, political and academic debate about the fairness of the tax system in the UK, particularly in relation to economic inequality. But the extent to which this debate is based on reality is questionable. For example, discussions on the tax distribution frequently concentrate on income tax only, despite this constituting only about 27% of the overall tax take.
This report seeks to illuminate the current levels of confusion in the tax debate and dispel some of this misunderstanding by setting out the actual tax distribution. In doing so, it aims to provide the basis for a more honest debate about the UK’s tax system, as well as explore possibilities for the development of a tax system that better acknowledges public preferences.
ThefirstsectionexplorestheUKpublic’sunderstandingoftheamountoftaxpaidbypeople across the income distribution and investigates what the public perceive to be a fair distribution. This is followed by an analysis of the tax system in its current form and assessment oftheextenttowhichtaxisfairlydistributedacrosstheincomespectrum.Thefinalsection
2 Economist/Ipsos MORI March 2014 Issues Index March 2014
3 http://www.equalitytrust.org.uk/about-inequality
4 Therborn G, 2013, The Killing Fields of Inequality, Polity Press

Unfair and Unclear | 7
discussesthefindingsandaskswhetherthecurrenttaxsystemisanaccuratereflectionofpublic perceptions and preferences.

8 | Unfair and Unclear
METHODOLOGY
Research was conducted online by The Equality Trust in partnership with Ipsos MORI among a total of 1,036 adults aged 16-75 in the United Kingdom from 11th – 14th April 2014 via its Online iOmnibus Survey. The survey data were weighted by age, gender, region, social grade and working statustotheknownprofileoftheUKpopulationaged16-75.
Itwasensuredthatallrespondentshadthesameworkingdefinitionof“householdincome”and“alltypesoftaxes”byrequiringthemtoreadthefollowingbeforebeginningthesurvey:
“ThenextfewquestionsareabouthouseholdsacrosstheUnitedKingdom–thatisacrossEngland, Scotland, Wales and Northern Ireland.
Thequestionsareabout“householdincome”–thatistotalhouseholdincomefromallsources,before tax and other deductions. The next few questions ask about all of the different taxes individuals in a household may pay. By tax we mean all of the following types of tax:
• Income tax• Tax on interest earned by savings/rental income/other income• Capital gains tax• Council tax• Car/vehicle/road tax• Inheritance tax• Stamp duty• Tax added to the cost of some goods, services, and transactions (i.e. VAT):• National insurance• Tax duty on fuel, beer, cider, wine, spirits, tobacco• Betting & Gaming Duties• Air Passenger Duty• Insurance Premium Tax• LandfillTax• Climate Change Levy• Aggregates tax
If you are unsure of the answer to one or more of the questions please provide your best “guesstimate”.”
Unfair and Unclear | 9
Itisimportanttonotethatatnopointwererespondentsmadeawareoftheactualfiguresforthe percentage of income paid in all types of taxes by the household income groups.
TocalculatetheleveloftaxpaidbyeachgroupweusedtheONSEffectsofTaxandBenefitsonHousehold Income, 2013 data. The data available from the ONS runs from 1977 to 2011. We looked at the difference between gross income and post-tax income measuring the percentage of gross income removed through direct tax and indirect taxation. The ONS data addresses taxes on incomes and not those on capital, as there is not a valid way of estimating these taxes. We are focusing on households in the lowest 10%, Mean and highest 10% income groups, as these are available in the ONS dataset and are the easiest to communicate to the public.
10 | Unfair and Unclear
KEY FINDINGS
1. Public perception of how the UK’s tax system affects households in different income groups contrasts sharply with the reality
2. The public believe the UK’s tax system is more progressive than it is, with nearly seven in ten people (68%) believing that households in the highest 10% income group pay more of their income in tax than households in the lowest 10% income group. In reality, households in the highest 10% income group pay a smaller proportion of their income in tax than households in the lowest 10% income group
3. Public support for a more progressive5 tax system is high. Overfourfifthsofthepopulation (82%) think that households in the highest 10% income group should pay a greater proportion of their income in tax than households in the lowest 10% income group. And 96% would like the tax system to be more progressive than it currently is.
5 Defined as the lowest 10% household income group paying a lower proportion than the average household, who in turn pay a lower proportion than households in the highest 10% income group.
Unfair and Unclear | 11
PUBLIC PERCEPTIONS OF THE TAX DISTRIBUTION
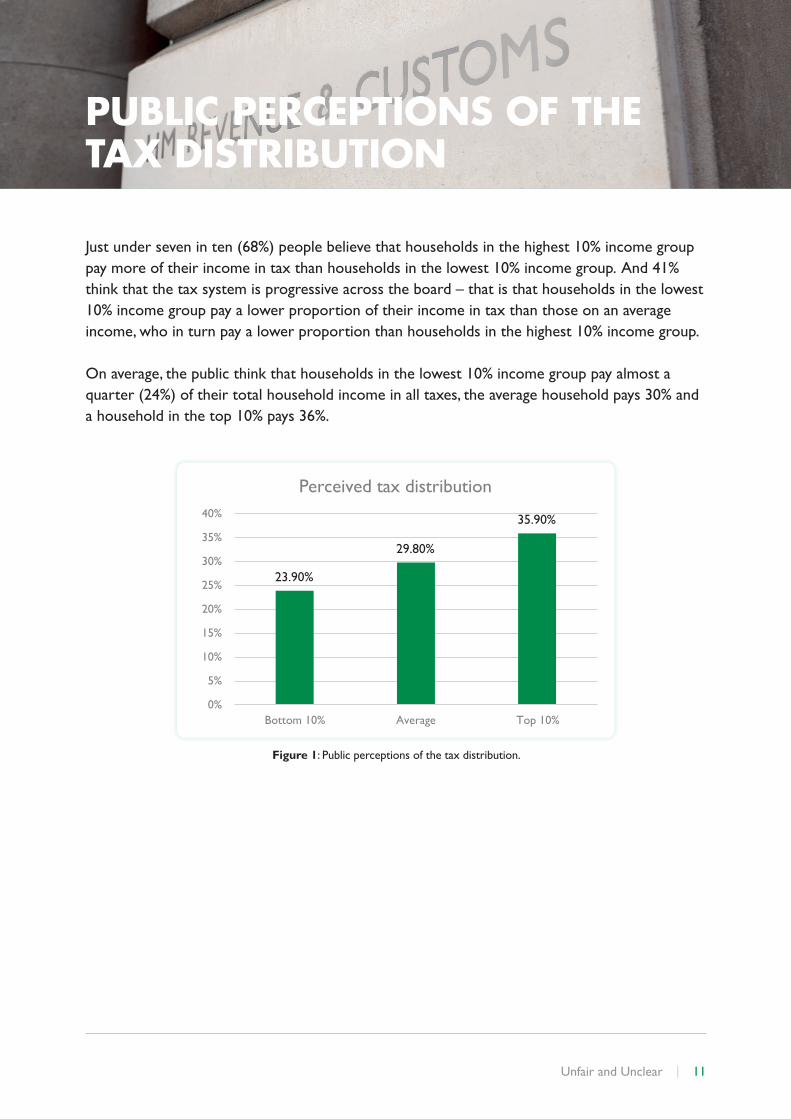
Just under seven in ten (68%) people believe that households in the highest 10% income group pay more of their income in tax than households in the lowest 10% income group. And 41% think that the tax system is progressive across the board – that is that households in the lowest 10% income group pay a lower proportion of their income in tax than those on an average income, who in turn pay a lower proportion than households in the highest 10% income group.
On average, the public think that households in the lowest 10% income group pay almost a quarter (24%) of their total household income in all taxes, the average household pays 30% and a household in the top 10% pays 36%.
23.90%
29.80%
35.90%
0%
5%
10%
15%
20%
25%
30%
35%
40%
Bottom 10% Average Top 10%
Perceived tax distribution
Figure 1: Public perceptions of the tax distribution.
12 | Unfair and Unclear
PUBLIC ATTITUDES TOWARDS THE TAX DISTRIBUTION
People think that the tax system should be considerably more progressive than they perceive it to be.
Overfourthfifthsofthepopulation(82%)thinkthathouseholdsinthehighest10%incomegroup should pay a greater proportion of their income in tax than households in the lowest 10% income group. Six in ten people (59%) believe that the tax system should be progressive across the board, with households in the lowest 10% income group paying a smaller proportion of their income in tax than those on an average income, who in turn should pay less than households in the highest 10% income group.
When people’s preferences are measured against the actual tax distribution, rather than their perception of what it is, 96% think that the gap in tax paid between households in the highest 10% income group and households in the lowest 10% income group should be more progressive than it currently is.
On average, people think that:
• Households in the highest 10% income group should pay 39% of their income in tax – 3 percentage points more than they believe they currently do pay
• The average household should pay 22% – 8 percentage points less than they think currently do• Households in the lowest 10% income group should pay only 15% of their total income in
tax – 9 percentage points less than they are currently thought to do.

Unfair and Unclear | 13
14.80%
22.40%
38.60%
0%
5%
10%
15%
20%
25%
30%
35%
40%
45%
Bottom 10% Average Top 10%
Preferred tax distribution
Figure 2: Public preference for the tax distribution.
There is a surprising consensus on preferred tax distribution, with supporters of all parties and people from all income groups on average favouring a more progressive tax system than they thinkcurrentlyexists. Nevertheless,withinthesecategories,therearesignificantdifferenceswhen it comes to what percentage of income they think particular households in different income groups should pay in all taxes.
14 | Unfair and Unclear
THE REALITY: THE UK’S CURRENT TAX DISTRIBUTION
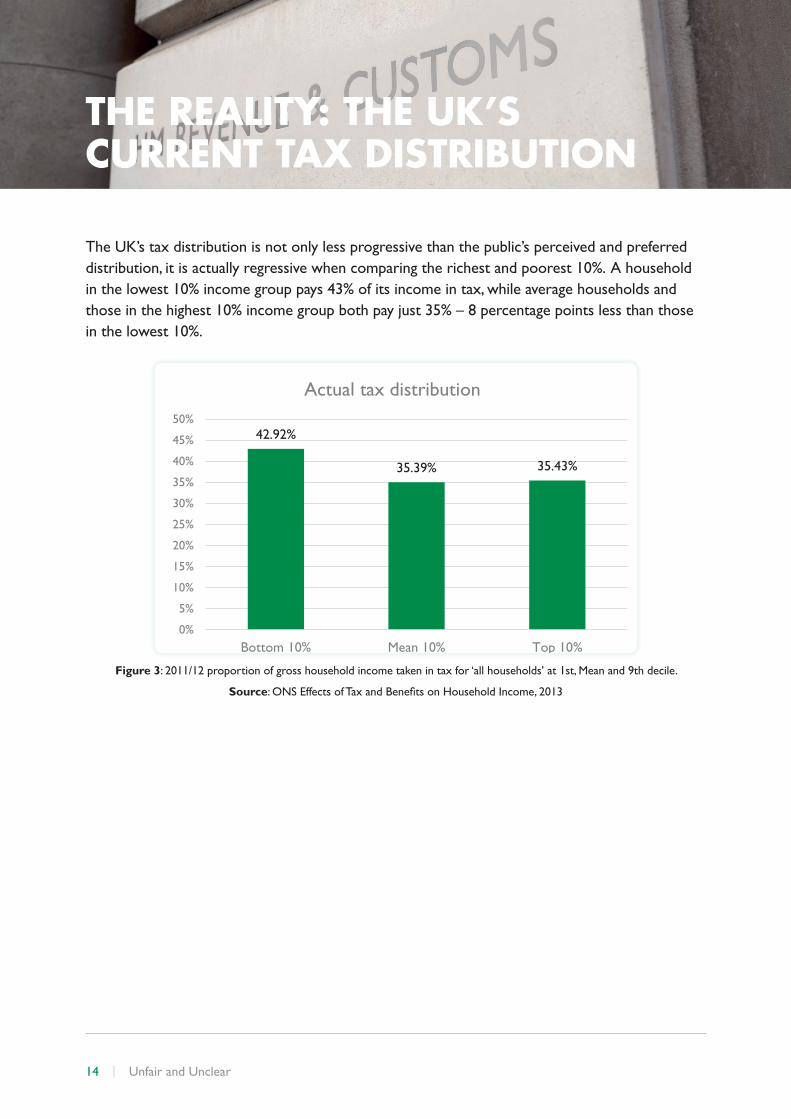
The UK’s tax distribution is not only less progressive than the public’s perceived and preferred distribution, it is actually regressive when comparing the richest and poorest 10%. A household in the lowest 10% income group pays 43% of its income in tax, while average households and those in the highest 10% income group both pay just 35% – 8 percentage points less than those in the lowest 10%.
42.92%
35.39% 35.43%
0%
5%
10%
15%
20%
25%
30%
35%
40%
45%
50%
Bottom 10% Mean 10% Top 10%
Actual tax distribution
Figure 3: 2011/12 proportion of gross household income taken in tax for ‘all households’ at 1st, Mean and 9th decile.
Source:ONSEffectsofTaxandBenefitsonHouseholdIncome,2013
Unfair and Unclear | 15
HOW HAS THE TAX DISTRIBUTION CHANGED?
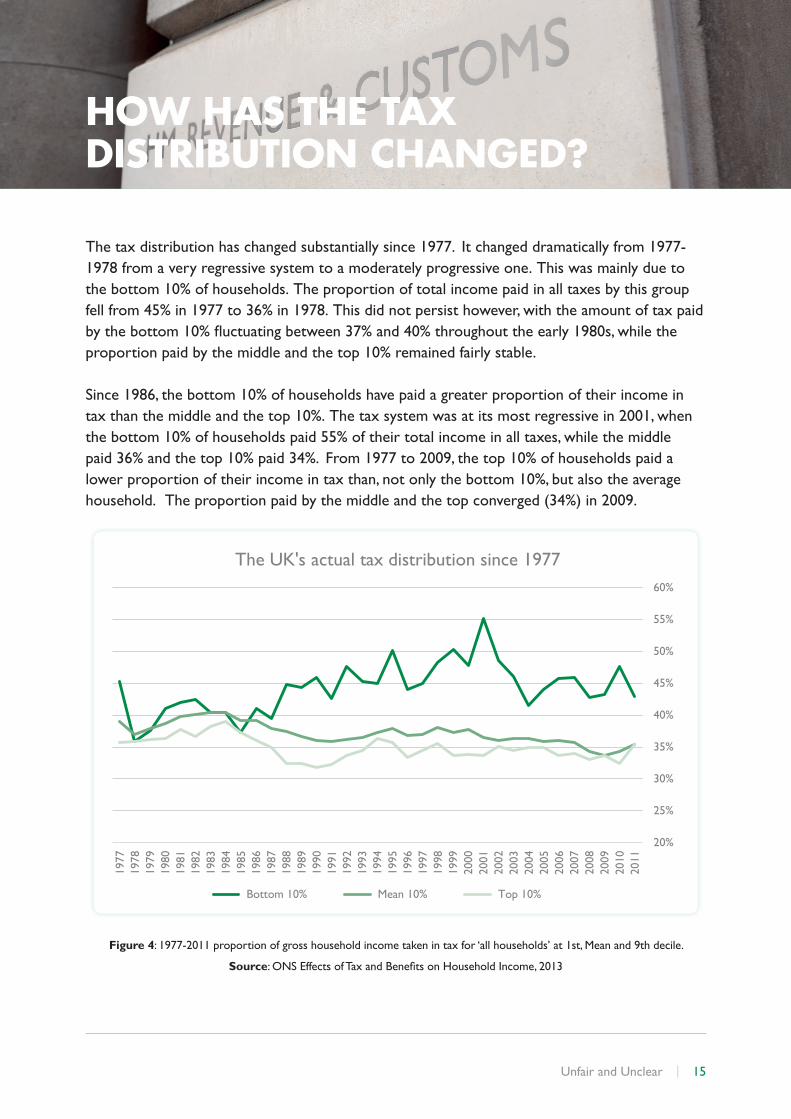
The tax distribution has changed substantially since 1977. It changed dramatically from 1977-1978 from a very regressive system to a moderately progressive one. This was mainly due to the bottom 10% of households. The proportion of total income paid in all taxes by this group fell from 45% in 1977 to 36% in 1978. This did not persist however, with the amount of tax paid bythebottom10%fluctuatingbetween37%and40%throughouttheearly1980s,whiletheproportion paid by the middle and the top 10% remained fairly stable.
Since 1986, the bottom 10% of households have paid a greater proportion of their income in tax than the middle and the top 10%. The tax system was at its most regressive in 2001, when the bottom 10% of households paid 55% of their total income in all taxes, while the middle paid 36% and the top 10% paid 34%. From 1977 to 2009, the top 10% of households paid a lower proportion of their income in tax than, not only the bottom 10%, but also the average household. The proportion paid by the middle and the top converged (34%) in 2009.
20%
25%
30%
35%
40%
45%
50%
55%
60%
2011
2010
2009
2008
2007
2006
2005
2004
2003
2002
2001
2000
1999
1998
1997
1996
1995
1994
1993
1992
1991
1990
1989
1988
1987
1986
1985
1984
1983
1982
1981
1980
1979
1978
1977
The UK's actual tax distribution since 1977
Bottom 10% Mean 10% Top 10%
Figure 4: 1977-2011 proportion of gross household income taken in tax for ‘all households’ at 1st, Mean and 9th decile.
Source:ONSEffectsofTaxandBenefitsonHouseholdIncome,2013
16 | Unfair and Unclear
INDIVIDUAL TAXES
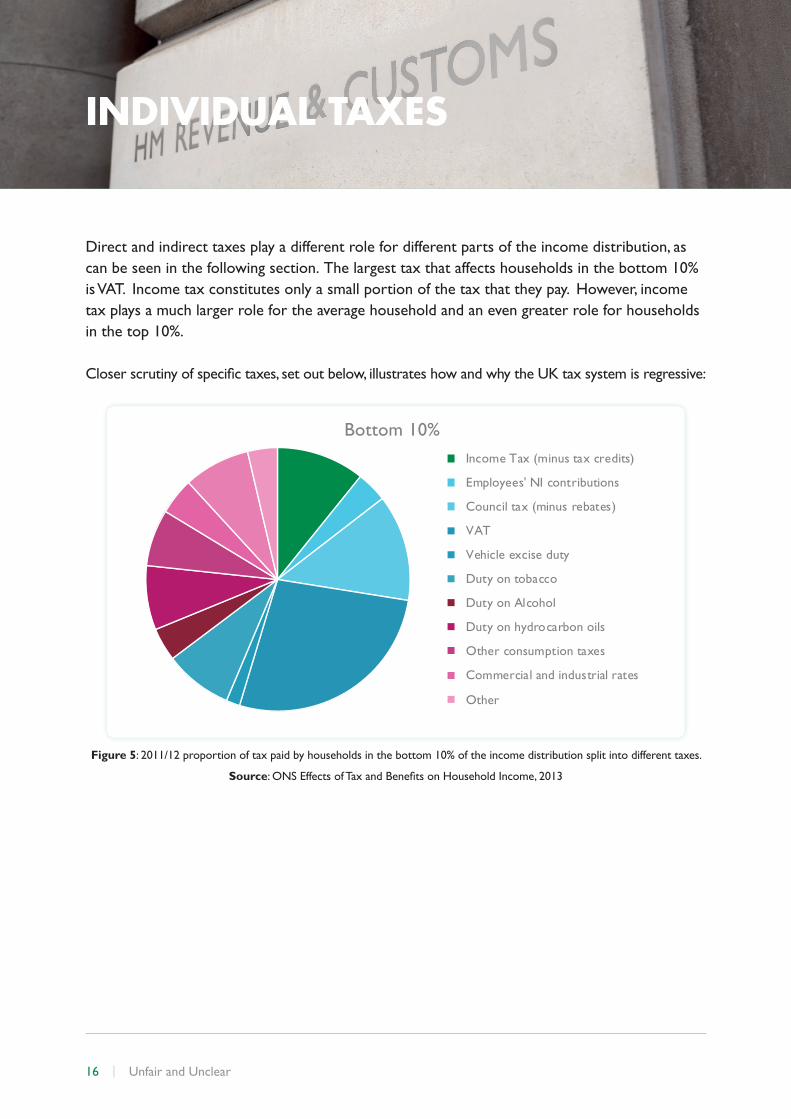
Direct and indirect taxes play a different role for different parts of the income distribution, as can be seen in the following section. The largest tax that affects households in the bottom 10% is VAT. Income tax constitutes only a small portion of the tax that they pay. However, income tax plays a much larger role for the average household and an even greater role for households in the top 10%.
Closerscrutinyofspecifictaxes,setoutbelow,illustrateshowandwhytheUKtaxsystemisregressive:
Income Tax (minus tax credits)
Employees' NI contributions
Council tax (minus rebates)
VAT
Vehicle excise duty
Duty on tobacco
Duty on Alcohol
Duty on hydrocarbon oils
Other consumption taxes
Commercial and industrial rates
Other
Bottom 10%
Figure 5: 2011/12 proportion of tax paid by households in the bottom 10% of the income distribution split into different taxes.
Source:ONSEffectsofTaxandBenefitsonHouseholdIncome,2013
Unfair and Unclear | 17
Income Tax (minus tax credits)
Employees' NI contributions
Council tax (minus rebates)
VAT
Vehicle excise duty
Duty on tobacco
Duty on Alcohol
Duty on hydrocarbon oils
Other consumption taxes
Commercial and industrial rates
Employers' NI contributions
Other
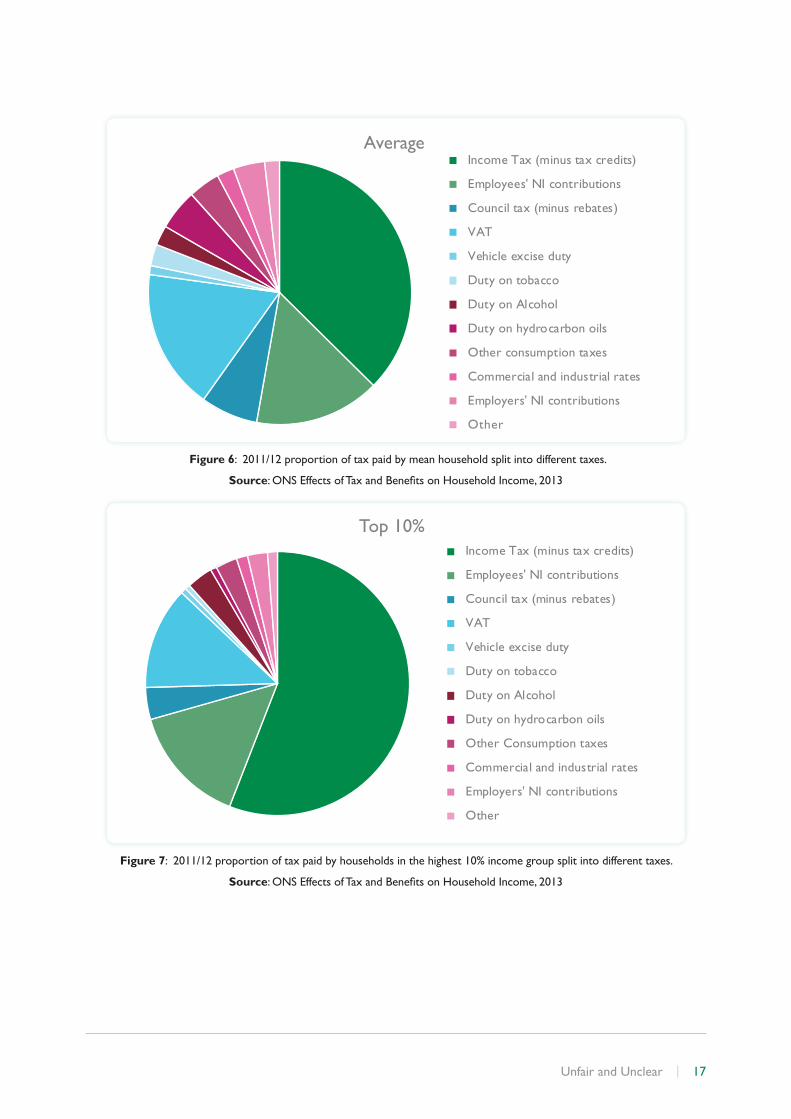
Average
Figure 6: 2011/12 proportion of tax paid by mean household split into different taxes.
Source:ONSEffectsofTaxandBenefitsonHouseholdIncome,2013
Income Tax (minus tax credits)
Employees' NI contributions
Council tax (minus rebates)
VAT
Vehicle excise duty
Duty on tobacco
Duty on Alcohol
Duty on hydrocarbon oils
Other Consumption taxes
Commercial and industrial rates
Employers' NI contributions
Other
Top 10%
Figure 7: 2011/12 proportion of tax paid by households in the highest 10% income group split into different taxes.
Source:ONSEffectsofTaxandBenefitsonHouseholdIncome,2013
18 | Unfair and Unclear
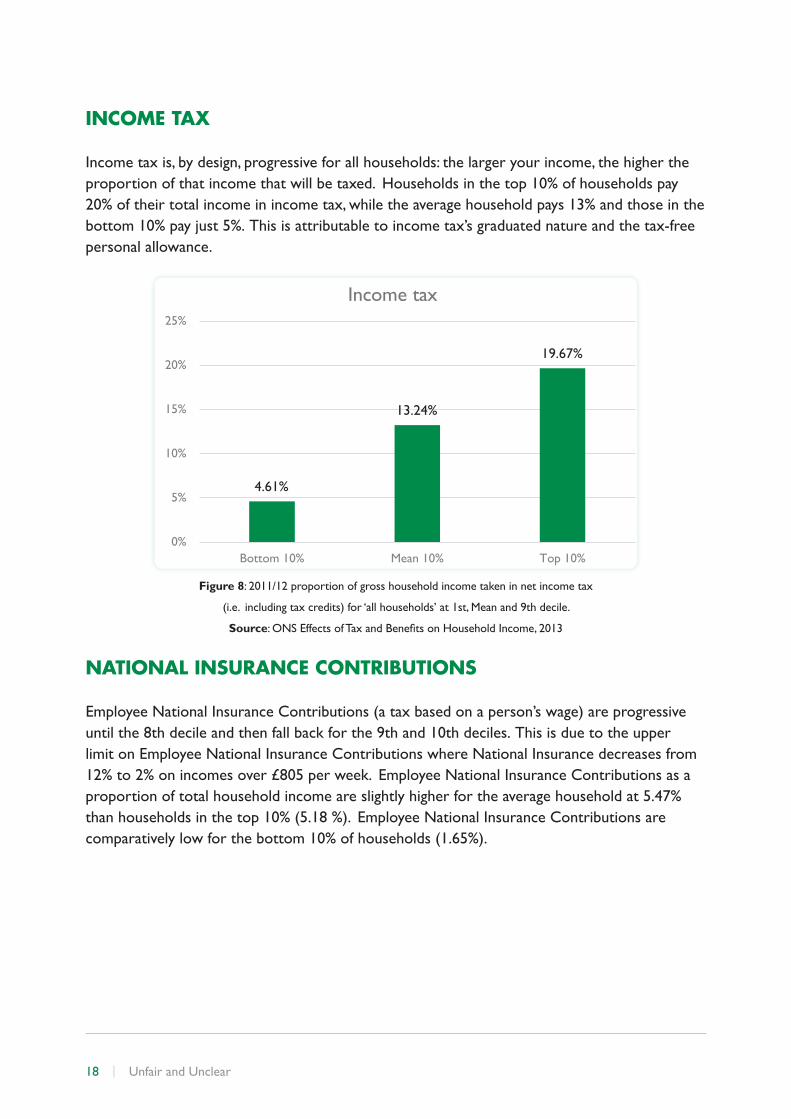
INCOME TAX
Income tax is, by design, progressive for all households: the larger your income, the higher the proportion of that income that will be taxed. Households in the top 10% of households pay 20% of their total income in income tax, while the average household pays 13% and those in the bottom 10% pay just 5%. This is attributable to income tax’s graduated nature and the tax-free personal allowance.
4.61%
13.24%
19.67%
0%
5%
10%
15%
20%
25%
Bottom 10% Mean 10% Top 10%
Income tax
Figure 8: 2011/12 proportion of gross household income taken in net income tax
(i.e. including tax credits) for ‘all households’ at 1st, Mean and 9th decile.
Source:ONSEffectsofTaxandBenefitsonHouseholdIncome,2013
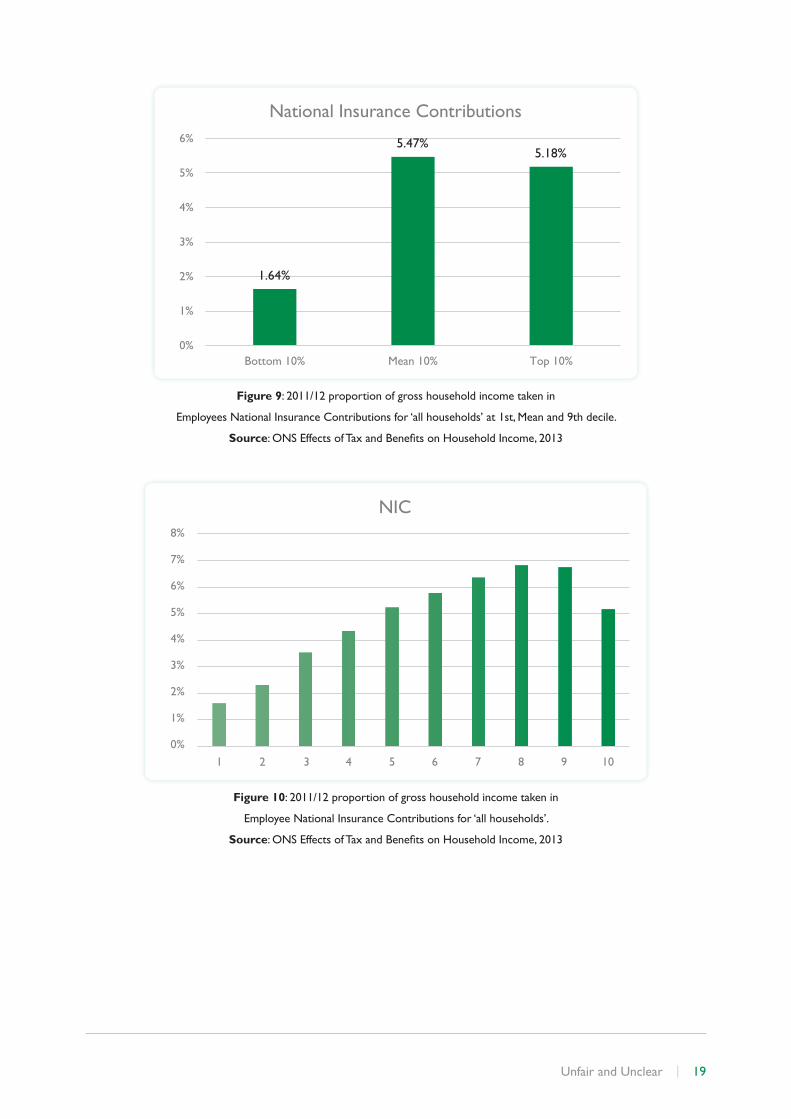
NATIONAL INSURANCE CONTRIBUTIONS
Employee National Insurance Contributions (a tax based on a person’s wage) are progressive until the 8th decile and then fall back for the 9th and 10th deciles. This is due to the upper limit on Employee National Insurance Contributions where National Insurance decreases from 12% to 2% on incomes over £805 per week. Employee National Insurance Contributions as a proportion of total household income are slightly higher for the average household at 5.47% than households in the top 10% (5.18 %). Employee National Insurance Contributions are comparatively low for the bottom 10% of households (1.65%).
Unfair and Unclear | 19
1.64%
5.47% 5.18%
0%
1%
2%
3%
4%
5%
6%
Bottom 10% Mean 10% Top 10%
National Insurance Contributions
Figure 9: 2011/12 proportion of gross household income taken in
Employees National Insurance Contributions for ‘all households’ at 1st, Mean and 9th decile.
Source:ONSEffectsofTaxandBenefitsonHouseholdIncome,2013
0%
1%
2%
3%
4%
5%
7%
8%
6%
1 2 3 4 5 6 7 8 9 10
NIC
Figure 10: 2011/12 proportion of gross household income taken in
Employee National Insurance Contributions for ‘all households’.
Source:ONSEffectsofTaxandBenefitsonHouseholdIncome,2013
20 | Unfair and Unclear
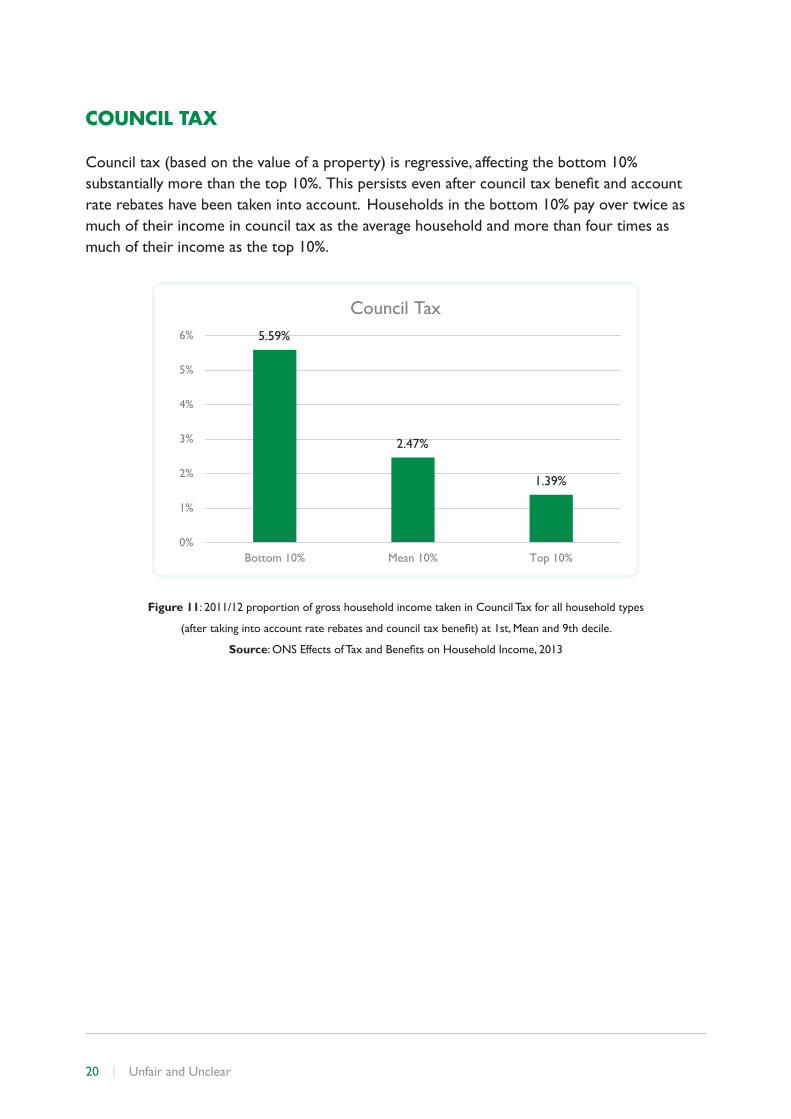
COUNCIL TAX
Council tax (based on the value of a property) is regressive, affecting the bottom 10% substantiallymorethanthetop10%.Thispersistsevenaftercounciltaxbenefitandaccountrate rebates have been taken into account. Households in the bottom 10% pay over twice as much of their income in council tax as the average household and more than four times as much of their income as the top 10%.
5.59%
2.47%
1.39%
0%
1%
2%
3%
4%
5%
6%
Bottom 10% Mean 10% Top 10%
Council Tax
Figure 11: 2011/12 proportion of gross household income taken in Council Tax for all household types
(aftertakingintoaccountraterebatesandcounciltaxbenefit)at1st,Meanand9thdecile.
Source:ONSEffectsofTaxandBenefitsonHouseholdIncome,2013

Unfair and Unclear | 21
INDIRECT TAXES
VALUE ADDED TAX
Value Added Tax (VAT) (a tax on most items sold in the UK) is slightly less regressive than Council Tax, but occupies a larger proportion of household incomes. The bottom 10% of households pay 11.62% of their total income in VAT, almost double the proportion of the average household (6.11%) and close to three times the proportion paid by the top 10% of households (4.39%).
11.62%
6.11%
4.39%
0%
2%
4%
6%
8%
10%
12%
14%
Bottom 10% Mean 10% Top 10%
VAT
Figure 12: 2011/12 proportion of gross household income taken in
Value Added Tax for all household types at 1st, Mean and 9th decile.
Source:ONSEffectsofTaxandBenefitsonHouseholdIncome,2013
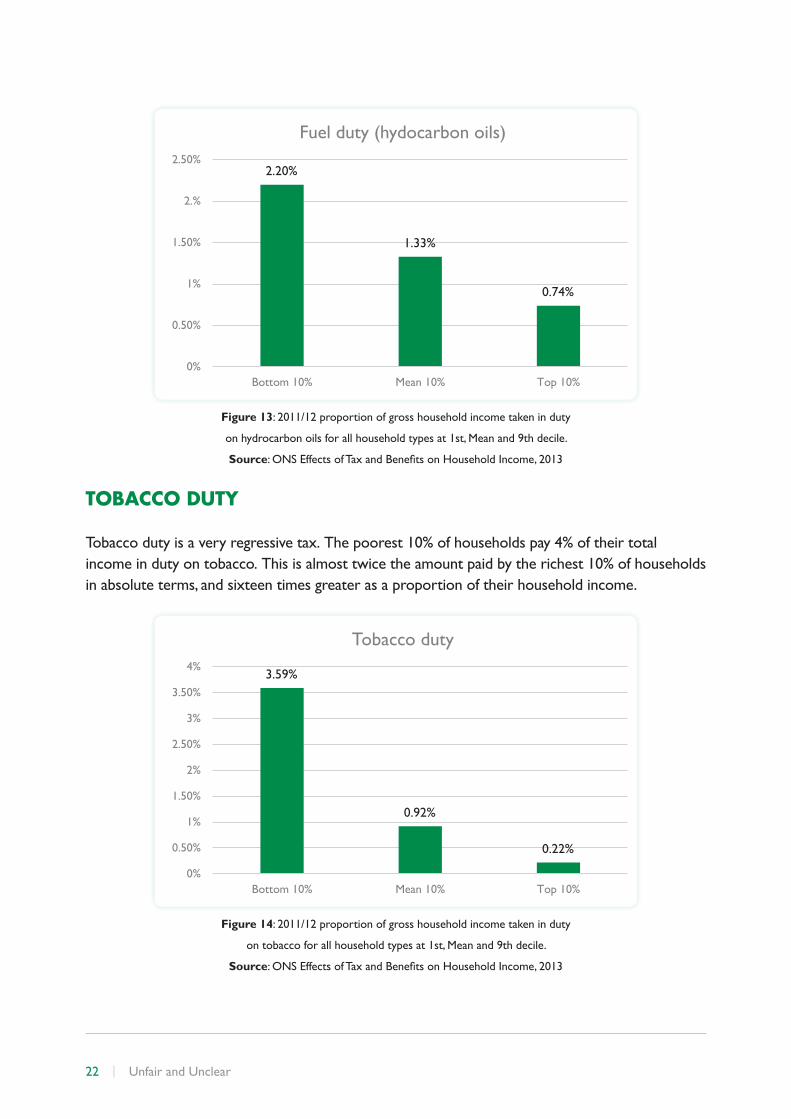
FUEL DUTY
Fuel duty is slightly less regressive than VAT; however, like council tax, it occupies a substantially larger proportion of the poorest 10%’s total income than either the average household or the top 10%.
22 | Unfair and Unclear
2.20%
1.33%
0.74%
0%
0.50%
1%
1.50%
2.%
2.50%
Bottom 10% Mean 10% Top 10%
Fuel duty (hydocarbon oils)
Figure 13: 2011/12 proportion of gross household income taken in duty
on hydrocarbon oils for all household types at 1st, Mean and 9th decile.
Source:ONSEffectsofTaxandBenefitsonHouseholdIncome,2013
TOBACCO DUTY
Tobacco duty is a very regressive tax. The poorest 10% of households pay 4% of their total income in duty on tobacco. This is almost twice the amount paid by the richest 10% of households in absolute terms, and sixteen times greater as a proportion of their household income.
3.59%
0.92%
0.22%
0%
0.50%
1%
1.50%
2%
2.50%
3%
3.50%
4%
Bottom 10% Mean 10% Top 10%
Tobacco duty
Figure 14: 2011/12 proportion of gross household income taken in duty
on tobacco for all household types at 1st, Mean and 9th decile.
Source:ONSEffectsofTaxandBenefitsonHouseholdIncome,2013
Unfair and Unclear | 23
THE UK TAX SYSTEM - KEY QUESTIONS
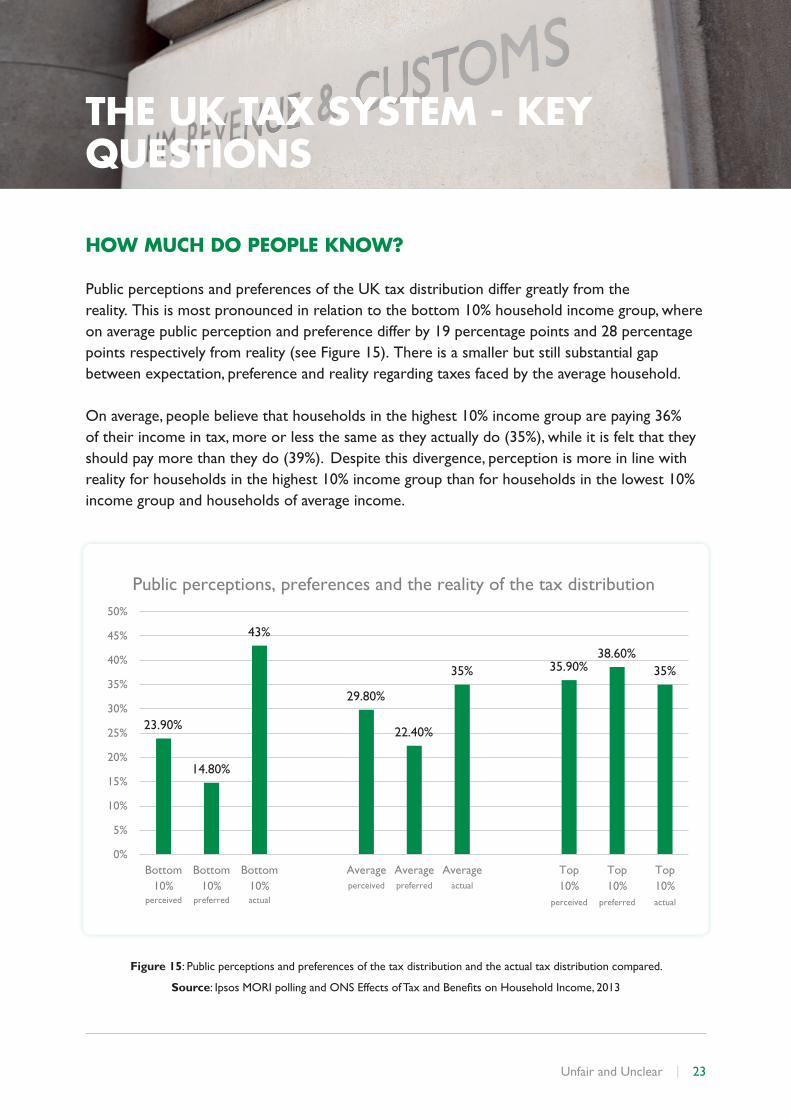
HOW MUCH DO PEOPLE KNOW?
Public perceptions and preferences of the UK tax distribution differ greatly from the reality. This is most pronounced in relation to the bottom 10% household income group, where on average public perception and preference differ by 19 percentage points and 28 percentage points respectively from reality (see Figure 15). There is a smaller but still substantial gap between expectation, preference and reality regarding taxes faced by the average household.
On average, people believe that households in the highest 10% income group are paying 36% of their income in tax, more or less the same as they actually do (35%), while it is felt that they should pay more than they do (39%). Despite this divergence, perception is more in line with reality for households in the highest 10% income group than for households in the lowest 10% income group and households of average income.
23.90%
14.80%
43%
29.80%
22.40%
35% 35.90% 38.60%
35%
0%
5%
10%
15%
20%
25%
30%
35%
40%
45%
50%
Bottom10%
perceived
Bottom10%
preferred
Bottom10% 10% 10% 10%actual
Averageperceived
Averagepreferred
Averageactual
Top
perceived
Top
preferred
Top
actual
Public perceptions, preferences and the reality of the tax distribution
Figure 15: Public perceptions and preferences of the tax distribution and the actual tax distribution compared.
Source:IpsosMORIpollingandONSEffectsofTaxandBenefitsonHouseholdIncome,2013
24 | Unfair and Unclear
WHAT ARE THE REASONS FOR THE GAP BETWEEN PUBLIC PERCEPTION AND REALITY?
From an analysis of the distribution of different types of taxes paid by households it is possible to infer that public perception, and its inaccuracy, is partly attributable to people’s tendency to disproportionately focus on income tax in any consideration of the overall tax burden.
Public perceptions of the tax distribution seem to align closely with income tax rates despite surveyrespondentsbeingprovidedwithacleardefinitionofthemultipletaxespaidbyhouseholdsandaskedspecificallytoevaluatetheentiretaxsystem. Publicperceptionsofthetotal tax paid as a proportion of gross household income by the bottom 10% of households and average households are close to the 20% basic income tax rate, while public perceptions of tax paid by the top 10% of households are closer to the 40% higher rate of tax. Although this may be an accurate representation of the income tax rate of the household in question, it is neither an accurate description of the proportion of their income paid in income tax – this is a matter of the average not the marginal tax rate applied to the household – nor an accurate representation of the total tax paid by this household.
The tax system diverges from the shape perceived and preferred by the public once taxes other than income tax are included, suggesting some misunderstanding of the functioning of the tax system as a whole. Unlike income tax, Employee National Insurance Contributions are progressive only up to the 8th decile, before becoming regressive, while Council Tax and most indirect taxes are regressive, albeit to differing degrees.
WHAT ARE THE IMPLICATIONS OF THE DISTRIBUTION OF OUR TAX SYSTEM?
Households in the bottom 10% income group pay roughly 23% of their gross household income inindirecttaxesonconsumption. Indirecttaxesarenowcharacteristicallyflatratewhereashistorically they were often higher on ‘luxury goods’. It is mainly as a result of spending such a relatively high proportion of their income on consumption that households in the lowest 10% income group pay high indirect taxes. The high proportion of income paid by this group in Council Tax,evenafterCouncilTaxBenefitandAccountRateRebateshavebeentakenintoaccount,ismore surprising. Importantly, the data analysed in this report is from 2011-12, when those in receiptofmanymeans-testedstatebenefitswereeligiblefor100%rebatesonCouncilTax. ItislikelythattherecentreformofcounciltaxbenefitwillhavemadeCouncilTaxmoreregressiveand increased the proportion of their income that the bottom 10% pay in tax.
The relatively large amount of their income paid in all taxes by the bottom 10% is related to public misunderstandingoftheentiretaxandbenefitsystemandthetendencyforpublicandpoliticaldebatetolargelyfocusonthebenefitsandtaxcreditsreceivedbythisgroup,notthetaxespaid.Thebottom10%receiveahighproportionoftheirincomeinstatebenefitsandtaxcreditsanditisonthisthatthetax-benefitdebatemainlyfocuses,notonthegrosstaxpaidbythisgroup.
Unfair and Unclear | 25
Althoughitisimportanttonotethatthelowestdecilearenetbeneficiariesofthetaxandbenefitsystem,taxratesandbenefitsaredebatedandconstructedlargelyinsilos.Whenthe‘generosity’ofbenefitsisdebatedthisisdonebylookingatgrossbenefitamountandisignorant of the effect of taxation on this group. It is important for the public to understand the amount of taxation that is paid by those who receive social security and for this to be a crucial part of ongoing debate.
26 | Unfair and Unclear
POLICY RECOMMENDATIONS
There is a stark divergence between people’s perception of the amount of tax paid by both themselves and others, their preferred distribution of tax across the income spectrum and the reality of the tax distribution under the current system. In short, people perceive the tax system to be progressive and would like it to be more progressive than they think it is. The tax system is, in fact, broadly regressive.
Therearetwoparticularlyworryingconclusionsfromthefindingswhichshouldbeofconcernto politicians and policy-makers: most people believe the current distribution of tax to be differenttothereality;andthetaxsysteminitscurrentformisnotfitforpurpose.
Thesefindingsarguablysuggestthatthecurrenttaxsystemhaslittle,ifany,publicmandate. Forthe system to better acknowledge the desires of the electorate, policy must aim for a tax system that is progressive.
In light of this, we recommend that:
• Parties seeking to form the government from 2015 should commit to the principle that any changes in tax policy are progressive.
• Council tax should be transformed into a progressive property tax by re-evaluating properties and creating new bands with higher rates for higher value properties. As identifiedinthisreport,counciltaxishighlyregressiveand,hence,itsreformshouldbecentral to any wider tax strategy which aims for a broadly progressive tax system.
• Government should aim to reduce VAT when it has a budget surplus. Our analysis highlights that Value Added Tax (VAT) weighs more heavily on those at the bottom than the top of the income distribution. Although it is slightly less regressive than Council Tax, it occupies a larger proportion of household incomes and should be a cause for concern.
• The upper limit of National Insurance Contributions should be raised to ensure that the tax is progressive across all deciles.
This report is part of the Fairer Tax strand of The Equality Trust’s Fairer Stronger Economy project anticipating the 2015 general election. More information on this project and further policy recommendations are available on our website: www.equalitytrust.org.uk

Unfair and Unclear | 27
CONCLUSION
The British Social Attitudes Survey published in 2013 revealed that inequality is an issue of serious concern to the electorate, with over 80% now believing the gap between rich and poor is too big6. Our new data and analysis now also makes clear that the UK’s current tax system exacerbates this inequality and differs greatly from the desired tax system of the UK population.
By addressing the regressive nature of the tax system, politicians will be able to ensure that their policies have a public mandate. And, by creating a more progressive tax system, they will also be able to better tackle the UK’s extreme economic inequality, a move likely to be popular with the electorate.
However to achieve this, tax policy must address not only the bottom, middle and top of the income distribution as outlined in this report, but also the very top, the richest 1%. Inequality today can no longer be seen as just a question of the overall distribution. Even within the group of top-income earners, incomes over the past three decades have become more concentrated, tilting towards the richest of the rich. In an upcoming report ‘Course Correction: the pre-distributivecaseforthe50ptoptaxrate,willlookspecificallyatthisveryhighincomegroup,to address not only what tax rates should apply to those at the top and why, but also the economic implications of these top tax rates.
The gap between perceptions, preferences and reality when it comes to the UK’s current tax systemshouldbeofdeepconcerntopoliticians. Buildingasystemthatisfitforafairsocietymust now be a priority.
6 BSA 2013

The Equality Trust
17 Victoria Park Square
London E2 9PB
+44 (0)20 7922 7926 | [email protected] | www.equalitytrust.org.uk