unicef/wfp return on investment for emergency ... on investment for emergency preparedness study i...
TRANSCRIPT

Conducted by The Boston Consulting Group Funded by DFID
UNICEF/WFP Return on Investment
for Emergency Preparedness Study
Appendix
January 2015

Return on Investment for Emergency Preparedness Study i
January 2015
Contents
8. ROI assessment for the three pilot countries ....................................................................... 32
8.1. Chad ........................................................................................................................ 32
8.1.1. Country risk profile .............................................................................................. 32
8.1.2. Investments in scope .......................................................................................... 34
8.1.3. ROI and time savings .......................................................................................... 37
8.2. Pakistan ................................................................................................................... 39
8.2.1. Country risk profile .............................................................................................. 40
8.2.2. Investments in scope .......................................................................................... 42
8.2.3. ROI and time savings .......................................................................................... 46
8.3. Madagascar ............................................................................................................. 48
8.3.1. Country risk profile .............................................................................................. 49
8.3.2. Investments in scope .......................................................................................... 51
8.3.3. ROI and time savings .......................................................................................... 55
9. Details of risk scenario calculations ..................................................................................... 59
9.1. Historical data on risk scenarios .............................................................................. 59
9.2. Monte Carlo analysis ............................................................................................... 62
9.3. Details of sensitivity analysis ................................................................................... 65
10. Details of commodities covered ........................................................................................... 67
11. Details of utilized model ....................................................................................................... 68
12. Contact details of the study team ........................................................................................ 70
13. List of stakeholders consulted during the study ................................................................... 71
14. Acronyms ............................................................................................................................. 76
15. Bibliography ......................................................................................................................... 78

Return on Investment for Emergency Preparedness Study ii
January 2015
Table of figures
Figure 13 – Risk scenarios defined for Chad ............................................................................... 33
Figure 14 – Detailed future scenarios assumed for all major risks (Chad) ................................... 34
Figure 15 – Emergency preparedness investments for Chad ...................................................... 35
Figure 16 – Visual representation of time and cost savings in Chad ............................................ 39
Figure 17 – Risk scenarios defined for Pakistan .......................................................................... 41
Figure 18 – Detailed future scenarios assumed for all major risks (Pakistan) .............................. 42
Figure 19 – Emergency preparedness investments for Pakistan ................................................. 43
Figure 20 – Visual representation of time and cost savings in Pakistan ...................................... 48
Figure 21 – Risk scenarios defined for Madagascar .................................................................... 50
Figure 22 – Detailed future scenarios assumed for all major risks (Madagascar) ........................ 51
Figure 23 – Emergency preparedness investments for Madagascar ........................................... 51
Figure 24 – Visual representation of time and cost savings in Madagascar ................................ 57
Figure 25 – Historical baseline data on Chad's risk profile ........................................................... 60
Figure 26 – Historical baseline data on Pakistan's risk profile .................................................... 611
Figure 27 – Historical baseline data on Madagascar's risk profile .............................................. 611
Figure 28 – Monte Carlo simulation for Pakistan's risk scenario .................................................. 62
Figure 29 – Monte Carlo simulation for Chad and Madagascar ................................................. 633
Figure 30 – Monte Carlo results with and without independence ............................................... 645
Figure 31 – Resulting need for commodities based on the Monte Carlo simulation ..................... 66
Figure 32 – Simulation details and smoothing of resulting ROI values ........................................ 67
Figure 33 – Overview of commodities included in the model by pilot country .............................. 68
Figure 34 – Selected screenshots from the Excel-based ROI model ........................................... 70

Return on Investment for Emergency Preparedness Study iii
January 2015
Table of illustrations
Illustration 1 – Tissi airstrip rehabilitation ...................................................................................... 36
Illustration 2 – Nasir Bagh platform work ...................................................................................... 44
Illustration 3 – Community training session on the Early Warning system ................................... 54
List of tables
Table 1 – Summary of time and cost savings for emergency preparedness investments in Chad
...................................................................................................................................................... 37
Table 2 – Summary of time and cost savings for emergency preparedness investments in
Pakistan ........................................................................................................................................ 46
Table 3 – Summary of time and cost savings for emergency preparedness investments in
Madagascar .................................................................................................................................. 55
Photo cover page © Unicef/NYHQ 2011-1415/Page

Return on Investment for Emergency Preparedness Study 32
January 2015
8. ROI ASSESSMENT FOR THE THREE PILOT COUNTRIES
8.1. Chad
Chad is one of the poorest countries in the world, ranking 184th out of 187 in the 2014 UNDP
Human Development Index. Climate hazards and violent conflicts have plagued the country and
aggravated poverty since its independence in 1960, resulting in high levels of food insecurity and
malnutrition1, and poor access to water and health services. The Sahelian belt is the most food-
insecure part of the country, as it is a particularly fragile environment with a degraded agro-
ecological landscape exposed to recurrent shocks such as droughts, floods and crop failures,
resulting in food price spikes. Located in a restive geopolitical region, Chad's porous borders
areas are also vulnerable to spillover from crises in neighbouring countries, most notably the
Central African Republic, Sudan, Libya and Nigeria.
The national level of preparedness is generally weak. According to InfoRM, Chad has the third-
highest vulnerability index rating out of 191 countries (at 7.8) and the second-highest lack of
coping capacity globally (at 9.0). The lack of national contingency planning, scarcity of human
capital and weak institutional coordination of disaster management often hamper timely and cost-
effective emergency responses. Additionally, as a landlocked country with limited local transport
and supply infrastructure and unreliable operational supply corridors from other neighbouring
countries, it faces significant logistical constraints in rapid movement of emergency commodities
and services.
8.1.1. Country risk profile
Three main risk scenarios were defined for Chad together with UNICEF and WFP COs: drought,
flood and conflict-related population displacement (internally displaced persons, refugees and
returnees).
Figure shows the geographical prevalence of each of these risks and the main demographic
assumptions entered in the model.
1 30.3% of children are severely or moderately underweight (UNICEF Statistics, 2008–2012).

Return on Investment for Emergency Preparedness Study 33
January 2015
Figure 13 – Risk scenarios defined for Chad
For each risk, the probability of hazard occurrence, new population in need of assistance2,
related global acute malnutrition rates and duration of assistance were defined. Since a
consistent level of drought and conflict-related population displacement materialize every year in
Chad, these recurrent yearly risks were not treated as distinct 'emergencies' in the ROI model
because UNICEF and WFP respond to them as part of their regular programmes. Similarly, the
current, pre-existing caseload of IDPs, refugees and returnees already present in the country
were excluded from the study. The risk scenarios therefore include only the occurrence of new
crises or significant escalations of existing crises.
Figure 14 shows the details of each scenario. For each type of risk, a smaller and a larger impact
scenario were hypothesized based on a historical analysis of context risks and in consultation
with UNICEF and WFP emergency experts in each pilot country. Historical data was used for
backward-looking projections for drought and flood3 and for conflict-related displacement4, but
the final figures were adapted based on any available forward-looking projections for each risk.5
For drought and flood, for instance, the estimates on the probability of hazard occurrence and
new population in need were slightly inflated compared to historical data to account for the
2 Excluding pre-existing caseloads
3 EM-DAT: The International Disaster Database, 2014. Country Profiles. Centre for Research on the Epidemiology of
Disasters – CRED. http://www.emdat.be/country-profile 4 United Nations High Commissioner for Refugees (UNHCR), 2014. UNHCR Statistical Online Population Database.
5 See Appendix 8.1.1. for detailed historical figures.
Ati
Mongo
Am Timan
Doba
Moundou
Pala
Bongor
Abéché
Biltine
LaiSarh
Koumra
Bol
Mao
Massakory
Massenya
Faya-Largeau
N'Djamena
Moussoro
Am Djaras
Goz-Beida
Haraze
Gore
Drought
Conflict
Airport
National capitalRegion capital
UNICEF/WFP presence
Flood
Demographics
Children 6 to 59 months
Pregnant/lactating
women
Others
Average family size
20%
5%
75%
6

Return on Investment for Emergency Preparedness Study 34
January 2015
impacts of climate change6 as well as estimates provided in the respective national contingency
plans. For conflict-related displacement, future projections on the situation in Chad's
neighbouring countries (mainly Nigeria) were taken into account.
The estimates on the probability of hazard occurrence defined in Figure 12 are a critical input to
the ROI model.
Figure 14 – Detailed future scenarios assumed for all major risks (Chad)
8.1.2. Investments in scope
As illustrated in Figure , seven emergency preparedness investments were analysed for Chad,
covering the six different types defined in the methodology. These investments were all either
fully or partly funded under the DFID Humanitarian Programme.
6 As pointed out by Kandji et al. (2006, p. 10), "this is all the more necessary that climate change is likely to increase
the frequency of extremes such as droughts and flood in the region."
Probability of
hazard occurrence
Flood
Conflict
New population in
need Duration
• Every 2 years
• Every 15 years
• 70,000
• 1 million
• 2-3 months
• 2-3 months
• Every 7 years
• Every 7 years
• 50,000 (returnees)
• 100,000
• 12 months
• 12 months
Drought• Every 3 years
• Every 8 years
• 300,000
• 2 million
• 4-5 months
• 12 months
MAM children
• 4,200 (30%)
• 60,000 (30%)
• 3,000 (30%)
• 6,000 (30%)
• 18,000 (30%)
• 120,000 (30%)
SAM children
• 2,100 (15%)
• 30,000 (15%)
• 1,500 (15%)
• 3,000 (15%)
• 10,200 (17%)
• 68,000 (17%)

Return on Investment for Emergency Preparedness Study 35
January 2015
Figure 15 – Emergency preparedness investments for Chad7
Emergency supply pre-positioning: 25.0 Mt of HEB was pre-positioned to respond to two risk
scenarios (conflict-related displacements and floods), while 25.0 Mt of RUSF was pre-positioned
to respond to the three risk scenarios (conflict-related displacements, floods and drought),
respectively. 15 Mt of both HEB and RUSF will be pre-positioned in Bol, while the rest will be
sent to Goz-Beida. RUTF was also pre-positioned in Tissi, but for existing programmes rather
than emergency response purposes and was thus excluded from the ROI analysis.
For the WASH and Health sectors, four specific commodities were analysed: bleach, soap,
Aquatabs and LLIN. 48.1 kl of bleach, 77.4 Mt of soap, 1.1M Aquatabs and 6,605 LLIN were pre-
positioned in 2014, partly under the DFID Humanitarian Programme, with the rest of the costs
covered by other donors. The bleach, soap and Aquatabs were relevant for the three risk
scenarios and were distributed across the country to various UN and government warehouses
and to three displacement centres (Danamadja, Maro and Tissi). The LLINs, however, were only
stocked in the three displacement centres to respond to a conflict emergency.
Infrastructure projects: Two different infrastructure initiatives were funded under the DFID
Humanitarian Programme: the rehabilitation of the Tissi airstrip and the pre-fabricated offices and
ICT equipment in Bol.
7 UNICEF Chad Work Plan for DFID II; WFP Chad Concept of Operations
Logistics/ICT Procurement Staffing External contracting
I
II
IV VI
V
Pre-positioning of HEB, RUSF and WASH, as well
as Health contingency stocks
Rehabilitation of the
Tissi airstripEstablishment of 10
LTAs (especially for
non-food items)
HR capacity
reinforcement in the
four zonal offices
Mandatory EPRP
training for
programme and
operations staff
Standby agreement
with a consortium of
partners for rapid
response
III
Pre-positioning of
logistics and ETC
equipment
Emergency supply pre-positioning
Long Term Agreements Additional resources
Trainings PCAs/FLAs

Return on Investment for Emergency Preparedness Study 36
January 2015
Illustration 1 – Tissi airstrip rehabilitation
Due to its strategic location close to the
borders with the Central African Republic
and Sudan, the Tissi area experiences
periodic influxes of refugees/returnees
from across the border and already hosts
pre-existing caseloads within camps that
are spread out across the greater Tissi
region. In order to provide assistance to
these camps, the airstrip is in constant
use throughout the entire year. During
the rainy season, the area of Tissi
becomes totally inaccessible by road and
is cut off for approximately five months,
with air transport being the sole means of access for humanitarian operations within the area.
The airstrip was, however, previously rendered unusable for landing fixed-wing aircraft during the
rainy season, and a helicopter had to be used instead. Its rehabilitation into an all-weather airstrip
has facilitated the use of fixed-wing aircraft throughout the year.
Bol is located in the western part of the country and close to the border with Nigeria. This area is
often inaccessible by road during the rainy season due to flooding but is also exposed to the
additional risk of spillover conflict and refugee influxes due to the continued escalation of the
Boko Haram crisis in Northern Nigeria. The CO therefore pre-positioned pre-fabricated offices
and ICT equipment required to set up an operational hub to facilitate rapid response by
humanitarian partners in the event of an emergency while mitigating safety and security risks for
humanitarian personnel and assets in a highly volatile security environment.
Long Term Agreements: Within the timeline of the DFID grant, four new LTAs for emergency
procurement of commodities and four new LTAs for transport of supplies were signed. These
agreements aimed to increase operational speed and reduce costs while ensuring the reliability
of humanitarian response by reserving suppliers' production capacity in advance.
Trainings: Intensive workshops on emergency preparedness and response were held for 60
staff members (all programme staff at central level plus all zonal office chiefs) so as to train staff
on planning and implementing key preparedness and response activities in accordance with
humanitarian standards and as appropriate to the specific context. The workshops taught
participants how to quickly assess the needs and coordinate the response to escalating
humanitarian situations relevant to Chad.
Additional resources: One additional supply and logistics staff member was deployed in each of
the four zonal offices to provide operational support for emergency response. This preparedness
investment is relevant for all risk scenarios, as the additional logistics staff can respond to and
are located in the zonal offices close the potential emergency locations for all three humanitarian
risks assessed for Chad.

Return on Investment for Emergency Preparedness Study 37
January 2015
PCAs/FLAs: Nine emergency contingency addendums to existing PCAs were developed for
activation in the event of an emergency within the timeline of the DFID grant. These included one
PCA for WASH interventions in the event of floods, while the other eight PCAs were relevant to
conflict-related displacement within the different sectors of WASH, health, nutrition, education
and child protection.8.
8.1.3. ROI and time savings
Table 1 – Summary of time and cost savings for emergency preparedness investments in Chad
Total investment (000$)
Total gross savings (000$)
Total net savings (000$)
ROI Time savings (days)
Pre-positioning
HEB 86.9 136.2 49.3 1.6 28–29
RUSF 118.0 198.2 80.2 1.7 28–29
Bleach 113.9 109.2 -4.8 1.0 12
Soap 147.0 141.1 -5.9 1.0 12
Aquatabs 36.2 90.1 53.9 2.5 14
LLIN 32.7 52.8 20.2 1.6 14
Infrastructure projects
Tissi airstrip 680.0 5,220.4 4,540.4 7.7 -
Bol 358.9 - - - 26
LTAs
Commodities - - - - 30
Transport - - - - 21
Training
EPRP workshop
6.5 121.6 115.1 18.7 4
Additional resources
Four new logistics staff
84.7 85.5 0.8 1.0 4
PCAs/FLAs
Nine PCAs 23.2 383.5 355.4 16.3 10.5
Table 1 summarizes the time and cost savings from each preparedness investment in Chad. All
investments examined in the Chad case study demonstrate strong 'returns' on either cost or time
8 Cooperating partners under this PCAs included SID, AFDI, Terre verte/CELIAF, CARE, IRC, CSSI, OPAD and
ADES.

Return on Investment for Emergency Preparedness Study 38
January 2015
savings or both, suggesting that all preparedness interventions taken were beneficial in purely
financial and/or response speed terms, even when additional qualitative spillover benefits were
excluded. None of the preparedness investments undertaken were shown to slow emergency
response.
Comparatively, the highest ROIs came from the emergency preparedness and response staff
training workshops (18.9), the PCAs (16.6) and the rehabilitation of Tissi airstrip (7.7). These high
ROI figures for the training workshops and the PCAs can be explained by the fact that the initial
upfront investments were limited and yielded relatively high cash flows. The Tissi airstrip in
contrast represents the largest upfront investment analysed in Chad ($680,000), but the large
annual savings generated allow for a very fast payback. As the Tissi rehabilitation will last for a
much longer period of time9, the total discounted cash flow generated leads to a high ROI. Even
without taking into account any additional qualitative benefits, these investments make a lot of
sense from a purely financial perspective.
On the other hand, LTAs for commodities and transport (21 to 30 days), Bol pre-fabricated offices
and ICT equipment (26 days) and pre-positioning investments (12 to 29 days) showed the largest
time savings. Such large gains in speed of operations are often critical during emergencies. Cost
savings for both the Bol pre-positioning investment and LTAs were excluded due to the lack of
sufficient reliable historical data to support the analysis. Both investments, however, contribute to
increased reliability of UNICEF/WFP responses.
The only investment with an ROI slightly below 1 was the pre-positioning of locally procured soap
and bleach (0.96), while additional resources investment was cost neutral, with an ROI of 1. The
relatively low ROI of soap and bleach is explained by the balance between the additional storage
costs to pre-position the commodities and the higher emergency transport costs to deliver the
same supplies to an emergency had no pre-positioning been done. However, the transport cost
differential for locally procured goods is minimal compared to that of internationally sourced
goods, explaining the latter's high ROI values compared to those for soap and bleach. If this
balance is a zero-sum game for Chad from a financial perspective, pre-positioning still affords
significant time savings during an emergency and ensures the availability of key humanitarian
resources. Increasing staff capacity in the zonal offices does not significantly save costs
compared to only reacting periodically to emergencies. But additional resources have other
qualitative benefits, as the additional staff members are present locally, performing other
functions throughout the entire year.
9 A 10-year period has been accounted for in the model, as opposed to other investments such as pre-positioning that
are 'consumed' after their first use.

Return on Investment for Emergency Preparedness Study 39
January 2015
Figure 16 – Visual representation of time and cost savings in Chad10
All investments made in Chad have either a significant financial ROI or time savings – some had
both dimensions. However, if choices are to be made, the investments in trainings showed higher
ROIs than those in additional resources but had a relatively similar effect on the time dimension.
While pre-positioned goods procured internationally had higher financial ROI than those locally
procured, both showed large gains in rapidity during emergency situations. Finally, both
infrastructure investments show positive impacts on both cost and time savings.
8.2. Pakistan
Sharing a long and porous 1,640-mile border with Afghanistan, Pakistan is located in a politically
unstable and strategically sensitive region. Since 2008, security operations in the country's
northwest have led to major population displacements with serious social, security and
humanitarian access implications. Response and recovery have been hampered by security
restrictions in the volatile Federally Administered Tribal Areas (FATA), and 1.65 million IDPs11
are living in camps (3%) or host communities (97%) that are often restricted from access. Limited
humanitarian access is a persistent and critical risk factor for UNICEF, WFP and other
humanitarian organizations across all operational platforms. Looking forward, the difficult political,
10
LTAs and other investments for which cost savings not calculated were excluded from the analysis 11
According to the International Displacement Monitoring Center, 1.15 million IDPs were in camp as of June 2014.
However, another 500,000 people became IDPs as they fled from North Waziristan between the end of June and July,
as indicated in the Preliminary Response Plan (OCHA, 2014).

Return on Investment for Emergency Preparedness Study 40
January 2015
security and economic situation in Afghanistan poses the risk of additional waves of refugees
seeking assistance in Khyber Pakhtunkhwa (KP), FATA and Balochistan.
Increasingly intense and recurrent natural disasters in recent years have also exacerbated
disparities and contributed to a sharp decline in food and nutrition security. The country is subject
to frequent flooding from monsoon rains, and its location at the centre of tectonic plates makes it
vulnerable to earthquakes. The 2010 floods affected 20 million people and left 10 million in need
of humanitarian assistance. Moreover, the Sindh and Balochistan provinces chronically
experience severe drought-like conditions.
This combination of high human and natural hazards, together with the large national population
(over 180 million inhabitants), explains the very large-scale operations for UNICEF and WFP.
Both country offices are the largest amongst the three pilot countries of this study: The 2014
UNICEF Pakistan budget amounted to ~$154M, while WFP planned for ~$200M. However,
Pakistan has a strong national transport and supply infrastructure with strong local market
capacities.12 The government of Pakistan's capacity in leading national responses to
emergencies has also significantly increased over the last decades, as illustrated by a relatively
low rating of 5.9 on the index for lack of coping capacity on InfoRM (ranked 61st out of 191
countries).
8.2.1. Country risk profile
Four risk scenarios were included in the study: security operations, floods, earthquake and
drought-like conditions.
Figure shows where each of these risks is mainly prevalent throughout the country.
12
Pakistan is the eighth-largest producer of wheat worldwide (FAOSTAT, 2012).

Return on Investment for Emergency Preparedness Study 41
January 2015
Figure 17 – Risk scenarios defined for Pakistan
The probability of hazard occurrence, new populations in need of humanitarian assistance, global
acute malnutrition rates and duration of assistance have been summarized in Figure . For
security operations in the country's northwest (KP and FATA regions), the projected population
estimates for the smaller risk scenario (every two years) were derived from the country's
interagency strategic response plan.13, 14
13
Humanitarian Country Team (HCT), Strategic Plan Pakistan 2014 14
For earthquake, although additional forward-looking analysis would ideally have been included to strengthen the
probability of hazard occurrence figures, no reliable source could be found
Airport
National capital
Region capital
UNICEF/WFP presence
Major cities
Gilgit
Muzaf farabad
Lahore
IslamabadPeshawar
Quetta
Karatchi
Nok Kundi
Khuzdar
Panjgur
Turbat
Ormara
Hyderabad
Nawabshaw
Sukkur
Bahimyar
Khan
Dera Ghazi
Khan
Zhob Faisalabad
Tank
Chitral Skardu
Sanghar
Matli
Kairpur
Earthquake
Drought
Flood
Security
operations
Demographics
Children 6 to 59 months
Pregnant/lactating
women
Others
Average family size
13%
8%
79%
6

Return on Investment for Emergency Preparedness Study 42
January 2015
Figure 18 – Detailed future scenarios assumed for all major risks (Pakistan)
8.2.2. Investments in scope
Thirteen different emergency preparedness investments were analysed in Pakistan. As illustrated
in Figure 19, quite a few concerned HR-related activities. All analysed investments were either
fully or partly funded under the DFID Humanitarian Programme.
Probability of
hazard occurrence
Flood
Security
operations
New population in
need Duration
• Every 2.5 years
• Every 6 years
• 2 million
• 10 million
• 6 months
• 9 months
• Within 2 years
• Within 2 years
• Within 7 years
• 330,000 (IDPs)
• 270,000 (returnees)
• 2 million
• 12 months
• 12 months
• 12 months
Earthquake• Every 2 years
• Every 30 years
• 100,000
• 5 million
• 3 months
• 6 months
Drought-like
conditions
• Every 2-3 years
• Every 15 years
• 1 million
• 3 million
• 6 months
• 12 months
MAM children
• 22,400 (9%)
• 112,100 (9%)
• 8,800 (21%)
• 7,200 (21%)
• 53,600 (21%)
• 1,300 (10%)
• 64,300 (10%)
• 12,600 (10%)
• 60,500 (16%)
SAM children
• 12,100 (5%)
• 60,500 (5%)
• 3,500 (8%)
• 2,900 (8%)
• 21,400 (8%)
• 500 (4%)
• 25,700 (4%)
• 8,800 (7%)
• 41,600 (11%)

Return on Investment for Emergency Preparedness Study 43
January 2015
Figure 19 – Emergency preparedness investments for Pakistan15
Emergency supply pre-positioning: Different types of commodities were pre-positioned
throughout the country:
Key commodities from the WASH, Health and Nutrition sectors (namely RUTF,
micronutrient powder, ORS, zinc, (family) hygiene kits and LLINs) were pre-positioned in
warehouses located in both Islamabad and Karachi for rapid distribution in case of an
emergency.
Spare parts/accessories to re-kit 17 Mobile Storage Units were also purchased under the
DFID grant. This facilitated the pre-positioning of the previously unusable MSU units in
Nasir Bagh (Peshawar) for further deployment to emergency locations in the region in the
event of either floods or population displacements due to security operations.
The minimum sets of ICT equipment (including radios, generators, cables, etc.) required
to respond to two emergencies of any type are being stocked in Islamabad and Karachi.
15
UNICEF Pakistan Work Plan for DFID II; WFP Pakistan Concept of Operations
Logistics/ICT Procurement Staffing External contracting
I IV
V
Pre-positioning of essential WASH, Health and Nutrition
stocks
Establishment or
renewal of LTAs for goods, transportation
and services Emergency national
roster
EPRP
III
Pre-positioning of ICT equipment
Increased capacity for
needs assessments
IT emergency
management
II
Enhanced operational
support capacity for contingency supplies
in Peshawar
Pre-positioning of Mobile Storage Units
Emergency supply pre-positioning
Infrastructure project Long Term Agreements Additional resources
Trainings
Rapid need assessment
Humanitarian
Performance Monitoring
WASH, Health and
Nutrition
VI
Nine contingency PCAs
with local partners
PCAs/FLAs

Return on Investment for Emergency Preparedness Study 44
January 2015
Illustration 2 – Nasir Bagh platform work
Illustration 1 – Rehabilitation of the Tissi airstrip
Infrastructure project: The warehouse
of Nasir Bagh (Peshawar) not only
serves as the main logistical hub for
operations in the KP and FATA regions,
but also supports operations in
neighbouring Afghanistan. The
warehouse has a storage capacity in
excess of 35,000 Mt for commodities,
but only 10,000 Mt of this is covered
storage capacity, while the remaining
25,000 Mt is open storage space. While
the open storage is used for brief
periods, commodities can be exposed to adverse weather conditions. The commodities must
therefore be protected using plastic sheeting and tarpaulin coverings. Moreover, this poses a
huge reputational risk in the event of floods due to the increased risk of commodity losses for
other humanitarian partners who also use the facility during emergencies. The 2010 floods, for
instance, had a devastating impact resulting in dramatic losses of critical commodities in two
other warehouses within the region.16 To mitigate such losses in the future, one-metre-high
concrete platforms were constructed to install 45 MSUs to improve warehousing efficiency and
expand covered storage capacity by an additional 10,000–15,000 Mt tonnes, thus boosting the
capacity of the Logistics Cluster to provide logistical support during emergencies.
Long Term Agreements: In 2014, 23 new local LTAs for goods and services were established,
while more than 50 existing LTAs were updated with local suppliers and transport companies.
Additionally, four LTAs (one in each province) were signed with an expert consulting firm in field
monitoring for both development and humanitarian activities. These LTAs allow the CO to
delegate the monitoring of its programme activities to a specialized company in times of
emergency. This in turn allows for the higher-frequency, result-based monitoring and reporting
that better informs responses, as well as an expanded geographical reach since monitors located
in sensitive or insecure areas are often able to access areas inaccessible to UN staff members
due to security restrictions.
Trainings: Five different trainings were supported by the DFID Humanitarian Programme:
A three-day training on ICT emergency management was provided to mid-level
managers from UNICEF, WFP and other UN agencies. The objective of this intensive
course was to ensure timely, predictable and effective information management from the
onset of an emergency and better coordination between relevant humanitarian
stakeholders.
A three- to four-day training on rapid need assessment was planned for 10–12 technical
staff members from WFP (VAM team), UNICEF, OCHA, FAO, UNHCR and the national
government. The focus of the training was on quantitative and analytical skills to improve
the quality and efficiency of joint inter-agency needs assessments and the use of
16
Aza Khel and Peer Payaee warehouses in Peshawar

Return on Investment for Emergency Preparedness Study 45
January 2015
personal digital assistant devices (PDAs) for real-time data collection and analysis and
for quality control purposes.
In order to build a result-based monitoring framework on monitoring coordination
(including in times of emergency) and to enhance knowledge transfer, a two-day
Humanitarian Performance Monitoring (HPM) training was organized for both CO staff
and local partners and governmental bodies.
Emergency staff members in the provinces of KP/FATA and Balochistan received a two-
day training on Emergency Preparedness and Response Planning (EPRP). Similar to the
one organized in Chad, this training allows for better planning of all aspects of emergency
preparedness and response. Participants were coached on the use of specialized
humanitarian tools (e.g., Excel-automated models to estimate CCC-based supply
requirements following preliminary need assessments) and briefed on the key actions to
perform.
Specific sectoral trainings (for Health, WASH and Nutrition) were held in two provinces
(KP/FATA and Balochistan) on Community-Based Disaster Risk Management (CBDRM),
which includes a large emergency preparedness training section. In total, 136 people
including cluster and government staff were trained through these two workshops.
Additional resources: Three additional people were integrated into the VAM team. Of these,
two were deployed to the provincial offices in Peshawar and Karachi to boost field-level analytical
capacities and lead the emergency rapid need assessments, while the third is based in
Islamabad and is dedicated to statistical design and analysis and to conducting in-house
trainings for other staff members.
Another preparedness activity performed by both UNICEF and WFP was the establishment of
national emergency rosters with a pool of pre-qualified staff who can be quickly hired and
mobilized in the event of a crisis. All roster candidates have already worked with UNICEF and
WFP in the past or have been interviewed by UNICEF/WFP for relevant roles. They can
therefore be called up and directly assigned to an emergency, which saves critical time and costs
in the recruitment of additional staff.
PCAs/FLAs: Nine emergency contingency PCAs were signed to prepare specifically for a
potential new influx of Afghan refugees: two for WASH with the Rural Development Initiative and
the Water, Environment and Sanitation Society, two for Nutrition with Frontier Primary Health
Care and the American Refugee Committee, two for Child Protection with Change Through
Empowerment and Basic Education & Employable Skill Training, one for Health with Frontier
Primary Health Care and two for Primary Education with BEFARE (Basic Education for
Awareness Reforms and Empowerment) and SESPB (Society for Community Strengthening and
Promotion of Education, Balochistan). In the event of an emergency, these agreements can be
activated immediately to scale up programmatic interventions without delay.

Return on Investment for Emergency Preparedness Study 46
January 2015
8.2.3. ROI and time savings
Table 2 – Summary of time and cost savings for emergency preparedness investments in
Pakistan
Total investment
(000$)
Total gross savings (000$)
Total net savings (000$)
ROI Time savings (days)
Pre-positioning
RUTF 64.7 119.3 54.6 1.8 14
Micronutrient powder 13.5 17.8 4.3 1.3 14
ORS 82.0 184.9 102.9 2.3 14
Zinc 8.3 8.6 0.3 1.0 14
Family hygiene kit 400.4 378.5 -21.9 0.9 6
Hygiene kit 453.2 428.4 -24.7 0.9 6
LLIN 27.5 24.5 -3.0 0.9 6
MSU 388.7 717.8 329.1 1.8 4
ICT equipment 137.1 143.6 6.5 1.0 49
Infrastructure project
Nasir Bagh 1,504.1 2,195.2 691.1 1.5 -
LTAs
Goods and services 2.1 - - - 10–38
Commodities and transport
2.1 - -
- 7
Monitoring 10.1 67.1 56.9 6.6 15–16
Training
ICT emergency mgmt. 15.6 165.5 149.9 10.6 8–9
Rapid need assessment
20.0 - - - 7
HPM 20.0 156.5 136.5 7.8 15–16
EPRP 15.0 24.2 9.2 1.6 30–31
Sectoral trainings 66.0 - - - 8
Additional resources
VAM team 61.4 13.5 -47.9 0.2 23
National rosters 3.5 43.8 40.3 12.4 8–9
PCAs/FLAs
Nine PCAs 2.8 - - - 14
Table 2 summarizes the time and cost savings from each preparedness investment in Pakistan.
All investments saved either time or costs or both, and there was no investment that slowed
down emergency response times.

Return on Investment for Emergency Preparedness Study 47
January 2015
The highest ROIs were related to trainings, which focused on enhancing local capabilities to
prepare and respond to emergency situations, thus minimizing costly international deployments.
The ICT emergency management training had the highest ROI, while the Humanitarian
Performance Monitoring (HPM) and the EPRP trainings also provided significant returns by
avoiding additional local staff reassignment during emergencies. The rapid need assessment
training and the sectoral trainings do not include a dollar savings dimension because the
additional costs needed to reach the same level of service without the trainings were not
quantifiable due to a lack of sufficient reliable data to support this analysis. The main benefits of
these interventions were primarily the quality and timeliness of UNICEF/WFP emergency
responses.
A high ROI was also observed from the establishment of national rosters for emergency
response. This is a 'must do' investment. Keeping a roster up-to-date requires limited staff
capacity but can save precious time and resources during an emergency. On the other hand, the
VAM additional resources investment had a negative ROI because boosting full-time staff
capacity costs more than periodically increasing staff capacity during emergencies but has
enormous time savings and qualitative benefits to overall service provision.
Field monitoring LTAs also generated strong cost and time savings. While the initial investment
of signing these agreements is rather limited (only staff time), they can save costs on staff
reassignments to perform the third-party monitoring in the field during emergencies.
The pre-positioning activities showed different patterns for locally and internationally sourced
commodities. Hygiene kits (composed of locally sourced products) and LLINs had ROIs slightly
below 1. Due to a strong local supply infrastructure, the prices of these commodities do not
experience significant peaks during emergencies. Pre-positioning therefore does not lead to large
cost savings, but allows a faster response from UNICEF/WFP since six days of delivery time are
saved. Only the ICT equipment had an ROI just above 1, as local suppliers would generally ask
for a price premium during an emergency. Since local suppliers would still have to import most of
the ICT equipment17, the lead time saved due to the pre-positioning investment is significant (up
to 49 days). Internationally sourced commodities, on the other hand, all had strong positive ROIs.
This was because the required air transport costs in case of emergency for RUTF, micronutrient
powders, ORS, zinc and MSUs was significantly more expensive than the sea transport costs
incurred during the pre-positioning activity.
Also remarkable were the large cash flows generated by Nasir Bagh investment. This
infrastructure work required the largest upfront investment ($1.5M), but saves significant costs in
potential food losses and temporary storage costs (tarpaulins and plastic sheeting) to recoup the
investment ($100,000 will be saved every year, on top of more than $2.0M in food losses in the
event of a major flood).
17
Direct international sourcing by UNICEF/WFP would not be possible for most of the ICT equipment due to
government restrictions.

Return on Investment for Emergency Preparedness Study 48
January 2015
Finally, LTAs and PCAs represent very small investments (only the staff capacity required to
process the agreements) but enable UNICEF/WFP to get additional suppliers or partners on
board much faster during emergencies. Unlike in Chad, it was not feasible to quantify exact cost
savings from PCAs due to insufficient reliable historical data.
Figure 20 – Visual representation of time and cost savings in Pakistan18
As a country with better coping capacity and well-established transport and supply infrastructure,
it has moved away from pre-positioning of basic food commodities to investing more in higher-
yielding human capital initiatives. The general pattern regarding the different returns from training
and additional resources is also observed. However, given the complexity of the security situation
and the bureaucratic travel authorization procedures in politically sensitive and insecure regions,
time savings from having well-trained people at the right place are inflated.
8.3. Madagascar
Madagascar is among the poorest countries in the world. In 2010, 87.7% of the population lived
on less than $1.25 a day, and 95.1% on less than $2.00 a day.19 The country has not yet
recovered from the political crisis that followed the coup d'état of 2009 and that led to the
suspension of the majority of international aid. Although development partners have
progressively recommitted themselves since 2012, the volume of aid remains at half of its pre-
18
LTAs and other investments for which cost savings not calculated were excluded from the analysis 19
World Bank, 2014. Poverty headcount ratio at 1.25$ a day (PPP). http://data.worldbank.org/indicator/SI.POV.DDAY

Return on Investment for Emergency Preparedness Study 49
January 2015
crisis levels. 20 As a consequence, the government lacks significant resources to invest in basic
social services and to assist the population in case of emergencies. This is illustrated by a high
rating of 7.7 on the lack of coping capacity index on InfoRM (ranked 17th out of 191 countries).
UN agencies like UNICEF and WFP therefore play an important role in supporting the
government in reinforcing its capacity and ability to respond to emergencies. The main
government counterparts for all emergency preparedness activities are the Bureau National de
Gestion des Risques et des Catastrophes (BNGRC) and its operational arm, the Corps de
Protection Civile (CPC).
Madagascar is highly prone to natural disasters, and climate change now threatens to
exacerbate these risks. In the last four decades, over 50 natural disasters have recurrently
caused destruction on the island.21 While the south suffers from recurrent droughts, cyclones,
often accompanied by floods, can strike several parts of the country. The eastern coastline was
historically the main gateway for cyclones. However, in the past two decades, cyclones have also
started to hit the western coast with a marked increase in frequency and intensity also noted
during this period. The increasing fragility of the ecosystem, caused by inadequate education,
insufficient productive infrastructure (including agricultural infrastructure) and poverty is a major
cause of the increased vulnerability to shocks and related food insecurity.
8.3.1. Country risk profile
Both drought and cyclone (including the associated floods) scenarios were analysed in the study.
Figure illustrates this new trend that, while droughts are largely confined to the south, cyclones
now hit the entire perimeter coast of the country.
20
UNICEF Madagasar, 2012. Kit d'information. 21
EM-DAT: The International Disaster Database, 2014. Country Profiles. Centre for Research on the Epidemiology of
Disasters – CRED. http://www.emdat.be/country-profile

Return on Investment for Emergency Preparedness Study 50
January 2015
Figure 21 – Risk scenarios defined for Madagascar
Different thresholds for the risk scenarios included in the model are summarized in Figure .
Again, recurrent 'smaller–scale' emergencies materializing every year were excluded from the
model. Over the last 10 years, Madagascar has been hit every year by at least one cyclone
affecting up to 100,000 people.22 While acknowledging this annual risk, the model excluded it
from the ROI analysis due to its high predictability. On top of historical figures and COs'
experience, the new figures for population in need were derived from the 2013–14 Outil de
Synthèse: Plan de Contingence National et du Comité Permanent Inter-Agence – Cyclone et
inondation.23
22
OCHA Madagascar, 2014. Tableau & graphique dégât cyclonique 2001 à 2012; EM-DAT: The International Disaster
Database, 2014. Country Profiles. Centre for Research on the Epidemiology of Disasters – CRED.
http://www.emdat.be/country-profile 23
Bureau National de Gestion des Risques et des Catastrophes (BNGRC) and the Inter-Agency Standing Committee
(IASC), 2013–2014. Outil de Synthèse: Plan de Contingence National et du Comité Permanent Inter-Agence –
Cyclone et inondation.
Antsiranana
Antsohihy
Mahajanga
Maevatanana
Miarinarivo
Maintirano
TsiroanomandidyAntananarivo
Antsirabe
Ambositra
Drought
Cyclone
Ambovombe Androy
Toliara
Ihosy
Tolanaro
Fianarantsoa
Manakara
Farafangana
Fenoarivo Atsinanana
Toamasina
Sambava
Airport
National capital
Region capital
UNICEF/WFP presence
Major cities
Demographics
Children 6 to 59 months
Pregnant/lactating
women
Others
Average family size
20%
5%
75%
6

Return on Investment for Emergency Preparedness Study 51
January 2015
Figure 22 – Detailed future scenarios assumed for all major risks (Madagascar)
8.3.2. Investments in scope
Eleven different emergency preparedness investments were analysed in Madagascar and
consisted of investments either fully or partly funded under the DFID Humanitarian Programme.
Figure 23 – Emergency preparedness investments for Madagascar24
24
UNICEF Pakistan Work Plan for DFID II; WFP Pakistan Concept of Operations
Probability of
hazard occurrence
New population
in need
MAM
children
Drought• Every 7-8
years
• 600,000 • 9,300 (8%)
Cyclone
• Every 2 years
• Every 5 years
• 270,000
• 720,000
• 4,400(8%)
• 11,800 (8%)
Duration
• 6 months
• 1 month
• 6 months
SAM
children
• 1,200 (1%)
• 540 (1%)
• 1,400 (1%)
Logistics/ICT Procurement Staffing External contracting
I IV VI
V
Pre-positioning of motorized boats, ICT equipment
and Mobile Storage Units
Increased pre-positioning of Nutrition and WASH
commodities
Deployment
of 7 additional Regional Tech. Assistants (ATRs)
ATR training on EPRP
approach and simulation exercise
Emergency
prep. and operation training
Set-up of an
early warning system
Standby or contingency
PCA agreements in high-risk zones
II
UAV/drone for aerial
post-disaster needs assessment
Cash & Voucher
feasibility study and simulation exercise
4 addit. resource (field
monitor, program and VAM assistant)
IT emergency
management raining
Emergency supply pre-positioning
Infrastructure project Additional resources
Trainings PCAs/FLAs

Return on Investment for Emergency Preparedness Study 52
January 2015
Emergency supply pre-positioning: Different types of commodities were pre-positioned, mainly
in the capital. Given the unpredictability of the location of the next cyclone, the centralized
location of Antananarivo on the island makes it a strategic hub for pre-positioning emergency
supplies.
$64,935 (including transport and storage cost) of various ICT equipment were pre-
positioned in the capital. These included; radios, computers, generators, BGAN terminals,
scanners, printers and repeaters that are crucial for better coordination and information
management during emergencies.
14 Mt of RUTF, 34 Mt of soap and more than 100,000 sachets of water
flocculant/disinfectant powder were also pre-positioned in Antananarivo in case of cyclone
or drought.
Two Mobile Storage Units valued at $13,123 each were also procured. One was donated
to the CPC to be pre-positioned in the southeast, while the second was pre-positioned in
the east in Tamatave for the event of a cyclone.
Two motorized boats were procured and pre-positioned in Antananarivo. They were also
donated to the CPC, but will be available to the UN community in the event of a cyclone
for emergency assessments and search and rescue operations in isolated locations. One
of the main advantages of these boats is that – unlike most of the boats available on the
Malagasy market – they are compliant with UN security norms, allowing UN staff to be
transported on them.
Infrastructure project: The team also analysed the purchase of two UAVs for post-disaster
aerial needs assessment. In the immediate aftermath of a cyclone, UAVs can complement the
role of helicopters in the assessment of the damages and in determining the needs of the
population. Due to their limited flight radius, UAVs cannot fully replace the need for helicopters,
since large-scale cyclones often affect large geographical areas. However, once the most
critically affected zones have been identified by helicopter, UAVs can take over aerial
assessment work and provide much more precise information and imagery of the situation. This
saves cost and time from reduced helicopter usage and also provides higher-quality post-disaster
needs assessments with greater specificity in terms of the magnitude of the damages, people
affected and required interventions.
Trainings: Three different trainings were conducted with support from the DFID Humanitarian
Programme:
Three workshops (in Antananarivo, Ambovombe and Toliara) were held on emergency
preparedness and operation. These 2.5-day trainings were given in total to 20 CO staff
and 50 partners. Participants were briefed on the EPRP package and MIRA assessment.
The objective of the training was to speed up responses at the onset of an emergency
due to increased knowledge of the protocols, improved coordination and higher-quality
assessment of the strategic humanitarian priorities.
48 regional technical assistants (ATRs) were trained in rapid assessments and response
methodology to improve reporting on emergency needs and impact (using SMS surveys)
and to assist authorities within their regions in properly following preparedness and

Return on Investment for Emergency Preparedness Study 53
January 2015
response protocols. In addition to policy and planning-related training on humanitarian
needs assessment, emergency response and use of early warning SMS systems,
participants also operationalized their new knowledge with a simulation exercise to test
emergency response in real time.
A three-day training on ICT emergency management was provided to 21 ICT personnel
drawn from various stakeholders (government, UN, NGOs and the private sector). This
intensive course covered a wide range of topics such as ICT capacity gap analysis,
operations management, business continuity plans and coordination frameworks to
ensure timely, predictable and effective information management from the onset of an
emergency and better coordination between relevant humanitarian stakeholders. The
training also raised the participants' awareness of the international laws covering
emergency response.
Additional resources: Staff capacity was also reinforced in two different areas:
To ensure that the CO has ongoing field presence for emergency preparedness and
response, seven Regional Technical Assistants embedded within four government
ministries (Water, Social Protection, Education and Health) were funded.
Two field aid monitors for emergency preparedness and operations in the east and the
southeast, one programme assistant and one VAM assistant based in Antananarivo were
also recruited.
In both cases, the additional staff capacity allow for faster mobilization of resources and partners
on the ground during an emergency and more accurate monitoring of the risks and evaluation of
humanitarian needs.
Partnerships/external contracting: Three different types of partnership activities were
conducted by UNICEF/WFP COs for emergency preparedness purposes:

Return on Investment for Emergency Preparedness Study 54
January 2015
Illustration 3 – Community training session on the Early Warning system
Illustration 1 – Rehabilitation of the Tissi airstrip
In collaboration with the BNGRC, a Community Preparedness Early Warning system was
put in place in cyclone-prone coastal areas. 1,500 Fokontany25 were equipped with Early
Warning kits (including mobile phone devices with SIM cards for disaster information
transfer by SMS, solar, and/or crank radios and weather warning flags). The local
committees for risk and disaster management in 200 Fokontany were also trained by the
BNGRC on the use of the equipment, emergency colour codes and the fast reaction
matrix so as to make rapid informed decisions at the onset of a cyclone.
The CO conducted a feasibility assessment of cash- and/or voucher-based interventions.
This included an assessment of 16 local markets and local retail supply chains to
determine price fluctuation, seasonality and reactivity of supply and demand and capacity
of financial service providers (banks, mobile phone companies and micro-finance
institutions) and to identify operational partners with knowledge and skills in cash
transfers and mitigation measures needed to minimize misuse and fraud in cash
modalities. In addition to this, a Cash & Voucher simulation exercise was conducted with
a cooperating partner that has adequate field experience to evaluate the relevance and
feasibility of the approach.
15 to 20 new standby agreements with cooperating partners were signed for the
distribution of food in high risk areas
25
Subdivisions of the communes headed by a chief

Return on Investment for Emergency Preparedness Study 55
January 2015
8.3.3. ROI and time savings
Table 3 – Summary of time and cost savings for emergency preparedness investments in
Madagascar
Total investment
(000$)
Total gross savings (000$)
Total net savings (000$)
ROI Time savings (days)
Pre-positioning
ICT equipment 64.9 61.7 -3.2 1.0 35–36
RUTF 57.1 122.7 65.7 2.1 14
MSU 32.9 52.6 19.7 1.6 7
Motorized boats 24.3 49.8 25.5 2.1 5
Water flocculant powder 4.3 7.9 3.6 1.8 3–4
Soap 4.2 3.0 -1.2 0.7 2
Infrastructure project
Two UAVs 20.0 46.4 26.4 2.3 -
Training
Emergency preparedness and operations
54.1 72.5 18.3 1.3 4
ATR training 35.8 52.8 17.1 1.5 3
ICT emergency mgmt. 19.7 59.3 39.5 3.0 4
Additional resources
Seven ATRs 184.1 126.8 -57.3 0.7 3
Field monitors, VAM and programme assistants
104.4 26.0 -78.4 0.3 3
Partnerships/external contracting
EW system 350.8 - - - -
C&V study and simulation 69.9 - - - -
Standby agreements 3.5 5.1 1.6 1.5 2–3
Table 3 summarizes the time and cost savings from each preparedness investment in
Madagascar. The highest ROIs observed were from the trainings and the UAVs. The three types
of trainings enhanced national staff capacity, reducing reliance on more costly international staff
support. The UAVs represent a relatively small initial investment ($20,000)26 and, although they
do not fully replace the need for helicopters during an emergency, the part of the helicopter work
they can take over is already sufficient to generate large savings.
26
Including training costs for the UAV operators

Return on Investment for Emergency Preparedness Study 56
January 2015
Internationally sourced commodities (RUTF, MSU, motorized boats and water flocculant powder)
also had very strong financial ROIs and time savings. Given that Madagascar is a remote island,
the cost-efficiency of sea transport compared to airlifting is multiplied. On the other hand, the
ROIs of ICT equipment (a mix of locally and internationally purchased products) and locally
procured soap are slightly below 1. Although in-country transport costs for the ICT equipment are
higher in case of emergency (due to the use of planes), the cost savings are negligible. However,
both investments allow crucial time savings at the onset of an emergency. Additional resources
also yield an ROI below 1 (for the extra ATRs and the field monitors, VAM and Programme
assistants).
In the external contracting and partnerships focus area, no financial ROIs were calculated for the
early warning system or the cash and voucher study and simulations. For the early warning
system, the project was still at an early stage of implementation at the time of this study. Since
the investment in community-level early warning systems in Madagascar remains quite low and
is still in its formative stages, there was limited historical evidence or reliable community-level
data to support a rigorous quantitative analysis of the expected benefits of such early warning
systems in saving lives and mitigating economic losses among affected communities. Due to
time constraints placed on the study, it was also not possible or within the scope of this study to
collect and collate the extensive household-level data required to meet the data quality
thresholds to measure the impact of early warning systems at mitigating losses at a household
level.27 Such detailed household-level data would have been critical to capture the full cost
savings realized during a cyclone and thus to calculate an accurate financial ROI. However, other
research suggests strong positive returns from Community-Level Early Warning systems.28
Discussions held with community leaders during EWS trainings in Tamatave indicated that they
felt increasingly empowered and engaged in supporting their respective Fokotany (villages) to
self-organize and prepare for cyclones without fully relying on external assistance. The early
warning equipment will also facilitate faster top-down and bottom-up communication and
coordination between the affected villages and the national authorities during cyclones. There is
also the added benefit of simultaneously disseminating real-time data to humanitarian partners to
facilitate faster emergency assessments, and targeted, rapid responses with reduced time and
resources (staff, vehicles, supplies) expended on conducting emergency assessments
independently.
A comparable reasoning holds for the cash and voucher investments. The cash and voucher
project is also in its early stages of implementation. The feasibility study and the simulation
exercise were first necessary steps and allowed a better understanding of the market structure
and dynamics. The results were used to further develop a methodology on rapid assessments of
post-crisis markets and the resulting impact on C&V modalities. Further preparedness
27
Blown-off roofs, rotten wood inhabitations, cut-off roads, flooded crop lands, uprooted lychee trees, etc. 28
Subbiah et al. (2008) conducted five case studies of Early Warning systems in Asian countries for flood and
cyclones scenarios and proved cost-benefit ratios between 0.93 and 558.9 over a ten-year period. Similarly, Woodruff
(2008) found that an improved flood forecasting system in Samoa would yield a cost-benefit ratio between 1.72 and
1.92 depending on the discount rate. Additionally, Kull et al. (2003) estimated the cost-benefit ratio of an Early Warning
system in the Lai River Basin in Pakistan at 1.6.
Return on Investment for Emergency Preparedness Study 57
January 2015
investments are required in biometric identification and registration systems to minimize misuse
and fraud and enable price collection and monitoring systems, standardized beneficiary cards,
signing of financial arrangements with banks and mobile phone companies and training of
operational partners (mainly for registration, complaint mechanisms and community sensitization)
in order to roll out C&V modalities for the 2015–2016 cyclone season. Once these systems are in
place, strong evidence from other countries suggests that a future cash and voucher programme
would not only improve the CO's cost-efficiency but would also have strong positive impact on
the beneficiaries.29
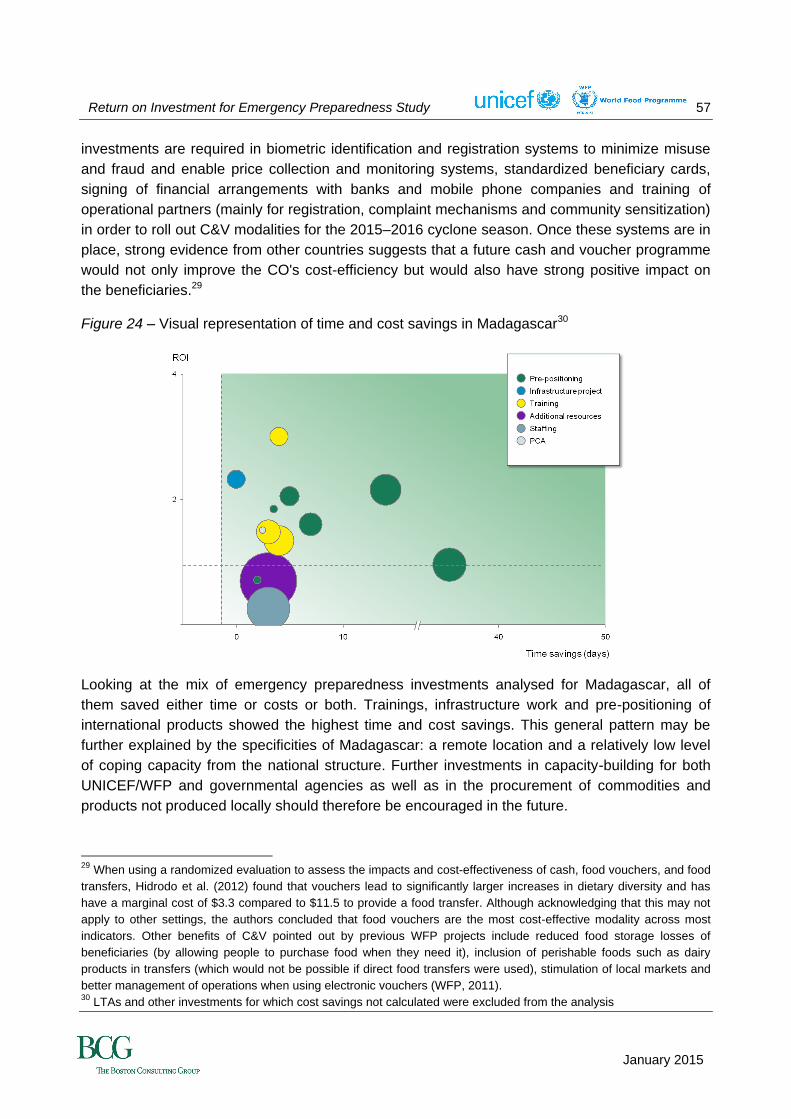
Figure 24 – Visual representation of time and cost savings in Madagascar30
Looking at the mix of emergency preparedness investments analysed for Madagascar, all of
them saved either time or costs or both. Trainings, infrastructure work and pre-positioning of
international products showed the highest time and cost savings. This general pattern may be
further explained by the specificities of Madagascar: a remote location and a relatively low level
of coping capacity from the national structure. Further investments in capacity-building for both
UNICEF/WFP and governmental agencies as well as in the procurement of commodities and
products not produced locally should therefore be encouraged in the future.
29
When using a randomized evaluation to assess the impacts and cost-effectiveness of cash, food vouchers, and food
transfers, Hidrodo et al. (2012) found that vouchers lead to significantly larger increases in dietary diversity and has
have a marginal cost of $3.3 compared to $11.5 to provide a food transfer. Although acknowledging that this may not
apply to other settings, the authors concluded that food vouchers are the most cost-effective modality across most
indicators. Other benefits of C&V pointed out by previous WFP projects include reduced food storage losses of
beneficiaries (by allowing people to purchase food when they need it), inclusion of perishable foods such as dairy
products in transfers (which would not be possible if direct food transfers were used), stimulation of local markets and
better management of operations when using electronic vouchers (WFP, 2011). 30
LTAs and other investments for which cost savings not calculated were excluded from the analysis

Return on Investment for Emergency Preparedness Study 58
January 2015

Return on Investment for Emergency Preparedness Study 59
January 2015
9. DETAILS OF RISK SCENARIO CALCULATIONS
As outlined in sections 6.1.1, 6.2.1 and 6.3.1, the defined risk scenarios were a key input for all
calculations. For this, two complementary approaches were followed. The main model calculates
the next expected scenario in terms of caseload, duration and time until materialization. The
assigned probabilities for each scenario are used as weights.31 For all further calculations, only
the next expected emergency scenario is taken into account.
To test the predictability of the model, additional probabilistic Monte Carlo simulations were
performed. This takes probabilities and caseloads of all risks as input and simulates random
years, where the outcome ranges between no emergency in a given year to all the risk scenarios
materializing within the same year. Thus, the second approach has by trend slightly higher
caseloads.32 As this is an elaborate analytical approach requiring specific software and skills, it is
only used for sensitivity analysis but is not part of the final model.
However, for all calculations some general assumptions were made:
All events (risk types and specific scenarios) are independent of each other – thus, it may
be that none of the events take place or that all occur at the same time.
For the probabilities or recurrence times as well as impact (caseload), historical data was
used as a baseline (see the next section).
Forward-looking projections (where available) were included in the assessment for
selected risks (e.g., more recent data on conflict and climate change for flood and
drought).
For all sectors and/or commodities of both organizations, specific operational targets were
defined to calculate their effect on the overall needs for the country's emergency
scenario.
9.1. Historical data on risk scenarios
Figure , Figure and Figure 27 show the historical data on the frequency and impact of relevant
risks that was used as a starting point for the risk profile definition of the three pilot countries.
EM-DAT was used as the primary data source for affected population estimates for natural
hazards (namely drought, flood, earthquake and cyclones). For conflict, the UNHCR database
was leveraged. The conflict estimates on the graphs only reflect new influxes of conflict-displaced
populations – refugees, returnees (and IDPs for Pakistan); they exclude pre-existing caseloads
already present in the country and as such do not correspond to the total population of refugees,
returnees and IDPs for the respective years.
31
The details of the calculation are shown in Figure 3 in the main part. 32
What was not taken into account is the increased vulnerability of households due to several shocks striking
consecutively. This resilience perspective was not in the scope of this study.

Return on Investment for Emergency Preparedness Study 60
January 2015
Figure 25 – Historical baseline data on Chad's risk profile
0
500
1,000
1312111009080706050403
0
0201
1
009998
47
97
81
96
174
95
176
94
173
93
14
92
13
919089
145
88
614
87868584
1
Conflict
150
100
50
0
1312111009
5
0807
7
060504
113
030201
179
1917 10
113
8
4160
Historical data of new population in need (000 people)
Averaged
events
Flood
• 600,000 people
every 30 years
• 75,000 people
every 3 years
• 50,000 people
every 5 years
• 100,000 people
every 5 years
Drought
• 2M people
every 15 years
• 500,000 people
every 10 years
2,000
0
1,000
3,000
800
2,400
300
1,600
356
1312111009080706050402010099989796959493929190898887868584 03

Return on Investment for Emergency Preparedness Study 61
January 2015
Figure 26 – Historical baseline data on Pakistan's risk profile
Figure 27 – Historical baseline data on Madagascar's risk profile
Flood 10
20
0
5.1
11
5.4
10
20.43
09 13
1.5
129998
0.2
97
0.9
96
1.3
95
1.9
94
0.8
93
0.3
08
0.3
070605
7.5
0403
1.3
0201
0.4
0092
12.8
919089
0.1
88
1.0
87868584
5
0
13
0.2
12
0.2
90
0.0
898887 9998
0.0
97
0.0
96 070605
5.1
04
0.0
86
0.0
85
0.0
84
0.0
11
0.0
100908
0.1
0302
0.2
01
0.9
0095949392
0.0
91
0.0
1.0
2.0
3.0 2.8
0807
1.0
060504
0.2
030201
0.2
13
0.0
12111009
Historical data of new population in need (M people) Averaged events
• 10M people
every 6 years
• 800,000 people every 2.5 years
Security
op.
• 2M people
every 6.5 years
• 100,000 people every 4 years
Drought
• 5M people
every 30 years
• 100,000 people every 2 years
Earth-
quake
4
0
2
99
2.2
929190898887868584 090803 06050402 13121110989796959493 0100 07
• 2.2M people
every 30 years
Drought
0
1,000
500
131211100908
720
070605040302
600
0100
231
999897969594939291908988
950
87868584
• 600,000 people
every 7.5 years
Historical data of new population in need (000 people)
Averaged
events
Cyclone
• 700,000 people
every 5 years
• 120,000 people
every 2 years
0
1,000
500
13
45
12
336
11
115
10
192
09
131
08
533
07
223
06
7
05
8
04
1,032
03
163
02
528
0100
1,106
999897
600
96
100
9594
540
939291
250
9089
55
888786
84
8584
100

Return on Investment for Emergency Preparedness Study 62
January 2015
9.2. Monte Carlo analysis
The Monte Carlo analysis was performed in the model for one particular type of preparedness
investment: emergency supply pre-positioning. Pre-positioning is indeed the only investment that
is fully scalable for the magnitude of the emergencies. While the quantity of a pre-positioned
commodity can be freely adjusted to optimize the emergency response, it is difficult to invest in
half of an airstrip or to provide the same training four times.
The analysis simulates random years, taking the probabilities of the specified risk assumptions
as a starting point. Thus, the simulated year reflects all possible combinations of the single risk.
The probabilities are fixed, but the final materialization is left to the probabilistic nature of the
simulation. Monte Carlo simulations allow repetitive cycles for a large number of years. For this
study, we used 5,000 repetitions or simulated years. Figure 28 shows the results of simulation for
the case of Pakistan.
Figure 28 – Monte Carlo simulation for Pakistan's risk scenario
The x-axis depicts the overall caseload of a simulated year, ranging from 0 to more than 20
million.33 The bars connected with the right axis represent the probability that a specific caseload
was simulated (number of outcomes divided by the total number of simulations). The highest
single probability is for caseload numbers between 200,000 and 400,000 beneficiaries at over
9%. The cumulative probability depicted by the line sums up all single probabilities. It is steeply
33
The probability that all risk scenarios happen simultaneously and a caseload of 23.8 million would materialize is very
low, at 0.00011%, and did not occur in the 5,000 simulated years above. The probability that none of the risks
materialize is 2.9% and is clearly visible in the above graph.
Case load (M)1
Probability of caseload (%)Cumulative probability
9.5
0.5
2.0
1.5
0.0
0.35
0.05
6.5
7.0
0.15
7.5
0.25
8.0
8.5
9.0
4.0
2.5
4.5
3.5
3.0
0.45
0.55
0.65
0.75
0.85
0.95
1.00
1.0
6.0
0.10
0.40
0.60
5.0
0.70
0.00
0.30
0.20
0.80
5.5
0.50
0.90
7.2
6.4
6.0
5.6
9.6
14.8
14.4
14.0
13.6
13.2
12.8
2.8
2.4
2.0
1.6
1.2
0.8
19.6
19.2
18.8
18.4
18.0
17.6
5.2
4.8
4.4
4.0
3.6
0.4
17.2
16.8
16.4
16.0
15.6
15.2
0.0
10.0
9.2
8.8
6.8
8.4
8.0
20.0
12.4
12.0
11.6
11.2
10.8
10.4
7.6
3.2
~75% of realizations
(years) show a composite
caseload of below ~4.4M
Single risk scenarios as
defined with the COs
Caseload and probability
of simulated years

Return on Investment for Emergency Preparedness Study 63
January 2015
inclined for smaller caseloads and levels out for higher ones. This shows that approximately 75%
of realizations (years) have a composite caseload of below 4.3 million. Higher caseloads only
materialize when one of the major risks (earthquakes and major floods affecting 5 and 20 million
people, respectively) hit the country.
In contrast to the nine risk scenarios for Pakistan, Chad and Madagascar had only six and three
less complex scenarios, respectively. This is why their respective simulation results are less
smooth. However, the cumulative curve has a similar structure. Figure summarizes the results
for these two countries.
Figure 29 – Monte Carlo simulation for Chad and Madagascar
As an additional sensitivity test, a Monte Carlo simulation was run without the strong assumption
of the total independence of each individual event. Thus, two similar risk types were not allowed
to hit in the same year (e.g., a small and large flood would not hit Pakistan in the same year). The
resulting cumulative probability line is covered in
Case load (M)1
0.6
0.5
100.4
16
0.3
22
0.2
0.1
20
0.7
8
0.9
180.8
14
0.0
12
6
24
4
2
1.0
0
910
840
770
700
630
560
490
420
350
280
210
140
700
1,0
50
1,6
10
1,5
40
1,4
70
Probability of caseload (%)
1,4
00
1,3
30
1,2
60
Cumulative probability
1,1
90
1,1
20
980
3,5
00
3,4
30
3,3
60
3,2
90
3,2
20
3,1
50
3,0
80
3,0
10
2,9
40
2,8
70
2,8
00
2,7
30
2,6
60
2,5
90
2,5
20
2,4
50
2,3
80
2,3
10
2,2
40
2,1
70
2,1
00
2,0
30
1,9
60
1,8
90
1,8
20
1,7
50
1,6
80
> 80% of realizations below
a composite caseload of ~ 490K
0.9
0.2
0.0 0
0.5
40
0.8
5
35
20
0.1
0.730
0.6
1.0
0.310
150.4
25
83
2
80
0
76
8
73
6
70
4
67
2
64
0
60
8
57
6
54
4
51
2
48
0
44
8
41
6
38
4
1,2
16
32
0
28
8
25
6
22
4
19
2
16
0
12
8
96
64
320
1,5
04
1,5
36
1,4
72
1,4
40
1,4
08
1,3
76
1,3
44
1,3
12
1,2
80
1,2
48
1,6
00
1,1
84
1,1
52
1,1
20
35
2
1,0
88
1,0
56
1,0
24
1,5
68
99
2
96
0
92
8
89
6
86
4
Case load (M)1
In ~ 85% of realizations the risks hit
Madagascar not at all or individually
Ma
da
ga
sc
ar
Ch
ad

Return on Investment for Emergency Preparedness Study 64
January 2015
Figure . The comparison shows very small variations. As the interdependency of the individual
risk types is very complex with limited added value, all other simulations retained the
independence assumption.34
34
The only case where this is not true is when two risks are totally dependent, in which case we treated them as one
risk. This is the case in Madagascar, for example, where we only show a cyclone risk that implicitly includes the flood
that always hits in the aftermath.

Return on Investment for Emergency Preparedness Study 65
January 2015
Figure 30 – Monte Carlo results with and without independence
For each risk scenario, UNICEF and WFP had specific operational targets out of the overall total
affected population. These vary by sector and, in some cases, by the specific target group. Some
commodity needs are based on household sizes, individual beneficiaries and/or specific target
groups, e.g., children with severe acute malnutrition. Finally, the duration of the risk affects the
total need of a specific commodity.
The graph in Figure is quite similar to that in Figure 28 but takes this additional assumption into
account and shows the significant RUTF needs in Pakistan. To be prepared for 75% of
emergency scenarios, a total amount of 370 Mt RUTF is needed. Preparing for needs beyond the
75% threshold is costly but would only add a small probability (15–25%) to also be fully prepared
for the larger but very rare events. The sharp rise in the beginning indicates that every
additionally invested amount prepares for a highly relevant risk scenario. The decline reflects the
decreasing marginal returns in investing in pre-positioning. Moving to the second point would
require an additional 360 Mt RUTF only to be prepared for an additional 15% of possible larger
caseloads
Case load (M)1
Probability of caseload (%)Cumulative probability
0.95
0.85
0.90
1.00
0.80
0.75
0.70
0.65
0.60
0.55
0.50
3.0
2.0
2.5
7.5
1.5
3.5
4.0
4.5
5.0
5.5
6.0
8.0
7.0
6.5
8.5
9.0
9.5
0.10
0.05
0.00
1.0
0.5
0.0
0.45
0.40
0.35
0.30
0.25
0.20
0.15
10.0
9.6
9.2
8.8
8.4
8.0
7.6
7.2
6.8
6.4
6.0
5.6
5.2
4.8
4.4
4.0
3.6
13.6
13.2
12.8
12.4
12.0
11.6
11.2
10.8
10.4
2.4
20.0
2.0
19.2
18.8
18.4
18.0
17.6
17.2
16.8
16.4
16.0
15.6
2.8
1.6
1.2
0.8
0.4
0.0
3.2
15.2
14.8
14.4
14.0
19.6
~75% cut off very
comparable under both
assumptions
For high caseload values
smaller outcomes than if full
independence is assumed
Caseloads of negatively
correlated events

Return on Investment for Emergency Preparedness Study 66
January 2015
Figure 31 – Resulting need for commodities based on the Monte Carlo simulation
9.3. Details of sensitivity analysis
Figure 32132 summarizes all Monte Carlo simulation details to derive the optimal amount to be
pre-positioned. The x-axis contains the randomly pre-positioned amount ranging between 1 and
730 Mt of RUTF.35 Simultaneously, the effective need in each year was simulated, leading to the
specific ROI value. The single realizations are represented by the dots in the graph. This initial
dot cloud reveals some interesting trends, highlighted by the yellow lines. The one to left
comprises all realizations with an effective caseload of less than 0.5 million beneficiaries. As the
effective need in these cases is rather low, the pre-positioned amount quickly exceeds those
needs, resulting in a low ROI. The two pyramid-shaped lines highlight the medium caseload
scenarios between 1 and 2 million beneficiaries. In the last case, for the few large risk scenarios,
the pre-positioned amounts are not enough to match the effective need. Thus, further pre-
positioning for those cases would still increase the ROI. However, these cases are extremely
rare.
35
The range was selected to cover 90% of the possible needs that may materialize based on the earlier simulation
results seen in Figure 31.
Commodity needs (Mt)
0.7
0.0
0.6
0.5
0.4
0.3
0.2
0.1
1.0
0.9
0.8
494
468
442
416
390
364
338
312
286
260
234
208
182
130
104
78
52
260
598
780
754
728
702
676
650
156
1300
1274
1248
1222
1196
1170
1144
1118
1092
624
1040
1014
988
962
936
910
1066
858
832
806
572
546
520
884
Cumulative probability
370 Mt RUTF sufficient
to react to upcoming
emergencies with a 75%
probability
360 Mt additional RUTF
needed to increase pre-
positioned stock to be
able to react to 90% of
possible emergencies
2
570 Mt additional
RUTF needed to
increase pre-
positioned stock to
be able to react to
100% of possible
emergencies
3
1

Return on Investment for Emergency Preparedness Study 67
January 2015
Figure 321 – Simulation details and smoothing of resulting ROI values
The red line represents the average ROI.36 This approach allows to identify an optimal range of
the amount to be pre-positioned for a given commodity. Comparing both approaches (the one
included in the Excel model and the Monte Carlo simulations) we find that for Pakistan (with the
broadest risk portfolio of all pilot countries) that the simulation arrives at somewhat higher values
for the amount to be pre-positioned than in the Excel model, however further analysis is needed
to confirm that implementing partner capacity would be sufficient to maintain fluid distribution of
larger quantities without operational bottlenecks. For Chad and Madagascar (with more focused
risks) the opposite is true.
36
The simulation range was divided into 100 equally sized intervals.
0 25 50 75 100 125 150 175 200 225 250 275 300 325 350 375 400 425 450 475 500 525 550 575 600 625 650 675 700 725 750
2.0
1.4
0.4
0.2
1.0
1.2
0.0
1.6
0.6
1.8
0.8
ROI
0 25 50 75 100 125 150 175 200 225 250 275 300 325 350 375 400 425 450 475 500 525 550 575 600 625 650 675 700 725 750
0.0
2.0
1.0
0.8
0.4
1.6
1.4
0.6
1.2
0.2
1.8
Emergency scenarios
> 5M caseload
Smoothed average Pre-positioned amount
Emergency scenarios
1M < 1.5M caseload
Emergency scenarios
1.5M < 2M caseload
Emergency scenarios
0.1M < 0.5M caseload

Return on Investment for Emergency Preparedness Study 68
January 2015
10. DETAILS OF COMMODITIES COVERED
The focus of the pre-positioning was set to be around commodities in food, nutrition, health and
WASH. The key commodities that were analyzed in the three pilot countries are shown in the
illustration below. Under the DFID grant, no general food commodities were pre-stocked.
However, the model allows for this option, as this might be important for many countries in the
future. Additionally to those four groups, operational support equipment (ICT and MSUs) was
included, as it is specifically important to those countries.
Figure 33 – Overview of commodities included in the model by pilot country
Key commodities Chad Pakistan Madagascar
Food
Rice
Corn
Wheat
Pulses
Oil
Salt
HEB
Nutrition
RUSF
RUTF
Micro-nutrient powders
Health
Oral-rehydration salts
Zinc
Long-lasting insecticide-treated nets
WASH
WASH Family kit
WASH Hygiene kit
Water purification tablets
Soap
Bleach
ICT ICT equipment
OtherMobile Storage Units
Motorized boats
−
Not pre-positioned Pre-positioned
−−−−−−−
✓✓✓✓
−−−
✓✓
−
✓
✓
✓
−−−−−−✓✓
−−✓−
✓✓✓
−−
−
−
−
−−−−
✓✓−
✓✓
−
−
✓
−−−−−−−−
Currently, no general food commodities were pre-stocked.
However, the model allows for this option
−− ✓

Return on Investment for Emergency Preparedness Study 69
January 2015
11. DETAILS OF UTILIZED MODEL
To support all calculations in this report, an Excel-based model was developed. It was tested for
a Windows 7 Enterprise version with Excel 2007. The country-specific version was handed over
to the respective country office. The model including a detailed user manual may be obtained
upon request from the UNICEF/WFP emergency operations departments that led the efforts of
this study. The model has been developed to be as user-friendly as possible. However,
advanced Excel knowledge on the part of the user is still required.
The model is constructed around six different types of sheets:
Content and Sources: Two first sheets explain the content of the model, the cell colour
coding and the sources of all the input.
Output: The output sheet summarizes all the results from the model.
Risk profile and Commodity needs: These are mainly input sheets where the risk
scenarios and the beneficiary needs for each key commodity are defined. Up to five
different risk scenarios can be included, and the model provides for nine different types of
risks: drought, flood, cyclone, economic crisis, conflict, epidemic, volcano, tsunami and
earthquake.
Preparedness investments: All the following sheets correspond to a specific
preparedness investment (pre-positioning, training, etc.). These are the sheets where
data related to each investment is computed and where cost and time savings are
calculated.
Stock and Longer pre-positioning: These two sheets only contain calculations for the
pre-positioning investments. They allow the exact storage duration of the commodities to
be taken into consideration depending on the quantities required for each emergency and
on when the emergencies happen, and also to spread the investments over time. No
input or manipulation is required in these sheets.
Infrastructure examples: This sheet contains illustrations of cost and time savings
calculations for different types of infrastructure work to help the users in the development
of ROI calculations for infrastructure investments.

Return on Investment for Emergency Preparedness Study 70
January 2015
Figure 34 – Selected screenshots from the Excel-based ROI model
I
II
III
IV
V
1
2
3
4
1
2
7
3 4
5 6 6

Return on Investment for Emergency Preparedness Study 71
January 2015
12. CONTACT DETAILS OF THE STUDY TEAM
Mari Denby: [email protected]
Andreas Wuestenberg: [email protected]
Naomi Gikonyo: [email protected]
Déborgah Nguyen: [email protected]
Heino Meerkatt: [email protected]
Philipp Kolo: [email protected]
Quentin Renson: [email protected]

Return on Investment for Emergency Preparedness Study 72
January 2015
13. LIST OF STAKEHOLDERS CONSULTED DURING THE STUDY
Organization HQ/country Name Department/function
HQ DFID Fergus McBean Humanitarian Preparedness and
Response, Economic Advisor,
CHASE
HQ DFID Peter D'Souza Humanitarian Preparedness and
Response Advisor, CHASE
HQ GPPI Antonio Galli PREP Evaluation Team
HQ GPPI Julia Steets PREP Evaluation Team
HQ UNICEF Afshan Khan EMOPS Director
HQ UNICEF Betel Tassew Division of Human Resources
HQ UNICEF Carla Martinez EMOPS
HQ UNICEF Ehsan Ul Haq EMOPS
HQ UNICEF Gemma Orta-Martinez Supply Division
HQ UNICEF Genevieve Boutin EMOPS
HQ UNICEF Jean-Cedric Meeus Supply Division
HQ UNICEF Jens Grimm Supply Division
HQ UNICEF John Paul Anderson Division of Human Resources
HQ UNICEF Joselito Nuguid Supply Division, Deputy Director
HQ UNICEF Koorosh Raffii Evaluation
HQ UNICEF Leon Cases Gonzalez Supply Division
HQ UNICEF Mari Denby EMOPS
HQ UNICEF Martin Hyuntae Chun Division of Human Resources
HQ UNICEF Martin Porter EMOPS
HQ UNICEF Mathew Varghese Evaluation
HQ UNICEF Peta Barns Supply Division
HQ UNICEF Yasmin Haque EMOPS Deputy Director
HQ WFP Adam Fysh Emergency Preparedness and
Response Branch
HQ WFP Andreas Wuestenberg Emergency Preparedness and
Response Branch
HQ WFP Anthony Craig Emergency Preparedness and
Response Branch

Return on Investment for Emergency Preparedness Study 73
January 2015
HQ WFP Claudia Gessler Value for Money
HQ WFP Déborah Nguyen Emergency Preparedness and
Response Branch
HQ WFP Eric Perdison Logistics
HQ WFP Gaby Duffy HR
HQ WFP John Myraunet Logistics
HQ WFP Katja Hildebrand Logistics
HQ WFP Kevin Wyjad Emergency Preparedness and
Response Branch
HQ WFP Lara Prades Emergency Preparedness and
Response Branch
HQ WFP Manuela Reinfeld Emergency Preparedness and
Response Branch
HQ WFP Naomi Gikonyo Emergency Preparedness and
Response Branch
HQ WFP Nenad Loncarevic Logistics
HQ WFP Raymond Zingg Emergency Preparedness and
Response Branch
HQ WFP Rie Ishii Logistics
HQ WFP Sara Bertilsson Logistics
HQ WFP Shane Prigge Food Security
HQ WFP Shruthi Baskaran Value for Money
HQ WFP Thomas Morley Procurement
Chad UNICEF Amadou Tall Logistics
Chad UNICEF Banga Pinah Logistics
Chad UNICEF Bruno Maes Representative
Chad UNICEF Dadoum Edmond Aiba Supply & Procurement
Chad UNICEF Guerdita Djimngang Emergency Unit
Chad UNICEF Guy Yogo Emergency Unit, Chief
Chad UNICEF Honore Nguessan Yao Logistics
Chad UNICEF Ismael Ngnie Teta Nutrition
Chad UNICEF Laurent Badaut Logistics
Chad UNICEF Marcel Ouattara Deputy Representative
Chad UNICEF Nathalie Eboma Emergency Unit

Return on Investment for Emergency Preparedness Study 74
January 2015
Chad UNICEF Regina Aplogan Supply & Logistics
Chad UNICEF Sarhane Mahmat Khamis Education
Chad UNICEF Therese Nduwimana HIV/AIDS
Chad WFP Desire Amougou Cash & Voucher
Chad WFP Geoffrey Mwangi UNHAS
Chad WFP Graan Jaff Head of Logistics
Chad WFP Guillaume Harel UNHAS
Chad WFP Lauren Landis Country Director
Chad WFP Nitesh Patel Programme
Chad WFP Ollo Sib VAM
Chad WFP Peter Musoko Deputy Country Director
Chad WFP Stanislas Bellbell Procurement
Chad WFP Vivens Nzabikiramo Logistics
Chad WFP William Nall Head of Programmes
Madagascar BNGRC Lucia Aime Rova
Naivomanana.
Preparedness Planning &
Response
Madagascar BNGRC Nianja Raonivelo Preparedness Planning &
Response
Madagascar OCHA Benoit Pylyser Coordination
Madagascar UNICEF Elke Wisch Representative
Madagascar UNICEF FelanAndo Aliderson Education Officer/DRR focal point
Madagascar UNICEF Irma Alofa Supply & Logistics
Madagascar UNICEF Jacky Roland Randimbiarison Emergencies
Madagascar UNICEF Laetichia Michele
Rakotoarison
Supply & Logistics
Madagascar UNICEF Max Vieille Planning & Monitoring
Madagascar UNICEF Sara Bordas Eddy Deputy Representative
Madagascar WFP Arisoa Raharinjatovo Programme
Madagascar WFP Edmondo Perrone Logistics
Madagascar WFP Giuseppe Rullanti Cash & Voucher
Madagascar WFP Haganirina Ratsimbazafy Procurement
Madagascar WFP Halivola Andrianasolo HR
Madagascar WFP Haritiana Ravokatra Programme

Return on Investment for Emergency Preparedness Study 75
January 2015
Madagascar WFP Hasiniaina Randria ICT
Madagascar WFP Joellemarie Andriamahazo Logistics
Madagascar WFP Maherisao Rakotonirainy VAM
Madagascar WFP Natacha Pugin Cash & Voucher
Madagascar WFP Nora Hobbs Programme
Madagascar WFP Razafimahatratra Christian Logistics
Madagascar WFP Rijasoa
Rakotoarinoroandriamahazo
VAM
Madagascar WFP Willem Vanmillink Country Director
Pakistan UNICEF Alhaji Bah Field Operations, Chief
Pakistan UNICEF Aubaidadullah Abdool Raman Supply & Logistics
Pakistan UNICEF Ijaz Ahmad HR
Pakistan UNICEF Jamila Jamila Planning, Monitoring &
Evaluation
Pakistan UNICEF Jamshed Thomas Programmes, Peshawar Field
Office
Pakistan UNICEF Maqsood Siddique Supply & Logistics
Pakistan UNICEF Masooma Qazilbash Emergency Unit
Pakistan UNICEF Miriam de Figuerao Deputy Representative
Pakistan UNICEF Muhammad Idrees Khan Emergency Unit
Pakistan UNICEF Muhammad Rafiq Programmes, Peshawar Field
Office
Pakistan UNICEF Nazeef Ullah Khan Partnerships
Pakistan UNICEF Saba Shuja Nutrition
Pakistan UNICEF Samia Hashim Health
Pakistan UNICEF Shandana Aurangzeb Planning, Monitoring &
Evaluation
Pakistan UNICEF Syed Fida Hussain Shah WASH
Pakistan WFP Akhtar Nawaz ICT
Pakistan WFP Ashwini Rai Logistics
Pakistan WFP Farrukh Saleem ICT
Pakistan WFP Krishna Pahari VAM
Pakistan WFP Lola Castro Country Director
Pakistan WFP Mie Kataoka Procurement

Return on Investment for Emergency Preparedness Study 76
January 2015
Pakistan WFP Musa Khan Security
Pakistan WFP Peter Scott-Bowden Deputy Country Director
Pakistan WFP Raja Amjad Ali Security
Pakistan WFP Sahir Aslam Logistics
Pakistan WFP Zulfiqar Ali-Zaidi Logistics
Pakistan WFP Zulfiquar Rao Programme
- - Courtenay Venton Economist, climate change and
sustainable development

Return on Investment for Emergency Preparedness Study 77
January 2015
14. ACRONYMS
ADES Agence de Développement Economique et Social
AFDI Agriculteurs Français et Développement International
ATR Regional Technical Assistant
BCG The Boston Consulting Group
BNGRC Bureau National de Gestion des Risques et des Catastrophes
CARE Cooperative for Assistance and Relief Everywhere
CCC Core Commitments to Children
CELIAF Cellule de Liaison et d'Information des Associations Féminines
CO Country Office
CPC Corps de Protection Civile
CSSI Centre de Support en Santé Internationale
C&V Cash and Voucher
DSA Daily Subsistence Allowance
DFID Department for International Development
DRR Disaster Risk Reduction
EPRP Emergency Preparedness and Response Planning
EW Early Warning
FAO Food and Agriculture Organization
FLA Field Level Agreement
FTE Full-Time Equivalent
HEB High Energy Biscuit
HPM Humanitarian Performance Monitoring
HQ Headquarters
IASC Inter-Agency Standing Committee
ICT Information and Communication Technology
IRC International Rescue Committee
LLIN Long-Lasting Insecticide-Treated Net
MAM Moderate Acute Malnutrition
MIRA Multi-Cluster/Sector Initial Rapid Assessment
MSF Médecins Sans Frontières

Return on Investment for Emergency Preparedness Study 78
January 2015
MSU Mobile Storage Unit
NOC Non Objection Certificate
OCHA Office for the Coordination of Humanitarian Affairs
OPAD Organisation pour la Promotion et l'Appui au Développement
PDA Personal Digital Assistant
PCA Programme Cooperation Agreement
PHO Probability of Hazard Occurrence
PRRO Protracted Relief and Recovery Operation
RFP Request For Proposal
ROI
RUSF
RUTF
Return On Investment
Ready-to-Use Supplementary Food
Ready-to-Use Therapeutic Food
SAM Severe Acute Malnutrition
SID Secours Islamique pour le Développement
UAV Unmanned Aerial Vehicle
UN United Nations
UNDP United Nations Development Programme
UNHAS United Nations Humanitarian Air Service
UNHCR United Nations High Commissioner for Refugees
UNICEF United Nations Children's Fund
UNISDR United Nations International Strategy for Disaster Reduction
VAM Vulnerability Analysis and Mapping
WASH Water, Sanitation and Hygiene
WFP World Food Programme

Return on Investment for Emergency Preparedness Study 79
January 2015
15. BIBLIOGRAPHY
BCG projects. 2014. Enabling Global Scaling of C&V—Integrated Business Case (work in
progress)
BCG projects. 2012. PREP—Generic Response Capability Model
BCG projects. 2012. African Risk Capacity: Closing One of the Biggest Loops in
Emergency Aid. Business Model and Impact
BCG projects. 2011. PREPARE: Regional Food Reserves for Africa in Response to High
and Volatile Food Prices
BCG projects. 2007. The Asia Emergency Preparedness and Response Concept
Benson, C. 1998. The Cost of Disasters. Development at Risk? Natural Disasters and the
Third World. J. Twigg (ed.). Oxford, Oxford Centre for Disaster Studies, UK National
Coordinated Committee for the International Decade for Natural Disaster Reduction
(IDNDR): 8–13
Burton, C. and C.C. Venton. 2009. Case Study of the Philippines National Red Cross:
Community Based Disaster Risk Management Programming. IFRC
DFID. 2011. Defining Disaster Resilience: A DFID Approach Paper
EM-DAT: The International Disaster Database, 2014. Country Profiles. Centre for
Research on the Epidemiology of Disasters – CRED. http://www.emdat.be/country-profile
FAOSTAT, 2012. Food and Agricultural Commodities Production/Countries by
Commodity. http://faostat3.fao.org/browse/rankings/countries_by_commodity/E
Godschalk, D.R., A. Rose, E. Mittler, K. Porter, and C.T. West. 2009. Estimating the
Value of Foresight: Aggregate Analysis of Natural Hazard Mitigation Benefits and Costs.
Journal of Environmental Planning and Management, vol. 52, no. 6, pp. 739–756
Guha-Sapir D. et al. 2012. Annual Disaster Statistical Review 2012 – The Numbers and
Trends. CRED/IRSS/UCL
Hallegatte, S. 2012. Perspective Paper: Natural Disasters. For the Copenhagen
Consensus. World Bank
IFRC, 2012. Focus on Reducing Risk. World Disaster Report
Khan F., D. Mustafa, D. Kull 2008. Evaluating the Costs and Benefits of Disaster Risk
Reduction under Changing Climatic Conditions: A Pakistan Case Study. From Risk to
Resilience, Working Paper 5
Kandji, T., L. Verchot, and J. Mackensen. 2006. Climate Change and Variability in the
Sahel Region: Impacts and Adaptation Strategies in the Agricultural Sector. World
Agroforestry Centre (ICRAF) and United Nations Environment Programme (UNEP)
Kelman, I. 2014. Disaster Mitigation is Cost Effective. World Development Report
Kent, R. 1994. Disaster Preparedness, UNDP/DHA Disaster Training Programme, 2nd
Edition
Kull, D., R. Mechler, and S. Hochrainer. 2013. Probabilistic Cost-Benefit Analysis of
Disaster Risk Management in a Development Context. Disasters, forthcoming

Return on Investment for Emergency Preparedness Study 80
January 2015
Kunreuther, H. and E. Michel-Kerjan. 2012. Challenge Paper: Natural Disasters. Policy
Options for Reducing Losses from Natural Disasters: Allocating $75 billion. Revised
version for the Copenhagen Consensus. Center for Risk Management and Decision
Processes, The Wharton School, University of Pennsylvania
Mechler, R. 2005. Cost-Benefit Analysis of Natural Disaster Risk Management in
Developing Countries. Sector Project "Disaster Risk Management in Development
Cooperation", German Federal Ministry for Economic Cooperation and Development
Mechler, R. et al. 2008. Uttar Pradesh Drought Cost-Benefit Analysis, India. From Risk to
Resilience, Working Paper 5
Moench, M. 2008. Understanding the Costs and Benefits of Disaster Risk Reduction
under Changing Climatic Conditions. From Risk to Resilience, Working Paper 9
Newhall, C., J.A. Hendley II, and P.H. Stauffer. 1997. Reducing the Risk from Volcano
Hazards: Benefits of Volcano Monitoring Far Outweigh Costs—The Case of Mount
Pinatubo. U.S. Geological Survey Fact Sheet 115–97
OCHA on behalf of the Humanitarian Country Team (HCT). 2014, Humanitarian Country
Team Strategic Plan – Pakistan.
OCHA on behalf of the Humanitarian Country Team (HCT). 2014, Preliminary Response
Plan – North Waziristan (1 July 2014–31 December 2014)
OECD . 2014. International Development Statistics (IDS) online databases.
http://www.oecd.org/dac/stats/idsonline.htm
Offenheiser, R. 2014. Time for an Alternative Humanitarian Response Funding Model.
Devex, 17 December. https://www.devex.com/news/time for-an-alternative-humanitarian-
response-funding-model-85129
Subbiah, 1.R., L. Bildan, and R. Narasimhan. 2008. Background Paper on Assessment of
the Economics of Early Warning Systems for Disaster Risk Reduction. The World Bank
Group Global Facility for Disaster Reduction and Recovery (GFDRR)
Twigg, J. 2004. Disaster Risk Reduction: Mitigation and Preparedness in Development
and Emergency Programming, Good Practice Review (Humanitarian Practice
Network/Overseas Development Institute)
UNICEF. 2010. The Core Commitments for Children in Humanitarian Action
UNICEF. 2011. Independent Review of UNICEF's Operational Response to the January
2010 Earthquake in Haiti
UNICEF. 2012. UNICEF Madagascar – Kit d'information
UNICEF. 2012. UNICEF's Response to the Emergency in the Horn of Africa 2011–2012:
Lesson-Learning Exercise, Final Report – Summary
UNICEF. 2013. DFID Humanitarian Programme Framework, Strengthening Humanitarian
Preparedness in High Risk Countries, Proposal prepared by UNICEF and WFP for DFID
UNICEF. 2013. Early Warning Early Action Annual Report [Excel and Word document]
UNICEF. 2013. Evaluation of UNICEF's Emergency Preparedness Systems
UNICEF. 2013. Multilateral Aid Review Update – Driving Reform to Achieve Multilateral
Effectiveness, DFID

Return on Investment for Emergency Preparedness Study 81
January 2015
UNICEF. 2013. Strategic Response Plan to Typhoon Haiyan (Yolanda), Disaster
Response and Building Resilience in the Philippines
UNICEF. 2013. UNICEF Humanitarian Action Study
UNICEF. 2014. Assessment of L3 Support Mechanisms for UNICEF's Response to the
CAR Crisis
UNICEF. 2014. Child-Centred Risk Assessment – Regional Synthesis of UNICEF
Assessments in Asia
UNICEF. 2014. IASC Early Warning Report
UNICEF. 2014. Real-Time Evaluation of UNICEF Response to Typhoon Haiyan
UNICEF. 2014. Output 3 Midyear Update, UNICEF/WFP Presentation to DFID
UNICEF. 2014. Work Plan for DFID 2 [Chad, Madagascar and Pakistan]
UN interagency Index for Risk Management (InfoRM), 2015. InfoRM_2015_v304
UNISDR. 2014. Definition of Disaster Types. http://www.desinventar.net/definitions.html
United Nations High Commissioner for Refugees (UNHCR), 2014. UNHCR Statistical
Online Population Database. www.unhcr.org/statistics/populationdatabase
Venton, C.C. et al. 2012. The Economics of Early Response and Disaster Resilience:
Lessons from Kenya and Ethiopia. DFID
Venton, C.C. et al. 2013. The Economics of Early Response and Disaster Resilience:
Lessons from Kenya and Mozambique. DFID
Venton, C.C. et al. 2013. The Economics of Early Response and Disaster Resilience:
Approach and Methodology. DFID
Venton, C.C. and L. Coulter. 2013. The Economics of Early Response and Resilience:
Lessons from Niger. DFID
Venton, C.C. and S. Majumder. 2013. The Economics of Early Response and Resilience:
Lessons from Bangladesh. DFID
WFP. 2011. Update on Implementation of WFP's Policy on Vouchers and Cash Transfers
WFP. 2012. Emergency Preparedness and Response Package, 1st Edition
WFP. 2012. P4P Purchase for Progress – A Primer
WFP. 2012. Preparedness and Response Enhancement Programme, Towards a New
Response Model
WFP. 2012. PREP – WFP's Emergency Preparedness and Response Enhancement
Programme
WFP. 2013. Annual Evaluation
WFP. 2013. Emergency Preparedness and Response Branch
WFP. 2013. Emergency Response Classifications
WFP. 2013. Protecting Asia's Most Vulnerable, WFP and Social Safety Nets in Asia
WFP. 2014. Countries Concept of Operations [12 countries and 3 regions]
WFP. 2014. Early Warning Reports [4]
WFP. 2014. IASC Applying the System-wide Emergency Activation ('L3 activation') to
Slow-onset and Protracted Humanitarian Crises

Return on Investment for Emergency Preparedness Study 82
January 2015
WFP. 2014. IASC Common Framework for Preparedness
WFP. 2014. Level 2 and 3 Emergencies, Historical Information [Excel document]
WFP. 2014. Return on Emergency Preparedness Investment Study: Suggested
Framework of Analysis, DFID
WFP. 2014. Strengthening Humanitarian Preparedness in High Risk Contexts, Business
Case and Intervention Summary, DFID
WFP. 2014. WFP Response in the Flood Emergency in Paraguay
Woodruff, A. 2008. Samoa Technical Report – Economic Analysis of Flood Risk
Reduction Measures for the Lower Vaisigano Catchment Area. EU EDF – SOPAC Project
Report 69g Reducing Vulnerability of Pacific ACP States
World Bank, 2014. Poverty Headcount Ratio at 1.25$ a Day (PPP).
http://data.worldbank.org/indicator/SI.POV.DDAY