unicredit bank ag · this registration document replaces and supersedes the registration document...
TRANSCRIPT

This document constitutes a registration document (the "Registration Document") of UniCredit Bank AG within
the meaning of section 12 (1) of the German Securities Prospectus Act (Wertpapierprospektgesetz – "WpPG") in
connection with Art. 14 and Annex XI of the Commission Regulation (EC) No. 809/2004 of 29 April 2004 (the
"Regulation"). This Registration Document replaces and supersedes the Registration Document dated 20 May
2009.
UniCredit Bank AG
Munich, Federal Republic of Germany
20 May 2010

- 2 -
TABLE OF CONTENTS
Risk Factors ........................................................................................................................................................... 4
Risks relating to UniCredit Bank AG ................................................................................................................. 4
Risks relating to HVB Group's Business ............................................................................................................. 5
Regulatory risks .................................................................................................................................................. 7
Responsibility Statement ...................................................................................................................................... 9
UniCredit Bank AG ............................................................................................................................................ 10
Information about HVB, the parent company of HVB Group .......................................................................... 10
Auditors ............................................................................................................................................................. 10
Ratings .............................................................................................................................................................. 10
Recent Developments........................................................................................................................................ 11
Business Overview............................................................................................................................................... 12
Divisions of HVB Group .................................................................................................................................. 12
Principal Markets .............................................................................................................................................. 13
Administrative, Management and Supervisory Bodies ..................................................................................... 14
Major Shareholders ........................................................................................................................................... 15
Selected Consolidated Financial Information ................................................................................................... 15
Legal Risks/Arbitration Proceedings ................................................................................................................ 20
General Information ........................................................................................................................................... 24
Availability of Documents ................................................................................................................................ 24
Significant Changes in HVB's Financial Position and Trend Information ........................................................ 24
Information incorporated by reference .............................................................................................................. 24
Documents incorporated by reference ............................................................................................................... 24
Audited consolidated financial statements of HVB as at 31 December 2009 (IFRS) ................................... F-1
Consolidated Income Statement ....................................................................................................................... F-1
Balance Sheet ................................................................................................................................................... F-3
Statement of Changes in Shareholders' Equity ................................................................................................. F-5
Cash Flow Statement........................................................................................................................................ F-7
Notes to the Consolidated Financial Statements .............................................................................................. F-9
Cash Flow Statement........................................................................................................................................ F-7
Auditor's Report ............................................................................................................................................. F-88
Audited financial statements of HVB as at 31 December 2009 (HGB) ........................................................ F-89
Income Statement of UniCredit Bank AG ..................................................................................................... F-89
Balance Sheet of UniCredit Bank AG ............................................................................................................ F-91
Notes .............................................................................................................................................................. F-97
Auditor's Report ........................................................................................................................................... F-126
Unaudited consolidated financial statements of HVB as at 31 March 2010 (IFRS) ................................. F-127
Corporate Performance ................................................................................................................................ F-127
Consolidatde Income Statement ................................................................................................................... F-137
Balance Sheet ............................................................................................................................................... F-139

- 3 -
Statement of Changes in Shareholders' Equity ............................................................................................. F-141
Selected Notes .............................................................................................................................................. F-143
Signature page ................................................................................................................................................... Z-1
- 4 -
RISK FACTORS
The following is a disclosure of risk factors (the "Risk Factors") that are material with respect to the ability of
UniCredit Bank AG ("HVB", and together with its consolidated subsidiaries, the "HVB Group") to fulfill its
obligations under securities issued by it. Prospective investors should consider these Risk Factors before
deciding to purchase securities issued by HVB, especially since in certain cases the investor may lose his entire
investment or (substantial) parts of it.
Prospective investors should consider all information provided in this registration Document and consult with
their own professional advisers (including their financial, accounting, legal and tax advisers) if they consider it
necessary. In addition, prospective investors should be aware that the risks described below may arise
individually or cumulatively with other risks and might have mutually reinforcing effects.
(Note: Terms and expressions defined in other parts of this Registration Document and not otherwise defined in
the Risk Factors shall have the same meanings in this part of the Registration Document.)
Risks relating to UniCredit Bank AG
Issuer risk
By purchasing the financial instruments issued by HVB, investors are financing the latter. As a result investors
are subject to the risk that HVB is not able to honour its obligations relating to financial instruments where its
financial condition will become negative. At the date of this Registration Document the financial condition of
HVB is such that HVB is able to honour its obligations relating to financial instruments.
Risks related to the transfer of the Bank Austria Creditanstalt shares to UniCredit
The transfer at the beginning of 2007 of the investments in Bank Austria Creditanstalt (later on renamed as
UniCredit Bank Austria AG) ("Bank Austria") and other units in Central and Eastern Europe to UniCredit
S.p.A., Rome ("UniCredit", and together with its consolidated subsidiaries, the "UniCredit Group"), resulted in
substantial sales proceeds, but if – contrary to the expectations of the Management Board of HVB – the transfer
of the shares in the Bank Austria Group and the other units in Central and Eastern Europe sold by HVB must be
reversed, so that HVB must repay the proceeds from the sale to the buyers of the units, this would likely have
serious detrimental effects on the expansion strategy pursued by HVB Group because it would then no longer
have the high capital base and liquidity needed for this strategy.
Moreover, as a result of the disposal of the Bank Austria Group and the operations in Central and Eastern
Europe, HVB Group now has a stronger regional focus on Germany, which exposes it to developments on the
German market and the German economy.
Risks from the financial markets crisis and global economic crisis
The Markets & Investment Banking ("MIB") division1 suffered from declines or losses notably in structured
loans recorded in net trading income from the third quarter of 2007 up to the first quarter 2009.
The subprime crisis originated from the United States of America and started in second half of 2007. Triggered
by the loss in value of asset-backed papers based on subprime mortgages in the United States of America, there
was a significant decrease in investors' appetite for risk, resulting in liquidity bottlenecks on the money market,
accompanied by a massive widening of credit spreads. Like the entire UniCredit Group, HVB Group has only a
slight direct exposure to the underlying U.S. real estate crisis.
The resulting financial market turbulence have also affected the European financial markets and meanwhile the
global economy. Especially several countries and several industry segments are in severe economic difficulties.
To a varying degree and extent, this has of course also affected the business operations and the profitability of
HVB Group, in particular in the MIB division in 2007 and 2008. These effects were most noticeable in
structured credit products held for trading purposes and in the syndicated finance market.
In general terms, there is a risk that the economic recovery that began in the second half of 2009 will not be
repeated to the same degree in 2010 and that economic conditions will remain difficult both worldwide and in
Germany. In particular, a weak trend in important sectors such as the automotive and automotive supply
industry, engineering and commercial real estate coupled with a rising unemployment rate could have a
detrimental effect on loan-loss provisions. Decreasing central bank liquidity and a flat yield curve could
negatively impact the capital markets and thus, indirectly, HVB's total revenues.
In general, the overall economic environment will be subject to numerous sources of uncertainty in 2010 and the
financial sector will continue to face major challenges during the year. For example, if HVB Group experiences
1 Since mid 2009, the former divisions of Corporates & Commercial Real Estate Financing and Markets & Investment Banking (MIB) have
been formally merged to form the new Corporate & Investment Banking Division (CIB) in HVB.

- 5 -
renewed turmoil on the financial markets, such as insolvencies in the financial sector or sovereign defaults, this
could have a negative effect on the assets, liabilities, financial position and profit or loss of HVB Group.
Tax implications – loss carry forwards
The use of the substantial tax loss carry forwards (in particular in HVB) depends on certain conditions, which
have to be fulfilled after the transfer of shares in HVB to UniCredit took place. If these conditions would not be
fulfilled the tax loss carry forwards at the time of the transfer of shares to UniCredit would get lost retroactively.
Risks relating to HVB Group's Business
A deterioration of HVB Group's ratings may pose significant risks for HVB Group's business
The recognition of impairment losses, unforeseen defaults of large borrowers, financial results or capital ratios
below expectations and a deterioration of the macro-economic environment in HVB Group's core markets may
result in a lowering of HVB Group's credit ratings. Also any deterioration of the credit ratings of UniCredit
Group and its subsidiaries might as well lead to a lowering of HVB Group's credit ratings. In view of the
continuing turbulence on financial markets and the further worsening of the global economic condition, the
financial sector ratings could be adjusted downwards in general. Should this development arise, this may well
mean that the ratings of HVB Group, UniCredit Group and their subsidiaries are affected.
Any deterioration of the credit ratings of HVB and related subsidiaries that are rated, for any reason, will result
not only in increased funding costs, but will also limit HVB Group's funding sources and impact its liquidity.
In addition, rating downgrades may limit HVB Group's ability to conduct certain businesses, including
strategically productive ones, and may have a considerable negative impact on the HVB Group. Such a change in
the rating could make it harder to tap the capital markets, with higher funding costs having a negative effect on
the assets, liabilities, financial position and profit or loss of HVB Group.
Moreover, the lowering of HVB Group's credit ratings may also affect the liquidity and the price of the
Instruments to be issued.
Disruptions on financial markets potentially impact the liquidity situation of HVB Group
As market participant with global activities HVB Group is exposed to the general risk of disruptions on financial
markets. As a consequence there might be the situation that HVB has to refinance assets at significantly
increased funding costs. Longer lasting market tension might lead to an elevated liquidity risk situation caused
by a lack of available funding sources.
Loan losses may exceed anticipated levels
HVB Group is a major lender to several large corporate customers that have filed for the initiation of insolvency
proceedings in the past years or are undergoing restructuring. There is the risk that HVB Group may require
provisions for losses on loans and advances or incur loan losses in excess of the budgeted amounts.
HVB Group is a major lender to large corporate customers, banks and financial institutions in Germany and
other countries. The number of insolvencies to be expected in the future among HVB Group customers is
unpredictable. If such number exceeds the anticipated levels, HVB Group may require provisions for losses on
loans and advances or incur loan losses in excess of the budgeted amounts.
In such scenarios, loan losses may exceed anticipated levels.
Risks related to market implementations
Investors are relying upon the creditworthiness of the HVB Group and the results of the HVB Group are affected
by general economic, financial and other business conditions. During recessionary periods, there may be less
demand for loan products and a greater number of HVB Group's customers may default on their loans or other
obligations. Interest rate rises may also have an impact on the demand for mortgages and other loan products.
Fluctuations in interest rates in Europe and in the other markets in which the HVB Group operates influence the
HVB Group's performance.
Competition risk
Both investment banking and the financial services market in Germany represent highly competitive
environments. In its core German market, the corporate group competes with public-sector banks, cooperative
banks and other German and international private banks; certain of the public-sector banks can still call upon
state guarantees for some of their operations.
This may possibly have a negative impact on the assets, liabilities, financial position and profit or loss of the
corporate group.

- 6 -
In particular cyclical effects and unexpected fluctuations on international financial and securities markets have a
stronger impact in this environment. If the developments in these markets run counter to the expectations of
HVB Group, this would impose a heavier burden on HVB's results than in previous years. This means that such
swings could be reflected more visibly in the assets, liabilities, financial position and profit or loss of the
corporate group.
HVB Group may not be able to further successfully implement its pricing strategy and improve interest margins
in the current competitive environment. Failure to improve interest margins or maintain them at current level
may have a significant negative impact on the HVB Group's results of operations and financial condition.
Non-traditional banking activities add to credit risks
Like other banks, HVB Group is exposed to the risk that third parties who owe HVB Group money, securities
and other assets will not perform their obligations. Many of HVB Group's businesses activities beyond the
traditional banking business of lending and deposit-taking also expose it to credit risk.
Non-traditional credit risk can, for example, arise from: holding securities of third parties; entering into
derivative contracts under which counterparties have obligations to make payments to HVB Group entities;
executing securities, futures, currency or commodity trades that fail to settle at the required time due to non-
delivery by the counterparty or systems failure by clearing agents, exchanges, clearing houses or other financial
intermediaries and extending credit through other arrangements.
HVB Group's risk management strategies and techniques may leave HVB Group exposed to unidentified
or unanticipated risks
Risk management strategies and techniques may fail under some circumstances, particularly if HVB Group is
confronted with risks that it has not identified or anticipated. Some of HVB Group's methods for managing risk
are based upon observations of historical market behavior and on statistical models. HVB Group may experience
material unexpected losses if the measures used to assess and mitigate risk proved insufficient.
Tax implications – new types of tax to make banks contribute to the cost of the financial crisis
Several ways of making banks contribute to the cost of the financial crisis are currently being discussed
internationally. Things like a general levy on financial institutions, taxes on proprietary trading activities, taxes
on financial transactions and taxes on variable elements of remuneration paid to bank employees with
comparatively high incomes are being cited. Actual draft laws are already being promoted in individual countries
(taxes on elements of remuneration already implemented e.g. in United Kingdom). The major industrialised
nations are currently discussing all possible measures to agree upon a coordinated approach. Besides extracting a
contribution to the costs, these measures also have a political purpose. HVB Group could face additional costs,
should any of these issues currently under discussions actually be translated into new tax laws.
IT risks
The introduction of a new IT platform is generally one of the most challenging tasks for a bank, engendering
greater operational risks on account of its size and complexity per se and hence entailing great responsibility
towards employees and customers alike. At the end of April 2010 it was decided to again postpone the launch
date of EuroSIG, UniCredit Bank AG’s new IT platform, in order to reinforce security and reliability features for
both customers and employees. Currently some mandatory requirements have to be carried out with manual
process activities as they are not fully automated installed in today’s UniCredit Bank AG’s IT systems. EuroSIG
will provide state-of-the-art IT support as soon as it is implemented. Up to this time the business is manageable
as all actual systems are continuously running.
Although major milestones have been achieved at all project levels – in particular in adapting sales and
customer-related applications – it is intended to carry out additional tests and to make further improvements on
the basis of these tests. These improvements will be implemented speedily and the launch itself will take place as
soon as possible. Before the launch, eight criteria must be fulfilled in full. These are aimed at reducing the
heightened operational risks that go hand-in-hand with any major project of this dimension.
HVB Group is exposed to German economy
Given the situation with Germany as the regional core market, HVB is more heavily exposed to economic and
political developments in Germany. HVB Group is one of the largest lenders to the German Mittelstand and one
of the leading providers of personal and business loans in Germany.
If the economy performs below expectations, HVB cannot preclude the possibility that the customers of HVB
Group will also feel the effects of the crisis, and that loan-loss provisions could increase above the expected
level.
Difficult market situations can add to volatitlity in HVB Group's income

- 7 -
HVB Group is responsible for the regional management of the German market and is also the centre of
competence for the markets and investment banking operations of UniCredit Group. This gives rise to a
balanced, solid business model built around several pillars. Depending on developments on external markets, it
is possible that imbalances in earnings contributions may arise.
The strategic objective of HVB's Corporate & Investment banking division is to be a leading, integrated
European corporate and investment bank, offering its customers added value through specific relationship
models geared to customer individual needs. Despite the customer-oriented approach of its investment banking
activities and the gradual elimination of proprietary trading, income naturally remains relatively volatile.
Although investment banking is very profitable in a normal market environment, it is subject to increased
income risks in difficult market situations.
HVB Group's income can be volatile related to trading activities and currency exchange
HVB Group's trading income can be volatile and is dependent on numerous factors beyond HVB Group's
control, such as the general market environment, overall trading activity, equity prices, interest rate and credit
spread levels, fluctuations in exchange rates and general market volatility.
HVB will in short time take over significant parts of the markets and investment banking activities of Bank
Austria/UniCredit CAIB AG ("CAIB"), including Bank Austria’s markets activities and the London based
brokerage subsidiary CAIB UK. The acquisition of the shares in CAIB will be followed by a cross-border-
merger into UniCredit Bank AG and some weeks later the technical integration. This integration leads to further
concentration of the markets- and investmentbanking business of UniCredit Group in HVB and could increase
HVB Group’s trading income volatility.
HVB Group generates a significant amount of its income and incurs a significant amount of its expenses outside
the Eurozone, and therefore is exposed to currency risk.
Real estate finance slowdown could have a negative influence on the financial position and profitability of
HVB Group.
In recent years, HVB Group has considerably reduced its real estate financing portfolio, particularly commercial
real estate financing, and adjusted its valuation method for collateral. Another sharp decline in real estate
markets could have a negative impact on the financial position and profitability of HVB Group.
In accordance with the generally conservative lending policy of HVB Group, HVB does not intend to increase
the direct involvement of HVB Group in real estate financing with subprime features in 2010 either, so that the
direct risk from subprime exposures will remain marginal in the future as well.
Litigation risks
The HVB Group is involved in various legal proceedings (litigation and investigatory measures). HVB believes
that such proceedings have been properly analysed by the HVB Group in order to decide whether any increase in
provisions for litigation is necessary or appropriate under the current circumstances.
Regulatory risks
The regulatory environment for HVB Group may change; non-compliance with regulatory requirements
may result in enforcement measures
HVB Group's operations are regulated and supervised by the central banks and regulatory authorities in each of
the jurisdictions where it conducts business. The bank regulatory regimes in the various local jurisdictions are
subject to change. Changes in the regulatory requirements in a relevant jurisdiction may impose additional
obligations on HVB Group companies. In addition, compliance with the revised regulatory requirements may
result in a significant increase in administrative expenses which may have an adverse impact on HVB Group's
financial condition and results of operations.
There is a risk that in the case of a repeated violation of the regulatory requirements in any relevant jurisdiction,
the banking license granted to a company of the HVB Group in such jurisdiction will be revoked or limited.
In Germany, HVB Group is regulated by the German Federal Financial Supervisory Authority (Bundesanstalt
für Finanzdienstleistungsaufsicht – "BaFin"). BaFin has a wide range of enforcement powers in the event it
discovers any irregularities. Among other things, if HVB's or HVB Group's own funds or liquidity requirements
do not meet the statutory minimum requirements, BaFin may prohibit HVB Group from extending further
credits. Should there be a risk that a bank may not be able to perform its obligations vis-à-vis its creditors, BaFin
may, for the purpose of avoiding such risk, impose a so-called moratorium on the German banking subsidiaries
of HVB Group in accordance with section 46a of the German Banking Act (Gesetz über das Kreditwesen), i.e.
prohibit the disposal of assets and the making of payments, impose the closing down of a bank's business with
customers and prohibit the acceptance of payments not intended for the discharge of debts owed to the bank.

- 8 -
Should the HVB Group or one of its subsidiaries not comply fully with the regulatory demands of the
supervisory authorities, this could lead to sanctioning measures, in particular by BaFin. At worst, the business
capabilities of the HVB Group and its subsidiaries could be restricted as a result.
Uncertainty about macro-economic developments and risks from increasingly stringent regulatory
requirements
The international discussion about the future regulatory environment for banks has many facets and the outcome
is hard to assess at present in terms of complexity and cumulative effect. The regulatory environment will be
tightened up across the board as a consequence of the financial crisis. It is possible, for instance, that the required
core capital ratio will be raised and further regulatory ratios introduced. Besides increasing funding costs, the
cost of implementing regulatory requirements and for updating IT systems accordingly will also rise in this
context. At worst, this could weaken HVB Group's strong capital base.

- 9 -
RESPONSIBILITY STATEMENT
UniCredit Bank AG having its registered office at Kardinal-Faulhaber-Strasse 1, 80333 Munich ("HVB", acting
through its head office or one of its foreign branches) accepts responsibility for the information contained in this
Registration Document. UniCredit Bank AG declares that the information contained in this Registration
Document is, to the best of its knowledge, in accordance with the facts and that no material information has been
omitted.

- 10 -
UNICREDIT BANK AG
Information about HVB, the parent company of HVB Group
UniCredit Bank AG, formerly Bayerische Hypo- und Vereinsbank Aktiengesellschaft ("HVB", and together with
its consolidated subsidiaries, the "HVB Group") was formed in 1998 through the merger of Bayerische
Vereinsbank Aktiengesellschaft and Bayerische Hypotheken- und Wechsel-Bank Aktiengesellschaft. It is the
parent company of HVB Group, which is headquartered in Munich. HVB has been an affiliated company of
UniCredit S.p.A., Rome ("UniCredit", and together with its consolidated subsidiaries, the "UniCredit Group").
since November 2005 and hence a major part of the UniCredit Group from that date as a sub-group. UniCredit
holds directly 100% of HVB's share capital.
HVB has its registered office at Kardinal-Faulhaber-Strasse 1, 80333 Munich and is registered with the
Commercial Register at the Lower Court (Amtsgericht) in Munich under number HRB 42148, incorporated as a
stock corporation under the laws of the Federal Republic of Germany. It can be reached via telephone under
+49-89-378-0 or via www.hvb.de.
As a result of the integration into the UniCredit Group, the activities of HVB have been restructured in the
following divisions: Corporate & Investment Banking, Retail and Private Banking.
Through these divisions, HVB offers a comprehensive range of banking and financial products and services to
private and corporate clients including multinationals, public sector and institutional customers.
Since 2006, HVB strategy was refocused. Thus, in 2007, the completion of the sale of shares held by HVB in
today's UniCredit Bank Austria AG ("Bank Austria") was an important step. Similarly, HVB sold its Russian,
Lithuanian, Latvian, and Estonian business to Bank Austria as well as its participation in today's Joint Stock
Commercial Bank Ukraine to Bank Pekao, a subsidiary of UniCredit.
With its new alignment, HVB focuses on the financial services market in Germany and on the investment
banking business worldwide.
In 2007, HVB took on most of the markets and investment banking activities of UniCredit Banca Mobiliare
S.p.A. ("UBM"), the investment banking subsidiary of UniCredit, and acquired in 2008 the investment banking
activities of Capitalia S.p.A. and its subsidiary, Banca di Roma S.p.A., purchased by UniCredit in the year 2007.
A further major step to concentrate the markets and investment banking business of UniCredit Group in HVB
was the acquistion of UniCredit CAIB AG including its subsidiary CAIB UK, London. The transfer of the shares
will be followed by a cross-border merger of UniCredit CAIB AG into HVB. Closing of integration is envisaged
to be completed in the third quarter 2010.
Auditors
KPMG AG Wirtschaftsprüfungsgesellschaft ("KPMG"), Ganghoferstrasse 29, 80339 Munich, the independent
auditors (Wirtschaftsprüfer) of HVB have audited the consolidated financial statements of HVB Group and the
unconsolidated financial statements of HVB as of and for the years ended 31 December 2009 and 2008 and have
issued an unqualified audit opinion thereon. KPMG is a member of the Chamber of German Public Accountants,
an institution incorporated under public law (Wirtschaftsprüferkammer, Anstalt des Öffentlichen Rechts),
Rauchstrasse 26, 10787 Berlin.
Ratings
Unless otherwise specified in the applicable final terms, securities currently issued by HVB have been rated as
follows by Fitch Ratings Ltd. ("Fitch"), Moody's Investors Service Ltd. ("Moody's") and Standard & Poor's
Ratings Services ("S&P"):
Type of Instruments Fitch Moody's S&P
Public Sector Pfandbriefe AAA Aaa AAA
Mortgage Pfandbriefe AAA Aa1 ---
Long-term Senior Notes A+ A1 A
Subordinated Notes A A2 A-
Short-term Notes F1+ P-1 A-1
Instruments to be issued under the Programme may be rated or unrated. Where an issue of Instruments is rated,
its rating may not be the same as the rating applicable to the Programme.
A rating is not a recommendation to buy, sell or hold securities and may be subject to suspension, reduction or
withdrawal at any time by the assigning rating agency.

- 11 -
Fitch's long-term credit ratings are set up along a scale from AAA, AA, A, BBB, BB, B, CCC, CC, C down to D.
Fitch uses the intermediate modifiers "+" and "-" for each category between AA and CCC to show the relative
standing within the relevant rating categories. Fitch's short-term ratings indicate the potential level of default
within a 12-month period at the levels F1+, F1, F2, F3, F4, B, C and D.
Moody's appends long-term obligation ratings at the following levels: Aaa, Aa, A, Baa, Ba, B, Caa, Ca and C.
To each generic rating category from Aa to Caa Moody's assigns the numerical modifiers "1", "2" and "3". The
modifier "1" indicates that the bank is in the higher end of its letter-rating category, the modifier "2" indicates a
mid-range ranking and the modifier "3" indicates that the bank is in the lower end of its letter-rating category.
Moody's short-term ratings are opinions of the ability of issuers to honor short-term financial obligations and
range from P-1, P-2, P-3 down to NP.
S&P assign long-term credit ratings on a scale from AAA to D. The ratings from AA to CCC may be modified
by the addition of a "+" or "-" to show the relative standing within the major rating categories. S&P may also
offer guidance (termed a "credit watch") as to whether a rating is likely to be upgraded (positive), downgraded
(negative) or uncertain (neutral). S&P assigns short-term credit ratings for specific issues on a scale from A-1,
A-2, A-3, B, C down to D. Within the A-1 category the rating can be designated with a "+".
HVB confirms that the information contained in this section "Ratings" has been accurately reproduced and that
as far as HVB is aware and is able to ascertain from information published by Fitch, Moody's and S&P,
respectively, no facts have been omitted which would render the reproduced information inaccurate or
misleading.
Recent Developments
Change of Legal Name of the Issuer
With effect of 15 December 2009 HVB has changed its legal name from "Bayerische Hypo- und Vereinsbank
Aktiengesellschaft" to "UniCredit Bank AG". The brand name "HypoVereinsbank" has not changed.
Acquisition of markets operations of Bank Austria/CAIB
The Supervisory Board of HVB has approved the purchase of significant parts of the markets and investment
banking activities of Bank Austria/UniCredit CAIB AG ("CAIB"), including Bank Austria’s markets activities
and the London based brokerage subsidiary CAIB UK. This is a further major step to concentrate the markets-
and investment banking business of UniCredit Group in HVB. Following the decision of the Supervisory Board
the share purchase agreement regarding all shares in CAIB was signed 19/22 February 2010. The total
consideration for all shares in CAIB comprises the agreed purchase price of EUR 1.24 billion, established with
reference to an expert valuation opinion provided by an independent external adviser, plus the excess capital
from CAIB on completion of the purchase contract. The transaction is expected to close on 1 June 2010, subject
to necessary regulatory approvals.
Immediately after transfer of the shares in CAIB to HVB, CAIB is to be merged cross border into HVB. The
merger is expected to be registered start of the third quarter 2010 and will be followed by the operational
integration of all markets acticities of former CAIB into HVB.
The further access of HVB to markets product lines, i.e. the flow business with all retail and corporate customers
of Bank Austria and bank book business, will be goverend by a cooperation agreement concluded between Bank
Austria and HVB under which HVB will provide services to Bank Austria consisting of the closing of measured
open market risk positions of Bank Austria and the provision of brokerage services. HVB will serve as exclusive
partner and prime broker of Bank Austria in relation to the services mentioned.

- 12 -
BUSINESS OVERVIEW
Divisions of HVB Group
The market-related activities of HVB Group are divided into the following globally active divisions: Corporate
& Investment Banking, Retail and Wealth Management (renamed Private Banking as of 1 April 2010).
Also shown is an "Other/consolidation" segment that covers Global Banking Services ("GBS") and Group
Corporate Centre activities and the effects of consolidation.
Largely the same principles used at year-end 2008 are being applied in 2009. As of 1 January 2009, HVB started
using risk-weighted assets compliant with Basel II as the criterion applied to allocate tied equity capital. The
interest rate used to assess the equity capital allocated to the companies assigned to several divisions (HVB,
UniCredit Luxembourg S.A.) was 3.97% in 2008. This rate was determined for 2009 and, since 1 January 2009,
amounts to 4.30%. This rate was redetermined 2010 and has been 4.09% since 1 Januar 2010.
Corporate & Investment Banking division
The Corporates & Commercial Real Estate Financing and Markets & Investment Banking divisions have been
reorganised and consolidated to form a new division known as Corporate & Investment Banking ("CIB"). This
move is intended to help HVB evolve into an integrated corporate and investment bank and can also be viewed
as a consequence of the financial and economic crisis. The investment banking products have been revised to
make them more accessible for customers and the customer relationship is more fully emphasised. The formation
of CIB serves to secure a standardised business logic, a stricter, more uniform process and management
environment, and an increase in efficiency.
In the new organisational structure, four independent product units act as suppliers of specialised products for the
regional distribution network in corporate banking and for the other divisions. These are: Markets, Financing &
Advisory ("F&A"), Global Transaction Banking ("GTB") and Leasing. At the same time, Markets and F&A
represent the centres of competence within UniCredit Group.
HVB serves its approx. 78,000 corporate customers through its distribution network, concentrating on their
needs in areas such as restructuring, growth and cross-border expansion. HVB's customers in Germany include
corporations with revenues in excess of EUR 3 million, the public sector, commercial real estate customers and
institutionals. The corporate banking business provides various relationship models based on different customer
requirements.
CIB covers a broad range of banking services to corporate customers. Lending is, and is set to remain, HVB's
core business, associated with an appropriate proportion of its customers' other financial activities. HVB aims to
build stable, strategic business partnerships by leveraging physical and logical proximity, and providing advice
and solutions in both commercial and investment banking. HVB aims at actively driving and shaping strategic
issues with its customer as part of a dialogue. This also includes HVB's expertise in sector-specific underlying
conditions and developments.
HVB supports its customers through its European network. The division also has a presence in all the key
financial centres in the world.
HVB's market activities focus on the oversight of IPOs and capital increases, and the syndication of equities,
bond products and structured products. These operations are conducted primarily by the Equity Capital Markets
unit for equity products and structured products based on equities, and the Debt Capital Markets unit for debt
instruments such as corporate bonds, Pfandbriefs and debentures, and the associated risk transfer. The Corporate
Treasury Sales unit provides financial risk management involving a wide range of advisory services and products
covering the hedging of entrepreneurial risks, such as liquidity management (including asset management,
deposits and investments), foreign exchange and innovative derivatives.
F&A combines financing and advisory expertise in an integrated product platform. The broad range of structured
transactions in financing activities includes advising the customer on corporate strategy and, in M&A situations,
on acquisition and project loans, more complex transactions, syndications and subordinated capital. HVB's
shipping activities are also included in F&A.
GTB bundels HVB's competencies (product development and services) in e-business, cash management and
foreign trade financing. The Leasing unit covers a wide range of products from small contracts to special
financing solutions for larger transactions.
Major subsidiaries assigned to this division include UniCredit Luxembourg S.A., which is assigned to several
divisions, UniCredit Leasing Finance GmbH, HVB Global Assets Company L.P., HVB Capital Asia Ltd., and
HVB Capital Partners AG.
Retail division

- 13 -
HVB's customers are divided into three strategic target groups: mass market, affluents and business customers.
In order to tie customers to the bank, HVB serves the three target groups with different service models that are
aimed at reflecting their individual needs. The main aim in the mass-market target group is to increase product
penetration by providing demand-based advice and expanding online banking. HVB is also looking to secure
further growth in the target groups of affluents and business customers. To do so, HVB is continuing to invest in
systematic customer contact, refining both its needs-based approach and its products.
Wealth Management division (as of 1 April 2010 renamed Private Banking division)
The Private Banking division has set itself the goal of meeting the specific expectations of wealthy customers
with regard to a bank and the services it offers in line with demand. The division serves customers with an
aggregate investment volume of EUR 39 billion. The Private Banking division is divided into three subdivisions.
HVB Wealth Management (WEM) (as of 1 April 2010 renamed HVB Private Banking)
This unit serves more than 38,000 UniCredit Bank AG customers with assets under management of more than
EUR 21 billion. Its approx. 500 employees offer to customers and customer groups with liquid assets in excess
of EUR 0.5 million individual, personal advice at 43 locations throughout Germany. The Family Office serves
family groups with complex assets of more than EUR 30 million.
WEM's strategic objectives are to serve high net worth individuals with a wide range of advisory services,
products and customer relationships, and to increase its market share in the competitive wealth management
environment.
Wealth Management Capital Holding (WMC)
WMC structures and issues investment products that are tailored to the Wealth Management customer group.
Around 127,000 customers are served by approx. 230 employees in this unit.
UniCredit Luxembourg
HVB Banque Luxembourg S.A. was renamed UniCredit Luxembourg S.A. ("UniCredit Luxembourg") on
1 August 2009.
UniCredit Luxembourg provides access to the financial centre of Luxembourg for the customers of HVB Group.
Together with the HVB Wealth Management (HVB Private Banking) subdivision, UniCredit Luxembourg has
devised solutions that enable its customers to benefit from the advantageous underlying conditions offered by
Luxembourg as a financial centre. The Private Banking unit of UniCredit Luxembourg provides specialised
portfolio solutions for more than 13,000 customers with an investment volume of more than EUR 12 billion and
employs approx. 80 people.
Other/consolidation division
The "Other/consolidation" division encompasses Global Banking Services, Group Corporate Centre activities
and consolidation effects.
Global Banking Services
Global Banking Services activities encompass purchasing, organisation, logistics and facility management, cost
management and back-office functions for credit, accounts, foreign exchange, money market and derivatives.
Payments, securities services and IT application development and operation have been outsourced. The Special
Credit Portfolio ("SCP") defined in 2006 is also included together with the remaining holdings of customer
portfolio of Real Estate Restructuring.
Group Corporate Centre
The Group Corporate Centre activities include profit contributions that do not fall within the responsibility of the
individual divisions. Among other items, this includes the profits and losses of consolidated subsidiaries for
which HVB's strategic property management function is responsible, such as HVB Immobilien AG and its
subsidiaries, and of non-consolidated holdings, provided they are not assigned to the divisions, together with the
net income from securities holdings for which the Management Board is responsible. Also incorporated in this
segment are the amounts arising from decisions taken by management with regard to asset/liability management.
Principal Markets
HVB Group offers a wide range of banking and financial products and services to private, corporate and public-
sector customers, and international customers. Its range extends, for example, from mortgage loans, consumers
loans and banking services for private customers, business loans and foreign trade financing through to fund
products for a broad range of asset classes, advisory and brokerage services, securities transactions, liquidity and

- 14 -
financial risk management, advisory services for affluent customers and investment banking products for
corporate customers. HVB Group has a developed network of branches in Germany via which it serves its
customers. HVB is traditionally particularly strong in Bavaria and northern Germany with market shares of
around 15% in Bavaria, and around 10% in Hamburg and Lower Saxony.
HVB Group is well positioned in the German banking market, benefiting from the diversified total revenues of
the Corporate & Investment Banking, Retail and Wealth Management divisions.
In 2009, HVB adjusted its business model, in particular in the Corporates & Commercial Real Estate Financing
and Markets & Investment Banking divisions, to cater to changes in the market. Therefore, HVB launched the
new Corporate & Investment Banking division ("CIB") by merging the former Corporates & Commercial Real
Estate Financing division with the Markets & Investment Banking division. The new division focuses more
strongly on customers in all business sectors and their different requirements, and greater emphasis is placed on
the customer relationship overall.
Administrative, Management and Supervisory Bodies
Like all German stock corporations, UniCredit Bank AG has a two-tier board system. The Management Board
(Vorstand) is responsible for management and the representation of HVB with respect to third parties. The
Supervisory Board (Aufsichtsrat) appoints and removes the members of the Management Board and supervises
the Management Board's activities.
The members of the Management Board and the Supervisory Board of HVB may be reached at its business
address (UniCredit Bank AG, Kardinal-Faulhaber-Strasse 1, 80333 Munich, Germany).
As of the date of this Registration Document, the composition of the Management Board and of the Supervisory
Board of HVB and the functions and major activities performed by members of the Management Board outside
HVB and the principal occupations of the members of its Supervisory Board are as follows:
Management Board
Name Areas of Responsibility Membership of Statutory Supervisory Boards in
Germany outside HVB Group
Peter Buschbeck Retail -
Lutz Diederichs Corporate & Investment
Banking
Deutsche Schiffsbank AG, Bremen/Hamburg
Köhler & Krenzer Fashion AG, Ehrenberg
Rolf Friedhofen
(until 31 May 2010)
Chief Financial Officer HVB Trust Pensionsfonds AG, Munich
Heinz Laber Human Resources Management,
Global Banking Services
HVB Trust Pensionsfonds AG, Munich
Andrea Umberto
Varese
Chief Risk Officer -
Dr Theodor Weimer Board Spokesman ERGO Versicherungsgruppe AG, Düsseldorf
Andreas Wölfer Wealth Mangement
(as of 1 April 2010 renamed
Private Banking)
-
Supervisory Board
Name Principal Occupation
Sergio Ermotti, Collina d'Oro, Chairman Deputy CEO of UniCredit S.p.A.
Head of Corporate and Investment Banking & Private
Banking Strategic Business Area
Member of the Management Committee of UniCredit
S.p.A.
Peter König, Munich, Haar-Salmdorf, Deputy
Chairman(1)
Employee of UniCredit Bank AG
Dr Wolfgang Sprissler, Sauerlach, Deputy
Chairman
Former Board Spokesman of UniCredit Bank AG

- 15 -
Gerhard Bayreuther, Neubeuern(1)
Employee of UniCredit Bank AG
Aldo Bulgarelli, Verona Attorney and partner in law firm NCTM
Beate Dura-Kempf, Litzendorf(1)
Employee of UniCredit Bank AG
Paolo Fiorentino, Milan Deputy CEO of UniCredit S.p.A.
Head of Global Banking Services Strategic Area
Member of the Management Committee of UniCredit
S.p.A.
Giulio Gambino, Unterschleißheim(1)
Employee of UniCredit Bank AG
Klaus Grünewald, Gröbenzell(1)
FB1 unit manager in the Bavarian division of Vereinte
Dienstleistungsgewerkschaft
Karl Guha, Milan Chief Risk Officer
Member of the Management Committee of UniCredit
S.p.A.
Beate Mensch, Cologne(1)
Trade union secretary in the North Rhine-Westphalian
division of ver.di-Vereinte Dienstleistungsgewerkschaft,
unit 10
Dr Lothar Meyer, Bergisch-Gladbach Former Chairman of the Management Board of ERGO
Versicherungsgruppe AG
Marina Natale, Uboldo Chief Financial Officer
Member of the Management Committee of UniCredit
S.p.A.
Roberto Nicastro, Milan Deputy CEO of UniCredit S.p.A.
Head of Retail Strategic Business Area
Member of the Management Committee of UniCredit
S.p.A.
Panagiotis Sfeliniotis, Munich(1)
Employee of UniCredit Direkt Services GmbH
Professor Hans-Werner Sinn, Gauting President of the ifo-Institute for Economic Research
Jutta Streit, Augsburg(1)
Employee of UniCredit Bank AG
Michael Voss, Gröbenzell(1)
Employee of UniCredit Bank AG
Jens-Uwe Wächter, Himmelpforten(1)
Employee of UniCredit Bank AG
Dr Susanne Weiss, Munich Attorney and partner in law firm Weiss, Walter, Fischer-
Zernin
(1) Representative of Employees
As at the date of this Registration Document, there are no potential conflicts of interest between the duties to
HVB of the above-mentioned members of the Management Board and members of the Supervisory Board of
HVB and their private interests and/or other duties.
Major Shareholders
Following the completion of the squeeze-out, which took effect when entered in the Commercial Register at the
Lower Court (Amtsgericht) in Munich on 15 September 2008, UniCredit is the sole shareholder of HVB.
Selected Consolidated Financial Information
The selected consolidated financial data presented below are derived from and should be read in conjunction
with, the unaudited Interim HVB Group Financial Statements as of 31 March 2010.
Publication of the Interim Report as at 31 March 2010 (unaudited)
On 12 May 2010, HVB published its unaudited interim report as of 31 March 2010. The following statements
are taken from this report.

- 16 -
Significant events in the first quarter of 2010 and general comments on the business situation
Corporate acquisitions and sales
There were no significant corporate acquisitions and sales of HVB Group in the period under review.
Underlying conditions and general comments on the business situation
The global economy has recovered to some extent from the financial crisis. Stimulus packages around the world
and intervention by central banks helped to stabilise economic output in industrialised nations in the first quarter
of 2010. This holds particularly true for the United States and, to a limited degree, the euro area as well.
Exports have started to expand again noticeably in the euro area in general, and Germany in particular, which
has had a positive impact on growth. Short-time working arrangements and agreed reductions in working hours
have served to hold down trends in unemployment statistics. Compared with December 2009 (8.1%), the
unemployment rate fell to 7.8% in April 2010, especially against the backdrop of a revival in global demand.
Private consumption hardly increased at all. Inflation rose only slightly, to 1.1%.
The capital markets experienced contrary trends. Whereas the stockmarkets have recovered further since the start
of the year to reach roughly the same level as at the turn of the year, the credit markets have again been
dominated by widening spreads; notably among financial instruments issued by governments and banks. The
common currency - the euro - also came under pressure due to the high levels of public debt in some euro-zone
countries, although it was still worth far more than last year's low in the first quarter. Credit growth was low on
account of the persistently difficult economic environment and the associated reticence to invest. A high level of
bankruptcies in the corporate sector led to a need for higher write-downs to be taken.
HVB Group recorded a very good profit before tax of €694 million in the first quarter of 2010 (previous year:
€94 million) in a market environment that is still difficult overall, but one that has recovered tangibly since the
equivalent period last year. This represents the best quarterly result since the outbreak of the financial crisis in
the summer of 2008. The strong operating profit of €1,044 million is particularly pleasing as it follows on
seamlessly from the already good results of the preceding quarters. The total has more than doubled compared
with the year-ago figure of €452 million, which was still heavily affected by the financial crisis. Total revenues
increased by 45.7% year-on-year to €1,903 million. This was generated on the back of a sharp rise in total
revenues together with a massive increase in net fees and commissions totalling around 26%, together with a
good net trading profit of €440 million following on from a net trading loss of €261 million last year on account
of the fallout from the financial crisis. HVB Group's successful cost management programme resulted in
practically no change in its operating costs (up 0.6%) which, coupled with the good operating profit, led to a
significant improvement in the cost-income ratio to an excellent level, 45.1%. As expected, HVB Group's net
write-downs of loans and provisions for guarantees and commitments rose to €372 million after €283 million last
year on account of the difficult credit environment.
All the operating divisions contributed to the pleasing profit before tax of HVB Group in terms of both profit
before tax and improved earnings compared with the equivalent period last year. The very good earnings
performance was for the most part generated by the operations of the Corporate & Investment Banking division.
A sharp rise in net fees and commissions and a strong rebound in net trading income contributed to the
significant improvement in the total revenues recorded by this division. Despite a sharp year-on-year rise of 61%
in net write-downs of loans and provisions for guarantees and commitments to €344 million, the division
generated a profit before tax of €531 million, which is €454 million higher than the year-ago total of €77 million.
The Retail and Private Banking (formerly Wealth Management) divisions also managed to increase their profits
before tax year-one-year in the first quarter of 2010, despite the continued tangible reticence among investors.
The main factors contributing to the positive result were higher net fees and commissions and a more favourable
development in net write-downs of loans and provisions for guarantees and commitments.
HVB Group has succeeded in further bolstering its already excellent capital base in the light of the good results.
Thus, shareholders' equity rose by €0.5 billion over the total at year-end 2009, to €24.1 billion. As a result of
targeted deleveraging measures, the leverage ratio (ratio of total assets to shareholders' equity shown in the
balance sheet) of 15.7 at 31 March 2010 remained almost unchanged compared with the figure of 15.4 reported
at the end of December 2009.
The core capital ratio (Tier 1 ratio) in accordance with Basel II totalled 17.1% at 31 March 2010 after 17.8% at
year-end 2009, which continues to represent an outstanding level by both national and international standards.
HVB Group again enjoyed an adequate liquidity base and a solid financing structure in the first three months of
this year. The funding risk remained low on account of the broad funding base in terms of products, markets and
investor groups, meaning that adequate funding of HVB Group's lending operations was ensured at all times.
HVB' Group's Pfandbriefs continued to represent an important source of funding thanks to their very good credit
rating and liquidity. At 1.40, the liquidity ratio of UniCredit Bank AG compliant with Section 11 KWG was at
the same high level at the end of March 2010 as at year-end 2009 (1.43).

- 17 -
Consolidated Income Statement and Earnings per share from 1 January to 31 March 2010 (unaudited)
Balance Sheet at 31 March 2010 (unaudited)

- 18 -
Outlook and events since 31 December 2009
Management's Discussion and Analysis and the rest of the Annual Report 2009 include statements, expectations
and forecasts concerning the future. These forward-looking statements are based on plans and estimates that are
supported by the information that is available to HVB at the present time. Unless required by law, HVB assumes
no obligation to update these statements in the light of new information or future events. Known or unknown
risks and uncertainties may be entailed in forward-looking statements and the actual results and developments
may thus differ significantly from those expected at present. Such discrepancies may result particularly from
changes to the general economic climate and the competitive situation, developments on international capital
markets, the possible default of borrowers or contracting parties in commercial transactions, the implementation
of restructuring measures, amendments to national and international laws, notably to tax regulations, the
reliability of HVB's risk management procedures and methods as well as other risks, some of which are
described in detail in the Risk Report.
The following comments on the outlook are to be viewed in connection with the comments on the outlook in the
Financial Review and the Risk Report in the consolidated financial statements for the 2009 financial year.
General economic outlook for 2010
HVB expects the global economy to expand by 3.5% in 2010, with the United States growing by 2.5% and the
Euro zone by just 0.9%. Inflation rose again across the globe at the turn of the year. This resulted from a rebound
in oil prices to over USD 70 per barrel (forecast for year-end 2010: USD 90 per barrel). In general, though, price
rises remain very subdued.
Nonetheless, the exporting industry in the Euro zone could benefit from a weaker exchange rate this year. After
the Euro had appreciated hugely against the US Dollar in 2009, the weak growth outlook for peripheral countries
in the Euro zone in particular served to depress the exchange rate from over USD 1.50 to about USD 1.35. HVB
expects the Euro to strengthen slightly, to USD 1.38, through to the end of 2010. Separately from this, the very
high levels of both private and public debt, and the associated major need for consolidation, are likely to slow
economic expansion over the coming years.
The corporate mood in Germany has lightened again at the start of 2010. The Ifo Business Climate Index rose
sharply to 95.8 points at the beginning of the year 2010, after falling to as low as 82.2 points in the wake of the

- 19 -
economic crisis. This can be viewed as clear evidence that the global economic recovery is not likely to come to
a premature end. Important factors temporarily lifting the pace of economic expansion – the effect of the
inventory cycle and the fiscal stimulus – will decline, causing the recovery to slacken again as the year 2010
wears on. Besides decreasing export growth, economic performance will also be depressed by a weaker domestic
economy in 2010.
Capital spending on equipment is only expected to increase by a moderate 1% in Germany in 2010, following a
fall of 20% in 2009, and to decline by a further 1.5% in the Euro zone as a whole. High unit labour costs will
continue to put pressure on the labour market in Germany, probably causing unemployment to rise again sharply
during the course of the year (forecast for 2010: 8.9%). HVB expects German GDP to increase by 1.7% this year
– driven by greater demand for exports (forecast for 2010: plus 8% after minus 14% in 2009) – following a
contraction of 5.0% in 2009.
The high level of liquidity currently available on the market as a result of the expansionary monetary policies
applied by central banks is not considered likely to stoke inflation at the present time. The US Federal Reserve is
expected to raise its federal funds rate by 1 percentage point to 1.25% by the end of the year. At the same time,
HVB assumes that the ECB will not raise interest rates before the end of 2010. HVB expects inflation to average
just under 1% in Germany in 2010, following on from 0.3% in the past year. The central banks will only
gradually return to a more restrictive monetary policy so as not to jeopardise the incipient recovery that is
surrounded by so much uncertainty nor trigger new turmoil on the financial markets.
Sector development in 2010
The economic recovery that set in during the second half of 2009 is expected to continue through the current
year, although at a slower pace. Unemployment rates are set to rise sharply, public finances to deteriorate, and
the number of defaults at US banks to increase. Moreover, financial institutions will be affected by weak
performance in key sectors, such as the automotive industry and commercial property. The banks will continue
to face challenges, such as risk provisioning rates that remain persistently high overall, declining central bank
liquidity and a flatter yield curve.
One of the key questions will concern the shape of future relations between the financial world and the real
economy, and the likely regulatory, political and social restrictions which might have unexpected consequences
when aggregated across the globe. It remains to be seen how well the financial sector will succeed in coming to
terms with the new realities, not least because of the complex contours of a new international financial and
economic system currently in flux at many levels.
Development of HVB Group
HVB Group expects that the unexpectedly strong economic recovery in 2009 will not recur with the same
intensity in the 2010 financial year. Generally, economic conditions will continue to be difficult both in
Germany and worldwide, and marked by considerable uncertainty. Hence, the financial sector will continue to
face major challenges in the 2010 financial year. Against this backdrop and on the basis of HVB's plans for the
2010 financial year, based mainly on the statements made above under the general economic outlook for 2010,
HVB anticipates that the total revenues of HVB Group will largely stabilise at the level of the year under review.
Adjusted for inflation, total operating costs will probably remain almost unchanged compared with last year.
Apart from the change in total revenues – and particularly net trading income – the development of net write-
downs of loans and provisions for guarantees and commitments will be the main factor influencing the earnings
situation. At present, HVB assumes that net write-downs of loans and provisions for guarantees and
commitments in the 2010 financial year will not significantly exceed the level in 2009 despite HVB's expectation
that the difficult credit situation will persist.
The trends in results of HVB Group in 2010 named above are as follows for the individual operating divisions
below.
HVB Group's performance in the 2010 financial year will again depend on the operating performance of the
Corporate & Investment Banking division, in particular the earnings and the net write-downs of loans and
provisions for guarantees and commitments of this division. For 2010, HVB expects an increase in total
revenues, which should more than compensate for a rise in operating costs.
The operating performance in the Retail and Private Banking (formerly Wealth Management) divisions is
expected to continue to be marked by uncertainties on markets and the related cautiousness on the part of
customers. Against this backdrop, HVB anticipates a slight increase in total revenues with a moderate increase in
operating costs, particularly in the Retail division.
It remains unclear, however, whether the current economic programmes will prove to be effective and the
financial markets will continue to return to normal. Consequently, HVB's performance in the 2010 financial year
also remains dependent on the further development of the real economy and on financial markets. With its
strategic orientation and capital resources, HVB Group is in a good overall position to effectively exploit the

- 20 -
opportunities that may arise from further volatility that can be expected on the financial markets and from a slow
recovery in the real economy.
Legal Risks/Arbitration Proceedings
Medienfonds lawsuit
Numerous investors who invested in VIP Medienfonds 4 GmbH & Co. KG have filed complaints and lawsuits
against UniCredit Bank AG. The main reason for these actions is the fact that the tax deferrals, which were
originally part of the benefits achieved by the investment, will no longer apply according to the current position
of the tax authorities. UniCredit Bank AG did not market the fund, but it did grant investment finance loans to all
investors for a portion of the investment amount. Moreover, to collateralise the fund, UniCredit Bank AG
assumed various payment obligations of film distribution companies vis-à-vis the fund.
At the end of 2009 suits were pending against UniCredit Bank AG for a total value in dispute in the low triple-
digit million Euro range.
The complaints and suits against HVB are based on the allegation that HVB culpably violated its obligations to
provide information prior to signing the contracts as it was aware that the fund’s structure and execution
allegedly made it highly risky in tax respects. Moreover, the lawsuits are based on alleged errors in the
prospectus, for which the plaintiffs say HVB is responsible along with the initiator and other persons. A few
first-instance rulings have been issued. In some cases, courts have ruled against HVB because of alleged
violations of obligations to inform the investors whereas some suits have been dismissed. So far, none of the
rulings on these matters are final. The Munich Higher Regional Court (Oberlandesgericht) has started a test case
procedure pursuant to the Capital Markets Test Case Act (KapMuG) that – among other matters – is intended to
clarify the question of responsibility for the prospectus, also on the part of UniCredit Bank AG, with regard to
the banking services it provided.
Some investors based their claims on formal deficiencies regarding the investment finance loans granted to
investors in order to be able to unwind their whole investment vis-à-vis HVB.
From today's perspective, the situation in the legal proceedings and the outcome of the claims of investors is
unclear. HVB has set up adequate provisions for these proceedings. In order to amicably settle the alleged claims
and to bring the complex lawsuits to a reasonable end, UniCredit Bank AG jointly with another German bank
involved that marketed the predominant part of the fund share, recently decided to make a settlement offer to the
investors.
Real estate finance/financing of purchases of shares in real estate funds
UniCredit Bank AG will not suffer negative legal consequences if customers cancel their property loan
agreements under the Doorstep Transactions Act (Haustürwiderrufsgesetz). According to the law and the
opinion on this subject expressed in the German Supreme Court's (Bundesgerichtshof) established practice, the
customer, who is required to prove that the conditions for cancelling the contract have been met, must repay the
loan amount to the bank, including interest at customary market rates, even after cancellation of the loan
agreement.
Under a well-established body of court decisions, the bank would be required to assume the investment risk
because of its failure to notify the customer of his right to cancel the contract only if the customer could prove
that he would not have made the investment if he had been aware of this right; in addition, the German Supreme
Court has decided that the bank would only have to assume the investment risk in case of culpable actions. On
the basis of court rulings issued so far, HVB does not expect any negative effects in such cases.
HVB's claim to repayment remains in effect even if the borrower issued an invalid proxy to a third party, and
HVB relied on the validity of the proxy when entering into the loan agreement. Based on the experience gained
to date, HVB assumes that legal risks will not arise fromf these cases.
Judgements from the German Supreme Court recently also confirm the already narrow conditions for a possible
obligation on the part of HVB to give information and advice. The German Supreme Court makes it easier for
investors to provide evidence of violations of a bank's obligation to give information only in cases of
institutionalised collaboration between the bank funding the acquisition of the property and the seller of the
property. Recent judgements also indicate that a bank's liability cannot be ruled out completely if it has advised
the customer on the acquisition of the property and received commission from the seller for selling the property.
Based on its experience so far, HVB does not expect any negative effects for UniCredit Bank AG in this respect
either.
If a bank finances the purchase of shares in real estate funds for the borrower with a loan not secured by a real
property lien, the borrower can – if the transaction is a so-called related transaction – contest the claim of the
financing bank to repayment on the basis of objections which the borrower is entitled to assert against the seller
or agent in the fund transaction on account of having received inocrrect advice. Consequently, the bank has no
- 21 -
claim against the customer to repayment of the loan if it utilised the sales organisation of the agent arranging the
sale of shares in the fund, the loan was disbursed directly to the fund and the investor was misled when
purchasing the shares or if the borrower has a right of rescission. The borrower in each individual case would
have to demonstrate that these prerequisites were met. From today's standpoint, HVB expects these
circumstances to apply, if at all, only in exceptional cases.
Lawsuits in connection with the financial crisis
As a result of the dramatic developments in global financial markets, the number of complaints from customers
with investments in securities negatively affected by this crisis or customers who entered into derivative
transactions with UniCredit Bank AG have risen to above-average levels of past years. So far customers have
filed lawsuits based on claims of allegedly insufficient disclosure or of improper advice that was either
inappropriate for the investor or inappropriate regarding the form of the investment only in exceptional cases.
Three class actions were raised in the United States against HVB's American brokerage subsidiary, UniCredit
Capital Markets, Inc., along with numerous other defendants.The reason behind these actions is that both
Lehman Brothers Holding and Merrill Lynch issued securities. Although UniCredit Capital Markets was part of
the underwriting consortium for some of the securities in dispute, it neither received nor sold the securities
specified in the claims. Based on the appraisals of its external lawyers, HVB has decided not to set up any
provisions in this regard.
Lawsuit in connection with Primeo Notes
UniCredit Bank AG had issued several tranches of notes whose potential return was to be calculated by reference
to the performance of a synthetic hypothetical investment in the Primeo fund. The nominal value of the notes
issued by UniCredit Bank AG was around EUR 27 million for the Primeo referenced notes. Legal proceeding
has been commenced in Germany in connection with the issuance of said Primeo linked notes, which also named
UniCredit Bank AG as a defendant. From today's perspective, the outcome of the proceeding is open.
Arbitration proceedings on the cash settlement for Vereins- und Westbank AG
The Extraordinary Shareholders' Meeting of Vereins- und Westbank AG held on 24 June 2004 approved the
transfer of shares of minority shareholders of Vereins- und Westbank AG to UniCredit Bank AG. After
settlement of the legal challenges to this move, UniCredit Bank AG paid the minority shareholders of Vereins-
und Westbank AG an increased cash settlement of EUR 26.65 per share (the "EUR 26.65 settlement").
Notwithstanding this arrangement, numerous minority shareholders have exercised their right to have the
EUR 26.65 settlement reviewed in special judicial proceedings pursuant to Section 1 (3) of the Act on the
Procedure Regarding the Compensation of Minority Shareholders (Spruchverfahrensgesetz). In a ruling dated
2 March 2006, the Regional Court (Landgericht) of Hamburg increased the cash settlement to EUR 37.20 per
share on the basis of its own assessment. HVB has appealed against this decision. HVB assumes that, at most, a
much smaller payment in addition to the EUR 26,65 settlement will have to be made to the squeezed-out
shareholders of Vereins- und Westbank AG.
Court proceedings of UniCredit Bank AG's shareholders
Numerous (former) shareholders of UniCredit Bank AG filed a suit challenging the resolutions adopted by the
Annual General Meeting of HVB on 12 May 2005. Munich Regional Court I (Landgericht) has dismissed the
suit insofar as it challenges the election of Supervisory Board members and the auditor of the annual financial
statements; the ruling is not yet final.
Legal proceedings relating to the restructuring of HVB
Numerous (former) minority shareholders filed suits challenging the resolutions of the Extraordinary
Shareholders' Meeting of UniCredit Bank AG on 25 October 2006 approving the sale and transfer of the shares
held by HVB in Bank Austria Creditanstalt AG ("Bank Austria") and in HVB Bank Ukraine to UniCredit S.p.A.
and the shares held in Closed Joint Stock Company International Moscow Bank (IMB) (renamed as ZAO
UniCredit Bank, Moscow in December 2007, but still referred to as IMB below) and in HVB Bank Latvia AS
(later renamed as AS UniCredit Bank, Riga) to Bank Austria Creditanstalt AG, and the branches of HVB in
Vilnius und Tallinn to AS UniCredit Bank, Riga, asking the court to declare these resolutions null and void. The
former minority shareholders filed their lawsuits on the basis of alleged deficiencies of formalities in connection
with the invitation and conduct of the Extraordinary Shareholders' Meeting of 25 October 2006 and the allegedly
inadequate, too low purchase price paid for the units sold. In a ruling of 31 January 2008, Munich Regional
Court I declared the resolutions passed at the Extraordinary Shareholders' Meeting on 25 October 2006 null and
void solely for formal reasons. The court was of the opinion that the Business Combination Agreement ("BCA")
entered into by HVB and UniCredit S.p.A. on 12 June 2005 was not described in sufficient detail in the
invitation to the above meeting, particularly with regard to the provisions of the BCA on the court of arbitration
and the choice of law. Moreover, the court stated that shareholders' questions regarding the hypothetical effects
of specific alternative valuation parameters were not answered adequately. The court did not decide on the issue

- 22 -
of the allegedly inadequate purchase price paid for the purchased units. At the same time, based on a petition
filed by some minority shareholders, the court declared that the BCA should have been submitted to a general
shareholders' meeting of the company for approval to become valid because it represented a "hidden" domination
agreement.
UniCredit Bank AG believes that such ruling is not convincing since the provisions of the BCA considered by
the court to be material were not material for the purchase agreements submitted to the Extraordinary
Shareholders' Meeting on 25 October 2006, which contain their own arrangements anyway, and since answering
the question regarding individual alternative valuation parameters – even if at all possible to do so correctly at
the Extraordinary Shareholders' Meeting and without taking into account contrary effects induced by modified
parameters – would have done nothing to change the specific purchase agreements submitted for approval.
Consequently, HVB has appealed against this ruling.
As a precaution the resolutions passed by the Extraordinary Shareholders' Meeting of 25 October 2006 were
confirmed at UniCredit Bank AG's Annual General Meeting on 29 and 30 July 2008. Numerous suits were filed
against said confirmatory resolutions some of which are based on formal errors. Most, however, claim that the
purchase price for the sale of the participating interests and branches was too low and inadequate. As a
precaution, the resolutions and the confirmatory resolutions were confirmed once again at the Extraordinary
Shareholders' Meeting of UniCredit Bank AG on 5 February 2009.
In a ruling dated 29 October 2008, Munich Higher Regional Court suspended the appeal against the suits
challenging the resolutions of the Extraordinary Shareholders' Meeting of UniCredit Bank AG of 25 October
2006 until such time as a final court decision is passed on the suits challenging the confirmatory resolutions
adopted at the Annual General Meeting of UniCredit Bank AG on 29 and 30 July 2008. On 10 December 2009
Munich Regional Court I dismissed the suits against the resolutions adopted at the Annual Shareholders' Meeting
on 29 and 30 July 2008 including the suits against the confirmatory resolutions adopted at this meeting. Some
shareholders appealed against this ruling which is why a final decision has not yet been passed.
Special Representative
The Annual General Meeting of Shareholders of UniCredit Bank AG on 26 and 27 June 2007 passed a resolution
in favour of asserting alleged claims for damages against UniCredit S.p.A. and its legal representatives and
against the governing bodies of HVB due to the alleged damage to HVB's assets as a result of the sale of the
Bank Austria shares as well as due to the BCA concluded between HVB and UniCredit S.p.A. and appointed Dr
Thomas Heidel, a solicitor, as a special representative. HVB's now sole shareholder, UniCredit S.p.A., filed a
lawsuit challenging this resolution. In its ruling of 27 August 2008, Munich Higher Regional Court stated that
the resolution adopted at UniCredit Bank AG's Annual General Meeting on 26 and 27 June 2007 on the assertion
of claims for damages due to damage caused to HVB's assets and on the appointment of the special
representative was partly invalid, especially insofar as the special representative is not entitled to assert claims
for damages in connection with the conclusion of the BCA (lit. d of item 10 of the agenda of the Annual General
Meeting in 2007). The special representative and other former minority shareholders of HVB have filed an
appeal against this decision and the denial of leave to appeal with the German Federal Supreme Court, a step
also taken by UniCredit, HVB's sole shareholder since 15 September 2008. A final ruling has not yet been
passed.
An Extraordinary Shareholders' Meeting of UniCredit Bank AG on 10 November 2008 revoked the resolution
dated 26/27 June 2007 regarding the appointment of the special representative to assert alleged claims for
damages due to the sale of Bank Austria and the conclusion of the BCA (item 10 of the agenda of the
Shareholders' Meeting in 2007) and resolved that the appointed special representative be dismissed from office
with immediate effect. Munich Higher Regional Court on 3 March 2010 dismissed the claims raised against the
revocation of the resolutions to assert alleged claims for damages and to dismiss the special representative from
office. This ruling is not yet final and binding.
In letters dated 27 and 28 December 2007, the special representative demanded that UniCredit S.p.A. return the
Bank Austria shares sold to it. After UniCredit S.p.A. rejected this request, the special representative, on
20 February 2008, filed a suit against UniCredit S.p.A., Alessandro Profumo, Dr Wolfgang Sprissler and Rolf
Friedhofen as joint and severally liable for the return of the Bank Austria shares (and alternatively for claims for
damages of at least EUR 13.9 billion), and in addition to compensate any losses suffered by UniCredit Bank AG
through the sale and transfer of said shares ("Heidel action") referring to the "hedge fund claims" mentioned
below. On 10 July 2008 the special representative extended his suit and asserted additional alleged claims for
damages amounting to least EUR 2.92 billion against the defendants named above. The special representative
alleges that UniCredit Bank AG suffered damages for at least the amount stated in connection with the
contribution of the investment banking business of UniCredit Banca Mobiliare S.p.A. ("UBM"). The defendants
are convinced that the alleged claims are unfounded.
In a ruling dated 2 June 2009, Munich Regional Court I ordered the stay of said proceedings until such time as a
final decision has been passed in the suits challenging the resolutions of the shareholders' meeting dated 26/27

- 23 -
June 2007 (to assert alleged claims for damages and appointment of Dr. Thomas Heidel) as well as the suits
challenging the resolutions of the shareholders' meeting dated 10 November 2008 (revocation and dismissal of
the special representative).
Financial Statement for Fiscal 2006
A total of eight hedge funds with headquarters in the United States, the Virgin Islands, the Cayman Islands,
British West Indies and Bermuda, claiming that they are minority shareholders of HVB, have filed suits against
UniCredit S.p.A., Alessandro Profumo and Dr Wolfgang Sprissler, seeking (i) payment of EUR 17.35 billion in
damages to UniCredit Bank AG and (ii) payment by UniCredit of a guaranteed dividend starting from
19 November 2005 onwards ("hedge fund suits"). Iin their suits the plaintiffs argue that the sale of the shares in
Bank Austria to UniCredit S.p.A. as well as the sale and transfer of further entities (especially CEE units and the
asset management companies) sold to companies affiliated with UniCredit in each case were sold at a price
significantly below market value. Another (former) shareholder, Verbraucherzentrale für Kapitalanleger e.V.
(VzfK), filed another suit based on alleged damages against UniCredit AG, Mr. Profumo and Dr Sprissler on
similar grounds and asking for EUR 173.5 million. On 29 July 2009, Munich Regional Court I decided to join
the claims.
Against the backdrop of the independent external opinions obtained for the various transactions, and in view of
the fact that all transactions took place at arm's length, the defendants are convinced that the alleged claims for
damages are without foundation.
The plaintiffs of the hedge fund suits and another shareholder have also filed suits against HVB, making the
same arguments as mentioned above, seeking to have HVB's annual financial statements for the 2006 financial
year declared null and void because the above-mentioned claims were not recognised in the balance sheet. The
proceedings have been suspended until final ruling has been passed on the hedge fund suits.

- 24 -
GENERAL INFORMATION
Availability of Documents
Copies of the articles of association of HVB, the consolidated annual reports in respect of the fiscal years ended
31 December 2008 and 2009 of HVB, the consolidated interim report as at 31 March 2010 of HVB as well as the
unconsolidated annual financial statements of HVB prepared in accordance with the German Commercial Code
(Handelsgesetzbuch) in respect of the fiscal year ended 31 December 2009 will be available during usual
business hours on any weekday (except Saturdays and public holidays) at the offices of HVB. For the life of this
Registration Document, all documents incorporated by reference herein will be available for collection in the
English language, free of charge, at the specified offices of HVB as set out on the last page of this Registration
Document.
Significant Changes in HVB's Financial Position and Trend Information
There has been (i) no significant change in the financial position of the HVB Group which has occurred since 31
March 2010, and (ii) no material adverse change in the prospects of the HVB Group since the date of its last
published audited financial statements of 2009 (Annual Report 2009).
HVB Group expects economic conditions both worldwide and in Germany to remain difficult, marked by
considerable uncertainty. To cite one example, the high level of public debt in some European countries
represents a serious risk to growth and the development of interest and exchange rates.
This all means that the financial industry will again face major challenges in the 2010 financial year.
It still remains unclear whether the financial markets will continue returning to normal, notably against the
backdrop of the debt crisis currently looming in some European states. Consequently, HVB's performance in the
2010 financial year still remains dependent in part on the further development of the financial markets and the
real economy.
Information incorporated by reference
The section "Audited consolidated financial statements (Konzernabschluss) for the fiscal year ended
31 December 2008" set out in the Supplement dated 23 March 2009 relating to the Base Prospectus for the Euro
50,000,000,000 Debt Issuance Programme of Bayerische Hypo- und Vereinsbank AG dated 4 March 2009 is
incorporated by reference into this prospectus (see "General Information – Documtens incorporated by
reference").
Documents incorporated by reference
The following documents with respect to HVB shall be deemed to be incorporated in, and to form part of, this
Registration Document:
Audited consolidated financial
statements (Konzernabschluss) for the
fiscal year ended 31 December 2008
Extracted from the Supplement
dated 23 March 2009 relating to
the Base Propectus for the Euro
50,000,000,000 Debt Issuance
Programme of HVB dated 4
March 2009
Inserted in this Prospectus
on the following pages:
- List of Major HVB Group
Companies
- p. F-10-F-11 - p. 24
- Consolidated Income Statement
(Konzern-Gewinn-und
Verlustrechnung)
- p. F-1 - p. 24
- Consolidated Balance Sheet
(Konzernbilanz)
- p. F-2-F-3 - p. 24
- Consolidated Statement of
Changes in Sharesholders'
Equity (Konzern-Eigenkapital-
veränderungsrechnung)
- p. F-4-F-5 - p. 24
- Consolidated Cash Flow
Statement (Konzern-
Kapitalflussrechnung)
- p. F-6-F-7 - p. 24
- Notes to the Consolidated
Financial Statements
- p. F-8-F-87 - p. 24

- 25 -
(Konzernanhang)
- Auditor's Certificate
(Bestätigungsvermerk)
- p. F-88 - p. 24
The abovementioned Annual Report 2008 is included in the Supplement approved by BaFin and dated 23 March
2009 relating to the Base Propectus for the Euro 50,000,000,000 Debt Issuance Programme of Bayerische Hypo-
und Vereinsbank AG dated 4 March 2009. Copies of any or all of the documents which are incorporated herein
by reference will be available free of charge from the specified offices of HVB set out at the end of this
Registration Document.

88 2009 Annual Report · HypoVereinsbank
Financial Statements (2) | Consolidated Financial Statements
for the year ended 31 December 2009
Earnings per share (in €)
Notes 2009 2008
Earnings per share 42 1.02 (0.84)
Earnings per share (adjusted)1 42 1.18 (0.80)
1 2009 and 2008 adjusted for restructuring costs
Since no conversion rights or option rights on conditional capital existed at the closing date for 2009, there is no calculation of diluted earnings per share.
2009 2008 CHANGE
Income/Expenses NOTES € millions € millions € millions in %
Net interest 4,476 4,059 + 417 + 10.3
Dividends and other income from equity investments 52 200 (148) (74.0)
Net interest income 32 4,528 4,259 + 269 + 6.3
Net fees and commissions 33 1,187 1,453 (266) (18.3)
Net trading income 34 1,074 (1,882) + 2,956
Net other expenses/income 35 141 147 (6) (4.1)
Net non-interest income 2,402 (282) + 2,684
TOTAL REVENUES 6,930 3,977 + 2,953 + 74.3
Payroll costs (1,822) (1,961) + 139 (7.1)
Other administrative expenses (1,418) (1,281) (137) + 10.7
Amortisation, depreciation and impairment
losses on intangible and tangible assets (222) (253) + 31 (12.3)
Operating costs 36 (3,462) (3,495) + 33 (0.9)
OPERATING PROFIT 3,468 482 + 2,986 >+ 100.0
Provisions for risks and charges 37 (151) (6) (145) >+ 100.0
Write-down on goodwill — — — —
Restructuring costs 38 (170) (26) (144) >+ 100.0
Net write-downs of loans and provisions
for guarantees and commitments 39 (1,601) (760) (841) >+ 100.0
Net income from investments 40 (280) (285) + 5 + 1.8
PROFIT/(LOSS) BEFORE TAX 1,266 (595) + 1,861
Income tax for the period 41 (382) (54) (328) >+ 100.0
CONSOLIDATED PROFIT/(LOSS) 884 (649) + 1,533
attributable to shareholder of UniCredit Bank AG 819 (671) + 1,490
attributable to minorities 65 22 + 43 >+ 100.0
Consolidated Income Statement
F-1

HypoVereinsbank · 2009 Annual Report 89
Statement of Other Comprehensive Income (€ millions)
2009 2008
Consolidated profit/(loss) recognised in the income statement 884 (649)
Income and expenses recognised in equity
Changes from foreign currency translation and other changes (36) 86
Changes from companies accounted for using the equity method — —
Actuarial profit on defined benefit plans (pension commitments) (121) 73
Discontinued operations and assets held for sale — —
Change in valuation of financial instruments (AfS reserve) 106 (938)
Change in valuation of financial instruments (hedge reserve) (196) 1,350
Taxes on income and expenses recognised in equity 96 (417)
Income and expenses recognised in equity (151) 154
Total recognised in equity 733 (495)
of which
attributable to shareholder of UniCredit Bank AG 697 (560)
attributable to minority interest 36 65
F-2

90 2009 Annual Report · HypoVereinsbank
Financial Statements (2) | Consolidated Financial Statements
at 31 December 2009
Assets
2009 2008 CHANGE
NOTES € millions € millions € millions in %
Cash and cash balances 43 6,400 5,556 + 844 + 15.2
Financial assets held for trading 44 133,389 199,019 (65,630) (33.0)
Financial assets at fair value through profit or loss 45 13,758 13,335 + 423 + 3.2
Available-for-sale financial assets 46 4,441 5,854 (1,413) (24.1)
Shares in associates accounted for using the equity method
and joint ventures accounted for using the equity method 47 88 32 + 56 >+ 100.0
Held-to-maturity investments 48 2,679 6,020 (3,341) (55.5)
Loans and receivables with banks 49 43,254 41,453 + 1,801 + 4.3
Loans and receivables with customers 50 145,919 175,518 (29,599) (16.9)
Hedging derivatives 52 3,578 2,654 + 924 + 34.8
Hedge adjustment of hedged items
in the fair value hedge portfolio 53 — + 53
Property, plant and equipment 53 2,581 1,877 + 704 + 37.5
Investment properties 54 1,907 1,723 + 184 + 10.7
Intangible assets 55 656 795 (139) (17.5)
of which: goodwill 424 424 — —
Tax assets 56 2,612 2,792 (180) (6.4)
of which: deferred tax assets 2,252 2,371 (119) (5.0)
Non-current assets or disposal groups held for sale 57 4 4 — —
Other assets 58 2,101 1,970 + 131 + 6.6
Total assets 363,420 458,602 (95,182) (20.8)
Balance Sheet
F-3

HypoVereinsbank · 2009 Annual Report 91
Liabilities
NOTES 2009 2008 CHANGE
€ millions € millions € millions in %
Deposits from banks 60 50,704 83,867 (33,163) (39.5)
Deposits from customers 61 96,490 114,962 (18,472) (16.1)
Debt securities in issue 62 61,286 63,639 (2,353) (3.7)
Financial liabilities held for trading 63 121,206 163,944 (42,738) (26.1)
Hedging derivatives 64 1,369 617 + 752 >+ 100.0
Hedge adjustment of hedged items
in the fair value hedge portfolio 65 1,200 554 + 646 >+ 100.0
Tax liabilities 66 1,849 1,938 (89) (4.6)
of which: deferred tax liabilities 1,175 1,394 (219) (15.7)
Liabilities of disposal groups held for sale 67 — 4 (4) (100.0)
Other liabilities 68 4,179 4,562 (383) (8.4)
Provisions 69 1,499 1,491 + 8 + 0.5
Shareholders’ equity 70 23,638 23,024 + 614 + 2.7
Shareholders’ equity attributable to
shareholder of UniCredit Bank AG 22,870 22,217 + 653 + 2.9
Subscribed capital 2,407 2,407 — —
Additional paid-in capital 9,791 9,791 — —
Own shares — — — —
Other reserves 9,034 9,996 (962) (9.6)
Change in valuation of financial instruments 5 23 (18) (78.3)
AfS reserve (190) (306) + 116 + 37.9
Hedge reserve 195 329 (134) (40.7)
Consolidated profit 1,633 — + 1,633
Minority interest 768 807 (39) (4.8)
Total shareholders’ equity and liabilities 363,420 458,602 (95,182) (20.8)
The profit available for distribution disclosed in the separate financial statements of UniCredit Bank AG (= consolidated profit of HVB Group), which forms
the basis for the appropriation of profit, amounts to €1,633 million. We will propose to the Annual General Meeting of Shareholders that a dividend of
€1,633 million be paid to our sole shareholder, UniCredit S.p.A. (UniCredit), Rome, Italy. This represents a dividend of around €2.03 per share of common
stock and per share of preferred stock, an advance dividend of €0.064 per share of preferred stock and a retroactive payment on the advance share of
profits of €0.064 per share of preferred stock for 2008.
F-4

92 2009 Annual Report · HypoVereinsbank
Financial Statements (2) | Consolidated Financial Statements
SUBSCRIBED
CAPITAL
ADDITIONAL
PAID-IN CAPITAL OWN SHARES
OTHER RESERVES
TOTAL OTHER
RESERVES
OF WHICH:
PENSIONS AND
SIMILAR OBLI-
GATIONS (IAS 19)
Shareholders’ equity at 1/1/2008 2,407 9,791 (2) 6,913 (189)
Recognised income and expenses
Consolidated profit/(loss) recognised
in the consolidated income statement — — — (671) —
Income and expenses recognised in equity
Change in valuation of financial instruments not affecting income — — — — —
Change in valuation of financial instruments affecting income — — — — —
Actuarial losses on defined benefit plans — — — 50 50
Reserve arising from foreign currency translation and other changes — — 2 43 —
Income and expenses recognised in equity — — 2 93 50
Total income and expenses recognised — — 2 (578) 50
Other changes recognised in equity
Dividend payouts — — — — —
Transfers from consolidated profit — — — 3,672 —
Changes in group of consolidated companies — — — (11) —
Total other changes in equity — — — 3,661 —
Shareholders’ equity at 31/12/2008 2,407 9,791 — 9,996 (139)
Shareholders’ equity at 1/1/2009 2,407 9,791 — 9,996 (139)
Recognised income and expenses
Consolidated profit/(loss) recognised in the
consolidated income statement — — — — —
Income and expenses recognised in equity
Change in valuation of financial instruments not affecting income — — — — —
Change in valuation of financial instruments affecting income — — — — —
Actuarial losses on defined benefit plans — — — (84) (84)
Reserve arising from foreign currency translation and other changes — — — (14) —
Income and expenses recognised in equity — — — (98) (84)
Total income and expenses recognised — — — (98) (84)
Other changes recognised in equity
Dividend payouts — — — — —
Transfers to consolidated profit — — — (814) —
Changes in group of consolidated companies — — — (50) —
Total other changes in equity — — — (864) —
Shareholders’ equity at 31/12/2009 2,407 9,791 — 9,034 (223)
1 UniCredit Bank AG (HVB)
Statement of Changes in Shareholders’ Equity
F-5

HypoVereinsbank · 2009 Annual Report 93
(€ millions)
CHANGE IN VALUATION
OF FINANCIAL INSTRUMENTS
CONSOLIDATED
PROFIT
TOTAL SHAREHOLDERS’
EQUITY ATTRIBUTABLE TO
SHAREHOLDER OF HVB1
MINORITY
INTEREST
TOTAL
SHAREHOLDERS’
EQUITYAFS RESERVE HEDGE RESERVE
619 (612) 4,074 23,190 808 23,998
— — — (671) 22 (649)
(924) 982 — 58 — 58
1 (41) — (40) — (40)
— — — 50 — 50
(2) — — 43 43 86
(925) 941 — 111 43 154
(925) 941 — (560) 65 (495)
— — (402) (402) (68) (470)
— — (3,672) — — —
— — — (11) 2 (9)
— — (4,074) (413) (66) (479)
(306) 329 — 22,217 807 23,024
(306) 329 — 22,217 807 23,024
— — 819 819 65 884
175 (4) — 171 (2) 169
(70) (130) — (200) — (200)
— — — (84) — (84)
5 — — (9) (27) (36)
110 (134) — (122) (29) (151)
110 (134) 819 697 36 733
— — — — (54) (54)
— — 814 — — —
6 — — (44) (21) (65)
6 — 814 (44) (75) (119)
(190) 195 1,633 22,870 768 23,638
F-6

94 2009 Annual Report · HypoVereinsbank
Financial Statements (2) | Consolidated Financial Statements
(€ millions)
2009 2008
Consolidated profit/(loss) 884 (649)
Write-downs, provisions for losses on, and write-ups of,
loans and receivables and additions to provisions for losses on guarantees and indemnities 1,678 831
Write-downs and depreciation less write-ups on long-term assets 620 617
Change in other non-cash positions 3,119 (2,064)
Profit from the sale of investments, property, plant and equipment (194) (29)
Other adjustments (net interest and dividend income from the income statement, taxes on income paid) (4,781) (4,443)
Subtotal 1,326 (5,737)
Change in assets and liabilities from operating activities
after correction for non-cash components
Increase in assets/decrease in liabilities (–)
Decrease in assets/increase in liabilities (+)
Financial assets held for trading 27,423 41,042
Loans and receivables with banks (2,880) 1,456
Loans and receivables with customers 27,288 (14,690)
Other assets from operating activities 12 (84)
Deposits from banks (33,110) (3,279)
Deposits from customers (15,955) 5,752
Debt securities in issue 611 (15,163)
Other liabilities from operating activities (8,506) (9,719)
Taxes on income paid (109) (469)
Interest received 11,791 15,871
Interest paid (7,924) (11,974)
Dividends received 415 946
Cash flows from operating activities 382 3,952
Proceeds from the sale of investments 5,475 1,869
Proceeds from the sale of property, plant and equipment 60 54
Payments for the acquisition of investments (1,025) (4,534)
Payments for the acquisition of property, plant and equipment (969) (312)
Effects of the change in the group of companies included in consolidation (including discontinued operations) 107 —
Cash flows from investing activities 3,662 (2,923)
Change in additional paid-in capital — —
Dividend payments — (402)
Other financing activities, net (subordinated and hybrid capital) (2,864) (1,792)
Other financing activities, net (322) 89
Cash flows from financing activities (3,186) (2,105)
Cash Flow Statement
F-7

HypoVereinsbank · 2009 Annual Report 95
(€ millions)
2009 2008
Cash and cash equivalents at end of previous period1 5,556 6,632
Net cash provided/used by operating activities 382 3,952
Net cash provided/used by investing activities 3,648 (2,923)
Net cash provided/used by financing activities (3,186) (2,105)
Effects of exchange rate changes — —
Less disposal groups held for sale and discontinued operations — —
Cash and cash equivalents at end of period1 6,400 5,556
1 The cash and cash equivalents are identical to the cash and cash balances shown in the balance sheet. We have modified the disclosure of balances with central banks in the balance sheet in compliance
with IAS 1.68 (I) in conjunction with IAS 8.41 (see comments in Note 2, “Consistency”).
F-8

96 2009 Annual Report · HypoVereinsbank
Financial Statements (2) | Consolidated Financial Statements
Consolidated financial statements in accordance with IFRSAs a globally active company, we prepare the financial statements in accordance with the requirements of the International Accounting Standards Board
(IASB).
This gives our shareholder and all other interested parties a reliable and internationally comparable basis for evaluating the HVB Group and its profitability.
Our value-based management is similarly based on these accounting principles.
The consolidated financial statements have been prepared in accordance with the International Financial Reporting Standards (IFRS) pursuant to Commis-
sion Regulation 1606/2002 of the European Parliament and of the Council of 19 July 2002 together with further regulations regarding the adoption of
certain IFRSs within the framework of the EU endorsement in conjunction with Section 315a (1) of the German Commercial Code (Handelsgesetzbuch –
HGB) as non-exempt consolidated financial statements compliant with Section 4 of the IAS Regulation. Besides the standards defined as IFRS, the IFRSs
also comprise the existing International Accounting Standards (IAS) together with the interpretations of the International Financial Reporting Interpreta-
tions Committee (IFRIC) and the former Standing Interpretations Committee (SIC). All the standards and interpretations subject to mandatory adoption in
the EU for the 2009 financial year have been applied. Section 315a of the German Commercial Code also contains national regulations to be applied
alongside the IFRS by companies active on the capital market.
The statement regarding the Corporate Governance Code required by Section 161, German Stock Corporation Act (Aktiengesetz – AktG), has been
published on our website at www.hvb.com/declarationofconformity. Our listed subsidiaries DAB Bank AG and AGROB Immobilien AG have posted an
equivalent statement on their websites.
The Management’s Discussion and Analysis meets the requirements of Section 315 (1, 2) of the German Commercial Code. Also incorporated is a risk
report pursuant to Section 315, German Commercial Code.
Compliant with Section 264b of the German Commercial Code, the following companies are exempted from the obligation to prepare a management
report and to publish their annual financial statements:
– HVZ GmbH & Co. Objekt KG, Munich
– Salvatorplatz-Grundstücksgesellschaft mbH & Co. OHG Verwaltungszentrum, Munich
– Hypo-Bank Verwaltungszentrum GmbH & Co. KG Objekt Arabellastraße, Munich
– Portia Grundstücks-Verwaltungsgesellschaft mbH & Co. Objekt KG, Munich
– A & T-Projektentwicklungs GmbH & Co. Potsdamer Platz Berlin KG, Munich
– Acis Immobilien- und Projektentwicklungs GmbH & Co. Stuttgart Kronprinzstraße KG, Munich
– Acis Immobilien- und Projektentwicklungs GmbH & Co. Oberbaum City KG, Munich
– Acis Immobilien- und Projektentwicklungs GmbH & Co. Parkkolonnaden KG, Munich
– Delpha Immobilien- und Projektentwicklungs GmbH & Co. Großkugel Bauabschnitt Alpha Management KG, Munich
– Delpha Immobilien- und Projektentwicklungs GmbH & Co. Großkugel Bauabschnitt Beta Management KG, Munich
– Delpha Immobilien- und Projektentwicklungs GmbH & Co. Großkugel Bauabschnitt Gamma Management KG, Munich
– Grundstücksgesellschaft Simon beschränkt haftende Kommanditgesellschaft, Munich
– HVB Gesellschaft für Gebäude mbH & Co. KG, Munich
– HYPO-REAL Haus- und Grundbesitz Gesellschaft mbH & Co. 1. Vermietungs KG, Munich
– Othmarschen Park Hamburg GmbH & Co. Centerpark KG, Munich
– Othmarschen Park Hamburg GmbH & Co. Gewerbepark KG, Munich
– SOLARIS Verwaltungsgesellschaft mbH & Co. Vermietungs KG, Munich
– Solos Immobilien- und Projektentwicklungs GmbH & Co. Sirius Beteiligungs KG, Munich
– TERRENO Grundstücksverwaltung GmbH & Co. Entwicklungs- und Finanzierungsvermittlungs KG, Munich.
Compliant with Section 264 (3) of the German Commercial Code, the following companies are exempted from the obligation to publish their annual
financial statements:
– Argentaurus Immobilien Vermietungs- und Verwaltungs GmbH, Munich
– GIMMO Immobilien-Vermietungs- und Verwaltungs GmbH, Munich
– HVB Immobilien AG, Munich
– HVB Projekt GmbH, Munich
– HVB Tecta GmbH, Munich
– Interra Gesellschaft für Immobilienverwaltung mbH, Munich
– Orestos Immobilien- Verwaltungs GmbH, Munich.
Notes to the Consolidated Financial Statements
F-9
HypoVereinsbank · 2009 Annual Report 97
1 Uniform Group accounting policiesThe separate financial statements of the domestic and foreign subsidiaries are incorporated in our consolidated financial statements in accordance with
uniform principles of accounting and valuation. Where options have been exercised, the details are explained under the balance sheet items concerned.
2 ConsistencyIn accordance with the IFRS Framework for the presentation of financial statements together with IAS 1 and IAS 8, we apply the accounting and dis-
closure principles consistently from one period to the next. Where accounting and valuation errors from earlier periods are corrected, the amounts
involved are adjusted against retained earnings. Where we effect changes in accounting policies, any resulting adjustments are similarly recognised
retrospectively.
Changes in estimates are recognised in net income for the period affected by the change in the estimation method, or – where the change in the estima-
tion method does not affect the income statement – the carrying amount of the concerned asset or liability, or shareholders’ equity position, is adjusted.
The consolidated financial statements are prepared under the assumption of a going concern. Accounting and valuation in accordance with IFRS contains
values that have been determined properly using estimates and assumptions. The estimates and assumptions applied are based on past experience and
other factors such as budgets, expectations and forecasts regarding future events which seem appropriate under the present circumstances. This mainly
affects the determination of the fair value of certain financial assets and liabilities, net write-downs of loans and provisions for guarantees and commit-
ments, deferred taxes and the accounting and valuation of provisions. The actual values may differ from the assumptions and estimates made.
The disclosure of deposits with central banks was changed in the balance sheet for the first time in the Half-yearly Financial Report for 2009 compliant
with IAS 1.68 (I) in conjunction with IAS 8.41. Thus, the cash balances at central banks are shown under “Cash and cash balances” in line with the indus-
try’s usual disclosure practice, and no longer under “Loans and receivables with banks” as before.
In addition, we changed the disclosure of income and expenses relating to the valuation and realisation gains of private equity funds as well as direct
and co-investments in the income statement compliant with IAS 8.41 for the first time in the Interim Report at 30 September 2009. These contributions
to earnings are now reported under the item “Net income from investments” in the income statement and not under the item “Net trading income” as
previously. Compliant with IAS 8.43, both changes have been made retrospectively. The comparison figures for the previous year and the previous quar-
ters have been adjusted accordingly.
We applied fair value hedge accounting for credit risks (micro fair value hedge) for the first time in 2009. Compliant with IAS 39.86 (a), we use hedging
instruments to hedge credit-induced risks that change the fair value of the hedged item. In doing so, we hedged the credit risks of selected hedged items
such as loans and receivables with customers and irrevocable credit commitments (fixed obligations not recognised in the balance sheet) using credit
default swaps (CDS).
Mostly in the first quarter of 2009, further financial assets held for trading, for which there was no active market at the time of reclassification, were
prospectively reclassified as loans and receivables compliant with IAS 39.50 et seq. as was the case in 2008. For the most part, this relates to Pfand-
briefs, government bonds and bank bonds. The intention to trade no longer exists with regard to the reclassified assets. Given the high quality of the
assets concerned, HVB Group intends to retain the assets for a longer period. We have not reclassified any holdings from the available-for-sale portfolio.
Apart from this, the accounting and valuation principles applied in 2009 are the same as those applied in the consolidated financial statements for 2008,
with the exception of the new IFRS rules to be applied as described in Note 3 below.
Accounting and Valuation
F-10

98 2009 Annual Report · HypoVereinsbank
Financial Statements (2) | Consolidated Financial Statements
3 Application of new reclassification rulesWe applied the revised IAS 1, “Presentation of Financial Statements” for the first time in the 2009 financial year. The revised standard requires a separate
statement of other comprehensive income to be included in the consolidated financial statements in addition to the traditional income statement.
In March 2009, the IASB issued amendments to IFRS 7 entitled “Improving Disclosures about Financial Instruments” which were already applicable in
2009. The amendments call for expanded disclosures regarding financial instruments measured at fair value in accordance with a three-level fair value
hierarchy, showing the quality of the prices and parameters used in these valuation methods. Expanded qualitative and quantitative disclosures regarding
liquidity risk are also required. We have met these requirements by providing further disclosures in the notes.
The new IFRS 8 “Operating Segments”, which is the subject of mandatory adoption in 2009, replaces the old IAS 14 regarding segment reporting. In
accordance with the new standards, the segment report is based on what is known as the Management Approach. More detailed information regarding
the method of segment reporting is provided in Note 27. The application of IFRS 8 had no significant impact on our existing segment reporting.
The amendments to IFRIC 9 cover the accounting treatment of embedded derivatives in connection with the reclassification of financial instruments. In
line with the amendments, a reclassification of synthetic ABSs from the held-for-trading portfolio is not possible where they contain embedded derivatives
that are not measured separately and carried at fair value. This did not have any impact on HVB Group, as we had already taken account of this clarifying
interpretation when reclassifying financial instruments.
The other new interpretations (IFRIC 12, 13, 15, 16, 18) applicable in the 2009 financial year and minor amendments to IFRS standards did not give rise
to any significant effects on the consolidated financial statements.
4 Published IFRSs that are not yet the subject of mandatory adoption and that have not been the subject of early adoptionThe standards and interpretations newly published or revised by the IASB, which only become the subject of mandatory adoption for financial years
beginning on or after 1 January 2010, have not been the subject of early adoption.
5 Companies included in consolidationThe group of companies included in consolidation by HVB Group encompasses 96 (2008: 87) subsidaries. The group of consolidated companies also
includes 41 (2008: 33) companies and fund assets which SIC 12 requires to be consolidated as special purpose entities.
The group of companies included in consolidation has been defined taking into account materiality criteria. The fully consolidated subsidiaries prepared
their annual financial statements for the period ended 31 December 2009. The group of consolidated companies does not include any companies that
are not fully consolidated. With effect from 1 May 2009, HVB transferred the limited partner’s interests it held in HVB Information Services GmbH & Co.
KG (HVB IS) to UniCredit Global Information Services Società Consortile per Azioni (UGIS) against the issue of new UGIS shares and now holds an interest
of 24.7% in UGIS. HVB IS left the group of companies included in consolidation with effect from 1 May 2009 whereas UGIS was added to the group of
companies included in consolidation with effect from 1 May 2009, being accounted for using the equity method. UGIS is currently the only company
accounted for using the equity method that is consolidated.
In 2009 the following companies and fund assets, among others, were added to the group of companies included in consolidation at HVB Group:
– NXP Co-Investment Partners VIII, L.P., London
– UniCredit London Investments Limited, London (formerly UniCredit Finance & Investments Limited, London)
– Merkurhof Grundstücksgesellschaft mit beschränkter Haftung, Hamburg
– HVB Finance London Limited, London
– UniCredit Capital Markets, Inc., New York (formerly HVB Capital Markets Inc., New York)
– GELDILUX-TS-2009 S.A., Luxembourg
– UniCredit Global Information Services Società Consortile per Azioni, Milan
– Blue Capital Europa Immobilien GmbH & Co. Achte Objekte Großbritannien KG, Hamburg
– HVB Funding Trust, Wilmington
– HVB Funding Trust III, Wilmington
– Redstone Mortgages Limited, London
Accounting and Valuation (CONTINUED)
F-11

HypoVereinsbank · 2009 Annual Report 99
– European-Office-Fond, Munich
– Sofimmocentrale S.A., Brussels
– HYPO-REAL Haus- und Grundbesitz Gesellschaft mbH & Co. 1. Vermietungs KG, Munich
– HYPO-REAL Haus- und Grundbesitzgesellschaft des bürgerlichen Rechts Nr. 1, Munich
– HVB Asia Limited, Singapore
– Cameron Granville 2 Asset Management Inc., Global City, Taguig, Philippines
– Cameron Granville 3 Asset Management Inc., Global City, Taguig, Philippines
– Cameron Granville Asset Management (SPV-AMC), Inc., Global City, Taguig, Philippines
– AGROB Immobilien AG, Ismaning
– Grundstücksgesellschaft Simon beschränkt haftende Kommanditgesellschaft, Munich
– Tender Option Bonds USA: 11 special purposes entities used to securitise municipal loans in the United States
– Grand Central Funding Corp., New York
– Kinabalu Financial Products LLP, London
– Kinabalu Financial Solutions Limited, London
In 2009 the following companies and fund assets left the group of companies included in consolidation at HVB Group:
– HVB Information Services GmbH & Co. KG, Munich
– Hewitt Associates GmbH, Grünwald (formerly: BodeHewitt AG & Co, KG, Grünwald)
– Vereinsbank Victoria Bauspar Aktiengesellschaft, Munich
– Euro ImmoProfil, Munich
– Ramius Fund of Funds Group, LLC (accounted for using the equity method), Dover
– Großkugel Immobilien- und Projektentwicklungs GmbH, Munich
– Omnia Grundstücks-GmbH & Co. Objekt Ostragehege KG, Munich
– KHR Projektentwicklungsgesellschaft mbH & Co. Objekt Bornitzstraße I KG, Munich
– Ocean Breeze Finance S.A., Luxembourg, (Compartment II)
– HVB Hong Kong Limited, Hong Kong
In total, HVB Group has 261 affiliated and associated companies and joint ventures that were neither fully consolidated nor fully accounted for using the
equity method as they do not have a material impact for the Group.
The effects on the balance sheet of the contractual relationships between the Group companies and these non-consolidated companies are included
in the consolidated financial statements. The aggregate net income for the year of these affiliated companies which are not consolidated due to consider-
ations of materiality makes up around 3.2% of the consolidated profit of HVB Group, while such companies provide around 0.2% of consolidated assets.
The interests in these companies are carried as available-for-sale financial assets.
2009 2008
Subsidiaries total 343 367
Consolidated companies 96 87
Non-consolidated companies 247 280
Joint ventures 6 6
of which:
accounted for using the equity method — —
Associated companies 9 10
of which:
accounted for using the equity method 1 1
HVB has applied the option given in Section 313 (4) of the German Commercial Code. The separate list of holdings drawn up in compliance with Section
313 (2) of the German Commercial Code contains all joint ventures, and affiliated and associated companies broken down by whether they are included
in the consolidated financial statements or not – together with other holdings. The full list of our shareholdings is published as part of the present financial
statements by the operator of the electronic Federal Gazette in accordance with Section 325 (2) of the German Commercial Code and can be accessed
via the homepage of the company register in accordance with Section 8b (2) of the German Commercial Code. It can also be called up on our homepage
at www.hvb.de/annualreport.
F-12

100 2009 Annual Report · HypoVereinsbank
Financial Statements (2) | Consolidated Financial Statements
6 Principles of consolidationConsolidation is performed by offsetting the purchase price of an affiliated company against the value of the interest held in the completely recalculated
shareholders’ equity at the time of acquisition, provided the transactions involved are not internal to UniCredit Group. This amount represents the differ-
ence between the assets and liabilities of the acquired company, measured at the fair value at the time of initial consolidation. The difference between the
higher acquisition cost and the prorated recalculated shareholders’ equity is recognised as goodwill under intangible assets in the balance sheet. Goodwill
on companies accounted for using the equity method is carried under investments in associates, joint ventures and non-consolidated subsidiaries.
Compliant with IAS 36, depreciation is not recognised on goodwill. The goodwill is allocated to the cash-generating units that are expected to benefit from
the synergies arising from the business combination. At HVB Group, these cash-generating units are the divisions. Where the commercial activities of a
company span more than one segment, the goodwill is distributed in line with the expected contribution to results at the time of acquisition. The goodwill
is tested for impairment at least once a year at cash-generating unit level. This involves comparing the carrying amount of the CGU with the recoverable
amount defined as the maximum of the unit’s value in use and the fair value less costs to sell. Since the value in use far exceeds the carrying amount for
the CGUs to which goodwill is allocated, the values in use have been used as the recoverable amount. When the values in use are calculated, the division-
al plans are employed as the basis and a uniform rate of 10.2% for the cost of capital is used for discounting. No growth factor has been assumed for the
government perpetuity.
IFRS 3 is not applicable to combinations of businesses under common control (IFRS 3.2c). IAS 8.10 requires an appropriate accounting and valuation
method to be developed accordingly for such cases. Given that HVB Group is part of UniCredit Group, the carrying amounts of the parent company are
retained for business combinations within the UniCredit Group. Any difference between the purchase price paid and the net carrying amount of the com-
pany acquired is recognised in equity under reserves.
SIC 12 requires us to consolidate special purpose entities provided, in substance, the majority of the risks and rewards incident to the activities of these
special purpose entities is attributable to us or, in substance, we control the special purpose entities. Where they are material, they are included in
consolidation. An interest in the equity capital of the special purpose entities is immaterial in this regard.
The assets and liabilities of the special purpose entity are included at the balance sheet date measured at their fair value when initially consolidated in
accordance with SIC 12. They are subsequently measured in accordance with the uniform principles of accounting and valuation used across the cor-
porate group. The expenses and income of the special purpose entity in question have been included in the consolidated income statement from the date
of initial consolidation. Thus, the consolidation of special purpose entities in accordance with SIC 12 has the same effect as full consolidation. Equity
interests held by third parties in a special purpose entity consolidated by us in accordance with SIC 12 are recognised under minority interest.
The same principles are applied when consolidating associated companies and joint ventures accounted for using the equity method.
Business transactions between consolidated companies are eliminated. Any profits or losses arising from intercompany transactions are also eliminated.
7 Financial instrumentsA financial instrument is any contract that gives rise to both a financial asset of one company and a financial liability or equity instrument of another
company.
The classes required by IFRS 7.6 are defined as follows:
– Cash and cash reserves
– Financial assets and liabilities held for trading
– Financial assets at fair value through profit or loss
– Available-for-sale financial assets (measured at cost)
– Available-for-sale financial assets (measured at fair value)
– Held-to-maturity investments
– Loans and receivables with banks (classified as loans and receivables)
– Loans and receivables with customers (classified as loans and receivables)
– Hedging derivatives
– Other liabilities (deposits from customers, deposits from banks, debt securities in issue)
– Liabilities from outstanding fund shares (for 2008 only)
– Financial guarantees and irrevocable lending commitments
Accounting and Valuation (CONTINUED)
F-13

HypoVereinsbank · 2009 Annual Report 101
Among other things, the balance sheet disclosures and earnings contributions of the financial instruments must be shown separately, broken down by the
IAS 39 valuation categories. In the present consolidated financial statements, we have included these changes in the explanatory notes to the balance
sheet and the income statement. The information required by IFRS 7 regarding risks in connection with financial instruments is also provided in the Risk
Report within the Management’s Discussion and Analysis. Compliant with IFRS 7.36 A, the maximum credit exposure is the same as the carrying amount
of the risk-bearing financial instruments or, in the case of financial guarantees and lending commitments, the nominal amount disclosed in Note 79 for
the guarantee/amount of the lending commitments not yet utilised.
IAS 39 requires all financial instruments to be recognised in the balance sheet, classified in the given categories and measured in line with this classifi-
cation.
Financial assets and liabilities at fair value through profit or lossThe “at fair value through profit or loss” category is divided into two categories:
– Financial assets and liabilities held for trading.
Financial assets and liabilities classified as held for trading at the time of initial recognition are financial instruments acquired or incurred for the
purpose of short-term profit-taking as a result of changes in market prices or of realising a profit margin. This category also includes all derivatives
(apart from hedging derivatives) which qualify for hedge accounting. Financial assets and liabilities held-for-trading purposes are shown under
financial assets and liabilities held for trading.
– All financial assets designated as financial instruments measured at fair value through profit or loss upon initial recognition (fair value option).
We only use the fair value option for certain financial assets designated as at fair value through profit or loss upon initial recognition. In this context,
we have limited ourselves mostly to the designation option of the accounting mismatch by means of which recognition or measurement inconsisten-
cies are avoided or considerably reduced in economic hedges for which hedge accounting is not applied. Only for a specific, smaller portfolio is the
designation based on fair value-based risk management.
Both financial assets held-for-trading and fair-value-option portfolios are measured at fair value. Changes in value are recognised in the income
statement.
Loans and receivablesThe category “loans and receivables” includes non-derivative financial assets – both originated by us and acquired – with fixed or determinable payments
that are not quoted in an active market, unless they are classified as at fair value through profit or loss or available for sale (AfS). We classify as loans and
receivables leveraged buyout financing that we hold to maturity and leveraged buyout financing that we intend to outplace, as there is no short-term in-
tention to trade. Loans and receivables originated by the company are measured at amortised cost and capitalised under loans and receivables with
banks, and loans and receivables with customers. Premiums and discounts are taken to the income statement under net interest income over the term of
the underlying items.
Held-to-maturity investmentsHeld-to-maturity (HtM) investments are non-derivative financial assets with fixed or determinable payments and fixed maturity that an entity has the
positive intention and ability to hold to maturity, unless they are designated as at fair value through profit or loss, or available for sale. HtM financial instru-
ments are measured at amortised cost, with premiums and discounts taken to the income statement under net interest income over the term of the
underlying items.
Available-for-sale financial assetsAll other non-derivative financial assets are classified as available-for-sale (AfS) securities and receivables. A distinction is made within this category
between measurement at fair value and measurement at amortised cost.
– Debt instruments and equity instruments for which the fair value can be reliably determined are measured at fair value. The difference between the
fair value and amortised cost is carried in a separate item under the shareholders’ equity (AfS reserve) in the balance sheet until the asset is sold or
an impairment to be recognised in profit or loss has occurred. Premiums and discounts on debt instruments are taken to the income statement under
net interest income over the term of the underlying items.
F-14

102 2009 Annual Report · HypoVereinsbank
Financial Statements (2) | Consolidated Financial Statements
– Equity instruments for which there is no quoted market price in an active market and whose fair value cannot be reliably determined are measured at
amortised cost. Besides shares in unlisted companies, this primarily concerns investments in private equity funds, which we measure at cost. It is not
possible to reliably determine a fair value for these equity instruments since there is no active market in these instruments and, especially with regard
to investments in private equity funds, the Bank as shareholder with a small holding does not have enough influence to obtain the necessary data
promptly for a model-based determination of fair value. Consequently, they are not included in the AfS reserve.
The regulations set forth in IAS 39 regarding reclassifications have been observed. Purchases and sales of financial assets are normally recognised at the
trade date.
Determination of fair valueWe can normally reliably determine the fair value of financial instruments measured at fair value. Fair value is the amount for which an asset could be
exchanged, or a liability settled, between knowledgeable, willing parties in an arm’s-length transaction (other than in a forced or liquidation sale) at the
balance sheet date.
The fair value is determined in accordance with the following valuation hierarchy (IAS 39.48 et seq. in conjunction with IAS 39.AG 71 et seq.):
Listed prices on an active market are used as fair value:
– Prices on the closing date
– Prices shortly before the closing date to be adjusted to the extent that the economic data have changed materially since the date the price was deter-
mined
If there is no active market, the fair value is derived using valuation methods:
– The latest transactions between knowledgeable, willing parties in an arm’s-length transaction for an identical financial instrument are used
– The amount is compared with the current fair value of a different, essentially identical financial instrument
– Valuation models are used (such as discounting of expected cash flows, option price models or other valuation models normally used by market
players to value these financial instruments) as far as possible taking into account normal market valuation parameters
The own credit spread is also included in the underlying valuation parameters for liabilities held for sale. Suitable adjustments are taken on the fair values
determined in this way to reflect further factors affecting the fair value (such as the liquidity of the financial instrument or model risks when the fair value
is determined using a valuation model).
In addition to the method described above for the valuation or determination of fair values, the fair values in the hierarchy compliant with IFRS 7.27A are
shown in Note 75 for further information. A three-level fair-value hierarchy is listed for every class of financial asset and financial liability carried at fair
value in the balance sheet. Note 75 similarly contains a detailed description of this hierarchy, which is only used for the purpose of disclosure in the notes.
Financial guaranteesUnder IAS 39, a financial guarantee contract is a contract that requires the issuer to reimburse the holder for a loss it incurs because a specific debtor
fails to make payment when due in accordance with the original or modified terms of a debt instrument.
Viewed overall, the fair value of a financial guarantee is zero when the contract is concluded because the value of the premium received will normally
match the value of the guarantee obligation in standard market contracts. The guarantee premium is recognised on a pro-rata basis. The need for an
allowance to be taken for losses on guarantees is checked during the subsequent measurement.
Credit derivatives, and most notably standardised credit default swaps (CDSs), are measured at fair value through profit or loss as they are considered
derivatives held for trading and not financial guarantees.
Accounting and Valuation (CONTINUED)
F-15

HypoVereinsbank · 2009 Annual Report 103
Embedded derivativesOutside the portfolio held-for-trading purposes and designated at fair value through profit or loss, detachable embedded derivative financial instruments
within a structured product are detached from the underlying contract and recorded as separate derivative financial instruments. The underlying contract
is then accounted for in accordance with the classification made. The change in value arising from the derivatives that are detached and carried at fair
value is recognised in the income statement.
Hedge accountingHedges between financial instruments are recognised in accordance with the forms of the fair value hedge described in IAS 39. Since the end of 2008,
HVB Group has changed the previously applied macro cash-flow hedge accounting to the fair value hedge similarly permitted by IAS 39 for interest-rate
risks at the portfolio level; this is also described in the following in addition to the rules of the general fair value hedge.
A fair value hedge is a hedge of the exposure to changes in the fair value of a recognised asset, liability, or an unrecognised firm commitment – or an
identified portion thereof – that is attributable to a particular risk and that might affect net income for the period. In this respect, a high level of effective-
ness is required, with the changes in the fair value of the hedged item with regard to the hedged risk and hedging derivative compensating each other
within a range of 80% to 125%. In fair-value-hedge accounting, we use derivates to hedge changes in the fair value of recognised assets and liabilities.
Under this method, the hedging instrument is measured at fair value through profit and loss. The carrying amounts of the hedged item are adjusted by
the valuation results relating to the hedged risk in a way that affects the income statement.
In terms of the accounting treatment of hedges in asset/liability interest-rate risk management, we have adopted the change in the hedge-accounting
method applied in Germany at the end of 2008 at our foreign offices in London and New York in 2009 as well. In place of the previously used macro
cash-flow-hedge, we have prospectively applied the fair-value-hedge portfolio for interest-rate risks similarly permitted by IAS 39. The new approach to
hedging the fair value with regard to a portfolio of interest-bearing financial assets and liabilities makes it largely possible to also reflect the usual bank
risk-management procedures to hedge fixed interest-rate-risks in the balance sheet.
Under this accounting treatment of hedges across several items, the changes in the value of the hedged amount of the hedged items attributable to the
hedged risk are carried altogether as a separate asset or liability item, and not as an adjustment to the carrying amount of individual items as is the case
with micro hedges. The hedge adjustments have been recognised on a gross basis in the balance sheet for one subsidiary for which asset and liability
holdings can be hedged separately. The hedged amount of the hedged items is determined as part of interest rate risk management; the liabilities do not
contain any sight or savings deposits. Thus, we have not made use of sight and savings deposits in the hedged amount as permitted by the EU carved-out
version of IAS 39 in this regard. Where the hedge conditions are met, the offsetting changes in value of the hedged amount of the hedged items and the
hedging instruments (interest derivatives) are recognised directly in profit and loss. Hedge inefficiencies arising within the necessary hedge efficiency
thresholds of 80% to 125% are recognised as profit or loss in net hedging income.
The cash flow hedge reserve existing at the changeover date and the offsetting clean fair values of the existing cash-flow-hedge derivatives are amortised
over the remaining term of the hedging derivatives in net interest income. This means that they will have no overall impact on profit or loss in the future
until they are fully amortised. The changes in value of the same hedged items and hedging derivatives, together with all new contracts arising after the
changeover date are treated in accordance with the new fair-value-hedge portfolio model. To a minor extent, previous cash-flow-hedge derivatives have
no longer been included in the new fair value hedge. Their portion of the cash-flow-hedge reserve was immediately taken to the income statement in net
interest income. The subsequent measurement of these standalone derivatives is recognised in net trading income.
At the same time, HVB has employed a fair-value-hedge portfolio for interest rate risks since 2007 for a limited portfolio of liabilities.
We applied fair value hedge accounting for credit risks (micro fair value hedge) for the first time in 2009 alongside the existing portfolio fair value hedge
for interest rate risks. The purpose of hedge accounting for credit risks is to reduce the volatility in the income statement. This is done by including exist-
ing hedges in hedge accounting. Otherwise existing inconsistencies upon valuation (accounting mismatch) are corrected by hedge accounting.
F-16

104 2009 Annual Report · HypoVereinsbank
Financial Statements (2) | Consolidated Financial Statements
As part of hedge accounting for credit risks, the credit-induced changes in the fair value of a hedged item and the full-induced changes in the fair value of
a hedging instrument are offset. Remaining-term effects need to be adjusted in this context.
These remaining-term effects lead to a change in the credit-induced fair value over time without the current market credit spread changing. Among other
things, this includes a difference between the nominal amount and the credit-induced fair value at the inception of the hedge. Excluding the possibility of
an impairment, the credit-induced fair value on the settlement date will correspond to the nominal amount of the hedged item. Any difference between
the credit-risk-induced fair value and the nominal amount existing when the hedge is designated amortises over the remaining time (pull-to-par effect).
Differences like this can arise when hedged items are designated at a later date rather than when originated, for instance, since the contractually agreed
credit spread does not generally match the normal market credit spread at the inception of the hedge in such cases.
The change in the credit-induced fair value determined in this way (after adjustment for remaining-term effects) is taken to the income statement under
effects arising from hedge accounting in net trading income. Where the hedged items are assets recognised in the balance sheet, the carrying amount is
adjusted for the changes in the credit-induced fair value. Irrevocable credit commitments (fixed commitments not shown in the balance sheet), on the
other hand, are not recognised in the balance sheet. The credit-related changes in the fair value relating to these are carried under other assets in the
balance sheet.
We show the associated hedging instruments at their fair value as hedging derivatives; the changes in the fair value are similarly taken to the income
statement as effects arising from hedge accounting in net trading income.
The hedge is terminated compliant with IAS 39.91 if either the hedging instrument or the hedged item expires, the hedge is no longer efficient or the
Bank decides to terminate the hedge.
When the hedge is terminated, the credit-induced changes in the fair value accruing to that date with regard to the hedged risk (hedge adjustment) are
amortised over the remaining term of the hedged item. This amortisation is disclosed in net interest income. If the hedged item similarly expires upon
termination of the hedge exceptionally (in the event of early repayment by the borrower, for instance), the hedge adjustment accruing to that date is taken
directly to the income statement.
If the hedging instrument does not expire at the end of the hedge, it is designated as held for trading and continues to be recognised at fair value under
net trading income.
8 Assets held for trading purposesThis item includes securities held for trading purposes and positive market values of traded derivatives. All other derivatives not classified as hedging
derivatives (which are shown separately in the balance sheet) are similarly considered held for trading. This includes standardised credit default swaps
(CDSs) concluded outside the held for trading portfolio, which are measured in the same way as traded derivatives.
Provided they are held for trading purposes, promissory notes, registered bonds and treasury bills are carried as other financial assets held for trading.
Financial assets held for trading purposes are carried at fair value. Gains and losses arising from the valuation and realisation of financial assets held for
trading are taken to the income statement as gains less losses arising from trading securities.
9 Financial assets at fair value through profit or lossHVB Group mainly applies the fair-value option for financial assets with economic hedges for which hedge accounting is not applied. The designation
removes or significantly reduces differences resulting from an accounting mismatch. The portfolio mostly comprises interest-bearing securities not held
for trading that are hedged against interest rate risks by means of interest rate swaps. In the case of promissory note receivables similarly included here,
there is no material fair value change in terms of the credit risk on account of the top rating of the issuers. Changes in fair value of the hedged items and
the associated derivatives are shown separately in net trading income; current interest income/expenses are recognised in net interest income. Alongside
an accounting mismatch as the main grounds for designation, the designation for a specific, smaller portfolio is based on fair value-based risk manage-
ment.
Accounting and Valuation (CONTINUED)
F-17

HypoVereinsbank · 2009 Annual Report 105
10 Available-for-sale financial assets We recognise interest-bearing securities, equities and other equity-related securities, investment certificates and participating interests as available-for-
sale financial instruments under available-for-sale financial assets in the balance sheet.
Available-for-sale financial instruments that are effectively hedged against market risk are recorded as part of fair-value hedge accounting.
Available-for-sale financial instruments also include shares in non-consolidated subsidiaries. Furthermore, joint ventures and associates not accounted
for using the equity method are subsumed in available-for-sale financial instruments, provided they are not significant.
Listed companies are always carried at fair value. Where the fair value cannot be determined reliably for non-listed companies, they are valued at cost.
11 Shares in associated companies and joint ventures accounted for using the equity methodInvestments in joint ventures and associated companies are accounted for using the equity method.
12 Held-to-maturity investmentsHVB Group has classified interest-bearing assets as held to maturity and recognised them under held-to-maturity investments. Held-to-maturity invest-
ments are measured at amortised cost; the resulting interest income is included in net interest income.
13 Loans and receivablesLoans and receivables are recognised in the balance sheet under loans and receivables with banks, and loans and receivables with customers. They
are carried at amortised cost, provided they are not hedged items of a recognised fair value hedge. The amount shown in the balance sheet has been
adjusted for allowances for losses on loans and receivables.
14 Impairment of financial assetsImpairment losses are recognised for financial assets that are measured at amortised cost and classified as available for sale.
An impairment loss is determined in two steps. First, an assessment is made to see if there is any objective evidence that the financial asset is impaired.
The second step involves assessing whether the financial instrument actually is impaired.
Objective evidence of impairment refers to events that normally lead to an actual impairment. In the case of debt instruments, these are events that could
result in the borrower not being able to settle his obligations in full or at the agreed date. In the case of equity instruments, significant or prolonged lower
market values compared with the carrying amount represent objective evidence of impairment.
Objective evidence is provided only by events that have already occurred, not anticipated events in the future.
How an impairment is determined for each relevant category is described below.
In the case of loans and receivables and held-to-maturity financial instruments, an impairment is the difference between the carrying amount and the
present value of the anticipated future cash flows. The future cash flows are determined taking into account past events (objective evidence). The antici-
pated future cash flows may comprise the repayment and/or interest payments still expected and the income from the realisation of collateral. The
impairment is the difference between the present value of the antici pated future cash flows and the carrying amount. A specific loan-loss provision is
recognised for the impairment determined in this way.
Held-to-maturity investments are handled similarly.
F-18

106 2009 Annual Report · HypoVereinsbank
Financial Statements (2) | Consolidated Financial Statements
During subsequent measurement, both changes in the anticipated future cash flows and the time effect arising from a reduction of the discounting period
are taken into account. The difference between the newly determined present value of the anticipated future cash flows at each balance sheet date and
the carrying amount at the previous balance sheet date is recognised as a reversal of, or an addition to, allowances for losses on loans and receivables.
In the case of loan receivables, the impairment determined in this way is posted to an impairment account which reduces the carrying amount of the
receivable on the assets side. In the case of securities, an impairment directly reduces the carrying amount of the security.
In the case of financial guarantees, a possible impairment is determined in the same way; the impairment loss is recognised as a provision.
Specific loan-loss allowances or provisions to the amount of the anticipated loss have been made individually to cover all identifiable default risks arising
from lending operations (loans, receivables and financial guarantees), with the amount of the expense being estimated. Specific loan-loss allowances are
also determined on a collective basis for individual cases where the amounts involved are not significant. These allowances are recognised and disclosed
within specific loan-loss allowances at HVB Group. Specific loan-loss allowances are reversed as soon as the reason for forming the allowance no longer
exists, or used if the receivable is classified as uncollectable and written off. Acute country-specific transfer risks are included in this process.
In the case of receivables (and guarantees) for which no specific allowances have been formed, portfolio allowances are set up to cover losses (= impair-
ments) that have been incurred but not yet recognised by the Bank at the balance sheet date. We apply the loss confirmation period method for this. The
loss confirmation period represents the period between a default event occurring or a borrower defaulting, and the point at which the Bank identifies the
default. The loss confirmation period is determined separately for various credit portfolios on the basis of statistical surveys. The loss that has occurred
but has not yet been recognised is estimated by means of the expected loss.
In the case of assets classified as available for sale, a distinction is made between debt and equity instruments.
A debt instrument is impaired when an event occurs that results in the borrower not being able to settle his obligations in full or at the agreed date.
Essentially, an impairment exists in the same cases as for loan receivables from the same borrower (issuer).
The amount of the impairment is defined as the difference between the amortised cost and the current fair value, whereby the difference first recognised
in the AfS reserve in the balance sheet is taken to the income statement when an impairment occurs.
Should the reason for the impairment no longer apply, the difference between the higher market value and the carrying amount at the previous balance
sheet date is written back in the income statement up to the amount of initial cost. If the current market value at the balance sheet date exceeds the initial
cost, the difference is recognised in the AfS reserve under shareholders’ equity.
In the case of equity instruments carried at fair value, an impairment exists if the current fair value is significantly below the carrying amount or if the fair
value has remained below the carrying amount for a prolonged period of time. Where this is the case, the difference between the current fair value and
initial cost is recognised as profit or loss in the income statement. Such an impairment recognised in profit or loss has to be considered for the new
cost basis required for the calculation of the AfS reserve. If the fair value rises in the future, the difference between a higher fair value and the initial cost
adjusted as described is recognised in the AfS reserve under shareholders’ equity.
Equity instruments valued at cost are considered impaired if the present value is significantly or permanently less than the acquisition cost (or, if an
impairment has already been recognised in the past, it is less than the acquisition cost less the recognised impairment loss). If there is objective evidence
of an impairment, the present value of the equity instruments must be determined. The estimated future cash flows discounted by the current market
return on a comparable asset are used as the basis for determining this value. The amount of the impairment is calculated as the difference between the
present carrying amount and the value of the equity instrument determined as described above. The impairment is taken to the income statement. An
impairment of an equity instrument is not permitted to be reversed if the reasons for the impairment no longer apply.
Accounting and Valuation (CONTINUED)
F-19

HypoVereinsbank · 2009 Annual Report 107
15 Property, plant and equipmentProperty, plant and equipment is valued at acquisition or production cost less depreciation – insofar as the assets are depreciable – using the straight-
line method based on the assets’ useful lives. Fixtures in rented buildings are depreciated over the term of the rental contract, taking into account any
extension options, if this is shorter than the normal useful life of the asset concerned.
PROPERTY, PLANT AND EQUIPMENT USEFUL ECONOMIC LIFE
Buildings 25 – 50 years
Fixtures in buildings not owned 10 – 25 years
Computer equipment 3 – 5 years
Other plant and office equipment 3 – 25 years
Impairments are taken on property, plant and equipment whose value is impaired. Should the reasons for the impairment no longer apply, a subsequent
write-up is taken to the income statement; the amount of this subsequent write-up must not increase the value of the property, plant and equipment to a
level in excess of the amortised acquisition or production cost.
Subsequent expenditure relating to an item of property, plant and equipment is capitalised, provided additional future economic benefits will flow to the
Bank. Expenditure on repairs or maintenance of property, plant and equipment is recognised as expense in the year in which it is incurred.
16 Lease operationsUnder IAS 17, lease operations are divided into finance leases and operating leases. Unlike an operating lease, a finance lease is a lease that transfers
substantially all the risks and rewards incident to ownership of an asset to the lessee. Title may or may not eventually be transferred.
HVB Group as lessor
Under finance leases, the lessor recognises the leased asset in the balance sheet as a receivable from the lessee at an amount equal to the net invest-
ment in the lease. The lease payments are broken down into the finance charge and the redemption payment. The redemption payment reduces the
amount of the outstanding liability (net investment); the finance charge is treated as interest income. Interest and similar income are recognised on the
basis of a constant, periodic rate of return relating to the net investment outstanding. The term “net investment” is defined in detail in Note 50, “Loans
and receivables with customers”. HVB Group currently leases mobile assets as a lessor under finance leases.
In contrast, assets held under operating leases attributable to the lessor are recognised as, and valued using the same principles as, property, plant and
equipment. Revenue under these arrangements is recognised on a straight-line basis over the lease term. HVB Group currently leases movable assets
as a lessor under operating leases.
HVB Group as lessee
Under a finance lease, the asset is recognised as property, plant and equipment, and the obligation is recognised as a liability. Each asset is stated at the
lower of the following two values: either the fair value of the leased asset at the inception of the lease or, if lower, the present value of the minimum lease
payments. In calculating the present value of the minimum lease payments, the interest rate implicit in the lease is applied.
The lease payments relating to finance leases are broken down into two components: the finance charge and the redemption payment. The redemption
payment reduces the residual liability, and the finance charge is shown as interest expense.
Lease payments relating to operating leases are recognised under other operating costs or, if they comprise rental expenses, under operating costs. The
correspond ing leasing assets are not recognised. Contracts in which HVB Group acts as lessee are comparatively insignificant.
17 Investment propertyCompliant with IAS 40.30 in conjunction with IAS 40.56, land and buildings held by us as investments with a view to generating rental income and/or
capital gains are normally carried at amortised cost and written down on a straight-line basis over a useful economic life of 25–50 years.
F-20

108 2009 Annual Report · HypoVereinsbank
Financial Statements (2) | Consolidated Financial Statements
We only made use of the provision set forth in IAS 40.32A for a defined portfolio of investment property until 30 September 2009. This regulation allows
an entity to measure at fair value through profit or loss any investment properties whose fair value determines the extent of the repayment of liabilities
linked to the investment properties, even if all other investment property is measured at amortised cost.
The fair values stated for this defined portfolio of investment properties were determined as part of an appraisal performed by external experts compliant
with Section 194 of the German Building Code (Baugesetzbuch – BauGB). This involved determining fair values on the basis of sustainable rents. When
these values were determined, non-recurring effects were taken into account such as differences between contractual rents and sustainable rents.
Current expenses and rental income from investment property is disclosed in net other expenses/income. Scheduled depreciation on such investments
carried at amortised cost is included in operating expenses, whereas impairments are recognised in net income from investments. Changes in the value
of investments carried at fair value through profit or loss are similarly included in net income from investments. No scheduled depreciation is recognised
for these instruments as they are measured at fair value.
18 Intangible assetsThe main items included in intangible assets are goodwill arising from the acquisition of fully consolidated subsidiaries and software. An intangible asset
shall only be recognised if it is probable that the expected future economic benefits attributable to the asset will flow to the entity and the cost of the asset
can be measured reliably. Compliant with IAS 36, depreciation is no longer taken on goodwill. The value of goodwill is tested annually and where there is
an indication of impairment. Impairments are taken where necessary. Software is valued at amortised cost and written down over an expected useful life
of three to five years. All other intangible assets are amortised over a period of up to ten years, as they have a limited useful life.
19 Assets of discontinued operations and non-current assets or disposal groups held for saleUnder IFRS 5, assets of discontinued operations and non-current assets or disposal groups held for sale are carried at the lower of the carrying amount or
fair value less costs to sell at the balance sheet date.
20 LiabilitiesDeposits from banks and customers, and debt securities in issue that are not hedged items of an effective micro fair value hedge are reported at amort-
ised cost.
21 Financial liabilities held for tradingThis item includes the negative market values of traded derivatives and all other derivatives that are not classified as hedging derivatives (which are
recognised separately). Also included here are warrants, certificates and bonds issued by our trading department as well as delivery obligations arising
from short sales of securities held-for-trading purposes.
Financial liabilities held for trading are carried at fair value. Gains and losses arising from the valuation and realisation of financial liabilities held for
trading are taken to the income statement under net trading income.
We act as market maker for the structured products we issue.
22 Hedge adjustment of hedged items in the fair value hedge portfolioNet changes in the value of the hedged amount of hedged items are carried in this hedge adjustment of the fair value hedge portfolio to be shown sepa-
rately (see Note 65). The hedge adjustments have been recognised on a gross basis in the balance sheet for one subsidiary for which asset and liability
holdings can be hedged separately.
23 Other liabilitiesCompliant with IAS 37, accruals and other items are shown under other liabilities. These reflect future expenditure of uncertain timing or amount, but
the uncertainty is much less than for provisions. Accruals are liabilities for goods and services provided or received that have been neither paid for nor
invoiced by the supplier nor formally agreed. This also includes current liabilities to employees, such as flexi-time credits and outstanding vacation.
Accruals are carried at the amount likely to be used.
Accounting and Valuation (CONTINUED)
F-21

HypoVereinsbank · 2009 Annual Report 109
Furthermore, shares held by other investors in the capital of a consolidated investment fund were disclosed under other liabilities up to the end of
September 2009. Since these investors were entitled to return their shares in the fund at the redemption price at any time, their shares represent liabili-
ties from the Group point of view. These liabilities are measured at the respective redemption price. Changes in the value of the redemption price were
recognised in the income statement up to and including September 2009.
24 ProvisionsPresent legal or constructive obligations as a result of past events involving a probable outflow of resources, and whose amount can be reliably estima ted,
are recognised as provisions.
When assessing provisions for uncertain liabilities and anticipated losses on onerous transactions, we use a best estimate compliant with IAS 37.36 et
seq. Long-term provisions are discounted.
In accordance with IAS 19, we use actuarial principles to determine the provisions for pensions and similar commitments. The amounts are calculated
using the projected unit credit method, taking into account the present value of the defined benefit obligations, the fair value of plan assets, and unreal-
ised actuarial gains and losses. Causes of such gains and losses include variances between the actual and the predicted risk profiles (e.g. higher or lower
rates of early retirement or mortality than anticipated in the calculation principles applied) and changes in the applicable parameters.
We exercise the option for recognising unrealised actuarial gains or losses in shareholders’ equity permitted in IAS 19.93A, “Employee benefits”.
The discount rate is based on the long-term interest rate for prime, fixed-yield corporate bonds at the balance sheet date. The amount of the provision
shown in the balance sheet is calculated as the present value of the obligation determined at the end of the financial year less the fair value of the plan
assets determined at the end of the financial year. The plan assets set up by UniCredit Bank AG and a number of subsidiaries to fund pension obligations
are described in detail in Note 69, “Provisions”.
25 Foreign currency translationThe consolidated financial statements are prepared in euros, the reporting currency of the corporate group. Amounts in foreign currency are translated in
accordance with the principles set forth in IAS 21. This standard calls for monetary items not denominated in the respective functional currency (generally
the local currency in each case) and cash transactions not completed at the valuation date to be translated into euros using market rates applicable on
the balance sheet date. Non-monetary items carried at fair value are similarly translated into euros using market rates applicable on the balance sheet
date. Non-monetary items carried at cost are translated using the rate applicable at the time of acquisition.
Income and expense items arising from foreign currency translation at the individual Group companies are stated under the appropriate items of the
income statement.
Where they are not stated in euros, the balance sheet items reported by our subsidiaries are translated using current market rates at the balance sheet
date in the consolidated financial statements. Transaction rates are used to translate the income and expenses of these subsidiaries.
Exchange rate differences resulting from the translation of a foreign operation are recognised in shareholders’ equity without affecting profit or loss and
are only taken to the income statement if the operation is sold in part or in full.
26 Income tax for the periodIncome tax for the period is accounted for in accordance with the principles set forth in IAS 12. Apart from a few exceptions allowed for in the standard,
deferred tax assets and liabilities are recognised for all temporary differences between the values stated in accordance with IFRS and the values stated for
tax-reporting purposes (balance sheet approach). Deferred tax assets arising from unused losses carried forward for tax-reporting purposes are shown
where permitted by IAS 12.
Since the concept is based on the approach of future tax assets and liabilities under the liability method, the assets and liabilities are computed using the
tax rates that are expected to apply when the differences are reversed.
F-22

110 2009 Annual Report · HypoVereinsbank
Financial Statements (2) | Consolidated Financial Statements
27 Notes to segment reporting by divisionIn segment reporting, the market-related activities of HVB Group are divided into the following globally active divisions: Corporate & Investment Banking,
Retail, and Wealth Management.
Also shown is the Other/consolidation segment that covers Global Banking Services (GBS) and Group Corporate Centre activities and the effects of
consolidation. The Special Credit Portfolio (SCP) defined in 2006 and the remaining holdings of the customer portfolio of Real Estate Restructuring are
included in GBS.
Method of segment reportingSegment reporting is based on the internal organisational and management structure together with internal financial reporting. In accordance with IFRS 8
(Operating Segments), segment reporting thus follows the Management Approach, which requires segment information to be presented externally in the
same way as regularly used by the Management Board as the responsible management body when allocating resources (especially risk-weighted assets
compliant with Basel II) to the business segments and assessing profitability (profit before tax). Since the income statement of HVB Group broken down
by segment is reported internally to the Management Board of HVB down to profit before tax, we have also taken the profit before tax as the basis for
external reporting. In this context, the segment data is determined in accordance with International Financial Reporting Standards (IFRS).
In segment reporting, the divisions operate as autonomous companies with their own equity resources and responsibility for profits and losses. The div-
isions are delimited by responsibility for serving customers. For a description of the customer groups assigned to the individual segments and the main
components of the segments, please refer to the section entitled “Components of the segments of HVB Group” below.
The total revenues shown in the segments, such as net fees and commissions and net trading profit, are based almost exclusively on transactions involv-
ing external customers. Net interest income is assigned to the segments in accordance with the market interest calculation method on the basis of the
external interest income and interest expenses. For this reason, a separate presentation broken down by external/internal revenues (total revenues) has
not been included. The equity capital allocation used to calculate the return on investment on companies assigned to several divisions is based on a
uniform core capital allocation for each division. This involves allocating 6.4% of core capital from risk-weighted assets to the divisions. The average tied
core capital calculated in this way is used to compute the return on investment, which is disclosed under net interest income. We have used risk-weight-
ed assets compliant with Basel II as the criter ion for allocating tied equity capital since 1 January 2009. The figures for the previous year have been
adjusted accordingly to reflect the modified allocation of tied equity capital. The percentage used to assess the equity capital allocated to the companies
assigned to several divisions (HVB, UniCredit Luxembourg) equals the 5-year average of the 5-year euro swap rate plus a premium in the amount of the
5-year average of the 5-year UniCredit S.p.A. spread. This rate is set for one year in advance as part of each budgeting process. The percentage changed
from 3.97% in 2008 to 4.30% for the 2009 financial year. Equity capital is not standardised for the other companies included in the consolidated finan-
cial statements.
The income of €7 million from investments in associated companies relates to UGIS, a company accounted for using the equity method, and is assigned
to the Other/consolidation segment. The amount involved is disclosed under net interest income in the income statement. The carrying amount of this
company accounted for using the equity method is €88 million.
Operating costs, which contain payroll costs, other administrative expenses, amortisation, depreciation and impairment losses on tangible and other
intangible assets (without goodwill), are allocated to the appropriate division according to causation. Global Banking Services and the Group Corporate
Centre are treated as external service providers, charging the divisions for their services at a price which covers their costs. The method of charging the
costs of general bank services that cannot be allocated directly involves identifying the overhead costs for each segment individually in the budgeting
process, and setting them in the form of a fixed premium on the direct and indirect costs for the appropriate financial year. The vast majority of the
depreciation and impairment losses taken on property, plant and equipment is posted by the Other/consolidation segment via the real estate companies
of HVB Group included in the Global Banking Services activities.
Segment Reporting
F-23

HypoVereinsbank · 2009 Annual Report 111
Several changes were made to the segment assignments in 2009, the most important of which are listed below:
– As one of the measures implementing the strategic reorientation of the former Markets & Investment Banking and Corporates & Commercial Real
Estate Financing divisions, these divisions were consolidated in the new Corporate & Investment Banking division for the first time in the third quarter
of 2009. In doing so, we have geared the earlier investment banking activities more strongly to the needs of our corporate customers in response to
the changed market environment.
– The DAB Group, which acts as a direct bank in HVB Group, was assigned to the Retail division for the first time in the second quarter of 2009. The
DAB Group had previously been included in the Wealth Management division.
– Besides this, a number of smaller reorganisations have taken place, leading to modified assignments notably in net interest income and operating
costs.
The figures for the comparable periods in the previous year have been adjusted to take account of these changes.
Components of the segments of HVB Group
Corporate & Investment Banking divisionThe Corporates & Commercial Real Estate Financing and Markets & Investment Banking divisions have been reorganised and consolidated to form a new
division known as Corporate & Investment Banking (CIB). This move is intended to help HVB evolve into an integrated corporate and investment bank
and can also be viewed as a consequence of the financial and economic crisis. The investment banking products have been revised to make them more
accessible for customers and the customer relationship is more fully emphasised. The formation of CIB serves to secure a standardised business logic, a
stricter, more uniform process and management environment, and an increase in efficiency.
In the new organisational structure, four independent product units act as suppliers of innovative, specialised products for the regional distribution
network in corporate banking and for the other divisions. These are: Markets, Financing & Advisory (F&A), Global Transaction Banking (GTB) and Leasing.
At the same time, Markets and F&A represent the centres of competence within UniCredit Group.
We serve our 78,000 or so corporate customers through our distribution network, concentrating on their needs in areas such as restructuring questions,
growth and cross-border expansion. Our customers in Germany include corporations with revenues in excess of €3 million, the public sector, commercial
real estate customers and institutionals. The corporate banking business provides various relationship models based on different customer requirements.
CIB covers all the banking needs of corporate customers. Lending is, and is set to remain, our core business, associated with an appropriate proportion of
our customers’ other financial activities. We aim to build stable, strategic business partnerships by leveraging physical and logical proximity, and provid-
ing high-quality advice and solutions in both commercial and investment banking. We play a creative role with the customer, actively driving and shaping
strategic issues as part of a dialogue. This also includes our expertise in sector-specific underlying conditions and developments.
As part of a leading corporate and investment bank in Europe, we support our customers through our European network. The division also has a presence
in all the key financial centres in the world.
Our markets activities focus on the oversight of IPOs and capital increases, and the syndication of equities, bond products and structured products.
These operations are conducted primarily by the Equity Capital Markets unit for equity products and structured products based on equities, and the Debt
Equity Markets unit for debt instruments such as corporate bonds, Pfandbriefs and debentures, and the associated risk transfer. The Corporate Treasury
Sales unit provides professional financial risk management involving a wide range of advisory services and products covering all possible ways of hedging
entrepreneurial risks, such as liquidity management (including asset management, deposits and investments), foreign exchange and innovative deriva-
tives.
F-24

112 2009 Annual Report · HypoVereinsbank
Financial Statements (2) | Consolidated Financial Statements
F&A combines financing and advisory expertise in a heavily integrated product platform. The broad range of structured transactions in financing activities
includes advising the customer on corporate strategy and, in M&A situations, on acquisition and project loans, more complex transactions, syndications
and subordinated capital. Our global shipping activities now come under the F&A umbrella as well.
GTB pools our competencies (product development and services) in e-business, cash management and foreign trade financing. The Leasing unit covers
everything from small contracts to special financing solutions for larger transactions.
Major subsidiaries assigned to this division include UniCredit Luxembourg S.A., which is assigned to several divisions, UniCredit Leasing Finance GmbH,
HVB Global Assets Company L.P., HVB Capital Asia Ltd., and HVB Capital Partners AG.
Retail division We divide our customers into three strategic target groups: mass market, affluents and business customers. In order to tie customers to the Bank, we
serve the three target groups with different service models that reflect their individual needs. Our main aim in the mass-market target group is to increase
product penetration by providing demand-based advice and expanding online banking. We are also looking to secure further growth in the target groups
of affluents and business customers. To do so, we are continuing to invest in systematic customer contact, constantly refining both our needs-based
approach and our products.
In our mass market operations, the Willkommenskonto continued to be warmly received by customers with demand remaining strong. The product
again succeeded in gaining a number of awards over the past financial year.
Demand from customers for the EC cards with special designs remained high. The number of cards issued has now passed the 100,000 mark and the
range of designs has been expanded to more than 150. As last year, we again succeeded in meeting the strong demand from our customers for overdraft
facilities and consumer loans with market-based terms. In this area, the financial crisis did not lead to any bottlenecks whatsoever in terms of lending.
The cooperation with Wüstenrot Bausparkasse AG initiated during the last financial year enabled us to offer our customers attractive, competitive savings-
and-loan products, for example one for owner-occupied residences financed as part of a state-subsidised pension scheme.
The continued uncertainty on the stockmarkets was also reflected among our affluent customers. Safe investments with capital guarantees proved
extremely popular as a result.
Secure investments also dominated on the securities side. Therefore, we added a new product type, the HVB VermögensDepot privat Defensiv to our
wealth management offerings, rounding out our portfolio of core investments. Strong inflows were also recorded by high quality bond funds, such as the
F&C HVB Stiftungsfonds, as well as satellite investments used to diversify portfolios, such as alternative investments and closed-ended funds.
The successful insurance product HVB AktivRente was enhanced by a new line of funds, with a tax-optimised variant added at the end of the third
quarter, targeted primarily at affluent and business customers.
The business model used by the securities experts for this customer segment was also modified. The specialists now focus on customers with an invest-
ment volume of more than €250,000, notably in the field of securities but also for pensions as well. In addition, the specialists are specifically targeting
business customers with a view to meeting their private investment needs as well as to tying the customers more firmly to the Bank and drawing in new
money.
Despite the difficult economic climate, HVB remained a reliable lender to the target group of business customers in 2009. We had already met our
commitment to extend new credit lines worth €1 billion in 2009 after three quarters of the year. The strategic focus for lending products in 2009 was on
state-backed special credit programmes that enabled our customers to meet their financing requirements to best effect.
Moreover, we have expanded our Business Class service model, which allows customers to use their same account managers for both business and
private needs. We also extended the use of our all-round Business Dialog advisory tool in 2009.
Segment Reporting (CONTINUED)
F-25

HypoVereinsbank · 2009 Annual Report 113
In the fourth quarter of 2009, we rolled out an innovative account package known as HVB Konto4Business. Alongside an attractive account, the package
features value-added services, such as access to the mailing factory of our cooperation partner Deutsche Post, specialist seminars and free marketing
advice. This initiative enabled us to acquire more than a thousand new customers for our Bank in the fourth quarter of 2009 alone.
We manage our real estate financing activities across all target groups. We have continued to provide our mass-market, affluent and business
customers with plenty of capital to finance property investments. In doing so, we not only used our own funding, but also offered our customers the full
product range of the market from our 40 partner banks. We succeeded in enhancing the quality of the advice we provide, receiving top marks for this
from the German Institute for Service Quality. We achieved attractive margins overall. By extending funds from the German reconstruction and develop-
ment bank (KfW), we funded investments aimed at enhancing energy efficiency by renovating and modernising existing properties.
Wealth Management divisionThe Wealth Management division has set itself the goal of optimally meeting the specific expectations of wealthy customers with regard to a bank and the
services it offers in line with demand. The division serves customers with an aggregate investment volume of €39 billion. Wealth Management is divided
into three subdivisions.
HVB Wealth Management (WEM)This unit serves 38,563 UniCredit Bank AG customers with assets under management of €21.4 billion. Our 500 or so employees offer individual, personal
advice at 44 locations throughout Germany. Customers and customer groups with liquid assets in excess of €0.5 million are offered all-round, bespoke
advice; the Family Office serves family groups with complex assets of more than €30 million.
WEM’s strategic objectives are to satisfy high net worth individuals with a comprehensive range of advisory services, attractive products and outstanding
customer relationships, and to increase its market share in the highly competitive wealth management environment. WEM aspires to quality leadership in
the German market.
Wealth Management Capital Holding (WMC)WMC structures and issues sophisticated investment products that are perfectly and exclusively tailored to the Wealth Management customer group. It is
one of the biggest initiators of closed-ended funds in Germany. Around 127,000 customers are served by some 236 employees in this unit.
UniCredit LuxembourgHVB Banque Luxembourg S.A. was renamed UniCredit Luxembourg S.A. on 1 August 2009. UniCredit Luxembourg provides access to the financial centre
of Luxembourg for the customers of HVB Group. Together with the HVB Wealth Management subdivision, UniCredit Luxembourg has devised solutions
that enable its customers to benefit from the advantageous underlying conditions offered by Luxembourg as a financial centre. The Private Banking unit
based on Luxembourg provides specialised portfolio solutions for 13,362 customers with an investment volume of €12.4 billion and employs 84 people.
Other/consolidation segmentThe Other/consolidation segment encompasses Global Banking Services and Group Corporate Centre activities, and consolidation effects.
Global Banking Services activities encompass purchasing, organisation, logistics and facility management, cost management and back-office functions
for credit, accounts, foreign exchange, money market and derivatives. Payments, securities services and IT application development and operation have
been outsourced. The Special Credit Portfolio (SCP) defined in 2006 is also included together with the remaining holdings from the Real Estate Restruc-
turing portfolio.
The Group Corporate Centre activities include profit contributions that do not fall within the jurisdiction of the individual divisions. Among other items,
this includes the profits and losses of consolidated subsidiaries for which HVB’s strategic property management function is responsible, such as HVB
Immobilien AG and its subsidiaries, and of non-consolidated holdings, provided they are not assigned to the divisions, together with the net income from
securities holdings for which the Management Board is responsible. Also incorporated in this segment are the amounts arising from decisions taken by
management with regard to asset/liability management.
F-26

114 2009 Annual Report · HypoVereinsbank
Financial Statements (2) | Consolidated Financial Statements
Segment Reporting (CONTINUED)
28 Income statement broken down by division (€ millions)
CORPORATE &
INVESTMENT
BANKING RETAIL
WEALTH
MANAGEMENT
OTHER/
CONSOLIDATION HVB GROUP
TOTAL REVENUES
2009 4,679 1,478 253 520 6,930
2008 1,392 1,741 302 542 3,977
Operating costs
2009 (1,672) (1,316) (171) (303) (3,462)
2008 (1,667) (1,442) (181) (205) (3,495)
OPERATING PROFIT/(LOSS)
2009 3,007 162 82 217 3,468
2008 (275) 299 121 337 482
Restructuring costs
2009 (87) (63) (3) (17) (170)
2008 (8) — — (18) (26)
Net write-downs of loans
and provisions for guarantees
and commitments
2009 (1,536) (63) 4 (6) (1,601)
2008 (877) (72) 5 184 (760)
Net income from
investments and other items1
2009 (413) (7) (9) (2) (431)
2008 (199) (19) (5) (68) (291)
PROFIT/(LOSS) BEFORE TAX
2009 971 29 74 192 1,266
2008 (1,359) 208 121 435 (595)
1 contains the following income statement items: provisions for risks and charges and net income from investments
F-27

HypoVereinsbank · 2009 Annual Report 115
Income statement of the Corporate & Investment Banking division (€ millions)
INCOME/EXPENSES 2009 2008
Q4
2009
Q3
2009
Q2
2009
Q1
2009
Net interest income 3,237 2,659 733 755 818 931
Net fees and commissions 516 587 137 122 132 125
Net trading income 927 (1,874) 72 582 569 (296)
Net other expenses/income (1) 20 (5) 2 2 —
Net non-interest income 1,442 (1,267) 204 706 703 (171)
TOTAL REVENUES 4,679 1,392 937 1,461 1,521 760
Payroll costs (686) (622) (211) (176) (146) (153)
Other administrative expenser (976) (1,038) (228) (247) (250) (251)
Amortisation, depreciation and impairment
losses on intangible and tangible assets (10) (7) (6) (1) (1) (2)
Operating costs (1,672) (1,667) (445) (424) (397) (406)
OPERATING PROFIT/(LOSS) 3,007 (275) 492 1,037 1,124 354
Restructuring costs (87) (8) 125 — (163) (49)
Net write-downs of loans and provisions
for guarantees and commitments (1,536) (877) (145) (496) (681) (214)
Net income from investments and other items1 (413) (199) (111) (213) (75) (14)
PROFIT/(LOSS) BEFORE TAX 971 (1,359) 361 328 205 77
Cost-income ratio in % 35.7 119.8 47.5 29.0 26.1 53.4
1 contains the following income statement items: provisions for risks and charges and net income from investments
Development of the Corporate & Investment Banking division The total revenues of the Corporate & Investment Banking division increased by €3,287 million to €4,679 million during the year under review. With oper-
ating costs remaining roughly the same, this gave rise to a strong operating profit of €3,007 million. An operating loss of €275 million was generated in
2008 on the back of a net trading loss.
Net interest income improved greatly year-on-year, rising €578 million or 21.7%. This increase can be attributed primarily to much higher trading-related
interest income together with the positive effects arising from the amortisation of assets reclassified compliant with IAS 39. Net interest income from
our corporate banking operations improved as a result of higher volumes in the short-term bracket. Moreover, interest margins climbed across all areas
of our lending operations. At the same time, the dividends included in net interest income declined essentially on account of lower dividend payouts by
private equity funds.
Fee and commission income fell by €71 million, or 12.1%. This can be attributed to lower income from cash management, operations involving interest
rate hedging instruments for corporate customers and reluctance on the part of market players, primarily affecting the Project Finance, Commodity
Finance and Corporate Solutions units. At the same time, Corporate Finance Fees recorded better results again.
Net trading income improved strongly as a result of the recovery across the entire capital market, rising by €2,801 million compared with 2008 to
€927 million (2008: net loss of €1,874 million). Besides the Fixed Income (fixed-income and foreign exchange products) and Equities (equity and index
products) units, Credit Markets (credit-related products and credit derivatives) and Capital Markets (IPOs, capital increases, bonds) units in particular
posted significant growth.
At €1,672 million, operating costs remained practically unchanged from the 2008 total of €1,667 million. The cost-income ratio improved to the excellent
level of 35.7% (2008: 119.8%) as a result of the strong increase in total revenues.
Restructuring costs of €87 million were incurred as part of the strategic reorientation of the Corporate & Investment Banking division. The loss of
€413 million reported under net income from investments and other items results chiefly from valuation expenses relating to private equity funds and
direct and co-investments.
Net write-downs of loans and provisions for guarantees and commitments rose sharply to €1,536 million in 2009 (2008: €877 million) on account of
the far worse credit environment. Despite the adverse effects caused by the net write-downs of loans and provisions for guarantees and commitments,
the net loss from investments and other items, and the non-recurring restructuring costs, the division concluded the financial year with a pleasing profit
before tax of €971 million (2008: loss of €1,359 million).
F-28

116 2009 Annual Report · HypoVereinsbank
Financial Statements (2) | Consolidated Financial Statements
Income statement of the Retail division (€ millions)
INCOME/EXPENSES 2009 2008
Q4
2009
Q3
2009
Q2
2009
Q1
2009
Net interest income 962 1,093 228 233 244 257
Net fees and commissions 520 675 121 135 133 131
Net trading income 10 (26) 4 5 1 —
Net other expenses/income (14) (1) (9) (3) (6) 4
Net non-interest income 516 648 116 137 128 135
TOTAL REVENUES 1,478 1,741 344 370 372 392
Payroll costs (547) (596) (136) (134) (132) (145)
Other administrative expenses (756) (832) (184) (190) (184) (198)
Amortisation, depreciation and impairment losses
on intangible and tangible assets (13) (14) (3) (3) (4) (3)
Operating costs (1,316) (1,442) (323) (327) (320) (346)
OPERATING PROFIT 162 299 21 43 52 46
Restructuring costs (63) — (8) — (55) —
Net write-downs of loans and provisions
for guarantees and commitments (63) (72) (8) (13) (6) (36)
Net income from investments and other items1 (7) (19) 1 1 (15) 6
PROFIT/(LOSS) BEFORE TAX 29 208 6 31 (24) 16
Cost-income ratio in % 89.0 82.8 93.9 88.4 86.0 88.3
1 contains the following income statement items: provisions for risks and charges and net income from investments
Development of the Retail division The operating profit of the Retail division was again affected in 2009 by cautiousness on the part of customers due to the poor economic environment in
the real economy stemming from the financial crisis. At €162 million, the total was below the good figure recorded for the previous year (€299 million),
which was, however, generated for the most part in a much friendlier market environment in the first half of 2008.
Total revenues fell by around 15% year-on-year, primarily due to a decline in contributions to earnings from interest and service operations. Net interest
income declined by around 12%, to €962 million, resulting on the deposit-taking side from lower interest margins. The decrease in net interest income
on the lending side stems primarily from falling volumes, notably in real estate financing, together with the lack of new business involving Sofortkredit
instant-approval loans. These loans have been passed on to the German branch of UniCredit Family Financing Bank S.p.A. since mid-2008 rather than
being extended directly by HVB Group, generating fee and commission income rather than interest income. At €520 million, net fees and commissions
were again affected by declining customer activities notably in securities operations, which was the main reason why the good figure of €675 million for
the previous year could not be matched. Nonetheless, the development across the quarters shows a relatively stable performance in services activities.
This was also helped by the fact that we reflected the trend for our customers to prefer security-oriented investments by successfully distributing innova-
tive, new investment products reflecting the greater quality and security needs of our customers. Particularly important in this regard were various
stepped coupon bonds and floaters, of which almost €3 billion were sold.
The cost-income ratio totalled 89.0% at the end of December 2009 after 82.8% at the same point last year. The decline in total revenues was partially
offset by the savings in operating costs generated by consistent cost management. Within operating costs, payroll costs declined by €49 million or 8.2%
– notably due to a reduction in the headcount – and other administrative expenses declined by €76 million or 9.1%.
At €63 million, the net write-downs of loans and provisions for guarantees and commitments in 2009 were below the previous-year total of €72 million.
Net income from investments and other items of €7 million includes expenses from the sale of Vereinsbank Victoria Bauspar AG largely offset by
income from the sale of the FondsServiceBank unit recorded by our DAB Bank AG subsidiary.
Restructuring costs of €63 million give rise to non-recurring charges against earnings. Nevertheless, the division succeeded in generating a profit before
tax of €29 million, or €92 million when adjusted for the non-recurring restructuring costs, after €208 million in the previous year.
Segment Reporting (CONTINUED)
F-29
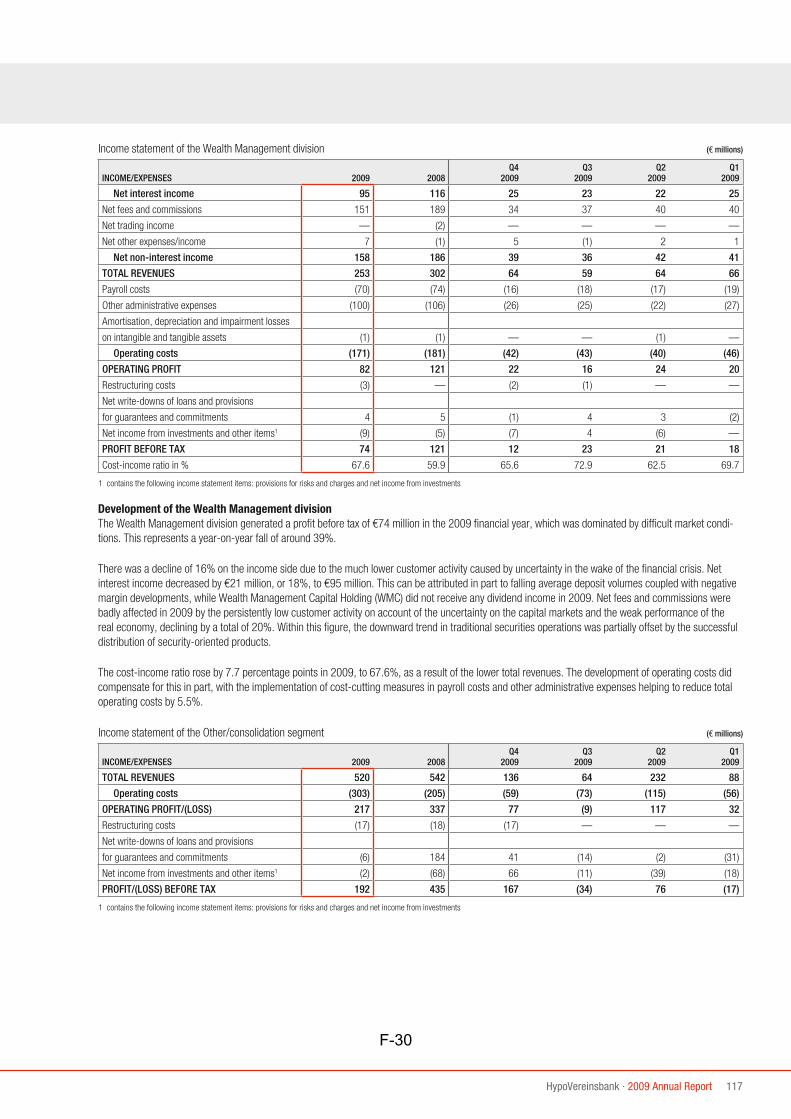
HypoVereinsbank · 2009 Annual Report 117
Income statement of the Wealth Management division (€ millions)
INCOME/EXPENSES 2009 2008
Q4
2009
Q3
2009
Q2
2009
Q1
2009
Net interest income 95 116 25 23 22 25
Net fees and commissions 151 189 34 37 40 40
Net trading income — (2) — — — —
Net other expenses/income 7 (1) 5 (1) 2 1
Net non-interest income 158 186 39 36 42 41
TOTAL REVENUES 253 302 64 59 64 66
Payroll costs (70) (74) (16) (18) (17) (19)
Other administrative expenses (100) (106) (26) (25) (22) (27)
Amortisation, depreciation and impairment losses
on intangible and tangible assets (1) (1) — — (1) —
Operating costs (171) (181) (42) (43) (40) (46)
OPERATING PROFIT 82 121 22 16 24 20
Restructuring costs (3) — (2) (1) — —
Net write-downs of loans and provisions
for guarantees and commitments 4 5 (1) 4 3 (2)
Net income from investments and other items1 (9) (5) (7) 4 (6) —
PROFIT BEFORE TAX 74 121 12 23 21 18
Cost-income ratio in % 67.6 59.9 65.6 72.9 62.5 69.7
1 contains the following income statement items: provisions for risks and charges and net income from investments
Development of the Wealth Management divisionThe Wealth Management division generated a profit before tax of €74 million in the 2009 financial year, which was dominated by difficult market condi-
tions. This represents a year-on-year fall of around 39%.
There was a decline of 16% on the income side due to the much lower customer activity caused by uncertainty in the wake of the financial crisis. Net
interest income decreased by €21 million, or 18%, to €95 million. This can be attributed in part to falling average deposit volumes coupled with negative
margin developments, while Wealth Management Capital Holding (WMC) did not receive any dividend income in 2009. Net fees and commissions were
badly affected in 2009 by the persistently low customer activity on account of the uncertainty on the capital markets and the weak performance of the
real economy, declining by a total of 20%. Within this figure, the downward trend in traditional securities operations was partially offset by the successful
distribution of security-oriented products.
The cost-income ratio rose by 7.7 percentage points in 2009, to 67.6%, as a result of the lower total revenues. The development of operating costs did
compensate for this in part, with the implementation of cost-cutting measures in payroll costs and other administrative expenses helping to reduce total
operating costs by 5.5%.
Income statement of the Other/consolidation segment (€ millions)
INCOME/EXPENSES 2009 2008
Q4
2009
Q3
2009
Q2
2009
Q1
2009
TOTAL REVENUES 520 542 136 64 232 88
Operating costs (303) (205) (59) (73) (115) (56)
OPERATING PROFIT/(LOSS) 217 337 77 (9) 117 32
Restructuring costs (17) (18) (17) — — —
Net write-downs of loans and provisions
for guarantees and commitments (6) 184 41 (14) (2) (31)
Net income from investments and other items1 (2) (68) 66 (11) (39) (18)
PROFIT/(LOSS) BEFORE TAX 192 435 167 (34) 76 (17)
1 contains the following income statement items: provisions for risks and charges and net income from investments
F-30

118 2009 Annual Report · HypoVereinsbank
Financial Statements (2) | Consolidated Financial Statements
Development of the Other/consolidation segmentThe Other/consolidation segment encompasses the Group Corporate Centre, Global Banking Services and consolidation effects. Global Banking Services
also includes the Special Credit Portfolio defined in 2006 together with the remaining holdings in the Real Estate Restructuring customer portfolio.
The total revenues of this segment declined by €22 million, from €542 million in 2008 to €520 million in 2009. Within this total, net interest income fell
sharply, due mainly to the strategic reduction in volumes in the Special Credit Portfolio and far lower dividend payments from our shareholdings. These
effects were largely offset within total revenues by income relating to the buy-back of hybrid capital, income from interest rate hedges and a positive
exchange rate difference compliant with IAS 21.28. Operating costs increased by €98 million year-on-year, primarily on account of higher payments into
the deposit insurance schemes of German banks and the pension guarantee association. Operating profit declined to €217 million (2008: €337 million)
on account of the rise in operating costs.
It was necessary to add a minor €6 million to net write-downs of loans and provisions for guarantees and commitments in the year under review, after a
high net reversal of €184 million was recorded in 2008, essentially on account of success in reducing the special portfolios (former Real Estate Restruc-
turing portfolio and Special Credit Portfolio). The profit before tax fell by €243 million to €192 million in 2009 after €435 million in 2008.
29 Balance sheet figures, broken down by division (€ millions)
CORPORATE &
INVESTMENT
BANKING RETAIL
WEALTH
MANAGEMENT
OTHER/
CONSOLIDATION HVB GROUP1
Loans and receivables with banks
2009 41,009 721 7 1,517 43,254
2008 38,085 2,647 2 719 41,453
Loans and receivables with customers
2009 101,977 34,185 4,672 5,085 145,919
2008 121,309 39,990 4,534 9,685 175,518
Goodwill
2009 419 5 — — 424
2008 421 3 — — 424
Deposits from banks
2009 43,834 2,447 221 4,202 50,704
2008 79,408 2,705 176 1,578 83,867
Deposits from customers
2009 49,509 31,773 8,170 7,038 96,490
2008 66,661 34,754 8,997 4,550 114,962
Debt securities in issue
2009 15,090 394 194 45,608 61,286
2008 10,057 593 302 52,687 63,639
Risk-weighted assets
(including equivalents for market risks and
additionally for Basel II operational risks)
2009 95,898 9,348 1,486 8,370 115,102
2008 121,033 12,389 1,815 13,010 148,247
1 balance sheet figures for non-current assets or disposal groups held for sale are shown separately in Note 57 and 67
Segment Reporting (CONTINUED)
F-31

HypoVereinsbank · 2009 Annual Report 119
30 Employees, broken down by operating and service division
2009 2008
Corporate & Investment Banking 4,841 5,378
Retail 8,176 8,906
Wealth Management 797 823
Global Banking Services 1,901 4,462
Group Corporate Centre 4,744 5,069
Total 20,459 24,638
31 Segment reporting by regionThe allocation of amounts to regions is based on the head office of the Group companies or offices involved.
Income statement, broken down by region (€ millions)
GERMANY REST OF EUROPE AMERICAS ASIA CONSOLIDATION HVB GROUP
TOTAL REVENUES
2009 7,199 426 47 99 (841) 6,930
2008 4,809 78 (24) 111 (997) 3,977
OPERATING PROFIT/ (LOSS)
2009 3,198 435 156 41 (362) 3,468
2008 1,056 (361) (94) 61 (180) 482
Total assets, broken down by region (€ millions)
2009 2008
Germany 290,892 342,270
Rest of Europe 139,386 185,502
Americas 11,273 21,138
Asia 4,988 9,531
Consolidation (83,119) (99,839)
Total 363,420 458,602
Employees, broken down by region (€ millions)
2009 2008
Germany 18,526 22,461
Rest of Europe 1,415 1,599
Africa 3 3
Americas 251 269
Asia 264 306
Total 20,459 24,638
F-32

120 2009 Annual Report · HypoVereinsbank
Financial Statements (2) | Consolidated Financial Statements
32 Net interest income (€ millions)
2009 2008
Interest income from
lending and money market transactions 7,563 11,532
other interest income 3,496 5,216
Interest expense from
deposits (2,174) (7,103)
debt securities in issue and other interest expenses (4,409) (5,586)
Net interest 4,476 4,059
Dividends and other income from equity investments
Dividends and other similar income 45 202
Companies accounted for using the equity method 7 (2)
Total 4,528 4,259
Interest income and interest expense for financial assets and liabilities not carried at fair value through profit or loss totalled €8,140 million and
€5,669 million, respectively. In this context, it should be noted that a comparison of these latter figures is of only limited informative value in economic
terms, as the interest expenses for financial liabilities that are not measured at fair value through profit or loss also include refinancing for financial
assets at fair value through profit or loss and partially for financial assets held for trading as well.
33 Net fees and commissions (€ millions)
2009 2008
Management, brokerage and consultancy services 647 795
Collection and payment services 196 197
Lending operations 335 397
Other service operations 9 64
Total 1,187 1,453
This item comprises the balance of fee and commission income of €2,160 million (2008: €2,535 million) and fee and commission expense of €973 mil-
lion (2008: €1,082 million).
34 Net trading income (€ millions)
2009 2008
Net gains/(losses) on financial assets held for trading1 1,065 (1,655)
Effects arising from hedge accounting 30 6
Changes in fair value of hedged items (428) (499)
Changes in fair value of hedging derivatives 458 505
Net gains/(losses) on financial assets at fair value through profit or loss (fair value option)2 (73) (206)
Other net trading income 52 (27)
Total 1,074 (1,882)
1 including dividends on financial assets held for trading
2 also including the valuation results of derivatives concluded to hedge financial assets through fair value at profit or loss (effect in 2009: €159 million; 2008: minus €579 million)
Other net trading income in the year under review includes positive effects from the partial buy-back of hybrid capital.
The effects arising from hedge accounting includes the hedge results of the fair value hedge portfolio and the individual micro fair value hedges as a net
aggregate total.
The net gains on holdings at fair value through profit or loss (held-for-trading portfolio and fair value option) generally only contain the changes in fair
value disclosed in the income statement. The interest income from held-for-trading portfolios is normally disclosed under net interest income. To ensure
that the full contribution to profits is disclosed, the interest cash flows are only carried in net trading income for the interest rate swap trading book, which
exclusively contains interest rate derivatives.
Notes to the Income Statement
F-33

HypoVereinsbank · 2009 Annual Report 121
35 Net other expenses/income (€ millions)
2009 2008
Other income 399 288
Other expenses (258) (141)
Total 141 147
Net other expenses/income totalled €141 million in 2009 (previous year: €147 million). The total includes a net gain from income and current expenses
regarding investment properties and from rental income less current expenses from mixed usage buildings (€104 million). At the same time, there were
gains of €76 million on the sale of receivables and further income of €74 million arising from services performed and charged on.
Other expenses include effects of €73 million arising from the revaluation of assets as part of the initial consolidation of Redstone Mortgages Limited,
London, and valuation expenses of €43 million accruing in connection with the acquisition of shares in real estate funds.
In addition to the net gain (rental expenses less current expenses) from investment properties and mixed usage buildings, the previous-year total included
income from IT services performed for third parties by our former HVB Information Services GmbH subsidiary, the shares in which were transferred to the
UniCredit Group IT service provider UGIS during 2009.
36 Operating costs (€ millions)
2009 2008
Payroll costs (1,822) (1,961)
Wages and salaries (1,514) (1,650)
Social security costs (211) (232)
Pension and other employee benefit costs (97) (79)
Other administrative expenses (1,418) (1,281)
Amortisation, depreciation and impairment losses (222) (253)
on property, plant and equipment (116) (126)
on software and other intangible assets, excluding goodwill (106) (127)
Total (3,462) (3,495)
UniCredit Group has two different share-based schemes: the long-term incentive programme and the employee share ownership plan, both of which are
described below.
Long-term incentive programme
A long-term incentive programme including share-based remuneration transactions featuring compensation in UniCredit shares (stock options and per-
formance shares) has been set up for executives and junior managers of all UniCredit Group companies selected using defined criteria.
The following statements relate to all HVB Group executives covered by the long-term incentive programme. The information provided in Note 84 in this
regard showing the emoluments paid to members of the Management Board merely relates to the stock options and performance shares granted to
members of the Management Board.
The stock options grant entitlement to purchase a UniCredit share at a price which was fixed before the option was issued. The options may only be exer-
cised during a fixed period which starts after the lock-up period expires. If the beneficiary leaves UniCredit Group, the stock options are forfeited, meaning
that they can no longer be exercised. The options are acquired on a pro rata basis in certain exceptional circumstances, such as disability, retirement or
an employer leaving UniCredit Group.
F-34
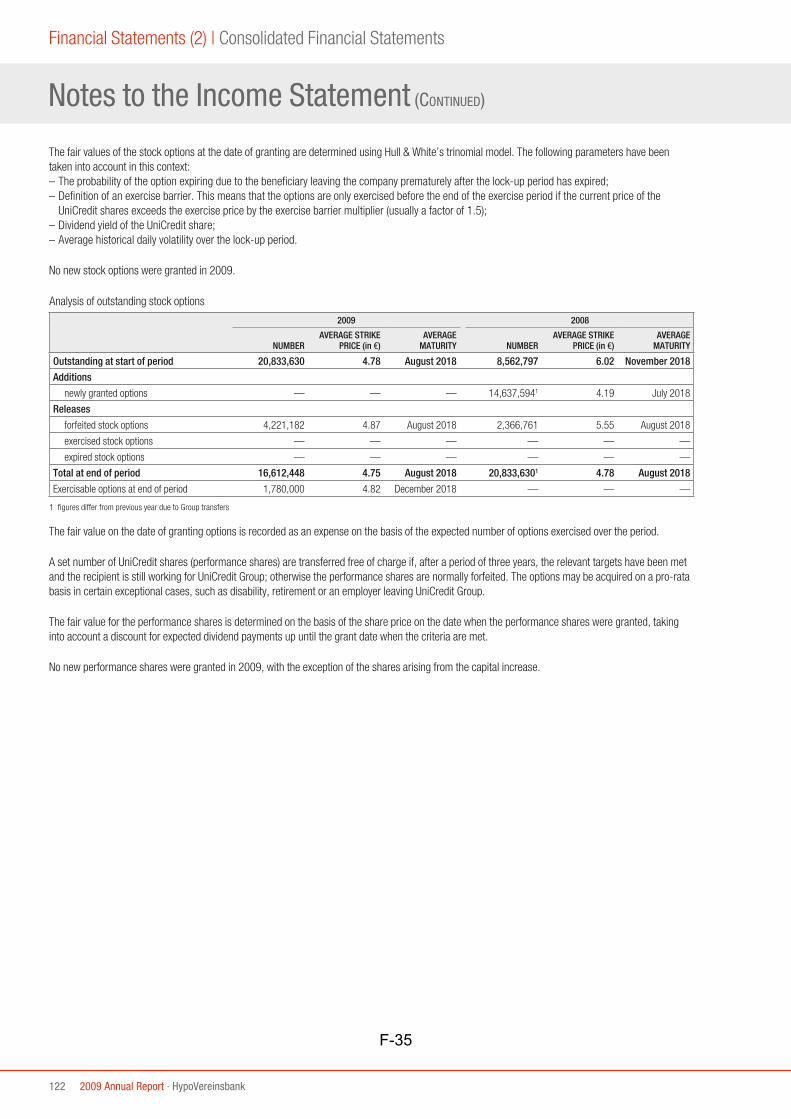
122 2009 Annual Report · HypoVereinsbank
Financial Statements (2) | Consolidated Financial Statements
The fair values of the stock options at the date of granting are determined using Hull & White’s trinomial model. The following parameters have been
taken into account in this context:
– The probability of the option expiring due to the beneficiary leaving the company prematurely after the lock-up period has expired;
– Definition of an exercise barrier. This means that the options are only exercised before the end of the exercise period if the current price of the
UniCredit shares exceeds the exercise price by the exercise barrier multiplier (usually a factor of 1.5);
– Dividend yield of the UniCredit share;
– Average historical daily volatility over the lock-up period.
No new stock options were granted in 2009.
Analysis of outstanding stock options
2009 2008
NUMBER
AVERAGE STRIKE
PRICE (in €)
AVERAGE
MATURITY
NUMBER
AVERAGE STRIKE
PRICE (in €)
AVERAGE
MATURITY
Outstanding at start of period 20,833,630 4.78 August 2018 8,562,797 6.02 November 2018
Additions
newly granted options — — — 14,637,5941 4.19 July 2018
Releases
forfeited stock options 4,221,182 4.87 August 2018 2,366,761 5.55 August 2018
exercised stock options — — — — — —
expired stock options — — — — — —
Total at end of period 16,612,448 4.75 August 2018 20,833,6301 4.78 August 2018
Exercisable options at end of period 1,780,000 4.82 December 2018 — — —
1 figures differ from previous year due to Group transfers
The fair value on the date of granting options is recorded as an expense on the basis of the expected number of options exercised over the period.
A set number of UniCredit shares (performance shares) are transferred free of charge if, after a period of three years, the relevant targets have been met
and the recipient is still working for UniCredit Group; otherwise the performance shares are normally forfeited. The options may be acquired on a pro-rata
basis in certain exceptional cases, such as disability, retirement or an employer leaving UniCredit Group.
The fair value for the performance shares is determined on the basis of the share price on the date when the performance shares were granted, taking
into account a discount for expected dividend payments up until the grant date when the criteria are met.
No new performance shares were granted in 2009, with the exception of the shares arising from the capital increase.
Notes to the Income Statement (CONTINUED)
F-35

HypoVereinsbank · 2009 Annual Report 123
Analysis of outstanding performance shares
2009 2008
NUMBER
AVERAGE
MATURITY
NUMBER
AVERAGE
MATURITY
Outstanding at start of period 6,398,643 March 2011 3,209,305 January 2010
Additions
increase in portfolio arising from capital increase
from company funds 741,200 February 2011 — —
newly granted performance shares — — 4,027,6041 December 2011
Releases
forfeited performance shares 1,141,624 June 2011 838,266 June 2010
transferred performance shares 102,156 December 2008 — —
expired performance shares 906,596 December 2008 — —
Total at end of period 4,989,467 July 2011 6,398,6431 March 2011
1 figures differ from previous year due to Group transfers
The fair value on the date of granting is recorded as an expense for performance shares in the period that is decisive for fulfilling the respective criteria.
The expenses for both programmes (stock options and performance shares) totalled €3.1 million at HVB Group in 2009 and will be reimbursed to
UniCredit S.p.A. when they fall due.
Employee share ownership plan
An employee share ownership plan has been set up enabling UniCredit Group employees to purchase UniCredit shares under favourable conditions.
Between January 2009 and December 2009, people participating in the plan had the opportunity to use their contributions to buy regular UniCredit
shares (known as investment shares). The plan offers the following advantages compared with buying the shares directly on the market:
– One free share (known as a discount share) for every 20 investment shares purchased under the plan (this represents a discount of 5%; the discount
shares were allocated in January 2010);
– One additional free share (known as a matching share) for every five investment and discount shares purchased under the plan (this represents a
discount of 21%). The matching shares will be allocated in January 2013 until when they are granted as “rights to matching shares”.
Granting these free shares affords a maximum discount of 26% of the investment made possible. Added to this is a tax break that exists in Germany for
such employee share-ownership plans.
The sale of all free shares (discount and matching shares or the right to them) is not permitted for a lock-up period of three years, meaning until
January 2013. The rights to matching shares generally expire when employees sell investment shares or they cease to be employed by a UniCredit Group
company before the lock-up period ends. In this case, however, the discount shares are retained. It is intended to operate the plan on an annual basis.
F-36

124 2009 Annual Report · HypoVereinsbank
Financial Statements (2) | Consolidated Financial Statements
37 Provisions for risks and chargesProvisions for risks and charges amounted to €151 million in 2009. This total includes mainly additions to provisions for risks and charges relating to
property (such as rental guarantees) and litigation risks.
In 2008, the balance of provisions for risks and charges totalled €6 million. Within this total, reversals of provisions for litigation risks were largely offset
by additions to provisions for building reconversion obligations and rental guarantees.
38 Restructuring costsHVB Group recorded restructuring costs of €170 million in 2009, resulting mainly from the elimination of positions. Most of the restructuring costs are a
result of restructuring activities undertaken as part of the strategic reorientation of the Corporate & Investment Banking division (€87 million).
The remaining restructuring costs relate to the Retail (€63 million) and Wealth Management (€3 million) divisions and Other/consolidation (€17 million).
In 2008, the restructuring costs of €26 million related primarily to the consolidation of various back-office activities in UniCredit Group.
39 Net write-downs of loans and provisions for guarantees and commitments (€ millions)
2009 2008
Additions (2,480) (1,754)
Allowances for losses on loans and receivables (2,368) (1,636)
Allowances for losses on guarantees and indemnities (112) (118)
Releases 800 923
Allowances for losses on loans and receivables 783 897
Allowances for losses on guarantees and indemnities 17 26
Recoveries from write-offs of loans and receivables 77 71
Gains on the disposal of impaired loans and receivables 2 —
Total (1,601) (760)
Income from the disposal of performing loans and receivables is disclosed under net other expenses/income. This gave rise to a gain of €76 million in
the year under review. The net expenses (net write-downs of loans and provisions for guarantees and commitments, and gains on disposal) for loans and
receivables amount to €1,430 million (2008: €663 million).
Net write-downs of loans and provisions for guarantees and commitments, to related entities (€ millions)
2009 2008
Non-consolidated subsidiaries — —
Joint ventures — (2)
Associated companies — —
Other participating interests — (1)
Total1 — (3)
1 2008: balance added
40 Net income from investments (€ millions)
2009 2008
Available-for-sale financial assets (290) (204)
Shares in affiliated companies 32 (1)
Companies accounted for using the equity method (12) —
Held-to-maturity investments 2 (17)
Land and buildings 13 20
Investment properties1 (42) (83)
Other 17 —
Total (280) (285)
1 impairments and write-ups together with fair value fluctuations for investment properties measured at market value
Notes to the Income Statement (CONTINUED)
F-37

HypoVereinsbank · 2009 Annual Report 125
Net income from investments breaks down as follows: (€ millions)
2009 2008
Gains on the disposal of 194 55
available-for-sale financial assets 115 36
shares in affiliated companies 47 (1)
companies accounted for using the equity method (6) —
held-to-maturity investments 8 —
land and buildings 13 20
other 17 —
Write-downs and value adjustments on (474) (340)
available-for-sale financial assets (405) (240)
shares in affiliated companies (15) —
companies accounted for using the equity method (6) —
held-to-maturity investments (6) (17)
investment properties1 (42) (83)
Total (280) (285)
1 impairments and write-ups together with fair value fluctuations for investment properties measured at market value
The net income from available-for-sale financial assets includes a net loss of €327 million (2008: net loss of €29 million) on private equity funds and
direct and co-investments in the year under review. This total comprises value adjustments of €328 million (2008: €60 million) on available-for-sale
financial assets carried under write-downs and value adjustments and gains of €1 million (2008: €31 million) on the disposal of available-for-sale
financial assets.
The largest single item within gains on disposal of available-for-sale financial assets is a gain on the disposal of our holding in ERGO.
The largest single items included in the net income (gains on disposal less write-downs and value adjustments) of €32 million from shares in affiliated
companies in 2009 are the gain of €46 million on the disposal of our BodeHewitt subsidiary and a write-down of €16 million compliant with IFRS 5 in
connection with the sale of Vereinsbank Victoria Bauspar AG completed in July 2009.
The net income from other financial assets in 2009 contained positive effects in connection with the sale of the FondsServiceBank unit of our DAB Bank
AG subsidiary.
The net loss of €221 million from available-for-sale financial assets and held-to-maturity investments in 2008 resulted primarily from negative effects
from asset-backed securities, Lehman bonds, Icelandic bonds and our holding in Babcock & Brown carried in these categories.
41 Income taxes for the period (€ millions)
2009 2008
Current taxes (398) (185)
Deferred taxes 16 131
Total (382) (54)
The current tax expense for 2009 was reduced by €41 million on account of the tax income for previous years offset against tax expenses. In 2008, on
the other hand, this item increased by €6 million tax expense for previous years.
The deferred tax income in the year under review comprises net income of €32 million from write-ups and write-downs of deferred tax assets as well as
net deferred tax expenses of €16 million arising from the origination and utilisation of tax losses and deferred taxes from the origination and reversal of
temporary differences.
The deferred tax income in 2008 comprised income from the recognition of deferred tax assets on tax loss carryforwards (€482 million) and a deferred
tax expense arising from the origination and reversal of temporary differences (€351 million).
F-38

126 2009 Annual Report · HypoVereinsbank
Financial Statements (2) | Consolidated Financial Statements
The differences between computed income tax and recognised income tax are shown in the following reconciliation: (€ millions)
2009 2008
Profit before tax 1,266 (595)
Applicable tax rate 15.8% 15.8%
Computed income taxes (200) + 94
Tax effects
arising from previous years and changes in tax rates + 91 (5)
arising from foreign income (99) + 129
arising from non-taxable income + 55 + 42
arising from different tax laws (140) (51)
arising from non-deductible expenses (70) (46)
arising from valuation adjustments and the non-recognition
of deferred taxes (17) (217)
arising from amortisation of goodwill — —
arising from other differences (2) —
Recognised income taxes (382) (54)
The tax rate applicable in the year under review remained unchanged at 15.8%. It comprises the current rate of corporate income tax in Germany of
15.0% and the solidarity surcharge of 5.5% of corporate income tax.
The effects arising from tax of foreign income results from different tax rates applicable in other countries.
The item tax effects arising from different tax laws comprises primarily current and deferred trade tax in Germany for the current year calculated using tax
rates which differ per municipality.
The deferred tax assets and liabilities are broken down as follows: (€ millions)
2009 2008
Deferred tax liabilities
Loans and receivables with banks and customers, incl. provisions for losses on loans and receivables 85 140
Financial assets/liabilities held for trading 102 147
Investments 78 169
Property, plant and equipment/intangible assets 76 69
Other assets/other liabilities/derivatives 555 680
Deposits from banks/customers 87 81
Other 192 108
Recognised deferred tax liabilities 1,175 1,394
Deferred tax assets
Financial assets/liabilities held for trading 403 412
Investments 67 146
Property, plant and equipment/intangible assets 75 71
Provisions 296 277
Other assets/other liabilities/derivatives 568 287
Loans and receivables with banks and customers, incl. provisions for losses on loans and receivables 308 217
Losses carried forward 524 846
Other 11 115
Recognised deferred tax assets 2,252 2,371
Notes to the Income Statement (CONTINUED)
F-39

HypoVereinsbank · 2009 Annual Report 127
German corporations are generally charged a corporate income tax rate of 15%, irrespective of any dividend distribution. Deferred taxes are measured
for our domestic companies using the uniform corporate income tax rate of 15.8%, including the solidarity surcharge, and the municipal trade tax rate
dependent on the applicable municipal trade tax multiplier. At HVB, this resulted in an unchanged overall valuation rate for deferred taxes of 31.4%.
Deferred tax assets of €21 million (2008: €24 million) were credited to the AfS reserve and deferred tax liabilities of €91 million (2008: €152 million)
were offset against the hedge reserve. On account of the option set forth in IAS 19.93A, deferred tax assets of €101 million (2008: €64 million) were
directly credited to shareholders’ equity. In each case, the deferred tax items offset directly against reserves are the balance of deferred tax assets and
deferred tax liabilities before adjustment for minority interests.
Compliant with IAS 12, no deferred tax assets have been recognised for tax loss carryforwards of HVB Group of €5,814 million (2008: €5,696 million),
most of which do not expire, and for deductible temporary differences of €1,432 million (2008: €1,335 million).
The deferred tax assets recognised on tax loss carryforwards were calculated using plans of the individual divisions, which are based on segment-
specific and general macroeconomic assumptions. The amounts were measured taking into account appropriate valuation discounts. The planning hori-
zon remained unchanged at 5 years. Measurement was carried out taking into account possible restrictions of local regulations regarding time and the
so-called minimum taxation rule for domestic tax loss carryforwards.
42 Earnings per share
2009 2008
Consolidated profit/(loss) attributable to shareholders (€ millions) 819 (671)
Consolidated profit/(loss) attributable to shareholders (adjusted1, € millions) 948 (645)
Average number of shares 802,383,672 802,383,672
Earnings per share (€) 1.02 (0.84)
Earnings per share (adjusted1, €) 1.18 (0.80)
1 2009 and 2008 adjusted for restructuring costs
F-40

128 2009 Annual Report · HypoVereinsbank
Financial Statements (2) | Consolidated Financial Statements
43 Cash and cash balances (€ millions)
2009 2008
Cash on hand 506 558
Cash balances at central banks1 5,894 4,998
Total1 6,400 5,556
1 we have changed the disclosure of deposits with central banks within the balance sheet compliant with IAS 1.68(i) in conjunction with IAS 8.41 (see comments in Note 2, “Consistency”)
44 Financial assets held for trading (€ millions)
2009 2008
Balance-sheet assets
Fixed-income securities 33,950 47,433
Equity instruments 6,586 4,521
Other financial assets held for trading 11,772 27,576
Positive fair value from derivative financial instruments 81,081 119,489
Total 133,389 199,019
The financial assets held for trading include €512 million (2008: €1,630 million) in subordinated assets.
Financial assets held for trading of related entities (€ millions)
2009 2008
Non-consolidated subsidiaries 15,173 19,815
Joint ventures — —
Associated companies — —
Other participating interests 299 104
Total 15,472 19,919
45 Financial assets at fair value through profit or loss (€ millions)
2009 2008
Fixed-income securities 11,266 10,522
Equity instruments 1 —
Investment certificates 1 1
Promissory notes 2,490 2,812
Other financial assets at fair value through profit or loss — —
Total 13,758 13,335
84% of the promissory notes were issued by the federal states and regional authorities in the Federal Republic of Germany. The remaining promissory
notes were issued by European central and regional governments.
On account of the prime ratings of the promissory notes, the fair value fluctuations contain only minor effects from changes in credit ratings.
The financial assets at fair value through profit or loss include €274 million (2008: €287 million) in subordinated assets.
46 Available-for-sale financial assets (€ millions)
2009 2008
Fixed-income securities 2,433 2,828
Equity instruments 862 2,398
Other available-for-sale financial assets 475 344
Impaired assets 671 284
Total 4,441 5,854
Available-for-sale financial assets include financial instruments of €1,444 million (2008: €1,672 million) valued at cost compliant with IAS 39.46 (c).
Notes to the Consolidated Balance Sheet
F-41

HypoVereinsbank · 2009 Annual Report 129
The available-for-sale financial assets contain a total of €671 million in impaired assets for which impairments of €419 million (2008: €232 million) were
taken to the income statement during the year under review. None of the non-impaired debt instruments are financial instruments past due.
The available-for-sale financial assets include €257 million (2008: €259 million) in subordinated assets.
47 Shares in associated companies accounted for using the equity method and joint ventures accounted for using the equity method (€ millions)
2009 2008
Associated companies accounted for using the equity method 88 32
of which: goodwill — —
Joint ventures accounted for using the equity method — —
Total 88 32
Change in portfolio of shares in associated companies (€ millions)
2008 ASSOCIATED COMPANIES ACCOUNTED FOR USING THE EQUITY METHOD
Carrying amounts at 1 January 34
Additions 2
Purchases —
Write-ups —
Changes from currency translation 2
Other additions1 —
Disposals (4)
Sales —
Impairments —
Changes from currency translation —
Non-current assets or disposal groups held for sale —
Other disposals1 (4)
Carrying amounts at 31 December 32
2009 ASSOCIATED COMPANIES ACCOUNTED FOR USING THE EQUITY METHOD
Carrying amounts at 1 January 32
Additions 88
Purchases —
Write-ups —
Changes from currency translation —
Other additions1 88
Disposals (32)
Sales (25)
Impairments (6)
Changes from currency translation (1)
Non-current assets or disposal groups held for sale —
Other disposals1 —
Carrying amounts at 31 December 88
1 also including changes in the group of companies included in consolidation
F-42

130 2009 Annual Report · HypoVereinsbank
Financial Statements (2) | Consolidated Financial Statements
48 Held-to-maturity investments (€ millions)
2009 2008
Fixed-income securities 2,664 6,008
Other held-to-maturity investments 11 12
Impaired assets 4 —
Total 2,679 6,020
Held-to-maturity investments include a total of €4 million in impaired assets, for which impairments of €6 million were taken to the income statement
during the year under review.
None of the non-impaired debt instruments are financial instruments past due.
The held-to-maturity investments include €11 million (2008: €12 million) in subordinated assets.
The disposals carried out in the year under review were immaterial as a proportion of the item as a whole, meaning that HVB Group essentially complied
with the tainting rules defined in IAS 39 AG22.
Development of held-to-maturity investments (€ millions)
2009 2008
Balance at 1 January 6,020 3,058
Additions
Purchases 18 3,116
Write-ups — —
Other additions — 45
Disposals
Sales (95) —
Redemptions at maturity (3,200) (175)
Write-downs (6) (17)
Other disposals (58) (7)
Balance at 31 December 2,679 6,020
Held-to-maturity investments of related entities (€ millions)
2009 2008
Non-consolidated subsidiaries 2,104 2,127
Joint ventures — —
Associated companies — —
Other participating interests — —
Total 2,104 2,127
49 Loans and receivables with banks (€ millions)
2009 2008
Loans to banks
Current accounts and demand deposits 14,887 15,467
Repos1 10,265 6,331
Reclassified securities 8,349 4,258
Other loans to banks 9,753 15,397
Total2 43,254 41,453
1 repurchase agreements
2 we have changed the disclosure of deposits with central banks within the balance sheet compliant with IAS 1.68(i) in conjunction with IAS 8.41
(see comments in Note 2, “Consistency”)
The loans and receivables with banks included €862 million (2008: €845 million) in subordinated assets at 31 December 2009.
Notes to the Consolidated Balance Sheet (CONTINUED)
F-43

HypoVereinsbank · 2009 Annual Report 131
The figures stated for loans and receivables with banks are shown net of the associated allowances for losses on loans and receivables.
These allowances break down as follows: (€ millions)
2009 20082
Properly serviced loans and receivables
Carrying amount before allowances 42,884 41,444
Portfolio allowances1 19 11
Carrying amount 42,865 41,433
Properly serviced loans and receivables past due
Carrying amount before allowances — —
Portfolio allowances1 — —
Carrying amount — —
Loans and receivables with allowances
Carrying amount before allowances 566 269
Specific allowances 177 249
Carrying amount 389 20
1 including provisions for country risks
2 2008 figures adjusted due to change in balance sheet disclosure of deposits with central banks (see comments in Note 2, “Consistency”)
The non-performing loans and receivables are the loans and receivables in rating classes 8–, 9 and 10. These include receivables totalling €1 million that
meet the criteria for an allowance, but for which no specific allowances have been created on account of fully realisable collateral.
(€ millions)
2009 20081
Loans and receivables broken down by rating class
Free of counterparty risk 1,347 483
Not rated 4,375 7,640
Rating class 1 – 4 35,790 31,218
Rating class 5 – 8 1,362 2,084
Rating class 9 – 10 380 28
Collateral broken down by rating class
Free of counterparty risk 107 25
Not rated — 2
Rating class 1 – 4 10,976 8,320
Rating class 5 – 8 1,036 1,025
Rating class 9 – 10 251 —
1 2008 figures adjusted due to change in balance sheet disclosure of deposits with central banks (see comments in Note 2, “Consistency”)
Loans and receivables with related entities (€ millions)
2009 2008
Non-consolidated subsidiaries 4,568 10,130
Joint ventures — —
Associated companies — —
Other participating interests 50 75
Total 4,618 10,205
F-44

132 2009 Annual Report · HypoVereinsbank
Financial Statements (2) | Consolidated Financial Statements
50 Loans and receivables with customers (€ millions)
2009 2008
Current accounts 6,349 7,082
Repos1 971 8,643
Mortgage loans 56,012 62,723
Finance leases 2,357 1,842
Reclassified securities 8,009 9,358
Non-performing loans and receivables 5,029 3,844
Other loans and receivables 67,192 82,026
Total 145,919 175,518
1 repurchase agreements
The loans and receivables with customers include €2,054 million (2008: €1,055 million) in subordinated assets.
The figures stated for loans and receivables with customers are shown net of the associated allowances for losses on loans and receivables.
These allowances break down as follows: (€ millions)
2009 2008
Properly serviced loans and receivables
Carrying amount before allowances 138,629 167,771
Portfolio allowances1 550 512
Carrying amount 138,079 167,259
Properly serviced loans and receivables past due
Carrying amount before allowances 2,823 4,428
Portfolio allowances1 12 13
Carrying amount 2,811 4,415
Non-performing loans and receivables
Carrying amount before allowances 9,493 7,900
Specific allowances 4,464 4,056
Carrying amount 5,029 3,844
1 including provisions for country risks
The non-performing loans and receivables are the loans and receivables in rating classes 8–, 9 and 10. These include receivables totalling €312 million
that meet the criteria for an allowance, but for which no specific allowances have been created. Some of these are non-performing loans and receivables
for which no specific allowances have been set up on account of fully realisable collateral while others are loans and receivables that are no longer
assigned to rating classes 8, 9 and 10 due to improved credit ratings, but which have been in these classes for a total period of 24 months since first
being classified as non-performing.
(€ millions)
2009 2008
Carrying amount of properly serviced loans and receivables past due, broken down by period past due
1 – 30 days 2,426 3,942
31 – 60 days 300 363
61 – 90 days 85 110
(€ millions)
2009 2008
Value of collateral broken down by period past due
1 – 30 days 871 1,067
31 – 60 days 50 68
61 – 90 days 11 27
Notes to the Consolidated Balance Sheet (CONTINUED)
F-45
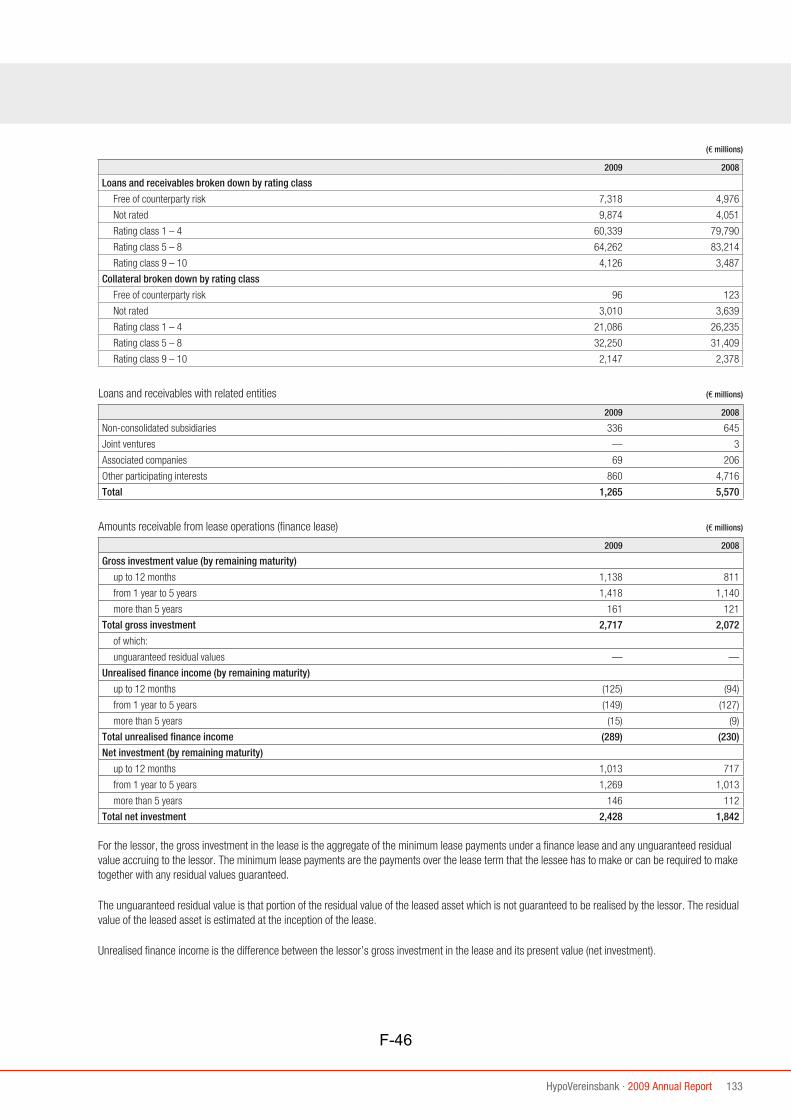
HypoVereinsbank · 2009 Annual Report 133
(€ millions)
2009 2008
Loans and receivables broken down by rating class
Free of counterparty risk 7,318 4,976
Not rated 9,874 4,051
Rating class 1 – 4 60,339 79,790
Rating class 5 – 8 64,262 83,214
Rating class 9 – 10 4,126 3,487
Collateral broken down by rating class
Free of counterparty risk 96 123
Not rated 3,010 3,639
Rating class 1 – 4 21,086 26,235
Rating class 5 – 8 32,250 31,409
Rating class 9 – 10 2,147 2,378
Loans and receivables with related entities (€ millions)
2009 2008
Non-consolidated subsidiaries 336 645
Joint ventures — 3
Associated companies 69 206
Other participating interests 860 4,716
Total 1,265 5,570
Amounts receivable from lease operations (finance lease) (€ millions)
2009 2008
Gross investment value (by remaining maturity)
up to 12 months 1,138 811
from 1 year to 5 years 1,418 1,140
more than 5 years 161 121
Total gross investment 2,717 2,072
of which:
unguaranteed residual values — —
Unrealised finance income (by remaining maturity)
up to 12 months (125) (94)
from 1 year to 5 years (149) (127)
more than 5 years (15) (9)
Total unrealised finance income (289) (230)
Net investment (by remaining maturity)
up to 12 months 1,013 717
from 1 year to 5 years 1,269 1,013
more than 5 years 146 112
Total net investment 2,428 1,842
For the lessor, the gross investment in the lease is the aggregate of the minimum lease payments under a finance lease and any unguaranteed residual
value accruing to the lessor. The minimum lease payments are the payments over the lease term that the lessee has to make or can be required to make
together with any residual values guaranteed.
The unguaranteed residual value is that portion of the residual value of the leased asset which is not guaranteed to be realised by the lessor. The residual
value of the leased asset is estimated at the inception of the lease.
Unrealised finance income is the difference between the lessor’s gross investment in the lease and its present value (net investment).
F-46

134 2009 Annual Report · HypoVereinsbank
Financial Statements (2) | Consolidated Financial Statements
51 Allowances for losses on loans and receivables with customers and banks Analysis of loans and receivables (€ millions)
SPECIFIC
ALLOWANCES
PORTFOLIO
ALLOWANCES TOTAL
Balance at 1 January 2008 4,573 520 5,093
Changes affecting income
Gross additions1 1,585 51 1,636
Releases (868) (29) (897)
Changes not affecting income
Changes due to make-up of group of consolidated companies and
reclassifications of disposal groups held for sale — — —
Use of existing loan-loss allowances (1,054) — (1,054)
Effects of currency translation and other changes not affecting income 69 (6) 63
Non-current assets or disposal groups held for sale — — —
Balance at 31 December 2008 4,305 536 4,841
SPECIFIC
ALLOWANCES
PORTFOLIO
ALLOWANCES TOTAL
Balance at 1 January 2009 4,305 536 4,841
Changes affecting income
Gross additions1 2,303 63 2,366
Releases (768) (15) (783)
Changes not affecting income
Changes due to make-up of group of consolidated companies and
reclassifications of disposal groups held for sale (9) (2) (11)
Use of existing loan-loss allowances (1,285) — (1,285)
Effects of currency translation and other changes not affecting income 95 (1) 94
Non-current assets or disposal groups held for sale — — —
Balance at 31 December 2009 4,641 581 5,222
1 the additions include the gains on the disposal of impaired loans and receivables
Notes to the Consolidated Balance Sheet (CONTINUED)
F-47

HypoVereinsbank · 2009 Annual Report 135
Breakdown of allowances for receivables (€ millions)
LOANS AND RECEIV ABLES
WITH BANKS
2009
LOANS AND RECEIV ABLES
WITH BANKS
2008
LOANS AND RECEIV ABLES
WITH CUSTOMERS
2009
LOANS AND RECEIV ABLES
WITH CUSTOMERS
2008
Properly serviced receivables
Carrying amount before allowances 42,884 41,444 141,452 172,199
Portfolio allowance 19 11 562 525
Carrying amount 42,865 41,433 140,890 171,674
Loans and receivables with allowances
Carrying amount before allowances 566 269 9,493 7,900
Specific allowances 177 249 4,464 4,056
Carrying amount 389 20 5,029 3,844
52 Hedging derivatives (€ millions)
2009 2008
Micro fair value hedge 278 212
Fair value hedge portfolio 3,300 2,081
Cash flow hedge — 361
Total 3,578 2,654
53 Property, plant and equipment (€ millions)
2009 2008
Land and buildings 1,078 1,061
Plant and office equipment 278 324
Other property 1,225 492
Total1 2,581 1,877
1 including leased assets of €65 million (2008: €1 million)
Other property contains solely assets under construction by our subsidiary Ocean Breeze Energy GmbH & Co KG, Munich.
F-48

136 2009 Annual Report · HypoVereinsbank
Financial Statements (2) | Consolidated Financial Statements
Development of property, plant and equipment (€ millions)
LAND AND
BUILDINGS
PLANT AND
OFFICE
EQUIPMENT
TOTAL INTERN-
ALLY USED
PROPERTY, PLANT
AND EQUIPMENT1
OTHER
PROPERTY
TOTAL
PROPERTY,
PLANT AND
EQUIPMENT1
Acquisition costs at 1 January 2008 2,225 1,318 3,543 — 3,543
Write-downs and write-ups from previous years (1,119) (1,087) (2,206) — (2,206)
Carrying amounts at 1 January 2008 1,106 231 1,337 — 1,337
Additions
Acquisition/production costs 3 118 121 — 121
Write-ups 3 — 3 — 3
Changes from currency translation — — — — —
Other additions2 5 94 99 492 591
Disposals
Sales (1) (13) (14) — (14)
Amortisation and write-downs (48) (80) (128) — (128)
Impairments (3) — (3) — (3)
Changes from currency translation — — — — —
Non-current assets
or disposal groups held for sale — — — — —
Other disposals2 (4) (26) (30) — (30)
Carrying amounts at 31 December 2008 1,061 324 1,385 492 1,877
Write-downs and write-ups
from previous year plus year under review 1,060 846 1,906 — 1,906
Acquisition costs at 31 December 2008 2,121 1,170 3,291 492 3,783
LAND AND
BUILDINGS
PLANT AND
OFFICE
EQUIPMENT
TOTAL INTERN-
ALLY USED
PROPERTY, PLANT
AND EQUIPMENT1
OTHER
PROPERTY
TOTAL
PROPERTY,
PLANT AND
EQUIPMENT1
Acquisition costs at 1 January 2009 2,121 1,170 3,291 492 3,783
Write-downs and write-ups from previous years (1,060) (846) (1,906) — (1,906)
Carrying amounts at 1 January 2009 1,061 324 1,385 492 1,877
Additions
Acquisition/production costs 7 65 72 733 805
Write-ups 1 — 1 — 1
Changes from currency translation — — — — —
Other additions2 60 59 119 — 119
Disposals
Sales (2) (102) (104) — (104)
Amortisation and write-downs (49) (65) (114) — (114)
Impairments — — — — —
Changes from currency translation — — — — —
Non-current assets
or disposal groups held for sale — — — — —
Other disposals2 — (3) (3) — (3)
Carrying amounts at 31 December 2009 1,078 278 1,356 1,225 2,581
Write-downs and write-ups
from previous year plus year under review 1,220 644 1,864 — 1,864
Acquisition costs at 31 December 2009 2,298 922 3,220 1,225 4,445
1 including leased assets
2 also including changes in the group of companies included in consolidation
Notes to the Consolidated Balance Sheet (CONTINUED)
F-49

HypoVereinsbank · 2009 Annual Report 137
54 Investment propertyThe fair value of investment property, which is measured at amortised cost, totalled €2,034 million (2008: €500 million). The appraisals prepared to
calculate the fair values are based on recognised appraisal methods used by external assessors, primarily taking the form of asset-value and gross-rental
methods.
Investment properties (€ millions)
MEASURED
AT COST
MEASURED
AT FAIR VALUE
Acquisition costs at 1 January 2008 849 1,459
Write-downs and write-ups from previous years (418) —
Carrying amounts at 1 January 2008 431 1,459
Additions
Purchases 2 —
Write-ups 2 —
Changes from currency translation — —
Other additions1 4 —
Disposals
Sales (10) (42)
Amortisation and write-downs (6) —
Impairments (2) —
Changes from currency translation — (12)
Non-current assets or disposal groups held for sale (2) —
Net gains/losses on the adjustment of fair values — (98)
Other disposals1 (3) —
Carrying amounts at 31 December 2008 416 1,307
Write-downs and write-ups from previous year plus year under review 424 —
Acquisition costs at 31 December 2008 840 1,307
MEASURED
AT COST
MEASURED
AT FAIR VALUE
Acquisition costs at 1 January 2009 840 1,307
Write-downs and write-ups from previous years (424) —
Carrying amounts at 1 January 2009 416 1,307
Additions
Purchases 3 —
Write-ups 5 —
Changes from currency translation — 2
Other additions1 1,511 —
Disposals
Sales (1) (193)
Amortisation and write-downs (14) —
Impairments (5) —
Changes from currency translation — —
Non-current assets or disposal groups held for sale (4) —
Net gains/losses on the adjustment of fair values — (50)
Other disposals1 (4) (1,066)
Carrying amounts at 31 December 2009 1,907 —
Write-downs and write-ups from previous year plus year under review 363 —
Acquisition costs at 31 December 2009 2,270 —
1 also including changes in the group of companies included in consolidation
F-50

138 2009 Annual Report · HypoVereinsbank
Financial Statements (2) | Consolidated Financial Statements
55 Intangible assetsWrite-downs on goodwill are shown in a separate item in the income statement. Amortisation of software and other intangible assets is normally stated
under amortisation, depreciation and impairment losses on intangible and tangible assets under operating costs.
(€ millions)
2009 2008
Goodwill 424 424
Other intangible assets
Internally generated intangible assets 129 212
Other intangible assets 103 159
Total 656 795
Development of intangible assets (€ millions)
GOODWILL FROM
SUBSIDIARIES
INTERNALLY GENERATED
INTANGIBLE ASSETS
OTHER
INTANGIBLE ASSETS
Acquisition costs at 1 January 2008 1,088 592 692
Write-downs and write-ups from previous years (667) (412) (523)
Carrying amounts at 1 January 2008 421 180 169
Additions
Purchases/internally generated — 101 46
Write-ups — — —
Changes from currency translation — — —
Other additions1 3 1 22
Disposals
Sales — — —
Amortisation and write-downs — (57) (65)
Impairments — — (5)
Changes from currency translation — — —
Non-current assets or disposal groups held for sale — — —
Other disposals1 — (13) (8)
Carrying amounts at 31 December 2008 424 212 159
Write-downs and write-ups from previous year plus year under review 667 254 333
Acquisition costs at 31 December 2008 1,091 466 492
1 also including changes in the group of companies included in consolidation
Notes to the Consolidated Balance Sheet (CONTINUED)
F-51

HypoVereinsbank · 2009 Annual Report 139
Development of intangible assets (€ millions)
GOODWILL FROM
SUBSIDIARIES
INTERNALLY GENERATED
INTANGIBLE ASSETS
OTHER
INTANGIBLE ASSETS
Acquisition costs at 1 January 2009 1,091 466 492
Write-downs and write-ups from previous years (667) (254) (333)
Carrying amounts at 1 January 2009 424 212 159
Additions
Purchases/internally generated 2 64 39
Write-ups — — —
Changes from currency translation — — —
Other additions1 — 6 4
Disposals
Sales — (102) (29)
Amortisation and write-downs — (47) (62)
Impairments — — —
Changes from currency translation — — —
Non-current assets or disposal groups held for sale — — —
Other disposals1 (2) (4) (8)
Carrying amounts at 31 December 2009 424 129 103
Write-downs and write-ups from previous year plus year under review 660 287 327
Acquisition costs at 31 December 2009 1,084 416 430
1 also including changes in the group of companies included in consolidation
56 Income tax assets (€ millions)
2009 2008
Current tax assets 360 421
Deferred tax assets 2,252 2,371
Total 2,612 2,792
57 Non-current assets or disposal groups held for saleCompliant with IFRS 5, non-current assets held for sale and the assets of a disposal group held for sale are shown separately
in the balance sheet. (€ millions)
ASSETS 31/12/2009 31/12/2008
Shares in associated companies accounted for using the equity method
and joint ventures accounted for using the equity method — 2
Investment properties 4 2
Total 4 4
F-52

140 2009 Annual Report · HypoVereinsbank
Financial Statements (2) | Consolidated Financial Statements
58 Other assetsOther assets include prepaid expenses of €78 million (2008: €119 million).
59 Own securitisationSynthetic securitisation requires the portfolio to be divided into at least two tranches. The credit risk inherent in the underlying receivables is spread over
the tranches with different risk profiles. A traditional securitisation transaction (true sale), on the other hand, is structured in such a way that the cash flow
from the underlying receivables services at least two tranches reflecting different risk profiles.
One of the goals of securitisation transactions is to reduce the strain imposed on risk-weighted assets. Accordingly, the prime motivation for our securiti-
sation programmes is the desire to reduce the risk in our loan portfolio and to achieve the optimum capital allocation for creating value. In order to reduce
the strain imposed on risk-weighted assets in a way that is recognised by the supervisory authorities, at least 50% of the risk-weighted assets relating to
the mezzanine tranches of the underlying pool of receivables must be transferred compliant with Section 232 of the German Solvency Regulation (SolvV);
the securitising institution may retain the remaining portion. The extent to which the bank then actually retains risks depends on the current market condi-
tions and the type of securitisation transaction (synthetic or traditional), among other factors.
In the case of synthetic securitisation, the transfer of risk and the ensuing reduction in capital requirements is essentially achieved using hedges in the
form of guarantees and credit derivatives (credit default swaps, credit-linked notes). In the case of traditional securitisation, this is achieved by selling
balance sheet assets (true sale).
The Provide-A 2003 transaction expired during 2009 with an aggregate lending volume of €0.7 billion.
As a result of a downgraded rating of a guarantor and the related termination of supervisory recognition as a guarantor, the Building Comfort 2007 trans-
action became ineffective in February 2009, meaning that the reduction in risk-weighted assets was reversed.
At 31 December 2009, the total volume of lending in HVB Group’s full set of securitisation programmes totalled €43.7 billion, serving to deduct a gross
amount of €21.5 billion from risk-weighted assets compliant with Basel II or a net amount of €12.2 billion taking account of the retained tranches. In this
context, a risk weighting of 1.250% is assumed for the items deductible from capital.
With the Geldilux-TS-2005, Geldilux-TS-2007 and Geldilux-TS-2008 true sale transactions that have been carried out, the underlying receivables with a
carrying amount of €5.6 billion are still fully shown in the balance sheet. Compliant with SIC 12, the special purpose entities set up for this purpose –
Geldilux-TS-2005 S.A., Geldilux-TS-2007 S.A. and Geldilux-TS-2008 S.A. – are fully consolidated.
The Geldilux transactions, the true sale transaction Rosenkavalier 2008 was carried out with a view to using the securities generated as collateral for
repurchase agreements with the ECB. HVB Group continues to recognise the underlying receivables and the special purpose entity set up for this purpose
is fully consolidated. The volume of lending involved totalled €9.9 billion at 31 December 2009. The Bank has retained all the tranches, meaning that
there is no reduction in risk-weighted assets.
HVB Group continued its securitisation activities in 2009 with one new transaction (Geldilux-TS-2009). This true sale transaction was carried out with
a view to using the securities generated as collateral for repurchase agreements with the ECB. The underlying receivables with a carrying amount of
€1.0 billion continued to be recognised in full in the consolidated balance sheet of HVB Group. The Geldilux-TS-2009 transaction carried out in April 2009
for liquidity purposes was reversed again in November 2009.
Notes to the Consolidated Balance Sheet (CONTINUED)
F-53

HypoVereinsbank · 2009 Annual Report 141
ISSUER TRANSACTION NAME
LEGAL TRANSACTION
MATURITY
TYPE OF ASSET
SECURITISED
VOLUME OF
LENDING
BASEL II
€ millions
REDUCTION IN
RISK-WEIGHTED
ASSETS COMPLIANT
WITH BASEL II1
€ millions
TRANSACTION
CALL DATE
UniCredit Bank AG PROVIDE-A 2004-1
27/11/2045
27/2/2010 Private mortgage loans 1,382 145
Total for 2003-2004 1,382 145
UniCredit Bank AG PROVIDE-A 2005-1
25/8/2048
25/2/2011 Private mortgage loans 2,605 302
UniCredit Luxembourg S.A. Geldilux-TS-2005
10/12/2012
Series 3: 10/7/2010 Euroloans 2,000 1,840
Total for 2005 4,605 2,142
UniCredit Bank AG PROVIDE-A 2006-1
25/8/2048
1/5/2012 Private mortgage loans 1,718 262
UniCredit Bank AG Promise-XXS 2006-1
12/5/2024
12/8/2012 Corporate loans 2,079 1,112
Total for 2006 3,797 1,374
UniCredit Luxembourg S. A. GELDILUX-TS-2007
8/9/2014
8/4/2012 Euroloans 2,100 1,900
UniCredit Bank AG/
UniCredit Luxembourg S. A.
EuroConnect Issuer
LC 2007-1
15/3/2028
15/9/2013 Corporate loans 958 0
UniCredit Bank AG
EuroConnect Issuer
SME 2007-1
15/11/2030
15/2/2015 Corporate loans 1,815 958
UniCredit Bank AG Building Comfort 2007
25/1/2051
25/7/2013 Private mortgage loans 3,168 0
Total for 2007 8,041 2,858
UniCredit Luxembourg S. A. GELDILUX-TS-2008
10/1/2014
10/8/2011 Euroloans 1,491 1,295
UniCredit Bank AG Building Comfort 2008
25/9/2050
25/9/2013 Private mortgage loans 2,522 335
UniCredit Bank AG
EuroConnect Issuer
SME 2008-1
17/4/2033
17/4/2014 Corporate loans 1,466 704
UniCredit Bank AG SFA-1-2008
30/12/2021
30/9/2013 Corporate loans 7,896 4,442
UniCredit Bank AG SFA-3-2008
30/3/2028
30/12/2013
Corporate loans/
mortgage loans 9,145 6,208
UniCredit Bank AG SFA-2-2008
30/3/2028
30/12/2013 Corporate loans 3,348 2,043
Total for 2008 25,868 15,027
Total 43,693 21,546
1 does not include any retained risks
The values shown are carrying amounts relating to the reporting date 31 December 2009.
F-54

142 2009 Annual Report · HypoVereinsbank
Financial Statements (2) | Consolidated Financial Statements
60 Deposits from banks (€ millions)
2009 2008
Deposits from central banks 8,385 29,549
Deposits from banks 42,319 54,318
Current accounts and demand deposits 13,553 12,001
Reverse repos1 5,574 12,378
Other liabilities 23,192 29,939
Total 50,704 83,867
1 repurchase agreements
Amounts owed to related entities (€ millions)
2009 2008
Non-consolidated subsidiaries 4,325 6,342
Joint ventures — —
Associated companies — 151
Other participating interests 12 95
Total 4,337 6,588
61 Deposits from customers (€ millions)
2009 2008
Current accounts and demand deposits 41,281 36,237
Savings deposits 13,183 13,648
Reverse repos1 1,834 12,245
Other liabilities 40,192 52,832
Total 96,490 114,962
1 repurchase agreements
Liabilities to related entities and persons (€ millions)
2009 2008
Non-consolidated subsidiaries 320 330
Joint ventures 1 1
Associated companies 27 68
Other participating interests 628 10,377
Total 976 10,776
62 Debt securities in issue (€ millions)
2009 2008
Bonds 59,265 61,570
Other securities 2,021 2,069
Total 61,286 63,639
Debt securities in issue, payable to related entities (€ millions)
2009 2008
Non-consolidated subsidiaries 1,545 1,470
Joint ventures — —
Associated companies — —
Other participating interests — 52
Total 1,545 1,522
Notes to the Consolidated Balance Sheet (CONTINUED)
F-55

HypoVereinsbank · 2009 Annual Report 143
63 Financial liabilities held for trading (€ millions)
2009 2008
Negative fair values arising from derivative financial instruments 84,394 119,011
Other financial liabilities held for trading 36,812 44,933
Total 121,206 163,944
The negative fair values arising from derivative financial instruments are carried as financial liabilities held-for-trading purposes. Also included under
other financial liabilities held-for-trading purposes are warrants, certificates and bonds issued by our trading department as well as delivery obligations
arising from short sales of securities held for trading purposes.
The cumulative valuation effects of the held for trading financial liabilities in the portfolio at 31 December 2009, resulting among other things from the
own credit spread, total €100 million. Valuation expenses of €39 million arising from own credit spread changes accrued for these holdings in the year
under review.
64 Hedging derivatives (€ millions)
2009 2008
Micro fair value hedge 98 —
Fair value hedge portfolio 1,271 439
Cash flow hedge — 178
Total 1,369 617
65 Hedge adjustment of hedged items in the fair value hedge portfolioThe net changes in fair value of portfolio hedged items for receivables and liabilities with interest rate hedges total €1,200 million. This is offset on the
assets side by an economic equivalent amount of approximately the same size disclosed under hedging derivatives. The hedge adjustments are recog-
nised as gross amounts for one subsidiary for which it is possible to hedge assets and liabilities separately. The corresponding amount on the assets side
of the balance sheet is €53 million.
66 Income tax liabilities (€ millions)
2009 2008
Current tax liabilities 674 544
Deferred tax liabilities 1,175 1,394
Total 1,849 1,938
67 Liabilities of disposal groups held for saleThe amount of €4 million disclosed as the liabilities of disposal groups held for sale in 2008 related to the “Other liabilities” item in the balance sheet.
68 Other liabilitiesThis item essentially encompasses deferred income and accruals compliant with IAS 37. Accruals include, notably, commitments arising from accounts
payable with invoices outstanding, short-term liabilities to employees, and other accruals arising from fees and commissions, interest, cost of materials,
etc. In 2008, other liabilities also included the interests held by outside shareholders in the capital of certain investment funds consolidated by us.
69 Provisions (€ millions)
2009 2008
Provisions for pensions and similar commitments 50 104
Allowances for losses on guarantees and commitments 237 223
Restructuring provisions 121 92
Other provisions 1,091 1,072
Total 1,499 1,491
F-56
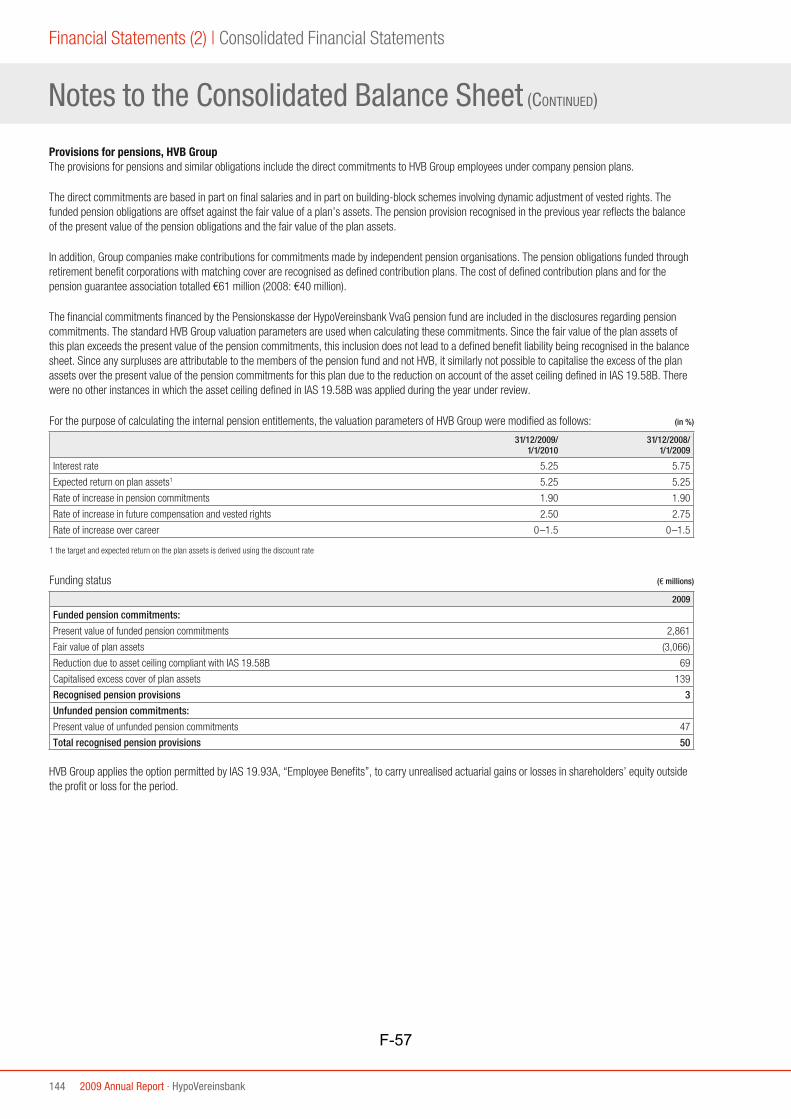
144 2009 Annual Report · HypoVereinsbank
Financial Statements (2) | Consolidated Financial Statements
Provisions for pensions, HVB GroupThe provisions for pensions and similar obligations include the direct commitments to HVB Group employees under company pension plans.
The direct commitments are based in part on final salaries and in part on building-block schemes involving dynamic adjustment of vested rights. The
funded pension obligations are offset against the fair value of a plan’s assets. The pension provision recognised in the previous year reflects the balance
of the present value of the pension obligations and the fair value of the plan assets.
In addition, Group companies make contributions for commitments made by independent pension organisations. The pension obligations funded through
retirement benefit corporations with matching cover are recognised as defined contribution plans. The cost of defined contribution plans and for the
pension guarantee association totalled €61 million (2008: €40 million).
The financial commitments financed by the Pensionskasse der HypoVereinsbank VvaG pension fund are included in the disclosures regarding pension
commitments. The standard HVB Group valuation parameters are used when calculating these commitments. Since the fair value of the plan assets of
this plan exceeds the present value of the pension commitments, this inclusion does not lead to a defined benefit liability being recognised in the balance
sheet. Since any surpluses are attributable to the members of the pension fund and not HVB, it similarly not possible to capitalise the excess of the plan
assets over the present value of the pension commitments for this plan due to the reduction on account of the asset ceiling defined in IAS 19.58B. There
were no other instances in which the asset ceiling defined in IAS 19.58B was applied during the year under review.
For the purpose of calculating the internal pension entitlements, the valuation parameters of HVB Group were modified as follows: (in %)
31/12/2009/
1/1/2010
31/12/2008/
1/1/2009
Interest rate 5.25 5.75
Expected return on plan assets1 5.25 5.25
Rate of increase in pension commitments 1.90 1.90
Rate of increase in future compensation and vested rights 2.50 2.75
Rate of increase over career 0–1.5 0–1.5
1 the target and expected return on the plan assets is derived using the discount rate
Funding status (€ millions)
2009
Funded pension commitments:
Present value of funded pension commitments 2,861
Fair value of plan assets (3,066)
Reduction due to asset ceiling compliant with IAS 19.58B 69
Capitalised excess cover of plan assets 139
Recognised pension provisions 3
Unfunded pension commitments:
Present value of unfunded pension commitments 47
Total recognised pension provisions 50
HVB Group applies the option permitted by IAS 19.93A, “Employee Benefits”, to carry unrealised actuarial gains or losses in shareholders’ equity outside
the profit or loss for the period.
Notes to the Consolidated Balance Sheet (CONTINUED)
F-57

HypoVereinsbank · 2009 Annual Report 145
The following table shows the breakdown of pension expense: (€ millions)
2009
Present value of the pension claims vested in the year under review (20)
Interest expense (124)
Expected income from plan assets 119
Losses from changes to plans —
Total (25)
Pension expense is recognised in payroll costs (pension and other employee benefit costs) as a net amount.
The following table shows an analysis of funded pension commitments for 2009: (€ millions)
Balance at 1 January 2009 2,751
Present value of the pension claims vested in the year under review 29
Interest expense 153
Contributions from plan participants 3
Actuarial gains (losses) 161
Payments affecting liquidity (125)
Changes in consolidated group (98)
Changes arising from foreign currency translation 3
Other changes (16)
Balance at 31 December 2009 2,861
The following table shows an analysis of the present value of unfunded pension commitments for 2009: (€ millions)
Balance at 1 January 2009 85
Present value of the pension claims vested in the year under review 1
Interest expense 3
Contributions from plan participants —
Actuarial gains (losses) 1
Payments affecting liquidity (4)
Changes in consolidated group (33)
Changes arising from foreign currency translation —
Other changes (6)
Balance at 31 December 2009 47
HVB reorganised its company pension plans (direct commitments) in 2009, setting up HVB Trust Pensionsfonds AG (pension fund) in the process. Both
the pension commitments to pensioners and the assets required to cover these commitments were transferred to the pension fund. The pensioners’
pension claims are not affected by the restructuring, and HVB continues to guarantee the pension. Although the pensioners’ claims are first of all against
the pension fund, however, there is also a legal claim against the Bank, to the extent that the pension fund is unable to meet the claims in full. All in all,
the pensioners’ rights are strengthened, as they have a direct claim against the pension fund in addition to a right of recourse against the Bank.
F-58

146 2009 Annual Report · HypoVereinsbank
Financial Statements (2) | Consolidated Financial Statements
The pension fund is a legally independent institution regulated by the German Federal Financial Supervisory Authority (BaFin).
It serves as an instrument for financing the company pension scheme by which the employer provides benefits for its employees under the company
pension scheme. What is more, the pensions are secured by HVB Trust Pensionsfonds AG.
HVB set up plan assets in the form of so-called contractual trust arrangements (CTA). This involved transferring the assets required to fund its pension
commitments to legally independent trustees, including HVB Trust e.V. Compliant with IAS 19.54 assets transferred to be offset against the pension
provisions, with the amount of the pension provisions in the corporate group declining accordingly.
The following table shows the plan assets available to the trustees to finance the pension obligations: (€ millions)
2009
Equities 5
Fixed-income securities 89
Property 84
Other assets 89
Investment funds 2,799
Plan assets 3,066
The following table shows the development of the plan assets in the year under review: (€ millions)
Balance at 1 January 2009 3,010
Expected income from plan assets 153
Actuarial gains (losses) 5
Allocations to plan assets (HVB Group) 105
Employee contributions —
Disbursements to beneficiaries (125)
Additional allocations in the form of benefits not taken —
Changes in exchange rates 4
Changes in consolidated group (86)
Balance at 31 December 2009 3,066
With regard to the plan assets, the item actuarial gains (losses) shows the difference between the expected income from plan assets and the income from
plan assets actually realised. The balance of expected income and actuarial gains from plan assets gives the actual income from plan assets of €158 mil-
lion.
The following tables provides an overview of the long-term development of the covered pension obligations and plan assets: (€ millions)
2009 2008 2007 2006 2005
Funded pension obligations 2,861 2,751 2,305 2,399 2,362
Plan assets 3,066 3,010 2,322 2,343 2,255
Difference between expected
income and actual income from plan assets 5 (104) (58) — 64
Notes to the Consolidated Balance Sheet (CONTINUED)
F-59

HypoVereinsbank · 2009 Annual Report 147
The cumulative actuarial gains recognised in shareholders’ equity compliant with IAS 19.93A total €324 million (2008: €203 million) before deferred
taxes or minority interests. Compliant with IAS 19.93C, the total also includes adjustments caused by changes in the limit defined in IAS 19.58B.
When the present value of the pension obligation was calculated, the differences between the expected and actual development in the composition of the
eligible employees (experience adjustment) totalled minus €55 million in the year under review (2008: minus €18 million, 2007: minus €27 million, 2006:
plus €5 million).
Allowances for losses on guarantees and commitments, restructuring provisions and other provisions (€ millions)
ALLOWANCES FOR LOSSES
ON GUARANTEES AND
COMMITMENTS
RESTRUCTURING
PROVISIONS
OTHER
PROVISIONS
Balance at 1 January 2009 223 92 1,072
Changes in consolidated group — (7) (103)
Changes arising from foreign currency translation (2) — —
Transfers to provisions 113 165 199
Reversals (18) (11) (43)
Reclassifications — (84) 69
Amounts used (79) (34) (103)
Non-current assets or disposal groups held for sale — — —
Balance at 31 December 2009 237 121 1,091
The allowances for losses on guarantees and commitments primarily include allowances for financial guarantees (guarantee risks and documentary
credits).
Other provisions include provisions for litigation fees, damage payments, anticipated losses and long-term liabilities to employees such as service anni-
versary awards, early retirement and partial retirement.
The provisions for the Retention Awards Programme are also carried under other provisions. In addition to the bonus for the current financial year,
selected employees in investment banking receive a retention award which is disbursed later (after two years), provided that these employees are still
working for HVB Group at that time. The award granted to the eligible employees attracts interest of 4.2% over the waiting period.
No further provisions were set aside for the Retention Awards Programme in 2009. The Retention Awards Programme from 2006 was disbursed in 2009.
The Retention Awards Programme from 2007 will be disbursed in 2010.
70 Shareholders’ equityAnalysis of the subscribed capital, authorised capital increase and conditional capital of UniCredit Bank AG.
Breakdown of subscribed capitalAt 31 December 2009, the subscribed capital of HVB totalled €2,407 million (2008: €2,407 million) and consisted of the following:
2009 2008
Shares of common bearer stock (no par shares) 787,830,072 787,830,072
Shares of registered preferred stock (no par shares) 14,553,600 14,553,600
The proportionate amount of capital stock attributable to the share amounts to €3.00 per no par share.
F-60

148 2009 Annual Report · HypoVereinsbank
Financial Statements (2) | Consolidated Financial Statements
The shares of preferred stock are non-voting and receive an advance share of profits of €0.064 per no par share, payable on a cumulative basis, as well
as a further share in profits of the same amount as the shares of common stock. The claim to payment on a cumulative basis of the advance share of
profits is granted to the holders of preferred stock as a separate right. The right to issue further shares of non-voting preferred stock with equal rights
remains reserved.
Authorised capital increase
YEAR AUTHORISED
AVAILABLE UNTIL
ORIGINAL AMOUNT
€ millions
BALANCE AT 31/12/2009
€ millions
2004 29/4/2009 990 —
The resolution adopted at the Annual General Meeting of Shareholders on 29 April 2004 with regard to the release of the remaining €137 million and the
simultaneous approval of an authorised capital increase with a new amount of €990 million was entered in the Commercial Register on 18 December
2006. An amount of €155 million from the authorised capital increase was used for the transfer of the investment banking activities of the former
UniCredit Banca Mobiliare S.p.A. (UBM) to HVB in April 2007 as part of a capital increase against a contribution in kind. The remaining authorised capital
increase which was available until 29 April 2009 has expired.
Conditional capitalNo use was made of the authorisation to issue conditional capital that expired on 14 May 2008. The conditional capital was consequently dissolved by
way of a resolution adopted by the Annual General Meeting of Shareholders on 19 May 2009.
Change in valuation of financial instrumentsThe reserves arising from changes in the valuation of financial instruments recognised in equity totalled €5 million (2008: €23 million) at 31 December
2009. Within this total, the €134 million decline in the hedge reserve to €195 million was largely offset by the positive development of the AfS reserve.
The AfS reserve recorded an increase of €116 million to minus €190 million in a far friendlier market environment. This can be attributed primarily to
positive fair value fluctuations notably in fixed-income securities classified as available for sale (AfS). In 2009 there was a minor, market-related increase
in the value of ABS holdings in the available-for-sale portfolio, for which there were no impairment criteria as defined in IAS 39.59 and hence no impair-
ment losses needed to be recognised.
71 Subordinated capitalThe following table shows the breakdown of subordinated capital included in deposits from banks and customers and debt securities in issue: (€ millions)
2009 2008
Subordinated liabilities 4,232 7,206
Participating certificates outstanding 205 205
Hybrid capital instruments 1,671 1,804
Total 6,108 9,215
Pursuant to Section 10 (4, 5 and 5a) of the German Banking Act (KWG) and in accordance with the Capital Accord introduced by the Basel Committee on
Banking Supervision in July 1988, subordinated capital (subordinated liabilities, participating certificates outstanding and hybrid capital instruments) was
carried as core capital and supplementary capital in 2009.
The following table shows the breakdown of subordinated capital by balance sheet item: (€ millions)
2009 2008
Deposits from banks 307 389
Deposits from customers 902 907
Debt securities in issue 4,899 7,919
Total 6,108 9,215
We have incurred interest expenses of €372 million in connection with this subordinated capital. Subordinated capital includes proportionate interest of
€125 million.
Notes to the Consolidated Balance Sheet (CONTINUED)
F-61

HypoVereinsbank · 2009 Annual Report 149
Subordinated liabilitiesThe borrower cannot be obliged to make early repayments in the case of subordinated liabilities. In the event of insolvency or liquidation, subordinated
liabilities are only repaid after the claims of all primary creditors have been settled.
There were subordinated liabilities of €1,062 million payable to related entities in 2009.
Participating certificates outstandingThe following issue represents a major component of HVB Group’s participating certificates outstanding:
ISSUER
YEAR OF ISSUE
TYPE
NOMINAL AMOUNT
€ MILLIONS
INTEREST RATE
IN %
MATURITY
UniCredit Bank AG (formerly
Bayerische Hypo- und Vereinsbank AG) 2001
Bearer participating
certificates 100 6.30 2011
Holders of participating certificates are subordinated creditors and are not entitled to a share of the proceeds on company liquidation.
In each case, the participating certificates grant holders an entitlement to an annual interest payment with priority over the entitlement of shareholders to
dividend payments; the interest payments arising from the participating certificates are reduced if such payments would result in a net loss for the year.
In the event of the interest payment being reduced, the shortfall is to be paid in the subsequent financial years, provided this does not result in a net loss
for the year; a claim to such payment only exists, however, during the term of the participating certificates.
Repayment is at the nominal amount; in the event of a net loss for the year or a reduction in the capital stock to cover losses, the redemption amount
to which holders are entitled declines proportionately. Where net profits are generated in the subsequent financial years following a participation of the
participating certificates in a net loss, the claims to repayment of the participating certificates are to be increased out of these profits before the net
income is appropriated in any other way, once the legal reserves have been replenished; this obligation terminates when the participating certificates
expire.
Hybrid capital instrumentsAt 31 December 2009, HVB Group had hybrid core capital of €1,186 million (eligible amount compliant with the German Banking Act, KWG) to bolster its
capital base.
The eligible hybrid core capital fell by €563 million compared with the previous-year total, mainly due to the omission of a €500 million hybrid bond,
which falls due for repayment in less than two years. In addition, partial buy-backs of the remaining hybrid issues were carried out, which were approved
by the German Federal Financial Supervisory Authority (BaFin) on account of HVB Group’s strong core capital base.
Hybrid capital instruments include issues placed by specially created subsidiaries in the form of capital contributions from silent partners or preferred
shares.
These instruments differ from supplementary capital in that they are subject to more stringent conditions in terms of maturity. The terms of issue for cap-
ital contributions from silent partners envisage a minimum term of ten years, while an unlimited term has been agreed with the investors for preferred
shares. In addition, hybrid capital instruments are not repaid until after supplementary capital has been repaid (subordinated liabilities and participating
certificates outstanding) in the event of bankruptcy.
In contrast to traditional components of core capital such as shares, the claim to a share of profit takes the form of a fixed interest payment in the case of
hybrid capital. Moreover, hybrid capital can be issued both with unlimited maturity and repayable in the long term.
Both the German Banking Supervisory Authority and the Basel Committee on Banking Supervision have expressly confirmed the recognition of hybrid
capital for banking supervisory purposes.
F-62

150 2009 Annual Report · HypoVereinsbank
Financial Statements (2) | Consolidated Financial Statements
72 Notes to the items in the cash flow statementThe cash flow statement shows the cash flows resulting from operating activities, investing activities and financing activities for the year under review.
Operating activities are defined broadly enough to allow the same breakdown as for operating profit.
The cash and cash equivalents shown correspond to the item “Cash and cash balances” in the balance sheet, comprising both cash on hand and cash
balances at central banks repayable on demand.
Change in other non-cash positions comprises the changes in the valuation of financial instruments, net additions to deferred taxes, changes in provi-
sions, changes in prorated and deferred interest, the reversal of premiums and discounts, changes arising from valuation using the equity method and
minority interest in net income.
Shares in three fully consolidated companies were sold in 2009. Proceeds of €192 million were generated from the sale of shareholdings, including
€86 million in the form of an investment accounted for using the equity method and €106 million in cash.
(€ millions)
SOLD
Assets
Cash and cash balances —
Financial assets held for trading —
Financial assets at fair value through profit or loss —
Available-for-sale financial assets 143
Shares in associated companies accounted for using the equity method
and joint ventures accounted for using the equity method —
Held-to-maturity investments —
Loans and receivables with banks 1,135
Loans and receivables with customers 925
Hedging derivatives —
Property, plant and equipment 83
Investment properties
Intangible assets 128
of which: goodwill —
Tax assets 9
Non-current assets or disposal groups held for sale —
Other assets 57
Liabilities
Deposits from banks 102
Deposits from customers 1,883
Debt securities in issue —
Financial liabilities held for trading —
Hedging derivatives —
Hedge adjustment of hedged items in the fair value hedge portfolio —
Tax liabilities 11
Liabilities of disposal groups held for sale —
Other liabilities 159
Provisions 129
Notes to the Cash Flow Statement
F-63

HypoVereinsbank · 2009 Annual Report 151
Other Information
73 Application of reclassification rules defined in IAS 39.50 et seq.Mostly in the first quarter of the financial year 2009, we reclassified further assets held for trading, for which there was no active market at the time of
reclassification, prospectively as loans and receivables compliant with IAS 39.50 et seq. These had a carrying amount or market value of €9.3 billion
(nominal value: €9.4 billion) at the time of reclassification. For the most part, this relates to Pfandbriefs, government bonds and bank bonds. The intention
to trade no longer exists for the reclassified assets, since the markets in these financial instruments had become illiquid as a result of the extraordinary
circum stances created by the financial crisis through to the time of reclassification. Given the high quality of the assets concerned, HVB intends to retain
the assets for a longer period. HVB has not reclassified any assets from the available-for-sale portfolio.
The following table shows the development of the reclassified holdings: (€ billions)
RECLASSIFIED ASSET-BACKED SECURITIES
AND OTHER DEBT SECURITIES
CARRYING AMOUNT OF ALL
RECLASSIFIED ASSETS1
FAIR VALUE OF ALL
RECLASSIFIED ASSETS
NOMINAL AMOUNT OF ALL
RECLASSIFIED ASSETS
Reclassified in 2008
Balance at 31/12/2008 13.7 11.8 14.6
Balance at 31/12/2009 9.0 8.0 9.7
Reclassified in 2009
Balance at 31/12/2009 7.3 7.4 7.4
Balance of reclassified assets at 31/12/2009 16.3 15.4 17.1
1 before accrued interest
The fair value of the financial instruments reclassified as loans and receivables with banks and customers amounts to a total of €15.4 billion at 31 De-
cember 2009. If these re classifications had not been carried out in 2008 and 2009, mark-to-market valuation (including realised disposals) would have
given rise to a net gain of €1,159 million in net trading income in the 2009 financial year. €163 million of this total relates to the holdings largely reclassi-
fied in March 2009. In 2008 as a whole, a net loss of €1.8 billion would have accrued in net trading income from the holdings reclassified in 2008.
These effects reflect a theoretical, pro forma calculation, as the assets are measured at amortised cost on account of the reclassification.
We have taken loan-loss provisions of €80 million on the reclassified assets in 2009 (2008: €63 million). Specific allowances account for €60 million of
this total and portfolio allowances account for €20 million. The fair value at the date when the reclassification takes effect represents the new acquisition
costs, some of which are considerably less than the nominal value. Accordingly, this difference (discount) is to be amortised over the remaining term of
the reclassified financial assets. This gives rise to an effect of €208 million (2008: €127 million) in 2009, which is recognised in net interest income.
A gain of €83 million on reclassified securities that had matured, been partially paid off and sold was recognised in the income statement in 2009.
74 Notes to selected structured productsAdditional information regarding selected structured products is given below in order to provide greater transparency. Assets of fully consolidated
commercial paper conduits and other fully consolidated special purpose vehicles are shown alongside tranches retained by HVB Group and holdings of
asset-backed securities (ABS) transactions issued by third parties, broken down by various criteria.
ABS portfolioIn a securitisation transaction, above all the originator transfers credit receivables and/or credit risks to third parties. The securitisation itself is usually
performed via special purpose vehicles (SPVs). In order to refinance the acquisition of receivables, these SPVs issue securities on the capital market that
are secured by the receivables acquired. This serves to transfer the associated credit risks to investors in the form of asset-backed securities. The secur-
ities issued by SPVs are generally divided into tranches which differ above all in terms of seniority in the servicing of claims to repayment and interest
payments. These tranches are generally assessed by rating agencies.
Depending on the underlying assets in a securitisation transaction, the following types of security among others are distinguished in ABS transactions:
– Residential mortgage-backed securities (RMBS) relating to mortgage loans in the private sector (residential mortgage loans)
– Commercial mortgage-backed securities (CMBS) relating to mortgage loans in the commercial sector (commercial mortgage loans)
– Collateralised loan obligations (CLO) relating to commercial bank loans
– Collateralised bond obligations (CBO) relating to securities portfolios
Besides this, consumer loans, credit card receivables and lease receivables are also securitised.
F-64

152 2009 Annual Report · HypoVereinsbank
Financial Statements (2) | Consolidated Financial Statements
Positions retained from own securitisation transactions and in third-party ABS transactions, broken down by rating class (HVB Group
without fully consolidated commercial paper conduits or other fully consolidated special purpose vehicles; these are shown separately) (€ millions)
31/12/2009 31/12/2008
CARRYING AMOUNTS SENIOR MEZZANINE JUNIOR TOTAL TOTAL
Positions retained from own securitisations 81 136 21 238 447
Positions in third-party ABS transactions 3,949 1,422 33 5,404 7,131
Residential mortgage-backed securities (RMBS) 1,777 528 4 2,309 2,928
thereof:
US subprime — — — — —
US alt A 21 18 4 43 43
Commercial mortgage-backed securities (CMBS) 804 338 — 1,142 1,283
Collateralised debt obligations (CDO) 87 139 — 226 618
thereof:
US subprime 1 6 — 7 9
US Alt A — 4 — 4 5
Collateralised loan obligations (CLO)/
Collateralised bond obligations (CBO) 660 238 6 904 1,023
Consumer loans 316 75 — 391 465
Credit cards 86 9 — 95 119
Leases 133 71 — 204 298
Others 86 24 23 133 397
Total31/12/2009 4,030 1,558 54 5,642
31/12/2008 5,601 1,886 91 7,578
Unfunded collateralised debt
obligations (CDO) (derivatives)1
31/12/2009 4 306 83 393
31/12/2008 44 348 192 584
1 the amount shown in the table represents the carrying amount (fair value)
The positions are classified as senior, mezzanine and junior on the basis of external ratings, or internal ratings where no external rating exists. Only those
tranches with the best rating are carried as senior tranches. Only tranches with low ratings (worse than BB- in external ratings) and unrated tranches
(known as first loss pieces) are carried as junior tranches; all other tranches are grouped together as mezzanine tranches.
Other Information (CONTINUED)
F-65

HypoVereinsbank · 2009 Annual Report 153
Positions retained from own securitisation transactions and in third-party ABS transactions, broken down by region (HVB Group
without fully consolidated commercial paper conduits or other fully consolidated special purpose vehicles are shown separately) (€ millions)
31/12/2009
CARRYING AMOUNTS EUROPE USA ASIA OTHER REGIONS TOTAL
Positions retained from own securitisations 238 — — — 238
Positions in third-party ABS transactions 4,458 510 200 236 5,404
Residential mortgage-backed securities (RMBS) 2,045 44 33 187 2,309
thereof:
US subprime — — — — —
US alt A — 43 — — 43
Commercial mortgage-backed securities (CMBS) 944 90 94 14 1,142
Collateralised debt obligations (CDO) 32 143 51 — 226
thereof:
US subprime — 7 — — 7
US Alt A — 4 — — 4
Collateralised loan obligations (CLO)/
Collateralised bond obligations (CBO) 785 98 1 20 904
Consumer loans 299 86 2 4 391
Credit cards 76 — 19 — 95
Leases 167 26 — 11 204
Others 110 23 — — 133
Total31/12/2009 4,696 510 200 236 5,642
31/12/2008 6,155 585 407 431 7,578
Unfunded collateralised debt
obligations (CDO) (derivatives)1
31/12/2009 28 365 — — 393
31/12/2008 36 548 — — 584
1 the amount shown in the table represents the carrying amount (fair value)
F-66

154 2009 Annual Report · HypoVereinsbank
Financial Statements (2) | Consolidated Financial Statements
Positions retained from own securitisation transactions and in third-party ABS transactions, broken down by remaining maturity (HVB Group
without fully consolidated commercial paper conduits or other fully consolidated special purpose vehicles are shown separately) (€ millions)
31/12/2009
CARRYING AMOUNTS LESS THAN 1 YEAR
BETWEEN
1 AND 5 YEARS
MORE THAN
5 YEARS TOTAL
Positions retained from own securitisations 36 159 43 238
Positions in third-party ABS transactions 337 3,642 1,425 5,404
Residential mortgage-backed securities (RMBS) 42 1,348 919 2,309
thereof:
US subprime — — — —
US alt A — 21 22 43
Commercial mortgage-backed securities (CMBS) 62 939 141 1,142
Collateralised debt obligations (CDO) 2 131 93 226
thereof:
US subprime — — 7 7
US Alt A — — 4 4
Collateralised loan obligations (CLO)/
Collateralised bond obligations (CBO) 15 708 181 904
Consumer loans 70 232 89 391
Credit cards 86 9 — 95
Leases 46 156 2 204
Others 14 119 — 133
Total31/12/2009 373 3,801 1,468 5,642
31/12/2008 399 5,336 1,843 7,578
Unfunded collateralised debt
obligations (CDO) (derivatives)1
31/12/2009 — 163 230 393
31/12/2008 13 296 275 584
1 the amount shown in the table represents the carrying amount (fair value)
Other Information (CONTINUED)
F-67

HypoVereinsbank · 2009 Annual Report 155
Positions retained from own securitisation transactions and in third-party ABS transactions broken down by class as per IAS 39 (HVB Group
without fully consolidated commercial paper conduits or other fully consolidated special purpose vehicles are shown separately) (€ millions)
31/12/2009
CARRYING AMOUNTS
HELD FOR
TRADING
FAIR VALUE
OPTION
LOANS &
RECEIVABLES
HELD TO
MATURITY
AVAILABLE
FOR SALE TOTAL
Positions retained from own securitisations 23 — — — 215 238
Positions in third-party ABS transactions 324 97 4,712 56 215 5,404
Residential mortgage-backed securities (RMBS) 47 40 2,190 — 32 2,309
thereof:
US subprime — — — — — —
US alt A — 1 42 — — 43
Commercial mortgage-backed securities (CMBS) 37 4 1,039 — 62 1,142
Collateralised debt obligations (CDO) 1 4 137 34 50 226
thereof:
US subprime — — 7 — — 7
US Alt A — — 4 — — 4
Collateralised loan obligations (CLO)/
Collateralised bond obligations (CBO) 235 33 572 18 46 904
Consumer loans 1 — 390 — — 391
Credit cards — — 86 — 9 95
Leases 3 4 178 3 16 204
Others — 12 120 1 — 133
Total31/12/2009 347 97 4,712 56 430 5,642
31/12/2008 633 177 5,874 67 827 7,578
Unfunded collateralised debt
obligations (CDO) (derivatives)1
31/12/2009 393 — — — — 393
31/12/2008 584 — — — — 584
1 the amount shown in the table represents the carrying amount (fair value)
F-68

156 2009 Annual Report · HypoVereinsbank
Financial Statements (2) | Consolidated Financial Statements
Fully consolidated commercial paper conduits and other consolidated special purpose vehicles Alongside the directly held portfolios of own and external ABS transactions, further structured products are held through commercial paper conduits that
are managed by HVB (SPVs that issue short-term commercial paper to refinance their assets) and other fully consolidated special purpose vehicles.
Essentially, these involve credit receivables of third parties that are securitised by HVB using the services of the commercial paper conduits. Pos itions in
ABS transactions issued by third parties and in hedge funds are also shown. An amount of €259 million out of the total €2,033 million disclosed under
“Other” relates to investments under which HVB passes on all the risks and rewards to customers.
Positions held by fully consolidated commercial paper conduits and other consolidated special purpose vehicles,
broken down by product category and rating class (€ millions)
31/12/2009 31/12/2008
CARRYING AMOUNTS SENIOR MEZZANINE JUNIOR TOTAL TOTAL
Residential mortgage loans/
Residential mortgage-backed securities (RMBS) 196 1,324 1891 1,709 1,465
Commercial mortgage loans/
Commercial mortgage-backed securities (CMBS) 689 29 — 718 976
Collateralised debt obligations (CDO) 4 — — 4 5
Collateralised loan obligations (CLO)/
Collateralised bond obligations (CBO) — 86 — 86 154
Consumer loans 402 501 — 903 1,127
Credit cards — — — — —
Leases 493 — — 493 628
Other (including hedge fund investments) 553 837 6432 2,033 1,458
Total31/12/2009 2,337 2,777 832 5,946
31/12/2008 1,758 4,055 — 5,813
1 these assets are impaired
2 the volume shown here relates to investment and hedge funds with no rating and are hence disclosed under Junior
The positions are classified as senior, mezzanine and junior on the basis of external ratings, or internal ratings where no external ratings exist. Only those
tranches with the best rating are carried as senior tranches. Only tranches with low ratings (worse than BB- in external ratings) and unrated tranches
(known as first loss pieces) are carried as junior tranches; all other tranches are grouped together as mezzanine tranches.
Positions held by fully consolidated commercial paper conduits and other consolidated special purpose vehicles,
broken down by product category and region (€ millions)
31/12/2009
CARRYING AMOUNTS EUROPE USA ASIA OTHER REGIONS TOTAL
Residential mortgage loans/
Residential mortgage-backed securities (RMBS) 1,513 2 — 194 1,709
Commercial mortgage loans/
Commercial mortgage-backed securities (CMBS) 609 109 — — 718
Collateralised debt obligations (CDO) — 4 — — 4
Collateralised loan obligations (CLO)/
Collateralised bond obligations (CBO) — 86 — — 86
Consumer loans 903 — — — 903
Credit cards — — — — —
Leases 493 — — — 493
Other (including hedge fund investments) 984 821 — 228 2,033
Total31/12/2009 4,502 1,022 — 422 5,946
31/12/2008 4,517 1,044 — 252 5,813
Other Information (CONTINUED)
F-69

HypoVereinsbank · 2009 Annual Report 157
Positions held by fully consolidated commercial paper conduits and other consolidated special purpose vehicles,
broken down by product category and remaining maturity (€ millions)
31/12/2009
CARRYING AMOUNTS LESS THAN 1 YEAR
BETWEEN
1 AND 5 YEARS
MORE THAN
5 YEARS TOTAL
Residential mortgage loans/
Residential mortgage-backed securities (RMBS) 384 — 1,325 1,709
Commercial mortgage loans/
Commercial mortgage-backed securities (CMBS) — 4 714 718
Collateralised debt obligations (CDO) — — 4 4
Collateralised loan obligations (CLO)/
Collateralised bond obligations (CBO) — — 86 86
Consumer loans 903 — — 903
Credit cards — — — —
Leases 493 — — 493
Other (including hedge fund investments) 1,381 112 540 2,033
Total31/12/2009 3,161 116 2,669 5,946
31/12/2008 2,813 453 2,547 5,813
Positions held by fully consolidated commercial paper conduits and other consolidated special purpose vehicles,
broken down by product category and class as per IAS 39 (€ millions)
31/12/2009
CARRYING AMOUNTS
HELD FOR
TRADING
FAIR VALUE
OPTION
LOANS &
RECEIVABLES
HELD TO
MATURITY
AVAILABLE
FOR SALE TOTAL
Residential mortgage loans/
Residential mortgage-backed securities (RMBS) — — 1,707 2 — 1,709
Commercial mortgage loans/
Commercial mortgage-backed securities (CMBS) — 81 608 — 29 718
Collateralised debt obligations (CDO) — — — 4 — 4
Collateralised loan obligations (CLO)/
Collateralised bond obligations (CBO) — — — 55 31 86
Consumer loans — — 903 — — 903
Credit cards — — — — — —
Leases — — 493 — — 493
Other (including hedge fund investments) 643 297 760 82 251 2,033
Total31/12/2009 643 378 4,471 143 311 5,946
31/12/2008 — 184 5,200 169 260 5,813
75 Fair value hierarchyWe show financial instruments measured at fair value and recognised at fair value in the balance sheet separately in a fair value hierarchy in the following
table. This fair value hierarchy is divided into the following levels:
Level 1 contains financial instruments measured using prices of identical assets or liabilities listed on an active market. These prices are incorporated
unchanged. We have assigned mostly listed equity instruments and bonds to this category.
Assets and liabilities whose valuation is derived from directly observable (prices) or indirectly observable (derived from prices) input data are shown in
Level 2. No price can be observed on an active market for the assets and liabilities concerned themselves. As a result of this, we notably show the fair
values of interest rate and credit derivatives in this level together with the fair values of ABS bonds, provided a liquid market exists for the asset class in
question.
Financial assets and liabilities of €384 million have been transferred between Level 1 and Level 2. Almost all of this total relates to fixed-income
securities for which the fair value is calculated using valuation models based on valuation parameters that can be observed on an active market as the
fair value can no longer be observed on an active market. At the same time, financial assets or liabilities of €3,136 million migrated between Level 2 and
Level 1. For the most part, this involves fixed-income securities for which a fair value can now be observed on an active market. The other securities
concerned are equities.
F-70

158 2009 Annual Report · HypoVereinsbank
Financial Statements (2) | Consolidated Financial Statements
Level 3 relates to assets or liabilities for which the fair value cannot be calculated exclusively on the basis of observable market data (non-observable
input data). Thus, the respective fair values also incorporate valuation parameters based on model assumptions. This includes derivatives and structured
products that contain at least one “exotic” component, such as foreign currency or interest rate derivatives on illiquid currencies, derivatives without
standard market terms, structured products with an illiquid underlying as reference and ABS bonds of an asset class for which no liquid market exists.
If the value of a financial instrument is based on non-observable input parameters, the value of these parameters may be selected from a range of pos-
sible appropriate alternatives at the balance sheet date. Appropriate values are selected for these non-observable parameters when the annual financial
statements are prepared, reflecting the predominant market conditions and the valuation control approach of the Group.
Changes to the appropriate alternative parameter values on the fair value (after adjustments) is shown in the sensitivity analysis presented below. The
positive change in fair values at 31 December 2009 resulting from the use of possible appropriate alternatives would be €227.9 million, and the negative
change would be €77.3 million.
The following non-observable parameters were varied (stress test) for the sensitivity analysis for equity products included in Level 3: spot prices for hedge
funds, implicit volatility, dividends, implicit correlations and the assumptions regarding the interpolation between individual parameters observable on the
market, such as volatilities.
The following parameters were varied for interest rate products in Level 3 as part of the sensitivity analysis: interest rate correlations and the parameter
that governs how quickly a fluctuating interest rate reverts to the long-term mean (mean reversion).
More conservative and more aggressive values for correlations between the fair value of the credit derivative (CDS) and the respective underlying and
implicit correlations were applied for credit derivatives than was the case as part of the fair value calculation. Furthermore, rating-dependent shifts to the
mid-market CDS levels were assumed for illiquid CDSs.
(€ millions)
31/12/2009
FAIR VALUE OBSERVED ON
AN ACTIVE MARKET
(LEVEL 1)
FAIR VALUE BASED ON
VALUATION PARAMETERS
OBSERVED ON THE MARKET
(LEVEL 2)
FAIR VALUE BASED ON
VALUATION PARAMETERS NOT
OBSERVED ON THE MARKET
(LEVEL 3)
Financial assets recognised in the
balance sheet at fair value
Financial assets held for trading 35,017 95,643 2,729
thereof: derivatives 4,198 75,211 1,672
Financial assets at fair value through profit or loss 7,790 5,568 400
Available-for-sale financial assets 1,611 915 1,915
Hedging derivatives 194 3,383 1
Financial liabilities recognised in the
balance sheet at fair value
Financial liabilities held for trading 14,419 103,579 3,208
thereof: derivatives 6,158 75,732 2,504
Hedging derivatives 50 1,319 —
Transfers were made from Level 2 to Level 3 in the year under review as follows: €415 million for financial assets held for trading; €114 million for finan-
cial assets at fair value through profit or loss; €113 million for available-for-sale financial assets; and €311 million for financial liabilities held for trading.
These transfers were made because certain input parameters for the valuation model applied were no longer observable on the market. There were no
significant transfers from Level 1 to Level 3.
Transfers were made from Level 3 to Level 2 in the year under review as follows: €904 million for financial assets held for trading; and €1,344 million for
financial liabilities held for trading. These transfers were made because parameters that could not previously be observed on the market for the valuation
model applied could be observed again on the market. There were no significant transfers from Level 3 to Level 1.
In the year under review, HVB Group did not issue any securities to be recognised at fair value that are included in Level 3.
Other Information (CONTINUED)
F-71

HypoVereinsbank · 2009 Annual Report 159
76 Fair values of financial instruments compliant with IFRS 7The fair values stated for financial instruments as defined in IFRS 7 are the amounts for which the asset could be exchanged, or a liability settled,
between knowledgeable, willing parties in an arm’s length transaction on the balance sheet date.
The fair values are calculated using the market information available at the reporting date and individual company valuation methods.(€ billions)
2009 2008
ASSETSCARRYING
AMOUNT FAIR VALUE
CARRYING
AMOUNT FAIR VALUE
Cash and cash balances 6.4 6.4 5.6 5.6
Financial assets held for trading 133.4 133.4 199.0 199.0
Financial assets at fair value through profit or loss 13.8 13.8 13.3 13.3
Available-for-sale financial assets
thereof measured
at cost 1.4 1.4 1.7 1.7
at fair value 3.0 3.0 4.2 4.2
Shares in associated companies accounted for using the equity method
and joint ventures accounted for using the equity method 0.1 0.1 — —
Held-to-maturity investments 2.7 2.7 6.0 5.9
Loans and receivables with banks 43.3 43.3 41.5 41.3
Loans and receivables with customers 145.9 148.0 175.5 177.9
Hedging derivatives 3.6 3.6 2.7 2.7
Hedge adjustment amount of hedged items in fair value hedge portfolio 0.1 0.1 — —
Total 353.7 355.8 449.5 451.6
2009 2008
LIABILITIESCARRYING
AMOUNT FAIR VALUE
CARRYING
AMOUNT FAIR VALUE
Deposits from banks 50.7 50.7 83.9 84.1
Deposits from customers 96.5 97.1 115.0 115.5
Debt securities in issue 61.3 62.8 63.6 64.0
Financial liabilities held for trading 121.2 121.2 163.9 163.9
Hedging derivatives 1.4 1.4 0.6 0.6
Hedge adjustment amount of hedged items in fair value hedge portfolio 1.2 1.2 0.6 0.6
Other liabilities1 — — 0.4 0.4
Total 332.3 334.4 428.0 429.1
1 interests held by outside shareholders in consolidated investment funds, which are designated as a separate class in accordance with IFRS 7, have been disclosed here since 2007
(€ billions)
2009 2008
CARRYING
AMOUNT FAIR VALUE
CARRYING
AMOUNT FAIR VALUE
Irrevocable credit commitments 56.8 56.8 73.1 73.1
The fair values of certain financial instruments stated with their nominal values are roughly equivalent to their carrying amounts. These include the cash
and cash balances as well as receivables and liabilities without a defined maturity or fixed interest rate.
For other receivables and liabilities, future anticipated cash flows are discounted to their present value using current interest rates taking into account the
respective spreads. The spread used here for receivables is determined on the basis of Basel II-compliant expected loss values and the cost of capital.
Where loans and receivables with banks and customers contain reclassified securities, these are stated at the fair value shown in Note 73.
F-72
160 2009 Annual Report · HypoVereinsbank
Financial Statements (2) | Consolidated Financial Statements
Quoted market prices are used for exchange-traded securities and derivatives as well as for listed debt instruments. The fair value of the remaining
securities is calculated as the net present value of anticipated future cash flows.
The fair values of single currency and cross-currency swaps and interest rate futures are calculated on the basis of discounted, anticipated future cash
flows. In doing so, we apply the market rates applicable for the remaining maturity of the financial instruments.
The fair value of forward exchange transactions is computed on the basis of current forward rates. Options are valued using price quotations or generally
accepted models used to calculate the price of options. The common Black & Scholes (equity, currency and index instruments) or lognormal models
(interest instruments) are used to value simple European options. In the case of more complex instruments, the interest is simulated using term-structure
models with the current interest rate structure as well as caps and swaption volatilities as parameters relevant for valuation. The disbursement structure
of the equities or indexes for the complex instruments is valued using either Black & Scholes or a stochastic volatility model with equity prices, volatilities,
correlations and dividend expectations as parameters.
Investments in joint ventures and associated companies are valued using the equity method, provided they are not of minor significance. Investments in
non-consolidated companies and listed companies not accounted for using the equity method are normally carried at their fair value.
Where the fair value of non-listed assets cannot be reliably determined, such assets are recognised at amortised cost.
The fair values of financial guarantees and irrevocable credit commitments are the same as their carrying amounts.
The difference in HVB Group between the fair values and carrying amounts totals €2.1 billion for assets and €2.1 billion for liabilities.
77 Undiscounted cash flowCompliant with IFRS 7.39, we are disclosing the remaining terms for non-derivative and derivative financial liabilities and for credit commitments and
financial guarantees. The breakdown of remaining terms is based on the contractual due dates. These are crucial for determining the timing of payments.
Consequently, we have divided the contractually agreed, undiscounted payments into maturity buckets. The undiscounted cash flows shown here are not
comparable with the carrying amounts, as the latter are based on discounted cash flows.
At the same time, we have broken down the financial assets by remaining term in this context compliant with IFRS 7.39(c). These are financial assets that
generate cash flows used to settle financial liabilities.
In the following tables, we have divided the derivative and non-derivative financial assets and liabilities into maturity buckets. All financial liabilities have
been allocated to the earliest possible maturity bucket. The derivatives on financial assets held for trading and financial liabilities held for trading have
been allocated to the shortest maturity bucket with their fair value. This reflects the fact that the derivatives are subject to an intention to sell in the short
term and hence the maturity of the contractual undiscounted cash flows does not adequately represent the timing of payments that is actually expected.
The remaining financial instruments classified as financial assets held for trading and financial liabilities held for trading have been allocated to the
earliest possible maturity bucket with their cash flows. Hedging derivatives used under hedge accounting have been allocated to the applicable maturity
bucket with their contractually agreed, undiscounted cash flows.
Other Information (CONTINUED)
F-73

HypoVereinsbank · 2009 Annual Report 161
Credit commitments and financial guarantees have been allocated with the maximum amount to the shortest maturity bucket (repayable on demand) in
which they can be utilised at the earliest. The credit commitments amount to €37.3 billion. This assumption defined in IFRS 7 is unrealistic for credit
commitments not utilised and contingent liabilities for financial guarantees in particular, as it is not likely that all open credit commitments and financial
guarantees will be utilised on the next day. The same holds true for the presentation of the fair values of trading derivatives.
Breakdown of financial assets by maturity bucket (€ millions)
2009
CARRYING AMOUNTS
REPAYABLE
ON DEMAND
UP TO
1 MONTH
1 MONTH TO
3 MONTHS
3 MONTHS TO
1 YEAR
1 YEAR TO
5 YEARS
MORE THAN
5 YEARS UNDATED
Financial assets held for trading 18,859 1,894 1,735 4,729 10,625 7,459 9,091
Derivatives on financial assets held for trading 81,081 — — — — — —
Financial assets at fair value
through profit or loss — 186 258 712 7,407 5,550 —
Available-for-sale financial assets 1 71 27 190 1,201 2,325 1,927
Held-to-maturity investments — 5 — 29 2,545 59 4
Loans and receivables with banks 36,529 18,014 1,976 4,786 6,426 3,205 1,234
Loans and receivables with customers 13,547 14,490 12,319 19,114 58,821 43,724 5,126
Hedging derivatives — 64 414 819 1,698 369 —
Breakdown of non-derivative and derivative financial liabilities by maturity bucket (€ millions)
2009
CARRYING AMOUNTS
REPAYABLE
ON DEMAND
UP TO
1 MONTH
1 MONTH TO
3 MONTHS
3 MONTHS TO
1 YEAR
1 YEAR TO
5 YEARS
MORE THAN
5 YEARS UNDATED
Deposits from banks 27,710 14,045 4,022 6,315 9,339 5,175 81
Deposits from customers 54,933 12,848 7,226 10,649 8,020 5,225 855
Debt securities in issue 48 4,812 6,393 10,620 28,705 20,260 41
Financial liabilities held for trading 15,868 59 712 1,649 10,008 1,584 5,171
Derivatives on financial assets held for trading 84,394 — — — — — —
Hedging derivatives — 25 179 222 636 201 —
Credit commitments and financial guarantees 56,796 — — — — — —
F-74

162 2009 Annual Report · HypoVereinsbank
Financial Statements (2) | Consolidated Financial Statements
78 Key capital ratios (based on German Commercial Code)The capital ratio for banking supervisory purposes defined in the German Solvency Regulation represents the ratio of the eligible equity compliant with
Section 10 of the German Banking Act (KWG) to the total eligible amount for default risk, market risk and operational risk multiplied by 12.5 (corresponds
to the risk-weighted equivalent of these risk positions). The capital ratio and the equity funds ratio must be at least 8.0%. Under Section 10 of the German
Banking Act in conjunction with Section 2 of the German Solvency Regulation, the core capital ratio calculated as the ratio of core capital to total risk-
weighted assets determined as described above must be at least 4.0%.
The eligible equity which is used to calculate the capital ratio in accordance with the German Solvency Regulation consists of the core capital, the supple-
mentary capital and Tier 3 capital. The Tier 3 capital comprises current subordinated liabilities which we only use to back market risk positions. HVB
Group mostly uses internal models to measure market risk positions.
The following tables show equity funds based on financial statements approved by the Supervisory Board and risk-weighted assets together with the risk
equivalents for market risk positions and operational risk at 31 December 2009:
Equity funds1 (€ millions)
2009 2008
Tier 1
Shares of common stock 2,363 2,363
Additional paid-in capital, retained earnings, minority interest, own shares 16,813 17,224
Hybrid capital instruments (silent partnership certificates and trust preferred securities)
without prorated interest 1,186 1,749
Other 314 214
50% deductible Items (229) (339)
Total core capital for solvency purposes 20,447 21,211
Tier 2
Unrealised reserves in land and buildings and in securities — —
Offsetting reserves for general banking risks 45 46
Cumulative shares of preferred stock 44 44
Participating certificates outstanding 155 175
Subordinated liabilities 3,542 4,515
Value adjustment excess for IRBA positions 386 676
Other 17 19
50% deductible Items (228) (339)
Total supplementary capital for solvency purposes 3,961 5,136
Total equity capital 24,408 26,347
Tier 3 capital — —
Total equity funds 24,408 26,347
1 group of consolidated companies and principles of consolidation in accordance with banking supervisory regulations
Pursuant to Sections 10 and 10a of the German Banking Act, the equity funds of HVB Group amounted to €24,408 million at 31 December 2009. Supple-
mentary capital includes no unrealised reserves pursuant to Section 10 (2b) 1 No. 6 and 7 of the German Banking Act.
Our equity funds compliant with the KWG rules are calculated on the basis of the individual financial statements of the consolidated companies, taking into
account the special provisions of German banking supervisory regulations.
Other Information (CONTINUED)
F-75

HypoVereinsbank · 2009 Annual Report 163
The following table shows the reconciliation from the equity items shown in the balance sheet prepared in accordance with IFRS: (€ millions)
CORE CAPITAL
SUPPLEMENTARY
CAPITAL
TIER 3 CAPITAL
TOTAL EQUITY
FUNDS
Shown in IFRS balance sheet
Shareholders’ equity 23,638 — — 23,638
Reconciliation to the equity funds compliant with the German Banking Act
AfS reserve 190 — — 190
Hedge reserves (195) — — (195)
Cumulative shares of preferred stock (44) 44 — —
Deduction of intangible assets (656) — — (656)
Ineligible profit components under banking supervisory regulations (1,840) — — (1,840)
Consolidated profit for 2009 (1,633) — — (1,633)
Hybrid capital recognised under banking supervisory regulations 1,186 — — 1,186
Eligible portion of certificates outstanding — 155 — 155
Eligible portion of subordinated liabilities — 3,542 — 3,542
Reclassifications to Tier 3 capital due to banking supervisory regulations — — — —
Eligible Tier 3 capital unused — — — —
Unrealised reserves in land and buildings and in securities — — — —
Value adjustment excess for IRBA positions — 386 — 386
Deductible items due to non-consolidated investments (46) (45) — (91)
Deductible items compliant with Sect.10 (6a), German Banking Act (183) (182) — (365)
Other effects
(e. g. differences in group of consolidated companies and principles of consolidation) 30 61 — 91
Equity funds compliant with German Banking Act 20,447 3,961 — 24,408
(€ billions)
2009
BASEL II
2008
BASEL II
Risk-weighted assets from
on-balance-sheet counterparty risk positions 70.8 83.3
off-balance sheet counterparty risk positions 17.2 22.5
other counterparty risk positions1 0.6 1.5
derivative counterparty risk positions 14.3 18.7
Total credit risk-weighted assets 102.9 126.0
Risk-weighted asset equivalent for market risk positions 3.9 12.2
Risk-weighted asset equivalent for operational risk 8.3 10.0
Total risk-weighted assets 115.1 148.2
1 primarily including repos and securities lending transactions
At 31 December 2009, the key capital ratios (based on financial statements approved by the Supervisory Board) were as follows: (in %)
2009
BASEL II
2008
BASEL II
Core capital ratio I (core capital/risk-weighted assets) 19.9 16.8
Core capital ratio II (core capital/[risk-weighted assets + 12.5 x market risk positions + 12.5 x operational risk]) 17.8 14.3
Equity funds ratio
(Equity funds/[risk-weighted assets + 12.5 x market risk positions + 12.5 x operational risk]) 21.2 17.8
F-76

164 2009 Annual Report · HypoVereinsbank
Financial Statements (2) | Consolidated Financial Statements
79 Contingent liabilities and other commitments (€ millions)
2009 2008
Contingent liabilities1 19,544 24,428
Guarantees and indemnities 19,544 24,428
Other commitments 56,787 67,068
Irrevocable credit commitments 37,252 48,645
Other commitments 19,535 18,423
Total 76,331 91,496
1 contingent liabilities are offset by contingent assets to the same amount
Neither contingent liabilities nor irrevocable lending commitments contain any significant items. The gross volume of contingent liabilities for which
provisions have been created in the above totals €662 million (2008: €584 million). The provisions of €237 million (2008: €223 million) set up for these
liabilities have been deducted from the contingent liabilities recognised and are carried under provisions in the balance sheet (see Note 69, “Provisions”).
The vast majority of the other commitments of €19,535 million in the year under review relate to delivery obligations arising from securities lending trans-
actions. Commitments arising from rental, leasing and maintenance agreements, and from rental of office space and use of technical equipment are also
included. The contracts run for standard market periods and no charges have been put off to future years.
As part of real estate financing and development operations, we have assumed rental obligations or issued rental guarantees on a case-by-case basis to
make fund constructions more marketable – in particular for lease funds and (closed) KG real estate funds offered by our H.F.S. Hypo-Fondsbeteiligungen
für Sachwerte GmbH subsidiary. Identifiable risks arising from such guarantees have been taken to the income statement.
Commitments for uncalled payments on shares not fully paid up amounted to €639 million at year-end 2009 (2008: €703 million), and similar obligations
for shares in cooperatives totalled €1 million (2008: €1 million). Under Section 22 (3) and Section 24 of the German Private Limited Companies Act
(Gesetz betreffend die Gesellschaften mit beschränkter Haftung, GmbHG), we were also liable for defaults on such calls in respect of one company for
an aggregate of €1 million (2008: €1 million).
Under Section 26 of the German Private Limited Companies Act, we were liable for calls for additional capital of €5 million (2008: €7 million) with regard
to CMP Fonds I GmbH and of €58 million (2008: €58 million) with regard to Liquiditäts-Konsortialbank GmbH, Frankfurt am Main, at year-end 2009. In
addition, under Article 5 (4) of the Articles of Association of Liquiditäts-Konsortialbank GmbH, we are jointly and severally liable for any defaults on such
calls by members of the Association of German Banks.
At the balance sheet date, we had unlimited personal liability arising from shares in 24 partnerships.
Under Section 5 (10) of the by-laws of the Deposit Guarantee Fund, we have undertaken to indemnify the Association of German Banks, Berlin, against
any losses it might incur as a result of action taken on behalf of the banks in which we have a majority interest.
With a Statement of Responsibility dated 21 December 1993, HVB issued an undertaking to the State of Baden-Wuerttemberg (Ministry of Finance) to
assume a liquidity provision obligation in the event of the sale, liquidation or bankruptcy of HVB Projekt GmbH.
In the same way as HVB and its affiliated banks assume liability in Germany, our subsidiaries, in their capacity as members of the respect ive deposit
guarantee funds in their country of operations, assume liability in their respective countries.
Contingent liabilities payable to related entities (€ millions)
2009 2008
Non-consolidated subsidiaries 3,817 3,062
Joint ventures — —
Associated companies — 1
Other participating interests 78 51
Total 3,895 3,114
Other Information (CONTINUED)
F-77

HypoVereinsbank · 2009 Annual Report 165
80 Statement of responsibilityUniCredit Bank AG ensures that, to the extent of its shareholding, the companies set forth below are in a position to meet their contractual obligations
except in the event of political risks:
1. Banks in Germany
Bankhaus Neelmeyer AG, Bremen
DAB Bank AG, Munich1
2. Banks in other regions
HVB Singapore Limited, Singapore
UniCredit Luxembourg S. A., Luxembourg
3. Financial companies
Beteiligungs- und Handelsgesellschaft in Hamburg mit beschränkter Haftung, Hamburg
HVB Alternative Financial Products AG in administration, Vienna
UniCredit Leasing GmbH, Hamburg
4. Companies with bank-related auxiliary services
HypoVereinsFinance N. V., Amsterdam
1 the company provides a Statement of Responsibility with the same wording for selected subsidiaries in its annual report
If our shareholding in a particular company declines, our commitment arising from the above Statement of Responsibility is also reduced to the same
extent with regard to commitments of the relevant company that did not arise until after our shareholding decreased.
HVB no longer provides a Statement of Responsibility for companies which left HVB Group in a previous financial year, but for which a Statement of
Responsibility had been provided in earlier annual reports. Liabilities of these companies arising after their departure from HVB Group are not covered
by earlier Statements of Responsibility.
81 Trust business Trust assets (€ millions)
2009 2008
Loans and receivables with banks 87 110
Loans and receivables with customers 440 431
Equity securities and other variable-yield securities 239 200
Bonds — —
Participating interests — —
Property, plant and equipment — —
Other assets — —
Fund shares held in trust 1,492 1,587
Remaining trust receivables — —
Total 2,258 2,328
Trust liabilities (€ millions)
2009 2008
Deposits from banks 199 207
Deposits from customers 2,059 2,121
Debt securities in issue — —
Other liabilities — —
Total 2,258 2,328
F-78

166 2009 Annual Report · HypoVereinsbank
Financial Statements (2) | Consolidated Financial Statements
82 Assets assigned or pledged as security for own liabilities Examples of own liabilities of HVB Group for which we provide collateral are special credit facilities provided by KfW and similar institutions, which we
have passed on as loans in compliance with their conditions. In addition, security has been provided for borrowings under repurchase agreements on
international money markets, for open market transactions with central banks and for securities lending transactions. As a seller under repurchase agree-
ments, HVB Group has entered into sales and repurchase transactions for securities with a carrying amount of €51.4 billion. These securities continue
to be shown under our assets, and the consideration received in return is stated under liabilities.
The following table shows the breakdown of own liabilities for which we provide collateral: (€ millions)
2009 2008
Deposits from banks 51,493 49,411
Deposits from customers 8,716 25,176
Debt securities in issue — —
Financial liabilities held for trading 14,008 19,596
Contingent liabilities — —
Total 74,217 94,183
The assets pledged as security for own liabilities can be broken down as follows: (€ millions)
2009 2008
Financial assets held for trading 66,036 67,527
Financial assets at fair value through profit or loss 164 16,189
Available-for-sale financial assets 27 1,046
Held-to-maturity investments — —
Deposits from banks 338 312
Deposits from customers 7,652 9,109
Property, plant and equipment — —
Total 74,217 94,183
Compliant with IFRS 7.14, we are disclosing the carrying amount of the financial assets which we provide as security. In addition details will be added to
the extent to which the security provided may be pledged or sold on by the borrower.
(€ millions)
2009 2008
Aggregate carrying amount of assets pledged as security 74,217 94,183
of which:
pledged/sold on 15,825 48,282
83 Collateral received that HVB Group may sell on or pledge onAs part of repurchase agreements and securities lending transactions, HVB Group has received security that it may sell on or pledge on at any time with-
out the security provider having to be in arrears. The fair value of this security is €23.6 billion.
HVB Group has actually sold or pledged on €13.4 billion of this total, for which there is an obligation to return collateral received of the same type,
volume and quality.
Other Information (CONTINUED)
F-79

HypoVereinsbank · 2009 Annual Report 167
84 Information on relationships with related partiesTransactions involving related parties are always conducted on an arm’s length basis.
At the Annual General Meeting of Shareholders on 23 May 2006, the so-called opting-out clause under the Act concerning the Disclosure of Manage-
ment Board Remuneration was used and a resolution was adopted, whereby the information required in Section 285 (1) No. 9a and (5) to (9) and Section
314 (1) No. 6a (5) to (9) of the German Commercial Code is not to be disclosed in our annual and consolidated financial statements for the financial years
2006 until 2010, at the latest until 22 March 2011. In addition, HVB is no longer a listed company as a result of the filing of the squeeze-out resolution in
the Commercial Register on 15 September 2008. Hence the emoluments paid to members of the Management Board are not shown on an individualised
basis.
Emoluments paid to members of the Supervisory Board and Management Board (€ millions)
FIXED
COMPENSATION
PROFIT-RELATED
COMPONENTS
LONG-TERM
INCENTIVES1
TOTAL
2009 2008 2009 2008 2009 2008 2009 2008
Management Board of UniCredit Bank AG 3 3 22 47 13 1 64 8
Supervisory Board of UniCredit Bank AG
for Supervisory Board activities 1 0.8 —6 0.45 — — 16 1.2
Former members of the Management Board
of UniCredit Bank AG and their surviving dependants 10 10
Transitional allowances for former members
of the Management Board 4 8
1 cash value of the share-based compensation
2 the profit-related components for 2009 are generally deferred over two years, with disbursement in subsequent years dependent on defined company targets being met. Moreover,
income of €3.4 million from the reversal of the provision of the 2008 financial year is not included
3 prorated disclosure of the long-term incentive plans for 2005 to 2008. A long-term incentive cash plan has been set up for 2009, with disbursement dependent on targets being met in 2013
4 the accrued taxes and lawyer fees of €2.6 million relating to various pending legal disputes have been advanced to executives as part of the insurance benefits arising from a corporate
Directors and Officers insurance policy
5 relating to 2007 financial year, disbursed in 2008
6 added to this is a profit-related component of €1.7 million for the 2009 financial year, provided the Annual General Meeting of Shareholders adopts a resolution regarding the profit available
for distribution as proposed
7 this is a reserve that was not fully utilised
Up until 30 July 2009, the total remuneration paid to the individual members of the Management Board was set by the Remuneration & Nomination
Committee of the Supervisory Board; from this date onwards, the full Supervisory Board has been responsible for setting the total remuneration paid
to the individual members of the Management Board. Direct compensation has three components and comprises fixed and variable elements: fixed
compensation, variable compensation as an incentive with a profit-related component (short-term incentive) and a long-term incentive.
Besides direct remuneration, Management Board members have received pension commitments. Seven members of the Management Board (one of
whom left the Bank during the year) took part in the funded deferred compensation scheme in 2009, which is also available to the Bank’s employees.
The Bank has provided 20% of the fixed salary and the short-term incentive disbursed as contributions; this is subject to a cap of €200,000 per financial
year for five members of the Management Board and €120,000 per financial year for one member of the Management Board, and a total of €120,000
per annum for one member of the Management Board. It has been agreed with the members of the Management Board that this amount of their pay
would be converted, which means that, instead of a disbursed sum of money, the Management Board member receives a pension commitment to the
same value from the Bank.
Details of share-based compensation (number)
MEMBERS OF THE MANAGEMENT BOARD OF UNICREDIT BANK AG
Options
Stock options 2008 1,454,150
Stock options 2009 —1
Performance shares
Performance shares 2008 355,158
Performance shares 2009 —1
1 long-term incentive: no long-term incentive plan based on options and performance shares was set up for the 2009 financial year; a cash-based plan was set up instead
F-80

168 2009 Annual Report · HypoVereinsbank
Financial Statements (2) | Consolidated Financial Statements
For more details of the stock options and performance shares, please refer to Note 36, where UniCredit Group’s long-term incentive programme under-
lying these instruments is described.
Benefits in kind and other fringe benefits are granted to members of the Management Board to the usual extent. The amounts involved are included in the
totals for fixed compensation shown.
Compensation paid to members of the Management Board or employees of HVB for positions on supervisory boards of Group companies is to be surren-
dered to HVB.
A sum of €616,298 was transferred to provisions for pensions in the 2009 financial year to cover the commitments made to the members of the
Management Board; this relates to the deferred compensation invested in a fund.
Upon the formation of HVB Trust Pensionsfonds AG, pension commitments to a majority of the former executives of UniCredit Bank AG were transferred
from UniCredit Bank AG to HVB Trust Pensionsfonds AG. The assets required to cover the pension commitments were transferred at the same time. The
Bank has continued to set up provisions for the commitments transferred to the pension fund in the consolidated financial statements prepared in accord-
ance with IFRS. The provision for pensions payable to retired members of the Management Board calculated in accordance with IFRS totals €121 million.
Provisions are no longer shown in the commercial balance sheet in the annual financial statements of UniCredit Bank AG prepared in accordance with the
German Commercial Code for the group of people affected by the transfer. Compliant with Section 285 of the German Commercial Code, the provisions
for pensions payable to former members of the Management Board and their surviving dependants at HVB declined to €23 million (2008: €94 million)
accordingly at 31 December 2009.
Other Information (CONTINUED)
F-81

HypoVereinsbank · 2009 Annual Report 169
Compensation of members of the Supervisory BoardThe following table shows the breakdown of compensation paid to members of the Supervisory Board for 2009: (in €)
FIXED COMPENSATION
COMPENSATION FOR
COMMITTEE WORK
VARIABLE
COMPENSATION10
TOTAL
(EXCL. VALUE-ADDED TAX)
Alessandro Profumo, Chairman1 4,931.51 15,070.68 20,002.19 (13,671.509)
Sergio Ermotti, Chairman2 47,534.24 145,264.66 192,798.90 (131,778.069)
Peter König, Deputy Chairman 37,500.00 27,500.00 114,600.00 179,600.00
Dr Lothar Meyer, Deputy Chairman3 26,232.88 55,000.00 80,167.67 161,400.55
Dr Wolfgang Sprissler, Deputy Chairman4 33,801.37 103,296.99 137,098.36
Gerhard Bayreuther 25,000.00 27,500.00 76,400.00 128,900.00
Aldo Bulgarelli 25,000.00 27,500.00 76,400.00 128,900.00 (88,103.159)
Beate Dura-Kempf 25,000.00 76,400.00 101,400.00
Paolo Fiorentino 25,000.00 76,400.00 101,400.00 (69,306.909)
Dario Frigerio5 2,465.75 7,535.34 10,001.09 (6,835.749)
Giulio Gambino 25,000.00 76,400.00 101,400.00
Klaus Grünewald 25,000.00 76,400.00 101,400.00
Karl Guha6 22,534.25 68,864.66 91,398.91 (62,471.149)
Ranieri de Marchis7 13,972.60 15,369.86 42,700.27 72,042.73 (49,241.219)
Beate Mensch 25,000.00 76,400.00 101,400.00
Marina Natale8 11,027.40 11,828.77 33,699.73 56,555.90 (38,655.959)
Roberto Nicastro 25,000.00 76,400.00 101,400.00 (69,306.909)
Vittorio Ogliengo5 2,465.75 7,535.34 10,001.09 (6,835.749)
Panagiotis Sfeliniotis 25,000.00 76,400.00 101,400.00
Professor Hans-Werner Sinn 25,000.00 76,400.00 101,400.00
Jutta Streit 25,000.00 76,400.00 101,400.00
Michael Voss 25,000.00 76,400.00 101,400.00
Jens-Uwe Wächter 25,000.00 76,400.00 101,400.00
Dr Susanne Weiss6 22,534.25 68,864.66 91,398.91
Total 550,000.00 164,698.63 1,680,800.00 2,395,498.63 (2,147,204.119)
1 member and chairman until 5 February 2009
2 chairman since 5 February 2009
3 deputy chairman until 5 February 2009
4 member and deputy chairman since 5 February 2009
5 member until 5 February 2009
6 member since 5 February 2009
7 member until 23 July 2009
8 member since 24 July 2009
9 after deduction of 30% supervisory board tax and 5.5% solidarity surcharge
10 subject to a resolution adopted by the Annual General Meeting of Shareholders regarding the appropriation of the profit available for distribution
The compensation paid to members of the Supervisory Board is regulated in Article 15 of the Bank’s Articles of Association. The currently applicable
arrangements under these articles are based on a resolution adopted by the Annual General Meeting of Shareholders on 23 May 2006 modified by a
resolution adopted by the Annual General Meeting of Shareholders on 30 September 2009. The compensation is divided into a fixed and a variable,
dividend-dependent component. Under the terms of the arrangements, the members of the Supervisory Board receive fixed compensation of €25,000
pay able upon conclusion of the financial year and dividend-dependent compensation of €400 for every €0.01 dividend paid above the amount of €0.12
per no par share. The chairman of the Supervisory Board receives twice the compensation stated, the deputy chairmen one and a half times the compen-
sation stated. Furthermore, the Supervisory Board is entitled to a fixed annual compensation of €165,000 (previously €120,000) payable upon conclusion
of the financial year, which is used to compensate committee members on the basis of a corresponding Supervisory Board resolution. According to this
resolution, the members of the Audit Committee receive annual compensation of €27,500 each for the 2009 financial year. The chairman of the commit-
tee receives twice this amount. The members of the Remuneration & Nomination Committee and the members of the statutory Negotiating Committee,
which only meets if required, receive no separate compensation for committee work. Furthermore, every member of the Supervisory Board and every
member of the Audit Committee receives an allowance of €250 for attending a meeting of the Supervisory Board or the Audit Committee. In addition, the
members of the Supervisory Board are reimbursed their expenses and the value-added tax payable on their Supervisory Board functions. Where they sit
on the Management Committee of UniCredit S.p.A., the members of the Supervisory Board surrender to UniCredit S.p.A. the compensation they receive
for supervisory board work, as the performance of supervisory board functions at subsidiaries is considered a typical management duty. Members of the
Supervisory Board who belong to the Supervisory Board for only a part of the financial year receive pro rata compensation. The chairman of the Supervi-
sory Board has an office complete with staff at his disposal. In 2009, expense allowances totalling €45,001.45 were paid to members of the Supervisory
Board. No remuneration was paid in the 2009 financial year for services provided personally.
F-82

170 2009 Annual Report · HypoVereinsbank
Financial Statements (2) | Consolidated Financial Statements
The total amount of loans and advances made to, and liabilities assumed for, members of the Supervisory Board and Management Board
and to executives at Bereichsvorstand level at the balance sheet date was as follows: (€ millions)
2009 2008
Management Board of UniCredit Bank AG 1 3
Supervisory Board of UniCredit Bank AG 5 1
Executives at Bereichsvorstand level 2 1
Interest is payable on all loans and advances made to members of the Management Board and the Supervisory Board, and to the executives at Bereichs-
vorstand level at usual market rates.
85 Fees paid to the independent auditorsThe following table shows the breakdown of fees of €16 million recorded as expense in the year under review, as paid to the independent auditors
KPMG AG, Wirtschaftsprüfungsgesellschaft, for activities performed for HVB Group: (€ millions)
2009
Fee for auditing of the financial statements 7
Other auditing and appraisal services 4
Tax advisory services —
Other services 5
86 Employees Average number of people employed by us
2009 2008
Employees (excluding trainees) 19,788 23,525
Full-time 15,496 18,556
Part-time 4,292 4,969
Trainees 1,096 1,122
Other Information (CONTINUED)
F-83

HypoVereinsbank · 2009 Annual Report 171
87 Offices Offices, broken down by region
1/1/2009
ADDITIONS REDUCTIONS CHANGE IN
CONSOLIDATED
GROUP 31/12/2009NEW OPENINGS CLOSURES CONSOLIDATIONS
Germany
Baden-Wuerttemberg 34 — 1 — — 33
Bavaria 463 — 3 — (2) 458
Berlin 15 — — — — 15
Brandenburg 9 — 1 — — 8
Bremen 8 — 1 — — 7
Hamburg 42 1 2 3 2 40
Hesse 20 1 3 1 — 17
Lower Saxony 30 2 1 — — 31
Mecklenburg-Western Pomerania 9 — — — — 9
North Rhine-Westphalia 27 — 1 — — 26
Rhineland-Palatinate 25 1 — — — 26
Saarland 10 — — — — 10
Saxony 14 1 — — — 15
Saxony-Anhalt 12 — 1 — — 11
Schleswig-Holstein 67 1 3 — — 65
Thuringia 9 1 — — — 10
Subtotal 794 8 17 4 — 781
Other regions
Austria 7 — — — — 7
Other western Europe 20 1 1 — 9 29
Central and eastern Europe 2 — 2 — — —
Africa 1 — — — — 1
Americas 15 — — — 3 18
Asia 13 1 1 — 3 16
Subtotal 58 2 4 — 15 71
Total 852 10 21 4 15 852
F-84

172 2009 Annual Report · HypoVereinsbank
Financial Statements (2) | Consolidated Financial Statements
Other Information (CONTINUED)
88 Members of the Supervisory Board
Alessandro ProfumoChairman
until 5 February 2009
Sergio ErmottiChairman1
Peter KönigDeputy Chairman
Dr Lothar MeyerDeputy Chairman2
Dr Wolfgang SprisslerDeputy Chairman
since 5 February 2009
Ranieri de Marchisuntil 23 July 2009
Beate Mensch
Marina Natalesince 24 July 2009
Roberto Nicastro
Vittorio Ogliengountil 5 February 2009
Panagiotis Sfeliniotis
Professor Hans-Werner Sinn
Gerhard Bayreuther
Aldo Bulgarelli
Beate Dura-Kempf
Paolo Fiorentino
Dario Frigeriountil 5 February 2009
Giulio Gambino
Klaus Grünewald
Karl Guhasince 5 February 2009
Jutta Streit
Michael Voss
Jens-Uwe Wächter
Dr Susanne Weisssince 5 February 2009
1 since 5 February 2009
2 until 5 February 2009
F-85

HypoVereinsbank · 2009 Annual Report 173
Peter BuschbeckRetail division
since 1 August 2009
Willibald CernkoRetail division1
until 30 September 2009
Rolf FriedhofenChief Financial Officer (CFO)
Henning GieseckeChief Risk Officer (CRO)
until 31 July 2009
Heinz LaberHuman Resources Management,
Global Banking Services
Munich, 9 March 2010
UniCredit Bank AG
The Management Board
Lutz DiederichsCorporates & Commercial Real Estate
Financing division,
Markets & Investment Banking division2,
now Corporate & Investment Banking
division, as a result of the integration of
the two above-mentioned divisions
Andrea Umberto VareseChief Risk Officer (CRO)
since 1 August 2009
Dr Theodor Weimer Board spokesman
Markets & Investment Banking division3
Andreas WölferWealth Management division
89 Members of the Management Board
1 until 31 July 2009
2 since 1 April 2009
3 until 31 March 2009
Buschbeck
Laber
Diederichs
Varese
Friedhofen
Dr Weimer Wölfer
F-86

174 2009 Annual Report · HypoVereinsbank
Financial Statements (2) | Consolidated Financial Statements
To the best of our knowledge, and in accordance with the applicable reporting principles, the consolidated financial statements give a true and fair view of
the assets, liabilities, financial position and profit or loss of the Group, and Management’s Discussion and Analysis includes a fair review of the develop-
ment and performance of the business and the position of the Group, together with a description of the principal opportunities and risks associated with
the expected development of the Group.
Statement by the Management Board
Munich, 9 March 2010
UniCredit Bank AG
The Management Board
Buschbeck
Laber
Diederichs
Varese
Friedhofen
Dr Weimer Wölfer
F-87
HypoVereinsbank · 2009 Annual Report 175
We have audited the consolidated financial statements prepared by the UniCredit Bank AG (until 14 December 2009 Bayerische Hypo- und Vereinsbank AG), Munich comprising the balance sheet, the consolidated income statement, statement of other comprehensive income, statement of changes in shareholders’ equity, cash flow statement and the notes to the consolidated financial statements, together with the group management report for the business year from 1 January to 31 December 2009. The preparation of the consolidated financial statements and the group management report in accordance with IFRSs, as adopted by the EU, and the additional requirements of German commercial law pursuant to § 315a Abs. 1 HGB [Handelsge-setzbuch “German Commercial Code”] (and supplementary provisions of the shareholder agreement/articles of incorporation) are the responsibility of the parent company’s management. Our responsibility is to express an opinion on the consolidated financial statements and on the group management report based on our audit.
We conducted our audit of the consolidated financial statements in accordance with § 317 HGB [Handelsgesetzbuch „German Commercial Code“] and German generally accepted standards for the audit of financial statements promulgated by the Institut der Wirtschaftsprüfer [Institute of Public Auditors in Germany] (IDW). Those standards require that we plan and perform the audit such that misstatements materially affecting the presentation of the net assets, financial position and results of operations in the consolidated financial statements in accordance with the applicable financial reporting frame-work and in the group management report are detected with reasonable assurance. Knowledge of the business activities and the economic and legal environment of the Group and expectations as to possible misstatements are taken into account in the determination of audit procedures. The effective-ness of the accounting-related internal control system and the evidence supporting the disclosures in the consolidated financial statements and the group management report are examined primarily on a test basis within the framework of the audit. The audit includes assessing the annual financial statements of those entities included in consolidation, the determination of entities to be included in consolidation, the accounting and consoli dation principles used and significant estimates made by management, as well as evaluating the overall presentation of the consolidated financial statements and group management report. We believe that our audit provides a reasonable basis for our opinion.
Our audit has not led to any reservations.
In our opinion, based on the findings of our audit, the consolidated financial statements comply with IFRSs, as adopted by the EU, the additional require-ments of German commercial law pursuant to § 315a Abs. 1 HGB (and supplementary provisions of the shareholder agreement/articles of incorporation) and give a true and fair view of the net assets, financial position and results of operations of the Group in accordance with these requirements. The group management report is consistent with the consolidated financial statements and as a whole provides a suitable view of the Group’s position and suitably presents the opportunities and risks of future development.
Munich, 10 March 2010
KPMG AG Wirtschaftsprüfungsgesellschaft
Pukropski Pfeiffer Wirtschaftsprüfer Wirtschaftsprüfer
Auditor’s Report
F-88

58 2009 Annual Report · HypoVereinsbank
For the year ended 31 December 2009
Income Statement of UniCredit Bank AG
Expenses (€ millions)
2009 2008
1 Interest payable 6,403 12,308
2 Fees and commissions payable 919 1,046
3 Net loss on financial operations — 3,149
4 General administrative expense
a) payroll costs
aa) wages and salaries 1,544 1,386
ab) social security costs and expenses for
pensions and other employee benefits 720 348
2,264 1,734
including: for pensions
€530 million (150)
b) other administrative expenses 1,472 1,401
3,736 3,135
5 Amortisation, depreciation and impairment losses
on intangible and tangible assets 106 159
6 Other operating expenses 203 114
7 Write-downs and impairments for receivables and
certain securities as well as additions to provisions
for losses on guarantees and indemnities 2,302 2,470
8 Write-downs and impairments on participating
interests, shares in affiliated companies
and investment securities 220 107
9 Expenses from absorbed losses 223 51
10 Extraordinary expenses — —
11 Transfers to the special fund for general banking
risks pursuant to Section 340g, Commercial Code — —
12 Taxes on income 322 149
13 Other taxes, unless shown under
“Other operating expenses” 2 21
14 Net income 1,633 —
Total expenses 16,069 22,709
F-89

HypoVereinsbank · 2009 Annual Report 59
Income (€ millions)
2009 2008
1 Interest income from
a) loans and money market operations 8,217 12,164
b) fixed-income securities and government-inscribed debt 2,213 3,616
10,430 15,780
2 Current income from
a) equity securities and other variable-yield securities 426 832
b) participating interests 21 100
c) shares in affiliated companies 340 160
787 1,092
3 Income earned under profit-pooling
and profit-and-loss transfer
agreements 18 52
4 Fees and commissions receivable 2,014 2,256
5 Net profit on financial operations 1,209 —
6 Write-ups on bad and doubtful debts and on certain
securities as well as release of provisions for losses on
guarantees and indemnities 1,244 1,002
7 Write-ups on participating interests,
shares in affiliated companies and
investment securities — —
8 Other operating income 367 176
9 Net loss — 2,351
Total income 16,069 22,709
1 Net income/net loss 1,633 (2,351)
2 Withdrawal from retained earnings
a) from legal reserve — —
b) from reserve for own shares 3 —
c) from other retained earnings — 2,354
3 2,354
3 Transfer to retained earnings
a) to legal reserve — —
b) to reserve for own shares — 3
c) to other retained earnings 3 —
3 3
4 Profit available for distribution 1,633 —
F-90

60 2009 Annual Report · HypoVereinsbank
at 31 December 2009
Balance Sheet of UniCredit Bank AG
Assets (€ millions)
31/12/2009 31/12/2008
1 Cash and cash balances
a) cash on hand 495 536
b) balances with central banks 5,780 4,703
including: with Deutsche Bundesbank
€4,707 million (4,270)
6,275 5,239
2 Treasury bills and other bills eligible
for refinancing with central banks
a) Treasury bills and zero-interest treasury notes and
similar securities issued by public authorities 153 11
including: eligible for refinancing with
Deutsche Bundesbank
€152 million (8)
b) bills of exchange — —
including: eligible for refinancing with
Deutsche Bundesbank
€— million (—)
153 11
3 Loans and receivables with banks
a) repayable on demand 23,845 24,525
b) other loans and receivables 39,607 51,210
63,452 75,735
including: mortgage loans
€— million (—)
municipal loans
€752 million (767)
4 Loans and receivables with customers 118,781 143,717
including: mortgage loans
€53,428 million (61,531)
municipal loans
€13,673 million (14,413)
other loans secured by
real-estate liens
€3,474 million (3,671)
Amount carried forward: 188,661 224,702
F-91

HypoVereinsbank · 2009 Annual Report 61
Liabilities (€ millions)
31/12/2009 31/12/2008
1 Deposits from banks
a) repayable on demand 16,910 12,966
b) with agreed maturity dates or periods of notice 46,379 85,866
63,289 98,832
including: registered mortgage bonds in issue
€1,344 million (1,483)
registered public-sector bonds in issue
€450 million (445)
bonds given to lender as
collateral for funds borrowed:
registered mortgage bonds
€1 million (2)
and registered public-sector bonds
€5 million (3)
2 Deposits from customers
a) Savings deposits
aa) with agreed period of notice of three months 13,016 11,530
ab) with agreed period of notice
of more than three months 72 110
13,088 11,640
b) registered mortgage bonds in issue 9,962 10,590
c) registered public-sector bonds in issue 4,020 3,860
d) other debts
da) repayable on demand 40,173 45,297
db) with agreed maturity dates or periods of notice 57,321 82,963
including: bonds given to lender as
collateral for funds borrowed:
registered mortgage bonds
€40 million (76)
and registered public-sector bonds
€34 million (60)
97,494 128,260
124,564 154,350
Amount carried forward: 187,853 253,182
F-92

62 2009 Annual Report · HypoVereinsbank
Balance Sheet of UniCredit Bank AG (CONTINUED)
Assets (€ millions)
31/12/2009 31/12/2008
Amount brought forward: 188,661 224,702
5 Bonds and other
fixed-income securities
a) money market paper
aa) issued by public authorities 3 1,281
including: those eligible for collateral for
Deutsche Bundesbank advances
€— million (864)
ab) issued by other borrowers 6,835 12,197
including: those eligible for collateral for
Deutschen Bundesbank advances
€2,298 million (7,506)
6,838 13,478
b) bonds and notes
ba) issued by public authorities 24,173 20,615
including: those eligible for collateral for
Deutsche Bundesbank advances
€23,573 million (20,109)
bb) issued by other borrowers 47,842 65,124
including: those eligible for collateral for
Deutsche Bundesbank advances
€26,995 million (34,974)
72,015 85,739
c) own bonds 13,169 15,582
nominal value €14,907 million (16,634)
92,022 114,799
6 Equity securities and other variable-yield securities 10,044 12,663
7 Participating interests 1,053 1,091
including: in banks
€21 million (19)
in financial service institutions
€— million (—)
8 Shares in affiliated companies 2,915 3,014
including: in banks
€1,123 million (1,186)
in financial service institutions
€240 million (46)
Amount carried forward: 294,695 356,269
F-93

HypoVereinsbank · 2009 Annual Report 63
Liabilities (€ millions)
31/12/2009 31/12/2008
Amount brought forward: 187,853 253,182
3 Debt securities in issue
a) bonds
aa) mortgage bonds 19,256 19,556
ab) public-sector bonds 2,691 3,233
ac) other bonds 38,094 37,186
60,041 59,975
b) other debt securities in issue — —
including: money market paper
€— million (—)
acceptances and promissory notes
€— million (—)
60,041 59,975
4 Trust liabilities 232 247
including: loans taken out on a trust basis
€232 million (247)
5 Other liabilities 30,559 28,162
6 Deferred income
a) from issuing and lending operations 62 89
b) other 225 268
287 357
7 Provisions
a) provisions for pension fund
and similar obligations 590 1,523
b) tax provisions 663 559
c) other provisions 2,195 2,019
3,448 4,101
8 Subordinated liabilities 5,193 7,632
9 Participating certificates outstanding 205 205
including: those due in less than two years
€50 million (—)
10 Fund for general banking risks 291 291
Amount carried forward: 288,109 354,152
F-94

64 2009 Annual Report · HypoVereinsbank
Balance Sheet of UniCredit Bank AG (CONTINUED)
Assets (€ millions)
31/12/2009 31/12/2008
Amount brought forward: 294,695 356,269
9 Trust assets 232 247
including: loans granted on a trust basis
€232 million (247)
10 Intangible assets 189 261
11 Property, plant and equipment 287 314
12 Own shares — —
nominal value €— million (—)
13 Other assets 13,497 16,155
14 Prepaid expenses
a) from issuing and lending operations 93 134
b) other 83 106
176 240
Total assets 309,076 373,486
F-95

HypoVereinsbank · 2009 Annual Report 65
Liabilities (€ millions)
31/12/2009 31/12/2008
Amount brought forward: 288,109 354,152
11 Shareholders’ equity
a) subscribed capital 2,407 2,407
divided into:
787,830,072 shares of common
bearer stock
14,553,600 shares of registered
non-voting preferred stock
b) additional paid-in capital 9,791 9,791
c) retained earnings
ca) legal reserve — —
cb) reserve for own shares — 3
cc) other retained earnings 7,136 7,133
7,136 7,136
d) profit available for distribution 1,633 —
20,967 19,334
Total liabilities and shareholders’ equity 309,076 373,486
1 Contingent liabilities
a) contingent liabilities on rediscounted
bills of exchange credited to borrowers — —
b) liabilities under guarantees and
indemnity agreements 32,070 39,976
c) contingent liabilities on assets pledged
as collateral for third-party debts — —
32,070 39,976
2 Other commitments
a) commitments from the sale of assets
subject to repurchase agreements — —
b) placing and underwriting commitments — —
c) irrevocable lending commitments 31,373 41,912
31,373 41,912
F-96

66 2009 Annual Report · HypoVereinsbank
Legal basisThe annual financial statements of UniCredit Bank AG (“HVB”) for the 2009 financial year are prepared in accordance with the accounting regulations in
the German Commercial Code (Handelsgesetzbuch – HGB), the German Stock Corporation Act (Aktiengesetz – AktG), the German Pfandbrief Act (Pfand-
briefgesetz – PfandBG) and the Regulations Governing Disclosures in the Financial Statements of Banks and Similar Financial Institutions (Verordnung
über die Rechnungslegung der Kreditinstitute und Finanzdienstleistungsinstitute – RechKredV).
HVB is active in all of the sectors served by commercial and mortgage banks.
HVB has published the statement of compliance with the German Corporate Governance Code required by Section 161 of the Stock Corporation Act on its
website at www.hvb.de/annualreport.
Accounting, valuation and disclosureThe German Accounting Law Modernisation Act (Bilanzrechtsmodernisierungsgesetz – BilMoG) came into force at the end of May 2009. This law essen-
tially contains simplifications to accounting rules for small companies, the implementation of EU directives (regarding amendments to accounting rules
and statutory audits of annual accounts and consolidated accounts) and changes to accounting rules. Whereas the regulations regarding simplifications
for small companies and the implementation of the EU directives became applicable when law came into force, the changes to accounting rules are not
subject to mandatory first-time application for HVB until the 2010 financial year. Use has not been made of the option of applying these rules prematurely
in the 2009 financial year.
Changes in accounting and valuation methods as well as disclosure modifications are indicated for the respective item.
Treasury bills and other bills (asset item 2) are shown at their cash value, less any discounted amounts.
Loans and receivables (asset items 3 and 4) are valued strictly at the lower of cost or market as stipulated in Section 253 (3) 1, German Commercial
Code. HVB creates specific loan-loss provisions and accruals to the amount of the anticipated loss for all identifiable exposure to lending risk. Specific
loan-loss provisions and accruals are reversed as soon as the default risk has ceased, or used if the receivable is classified as irrecoverable and written
off. The discounted amount of expected flow-backs was used when determining the level of write-downs compliant with Section 253 of the German Com-
mercial Code.
HVB makes general provisions for losses on specific loans or sets aside provisions for loans in countries with acute transfer risk or guarantees with com-
parable risk. Country-specific risk provisions are created to cover renegotiated loans and other finance facilities (due in more than one year). Sound
assets pledged to HVB as security reduce HVB’s exposure to loan-loss risk. The group of countries with acute transfer risk and the corresponding write-
down rate are updated regularly to take account of the current risk situation.
Latent lending risks are covered by global provisions. When assessing domestic latent lending risks, HVB applies the principles of the German tax regu-
lations allowing financial institutions to deduct global provisions.
Like other loans and receivables, mortgage loans are shown at their nominal values. Differences between the nominal amount and the actual amount paid
out are included under either prepaid expenses or deferred income, and amortised over the period to which they apply.
Securities are shown under the items bonds and other fixed-income securities (asset item 5) and equity securities and other variable-yield securities
(asset item 6). Depending on specific criteria like holding period and purpose, all securities are classified as held for trading purposes, as investment
securities or as held for liquidity purposes (securities treated neither as held for trading purposes nor as investment securities). HVB’s total holdings
consist of 54.9% held for trading purposes, 23.8% held for liquidity purposes and 21.2% investment securities on the balance sheet date.
Notes
F-97

HypoVereinsbank · 2009 Annual Report 67
Investment securities are valued in accordance with the regulations set forth in Section 253 (2) 3, German Commercial Code, which only allow for write-
downs to be taken in the event of probable permanent impairment. Securities held for liquidity purposes are valued strictly at the lower of the moving
average value or the market price at the balance sheet date, as provided for in Section 253 (3) 1, German Commercial Code.
Securities held for liquidity purposes that are hedged by offsetting positions are treated in accordance with the valuation-unit principles. Consequently,
HVB has established documented, predefined valuation units which are subject to strict preconditions; these are made up of underlying on-balance-sheet
transactions (such as fixed-income securities) and associated hedging instruments (such as interest rate swaps) for the same type of risk. Within the indi-
vidual valuation units, the results of valuing the individual financial instruments are netted. Any residual profit is disregarded when net income is com-
puted; a loss is covered by appropriate provisions for anticipated losses on pending transactions.
For accounting purposes, securities held for trading purposes are grouped together with other financial contracts held for trading purposes to form port-
folios, which are valued using a modified mark-to-market method. Trading portfolios and contracts are valued at market prices less computed potential
loss of the portfolio (value-at-risk discount on the basis of a holding period of 10 days) – where there is a positive valuation difference – to ensure that no
unrealised gains from outstanding positions are recognised in the income statement. HVB makes allowance for the principle of prudence by limiting this
procedure to the actively managed and liquid portfolios in the trading book and by applying a value-at-risk discount to take account of future uncertain-
ties. The value-at-risk does not reflect uncertainty in the process of determining fair value. Applying the value-at-risk discount gives a value that protects
HVB against potential loss positions that it is essential to close out or execute within a defined period.
The valuation results for securities and derivatives are calculated on the basis of either external price sources (e.g. stock exchanges or other price pro-
viders like Reuters) or market prices determined using internal valuation models (mark-to-model). For the most part, prices from external sources are
used to calculate the valuation results of securities. Derivatives are primarily valued on the basis of valuation models. The parameters for HVB’s internal
valuation models (e.g. yield curves, volatilities, spreads) are taken from external sources and checked for validity and correctness by the Risk Control Unit.
Appropriate adjustments are made to the fair values calculated in this way in order to take account of other influences on the fair value (such as the
liquidity of the financial instrument or model risks in the fair value calculation using a valuation model).
Exhaustive information about HVB’s off-balance-sheet financial contracts, complete with detailed breakdowns of the nominal amounts and counterparty
structure, is included in the Risk Report.
Participating interests and shares in affiliated companies (asset items 7 and 8) are shown at the lower of acquisition cost or – if there is a permanent
impairment – fair value prevailing at the balance sheet date.
Where HVB holds a controlling interest, profits and losses of partnerships as well as dividends paid by limited or incorporated companies are recognised
in the year in which they arise.
When disclosing income from write-ups on participating interests, shares in affiliated companies and investment securities (income item 7) and write-
downs on these investments (expense item 8), HVB has exercised the option allowed under Section 340c (2) 2, German Commercial Code. HVB nets out
respective expense and income items which also contain the results from the disposal of financial assets.
Software is disclosed under intangible assets (asset item 10). Software is valued at cost, with scheduled amortisation taken over an expected useful life of
three to five years.
Property, plant and equipment (asset item 11) is valued at acquisition or production cost, less – insofar as the assets are depreciable – depreciation
using the straight-line method based on their expected useful life. In such cases, the useful lives are closely related to the depreciation rules specified
in Section 7 of the German Income Tax Act in conjunction with the depreciation tables for equipment. Minor fixed assets are fully expensed in the year
of acquisition and shown as additions and disposals in the analysis of non-current assets. Pro rata depreciation is taken to the income statement for
additions to furniture and office equipment in the year of acquisition.
Liabilities (liability items 1 to 3, 8 and 9) are shown on the basis of the actual amount payable. Any difference between this sum and the issue amount is
carried under deferred income and amortised as appropriate. However, discounted liabilities are shown at cash value.
F-98

68 2009 Annual Report · HypoVereinsbank
Notes
Provisions for taxes, liabilities of uncertain amount and anticipated losses on pending transactions (liability item 7) have been assessed in accordance
with the prudence and due diligence concept; they cover the anticipated payment obligation and are stated at nominal values, provided that accounting
regulations do not require discounting. Pension provisions are set aside in the highest amount permitted under the relevant tax legislation, in accordance
with actuarial principles, by applying an assumed interest rate of 6% on the future pension commitment; as provided for in Section 6a, German Income
Tax Act (Einkommensteuergesetz – EStG), in conjunction with Regulation 6a, German Income Tax Regulations (Einkommensteuer-Richtlinien – EStR),
such provisions are based on present values. Compliant with Section 8a of the German Semi-Retirement Act (Altersteilzeitgesetz), employee credits for
semi-retirement are secured by pledging securities to the trustee.
The timing differences between taxable income and accounting income are determined in a statistical working paper. Deferred tax assets and liabilities
are netted. Compliant with Section 274 (2), German Commercial Code, any remaining asset balance is not disclosed.
Net income for the year is not affected by additional tax-related depreciation allowances or omitted write-ups.
Foreign currenciesAmounts in foreign currency are translated in accordance with the principles set forth in Section 340h, German Commercial Code. In addition, HVB ob-
serves the suggestions for currency translation by banks given in Comment 3/1995 of the German Institute of Accountants’ Expert Committee on Banks.
As a result, assets and liabilities denominated in foreign currency and spot transactions outstanding at the balance sheet date are always converted into
euros using market rates applicable at the balance sheet date. On the other hand, investment securities with no special cover are translated at the ex-
change rate applicable at the time of acquisition. Outstanding forward transactions are translated at the forward rate effective at the balance sheet date.
Earnings arising from the translation of items affecting the balance sheet and from the valuation of forward contracts at year-end are included in the in-
come statement. Unrealised earnings from outstanding positions in money transfer operations are recognised in the period they arise. This does not give
rise to any significant deferments of earnings.
F-99

HypoVereinsbank · 2009 Annual Report 69
Notes to the Balance Sheet
Breakdown by maturity of selected asset items (€ millions)
2009 2008
A 3 b) Other loans and receivables with banks
with residual maturity of less than 3 months 28,761 36,439
at least 3 months but less than 1 year 4,888 7,044
at least 1 year but less than 5 years 3,030 4,189
5 years or more 2,928 3,538
A 4) Loans and receivables with customers
with residual maturity of less than 3 months 9,553 16,325
at least 3 months but less than 1 year 10,084 11,798
at least 1 year but less than 5 years 32,614 35,527
5 years or more 55,239 66,884
No fixed maturity 11,291 13,183
A 5) Bonds and other fixed-income securities amounts due in the following year 26,929 29,394
Breakdown by maturity of selected liability items (€ millions)
2009 2008
L 1 b) Deposits from banks
with agreed maturity dates or periods of notice
with residual maturity of less than 3 months 27,012 64,177
at least 3 months but less than 1 year 3,412 3,341
at least 1 year but less than 5 years 8,215 9,702
5 years or more 7,740 8,646
Deposits from customers
L 2 ab) Savings deposits with agreed maturity dates or periods of notice
with residual maturity of less than 3 months 3 3
at least 3 months but less than 1 year 5 30
at least 1 year but less than 5 years 24 33
5 years or more 40 44
L 2 b) Registered mortgage bonds in issue,
L 2 c) registered public-sector bonds in issue,
L 2 db) other debts with agreed maturity dates or periods of notice
with residual maturity of less than 3 months 37,204 53,021
at least 3 months but less than 1 year 10,821 9,533
at least 1 year but less than 5 years 9,940 9,497
5 years or more 13,338 25,362
Debt securities in issue
L 3 a) Bonds amounts due in following year 23,367 18,745
L 3 b) Other debt securities in issue
with residual maturity of less than 3 months — —
at least 3 months but less than 1 year — —
at least 1 year but less than 5 years — —
5 years or more — —
F-100

70 2009 Annual Report · HypoVereinsbank
Notes
Notes to the Balance Sheet (CONTINUED)
Amounts receivable from and payable to affiliates and companies in which participating interests are held (€ millions)
AFFILIATES
2009
AFFILIATES
2008
PARTICIPATING
INTERESTS
2009
PARTICIPATING
INTERESTS
2008
Loans and receivables with banks 21,608 32,902 395 538
Loans and receivables with customers 1,770 2,567 4,708 7,076
Bonds and other fixed-income securities 2,764 3,533 11,846 710
Deposits from banks 9,189 12,859 215 498
Deposits from customers 2,398 2,799 20,031 24,220
Debt securities in issue 1,956 1,616 — —
Subordinated liabilities 1,599 1,615 — —
Trust business Trust business assets and liabilities break down as follows: (€ millions)
2009 2008
Loans and receivables with banks 87 90
Loans and receivables with customers 145 157
Equity securities and other variable-yield securities — —
Participating interests — —
Other assets — —
Trust assets 232 247
Deposits from banks 5 6
Deposits from customers 227 241
Debt securities in issue — —
Trust liabilities 232 247
Foreign-currency assets and liabilities70.7% of HVB’s foreign-currency holdings consist of US dollars, 10.8% of pounds sterling, 7.1% of Japanese yen and 3.6% of Swiss francs. (€ millions)
2009 2008
Assets 37,983 49,671
Liabilities 32,458 34,712
The amounts shown represent the euro equivalents of all currencies. The differences in amount between assets and liabilities are generally offset by
off-balance-sheet transactions.
Subordinated asset itemsThe following balance sheet items contain subordinated assets: (€ millions)
2009 2008
Loans and receivables with banks 1,478 1,496
Loans and receivables with customers 600 812
Bonds and other fixed-income securities 3,623 4,862
Equity securities and other variable-yield securities 5 10
thereof: own participating certificates in market-smoothing portfolio — —
F-101
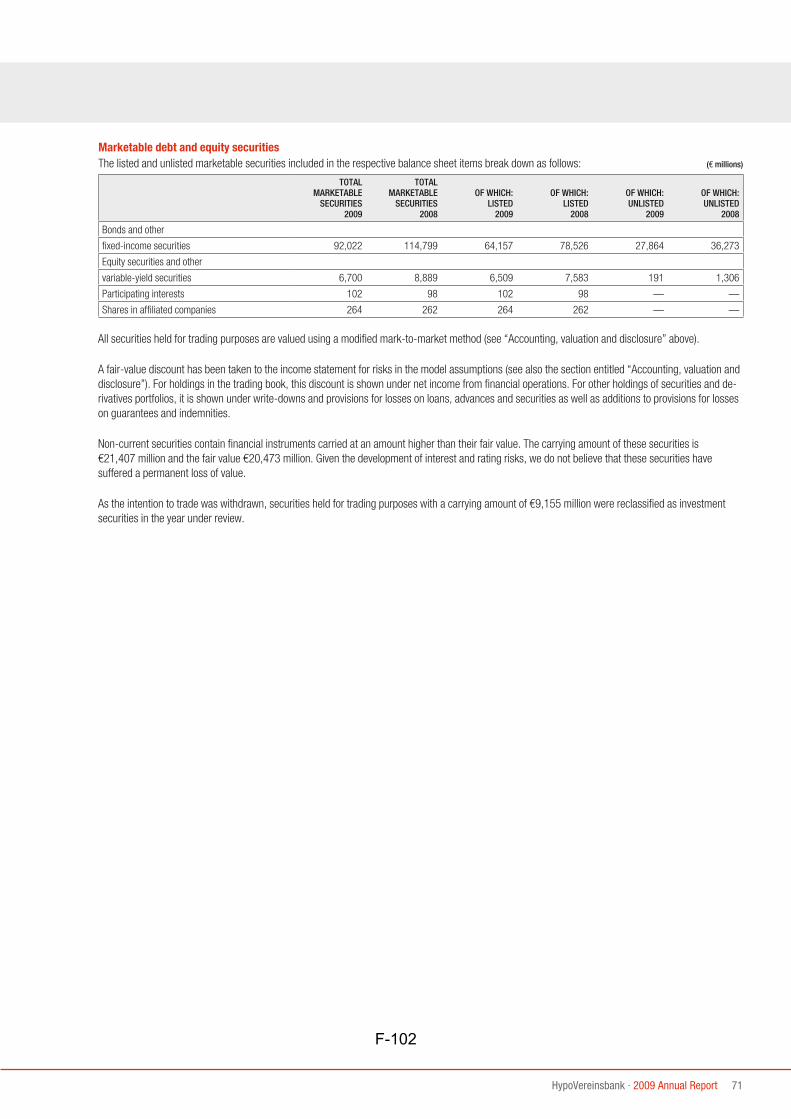
HypoVereinsbank · 2009 Annual Report 71
Marketable debt and equity securitiesThe listed and unlisted marketable securities included in the respective balance sheet items break down as follows: (€ millions)
TOTAL
MARKETABLE
SECURITIES
2009
TOTAL
MARKETABLE
SECURITIES
2008
OF WHICH:
LISTED
2009
OF WHICH:
LISTED
2008
OF WHICH:
UNLISTED
2009
OF WHICH:
UNLISTED
2008
Bonds and other
fixed-income securities 92,022 114,799 64,157 78,526 27,864 36,273
Equity securities and other
variable-yield securities 6,700 8,889 6,509 7,583 191 1,306
Participating interests 102 98 102 98 — —
Shares in affiliated companies 264 262 264 262 — —
All securities held for trading purposes are valued using a modified mark-to-market method (see “Accounting, valuation and disclosure” above).
A fair-value discount has been taken to the income statement for risks in the model assumptions (see also the section entitled “Accounting, valuation and
disclosure”). For holdings in the trading book, this discount is shown under net income from financial operations. For other holdings of securities and de-
rivatives portfolios, it is shown under write-downs and provisions for losses on loans, advances and securities as well as additions to provisions for losses
on guarantees and indemnities.
Non-current securities contain financial instruments carried at an amount higher than their fair value. The carrying amount of these securities is
€21,407 million and the fair value €20,473 million. Given the development of interest and rating risks, we do not believe that these securities have
suffered a permanent loss of value.
As the intention to trade was withdrawn, securities held for trading purposes with a carrying amount of €9,155 million were reclassified as investment
securities in the year under review.
F-102
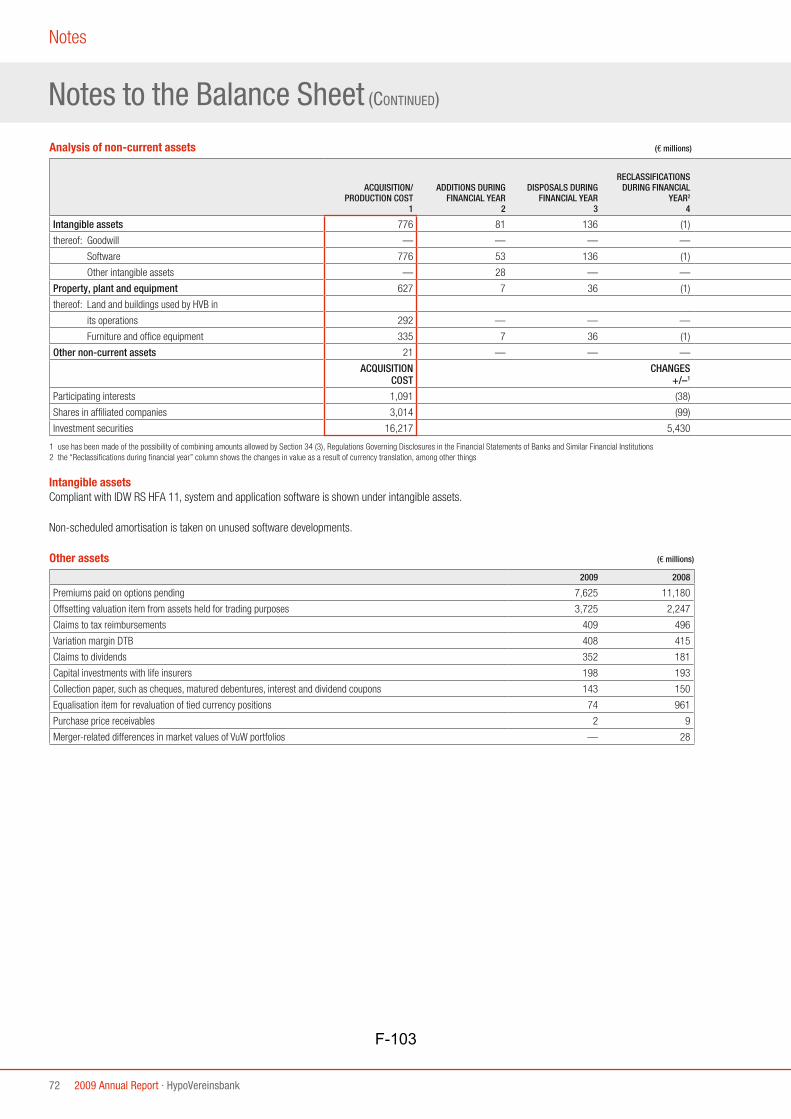
72 2009 Annual Report · HypoVereinsbank
Notes
Notes to the Balance Sheet (CONTINUED)
Intangible assetsCompliant with IDW RS HFA 11, system and application software is shown under intangible assets.
Non-scheduled amortisation is taken on unused software developments.
Other assets (€ millions)
2009 2008
Premiums paid on options pending 7,625 11,180
Offsetting valuation item from assets held for trading purposes 3,725 2,247
Claims to tax reimbursements 409 496
Variation margin DTB 408 415
Claims to dividends 352 181
Capital investments with life insurers 198 193
Collection paper, such as cheques, matured debentures, interest and dividend coupons 143 150
Equalisation item for revaluation of tied currency positions 74 961
Purchase price receivables 2 9
Merger-related differences in market values of VuW portfolios — 28
Analysis of non-current assets (€ millions)
ACQUISITION/
PRODUCTION COST
1
ADDITIONS DURING
FINANCIAL YEAR
2
DISPOSALS DURING
FINANCIAL YEAR
3
RECLASSIFICATIONS
DURING FINANCIAL
YEAR2
4
Intangible assets 776 81 136 (1)
thereof: Goodwill — — — —
Software 776 53 136 (1)
Other intangible assets — 28 — —
Property, plant and equipment 627 7 36 (1)
thereof: Land and buildings used by HVB in
its operations 292 — — —
Furniture and office equipment 335 7 36 (1)
Other non-current assets 21 — — —
ACQUISITION
COST
CHANGES
+/–1
Participating interests 1,091 (38)
Shares in affiliated companies 3,014 (99)
Investment securities 16,217 5,430
1 use has been made of the possibility of combining amounts allowed by Section 34 (3), Regulations Governing Disclosures in the Financial Statements of Banks and Similar Financial Institutions
2 the “Reclassifications during financial year” column shows the changes in value as a result of currency translation, among other things
F-103

HypoVereinsbank · 2009 Annual Report 73
Prepaid expensesThe prepaid expenses arising from issuing and lending operations include the following: (€ millions)
2009 2008
Discounts on funds borrowed 93 134
Premiums on amounts receivable — —
Assets assigned or pledged as security for own liabilitiesAssets totalling €57,748 million were assigned or pledged as security for the following liabilities: (€ millions)
2009 2008
Deposits from banks 39,019 45,794
Deposits from customers 18,729 30,399
Provisions for pension fund and similar obligations 590 1,523
Examples of own liabilities for which HVB provides collateral are special credit facilities provided by KfW and similar institutions, which the Bank has
passed as loans in compliance with their conditions.
As a seller under repurchase agreements, HVB entered into sales and repurchase transactions for securities with a book value of €51,380 million. These
securities continue to be shown under HVB’s assets, and the consideration received in return is stated under liabilities. They comprise mainly open-
market transactions with Deutsche Bundesbank and international money market transactions.
At the same time, further assets totalling €14,892 million were pledged as security for securities lending transactions and exchange-traded derivatives.
In setting up a contractual trust arrangement (CTA), HVB transferred collateral to the asset administrator to hedge pension and semi-retirement obli-
gations. Pursuant to Section 8a of the German Semi-Retirement Act (Altersteilzeitgesetz), employers are required to hedge credit exceeding three times
the amount of normal earnings, including the associated employer’s contribution to the total social security charge, against the risk of insolvency.
Recognised provisions and obligations to cover the costs of other group companies are not considered suitable means of security.
(€ millions)
WRITE-UPS
DURING FINANCIAL YEAR
5
DEPRECIATION/
AMORTISATION
ACCUMULATED
6
SCHEDULED
DEPRECIATION/
AMORTISATION
DURING FINANCIAL YEAR
7
NON-SCHEDULED
DEPRECIATION/
AMORTISATION
DURING FINANCIAL YEAR
8
NET BOOK VALUE
31/12/2009
9
NET BOOK VALUE
31/12/2008
10
— 531 16 1 189 261
— — — — — —
— 527 12 1 165 261
— 4 4 — 24 —
— 310 (4) — 287 314
— 85 9 — 207 216
— 225 (13) — 80 98
— — — — 21 21
NET BOOK VALUE
31/12/2009
NET BOOK VALUE
31/12/2008
1,053 1,091
20,915 3,014
21,647 16,217
F-104

74 2009 Annual Report · HypoVereinsbank
Notes
Notes to the Balance Sheet (CONTINUED)
Other liabilitiesThe following table shows the main items included in other liabilities: (€ millions)
2009 2008
Premiums received on options pending 9,630 12,202
Liabilities from short securities positions 8,476 13,392
Obligations arising from debts assumed 1,341 1,355
Liabilities from allowances paid to and losses absorbed from subsidiaries 223 51
Variation margin DTB 188 401
Taxes payable 131 188
Banking book valuation reserves 55 66
Accrued interest on participating certificates outstanding 5 5
Merger-related differences in market values of VuW portfolios — 19
Deferred incomeDiscounts on amounts receivable shown at nominal value totalled €44 million.
ProvisionsOther provisions include the following items: (€ millions)
2009 2008
Provisions for losses on guarantees and indemnities 304 280
Anticipated losses on pending transactions 532 563
Provisions for uncertain liabilities 1,243 1,097
of which:
Bonuses on savings plans 19 19
Anniversary bonus payments 72 79
Payments for early retirement, semi-retirement, etc. 18 28
Payments to employees 334 258
Restructuring provisions 116 79
Total other provisions 2,195 2,019
Subordinated liabilitiesThis item includes accrued interest of €98 million. HVB incurred interest expenses of €311 million in 2009.
The borrower cannot be obliged to make early repayment in the case of subordinated liabilities. In the event of insolvency or liquidation, subordinated
loans are only repaid after the claims of all primary creditors have been settled. For the purposes of a bank’s liable funds as defined under banking
supervisory regulations, subordinated liabilities are regarded as supplementary or Tier III capital.
On 5 February 2002, HVB issued a subordinated bond with a volume of €750 million. This subordinated bond matures on 5 February 2014.
The coupon is 6%.
F-105
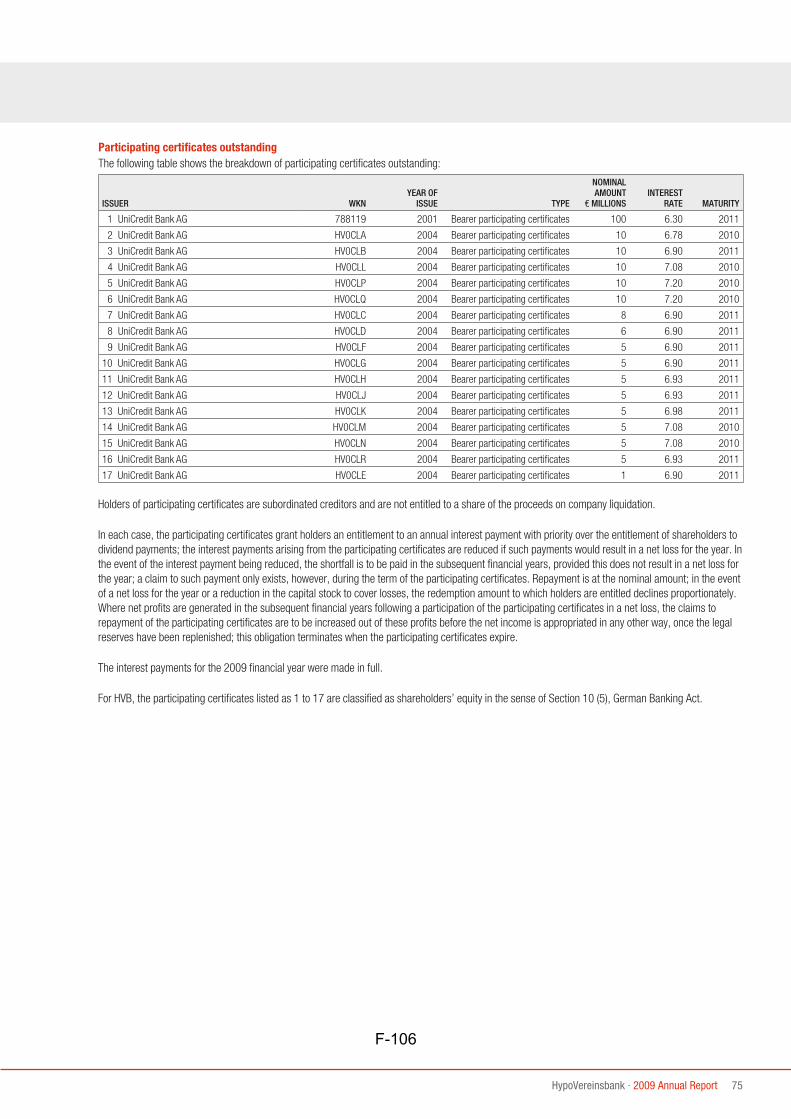
HypoVereinsbank · 2009 Annual Report 75
Participating certificates outstandingThe following table shows the breakdown of participating certificates outstanding:
ISSUER WKN
YEAR OF
ISSUE TYPE
NOMINAL
AMOUNT
€ MILLIONS
INTEREST
RATE MATURITY
1 UniCredit Bank AG 788119 2001 Bearer participating certificates 100 6.30 2011
2 UniCredit Bank AG HV0CLA 2004 Bearer participating certificates 10 6.78 2010
3 UniCredit Bank AG HV0CLB 2004 Bearer participating certificates 10 6.90 2011
4 UniCredit Bank AG HV0CLL 2004 Bearer participating certificates 10 7.08 2010
5 UniCredit Bank AG HV0CLP 2004 Bearer participating certificates 10 7.20 2010
6 UniCredit Bank AG HV0CLQ 2004 Bearer participating certificates 10 7.20 2010
7 UniCredit Bank AG HV0CLC 2004 Bearer participating certificates 8 6.90 2011
8 UniCredit Bank AG HV0CLD 2004 Bearer participating certificates 6 6.90 2011
9 UniCredit Bank AG HV0CLF 2004 Bearer participating certificates 5 6.90 2011
10 UniCredit Bank AG HV0CLG 2004 Bearer participating certificates 5 6.90 2011
11 UniCredit Bank AG HV0CLH 2004 Bearer participating certificates 5 6.93 2011
12 UniCredit Bank AG HV0CLJ 2004 Bearer participating certificates 5 6.93 2011
13 UniCredit Bank AG HV0CLK 2004 Bearer participating certificates 5 6.98 2011
14 UniCredit Bank AG HV0CLM 2004 Bearer participating certificates 5 7.08 2010
15 UniCredit Bank AG HV0CLN 2004 Bearer participating certificates 5 7.08 2010
16 UniCredit Bank AG HV0CLR 2004 Bearer participating certificates 5 6.93 2011
17 UniCredit Bank AG HV0CLE 2004 Bearer participating certificates 1 6.90 2011
Holders of participating certificates are subordinated creditors and are not entitled to a share of the proceeds on company liquidation.
In each case, the participating certificates grant holders an entitlement to an annual interest payment with priority over the entitlement of shareholders to
dividend payments; the interest payments arising from the participating certificates are reduced if such payments would result in a net loss for the year. In
the event of the interest payment being reduced, the shortfall is to be paid in the subsequent financial years, provided this does not result in a net loss for
the year; a claim to such payment only exists, however, during the term of the participating certificates. Repayment is at the nominal amount; in the event
of a net loss for the year or a reduction in the capital stock to cover losses, the redemption amount to which holders are entitled declines proportionately.
Where net profits are generated in the subsequent financial years following a participation of the participating certificates in a net loss, the claims to
repayment of the participating certificates are to be increased out of these profits before the net income is appropriated in any other way, once the legal
reserves have been replenished; this obligation terminates when the participating certificates expire.
The interest payments for the 2009 financial year were made in full.
For HVB, the participating certificates listed as 1 to 17 are classified as shareholders’ equity in the sense of Section 10 (5), German Banking Act.
F-106

76 2009 Annual Report · HypoVereinsbank
Notes
Shareholders’ Equity
Analysis of shareholders’ equity shown in the balance sheet (€ millions)
Subscribed capital
Balance at 1 January 2009 2,407
Balance at 31 December 2009 2,407
Additional paid-in capital
Balance at 1 January 2009 9,791
Balance at 31 December 2009 9,791
Retained earnings
Legal reserve
Balance at 1 January 2009 —
Balance at 31 December 2009 —
Reserve for own shares
Balance at 1 January 2009 3
Withdrawal from reserve for own shares (3)
Balance at 31 December 2009 —
Other retained earnings
Balance at 1 January 2009 7,133
Transfers arising from the reversal of the reserve for own shares 3
Balance at 31 December 2009 7,136
Profit available for distribution
Balance at 1 January 2009 —
Net profit 1,633
Balance at 31 December 2009 1,633
Shareholders’ equity at 31 December 2009 20,967
F-107

HypoVereinsbank · 2009 Annual Report 77
Authorised capital increase
YEAR AUTHORISED AVAILABLE UNTIL
ORIGINAL AMOUNT
€ millions
31/12/2009
€ millions
2004 29/4/2009 990 —
The resolution adopted at the Annual General Meeting of Shareholders on 29 April 2004 with regard to the release of the remaining €137 million and
the simultaneous approval of an authorised capital increase with a new amount of €990 million was entered in the Commercial Register on 18 December
2006.
An amount of €155 million from the authorised capital increase was used for the transfer of the investment banking activities of the former UniCredit
Banca Mobiliare S.p.A. (UBM) to HVB in April 2007 as a part of a capital increase against a contribution in kind. The remaining authorised capital increase
which was available until 29 April 2009 has expired.
Conditional capitalNo use was made of the authorisation to issue conditional capital that expired on 14 May 2008.
The conditional capital was consequently dissolved by way of a resolution adopted by the Annual General Meeting of Shareholders on 19 May 2009.
Holdings of UniCredit Bank AG stock in excess of 5% (in %)
2009 2008
UniCredit S.p.A. 100.0 100.0
Compliant with Section 271 (2) of the German Commercial Code, HVB is an affiliated company of UniCredit S.p.A., Rome (UCI), and is included in the
consolidated financial statements of UCI, which can be obtained from the Trade and Companies Register in Rome, Italy.
Holdings pursuant to Section 285 No. 11 and 11a, German Commercial CodeHVB has made use of the option set forth in Section 287 of the German Commercial Code. The full list of HVB’s shareholdings is published as part of the
present financial statements by the operator of the electronic Federal Gazette in accordance with Section 325 (2) of the German Commercial Code and
can be accessed via the homepage of the company register in accordance with Section 8b (2) of the German Commercial Code. It can also be called up
on HVB’s website at www.hvb.de/annualreport.
F-108

78 2009 Annual Report · HypoVereinsbank
Notes
Notes to the Income Statement
The condensed income statement is shown with the Management Report.
Services performed for third partiesHVB performed significant services for third parties notably in portfolio and asset management, and in the brokerage of insurance, savings and loan con-
tracts and investment funds.
Breakdown of income by regionThe following table shows a breakdown by region of
– interest receivable,
– current income from equity securities and other variable-yield securities, participating interests and shares in affiliated companies,
– income earned under profit-pooling and profit-and-loss transfer agreements,
– fees and commissions receivable,
– other operating income, and
– net profit on financial operations.
(€ millions)
2009 2008
Germany 11,616 13,936
Rest of Europe 2,671 4,332
Americas 323 655
Asia 215 433
Breakdown of other operating income and expensesThis item primarily includes income from the reversal of provisions other than provisions for lending and securities operations (€177 million) and payroll
costs and costs of materials passed on (€94 million).
Other operating expenses include the following:
– compensation and ex gratia payments (€71 million)
– additions to provisions other than provisions for lending and securities operations (€67 million)
Taxes on incomeAll of the taxes on income relate to income from ordinary operations.
Net profitHVB generated a net profit of €1,633 million in 2009. The reserve of €3 million for own shares set up in 2008 was reversed and transferred to other
retained earnings. The profit available for distribution, which forms the basis for the appropriation of profit, amounts €1,633 million. We will propose to
the Annual General Meeting of Shareholders that a dividend of €1,633 million be paid to our sole shareholder, UniCredit S.p.A. (UCI), Rome, Italy. This
represents a dividend of around €2.03 per share of common stock and per share of preferred stock, an advance dividend of €0.064 per share of pre-
ferred stock and a retroactive payment on the advance share of profits of €0.064 per share of preferred stock for 2008.
F-109
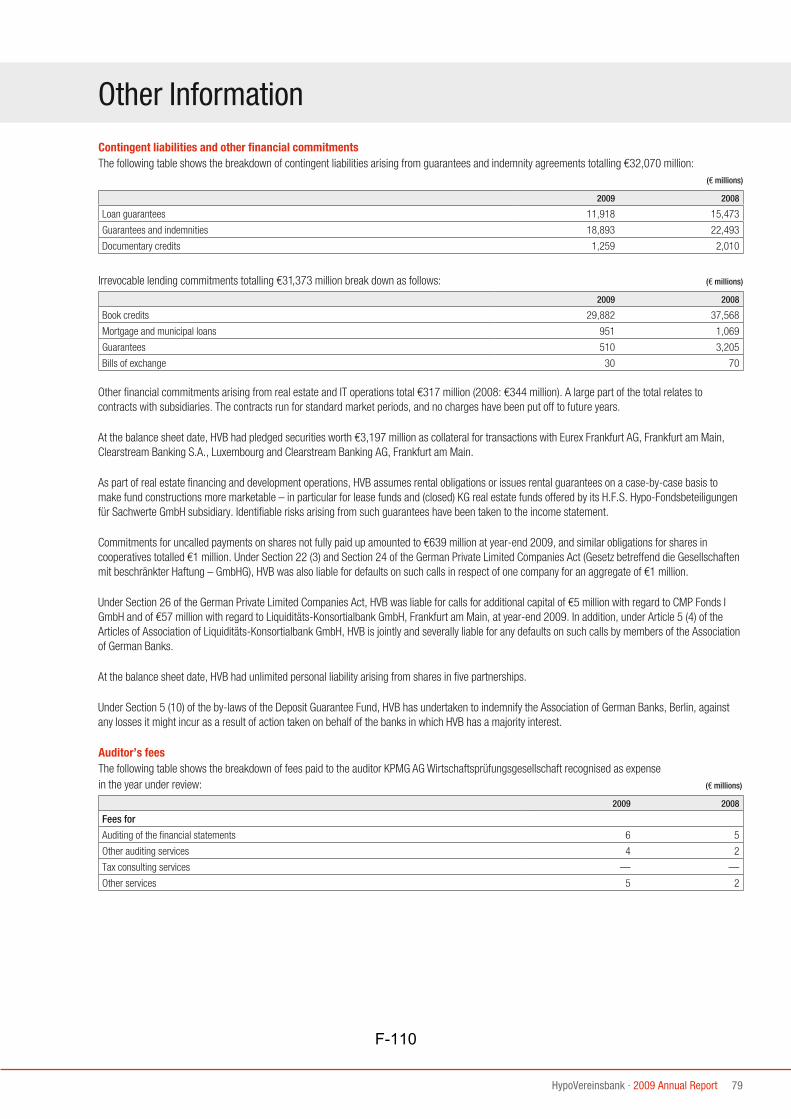
HypoVereinsbank · 2009 Annual Report 79
Other Information
Contingent liabilities and other financial commitmentsThe following table shows the breakdown of contingent liabilities arising from guarantees and indemnity agreements totalling €32,070 million:
(€ millions)
2009 2008
Loan guarantees 11,918 15,473
Guarantees and indemnities 18,893 22,493
Documentary credits 1,259 2,010
Irrevocable lending commitments totalling €31,373 million break down as follows: (€ millions)
2009 2008
Book credits 29,882 37,568
Mortgage and municipal loans 951 1,069
Guarantees 510 3,205
Bills of exchange 30 70
Other financial commitments arising from real estate and IT operations total €317 million (2008: €344 million). A large part of the total relates to
contracts with subsidiaries. The contracts run for standard market periods, and no charges have been put off to future years.
At the balance sheet date, HVB had pledged securities worth €3,197 million as collateral for transactions with Eurex Frankfurt AG, Frankfurt am Main,
Clearstream Banking S.A., Luxembourg and Clearstream Banking AG, Frankfurt am Main.
As part of real estate financing and development operations, HVB assumes rental obligations or issues rental guarantees on a case-by-case basis to
make fund constructions more marketable – in particular for lease funds and (closed) KG real estate funds offered by its H.F.S. Hypo-Fondsbeteiligungen
für Sachwerte GmbH subsidiary. Identifiable risks arising from such guarantees have been taken to the income statement.
Commitments for uncalled payments on shares not fully paid up amounted to €639 million at year-end 2009, and similar obligations for shares in
cooperatives totalled €1 million. Under Section 22 (3) and Section 24 of the German Private Limited Companies Act (Gesetz betreffend die Gesellschaften
mit beschränkter Haftung – GmbHG), HVB was also liable for defaults on such calls in respect of one company for an aggregate of €1 million.
Under Section 26 of the German Private Limited Companies Act, HVB was liable for calls for additional capital of €5 million with regard to CMP Fonds I
GmbH and of €57 million with regard to Liquiditäts-Konsortialbank GmbH, Frankfurt am Main, at year-end 2009. In addition, under Article 5 (4) of the
Articles of Association of Liquiditäts-Konsortialbank GmbH, HVB is jointly and severally liable for any defaults on such calls by members of the Association
of German Banks.
At the balance sheet date, HVB had unlimited personal liability arising from shares in five partnerships.
Under Section 5 (10) of the by-laws of the Deposit Guarantee Fund, HVB has undertaken to indemnify the Association of German Banks, Berlin, against
any losses it might incur as a result of action taken on behalf of the banks in which HVB has a majority interest.
Auditor’s feesThe following table shows the breakdown of fees paid to the auditor KPMG AG Wirtschaftsprüfungsgesellschaft recognised as expense
in the year under review: (€ millions)
2009 2008
Fees for
Auditing of the financial statements 6 5
Other auditing services 4 2
Tax consulting services — —
Other services 5 2
F-110
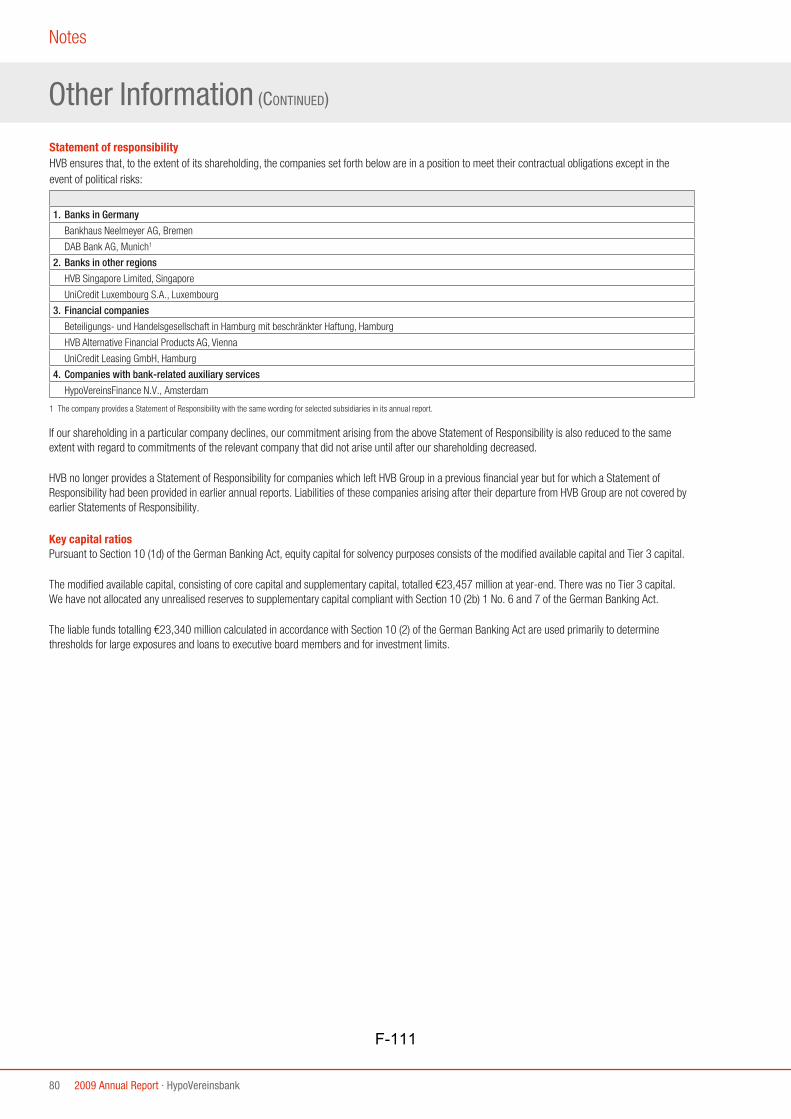
80 2009 Annual Report · HypoVereinsbank
Notes
Other Information (CONTINUED)
Statement of responsibilityHVB ensures that, to the extent of its shareholding, the companies set forth below are in a position to meet their contractual obligations except in the
event of political risks:
1. Banks in Germany
Bankhaus Neelmeyer AG, Bremen
DAB Bank AG, Munich1
2. Banks in other regions
HVB Singapore Limited, Singapore
UniCredit Luxembourg S.A., Luxembourg
3. Financial companies
Beteiligungs- und Handelsgesellschaft in Hamburg mit beschränkter Haftung, Hamburg
HVB Alternative Financial Products AG, Vienna
UniCredit Leasing GmbH, Hamburg
4. Companies with bank-related auxiliary services
HypoVereinsFinance N.V., Amsterdam
1 The company provides a Statement of Responsibility with the same wording for selected subsidiaries in its annual report.
If our shareholding in a particular company declines, our commitment arising from the above Statement of Responsibility is also reduced to the same
extent with regard to commitments of the relevant company that did not arise until after our shareholding decreased.
HVB no longer provides a Statement of Responsibility for companies which left HVB Group in a previous financial year but for which a Statement of
Responsibility had been provided in earlier annual reports. Liabilities of these companies arising after their departure from HVB Group are not covered by
earlier Statements of Responsibility.
Key capital ratiosPursuant to Section 10 (1d) of the German Banking Act, equity capital for solvency purposes consists of the modified available capital and Tier 3 capital.
The modified available capital, consisting of core capital and supplementary capital, totalled €23,457 million at year-end. There was no Tier 3 capital.
We have not allocated any unrealised reserves to supplementary capital compliant with Section 10 (2b) 1 No. 6 and 7 of the German Banking Act.
The liable funds totalling €23,340 million calculated in accordance with Section 10 (2) of the German Banking Act are used primarily to determine
thresholds for large exposures and loans to executive board members and for investment limits.
F-111

HypoVereinsbank · 2009 Annual Report 81
Derivative financial instrumentsDetailed information on HVB’s derivative financial instruments, complete with itemised breakdowns of the nominal amounts, fair values and counterparty
structure, is shown in the Risk Report.
EmployeesThe average number of staff employed was as follows:
2009 2008
Staff (excluding trainees) 17,396 19,346
of whom: full-time 13,500 15,077
part-time 3,896 4,269
Trainees 1,046 1,025
The staff’s length of service was as follows: (in %)
WOMEN MEN 2009 2008
(EXCLUDING TRAINEES) TOTAL
Staff’s length of service
25 years or more 15.7 19.1 17.2 16.3
15 to 25 years 36.8 25.7 31.7 29.2
10 to 15 years 14.4 12.8 13.7 14.4
5 to 10 years 23.1 23.1 23.1 13.0
less than 5 years 10.0 19.3 14.3 27.1
Emoluments (€ millions)
2009 2008
Members of the Management Board 6 8
Members of the Supervisory Board 1 1
Former members of the Management Board and their surviving dependants 10 10
At 31 December 2009, HVB had pension provisions for former members of the Management Board and their surviving dependants totalling €23 million
(2008: €94 million) calculated in accordance with Section 6a of the German Income Tax Act using actuarial principles. Pension commitments to former
HVB executives were transferred when HVB Trust Pensionsfonds AG was set up.
Loans to executive board membersThe total amount of loans and advances made and liabilities assumed at the balance sheet date was as follows: (€ millions)
2009 2008
Members of the Management Board 1 3
Members of the Supervisory Board 5 1
F-112

82 2009 Annual Report · HypoVereinsbank
Notes
Other Information (CONTINUED)
Executive boardsSupervisory Board
Alessandro ProfumoChairman
until 5 February 2009
Sergio ErmottiChairman1
Peter KönigDeputy Chairman
Dr Lothar MeyerDeputy Chairman2
Dr Wolfgang SprisslerDeputy Chairman
since 5 February 2009
Gerhard Bayreuther
Aldo Bulgarelli
Beate Dura-Kempf
Paolo Fiorentino
Dario Frigeriountil 5 February 2009
Giulio Gambino
Klaus Grünewald
Karl Guhasince 5 February 2009
Ranieri de Marchisuntil 23 July 2009
Beate Mensch
Management Board
Peter Buschbecksince 1 August 2009
Willibald Cernkountil 30 September 2009
Lutz Diederichs
Rolf Friedhofen
Henning Gieseckeuntil 31 July 2009
Marina Natalesince 24 July 2009
Roberto Nicastro
Vittorio Ogliengountil 5 February 2009
Panagiotis Sfeliniotis
Professor Hans-Werner Sinn
Jutta Streit
Michael Voss
Jens-Uwe Wächter
Dr Susanne Weisssince 5 February 2009
Heinz Laber
Andrea Umberto Varesesince 1 August 2009
Dr Theodor WeimerBoard Spokesman
Andreas Wölfer
1 since 5 February 2009
2 until 5 February 2009
F-113

HypoVereinsbank · 2009 Annual Report 83
List of Executives and Outside Directorships1
1 as of 31 December 2009
2 Group directorship
3 since 5 February 2009
4 until 5 February 2009
Supervisory Board
NAMEOCCUPATIONPLACE OF RESIDENCE
POSITIONS ON STATUTORY SUPERVISORY BOARDS OF OTHER GERMAN COMPANIES
POSITIONS ON COMPARABLE BOARDS OF GERMAN AND FOREIGN COMPANIES
Alessandro ProfumoChief Executive Officer
of UniCredit S.p.A.,
member of the Management Committee of
UniCredit S.p.A., Milan
Chairman
until 5 February 2009
UniCredit Bank Austria AG, Vienna (chairman)2
Sergio ErmottiDeputy CEO of UniCredit S.p.A.,
Head of Corporate and Investment Banking & Private
Banking Strategic Business Area,
member of the Management Committee of
UniCredit S.p.A., Collina d’Oro
Chairman³
UniCredit Bank Austria AG, Vienna2
London Stock Exchange Group Plc, London
Darwin Airline SA (chairman), Lugano
Enterra SA, Lugano
Hotel Residence Principe Leopoldo SA-Paradiso
(chairman), Lugano
Leopoldo Hotels & Restaurants SA (chairman), Lugano
Tessal SA, Lugano
Fidinam Group Holding SA, Lugano
Kurhaus Cadamario SA, Cadamario
Peter KönigEmployee, UniCredit Bank AG,
Haar-Salmdorf
Deputy Chairman
BVV Pensionsfonds des Bankgewerbes AG BVV Versicherungsverein des Bankgewerbes a.G.
Pensionskasse
BVV Versorgungskasse des Bankgewerbes e.V.
Dr Lothar MeyerFormer Chairman of the Management Board of ERGO
Versicherungsgruppe AG, Bergisch Gladbach
Deputy Chairman4
ERGO Versicherungsgruppe AG, Düsseldorf
DKV Deutsche Krankenversicherung AG, Cologne
Hamburg-Mannheimer Versicherungs-AG, Hamburg
Victoria Lebensversicherung AG, Düsseldorf
Jenoptik AG, Jena
Dr Wolfgang SprisslerFormer Board Spokesman of UniCredit Bank AG,
Sauerlach
Deputy Chairman since 5 February 2009
HFI Hansische Vermögensverwaltungs AG, Hamburg
(deputy chairman)
UniCredit Bank Austria AG, Vienna
Dr. Robert Pfleger Chemische Fabrik GmbH, Bamberg
Bankhaus Wölbern & Co. (AG & Co. KG), Hamburg
(chairman)
Gerhard BayreutherEmployee, UniCredit Bank AG,
Neubeuern
Pensionskasse der HypoVereinsbank (deputy chairman)
BayBG Bayerische Beteiligungsgesellschaft mbH
(deputy chairman)
Aldo BulgarelliAttorney and partner in law office NCTM,
Verona
ARAG ASSICURAZIONI S.p.A., Verona
(President of the Collegio Sindacale)
SIM Società Italiana Macchine S.p.A.
(President of the Collegio Sindacale)
Beate Dura-KempfEmployee, UniCredit Bank AG,
Litzendorf
F-114
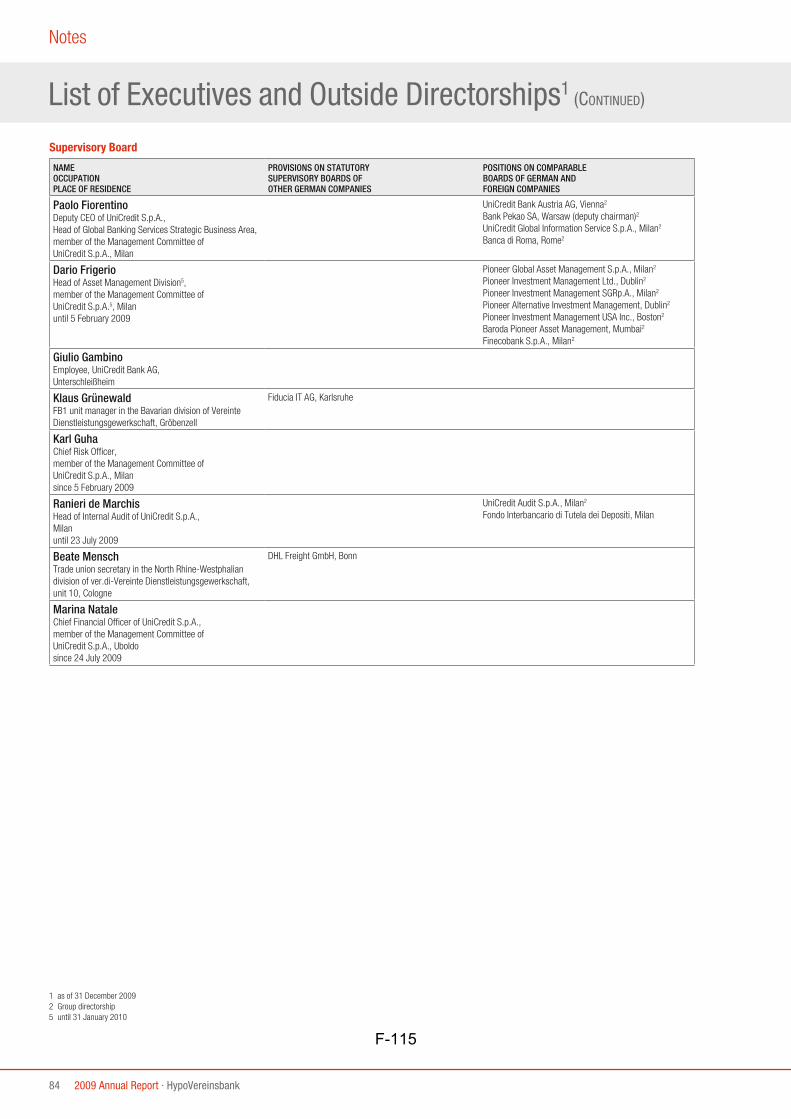
84 2009 Annual Report · HypoVereinsbank
Notes
List of Executives and Outside Directorships1 (CONTINUED)
1 as of 31 December 2009
2 Group directorship
5 until 31 January 2010
Supervisory Board
NAMEOCCUPATIONPLACE OF RESIDENCE
PROVISIONS ON STATUTORY SUPERVISORY BOARDS OF OTHER GERMAN COMPANIES
POSITIONS ON COMPARABLE BOARDS OF GERMAN AND FOREIGN COMPANIES
Paolo FiorentinoDeputy CEO of UniCredit S.p.A.,
Head of Global Banking Services Strategic Business Area,
member of the Management Committee of
UniCredit S.p.A., Milan
UniCredit Bank Austria AG, Vienna2
Bank Pekao SA, Warsaw (deputy chairman)2
UniCredit Global Information Service S.p.A., Milan2
Banca di Roma, Rome2
Dario FrigerioHead of Asset Management Division5,
member of the Management Committee of
UniCredit S.p.A.5, Milan
until 5 February 2009
Pioneer Global Asset Management S.p.A., Milan2
Pioneer Investment Management Ltd., Dublin2
Pioneer Investment Management SGRp.A., Milan2
Pioneer Alternative Investment Management, Dublin2
Pioneer Investment Management USA Inc., Boston2
Baroda Pioneer Asset Management, Mumbai2
Finecobank S.p.A., Milan2
Giulio GambinoEmployee, UniCredit Bank AG,
Unterschleißheim
Klaus GrünewaldFB1 unit manager in the Bavarian division of Vereinte
Dienstleistungsgewerkschaft, Gröbenzell
Fiducia IT AG, Karlsruhe
Karl GuhaChief Risk Officer,
member of the Management Committee of
UniCredit S.p.A., Milan
since 5 February 2009
Ranieri de MarchisHead of Internal Audit of UniCredit S.p.A.,
Milan
until 23 July 2009
UniCredit Audit S.p.A., Milan2
Fondo Interbancario di Tutela dei Depositi, Milan
Beate MenschTrade union secretary in the North Rhine-Westphalian
division of ver.di-Vereinte Dienstleistungsgewerkschaft,
unit 10, Cologne
DHL Freight GmbH, Bonn
Marina NataleChief Financial Officer of UniCredit S.p.A.,
member of the Management Committee of
UniCredit S.p.A., Uboldo
since 24 July 2009
F-115
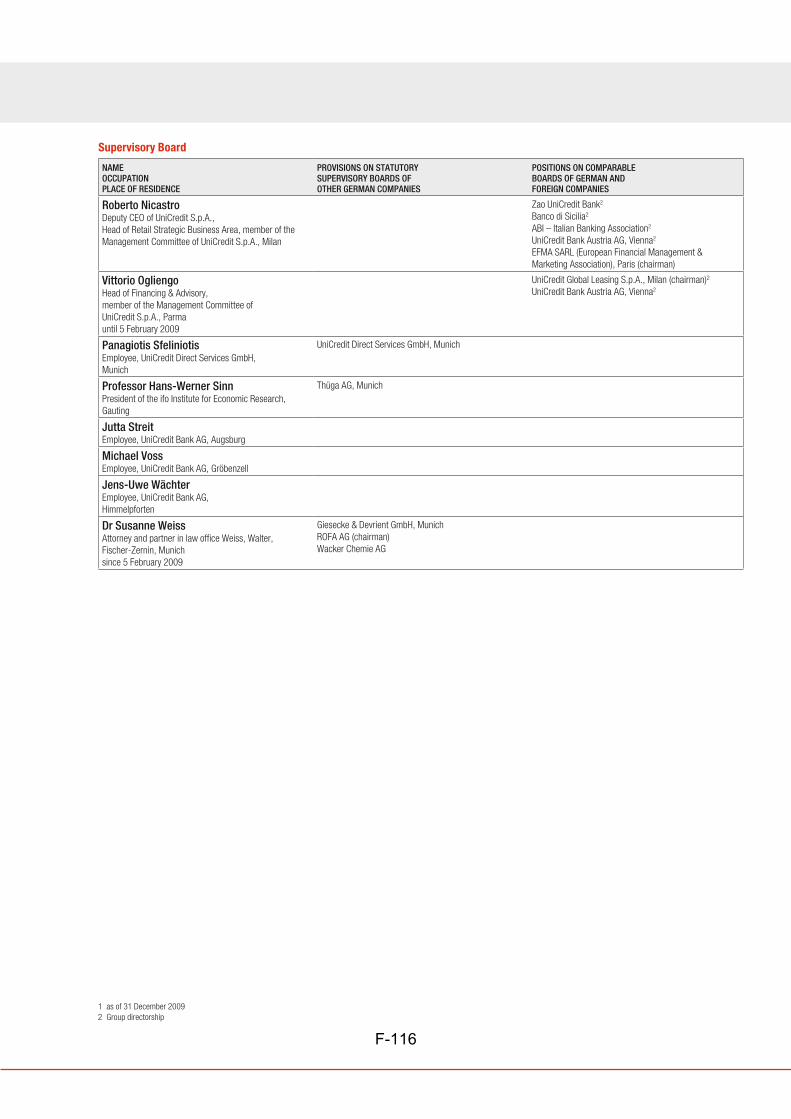
HypoVereinsbank · 2009 Annual Report 85
1 as of 31 December 2009
2 Group directorship
Supervisory Board
NAMEOCCUPATIONPLACE OF RESIDENCE
PROVISIONS ON STATUTORY SUPERVISORY BOARDS OF OTHER GERMAN COMPANIES
POSITIONS ON COMPARABLE BOARDS OF GERMAN AND FOREIGN COMPANIES
Roberto NicastroDeputy CEO of UniCredit S.p.A.,
Head of Retail Strategic Business Area, member of the
Management Committee of UniCredit S.p.A., Milan
Zao UniCredit Bank2
Banco di Sicilia2
ABI – Italian Banking Association2
UniCredit Bank Austria AG, Vienna2
EFMA SARL (European Financial Management &
Marketing Association), Paris (chairman)
Vittorio OgliengoHead of Financing & Advisory,
member of the Management Committee of
UniCredit S.p.A., Parma
until 5 February 2009
UniCredit Global Leasing S.p.A., Milan (chairman)2
UniCredit Bank Austria AG, Vienna2
Panagiotis SfeliniotisEmployee, UniCredit Direct Services GmbH,
Munich
UniCredit Direct Services GmbH, Munich
Professor Hans-Werner SinnPresident of the ifo Institute for Economic Research,
Gauting
Thüga AG, Munich
Jutta StreitEmployee, UniCredit Bank AG, Augsburg
Michael VossEmployee, UniCredit Bank AG, Gröbenzell
Jens-Uwe WächterEmployee, UniCredit Bank AG,
Himmelpforten
Dr Susanne WeissAttorney and partner in law office Weiss, Walter,
Fischer-Zernin, Munich
since 5 February 2009
Giesecke & Devrient GmbH, Munich
ROFA AG (chairman)
Wacker Chemie AG
F-116

86 2009 Annual Report · HypoVereinsbank
Notes
List of Executives and Outside Directorships1 (CONTINUED)
1 as of 31 December 2009
2 Group directorship
Management Board
NAME POSITIONS ON STATUTORY SUPERVISORY BOARDS OF OTHER GERMAN COMPANIES
POSITIONS ON COMPARABLE BOARDS OF GERMAN AND FOREIGN COMPANIES
Peter Buschbecksince 1 August 2009
Bankhaus Neelmeyer AG, Bremen (chairman)2,
since 1 October 2009
PlanetHome AG, Unterföhring near Munich (deputy
chairman)2, since 1 October 2009
UniCredit Direct Services GmbH, Munich (chairman)2,
since 1 October 2009
Wealth Management Capital Holding GmbH, Munich2,
since 1 October 2009
Willibald Cernkountil 30 September 2009
card complete Service Bank AG, Vienna,
Notartreuhandbank AG, Vienna (deputy chairman)
Lutz Diederichs Deutsche Schiffsbank AG, Bremen/Hamburg,
Köhler & Krenzer Fashion AG, Ehrenberg
UniCredit Leasing S.p.A., Bologna
Rolf Friedhofen HVB Immobilien AG, Munich (deputy chairman)2
HVB Trust Pensionsfonds AG, Munich2,
since 29 September 2009
Wealth Management Capital Holding GmbH, Munich
(deputy chairman)2
Henning Gieseckeuntil 31 July 2009
Endurance Capital AG, Munich (deputy chairman),
Rothenberger AG, Kelkheim
Heinz Laber Internationales Immobilien-Institut GmbH, Munich2,
since 23 October 2009
HVB Immobilien AG, Munich, (chairman)2
HVB Trust Pensionsfonds AG, Munich2,
since 29 September 2009
BVV Versicherungsverein des Bankgewerbes a.G., Berlin
UniCredit Business Partner Società Consortile per Azioni,
Cologno Monzese,
since 22 January 2009
UniCredit Global Information Services Società Consortile
per Azioni, Milan,
since 22 May 2009
Andrea Umberto Varesesince 1 August 2009
HVB Immobilien AG, Munich2 Locat Croatia DOO, Zagreb
Wealth Management Capital Holding GmbH, Munich2
Zao Locat Leasing Russia, Moscow
Dr Theodor WeimerSpokesman
DAB Bank AG, Munich (chairman)2,
since 14 May 2009
UniCredit Luxembourg S.A., Luxembourg
(deputy chairman)2,
since 1 July 2009
Andreas Wölfer Schoellerbank Aktiengesellschaft, Vienna,
since 11 March 2009
UniCredit Luxembourg S.A., Luxembourg (chairman)2
UniCredit Private Banking S.p.A., Turin,
since 7 May 2009
Wealth Management Capital Holding GmbH, Munich
(deputy chairman)2
F-117

HypoVereinsbank · 2009 Annual Report 87
1 as of 31 December 2009
2 Group directorship
List of employees and outside directorships
NAME POSITIONS ON STATUTORYSUPERVISORY BOARDS OFOTHER COMPANIES
Matthias Biebl Wacker Chemie AG, Munich
Carsten Dieck UniCredit Leasing GmbH, Hamburg (deputy chairman)²
Matthias Glückert Oechsler AG, Ansbach
Klaus Greger Bankhaus Neelmeyer AG, Bremen (deputy chairman)²
UniCredit Leasing GmbH, Hamburg (chairman)²
Dr Rainer Hauser UniCredit Direct Services GmbH, Munich (deputy chairman)²
Dr Martin Hebertinger UniCredit Direct Services GmbH, Munich²
UniCredit Leasing GmbH, Hamburg²
Sven Loeckel
ConCardis Gesellschaft mit beschränkter Haftung, Frankfurt am Main
Martin Marsmann AKA Ausfuhrkredit-Gesellschaft mbH, Frankfurt am Main
Dr Reiner Meisinger AGROB Immobilien AG, Ismaning²
Jörg Pietzner Bankhaus Neelmeyer AG, Bremen²
Dr Guido Schacht AVAG Holding AG, Augsburg
Joachim Scheuenpflug Bankhaus Neelmeyer AG, Bremen²
PlanetHome AG, Unterföhring near Munich²
Federico Sforza UniCredit Direct Services GmbH, Munich²
Stefan Sonnenberg Bankhaus Neelmeyer AG, Bremen²
Gabriela Vetter AKA Ausfuhrkredit-Gesellschaft mbH, Frankfurt am Main
Heike Wagner WABCO GmbH, Hanover
WABCO Holding GmbH, Hanover
F-118

88 2009 Annual Report · HypoVereinsbank
Notes
Mortgage Banking
Coverage (€ millions)
2009 2008
A. Mortgage bonds
Standard coverage
1. Loans and receivables with banks
Mortgage loans — —
2. Loans and receivables with customers
Mortgage loans 32,055 36,132
Other eligible cover1
1. Other lending to banks — 400
2. Bonds and other fixed-income securities 2,313 649
3. Equalisation claims on government authorities — —
Subtotal 34,368 37,181
Total mortgage bonds requiring cover 29,874 30,908
Excess coverage 4,494 6,273
B. Public-sector bonds
Standard coverage
1. Loans and receivables with banks 906 837
Mortgage loans — —
Municipal loans 906 837
2. Loans and receivables with customers 8,184 9,260
including:
mortgage loans 282 704
municipal loans 7,902 8,556
3. Bonds and other fixed-income securities 672 786
Other eligible cover2
Other lending to banks — —
Subtotal 9,762 10,883
Total public-sector bonds requiring cover 7,056 7,437
Excess coverage 2,706 3,446
1 compliant with Section 19 (1) of the German Pfandbrief Act
2 compliant with Section 20 (2) of the German Pfandbrief Act
F-119

HypoVereinsbank · 2009 Annual Report 89
Mortgage bonds outstanding and covering assets used (€ millions)
NOMINAL
2009
NOMINAL
2008
PRESENT VALUE
2009
PRESENT VALUE
2008
RISK PRESENT
VALUE
2009
RISK PRESENT
VALUE
2008
1. Mortgage bonds
Covering assets1 34,368 37,181 36,737 39,441 38,063 41,086
thereof: derivatives — — — — — —
Mortgage bonds 29,874 30,908 32,045 32,926 33,512 34,830
Excess coverage 4,494 6,273 4,692 6,515 4,551 6,256
2. Public-sector bonds
Covering assets2 9,762 10,883 10,395 11,567 10,019 11,113
thereof: derivatives — — — — — —
Mortgage bonds 7,056 7,437 7,602 7,963 7,245 7,528
Excess coverage 2,706 3,446 2,793 3,604 2,774 3,585
1 including further covering assets compliant with Section 19 (1) of the German Pfandbrief Act
2 including further covering assets compliant with Section 20 (2) of the German Pfandbrief Act
Maturity structure of mortgage bonds outstanding and fixed-interest periods of respective covering assets (€ millions)
COVERING ASSETS
2009
COVERING ASSETS
2008
MORTGAGE BONDS
2009
MORTGAGE BONDS
2008
1. Mortgage bonds1
less than 1 year 11,226 12,209 4,300 2,291
at least 1 year but less than 5 years 14,821 15,569 15,748 17,197
thereof: at least 1 year but less than 2 years 4,643 — 4,943 —
thereof: at least 2 years but less than 3 years 4,271 — 5,564 —
thereof: at least 3 years but less than 4 years 3,113 — 2,846 —
thereof: at least 4 years but less than 5 years 2,794 — 2,395 —
at least 5 years but less than 10 years 7,335 8,109 7,184 9,016
10 years or more 986 1,294 2,642 2,404
34,368 37,181 29,874 30,908
2. Public-sector bonds2
less than 1 year 3,745 4,196 1,670 1,844
at least 1 year but less than 5 years 3,329 3,750 2,036 2,013
thereof: at least 1 year but less than 2 years 1,250 — 654 —
thereof: at least 2 years but less than 3 years 740 — 414 —
thereof: at least 3 years but less than 4 years 620 — 375 —
thereof: at least 4 years but less than 5 years 719 — 593 —
at least 5 years but less than 10 years 1,982 2,224 2,012 2,154
10 years or more 706 713 1,338 1,426
9,762 10,883 7,056 7,437
1 including further covering assets compliant with Section 19 (1) of the German Pfandbrief Act
2 including further covering assets compliant with Section 20 (2) of the German Pfandbrief Act
3 breakdown as per amended German Pfandbrief Act 2009 (no information available for 2008)
Loans and receivables used to cover mortgage bonds, broken down by size (€ millions)
2009 2008
Mortgage covering assets
up to and including €300,000 18,724 22,312
over €300,000 up to and including €5,000,000 8,966 9,754
more than €5,000,000 4,366 4,066
32,056 36,132
F-120

90 2009 Annual Report · HypoVereinsbank
Notes
Mortgage Banking (CONTINUED)
Loans and receivables used to cover mortgage bonds, broken down by region in which the mortgaged properties are located and by type of occupancy (€ millions)
MORTGAGE COVERING ASSETS
RESIDENTIAL PROPERTY COMMERCIAL PROPERTY
2009 2008 2009 2008
1. Austria
Office buildings — — 5 5
— — 5 5
2. France/Monaco
Single-family houses 2 2 — —
Multi-family houses — 1 — —
2 3 — —
3. Germany
Apartments 7,010 8,600 — —
Single-family houses 7,956 9,329 — —
Multi-family houses 7,560 8,200 — —
Office buildings — — 3,756 3,803
Commercial buildings — — 3,012 3,087
Industrial buildings — — 609 698
Other commercially used buildings — — 745 732
Buildings under construction 791 896 522 686
Building sites 30 33 53 55
23,347 27,058 8,697 9,061
4. Italy/San Marino
Single-family houses 1 1 — —
1 1 — —
5. Luxembourg
Office buildings — — 3 3
— — 3 3
6. Spain
Single-family houses 1 1 — —
1 1 — —
23,351 27,063 8,705 9,069
F-121

HypoVereinsbank · 2009 Annual Report 91
Loans and receivables used to cover public-sector bonds, broken down by type of debtor or guarantor and its home country (€ millions)
COVERING ASSETS
2009 2008
1. Austria
Central government 200 200
200 200
2. Germany
Central government 10 62
Regional authorities 3,053 3,377
Public-sector authorities 4,429 4,665
Other 1,884 2,283
9,376 10,387
3. Greece
Central government 136 236
Other — 10
136 246
4. Spain
Public-sector authorities 50 50
50 50
9,762 10,883
F-122

92 2009 Annual Report · HypoVereinsbank
Notes
Mortgage Banking (CONTINUED)
Payments in arrearsPayments in arrears on mortgages and public-sector loans and receivables due between
1 October 2008 and 30 September 2009 break down as follows: (€ millions)
COVERING ASSETS
2009 2008
1. Payments in arrears on mortgages
Germany 7 14
7 14
2. Payments in arrears on public-sector loans and receivables
Germany
Regional authorities1 — —
Other1 1 2
1 2
1 officially guaranteed loans and receivables
Foreclosures and sequestrations
OF WHICH:
COMMERCIAL PROPERTY
2009
RESIDENTIAL PROPERTY
2009
1. Foreclosures and sequestrations
NUMBER OF PROCEEDINGS
a) Pending at 31 December 2009
Foreclosure proceedings 364 13 351
Sequestration proceedings 13 3 10
Foreclosure and sequestration proceedings 241 12 229
618 28 590
(comparative figures from 2008 376 24 352)
b) Foreclosures finalised in 2009 123 6 117
(comparative figures from 2008 1 036 65 971)
2. Properties auctioned or repossessed
The Pfandbrief bank did not have to repossess any properties during the year
under review to prevent losses on mortgage loans
F-123

HypoVereinsbank · 2009 Annual Report 93
Interest in arrearsInterest in arrears on mortgage-covering assets due between 1 October 2008 and 30 September 2009 totalled €3 million.
Arrears break down as follows: (€ millions)
2009 2008
Commercial property 1 1
Residential property 2 3
The present annual financial statements were prepared on 9 March 2010.
UniCredit Bank AG
The Management Board
Buschbeck
Laber
Diederichs
Dr Weimer
Friedhofen
Wölfer
Varese
F-124

94 2009 Annual Report · HypoVereinsbank
Notes
To the best of our knowledge, and in accordance with the applicable reporting principles, the annual financial statements give a true and fair view of
the assets, liabilities, financial position and profit or loss of HVB, and the Management Report includes a fair review of the development and performance
of the business and the position of HVB, together with a description of the principal opportunities and risks associated with the expected development
of HVB.
Declaration by the Management Board
Munich, 9 March 2010
UniCredit Bank AG
The Management Board
Buschbeck
Laber
Diederichs
Dr Weimer
Friedhofen
Wölfer
Varese
F-125

HypoVereinsbank · 2009 Annual Report 95
Auditor’s Report
We have issued the following unqualified auditor’s report:
“Auditor’s Report
We have audited the annual financial statements, comprising the balance sheet, the income statement and the notes to the financial statements, together
with the bookkeeping system, and the management report of UniCredit Bank AG (until 14 December 2009 Bayerische Hypo- und Vereinsbank AG),
Munich, for the business year from 1 January to 31 December 2009. The maintenance of the books and records and the preparation of the annual finan-
cial statements and management report in accordance with German commercial law are the responsibility of the Company’s management. Our responsi-
bility is to express an opinion on the annual financial statements, together with the bookkeeping system, and the management report based on our audit.
We conducted our audit of the annual financial statements in accordance with § 317 HGB [Handelsgesetzbuch “German Commercial Code”] and
German generally accepted standards for the audit of financial statements promulgated by the Institut der Wirtschaftsprüfer [Institute of Public Auditors
in Germany] (IDW). Those standards require that we plan and perform the audit such that misstatements materially affecting the presentation of the
net assets, financial position and results of operations in the annual financial statements in accordance with (German) principles of proper accounting
and in the management report are detected with reasonable assurance. Knowledge of the business activities and the economic and legal environment
of the Company and expectations as to possible misstatements are taken into account in the determination of audit procedures. The effectiveness of
the accounting-related internal control system and the evidence supporting the disclosures in the books and records, the annual financial statements and
the management report are examined primarily on a test basis within the framework of the audit. The audit includes assessing the accounting principles
used and significant estimates made by management, as well as evalu ating the overall presentation of the annual financial statements and management
report. We believe that our audit provides a reasonable basis for our opinion.
Our audit has not led to any reservations.
In our opinion, based on the findings of our audit, the annual financial statements comply with the legal requirements and give a true and fair view of the
net assets, financial position and results of operations of the Company in accordance with [German] principles of proper accounting. The management
report is consistent with the annual financial statements and as a whole provides a suitable view of the Company’s position and suitably presents the
opportunities and risks of future development.”
Munich, 10 March 2010
KPMG AG
Wirtschaftsprüfungsgesellschaft
Pukropski Pfeiffer
Wirtschaftsprüfer Wirtschaftsprüfer
F-126
4 Interim Report at 31 March 2010 · HypoVereinsbank
Corporate Performance
Underlying conditions and general comments on the business situationThe global economy has recovered to some extent from the financial crisis. Stimulus packages around the world and intervention by cen-tral banks helped to stabilise economic output in the industrialised nations in the first quarter of 2010. This holds particularly true for the United States and, to a limited degree, the euro area as well.
Exports have started to expand again noticeably in the euro area in general, and Germany in particular, which has had a positive impact on growth. Short-time working arrangements and agreed reductions in working hours have served to hold down trends in the unemployment statistics. Compared with December 2009 (8.1%), the unemployment rate fell to 7.8% in April 2010, especially against the backdrop of a revival in global demand. Private consumption hardly increased at all. Inflation rose only slightly, to 1.1%.
The capital markets experienced contrary trends. Whereas the stock-markets have recovered further since the start of the year to reach roughly the same level as at the turn of the year, the credit markets have again been dominated by widening spreads; notably among financial instruments issued by governments and banks. The common currency – the euro – also came under pressure due to the high levels of public debt in some euro-zone countries, although it was still worth far more than last year’s low in the first quarter. Credit growth was low on account of the persistently difficult economic environment and the associated reticence to invest. A high level of bankruptcies in the corporate sector led to a need for higher write-downs to be taken.
HVB Group recorded a very good profit before tax of €694 million in the first quarter of 2010 (previous year: €94 million) in a market environment that is still difficult overall, but one that has recovered tangibly since the equivalent period last year. This represents the best quarterly result since the outbreak of the financial crisis in the summer of 2008. The strong operating profit of €1,044 million is particularly pleasing as it follows on seamlessly from the already good results of the preceding quarters. The total has more than double compared with the year-ago figure of €452 million, which was still heavily affected by the financial crisis. Total revenues increased by 45.7% year-on-year
to €1,903 million. This was generated on the back of a sharp rise in total revenues together with a massive increase in net fees and commissions totalling around 26%, together with a good net trading profit of €440 million following on from a net trading loss of €261 mil-lion last year on account of the fallout from the financial crisis. Our successful cost management programme resulted in practically no change in our operating costs (up 0.6%) which, coupled with the good operating profit, led to a significant improvement in the cost-income ratio to an excellent level, 45.1%. As expected, HVB Group’s net write-downs of loans and provisions for guarantees and commitments rose to €372 million after €283 million last year on account of the difficult credit environment.
All the operating divisions contributed to the pleasing profit before tax of HVB Group in terms of both profit before tax and improved earnings compared with the equivalent period last year. The very good earnings performance was for the most part generated by the operations of the Corporate & Investment Banking division. A sharp rise in net fees and commissions and a strong rebound in net trading income contributed to the significant improvement in the total revenues recorded by this division. Despite a sharp year-on-year rise of 61% in net write-downs of loans and provisions for guarantees and commitments to €344 mil-lion, the division generated a profit before tax of €531 million, which is €454 million higher than the year-ago total of €77 million.
The Retail and Private Banking (formerly Wealth Management) divi-sions also managed to increase their profits before tax year-one-year in the first quarter of 2010, despite the continued tangible reticence among investors. The main factors contributing to the positive result were higher net fees and commissions and a more favourable devel-opment in net write-downs of loans and provisions for guarantees and commitments.
HVB Group has succeeded in further bolstering its already excellent capital base in the light of the good results. Thus, shareholders’ equity rose by €0.5 billion over the total at year-end 2009, to €24.1 billion. As a result of targeted deleveraging measures, the leverage ratio (ratio of total assets to shareholders’ equity shown in the balance sheet) of 15.7 at 31 March 2010 remained almost unchanged compared with the figure of 15.4 reported at the end of December 2009.
Business Performance
F-127

HypoVereinsbank · Interim Report at 31 March 2010 5
The core capital ratio (Tier 1 ratio) in accordance with Basel II totalled 17.1% at 31 March 2010 after 17.8% at year-end 2009, which continues to represent an outstanding level by both national and international standards.
HVB Group again enjoyed an adequate liquidity base and a solid financing structure in the first three months of this year. The funding risk remained low on account of the broad funding base in terms of products, markets and investor groups, meaning that adequate fund-ing of our lending operations was ensured at all times. Our Pfandbriefs continued to represent an important source of funding thanks to their very good credit rating and liquidity. At 1.40, the liquidity ratio of UniCredit Bank AG (HVB) compliant with Section 11 KWG was at the same high level at the end of March 2010 as at year-end 2009 (1.43).
With our diversified business model, high capital base, solid funding foundation and a good market position in our core business areas, we remain a reliable partner for our customers and investors. As an integral part of one of the biggest and strongest banking groups in Europe – UniCredit Group – HVB Group is in an excellent position to leverage its regional strengths in the international network of UniCredit Group for the benefit of its customers.
Operating performance of HVB Group
The operating performance of HVB Group is described in detail below.
Net interest incomeCompared with the same period last year, total net interest income was down by €207 million, or 16.8%, to €1,025 million at the end of March 2010.
In the process, net interest income fell by €207 million, to €1,010 million, primarily as a result of the significant year-on-year decline in income from trading operations. This development affect-ed the Corporate & Investment Banking division, which recorded a decrease of €237 million in net interest income. In the Retail and Private Banking divisions, net interest income also decreased chiefly due to falling interest margins, particularly in the deposit-taking business.
At €15 million, the income generated in the first quarter of 2010 from dividends and other income from equity investments remained unchanged compared with the previous year.
Net fees and commissionsNet fees and commissions developed very well, increasing signifi-cantly by 26.4%, to €373 million in the first quarter of 2010 com-pared with last year’s figure. All the operating divisions contributed to this development with a year-on-year rise in fee and commission income in spite of our customers’ ongoing restraint as a result of the financial crisis. The substantial increase in net fees and commissions is based on the sharp rise of 52.2%, to €207 million, in fee and commission income from management, brokerage and consultancy services. Fee and commission income from lending operations was also up by 27.6%, to €111 million, notably on account of higher in-come from the Corporate Finance unit in the Corporate & Investment Banking division.
Net trading incomeIn an overall more favourable market environment compared with the same period last year, the net trading income of HVB Group in the first three months of 2010 stood at a pleasing level of €440 million. Last year, a net trading loss of €261 million was recorded as a result of the impact of the considerably more difficult market conditions in connection with the financial crisis.
The increase to €339 million in net gains on financial assets classi-fied as held for trading led to the pleasing result in net trading income in the first quarter of 2010 (2009: net trading loss of €106 million). The Fixed Income (fixed income and foreign exchange products) and Equities (equity and index products) units in particular managed to achieve a significant improvement in results. In addition, the effect from the partial buy-back of hybrid capital in the first quarter of 2010 had a favourable impact on other net trading income (€81 million). The gains on the fair-value-option portfolios amounted to €8 million after the first three months of 2010 after posting a loss of €155 mil-lion last year due to the widening of spreads, particulary for govern-ment bonds.
F-128

6 Interim Report at 31 March 2010 · HypoVereinsbank
Corporate Performance
Private Banking, just as it was in 2009, with net write-downs of loans and provisions for guarantees and commitments declining compared with the previous year.
Net income from investmentsThe net profit from investments amounted to €27 million at the end of March 2010 after a loss of €7 million in the same period last year, and was generated from the gains on the sale and valuation of avail-able-for-sale financial assets.
Profit before tax, income tax for the period and consolidated profit Due to its good operating performance, HVB Group generated a very good profit before tax of €694 million (2009: €94 million) in the first three months. This represents the highest profit recorded for a quarter since the outbreak of the financial crisis in the summer of 2008.
Income tax rose to €234 million in the first quarter of 2010 after €31 million in the same period last year. This is mainly due to the significant improvement in performance in 2010.
After deducting taxes, HVB Group generated a consolidated profit of €460 million in the first three months of 2010. In the previous year, HVB Group had posted a consolidated profit of €63 million.
Segment results by divisionThe divisions contributed the following amounts to the very good profit before tax of €694 million of HVB Group:
Corporate & Investment Banking €531 million Retail €20 million Private Banking €19 million Other/consolidation €124 million
The income statements for each division and comments on the eco-nomic performance of the individual divisions are provided in Note 3, “Segment reporting”, in this Interim Report. The tasks and objectives of each division are described in detail in Note 27 of our 2009 Annual Report, “Notes to segment reporting by division”.
Operating costsTotal operating costs continue to reflect the success we have achieved with our consistent cost management and, at €859 million, roughly remained at last year’s level (€854 million). Due to the transfer last year of HVB Information Services GmbH & Co KG (HVB IS) to UniCredit Global Information Services S.p.A. (UGIS) and further outsourcing measures, there was also a shift in payroll costs to other administra-tive expenses compared with the previous year. Particularly as a result of this, payroll costs fell by €15 million, to €452 million, while other administrative expenses including amortisation, depreciation and impairment losses on intangible and tangible assets increased by €20 million to €407 million.
Operating profitDespite the decline in net interest income and the persistently chal-lenging market situation, HVB Group generated a pleasing operating profit of €1,044 million that matched the good results of previous quarters. Compared with the same period last year which was still strongly affected by the financial crisis, we succeeded in more than doubling the operating profit (Q1 2009: €452 million).
After the first three months of 2010, the cost-income ratio is at an excellent figure of 45.1% and has significantly improved, particularly as a result of improved operating income from net fees and commis-sions and net trading income both compared with the same period last year (65.4%) and compared with the pleasing figure of the full financial year of 2009 (50.0%).
Net write-downs of loans and provisions for guarantees and commitmentsNet write-downs of loans and provisions for guarantees and commit-ments rose to €372 million in the first quarter of 2010 in the persist-ently difficult credit environment compared with the previous year (€283 million) and is thus in line with our expectations as described in the 2009 Annual Report of HVB Group (see Outlook in the Manage-ment’s Discussion and Analysis). Business with corporate customers of the Corporate & Investment Banking division has been particularly affected by this development. In contrast, the development of net write-downs of loans and provisions for guarantees and commitments was more favourable in the remaining operating divisions Retail and
Business Performance (CONtINUED)
F-129

HypoVereinsbank · Interim Report at 31 March 2010 7
Financial situationTotal assetsThe total assets of HVB Group amounted to €379.2 billion at the end of March 2010. Hence, compared with year-end 2009, the total assets increased by €15.7 billion, or 4.3%. As a result of the increase in shareholders’ equity shown in the balance sheet, the leverage ratio, at 15.7, hardly changed from the 15.4 at year-end 2009. The leverage ratio is calculated based on the ratio of total assets to the shareholders’ equity shown in the balance sheet.
Compared with the 2009 year-end total, the cash and cash balances rose sharply by €8.2 billion, to €14.6 billion, primarily due to much higher cash balances at central banks.
Financial assets held for trading increased by €4.4 billion, or 3.3%, to €137.8 billion compared with the 2009 year-end total. At the same time, holdings of fixed-interest securities declined by €2.1 billion whereas the positive fair values from derivative financial instruments rose by €7.8 billion. The rise of €4.0 billion in financial assets at fair value through profit or loss is attributable to fixed-interest securities.
Loans and receivables with customers fell by €3.2 billion, to €142.7 billion. In particular, this decline is attributable to lower volumes of mortgage loans, the reduction in reclassified loans and receivables, and the decrease in sub- and non-performing loans and receivables. The rise of €1.5 billion in loans and receivables with banks is mainly due to a higher volume of repurchase agreements.
On the liabilities’ side, there was a total rise of €5.8 billion, to €56.5 billion, in deposits from banks which, apart from higher credit balances on current accounts and time deposits, is also attributable to higher volumes of repurchase agreements. The increase of €4.1 billion, to €100.6 billion, in deposits from customers is primarily due to higher volumes of repurchase agreements while time deposits declined. In contrast, debt securities fell by €4.1 billion, to €57.2 bil-lion, on account of issues due. The financial liabilities held for trading rose by €9.1 billion, to €130.4 billion.
At the end of March 2010, shareholders’ equity totalled €24.1 billion and had thus risen by €0.5 billion compared with the 2009 year-end total. The reason for this rise is the consolidated profit posted for the first three months of 2010 (up €0.5 billion). Under the changes in the valuation of financial instruments, a slight improvement in the available-for-sale reserve was offset by a lower hedge reserve.
Risk-weighted assets, key capital ratios and liquidity of HVB GroupThe risk-weighted assets for credit risks of HVB Group determined on the basis of Basel II – KWG/German Solvency Regulation (SolvV) – by applying partial use amounted to €106.5 billion at 31 March 2010 (including counterparty default risk in the trading book); at 31 De-cember 2009, the comparable risk-weighted assets amounted to €102.9 billion. This total includes the holdings reclassified compliant with IAS from the trading book to the banking book. The total risk-weighted assets, including market and operational risks, amounted to €118.0 billion at 31 March 2010 (31 December 2009: €115.1 billion).
The total risk-weighted assets of HVB Group increased by €2.9 billion compared with the 2009 year-end total. This rise is mainly due to an increase of €3.6 billion in the credit risk while the market risk declined by €0.4 billion (as a result of lower credit spreads) and operational risk by €0.3 billion. The rise in credit risk is chiefly attributable to rating changes, the decline in the relief provided by various outplacement transactions and the rise in counterparty risk.
The total lending volume under the 13 current risk-asset-reducing securitisation transactions of HVB Group amounted to €37.1 billion at 31 March 2010 (31 December 2009: €43.7 billion). Due to the resulting reduction in risk-weighted assets of gross €18.6 billion, we have optimised our capital allocation. In 2010, two transactions with a total volume of €4.6 billion expired.
F-130

8 Interim Report at 31 March 2010 · HypoVereinsbank
Corporate Performance
At 31 March 2010, the core capital of HVB Group compliant with the German Solvency Regulation totalled €20.2 billion and the equity capital €23.9 billion. This gives rise to a core capital ratio (Tier 1 ratio; including market risk and operational risk) under Basel II of 17.1% and an equity funds ratio of 20.2%.
A bank’s liquidity is evaluated using the liquidity ratio defined in Sec-tion 11 of the German Banking Act. This figure is the ratio of cash and cash equivalents available within a month to the payment obligations falling due in this period. Liquidity is considered adequate if the ratio is at least 1.00. At HVB, this figure amounted to 1.40 at the end of March 2010, after 1.43 at the end of December 2009.
Corporate acquisitions and salesThere were no significant corporate acquisitions and sales of HVB Group in the period under review.
Changes concerning the group of companies included in the Interim Report are provided in Note 2, “Changes in the group of companies included in consolidation”.
Events after the reporting date The Management Board of HVB announced mid-April that Mr Rolf Friedhofen, Chief Financial Officer and member of the Management Board of HVB, will leave the Bank by mutual, amicable agreement with effect as of 31 May 2010 to take up new career challenges outside the UniCredit Group.
Outlook
The following comments on the outlook are to be viewed in connec-tion with the comments on the outlook in the Financial Review and Risk Report in the consolidated financial statements for the 2009 financial year (see the HVB Group Annual Report for 2009).
General economic outlook and sector development in 2010 We expect the global economy to expand by 3.6% in 2010, with the United States growing by 3.0% and the euro zone by just 0.9%. Nonetheless, the economic development is surrounded by numerous imponderables, including high levels of public debt, volatility on the property markets and the relatively high unemployment rate. We expect German gross domestic product to expand by 1.6% this year after contracting by 5.0% last year. Growth will be driven mainly by exports, which are forecast to rise by 6% in 2010 after falling by 14% in 2009. Exports from the euro area will also benefit from a weaker exchange rate in 2010. After the euro strengthened massively against the US dollar in 2009, the weak growth prospects and the high level of debt in some countries of the euro area have served to strongly depress the exchange rate. We expect the euro to recover slightly to be worth $1.38 by the end of the year. This does, however, depend on the success of the efforts currently being made to resolve the national debt crisis in the euro area.
Inflation rose again considerably around the world at the turn of the year. We assume, however, that the high levels of overcapacity in companies together with the tight situation on the labour market will counteract an acceleration in the consumer price rises in the indus-trialised nations. We predict inflation to rise by an average of just under 1% in 2010 following 0.3% last year.
Business Performance (CONtINUED)
F-131

HypoVereinsbank · Interim Report at 31 March 2010 9
The corporate mood has again lightened noticeably since the start of the year. The broadly observed Ifo Business Climate Index had recov-ered sharply to 101.6 points by mid-April 2010 after falling to 82.2 points last year. If anything, this implies that the global economic re-covery will continue. Nonetheless, the pace of growth is likely to slow on account of the inventory cycle and the end of fiscal stimulus pack-ages. Production levels in the industrialised nations will remain well below those seen prior to the crisis. And high levels of overcapacity will also serve to dampen plant-expanding investment. Capital spend-ing could rise by a moderate 1% in Germany during 2010, despite the discontinuation of the declining-balance method of depreciation, after falling 20.5% in 2009; in the euro zone, on the other hand, it is expected to decline by a further 1.5%.
Despite the persistently low capacity utilisation levels, there are no signs yet of a rapid rise in unemployment in the industrialised nations. Corporate employment plans have stabilised of late, after companies started to reduce working hours more readily in response to the cur-rent situation. As a result, the unemployment rate should remain relatively stable at around 8% in Germany over the course of the year. A fast increase in employment is considered unlikely however.
The financial sector remains affected by the weak condition of key sectors, such as engineering, the automotive industry and commercial property. The banks will continue to face challenges into the future, such as risk provisioning rates that remain persistently high overall, a flatter yield curve and declining central bank liquidity. What cannot yet be estimated are the effects of political and legal regulation. At the same time, the fact that most banks have tangibly boosted their capitalisation will have a positive impact. Nevertheless, a very mixed picture emerges in the financial sector with regard to equity capital. One of the key questions still concerns the shape of future relations between the financial world and the real economy, and the likely global limitations in the regulatory and political field. It also remains to be seen how well the financial sector will come to terms with the new realities.
Development of HVB GroupHVB Group expects economic conditions both worldwide and in Germany to remain difficult, marked by considerable uncertainty. To cite one example, the high level of public debt in some European countries represents a serious risk to growth and the development of interest and exchange rates. This all means that the financial industry will again face major challenges in the 2010 financial year. Against this backdrop, we do not expect the pace of earnings growth in the first quarter of 2010 to be repeated across the year as a whole; instead, we continue to assume that the total revenues of HVB Group will largely stabilise at the prior year’s levels over the whole of 2010. Adjusted for inflation, total operating costs are projected to remain largely unchanged year-on-year. Besides the change in total reve-nues – and notably the change in net trading income – the develop-ment of net write-downs of loans and provisions for guarantees and commitments will be the main factor influencing the earnings position. In terms of net write-downs of loans and provisions for guarantees and commitments, from today’s viewpoint we assume that the total for the 2010 financial year will not substantially exceed the previous year’s total despite predictions of a persistently difficult lending environment.
It still remains unclear whether the financial markets will continue returning to normal, notably against the backdrop of the debt crisis currently looming in some European states. Consequently, our per-formance in the 2010 financial year still remains dependent in part on the further development of the financial markets and the real econo-my. With its good strategic orientation and its excellent capital re-sources, HVB Group is in a good overall position to effectively exploit the opportunities that may arise from further volatility that can be expected on the financial markets and from a slow recovery in the real economy.
F-132

10 Interim Report at 31 March 2010 · HypoVereinsbank
Corporate Performance
Development of Selected Risks
In the 2009 Annual Report, we presented a comprehensive descrip-tion of the management and monitoring of risks in HVB Group, the essential characteristics of the internal control and risk management systems with regard to the financial reporting process, risk types and risk measurement, overall bank management, and risk types in detail. In light of the expected regulatory changes to market risk and the planned introduction of a new internal model, we conducted a thorough review of the internal capital calculation for all risk types during the first quarter of 2010. We also introduced the announced broadening of internal capital components to include the capital cushion. Furthermore, no essential methodological changes were made to risk management nor to the monitoring of individual risk types, or to the internal control and risk management system. The following sections describe the development of selected risks.
Credit exposure and counterparty exposureBreakdown of credit exposure and counterparty exposure by industry sector (€ billions)
industry sector March 2010 DeceMber 2009
Banking and insurance 31.9 32.8
Construction 31.3 31.7
Retail customers 28.4 28.7
Public sector 22.8 14.6
Food, consumer goods, services 20.3 21.2
Transportation 11.8 11.8
Chemicals, health, pharmaceuticals 11.0 11.9
Other 9.4 9.4
Utilities 9.0 9.5
Mechanical engineering, steel 8.5 8.8
Automotive 7.3 8.2
Electrical, IT, communications 4.9 5.4
Mineral oil 4.4 4.2
Media, printing, paper 3.7 4.1
hVb group 204.7 202.3
breakdown of credit exposure and counterparty exposure by division – core portfolio (€ billions)
corporate & investment banking
149.8
153.8
retail
38.6
37.7
private banking
5.3
5.4
other/consolidation
7.6
6.8
March 2010December 2009
F-133

HypoVereinsbank · Interim Report at 31 March 2010 11
Breakdown of credit exposure and counterparty exposure by rating class – core portfolio
march 2010 december 2009
rating class € billions in % € billions in %
Free of default risk 0.0 0.0 7.5 3.7
Not rated 7.6 3.7 9.7 4.8
Rating classes 1–4 101.4 49.8 89.4 44.4
Rating classes 5–8 86.4 42.4 85.9 42.7
Rating classes 9–10 8.3 4.1 8.8 4.4
hVb group 203.7 100.0 201.3 100.0
Derivative transactionsDerivative transactions (€ millions)
nominaL amount fair VaLue
residuaL maturity totaL totaL positiVe negatiVe
up to1 year
more than 1 year up
to 5 yearsmore than
5 years 31/3/2010 31/12/2009 31/3/2010 31/12/2009 31/3/2010 31/12/2009
interest rate derivatives 1,021,729 1,096,269 789,408 2,907,406 2,873,119 68,731 60,896 67,337 59,833
foreign exchange derivatives 393,616 129,874 69,077 592,567 467,793 11,629 9,499 12,283 9,599
equity/index derivatives 85,272 105,822 6,457 197,551 186,805 8,446 9,212 11,488 11,742
credit derivatives 41,953 219,754 42,866 304,573 326,438 3,641 4,318 4,008 4,684
– Protection buyer 18,709 104,975 21,555 145,239 157,154 2,394 2,902 1,341 1,526
– Protection seller 23,244 114,779 21,311 159,334 169,284 1,247 1,416 2,667 3,158
other transactions 3,818 2,897 143 6,858 7,313 568 786 662 1,104
hVb group 1,546,388 1,554,616 907,951 4,008,955 3,861,468 93,015 84,711 95,778 86,962
F-134

12 Interim Report at 31 March 2010 · HypoVereinsbank
Corporate Performance
Development of Selected Risks (CONtINUED)
collateral provided by borrowers, risk-weighted assets for HVB Group amounted to €14.5 billion at 31 March 2010 (31 December 2009: €14.1 billion).
In accordance with the banking supervision regulations under Basel II (German Banking Act/Solvency Regulation), with so-called partial use based on individual risk weightings and the risk-reducing effects of existing, legally enforceable bilateral netting agreements and the
Derivative transactions by counterparty type (€ millions)
fair VaLue
positiVe negatiVe
31/3/2010 31/12/2009 31/3/2010 31/12/2009
Central governments and central banks 706 593 568 536
Banks 76,031 67,606 79,887 70,523
Financial institutions 12,106 12,818 13,746 14,286
Other companies and private individuals 4,172 3,694 1,577 1,617
hVb group 93,015 84,711 95,778 86,962
Market risk from trading positions of HVB Group (value-at-risk, 99% confidence level, one-day holding period) (€ millions)
31/3/2010aVerage
20091 31/12/2009 30/9/2009 30/6/2009 31/3/2009
Interest rate positions (incl. credit spread risks) 19 51 22 38 59 84
Foreign exchange positions 3 5 3 2 6 8
Equity/index positions 2 5 5 7 5 5
Diversification effect2 (5) (12) (9) (12) (15) (12)
hVb group 19 49 21 35 55 85
1 arithmetic mean of the four quarter-end dates2 because of the diversification effect between the risk categories, the total risk is less than the sum of the individual risks
Market riskMarket risk of HVB Group including reclassified portfolios (value-at-risk, 99% confidence level, one-day holding period) (€ millions)
31/3/2010aVerage
20091 31/12/2009 30/9/2009 30/6/2009 31/3/2009
hVb group 54 113 65 91 127 168
1 arithmetic mean of the four quarter-end dates
F-135

HypoVereinsbank · Interim Report at 31 March 2010 13
31 March 2010 (31 December 2009: €38.4 billion). This represents a normalisation of the overall balance at year-end 2009 achieved by steering measures.
The stress tests we conduct on a regular basis showed that liquidity reserves at the end of March 2010 were sufficient to cover liquidity requirements resulting from the defined scenarios.
The requirements of the German Liquidity Ordinance were met at all times by the affected units of HVB Group during the period under re-view. The funds available exceeded the payment obligations for the following month by €46.0 billion at 31 March 2010 (31 December 2009: €49.5 billion).
Funding riskThe funding risk of HVB Group was again quite low in the first quarter of 2010 due to our broad funding base with regard to products, markets and investor groups. This ensured that we were able to obtain adequate funding for our lending operations at all times.
Liquidity riskThe recovery of the global financial crisis over the course of 2009 also continued on into the beginning of first quarter 2010. However, widening credit spreads due to the national debts of some euro-zone countries resulted in a renewed rise in volatility on the money and capital markets. With its adequate liquidity situation and solid financing structure, HVB Group was well equipped going into the first quarter of 2010. Even so, it cannot be ruled out that market volatility will set in again (for instance, due to problems in other countries), which could impact the money and capital markets.
Short-term liquidityWithin the framework of our short-term liquidity limit system, which operates under conservative assumptions, we showed an overall positive balance of €28.6 billion (31 December 2009: €41.4 billion) in HVB Group for the next banking day at the end of March 2010. The portfolio of highly liquid securities eligible as collateral for central bank borrowings and available at short notice to compensate for unexpected outflows of liquidity amounted to €24.7 billion at
F-136

14 Interim Report at 31 March 2010 · HypoVereinsbank
Consolidated Results
Consolidated Income Statement
for the period from 1 January to 31 March 2010
Earnings per share (in €)
notes 1/1–31/3/2010 1/1–31/3/2009
Earnings per share 10 0.58 0.08
1/1–31/3/2010 1/1–31/3/2009 change
income/expenses notes € millions € millions € millions in %
Net interest 1,010 1,217 (207) (17.0)
Dividends and other income from equity investments 15 15 — —
net interest income 4 1,025 1,232 (207) (16.8)
Net fees and commissions 5 373 295 + 78 + 26.4
Net trading income 6 440 (261) + 701
Net other expenses/income 7 65 40 + 25 + 62.5
net non-interest income 878 74 + 804 >+ 100.0
totaL reVenues 1,903 1,306 + 597 + 45.7
Payroll costs (452) (467) + 15 (3.2)
Other administrative expenses (353) (324) (29) + 9.0
Amortisation, depreciation and impairment
losses on intangible and tangible assets (54) (63) + 9 (14.3)
operating costs (859) (854) (5) + 0.6
operating profit 1,044 452 + 592 >+ 100.0
Provisions for risks and charges (5) (19) + 14 (73.7)
Write-down on goodwill — — — —
Restructuring costs — (49) + 49 (100.0)
Net write-downs of loans and provisions
for guarantees and commitments 8 (372) (283) (89) + 31.4
Net income from investments 9 27 (7) + 34
profit before taX 694 94 + 600 >+ 100.0
Income tax for the period (234) (31) (203) >+ 100.0
consoLidated profit 460 63 + 397 >+ 100.0
attributable to shareholder of UniCredit Bank AG 468 62 + 406 >+ 100.0
attributable to minorities (8) 1 (9)
F-137

HypoVereinsbank · Interim Report at 31 March 2010 15
Statement of Other Comprehensive Income (€ millions)
1/1–31/3/2010 1/1–31/3/2009
consolidated profit recognised in the income statement 460 63
income and expenses recognised in equity
Changes from foreign currency translation and other changes 42 25
Changes from companies accounted for using the equity method — —
Actuarial profit on defined benefit plans (pension commitments) — —
Discontinued operations and assets held for sale — —
Change in valuation of financial instruments (AfS reserve) 52 (129)
Change in valuation of financial instruments (hedge reserve) (55) (22)
Taxes on income and expenses recognised in equity 13 17
income and expenses recognised in equity 52 (109)
total recognised in equity 512 (46)
of which:
attributable to shareholder of UniCredit Bank AG 473 (79)
attributable to minorities 39 33
F-138

16 Interim Report at 31 March 2010 · HypoVereinsbank
Consolidated Results
Balance Sheet
at 31 March 2010
Assets
31/3/2010 31/12/2009 change
notes € millions € millions € millions in %
Cash and cash balances 14,596 6,400 + 8,196 >+ 100.0
Financial assets held for trading 11 137,752 133,389 + 4,363 + 3.3
Financial assets at fair value through profit or loss 12 17,766 13,758 + 4,008 + 29.1
Available-for-sale financial assets 13 4,873 4,441 + 432 + 9.7
Shares in associates accounted for using the equity method
and joint ventures accounted for using the equity method 14 89 88 + 1 + 1.1
Held-to-maturity investments 15 2,681 2,679 + 2 + 0.1
Loans and receivables with banks 16 44,753 43,254 + 1,499 + 3.5
Loans and receivables with customers 17 142,672 145,919 (3,247) (2.2)
Hedging derivatives 4,052 3,578 + 474 + 13.2
Hedge adjustment of hedged items
in the fair value hedge portfolio 103 53 + 50 + 94.3
Property, plant and equipment 2,591 2,581 + 10 + 0.4
Investment properties 1,899 1,907 (8) (0.4)
Intangible assets 639 656 (17) (2.6)
of which: goodwill 424 424 — —
Tax assets 2,783 2,612 + 171 + 6.5
of which: deferred tax assets 2,414 2,252 + 162 + 7.2
Non-current assets or disposal groups held for sale 4 4 — —
Other assets 1,900 2,101 (201) (9.6)
total assets 379,153 363,420 + 15,733 + 4.3
F-139

HypoVereinsbank · Interim Report at 31 March 2010 17
Liabilities
notes 31/3/2010 31/12/2009 change
€ millions € millions € millions in %
Deposits from banks 20 56,461 50,704 + 5,757 + 11.4
Deposits from customers 21 100,630 96,490 + 4,140 + 4.3
Debt securities in issue 22 57,159 61,286 (4,127) (6.7)
Financial liabilities held for trading 130,355 121,206 + 9,149 + 7.5
Hedging derivatives 1,422 1,369 + 53 + 3.9
Hedge adjustment of hedged items
in the fair value hedge portfolio 1,667 1,200 + 467 + 38.9
Tax liabilities 2,245 1,849 + 396 + 21.4
of which: deferred tax liabilities 1,426 1,175 + 251 + 21.4
Liabilities of disposal groups held for sale — — — —
Other liabilities 3,627 4,179 (552) (13.2)
Provisions 23 1,446 1,499 (53) (3.5)
Shareholders’ equity 24,141 23,638 + 503 + 2.1
Shareholders’ equity attributable to
shareholder of UniCredit Bank AG 23,341 22,870 + 471 + 2.1
Subscribed capital 2,407 2,407 — —
Additional paid-in capital 9,791 9,791 — —
Own shares — — — —
Other reserves 9,037 9,034 + 3 0.0
Change in valuation of financial instruments 24 5 5 — —
AfS reserve (152) (190) + 38 + 20.0
Hedge reserve 157 195 (38) (19.5)
Consolidated profit 2009 1,633 1,633 — —
Net profit 1/1 – 31/3/20101 468 — + 468
Minority interest 800 768 + 32 + 4.2
total shareholders’ equity and liabilities 379,153 363,420 + 15,733 + 4.3
1 shareholders’ equity attributable to shareholder of UniCredit Bank AG
The 2009 profit available for distribution disclosed in the separate financial statements of UniCredit Bank AG (= consolidated profit of HVB Group), which forms the basis for the appropriation of profit, amounts to €1,633 million. We will propose to the Annual General Meeting of Shareholders that a dividend of €1,633 million be paid to our sole shareholder, UniCredit S.p.A. (UniCredit), Rome, Italy.
F-140
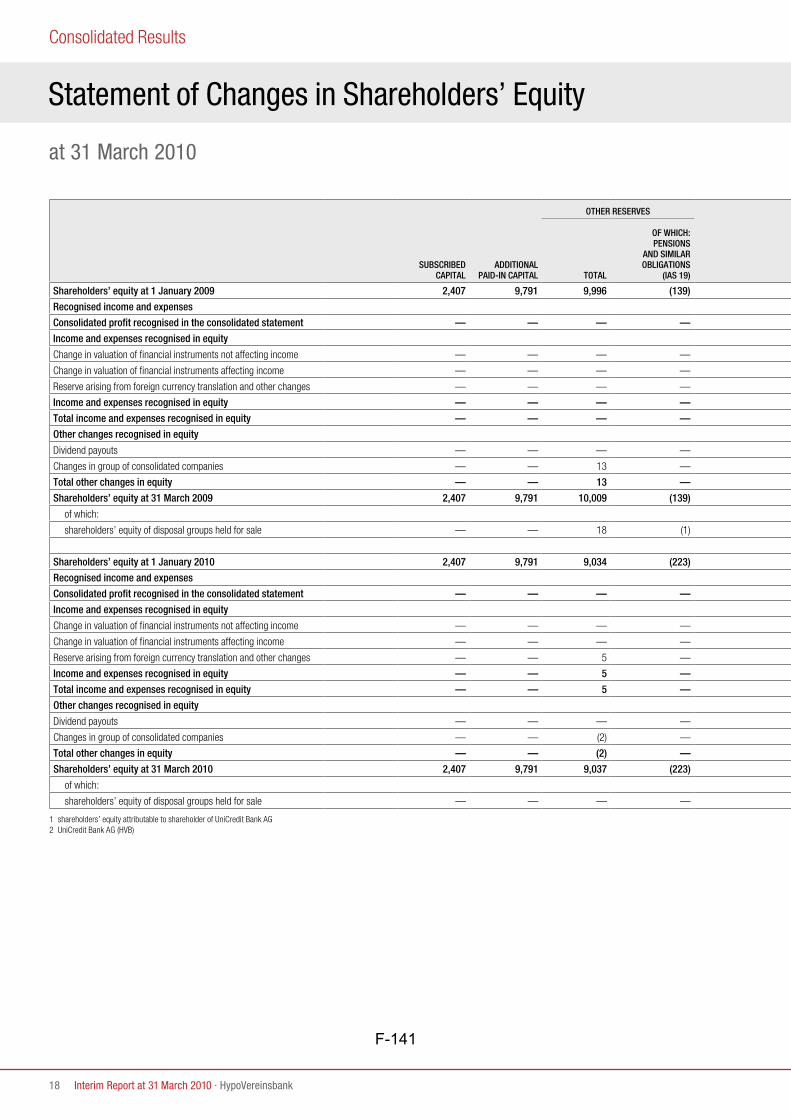
18 Interim Report at 31 March 2010 · HypoVereinsbank
Consolidated Results
Statement of Changes in Shareholders’ Equity
(€ millions)
subscribed capitaL
additionaL paid-in capitaL
other reserVes change in VaLuation of financiaL instruments
consoLidated profit
profit 1/1 – 31/31
totaL sharehoLders’
equity attributabLe to sharehoLder
of hVb2 minority interest
totaL sharehoLders’
equitytotaL
of which:pensions
and simiLar obLigations
(ias 19) afs reserVe hedge reserVe
shareholders’ equity at 1 January 2009 2,407 9,791 9,996 (139) (306) 329 — — 22,217 807 23,024
recognised income and expenses
consolidated profit recognised in the consolidated statement — — — — — — — 62 62 1 63
income and expenses recognised in equity
Change in valuation of financial instruments not affecting income — — — — (117) 53 — — (64) — (64)
Change in valuation of financial instruments affecting income — — — — (1) (69) — — (70) — (70)
Reserve arising from foreign currency translation and other changes — — — — (7) — — — (7) 32 25
income and expenses recognised in equity — — — — (125) (16) — — (141) 32 (109)
total income and expenses recognised in equity — — — — (125) (16) — 62 (79) 33 (46)
other changes recognised in equity
Dividend payouts — — — — — — — — — (11) (11)
Changes in group of consolidated companies — — 13 — — — — — 13 1 14
total other changes in equity — — 13 — — — — — 13 (10) 3
shareholders’ equity at 31 march 2009 2,407 9,791 10,009 (139) (431) 313 — 62 22,151 830 22,981
of which:
shareholders’ equity of disposal groups held for sale — — 18 (1) — — — — 18 32 50
shareholders’ equity at 1 January 2010 2,407 9,791 9,034 (223) (190) 195 1,633 — 22,870 768 23,638
recognised income and expenses
consolidated profit recognised in the consolidated statement — — — — — — — 468 468 (8) 460
income and expenses recognised in equity
Change in valuation of financial instruments not affecting income — — — — 46 (9) — — 37 1 38
Change in valuation of financial instruments affecting income — — — — 1 (29) — — (28) — (28)
Reserve arising from foreign currency translation and other changes — — 5 — (9) — — — (4) 46 42
income and expenses recognised in equity — — 5 — 38 (38) — — 5 47 52
total income and expenses recognised in equity — — 5 — 38 (38) — 468 473 39 512
other changes recognised in equity
Dividend payouts — — — — — — — — — (7) (7)
Changes in group of consolidated companies — — (2) — — — — — (2) — (2)
total other changes in equity — — (2) — — — — — (2) (7) (9)
shareholders’ equity at 31 march 2010 2,407 9,791 9,037 (223) (152) 157 1,633 468 23,341 800 24,141
of which:
shareholders’ equity of disposal groups held for sale — — — — — — — — — — —
1 shareholders’ equity attributable to shareholder of UniCredit Bank AG2 UniCredit Bank AG (HVB)
at 31 March 2010
F-141
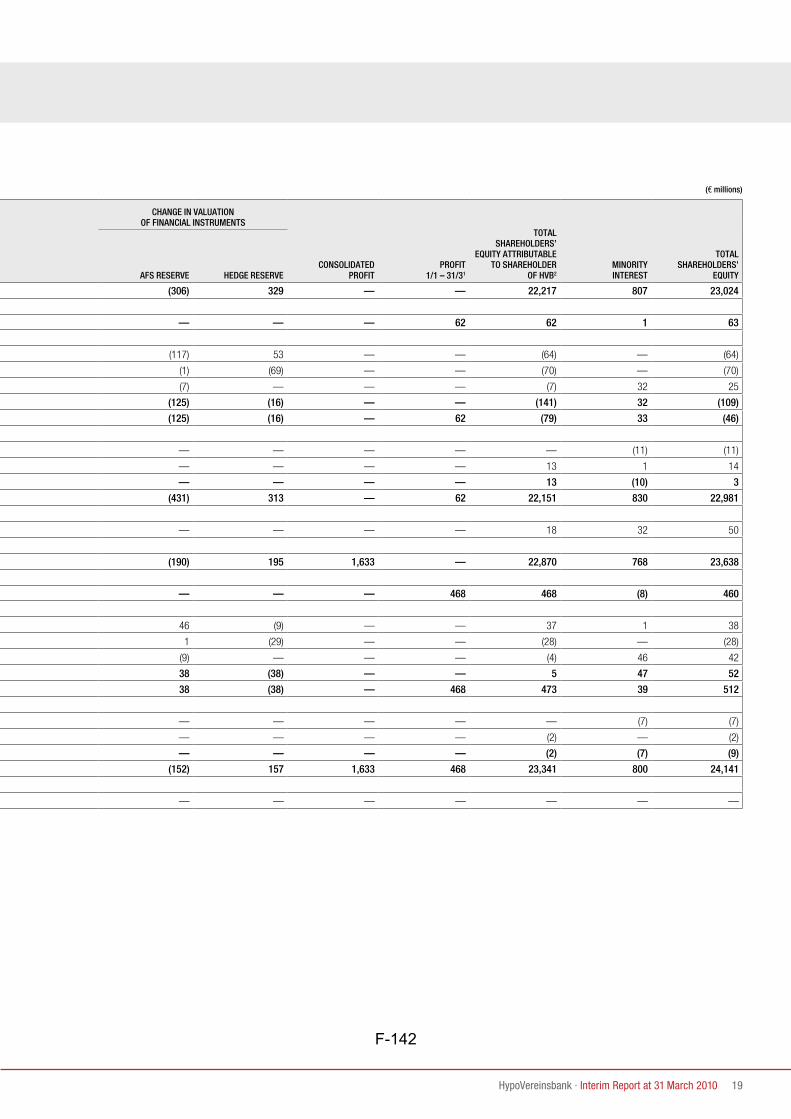
HypoVereinsbank · Interim Report at 31 March 2010 19
(€ millions)
subscribed capitaL
additionaL paid-in capitaL
other reserVes change in VaLuation of financiaL instruments
consoLidated profit
profit 1/1 – 31/31
totaL sharehoLders’
equity attributabLe to sharehoLder
of hVb2 minority interest
totaL sharehoLders’
equitytotaL
of which:pensions
and simiLar obLigations
(ias 19) afs reserVe hedge reserVe
shareholders’ equity at 1 January 2009 2,407 9,791 9,996 (139) (306) 329 — — 22,217 807 23,024
recognised income and expenses
consolidated profit recognised in the consolidated statement — — — — — — — 62 62 1 63
income and expenses recognised in equity
Change in valuation of financial instruments not affecting income — — — — (117) 53 — — (64) — (64)
Change in valuation of financial instruments affecting income — — — — (1) (69) — — (70) — (70)
Reserve arising from foreign currency translation and other changes — — — — (7) — — — (7) 32 25
income and expenses recognised in equity — — — — (125) (16) — — (141) 32 (109)
total income and expenses recognised in equity — — — — (125) (16) — 62 (79) 33 (46)
other changes recognised in equity
Dividend payouts — — — — — — — — — (11) (11)
Changes in group of consolidated companies — — 13 — — — — — 13 1 14
total other changes in equity — — 13 — — — — — 13 (10) 3
shareholders’ equity at 31 march 2009 2,407 9,791 10,009 (139) (431) 313 — 62 22,151 830 22,981
of which:
shareholders’ equity of disposal groups held for sale — — 18 (1) — — — — 18 32 50
shareholders’ equity at 1 January 2010 2,407 9,791 9,034 (223) (190) 195 1,633 — 22,870 768 23,638
recognised income and expenses
consolidated profit recognised in the consolidated statement — — — — — — — 468 468 (8) 460
income and expenses recognised in equity
Change in valuation of financial instruments not affecting income — — — — 46 (9) — — 37 1 38
Change in valuation of financial instruments affecting income — — — — 1 (29) — — (28) — (28)
Reserve arising from foreign currency translation and other changes — — 5 — (9) — — — (4) 46 42
income and expenses recognised in equity — — 5 — 38 (38) — — 5 47 52
total income and expenses recognised in equity — — 5 — 38 (38) — 468 473 39 512
other changes recognised in equity
Dividend payouts — — — — — — — — — (7) (7)
Changes in group of consolidated companies — — (2) — — — — — (2) — (2)
total other changes in equity — — (2) — — — — — (2) (7) (9)
shareholders’ equity at 31 march 2010 2,407 9,791 9,037 (223) (152) 157 1,633 468 23,341 800 24,141
of which:
shareholders’ equity of disposal groups held for sale — — — — — — — — — — —
1 shareholders’ equity attributable to shareholder of UniCredit Bank AG2 UniCredit Bank AG (HVB)
F-142

20 Interim Report at 31 March 2010 · HypoVereinsbank
Consolidated Results
1 Accounting and valuation principlesIFRS basisAfter trading in HVB shares was officially discontinued during 2008 following the completion of the squeeze-out, we are no longer formally obliged to prepare quarterly financial statements at 31 March and 30 September. We have decided, however, to continue publishing interim reports with a view to retaining a high level of transparency on the market.
The income statement and balance sheet contained in the present Interim Report together with the associated notes have again been prepared in accordance with the regulations defined in the International Financial Reporting Standards (IFRS).
We have applied the same accounting, valuation and disclosure principles in 2010 as in the consolidated financial statements for 2009 (please refer to the HVB Group Annual Report for 2009, starting on page 97). The main new regulations worthy of note in this regard are the revised IFRS 3 „Business Combinations“ (IFRS 3 R) and IAS 27 „Consolidated and Separate Financial Statements“ (IAS 27 R). Whereas IFRS 3 R defines more closely the applica-tion of the purchase method for business combinations, IAS 27 R contains revised regulations for the presentation of minority interests and for disclosure in the event of the loss of controlling influence over a subsidiary in the balance sheet. The new regulations could have an impact on HVB Group should there be future business combinations and transactions.
Segment reportingIn segment reporting, the market-related activities of HVB Group are divided into the following globally active divisions: Corporate & Investment Banking, Retail, and Private Banking (formerly referred to as Wealth Management).
Also shown is the Other/consolidation segment that covers Global Banking Services (GBS) and Group Corporate Centre activities and the effects of consolidation. The Special Credit Portfolio (SCP) defined in 2006 and the remaining holdings of the customer portfolio of Real Estate Restructuring are included in GBS.
Largely the same principles used at year-end 2009 are being applied in 2010. We use risk-weighted assets compliant with Basel II as the criterion applied to allocate tied equity capital. The interest rate used to assess the equity capital allocated to companies assigned to several divisions (HVB, UniCredit Luxembourg) was 4.30% in 2009. This rate was redetermined for 2010 and has been 4.09% since 1 January 2010.
2 Changes in the group of companies included in consolidationThe following company was added to the group of companies included in consolidation in the first three months of 2010:
– Bank Austria Immobilien Service GmbH, Vienna.
Selected Notes
F-143
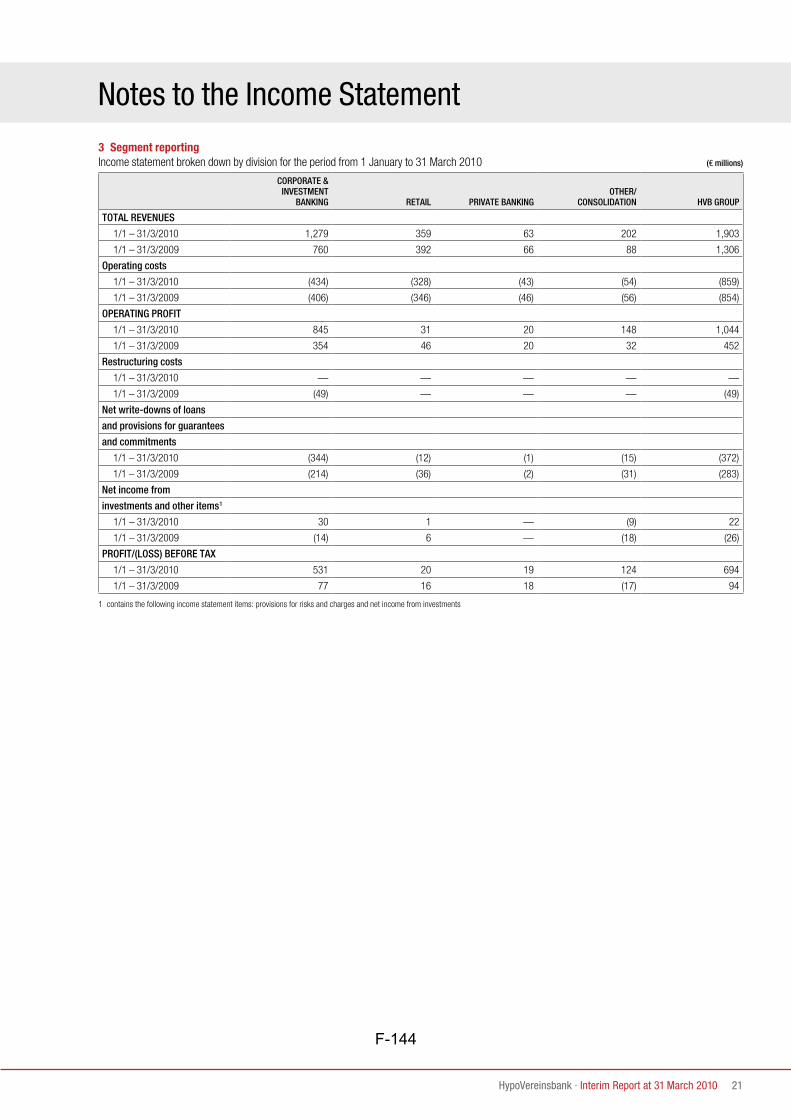
HypoVereinsbank · Interim Report at 31 March 2010 21
3 Segment reportingIncome statement broken down by division for the period from 1 January to 31 March 2010 (€ millions)
corporate & inVestment
banking retaiL priVate bankingother/
consoLidation hVb group
totaL reVenues
1/1 – 31/3/2010 1,279 359 63 202 1,903
1/1 – 31/3/2009 760 392 66 88 1,306
operating costs
1/1 – 31/3/2010 (434) (328) (43) (54) (859)
1/1 – 31/3/2009 (406) (346) (46) (56) (854)
operating profit
1/1 – 31/3/2010 845 31 20 148 1,044
1/1 – 31/3/2009 354 46 20 32 452
restructuring costs
1/1 – 31/3/2010 — — — — —
1/1 – 31/3/2009 (49) — — — (49)
net write-downs of loans
and provisions for guarantees
and commitments
1/1 – 31/3/2010 (344) (12) (1) (15) (372)
1/1 – 31/3/2009 (214) (36) (2) (31) (283)
net income from
investments and other items1
1/1 – 31/3/2010 30 1 — (9) 22
1/1 – 31/3/2009 (14) 6 — (18) (26)
profit/(Loss) before taX
1/1 – 31/3/2010 531 20 19 124 694
1/1 – 31/3/2009 77 16 18 (17) 94
1 contains the following income statement items: provisions for risks and charges and net income from investments
Notes to the Income Statement
F-144

22 Interim Report at 31 March 2010 · HypoVereinsbank
Consolidated Results
Income statement of the Corporate & Investment Banking division (€ millions)
income/eXpenses 1/1 – 31/3/2010 1/1 – 31/3/2009q4
2009q3
2009q2
2009
net interest income 697 931 733 755 818
Net fees and commissions 183 125 137 122 132
Net trading income 373 (296) 72 582 569
Net other expenses/income 26 — (5) 2 2
net non-interest income 582 (171) 204 706 703
totaL reVenues 1,279 760 937 1,461 1,521
Payroll costs (184) (153) (211) (176) (146)
Other administrative expenses (245) (251) (228) (247) (250)
Amortisation, depreciation and impairment
losses on intangible and tangible assets (5) (2) (6) (1) (1)
operating costs (434) (406) (445) (424) (397)
operating profit 845 354 492 1,037 1,124
Restructuring costs — (49) 125 — (163)
Net write-downs of loans and provisions
for guarantees and commitments (344) (214) (145) (496) (681)
Net income from investments and other items1 30 (14) (111) (213) (75)
profit before taX 531 77 361 328 205
Cost-income ratio in % 33.9 53.4 47.5 29.0 26.1
1 contains the following income statement items: provisions for risks and charges and net income from investments
Development of the Corporate & Investment Banking divisionThe Corporate & Investment Banking division generated total revenues of €1,279 million in the first quarter of 2010, which represents a sharp rise over the total revenues of €760 million recorded in the first quarter of 2009. With a slight increase in operating costs, the operating profit rose to €845 million in the first quarter of 2010 after €354 million in the equivalent period last year.
Net interest income fell by €234 million to €697 million year-on-year. This decline can essentially be attributed to lower trading-related interest income in line with the deliberate reduction in assets held for trading (deleveraging). Net fees and commissions developed pleasingly, rising by €58 million to €183 million. This is attributable most notably to income from project and structured financing.
The net trading income improved significantly year-on-year. The total €373 million was generated primarily by the Fixed Income (fixed income and foreign exchange products) and Equities (equities and index products) units after a net trading loss of €296 million had been recorded in the previous year on account of the far more difficult market conditions (including valuation expanses on ABS products and widening spreads on government bonds fair value option).
Despite the increase of almost 7% in operating costs to €434 million (first quarter of 2009: €406 million), the division improved its cost-income ratio to a satisfactory level of 33.9% (first quarter 2009: 53.4%).
Net write-downs of loans and provisions for guarantees and commitments rose to €344 million in the first quarter of 2010 on account of the persistently difficult credit environment (first quarter of 2009: €214 million). The net income from investments includes gains on disposals from private equity funds. All in all, the division recorded a profit before tax of €531 million in the first quarter of 2010 (first quarter of 2009: €77 million).
Notes to the Income Statement (CONtINUED)
F-145

HypoVereinsbank · Interim Report at 31 March 2010 23
Income statement of the Retail division (€ millions)
income/eXpenses 1/1 – 31/3/2010 1/1 – 31/3/2009q4
2009q3
2009q2
2009
net interest income 212 257 228 233 244
Net fees and commissions 144 131 121 135 133
Net trading income 4 — 4 5 1
Net other expenses/income (1) 4 (9) (3) (6)
net non-interest income 147 135 116 137 128
totaL reVenues 359 392 344 370 372
Payroll costs (134) (145) (136) (134) (132)
Other administrative expenses (191) (198) (184) (190) (184)
Amortisation, depreciation and impairment losses
on intangible and tangible assets (3) (3) (3) (3) (4)
operating costs (328) (346) (323) (327) (320)
operating profit 31 46 21 43 52
Restructuring costs — — (8) — (55)
Net write-downs of loans and provisions
for guarantees and commitments (12) (36) (8) (13) (6)
Net income from investments and other items1 1 6 1 1 (15)
profit/(Loss) before taX 20 16 6 31 (24)
Cost-income ratio in % 91.4 88.3 93.9 88.4 86.0
1 contains the following income statement items: provisions for risks and charges and net income from investments
Development of the Retail divisionThe total revenues of the Retail division fell by around 8% compared with the equivalent period last year in a persistently difficult economic environment. Within this total, net interest income declined by around 18% to €212 million due essentially to lower interest margins in deposit-taking activities. On the lending side, falling volumes, notably in real estate financing, led to a decline in net interest income. Despite customers’ continuing reticence in the wake of the financial crisis, net fees and commissions rose by €13 million or 10%. This pleasing development was a result of better securities operations driven by the strong demand for mandated products, such as the innovative “HVB Vermögensdepot privat”, together with the successful distribution of pension products and stronger sales of savings-and-loan products. This benefited from the new cooperation deal with Wüstenrot Bausparkasse AG.
The decline in total revenues was partially offset by the savings achieved in operating costs by applying consistent cost management. Within operating costs, there was a decline in both payroll costs due to a reduction in headcount, and other administrative expenses. The operating profit for the first quarter of 2010 decreased by €15 million compared with the first quarter of 2009, to €31 million, although the total was still €10 million higher than the profit recorded for the fourth quarter of 2009.
On account of the reduction to €12 million (previous year: €36 million) in net write-downs of loans and provisions for guarantees and commitments, the Retail division generated a 25% increase in profit before tax to €20 million in the first quarter of 2010.
F-146

24 Interim Report at 31 March 2010 · HypoVereinsbank
Consolidated Results
Notes to the Income Statement (CONtINUED)
Income statement of the Private Banking division (€ millions)
income/eXpenses 1/1 – 31/3/2010 1/1 – 31/3/2009q4
2009q3
2009q2
2009
net interest income 20 25 25 23 22
Net fees and commissions 43 40 34 37 40
Net trading income — — — — —
Net other expenses/income — 1 5 (1) 2
net non-interest income 43 41 39 36 42
totaL reVenues 63 66 64 59 64
Payroll costs (19) (19) (16) (18) (17)
Other administrative expenses (24) (27) (26) (25) (22)
Amortisation, depreciation and impairment losses
on intangible and tangible assets — — — — (1)
operating costs (43) (46) (42) (43) (40)
operating profit 20 20 22 16 24
Restructuring costs — — (2) (1) —
Net write-downs of loans and provisions
for guarantees and commitments (1) (2) (1) 4 3
Net income from investments and other items1 — — (7) 4 (6)
profit before taX 19 18 12 23 21
Cost-income ratio in % 68.3 69.7 65.6 72.9 62.5
1 contains the following income statement items: provisions for risks and charges and net income from investments
Development of the Private Banking divisionAt the start of 2010, the Wealth Management division changed its name to the Private Banking division. As part of the Private Banking division of UniCredit Group, we have adopted this uniform designation to signal our affiliation to the outside world with one of Europe’s biggest, market-leading private banking addresses.
At €20 million, the operating profit in the first quarter of 2010 remained at the same level as last year under persistently difficult market conditions. Total revenues fell a minor €3 million to €63 million due to lower net interest income. This decline was the sole result of unfavourable changes in market interest rates, whilst the average volume of deposits remained constant. At the same time, net fees and commissions rose by a pleasing €3 million to €43 million. Even though customers remain cautious due to ongoing uncertainty in the wake of the financial crisis, in the first quarter of 2010 we achieved the best total for net fees and commissions since the fourth quarter of 2008.
Operating costs fell by €3 million to €43 million due to a reduction in other administrative expenses as a result of consistent cost management. This helped the cost-income ratio to improve slightly by 1.4 percentage points to 68.3%.
All in all, the Private Banking division generated a profit before tax of €19 million in the first quarter of 2010, which is slightly higher than the year-ago figure of €18 million.
F-147

HypoVereinsbank · Interim Report at 31 March 2010 25
Income statement of the Other/consolidation segment (€ millions)
income/eXpenses 1/1 – 31/3/2010 1/1 – 31/3/2009q4
2009q3
2009q2
2009
totaL reVenues 202 88 136 64 232
operating costs (54) (56) (59) (73) (115)
operating profit/(Loss) 148 32 77 (9) 117
Restructuring costs — — (17) — —
Net write-downs of loans and provisions
for guarantees and commitments (15) (31) 41 (14) (2)
Net income from investments and other items1 (9) (18) 66 (11) (39)
profit/(Loss) before taX 124 (17) 167 (34) 76
1 contains the following income statement items: provisions for risks and charges and net income from investments
Development of the Other/consolidation segmentThe Other/consolidation segment encompasses the Group Corporate Centre, Global Banking Services and consolidation effects. Global Banking Services also includes the Special Credit Portfolio defined in 2006 together with the remaining holdings in the Real Estate Restructuring customer portfolio.
The total revenues of this segment increased by €114 million to €202 million in the first quarter of 2010 (first quarter of 2009: €88 million). Among other things, the total also includes gains realised on the buy-back of hybrid capital together with higher earnings from asset/liability management.
With operating costs declining by €2 million, an operating profit of €148 million was generated (first quarter of 2009: €32 million).
The net write-downs of loans and provisions for guarantees and commitments in this segment are almost exclusively due to the Special Credit Portfolio (including the Real Estate Restructuring customer portfolio). The total fell by €16 million to €15 million in the quarter under review compared with the first quarter of 2009. The profit before tax improved by €141 million to €124 million in the quarter under review (first quarter of 2009: loss of €17 million) on account of the higher total revenues and the lower net-write downs of loans and provisions for guarantees and commitments.
4 Net interest income (€ millions)
1/1 – 31/3/2010 1/1 – 31/3/2009
interest income from
lending and money market transactions 1,513 2,332
other interest income 640 950
interest expense from
deposits (282) (913)
debt securities in issue and other interest expenses (861) (1,152)
net interest 1,010 1,217
dividends and other income from equity investments
Dividends and other similar income 14 15
Companies accounted for using the equity method 1 —
total 1,025 1,232
F-148

26 Interim Report at 31 March 2010 · HypoVereinsbank
Consolidated Results
Notes to the Income Statement (CONtINUED)
5 Net fees and commissions (€ millions)
1/1 – 31/3/2010 1/1 – 31/3/2009
Management, brokerage and consultancy services 207 136
Collection and payment services 50 51
Lending operations 111 87
Other service operations 5 21
total 373 295
This item comprises the balance of fee and commission income of €615 million (2009: €531 million) and fee and commission expense of €242 million (2009: €236 million).
6 Net trading income (€ millions)
1/1 – 31/3/2010 1/1 – 31/3/2009
Net gains/(losses) on financial assets held for trading1 339 (106)
Effects arising from hedge accounting 12 5
Changes in fair value of hedged items (614) (985)
Changes in fair value of hedging derivatives 626 990
Net gains/(losses) on financial assets at fair value through profit or loss (fair value option) 8 (155)
Other net trading income 81 (5)
total 440 (261)
1 including dividends on financial assets held for trading
The effects arising from hedge accounting includes the hedge results of the fair value hedge portfolio and the individual micro fair value hedges as a net aggregate total.
The net gains on holdings at fair value through profit or loss (held-for-trading portfolio and fair value option) generally only contain the changes in fair value disclosed in the income statement. The interest income from held-for-trading portfolios is normally disclosed under net interest income. To ensure that the full contribution to profits is disclosed, the interest cash flows are only carried in net trading income for the interest rate swap trading book, which exclusively contains interest rate derivatives.
7 Net other expenses/income (€ millions)
1/1 – 31/3/2010 1/1 – 31/3/2009
Other income 89 66
Other expenses (24) (26)
total 65 40
8 Net write-downs of loans and provisions for guarantees and commitments (€ millions)
1/1 – 31/3/2010 1/1 – 31/3/2009
additions (382) (295)
Allowances for losses on loans and receivables (363) (301)
Allowances for losses on guarantees and indemnities (19) 6
recoveries from write-offs of loans and receivables 10 12
gains on the disposal of impaired loans and receivables — —
total (372) (283)
F-149

HypoVereinsbank · Interim Report at 31 March 2010 27
9 Net income from investments (€ millions)
1/1 – 31/3/2010 1/1 – 31/3/2009
Available-for-sale financial assets 27 (10)
Shares in affiliated companies — —
Companies accounted for using the equity method — —
Held-to-maturity investments — —
Land and buildings — 8
Investment properties1 — (5)
Other — —
total 27 (7)
1 impairments and write-ups together with fair value fluctuations for investment properties measured at market value
Net income from investments breaks down as follows: (€ millions)
1/1 – 31/3/2010 1/1 – 31/3/2009
gains on the disposal of 20 24
available-for-sale financial assets 20 10
shares in affiliated companies — 6
companies accounted for using the equity method — —
held-to-maturity investments — —
land and buildings — 8
other — —
write-downs and value adjustments on 7 (31)
available-for-sale financial assets 7 (26)
shares in affiliated companies — —
companies accounted for using the equity method — —
held-to-maturity investments — —
investment properties1 — (5)
total 27 (7)
1 impairments and write-ups together with fair value fluctuations for investment properties measured at market value
10 Earnings per share
1/1 – 31/3/2010 1/1 – 31/3/2009
Consolidated profit attributable to shareholders (€ millions) 468 62
Average number of shares 802,383,672 802,383,672
Earnings per share (€) 0.58 0.08
F-150

28 Interim Report at 31 March 2010 · HypoVereinsbank
Consolidated Results
11 Financial assets held for trading (€ millions)
31/3/2010 31/12/2009
balance sheet assets
Fixed-income securities 31,895 33,950
Equity instruments 5,863 6,586
Other financial assets held for trading 11,133 11,772
positive fair value from derivative financial instruments 88,861 81,081
total 137,752 133,389
The financial assets held for trading include €440 million (31 December 2009: €512 million) in subordinated assets at 31 March 2010.
12 Financial assets at fair value through profit or loss (€ millions)
31/3/2010 31/12/2009
Fixed-income securities 15,540 11,266
Equity instruments 1 1
Investment certificates 1 1
Promissory notes 2,224 2,490
Other financial assets at fair value through profit or loss — —
total 17,766 13,758
The financial assets at fair value through profit or loss include €293 million (31 December 2009: €274 million) in subordinated assets at 31 March 2010.
13 Available-for-sale financial assets (€ millions)
31/3/2010 31/12/2009
Fixed-income securities 2,829 2,433
Equity instruments 885 862
Other available-for-sale financial assets 476 475
Impaired assets 683 671
total 4,873 4,441
Available-for-sale financial assets include financial instruments of €1,463 million (31 December 2009: €1,444 million) valued at cost at 31 March 2010.
The available-for-sale financial assets contain a total of €683 million (31 December 2009: €671 million) in impaired assets at 31 March 2010. Impairments of €2 million (31 March 2009: €26 million) were taken to the income statement during the period under review. Of the non-impaired debt instruments non are financial instruments past due.
The available-for-sale financial assets include €266 million (31 December 2009: €257 million) in subordinated assets at 31 March 2010.
14 Shares in associated companies accounted for using the equity method and joint ventures accounted for using the equity method (€ millions)
31/3/2010 31/12/2009
Associated companies accounted for using the equity method 89 88
of which: goodwill — —
Joint ventures accounted for using the equity method — —
total 89 88
Notes to the Balance Sheet
F-151

HypoVereinsbank · Interim Report at 31 March 2010 29
15 Held-to-maturity investments (€ millions)
31/3/2010 31/12/2009
Fixed-income securities 2,666 2,664
Other held-to-maturity investments 11 11
Impaired assets 4 4
total 2,681 2,679
The held-to-maturity investments include €11 million (31 December 2009: €11 million) in subordinated assets at 31 March 2010.
16 Loans and receivables with banks (€ millions)
31/3/2010 31/12/2009
Current accounts and demand deposits 14,726 14,887
Repos1 12,414 10,265
Reclassified securities 7,093 8,349
Other loans to banks 10,520 9,753
total 44,753 43,254
1 repurchase agreements
The loans and receivables with banks include €892 million (31 December 2009: €862 million) in subordinated assets at 31 March 2010.
17 Loans and receivables with customers (€ millions)
31/3/2010 31/12/2009
Current accounts 6,344 6,349
Repos1 1,027 971
Mortgage loans 54,707 56,012
Finance leases 2,359 2,357
Reclassified securities 7,545 8,009
Non-performing loans and receivables 4,544 5,029
Other loans and receivables 66,146 67,192
total 142,672 145,919
1 repurchase agreements
The loans and receivables with customers include €2,029 million (31 December 2009: €2,054 million) in subordinated assets at 31 March 2010.
18 Application of reclassification rules defined in IAS 39.50 et seq.No further assets held for trading have been reclassified as loans and receivables in 2010. The intention to trade no longer exists for the assets reclassi-fied in 2008 and 2009, since the markets in these financial instruments had become illiquid as a result of the extraordinary circumstances created by the financial crisis through to the time of reclassification. Given the high quality of the assets concerned, HVB intends to retain the assets for a longer period. HVB has not reclassified any assets from the available-for-sale portfolio.
The following table shows the development of the reclassified holdings: (€ billions)
recLassified asset-backed-securities and other securities
carrying amount of aLL recLassified assets1
fair VaLue of aLL recLassified assets
nominaL amount of aLL recLassified assets
reclassified in 2008
Balance at 31/12/2008 13.7 11.8 14.6
Balance at 31/3/2010 8.4 7.6 9.2
reclassified in 2009
Balance at 31/12/2009 7.3 7.4 7.4
Balance at 31/3/2010 6.2 6.4 6.3
balance of reclassified assets at 31/3/2010 14.6 14.0 15.5
1 before accrued interest
F-152

30 Interim Report at 31 March 2010 · HypoVereinsbank
Consolidated Results
Notes to the Balance Sheet (CONtINUED)
The fair value of the financial instruments reclassified as loans and receivables with banks and customers amounts to a total of €14.0 billion at 31 March 2010. If these reclassifications had not been carried out in 2008 and 2009, mark-to-market valuation (including realised disposals) would have given rise to a net gain of €309 million in net trading income in the first quarter of 2010. A net loss of €0.6 billion would have accrued in net trading income from the holdings reclassified in 2008 and 2009. These effects reflect a theoretical, pro forma calculation, as the assets are measured at amortised cost on account of the reclassification.
We have taken loan-loss provisions of €1 million on the reclassified assets in the first three months of 2010 (2008 and 2009: €143 million). The fair value at the date when the reclassification takes effect represents the new acquisition costs, some of which are considerably less than the nominal value. Accordingly, this difference (discount) will be amortised over the remaining term of the reclassified financial assets. This gives rise to an effect of €36 million (2008 and 2009: €335 million) in the first quarter of 2010 which is recognised in net interest income.
A gain of €15 million (2008 and 2009: €83 million) on reclassified securities that had matured, been partially paid off and sold was recognised in the income statement in the first quarter of 2010.
19 Allowances for losses on loans and receivables with customers and banks Analysis of loans and receivables (€ millions)
specific aLLowances
portfoLio aLLowances totaL
balance at 1 January 2009 4,305 536 4,841
Changes affecting income 285 16 301
Changes not affecting income
Changes due to make-up of group of consolidated companies and
reclassifications of disposal groups held for sale (9) (2) (11)
Use of existing loan-loss allowances (74) — (74)
Effects of currency translation and other changes not affecting income 41 — 41
Non-current assets or disposal groups held for sale 9 2 11
balance at 31 march 2009 4,557 552 5,109
specific aLLowances
portfoLio aLLowances totaL
balance at 1 January 2010 4,641 581 5,222
Changes affecting income 343 20 363
Changes not affecting income
Changes due to make-up of group of consolidated companies and
reclassifications of disposal groups held for sale — — —
Use of existing loan-loss allowances (28) — (28)
Effects of currency translation and other changes not affecting income 15 — 15
Non-current assets or disposal groups held for sale — — —
balance at 31 march 2010 4,971 601 5,572
20 Deposits from banks (€ millions)
31/3/2010 31/12/2009
deposits from central banks 6,463 8,385
deposits from banks 49,998 42,319
Current accounts and demand deposits 16,876 13,553
Reverse repos1 7,969 5,574
Other liabilities 25,153 23,192
total 56,461 50,704
1 repurchase agreements
F-153

HypoVereinsbank · Interim Report at 31 March 2010 31
21 Deposits from customers (€ millions)
31/3/2010 31/12/2009
Current accounts and demand deposits 40,975 41,281
Savings deposits 13,884 13,183
Reverse repos1 8,423 1,834
Other liabilities 37,348 40,192
total 100,630 96,490
1 repurchase agreements
22 Debt securities in issue (€ millions)
31/3/2010 31/12/2009
Bonds 54,644 59,265
Other securities 2,515 2,021
total 57,159 61,286
23 Provisions (€ millions)
31/3/2010 31/12/2009
Provisions for pensions and similar commitments 50 50
Allowances for losses on guarantees and commitments 256 237
Restructuring provisions 108 121
Other provisions 1,032 1,091
total 1,446 1,499
24 Change in valuation of financial instrumentsThe reserves arising from changes in the valuation of financial instruments at 31 March 2010 remained practically unchanged compared with the total at year-end 2009 with €5 million. The decline of €38 million in the cash flow hedge reserve to €157 million was offset by the rise of €38 million in the AfS reserve to minus €152 million. The positive development of the AfS reserve can be attributed primarily to positive fair value fluctuations in our share-holdings and fixed-interest securities classified as available for sale. There was also a minor, market-related increase in the value of ABS holdings in the available-for-sale portfolio, for which there were no impairment criteria as defined in IAS 39.59 and hence no impairment losses needed to be recognised.
25 Subordinated capitalThe following table shows the breakdown of subordinated capital included in deposits from banks and customers and debt securities in issue: (€ millions)
31/3/2010 31/12/2009
Subordinated liabilities 4,016 4,232
Participating certificates outstanding 205 205
Hybrid capital instruments 1,333 1,671
total 5,554 6,108
F-154

32 Interim Report at 31 March 2010 · HypoVereinsbank
Consolidated Results
Other Information
26 Contingent liabilities and other commitments (€ millions)
31/3/2010 31/12/2009
contingent liabilities1 19,567 19,544
Guarantees and indemnities 19,567 19,544
other commitments 59,629 56,787
Irrevocable credit commitments 39,457 37,252
Other commitments 20,172 19,535
total 79,196 76,331
1 contingent liabilities are offset by contingent assets to the same amount
F-155

HypoVereinsbank · Interim Report at 31 March 2010 33
27 Members of the Supervisory Board and Management BoardSupervisory Board
sergio ermottiChairman
peter königDeputy Chairman
dr wolfgang sprisslerDeputy Chairman
gerhard bayreuther
beate mensch
dr Lothar meyer
marina natale
roberto nicastro
panagiotis sfeliniotis
aldo bulgarelli
beate dura-kempf
paolo fiorentino
giulio gambino
klaus grünewald
karl guha
professor hans-werner sinn
Jutta streit
michael Voss
Jens-uwe wächter
dr susanne weiss
peter buschbeckRetail division
Lutz diederichsCorporate & Investment Banking division
rolf friedhofenChief Financial Officer (CFO)until 31 May 2010
dr theodor weimer Board spokesman
andreas wölferPrivate Banking division1
heinz LaberHuman Resources ManagementGlobal Banking Services
andrea umberto VareseChief Risk Officer (CRO)
Management Board
1 formerly Wealth Management division; renamed Private Banking division as of 1 April 2010
Munich, 11 May 2010
UniCredit Bank AG
The Management Board
Buschbeck
Laber
Diederichs
Varese
Friedhofen
Dr Weimer Wölfer
F-156

Z-1
UniCredit Bank AG
Kardinal-Faulhaber-Strasse 1
80333 Munich
Signed 20 May 2010
Michael Furmans Matthias Preißer