unification and aging in germany: who pays and when? · many, and professor i1 at the university of...
TRANSCRIPT

This PDF is a selection from an out-of-print volume from the National Bureauof Economic Research
Volume Title: Generational Accounting around the World
Volume Author/Editor: Alan J. Auerbach, Laurence J. Kotlikoff and WilliLeibfritz, editors
Volume Publisher: University of Chicago Press
Volume ISBN: 0-226-03213-2
Volume URL: http://www.nber.org/books/auer99-1
Publication Date: January 1999
Chapter Title: Unification and Aging in Germany: Who Pays and When?
Chapter Author: Bernd Raffelhuschen, Jan Walliser, Willi Leibfritz
Chapter URL: http://www.nber.org/chapters/c6694
Chapter pages in book: (p. 277 - 298)

12 Unification and Aging in Germany: Who Pays and When? Bernd Raffelhuschen and Jan Walliser
12.1 Introduction
Germany has to deal with a double pressure on its fiscal policy that raises concerns about the sustainability of the current path of government spending. The first pressure stems from the unification of East and West Germany in 1990. Because the centrally planned eastern economy was inefficient, output in the East fell sharply after unification and a large number of workers became unemployed during the first years of transition. As a consequence, the federal government continues to transfer resources exceeding 5 percent of West Ger- man GDP to the eastern region in order to economically and socially cushion the East German transition. The second pressure stems from the sharp increase in dependency ratios, which is due to a severe aging of the population. If fertil- ity rates continue to be low, by the year 2030 around 25 percent of the popula- tion will be age 65 or older, compared to a value of 15 percent in 1995. Conse- quently, the elderly dependency ratio, measured as the number of individuals aged 65 or older per number of individuals aged 18 to 64, will increase from 23 to 48 percent by the year 2030.
How will the burdens of both a dramatically increasing elderly dependency ratio and the West-East transfers be distributed among current and future gen- erations? Will future generations be stuck with the bill? In order to illustrate the intertemporal impact of present and alternative fiscal policies, we employ the method of generational accounting developed by Auerbach, Gokhale, and Kotlikoff (1991, 1992). We show that both unification and aging will impose
Bernd Raffelhiischen is professor of economics at Albert-Ludwigs-University in Freiburg, Ger- many, and professor I1 at the University of Bergen, Norway. Jan Walliser is an economist in the Macroeconomic Analysis Division of the Congressional Budget Office.
The authors thank Daniel Besendorfer, Holger Bonin, and Christoph Borgmann for excellent research assistance. The opinions expressed in this chapter do not necessarily reflect the views of the Congressional Budget Office.
211

278 Bernd Raffelhiischen and Jan Walliser
sizable burdens on future German generations if the current paths for spending and revenues are maintained. Recent legislation has increased a number of taxes and reduced social insurance benefits to help finance the costs of aging and economic transition in East Germany. But according to our findings, those measures are far from sufficient to ensure fiscal sustainability.
The paper continues in section 12.2 with a brief description of the macro- economic performance and fiscal policy in East, West, and unified Germany during the recent past. Section 12.3 documents the data used in the analysis. Section 12.4 contains the basic findings and their sensitivity to alternative as- sumptions concerning the main parameters, the population projections, and the speed of adjustment of eastern Germany. In section 12.5, we explore the generational impacts of alternative fiscal policies. Finally, section 12.6 summa- rizes and concludes the paper.
12.2 Fiscal Policy and Macroeconomic Performance
During the 1980s, West Germany went through a period of steady though not miraculous economic expansion. Real GDP growth topped at a rate of 4 percent in 1989.' This long-lasting economic upswing prior to the unification of East and West Germany in 1990 allowed the Kohl administration to consoli- date government finances substantially. Public expenditures fell from approxi- mately 50 percent of GDP at the beginning of the 1980s to about 45 percent at the end of that decade. During the same period the overall public budget deficit including the deficit of the social insurance system shrank from its initial level of 3.3 percent of GDP until in 1989 the public sector realized a small surplus. As a consequence, the debt-to-GDP ratio rose more slowly after 1980 and eventually started to fall as well. All this was achieved despite a relatively high unemployment rate of 8 percent and above. Overall, West Germany seemed to be well prepared at the eve of unification since inflation was low due to a credible anti-inflationary policy; the overall public budget was balanced, tax burdens had been lowered considerably during the 1980s, and national saving rates continued to be high.
The opposite was true for the then still independent East German state. De- spite the economic progress reflected in the socialist government's official sta- tistics, problems of the Soviet-style command economy were aggravated dur- ing the 1980s. Timid and reluctantly introduced changes in the early 1980s returned some economic freedom to firms but failed to induce higher efficiency because price controls were still maintained. Similar inefficiencies arose from the fully controlled labor market with an inflexible wage structure and only minor wage differentiation. Additionally, the attempt to catch up with emerg- ing western high-tech industries failed and the concentration of investment in
I . If not indicated otherwise, the statistical figures are taken from Council of Economic Advisors (Sachverstandigenrat 1995, 1996).

279 Unification and Aging in Germany: Who Pays and When?
those capital-intensive areas worsened the already severe deterioration of the eastern capital stock in other industries. Most notably, the stock of the con- sumer durables industry (including housing) as well as the public infrastruc- ture suffered from general capital consumption. Moreover, significant parts of industrial capital became obsolescent because the East German economy was not subject to international competition through trade. In 1989 mounting eco- nomic and social pressure ignited political change in Eastern Europe that even- tually resulted in the opening of the Berlin Wall and the first free elections in the former GDR. These events were quickly followed by economic and mone- tary union between the two German states, and official unification in October 1990.* Two stylized facts most accurately illustrate the initial economic differ- ences between the two newly unified states. First, labor productivity as well as per capita GDP in the East amounted to only one-third of the western level. Second, the per capita endowment with industrial capital and public infrastruc- ture corresponded to less than 50 percent of that in West Germany. Industrial capital was mostly outdated, and considerable parts of housing and public in- frastructure were in bad shape. As a result, the standard of living in East Ger- many lagged far behind that in West Germany.
Additionally, monetary policy caused a severe adjustment shock for the east- ern economy. When both countries agreed on economic, monetary, and social union in July 1990, East Germany adopted the deutsche mark and converted wages and prices at par. As a result the former state-owned firms were over- loaded since eastern output prices collapsed and input costs skyrocketed. In fact, many firms did not survive, which caused a transitory drop of full- employment labor productivity to 22 percent of the western level in the begin- ning of 1991. One year later, both full-employment labor productivity and per capita output caught up with the preunification level. Presently, they reach about 50 percent of those in the West. Despite the economic depression, though, real wages more than doubled from about one-third of the western level in 1990 to around 70 percent of western wages in 1996.
Not surprisingly this wedge between the full-employment marginal product and the actual costs of labor induced massive unemployment. According to the official rates, registered unemployment first increased to a maximum of 15.9 percent of the civilian workforce in 1993 and has decreased slightly since then. However, the eastern numbers do not accurately reflect reality because hidden unemployment exists. If workers participating in retraining and labor creation programs, short-time employees, and early retirees were considered in addition to the officially unemployed, the 1992 unemployment rate would reach 36.7 percent. In 1996, this figure is expected to be around 23 percent. This drop in hidden unemployment can mostly be attributed to the reduced labor force participation rates of women and elderly workers as well as migration and
2. A more detailed analysis of the macroeconomic effects of German unification can be found in Siebert (1991), Sinn and Sinn (1992), and Raffelhiischen (1994).

280 Bernd Raffelhuschen and Jan Walliser
Table 12.1 West-East lkansfer, Additional Public Receipts, and Public Debt in lkansition (billions of U.S. dollars)
1991 1992 1993 1994 I995
Net transfers Total 73.9 91.6 95.0 91.5 112.6 Percentage of western GDP 3.8 4.5 4.6 4.2 5.0
Total 840.7 921.4 957.5 1,015.2 1,054.7 Percentage of total GDP 42.1 42.8 43.4 43.7 43.6
Total tax revenue
Public debt Total 820.9 940.7 1,055.4 1,162.3 1,394.8 Percentage of total GDP 41.1 43.7 47.8 50.1 57.7
Sources: Council of Economic Advisors (Sachverstihdigenrat 1995, 1996); Deutsche Bundesbank (recent issues).
commuting to the West since the growth of East German employment has been sluggish. During the same period, western unemployment reached a long-term minimum at a rate of 6.6 percent in 1992, but it has risen dramatically after- ward to a level of almost 10 percent.
Given that relatively generous West German social insurance programs were extended immediately to the East in 1990 it is not surprising that seven years after unification, unification-related burdens are still at the heart of the fiscal debate. The assistance provided includes benefits for the unemployed, social se- curity payments for old and early-retiring workers who never contributed to the West German social security program, income support for employees par- ticipating in active labor market programs, welfare for the needy, and other smaller programs. Furthermore, direct investments in public infrastructure and private investment subsidies are part of a long-term fiscal strategy aimed at triggering high growth in the East. Since the latter would reduce the size of transfers and increase tax revenues, public investment and investment tax cred- its could be partly self-financing. Currently, however, per capita tax revenues in the East are less than 40 percent of the western figures. Thus, for the time being, public expenditures for East Germany must largely be financed by West German taxpayers and through deficits.
Table 12.1 shows the overall fiscal implications of the German unification between 1991 and 1995. During these years, net public transfers increased from $73.9 to $112.6 b i l l i~n .~ Net transfers are predicted to stay at a level of approximately 5 percent of western GDP in the medium-term future. As a rule of thumb, about two-thirds of these annual transfers represent income support, one-fourth is spent on public investment, and the remainder provides for sub- stantial investment subsidies (Brocker and Raffelhuschen 1997). As table 12.1 also indicates, transfers were only partly financed through increases in taxes. In particular, most additional revenues were collected through (1) the introduc-
3. Throughout the analysis we apply the average 1995 exchange rate of DM 1.43 per dollar.

281 Unification and Aging in Germany: Who Pays and When?
tion of an income tax surcharge in July 1992, which was suspended between July 1993 and January 1995, (2) higher value-added taxes, (3) a significant increase in receipts from gasoline and insurance taxes, and (4) higher contribu- tions to unemployment insurance and social security. According to the official statistics, total taxes as a percentage of total GDP only rose from 42.1 percent in 1991 to 43.6 percent in 1995. Note that eastern GDP accounts for approxi- mately 12 percent of the western figure. Although it is difficult to attribute the revenue increase to the various sources, table 12.1 indicates that unification- related tax increases account for only a small part of the required transfers. As a consequence of insufficient additional revenues, the deficits of the public sector increased sharply. Furthermore, public debt was pushed up by the debt of the former East German state and the privatization of former state-owned in- dustrial conglomerates. Altogether, the debt-to-GDP ratio rose from 41.1 per- cent in 1991 to 57.7 percent in 1995.
In addition to unification-related fiscal burdens the German welfare system will suffer from a pronounced aging of the population. For more than 20 years, in both East and West, the fertility rate has been below the replacement value. Presently, the West German gross fertility rate is as low as 1.4. In the East, the number has declined even further to 0.9 after unification. Hence, according to official projections (Sommer 1994), the elderly dependency ratio-measured as the number of individuals aged 65 or older per number of individuals aged 18-64-will rise from 22.9 percent in 1995 to 47.7 percent in 2040. The aging process will have severe implications on three branches of the social security system, that is, the pension system, the health insurance system, and the re- cently introduced system of long-term care insurance. All of these are financed via pay-as-you-go (paygo) schemes and are fairly generous at the moment. For example, the pension system provides for a net replacement rate that exceeds 70 percent for an average production worker, and the average initial retirement age is approximately 60 years for females and slightly higher for males. If this generosity is to be maintained despite the demographic transition, payroll taxes will rise from 18.6 percent of gross income in 1995 to over 35 percent in 2035 (Boll, Raffelhuschen, and Walliser 1994,94). Similar increases in contribution rates will be necessary for long-term care insurance and health insurance.
The German government responded to the demographic pressure in 1992 by reducing the incentives for early retirement and lowering the replacement rate for future generations. More recently, the payroll tax rate was increased to 19.2 percent in 1996 and 20.3 percent in 1997. Additionally, expenditure ceilings have been imposed on suppliers of health care. But these reforms are not suffi- cient to guarantee the financial sustainability of the paygo scheme.
12.3 Data Description
As outlined in chapter 2 of this volume we require (1) a population projec- tion, (2) projections of average net taxes by age and sex, (3) an estimate of government net wealth, (4) a discount rate, and ( 5 ) a projection of government

282 Bernd Raffelhiischen and Jan Walker
Receipts Expenditures
Labor income taxes Capital income taxes Seigniorage Value-added tax Excise taxes Gasoline tax Insurance tax Vehicle tax Other taxes Social security Health insurance Unemployment insurance Long-term care insurance Accident insurance Other revenues
Total
Deficit
242.4 68.5 4.9
164.1 23.3 45.4
9.9 9.7 6.4
185.3 115.8 61.8 10.5 13.7 64.8
1,026.4
111.8
Social security Health insurance Unemployment insurance Long-term care insurance Accident insurance Maternity assistance Welfare benefits Housing benefits Youth support Child allowances Net investment Education (without investment) Subsidies Interest payments Government consumption
Total
243.7 157.8 43.0 4.7
12.2 5.1
13.0 4.0
17.4 14.4 42.7 77.6 52.1 90.7
359.2
1,138.2
Sources: Statistisches Bundesamt (l996a. 1996b); Ministry of Finance (Bundesministerium fur Finanzen 1996); Ministry of Labor and Social Affairs (Bundesministerium fur Arbeit und Sozial- ordnung 1996a); Commission of Federal and State Governments (Bund-Lander-Kommission 1996).
purchases. In order to correctly reflect differences in net remaining lifetime payments between the eastern and western parts of Germany we perform gen- erational accounting separately for the two parts of Germany. This requires region-specific projections of the population and of average future tax and transfer payments.
Our demographic projection takes the 1994 population as a starting point. We then closely follow the official baseline projections of the German Bureau of the Census (Sommer 1994) up to the year 2030. In particular, the western gross fertility rate is held constant at its 1994 value of 1.39; the eastern rate linearly increases from an initial value of 0.77 to the western figure until year 2005. Holding this fertility rate constant beyond the year 2030 would result in a continuously shrinking population. Since we consider such an outcome to be unrealistic we assume that fertility rates increase linearly in both regions be- tween 2030 and 2070 and remain stationary at their 2070 levels thereafter. This results in a stationary population of 54 million from 2120 onward. With respect to mortality, we assume in line with the official estimates that life expectancy at birth of males (females) increases from 73.2 (79.6) years in 1994 to 74.7 (81 .l) years in 2000 and remains constant thereafter. Net immigration de- creases from 420,000 in 1994 to 200,000 in 2010 and all following years; im- migration of ethnic Germans from Eastern Europe is phased out until the year 2010.
Table 12.2 quantifies the budget of the overall public sector, that is, federal,

283 Unification and Aging in Germany: Who Pays and When?
state, and local governments, and the social insurance system. Although the numbers of our base year 1995 are drawn from official statistics, some of them are not directly comparable to published statistics due to substantial correc- tions for intergovernmental or interadministrative payments. Additionally, we generally attribute administrative costs and other non-insurance-related expen- ditures of the social insurance system to government consumption. Aggregate revenues include taxes on labor income, taxes on capital income, value-added tax, gasoline tax, insurance tax, vehicle tax, and other excise taxes, as well as seigniorage and social insurance payroll taxes.4 Transfers include payments of the various branches of social insurance,* welfare benefits, and housing, child, and maternity support payments. Additionally, we calculate educational trans- fer spending for public kindergartens, schools, and universities. All revenue and expenditure projections take enacted and planned changes into account. In particular, our numbers reflect a 2 percentage point reduction in the solidarity surcharge tax in 1998, the removal of the wealth tax in 1997, the phasing in of long-term care insurance with concomitant reductions in general welfare spend- ing, the increase of the social security payroll tax in 1997, and increases in retirement age after the year 2000.
Aggregate taxes and transfers are distributed by age and sex in accordance with region-specific relative age-sex profiles. These profiles are retrieved from two microdata surveys, the German Socio-Economic Panel (SOEP) and the Consumer Expenditure Survey. Furthermore, health care spending is distrib- uted according to special health insurance data (Bundesministerium fur Arbeit und Sozialordnung 1996b). Finally, education age-sex profiles are estimated from both the SOEP data and the Commission of Federal and State Govern- ments (Bund-Lander-Kommission 1996). Except for the above-mentioned en- acted adjustments in revenues and expenditures we assume that 1995 per cap- ita taxes and transfers increase with the rate of productivity growth.
The calculation of government net wealth starts with the official debt of the public sector including all off-budget funds, which are the German Unity Fund, the Unification Debt Fund, the European Recovery Program, and pub- licly owned railway companies (Deutsche Bundesbank, recent issues). From the entire net financial debt of $1,394.8 billion in 1995, we attribute to East Germany $436.26 billion, which predominantly reflects unification-related special debt funds.'j
4. The aggregate for labor income taxes includes taxes on wages, salary payments, and imputed labor income taxes of the self-employed. For the self-employed, the residual represents capital income taxes. Capital income taxes also include corporate taxes, local business taxes on capital, and various minor taxes on wealth and property. Excise taxes include those indirect taxes not included elsewhere and comprise tobacco taxes and a range of special taxes on commodities.
5. In 1995, the government started to phase in long-term health care insurance. Due to specific arrangements upon introduction, that social insurance realized a surplus (see table 12.2) in our base year. Starting in 1996, we assume that expenditures catch up with growth-adjusted revenues so that the system operates on a pure paygo basis.
6. The division of debt is necessary only for our calculation of hypothetical West German ac- counts and does therefore not affect the results for unified Germany.

284 Bernd Raffelhuschen and Jan Walliser
In calculating government consumption we subtracted transfers, other reve- nues net of subsidies, net investment (without education), educational expendi- tures, and interest payments from the sum of total expenditures. In 1995 gov- ernment spending on goods and services amounted to $359.2 billion (see table 12.2). Note that both our residual method and the exclusion of educational services and investment purchases imply that the figure is not directly compa- rable with the official statistics and should more accurately be labeled “non- age-specific government expenditures.” Future government consumption as well as future net investment and other revenues net of subsidies are projected by assuming that per capita spending and receipts grow at a prespecified rate of economic growth after 1995.’ All future receipts and payments are dis- counted to the base year 1995 using an interest rate of 5 percent in the baseline calculations, while annual productivity growth is assumed to be 1.5 percent. Those figures approximate the long-run interest rate as well as productivity growth in West Germany during the past two decades.
Capital income taxes receive special treatment since tax-favored investment implies a higher tax burden on old capital relative to new capital. Ultimately, the current owners of assets bear the burden of the tax due to the drop in the market value of old capital. We estimate this tax burden to be equal to 18.5 percent of the value of private western physical capital and impose this amount as a one-time tax on living western generations. Our calculation utilizes empir- ical findings on German capital taxation by Leibfritz (1993). Moreover, the flow of capital income taxes is also adjusted, since the current flow overstates the burden on future generations due to the difference between the marginal tax rate on new capital and the observable average tax rate over both old and new capital. With the tax burden of existing capital attributed to living genera- tions, future generations are only affected by the marginal tax rate (Auerbach et al. 1991). Owing to high marginal tax rates we estimate a 36 percent down- ward revision of the flow of western capital income taxes.*
12.4 Basic Findings
12.4.1 Baseline Results
For a proper estimate of the intergenerational stance of fiscal policy in Ger- many we need to address the issues arising from the ongoing convergence pro- cess between the eastern and western parts. So far, the immediate adjustment
7. We assume identical per capita government consumption in East and West Germany. How- ever, this is only of importance for our calculation of separate West German accounts.
8. We refrain from similar explicit capital income tax adjustments for the relatively small eastern capital stock. Nevertheless, since we assume that the flow of eastern capital income tax payments will adjust to western levels in the future, they include a correction for the difference between marginal and average tax rates, as for the West. Overall, the adjustments happen to have only minor effects on the results in the German case.

285 Unification and Aging in Germany: Who Pays and When?
of East German social entitlements to western standards stands in sharp con- trast to the slow economic catching-up process. As outlined above, eastern resi- dents’ per capita taxes are currently lower than in the West, whereas a number of transfers, specifically unemployment benefits and female social security benefits, exceed western levels on a per capita basis. Upon successful transfor- mation, they may eventually converge toward western levels as eastern per capita income and consumption expenditures approach those of western resi- dents. Whether and when this will occur is uncertain.
As a reference point, we assume full convergence by the year 2010; that is, eastern tax payments and transfer receipts are assumed to increase or decrease uniformly such that equality with western per capita values is achieved within a period of 15 years. This optimistic viewpoint, which is in line with the results by Burda and Funke (1995) and Brocker and Raffelhiischen (1997), will be subject to further sensitivity analysis. In accordance with recent legislation, the surcharge of 7.5 percent on income tax owed is reduced by 2 percentage points in 1998 and removed after the year 2010 in the baseline simulations because the surcharge was originally intended to be eliminated upon completion of the transition.
Panel A of table 12.3 reports the generational accounts for cohorts between ages 0 and 90 in the base year 1995. Moreover, it shows the future net payments of representative male and female German generations under baseline assump- tions. All columns reveal a typical life cycle pattern; that is, young generations face positive net payments to the government over their remaining life cycle while older generations are net recipients. In particular, currently newborn in- dividuals pay $97,100. Due to both negative net payments during childhood and the discounting of future tax payments, the accounts first increase with age. They reach a maximum value of $313,600 at age 20 when the cohort enters the labor force and decrease over the years of active labor market partici- pation. At age 50, accounts turn negative since the present value of gross pay- ments falls short of the present value of benefits received over the remaining life cycle. As individuals approach retirement, the relative weight of future pensions and old-age services increases and the generational accounts further decrease until they reach a minimum at age 65. At this age, the remaining future benefits net of tax payments amount to $206,700. Clearly, with higher ages, the negative values decrease due to a decrease of the remaining life span.
As also shown in table 12.3, the future age-specific net payments of male and female agents display a similar life cycle pattern as those for men and women combined. However, due to both a comparatively low labor force par- ticipation rate and substantial gender-specific redistribution via all branches of the social insurance system, female net payments are at most half of the respec- tive male net payments while the accounts during old age range only slightly below those of males.
Future generations are left with a growth-adjusted payment of $248,800, which exceeds the payment of current newborns by 156.1 percent if our (fairly

Table 12.3 Generational Accounts of Current and Future Generations (thousands of U.S. dollars)
Generation’s Age in 1995 Average Male Female
A. Baseline 0 97.1 155.2 36.0 5 123.6 190.3 53.6
10 179.0 257.8 95.9 15 252.2 345.8 153.3 20 313.6 422.4 199.3 25 303.4 416.4 181.8 30 271.8 382.9 151.1 35 224.4 318.4 124.0 40 160.1 234.4 82.8 45 94.0 147.4 38.5 50 -4.2 26.3 -35.4 55 -98.9 -96.3 -101.5 60 - 183.6 -212.4 - 155.5 65 -206.7 -245.8 -171.9 70 - 180.7 -216.0 - 160.3 75 - 150.2 - 178.4 - 136.0 80 - 109.6 - 133.6 -99.3 85 -68.0 -86.2 -61.6 90 -3.2 - 10.8 -0.8
Future generations 248.8 397.9 92.3 Percentage difference 156.1 156.4 156.4
B. Baseline, Educarion Included in Government Consumption 0 165.0 224.3 102.5 5 194.3 262.4 122.8
10 233.8 314.2 149.0 15 287.9 383.2 187.4 20 333.6 445.1 216.5 25 309.7 425.1 185.5 30 271.8 383.0 151.2 35 224.4 318.4 124.0 40 160.1 234.4 82.8 45 94.0 147.4 38.5 50 -4.2 26.3 -35.4 55 -98.9 -96.3 -101.5 60 -183.6 -212.4 - 155.5 65 -206.7 -245.8 -171.9 70 - 180.7 -216.0 - 160.3 75 - 150.2 - 178.4 - 136.0 80 - 109.6 - 133.6 -99.3 85 -68.0 -86.2 -61.6 90 -3.2 - 10.8 -0.8
Future generations 316.8 430.9 197.0 Percentage difference 92.0 92.2 92.2

287 Unification and Aging in Germany: Who Pays and When?
optimistic) baseline representation of German fiscal policy is correct. Despite the increases in revenues related to unification (see table 12. l), there is, in fact, a severe generational imbalance to the disadvantage of future generations. The imbalance can alternatively be expressed as the ratio of present value of net tax payments to present value of lifetime labor income. According to our findings, current newborns’ net tax payments will account for 21.3 percent of their life- time labor income. The respective gender-specific rates are 24.9 and 12.9 per- cent for males and females. Future generations will face a 156 percent higher burden, which translates into a net lifetime tax rate of 54.5 percent.
Panel B of table 12.3 shows the generational accounts under the assumption that educational expenditures are not distributed to the respective age groups but included in government consumption. Earlier studies built on this approach due to the lack of appropriate data, so we report the corresponding results in order to make our findings comparable to earlier results (see Gokhale, Raffel- hiischen, and Walliser 1995). Including education in government consumption increases the present value of net payments of newborn and future generations by the same amount. This is due to the fact that the present value of future government consumption increases by the same amount as the sum of net taxes paid by currently living generations when education is no longer treated as a transfer. The described change in accounting methodology reduces the gener- ational imbalance to 92.0 percent. Note that educational transfers are only geared toward agents below age 30. Thus the generational accounts of older agents are unchanged. Without accounting for educational transfers net tax rates of current newborn and future generations are, of course, significantly higher. In particular, those born in the base year will face a rate of 36.3 percent, while future generations will experience a rate of nearly 70 percent.
Table 12.4 decomposes generational accounts into the specific tax payments and transfer receipts. All components add up to the net payments found in the “average” column in panel A of table 12.3. Note that progressive labor income taxes and the proportional contributions to all social insurance tend to be con- centrated on agents, predominantly males, between ages 25 and 65. Other taxes, specifically value-added taxes and excise taxes, are much more equally spread over the life cycle. Social security benefits on the other hand are paid mostly after age 60, and health insurance benefits also are larger for retirees. In contrast, unemployment benefits are targeted toward working-age agents, and general welfare payments support poor families, especially with children, as well as the elderly poor. Youth and maternity assistance are clearly most prominent at childbearing ages and below. The “education” column in table 12.4 reveals the important impact of the assumptions concerning the treatment of educational expenditures. Including education in government consumption would allocate the benefits more or less equally over the cohorts while, in fact, the incidence falls heavily on the young.
Which factors contribute to the intergenerational imbalance? To some extent

Table 12.4 Composition of Generational Accounts: Present Value of Payments and Receipts (thousands of U.S. dollars)
Tax Payments
Labor Capital Value- Excise Generation’s Income Income Added Taxes and Social Age in 1995 Taxes Taxes Seigniorage Tax Others Insuranc’
0 5
10 15 20 25 30 35 40 45 50 55 60 65 70 75 80 85 90
69.6 11.9 79.4 13.6 93.3 15.8
108.5 28.7 125.2 34.6 123.5 29.1 113.9 30.0 102.0 31.3 85.4 30.5 66.9 38.7 42.8 30.0 20.2 25.8
5.9 21.6 0.7 18.5 0 18.5 0 16.2 0 16.7 0 14.6 0 14.9
1.3 1.5 1.8 2.1 2.1 1.9 1.9 1.8 1.7 1.5 1.3 1.1 0.9 0.8 0.6 0.5 0.4 0.2 0.1
65.8 65.2 66.7 67.9 69.7 64.5 60.2 57.8 55.0 51.6 46.1 39.8 33.6 27.4 21.4 15.5 10.9 6.5 1.5
26.0 29.6 34.5 39.8 44.6 41.4 37.8 33.9 29.5 25.4 20.9 16.6 12.1 9.4 6.7 4.6 3.1 1.8 0.4
115.7 132.0 154.8 180.6 205.7 198.1 183.5 164.1 138.8 109.5 75.5 41 .O 12.5
1.5 0.1 0 0 0 0
Transfer Receipts
Social Security
and Youth Generation’s Accident Health Unemployment General and Age in 1995 Insurance Insurance Insurance Welfare Maternity Educatio
0 5
10 15 20 25 30 35 40 45 50 55 60 65 70 75 80 85 90
34.5 39.1 46.0 53.9 63.6 69.5 79.2 92.1
106.8 124.9 146.2 170.0 199.1 195.6 161.1 126.5 90.0 55.6 13.1
47.0 46.1 49.7 53.6 57.5 56.8 57.5 59.2 60.8 62.8 64.0 64.7 65.7 65.5 62.9 57.1 47.9 33.9 6.6
8.4 9.5
11.3 13.9 16.5 14.6 13.1 11.2 9.5 8.4 7.2 5.0 2.1 0 0 0 0 0 0
7.6 6.5 5.8 5.2 5.0 4.5 4.1 3.8 3.6 3.4 3.5 3.7 3.9 3.9 4.1 3.5 2.7 1.8 0.4
27.9 25.8 20.2 13.1 5.8 3.3 I .4 0.5 0.1 0 0 0 0 0 0 0 0 0 0
67.8 70.7 54.8 35.8 20.0 6.3 0.1 0 0 0 0 0 0 0 0 0 0 0 0
Note: Productivity growth assumed to be 1.5 percent; discount rate, 5 percent.
289 Unification and Aging in Germany: Who Pays and When?
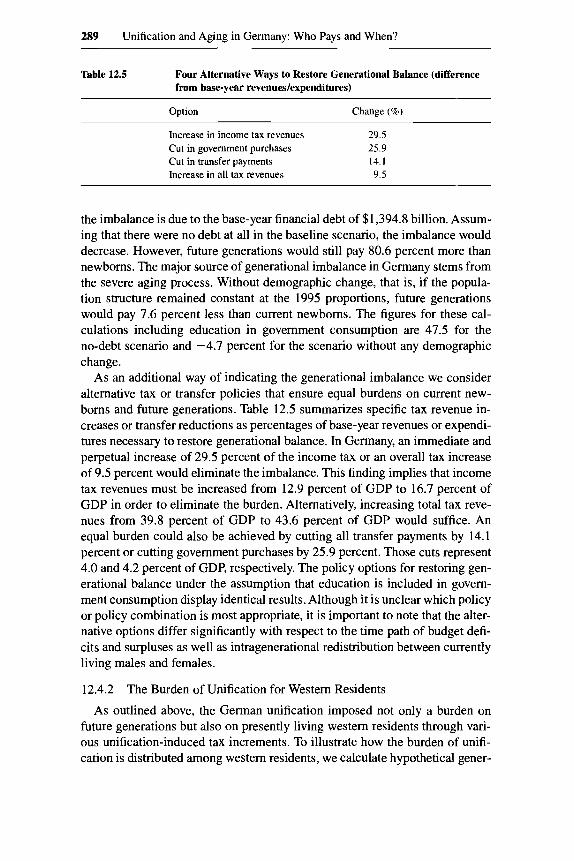
Table 12.5 Four Alternative Ways to Restore Generational Balance (difference from base-year revenues/expenditures)
Option Change (%)
Increase in income tax revenues 29.5 Cut in government purchases 25.9 Cut in transfer payments 14.1 Increase in all tax revenues 9.5
the imbalance is due to the base-year financial debt of $1,394.8 billion. Assum- ing that there were no debt at all in the baseline scenario, the imbalance would decrease. However, future generations would still pay 80.6 percent more than newborns. The major source of generational imbalance in Germany stems from the severe aging process. Without demographic change, that is, if the popula- tion structure remained constant at the 1995 proportions, future generations would pay 7.6 percent less than current newborns. The figures for these cal- culations including education in government consumption are 47.5 for the no-debt scenario and -4.7 percent for the scenario without any demographic change.
As an additional way of indicating the generational imbalance we consider alternative tax or transfer policies that ensure equal burdens on current new- borns and future generations. Table 12.5 summarizes specific tax revenue in- creases or transfer reductions as percentages of base-year revenues or expendi- tures necessary to restore generational balance. In Germany, an immediate and perpetual increase of 29.5 percent of the income tax or an overall tax increase of 9.5 percent would eliminate the imbalance. This finding implies that income tax revenues must be increased from 12.9 percent of GDP to 16.7 percent of GDP in order to eliminate the burden. Alternatively, increasing total tax reve- nues from 39.8 percent of GDP to 43.6 percent of GDP would suffice. An equal burden could also be achieved by cutting all transfer payments by 14.1 percent or cutting government purchases by 25.9 percent. Those cuts represent 4.0 and 4.2 percent of GDP, respectively. The policy options for restoring gen- erational balance under the assumption that education is included in govern- ment consumption display identical results. Although it is unclear which policy or policy combination is most appropriate, it is important to note that the alter- native options differ significantly with respect to the time path of budget defi- cits and surpluses as well as intragenerational redistribution between currently living males and females.
12.4.2
As outlined above, the German unification imposed not only a burden on future generations but also on presently living western residents through vari- ous unification-induced tax increments. To illustrate how the burden of unifi- cation is distributed among western residents, we calculate hypothetical gener-
The Burden of Unification for Western Residents

290 Bernd Raffelhiischen and Jan Walliser
ational accounts for the West under a scenario where no unification-related tax or contribution increases are imposed on western resident^.^ Moreover, in this scenario government spending on goods and services excludes spending on the eastern region. The “without taxes” columns in table 12.6 show the net pay- ment burdens for western residents under baseline assumptions but without unification-related tax hikes. The table also exhibits the generational accounts of western residents including these tax payments as well as the differences between the two cases. The age- and gender-specific differences indicate the changes in western net payments due to unification. Western residents of all ages will share in the burden of unification, but the burdens on those aged 55 or younger are especially large. On average, the percentage increase in burden of male and female retirees is only one-tenth of the respective figure for west- ern residents aged 55 or younger. It is clear from table 12.6 that in comparison to males, females contribute generally less in absolute but always significantly more in relative terms.
The reason for this distribution of the additional burden is straightforward. Most of the additional net payment burdens arise from proportional social in- surance taxes and indirect taxes for both male and female western generations, while revenues from the progressive solidarity surcharge tax range third. More- over, the surcharge will be phased out by 2010, which lowers its impact on future direct tax burdens. Indirect tax payments are much more evenly spread over the life cycle and the two sexes. Therefore, the additional tax load of the elderly is almost entirely paid via indirect taxes. To conclude, contributors to social insurance and females contribute more than proportionally to the burden of unification if the preunification tax system serves as a reference.
Our calculations show two effects of unification on the intertemporal redis- tribution: If we exclude East Germany and all unification-related taxes as de- fined earlier, the resulting intergenerational redistribution in West Germany would be 229 percent, which is larger than the intergenerational redistribution in unified Germany. However, had West Germany raised unification-related taxes without having to finance unification, redistribution would only be 81 percent. This implies that (a) perpetually raising unification-related taxes fi- nances more than the transition of the East, assuming that the transition is completed in year 2010; and (b) taking the tax hikes after unification as given, the additional burden of financing the East German transition is about as large as total current debt; that is, if debt were zero the burden of future generations in unified Germany would be approximately as large as the burden of future western residents without unification. Note, however, that this does not imply 50 percent of the current imbalance should be attributed to unification since unification caused both higher spending and higher revenues and these effects cannot be separated.
9. The method of decomposing generational accounts with respect to residence was first em- ployed by Gokhale et al. (1995).

Table 12.6 Burden of Unification on Western Residents ~~
Male Net Payments Female Net Payments
Generation's Without With Male Percentage Without With Female Percentage Age in 1995 Taxes Taxes Burden Increasea Taxes Taxes Burden Increase"
0 5
10 15 20 25 30 35 40 45 50 55 60 65 70 75 80 85 90
133.6 170.3 273.3 331.7 404.9 397.2 370.6 312.4 234.6 150.4 33.3
-91.4 -215.5 -247.0 -215.1 - 177.4 - 132.6 - 84.6
-8.3
155.5 195.4 267. I 367.4 446.5 438.2 409.8 349.0 267.2 177.8 54.2
-78.0 -208.6 -243.4 -212.7 - 175.8 -131.5 -83.8 -8.1
21.9 25.1 29.8 35.7 41.6 41.0 39.2 36.6 32.6 21.4 20.9 13.4 6.9 3.6 2.4 1.6 1.1 0.8 0.2
14.1 12.9 11.2 9.7 9.3 9.4 9.6
10.5 12.2 15.4 38.6 17.2 3.3 1.5 1.1 0.9 0.8 1 .o 2.8
21.9 39.2 80.6
145.2 189.8 169.0 139.4 115.4 78.1 36.9
-35.1 -95.6 - 145.0 - 160.4 -151.6 - 128.3 -91.7 -55.1
3.1
36.9 56.3
100.8 168.9 216.4 193.5 161.7 136.2 96.8 52.5
-23.3 -87.4 - 139.6 - 156.6 - 148.9 - 126.3 -90.3 -54.3
3.3
15.0 17.1 20.2 23.7 26.6 24.5 22.3 20.8 18.7 15.6 11.8 8.2 5.4 3.8 2.7 2.0 1.4 0.8 0.2
40.7 30.4 20.0 14.0 12.3 12.7 13.8 15.3 19.3 29.7 50.6 9.4 3.9 2.4 1.8 1.6 1.6 1.5 6.1
Nore: Productivity growth assumed to be 1.5 percent; discount rate, 5 percent. "Refers to increase in burden or decrease in receipts relative to the level without taxes.
292 Bernd Raffelhiischen and Jan Walker
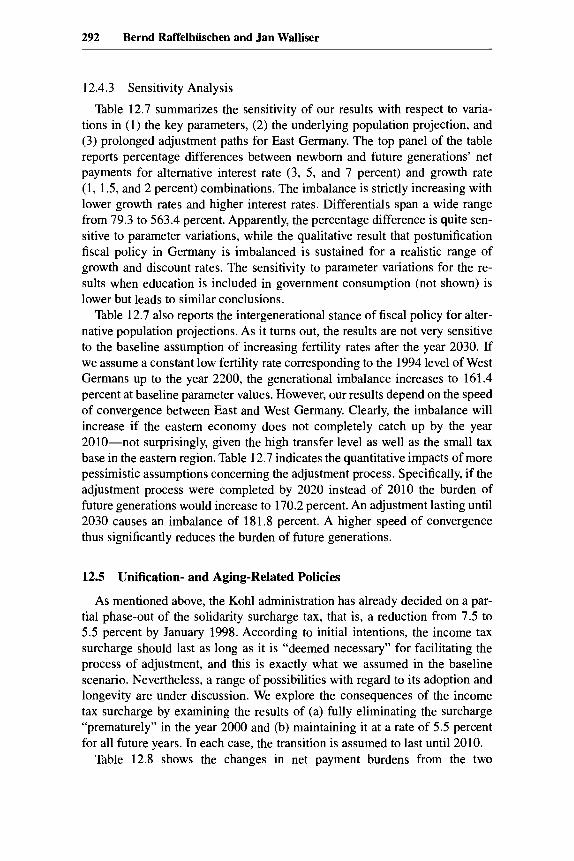
12.4.3 Sensitivity Analysis
Table 12.7 summarizes the sensitivity of our results with respect to varia- tions in (1) the key parameters, (2) the underlying population projection, and (3) prolonged adjustment paths for East Germany. The top panel of the table reports percentage differences between newborn and future generations’ net payments for alternative interest rate (3, 5, and 7 percent) and growth rate (1, 1.5, and 2 percent) combinations. The imbalance is strictly increasing with lower growth rates and higher interest rates. Differentials span a wide range from 79.3 to 563.4 percent. Apparently, the percentage difference is quite sen- sitive to parameter variations, while the qualitative result that postunification fiscal policy in Germany is imbalanced is sustained for a realistic range of growth and discount rates. The sensitivity to parameter variations for the re- sults when education is included in government consumption (not shown) is lower but leads to similar conclusions.
Table 12.7 also reports the intergenerational stance of fiscal policy for alter- native population projections. As it turns out, the results are not very sensitive to the baseline assumption of increasing fertility rates after the year 2030. If we assume a constant low fertility rate corresponding to the 1994 level of West Germans up to the year 2200, the generational imbalance increases to 161.4 percent at baseline parameter values. However, our results depend on the speed of convergence between East and West Germany. Clearly, the imbalance will increase if the eastern economy does not completely catch up by the year 2010-not surprisingly, given the high transfer level as well as the small tax base in the eastern region. Table 12.7 indicates the quantitative impacts of more pessimistic assumptions concerning the adjustment process. Specifically, if the adjustment process were completed by 2020 instead of 2010 the burden of future generations would increase to 170.2 percent. An adjustment lasting until 2030 causes an imbalance of 181.8 percent. A higher speed of convergence thus significantly reduces the burden of future generations.
12.5 Unification- and Aging-Related Policies
As mentioned above, the Kohl administration has already decided on a par- tial phase-out of the solidarity surcharge tax, that is, a reduction from 7.5 to 5.5 percent by January 1998. According to initial intentions, the income tax surcharge should last as long as it is “deemed necessary” for facilitating the process of adjustment, and this is exactly what we assumed in the baseline scenario. Nevertheless, a range of possibilities with regard to its adoption and longevity are under discussion. We explore the consequences of the income tax surcharge by examining the results of (a) fully eliminating the surcharge “prematurely” in the year 2000 and (b) maintaining it at a rate of 5.5 percent for all future years. In each case, the transition is assumed to last until 2010.
Table 12.8 shows the changes in net payment burdens from the two

Table 12.7 Sensitivity Analysis: Generational Imbalance between Current and Future Generations (percent)
g = 1 g = 1.5 g = 2
r = 3 r = 5 r = 7 r = 3 r = 5 r = l r = 3 r = 5 r = l
Generational imbalance 101.9 188.3 563.4 89.9 156.1 387.5 79.3 132.6 288.0
Population Projection Year East Catches Up
Constant Baseline Constant Population Structure Assumptions Fertility (1994) 2010 2020 2030
Generational imbalance -7.6 156.1 161.4 156.1 170.2 181.8
Nore: g is productivity growth (percent); r is discount rate (percent).

294 Bernd Raffelhiischen and Jan Walliser
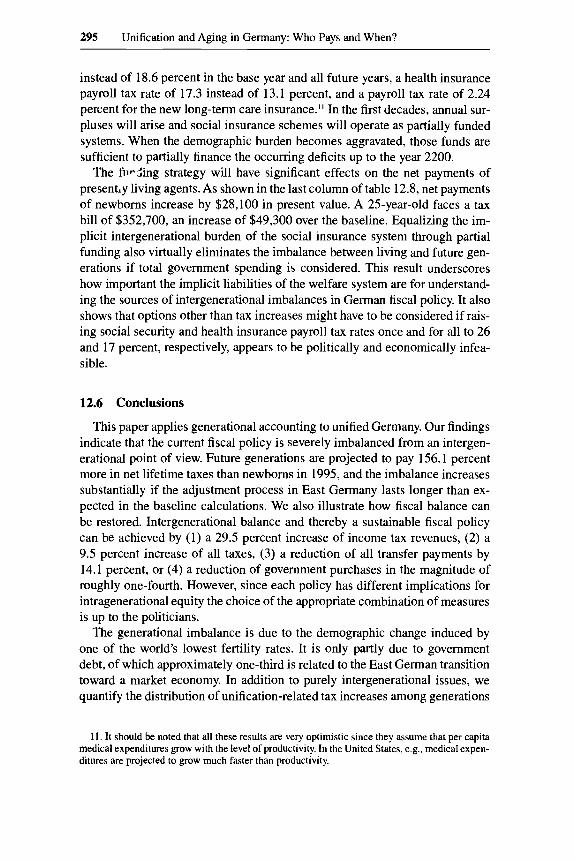
Table 12.8 Generational Accounts for Alternative Surcharge Tax Scenarios and Partial Funding of Social Insurance (thousands of U.S. dollars)
Generation’s Surcharge Surcharge Partial Age in 1995 until 2000 Baseline Maintained Funding
0 5
10 15 20 25 30 35 40 45 50 55 60 65 70 75 80 85 90
Future generations Percentage difference
97.1 123.5 178.3 250.7 311.6 301.3 269.5 222.0 158.0 92.3
-5.1 -99.2 - 183.7 -206.8 - 180.8 - 150.3 -109.6 -68.1 -3.2
253.8 161.3
97.1 123.6 179.0 252.2 313.6 303.4 271.8 224.4 160.1 94.0 -4.2
-98.9 - 183.6 -206.7 - 180.7 - 150.2 - 109.6 -68.0 -3.2
248.8 156.1
101.0 127.9 183.4 256.4 317.4 306.6 274.2 226.0 161.0 94.3 -4.1
-98.8 -183.5 -206.7 - 180.7 - 150.2 - 109.6 -68.0 -3.2
241.4 139.0
125.2 155.7 216.7 296.5 364.5 352.7 317.5 265.4 195.0 121.6 14.9
-88.5 - 180.6 -206.7 - 180.7 - 150.2 - 109.6 -68.0 -3.2
130.8 4.5
experiments relative to the baseline. Fully eliminating the surcharge in the year 2000 reduces net payments of basically all cohorts. This implies a 5.2 percent- age point larger burden of future generations compared to the baseline. In con- trast, permanently maintaining the surcharge imposes losses on living genera- tions amounting, for example, to $2,400 for 30-year-old agents. However, this policy would reduce the generational imbalance of current German fiscal pol- icy in our baseline scenario from 156.1 to 139.0 percent.
As far as the demographic pressure on the paygo-financed social insurance system is concerned, the recent debate about aging-related problems concen- trates on imposing a ceiling for future increases of the contribution rate. How- ever, the discussion is dominated by rather ad hoc fixed upper limits for sup- posedly sustainable rates. We therefore calculate contribution rates for social security, health insurance, and long-term care insurance that equally distribute the implicit demographic burden of social insurance among living and future generations.’O Assuming that federal subsidies as well as transfers from unem- ployment insurance stay fixed, we find that payroll taxes for social security and health and long-term care insurance need to be raised perpetually by 40.2 and 3 1.8 percent, respectively. This implies a social security payroll tax rate of 26.1
10. For a similar exercise for social security only, see Boll et al. (1994).
295 Unification and Aging in Germany: Who Pays and When?
instead of 18.6 percent in the base year and all future years, a health insurance payroll tax rate of 17.3 instead of 13.1 percent, and a payroll tax rate of 2.24 percent for the new long-term care insurance." In the first decades, annual sur- pluses will arise and social insurance schemes will operate as partially funded systems. When the demographic burden becomes aggravated, those funds are sufficient to partially finance the occurring deficits up to the year 2200.
The fil-Zing strategy will have significant effects on the net payments of present,y living agents. As shown in the last column of table 12.8, net payments of newborns increase by $28,100 in present value. A 25-year-old faces a tax bill of $352,700, an increase of $49,300 over the baseline. Equalizing the im- plicit intergenerational burden of the social insurance system through partial funding also virtually eliminates the imbalance between living and future gen- erations if total government spending is considered. This result underscores how important the implicit liabilities of the welfare system are for understand- ing the sources of intergenerational imbalances in German fiscal policy. It also shows that options other than tax increases might have to be considered if rais- ing social security and health insurance payroll tax rates once and for all to 26 and 17 percent, respectively, appears to be politically and economically infea- sible.
12.6 Conclusions
This paper applies generational accounting to unified Germany. Our findings indicate that the current fiscal policy is severely imbalanced from an intergen- erational point of view. Future generations are projected to pay 156.1 percent more in net lifetime taxes than newborns in 1995, and the imbalance increases substantially if the adjustment process in East Germany lasts longer than ex- pected in the baseline calculations. We also illustrate how fiscal balance can be restored. Intergenerational balance and thereby a sustainable fiscal policy can be achieved by (1) a 29.5 percent increase of income tax revenues, (2) a 9.5 percent increase of all taxes, (3) a reduction of all transfer payments by 14.1 percent, or (4) a reduction of government purchases in the magnitude of roughly one-fourth. However, since each policy has different implications for intragenerational equity the choice of the appropriate combination of measures is up to the politicians.
The generational imbalance is due to the demographic change induced by one of the world's lowest fertility rates. It is only partly due to government debt, of which approximately one-third is related to the East German transition toward a market economy. In addition to purely intergenerational issues, we quantify the distribution of unification-related tax increases among generations
1 1 . It should be noted that all these results are very optimistic since they assume that per capita medical expenditures grow with the level of productivity. In the United States, e.g., medical expen- ditures are projected to grow much faster than productivity.

296 Bernd Raffelhiischen and Jan Walliser
in West Germany. We find that unification imposes sizable burdens on future generations but also on young western males and females. The paper finally illustrates the intergenerational impacts of some of the most recent unification- and aging-related policies. From an intergenerational point of view, an early elimination of the income tax surcharge alone would lead to a small increase in the burden of future generations. Moreover, we demonstrate the effects of a partial funding strategy for public health insurance and social security. While balancing intergenerational burdens, this policy would require accumulation of capital over the next two to three decades through a once and for all increase in contribution rates of approximately 13 percent of taxable income.
Continuing on the current spending path without adjusting taxes and trans- fers may cause an exponential increase in the burden of future generations over time. In fact, if another 20 years pass with no changes in policy that address the current imbalance, generations born 20 years from now will already face a 496.6 percent higher lifetime tax burden than newborns.
References
Auerbach, A. J., J. Gokhale, and L. J. Kotlikoff. 1991. Generational accounts: A mean- ingful alternative to deficit accounting. In Tax policy and the economy, vol. 5 , ed. D. Bradford, 55-1 10. Cambridge, Mass.: MIT Press.
. 1992. Generational accounting: A new approach for understanding the effects of fiscal policy on saving. Scandinavian Journal of Economics 94:303-18.
Boll, S., B. Raffelhuschen, and J. Walliser. 1994. Social security and intergenerational redistribution: A generational accounting perspective. Public Choice 81:79-100.
Brocker, J., and B. Raffelhuschen. 1997. Fiscal aspects of German unification: Who is stuck with the bill? Applied Economics Quarterly 45: 139-62.
Bundesministerium fur Arbeit und Sozialordnung. 1996a. Arbeits- und Sozialstatistik: Hauptergebnisse. Bonn: Bundesministerium fur Arbeit und Sozialordnung.
. 1996b. Bundesarbeitsblatt 9A996. Bonn: Bundesministerium fur Arbeit und Sozialordnung.
Bundesministerium fur Finanzen. 1996. Finanzbericht 1997. Bonn: Bundesministerium fur Finanzen.
Bund-Lander-Kommission fur Bildungsplanung und Forschungsforderung. 1996. Aus- gaben der Gebietskorperschaften f i r Bildung und Wissenschaft in den Jahren 1993 (ist), 1994 und 1995 (soll). Bonn: Bund-Lander-Kommission fur Bildungsplanung und Forschungsforderung.
Burda, M., and M. Funke. 1995. Eastern Germany: Can’t we be more optimistic? ZFO- Studien 41:327-54.
Deutsche Bundesbank. Recent issues. Monatsbericht der Deutschen Bundesbank. Frankfurt a.M.
Gokhale, J., B. Raffelhuschen, and J. Walliser. 1995. The burden of German unification: A generational accounting approach. Finanzarchiv 52: 141-65.
Leibfritz, W. 1993. Germany. In Tax reform and the cost of capital: An international comparison, ed. D. W. Jorgenson and R. Landau, 166-90. Washington, D.C.: Brook- ings Institution.

297 Unification and Aging in Germany: Who Pays and When?
Raffelhiischen, B. 1994. Migration in Germany after unification. Kiel: University of
Sachverstandigenrat zur Begutachtung der gesamtwirtschaftlichen Entwicklung. 1995.
. 1996. Reformen voranbringen, Jahresgutuchten 1996/97. Stuttgart: Poeschel. Siebert, H. 1991. German unification: The economics of transition. Economic Policy
Sinn, G., and H.-W. Sinn. 1992. Jumpstart: The economic unijication of Germany. Cam- bridge, Mass.: MIT Press.
Sommer, B. 1994. Entwicklung der Bevolkerung bis 2040: Ergebnis der achten koordi- nierten Bevolkerungsvorausberechnung. Wirtschaji und Stutistik, no. 7: 497-503.
Statistisches Bundesamt. 1996a. Statistisches Juhrbuch. Stuttgart: Poeschel.
Kiel. Mimeograph.
Im Standortwettbewerb, Jahresgutuchten 1995/96. Stuttgart: Poeschel.
2~287-340.
. 1996b. Volkswirtschaftliche Gesumtrechnungen. Fachserie 18, Reihe 1.3, Huuptbericht. Stuttgart: Poeschel.

This Page Intentionally Left Blank