unified communications for maximiser
TRANSCRIPT
Funk and others—A
Quasi-G
lobal Precipitation Time Series for D
rought Monitoring—
Data Series 832
A Quasi-Global Precipitation Time Series for Drought Monitoring
Data Series 832
U.S. Department of the InteriorU.S. Geological Survey

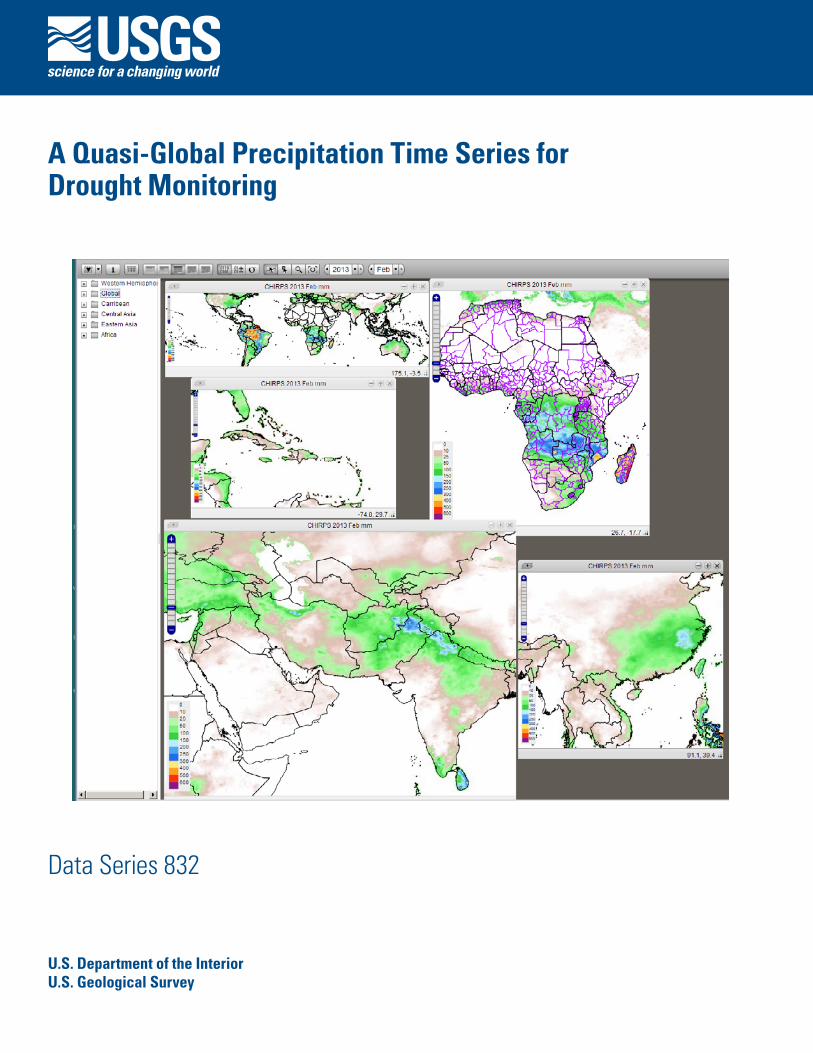
Cover illustration: Screen shot of February 2013 precipitation images in the Early Warning Explorer.
A Quasi-Global Precipitation Time Series for Drought Monitoring
By Chris C. Funk, Pete J. Peterson, Martin F. Landsfeld, Diego H. Pedreros, James P. Verdin, James D. Rowland, Bo E. Romero, Gregory J. Husak, Joel C. Michaelsen, and Andrew P. Verdin
Data Series 832
U.S. Department of the InteriorU.S. Geological Survey
U.S. Department of the InteriorSALLY JEWELL, Secretary
U.S. Geological SurveySuzette M. Kimball, Acting Director
U.S. Geological Survey, Reston, Virginia: 2014
For more information on the USGS—the Federal source for science about the Earth, its natural and living resources, natural hazards, and the environment, visit http://www.usgs.gov or call 1–888–ASK–USGS.
For an overview of USGS information products, including maps, imagery, and publications, visit http://www.usgs.gov/pubprod
To order this and other USGS information products, visit http://store.usgs.gov
Any use of trade, firm, or product names is for descriptive purposes only and does not imply endorsement by the U.S. Government.
Although this information product, for the most part, is in the public domain, it also may contain copyrighted materials as noted in the text. Permission to reproduce copyrighted items must be secured from the copyright owner.
Suggested citation:Funk, C.C., Peterson, P.J., Landsfeld, M.F., Pedreros, D.H., Verdin, J.P., Rowland, J.D., Romero, B.E., Husak, G.J., Michaelsen, J.C., and Verdin, A.P., 2014, A quasi-global precipitation time series for drought monitoring: U.S. Geological Survey Data Series 832, 4 p., http://dx.doi.org/10.3133/ds832.
ISSN 2327-638X (online)
iii
Contents
Abstract ...........................................................................................................................................................1Background.....................................................................................................................................................1Data Inputs to the CHIRPS ...........................................................................................................................1The CHIRPS Procedure .................................................................................................................................2The CHG Station Climatology Database .....................................................................................................2Blending Stations to Produce the CHIRPS ................................................................................................2CHIRPS Availability ........................................................................................................................................3References ......................................................................................................................................................3
iv
Acknowledgments
The Climate Hazards Group InfraRed Precipitation with Stations development process was carried out through U.S. Geological Survey (USGS) cooperative agreement #G09AC000001 “Monitoring and Forecasting Climate, Water and Land Use for Food Production in the Develop-ing World” with funding from: U.S. Agency for International Development Office of Food for Peace, award #AID-FFP-P-10-00002 for “Famine Early Warning Systems Network Support,” the National Aeronautics and Space Administration Applied Sciences Program, Decisions award #NN10AN26I for “A Land Data Assimilation System for Famine Early Warning,” SERVIR award #NNH12AU22I for “A Long Time-Series Indicator of Agricultural Drought for the Greater Horn of Africa,” The National Oceanic and Atmospheric Administration award NA11OAR4310151 for “A Global Standardized Precipitation Index supporting the US Drought Portal and the Famine Early Warning System Network,” and the USGS Land Change Science Program.
A Quasi-Global Precipitation Time Series for Drought Monitoring
By Chris Funk1,2, Pete Peterson2, Martin Landsfeld2, Diego Pedreros1,2, James Verdin1, James Rowland1, Bo Romero2, Gregory Husak2, Joel Michaelsen2, and Andrew Verdin3
AbstractEstimating precipitation variations in space and time is
an important aspect of drought early warning and environmen-tal monitoring. An evolving drier-than-normal season must be placed in historical context so that the severity of rainfall deficits may quickly be evaluated. To this end, scientists at the U.S. Geological Survey Earth Resources Observation and Sci-ence Center, working closely with collaborators at the Univer-sity of California, Santa Barbara Climate Hazards Group, have developed a quasi-global (50°S–50°N, 180°E–180°W), 0.05° resolution, 1981 to near-present gridded precipitation time series: the Climate Hazards Group InfraRed Precipitation with Stations (CHIRPS) data archive.
BackgroundSince 1999, U.S. Geological Survey (USGS) and Univer-
sity of California, Santa Barbara (UCSB) scientists, supported by funding from the U.S. Agency for International Develop-ment (USAID), the National Aeronautics and Space Admin-istration (NASA), and the National Oceanic and Atmospheric Administration (NOAA), have been developing techniques for producing precipitation grids in data sparse regions. Focusing primarily on Africa, this work supported drought monitor-ing efforts by the USAID Famine Early Warning Systems Network (FEWS NET). Early research focused on combining models of terrain-induced precipitation enhancement (Funk and Michaelsen, 2004) with interpolated station data (Funk and others, 2003). These data served a number of early warn-ing objectives. The data supported the creation of standardized precipitation index maps (Husak and others, 2007), making it easier to identify areas experiencing hydrologic extremes; allowed for the improved interpretation of African climate forecasts (Husak and others, 2011); and informed the first USGS/UCSB African drought analyses (Funk and others, 2005; Verdin and others, 2005).
More recently, USGS and UCSB combined new resources of satellite observations, average precipitation from stations, and rainfall predictors such as elevation, latitude, and longitude to build high resolution [0.05 degree, approximately 5 kilometers (km)] global gridded monthly precipitation averages to create the Climate Hazards Precipitation Clima-tology (CHPClim) (Funk and others, 2012). These improved monthly means for the period 1980-2009 were then used to remove systematic bias from monthly satellite-based precipita-tion fields using the ratio of the CHPClim to the satellite-only monthly mean. This bias removal method has been adopted as an effective approach to representing terrain-related precipita-tion effects (Funk and others, 2007). Further processing to blend station observations with these unbiased satellite rainfall estimates was used to produce the 1981 to present Climate Hazards Group InfraRed Precipitation with Stations (CHIRPS) dataset, to support FEWS NET drought monitoring activities (Funk and Verdin, 2010).
Data Inputs to the CHIRPSThe main data sources used in the creation of CHIRPS
were: (1) the monthly precipitation climatology, CHPClim, temporally disaggregated at each grid cell location into 72 pentadal (6-pentads per month) long-term average accumu-lation values, in millimeters—these 72 mean values describe the expected annual sequence of rainfall at each location; (2) quasi-global geostationary thermal infrared (IR) satellite observations from two NOAA sources, the Climate Prediction Center (CPC) IR (0.5 hour temporal resolution, 4 km spatial resolution, for 2000–present) and the National Climatic Data Center (NCDC) B1 IR (3 hour temporal resolution, 8 km spatial resolution, for 1981–2008) (Janowiak and others, 2001; Knapp and others, 2011); (3) the Tropical Rainfall Measur-ing Mission (TRMM) 3B42 product from NASA, (Huffman and others, 2007; Huffman and others, 2011); (4) atmospheric model rainfall fields from the NOAA Climate Forecast Sys-tem, version 2 (CFSv2) (Saha and others, 2010; Environmen-tal Modeling Center, 2011); and (5) in situ precipitation obser-vations obtained from a variety of sources including national and regional meteorological services. All the data sources
1U.S. Geological Survey.2Climate Hazards Group, University of California Santa Barbara.3University of Colorado, Boulder.
2 A Quasi-Global Precipitation Time Series for Drought Monitoring
were compiled as 5-day rainfall accumulations. The pentad (5-day total) is the focus of the CHIRPS estimation process because sub-monthly time steps are needed for monitoring and modeling agricultural drought (Verdin and Klaver, 2002).
The CHIRPS ProcedureCHIRPS is the product of a two part process. First, IR
Precipitation (IRP) pentad rainfall estimates are created from satellite data by calculating the percentage of time during the pentad that the IR observations indicate cold cloud tops (<235° K), and converting that value into millimeters of pre-cipitation by means of previously determined local regression with TRMM 3B42 precipitation pentads. The IRP pentads are then expressed as percent of normal by dividing the values by their long-term (1981–2012) IRP means. These unitless values represent variations in time from the long-term mean (below normal, normal, or above normal rainfall). The percent of normal IRP pentad is then multiplied by the corresponding CHPClim pentad to produce an unbiased gridded estimate, with units of millimeters per pentad, called the Climate Haz-ards Group IR Precipitation (CHIRP). In the second part of the process, stations are blended with the CHIRP data to produce the final product, CHIRPS.
The IRP estimate represents the temporal component of the rainfall accumulated during a pentad, while the CHPClim represents the spatial component. This approach has been determined to effectively represent some of the systematic climate effects of complex terrain (Funk and others, 2007).
In some cases, there are missing IRP values due to incomplete satellite coverage. These data gaps, which primar-ily occurred during the 1980s, were filled in using CFSv2 data. The CFSv2 estimates were bias corrected in the same way as the IRP estimates, by using the ratio of CHPClim pentad to the long-term pentadal mean of the CFSv2.
The CHG Station Climatology DatabaseThe Climate Hazards Group (CHG) at UCSB has
developed an extensive archive of in situ daily, pentadal, and monthly precipitation totals. These observations come from a variety of sources such as: the monthly Global Historical Cli-mate Network (GHCN) version 2 archive (Peterson and Vose, 1997), the daily GHCN archive (Durre and others, 2010), the Global Summary Of the Day dataset (GSOD) provided by NOAA’s National Climatic Data Center, the World Meteo-rological Organization’s Global Telecommunication System (GTS) daily archive provided by NOAA CPC, and over a dozen national and regional meteorological services.
There are a number of challenges trying to integrate sta-tion data from so many sources. The first issue is duplication of reports from different sources. Another concern is incom-plete observations through time that could bias the long-term
mean at locations where data are disproportionately missing for a given decade. These issues were addressed by creating time-series over a list of anchor locations. Sources were con-sidered sequentially, in order of their expected quality. Starting with the national datasets (which, though temporally and spa-tially disjointed, are expected to be of high quality), all loca-tions were added to a anchor list. After all the national datasets were included, stations were added from regional and global sources, one at a time. For each new source, stations were only added to the anchor list if they were outside of a 10-km radius from any station already in the list. Stations within the 10-km radius are assumed to be duplicates and are used to fill missing values in the anchor stations. Once the anchor list and cor-responding list of duplicate stations was complete, a precipi-tation time-series was built at each anchor location based on the ranking of the sources. Currently there are 52,743 anchor locations used in the production of CHIRPS.
Comparisons between the different station data sources and high quality daily observations from the originating national meteorological agencies indicated that the GTS and GSOD have substantial numbers of “false zeros”, that is, data values that have been incorrectly reported as zeros. A screening procedure was developed to flag and remove these potential false zeros.
If a GTS or GSOD station recorded a zero value on a day when the daily CHIRP value was above the expected daily rainfall intensity, that daily rainfall station value is treated as missing. Additional checks are made for spurious zero values for the pentadal and monthly accumulations. If the station reported zero for pentad or monthly values in the GTS or GSOD, but CHIRP indicated 7 mm or more for pentadal or 20 mm or more for monthly, the station data is treated as miss-ing. Lastly, if a lower ranking source reports a non-zero value while the higher ranking source reports zero, the non-zero value is selected.
The automated station processing used in the CHIRPS produces a 1981 to near-present dataset suitable for drought monitoring and trend analysis. Because this archive is qual-ity controlled by an automated procedure, it is not as closely curated as the monthly station data that go into longer latency global precipitation products like those produced by Global Precipitation Climate Center (Schneider and others, 2013) or the Global Precipitation Climatology Project (Adler and oth-ers, 2003; Huffman and others, 2009).
Blending Stations to Produce the CHIRPS
For each grid location in the CHIRP domain, the five nearest station observations are used to calculate an adjust-ment ratio for the CHIRP value. Each station is assigned a weight proportional to the square of their expected correlation. Closer stations receive higher weights. These five weights are then scaled to sum to 1 and used to blend the station data into
References 3
a single modifier (ratio) that can be used to adjust the CHIRP estimates. This ratio was capped at 3.0 to limit the possible impact of bad station data.
The CHIRP modification process also accounts for the estimated correlation of the CHIRP (0.5). The square of this value (0.25) and the square of the estimated correlation of the closest station are used to determine the relative “mix” between the interpolated station-adjusted CHIRP and the unmodified CHIRP. At a station location, where the expected correlation is 1, the relative mix would be as 12 is to 0.52 (80 percent adjusted and 20 percent raw CHIRP). Where the expected correlation of the nearest station is 0, the CHIRPS becomes identical to the CHIRP. The CHIRPS blending procedure is an inexact process, one that is not constrained to re-create the station values exactly. Even at a station location, the weighting procedure will still include values from four neighbors if the CHIRP fields indicate a positive correlation. The estimate will also include a contribution from the CHIRP. These algorithm decisions were based on a desire to mitigate the effect of potentially inaccurate observations, and especially false zeros, which can arise from the misreporting of missing data.
The CHIRP-station blending process is carried out at the pentadal and monthly time scales since there are a greater number of stations reporting at the monthly level. Pentadal CHIRPS values are adjusted such that their sum equals the total monthly CHIRPS.
For Africa, daily CHIRPS values are also created. Using daily cold cloud duration percentages (%CCD), daily rain/no-rain events are determined. The corresponding pentadal rainfall is partitioned among the daily rain events proportional to their %CCD.
CHIRPS AvailabilityTwo CHIRPS products are produced operationally: a
rapid preliminary version, and a later final version. The pre-liminary CHIRPS product is available, for the entire domain, soon after the end of a pentad. The preliminary CHIRPS uses only GTS stations, which are available within a 1 day delay. Other station datasets, GHCN, GSOD, take up to approxi-mately 15 days to completely report data for all stations. These data are used to produce the final CHIRPS products, which are available sometime after the 15th of the following month. Final monthly, rescaled pentads and daily products are calcu-lated at that time.
References
Adler, R.F., Huffman, G.J., Chang, A., Ferraro, R., Xie, P., Janowiak, J., Rudolf, B., Schneider, U., Curtis, S., Bolvin, D., Gruber, A., Susskind, J., Arkin, P., and Nelkin, E., 2003, The version 2 global precipitation climatology project monthly precipitation analysis (1979–Present): Journal of Hydrometeorology, v. 4, p. 1147–1167.
Environmental Modeling Center/National Center for Environ-mental Prediction/National Weather Service/NOAA/U.S. Department of Commerce, 2011, updated daily. NCEP Cli-mate Forecast System Version 2 (CFSv2) 6-hourly Products. Research Data Archived at the National Center for Atmo-spheric Research, Computation and Information Systems laboratory, accessed January 11, 2014, at http://rda.ucar.edu/datasets/ds094.0.
Durre, I., Menne, M. J., Gleason, B. E., Houston, T. G., and Vose, R. S., 2010, Comprehensive automated quality assurance of daily surface observations: Journal of Applied Meteorology and Climatology, v. 49, p.1615–1633.
Funk, C., Michaelsen, J., Verdin, J., Artan, G., Husak, G., Senay, G., Gadain, H., and Magadzire, T., 2003, The col-laborative historical African rainfall model—description and evaluation: International Journal of Climatology, v. 23, p. 47–66.
Funk, C., and Michaelsen, J., 2004, A simplified diagnostic model of orographic rainfall for enhancing satellite-based rainfall estimates in data poor regions: Journal of Applied Meteorology, v.43, p. 1366–1378.
Funk, C., Senay, G., Asfaw, A., Verdin, J., Rowland, J., Michaelsen, J., Eilerts, G., Korecha, D., and Choularton, R., 2005, Recent drought tendencies in Ethiopia and equatorial-subtropical eastern Africa: Famine Early Warning System Network Special Report. US Agency for International Development, 12 p.
Funk, C., Husak, G., Michaelsen, J., Love, T., and Pedreros, D., 2007, Third generation rainfall climatologies—Satellite rainfall and topography provide a basis for smart interpola-tion, in Crop and Rangeland Monitoring Workshop, 2nd, Nairobi, Kenya, March 2007, Extended Abstract.
Funk, C., and Verdin, J.P., 2010, Real-time decision support systems—The famine early warning system network, in Gebremichael, M., and Hossain, F., eds., 2010, Satellite rainfall applications for surface hydrology: Springer, Neth-erlands, Springer, p. 295–320.
4 A Quasi-Global Precipitation Time Series for Drought Monitoring
Funk, C., Michaelsen, J., and Marshall, M., 2012, Map-ping recent decadal climate variations in precipitation and temperature across Eastern Africa and the Sahel, chap. 14 of Wardlow, B., Anderson, M., and Verdin, J., eds., Taylor and Francis: Remote sensing of drought—Innovative monitor-ing approaches, 25 p.
Huffman, G.J., Bolvin, D.T., Nelkin, E.J., Wolff, D.B., Adler, R.F., Gu, G., and Stocker, E.F., 2007, The TRMM multis-atellite precipitation analysis (TMPA)—Quasi-global, multi-year, combined-sensor precipitation estimates at fine scales: Journal of Hydrometeorology, v. 8, no.1, p. 38–55.
Huffman, G.J, Adler, R.F., Bolvin, D.T., and Gu, G., 2009, Improving the global precipitation record—GPCP Ver-sion 2.1: Geophysical Research Letters, v. 36, no. L17808, doi:10.1029/2009GL040000.
Huffman, G.J., Adler, R.F., Bolvin, D.T., and Nelkin, E.J., 2011, The TRMM multi-satellite precipitation analysis (TMPA), in Mekonnen Gebremichael, Faisal Hossain, Satel-lite rainfall applications for surface hydrology: Netherlands, Springer, p. 3–22.
Husak, G., Michaelsen, J., and Funk, C., 2007, Use of the gamma distribution to represent monthly rainfall in Africa for drought monitoring applications: International Journal of Climatology, v. 27, no. 7, p. 935–944.
Husak, G.J., Michaelsen, J., Kyriakidis, P., Verdin, J.P., Funk, C., and Galu, G., 2011, The Forecast Interpretation Tool-a Monte Carlo technique for blending climatic distributions with probabilistic forecasts: International Journal of Clima-tology, v. 31, no. 461–467. doi: 10.1002/joc.2074
Janowiak, J.E., Joyce, R.J., and Yarosh, Y., 2001, A real-time global half-hourly pixel-resolution infrared dataset and its applications: Bulletin of the American Meteorological Soci-ety, v. 82, no. 2, p. 205–217.
Knapp, K.R., Ansari, S., Bain, L., Bourassa, M.A., Dickinson, M.J., Funk, C., Helms, C.N., Hennon, C.C., Holmes, C., Huffman, G.J., Kossin, J.P., Lee, H-Tien, Loew, A., and Magnusdottir, G., 2011, Globally gridded satellite (GriSat) observations for climate studies: Bulletin of the American Meteorological Society, v. 92, no. 7, p. 893–907.
Peterson, T.C., and Vose, R.S., 1997, An overview of the Global Historical Climatology Network temperature data-base: Bulletin of the American Meteorological Society, v. 78, no. 12, p. 2,837–2,849.
Saha, S., Moorthi, S., Pan, H. L., Wu, X., Wang, J., Nadiga, S., and Reynolds, R. W. 2010, The NCEP climate forecast system reanalysis. Bulletin of the American Meteorological Society, 91(8), p. 1015–1057.
Schneider, U., and others, 2013, GPCC’s new land surface precipitation climatology based on quality-controlled in situ data and its role in quantifying the global water cycle: Theo-retical and Applied Climatology, accessed January 2, 2014, at http://dx.doi.org/10.1007/s00704-013-0860-x.
Verdin, J., and Klaver, R., 2002, Grid cell based crop water accounting for the famine early warning system: Hydrologi-cal Processes, v. 16, p. 1617–1630.
Verdin, J., Funk, C., Senay, G., and Choularton, R., 2005, Climate science and famine early warning: Philosophical Transactions of the Royal Society B, v. 360, p. 2155–2168.

Publishing support provided by:Rolla Publishing Service Center
For more information concerning this publication, contact:U.S. Geological Survey Earth Resources Observation and Science
(EROS) Center47914 252nd Street, Sioux Falls, South Dakota 57198(605) 594–6151
Or visit the EROS Center Web site at:http://eros.usgs.gov/
Funk and others—A
Quasi-G
lobal Precipitation Time Series for D
rought Monitoring—
Data Series 832
ISSN 2327-638X (online)http://dx.doi.org/110.3133/ds832