unik4230: mobile communicationsits-wiki.no/images/6/67/unik4230-lec-9_mobile_broadband_2012.pdf ·...
TRANSCRIPT


2 © Nokia Siemens Networks
Mobile Broadband
Materials used from:
1. Nokia Siemens Networks
2. LTE for UMTS. Evolution to LTE-Advanced. 2nd Edition. Harri Holma and Antti Toskala

3 © Nokia Siemens Networks
LTE
Introduction
WCDMA/HSPA/HSPA+
LTE-Advanced
Summary
Agenda

4 © Nokia Siemens Networks
Over 6 billion mobile subscriptions • Affordable phones for mass market
• Over 1.2billion mobile broadband users, 50% y-o-y growth
• Operators global MBB service revenue grow annually 25%
• 350 million mobile Facebook users, out of 800 million total
• YouTube generates 22% of global mobile data traffic
• Mobile broadband subscriptions expected to exceed wireline broadband users within 2 years
• s
Strong momentum in mobile broadband
Source: NSN BI, Industry analysts
Networks
Devices Services
Affordable &
exciting MBB
offerings

5 © Nokia Siemens Networks
Mobile broadband traffic more than doubles every year Video traffic has overtaken everything else
Source: NSN BI, Industry analysts Source: NSN BI, Industry analysts

6 © Nokia Siemens Networks
Mobile data traffic generation per device type
0%
20%
40%
60%
80%
100%
Feature phones Smartphones Dongles
Distribution of global mobile data traffic, January 2011
Source: CSC, 2011
% subscribers
% data consumption
Consumer 2.8 GB
Enterprise 790 MB
100% Voice
Some data
Some voice
100% data
LaptopSmart Phone
Voice: 300 min
36 MB
150 MB
Tablet
Some voice
100% data
Average data usage 2010:
400 MB
Consumer 6 GB
Enterprise 2.1 GB600 MB
Average data usage 2015:
1.2 GB
Data usage per month, global averages
Source: NSN BI
7 © Nokia Siemens Networks
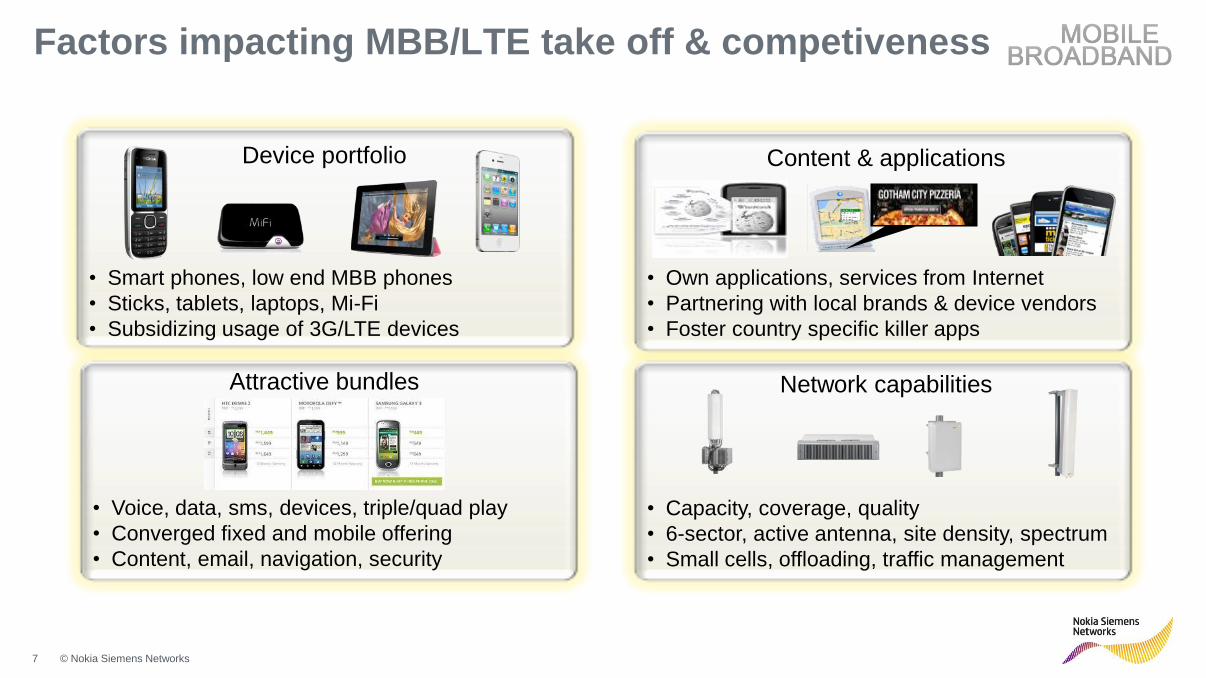
Factors impacting MBB/LTE take off & competiveness
Device portfolio Content & applications
Attractive bundles Network capabilities
• Smart phones, low end MBB phones
• Sticks, tablets, laptops, Mi-Fi
• Subsidizing usage of 3G/LTE devices
• Own applications, services from Internet
• Partnering with local brands & device vendors
• Foster country specific killer apps
• Voice, data, sms, devices, triple/quad play
• Converged fixed and mobile offering
• Content, email, navigation, security
• Capacity, coverage, quality
• 6-sector, active antenna, site density, spectrum
• Small cells, offloading, traffic management
8 © Nokia Siemens Networks
LTE
Introduction
WCDMA/HSPA/HSPA+
LTE-Advanced
Summary
Agenda
HSPA technology and evolution
HSPA device ecosystem overview
Introduction

9 © Nokia Siemens Networks
UMTS Air Interface technologies
UMTS Air interface is built based on two technological solutions
• WCDMA – FDD
• WCDMA – TDD
WCDMA – FDD is the more widely used solution
• FDD: Separate UL and DL frequency band
WCDMA – TDD technology is currently used in limited number of networks
• TDD: UL and DL separated by time, utilizing same frequency
Both technologies have own dedicated frequency bands

10 © Nokia Siemens Networks
WCDMA Technology
5 MHz
3.84 MHz
f
5+5 MHz in FDD mode
5 MHz in TDD mode
Fre
qu
ency
Time Direct Sequence (DS) CDMA
WCDMA Carrier
WCDMA
5 MHz, 1 carrier
TDMA (GSM)
5 MHz, 25 carriers
Users share same time and frequency

11 © Nokia Siemens Networks
UMTS & GSM Network Planning
GSM900/1800: 3G (WCDMA):

12 © Nokia Siemens Networks
Spreading Code
Spread Signal
Data
Air Interface
CDMA principle - Chips & Bits & Symbols Bits (In this drawing, 1 bit = 8 Chips SF=8)
Baseband Data
-1
+1
+1
+1
+1
+1
-1
-1
-1
-1
Chip Chip

13 © Nokia Siemens Networks
Global HSPA subscriber numbers
• HSPA overtook EVDO as top mobile broadband technology in 2008
• HSPA technology track will dominate for many years to come
• Lead markets USA, Japan, South Korea, Australia and West Europe
• China, India, Indonesia and Brazil with biggest growth
• Operators are aligned on LTE as the future technology for HSPA and EVDO networks
• WiMAX networks will not gain a significant share of global users
Source: Ovum

14 © Nokia Siemens Networks
HSPA “World Map” Overview
Source: GSA July 2011
Countries with commercial 3G/HSPA operators
Countries with 3G/HSPA network commitments/deployments
Over 99% of commercial WCDMA
operators has launched HSPA !
446 commercial HSPA operators in 170 countries/territories
136 commercial HSPA+ systems launched
World’s leading HSPA
market is Japan with
>85 Million subs
South-Korea
also big
USA leading MBB
with > 70 Million
WCDMA/HSPA subs
+ big CDMA2000
High WCDMA/HSPA
penetration in all
Western European
countries
Fairly low subscriber numbers
but 3-digit annual growth rates !
TOP-market = Brazil, 21M subs
Very fast growth in Brazil,
Argentina, Colombia, Chile,
Peru and Mexico
TOP3 WCDMA/HSPA-
countries
South-Africa (7.7 M),
Egypt (4.7 M) Nigeria (4.2 M)
Other countries still in pretty
early stages of HSPA-market
In India
HSPA
just
launched
Saudi-Arabia
biggest
WCDMA/HSPA
market in ME
APAC a mixture of
mature WCDMA/HSPA markets
(e.g. Australia >80% penetration) +
countries with high growth
phase (e.g. Philippines, Vietnam)
Russia biggest Eastern
European WCDMA/HSPA
market with 12 Million subs.
3-digit growth especially in Turkey
In China HSPA
fast growing

15 © Nokia Siemens Networks
LTE
Introduction
WCDMA/HSPA/HSPA+
LTE-Advanced
Summary
Agenda
HSPA technology and evolution
HSPA device ecosystem overview
Introduction
16 © Nokia Siemens Networks
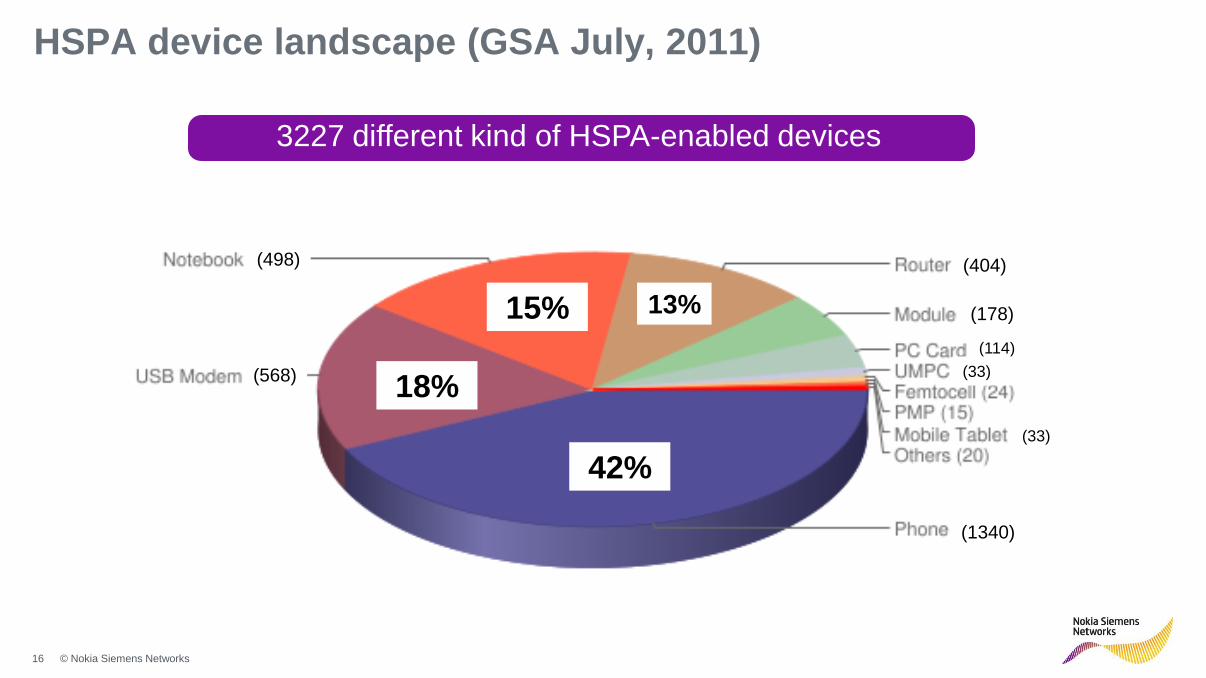
HSPA device landscape (GSA July, 2011)
3227 different kind of HSPA-enabled devices
42%
18%
15% 13%
(1340)
(568)
(498) (404)
(178)
(114)
(33)
(33)

17 © Nokia Siemens Networks
TRUE world-market HSPA devices available Examples:
Nokia C6
850/900/1900/2100
Nokia N8
Sierra Wireless
504
Option Globetrotter
441
Option ICON 452
850/AWS/1900/2100
Nokia E7
850/900/AWS/1900/2100
Nokia C7
Five- band !!
iPhone 4
iPhone 4S iPad 2 Samsung Galaxy S II
Samsung Galaxy Nexus
Nokia Lumia 800
Quad- band

18 © Nokia Siemens Networks
Huawei Ideos X1
Dual-band HSPA 7.2 Mbps
Android 2.2
~ 90 €
Clearly below 100 Euros HSPA phones now available
Samsung Hero E3213
Dual-band HSPA 3.6 Mbps
Quad band EDGE
~ 50 €
Samsung Hero E3210
Dual-band HSPA 3.6 Mbps
Quad band EDGE
~ 40 €
Nokia Asha 300
Quad-band HSPA 10.2 Mbps
Quad EDGE, Dual SIM
~ 75 €

19 © Nokia Siemens Networks
HSPA device categories and max theoretical data rates
HSDPA Categories (Downlink)
Cat6 3.6 Mbps, with 16QAM
Cat8 7.2 Mbps, with 16QAM
Cat9 10.1 Mbps, with 16QAM
Cat10 14.4 Mbps, with 16QAM
Cat14 21 Mbps, with 64QAM
Cat18 28 Mbps, with MIMO and 16QAM
Cat20 42 Mbps, with MIMO and 64QAM
Cat24 42 Mbps, DC-HSDPA and 64QAM
Cat28 84 Mbps, DC-HSDPA and 64QAM and MIMO
Cat32 168 Mbps, MC-HSDPA and 64QAM and MIMO
HSUPA Categories (Uplink)
Cat2 1.4 Mbps
Cat5 2.0 Mbps
Cat6 5.76 Mbps
Cat7 11.5 Mbps, with 16QAM
Cat8 11.5 Mbps, DC-HSUPA, 2x Cat6
Cat9 23 Mbps, DC-HSUPA, 2x Cat7

20 © Nokia Siemens Networks
LTE
Introduction
WCDMA/HSPA/HSPA+
LTE-Advanced
Summary
Agenda
HSPA technology and evolution
HSPA device ecosystem overview
Introduction

21 © Nokia Siemens Networks
DC-HSPA on 2100, 900 and 2100+900 MHz (dual-band DC)
• DC-HSPA 42 Mbit/s device available currently
in the market can support aggregation of two
HSPA-carriers on the 2100 MHz band
• Technology-wise DC-HSPA on 900 MHz could be
done but typically not included to the early devices/
chipset due lack of operator demand (not many operators that can free 900 for two HSPA-carriers)
• Devices capable for dual-band DC-HSPA 42 Mbit/s
are expected earliest year 2013

23 © Nokia Siemens Networks
HSPA+ radio performance basics
• HSDPA peak rate depends on adaptive modulation, coding and UE category
• BTS selects modulation and coding based on reported signal quality (affected by e.g. distance from BTS, load in neighboring cells and UE performance)
HIGH LOAD neighboring cells 64 QAM, no MIMO, no DC-HSPA
LOW LOAD neighboring cells 64 QAM, no MIMO, no DC-HSPA

24 © Nokia Siemens Networks
64QAM improves HSPA throughput, Live networks indicate 64QAM benefit is better than in simulations
Old category 12 device: max 1.8 Mbit/s
Category 14 device: max 21 Mbit/s
Category 10 device: max 14 Mbit/s
Clear difference close to base station
Similar at the cell edge
Typically CQI > 26 needed in
order to get benefit from 64QAM
Noticeable difference in the middle
Cat 14 device can benefit from 64QAM in fairly large area.
Some 17-28% throughput benefit compared to Cat 10 device,
except at cell edge. Max. 21 Mbps only close to BTS,
otherwise more robust coding needed with 64QAM.

25 © Nokia Siemens Networks
0.55
1.06 1.11
1.311.44
1.52
1.74
0.33 0.33 0.33
0.530.65 0.65
0.79
0.0
0.2
0.4
0.6
0.8
1.0
1.2
1.4
1.6
1.8
2.0
HS
PA R
6
HS
PA R
6 +
UE
equa
lizer
HS
PA R
7
64Q
AM
HS
PA R
8 D
C-
HS
DPA
HS
PA R
9 D
C-
HS
DPA
+MIM
O
HS
PA R
10 Q
C-
HS
DPA
+MIM
O
LTE
R8
bps/
Hz/
cell
Evolution of HSPA efficiency
Downlink
Uplink
Spectral Efficiency Evolution
HSPA+
LTE

26 © Nokia Siemens Networks
Similar technical solutions in Long Term HSPA Evolution and in LTE Advanced
Long Term HSPA Evolution – Technology Components
Bandwidth extension
Multi-cell transmission
4x 2x
8 x 5 MHz
1st LTE field trial Berlin, 11/2007
HSPA + LTE aggregation
HSPA LTE
MIMO

27 © Nokia Siemens Networks
HSPA Peak Data Rate Evolution
40 MHz2x2 / 4x4
MIMO
5 MHzNo MIMO
84 Mbps
10 MHz2x2 MIMO
10 MHzNo MIMO5 MHz
2x2 MIMO
Release 5Release 7
Release 8
Release 9
Release 10
10 MHz16QAM
5 MHz16QAM
5 MHzQPSK
Release 6Release 7
Release 9 10 MHz64QAMMIMO
DO
WN
LIN
K
UP
LIN
K
14 Mbps
42 Mbps
23 Mbps
11.52 Mbps5.76
Mbps
70 Mbps28 Mbps
20 MHz2x2 MIMO
Release 11+
336 - 672 Mbps
168 Mbps
Release 11+
• Downlink peak rate 672 Mbps with 4x4 MIMO
• Downlink peak rate 336 Mbps with 2x2 MIMO

28 © Nokia Siemens Networks
HSPA Peak Data Rate Evolution D
OW
NL
INK
U
PL
INK
14 Mbps
3GPP R5
3GPP R6
3GPP R7 3GPP R8 3GPP R9
3GPP R10
3GPP R11+
21 Mbps
64QAM
42 Mbps
DC-HSPA 84 Mbps
DC-HSPA +
Rel9 MIMO
168 Mbps
4-carrier
HSPA
672 Mbps
LT HSPA EVO
0.4 Mbps
5.8 Mbps HSUPA
3GPP R7
11 Mbps
16QAM
3GPP R9
23 Mbps
DC-HSUPA
3GPP R11+
70 Mbps
LT HSPA EVO
29 © Nokia Siemens Networks
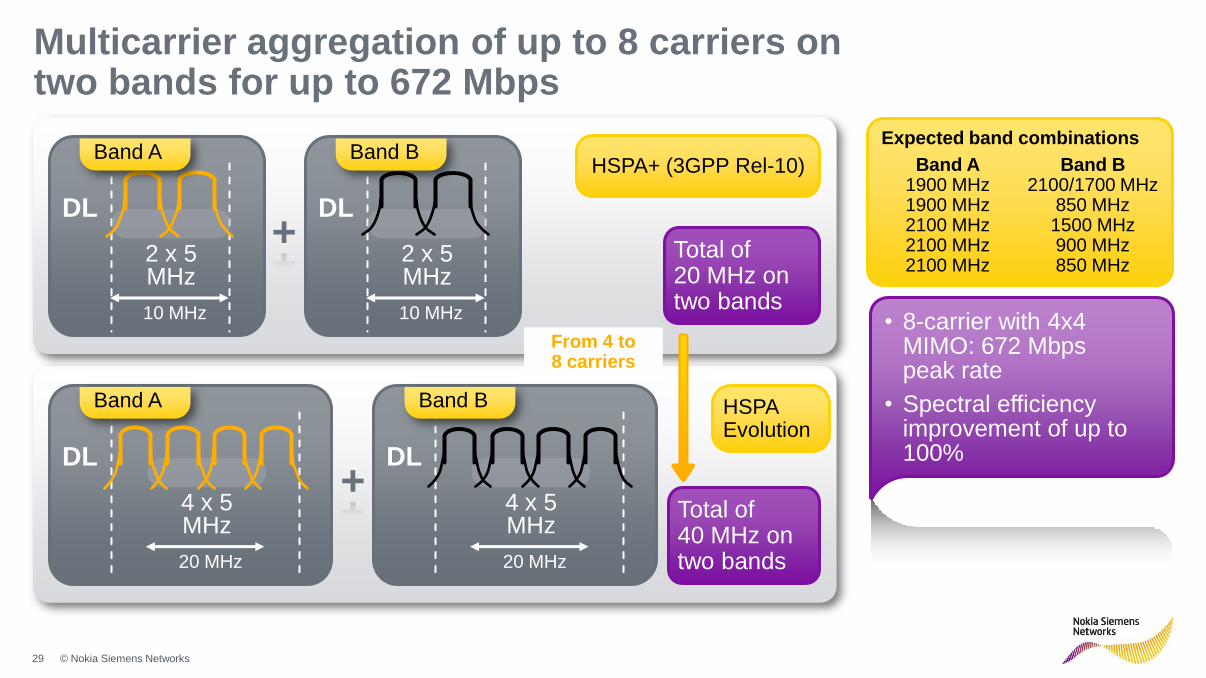
Expected band combinations
Multicarrier aggregation of up to 8 carriers on two bands for up to 672 Mbps
Total of 20 MHz on two bands
HSPA+ (3GPP Rel-10)
+
HSPA Evolution
Total of 40 MHz on two bands
Band B 2100/1700 MHz
850 MHz 1500 MHz 900 MHz 850 MHz
Band A 1900 MHz 1900 MHz 2100 MHz 2100 MHz 2100 MHz
• 8-carrier with 4x4 MIMO: 672 Mbps peak rate
• Spectral efficiency improvement of up to 100%
DL
10 MHz
2 x 5 MHz
Band A
DL
10 MHz
2 x 5 MHz
Band B
DL
20 MHz
4 x 5 MHz
Band A
+ DL
20 MHz
4 x 5 MHz
Band B
From 4 to 8 carriers
30 © Nokia Siemens Networks
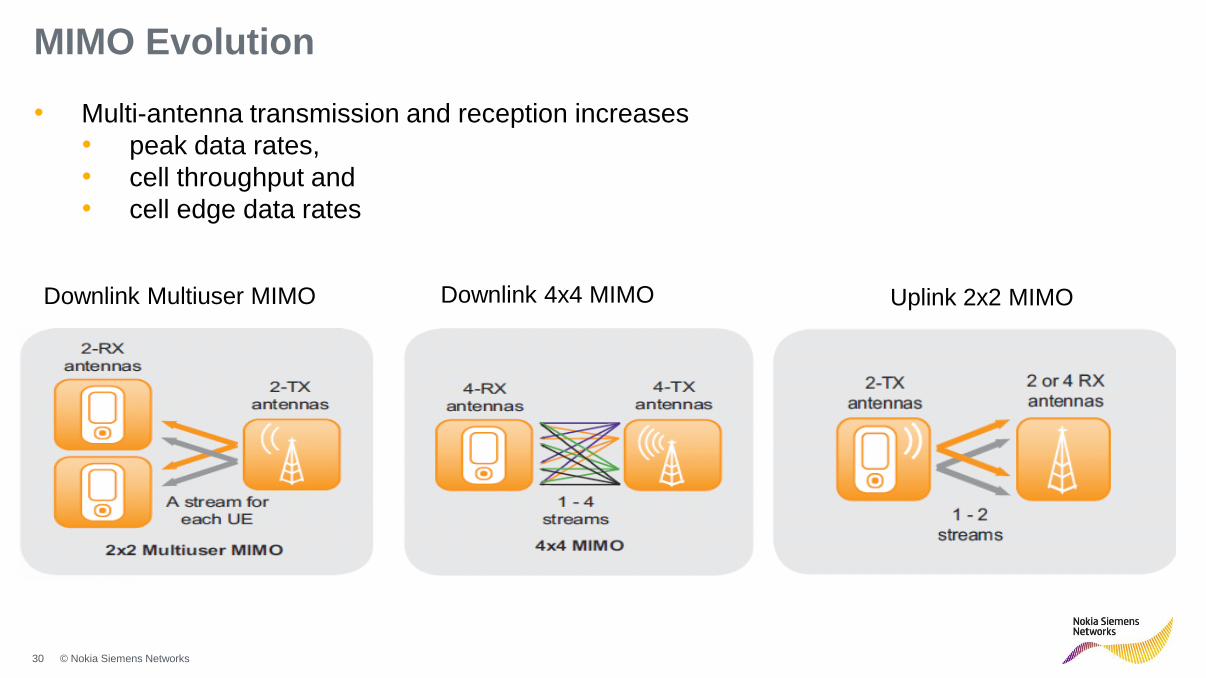
MIMO Evolution
• Multi-antenna transmission and reception increases
• peak data rates,
• cell throughput and
• cell edge data rates
Uplink 2x2 MIMO Downlink 4x4 MIMO Downlink Multiuser MIMO

31 © Nokia Siemens Networks
LTE
Introduction
WCDMA/HSPA/HSPA+
LTE-Advanced
Summary
Agenda
Radio Access Overview
LTE Spectrum
Introduction
Core Network Overview
QoS in LTE
Voice over LTE (VoLTE)
Self Organizing Network (SON)

32 © Nokia Siemens Networks
WHY LTE?
Superior mobile broadband user experience
GSM HSPA+ LTE
Throughput latency
GSM HSPA+ LTE
10ms
100 Mbps 150ms
<1 Mbit
<50ms >42 Mbps
Industry commitment behind the ecosystem
226 LTE network operator commitments in 76 countries
119 LTE networks expected to be in commercial operation by end 2012
> 380 million LTE subscribers by 2015 Forecast for LTE lead markets by Research and Markets
Technology convergence
GSM
WCDMA
CDMA
WiMAX
TD-
SCDMA
FDD LTE
TD-LTE
LTE
Advanced >90% harmonized
in 3GPP
Extensive range of radio spectrum support
23 different FDD frequency band options
11 different TDD frequency band options
Single operator may deploy both FDD+TDD LTE
for maximum utilization of spectrum assets
+ new ones still being specified both for new
band deployment and re-farming cases

33 © Nokia Siemens Networks
Motivation and Targets for LTE
• Spectral efficiency 2 to 4 times more than with HSPA Rel-6
• Peak rates exceed 100 Mbps in downlink and 50 Mbps in uplink (which is 10 times more than HSPA Rel-6)
• Enable a round trip time of < 10 ms
• Packet switched optimized
• High level of mobility and security
• Optimized terminal power efficiency
• Frequency flexibility with allocations from below 1.5 MHz up to 20 MHz

34 © Nokia Siemens Networks
3GPP Standard and Release schedule
1999 2000 2001 2002 2003 2004 2005 2006 2007 2008 2009 2010 2011
3GPP schedule
Commercial
deployment
WCDMA HSDPA HSUPA HSPA+
LTE
LTE-A
HSDPA HSUPA HSPA+ LTE EDGE
WCDMA
2008 2009 2010 2011 2012
Release 8 Release 9 Release 10 Release 11
3GPP LTE Release schedule

35 © Nokia Siemens Networks
LTE market status
• 226 commercial LTE network
commitments in 76 countries
326mn dual-mode (LTE+3G) and
260mn (LTE-FDD + TD-LTE) devices
activated by 2016 Forecast by Maravedis (May 2011)
• 49 operators have commercially
launched LTE
• 119 commercial LTE networks in
53 countries expected by end
2012

36 © Nokia Siemens Networks
49 commercially launched LTE networks, Jan 5th 2012 Source: GSA

37 © Nokia Siemens Networks
Access Flat Overall Architecture
• 2-node architecture
• IP routable transport architecture
Improved Radio Principles
• peak data rates [Mbps ] 173 DL , 58 UL
• Scalable BW: 1.4, 3, 5, 10, 15, 20 MHz
• Short latency: 10 – 20 ms
New Core Architecture
• Simplified Protocol Stack
• Simple, more efficient QoS
• UMTS backward compatible security
LTE / SAE introduces the mechanism to fulfill the requirements of a next generation mobile network
Access Core Control
LTE BTS
(eNodeB)
MME
SAE-GW
IMS HLR/HSS
RF Modulation:
• OFDMA in DL
• SC-FDMA in UL
Basic Concepts / Architecture
MME
S-GW and P-GW

38 © Nokia Siemens Networks
* LTE values according to Nokia and Nokia Siemens Network simulations for NGMN performance evaluation report V1.3 (macro cell, full buffer, 500m ISD, pedestrian speed)
** Server near RAN
Latency (Roundtrip delay)**
DSL (~20-50 ms, depending on provider)
GSM/EDGE
HSPA Rel.6
HSPAevo
(Rel.8)
LTE
0 20 40 60 80 100 120 140 160 180 200 ms
Average cell throughput
(macro cell, 2x20 MHz or equivalent)*
Mb
ps/c
ell
HSPA R6 HSPAevo
(2x2 MIMO/64QAM)
LTE
(2x2 MIMO/64QAM)
LTE
(4x4 MIMO/64QAM)
Downlink
Uplink
70
60
50
40
30
20
10
0
4 carriers,
each 2x5 MHz
4 carriers,
each 2x5 MHz
1 carriers,
2x20 MHz
1 carriers,
2x20 MHz
VoIP capacity*
HSPA R6 LTE FDD)
70 60 50 40 30 20 10 0
80
Ca
lls/M
hz/c
ell
Downlink
Uplink
Max. peak data rate
HSPA R6
2x5MH
z
2x5MHz
2x20MHz
2x20MHz
HSPAevo
(2x2 MIMO/64QAM)
LTE
(2x2 MIMO/64QAM)
LTE
(4x4 MIMO/64QAM)
Downlink (uncoded)
Uplink (uncoded)
Downlink (coded)
Uplink (coded)
350
300
250
200
150
100
50
0
Mb
ps
LTE for best Mobile Broadband end-user performance Superior data rates, capacity and latency

39 © Nokia Siemens Networks
LTE user devices Ecosystem growing faster than with any previous technology
269 LTE devices have
been announced by
57 suppliers (GSA, January 20, 2012)
HTC ThunderboltLTE+CDMA
HTC Sense, Skype with video
LG RevolutionLTE+CDMA
Android 2.2, hot spot capability
Moto Droid BionicLTE+CDMA
Android , See What I See Video
Samsung smartphoneLTE+CDMA Android 2.2
Motorola XOOMLTE+WiFi (2Q/11)
Android 3.0 HoneycombSamsung GalaxyLTE+CDMA, Android 2.2
Novatel MiFi 4510LLTE+CDMA WiFi
Samsung Mobile HotspotLTE+CDMA WiFi
Compaq CQ10-688nrLTE+CDMA
HP Pavilion dm1-3010nrLTE+CDMA
Huawei, 2G, 3G, LTE multimode (Qualcomm-based)Tele 2 Sweden
Samsung B3730, TeliaSonera, multimode Fully integrated in NSN LTE
Docomo LTEPCMCIA Card
Qualcomm-based multimode LTE terminals – commercial availability expected in 4Q10
Samsung Craft, LTE/CDMA, MetroPCS
SamsungTD-LTEprototype Fully
integrated in NSN LTE
Sequans TD-LTE trial device
Nokia LTE prototype
modem RD-3
LG single mode trial device Fully integrated in NSN LTE
LG Adrenaline, ATT, multimode
… devices announced by Verizon Wireless at CES for 1H2011
… and for
new segments Cisco Cius Business TabletLTE-capable
Cisco ISR2 G2 WAN-cardLTE-capable card to routers
for small and medium enterprises
Netgear MBR1000LTE+CDMA
SierraWireless MC7750LTE+CDMA embedded module
4Home
monitoring solution
Onstar car solutione.g. video over LTE
Ionicis home
monitoring & control GW
SerComm LTE-
enabled IP camera
BL HealthcareTCx-I terminal with LTE
for HD-video enabled telemedicine
Cradlepoint6 different router/adapter
models with Pantech UML290
NVIDIA and Acer tablets
EA’s Rockbandmultiplayer onlinegaming over LTE
… devices launched in 2010
Cat. 3 USB-modems launched during 2010 LTE in smartphones, notebooks, tablets, MiFi, … during 2011
Smartphones for GSM/HSPA/LTE in 2H/2011
TD-LTE
devices
40 © Nokia Siemens Networks
LTE
Introduction
WCDMA/HSPA/HSPA+
LTE-Advanced
Summary
Agenda
Radio Access Overview
LTE Spectrum
Introduction
Core Network Overview
QoS in LTE
Voice over LTE (VoLTE)
Self Organizing Network (SON)

41 © Nokia Siemens Networks
LTE spectrum & ecosystem
LTE FDD
• Early FDD LTE ecosystem (commercial networks)
2600 (Europe, APAC)
2100 (Japan)
1900 PCS (US)
1800 (GSM refarming)
1700/2100 AWS (NAM incl. Canada)
850 (South Korea)
800 Digital Dividend (Europe, MEA)
Upper 700 MHz, C (Verizon)
Lower 700 MHz, B/C (AT&T)
TD-LTE
• Early TD-LTE ecosystem mainly building on
2300 (MEA, India, China, APAC, Russia)
2600 (China, LatAM, Europe)
LTE FDD
Band MHz Uplink MHz Downlink MHz
1 2x60 1920-1980 2110-2170 UMTS core 2 2x60 1850-1910 1930-1990 US PCS 3 2x75 1710-1785 1805-1880 GSM 1800 4 2x45 1710-1755 2110-2155 NAM AWS 5 2x25 824-849 869-894 850 7 2x70 2500-2570 2620-2690 2600 FDD 8 2x35 880-915 925-960 GSM 900
9 2x35 1749-1784 1844-1879 Japan, Korea 1700
10 2x60 1710-1770 2110-2170 US AWS extension.
11 2x20 1427.9-1447.9 1475.9-1495.9 Japan 1500
12 2x18 698-716 728-746 US
13 2x10 777-787 746-756 Verizon 14 2x10 788-798 758-768 US – Public Safety 17 2x12 704-716 734-746 AT&T 18 2x15 815-830 860-875 Japan – 800 (KDDI)
19 2x15 830-845 875-890 Japan – 800 (DoCoMo)
20 2x30 832-862 791-821 EU 800 DD, MEA 21 2x15 1448-1463 1496-1511 Japan 1500
22 2x80 3410-3490 3510-3590 3.5 GHz FDD
23 2x20 2000-2020 2180-2200 US S-band
24 2x34 1626.5-1660.5 1525-1559 US (LightSquared) 25 2x65 1850-1915 1930-1995 US PCS extension (Sprint)
26 2x35 814-849 859-894 850 extension (Korea-KT, Sprint)
TD-LTE Band MHz Uplink MHz Downlink MHz 33 1x20 1900-1920 1900-1920 UMTS core – TDD
34 1x15 2010-2025 2010-2025 UMTS core – TDD, China TD/SCDMA
35 1x60 1850-1910 1850-1910 US (band 2 – TDD variant)
36 1x60 1930-1990 1930-1990 US (band 2 – TDD variant)
37 1x20 1910-1930 1910-1930 US PCS centre-gap
38 1x50 2570-2620 2570-2620 China, LatAM, Europe 39 1x40 1880-1920 1880-1920 China PHS
40 1x100 2300-2400 2300-2400 MEA, India, China, Russia 41 1x194 2496-2690 2496-2690 US (Clearwire)
42 1x200 3400-3600 3400-3600 3.4/5 GHz – TDD
43 1x200 3600-3800 3600-3800 3.7/8 GHz – TDD
Source: TS 36.101; commercialized bands

42 © Nokia Siemens Networks
Coverage – Low Band and FDD best for wide area LTE - FDD 800 MHz
BS antenna height [m] 30
MS antenna height [m] 1.5
Standard Deviation [dB] 8.0
Location Probability 95 %
Slow Fading Margin [dB] 8.8
Correction factor [dB] -5
Indoor loss [dB] 15
Example: LTE 800 Coverage (Germany)
3G at 2100 MHz LTE at 800 MHz
Source: Deutsche Telekom
> 3 – times
more coverage
on 800 MHz
• Government regulation (USO): -> specific rollout requirements within 800 MHz spectrum license
• Service provided outside wireline-DSL areas
Typical site coverage area in urban area
4.2
3.2
2.1
1.7
1.0
0.6
0.0 1.0 2.0 3.0 4.0 5.0
EU800
900
1800
2100
2600 FDD
2600 TDD
MHz
km2

43 © Nokia Siemens Networks
Coverage – Low Band and FDD best for wide area WCDMA/HSPA – FDD 900MHz
Example: UMTS 900 Coverage (Finland)
3G at 2100 MHz LTE at 800 MHz
Source: TeliaSonera
90% of area covered with
30% sites (U900)
U900 rollout completed in 1.5 years
• Government regulation (USO):
-> provide access to 1 Mbps broadband for every household – either wireline or wireless
• Target date: July 1, 2010
• HSPA900 chosen in view of time-line and 800 MHz spectrum availability
• > 500 devices in all form-factors & price-points
= UMTS900
= UMTS2100
3 – times
more coverage
on 900 MHz

44 © Nokia Siemens Networks
Coverage – Low Band and FDD The power of 700/800/900 MHz for urban indoor coverage
LTE 800 & LTE 2600 data rates (normalized onto LTE-800 cell size)
Dramatic increase of data rates
for cell edge & indoor coverage with lower band
spectrum
Dramatic increase of data rates
for cell edge & indoor coverage with lower band
spectrum

45 © Nokia Siemens Networks
LTE on
EU800-DD
LTE on
900 MHz*
HSPA+ on 900
MHz*
* GSM operation in parallel
More bandwidth = Superior data rates across cell range
10 km
(indicative range for 30m antennas)
LTE on
1800, 2600 MHz

46 © Nokia Siemens Networks
TD-LTE Capacity Similar spectral efficiency for TD-LTE and LTE-FDD
5
10
15
20
25
30
35
FDD 2 x 10MHz TD-LTE 1 x 20MHz TD-LTE 1x20MHz ( FDD 2 x 20MHz )
Mbps
Downlink
Uplink
TD-LTE config.1
• DL/UL = 4/4 timeslots
• Similar DL and UL capacity as in FDD
TD-LTE config.2
• DL/UL = 6/2 timeslots
• Optimized for very asymmetric traffic
FDD-LTE
• DL = 10MHz
• UL = 10MHz
FDD-LTE
• DL = 20MHz
• UL = 20MHz
• Double spectrum
= double capacity

47 © Nokia Siemens Networks
Practical Data Rate Evolution – End-user experience
DC-HSPA 10 MHz 42 Mbps
(84 Mbps)
LTE 10 MHz 74 Mbps
LTE 20 MHz 100 (150) Mbps
14 Mbps
20 Mbps
40 Mbps
Peak rates Typical drive
test rates
= 2 x more spectrum + 40% vs HSPA
= 4 x more spectrum + 40% vs HSPA
DC-HSPA doubles data rates
HSPA+ 5 MHz 21 Mbps
(42 Mbps) 7 Mbps
LTE improves data rates compared to HSPA
• with wider bandwidth, and
• with higher spectral efficiency (20-40%)

48 © Nokia Siemens Networks
Peak data rates Driven by LTE terminal capabilities
Class 1 Class 2 Class 5 Class 3 Class 4
Peak rate DL/UL
RF bandwidth
Modulation DL
Modulation UL
Rx diversity
MIMO DL
10/5 Mbps 50/25 Mbps 100/50 Mbps 150/50 Mbps 300/75 Mbps
20 MHz* 20 MHz* 20 MHz* 20 MHz* 20 MHz*
64 QAM 64 QAM 64 QAM 64 QAM 64 QAM
16 QAM 16 QAM 16 QAM 16 QAM 64 QAM
yes yes yes yes yes
optional 2 x 2 2 x 2 2 x 2 4 x 4
All LTE devices which have been launched during 2010
* All 3GPP Rel.8 LTE terminals can receive 20 MHz bandwidth, but (baseband) processing power is variable

49 © Nokia Siemens Networks
Spectrum Resources – Europe
EU800 (2 x 30 MHz)
LTE 10 MHz
900 (2 x 35 MHz)
1800 (2 x 75 MHz)
LTE 10+MHz & GSM (defragmentation)
2100 (2 x 60 MHz)
Multicarrier HSPA
2600 (2x70 MHz + 50 MHz)
LTE 20 MHz TD-LTE 20 MHz
Typical future
CSP deployment scenario
LTE capacity & highest data rates
HSPA capacity
LTE capacity + GSM capacity
HSPA coverage + GSM maintenance
LTE coverage
• Main LTE bands in Europe: 800, 1800 and 2600 MHz
HSPA 5+MHz & GSM (defragmentation) GSM
GSM
WCDMA/HSPA
new spectrum
new spectrum, Digital Dividend /
TV-transition
Overall spectrum
available

50 © Nokia Siemens Networks
Spectral Efficiency Relative to 10 MHz
0 %
20 %
40 %
60 %
80 %
100 %
120 %
1.4 MHz 3 MHz 5 MHz 10 MHz 20 MHz
Downlink
Uplink-40% -13% Baseline
LTE maintains high efficiency with bandwidth down to 3.0 MHz, e.g. for band refarming scenarios
LTE spectral efficiency for 1.4 MHz similar to HSPA with 2x2 MIMO and 64-QAM
Differences between bandwidths come from frequency scheduling gain and different overheads
Capacity - Highest spectral efficiency with LTE LTE maintains highest efficiency down to 5 MHz bandwidth
51 © Nokia Siemens Networks
LTE
Introduction
WCDMA/HSPA/HSPA+
LTE-Advanced
Summary
Agenda
Radio Access Overview
LTE Spectrum
Introduction
Core Network Overview
QoS in LTE
Voice over LTE (VoLTE)
Self Organizing Network (SON)

52 © Nokia Siemens Networks
Multiple Access Methods
TDMA FDMA CDMA OFDMA
f f
f
t
f
t
f
f
t
f
t
f
• Time Division • Frequency Division • Code Division • Frequency Division
• Orthogonal subcarriers
User 1 User 2 User 3 User ..

53 © Nokia Siemens Networks
Downlink - OFDM
Subchannels / Tones (each 15 kHz)
1 TTI
= 1ms
1 PRB (Physical Resource Block) = 12 Subcarriers = 180 kHz
1 PRB = 2 Slots = 2 * 0.5 ms
1.4 MHz = 72 Tones 20 MHz = 1200 Tones User 1
User 2
User 3
User ..

54 © Nokia Siemens Networks
Uplink – Single Carrier FDMA
SC-FDMA: PRB‘s are grouped to bring down Peak to Average Power Ratio (PAPR)
better power efficiency at the terminal
1.4 MHz = 72 Tones 20 MHz = 1200 Tones
Subchannels / Tones (each 15 kHz)
1 TTI
= 1ms
1 PRB (Physical Resource Block) = 12 Subcarriers = 180 kHz
1 PRB = 2 Slots = 2 * 0.5 ms
User 1
User 2
User 3
User ..

55 © Nokia Siemens Networks
LTE Radio highlight
LTE: Most efficient Radio Access Technology
Fast Link Adaptation
due to channel
behaviour
Short TTI = 1 ms
Transmission time
interval
Advanced Scheduling Time &
Freq. (Frequency Selective
Scheduling)
TX RX
Tx Rx
MIMO
Channel
DL: OFDMA
UL: SC-FDMA
scalable
HARQ: Hybrid
Automatic Repeat Request
64QAM
Modulation
1
2
2 1
NACK ACK
Rx Buffer
Combined decoding

56 © Nokia Siemens Networks
LTE Radio principles
• Power efficient uplink increasing battery lifetime
• Improved cell edge performance by low peak to average ratio
• Reduced Terminal complexity
Uplink:
SC-FDMA
• Enabling peak cell data rates of 173 Mbps DL and 58 Mbps in UL *
• Scalable bandwidth: 1.4 / 3 / 5 / 10 /15 / 20 MHz also allows deployment
in lower frequency bands (rural coverage, refarming)
• Short latency: 10 – 20 ms **
• Improved spectral efficiency
• Reduced interference
• Very well suited for MIMO
* At 20 MHz bandwidth, FDD, 2 Tx, 2 Rx, DL MIMO, PHY layer gross bit rate ** roundtrip ping delay (server near RAN)
Downlink:
OFDMA
Subchannels / Tones (each 15 kHz)
time
1 TTI
= 1ms
1 PRB (Physical Resource Block)
= 12 Subcarriers = 180 kHz
1 PRB = 2 Slots
= 2 * 0.5 ms
User 1
User 2
User 3
User ..
Subchannels / Tones (each 15 kHz)
time
1 TTI
= 1ms
1 PRB (Physical Resource Block)
= 12 Subcarriers = 180 kHz
1 PRB = 2 Slots
= 2 * 0.5 ms
User 1
User 2
User 3
User ..

57 © Nokia Siemens Networks
MIMO Technology Overview
Several antenna technologies are summarized under the term MIMO (Multiple Input /
Multiple output):
• Single user DL MIMO
• DL MIMO - transmit diversity
• DL MIMO - spatial Multiplexing
• Multi-user MIMO
• Virtual MIMO (UL MIMO)

58 © Nokia Siemens Networks
DL single user MIMO – with 2 antennas
DL MIMO – Transmit diversity
Enhanced cell edge performance,
capacity increase
• 2 TX antennas
• Single stream (code word)
DL MIMO – Spatial multiplexing
Two code words (A+B) are
transmitted in parallel on the
same PRB to one UE which
doubles the peak rate.
A
B
Doubles the peak rate at good channel quality (near
BTS)
• 2 TX antennas
• Spatial multiplexing with two code words
Optimum solution: Dynamic selection between
• Spatial multiplexing with two code words (UE nearthe BTS)
• Transmit diversity with one code word (UE far away from BTS to improve
link budget / SNIR)
One code word A is transmitted via
two antennas on the same PRB to
one far away UE which improves the
link budget / SNIR.
59 © Nokia Siemens Networks
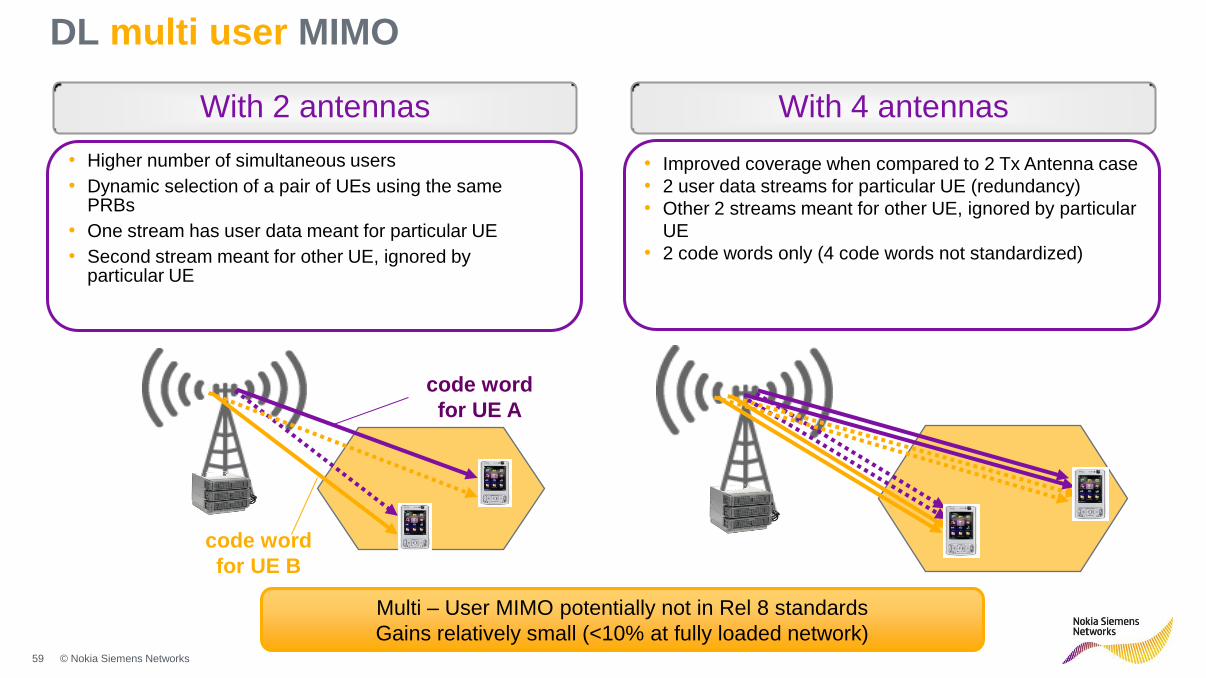
DL multi user MIMO
• Higher number of simultaneous users
• Dynamic selection of a pair of UEs using the same PRBs
• One stream has user data meant for particular UE
• Second stream meant for other UE, ignored by particular UE
• Improved coverage when compared to 2 Tx Antenna case
• 2 user data streams for particular UE (redundancy)
• Other 2 streams meant for other UE, ignored by particular
UE
• 2 code words only (4 code words not standardized)
With 2 antennas With 4 antennas
code word
for UE B
code word
for UE A
Multi – User MIMO potentially not in Rel 8 standards
Gains relatively small (<10% at fully loaded network)

60 © Nokia Siemens Networks
UL multi user MIMO (virtual MIMO)
• In uplink, multi-stream transmission from single UE is not supported.
• single Tx antenna and power amplifier at UE
• So-called virtual MIMO or UL MU-MIMO is used instead
• Two users are scheduled to use the same resource so the base station receives multi-stream transmission on the same PRB
Increased UL cell throughput by multi user diversity gains
UE B data stream
UE A data stream
61 © Nokia Siemens Networks
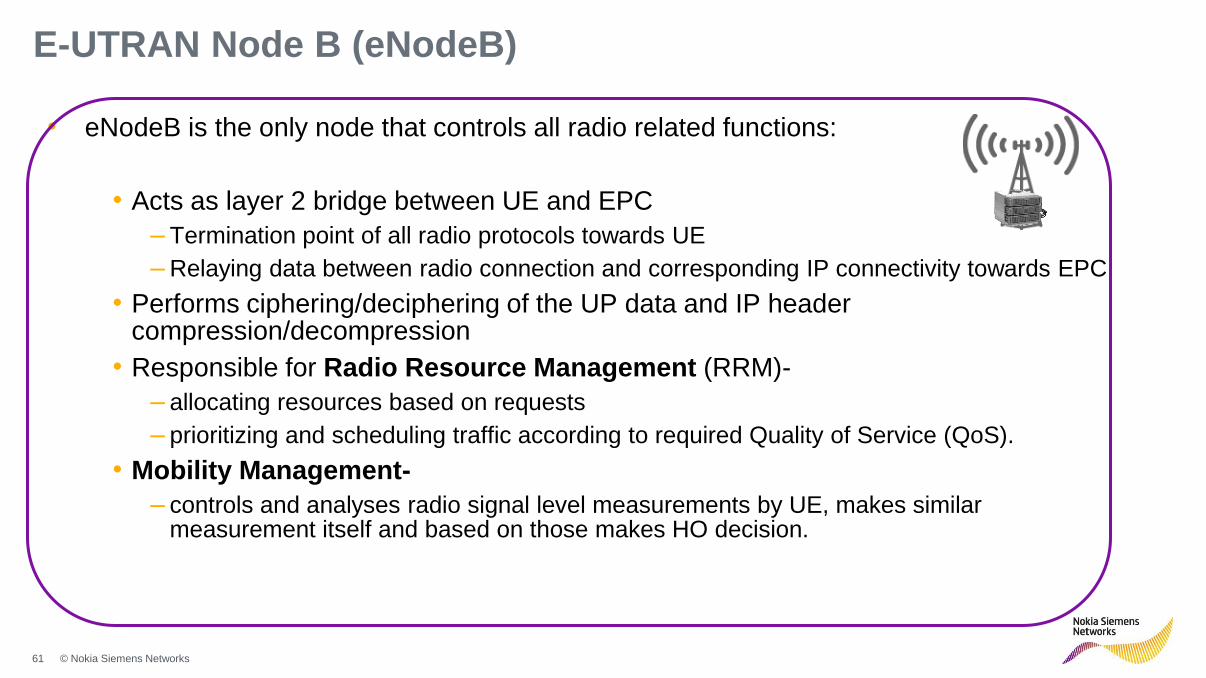
E-UTRAN Node B (eNodeB)
• eNodeB is the only node that controls all radio related functions:
• Acts as layer 2 bridge between UE and EPC
– Termination point of all radio protocols towards UE
– Relaying data between radio connection and corresponding IP connectivity towards EPC
• Performs ciphering/deciphering of the UP data and IP header compression/decompression
• Responsible for Radio Resource Management (RRM)-
– allocating resources based on requests
– prioritizing and scheduling traffic according to required Quality of Service (QoS).
• Mobility Management-
– controls and analyses radio signal level measurements by UE, makes similar measurement itself and based on those makes HO decision.

62 © Nokia Siemens Networks
LTE
Introduction
WCDMA/HSPA/HSPA+
LTE-Advanced
Summary
Agenda
Radio Access Overview
LTE Spectrum
Introduction
Core Network Overview
QoS in LTE
Voice over LTE (VoLTE)
Self Organizing Network (SON)

63 © Nokia Siemens Networks
Key architectural concept. Flat and cost effective Mobile Network
Access Core Control
W-CDMA BTS RNC
IMS HLR/HSS
2G BTS BSC
MSC MGW
SGSN GGSN
LTE BTS (eNodeB)
MGW
MME
SAE-GW
• New air I/F providing higher data throughputs
• LTE provides flexibility for spectrum re-farming and new
spectrum
• LTE can operate in a number of different frequency bands
• Simplified, flat network architecture based on IP reduces
operators’ cost per bit significantly
• Interworking with legacy systems is an integral part of service
continuity
• Re-use of existing equipment as much as possible
Improved flexible radio technology Simpler architecture for reduced OPEX
GSM/EDGE/
UMTS/HSPA
LTE / SAE

64 © Nokia Siemens Networks
Main EPS Standards: 23.401
• Defines EPS architectures for 3GPP accesses using GTP protocol (GTP on S5/S8) – One example is given below
• Defines role of MME, SGW and PGW
• Two GW configurations: standalone SGW and PGW, co-located SGW/PGW
• Defines high level procedures (mobility management, session management, interworking with existing accesses, etc.)
SGi
S12
S3
S1-MME
PCRF
Gx
S6a
HSS
Operator's IP Services
(e.g. IMS, PSS etc.)
Rx
S10
UE
SGSN
LTE-Uu
E-UTRAN
MME
S11
S5 Serving Gateway
PDN Gateway
S1-U
S4
UTRAN
GERAN
Non-roaming architecture for 3GPP accesses

65 © Nokia Siemens Networks
Trusted Non-3GPP IP Access
Evolved Packet Core (EPC)
2G
ePDG
User plane
Control plane
Untrusted Non-3GPP IP Access
LTE
SGSN
BSC
RNC
Radio Access Network Other access networks
eNode-B MME
S-GW P-GW
IMS
Services in Packet
Data Network
Internet
Operator services
Company intranets
PCRF HLR/HSS AAA
3G
HSGW
CDMA Access Network
Charging
3GPP R8 Architecture: Flat architecture for high efficiency

66 © Nokia Siemens Networks
Core Technology Overview Mobility Management Entity
• C-Plane Part
• Session & Mobility management
• Idle mode mobility management
• Paging
• AAA Proxy
Serving Gateway
• User plane anchor for mobility between the 2G/3G access system and the LTE access system.
• Resides in visited network in roaming cases
• Lawful Interception
Packet Data Network Gateway
• Gateway towards Internet/Intranets
• User plane anchor for mobility between 3GPP and non-3GPP access systems (HA).
• Charging Support
• Policy and Charging Enforcement (PCEF) *)
• Packet Filtering
• Lawful Interception
HLR/HSS
(AAA)
PCRF
SAE-GW: System Architecture Evolution Gateway
= S-GW + PDN-GW
*) PCRF: Policy and Charging Rules Function communicates with
PCEF (Policy and Charging Enforcement Function within
PDN SAE GW)
PDN GW
MME
Serving GW
PDN
IMS
PCEF
SAE-GW

67 © Nokia Siemens Networks
LTE
Introduction
WCDMA/HSPA/HSPA+
LTE-Advanced
Summary
Agenda
Radio Access Overview
LTE Spectrum
Introduction
Core Network Overview
QoS in LTE
Voice over LTE (VoLTE)
Self Organizing Network (SON)

68 © Nokia Siemens Networks Dept. / Author / Date
LTE is here already
LTE is happening
Voice remains an essential service
Source: Pyramid Research, Heady Reading 12/2010 Revenue source
LTE as the fastest
developing mobile system
technology ever. GSA Janauary 5,
2012
GSA Janauary 5, 2012

69 © Nokia Siemens Networks
Drivers for Voice over LTE (VoLTE)
• LTE is driven by mobile data growth
• Voice service is mandatory and desirable with increased voice efficiency with LTE
• LTE is full-IP thus voice must be handled over IP
• Although Internet players may enter LTE networks, operators have unique proposition to offer:
– Same end-user experience and QoS regardless of used access
– Voice service continuity between different accesses
• Over time Voice over LTE will grow to become the mainstream mobile voice technology
LTE
3GPP
3GPP2 0
25
50
75
100
201x 202x
% of voice subscribers (illustrative)
0
5
10
15
20
25
30
35
40
45
50
GSM
EFR
GSM
AMR
GSM
DFCA
WCDMA
CS voice
5.9 kbps
HSPA
VoIP/CS
12.2 kbps
HSPA CS
5.9 kbps
LTE VoIP
12.2 kbps
Use
r p
er M
Hz
15 x more users per MHz with LTE than with GSM EFR!

70 © Nokia Siemens Networks
Potential voice evolution steps in LTE
LTE used for high speed packet data access only
– Operator voice service provided over CS network
Fallback to CS voice
– LTE network is used for data only
– Terminal is simultaneously registered to both LTE and 2G/3G CS network
– Voice calls are initiated and received over CS network
Single radio Voice Call Continuity (VCC)
– Operator provides VoIP over LTE
– IMS acts as control machinery
– Voice calls can be handed over to CS network
All-IP network
– Operator provides VoIP over LTE
– IMS acts as control machinery
– Voice calls can be handed over to other packet switched networks

71 © Nokia Siemens Networks
CSFB SRVCC VoLTE
• Fallback to 2G/3G/CDMA access for voice
• LTE SMS
• MSC Server / MSC for voice
• Voice over LTE
• IMS for voice and Telecom Application Server for voice
• Rich Communication Services
The transition to VoLTE technology

72 © Nokia Siemens Networks
LTE data and voice evolution
20XX 2010
LTE
data
2G/3G
voice
Data oriented
terminals
Data & voice
oriented
terminals
2G/3G LTE
SRVCC CSFB Broad Band
Single radio
terminals
LTE
terminals
LTE 2G/3G LTE
2012 2013
2010 (Commercial) – VoLTE
Operator VoIP in laptops + LTE dongles in
LTE hot spots or rural areas i.e. VoIP (fixed
voice replacement) + velco terminals for
LTE/CDMA operators
2H11 (Commercial) – CSFB
LTE smartphones with CSFB capability
available.
1H12 (Commercial) – VoLTE with QoS
Operator VoIP in laptops + LTE dongles and smatrphones in LTE hot spots with QoS.
2013 (Commercial) – SR-VCC
LTE smartphones with VoLTE and SR-VCC.

73 © Nokia Siemens Networks
How many bands can current LTE device chipsets support ?
ST-Ericsson M710 [LTE/HSPA/EDGE, 4 LTE, 3 HSPA, 4 GSM]
Qualcomm MDM9200 [LTE/DC-HSPA+/GSM]
Qualcomm MDM9600 [LTE/DC-HSPA+/CDMA/GSM]
Nvidia Espresso 410 [LTE/HSPA+/GSM]
• 1 - 4 LTE bands with
• up to 4 HSPA bands
• up to 4 GSM bands
• up to 3 CDMA2000 bands
• Possible band combinations
vary between chipset vendors
• All leading platform vendors
are including TDD support
on their multimode solutions
Multimode chipset platforms

74 © Nokia Siemens Networks
LTE
Introduction
WCDMA/HSPA/HSPA+
LTE-Advanced
Summary
Agenda
Radio Access Overview
LTE Spectrum
Introduction
Core Network Overview
QoS in LTE
Voice over LTE (VoLTE)
Self Organizing Network (SON)

75 © Nokia Siemens Networks
LTE QoS Overview
eNode-B
SAE GW QoS parameters in open S1 interface are standardized
QoS algorithms in radio network are not
standardized
Full network control without UE QoS
requirements
QoS is bearer based – not packet based
UE
S1
Similar to 3G

76 © Nokia Siemens Networks
Network-centric QoS scheme
Substantially optimized Bearer handling compared to 3G networks
Single scalar label (QCI) is a pointer to a set of QoS parameters
Network-centric QoS scheme reduces complexity of UE implementations
• Always on default EPS bearer available after initial access
• Further dedicated EPS bearer setup on network request (e.g. for VoIP calls)
• Does not require support from terminal application clients or device operating system
Residual BER
SDU error rate
Delivery of erroneous SDUs
Max SDU size
Delivery order
Transfer delay
Traffic class
Traffic priority handling
ARP
Max. bit rate
Guaranteed bit rate
QoS Aware
QCI
ARP
Max. bit rate
Guaranteed bit rate
Non-QoS Aware
Aggregate max. bit rate (AMBR)
QCI... QoS control identifier
ARP… Allocation/Retention priority

77 © Nokia Siemens Networks
QoS Class Indentifier (QCI) Table in 3GPP 23.203
GBR 1
Guarantee Delay budget Loss rate Application QCI
GBR
100 ms 1e-2 VoIP
2
GBR
150 ms 1e-3 Video call
3
GBR
300 ms 1e-6 Streaming
4
Non-GBR 100 ms 1e-6 IMS signalling 5
Non-GBR 100 ms 1e-3 Interactive gaming 6
Non-GBR 300 ms 1e-6
TCP protocols : browsing, email, file download
7
Non-GBR 300 ms 1e-6 8
Non-GBR 300 ms 1e-6 9
Priority
2
4
5
1
7
6
8
9
50 ms 1e-3 Real time gaming 3

78 © Nokia Siemens Networks
Mapping of 3G and LTE QoS Parameters
Conversational 1
Traffic class QCI
2
3
4
Interactive 5
6
7
8
Background 9
Conversational
Streaming
Streaming
Interactive
Interactive
Interactive
-
Traffic handling priority
1
-
-
-
-
1
2
3
-
Signalling indication
Yes
-
-
-
-
-
-
-
Speech
Source statistic descriptor
-
-
Unknown
Speech
Unknown
-
-
-
UMTS QoS LTE

79 © Nokia Siemens Networks
Network Initiated Bearer in LTE
UE
SGSN
UE
SGSN
UE
MME
UE
MME
3G UTRAN LTE E-UTRAN
= Non-GBR bearer for IMS signalling
= UE initiated GBR bearer (VoIP)
= Network initiated GBR bearer (VoIP)
• Guaranteed bit rate QoS requires its own bearer
• New bearer must be initiated by UE in 3G
• New bearer can be initiated by network in LTE less requirements for the terminal and better network control
IMS VoIP IMS VoIP

80 © Nokia Siemens Networks
LTE
Introduction
WCDMA/HSPA/HSPA+
LTE-Advanced
Summary
Agenda
Radio Access Overview
LTE Spectrum
Introduction
Core Network Overview
QoS in LTE
Voice over LTE (VoLTE)
Self Organizing Network (SON)

81 © Nokia Siemens Networks
What is SON?
• SON originally refers to a network that can organize itself in the form of
– Self-Configuration, e.g. initial parameter deployment,…
– Self-Optimization, e.g. tuning the handover thresholds, …
– Self-Healing, e.g. recovering from eNB failures automatically,…
• This is implemented as closely network related automation by
– Centralized SON: associated with slow update rate and based on long term statistics where many cells are involved in optimization process. Implemented using network/element management system (OAM).
– Distributed SON: require fast reaction time which affect only few cells, parameters have only local impact but configuration or status about neighbour cells are required. Optimization algorithms are implemented in eNodeB
– Localized SON: require fast reaction time and only single cell involved- no impact on neighbour cells. Implemented by Radio Resource Management (RRM) in eNodeB
– Hybrid SON: all the above 3 processes are used simultaneously for different use cases.
• SON can be considered as a specific type of automation

82 © Nokia Siemens Networks
Why SON has been developed
• Group of leading CSP’s indentified and specified in 2006 NGMN forum the Self Organising Networks as an important, new solution to meet the challenges of
• data traffic growth
• declining voice ARPU
• investments to new technologies and network expansions
• SON is today 3GPP standardised for LTE
• Standardisation defines concept, interfaces and measurements for SON leaving e.g. implementation methods open.
• SON key objectives
• Reduce complexity and cost of network operations
• Maintain and improve quality of the networks
• Cost effective introduction of new technologies
• Protect network investments

83 © Nokia Siemens Networks
Self-Organizing Networks Intelligent Automation e2e
Self-Healing
• Error detection
• Error mitigation
• Alarm Mgt.
• Root cause analysis
Self-Optimization
• Interference
• Mobility
• Load/Capacity
• Measurement Collection
• Energy
Self-Configuration
• Site Creation
• Connection
• Configuration
• Neighbours
Quality
Capacity
Coverage
Automation
• Minimise manual tasks
• Reduce human errors
• Speeds-up operations
• Operational efficiency
OPEX
QoE

84 © Nokia Siemens Networks
SON- some important use cases
Configuration of Physical Cell ID (self configuration)
Automatic Neighbor Relations (ANR) (self configuration)
Mobility Load Balancing (MLB) (self optimization)
Mobility Robustness Optimization (MRO) (self optimization)
Energy Saving (self optimization)
Minimization of Drive Test (MDT)

85 © Nokia Siemens Networks Cinzia Sartori Self Organising Networks – London 2010
SON framework in 3GPP
• Release 8 functionality • Self-configuration procedures
• Release 9 enhancements • Self-optimization procedures • LTE Energy Saving Intra-RAT
• Release 10 objectives • Extend Self-optimization procedures , including inter-RAT • Minimization of Drive Test (MDT) • Energy Saving extension, including Multi-RAT (Study Item) • 3G-ANR • SON Conflict Resolution
• Release 11 proposals on hold until in June 2011 (RAN#52) • LTE SON extensions • MDT enhancements • HSDPA SON
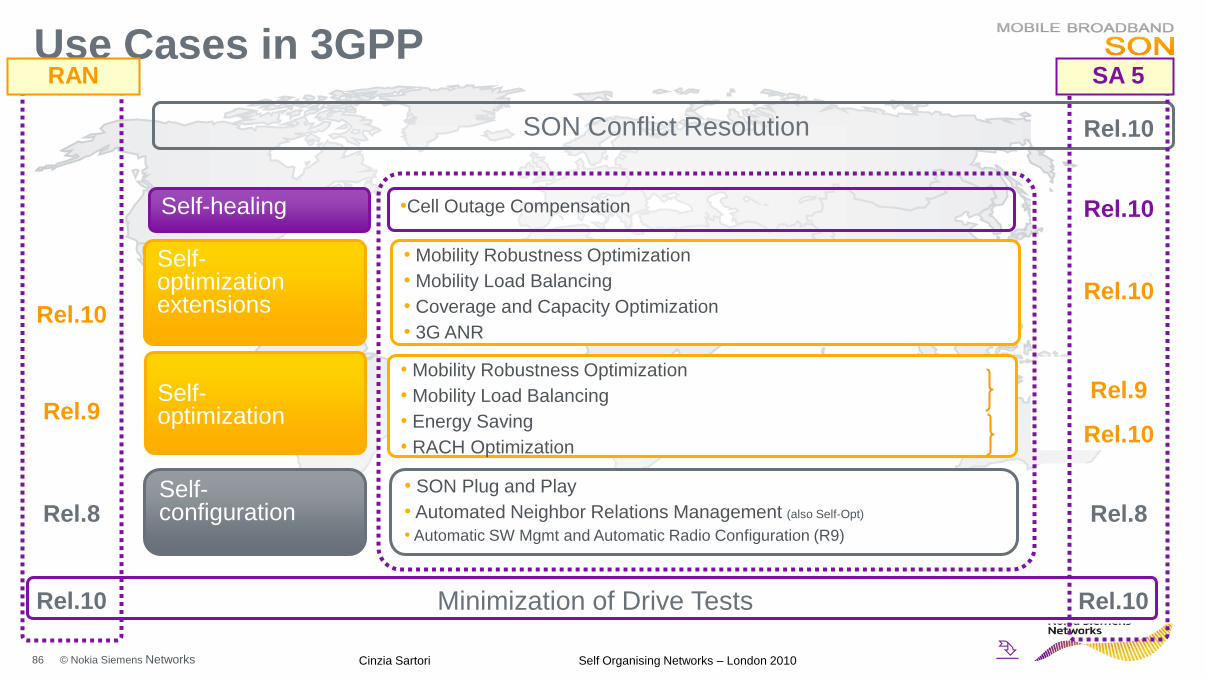
86 © Nokia Siemens Networks Cinzia Sartori Self Organising Networks – London 2010
Use Cases in 3GPP
Self-healing
Self- optimization
Self- configuration
• Mobility Robustness Optimization
• Mobility Load Balancing
• Energy Saving
• RACH Optimization
• SON Plug and Play
• Automated Neighbor Relations Management (also Self-Opt)
• Automatic SW Mgmt and Automatic Radio Configuration (R9)
Rel.9
Rel.8
Rel.10
Self- optimization extensions
• Mobility Robustness Optimization
• Mobility Load Balancing
• Coverage and Capacity Optimization
• 3G ANR
Rel.10
Rel.8
Rel.10
Rel.10
Minimization of Drive Tests
Rel.10
Rel.10
Rel.9
•Cell Outage Compensation
Rel.10 SON Conflict Resolution
SA 5 RAN

87 © Nokia Siemens Networks
LTE
Introduction
WCDMA/HSPA/HSPA+
LTE-Advanced
Summary
Agenda

88 © Nokia Siemens Networks
Why do we now talk about LTE-Advanced?
• ITU-R has issued a Circular Letter early 2008 to invite candidate Radio Interface Technologies (RIT) for IMT-Advanced
• ITU-R requires “enhanced peak data rates” for IMT-Advanced:
– 100 Mbit/s for high mobility
– 1 Gbit/s for low mobility
• World Radio Conference (WRC-07) took decisions on Frequency Band identifications in November 2007 impacting IMT-2000 and IMT-Advanced
• In March 2008 3GPP has started a new Study Item on LTE-Advanced to enhance LTE to fulfill all IMT-Advanced requirements and to become IMT-Advanced candidate
• Currently, 3GPP RAN is studying and evaluating the performance of the new relevant technology components.
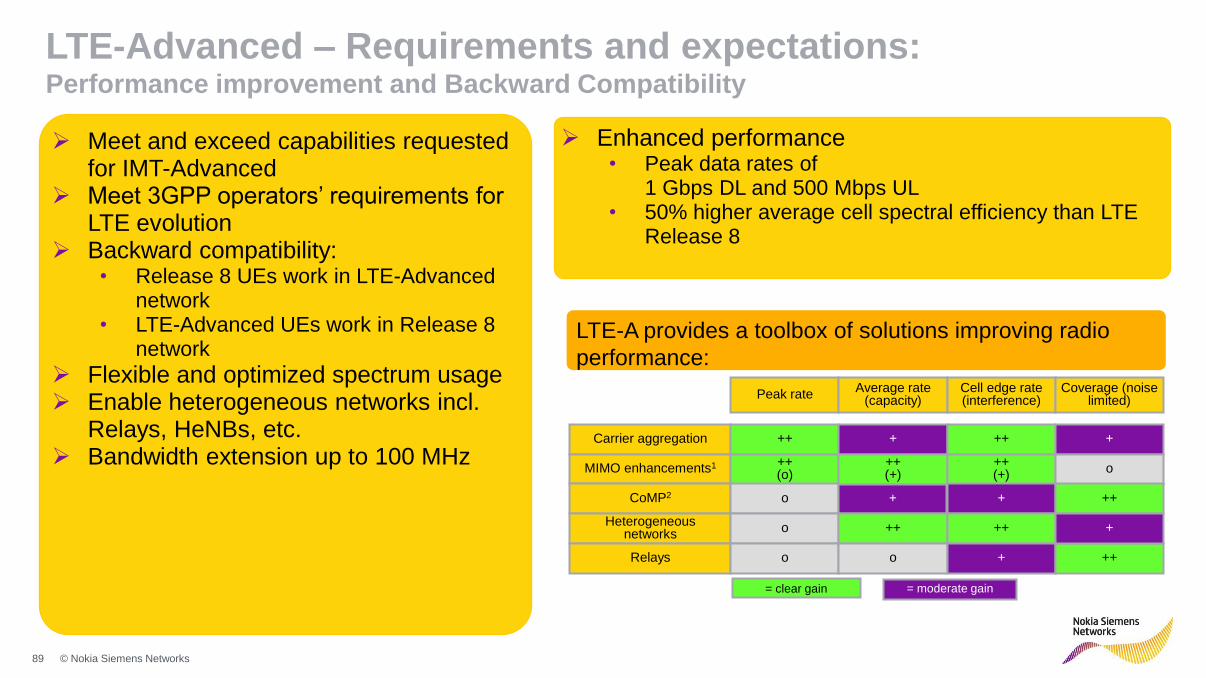
89 © Nokia Siemens Networks
Meet and exceed capabilities requested for IMT-Advanced
Meet 3GPP operators’ requirements for LTE evolution
Backward compatibility: • Release 8 UEs work in LTE-Advanced
network • LTE-Advanced UEs work in Release 8
network
Flexible and optimized spectrum usage Enable heterogeneous networks incl.
Relays, HeNBs, etc. Bandwidth extension up to 100 MHz
= clear gain = moderate gain
Carrier aggregation
MIMO enhancements1
Peak rate
CoMP2
Average rate (capacity)
Cell edge rate (interference)
Coverage (noise limited)
++ + ++ +
++ (o)
++ (+)
++ (+)
o
o + + ++
Heterogeneous networks o ++ ++
Relays o o + ++
+
LTE-A provides a toolbox of solutions improving radio
performance:
Enhanced performance • Peak data rates of
1 Gbps DL and 500 Mbps UL • 50% higher average cell spectral efficiency than LTE
Release 8
LTE-Advanced – Requirements and expectations: Performance improvement and Backward Compatibility

90 © Nokia Siemens Networks
LTE-Advanced: Carrier aggregation More dynamic spectrum usage for better user experience
3 Gbps
• Will be specified in 3GPP Rel.11
or later
• Most operators have significantly less
spectrum for LTE
• Even HD streaming services demand
less than 20Mbps
Resource allocation gain
• Ultrafast resource allocation by
scheduler instead of handover
• Users dynamically get the best
resources of aggregated carrier
• Higher average data rates
Peak data rate addition
• enables competitive peak data
rates on non-contiguous spectrum
• Mitigates the challenge of
fragmented spectrum
Example:
spectrum assets peak data rate
on Cat.4 device with carrier
aggregation
150 Mbps
75 Mbps
>200 Mbps 20MHz in 2.6GHz band
10MHz in 800MHz band
Relevant scenarios under standardisation (3GPP Rel.10/11)
20MHz 300Mbps
20MHz 300Mbps
20MHz 300Mbps 1.5Gbps
20MHz 300Mbps
20MHz 300Mbps
20MHz 600Mbps
20MHz 600Mbps
20MHz 600Mbps 3Gbps
20MHz 600Mbps
20MHz 600Mbps
10MHz in 800MHz band
20MHz in 2.6GHz band

91 © Nokia Siemens Networks
LTE-Advanced: Carrier aggregation Initial focus on Downlink
CA band WI (planned for Dec. 2012)
CA Band E-UTRA operating band
CA_3-7 3 + 7 (TeliaSonera)
CA_4-13 4 + 13 (Verizon)
CA_4-17 4 + 17 (AT&T)
CA_20-7 20 + 7 (Orange etc.)
CA_5-12 5 + 12 (US Cellular)
CA_4-12 4 + 12 (Cox)
CA_2-17 2 + 17 (AT&T)
CA_4-5 4 + 5 (AT&T)
CA_5-17 5 + 17 (AT&T)
CA_1-7 1 + 7 (China Telecom)
CA_3-5 3 + 5 (SK Telecom)
CA_4-7 4 + 7 (Rogers)
CA_20-3 20 + 3 (Vodafone)
CA_20-8 20 + 8 (Vodafone)
Inter-band CA:
CA Band E-UTRA operating band
CA_41 41 (Clearwire, CMCC)
CA_38 38 (CMCC)
CA_7 7 (CUC,CTC,Telenor, etc.)
CA_25 25 (Sprint;target June 2013)
CA Band E-UTRA operating bands
CA_1-5 1 + 5 (generic, Korea)
Carrier aggregation bands in 3GPP rel 10
(Source: TS36.104, version 10.4.0)
Inter-band CA:
Intra-band CA:
CA Band E-UTRA operating band
CA_1 1 (generic example)
CA_40 40 (generic example)
Intra-band CA:
• Downlink carrier aggregation
for 2 component carriers
• Up to 40 MHz combined
bandwidth
• Inter-band
• Intra-band
contiguous allocation
• PCC* based mobility
• 3GPP defined band
combinations
*Primary component carrier:
(from 3GPP Rel.8) -> mobility, data
*Secondary component carrier:
where available -> add-on data speed
LTE FDD
Band MHz Uplink MHz Downlink MHz
1 2x60 1920-1980 2110-2170 UMTS core 2 2x60 1850-1910 1930-1990 US PCS 3 2x75 1710-1785 1805-1880 GSM 1800 4 2x45 1710-1755 2110-2155 NAM AWS 5 2x25 824-849 869-894 850 7 2x70 2500-2570 2620-2690 2600 FDD 8 2x35 880-915 925-960 GSM 900
9 2x35 1749-1784 1844-1879 Japan, Korea 1700
10 2x60 1710-1770 2110-2170 US AWS extension.
11 2x20 1427.9-1447.9 1475.9-1495.9 Japan 1500
12 2x18 698-716 728-746 US
13 2x10 777-787 746-756 Verizon 14 2x10 788-798 758-768 US – Public Safety 17 2x12 704-716 734-746 AT&T 18 2x15 815-830 860-875 Japan – 800 (KDDI)
19 2x15 830-845 875-890 Japan – 800 (DoCoMo)
20 2x30 832-862 791-821 EU 800 DD, MEA 21 2x15 1448-1463 1496-1511 Japan 1500
22 2x80 3410-3490 3510-3590 3.5 GHz FDD (band 42–FDD variant)
23 2x20 2000-2020 2180-2200 US S-band
24 2x34 1626.5-1660.5 1525-1559 US (LightSquared) 25 2x65 1850-1915 1930-1995 US PCS extension (Sprint)
26 2x35 814-849 859-894 850 extension (Korea-KT, Sprint)
TD-LTE Band MHz Uplink MHz Downlink MHz 33 1x20 1900-1920 1900-1920 UMTS core – TDD
34 1x15 2010-2025 2010-2025 UMTS core – TDD, China TD/SCDMA
35 1x60 1850-1910 1850-1910 US (band 2 – TDD variant)
36 1x60 1930-1990 1930-1990 US (band 2 – TDD variant)
37 1x20 1910-1930 1910-1930 US PCS centre-gap
38 1x50 2570-2620 2570-2620 China, LatAM, Europe 39 1x40 1880-1920 1880-1920 China PHS
40 1x100 2300-2400 2300-2400 MEA, India, China, Russia 41 1x194 2496-2690 2496-2690 US (Clearwire)
42 1x200 3400-3600 3400-3600 3.4/5 GHz – TDD
43 1x200 3600-3800 3600-3800 3.7/8 GHz – TDD
Source: TS 36.101; commercialized bands
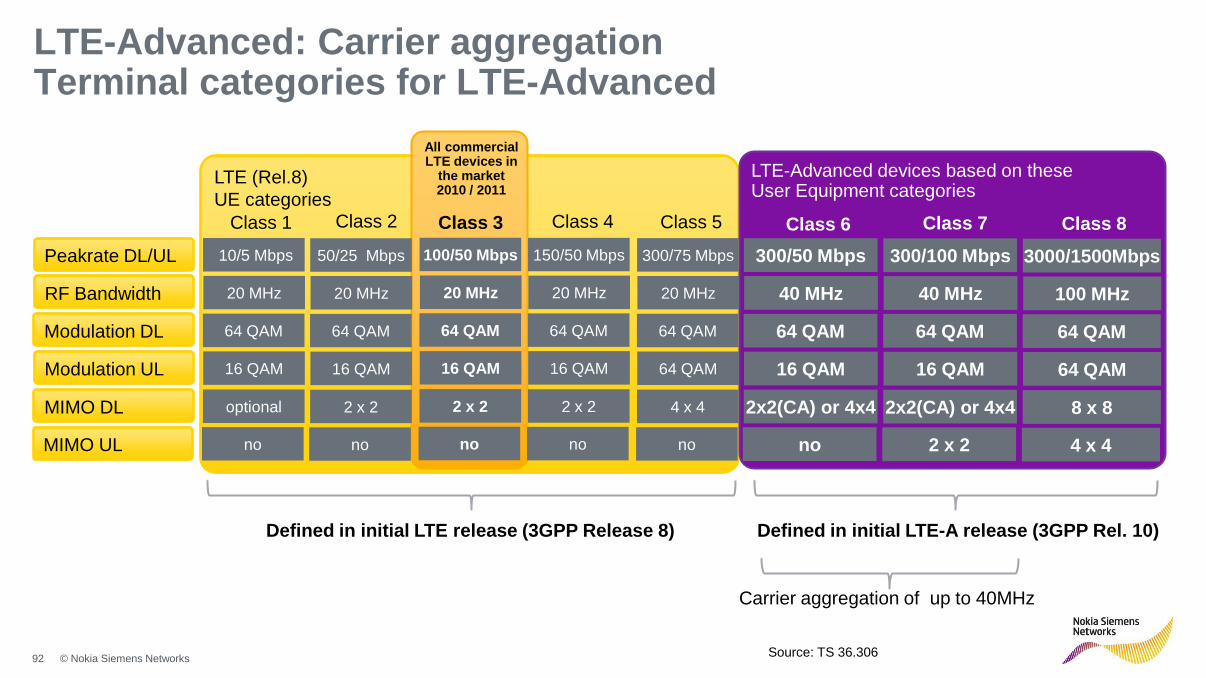
92 © Nokia Siemens Networks
LTE (Rel.8)
UE categories
LTE-Advanced: Carrier aggregation Terminal categories for LTE-Advanced
LTE-Advanced devices based on these User Equipment categories
All commercial LTE devices in
the market 2010 / 2011
Class 1 Class 2 Class 5 Class 3 Class 4
Peakrate DL/UL 10/5 Mbps 50/25 Mbps 100/50 Mbps 150/50 Mbps 300/75 Mbps
RF Bandwidth 20 MHz 20 MHz 20 MHz 20 MHz 20 MHz
Modulation DL 64 QAM 64 QAM 64 QAM 64 QAM 64 QAM
Modulation UL 16 QAM 16 QAM 16 QAM 16 QAM 64 QAM
MIMO UL no no no no no
Class 8 Class 6 Class 7
300/50 Mbps 300/100 Mbps 3000/1500Mbps
40 MHz 40 MHz 100 MHz
64 QAM 64 QAM 64 QAM
16 QAM 16 QAM 64 QAM
no 2 x 2 4 x 4
Defined in initial LTE release (3GPP Release 8) Defined in initial LTE-A release (3GPP Rel. 10)
MIMO DL optional 2 x 2 2 x 2 2 x 2 4 x 4 2x2(CA) or 4x4 2x2(CA) or 4x4 8 x 8
Carrier aggregation of up to 40MHz
Source: TS 36.306

93 © Nokia Siemens Networks
HSPA+ Long Term HSPA Evolution
Overview - Mobile Broadband Downlink peak data rate evolution
84 Mbps
10 MHz 2x2 MIMO
10 MHz No MIMO 5 MHz
No MIMO
Release 7 Release 8 Release 9 Release 10 Release 11 and beyond 3GPP timeline
42 Mbps 21 Mbps
20 MHz 2x2 MIMO
168 Mbps
LTE LTE-Advanced
40 MHz 2x2 / 4x4 MIMO
336-672 Mbps
20 MHz 2x2 MIMO (4x4 MIMO not optimized)
100 Mbps (Cat.3 devices)
150 Mbps (Cat.4 not yet available)
40 MHz 2x2 / 4x4 MIMO
300 Mbps
(Cat. 6, 7 devices) 100 MHz
8x8 MIMO
3Gbps (Cat. 8 devices)

94 © Nokia Siemens Networks
LTE
Introduction
WCDMA/HSPA/HSPA+
LTE-Advanced
Summary
Agenda

95 © Nokia Siemens Networks
Summary (1/3)
WCDMA/HSPA/HSPA+
Strong momentum and growth in Mobile Broadband with terminals, network technology and applications
WCDMA has both FDD (widely used) and TDD variant with FDD using 5+5 MHz and TDD 5 MHz as single carrier
HSPA/HSPA+ is a mature technology with broad ecosystem support, which will further evolve and will remain dominant technology for many years to come
Carrier aggregation and MIMO pushes the peak data rates and cell throughput

96 © Nokia Siemens Networks
Summary (2/3)
LTE
Motivation of LTE is need for higher peak data rate, spectral efficiency, less round trip delay, packet optimized network, high degree of mobility and spectrum flexibility
LTE has both FDD and TDD variant with frequency allocation flexibility with 1.4, 3, 5, 10, 15 and 20 MHz spectrum
LTE frequency bands for Europe are 2600 (capacity), 1800 (capacity) and 800 (coverage) MHz
LTE uses OFDMA in DL and SC-FDMA UL for multiple access technology. OFDMA in DL minimizes receiver complexity while SC-FDMA improves battery life time in receiver
LTE is packet oriented flat network with minimum no. of nodes- only eNodeB in access and MME, SAE-GW (S-GW/P-GW) in core networks. (additionally, HLR/HSS, PCRF and IMS is required in core)
Voice in LTE is accomplished by CS Fallback (initially) and SR-VCC (later).

97 © Nokia Siemens Networks
Summary (3/3)
SON
SON is a set of network algorithms for simplifying network configuration, optimization and healing
SON algorithms can be centralized targeting multi-cell optimization or distributed for fast and local optimization or a hybrid (combination of all)
SON is not limited to LTE only but many of these SON algorithms are applied to 3G/HSPA networks as well
LTE-Advanced
LTE-A in Rel-10 adds several enhancements in LTE
Improvements in peak and average data rates using carrier aggregation, increased number of antennas and advanced antenna technologies
Further improvements by use of relay and interference management
LTE-A with Rel-10 fulfills and exceeds requirements for IMT-Advanced
LTE-A can achieve peak data rates as high as 3 Gbps in DL and 1.5 Gbps in UL direction with 100 MHz spectrum