unit 1 notes!!!!!!!!!
DESCRIPTION
Unit 1 Notes!!!!!!!!!. Science!!!!. Diffusion is the process that moves particles from areas of high concentration, spreading them to areas of low concentration. Diffusion. Definition – the process by which a characteristic spreads across space from one place to another over time. - PowerPoint PPT PresentationTRANSCRIPT
Unit 1 Notes!!!!!!!!!
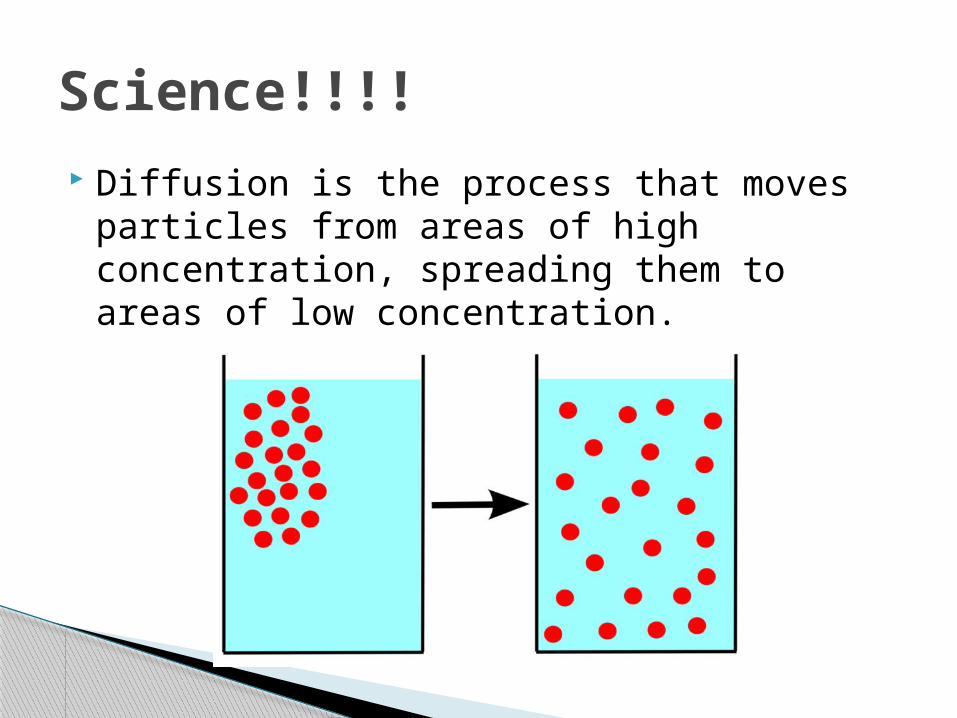
Diffusion is the process that moves particles from areas of high concentration, spreading them to areas of low concentration.
Science!!!!
Definition – the process by which a characteristic spreads across space from one place to another over time.
Easier definition – how ideas or objects spread
2 Kinds of Diffusion◦ Relocation Diffusion◦ Expansion Diffusion
Diffusion
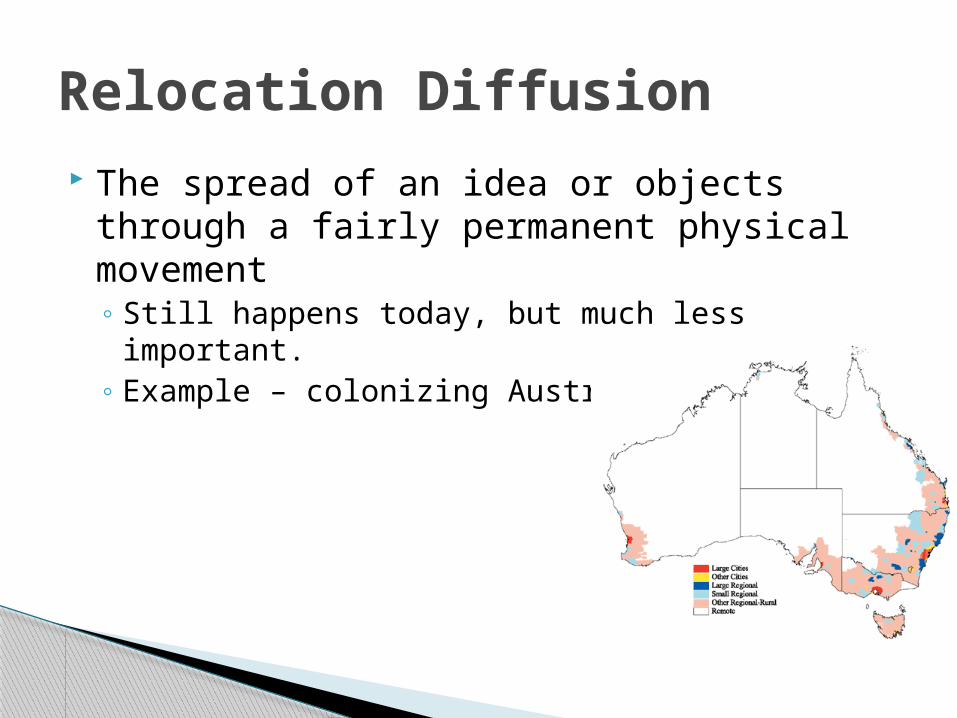
The spread of an idea or objects through a fairly permanent physical movement◦ Still happens today, but much less important.◦ Example – colonizing Australia
Relocation Diffusion
The spreading of ideas/objects through non-permanent physical contact.
3 Types◦ Hierarchichal diffusion◦ Contagious diffusion◦ Stimulus Diffusion
Expansion Diffusion
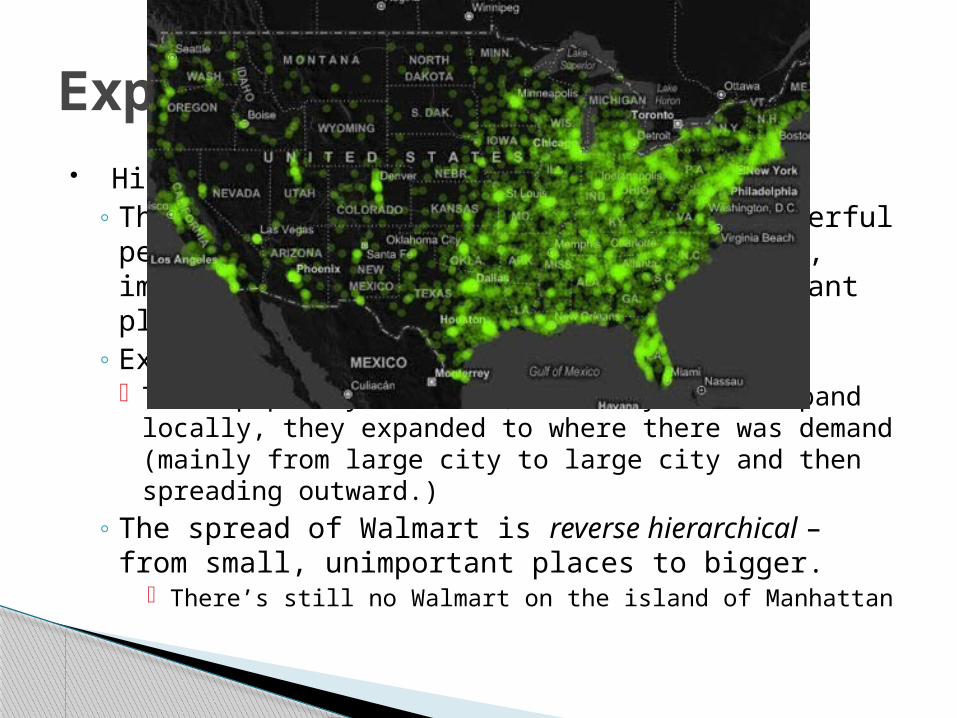
Hierarchichal diffusion◦ The spread of an idea from important/powerful
people to less important people from big, important places to smaller, less important places.
◦ Example: Starbucks The map partly shows it, but they would expand
locally, they expanded to where there was demand (mainly from large city to large city and then spreading outward.)
◦ The spread of Walmart is reverse hierarchical – from small, unimportant places to bigger.
There’s still no Walmart on the island of Manhattan
Expansion Diffusion
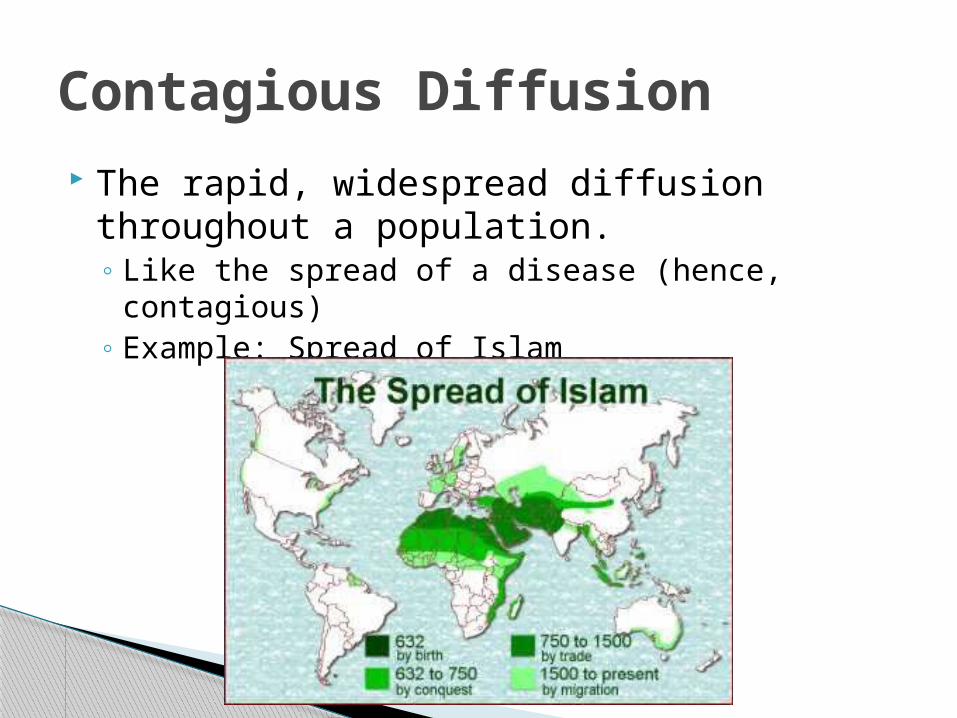
The rapid, widespread diffusion throughout a population.◦ Like the spread of a disease (hence, contagious)◦ Example: Spread of Islam
Contagious Diffusion
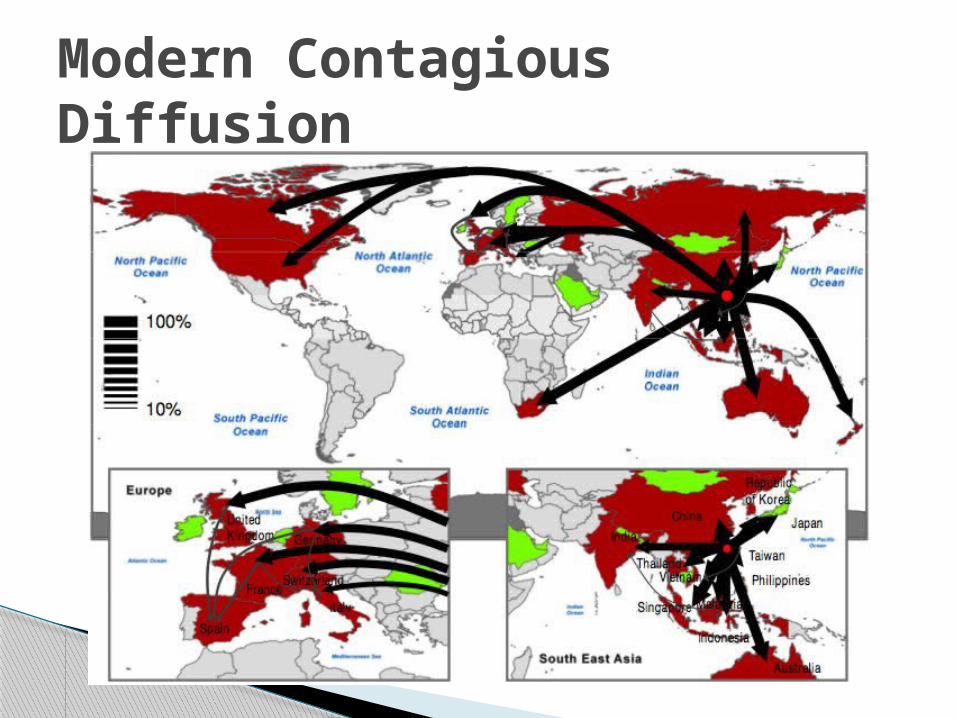
Modern Contagious Diffusion
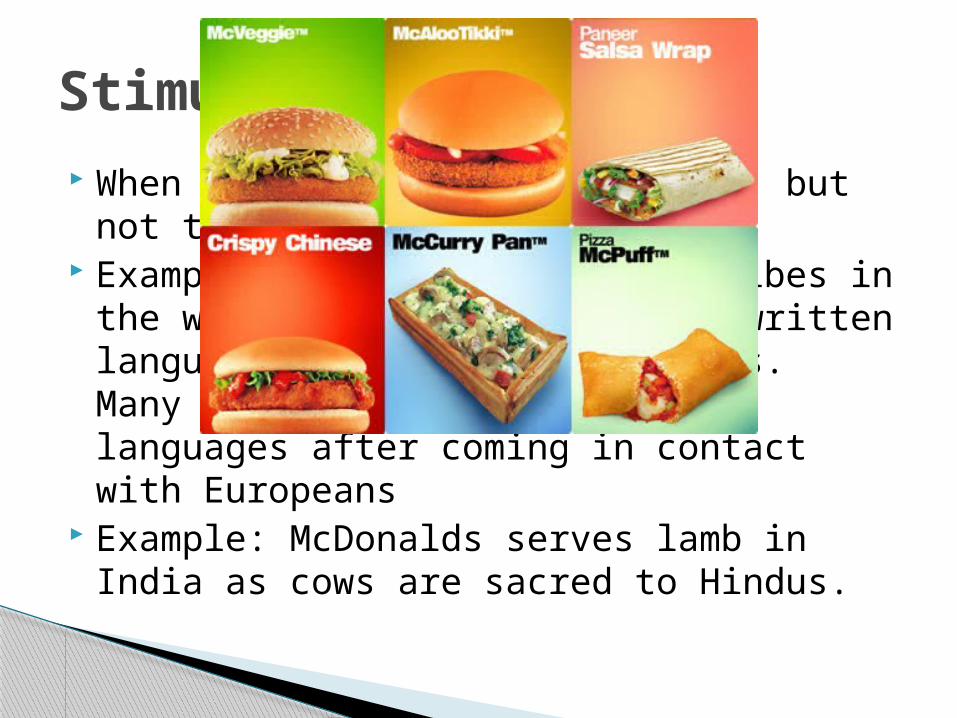
When part of an idea is spread, but not the whole idea itself.
Example: None of the Indian tribes in the what is today the USA had written language in Pre-Columbian times. Many however developed written languages after coming in contact with Europeans
Example: McDonalds serves lamb in India as cows are sacred to Hindus.
Stimulus Diffusion
What is Geography? Defined: description of the Earth’s surface
and the people and processes that shape its landscapes
Literally means “earth writing” Greeks were first to study and classify
geography During the Middle Ages Europe “ignored”
geographic education but other countries in Asia and the Islamic World continued to learn about and study the world around them
The Age of Exploration re-opened Europe to the idea of geography and world understanding
Cultural Ecology – the study of how humans and the environment interact◦ Old central theory – environmental determinism◦ Current central theory – environmental possibilism
Cultural Ecology
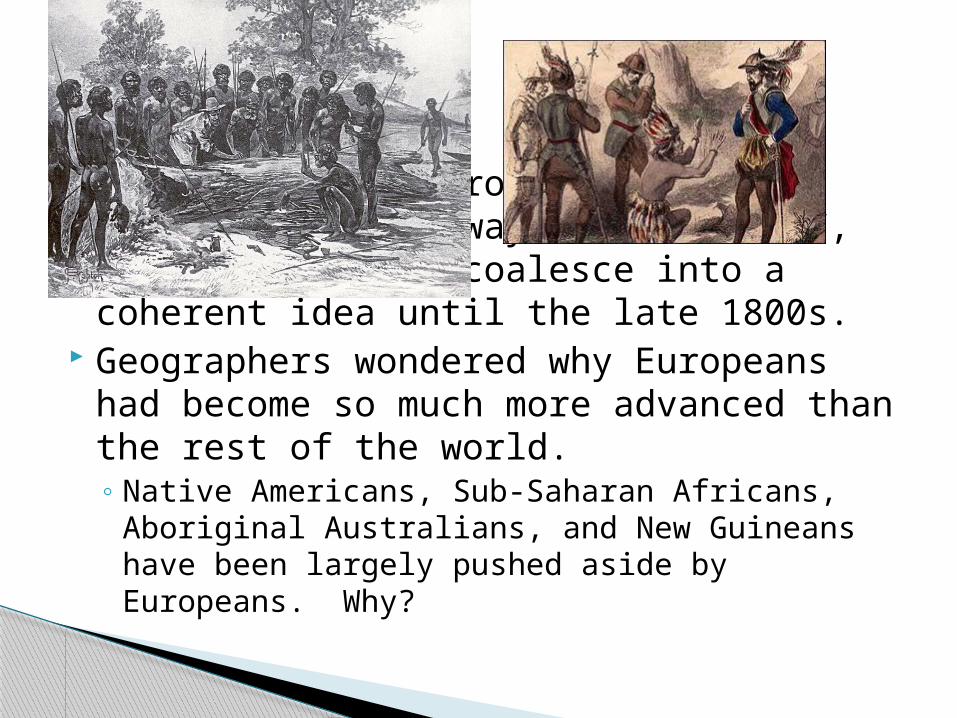
The ideas of environmental determinism date way back to 64 BC, but don’t really coalesce into a coherent idea until the late 1800s.
Geographers wondered why Europeans had become so much more advanced than the rest of the world.◦ Native Americans, Sub-Saharan Africans,
Aboriginal Australians, and New Guineans have been largely pushed aside by Europeans. Why?
Some people decide it’s because they have better genes. ◦ In other words the belief that white people are better,
stronger, smarter, etc.◦ Leads to things like eugenics.
More charitable (though still wrong people) will say it’s because of the environment in Europe, which leads to a school of thought called environmental determinism.◦ In other words, white people are not smarter, they’ve
just been living in places that make it easier to thrive.
Definition - the belief that the environment causes ALL cultural development.◦ Determinists believe that individual decisions and
social conditions have virtually no impact on the way societies develop.
◦ According to determinists, how well your society develops is 100% dependent on where you live.
◦ However, due to it’s Eurocentric bias and some flaws in the theory, it had largely been dropped by the 1940s when it returns in a mutated form as . . .
Environmental determinism
Definition – the belief that the environment can limit a culture’s growth, however, but that people create culture as a group.◦ A softer view of environmental determinism, using
some of the same ideas without all the harshness! A lot of the discussion of the subject has
died down as it’s often seen as racist, but some still say possibilism is a good way to explain European dominance in the world.
Environmental possibilism
Carl Sauer – “The cultural landscape is fashioned from a natural landscape by a cultural group. Culture is the agent, the natural are the medium, the cultural landscape is the result. ”
That’s beautiful. Let’s try something a little more precise:
The cultural landscape consists of material aspects of culture that characterize Earth’s surface.
What the heck is the cultural landscape, anyway?
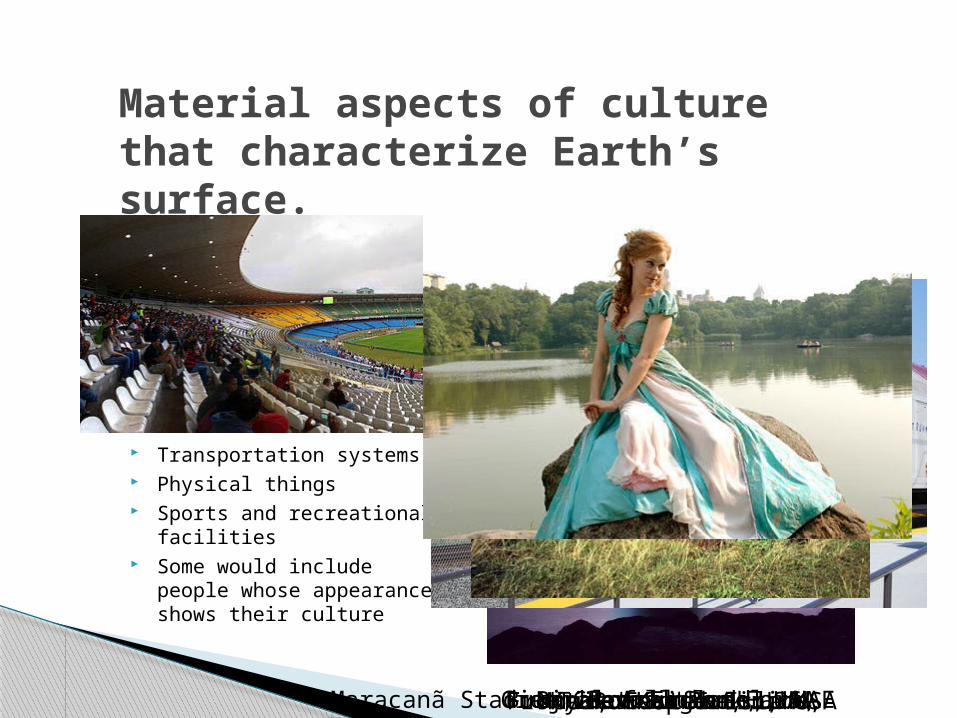
Buildings Shrines Signage Economic and agricultural
structures Crops and agricultural fields Transportation systems Physical things Sports and recreational
facilities Some would include people
whose appearance shows their culture
Material aspects of culture that characterize Earth’s surface.
Burj al Arab Hotel, UAEKyoto Knife Shrine, JapanTimes Square, USAGreen Revolution Farm, GhanaBank of England, UKFront Runner Train, USAMoai, Easter IslandMaracanã Stadium, BrazilCentral Park, USA
To create a useful map, you have to do some generalization.◦ Creating a map with every possible bit of
information on it will create a useless map It will be too cluttered to be easily read Very few people are looking for EVERYTHING at the
same time, rather usually a specific thing.◦ Generalizing a map means excluding information
that isn’t directly involved in what you’re planning for your map to accomplish.
Map Generalization
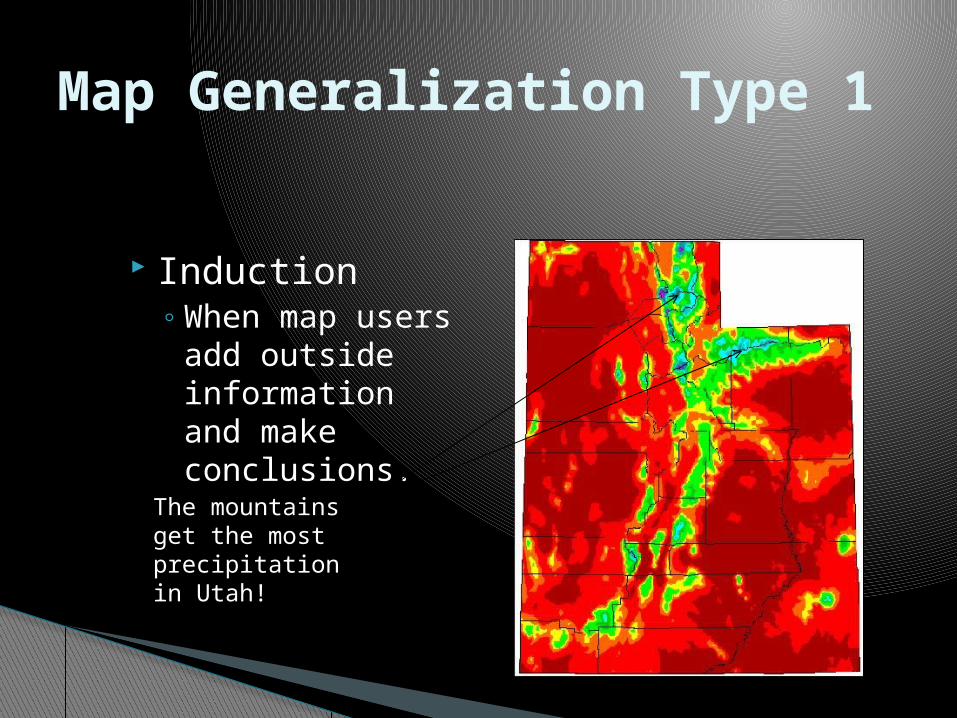
Induction◦ When map users
add outside information and make conclusions.
Map Generalization Type 1
The mountains get the most precipitation in Utah!
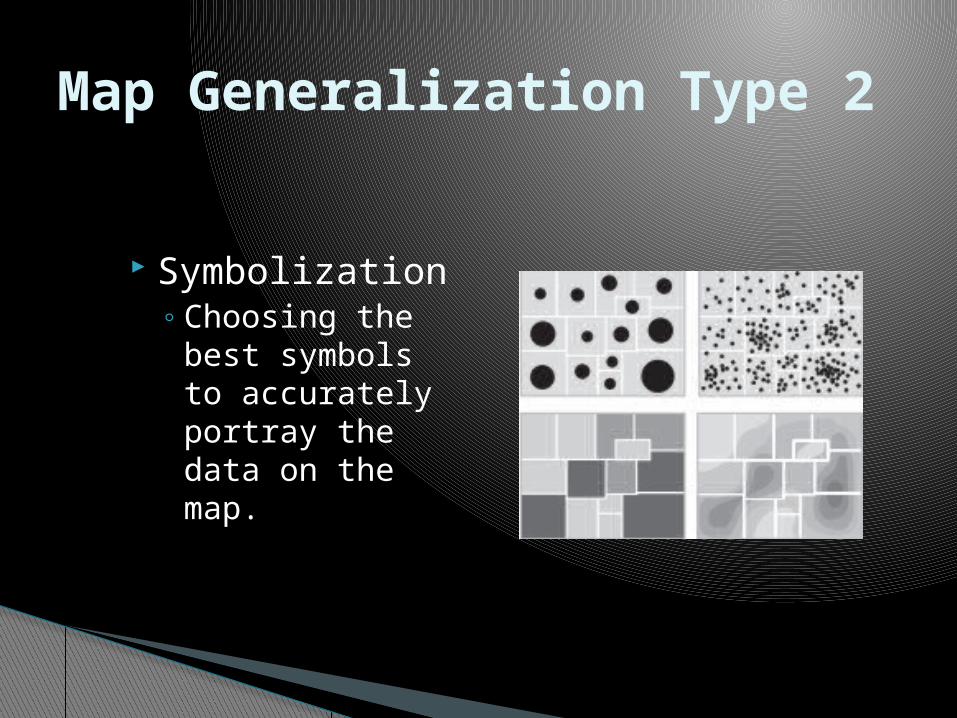
Symbolization◦ Choosing the
best symbols to accurately portray the data on the map.
Map Generalization Type 2
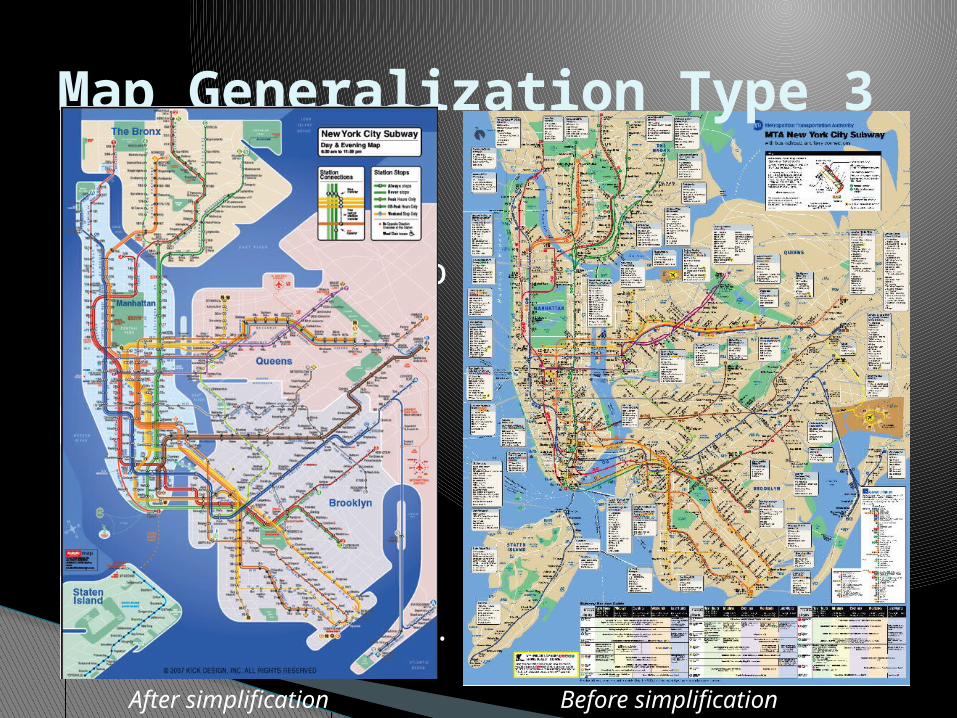
Simplification◦ Leaving off (or
minimizing) details that will confuse the audience or make the map cluttered.
Map Generalization Type 3
Before simplificationAfter simplification
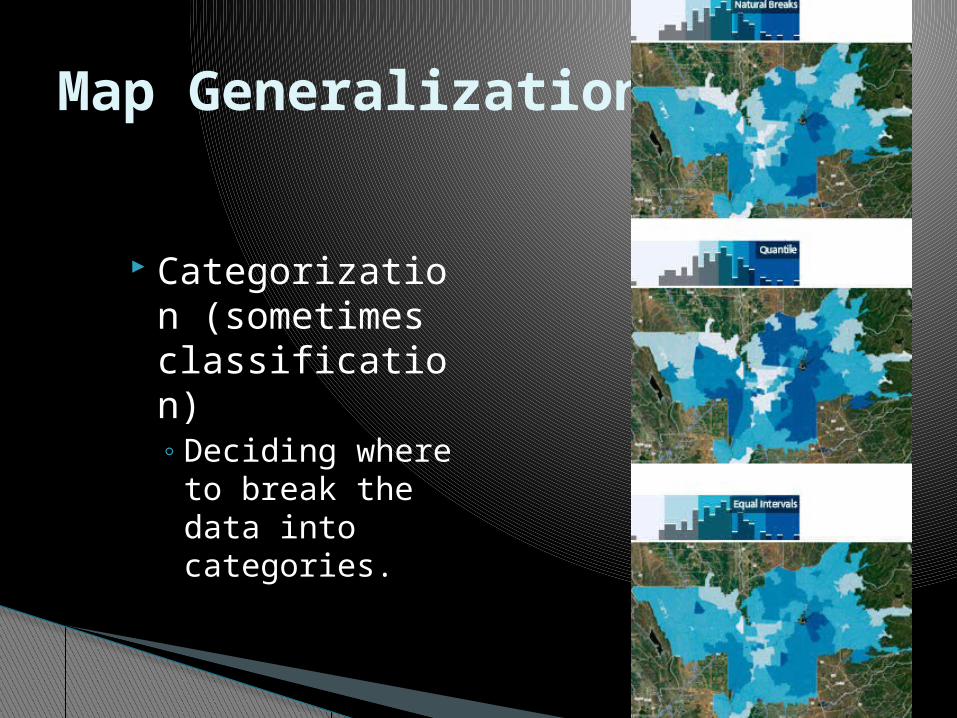
Categorization (sometimes classification)◦ Deciding where
to break the data into categories.
Map Generalization Type 4
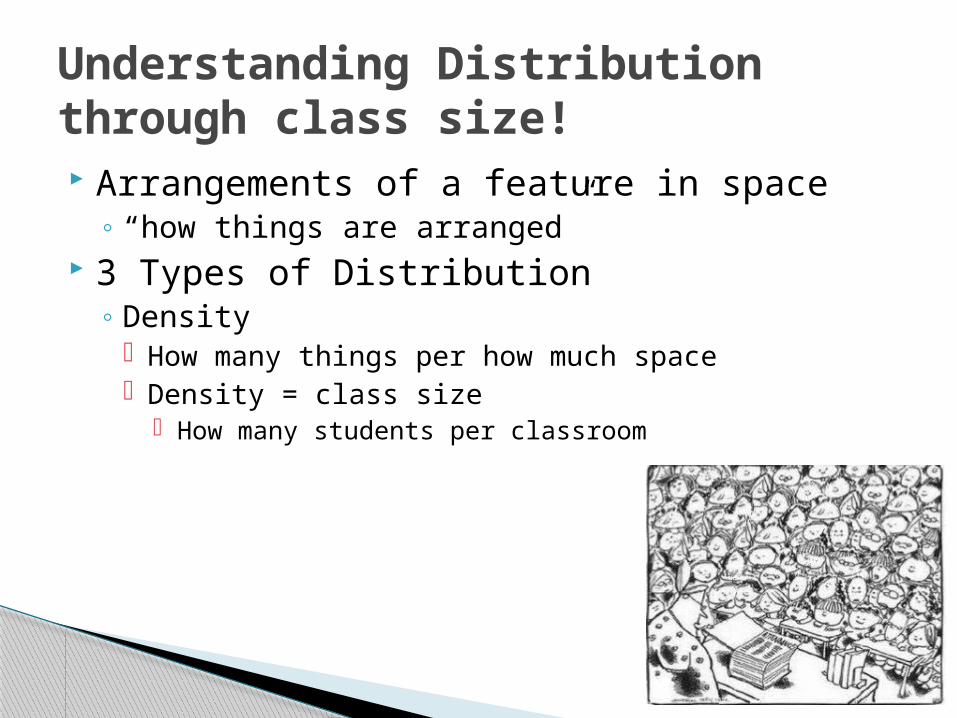
Arrangements of a feature in space◦ “how things are arranged”
3 Types of Distribution◦ Density
How many things per how much space Density = class size
How many students per classroom
Understanding Distribution through class size!
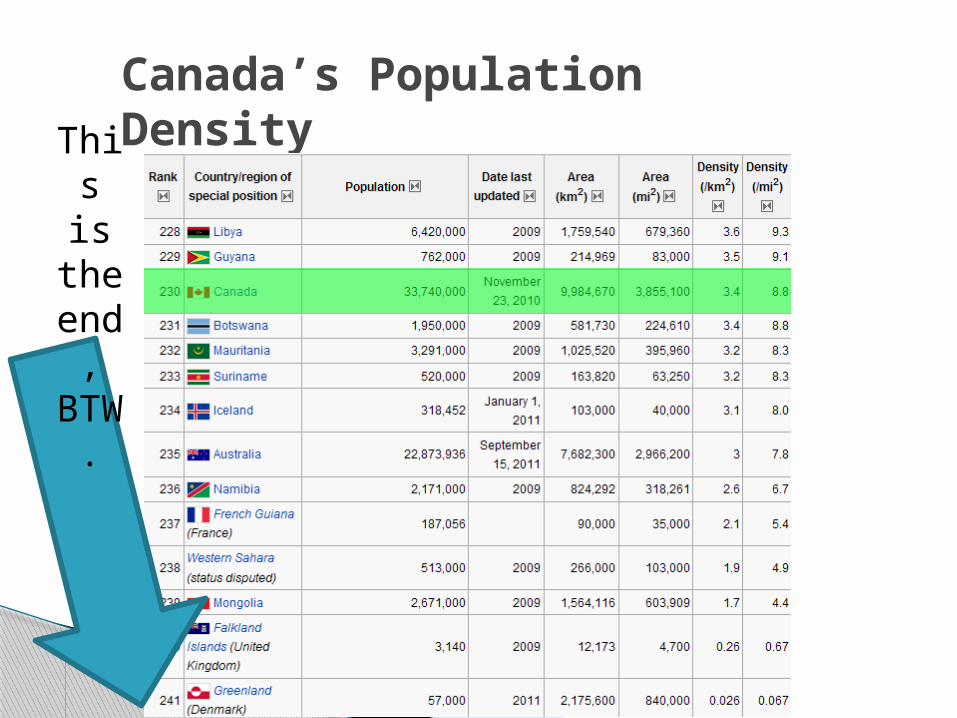
Canada’s Population DensityThis
is the end, BTW
.
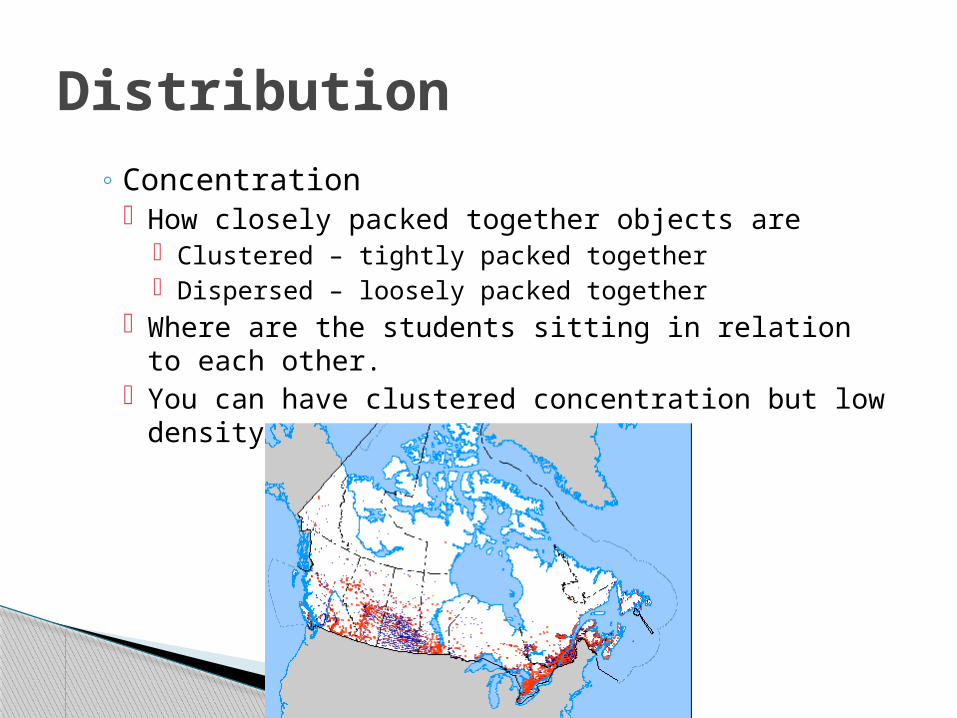
◦ Concentration How closely packed together objects are
Clustered – tightly packed together Dispersed – loosely packed together
Where are the students sitting in relation to each other.
You can have clustered concentration but low density.
Distribution
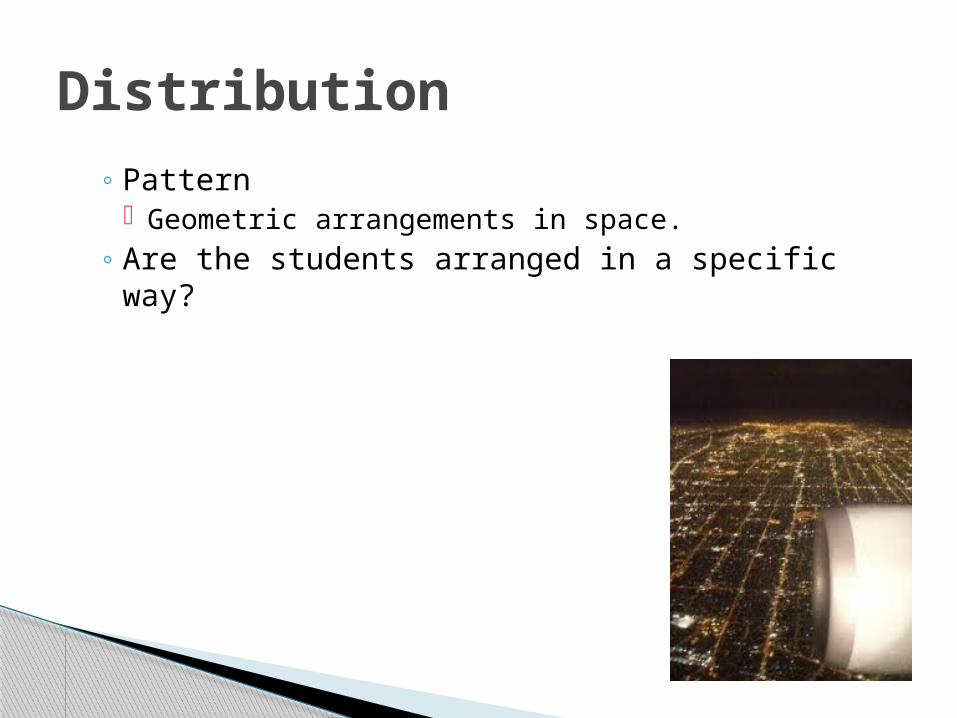
◦ Pattern Geometric arrangements in space.
◦ Are the students arranged in a specific way?
Distribution
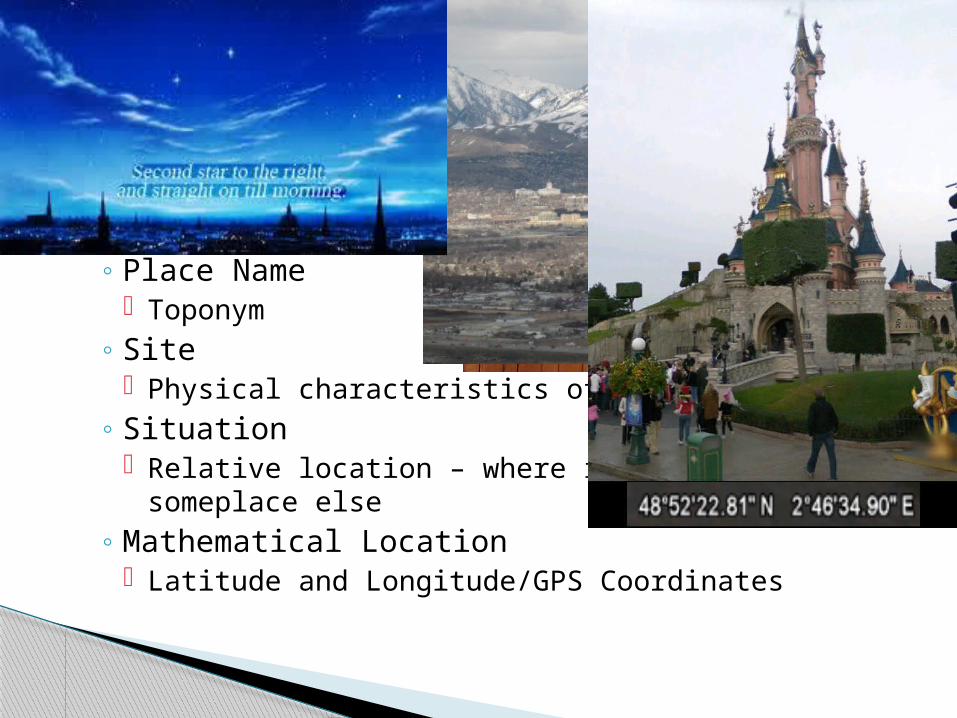
The position that something occupies on Earth’s surface.◦ Place Name
Toponym◦ Site
Physical characteristics of a place◦ Situation
Relative location – where it is from someplace else◦ Mathematical Location
Latitude and Longitude/GPS Coordinates
Location
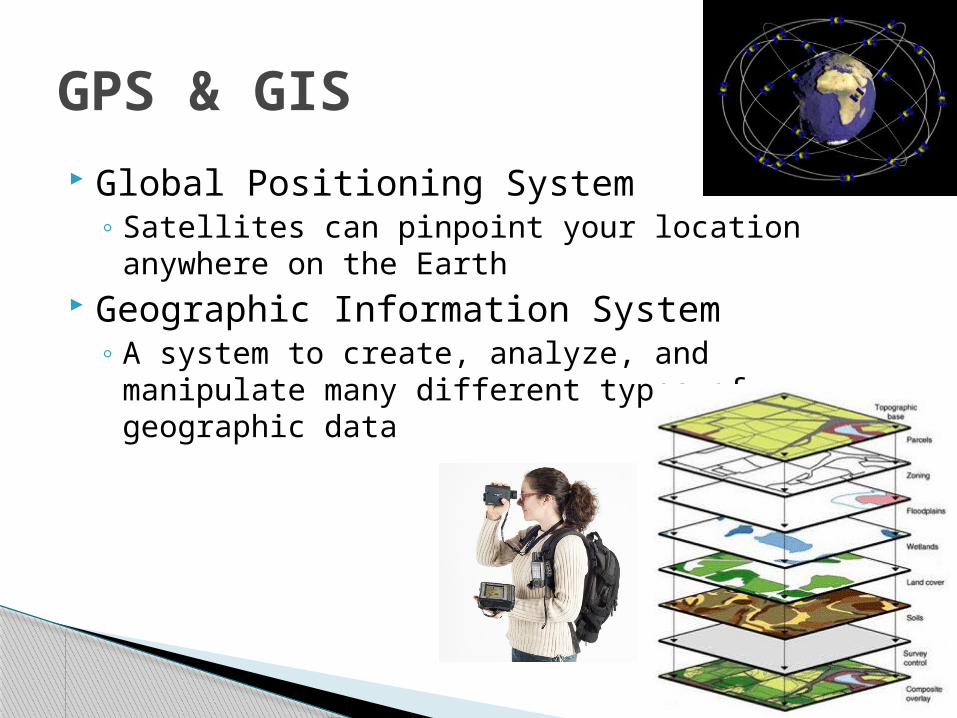
Global Positioning System◦ Satellites can pinpoint your location anywhere on
the Earth Geographic Information System
◦ A system to create, analyze, and manipulate many different types of geographic data
GPS & GIS
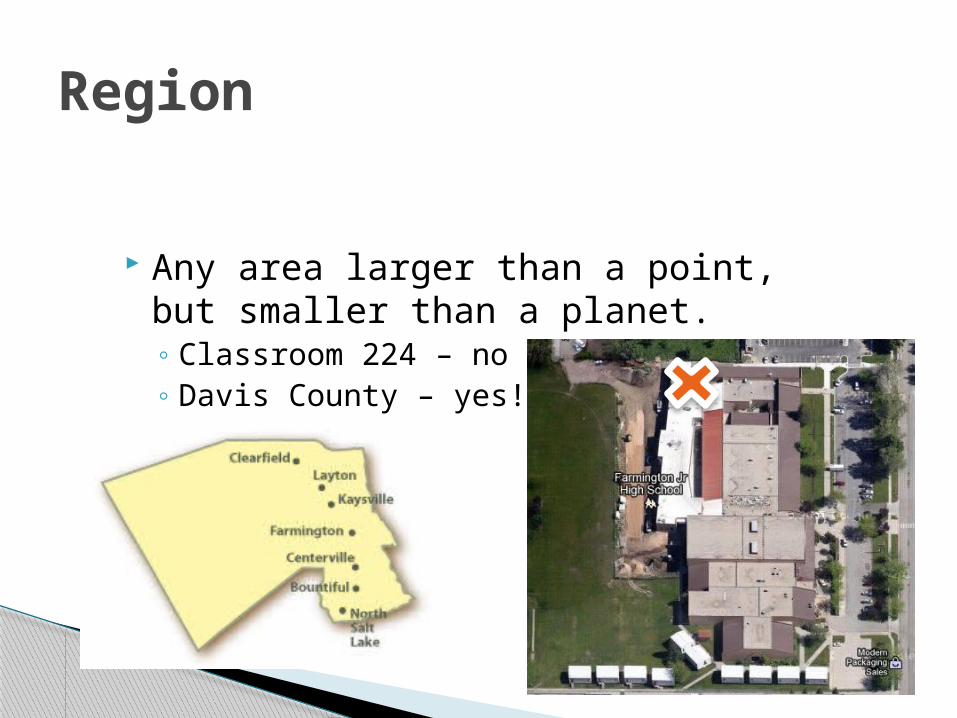
Any area larger than a point, but smaller than a planet.◦ Classroom 224 – no◦ Davis County – yes!
Region
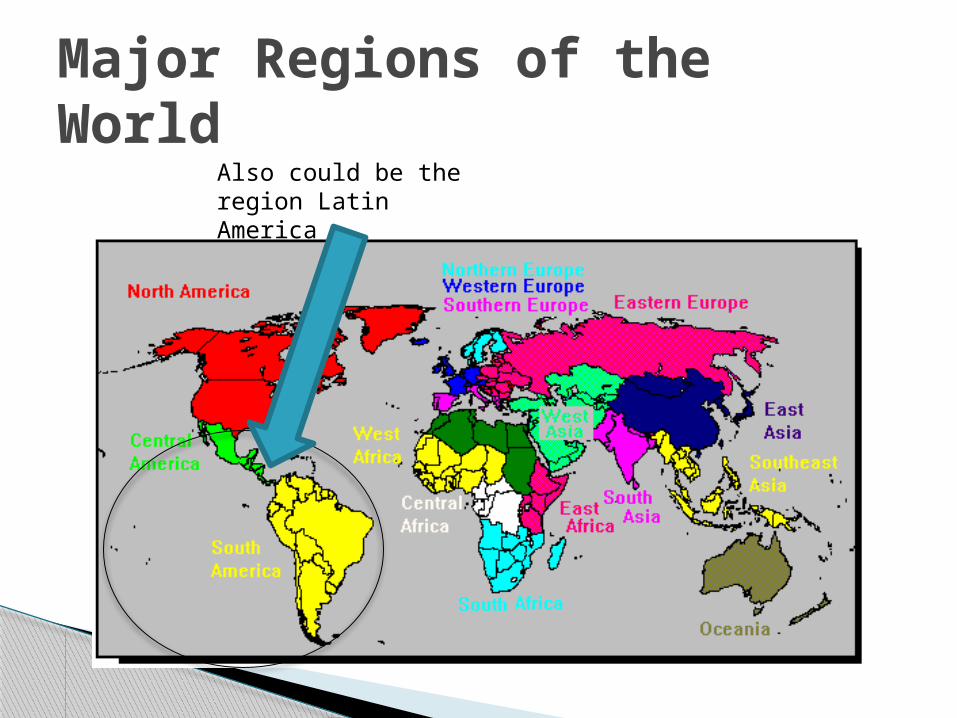
Major Regions of the WorldAlso could be the region Latin America
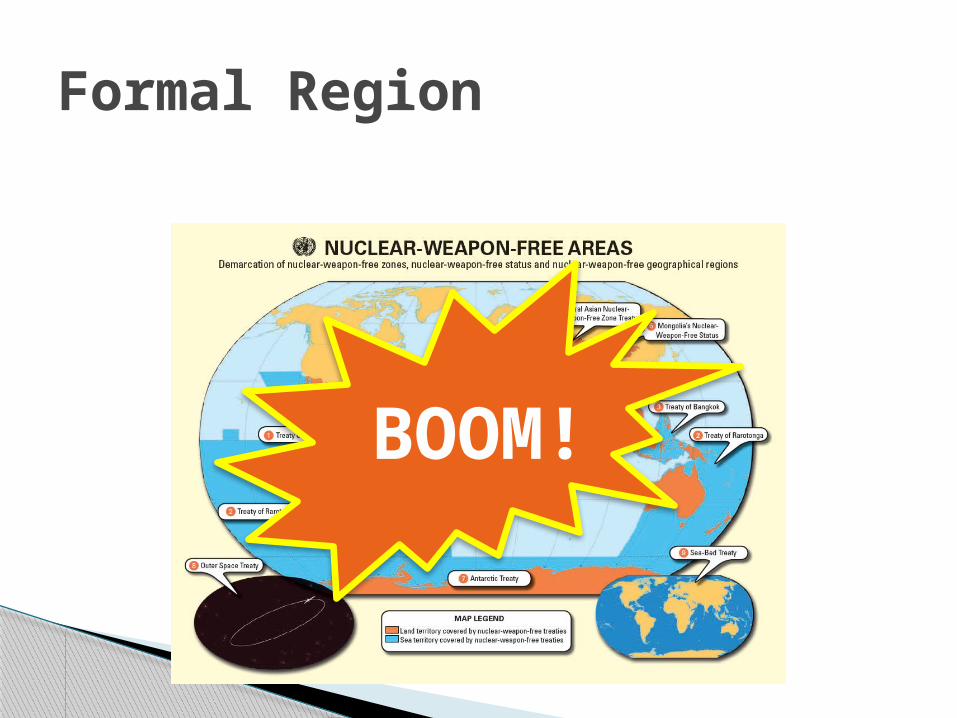
An area that has the same (or nearly the same) of a specific characteristic.◦ All official government areas (states, counties, etc.)
are formal regions.
Speaking of states, everyone needs to know that in the rest of the world, a state is a country. They generally use the term province for what we think of as states. When talking about the world, a state is a country!
Formal Region
Formal Region
BOOM!
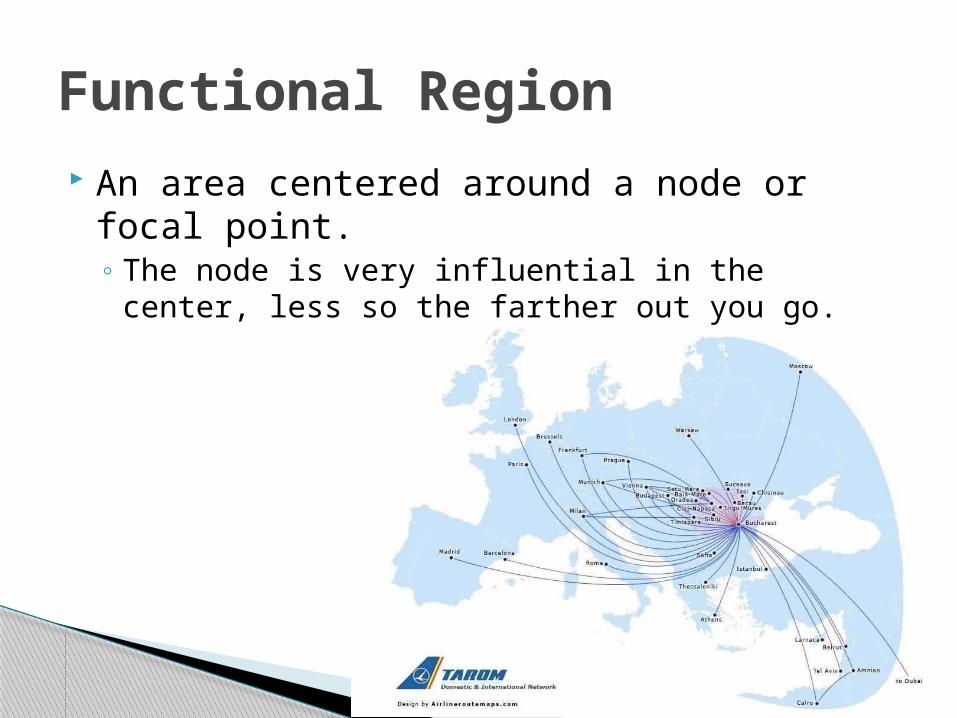
An area centered around a node or focal point.◦ The node is very influential in the center, less so
the farther out you go.
Functional Region
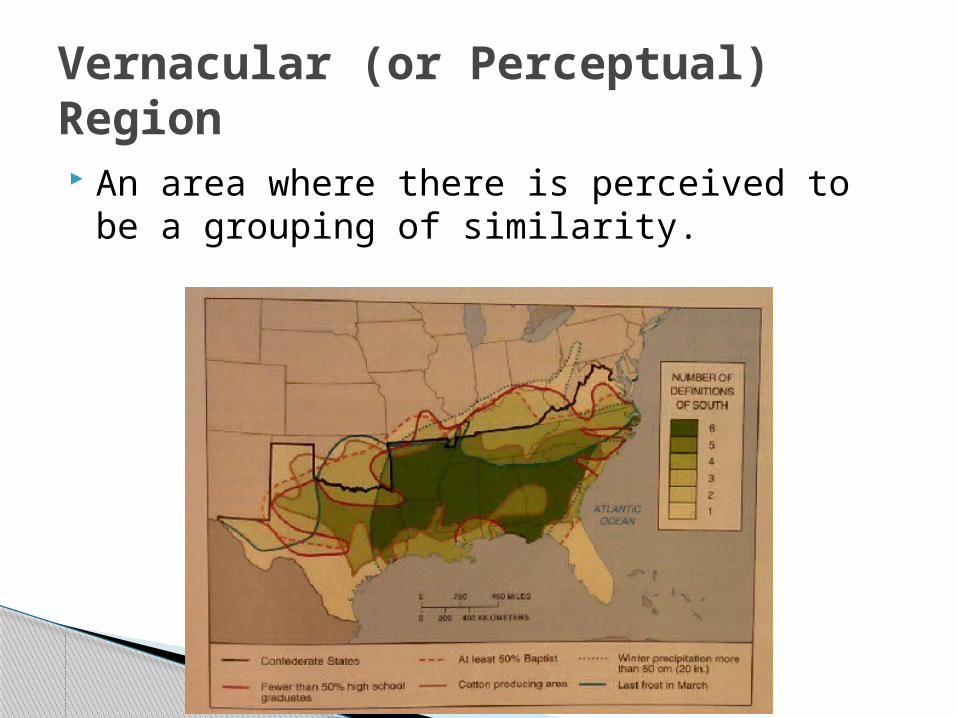
An area where there is perceived to be a grouping of similarity.
Vernacular (or Perceptual) Region
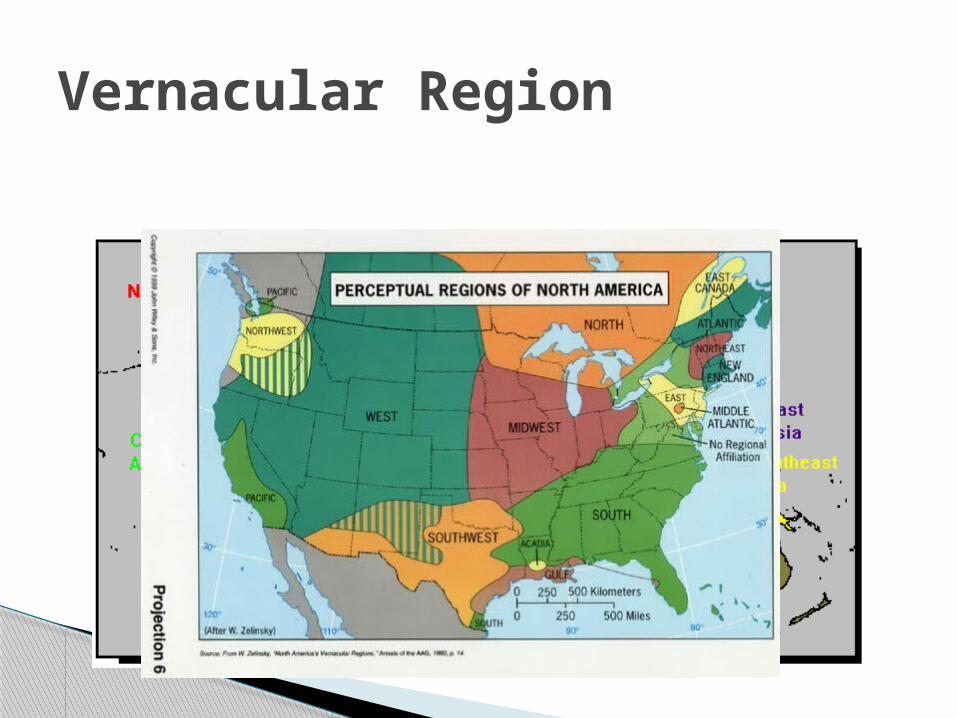
Vernacular Region
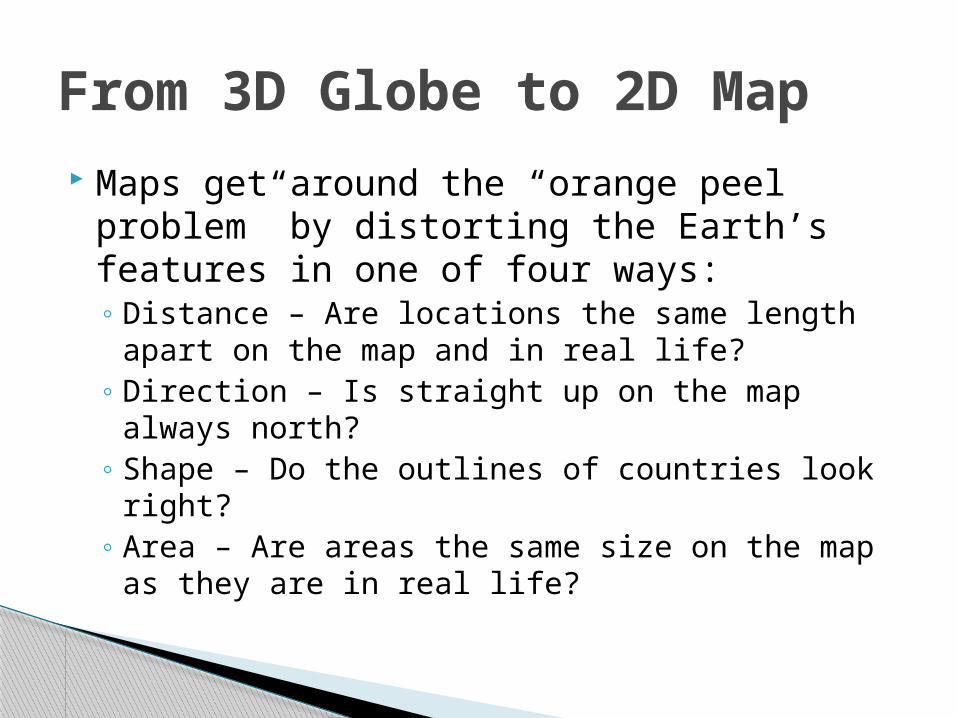
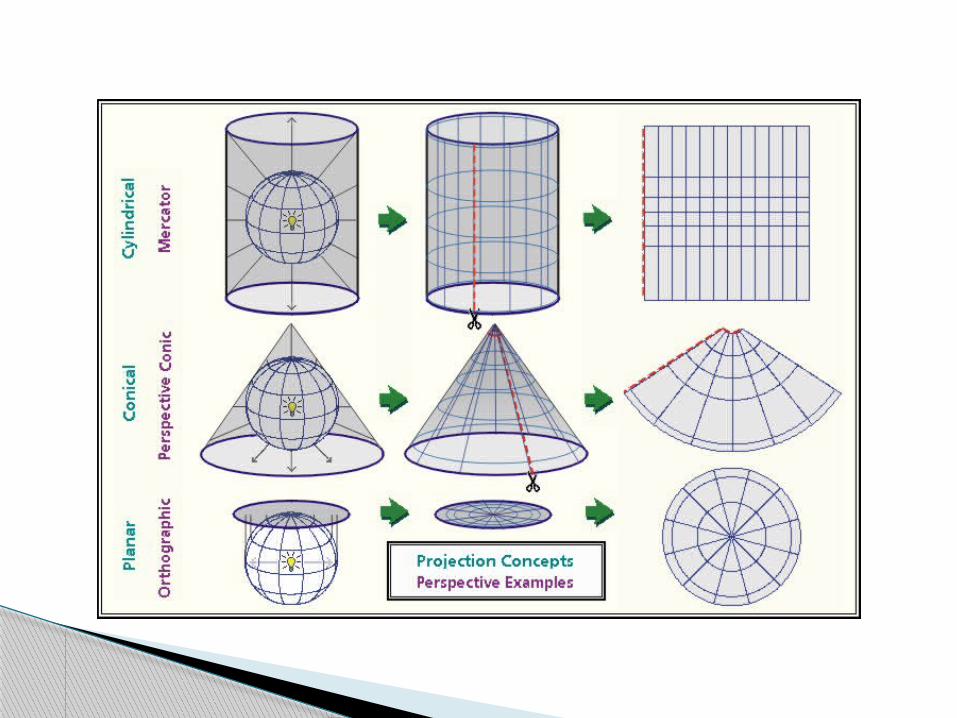
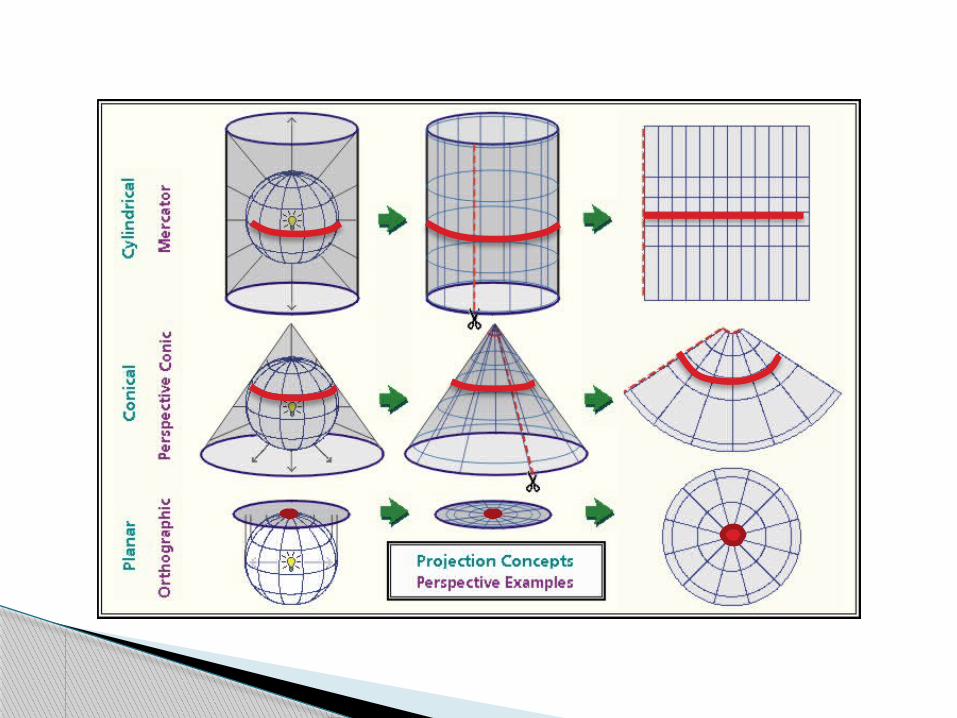
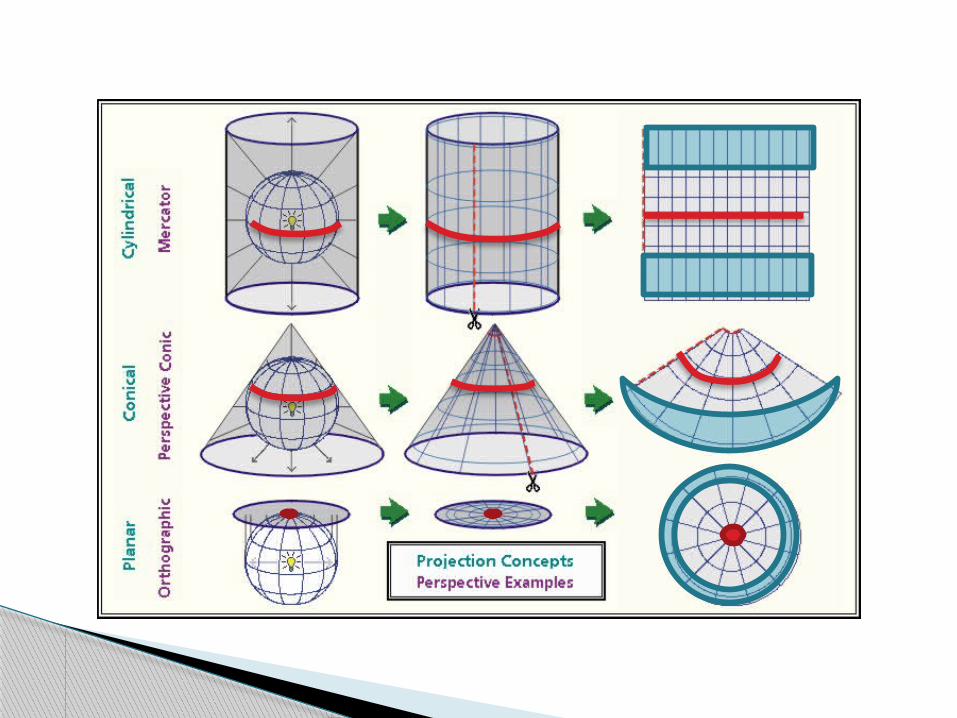
Maps get around the “orange peel problem” by distorting the Earth’s features in one of four ways:◦ Distance – Are locations the same length apart on
the map and in real life?◦ Direction – Is straight up on the map always
north?◦ Shape – Do the outlines of countries look right?◦ Area – Are areas the same size on the map as
they are in real life?
From 3D Globe to 2D Map
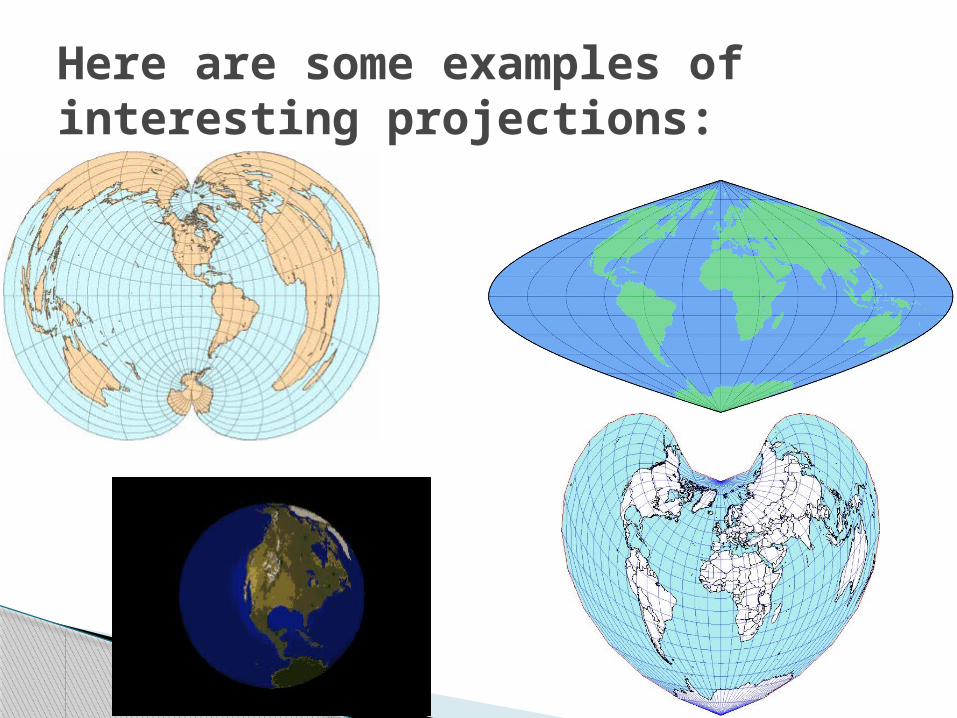
Here are some examples of interesting projections:

The projections that you need to know!
Azimuthal Equidistant, Mercator, Mollweide, Lambert Conic, Robinson, Lambert Conic, Gall-Peters, Winkel Tripel, Interrupted GoodeHomolosine

Abū al-Rayhān Muhammad ibn Ahmad al-Bīrūnī one of the greatest scholars of the medieval Islamic era and was well versed in physics, mathematics, astronomy, and natural sciences, and also distinguished himself as a historian, chronologist and linguist. Abū created the first known Azimuthal Equidistant Projection sometime around 1000 CE.
Distorts: Area and Shape (but mostly far from the center of the map)
Maintains: Distance and Direction from the center of the map
Strengths:◦ You can accurately measure distance either from or through
the center of the map.◦ Useful for pilots if the map is centered at their starting place.
Weaknesses:◦ Crazy distorted the farther out you get.◦ Distance and direction only measurable at or through the
center.
Azimuthal Equidistant Projection
MissedPicture
DayAndRe-
TakeDay
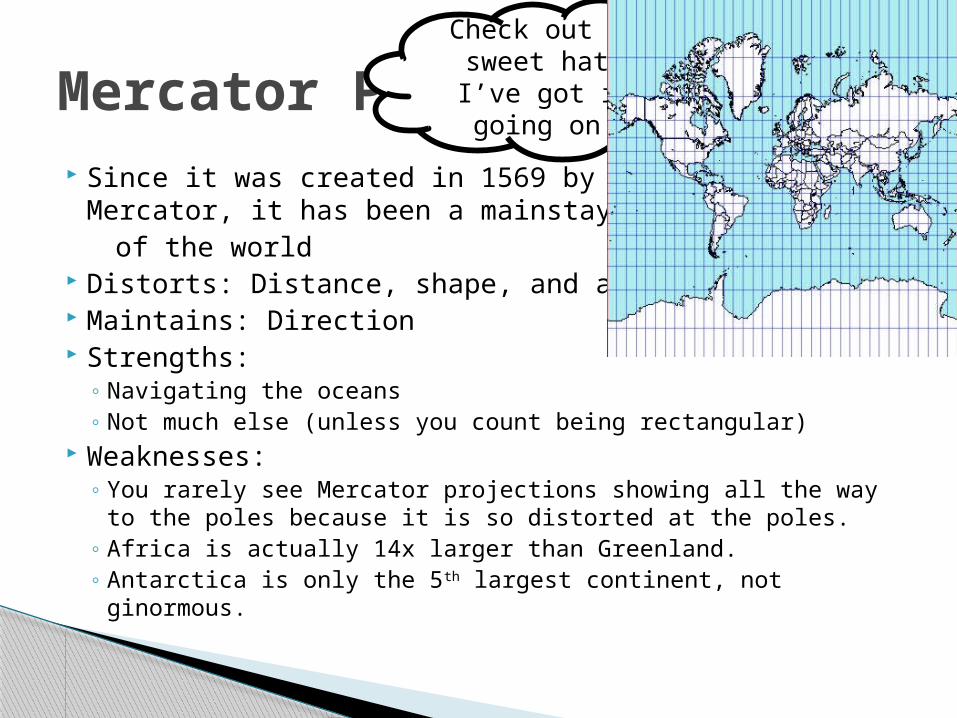
Since it was created in 1569 by Gerardus Mercator, it has been a mainstay of maps
of the world Distorts: Distance, shape, and area Maintains: Direction Strengths:
◦ Navigating the oceans◦ Not much else (unless you count being rectangular)
Weaknesses:◦ You rarely see Mercator projections showing all the way to the
poles because it is so distorted at the poles.◦ Africa is actually 14x larger than Greenland.◦ Antarctica is only the 5th largest continent, not ginormous.
Mercator ProjectionCheck out my sweet hat! I’ve got it going on!
Karl Mollweide invented in 1805 but didn’t become popular as a projection until 1857,more than 30 years after he died.
Distorts: Distance, shape, and direction Maintains: Area Strengths:
◦ You can accurately compare landmasses (hey, Greenland is only about the size of Mexico!)
Weaknesses:◦ Where Mercator distorts size like crazy,
Mollweide distorts shape, smushing towards the poles
Mollweide Projection
MissedPicture
DayAndRe-
TakeDay
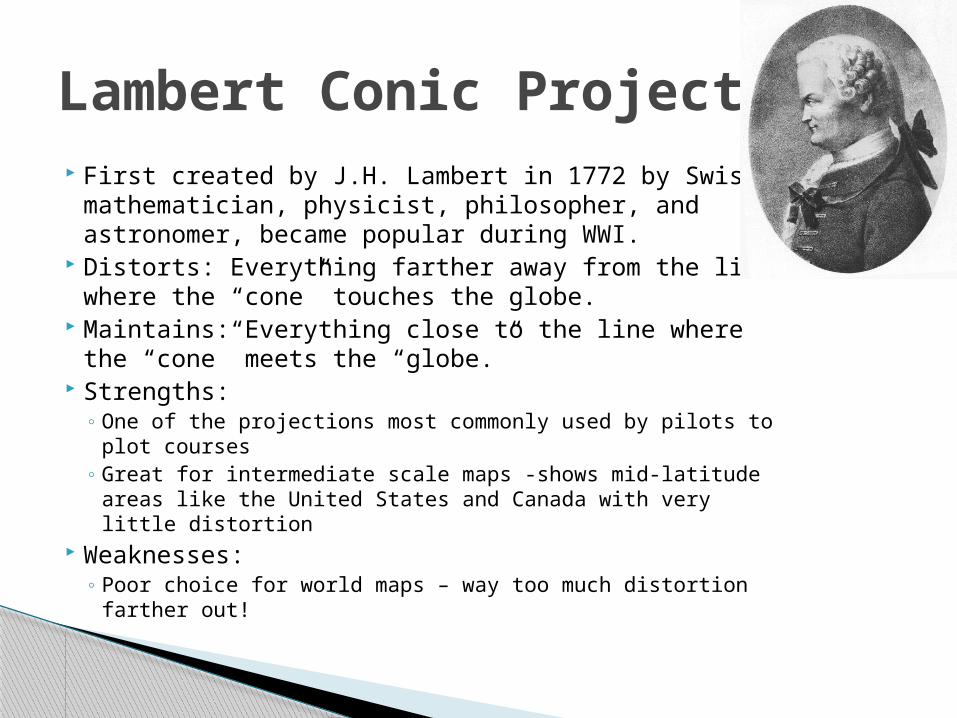
First created by J.H. Lambert in 1772 by Swiss mathematician, physicist, philosopher, and astronomer, became popular during WWI.
Distorts: Everything farther away from the line where the “cone” touches the globe.
Maintains: Everything close to the line where the “cone” meets the “globe.”
Strengths:◦ One of the projections most commonly used by pilots to plot
courses◦ Great for intermediate scale maps -shows mid-latitude areas
like the United States and Canada with very little distortion Weaknesses:
◦ Poor choice for world maps – way too much distortion farther out!
Lambert Conic Projection
MissedPicture
DayAndRe-
TakeDay
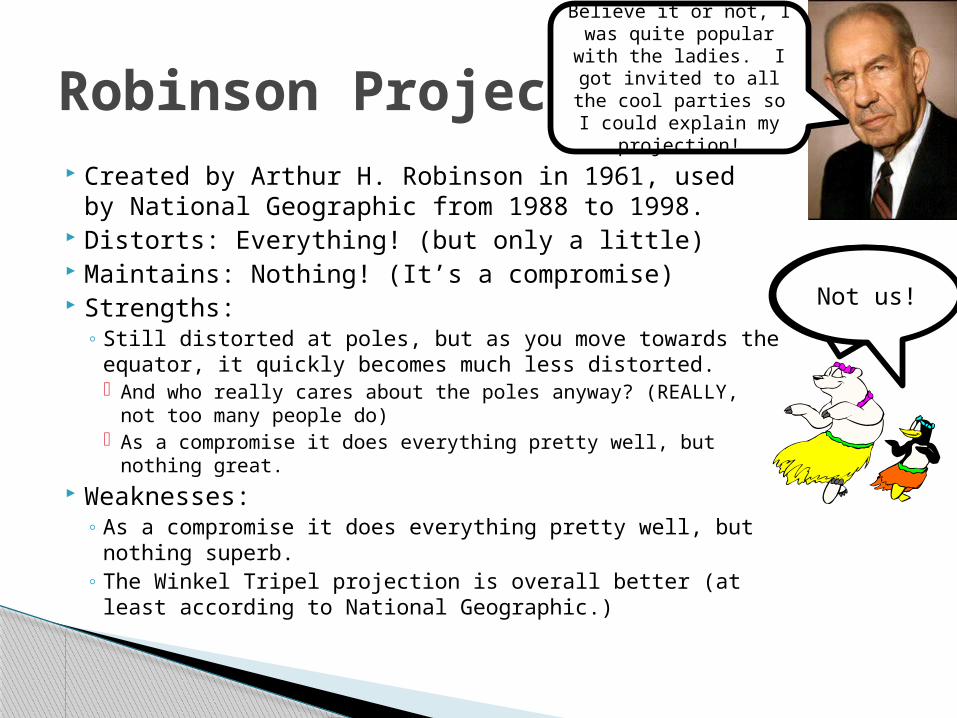
Created by Arthur H. Robinson in 1961, used by National Geographic from 1988 to 1998.
Distorts: Everything! (but only a little) Maintains: Nothing! (It’s a compromise) Strengths:
◦ Still distorted at poles, but as you move towards the equator, it quickly becomes much less distorted. And who really cares about the poles anyway? (REALLY, not too
many people do) As a compromise it does everything pretty well, but nothing
great. Weaknesses:
◦ As a compromise it does everything pretty well, but nothing superb.
◦ The Winkel Tripel projection is overall better (at least according to National Geographic.)
Robinson Projection
MissedPicture
DayAndRe-
TakeDay
Believe it or not, I was quite popular with the
ladies. I got invited to all the cool parties so I could
explain my projection!
Not us!
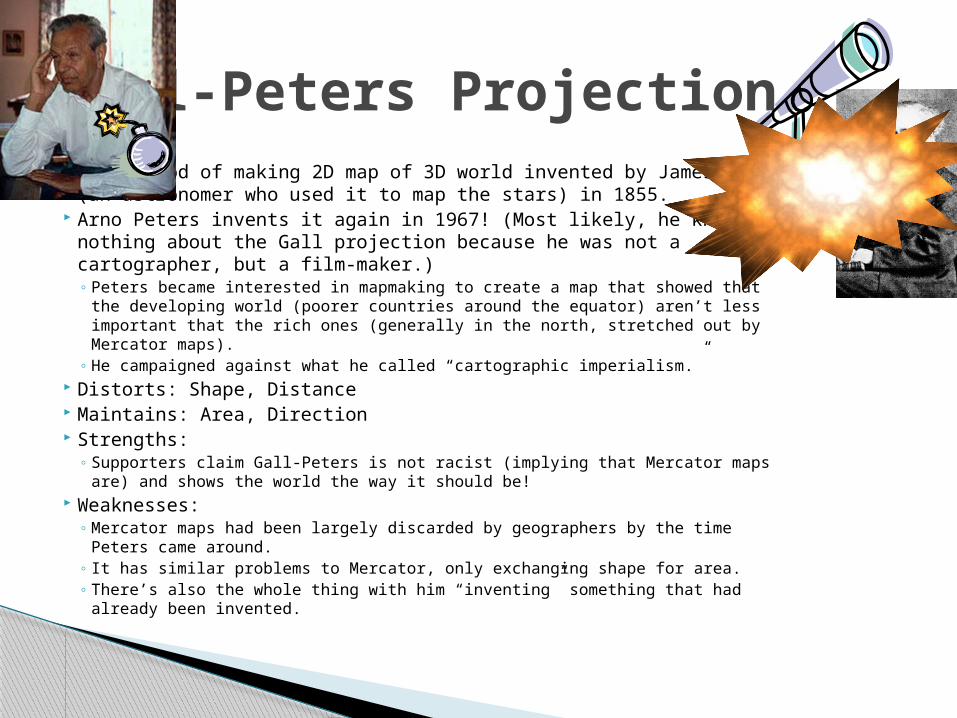
New method of making 2D map of 3D world invented by James Gall (an astronomer who used it to map the stars) in 1855.
Arno Peters invents it again in 1967! (Most likely, he knew nothing about the Gall projection because he was not a cartographer, but a film-maker.)◦ Peters became interested in mapmaking to create a map that showed that the
developing world (poorer countries around the equator) aren’t less important that the rich ones (generally in the north, stretched out by Mercator maps).
◦ He campaigned against what he called “cartographic imperialism.” Distorts: Shape, Distance Maintains: Area, Direction Strengths:
◦ Supporters claim Gall-Peters is not racist (implying that Mercator maps are) and shows the world the way it should be!
Weaknesses:◦ Mercator maps had been largely discarded by geographers by the time Peters
came around.◦ It has similar problems to Mercator, only exchanging shape for area.◦ There’s also the whole thing with him “inventing” something that had already
been invented.
Gall-Peters Projection
MissedPicture
DayAndRe-
TakeDay
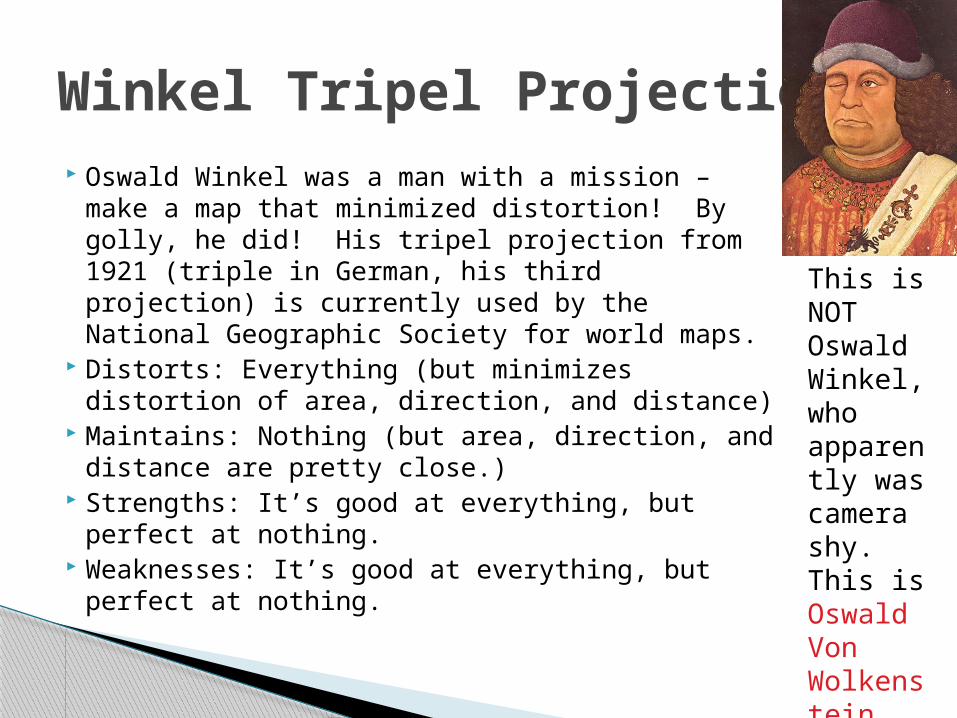
Oswald Winkel was a man with a mission – make a map that minimized distortion! By golly, he did! His tripel projection from 1921 (triple in German, his third projection) is currently used by the National Geographic Society for world maps.
Distorts: Everything (but minimizes distortion of area, direction, and distance)
Maintains: Nothing (but area, direction, and distance are pretty close.)
Strengths: It’s good at everything, but perfect at nothing.
Weaknesses: It’s good at everything, but perfect at nothing.
Winkel Tripel Projection
MissedPicture
DayAndRe-
TakeDay
This is NOT Oswald Winkel, who apparently was camera shy. This is Oswald Von Wolkenstein who popped up on the search results and just seemed really interesting.
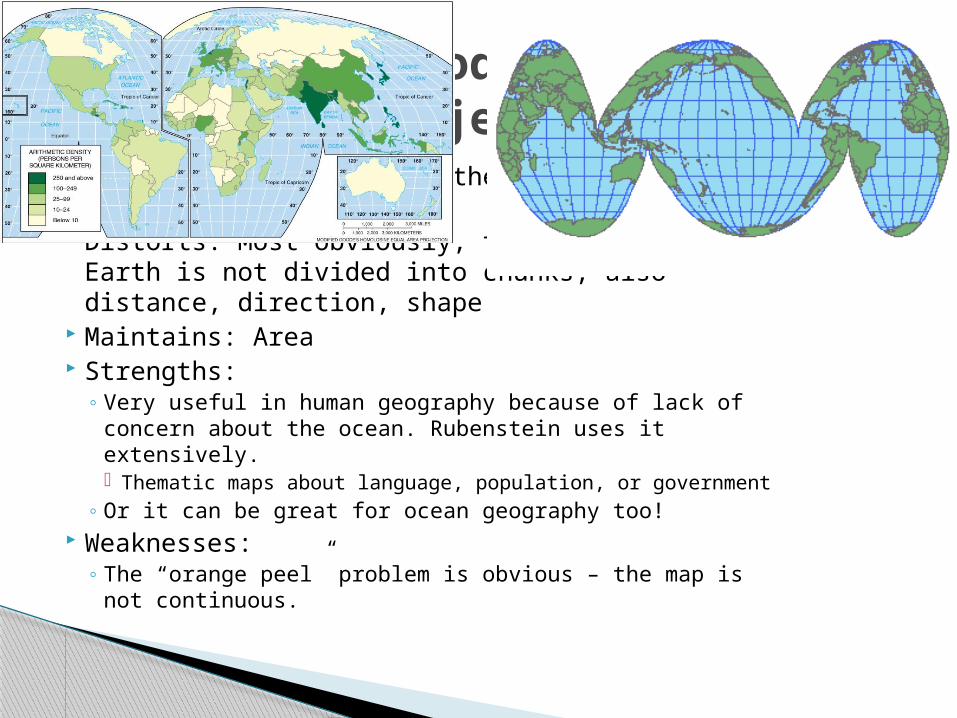
John Paul Goode created the his interrupted projection in 1908.
Distorts: Most obviously, the surface of the Earth is not divided into chunks, also distance, direction, shape
Maintains: Area Strengths:
◦ Very useful in human geography because of lack of concern about the ocean. Rubenstein uses it extensively. Thematic maps about language, population, or government
◦ Or it can be great for ocean geography too! Weaknesses:
◦ The “orange peel” problem is obvious – the map is not continuous.
Interrupted GoodeHomolosine Projection
MissedPicture
DayAndRe-
TakeDay
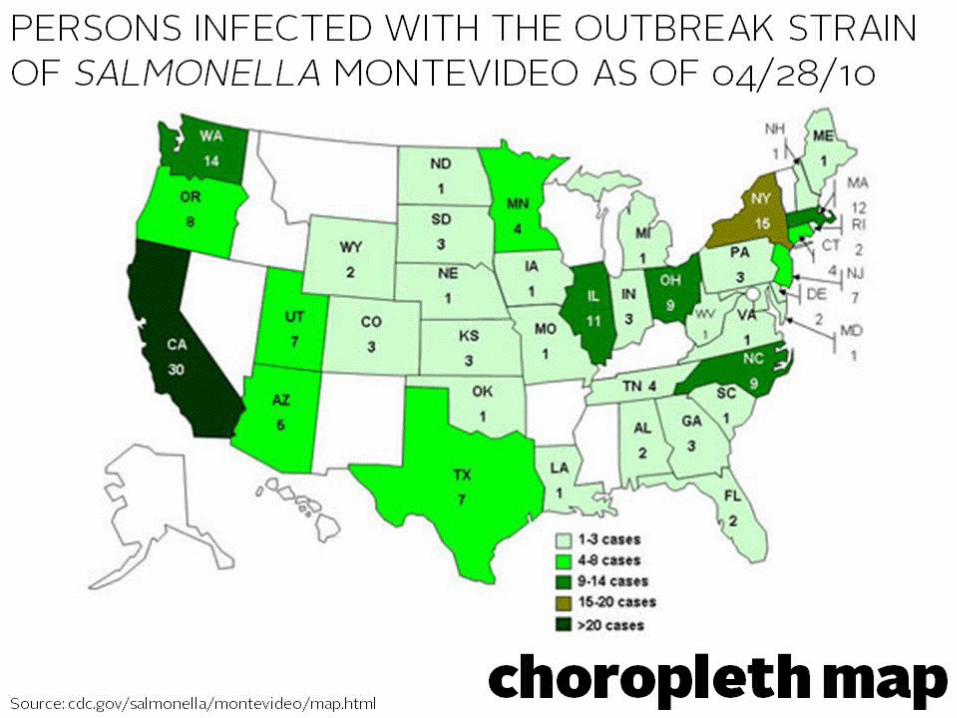
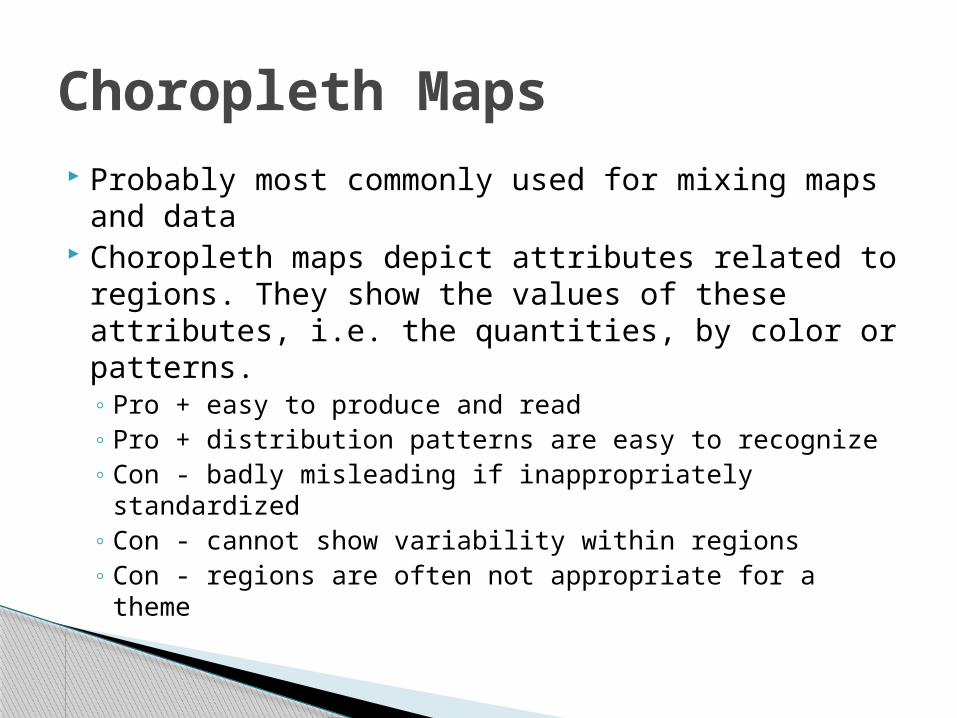
Probably most commonly used for mixing maps and data
Choropleth maps depict attributes related to regions. They show the values of these attributes, i.e. the quantities, by color or patterns.◦ Pro + easy to produce and read ◦ Pro + distribution patterns are easy to recognize ◦ Con - badly misleading if inappropriately standardized ◦ Con - cannot show variability within regions ◦ Con - regions are often not appropriate for a theme
Choropleth Maps
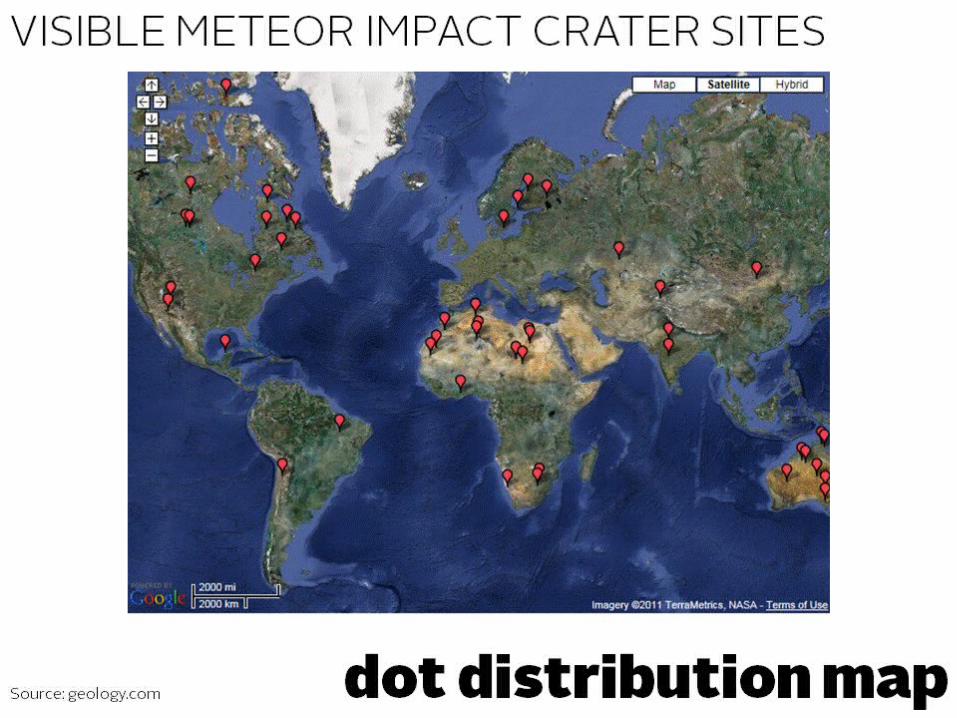
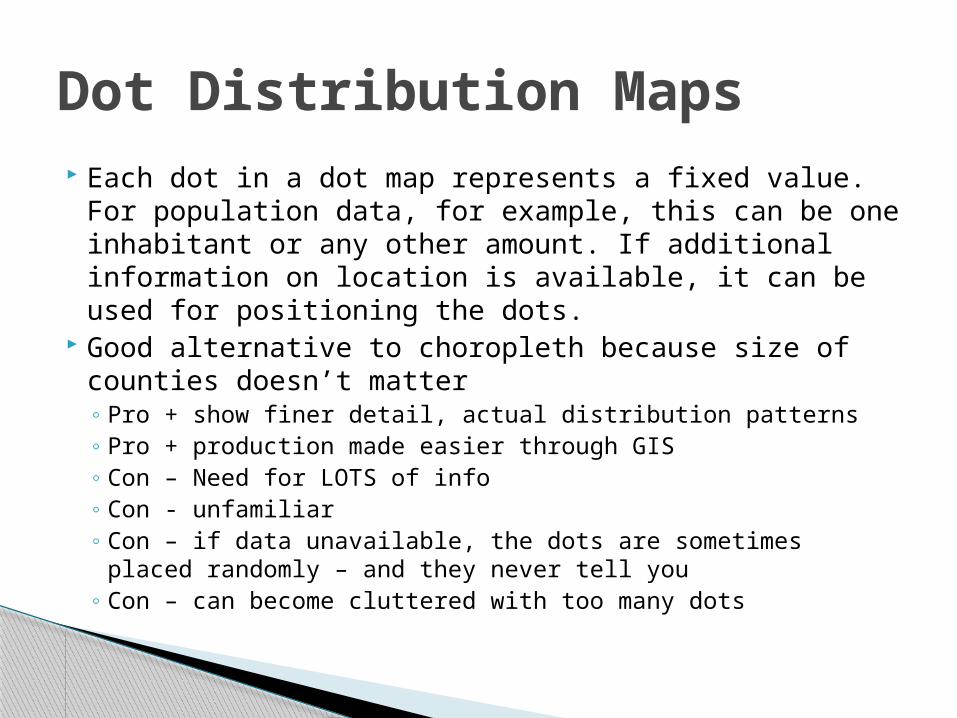
Each dot in a dot map represents a fixed value. For population data, for example, this can be one inhabitant or any other amount. If additional information on location is available, it can be used for positioning the dots.
Good alternative to choropleth because size of counties doesn’t matter◦ Pro + show finer detail, actual distribution patterns ◦ Pro + production made easier through GIS ◦ Con – Need for LOTS of info◦ Con - unfamiliar ◦ Con – if data unavailable, the dots are sometimes placed
randomly – and they never tell you◦ Con – can become cluttered with too many dots
Dot Distribution Maps
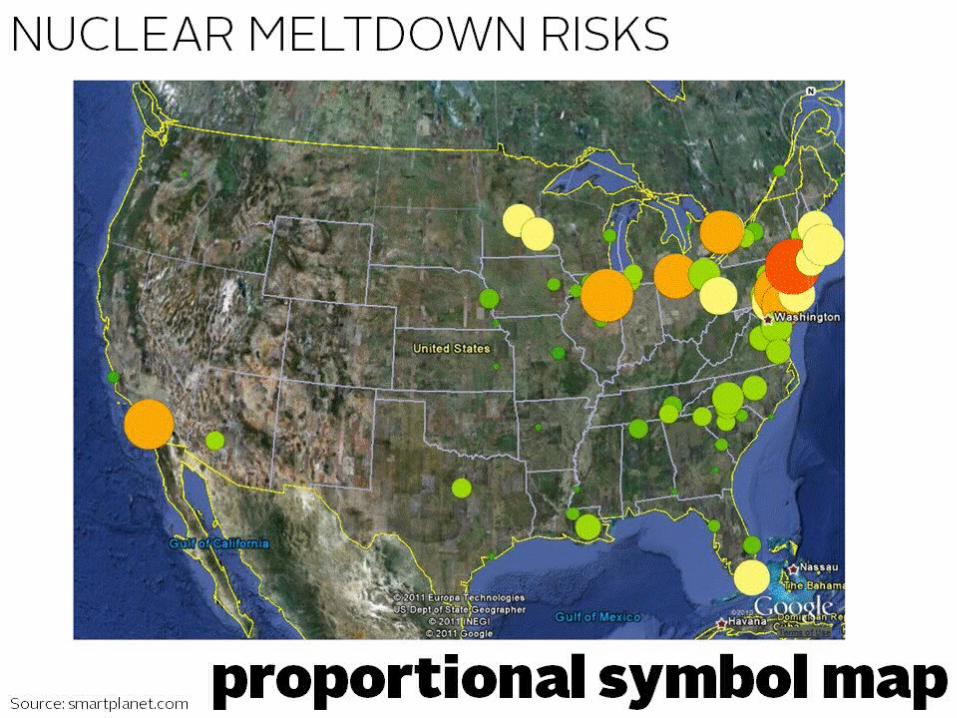
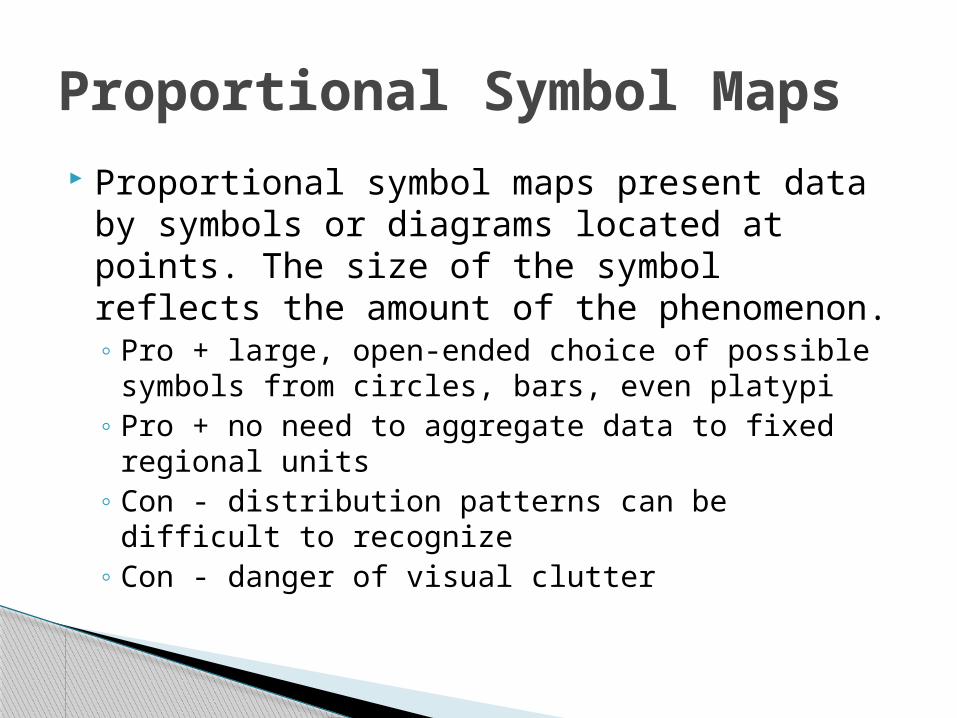
Proportional symbol maps present data by symbols or diagrams located at points. The size of the symbol reflects the amount of the phenomenon. ◦ Pro + large, open-ended choice of possible
symbols from circles, bars, even platypi ◦ Pro + no need to aggregate data to fixed regional
units ◦ Con - distribution patterns can be difficult to
recognize ◦ Con - danger of visual clutter
Proportional Symbol Maps
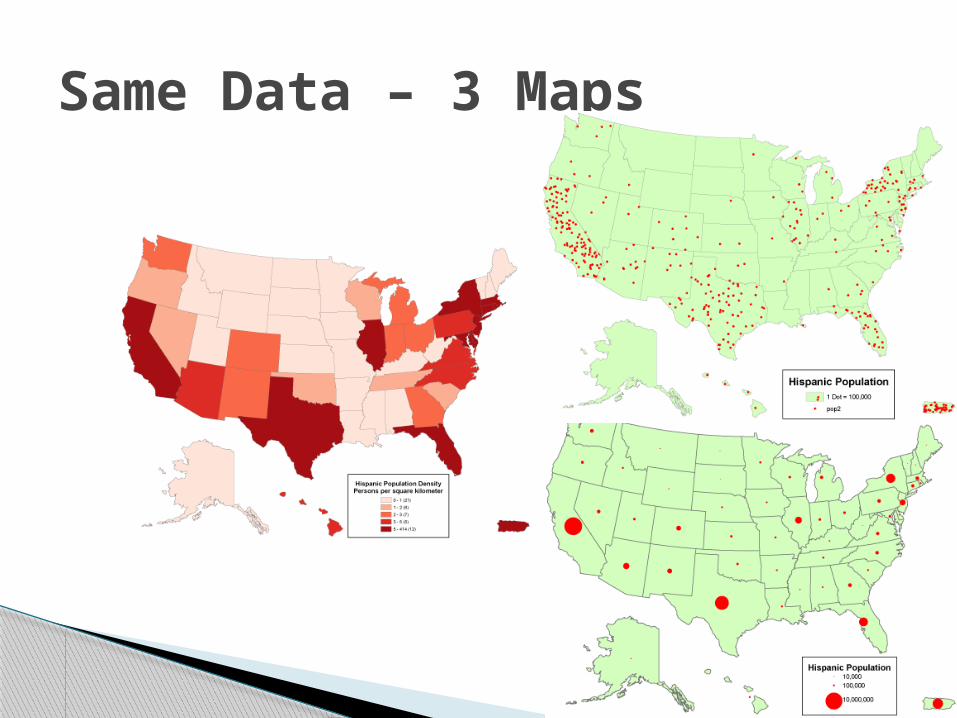
Same Data – 3 Maps
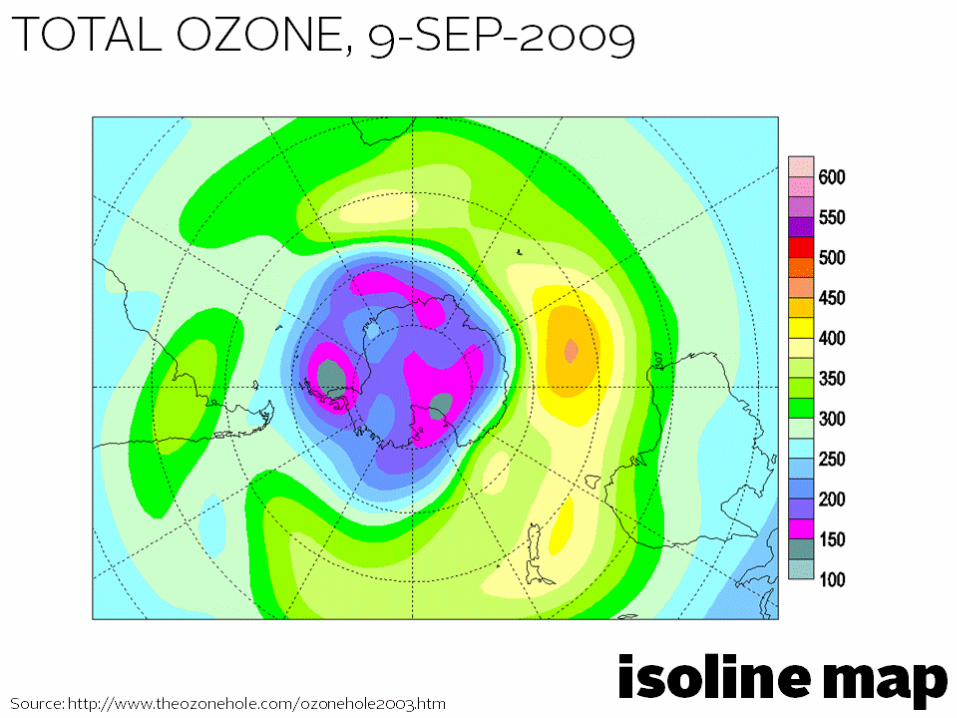
Isoline maps are used to depict smooth continuous phenomena. These phenomena are represented by interpolating lines of equal values Often used for height and temperature◦ Pro + familiar from topographic maps (terrain
representation) ◦ Pro + one type of map for continuous phenomena ◦ Con - often misused ◦ Con - suggesting detail that is not there
Isoline Maps
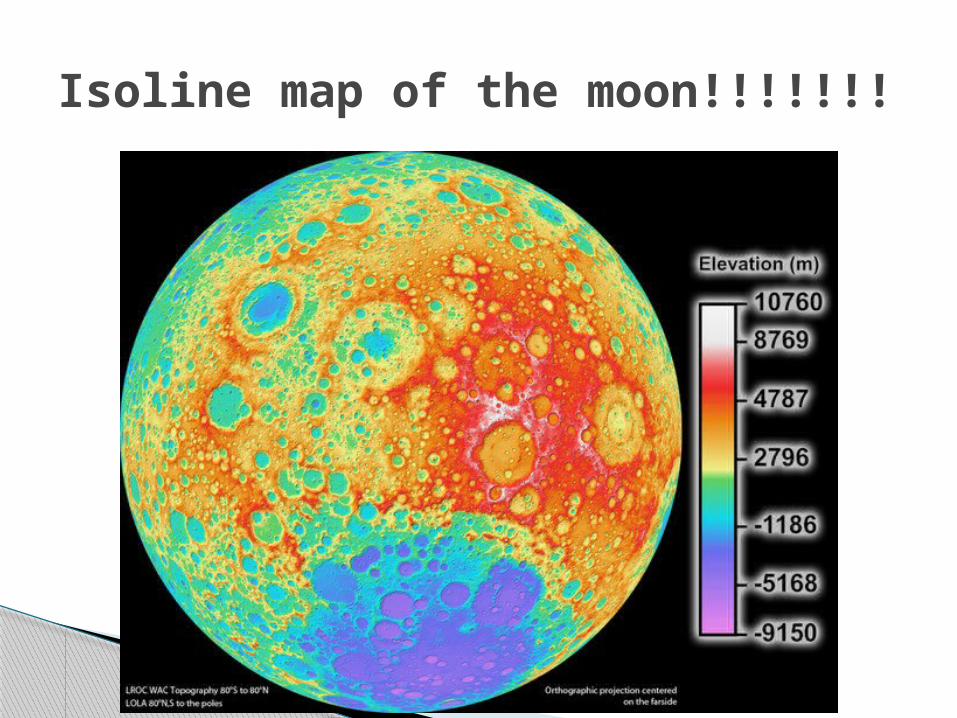
Isoline map of the moon!!!!!!!
Strictly speaking, they are not maps because countries are not drawn to scale, but they are handy at illustrating traits of countries/states.
Rather than show the countries by their area, the countries are shown according to the size of a particular statistic about them (often population) while maintaining the shape as much as possible so countries are identifiable.
Cartogram
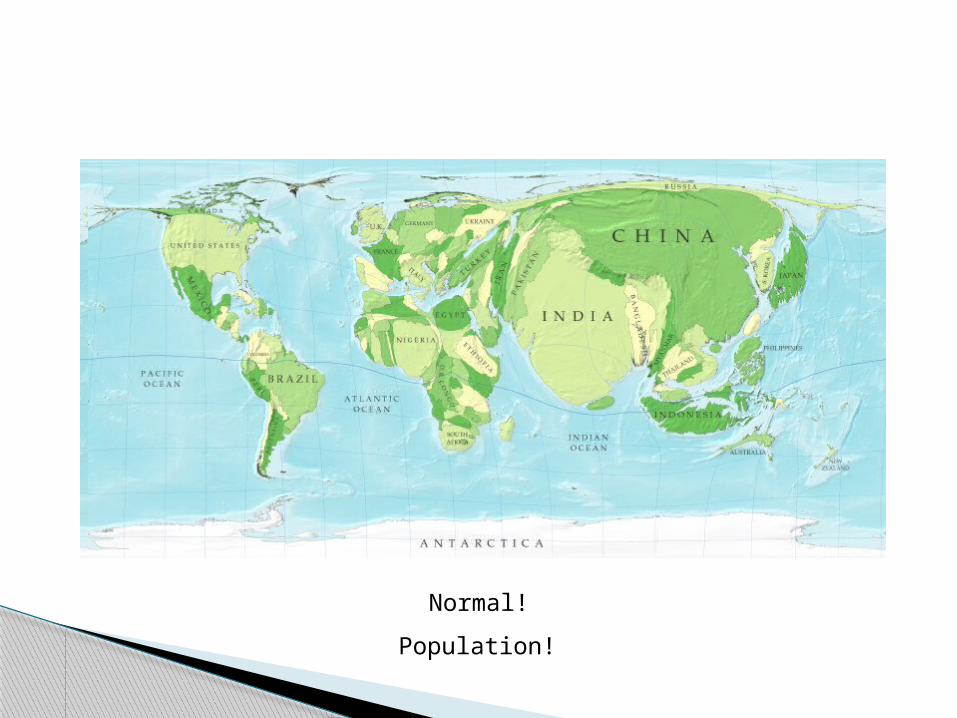
Normal!Population!
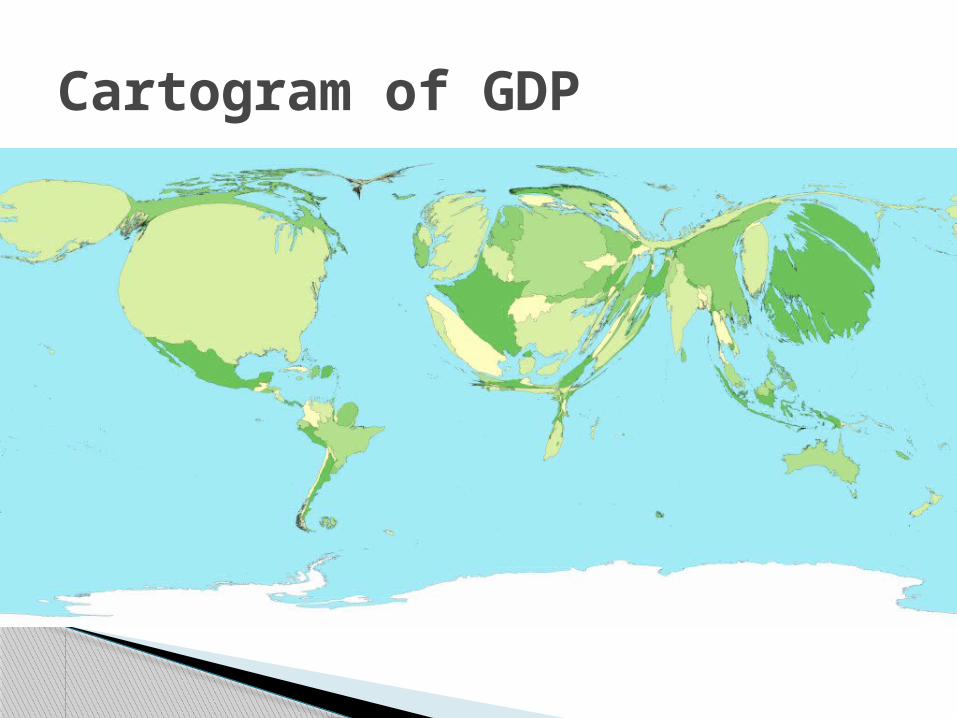
Cartogram of GDP
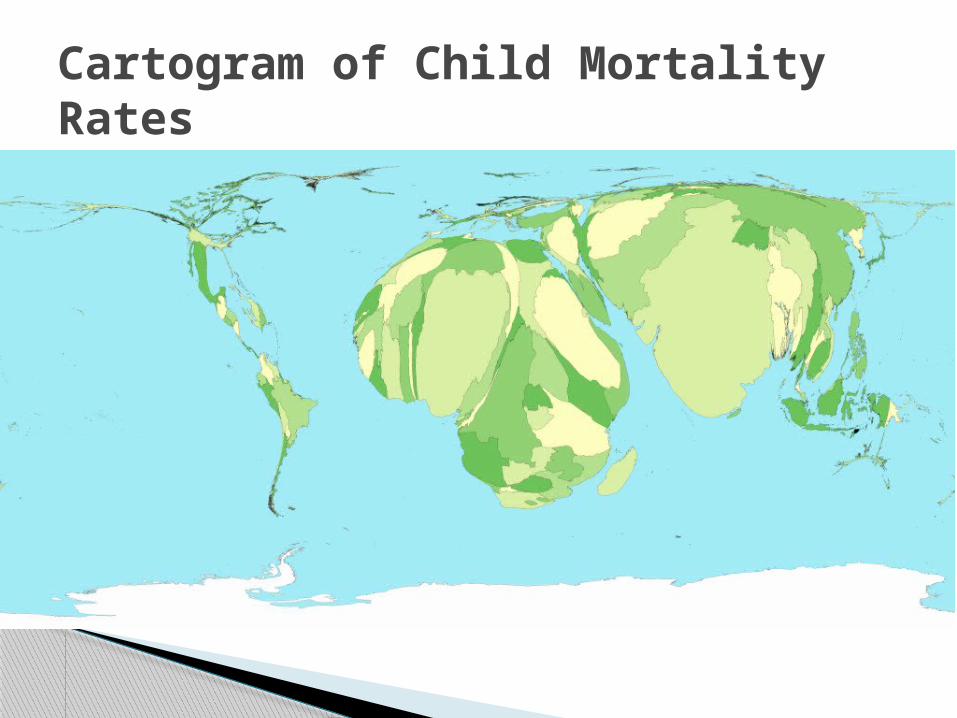
Cartogram of Child Mortality Rates
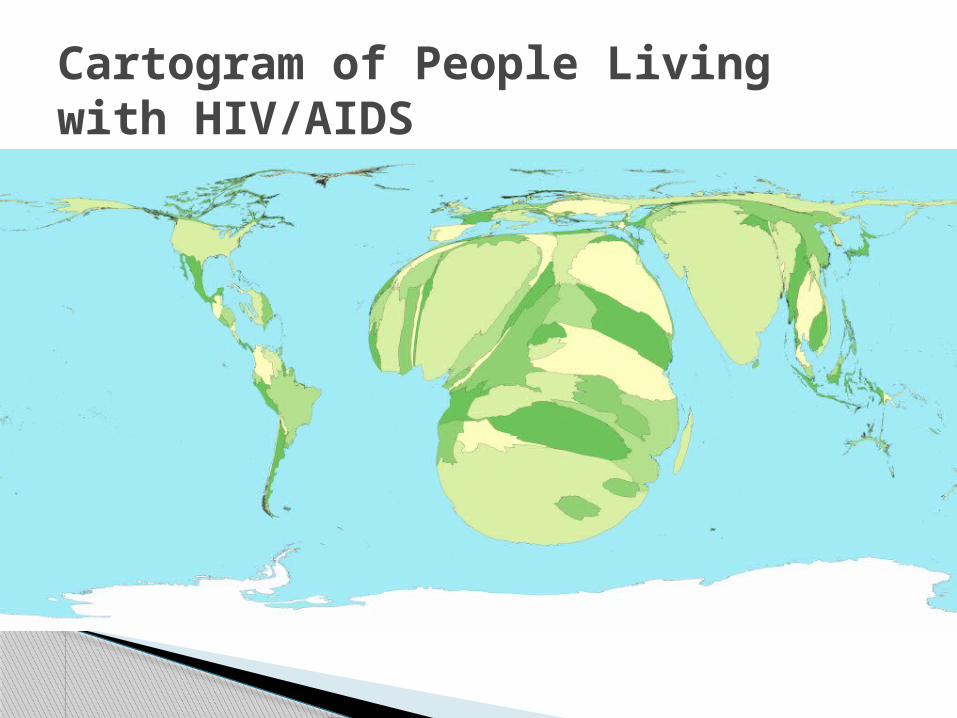
Cartogram of People Living with HIV/AIDS
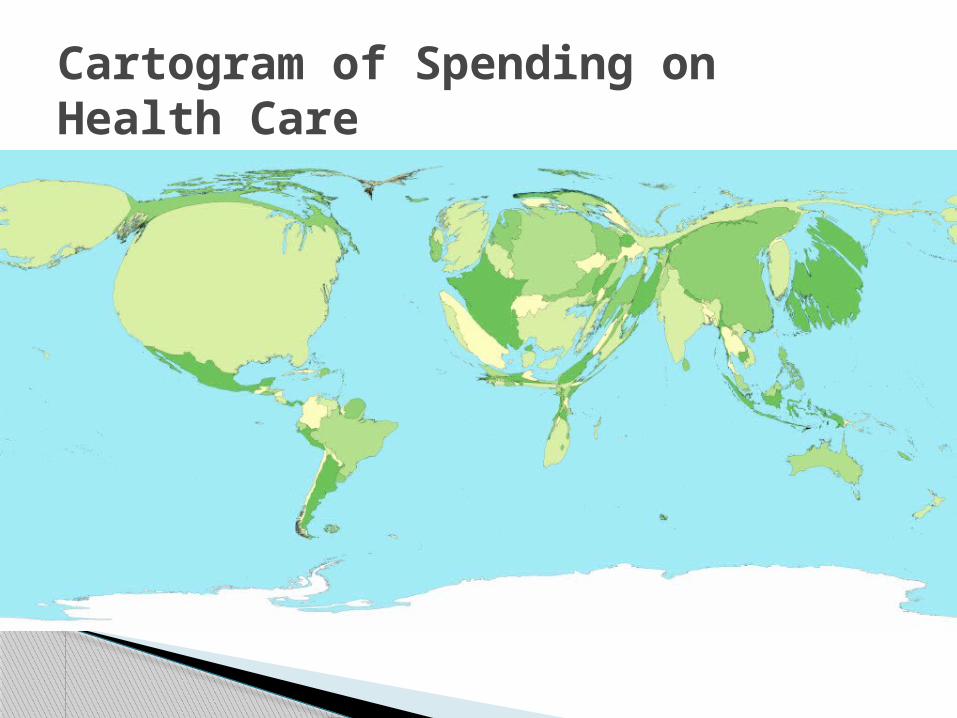
Cartogram of Spending on Health Care
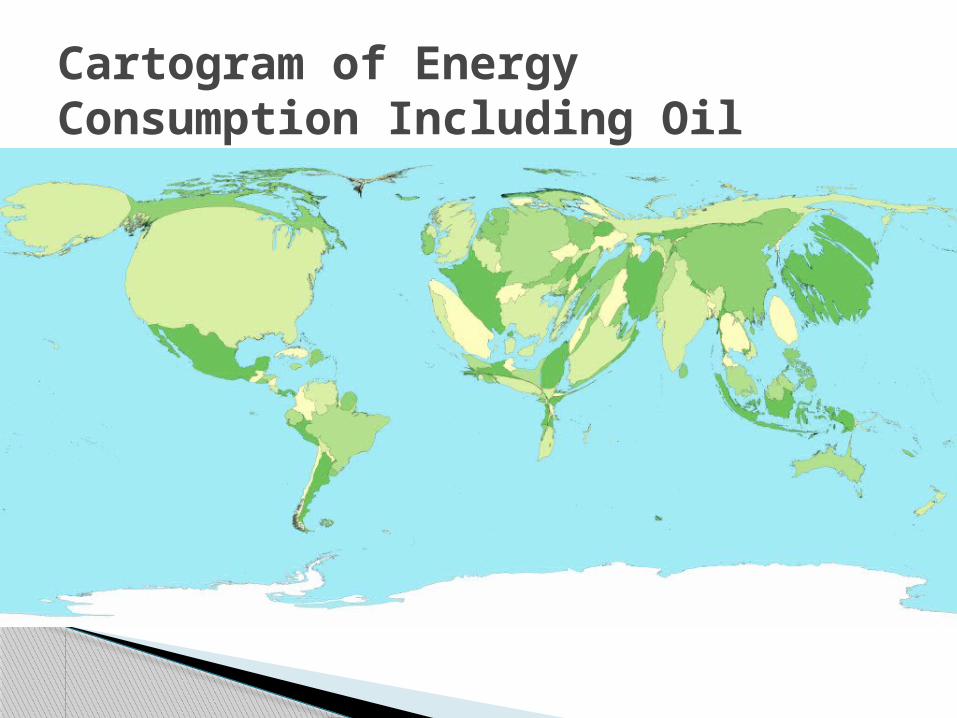
Cartogram of Energy Consumption Including Oil
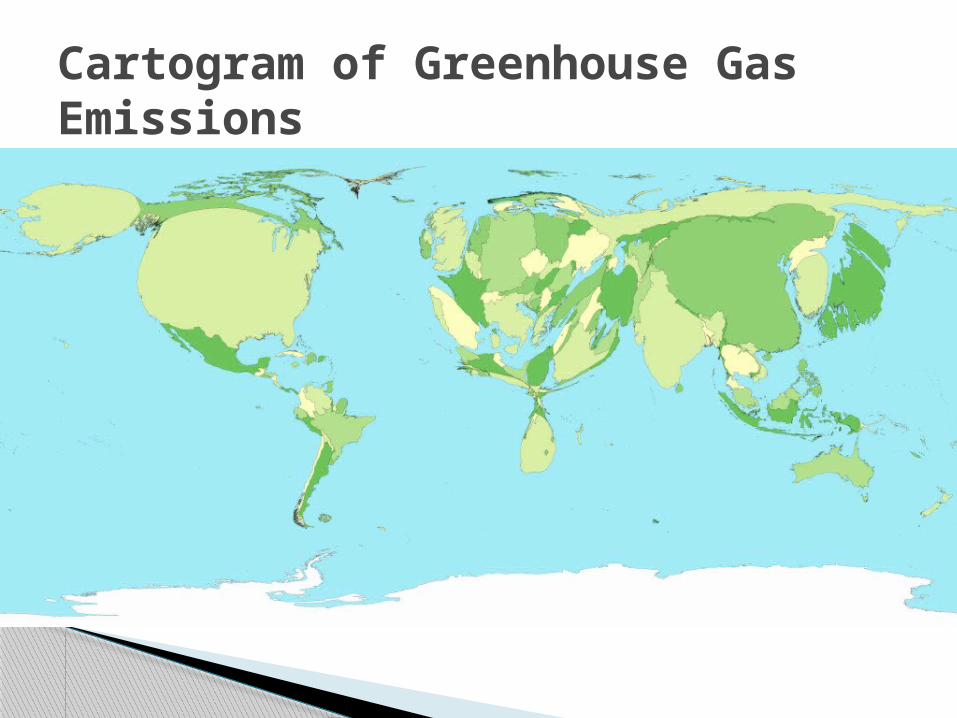
Cartogram of Greenhouse Gas Emissions
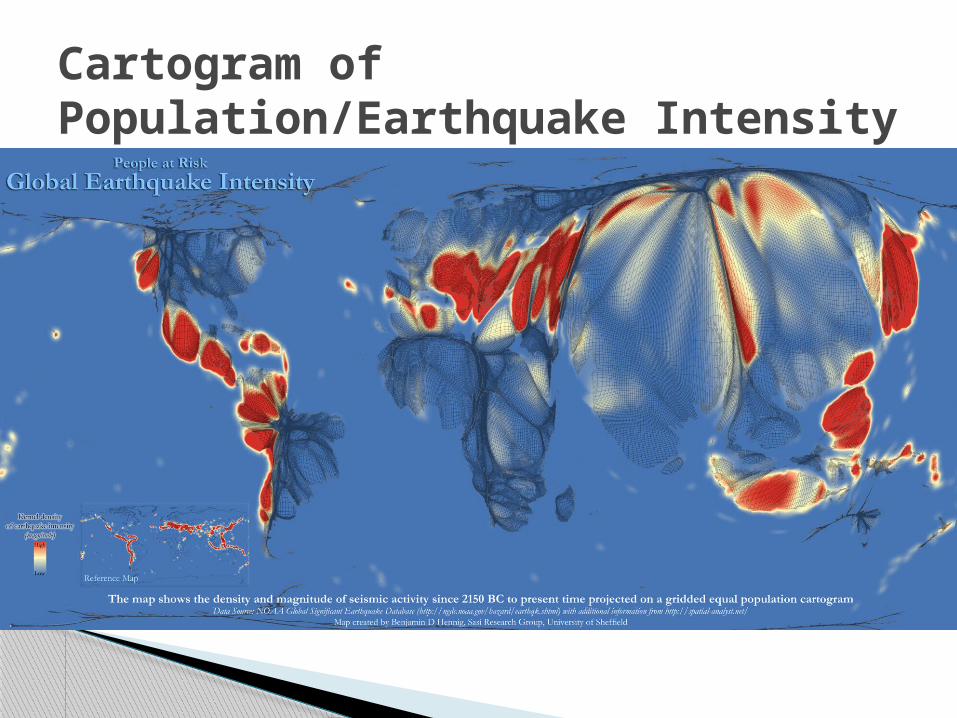
Cartogram of Population/Earthquake Intensity
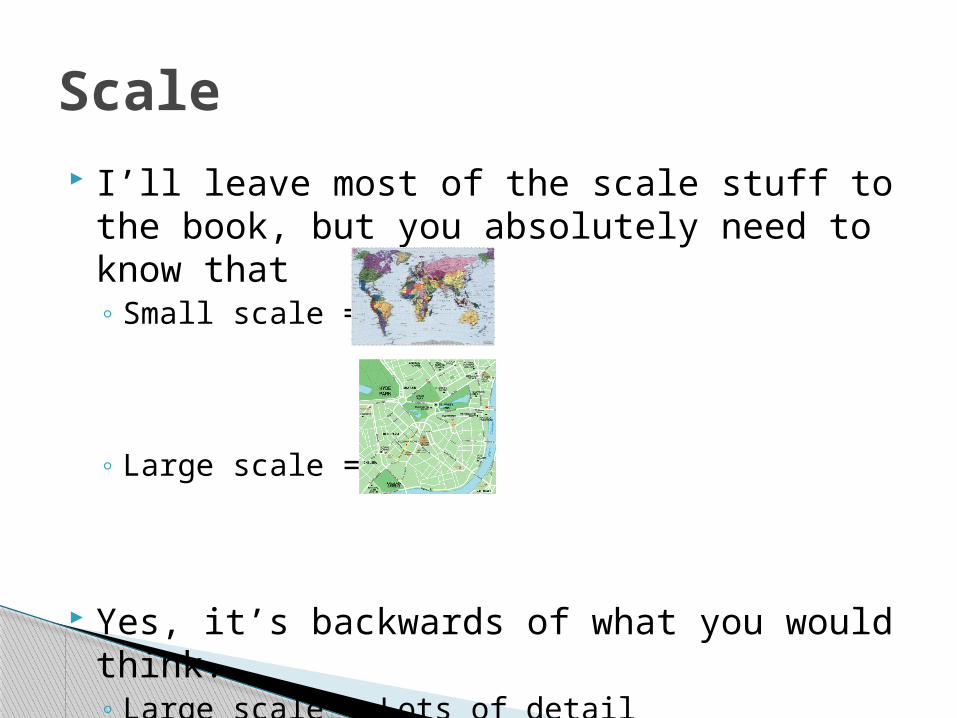
I’ll leave most of the scale stuff to the book, but you absolutely need to know that◦ Small scale =
◦ Large scale =
Yes, it’s backwards of what you would think.◦ Large scale = Lots of detail◦ Small scale = Very little detail
Scale