unit #18 - level curves, partial derivatives contour …math121/assignments/unit18.pdf · ... level...
TRANSCRIPT
Unit #18 - Level Curves, Partial Derivatives
Some problems and solutions selected or adapted from Hughes-Hallett Calculus.
Contour Diagrams
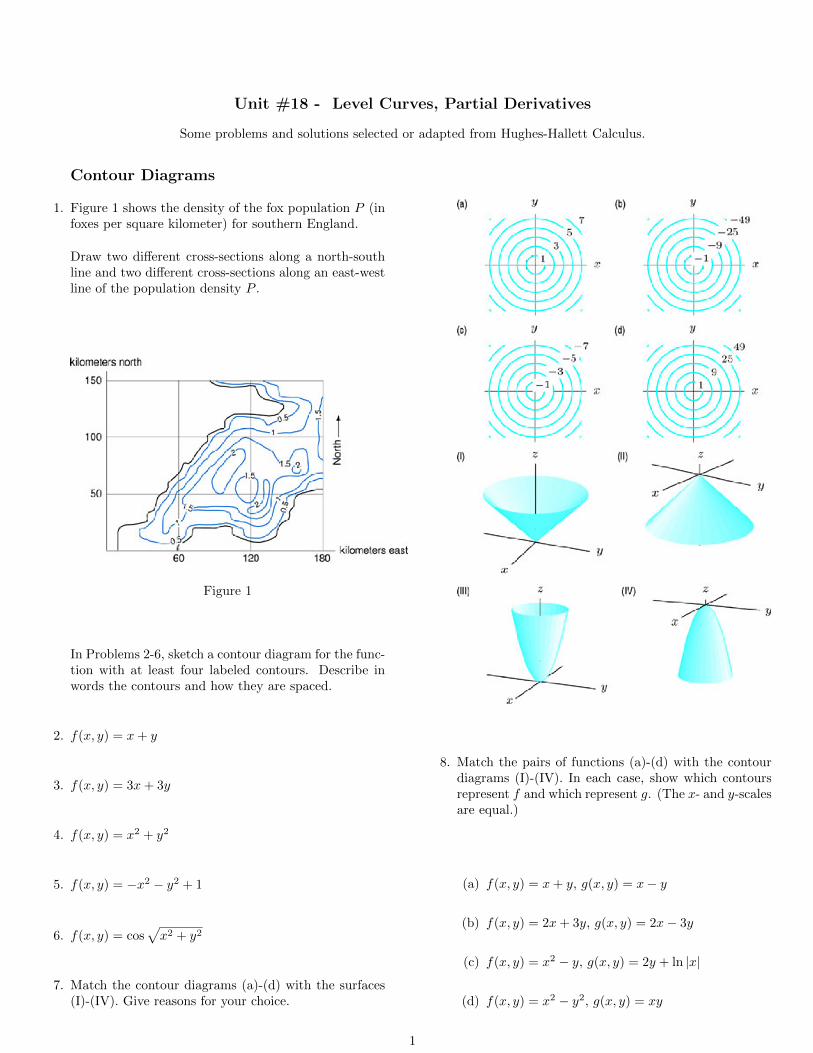
1. Figure 1 shows the density of the fox population P (infoxes per square kilometer) for southern England.
Draw two different cross-sections along a north-southline and two different cross-sections along an east-westline of the population density P .
Figure 1
In Problems 2-6, sketch a contour diagram for the func-tion with at least four labeled contours. Describe inwords the contours and how they are spaced.
2. f(x, y) = x+ y
3. f(x, y) = 3x+ 3y
4. f(x, y) = x2 + y2
5. f(x, y) = −x2 − y2 + 1
6. f(x, y) = cos√x2 + y2
7. Match the contour diagrams (a)-(d) with the surfaces(I)-(IV). Give reasons for your choice.
8. Match the pairs of functions (a)-(d) with the contourdiagrams (I)-(IV). In each case, show which contoursrepresent f and which represent g. (The x- and y-scalesare equal.)
(a) f(x, y) = x+ y, g(x, y) = x− y
(b) f(x, y) = 2x+ 3y, g(x, y) = 2x− 3y
(c) f(x, y) = x2 − y, g(x, y) = 2y + ln |x|
(d) f(x, y) = x2 − y2, g(x, y) = xy
1

9. Match the surfaces (a)-(e) with the contour diagrams(I)-(V) below.
10. Match Tables A-D with the contour diagrams (I)-(IV).
Table A
x-1 0 1
-1 2 1 2y 0 1 0 1
1 2 1 2
Table B
x-1 0 1
-1 0 1 0y 0 1 2 1
1 0 1 0
Table C
x-1 0 1
-1 2 0 2y 0 2 0 2
1 2 0 2
Table D
x-1 0 1
-1 2 2 2y 0 0 0 0
1 2 2 2
11. Match each Cobb-Douglas production function (a)-(c)with a graph (I)-(III) and a statement (D)-(G).
a. F (L,K) = L0.25K0.25
b. F (L,K) = L0.5K0.5
c. F (L,K) = L0.75K0.75
D. Tripling each input triples output.
E. Quadrupling each input doubles output.
G. Doubling each input almost triples output.
2

12. Below is the contour diagram of f(x, y).
x
y
1
2
3
1
1 2 31
x
y
2
21
1
0
0
-1
-1
-2
-2
Sketch the contour diagram of each of the followingfunctions.
(a) 3f(x, y)
(b) f(x, y)− 10
(c) f(x− 2, y − 2)
(d) f(−x, y)
Linear Functions
13. The charge, C, in dollars, to use an Internet service isa function of m, the number of months of use, and t,the total number of minutes on-line:
C = f(m, t) = 35 + 15m+ 0.05t
(a) Is f a linear function?
(b) Give units for the coefficients of m and t, and in-terpret them as charges.
(c) Interpret the intercept 35 as a charge.
(d) Find f(3, 800) and interpret your answer.
Which of the contour diagrams in Problems 14-17 couldrepresent linear functions?
14. 15.
3
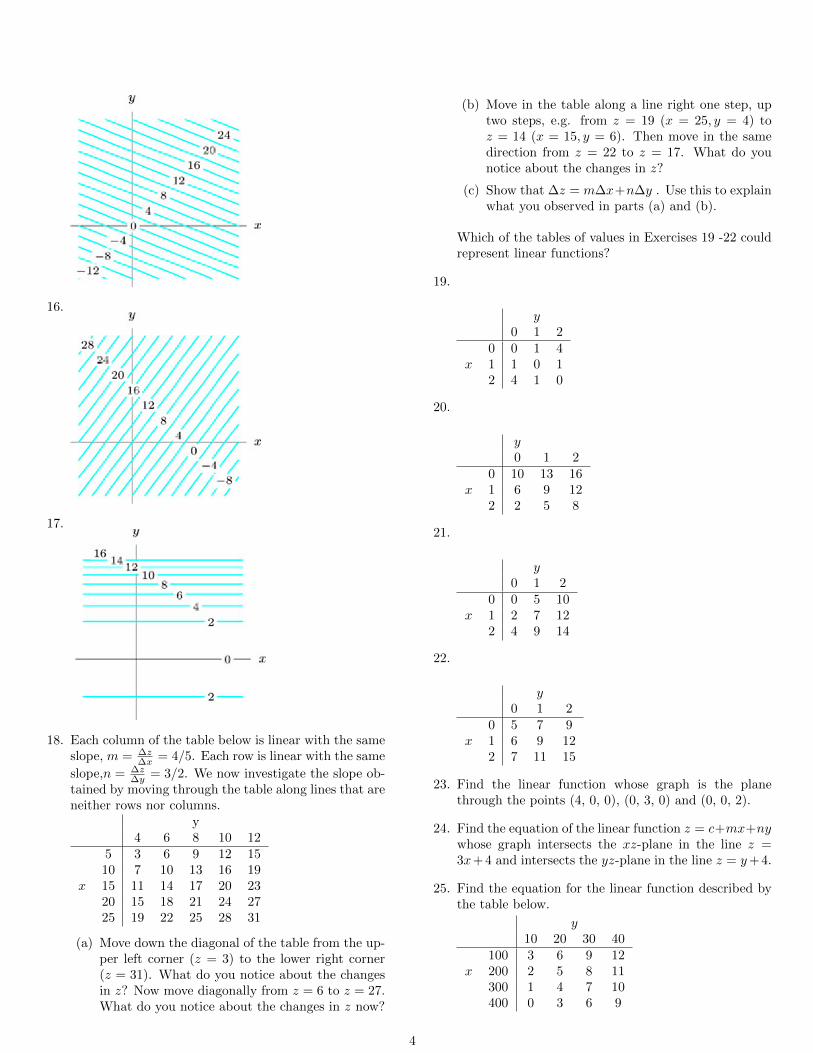
16.
17.
18. Each column of the table below is linear with the sameslope, m = ∆z
∆x = 4/5. Each row is linear with the same
slope,n = ∆z∆y = 3/2. We now investigate the slope ob-
tained by moving through the table along lines that areneither rows nor columns.
y4 6 8 10 12
5 3 6 9 12 1510 7 10 13 16 19
x 15 11 14 17 20 2320 15 18 21 24 2725 19 22 25 28 31
(a) Move down the diagonal of the table from the up-per left corner (z = 3) to the lower right corner(z = 31). What do you notice about the changesin z? Now move diagonally from z = 6 to z = 27.What do you notice about the changes in z now?
(b) Move in the table along a line right one step, uptwo steps, e.g. from z = 19 (x = 25, y = 4) toz = 14 (x = 15, y = 6). Then move in the samedirection from z = 22 to z = 17. What do younotice about the changes in z?
(c) Show that ∆z = m∆x+n∆y . Use this to explainwhat you observed in parts (a) and (b).
Which of the tables of values in Exercises 19 -22 couldrepresent linear functions?
19.
y0 1 2
0 0 1 4x 1 1 0 1
2 4 1 0
20.
y0 1 2
0 10 13 16x 1 6 9 12
2 2 5 8
21.
y0 1 2
0 0 5 10x 1 2 7 12
2 4 9 14
22.
y0 1 2
0 5 7 9x 1 6 9 12
2 7 11 15
23. Find the linear function whose graph is the planethrough the points (4, 0, 0), (0, 3, 0) and (0, 0, 2).
24. Find the equation of the linear function z = c+mx+nywhose graph intersects the xz-plane in the line z =3x+ 4 and intersects the yz-plane in the line z = y+ 4.
25. Find the equation for the linear function described bythe table below.
y10 20 30 40
100 3 6 9 12x 200 2 5 8 11
300 1 4 7 10400 0 3 6 9
4

The Partial Derivative
26. A drug is injected into a patient’s blood vessel. Thefunction c = f(x, t) represents the concentration of thedrug (in mg/L) at a distance x mm in the directionof the blood flow measured from the point of injectionand at time t seconds since the injection.
For the following partial derivatives,
• What are the units of the following partial deriva-tives?
• What are their practical interpretations?
• What do you expect their signs to be?
(a)∂c
∂x
(b)∂c
∂t
27. The quantity, Q, of beef purchased at a store, in kilo-grams per week, is a function of the price of beef, b, andthe price of chicken, c, both in dollars per kilogram.
(a) Do you expect∂Q
∂bto be positive or negative?
Explain.
(b) Do you expect∂Q
∂cto be positive or negative?
Explain.
(c) Interpret the statement∂Q
∂b= −213 in terms of
quantity of beef purchased.
28. Below is a contour diagram for z = f(x, y). Is fx posi-tive or negative? Is fy positive or negative? Estimatef(2, 1), fx(2, 1), and fy(2, 1).
29. An experiment to measure the toxicity of formaldehydeyielded the data in the table below. The values showthe percent, P = f(t, c), of rats surviving an exposureto formaldehyde at a concentration of c (in parts permillion, ppm) after t months.
Estimate ft(18, 6) and fc(18, 6) . Interpret your an-swers in terms of formaldehyde toxicity.
Time t (months)14 16 18 20 22 24
0 100 100 100 99 97 95Conc. c 2 100 99 98 97 95 92(ppm) 6 96 95 93 90 86 80
15 96 93 82 70 58 36
30. The surface z = f(x, y) is shown in the graph below.The points A and B are in the xy-plane.
(a) What is the sign of
(i) fx(A)?
(ii) fy(A)?
(b) The point P in the xy-plane moves along astraight line from A to B. How does the signof fx(P ) change? How does the sign of fy(P )change?
NOTE: the axes are not positioned in the usuallocation! Positive x values are back and left, and pos-itive y values are down and left. This affects your in-terpretation of the slope.
31. Consider the graph below:
(a) What is the sign of fx(0, 5)?
(b) What is the sign of fy(0, 5)?
32. The figure below shows a contour diagram for themonthly payment P as a function of the interest rate, r
%, and the amount, L, of a 5-year loan. Estimate∂P
∂r
5

and∂P
∂Lat the following points. In each case, give the
units and the everyday meaning of your answer.
(a) r = 8, L = 4000
(b) r = 8, L = 6000
(c) r = 13, L = 7000
Computing Partial Derivatives
Find the partial derivatives in Problems 33–40. As-sume the variables are restricted to a domain on whichthe function is defined.
33. fx and fy if f(x, y) = 5x2y3 + 8xy2 − 3x2
34.∂
∂x(a√x)
35.∂
∂B
(1
u0B2
)
36. Fv if F =mv2
r
37.∂T
∂lif T = 2π
√l
g
38. fa if f(a, b) = ea sin(a+ b)
39. gx if g(x, y) = ln(yexy)
40.∂Q
∂Kif Q = c(a1K
b1 + a2Lb2)γ
41. Money in a bank account earns interest at a continu-ous rate, r. The amount of money, $B, in the accountdepends on the amount deposited, $P , and the time, t,it has been in the bank according to the formula
B = Pert
Find∂B
∂tand
∂B
∂Pand interpret each in financial
terms.
42. The Dubois formula relates a person’s surface area, s,in m2, to weight, w, in kg, and height, h, in cm, by
s = f(w, h) = 0.01w0.25h0.75
Find f(65, 160), fw(65, 160), and fh(65, 160) . Inter-pret your answers in terms of surface area, height, andweight.
43. Is there a function f which has the following partialderivatives? If so what is it? Are there any others?
fx(x, y) = 4x3y2 − 3y4
fy(x, y) = 2x4y − 12xy3
6