unit 2. basic techniques - upmocw.upm.es/lenguajes-y-sistemas-informaticos/software...it is also...
TRANSCRIPT

Software Quality
Unit 2. Basic techniques
Calidad del Software
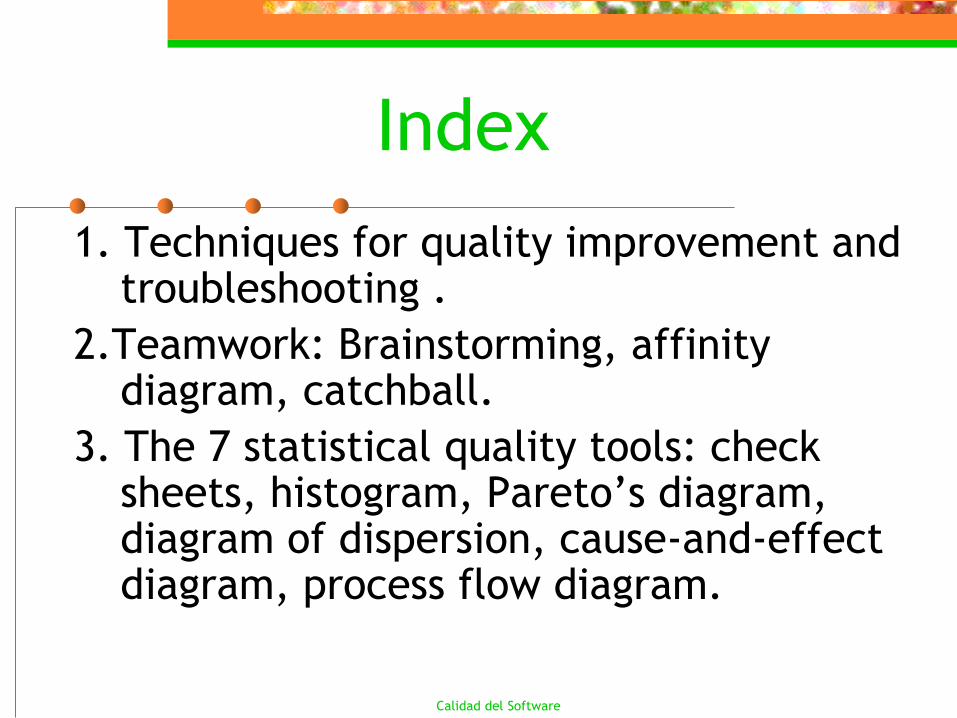
Index
1. Techniques for quality improvement and troubleshooting .
2.Teamwork: Brainstorming, affinity diagram, catchball.
3. The 7 statistical quality tools: check sheets, histogram, Pareto’s diagram, diagram of dispersion, cause-and-effect diagram, process flow diagram.

Calidad del Software
They are useful tools for:
• Look for defects.
• Data analysis and checking for
control limits.
• Staff problem detection.
• Systems improvement.
...
Quality basic techniques?

Calidad del Software
Problems resolution must be an usual practice in an Organization quality committed.
“Anyone makes an error. But only a stupid insists on it”
Robertine Maynard
IMPROVEMENT AND PROBLEMS
RESULUTION

Calidad del Software
Improvement and problems
resolution – PDSA cycle
DO
ACT
DAS
4. Implement
6. Standardize the solution7. Plan for the future
PLAN1. Identify the opportunity
2. Analyze the process
3. Develop the optimal
solutionPSTUDY
5. Study the results

Calidad del Software
1. IDENTIFY THE OPORTUNITY
Main goal of the phase is to identify
and prioritize opportunities for
improvements.
a) Identify the problem
b) Form the team
c) Define the scope
Improvement and problems
resolution – PDSA cycle

Calidad del Software
1.a IDENTIFY THE PROBLEM
• Is the problem important and why?
• Will problem solution contribute to
the attainment of goals?
• Can the problem be defined clearly
using objective measures?
Improvement and problems
resolution – PDSA cycle

Calidad del Software
1.b FORM THE TEAM
• Usually is a working group.
• If the problem is of multifunctional
nature the team should be selected
and tasked by the quality council.
• The team leader is selected and
became in the owner of the process
improvement.
Improvement and problems
resolution – PDSA cycle

Calidad del Software
1.c DEFINE THE SCOPE
• A problem well defined is half solved
The problem exits and it is clearly described and it
is easily understood.
The effect has been stated: what is wrong, when it
happens, and where it is occurring, not why it is
wrong or who is the responsible
What is known, what is unknown, and what needs
to be done.
Describe facts and not judgments.
Emphasizes the impact on the customers.
Improvement and problems
resolution – PDSA cycle

Calidad del Software
2. ANALIZE THE CURRENT PROCESS
The objective of the phase is to understand
the process. Key activities are:
a) Define process boundaries
b) Determine levels of customers
satisfaction and measurements needed
c) Gather data
d) Identify root causes
Improvement and problems
resolution – PDSA cycle

Calidad del Software
2. ANALIZE THE CURRENT PROCESS
First steep for the team: develop a
process flow diagram.
Second steep: define performance
measures.
Third steep: collect all available data
and information.
Fourth steep: develop a plan.
Improvement and problems
resolution – PDSA cycle

Calidad del Software
2. ANALIZE THE CURRENT PROCESS
Questions that plan answers:• What problem or operation do we wish to learn
about?
• What are the data used for?
• How many data are needed?
• What conclusions ca be drawn from the collected
data?
• What action should be taken as a result of the
conclusion?
Improvement and problems
resolution – PDSA cycle
Calidad del Software
3. DEVELOP THE OPTIMAL SOLUTION(S)
The objective is to establish potential
and feasible solutions and to recommend
the best solution to improve the process.
Improvement and problems
resolution – PDSA cycle

Calidad del Software
4. IMPLEMENT CHANGES
This phase prepares the implementation plan,
obtaining the approval, and implementing the
process improvement.
The content of the implementation plan must
fully describe:
Improvement and problems
resolution – PDSA cycle
Why will it be done?How will it be done?When will it be done?
Who will do it?Where will it be done?

Calidad del Software
5. STUDY THE RESULTS
This phase is responsible for the
monitoring and evaluation of the
change.
If the problem has not been solved
appropriately, then some of the phases
will be repeated again.
Improvement and problems
resolution – PDSA cycle

Calidad del Software
6. STANDARDIZE THE SOLUTION.
Once the solution is accepted by the
team, it must be institutionalize by
positive control of the process, process
certification, and operator
certification.
Improvement and problems
resolution – PDSA cycle

Calidad del Software
7. PLAN FOR THE FUTURE.
The phase is responsible for continuous
process improvement.
Improvement and problems
resolution – PDSA cycle

Calidad del Software
BRAINSTORMING
•To encourage creativity.
•To obtain many ideas about a topic.
•Freedom expression of ideas.
•Some of them will be no useful.
•They will be discussed.
TEAMWORK TECHNIQUES

Calidad del Software
BRAINSTORMING: Use
• Problem solving.
• To identify problems causes.
• To identify provisional measures.
• To identify appropriate solutions.
• To obtain innovative ideas emerging from improvement groups.
Teamwork techniques

Calidad del Software
Teamwork techniques
BRAINSTORMING: Rules
•Small groups (3-8).
•The group has a leader.
•People in the group has to know and to understand the discussion subject.
•The group accepts ideas from anyone of the members without criticism.
•Meeting length is fixed.

Calidad del Software
Teamwork techniques
BRAINSTORMING: Phases
1. Subject definition: Meeting starts and objectives are explained.
2. Reflection: Some time is taken to think about the subject.
3. Ideas expression and exposition: Leader asks for ideas and write-down them.
4. Analysis and ideas selection: Leader starts debate to select the most accurate ideas concerning to the subject.

Calidad del Software
Teamwork techniques
AFFINITY DIAGRAM
It is a way for organizing information.
It helps to group together those elements
which are related in a natural way. (chunking
information)
It is a creative process. The team produces a
classification by mean of the consensus.

Calidad del Software
AFFINITY DIAGRAM : Use
• For complex or incomprehensible
problems.
• Unorganized problems.
• Problems involving many people.
• Problems requiring key point
identification.
Teamwork techniques

Calidad del Software
AFFINITY DIAGRAM: Phases
1. To set the problem.
2. To establish 5-10 people groups.
3. To carry out a brainstorming and to write-
down each one in a post-it.
4. To stick post-it in a blackboard.
Teamwork techniques

Calidad del Software
AFFINITY DIAGRAM : Phases
5. To group similar pos-it.
6. To name each group and to write down an
explicative text.
6. To draw the affinity diagram.
7. To write a complete document with text
corresponding to each one of the groups.
Teamwork techniques

Calidad del Software
Teamwork techniques
CATCHBALL
This tool was developed in Japan to encourage participation.
The main goal is to involve employees in finding out:
•Problem solutions
•Good opportunities to improve the future.

Calidad del Software
Teamwork techniques
CATCHBALL
1. To throw: Someone throws an idea.
2. To catch and to think about: Everybody in the group thinks about it and tries to understand it.
3. To improve: Somebody else says an improvement for the idea.
4. To throw again: Te improved idea is thrown to the group and the cycle starts again.

Calidad del Software
• Check sheet
• Histogram
• Pareto Diagram
• Diagram of Dispersion
• Control chart
• Cause-and-Effect Diagram
• Process Flow Diagram
The 7 quality tools[Kaoru Ishikawa]
Calidad del Software
The main purpose is to ensure that data are
collected carefully and accurately by
operating personnel.
Data must be collected in such a manner
that they can be quickly and easily used and
analyzed.
Check sheet

Calidad del Software
They are designed as a table or diagram.
They catch, organize or classify data.
They are used to:
•Solve problems.
•To start control process, improvement
process.
•To analyze and to interpret information.
Check sheet
Calidad del Software
It is a very well known tool. It is a frequency diagram. Vertical bars represent the frequency of a continuous variable. Each one of the bars is an interval or a class.
They can be used to analyze data distribution, and to evaluate the results of implementing improvement actions.
Histogram

Calidad del Software
Histogram
Biased distribution
Gauss / bell distribution Bimodal distribution

Calidad del Software
Diagram 80 – 20
It is very well known that:
“20% of causes are the origin of the 80% of
effects”
This fact can be enounced in quality as
follows:
“80% of defects are caused by the 20% of
processes”
Pareto’s diagram

Calidad del Software
It is a very special bars diagram. In this
case, frequencies are ordered in a
decreasing order.
This representation permits to identify
main factors related to a problem.
So that, we can quickly act to solve
problems.
Pareto’s diagram

Calidad del Software
Pareto’s diagram
It is a very powerful tool to:
•Identify the most important and serious
problems.
•Study problem causes to remove them.
•Decide the objective of an improvement
proposal.
•Predict improvement effectiveness.

Calidad del Software
Pareto’s diagram
Error
class
#
Errors
Total % Accumu-
lated %
D 35 50% 50%
B 17 24% 74%
E 8 11% 85%
A 7 10% 95%
C 3 4% 100%
TOTAL 70 100%
10
20
30
40
50
60
70
100%
80%
60%
40%
20%
FewImportant
ManyTrivial
D B E A C

Calidad del Software
It is a correlation diagram. It permits to analyze if there is some relation between two data groups (variables).
It can be used to:
•Verify if there is a relation between two process variables.
•Estimate values of a variable hard to measure using other correlated variable.
•Show cause / effect relation between two variables.
Diagram of Dispersion

Calidad del Software
They are linear graphs to study, manage and
evaluate processes stability through the
time depending on a variable value, and
usually, at a glance.
Upper and lower bounds are established and
they are used to determine if processes are
or not under control.
Control charts

Calidad del Software
It is also known as fishbone diagram or
Ishikawa diagram.
It is used to represent and to study the
relationship among one effect and its
possible causes.
It is a way to determine the problem’ source
and how to effectively solve it.
Cause–and-Effect diagram

Calidad del Software
C&E diagram
It is a very powerful tool to:
•Identify true causes of a situation and
grouping them into categories.
•Summarize causes and effect of a process.
•Be favorable to critical thought.
•Analyze and solve problems in a systematic
way.
Cause–and-Effect diagram

Calidad del Software
Cause–and-Effect diagram
STEPS:
•To give a clear problem definition.
•To identify main factors (4 to 8).
•To determine causes and sub-causes associated to each one of the main factors.
•To select most likely causes and to classify and order them.
•To find out and to remove the root cause.

Calidad del Software
http://tecnicasdeinvestigacion.wordpress.com
/2009/03/18/diagramas-causa-efecto/
Cause–and-Effect diagram
HEAD
Main bone Main bone
Main boneMain bone
bone
Minor bone
spine

Calidad del Software
http://tecnicasdeinvestigacion.wordpress.com
/2009/03/18/diagramas-causa-efecto/
Cause–and-Effect diagram

Calidad del Software
These diagrams show the flow of the
product or service as it moves through
the various processing operations.
The diagram makes it easy to visualize
the entire system, identify potential
trouble spots, and locate control
activities.
Process flow diagram