unit 2: data and function fitting with a transformations of parent functions
TRANSCRIPT

UNIT 2: DATA AND FUNCTION FITTINGWith a Transformations of Parent Functions

LESSON 1:LINEAR VS. NON-LINEAR DATA
OBJECTIVE: SWBAT IDENTIFY LINEAR AND NONLINEAR DATA TRENDS
KEEP ON YOUR DESK: HW FROM MONDAY

LESSON 1 DAY 1 – 09/01/15LINEAR VS. NON-LINEAR DATA
OBJECTIVE: SWBAT IDENTIFY LINEAR AND NONLINEAR DATA TRENDS
KEEP ON YOUR DESK: HW FROM MONDAY
Stroop Test Data Collection
• Take 5-10 minutes to finish data collection process• Graph the List Length vs. Time on an x-y coordinate plane with a triangle and circle (according to your page)
• We will begin Part 2 of your test (Data Analysis) in 12 minutes
Stroop Test – Performance Assessment
• Your predictions (top two bubbles) do not have a single correct answer. Just predict!
• For the next two parts, look at the best-fit line that YOU drew on your graph for each set of data (triangles and circles). Choose (estimate) coordinate pairs that fall EXACTLY on the line. They don’t have to be from your data! They can be a crosshair where the line goes through.
• Self-explanatory from there
Correlation of a Linear Data Set
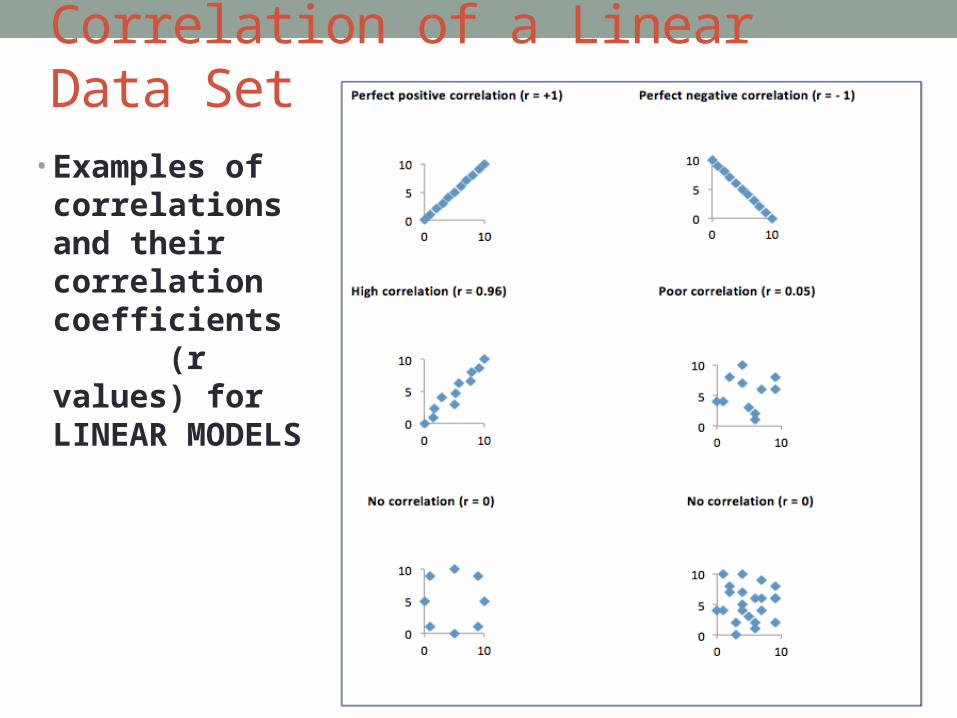
• Examples of correlations and their correlation coefficients (r values) for LINEAR MODELS
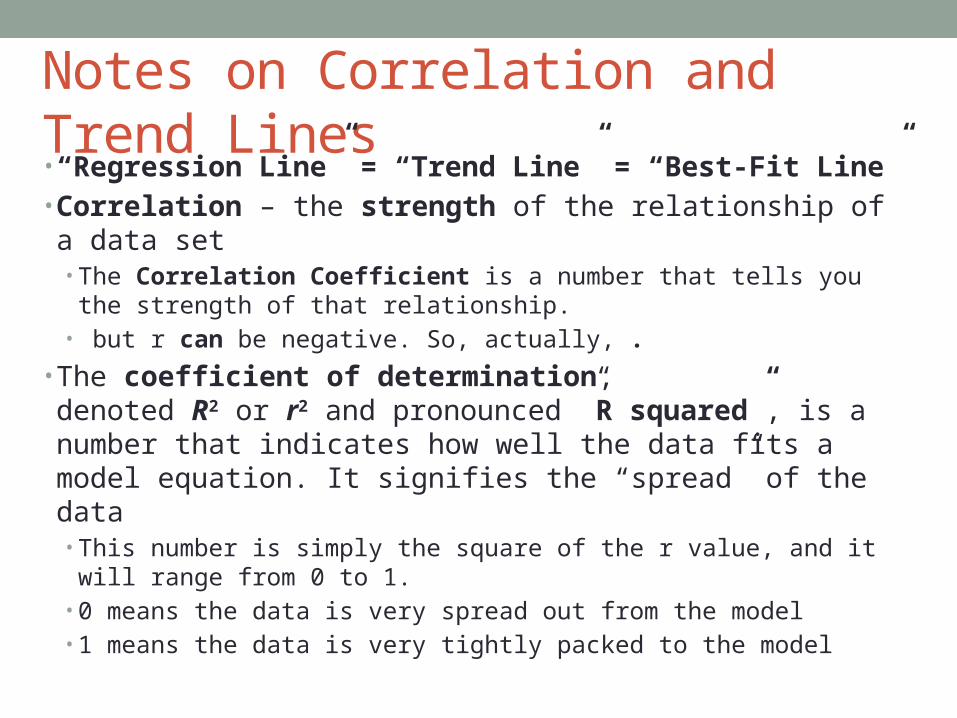
Notes on Correlation and Trend Lines • “Regression Line” = “Trend Line” = “Best-Fit Line”• Correlation – the strength of the relationship of a data
set• The Correlation Coefficient is a number that tells you the
strength of that relationship.• but r can be negative. So, actually, .
• The coefficient of determination, denoted R2 or r2 and pronounced ”R squared”, is a number that indicates how well the data fits a model equation. It signifies the “spread” of the data• This number is simply the square of the r value, and it will range
from 0 to 1.• 0 means the data is very spread out from the model• 1 means the data is very tightly packed to the model

When to use r vs. • Correlation coefficient – r
• When you are determining the type of correlation or relationship that the data have (positive, negative, none)
• Not every kind of regression model has an “r” value. Some only have . This is because not every model can have a “positive” and a “negative” correlation.
• Coefficient of determination - • When you are determining if a model is “reasonable” to use for a
particular data set• When you are comparing different function models (linear vs.
quadratic vs. logarithmic vs. exponential, etc.) – This is using the “STAT” “CALC” menu with all of the “Reg”s
Exit Ticket – In pairs of 2
•Do “Lesson Check” on page 96 #1-3 – check in with teacher’s textbook at front of room after each one
HOMEWORK (Due Thursday):
•Go back and adjust your answers to #7-14 ALL on pages 96-97 given what we talked about in class
•In addition to those, DO page 97 #18
LESSON 1 DAY 2 – 09/03/15LINEAR VS. NON-LINEAR DATA
OBJECTIVE: SWBAT IDENTIFY LINEAR AND NONLINEAR DATA TRENDS
KEEP ON YOUR DESK: HW FROM TUESDAY

HW Questions?
• In your pods, decide on ONE question that you have as a group. In doing so, help answer each other’s questions.
•Have one person write your question on the board in the spaces accordingly
•After finished with questions, turn HW into the tray.
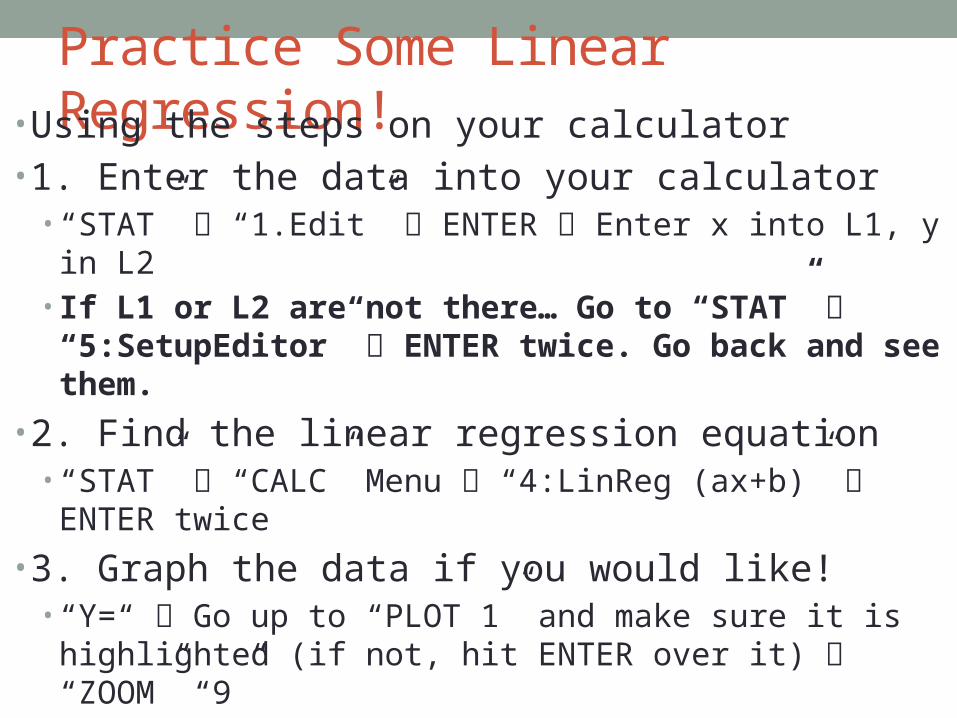
Practice Some Linear Regression!• Using the steps on your calculator• 1. Enter the data into your calculator
• “STAT” “1.Edit” ENTER Enter x into L1, y in L2• If L1 or L2 are not there… Go to “STAT” “5:SetupEditor” ENTER twice. Go back and see them.
• 2. Find the linear regression equation• “STAT” “CALC” Menu “4:LinReg (ax+b)” ENTER twice
• 3. Graph the data if you would like!• “Y=“ Go up to “PLOT 1” and make sure it is highlighted (if
not, hit ENTER over it) “ZOOM” “9”
• 4. Graph the regression equation if you would like!• “Y=“ Input the equation you found in step 2 above using the
a and b value along with “X,T,,n” button for X

HOMEWORK:1) Complete Linear Regression worksheets – ALL problems – you’ll need your graphing calculators! – Due Tuesday
2) Make corrections on your pink tests for EVERY problem where you missed points (no checkmark is drawn). Use notes, books, and other resources! FOR EACH PROBLEM:
• 1. Number of problem• 2. “What I did incorrectly was…”• 3. Correct the problem and circle your answer• - Due Thursday (ask Q’s after school Tues)

LESSON 1 DAY 3 – 09/08/15LINEAR VS. NON-LINEAR DATA
OBJECTIVE: SWBAT IDENTIFY LINEAR AND NONLINEAR DATA TRENDS
TURN IN TO THE TRAY:HW FROM THE WEEKEND (WORKSHEETS)

HOMEWORK (ALL Due Thursday)
1) Make corrections on your pink tests for EVERY problem where you missed points (no checkmark is drawn). Use notes, books, and other resources! FOR EACH PROBLEM:
• 1. Number of problem• 2. “What I did incorrectly was…”• 3. Correct the problem and circle your answer
2) Finish Group Data Presentation Details
3) READ and take notes on pages 41-45, 107-108

Data Analysis (Test Part 2) Return• Read through my comments on your Test Part 2’s silently.• General questions/comments? Individual questions after class
please• Details matter!
• Test grades – How do I improve? Do all of the following to gain up to the next highest letter grade (FD, DC, CB, BA)
1. Do your test corrections
2. After/before school on Thursday or Friday, come in for a re-test problem based on what you missed (must have corrections done already)
3. No exceptions – If this matters to you, then you must be there on one of those times for as long as I require!
Group Data Analysis• In groups of 3 or 4, you will be presented with some data. • You must graph the data on a giant graph paper and find the
linear regression equation (y=mx+b) along with its correlation coefficient and coefficient of determination
• You must also display two other regressions (found in the “STAT” “CALC” menu) that have a higher coefficient of determination () than the linear regression
YOU WILL BE GRADED ON HOW WELL YOU DO YOUR JOB IN YOUR GROUP AND YOUR GROUP’S ANALYSIS
JOBS: (1) Pattern Analyst (2) Grapher/Plotter
(3) Presenter (4) if necessary – director/extra analyst
Group Data AnalysisJOBS: (1) Grapher/Plotter (2) Pattern Analyst
(3) Presenter (4) if necessary - extra analyst or presenter
What you will turn in/be graded on:
1. Your giant graph of data along with three (diff. color) regression models through the data
2. Separate sheet of paper with all of the types of regressions you TRIED (even if you didn’t use it) with the equation AND value, along with r value if it is given.
- Also on sheet: Extrapolation with input value of 200 and extrapolation with output value of 5000.
3. Short (2-3 min) presentation about the different types of regression used, which one is best, which is worst, what the coefficient of determination says, and what your extrapolated input/output values are.
- Your group all needs to know what you are doing! Be time-efficient!

LESSON 2 DAY 1 – 09/10/15ABSOLUTE VALUE FUNCTION
OBJECTIVE: SWBAT SOLVE AND GRAPH THE ABSOLUTE VALUE FUNCTION
TURN IN TO THE TRAY:TEST CORRECTIONS!

HOMEWORK (ALL Due Friday)
1) Textbook Page 46 #11-29 Odds
2) Practice Quiz/Exploration
3) QUIZ tomorrow on Regression (Calculator steps and data analysis)
4) HONORS ONLY: Also page 46 #43-55 Odds
Data Analysis Presentations!
•Present as if you are a department presenting to the CEO (Mr. Speer)
•Speakly loudly and clearly•Don’t use “Um” or “like”•Explain the whole process, from start to finish
•2-3 minutes long
Which type of Regression should we use?• It is helpful to know the general shape of some of the functions that
are used in regression analysis.• Some common parent functions that are used to model data are:
1. Linear
2. Quadratic
3. Cubic
4. Absolute Value
5. Square Root
6. Exponential
7. Logarithmic
8. Rational
9. Sine
10. Cosine
11. Tangent
Let’s take a look at these
(on yellow “Parent
Functions Chart” sheet)
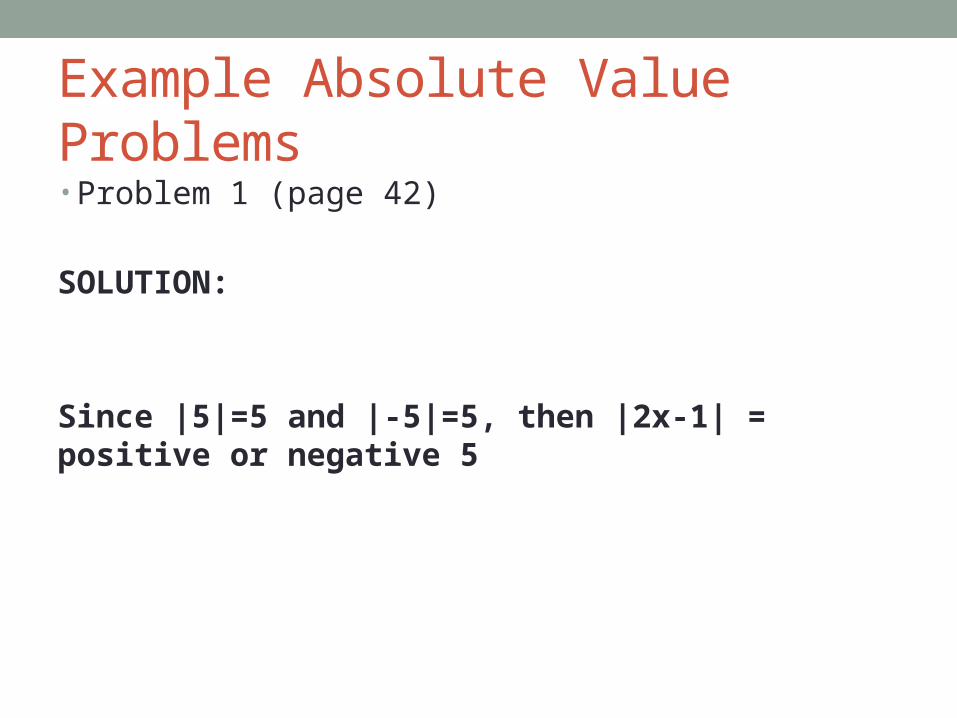
Example Absolute Value Problems• Problem 1 (page 42)
SOLUTION:
Since |5|=5 and |-5|=5, then |2x-1| = positive or negative 5
To graph, plot points on the number line at 3 and at -2.
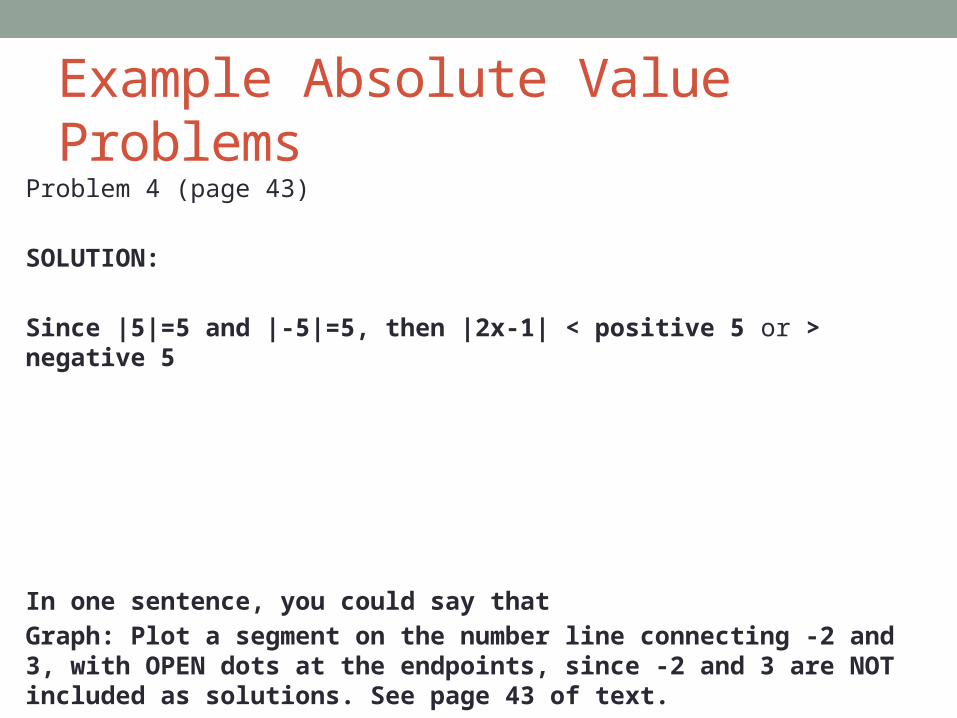
Example Absolute Value ProblemsProblem 4 (page 43)
SOLUTION:
Since |5|=5 and |-5|=5, then |2x-1| < positive 5 or > negative 5
In one sentence, you could say that
Graph: Plot a segment on the number line connecting -2 and 3, with OPEN dots at the endpoints, since -2 and 3 are NOT included as solutions. See page 43 of text.
LESSON 2 DAY 2 – 09/11/15ABSOLUTE VALUE FUNCTION
OBJECTIVE: SWBAT SOLVE AND GRAPH THE ABSOLUTE VALUE FUNCTION
KEEP TO TURN IN ON MONDAY:HW FROM TEXTBOOK – QUIZ TODAY!
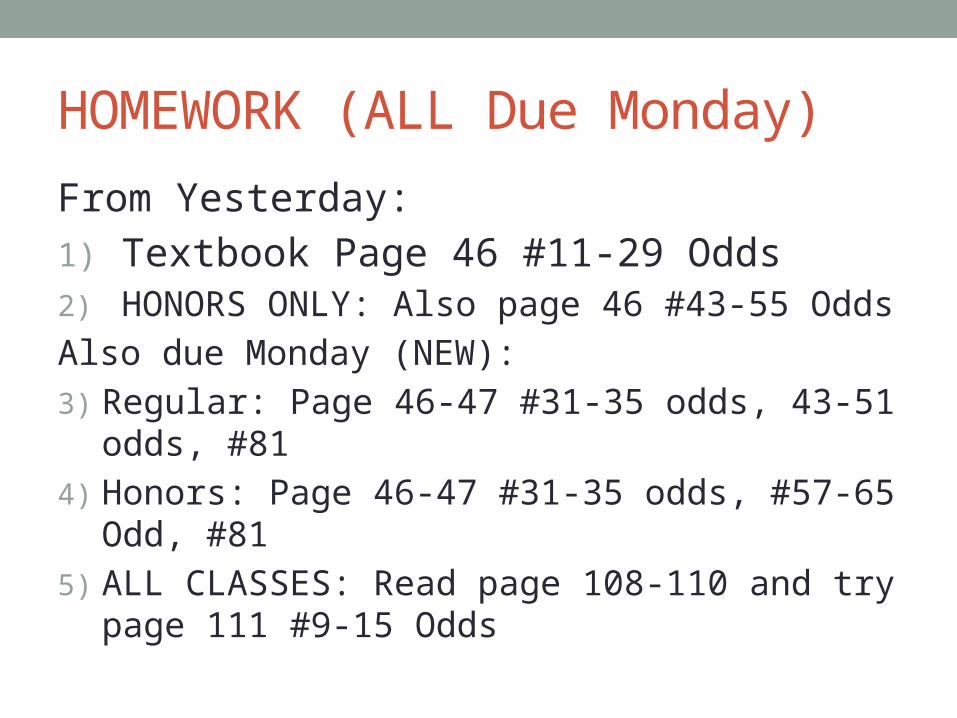
HOMEWORK (ALL Due Monday)
From Yesterday:
1) Textbook Page 46 #11-29 Odds 2) HONORS ONLY: Also page 46 #43-55 Odds
Also due Monday (NEW):
3) Regular: Page 46-47 #31-35 odds, 43-51 odds, #81
4) Honors: Page 46-47 #31-35 odds, #57-65 Odd, #81
5) ALL CLASSES: Read page 108-110 and try page 111 #9-15 Odds

Which is most difficult?• Out of the following three problems, take ONE minute to
read them and determine which is most difficult. You may solve them only AFTER you have examined each of them.
• Problem 1: Solve
• Problem 2: Solve and graph.
• Problem 3: Solve and graph.

“Levels” Stations
•Go to your station and complete the problems there in your group (or smaller pairs/triads)
•Bring your notes! Reference the book! Sitting idly by while time ticks away is NOT what you should be doing.

Exit Ticket
•At your station, there is an exit ticket. Take one, complete it, and turn it in to your class tray.
•You may leave when the bell rings.
LESSON 2 DAY 3 – 09/14/15ABSOLUTE VALUE FUNCTION
OBJECTIVE: SWBAT SOLVE AND GRAPH THE ABSOLUTE VALUE FUNCTION
KEEP AT YOUR DESK FOR REVIEW:HW FROM TEXTBOOK PAGES

HOMEWORK (ALL Due Tuesday)
Using Problem 1 on page 108 as a guide,
Do page 111 #8-16 Evens

HW Questions?• What questions do you have from
Regular Algebra 2
Textbook Page 46 #11-29 Odds #31-35 odds, 43-51 odds, #81,
Page 111 #9-15 Odds
Algebra 2 HonorsTextbook Page 46 #11-29 Odds #31-35 odds, 43-65 odds, #81,
Page 111 #9-15 Odds
Checking for Extraneous Solutions• When working with any kind of equation, the final step
should always be: “Does my answer make sense in the original problem?”
• Extraneous solution: A “solution” that actually does not work as a solution to the original problem.
• Example: Solve • Solution:
However, when plugging x=-8 into the original equation,

Checking for Extraneous Solutions
•Additional Examples – page 46 #20,22,24

LESSON 3 DAY 1 – 09/15/15PARENT FUNCTION TRANSLATIONS
OBJECTIVE: SWBAT GENERALIZE THE TRANSLATIONS OF ABSOLUTE VALUE FUNCTIONS TO ALL PARENT FUNCTION GRAPHS
KEEP AT YOUR DESK FOR REVIEW:HW FROM TEXTBOOK PAGES

Quick Quiz time!• Clear your desks, but keep your calculator and pencil out.
• Extra Credit (write your answer on the back of the quiz)
What is the motto of the University of Notre Dame?
Hint: It had something to do with the Virgin Mary…
After the quiz…. WARMUP!• Try the following problem…
1. Graph the function and by hand on the same graph with a table of values.
2. What is the difference between the two graphs in #1?
3. Try graphing and in the same way. Does the same thing happen as in #1?
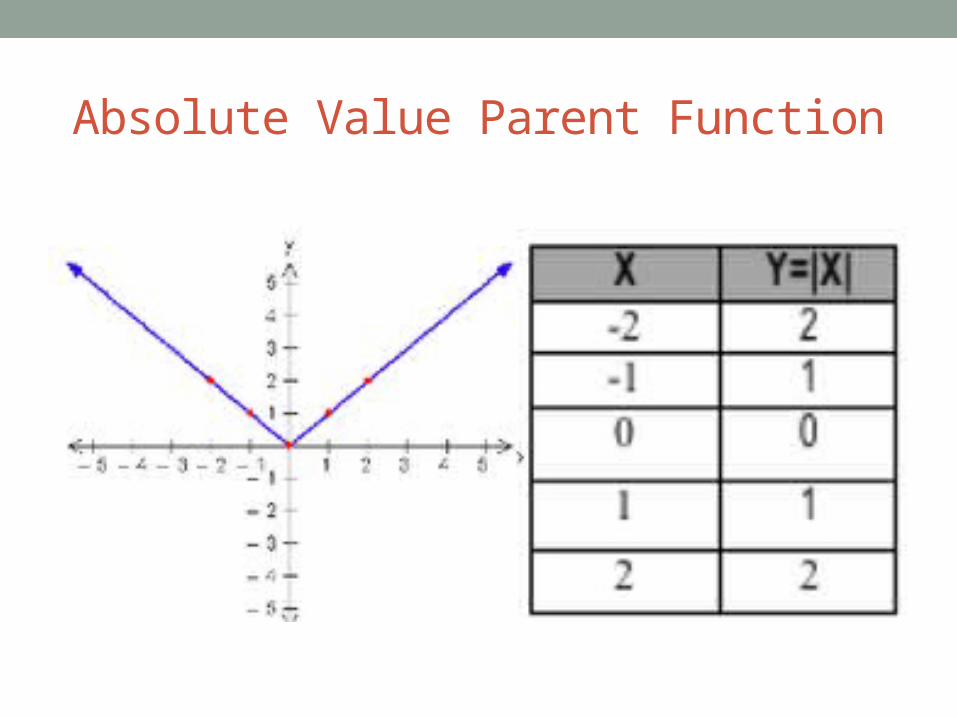
Absolute Value Parent Function

Transformations of the Absolute Value Function
• What if it wasn’t just ? What if we had or
• Transformations:• for any value k – Translates the parent function up/down by k
units.• for any value h – Translates the parent function right/left by h
units.• flips the graph across the x-axis (upside down V)• for any value a – stretches the absolute value parent function
vertically (multiply y-values by a)
Exit Problem
On whiteboards
1. On the blank side, describe the transformation happening to the parent function.
2. Make a table of 5 values and graph the transformed function on the graph side.
Function:

HOMEWORK (ALL Due Thursday)
Worksheet on Graphing Absolute Value Transformations – ALL
1. Draw the parent function,
2. Describe what the transformed graph looks like
3. Create a table of values and graph the transformed in a different color.

LESSON 3 DAY 2 – 09/17/15PARENT FUNCTION TRANSLATIONS
OBJECTIVE: SWBAT GENERALIZE THE TRANSLATIONS OF ABSOLUTE VALUE FUNCTIONS TO ALL PARENT FUNCTION GRAPHS
TO TURN IN LATER: WORKSHEET ON ABSOLUTE VALUE GRAPHSAND BOOK PROBLEMS THAT WERE DUE ON TUESDAY

Warmup
- Finish Page 3 of worksheet from Tuesday – Matching graphs #1-6 to equations a-f.
- Write the letter of the equation next to each graph.
- Try not using your calculator, but use it if you MUST.

Warmup (Honors)
On whiteboards
Function:
1. On the blank side, describe the transformation happening to the parent function.
2. Make a table of 5 values and graph the transformed function on the graph side.
Bonus: Try

Transformations of the Absolute Value Function
• What if it wasn’t just ? What if we had or
• Transformations:• for any value k – Translates the parent function up/down by k
units.• for any value h – Translates the parent function right/left by h
units.• flips the graph across the x-axis (upside down V)• for any value a – stretches the absolute value parent function
vertically (multiply y-values by a)
Transformations of Parent Functions• Using your yellow parent functions sheet, do this on
whiteboards:
1. On the blank side:
a. Identify the parent function (name)
b. Describe the transformation happening to the parent function.
2. Make a table of 3 accurate values and graph the transformed function on the graph side.

Ready…? Go!
- Parent: Absolute Value - Reflected across the x-axis
- Parent: Quadratic - Shifted left by 1 unit
- Parent: Square Root - Shifted up by 2 units
- Parent: Cubic - Shifted right by 4 units
- Parent: Rational - Shifted right by 2 units
HOMEWORK (ALL Due Monday)
HW 2.4 Worksheet on Graphing Transformed Parent Functions- ALL problems
LESSON 3 DAY 3 – 09/21/15PARENT FUNCTION TRANSLATIONS
OBJECTIVE: SWBAT GENERALIZE THE TRANSLATIONS OF ABSOLUTE VALUE FUNCTIONS TO ALL PARENT FUNCTION GRAPHS
TO BE CHECKED: HW 2.4 WORKSHEET
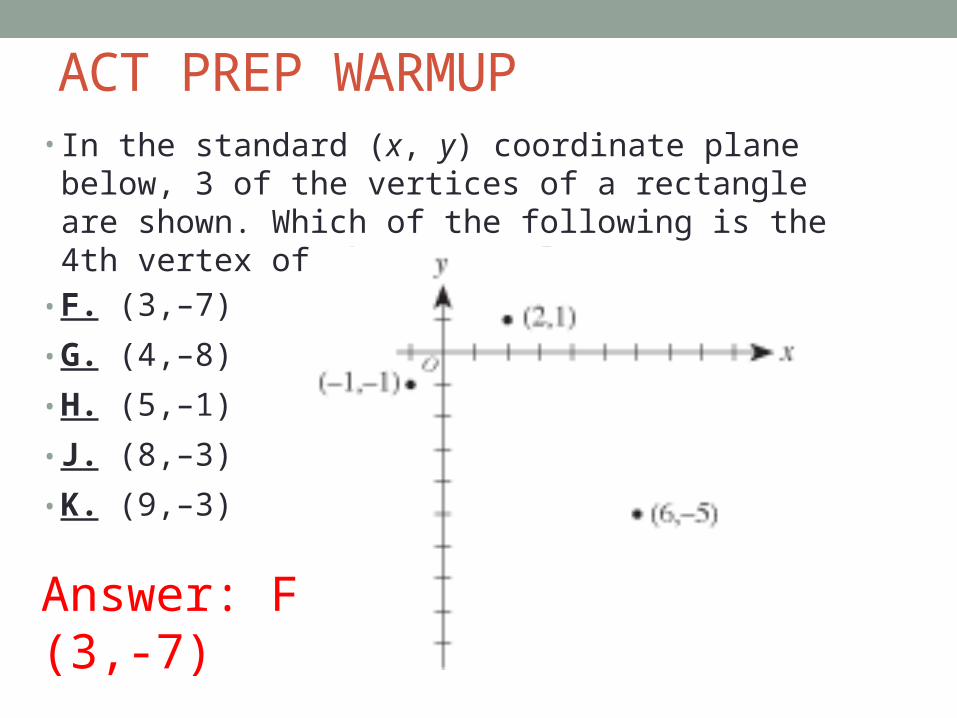
• In the standard (x, y) coordinate plane below, 3 of the vertices of a rectangle are shown. Which of the following is the 4th vertex of the rectangle?
• F. (3,–7)• G. (4,–8)• H. (5,–1)• J. (8,–3)• K. (9,–3)
ACT PREP WARMUP
Answer: F (3,-7)
Homework Questions?• Please ask now!
Whiteboard Quiz• Use the following functions:•

Homework due Tuesday
•Finish Stretch and Reflection Exploration worksheet packet
•Quiz tomorrow on parent function graphs and shifts/reflections

LESSON 4 DAY 1 – 09/22/15PARENT FUNCTION DILATIONS
OBJECTIVE: SWBAT GENERALIZE THE DILATIONS OF ABSOLUTE VALUE FUNCTIONS TO ALL PARENT FUNCTION GRAPHS
TO CHECK SOLUTIONS:HW WORKSHEET FROM MONDAY NIGHT
HW Solutions Check
•Check that you have the exact answers to the homework on the document camera!
•These are to be used as study tools for the test on Friday!

Vertical Dilations of Parent FunctionsWhat happens when you graph , where a is some number that is being multiplied by a parent function f(x)?
We call these dilations.
• Observations/Summary of dilations:
Q1: What do you notice about the graphs of af(x) when a > 1, in each part b on the front side (compared to the graphs in part a)?
A1: When you graph af(x) when a > 1, the graph is stretched vertically by a factor of a.
Q2: What do you notice about the graphs of af(x) when a < 1, in each part c on the front side (compared to the graphs in part a)?
A2: When you graph af(x) when a < 1, the graph is compressed vertically by a factor of a.
(To do all of this, keep x values the same, and multiply y-values by ‘a’)

On your own paper... • For each of the following, • (a) identify the parent function • (b) Describe the transformations applied to the parent• (c) Graph the function on a separate sheet of graph
paper
1.
2.
3.
4.

Quick Quiz time!
•Clear your desks except for a pencil.
Homework due Thursday
•Complete HW 2.5 worksheet on parent graphs and transformations
•Test on Friday!•Regression, Correlation, etc.•Absolute Value Equations/Ineqs•Parent Function Transformations
LESSON 4 DAY 2 – 09/24/15PARENT FUNCTION DILATIONS
OBJECTIVE: SWBAT GENERALIZE THE DILATIONS OF ABSOLUTE VALUE FUNCTIONS TO ALL PARENT FUNCTION GRAPHS
TO DISPLAY ON THE BOARD:HW 2.5 WORKSHEET
QUIZ AFTER!

Homework Review• Please post either:• Parts (a) and (b) to a problem
OR• The graph of a problem
• Everyone should have one problem to show. If you have one that you did not complete or did not understand, now is your chance to ask questions and build understanding! Ask a classmate first, then ask Mr. Speer!

Quiz Time!
•Remove everything from your desk EXCEPT:
1. Pencil
2. Homework (2.5 Worksheet)
Test on Monday
Topics:1. Regression Analysis 2. Absolute Value Equations and Inequalities 3. Graphing the Absolute Value and other Parent Graphs 4. Parent Functions and Transformations

Homework
•Complete worksheet #2.6 FRONT Side and try at least one problem from the “Challenge” side.
•Continue studying for the test; come with at least one question about a topic!
LESSON 4 DAY 3 – 09/25/15PARENT FUNCTION DILATIONS
OBJECTIVE: SWBAT GENERALIZE THE DILATIONS OF ABSOLUTE VALUE FUNCTIONS TO ALL PARENT FUNCTION GRAPHS
TO CHECK IN CLASS:HW 2.6 WORKSHEET

Warmup – Transform a point!• Transform the following points using all of the following
transformations together:• Reflected across the x-axis• Compressed vertically by a factor of • Shifted to the left by 4• Shifted down by 6
(0,0) (2,4)(9,3)(-4,-6) (-2,-)(5,-7)

HW Questions? TransformationsWhen graphing a function, use the following tips:Any number on the inside of the function applies to the x-values. Any number on the outside of the function applies to the y-values. Adding/Subtracting = shifting Multiplying = stretching/shrinking MEMORIZE the parent function graph coordinate pairs and transform them one at a time
Examples: For square root, the coordinate pairs are (0,0) (1,1) (4,2) and (9,3)
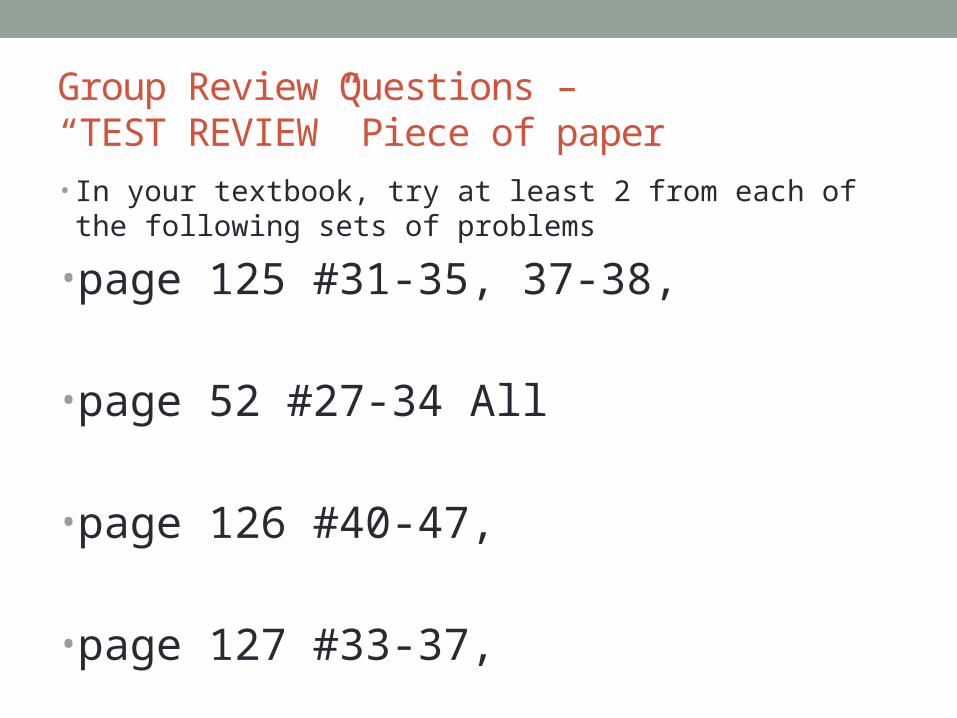
Group Review Questions – “TEST REVIEW” Piece of paper• In your textbook, try at least 2 from each of the following sets
of problems
• page 125 #31-35, 37-38,
• page 52 #27-34 All
• page 126 #40-47,
• page 127 #33-37,
Homework
•Complete the Study Guide for the TEST on MONDAY
•Study for TEST MONDAY! Look through notes, handouts, and quizzes!
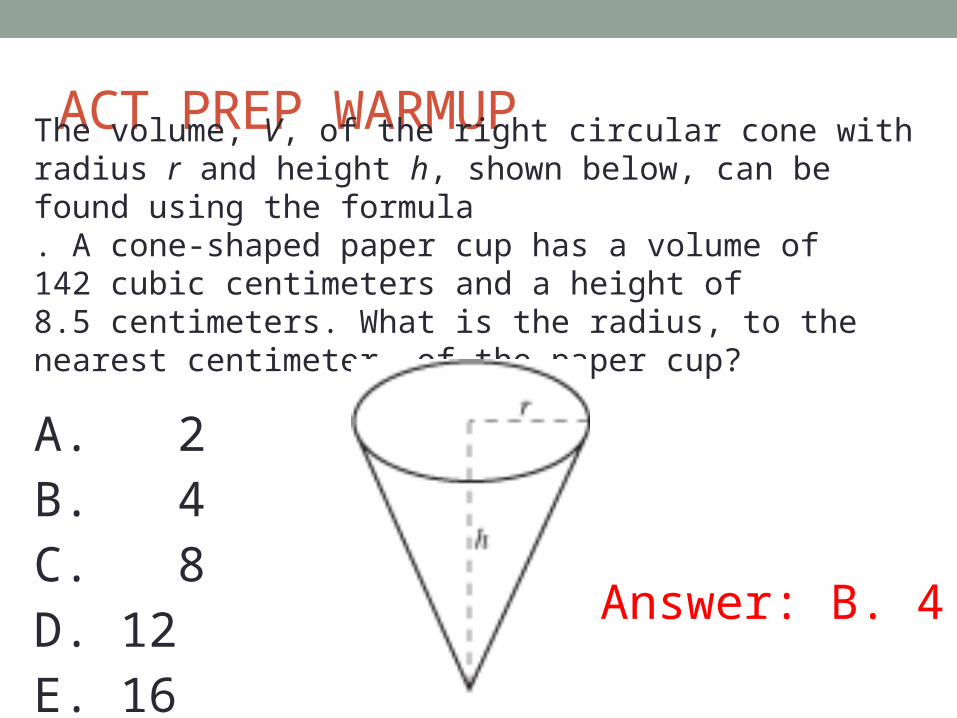
ACT PREP WARMUPThe volume, V, of the right circular cone with radius r and height h, shown below, can be found using the formula . A cone-shaped paper cup has a volume of 142 cubic centimeters and a height of 8.5 centimeters. What is the radius, to the nearest centimeter, of the paper cup?
A. 2 B. 4 C. 8 D. 12 E. 16
Answer: B. 4
TEST TIME• SILENCE is required for the ENTIRE period.• Please leave your study guides (completed for HW) on the bottom tray underneath your chair.
• NO TALKING• When you finish your calculator portion, please bring your test and calculator to me and receive the non-calculator portion.
• When finished, please remain quietly in your seats and work on something else.
• DO NOT TALK.• Pace yourself! You have 55 minutes.