unit 3 ecosystems - wvhs.k12.nf.ca · unit 3 ecosystems geog 3202 ... the tertiary consumers would...
TRANSCRIPT
Unit 3 Ecosystems Geog 3202
Chapter 6 & 7
* Many of the diagrams referred to in this presentation have been
scanned from the text book.

Define the terms ecosystem.
trophic level.
food pyramid
organisms
pesticides
producer
consumers
decomposer
herbivore
carnivore
Tundra
Forest
Grassland
Desert
soil texture.
Humus
Loam
Clay
Silt
Sand
Climax vegetation
Drought
Degradation
Desertification
Deforestation

Ecosystems of the World: Tundra
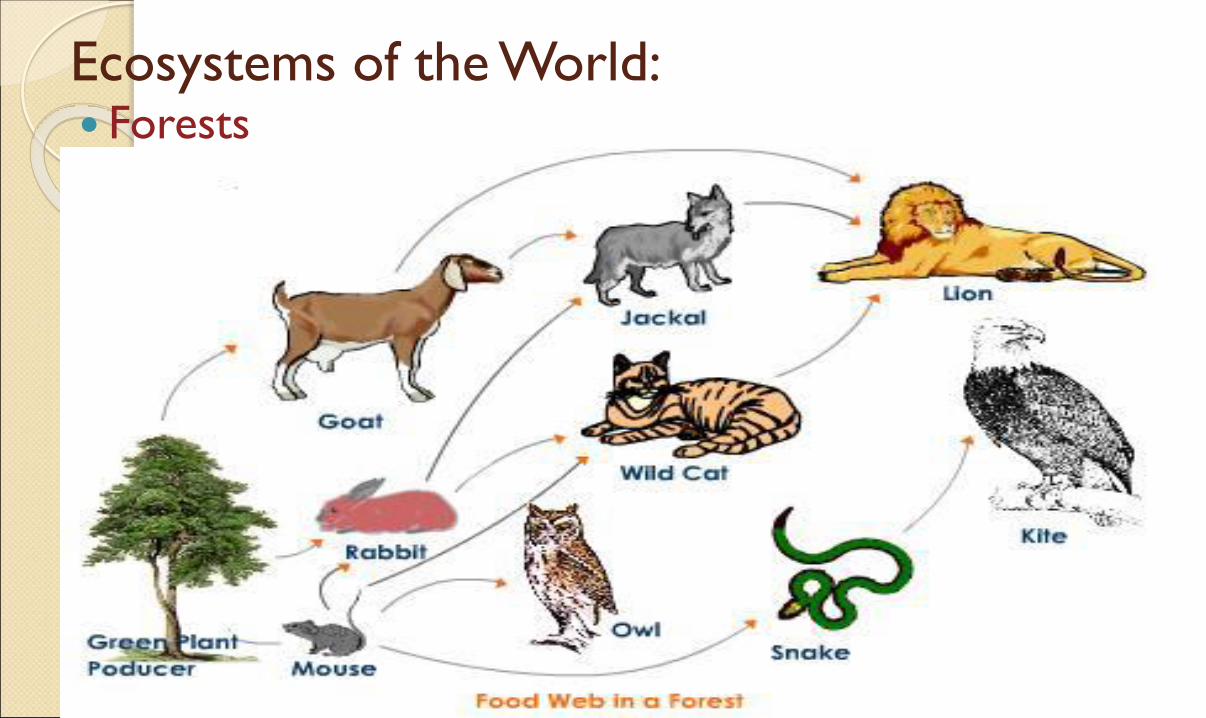
Ecosystems of the World: Forests

Ecosystems of the World: Grasslands

Ecosystems of the World:
Mountains

Ecosystems of the World:
Deserts

Ecosystems of the World:
Marine

7 Natural Vegetation Zones in Canada
(Refer to p.70, Text)

REMEMBER!!!
Strong relationship between climate
and the location of an ecosystem:
precipitation and temperatures.

In Canada, ecosystems are greatly influenced by
temperatures and precipitation, which in turn are
affected by latitude.
Generally, Canada is classified as a Nordic (northern)
climate - cold climate.
While summers are generally warm and at times hot,
they are all too short.

Winters on the other hand can be long and cold.
These conditions are also directly related to wet and
dry conditions which can affect soil fertility - hence
inability to produce vegetation.

Outline the flow of Energy through an ecosystem P. 95
Tree → insect → insect eating bird → hawkProducer Primary consumer 2nd order consumer 3rd order consumer
Note; The arrows indicate the flow of energy & nutrients
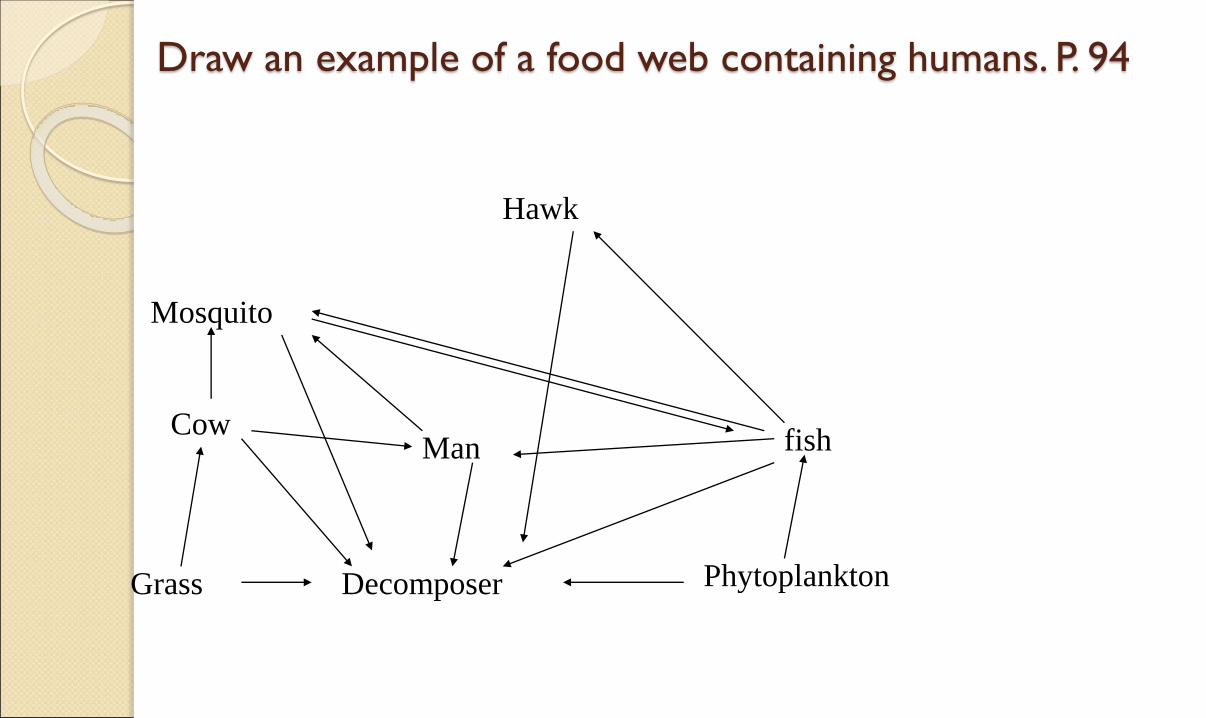
Draw an example of a food web containing humans. P. 94
ManCow
Mosquito
Hawk
Phytoplankton
fish
Grass Decomposer

3.1.3 Using figure 6.5 summarize the main energy flows in an
ecosystem p. 95 Sun = source of all ecosystem
energy
Producers make food via photosynthesis
Consumers eat plants and other consumers to get energy
Each time energy moves from one organism to another, energy leaves the system in the form of heat.
Decomposers return nutrients to the soil but energy is not recycled.

Unit 3 Part 2
Food Pyramids p. 95-100
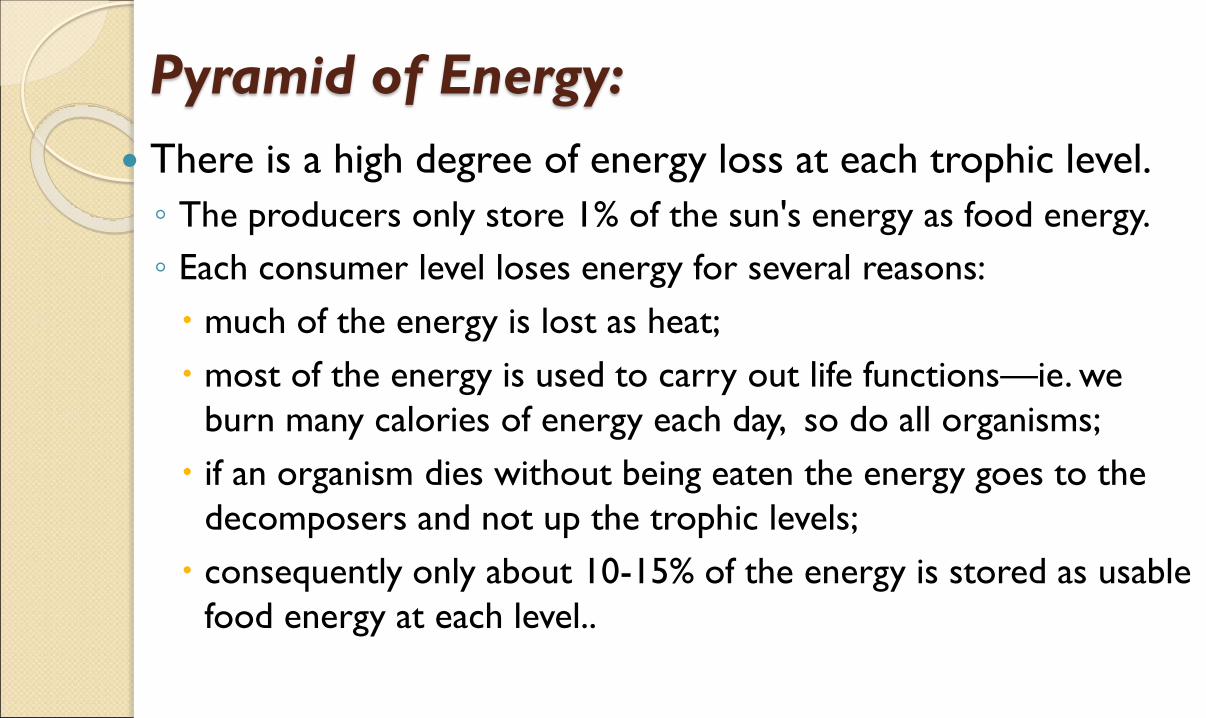
Pyramid of Energy:
There is a high degree of energy loss at each trophic level.
◦ The producers only store 1% of the sun's energy as food energy.
◦ Each consumer level loses energy for several reasons:
much of the energy is lost as heat;
most of the energy is used to carry out life functions—ie. we
burn many calories of energy each day, so do all organisms;
if an organism dies without being eaten the energy goes to the
decomposers and not up the trophic levels;
consequently only about 10-15% of the energy is stored as usable
food energy at each level..

Pyramid of Energy:
If we look at this in terms of units of energy and we start
with 1000 units of energy at the producer level then:
the primary consumers would only have 100-150 units
of food energy stored for the next level;
the secondary consumers would only have 10-15 units
of food energy stored for the next trophic level;
the tertiary consumers would only have 1-1.5 units of
food energy stored as food energy—it is easy to see
why we do not often see a quaternary trophic level
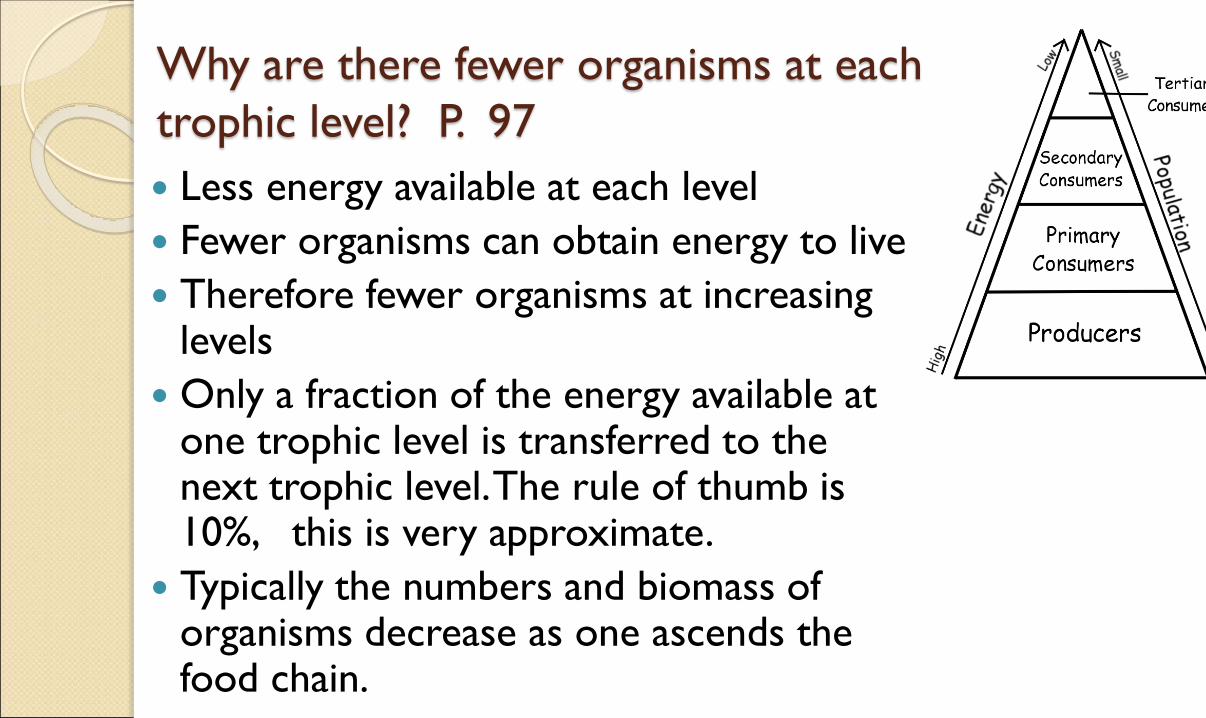
Why are there fewer organisms at each
trophic level? P. 97
Less energy available at each level
Fewer organisms can obtain energy to live
Therefore fewer organisms at increasing levels
Only a fraction of the energy available at one trophic level is transferred to the next trophic level. The rule of thumb is 10%, this is very approximate.
Typically the numbers and biomass of organisms decrease as one ascends the food chain.
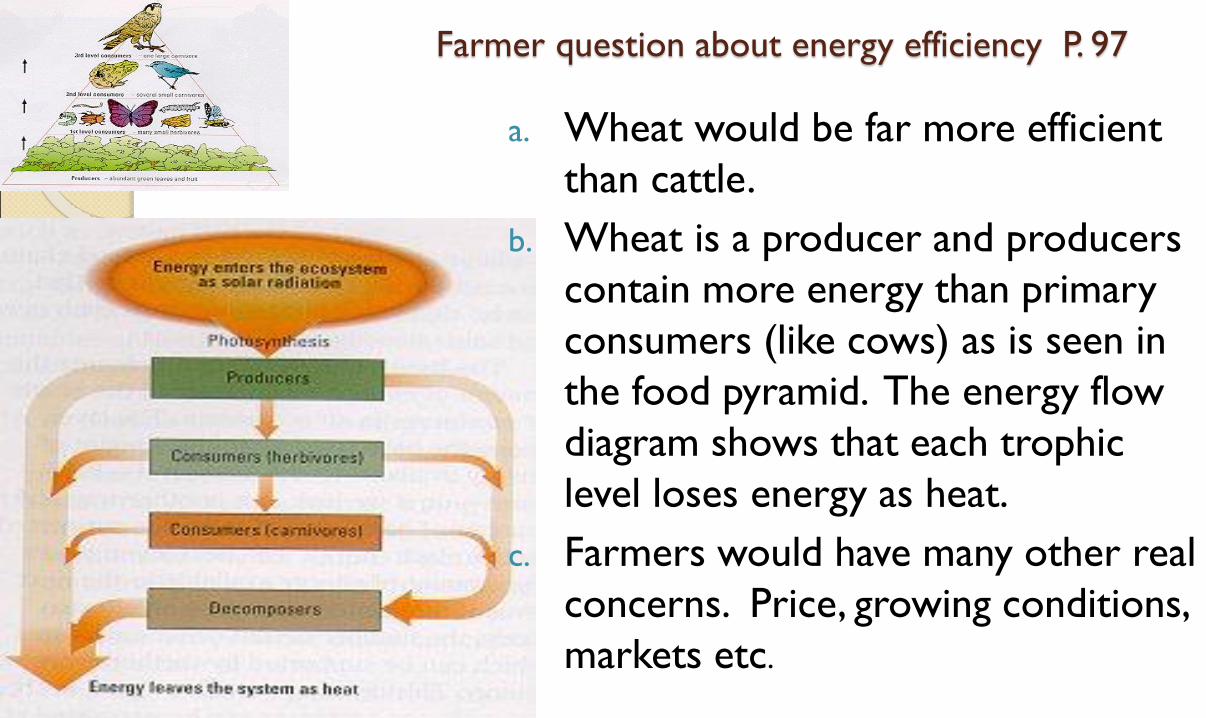
Farmer question about energy efficiency P. 97
a. Wheat would be far more efficient
than cattle.
b. Wheat is a producer and producers
contain more energy than primary
consumers (like cows) as is seen in
the food pyramid. The energy flow
diagram shows that each trophic
level loses energy as heat.
c. Farmers would have many other real
concerns. Price, growing conditions,
markets etc.

3.2.1 How do food pyramids help explain DDT Bioamplification?
This problem has occurred in our environment.
The most common case was that of DDT which
was used to control insect populations
DDT was a particularly dangerous toxin because it
is fat soluble and stays in an animals fat. (Some
poisons are water soluble and can be excreted from
the system)

Bioaccumulation
Some pesticides were fat soluble which lead to a problem known as bioaccumulation.
As each organism feeds on one lower in the food chain, the fat soluble pesticide began to be concentrated in ever higher amounts as you movetoward the top of the food pyramid.
Biomagnifcation results from bioaccumulation

3.2.1 How do food pyramids help explain DDT Bioamplification?
Lower order organisms ingest some
poison which may or may not affect
them.
Higher order organisms eat large
numbers of lower order organisms.
A small amount of toxin in a frog
becomes a large amount in a hawk that
eats 100 frogs.

Since every organism eats far more than its own body mass in food, the tiny amounts found in each organism consumed began to build up in greater concentrations in the consuming species
This is illustrated by the damage done to predatory birds as a result of bioaccumulation of DDT.
As a result DDT has been banned from use in North America.


Climax Vegetation is the natural vegetation in
the last possible stage of vegetation
development.
• Climax vegetation is stable and in balance
with the climatic conditions.
• It should change very little if left undisturbed.
The vegetation that would exist in an area if growth had
proceeded undisturbed for an extended period. This would be
the "final" collection of plant types that presumably would
remain forever, or until the stable conditions were somehow
disturbed.

• Ecosystems are largely defined by the climax
vegetation that grows in it.
The type of vegetation is largely determined by the
climate.
• We will look at three major type of ecosystems
found in high latitude regions.
Look at figure 6.8 on page 102 of your text book
and you will see the variety of ecosystems in
the world.

3.3.1 Continued (Ecosystem climatic conditions p.104)
Boreal Forest
Temperate cold winter
climate
Warm summers
Moderate precipitation

Beaverlodge, Alberta, Canada
earthobservatory.nasa.gov
Boreal Forest (Taiga)
Average annual temperature
and precipitation
55oN; 119o W

Describe “climax vegetation” in coniferous forest. P. 102
Evergreen trees
Needle like leaves
Thick bark
Conical shape
Dense growing which
blocks sun
Coniferous forests
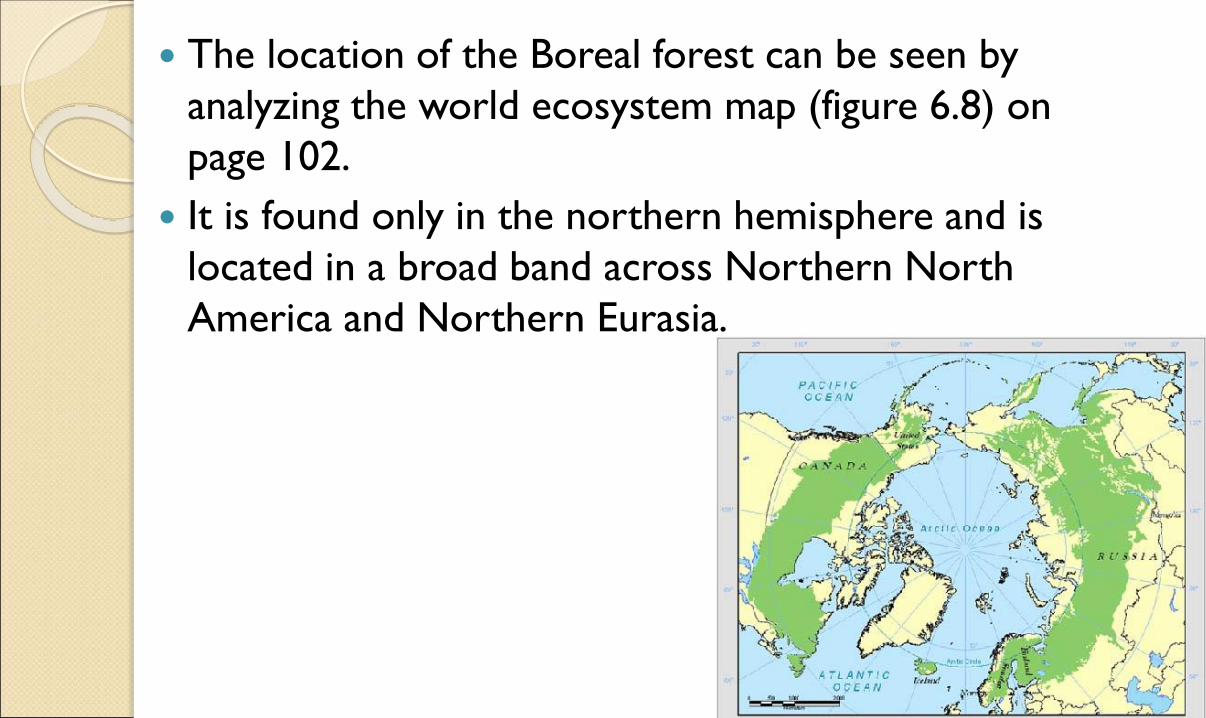
The location of the Boreal forest can be seen by
analyzing the world ecosystem map (figure 6.8) on
page 102.
It is found only in the northern hemisphere and is
located in a broad band across Northern North
America and Northern Eurasia.
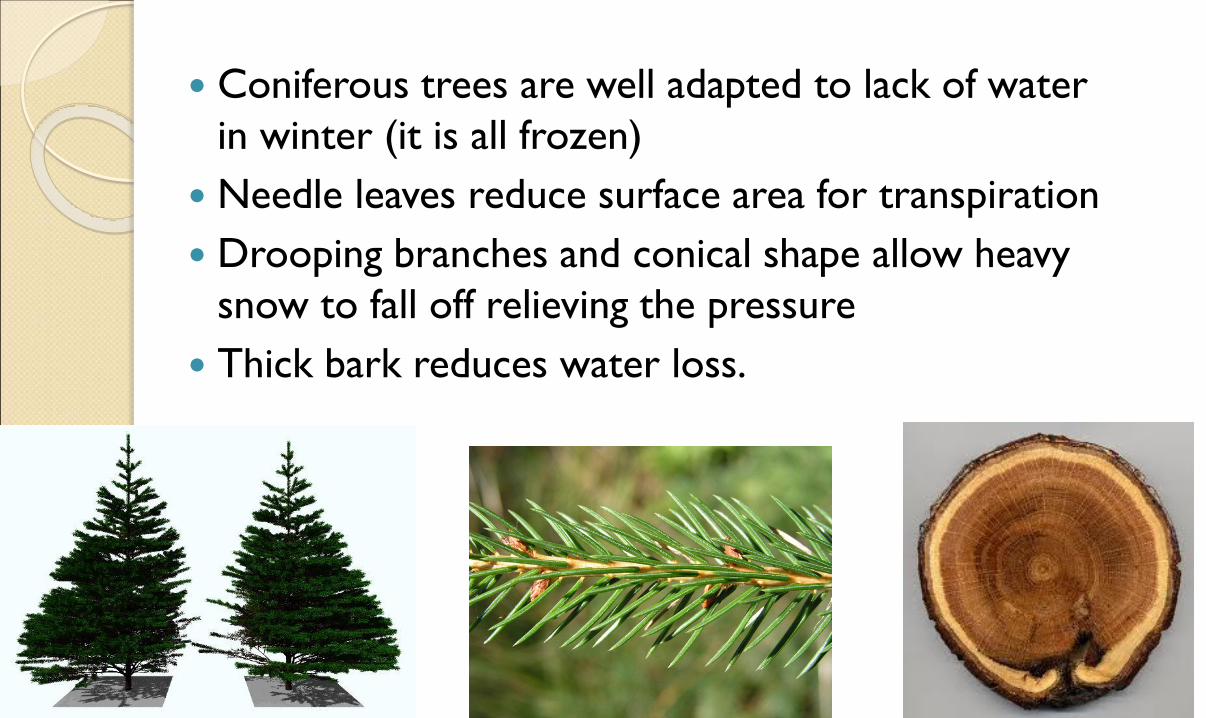
Coniferous trees are well adapted to lack of water
in winter (it is all frozen)
Needle leaves reduce surface area for transpiration
Drooping branches and conical shape allow heavy
snow to fall off relieving the pressure
Thick bark reduces water loss.

The climate in the boreal forest is temperate
cold winter.
Look at figure 6.8 on page 102 and locate the
boreal forest; then turn to page 75 and locate
the temperate cold winter (subarctic)
climate region. the two match very closely.

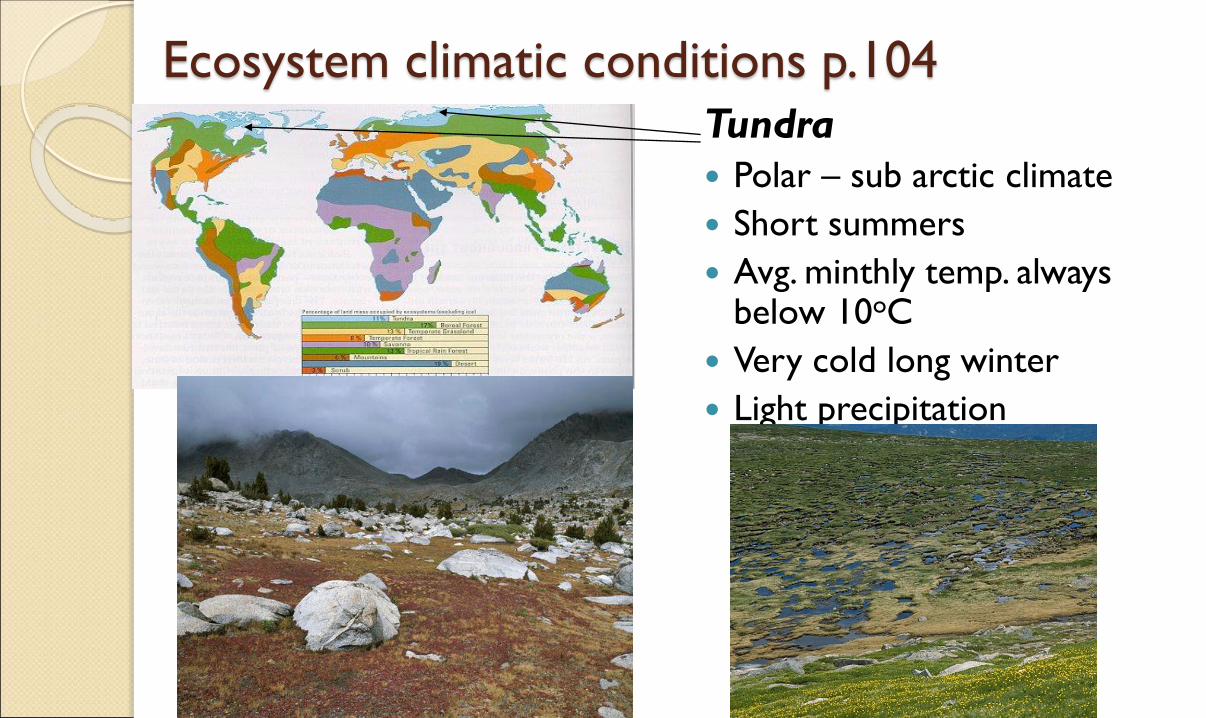
3.3.1 Ecosystem climatic conditions p.104
Tundra
Polar – sub arctic climate
Short summers
Avg. monthly temp. always below 10oC
Very cold long winter
Light precipitation

Yakutsk, RussiaLocation:
62.1 N; 129 W
earthobservatory.nasa.gov
Average annual temperature
and precipitation
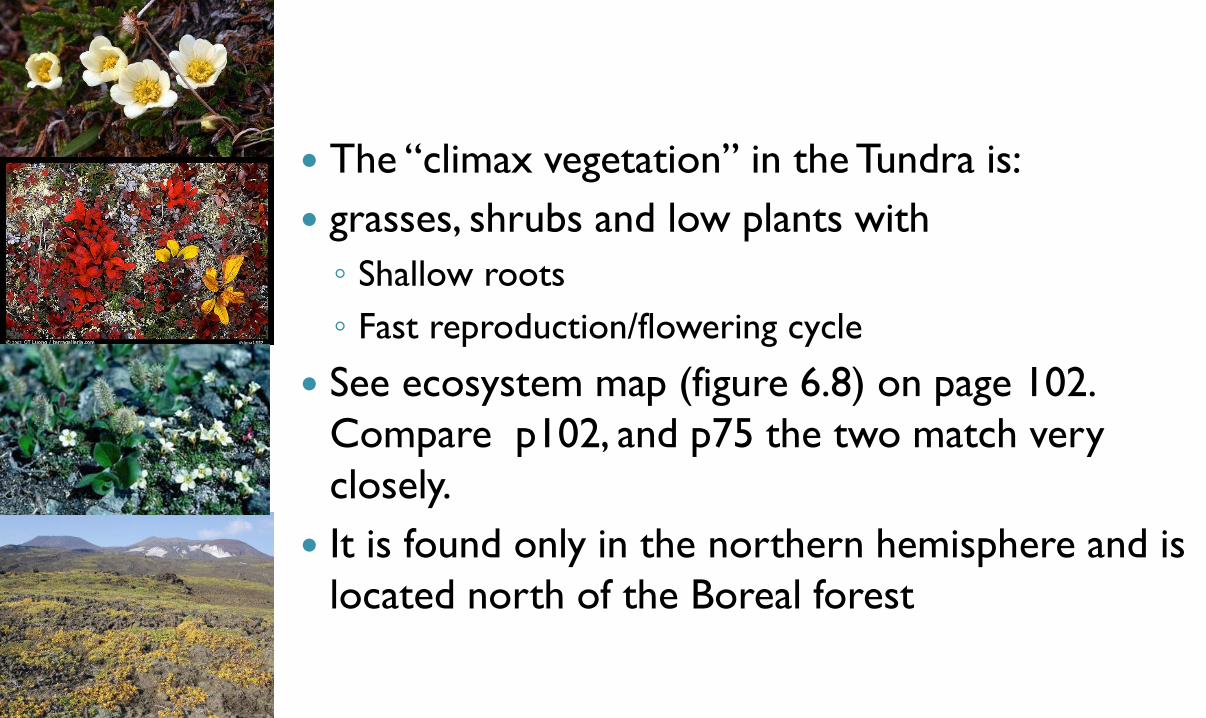
The “climax vegetation” in the Tundra is:
grasses, shrubs and low plants with
◦ Shallow roots
◦ Fast reproduction/flowering cycle
See ecosystem map (figure 6.8) on page 102.
Compare p102, and p75 the two match very
closely.
It is found only in the northern hemisphere and is
located north of the Boreal forest

The shrubs and bushes are well adapted to the
extreme climate (winter is long and summer is
very short. )
Shallow roots are needed because 1-3 meters
below the surface the soil is completely frozen
(Permafrost).

The fast flowering and reproduction cycle is needed
because the growing season is very short, lasting
only 1-2 months.
Animals have a variety of adaptations to the harsh
Tundra climate;
◦ Hibernation
◦ Migration in for the summer season and out for the
winter .
◦ The development of insulating features like thick fur & fat
insulation
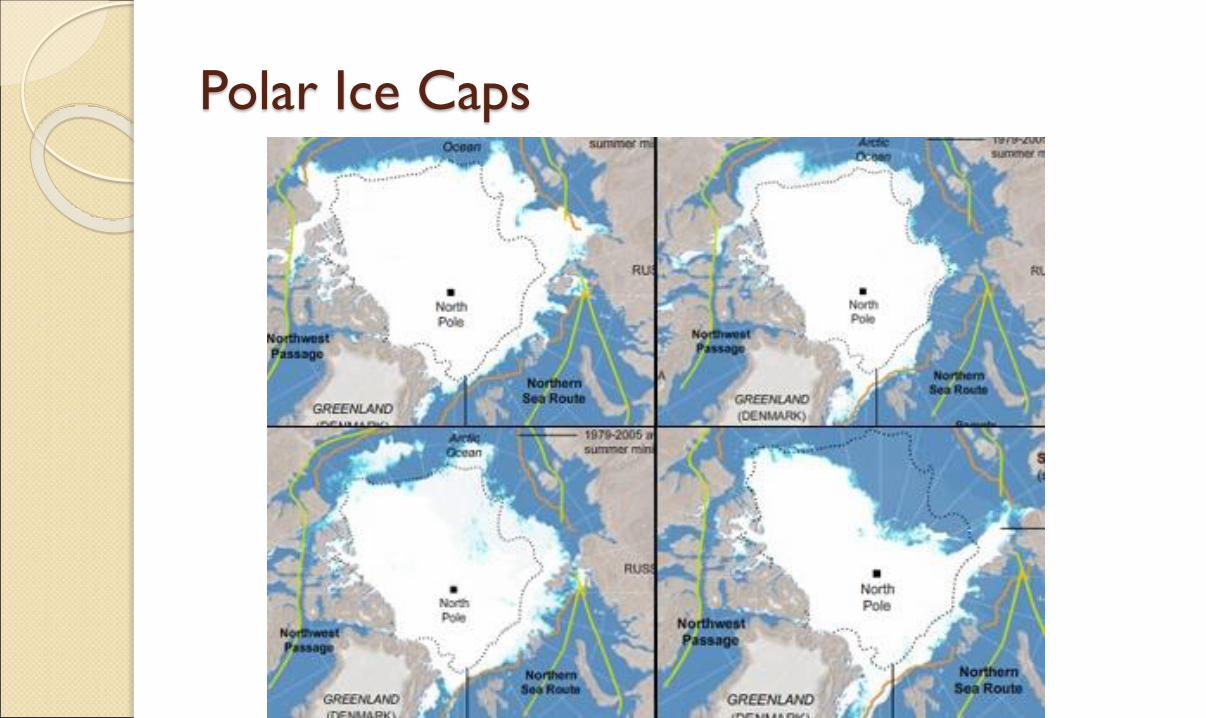
Polar Ice Caps
The “climax vegetation” is Phytoplankton beneath the
ice
The adaptation of producers to this ecosystem is
extreme.
There is no land for the producers to grow in so
there are only small phytoplankton to form the base
of the food chain. .
Polar Ice Caps

Polar Ice Caps
Animals have a variety of adaptations to
the harsh Polar ice cap climate.
Migration in for the summer season and
out for the winter season is a common
strategy for Birds and even larger animals
like caribou.
Polar Ice Caps
The development of insulating features like
thick fur & fat insulation is common among
polar bears and other mammals.
White fur/feathers to help with camouflage is
another common adaptation.
The climate in the Polar ice cap is so definitive
of the Polar ice cap that it is called Polar (ice
cap) climate.
Compare p102, and p75 the two match very
closely.

3.3.1 Continued (Ecosystem climatic conditions p.104)
Temperate Grassland
Semi-arid climate or temperate cold
winter
Light precipitation, most of it occurs in
summer
Warm to hot summer
Cold winters

Ingeniera White, Argentina40oS; 6oW
earthobservatory.nasa.gov
Average annual temperature and rainfall
The “climax vegetation” is grass with shallow roots,
small water requirement
See world ecosystem map (figure 6.8) on page 102. It
is found in North America, South America, Australia
and Eurasia.
Grasses are well adapted to lack of water; the small
size of the plant
The climate is semi-arid in most locations but in
some regions it is temperate cold winter.
Compare p102, and p75


The climate in the Temperate grassland
is semi-arid in most locations but in
some regions it is temperate cold winter.
Look at figure 6.8 on page 102 and
locate the Temperate grassland; then
turn to page 75 and locate the semiarid
climate region.
The two match very closely.

3.3.1 Continued (Ecosystem climatic conditions p.104)
Temperate Forest
Temperate Mild winter climate
Warm – hot summers
Moderate - heavy precipitation

Staunton, Virginia, United States38oN; 79oW
earthobservatory.nasa.gov
Average annual temperature and rainfall

The “climax vegetation” in Temperate forests is:
deciduous trees like oak, birch and maple which lose
leaves in winter
Deciduous trees are well adapted to lack of water in
winter.
Losing their leaves in winter helps them reduce water
loss.
The climate in the Temperate Forest is temperate
mild winter.
Compare p102, and p75

The climate in the Temperate Forest is temperate
mild winter.
Look at figure 6.8 on page 102 and locate the
Temperate forests; then turn to page 75 and locate
the temperate mild winter climate region.
The two match very closely.


3.3.1 Continued (Ecosystem climatic conditions p.104)
Tropical Rain Forest
Tropical Wet climate
High temperatures year round
High precipitation year round

Campa Pita, Belize
15 N latitude
earthobservatory.nasa.gov
Tropical Forest
Average annual temperature and precipitation

Tropical Rain Forests The “climax vegetation” is tall Evergreen Broadleaf
trees, these are well adapted to the thin soil with
buttress roots (figure 6.15 on p 108) to help support
their height.
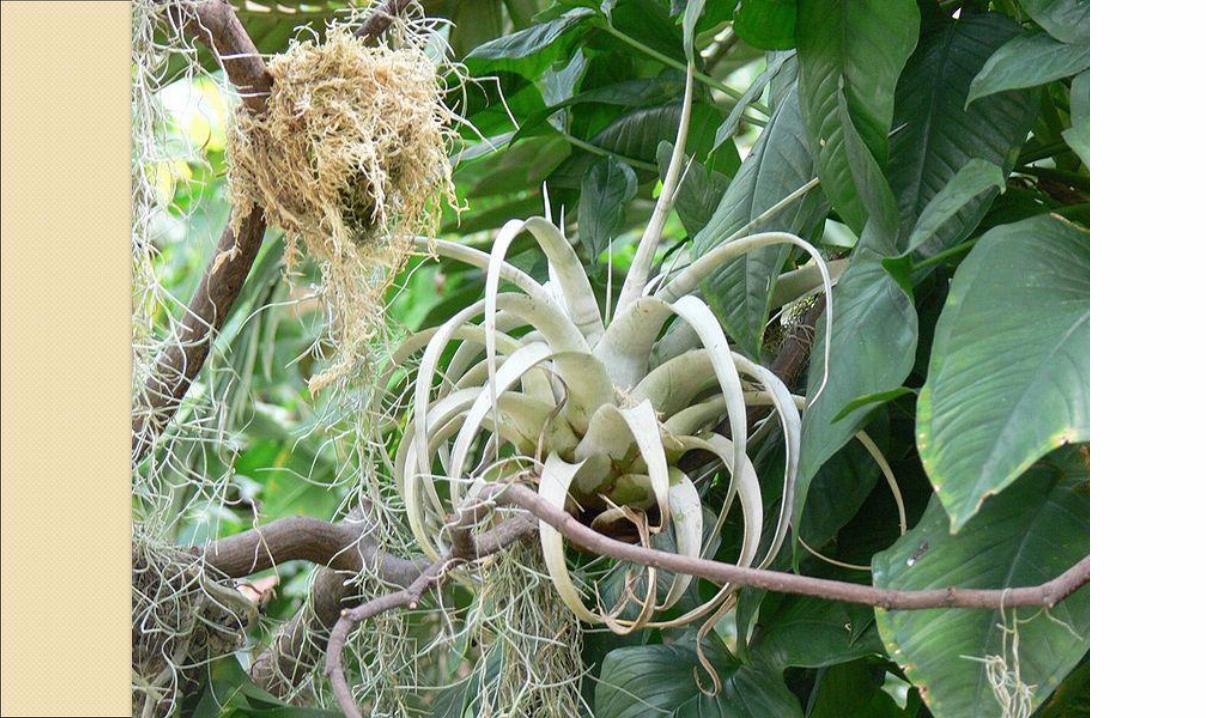
Some plants are epiphytes which are well adapted to
the rain forest.
They reach the sun by lying in the canopy while they
get water through roots that hang in the air and
absorb moisture.

Some animals are adapted to spend their entire life in
the canopy.
The climate in the Tropical rain forest is Tropical wet in
most locations but in some regions it is tropical wet
and dry.
mostly concentrated in two bands around the earth
10-30 North and South of the equator

The climate in the Tropical rain forest is Tropical wet
in most locations but in some regions it is tropical
wet and dry.
Look at figure 6.8 on page 102 and locate the Tropical
rain forest; then turn to page 75 and locate the
tropical wet climate region. The two match very
closely.
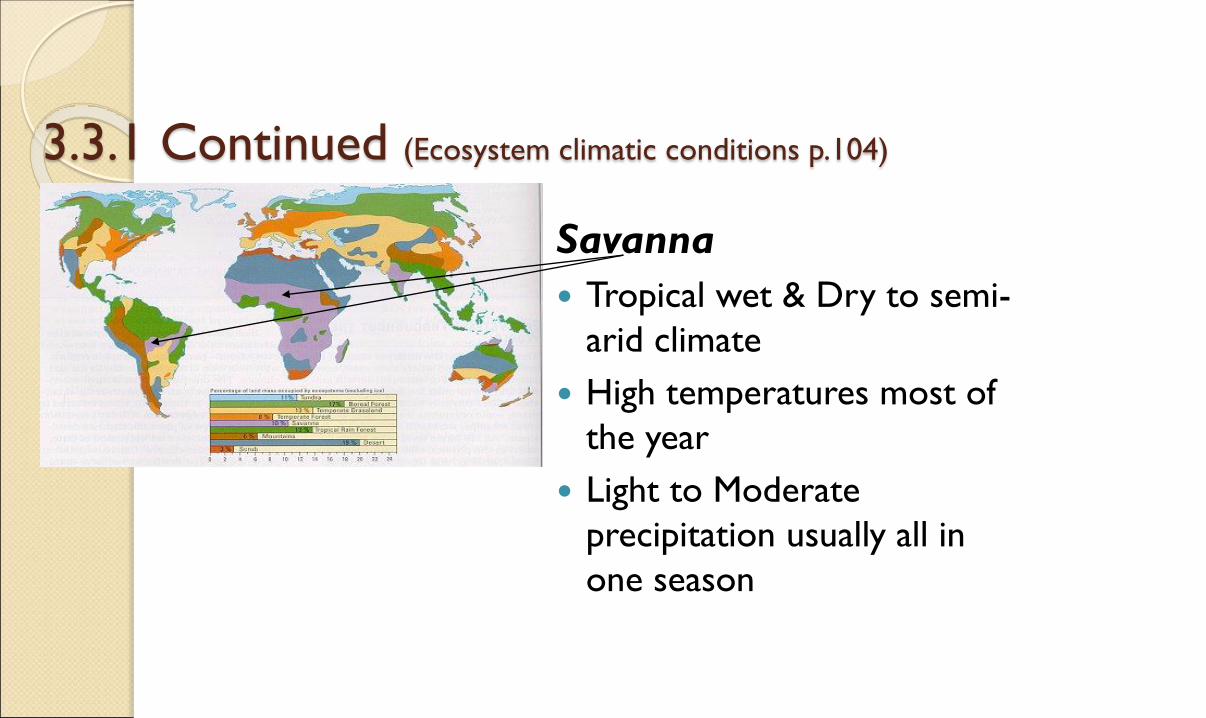
3.3.1 Continued (Ecosystem climatic conditions p.104)
Savanna
Tropical wet & Dry to semi-
arid climate
High temperatures most of
the year
Light to Moderate
precipitation usually all in
one season

savanna
The “climax vegetation” is grass with shallow roots,
small water requirement
◦ Grasses are well adapted to lack of water.
◦ The small size of the plant means that it requires less water.
See world ecosystem map (figure 6.8) on page 102,
compare with p 75.
South America, Australia, Africa and Southeast Asia.
Climate is tropical wet & dry in most locations but in
some regions it is semi-arid .

Look at figure 6.8 on page 102 and locate the
Savannas; then turn to page 75 and locate the Tropical
Wet and dry climate region.
The two match very closely


3.3.1 Continued (Ecosystem climatic conditions p.104)
Desert
Arid climate
High temperatures year
round
little precipitation

Deserts
The “climax vegetation” is: Cacti and
fleshy plants Cacti are well adapted to
lack of water.
They are often referred to as Xerophytes.
long roots help them obtain water deep
in the water table
water storage capacity gives them the
ability to endure long periods without
rain.
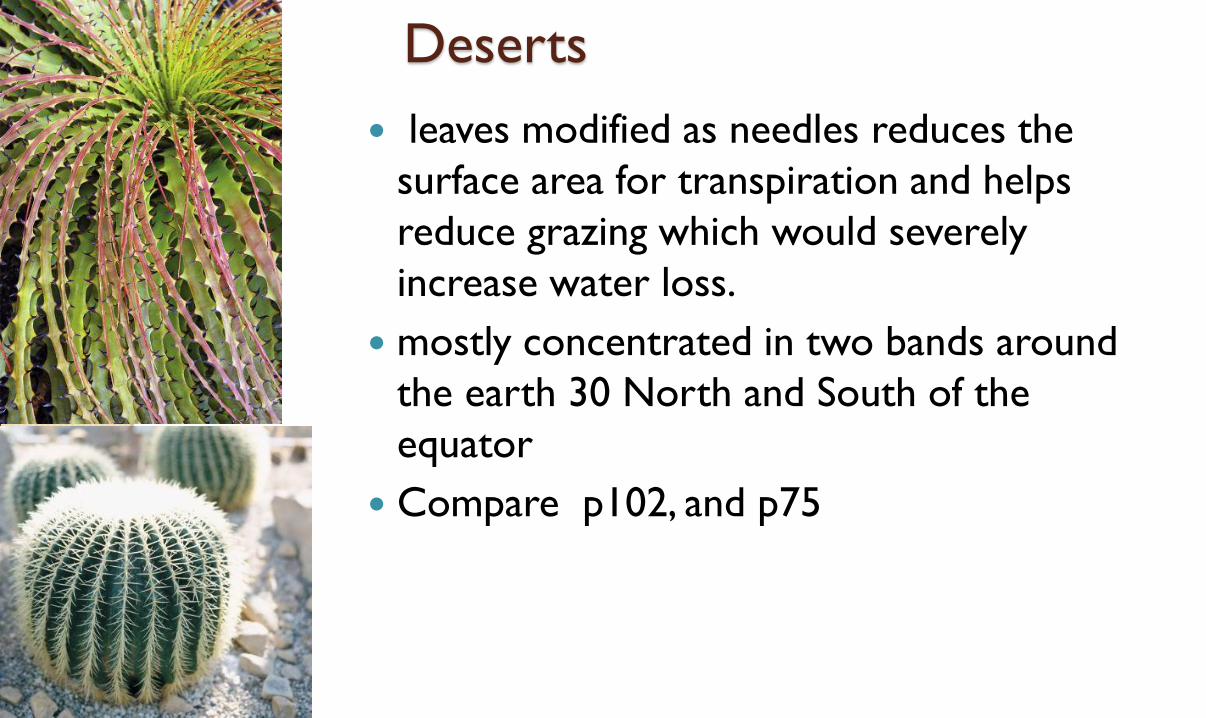
Deserts
leaves modified as needles reduces the
surface area for transpiration and helps
reduce grazing which would severely
increase water loss.
mostly concentrated in two bands around
the earth 30 North and South of the
equator
Compare p102, and p75

El-Oasr el-Akhdar, Egypt26oS; 30oE
Average yearly temperature and rainfall

The climate in the Desert is Arid.
Look at figure 6.8 on page 102 and locate the
Deserts; then turn to page 75 and locate the arid
climate region.
The two match very closely.

Mountain Ecosystems
Mountains ecosystems are not exclusively low
latitude, on the contrary they occur in most latitudes
and as you will see in figure 6.10 (p104) mountains
can contain all types of ecosystems from all latitudes.
Figure 6.10 well illustrates the fact that latitudinal
succession closely parallels altitudinal succession.

3.3.1 Continued (Ecosystem climatic conditions p.104)
Mountain
Different climates at
different elevations
High elevations often like
tundra

The changes we see in ecosystems as we move north
from the equator are generally, tropical rain forest,
Temperate forest, Coniferous forest, shrubby tundra
and then polar ice cap.
The same changes in ecosystem can be seen as you
move up a tropical mountain.
Mountain ecosystems are not very unique, they vary
with altitude and temperature.

Analyze world ecosystem map.
a. Boreal Forest & tundra are
wide spread in high latitudes
b. Tropical Rain Forests occur in
low latitudes
c. Tropical Rain forest is most
predominant in South America.
d. South America, Africa, Australia
and Antarctica do not have
tundra.
e. Boreal forest is our ecosystem


3.3.2 Ecosystems vs. climatic regions p.104
• Ecosystems of the world are largely defined by their climax vegetation.
• Example: tropical rain forest, grasslands, boreal forests, etc.
• Climax Vegetation is determined by climate. Therefore, ecosystems parallel climate zonesClimate zones
Ecosystem
zones
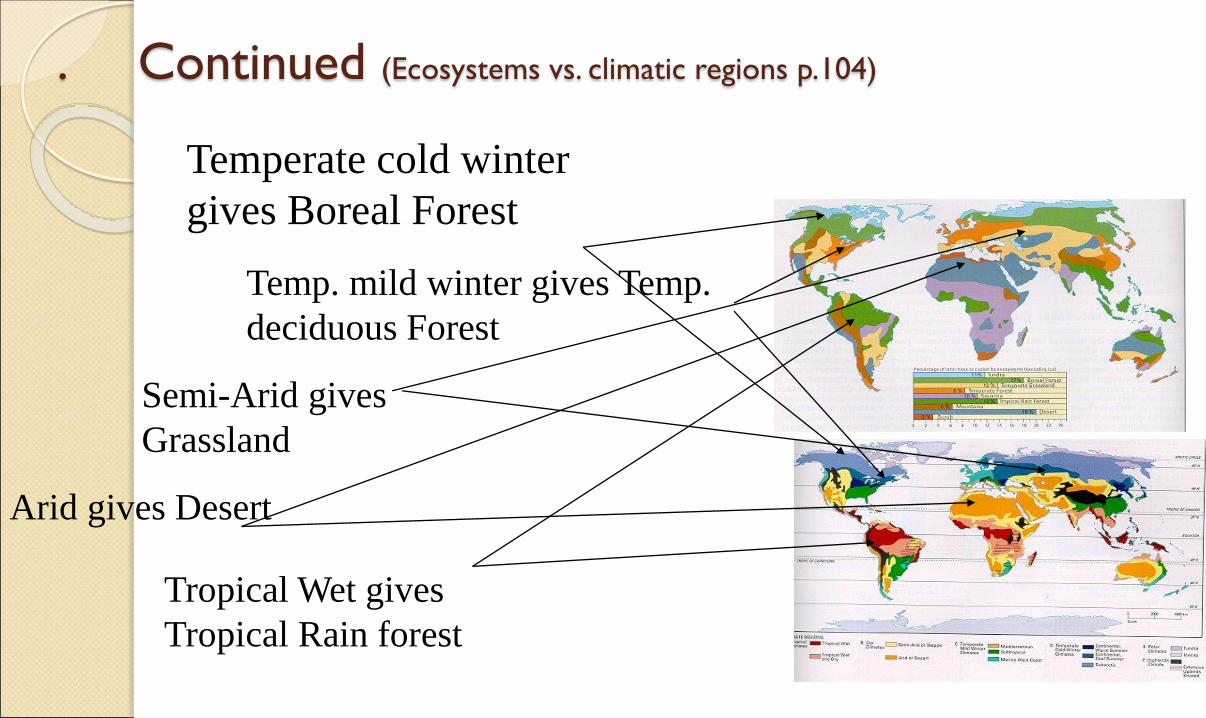
. Continued (Ecosystems vs. climatic regions p.104)
Arid gives Desert
Semi-Arid gives
Grassland
Tropical Wet gives
Tropical Rain forest
Temperate cold winter
gives Boreal Forest
Temp. mild winter gives Temp.
deciduous Forest

World Ecosystems
Different Locations
Different Climate (Temp. & Precip.)
Different Soil
Different Vegetation
Different Animals
Ecosystems
Climate Zones
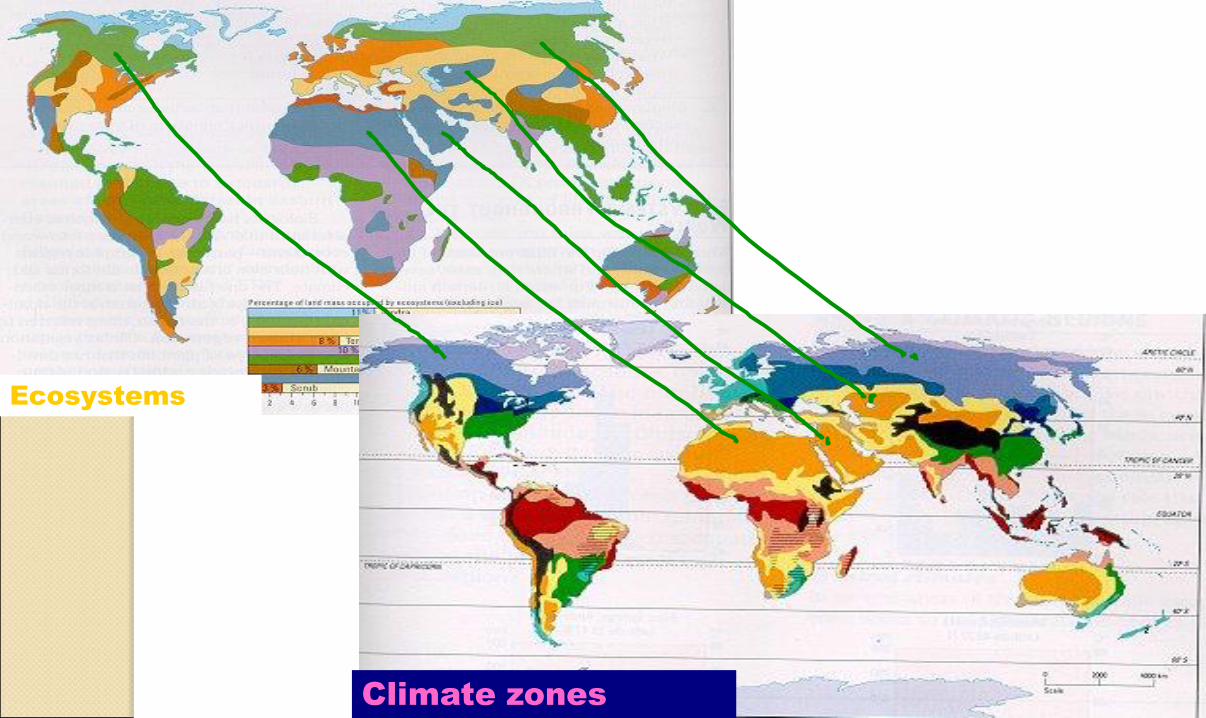
Climate zones
Ecosystems
Ecosystem climatic conditions p.104Tundra
Polar – sub arctic climate
Short summers
Avg. minthly temp. always below 10oC
Very cold long winter
Light precipitation

Succession: Directional cumulative change in the
types plant species that occupy a given area, through
time.

Relationship between Ecosystems and Latitude
The further north you travel the colder
and drier it gets thus less vegetation.
Winters are longer (colder) and summers
are shorter (less heat).

Relationship between Ecosystems and Latitude
Mountains are the exception because
elevation/altitude determines the type of
vegetation.
The higher you rise on the land the colder
and drier it will be thus vegetation will
change.

Relationship between Ecosystems and Latitude

Climate controls biome distribution by an altitudinal
gradient and a latitudinal gradient.
With increases of either altitude or latitude, cooler and
drier conditions occur.
Cooler conditions can cause aridity since cooler air can
hold less water vapor than can warmer air.
This is shown by the figure
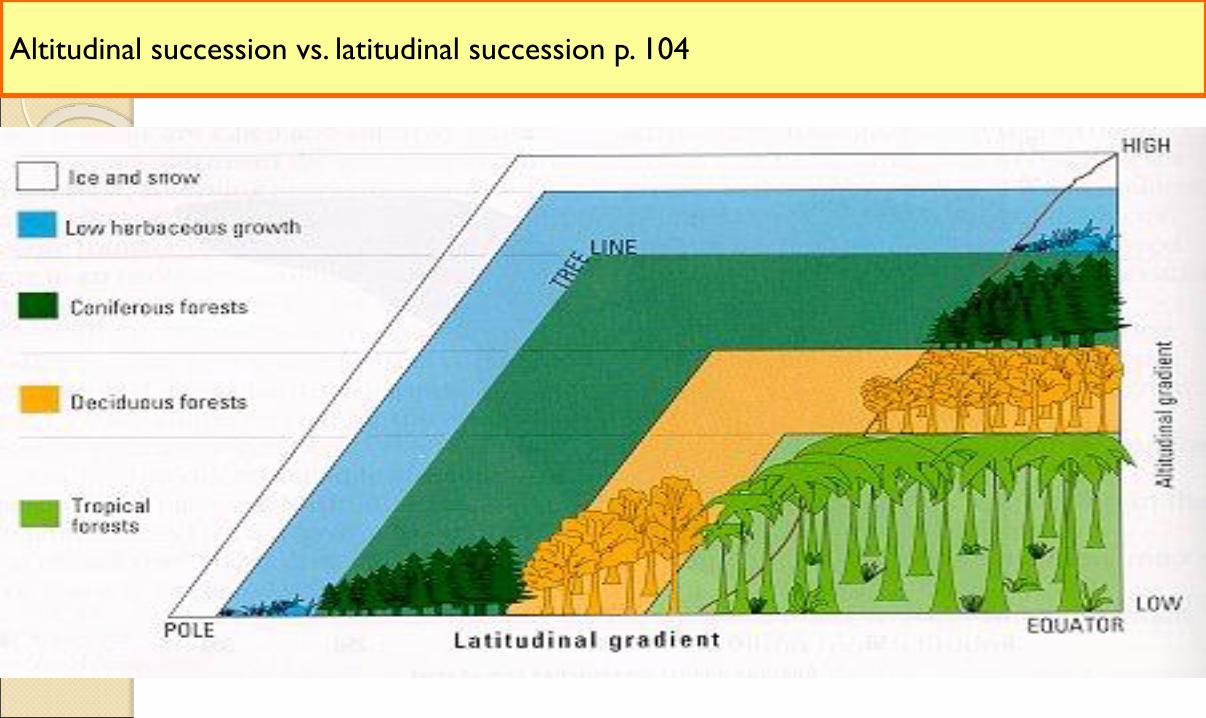
Altitudinal succession vs. latitudinal succession p. 104


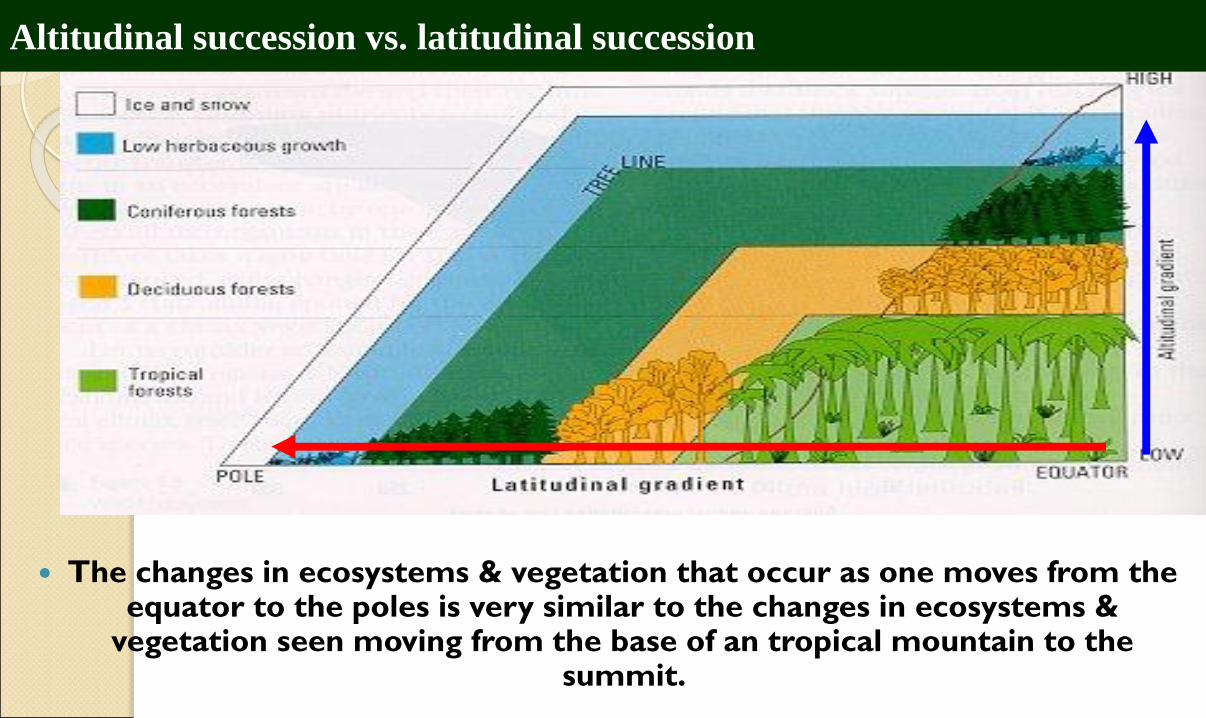
Altitudinal succession vs. latitudinal succession
The changes in ecosystems & vegetation that occur as one moves from the equator to the poles

Altitudinal succession vs. latitudinal succession
The changes in ecosystems & vegetation that occur as one moves from the base of an tropical mountain to the summit.
Altitudinal succession vs. latitudinal succession
Altitudinal succession vs. latitudinal succession
The changes in ecosystems & vegetation that occur as one moves from the equator to the poles is very similar to the changes in ecosystems &
vegetation seen moving from the base of an tropical mountain to the summit.
Altitudinal succession vs. latitudinal succession

3.3.2 Altitudinal succession vs. latitudinal succession p. 104
The changes in ecosystems that occur as one moves from the equator to the poles is very similar to the changes in ecosystems seen moving from the base of an tropical mountain to the summit.
Identify the ecosystems where the threat of
desertification is greatest and describe the underlying
causes

Deforestation contributes to the removal of nutrients
from the soil and exposes more land to erosion.
These directly contribute to desertification and as
such, it can be considered an indicator of possible
risks of desertification.
The following map shows the areas experiencing
deforestation as well as land degradation in drylands.


Areas in Asia are experiencing both net loss of forests
as well as land degradation.
In many of these areas, the two drylands and forests
are located fairly close to each other which allows for
desertification to spread more quickly.
The areas shown on this map that are experiencing
deforestation are all more likely to be subjected to
desertification at a faster rate than they would be
without the removal of the forests.


Desertification

Desertification
Desertification-is the process by which land becomes desert
Drought and overpopulation are main causes
Signs
Lowering of water table
Marked reduction of water supply
Progressive destruction of native vegetation
Accelerated soil erosion

Case Study: The Sahel
The Sahel is becoming
more like desert with
thin, dry, sandy soils
Soil erosion has created
bare rock
Vegetation is sparse

Desertification- Map of the Sahel
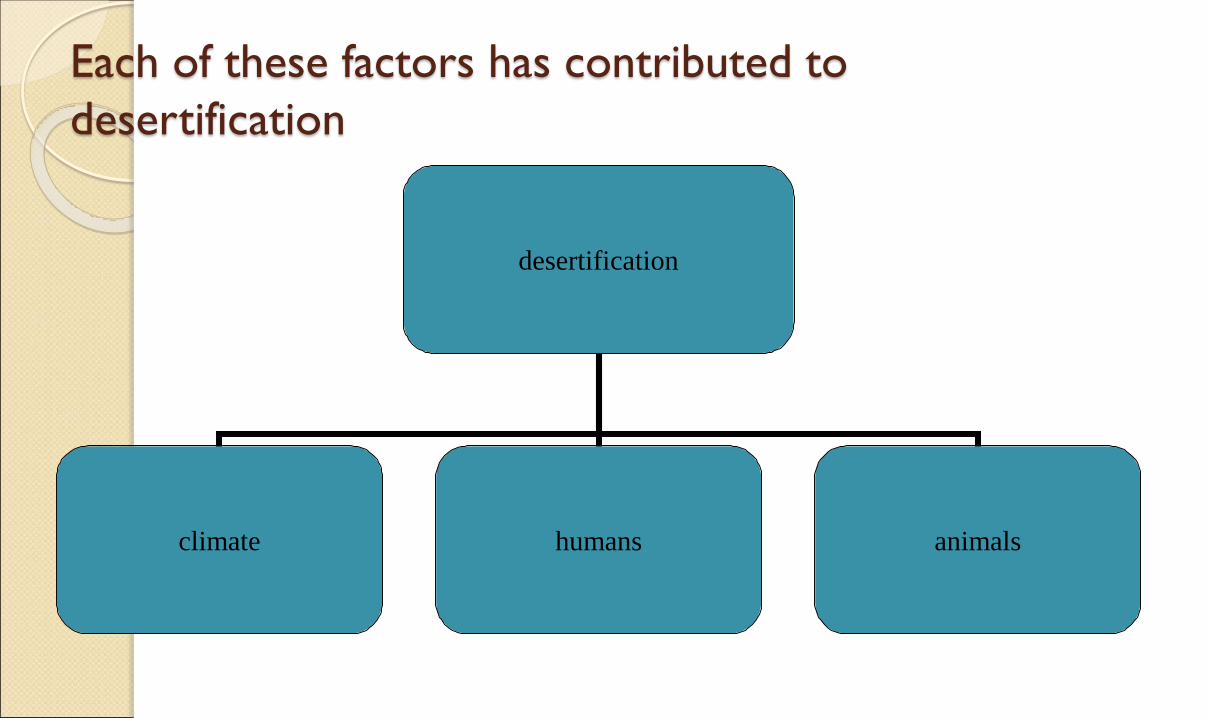
Each of these factors has contributed to
desertification
desertification
climate humans animals

Climate
Drought: low rainfall since 1968.
Soils become dry and there is no water left in wells.
Trees die, grass withers and is replaced by poor desert scrub.
Crops fail and cattle feed on poor pasture.
Less roots to protect the topsoil, less humus; soils become more sandy and dry.
Wind erosion removes the soil, causing dust storms, leaving bare rock.

Human activity Population is high and increasing fast.
To increase food supplies more crops are grown and more cattle kept leading to over-cultivation and over-grazing.
Yields decline and cattle are undernourished and die.
Demand increases for water as population grows.
Trees are cut down for fuel supplies.
Less vegetation; more dry, bare soil; more wind erosion.

Animals/insects
Locusts destroy the crops.
Overgrazing means all vegetation is eaten.
Animals trample the ground reducing it to dust.
Animals die and can’t breed.

What are the effects of desertification?
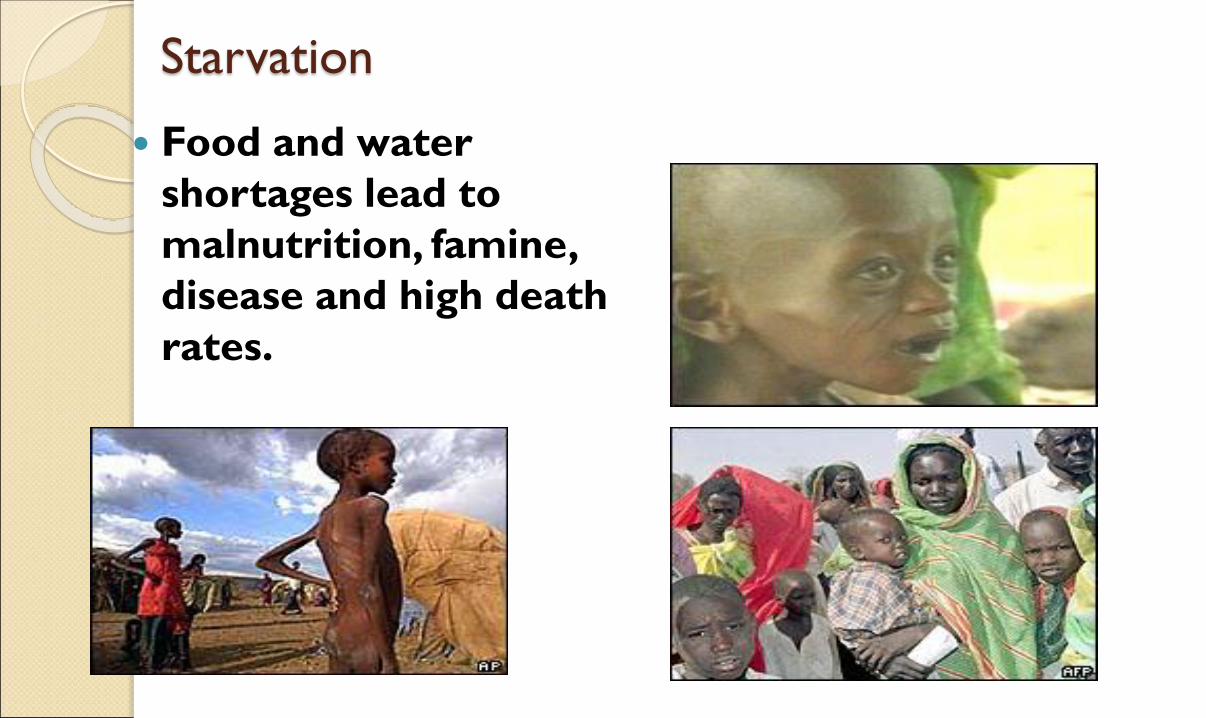
Starvation
Food and water
shortages lead to
malnutrition, famine,
disease and high death
rates.

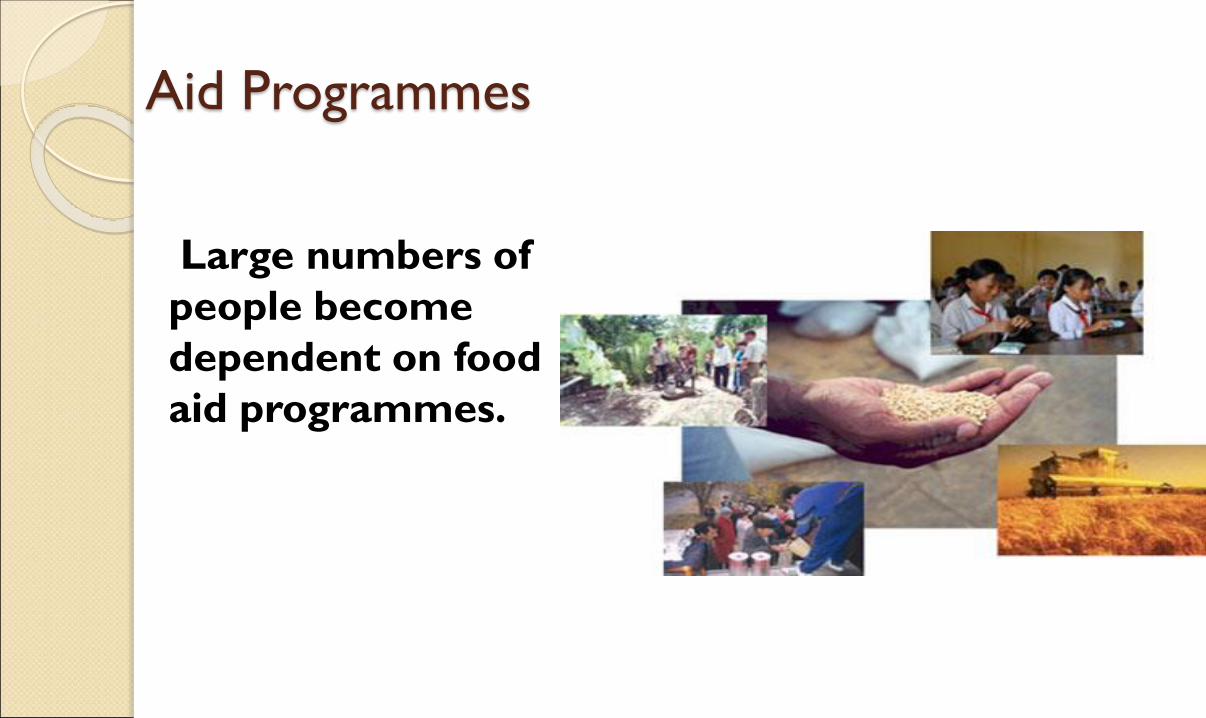
Aid Programmes
Large numbers of
people become
dependent on food
aid programmes.
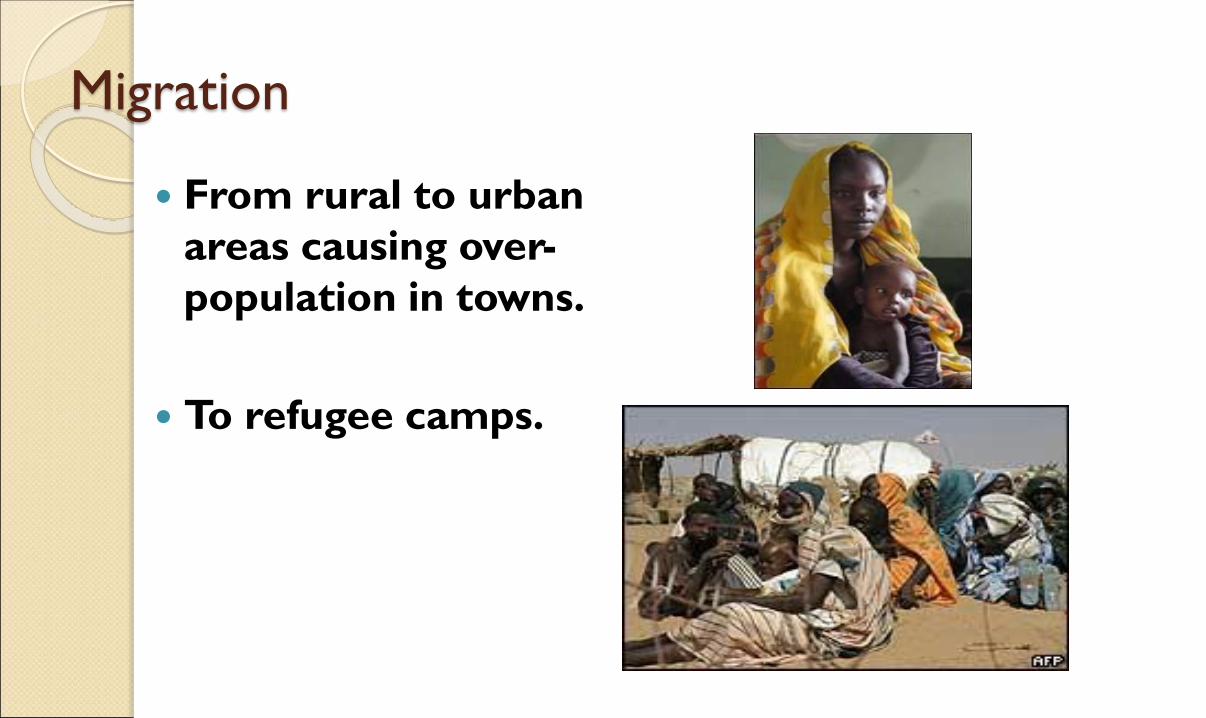
Migration
From rural to urban
areas causing over-
population in towns.
To refugee camps.

Solutions?
How can we solve the problems
of desertification?

Solutions
In the short-term, provide food aid and water supplies to prevent suffering.
Improve water supplies by building large reservoirs and drilling deeper wells.
Conserve water in local small-scale schemes

Solutions con’t
Encourage sustainable farming practices (using locally-made tools, not tractors).
Provide drought-resistant seed such as millet (northern Nigeria). GM crops.
Tree planting schemes to reduce soil erosion (Mauritania).
International action to reduce the causes of global warming.

Solving the Problems: the resultsNov 1992
Nov 1998
Before and after
animals have
overgrazed and
trampled the
savanna.
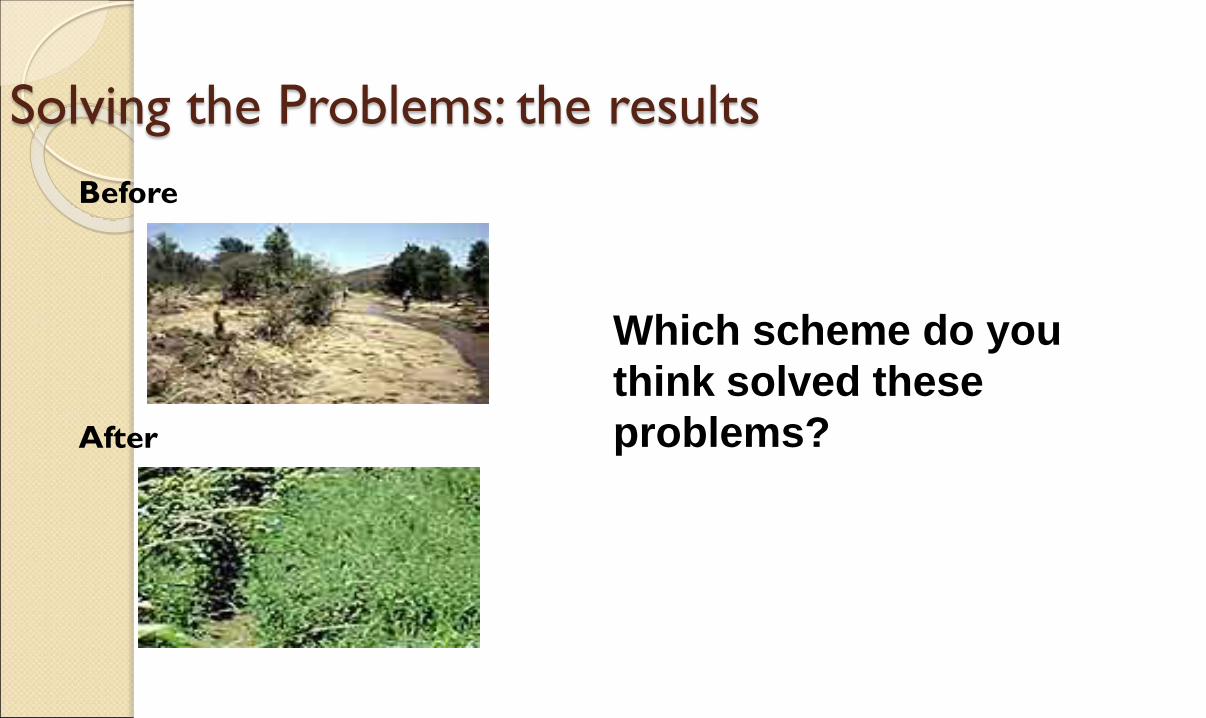
Solving the Problems: the results
Before
After
Which scheme do you
think solved these
problems?

Problems?
Civil wars, as in Ethiopia
and Sudan prevent aid
reaching stricken areas and
cause mass migration to
refugee camps.
Population growth
continues to outstrip food
supplies.