unit 5 statistical reasoning - wordpress.com€¦ · · 2017-03-134 a) calculate the mean,...
TRANSCRIPT
Unit 5 Statistical Reasoning 1
5.1 Exploring Data
Data: A set of values.
A set of data can be represented as { x1 , x2 , x3 , ... , xn }.
(I) Measures Of Central Tendency
Mean (Average): The sum of a set of values divided by the total number of
values.
The mean can be represented as xor .
Mean = ValuesOfNumber
ValuesOfSum
Median: The middle value in a set of ordered numbers.
Mode: The most frequent number that occurs in a set of data.
(II) Measures Of Dispersion
Range: In a set of data, Range = largest number – smallest number.
Standard Deviation: A measure indicating how data is spread out or dispersed
within a set of data. This measure identifies the distance
that each data value is from the mean.
Goals:
Exploring Measures of Central Tendency (mean, median and mode)
Exploring range as a measure of dispersion
Unit 5 Statistical Reasoning 2
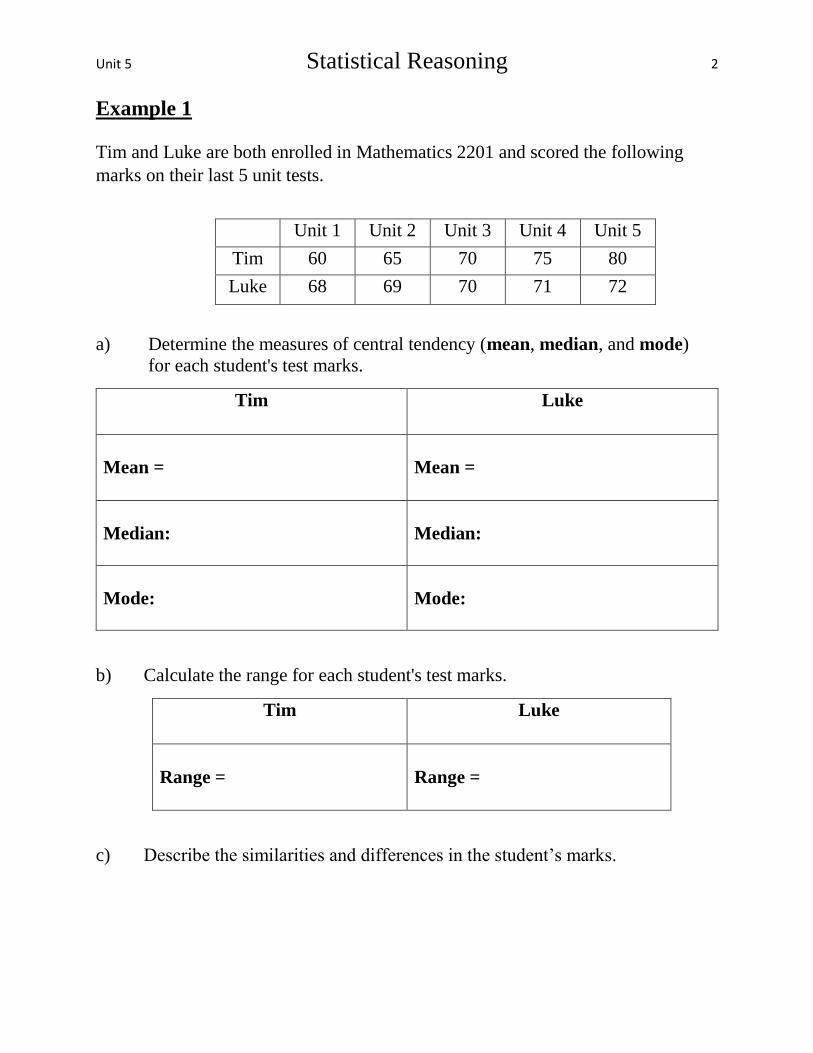
Example 1
Tim and Luke are both enrolled in Mathematics 2201 and scored the following
marks on their last 5 unit tests.
a) Determine the measures of central tendency (mean, median, and mode)
for each student's test marks.
Tim Luke
Mean =
Mean =
Median:
Median:
Mode:
Mode:
b) Calculate the range for each student's test marks.
Tim Luke
Range =
Range =
c) Describe the similarities and differences in the student’s marks.
Unit 1 Unit 2 Unit 3 Unit 4 Unit 5
Tim 60 65 70 75 80
Luke 68 69 70 71 72
Unit 5 Statistical Reasoning 3
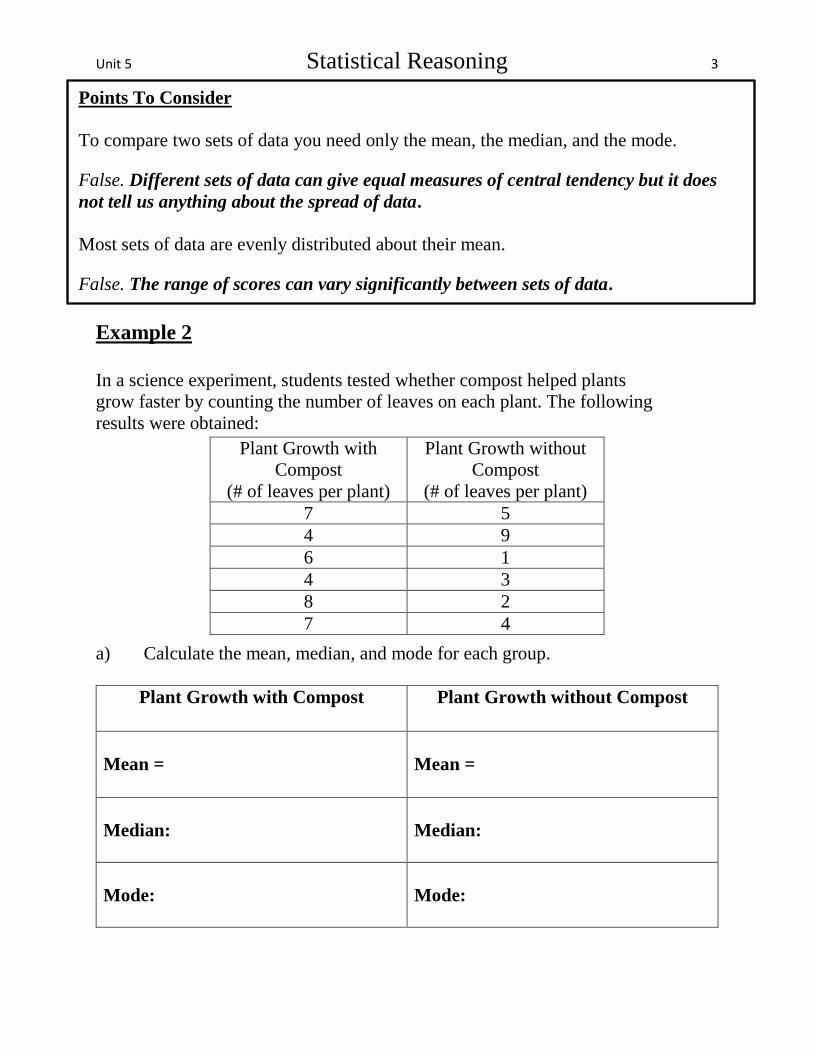
Example 2
In a science experiment, students tested whether compost helped plants
grow faster by counting the number of leaves on each plant. The following
results were obtained:
a) Calculate the mean, median, and mode for each group.
Plant Growth with Compost Plant Growth without Compost
Mean =
Mean =
Median:
Median:
Mode:
Mode:
Plant Growth with
Compost
(# of leaves per plant)
Plant Growth without
Compost
(# of leaves per plant)
7 5
4 9
6 1
4 3
8 2
7 4
Points To Consider
To compare two sets of data you need only the mean, the median, and the mode.
False. Different sets of data can give equal measures of central tendency but it does
not tell us anything about the spread of data.
Most sets of data are evenly distributed about their mean.
False. The range of scores can vary significantly between sets of data.

Unit 5 Statistical Reasoning 4
b) Calculate the range for each group.
Plant Growth with Compost Plant Growth without Compost
Range =
Range =
c) Describe the dispersion of the data for each group.
d) Which group of plants grew better? Justify your decision.
Example 3 10 numbers have a mean of 37. If one number is removed the mean is 38.
What was the number removed?

Unit 5 Statistical Reasoning 5
Example 4
Calculate the range of each group. Explain why the range, by itself, can be a
misleading measure of dispersion.
Group A: 8, 13, 13, 14, 14, 14, 15, 15, 20 Group B: 7, 7, 8, 9, 11, 13, 15, 15, 17, 18
Group A Group B
Range =
Range =

Unit 5 Statistical Reasoning 6
Example 5
Paulo is trying to decide between two different brands of batteries for his car. Both brands
are the same price. He obtains data for the lifespan, in years, for 30 batteries of each brand.
http://easycalculation.com/statistics/mean-median-mode.php
a) Determine the measures of central tendency and the range. Describe any
similarities and differences between the two sets of data.
Brand X Brand Y
Mean = Mean =
Median:
Median:
Mode:
Mode:
Range:
Range:
Measured Lifespans of 30 Car Batteries (years)
Brand X Brand Y
5.1 7.3 6.9 4.7 5.0
6.2 6.4 5.5 5.7 6.8
6.0 4.8 4.1 5.2 8.1
6.3 7.5 5.0 5.7 8.2
3.3 3.1 4.3 5.9 6.6
5.8 6.4 6.1 4.6 5.7
5.4 6.3 4.8 5.9 5.5
4.7 6.0 4.5 6.6 6.0
5.0 6.5 5.8 5.4 5.1
5.7 6.8 5.6 4.9 6.1
4.9 5.7 6.2 7.0 5.8
6.8 5.9 5.3 5.6 5.9

Unit 5 Statistical Reasoning 7
b) Is the mode useful to compare in this situation?
c) How can we compare the data to help Paulo decide which brand of battery to buy?
Questions: Pages 239 – 240, # 1a, b, d, 2, 3

Unit 5 Statistical Reasoning 8
5.2 Frequency Tables, Histograms, and Frequency Polygons
(I) Frequency Distributions:
(II) Histograms:
(III) Frequency Polygons:
Goals:
Creating Frequency Tables, Histograms and Frequency Polygons

Unit 5 Statistical Reasoning 9
Example 1
The marks earned on a 10 question Math quiz for a class of 20 students are given
below.
6 7 5 7 7 8 7 6 9 7
4 10 6 8 8 9 5 6 4 8
a) Construct a frequency table. b) Display the data on a histogram
and construct the frequency polygon.
Mark Tally Frequency
Unit 5 Statistical Reasoning 10
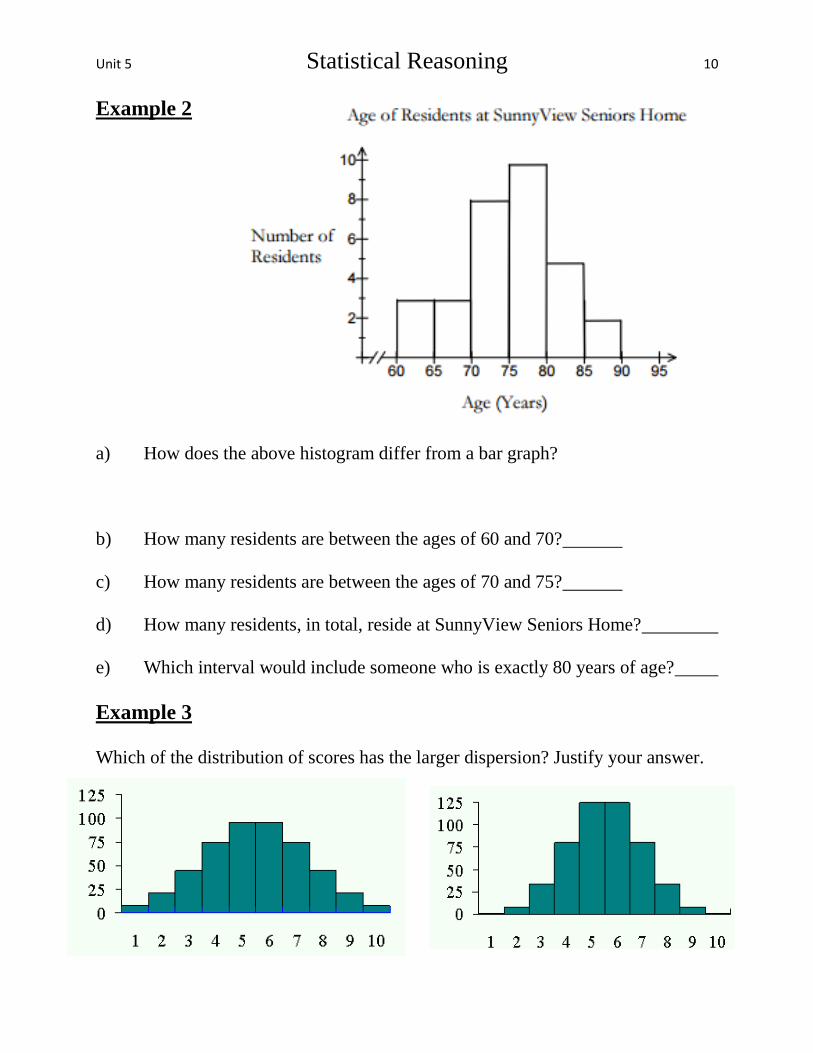
Example 2
a) How does the above histogram differ from a bar graph?
b) How many residents are between the ages of 60 and 70?
c) How many residents are between the ages of 70 and 75?
d) How many residents, in total, reside at SunnyView Seniors Home?
e) Which interval would include someone who is exactly 80 years of age?
Example 3 Which of the distribution of scores has the larger dispersion? Justify your answer.

Unit 5 Statistical Reasoning 11
Example 4
Jason does a survey at the local dog park. He asks 36 owners how long it takes
them to walk their dog to the park. Their responses (in minutes) are given below.
7 32 13 27 9 27 17 12 12 26 23 16 25 18 19 16 17 19
8 20 24 20 2 28 18 19 18 14 19 12 13 19 22 21 22 20
a) Construct a frequency table for the data above.
Time (Min) Tally Frequency
0–4
4–8
8–12
12–16
16–20
20–24
24–28
28–32
32–36

Unit 5 Statistical Reasoning 12
b) Construct a frequency polygon to display the data.
Time Midpoint Frequency
0–4
4–8
8–12
12–16
16–20
20–24
24–28
28–32
32–36
Questions: Pages 249–251, # 2, 3, 4, 5, 6

Unit 5 Statistical Reasoning 13
5.3 Standard Deviation
Deviation: Standard Deviation:
Goals: Determining Standard Deviation and using it to solve problems and
make decisions
Population Standard Deviation Sample Standard Deviation
n
x
DataOfNumber
SumTotalx
2
11
2
n
xx
DataOfNumber
SumTotalS x
x population standard deviation xS sample standard deviation
calculate the sum calculate the sum
x each individual data value x each individual data value
the population mean x the sample mean
n number of values in data set n number of values in data set
Note: A set of data will have a standard deviation of 0 when all the data values are the same.
Example: Given the set of data { 20 , 20 , 20 , 20 , 20 }. Standard Deviation = 0

Unit 5 Statistical Reasoning 14
Example 1
Remember the sample of Tim's and Luke's marks in Math 2201. Both scored the
following marks on their last five unit tests.
We previously calculated the mean of Tim's marks to be 70 and the median to be 70.
Also, we found the mean of Luke's marks to be 70 and the median to be 70.
a) Whose marks are more dispersed?
b) What does this mean in terms of a high or low standard deviation?
c) If the data is clustered around the mean, what does this tell us about the
value of the standard deviation?
d) Who was more consistent over the five unit tests?

Unit 5 Statistical Reasoning 15
e) Calculate the sample standard deviation for each student. What does the standard
deviation tell you about the dispersion of Tim's and Luke's test scores?

Unit 5 Statistical Reasoning 16
Example 2
The following data represents the time, in minutes, it takes each member of the
entire track team to complete the assigned circuit. Determine the population
standard deviation.
9 , 10 , 12 , 14, 8 , 10 , 14
Data
( x )
Mean
( )
( Data – Mean )
( x – )
( Data – Mean )2
( x – )2
9
10
12
14
8
10
14
Example 3 For the following would we determine the sample standard deviation, or the
population standard deviation, based on the data collected.
a) We want to determine how many gold coins pirates have on a pirate ship but
we only have time to interview 5 pirates.
b) A teacher recorded the grades, on a Math test, for all the students in his class.
c) A coach records all the goals scored by his team for a 20 game season.
d) The owner of a restaurant is interested in how much money each customer
spends at the restaurant. He examines 10 randomly selected receipts and
records the data.

Unit 5 Statistical Reasoning 17
Example 4
Two companies produce cinnamon heart candies. Quality control randomly
chooses and weighs 25 boxes from each company. The following masses are
recorded (in grams).
http://easycalculation.com/statistics/standard-deviation.php
a) Use technology to calculate the standard deviation of Company A and Company B.
b) If the standard deviation must be less than 0.5 for production to continue,
what decision must be made by Company A and Company B?
Example 5
The principals, of two different high schools, kept a record of the number of
students given detention over a 5 day period. The following results were obtained:
School A: 4 8 13 2 5 School B: 9 6 11 10 8
Standard Deviation = 3.83 Standard Deviation = 1.72
Which school has the greatest variation? Why?
Company A Company B
24.8 25.3 24.8 25.2 24.5 24.7 25.8
25.2 25.1 24.9 24.5 24.6 25.0 24.7
24.3 24.7 25.4 24.9 25.1 24.0 24.6
25.1 24.4 24.8 25.0
72.8 71.9 72.0 72.3 72.9 71.0 71.3
72.1 72.8 71.7 71.8 71.6 72.5 72.9
71.0 70.9 71.1 72.6 72.5 72.0 70.0
71.4 72.1 71.8 72.1

Unit 5 Statistical Reasoning 18
Example 6
Mr. Jones organized the results of the last math test he gave his Math 2201 class.
Mark Number Of Students
40 – 50 1
50 – 60 2
60 – 70 8
70 – 80 10
80 – 90 9
90 – 100 2
a) How many students wrote the test? b) What is the mode of the data?
c) What is the range of the data? d) Determine the standard deviation.
Data
( x )
Mean
( )
( Data – Mean )
( x – )
( Data – Mean )2
( x – )2
45
55
65
75
85
95
Questions: Pages 261 – 263, # 1a, c, 2, 5(use technology), 6, 7a, b, 9, 11
Unit 5 Statistical Reasoning 19
5.4 Normal Distribution
Analyzing the Distribution of Data
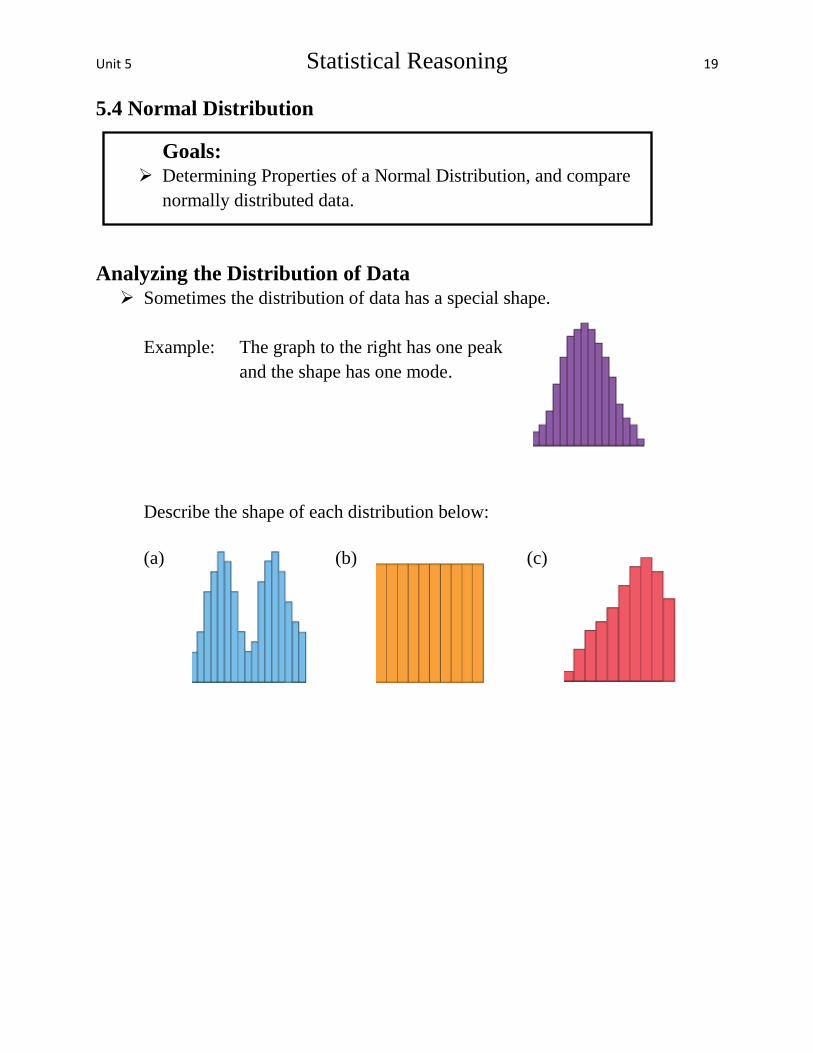
Sometimes the distribution of data has a special shape.
Example: The graph to the right has one peak
and the shape has one mode.
Describe the shape of each distribution below:
(a) (b) (c)
Goals: Determining Properties of a Normal Distribution, and compare
normally distributed data.

Unit 5 Statistical Reasoning 20
Properties Of The Normal Distribution Curve
• The graph is symmetrical.
• The mean, median, and mode are equal (or close) and fall at the line of symmetry.
• The normal curve is shaped like a bell peaking in the middle, sloping down toward
the sides, and approaching zero at the extremes.
• 50% of the data is to the right of the mean.
• 50% of the data is to the left of the mean.
• The area under the curve can be considered as 1 unit since it represents 100% of the data.
The 68 – 95 – 99.7% Rule
• About 68% of the data lie within one standard deviation of the mean.
• About 95% of the data lie within two standard deviations of the mean.
• About 99.7% of the data lie within three standard deviations of the mean.
Total area under the curve is 100% or a unit of 1
3223
0.15% 0.15%

Unit 5 Statistical Reasoning 21
Example 1
The following sample data represents the approximate number of hours of playing
video games in a week, for 15 year olds.
a) Determine the mean, median, mode, and standard deviation (use technology).
What do you notice about the values?
b) Construct a frequency table and generate a histogram. Use an interval width
equal to the standard deviation.
Hours Tally Frequency
c) Discuss the symmetry of the histogram.
21 21 17 23 14 20 19 17 24 22
18 19 18 17 20 15 21 16 13 20
14 19 24 22 17 24 21 19 21 21
16 23 19 19 15 20 27 17 19 18
Number of hours playing video games in a week. (15 year olds)

Unit 5 Statistical Reasoning 22
d) Draw a frequency polygon and explain its shape.
e) Where do the mean, median and mode lie?
f) Approximate the percentage of data that is within 1 standard deviation of the mean.
g) Approximate the percentage of data that is within 2 standard deviations of the mean.
h) Approximate the percentage of data that is within 3 standard deviations of the mean.
Example 2
Which normal distribution curve has the largest standard deviation? Explain your
reasoning.
A) B)
C) D)

Unit 5 Statistical Reasoning 23
Example 3
A data set of 50 items is given below with a standard deviation of 1.8. Answer the
following questions:
a) What is the value of the mean, median and mode?
b) Is the data normally distributed? Explain your reasoning.
6 9 6 7 6 7 6 7 6 6
5 8 5 8 6 7 7 4 8 6
5 4 6 8 6 6 7 6 6 8
8 7 6 6 0 4 7 8 5 3
6 7 6 7 1 7 7 4 4 3

Unit 5 Statistical Reasoning 24
Example 4
The weight of adult female Siberian huskies
is normally distributed with a population
mean ( ) of 48.5 lb and a standard
deviation ( ) of 2.1 lb.
a) Sketch a normal distribution curve
that represents the given data.
b) What percentage of adult female dogs would you expect to weigh between:
i) 46.4 lb and 50.6 lb ii) 44.3 lb and 52.7 lb iii) 42.2 lb and 54.8 lb
iv) 48.5 lb and 52.7 lb v) 44.3 lb and 50.6 lb vi) More than 50.6 lb
c) If there are 820 adult female Siberian huskies registered in Alberta how
many would weigh between 44.3 lb and 50.6 lb?

Unit 5 Statistical Reasoning 25
Example 5 The ages of the members of a seniors
curling club are normally distributed,
with a mean of 63 years and a standard
deviation of 4 years.
a) Construct a normal distribution curve.
b) What percentage of the curlers are in each of the following age groups?
i) between 59 and 67 years old ii) between 55 and 71 years old
iii) between 67 and 75 years old iv) older than 75 years old.
c) If there are 120 senior curlers in the club, how many of them are between 51
and 67 years old?
Questions: page 279–281, #2, 3, 4, 6, 8, 10, 11, 13

Unit 5 Statistical Reasoning 26
STATISTICS INCLASS ASSIGNMENT REVIEW SHEET
1. For the following data, determine the mean, the median, the mode, and the range
(a) 10 , 5 , 6 , 5 , 2 , 3 , 4 (b) 24, 10, 18, 11, 19, 12, 11, 7 (c) 21, 18, 25, 24, 22, 19, 26, 25, 23, 27
2. Given are the grades Mark and Mary received on 5 unit Math tests this year.
(a) Determine Mark’s and Mary’s average on their unit tests and the range value for their tests.
(b) Which student was more consistent in their grades?
3. (a) 15 numbers have a mean of 32. If one number is removed the mean is 30. What was the
number removed?
(b) 10 numbers have a mean of 24. If one number is added the mean is 28. What was the
number added?
4. Answer the following questions based on the given histogram.
(a) How many residents are between the ages of
60 and 85?
(b) How many residents are older than 75 years of age?
(c) How many residents reside at the Seniors Home?
5. The marks earned on a 10 question Science quiz for a class of 20 students are given below.
Construct a frequency table and construct a histogram.
5 7 5 7 7 9 6 8 9 7 4 10 7 6 8 4 5 6 3 8
Unit 1 Unit 2 Unit 3 Unit 4 Unit 5
Mark 50 68 77 59 86
Mary 45 65 55 85 75
Unit 5 Statistical Reasoning 27
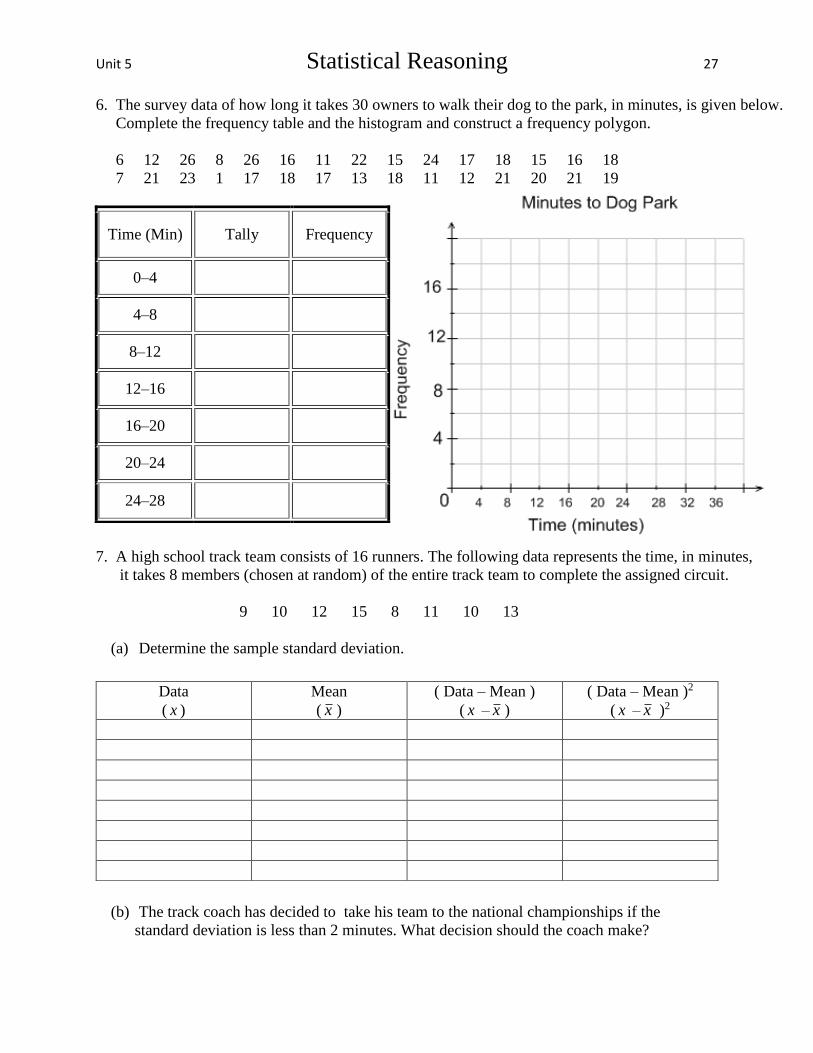
6. The survey data of how long it takes 30 owners to walk their dog to the park, in minutes, is given below.
Complete the frequency table and the histogram and construct a frequency polygon.
6 12 26 8 26 16 11 22 15 24 17 18 15 16 18
7 21 23 1 17 18 17 13 18 11 12 21 20 21 19
7. A high school track team consists of 16 runners. The following data represents the time, in minutes,
it takes 8 members (chosen at random) of the entire track team to complete the assigned circuit.
9 10 12 15 8 11 10 13
(a) Determine the sample standard deviation.
(b) The track coach has decided to take his team to the national championships if the
standard deviation is less than 2 minutes. What decision should the coach make?
Time (Min) Tally Frequency
0–4
4–8
8–12
12–16
16–20
20–24
24–28
Data
( x )
Mean
( x )
( Data – Mean )
( x – x )
( Data – Mean )2
( x – x )2
Unit 5 Statistical Reasoning 28
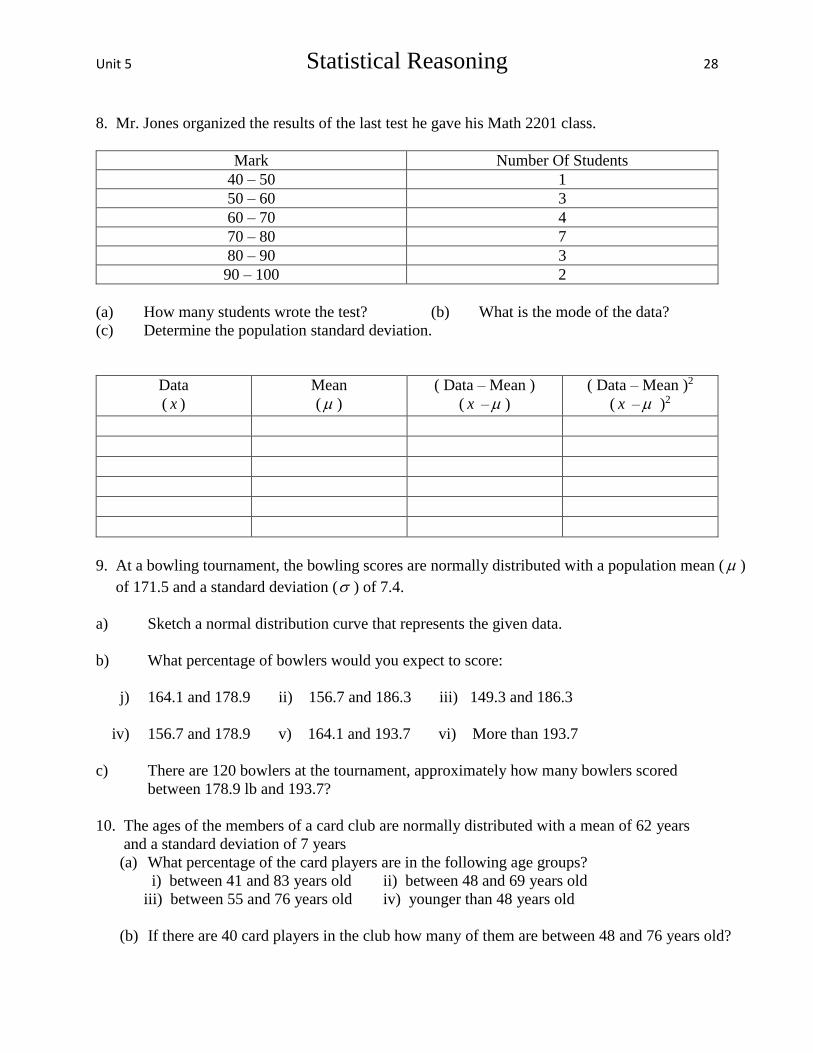
8. Mr. Jones organized the results of the last test he gave his Math 2201 class.
Mark Number Of Students
40 – 50 1
50 – 60 3
60 – 70 4
70 – 80 7
80 – 90 3
90 – 100 2
(a) How many students wrote the test? (b) What is the mode of the data?
(c) Determine the population standard deviation.
Data
( x )
Mean
( )
( Data – Mean )
( x – )
( Data – Mean )2
( x – )2
9. At a bowling tournament, the bowling scores are normally distributed with a population mean ( )
of 171.5 and a standard deviation ( ) of 7.4.
a) Sketch a normal distribution curve that represents the given data.
b) What percentage of bowlers would you expect to score:
j) 164.1 and 178.9 ii) 156.7 and 186.3 iii) 149.3 and 186.3
iv) 156.7 and 178.9 v) 164.1 and 193.7 vi) More than 193.7
c) There are 120 bowlers at the tournament, approximately how many bowlers scored
between 178.9 lb and 193.7?
10. The ages of the members of a card club are normally distributed with a mean of 62 years
and a standard deviation of 7 years
(a) What percentage of the card players are in the following age groups?
i) between 41 and 83 years old ii) between 48 and 69 years old
iii) between 55 and 76 years old iv) younger than 48 years old
(b) If there are 40 card players in the club how many of them are between 48 and 76 years old?

Unit 5 Statistical Reasoning 29
SOLUTIONS
1(a) Mean = 5 Median = 5 Mode = 5 Range = 8 (b) Mean = 14 Median = 11.5 Mode = 11 Range = 17
(c) Mean = 23 Median = 23.5 Mode = 25 Range = 9
2(a) Mark: Mean 68 Range 36 Mary: Mean 65 Range 40 (b) Mark 3(a) 60 (b) 68 4(a) 29 (b) 17 (c) 31
7(a) sample standard deviation = 2.27 (b) Don’t take the track team to the national championships.
8(a) 20 students (b) mode = 70 – 80 (c) population standard deviation = 9.42
9(b) i. 68% ii. 95% iii. 97.35% iv. 81.5% v. 83.85% vi. 0.15% (c) approximately 19 bowlers
10(a) i. 99.7% ii. 81.5% iii. 81.5% iv. 2.5% (b) 38 card players
TO KNOW
Mean = ValuesOfNumber
ValuesOfSum
Population Standard Deviation
n
x
DataOfNumber
SumTotalx
2
Sample Standard Deviation
11
2
n
xx
DataOfNumber
SumTotalS x

Unit 5 Statistical Reasoning 30
5.5 Z – Scores
How can we compare individual data scores within a set of data?
Example:
You play in a rock band. Band members practise an average of 16.5 h per week,
with a standard deviation of 4.2 h. You practise an average of 22 h per week. How
can we compare and estimate the percent of the band that, on average, practises
a greater number of hours than you.
Goals: Using Z – Scores to compare data, make predictions and solve
problems.
(I) Sketch the normal curve.
(II) Determine how many standard
deviations your practise time is above the
mean?
(III) Mark that standard deviation on the
normal curve.
(IV) Approximate the percentage of band
members that practise less hours than you.
(V) Determine the percentage of bamd
members that practise more than you.
Unit 5 Statistical Reasoning 31
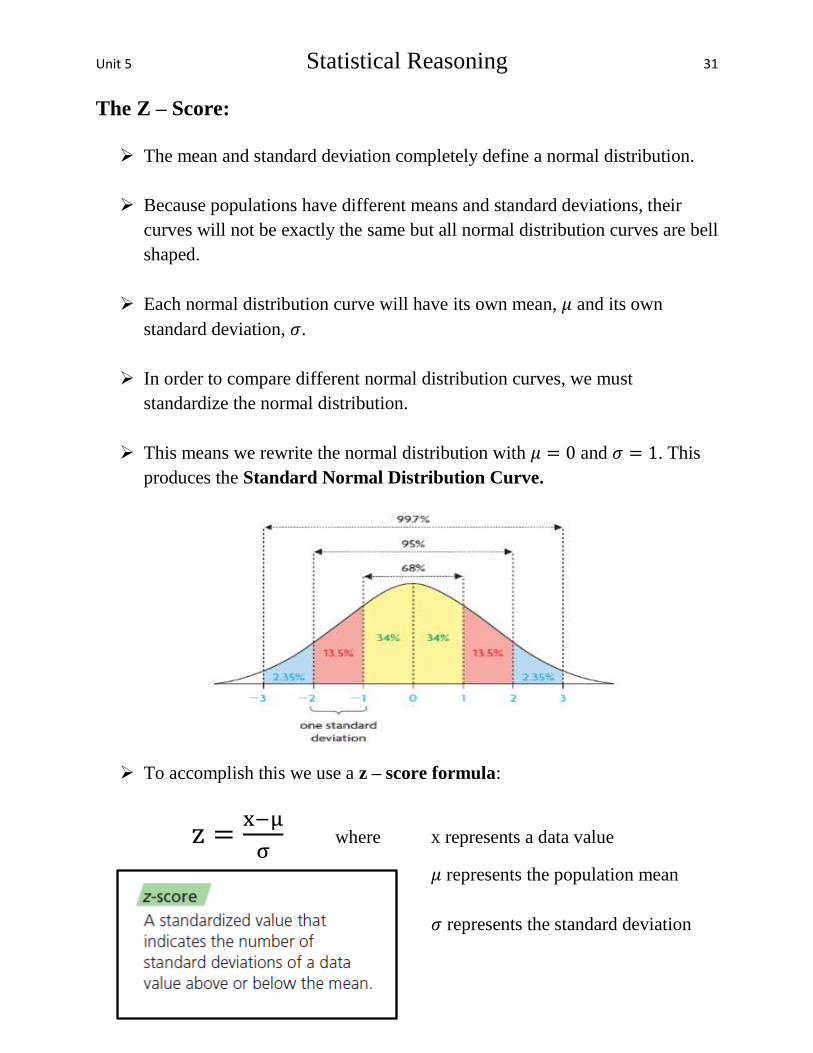
The Z – Score:
The mean and standard deviation completely define a normal distribution.
Because populations have different means and standard deviations, their
curves will not be exactly the same but all normal distribution curves are bell
shaped.
Each normal distribution curve will have its own mean, 𝜇 and its own
standard deviation, 𝜎.
In order to compare different normal distribution curves, we must
standardize the normal distribution.
This means we rewrite the normal distribution with 𝜇 = 0 and 𝜎 = 1. This
produces the Standard Normal Distribution Curve.
To accomplish this we use a z – score formula:
z =x−μ
σ where x represents a data value
𝜇 represents the population mean
𝜎 represents the standard deviation

Unit 5 Statistical Reasoning 32
Standard Normal Distribution Curve
The Normal Curve is Standardized to:
Compare scores within a set of data.
Compare scores between different sets of data to see which is better.
To determine if individual data values are above or below average.
To determine how far away an individual data value is from the average
which is calculated by the z – score formula.
A positive z–score indicates a data value lies above the mean.
A negative z–score indicates a data value lies below the mean.
The area under the standard normal distribution curve is 1.

Unit 5 Statistical Reasoning 33
Example 1
IQ tests are normally distributed with a mean of 100 and a standard deviation of
15. What percentage of students achieved less than the 130 mark?
a) Draw the normal distribution curve, labeling the mean and standard
deviation. Use this diagram to determine what percentage of students
achieved less than a 130 mark.
b) Draw the standard normal distribution curve and indicate where the
130 mark is found.
c) Using the z–score formula and then the z–score table (P.35 & P.36) check
your answer. Was there any difference in your answers from (b) and (c)?
Explain.

Unit 5 Statistical Reasoning 34
d) Using your diagram from (a), estimate the percentage of students who achieved
a mark less than 120.
e) Using your diagram from (b), the z–score formula and the z–score table
determine the percentage of students who achieved less than 120.
f) Why is the z–score more reliable than estimating using standard deviation?
g) What percentage of students achieved more than 120?
Example 2
Two students competed in a nation–wide mathematics competition and received
the following scores. For the competition the mean (μ) was 66 and the standard
deviation (σ) was 10. Determine the z–score for Alma and Bruce.
Alma: 70 Bruce: 80

Unit 5 Statistical Reasoning 35

Unit 5 Statistical Reasoning 36

Unit 5 Statistical Reasoning 37
Example 3 On the math placement test at Memorial University of Newfoundland, the mean
score was 62 and the standard deviation was 11. If Mark’s z–score was 0.8 what
was his actual exam mark?
Example 4
On her first math test Susan scored 70%. The mean class score was 65% with a
standard deviation of 4%. On her second test she received 76%. The mean class
score was 73% with a standard deviation of 10%.
a) Without performing any calculations, on which test do you think she did better?
b) By calculating 2 separate z–scores, on which test did Susan perform better
with respect to the rest of her class?

Unit 5 Statistical Reasoning 38
Example 5
NHL hockey players sharpen their skates to ensure speed, balance and quick turns.
Sidney Crosby wants to sharpen his skates when only 25% of other NHL skaters
would sharpen their skates. If the population mean for skate sharpening is 20
hours with a standard deviation of 3 hours, when should Sidney Crosby sharpen his
skates?
z =x−μ
σ
Step I:
Indicate the area under the standardized normal curve.
Step II:
Use the z – score table to determine a z – score
based on an area of 25% which is 0.25.
Step III:
Use the z – score from the table and the z – score formula to determine the individual
data score that represents when Sidney Crosby should sharpen his skates.
Unit 5 Statistical Reasoning 39
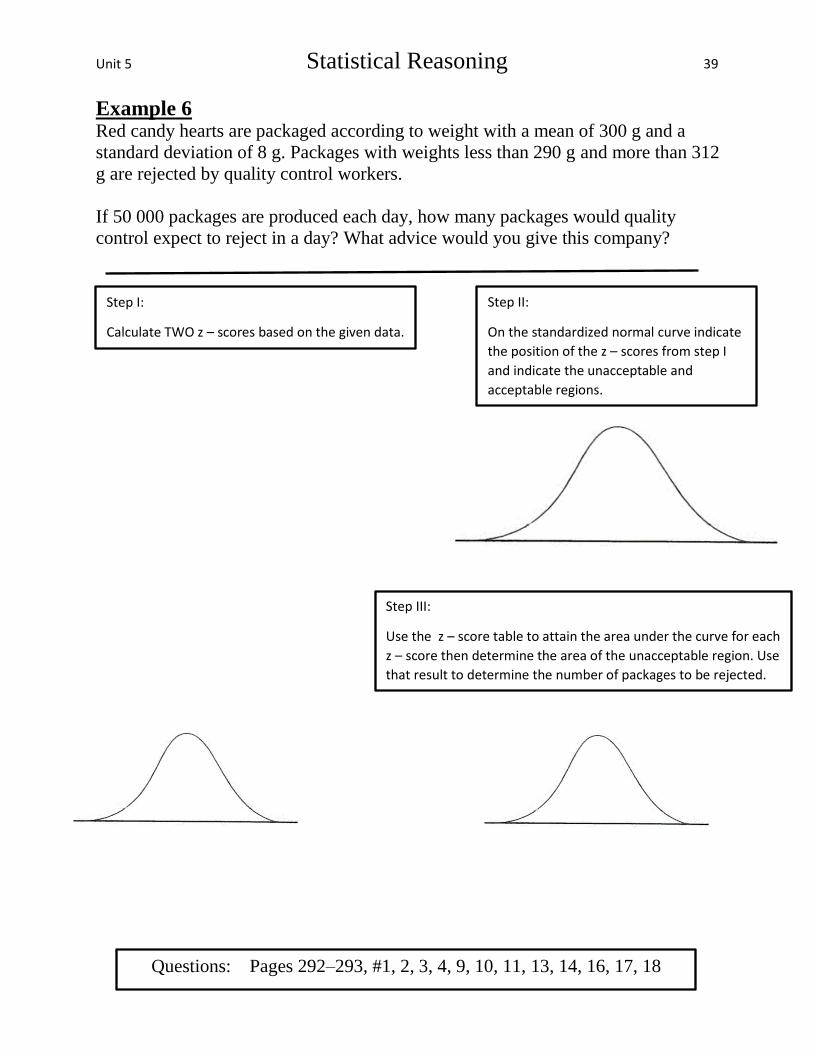
Example 6 Red candy hearts are packaged according to weight with a mean of 300 g and a
standard deviation of 8 g. Packages with weights less than 290 g and more than 312
g are rejected by quality control workers.
If 50 000 packages are produced each day, how many packages would quality
control expect to reject in a day? What advice would you give this company?
Step I:
Calculate TWO z – scores based on the given data.
Step II:
On the standardized normal curve indicate
the position of the z – scores from step I
and indicate the unacceptable and
acceptable regions.
Step III:
Use the z – score table to attain the area under the curve for each
z – score then determine the area of the unacceptable region. Use
that result to determine the number of packages to be rejected.
Questions: Pages 292–293, #1, 2, 3, 4, 9, 10, 11, 13, 14, 16, 17, 18
Unit 5 Statistical Reasoning 40
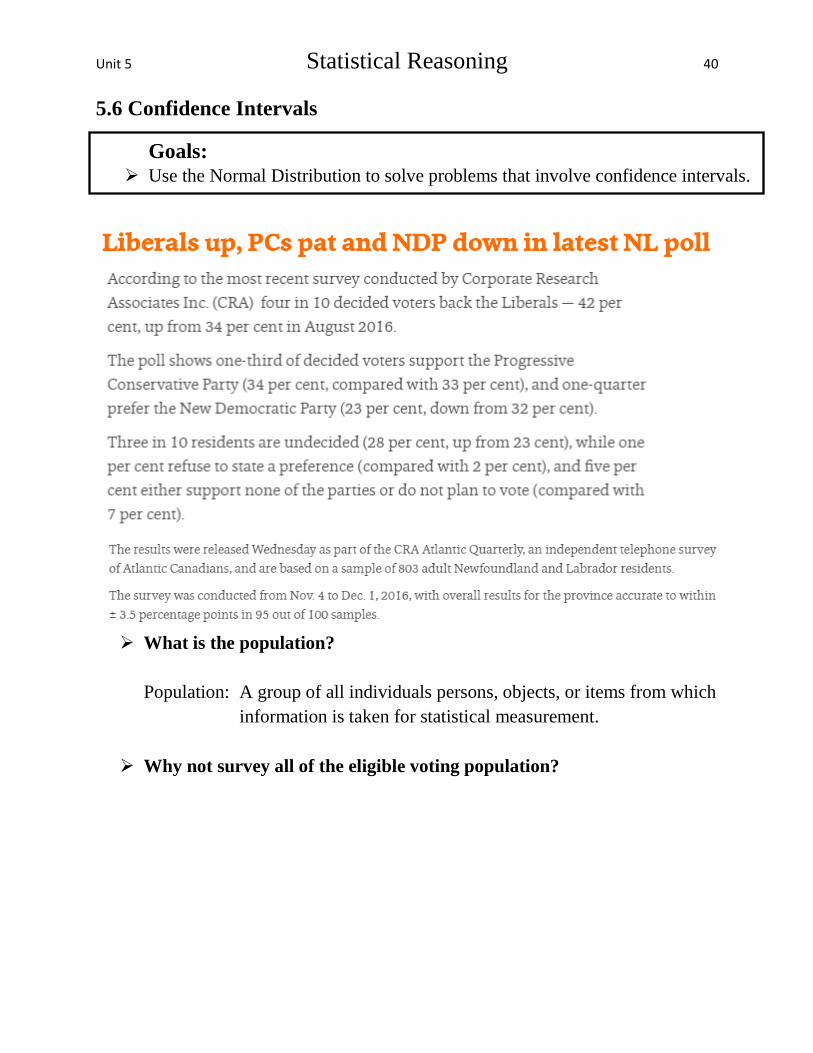
5.6 Confidence Intervals
What is the population?
Population: A group of all individuals persons, objects, or items from which
information is taken for statistical measurement.
Why not survey all of the eligible voting population?
Goals: Use the Normal Distribution to solve problems that involve confidence intervals.

Unit 5 Statistical Reasoning 41
Taking a portion or part of the population is a sample
Sample: A representative portion of the population
How can we be sure a sample represents the entire population?
How well a sample represents the larger population depends on two things:
(i) the confidence level
(ii) the margin of error
Consider the results of the survey posted above:
(a) What does “accurate to within 3.5% points” mean?
This is called the margin of error

Unit 5 Statistical Reasoning 42
(b) What does (c) What is a confidence interval?
“95 times out of 100” mean?
Example:
The confidence interval is calculated as:
42% ± 3.5%
Lower limit: 42% – 3.5% = 38.5%
Upper limit: 42% + 3.5% = 45.5%
This means that the committed NL voters are considered to accurately reflect the views of the NL voting
population so that if this survey was replicated 100 times, 95 times out of 100 percent of the time, voters
would support the liberals between 38.5% and 45.5%.
This is called the confidence level
This is called the confidence interval

Unit 5 Statistical Reasoning 43
Example 1
A Rent–A Car–company surveys customers and finds that 50 percent of the
respondents say its customer service is “very good.” The confidence level is cited
as 95 percent and the margin of error is ± 3 percent.
Determine the margin error, the confidence level, and the confidence interval.
Explain what they mean in this situation.
Example 2
A brand of battery has a mean life expectancy of 12.6 hours with a margin of error of
± 0.7 hours. Determine the confidence interval.

Unit 5 Statistical Reasoning 44
Example 3
A botanist collects a sample of 50 iris petals and measures the length of each. It is
found that the mean is 5.55 cm and the standard deviation is 0.57 cm. He then
reports that he is 95% confident that the average petal length is between 5.39 cm
and 5.71 cm.
a) Identify the margin of error, the confidence interval, and the confidence level.
b) Explain what information the confidence interval gives about the length of
iris petals.
c) If you did not know the margin of error but you knew that the confidence
interval is between 5.39 cm and 5.71 cm, how could you determine the
margin of error?
Example 4
A telephone survey of 600 randomly selected people was conducted in an urban
area. The survey determined that 76% of people, from 18 to 34, years of age, have
a social networking account. The results are accurate within ± 4 percentage points,
19 times out of 20.
a) Determine the margin of error, the confidence level, and the confidence interval.
b) What range of people, that were selected, have a social networking account?

Unit 5 Statistical Reasoning 45
Example 5
A recent study reports that 61% of students at Lewisporte Intermediate own a cell
phone. The results of the study are reported to be accurate, 19 times out of 20, with
a margin of errror of 3.6%.
a) What is the confidence level? b) What is the confidence interval?
c) According to the study, if there are 258 students at Lewisporte Intermediate
School what is the range of students who own a cell phone?
Example 6 In a national survey of 400 Canadians from the ages of 20 to 35, 37.5% of those
interviewed claimed they exercise for at least four hours a week. The results were
considered accurate within 4%, 9 times out of 10.
a) How many people in the survey claimed to exercise at least four hours a week?
b) What is the margin of error and the confidence level? What are the limitations
to this survey?
c) If there are approximately, 8.7 million people in Canada, what range of
Canadians exercise at least 4 hours a week?
Questions: Pages 302–303, # 1, 2a, 3, 4, 5, 6, 8a, b