unit ii – break-even analysis
TRANSCRIPT

Prepared by: Mr. R A Khan, Visiting Faculty Page 1
UNIT II – BREAK-EVEN ANALYSIS
Basic BreakevenAnalysis
GraphicalApproach
SingleProduct
MajorAssumption
BreakevenPoint
C/SRatio
Margin ofSafety
Target Profit
BreakevenCharts
MultiProduct
Limitations
Advantages
Further Aspectsof CVP
CVPAnalysis
COST-VOLUME-PROFIT (CVP) ANALYSISCVP analysis examines the interaction of a firm’s sales volume, selling price, cost structure, andprofitability. It is a powerful tool in making managerial decisions including marketing, production,investment, and financing decisions. How many units of its products must a firm sell to break even? How many units of its products must a firm sell to earn a certain amount of profit? Should a firm invest in highly automated machinery and reduce its labor force? Should a firm advertise more to improve its sales?
CVP Model – AssumptionsKey assumptions of CVP model Selling price is constant Costs are linear and can be divided into variable and fixed elements. In multi-product companies, sales mix is constant In manufacturing companies, inventories do not change.
Benefits of CVP:

Prepared by: Mr. R A Khan, Visiting Faculty Page 2
Assists in establishing prices of products. Assists in analyzing the impact that volume has on short-term profits. Assists in focusing on the impact that changes in costs (variable and fixed) have on
profits. Assists in analyzing how the mix of products affects profits.
Cost-Volume-Profit GraphCVP graphs can be used to gain insight into the behavior of expenses and profits. The basic CVPgraph is drawn with Revenues in Rs. term on the vertical axis and unit sales on the horizontal axis.Total fixed expense is drawn first and then variable expense is added to the fixed expense to drawthe total expense line. Finally, the total revenue line is drawn. The total profit (or loss) is the verticaldifference between the total revenue and total expense lines. The break-even occurs at the pointwhere the total revenue and total expenses lines cross.
The Limitations of CVP AnalysisA number of limitations are commonly mentioned with respect to CVP analysis:
The analysis assumes a linear revenue function and a linear cost function. The analysis assumes that price, total fixed costs, and unit variable costs can be accurately identified and
remain constant over the relevant range. The analysis assumes that what is produced is sold. For multiple-product analysis, the sales mix is assumed to be known. The selling prices and costs are assumed to be known with certainty.
Break-Even Analysis: We can accomplish break-even analysis in one of two ways. We can use theequation method or the contribution margin method. We get the same results regardless of the methodselected. You may prefer one method over the other. It’s a personal choice, but be aware that thereare problems associated with either method. Some are easier to solve using the equation method,while others can be quickly solved using the contribution margin method.Break-even analysis can be approached in two ways:
1. Equation method2. Contribution margin method
Break-Even Analysis and Target Profit Analysis:-Target profit analysis is concerned with estimating the level of sales required to attain a specifiedtarget profit. Break-even analysis is a special case of target profit analysis in which the target profit iszero.
1. Basic CVP equations. Both the equation and contribution (formula) methods of break-evenand target profit analysis are based on the contribution approach to the income statement. Theformat of this statement can be expressed in equation form as:
Profits = Sales Variable expenses Fixed expenses
In CVP analysis this equation is commonly rearranged and expressed as:
Sales = Variable expenses + Fixed expenses + Profits
Prepared by: Mr. R A Khan, Visiting Faculty Page 3
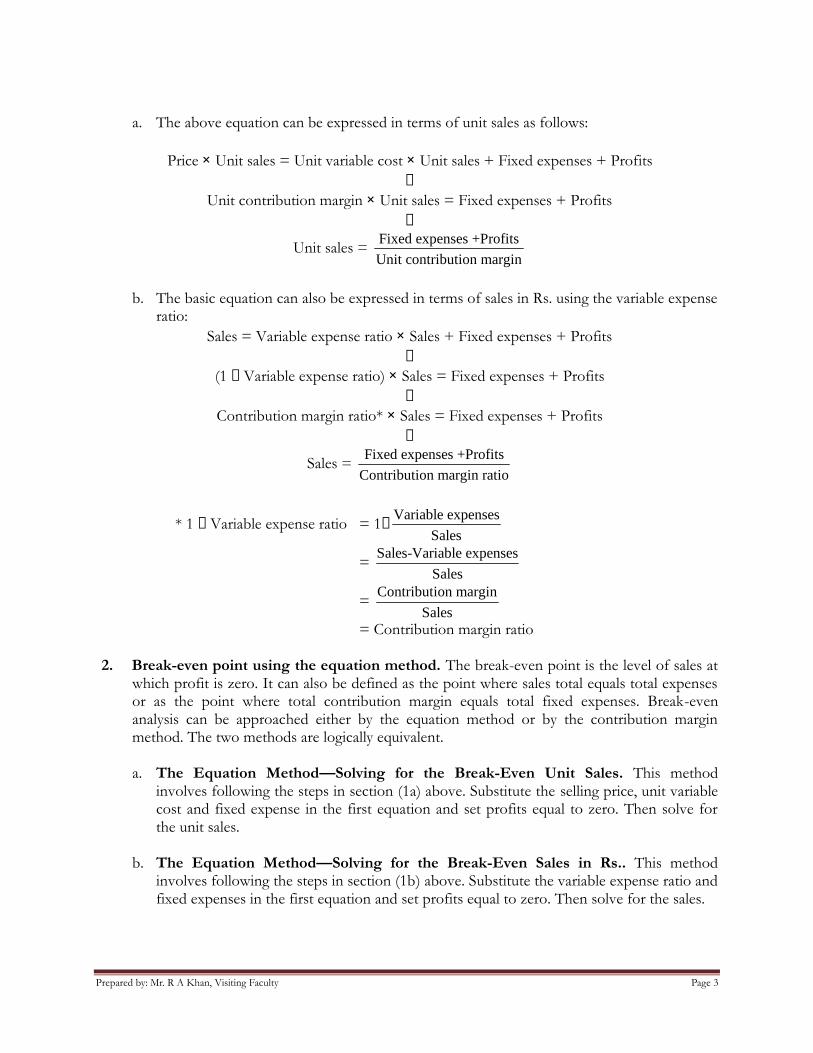
a. The above equation can be expressed in terms of unit sales as follows:
Price Unit sales = Unit variable cost Unit sales + Fixed expenses + Profits
Unit contribution margin Unit sales = Fixed expenses + Profits
Unit sales = Fixed expenses +Profits
Unit contribution margin
b. The basic equation can also be expressed in terms of sales in Rs. using the variable expenseratio:
Sales = Variable expense ratio Sales + Fixed expenses + Profits
(1 Variable expense ratio) Sales = Fixed expenses + Profits
Contribution margin ratio* Sales = Fixed expenses + Profits
Sales = Fixed expenses +Profits
Contribution margin ratio
* 1 Variable expense ratio = 1 Variable expenses
Sales
= Sales-Variable expenses
Sales
= Contribution margin
Sales= Contribution margin ratio
2. Break-even point using the equation method. The break-even point is the level of sales atwhich profit is zero. It can also be defined as the point where sales total equals total expensesor as the point where total contribution margin equals total fixed expenses. Break-evenanalysis can be approached either by the equation method or by the contribution marginmethod. The two methods are logically equivalent.
a. The Equation Method—Solving for the Break-Even Unit Sales. This methodinvolves following the steps in section (1a) above. Substitute the selling price, unit variablecost and fixed expense in the first equation and set profits equal to zero. Then solve forthe unit sales.
b. The Equation Method—Solving for the Break-Even Sales in Rs.. This methodinvolves following the steps in section (1b) above. Substitute the variable expense ratio andfixed expenses in the first equation and set profits equal to zero. Then solve for the sales.

Prepared by: Mr. R A Khan, Visiting Faculty Page 4
3. Break-even point using the contribution method. This is a short-cut method that jumpsdirectly to the solution, bypassing the intermediate algebraic steps.
a. The Contribution Method—Solving for the Break-Even Unit Sales. This methodinvolves using the final formula for unit sales in section (1a) above. Set profits equal tozero in the formula.
Break-even unit sales = Fixed expenses +$0
Unit contribution margin= Fixed expenses
Unit contribution margin
b. The Contribution Method—Solving for the Break-Even Sales in Rs.. This methodinvolves using the final formula for sales in section (1b) above. Set profits equal to zero inthe formula.
Break-even sales = Fixed expenses +$0
Contribution margin ratio= Fixed expenses
Contribution margin ratio
4. Target profit analysis. Either the equation method or the contribution margin method canbe used to find the number of units that must be sold to attain a target profit. In the case ofthe contribution margin method, the formulas are:
Unit sales to attain target profits = Fixed expenses +Target profits
Unit contribution margin
In Rs. sales to attain target profits = Fixed expenses +Target profits
Contribution margin ratio
Note that these formulas are the same as the break-even formulas if the target profit is zero.
E. Margin of Safety:- The margin of safety is the excess of budgeted (or actual) sales over thebreak-even volume of sales. It is the amount by which sales can drop before losses begin to beincurred. The margin of safety can be computed in terms of in Rs.:
Margin of safety in Rs. = Total sales – Break-even sales
or in percentage form:
Margin of safety percentage = Margin of safety in dollars
Total sales
F. Cost Structure. Cost structure refers to the relative proportion of fixed and variable costs inan organization. Understanding a company’s cost structure is important for decision-making as wellas for analysis of performance.
G. Operating Leverage:- Operating leverage is a measure of how sensitive net operating incomeis to a given percentage change in sales.

Prepared by: Mr. R A Khan, Visiting Faculty Page 5
1. Degree of operating leverage. The degree of operating leverage at a given level of sales iscomputed as follows:
Contribution marginDegree of operating leverage =
Net operating income
2. The math underlying the degree of operating leverage. The degree of operating leveragecan be used to estimate how a given percentage change in sales volume will affect net incomeat a given level of sales, assuming there is no change in fixed expenses. To verify this, considerthe following:
Degree of operating Percentage changeleverage in sales = Contribution margin New sales-Sales
Net operating income Sales
=Contribution margin New sales-Sales
Sales Net operating income
= New sales-SalesCM ratio
Net operating income
= CM ratio New sales-CM ratio Sales
Net operating income
=New contribution margin-Contribution margin
Net operating income
= Change in net operating income
Net operating income
= Percentage change in net operating income
Thus, providing that fixed expenses are not affected and the other assumptions of CVPanalysis are valid, the degree of operating leverage provides a quick way to predict thepercentage effect on profits of a given percentage increase in sales. The higher the degree ofoperating leverage, the larger the increase in net operating income.
3. Degree of operating leverage is not constant. The degree of operating leverage is notconstant as the level of sales changes. For example, at the break-even point the degree ofoperating leverage is infinite since the denominator of the ratio is zero. Therefore, the degreeof operating leverage should be used with some caution and should be recomputed for eachlevel of starting sales.
4. Operating leverage and cost structure. Richard Lord, “Interpreting and MeasuringOperating Leverage, points out that the relation between operating leverage and the cost
Prepared by: Mr. R A Khan, Visiting Faculty Page 6
structure of the company is contingent. It is difficult, for example, to infer the relativeproportions of fixed and variable costs in the cost structures of any two companies just bycomparing their operating leverages. We can, however, say that if two single-productcompanies have the same profit, the same selling price, the same unit sales, and the same totalexpenses, then the company with the higher operating leverage will have a higher proportionof fixed costs in its cost structure. If they do not have the same profit, the same unit sales, thesame selling price, and the same total expenses, we cannot safely make this inference abouttheir cost structure. All of the statements in the text about operating leverage and coststructure assume that the companies being compared are identical except for the proportionsof fixed and variable costs in their cost structures.
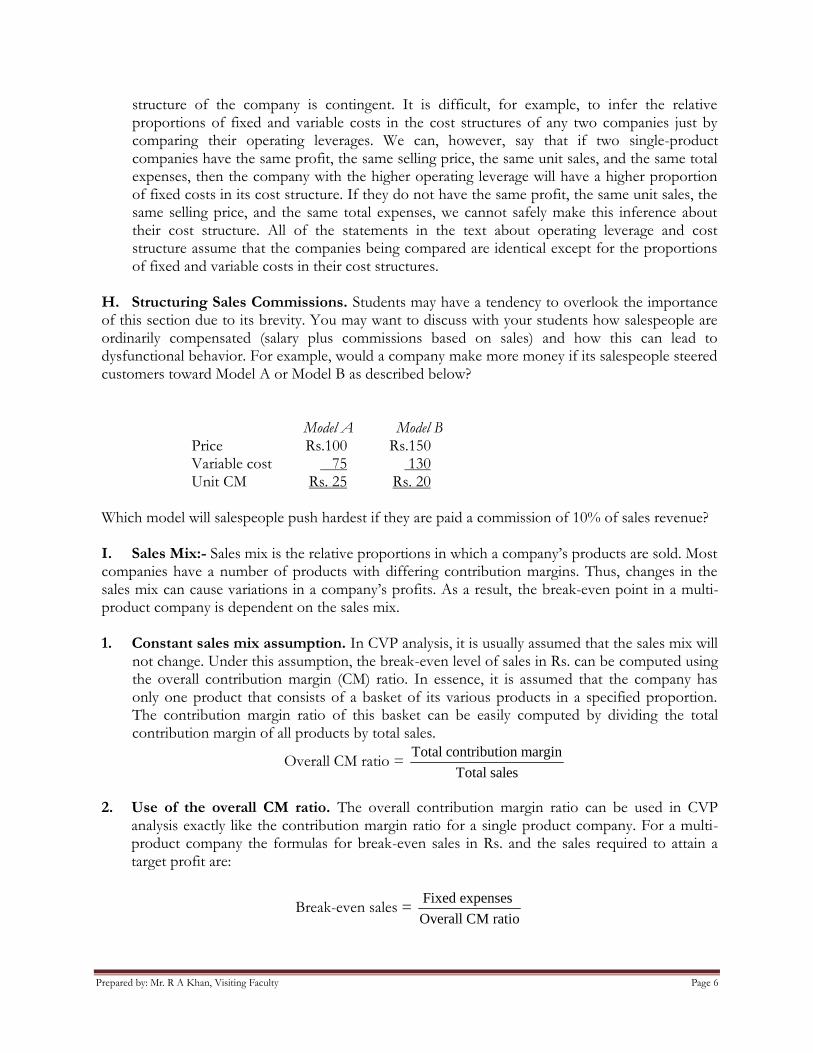
H. Structuring Sales Commissions. Students may have a tendency to overlook the importanceof this section due to its brevity. You may want to discuss with your students how salespeople areordinarily compensated (salary plus commissions based on sales) and how this can lead todysfunctional behavior. For example, would a company make more money if its salespeople steeredcustomers toward Model A or Model B as described below?
Model A Model BPrice Rs.100 Rs.150Variable cost 75 130Unit CM Rs. 25 Rs. 20
Which model will salespeople push hardest if they are paid a commission of 10% of sales revenue?
I. Sales Mix:- Sales mix is the relative proportions in which a company’s products are sold. Mostcompanies have a number of products with differing contribution margins. Thus, changes in thesales mix can cause variations in a company’s profits. As a result, the break-even point in a multi-product company is dependent on the sales mix.
1. Constant sales mix assumption. In CVP analysis, it is usually assumed that the sales mix willnot change. Under this assumption, the break-even level of sales in Rs. can be computed usingthe overall contribution margin (CM) ratio. In essence, it is assumed that the company hasonly one product that consists of a basket of its various products in a specified proportion.The contribution margin ratio of this basket can be easily computed by dividing the totalcontribution margin of all products by total sales.
Overall CM ratio = Total contribution margin
Total sales
2. Use of the overall CM ratio. The overall contribution margin ratio can be used in CVPanalysis exactly like the contribution margin ratio for a single product company. For a multi-product company the formulas for break-even sales in Rs. and the sales required to attain atarget profit are:
Break-even sales = Fixed expenses
Overall CM ratio
Prepared by: Mr. R A Khan, Visiting Faculty Page 7
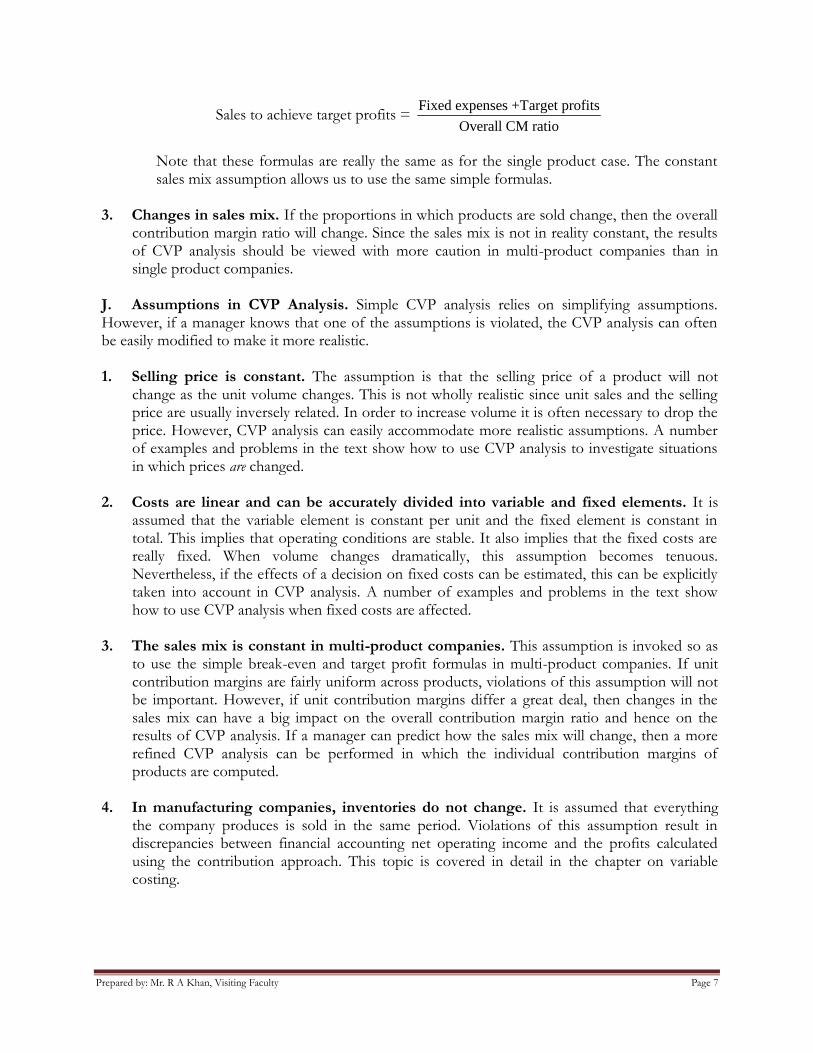
Sales to achieve target profits = Fixed expenses +Target profits
Overall CM ratio
Note that these formulas are really the same as for the single product case. The constantsales mix assumption allows us to use the same simple formulas.
3. Changes in sales mix. If the proportions in which products are sold change, then the overallcontribution margin ratio will change. Since the sales mix is not in reality constant, the resultsof CVP analysis should be viewed with more caution in multi-product companies than insingle product companies.
J. Assumptions in CVP Analysis. Simple CVP analysis relies on simplifying assumptions.However, if a manager knows that one of the assumptions is violated, the CVP analysis can oftenbe easily modified to make it more realistic.
1. Selling price is constant. The assumption is that the selling price of a product will notchange as the unit volume changes. This is not wholly realistic since unit sales and the sellingprice are usually inversely related. In order to increase volume it is often necessary to drop theprice. However, CVP analysis can easily accommodate more realistic assumptions. A numberof examples and problems in the text show how to use CVP analysis to investigate situationsin which prices are changed.
2. Costs are linear and can be accurately divided into variable and fixed elements. It isassumed that the variable element is constant per unit and the fixed element is constant intotal. This implies that operating conditions are stable. It also implies that the fixed costs arereally fixed. When volume changes dramatically, this assumption becomes tenuous.Nevertheless, if the effects of a decision on fixed costs can be estimated, this can be explicitlytaken into account in CVP analysis. A number of examples and problems in the text showhow to use CVP analysis when fixed costs are affected.
3. The sales mix is constant in multi-product companies. This assumption is invoked so asto use the simple break-even and target profit formulas in multi-product companies. If unitcontribution margins are fairly uniform across products, violations of this assumption will notbe important. However, if unit contribution margins differ a great deal, then changes in thesales mix can have a big impact on the overall contribution margin ratio and hence on theresults of CVP analysis. If a manager can predict how the sales mix will change, then a morerefined CVP analysis can be performed in which the individual contribution margins ofproducts are computed.
4. In manufacturing companies, inventories do not change. It is assumed that everythingthe company produces is sold in the same period. Violations of this assumption result indiscrepancies between financial accounting net operating income and the profits calculatedusing the contribution approach. This topic is covered in detail in the chapter on variablecosting.

Prepared by: Mr. R A Khan, Visiting Faculty Page 8
Q1: How is CVP Analysis Used?
(a) Contribution per unit = unit selling price – unit variable costs
(b) Breakeven point = activity level at which there is neither profit nor loss
=unitperonContributi
tsfixedTotal cos
(c) Contribution/sales (C/S) ratio = profit/volume (P/V) ratio
= %100Sales
onContributi
(d) Sales revenue at breakeven point = fixed costs ÷ C/S ratio
(e) Margin of safety (in units) = budgeted sales units – breakeven sales units
(f) Margin of safety (as %) Budgeted sales – breakeven sales × 100%Budgeted sales
(g) Sales volume to achieve a target profit Fixed cost + target profitContribution per unit
Exercise 1: A company manufactures a single product which has the following cost structure basedon a production budget of 10,000 units.Materials – 4 kg at Rs.3/kg Rs.12Direct labour – 5 hours at Rs.7/hour Rs.35Variable production overheads are recovered at the rate of Rs.8 per direct labour hour.Other costs incurred by the company are:
Rs.Factory fixed overheads 120,000Selling and distribution overheads 160,000Fixed administration overheads 80,000The selling and distribution overheads include a variable element due to a distribution cost of Rs.2per unit.
The fixed selling price of the unit is Rs.129.
Required:(a) Calculate how many units have to be sold for the company to breakeven.
(b) Calculate the sales revenue which would give a net profit of Rs.40, 000.
(c) If the company could buy in the units instead of manufacturing them, calculate how much itwould be prepared to pay if both:
(i) Estimated sales for next year are 9,500 units at Rs.129 each; and
(ii) Rs.197, 500 of fixed selling, distribution and administrative overheads would still beincurred even if there is no production (all other fixed overheads would be saved).

Prepared by: Mr. R A Khan, Visiting Faculty Page 9
BREAK-EVEN CHARTThe Graphical Approach for Single ProductThe second way to find the break-even is to use the graphical method. The graphical method isbased on the break-even chart, a graphical representation of cost-volume-profit relationships and thebreak-even point. It is an attempt to help management in their understanding of these relationshipsand so enable them to decide on the optimum level of output
Example 1A new product has the following sales and cost data.Selling price Rs.60 per unitVariable costs Rs.40 per unitFixed costs Rs.25,000 per month
Forecast sales 1,800 units per monthRequired:Prepare a breakeven chart using the above data.
Solution:
Breakeven Analysis for Multiple ProductsA major assumptionOrganisations typically produce and sell a variety of products and services. To perform breakevenanalysis in a multi-product organisation, however, a constant product sales mix must beassumed. In other words, we have to assume that whenever x units of product A are sold, y unitsof product B and z units of product C are also sold.
Example 2PL produces and sells two products. The M sells for Rs.7 per unit and has a total variablecost of Rs.2.94 per unit, while the N sells for Rs.15 per unit and has a total variable costof Rs.4.5 per unit. The marketing department has estimated that for every five units ofM sold, one unit of N will be sold. The organization’s fixed costs total Rs.36,000.Required: Calculate the breakeven point for PL.Solution:1. Calculate contribution per unit
M N

Prepared by: Mr. R A Khan, Visiting Faculty Page 10
Rs. per unit Rs. per unitSelling price 7.00 15.00Variable cost 2.94 4.50Contribution 4.06 10.50
2. Calculate contribution per mix= Rs.4.06 x 5 + Rs.10.50 x 1 = Rs.30.80
3. Calculate the breakeven point in terms of the number of mixes= fixed costs / contribution per mix= Rs.36,000 / Rs.30.80= 1,169 mixes (rounded)
4. Calculate the breakeven point in terms of the number of units of products= (1,169 x 5) 5,845 units of M and (1,169 x 1) 1,169 units of N
5. Calculate the breakeven point in terms of revenue= (5,845 x Rs.7) + (1,169 x Rs.15)= Rs.40,915 of M and Rs.17,535 of N= Rs.58,450 in total
Exercise 2Alpha manufactures and sells three products, the beta, the gamma and the delta. Relevantinformation is as follows.
Beta Gamma DeltaRs. per unit Rs. per unit Rs. per unit
Selling price 135.00 165.00 220.00Variable cost 73.50 58.90 146.20
Total fixed costs are Rs.950,000.
An analysis of past trading patterns indicates that the products are sold in the ratio 3:4:5
Required:Calculate the breakeven point for Alpha.
Contribution to sales (C/S) ratio for multiple products The breakeven point in terms of sales revenue can be calculated as fixed costs /
average C/S ratio. Any change in the proportions of products in the mix will change the contribution per
mix and the average C/S ratio and hence the breakeven point. You should know that the C/S ratio is sometimes called the profit/volume ratio or P/V
ratio.Example 3As example 2 above, we can calculate the breakeven point of PL as follows.

Prepared by: Mr. R A Khan, Visiting Faculty Page 11
Solution:1. Calculate revenue per mix
= (5 x Rs.7) + (1 x Rs.15) = Rs.50
2. Calculate contribution per mix (see example 2)= Rs.4.06 x 5 + Rs.10.50 x 1 = Rs.30.80
3. Calculate average C/S ratio= Rs.30.80/Rs.50.00 x 100%= 61.6%
4. Calculate the breakeven point= fixed costs ÷ C/S ratio= Rs.36,000 ÷ 0.616= Rs.58,443 (rounded)
5. Calculate revenue ratio of mix= (5 x Rs.7) : (1 x Rs.15)= 35 : 15 or 7 : 3
6. Calculate breakeven salesM = Rs.58,442 x 7/10 = Rs.40,909 (rounded)N = Rs.58,442 x 3/10 = Rs.17,533 (rounded)
Exercise 3Calculate the breakeven sales revenue of product Beta, Gamma and Delta (see Exercise 2above) using the approach shown in Example 3.
Points to Bear in MindAny change in the proportions of products in the mix will change the contribution permix and the average C/S ratio and hence the breakeven point.(a) If the mix shifts towards products with lower contribution margins, the
breakeven point (in units) will increase and profits will fall unless there is acorresponding increase in total revenue.
(b) A shift towards products with higher contribution margins without acorresponding decrease in revenues will cause an increase in profits and a lowerbreakeven point.
(c) If sales are at the specified level but not in the specified mix, there will beeither a profit or a loss depending on whether the mix shifts towardsproducts with higher or lower contribution margins.
Margin of safety for multiple productsThe margin of safety for a multi-product organisation is equal to the budgeted sales in thestandard mix less the breakeven sales in the standard mix. It may be expressed as a percentageof the budgeted sales.

Prepared by: Mr. R A Khan, Visiting Faculty Page 12
Example 4BA produces and sells two products. The W sells for Rs.8 per unit and has a total variablecost of Rs.3.80 per unit, while the R sells for Rs.14 per unit and has a total variable costof Rs.4.20. For every five units of W sold, six units of R are sold. BA's fixed costs areRs.43,890 per period.Budgeted sales revenue for next period is Rs.74,400, in the standard mix.Required:Calculate the margin of safety in terms of sales revenue and also as a percentage ofbudgeted sales revenues.Solution:
1. Calculate contribution per unitW R
Rs. per unit Rs. per unitSelling price 8.00 14.00Variable cost 3.80 4.20Contribution 4.20 9.80
2. Calculate contribution per mix= Rs.4.20 x 5 + Rs.9.80 x 6 = Rs.79.80
3. Calculate the breakeven point in terms of the number of mixes= fixed costs / contribution per mix= Rs.43,890 / Rs.79.80= 550 mixes
4. Calculate the breakeven point in terms of the number of units of products= (550 x 5) 2,750 units of W and (550 x 6) 3,300 units of R
5. Calculate the breakeven point in terms of revenue= (2,750 x Rs.8) + (3,300 x Rs.14)= Rs.22,000 of W and Rs.46,200 of R= Rs.68,200 in total
6. Calculate the margin of safety= budgeted sales – breakeven sales= Rs.74,400 – Rs.68,200= Rs.6,200 sales in total, in the standard mix= Rs.6,200 / Rs.74,400 x 100%= 8.3% of budgeted sales
Target profits for multiple productsThe number of mixes of products required to be sold to achieve a target profit is calculated as:
(fixed costs + required profit)/contribution per mix.
Example 5An organisation makes and sells three products, F, G and H. The products are sold in the

Prepared by: Mr. R A Khan, Visiting Faculty Page 13
proportions F:G:H = 2:1:3. The organisation's fixed costs are Rs.80,000 per month anddetails of the products are as follows.
Selling price Variable costProduct Rs. per unit Rs. per unitF 22 16G 15 19H 19 13
The organisation wishes to earn a profit of Rs.52,000 next month. Calculate the requiredsales value of each product in order to achieve this target profit.Solution:1. Calculate contribution per unit
F G HRs. per unit Rs. per unit Rs. per unit
Selling price 22 15 19Variable cost 16 12 13Contribution 6 3 6
2. Calculate contribution per mix= (Rs.6 x 2) + (Rs.3 x 1) + (Rs.6 x 3)= Rs.33
3. Calculate the required number of mixes= (Fixed costs + required profit)/contribution per mix= (Rs.80,000 + Rs.52,000)/Rs.33= 4,000 mixes
4. Calculate the required sales in terms of the number of units of the products andsales revenue of each product
Product Units Selling price Sales revenuerequired
Rs. per unit Rs.F 4,000 x 2 8,000 22 176,000G 4,000 x 1 4,000 15 60,000H 4,000 x 3 12,000 19 228,000
Total 464,000
The sales revenue of Rs.464,000 will generate a profit of Rs.52,000 if the products aresold in the mix 2:1:3.
Alternatively the C/S ratio could be used to determine the required sales revenue for aprofit of Rs.52,000. The method is again similar to that demonstrated earlier whencalculating the breakeven point.
Example 6Using the information as Example 5, calculate the required sales of each products byusing the C/S ratio.
Prepared by: Mr. R A Khan, Visiting Faculty Page 14
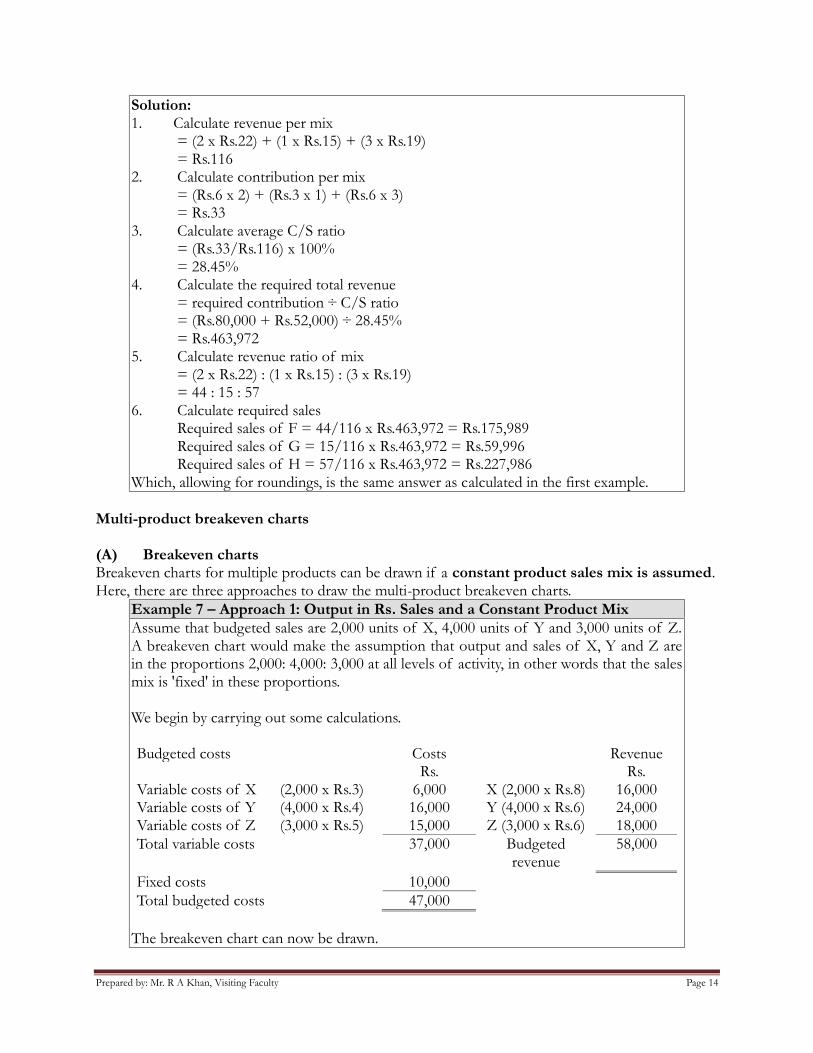
Solution:1. Calculate revenue per mix
= (2 x Rs.22) + (1 x Rs.15) + (3 x Rs.19)= Rs.116
2. Calculate contribution per mix= (Rs.6 x 2) + (Rs.3 x 1) + (Rs.6 x 3)= Rs.33
3. Calculate average C/S ratio= (Rs.33/Rs.116) x 100%= 28.45%
4. Calculate the required total revenue= required contribution ÷ C/S ratio= (Rs.80,000 + Rs.52,000) ÷ 28.45%= Rs.463,972
5. Calculate revenue ratio of mix= (2 x Rs.22) : (1 x Rs.15) : (3 x Rs.19)= 44 : 15 : 57
6. Calculate required salesRequired sales of F = 44/116 x Rs.463,972 = Rs.175,989Required sales of G = 15/116 x Rs.463,972 = Rs.59,996Required sales of H = 57/116 x Rs.463,972 = Rs.227,986
Which, allowing for roundings, is the same answer as calculated in the first example.
Multi-product breakeven charts
(A) Breakeven chartsBreakeven charts for multiple products can be drawn if a constant product sales mix is assumed.Here, there are three approaches to draw the multi-product breakeven charts.
Example 7 – Approach 1: Output in Rs. Sales and a Constant Product MixAssume that budgeted sales are 2,000 units of X, 4,000 units of Y and 3,000 units of Z.A breakeven chart would make the assumption that output and sales of X, Y and Z arein the proportions 2,000: 4,000: 3,000 at all levels of activity, in other words that the salesmix is 'fixed' in these proportions.
We begin by carrying out some calculations.
Budgeted costs Costs RevenueRs. Rs.
Variable costs of X (2,000 x Rs.3) 6,000 X (2,000 x Rs.8) 16,000Variable costs of Y (4,000 x Rs.4) 16,000 Y (4,000 x Rs.6) 24,000Variable costs of Z (3,000 x Rs.5) 15,000 Z (3,000 x Rs.6) 18,000Total variable costs 37,000 Budgeted
revenue58,000
Fixed costs 10,000Total budgeted costs 47,000
The breakeven chart can now be drawn.

Prepared by: Mr. R A Khan, Visiting Faculty Page 15
The breakeven point is approximately Rs.27,500 of sales revenue. This may either beread from the chart or computed mathematically.(a) The budgeted C/S ratio for all three products together is contribution/sales =
Rs.(58,000 – 37,000)/Rs.58,000 = 36.21%.(b) The required contribution to break even is Rs.10,000, the amount of fixed costs.
The breakeven point is Rs.10,000/36.21% = Rs.27,500 (approx) in sales revenue.The margin of safety is approximately Rs.(58,000 – 27,500) = Rs.30,500.
Example 8 – Approach 2: Products in SequenceThe products could be plotted in a particular sequence (say X first, then Y, then Z).Using the data from Approach 1, we can calculate cumulative costs and revenues asfollows.
Product Cumulative units Cumulative costs Cumulative revenueRs. Rs.
Nil 10,000 NilX (2,000 units) 2,000 16,000 16,000Y (4,000 units) 6,000 32,000 40,000Z (3,000 units) 9,000 47,000 58,000
The breakeven chart can now be drawn.

Prepared by: Mr. R A Khan, Visiting Faculty Page 16
In this case the breakeven point occurs at 2,000 units of sales (2,000 units of product X).The margin of safety is roughly 4,000 units of Y and 3,000 units of Z.
Example 9 – Approach 3: Output in Terms of % of Forecast Sales and a ConstantProduct MixThe breakeven point can be read from the graph as approximately 48% of forecast sales(Rs.30,000 of revenue).
Alternatively, with contribution of Rs.(58,000 – 37,000) = Rs.21,000, one percent offorecast sales is associated with Rs.21,000/100 = Rs.210 contribution.
Breakeven point (%) = fixed costs/contribution per 1%
= Rs.10,000/Rs.210 = 47.62%
∴Margin of safety = (100 – 47.62) = 52.38%

Prepared by: Mr. R A Khan, Visiting Faculty Page 17
(B) Multi-product P/V chartsThe same information could be shown on a P/V chart.
Example 10Same information as Example 7,Product Contribution Sales C/S ratio
Rs. Rs. %X 10,000 16,000 62.50Y 8,000 24,000 33.33Z 3,000 18,000 16.67Total 21,000 58,000 36.21
By convention, the products are shown individually on a P/V chart from left to right,in order of the size of their C/S ratio. In this example, product X will be plotted first,then product Y and finally product Z. A dotted line is used to show the cumulativeprofit/loss and the cumulative sales as each product's sales and contribution in turnare added to the sales mix.Product Cumulative sales Cumulative profit
Rs. Rs.X 16,000 (Rs.16,000 –
Rs.16,000)-
X and Y 40,000 8,000X, Y and Z 58,000 11,000
You will see on the graph which follows that these three pairs of data are used to plotthe dotted line, to indicate the contribution from each product. The solid line which joinsthe two ends of this dotted line indicates the average profit which will be earned fromsales of the three products in this mix.
The diagram highlights the following points.
Prepared by: Mr. R A Khan, Visiting Faculty Page 18
(a) Since X is the most profitable in terms of C/S ratio, it might be worthconsidering an increase in the sales of X, even if there is a consequent fall in thesales of Z.
(b) Alternatively, the pricing structure of the products should be reviewed and adecision made as to whether the price of product Z should be raised so as toincrease its C/S ratio (although an increase is likely to result in some fall in salesvolume).
The multi-product P/V chart therefore helps to identify the following.(a) The overall company breakeven point.(b) Which products should be expanded in output and which, if any, should be
discontinued.(c) What effect changes in selling price and sales volume will have on the company's
breakeven point and profit.
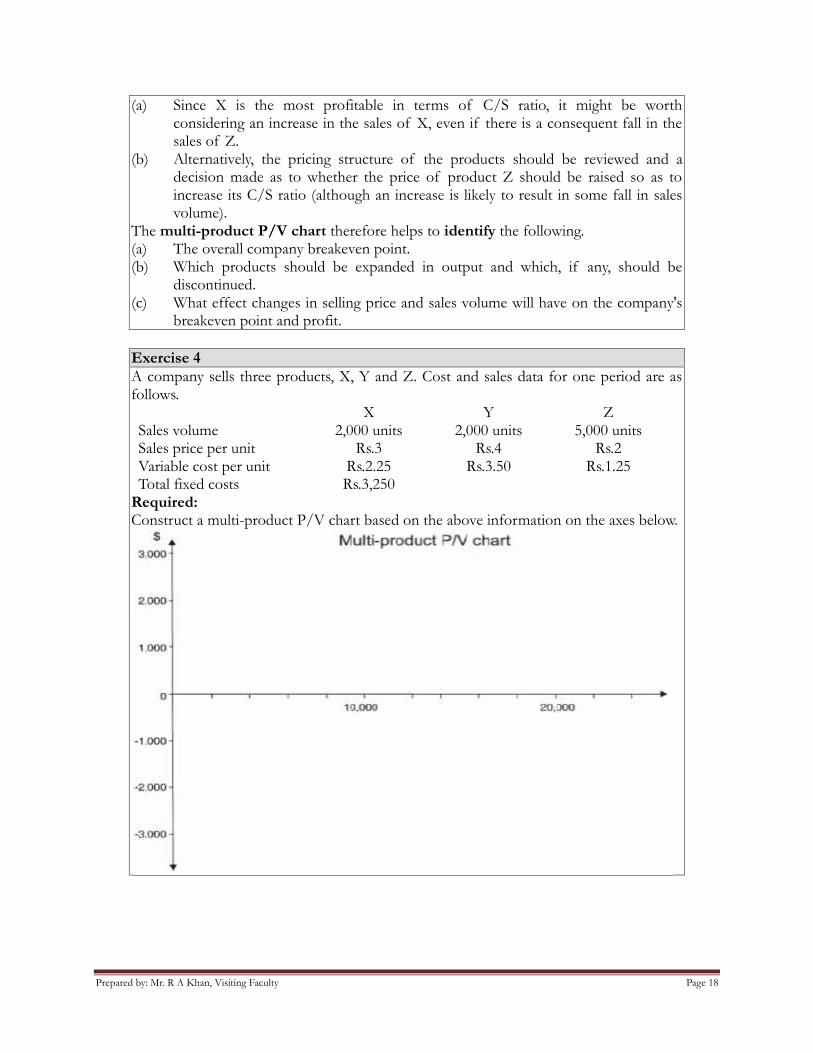
Exercise 4A company sells three products, X, Y and Z. Cost and sales data for one period are asfollows.
X Y ZSales volume 2,000 units 2,000 units 5,000 unitsSales price per unit Rs.3 Rs.4 Rs.2Variable cost per unit Rs.2.25 Rs.3.50 Rs.1.25Total fixed costs Rs.3,250
Required:Construct a multi-product P/V chart based on the above information on the axes below.

Prepared by: Mr. R A Khan, Visiting Faculty Page 19
Further Aspects of CVP AnalysisThe usefulness of CVP analysis is restricted by its unrealistic assumptions, such as constant salesprice at all levels of activity. However CVP has the advantage of being more easily understood bynon-financial managers due to its graphical depiction of cost and revenue data.Limitations:
(a) It is assumed that fixed costs are the same in total and variable costs are thesame per unit at all levels of output. This assumption is a great simplification.(i) Fixed costs will change if output falls or increases substantially (most fixed
costs are step costs).(ii) The variable cost per unit will decrease where economies of scale are made
at higher output volumes, but the variable cost per unit will also eventuallyrise when diseconomies of scale begin to appear at even higher volumes ofoutput (for example the extra cost of labour in overtime working).
(b) The assumption is only correct within a normal range or relevant range of output. Itis generally assumed that both the budgeted output and the breakeven point liewithin this relevant range.
(c) It is assumed that sales prices will be constant at all levels of activity. This maynot be true, especially at higher volumes of output, where the price may have to bereduced to win the extra sales.
(d) Production and sales are assumed to be the same, so that the consequences ofany increase in inventory levels or of 'de-stocking' are ignored.
(e) Uncertainty in the estimates of fixed costs and unit variable costs is oftenignored.
Advantages:(a) Graphical representation of cost and revenue data (breakeven charts) can be more
easily understood by non-financial managers.(b) A breakeven model enables profit or loss at any level of activity within the range
for which the model is valid to be determined, and the C/S ratio can indicate therelative profitability of different products.
(c) Highlighting the breakeven point and the margin of safety gives managers someindication of the level of risk involved.
Examination Style Questions
Question 1 – Breakeven Chart with Increases in Fixed Costs(a) Identify and discuss briefly five assumptions underlying cost-volume-profit analysis.(b) A local authority, whose area include a holiday resort situated on the east coast, operates, for
30 weeks each year, a holiday home which is let to visiting parties of children in care fromother authorities. The children are accompanied by their own house mothers who supervisethem throughout their holiday. From six to fifteen guests are accepted on terms of ₹ 100 perperson per week. No differential charges exist for adults and children.
Weekly costs incurred by the host authority are:₹ per guest
Food 25Electricity for heating and cooking 3Domestic (laundry, cleaning, etc.) expenses 5

Prepared by: Mr. R A Khan, Visiting Faculty Page 20
Use of minibus 10
Seasonal staff supervise and carry out the necessary duties at the home at a cost of ₹ 11,000for the 30-week period. This provides staffing sufficient for six to ten guests per week but ifeleven or more guests are to be accommodated, additional staff at a total cost of ₹ 200 perweek are engaged for the whole of the 30-week period.Rent, including rates for the property, is ₹ 4,000 per annum and the garden of the home ismaintained by the council’s recreation department which charges a nominal fee of ₹ 1,000 perannum.Required:
(i) Tabulate the appropriate figures in such a way as to show the break-even point(s) andto comment on your figures.
(ii) Draw, on the graph paper provided, a chart to illustrate your answer to (b)(i) above.
Question 2 – Multi-product Profit-volume GraphJK Limited has prepared a budget for the next 12 months when it intends to make and sell fourproducts, details of which are shown below:
Product Sales in units Selling price per unit Variable cost per unit(000) ₹ ₹
J 10 20 14.00K 10 40 8.00L 50 4 4.20M 20 10 7.00
Budgeted fixed costs are ₹ 240,000 per annum and total assets employed are ₹ 570,000.Required:(a) Calculate the total contribution earned by each product and their combined total
contributions.(b) Plot the data of your answer to (a) above in the form of a contribution to sales graph (or P/V
graph) on the graph paper provided.(c) Explain your graph to management, to comment on the results shown and to state the break-
even point.(d) Describe briefly three ways in which the overall contribution to sales ratio could be improved.
Question 3You are the assistant management accountant of QXY plc, a food manufacturer. The Board ofDirectors is concerned that its operational managers may not be fully aware of the importance ofunderstanding the costs incurred by the business and the effect that this has on their operationaldecision making. In addition, the operational managers need to be aware of the implications of theirpricing policy when trying to increase the volume of sales.You are scheduled to make a presentation to the operational managers tomorrow to explain to themthe different costs that are incurred by the business, the results of some research that has beenconducted into the implications for pricing and the importance of understanding these issues fortheir decision making. The diagram on the next page has already been prepared for the presentation.Required:

Prepared by: Mr. R A Khan, Visiting Faculty Page 21
You are required to interpret the diagram and explain how it illustrates issues that the operationalmanagers should consider when making decisions. (Note: your answer must include explanations ofthe Sales Revenue, Total Cost and Fixed Cost lines, and the significance of each of the activity levelslabelled A, B, C, D.)

Prepared by: Mr. R A Khan, Visiting Faculty Page 22

Prepared by: Mr. R A Khan, Visiting Faculty Page 23
Question 4RDF Ltd offers four services to television companies The number of services provided is measuredin service units and details of RDF Ltd's draft budget for its year ending 30 June 2005 are as follows.
Service K Service L Service M Service NNo. of service units 1,000 2,300 1,450 1,970Selling price per unit (Rs.) 18 16 12 20Variable cost per unit (Rs.) 8 10 13 13Fixed cost per unit (Rs.) 2 3 2 4
The budgeted level of activity shown in the table above has been based on fully meeting theforecasted market demand for each type of service.The following chart has been prepared based on the draft budget above.
Required:(a) Explain the meaning of the values shown as points A and B on the chart. (Note. Calculations
are not required.)(b) Further investigation into the nature of the fixed costs has shown that some of those shown
in the original budget are incurred as a direct result of providing specific services as follows.Rs.
Service K 4,400Service L 3,700Service M NilService N 2,650
The remaining budgeted fixed costs are general fixed costs that will be incurred regardless of thetype and number of services provided.RDF Ltd entered into a three-year contract in June 2002 which requires it to provide 500 units ofservice M per year or suffer significant financial penalties. These services are included in the
Prepared by: Mr. R A Khan, Visiting Faculty Page 24
budgeted demand.Required:(i) Evaluate the financial viability of each of the four services currently provided.(ii) Recommend the operating plan that will maximise profit for the year ended 30 June
2005 and state the resulting profit. Explain the assumptions that led to your decisionand other factors that should be considered.
(iii) Calculate the overall breakeven sales value for the operating plan you haverecommended in answer to (b)(ii), stating clearly the assumptions made in yourcalculations.
(iv) Comment on any limitations of using breakeven analysis for decision making purposes.