unit trust performance measurement: the snail trail … papers/jssh vol. 8 (2) sep. 20… · the...
TRANSCRIPT

Pertanika J. Soc. Sci. & Hum. 8(2): 103-114 (2000) ISSN: 0128-7702© Universiti Putra Malaysia Press
Unit Trust Performance Measurement: the Snail Trail Approach
TAN YEN KENGDepartment of Accounting and Finance, Faculty of Economics and Management,
Universiti Putra Malaysia, 43400 UPMt Serdang Selangor, Malaysia
Keywords: unit trust, Snail-Trail analysis, equity growth funds
ABSTRAKUnit amanah saham merupakan skim pelaburan yang diuruskan oleh pengurus atau organisasidana dengan menawarkan pelbagai portfolio kepada pelabur. Jangka masa pelaburan biasanyabergantung kepada matlamat amanah saham itu sendiri. Memandangkan ia melibatkan jangkamasa pemegangan yang panjang dan mendatangkan kesan berlipat-ganda, perbezaan kadarpulangan tahunan yang meskipun kecil juga amat merugikan pelabur. Oleh yang demikian,pernilaian terperinci diperlukan terhadap pencapaian amanah saham di samping pengurus danasebelum perjanjian dibuat. Seperti yang diketahui bahawa kadar pulangan yang tinggi pada satutempoh tunggal boleh mengelirukan jika kajian terhadap kemudahubahan pulangan pada masalampau tidak diambil kira. Walaupun kaedah risiko pulangan terlaras digunakan untukmenyelesaikan masalah ini, namun hanya merupakan analisis ukuran pencapaian yang "snapshot"sahaja. Analisis Snail Trail telah diperkenalkan untuk menyelesaikan kelemahan ini danmemberikan gambaran yang lebih menyeluruh terhadap pencapaian para pengurus dana.
Kajian ini mengambil kira 17 buah ekuiti pertumbuhan dana. Analisis Snail Trail menunjukkankedua-dua amanah saham Asia Progress dan KLMF Growth telah memperlihatkan kemajuan daripencapaian pulangan tinggi berisiko tinggi dan pulangan rendah berisiko rendah kepadapencapaian tinggi berisiko rendah. Sementara, tiga buah dana didapati berada di bawah paraspurata seperti yang ditunjukkan oleh gambar rajah Snail Trail. Ketiga-tiga dana ini terdiridaripada BHLB High Growth, KLMF Industry dan KLMF Aggressive Growth. Pencapaian dana-dana telah merosot prestasi sepanjang masa kini dari pulangan tinggi berisiko rendah kepadapulangan rendah berisiko tinggi. Empat buah amanah saham yang terdiri daripada SBB PremiumCapital, HLB Growth, OSK Equity and RHB Capital pula menunjukkan pencapaian risiko-pulangan dana yang tekal.
ABSTRACTUnit trust is an investment scheme that offers investors a well diversified portfolio managed bya professional fund manager or organisation. The investment horizon is medium to long termdepending on the stipulated objective of the unit trust. Due to the long holding period andcompounding effect, a slight difference in the annual rate of returns can be very detrimental tothe investor. Therefore the performance of a unit trust as well as the fund manager must becarefully evaluated before committing to the fund. As we know, a high rate of returns in a singleperiod can be very misleading if we do not study the volatility of the historical returns. Riskadjusted returns offer a solution to this problem, but this is only a "snapshot" performancemeasurement analysis. Snail-Trail analysis was introduced to overcome these drawbacks andbetter portray the dynamic history of fund manager's performance.
17 equity growth funds were selected for the purpose of this study. From the snail-Ttrailanalysis, two promising unit trusts were found to be Asia Progress and KLMF Growth. Both fundshave shown improvement in relative performance from the "high return high risk" and "lowreturn low risk" quadrant moving up to "high return low risk", the most favourable, quadrant.Meanwhile, three funds have been classified as below average as the snail trail diagrams showndeteriorating performance. These three funds are BHLB High Growth, KLMF Industry, andKLMF Aggressive Growth, the performance of which has been falling rapidly over recent years,

Tan Yen Keng
from the "high return low risk" quadrant to "low return high risk" quadrant. Four unit trustsshowing the most consistency in fund risk-return performance are SBB Premium Capital, HLBGrowth, OSK Equity and RHB Capital.
INTRODUCTIONUnit trust is an investment vehicle that poolsmoney from investors and the pooled fund willthen be invested in a diversified portfolio. Thefund will be managed by professional fundmanagers or asset management organisations onbehalf of unit trusts investors. Investors canselect the unit trust based on their investmentobjectives, investment strategy and risk tolerancelevel.
In the selection process, besides the abovementioned investor characteristics, the relativeperformance of the unit trust also plays animportant role. Here comes the question: whatdo you refer to when you want to know theperformance of a particular fund? We used torefer to the "league table" showing various unittrusts ranked according to their returns, or theadvertisements which highlight the impressivehigh rates of return over the last "xM months oryears.
A high rate of returns in a single period canbe very misleading if we do not study the volatilityof the historical returns. Therefore the risk-return tradeoffs must be studied. A diagramwith standard deviation of the returns on thehorizontal axis as a proxy for risk and the rate ofreturn on the vertical axis can be plotted. Thisdiagram is a step forward and allows explicitrisk-return tradeoffs to be made. This traditionalrisk-return diagram presents a single or staticsnapshot in time over a set period. As discussedin Balzer (1991), to further improve the diagram,multiple points, each representing a set of risk-return for a specific period can be plotted onthe same diagram. This diagram portrays adynamic history of a single fund manager'sperformance. However, this presentation isuseful only to show how a fund manager'sperformance has varied over time. It fails toreveal how much of that performance is due tothe manager's unique skill and how much is dueto fortuitous market movements enjoyed by mostmanagers.
A very good indication of the skillcomponent can be obtained by constructing arelative risk-return history, where the medianrisk and median return (for an appropriateuniverse of fund managers) are subtracted from
the results. This process highlights a manager'svalue-adding and risk-reduction skills relative toits peer group.
Unlike the traditional risk-return diagram,the snail trail approach not only shows resultsrelative to the median or average fund manager,but is a robust tool for comparing fund managers'performance.
METHODOLOGY
The relationship between risk and returns canbe graphically illustrated. Relative return isplotted on the vertical axis and relative risk isplotted on the horizontal axis.
The first point on the risk-return graph isplotted as usual. The beginning and end pointsof the period are then rolled forward by onequarter and the return and risk for the newperiod are calculated and plotted on the samegraph. By repeating this process, a trajectory istraced out dynamically in risk-return space.
After the compound average annual returnsover the period (4 quarters) are calculated, themedian returns for the same period for theuniverse of pooled funds are svibtracted to givethe relative returns.
To measure risk, there are a number ofalternative computations. As in Grinblatt et al(1994) and Woodward (1983), the mostcommonly accepted measure of risk, standarddeviation of returns, has been chosen for theseanalysis. The standard deviation of quarterlyreturns over the period is calculated andannualised using the standard -*4 factor (whichimplicitly assumes a random walk stochasticmodel for the return series). The relative risk isthen calculated by subtracting the medianstandard deviation for the group of fundmanagers and is plotted on the horizontal axis.
It is important to note that the horizontalaxis is not the standard deviation of the relativereturns, but the relative standard deviation ofthe total returns. Use of the former would showhow well a particular fund manager tracked themedian. This might or might not be a usefulmeasure depending on one's purpose. A lowfigure would simply indicate that the managerhas nicely tracked the median, which itself mightbe undesirably volatile. On the other hand, a
104 PertanikaJ. Soc. Sci. & Hum. Vol. 8 No. 2 2000

Unit Trust Performance Measurement: the Snail Trail Approach
low figure for relative standard deviation, asdefined in this paper, implies low volatility ofreturns in the absolute sense, which is clearlydesirable.
After the first point is plotted, the period isrolled forward one quarter and the calculationis repeated. One of the major advantages of theabove rolling approach is that, all results arerevealed — good or bad. The performancefigures used in this paper are "after fee**.
Fairly obvious, desirable above medianreturns appear above the horizontal medianreturn line and less-desirable below-medianresults appear below it. Similarly, below-medianvolatility appears on the left of the diagram andabove median volatility on the right. The mostdesirable region is on the top left "high returnlow risk" (HL) quadrant, while the least desirableis the bottom right "low return high risk" (LH)quadrant.
Irrespective of the absolute position of a setof points on the graph, the tightness of theirgrouping is a direct indication of the consistencyof a manager's risk-return performance.
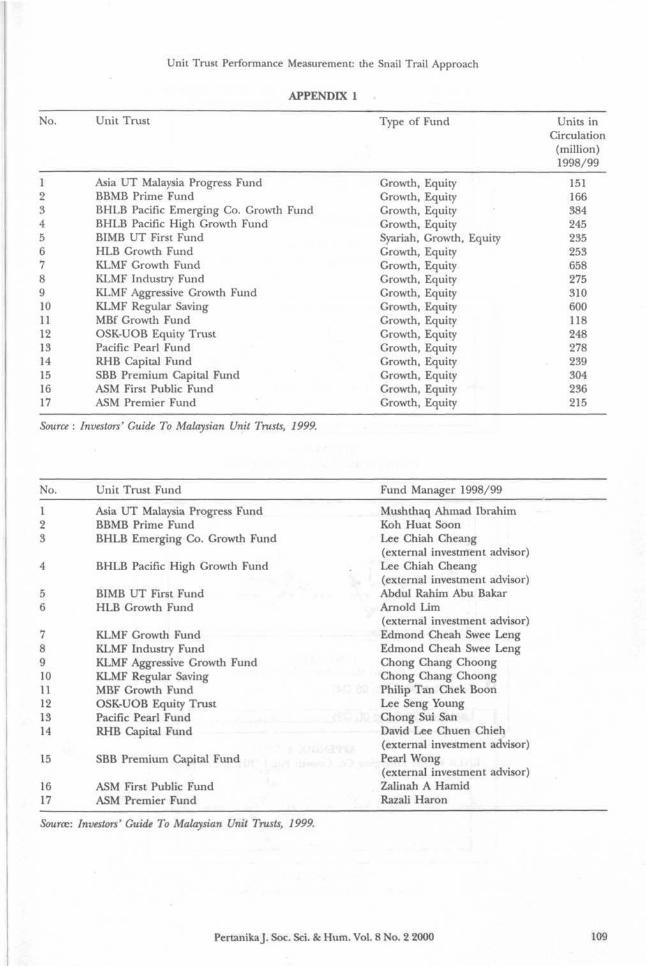
Seventeen unit trust funds were selected forthe purpose of this study. These funds arecategorised as growth and equity fund in Chong(1999). These funds are from EPF approvedunit trust companies. Only funds with morethan 100 million units in circulation will beincluded. By definition, a growth fundconcentrates on investing in securities withgrowth potential. Growth may come in the formof the invested company's growth or expansion,and capital appreciation. Growth fund, also knownas equity fund, invests mainly in shares traded onthe stock exchange. Equity funds can be madeup of local shares, shares of unlisted companies,or shares listed on foreign stock exchanges.
FINDINGS AND DISCUSSIONSOne way of visualising the relative risk-returnrelationship is to think of fixing the median"crosshairs" on a conventional risk-returndiagram in the centre of the page and thenwatching how a manager moves in relation tothem as the period of analysis is rolled forwardin time.
Three funds with distinctive relative risk-return performance history have been selectedfor discussion.
BHLB Pacific High Growth Fund
With the objective of achieving high capitalgains through investments in companies withhigh growth prospects as stated in Chong (1999),BHLB HGrowth allocated more than 70% (73%as of 14 April 99) of the total investment inequity assets.
Fig. 1: The dynamic snail trail diagramdemonstrates the relative 4-quarter return/riskperformance history of BHLB HGrowth. Priorto 96Q3, BHLB HGrowth was in the "low returnlow risk" quadrant. However, the relativeperformance of BHLB HGrowth improvedgradually and moved up to the upper leftquadrant, which is the "high return low risk"quadrant. The snail trail diagram indicatedBHLB HGrowth fund manager has read theAsian financial crisis right. This outstandingrelative performance exhibits the superior risk-reduction and value-added skills of BHLBHGrowth fund manager compared to the peergroup; however the good performance was notupheld. The performance history exhibits poorperformance in the post-crash period, when thesnail trail descended from the "high return lowrisk" quadrant to "low return low risk" quadrant,and further fell into "low return high risk"quadrant in 1999.
As a whole, from the snail trail diagram, wecan conclude that the performance of BHLBHGrowth in pre- and post-crisis period was notvery outstanding (i.e. in the "low risk low return"quadrant and "low return high risk" quadrant).But performance history has shown the ability ofthe fund manager in lowering the risk as well asimproving returns during the economic crisisindicating the superior capability of the fundmanager in countering the financial turmoil.
KLMF Regular Saving
Fig. 2. From the snail trail diagram, we can seethat the relative performance history of KLMF RSaving is not very consistent over time. This isa very good example of dramatic changes inperformance. In 1996, KLMF R Saving was inthe "low return high risk" quadrant, and lateradvanced into the "high return high risk"quadrant. During the early stage of the financialcrisis, KLMF R Saving was in the "high returnlow risk" quadrant. However, the favourableperformance was not maintained very long. After(98Q1-98Q4), KLMF R Saving performance has
PertanikaJ. Soc. Sci. & Hum. Vol. 8 No. 2 2000 105

Tan Yen Keng
-14
High Return Low Risk (HL)Favourable Performance
V\0% -9.0%
Low Return Low Risk (LL)Average Performance
Relative Return
40.0%
^^Jf 97Q1-97Q4-^^"^ 1 20.0%
/ 4
\ \ / \o.o%>»j£8Ql-98QV
N^HI \96Ql-96Q4\
-20.0%*
-40.0% •
99Q1-99Q4
99Q3-O0Q2
High Return High Risk (IIH)Average Performance
6.0% 11.0%Relative Risk
Low Return High Risk (LH)Unfavourable Performance
Fig. 1: Relative risk/return history (BHLB High Growth Fund)
High Return Low Risk (HL)Favourable Performance
Relative Return
40 0%H i g h R e t u r n H i g h Risk ( i l l l )
t Performance
Relative Risk
Low Return Low Risk (LL)Average Performance
Low Return High Risk (Ml)Unfavourable Performance
Fig. 2: Relative risk/return history (KLMF Regular Saving)
been falling, from the "low return low risk"quadrant to "low return high risk" or theunfavourable quadrant. This example showsthat the single snapshot approach can be verymisleading especially when the single periodsuperior performance during the financial crisisis highlighted and promoted to the public.
As KLMF R Saving's objective is to achievelong-term capital growth while maintaining asteady growth in income, it invested heavily infixed income securities (56%) and the moneymarket (20%) compared to other growth funds
in this study. With more than 70% of the totalfunds invested in non-equity instruments duringthe financial crisis, KLMF R Saving was able tominimise risk while securing desirable returnson investment. This might explain the KLMF RSaving performance history plots being in theabove-median return quadrant with belowaverage risk during the economic slow down.The decision of the KLMF R Saving fundmanager to reallocate the assets (from equity tobond and cash) during the crisis added value tothe fund as well as minimised risk.
106 Pertanika J. Soc. Sci. & Hum. Vol. 8 No. 2 2000

Unit Trust Performance Measurement: the Snail Trail Approach
However, during the pre-crisis period, theperformance of KLMF R Saving was belowaverage. Looking at the trend where the lastpoint of the snail trail diagram shows a fall from"low return low risk" quadrant to "low returnhigh risk" quadrant, might signal unfavourablefuture performance. From the dramaticmovement of the KLMF R Saving snail trail, oneshould be aware of how dangerous it can be toneglect the risk dimension or the performancehistory of a fund.
MBF Growth Fund
Fig. 3: From the diagram, the performance historyof MBF Growth indicated that MBF Growth isrelatively more risky as the snail trail plots weremoving on the right-region most of the time.Nevertheless, the relative risk increaseddramatically during the financial crisis. Therelative performance of MBF Growth wasunfavourable (i.e. located in "low return highrisk" quadrant) compared to many other growthfunds studied. However, the relative return hasshown some improvement along with theregional economy recovery but the relative riskis still higher than average. The last few plotsof snail trail indicated a recent movement fromthe "high return high risk" quadrant to "lowreturn low risk" quadrant exhibiting a reductionin return volatility.
As a whole, we can comment that theperformance of MBF Growth is moving in
tandem with aggregate market performance. Theobjective of the fund i.e. to achieve growththrough capital appreciation by investing in highgrowth companies in Malaysia and Asia Pacificregion, might give us an insight on the highreturn volatility and explain the performance ofMBF Growth which is closely affected by theregional equity market movement.
Overall Performance of 17 FundsFrom the appendices, using snail trail analysis,the most promising unit trusts are Asia Progress(Appendix 2) and KLMF Growth (Appendix 8).Both funds have shown improved relativeperformance from the "high return high risk"and "low return low risk" quadrant to "highreturn low risk" or the favourable quadrant.
Four unit trusts namely SBB PCapital(Appendix 18), HUB Growth (Appendix 7), OSKEquity (Appendix 15) and RHB Capital(Appendix 17) exhibit concentrated plots aroundthe median return and risk. The tightness oftheir snail trail plots is a direct indication of theconsistency of a fund's risk-return performance.BBMB Prime (Appendix 3) has been showing arisk reduction trend
Three funds are classified as below averageas the snail trail diagrams show deterioratingperformance. These funds are BHLB HGrowth(Appendix 5), KLMF Industry (Appendix 9),and KLMF AGrowth (10), where the relativeperformance has been falling rapidly over recent
High Return Low Risk (HL)l-'avourable Performance
Relative Return
99Q3
Low Return Low Risk (LL)A verage Performance
High Return High Risk (HH)Average Performance
11.0%Relative Risk
I97QI-97Q4
Low Return High Risk (LH)Unfavourable Performance
Fig. 3: Relative risk/return history (MBF Growth Fund)
PertanikaJ. Soc. Sci. & Hum. Vol. 8 No. 2 2000 107

Tan Yen Keng
years, from "high return low risk" quadrant to"low return high risk" quadrant.
Seven other unit trusts did not exhibit anysignificant changes in the relative performancehistory. Most of these 7 funds remained in thesame quadrant throughout the study period ormoved from/to "high return high risk"(HH)quadrant to/from "low return low risk"(LL)quadrant. Moving between these two quadrantsbasically is indifferent in terms of risk/returntradeoffs. These 7 funds are: KLMF Regular(remained in LL) (Appendix 11); MBf Growth(maintaied in HH) (Appendix 14); ASM (P)and ASM FPF (from HH to LL) (Appendix 12 -13); BHLB Emerging (from HL to HH and LL)(Appendix 4); BIMB First (from LL to HH)(Appendix 6); and Pacific Pearl (from LH toLL) (Appendix 16).
CONCLUSIONFrom the findings, we discovered that some unittrusts have undergone quite significant, evendramatic, changes over the study period. Thetraditional risk-return "snapshot" fails to highlightchanging performance and it fails to reveal howmuch of that performance is due to themanager's unique skill and how much is due tofortuitous market movements enjoyed by mostmanagers.
Unit trust is a medium to long terminvestment instrument. Therefore the initialselection process of the fund is very important.Any slight difference in annual returns can turninto a very big variance at the end of theinvestment horizon. For instance, 2% differencein the annual rate of returns can be magnifiedinto 21.9% variation in the total returns in 10years. From the snail trail analysis, we know thatsome funds might have more than 30%difference in their relative annual rates of returns.Therefore, it is advisable that potential or evenexisting unit trust investors be more diligent inthe selection process and might want to includethis snail trail approach as an additional analysis.
For investment purposes, investors shouldavoid unit trusts that are consistently staying in"low return high risk" quadrant. Unit trusts withvery inconsistent snail trail plots over time arealso undesirable because the dramatic movementindicates very volatile returns, and in the longterm, total holding period returns might deviatevery much from the targeted rate. Unit trustslocated in the "high return low risk" quadrant
are preferred and followed by those located in"low return low risk" or "high return high risk"quadrants. Investors with different investmentobjectives and risk tolerance level might beinterested in investing in funds located in thesetwo regions.
Again, the dynamic performance history willsave us from the pit-fall, which we might bedeceived into believing by the exaggerated ux"period rate of returns as advertised. As a long-term investor, we should select our investmentvehicle with great caution and not be misled bythe high return figure of any single period.Instead, consistent long term above averagereturns with low risk is most desirable,
REFERENCESBALZER, L. 1991. Risk/Return: How to learn from
history. Powerful aid to selecting fundmanagers. JASSA (12): 19-24.
BANK NEGARA MALAYSIA. Statistical bulletin,1996 to 2000 editions. Kuala Lumpur:Percetakan Nasional Malaysia Berhad.
CARHART, M. 1997. Persistence in mutual fundperformance. Journal of Finance- 42(1): 57-82.
CHOONG D. 1999. Investors'Guide to Malaysian UnitTrusts. Kuala Lumpur: Sage InformationServices.
KENT D., M. GRINBLATT, S. TITMAN and R. WERMERS.
1997. Measuring mutual fund performancewith characteristic-based benchmarks. Journalof Finance 52(3): 1035-1058.
GRINBLATT M. and S. TITMAN. 1993. Performancemeasurement without benchmarks: anexamination of mutual fund returns. Journal ofBusiness 66(1): 47-68.
. 1994. A study of monthly mutual fundreturns and performance evaluationtechniques. Journal of Financial and QuantitativeAnalysis 29(3): 419-444.
OKUNEV, J. 1990. An alternative measure of mutualfund performance. Journal of Business Financeand Accounting 17(2): 247-264.
SMIDT, S. 1978. Investment horizons andperformance measurement. Journal of PortfolioManagement 4(2): 18-22.
WOODWARD, R. S. 1983. The peformance of UKclosed-end funds: a comparison of the variousranking criteria. Journal of Business Finance andAccounting 10(3): 419-427.
108 Pertanika J. Soc. Sci. 8c Hum. Vol. 8 No. 2 2000
Unit Trust Performance Measurement: the Snail Trail Approach
APPENDIX 1
No.
1234567891011121314151617
Unit Trust
Asia UT Malaysia Progress FundBBMB Prime FundBHLB Pacific Emerging Co. Growth FundBHLB Pacific High Growth FundBIMB UT First FundHLB Growth FundKLMF Growth FundKLMF Industry FundKLMF Aggressive Growth FundKLMF Regular SavingMBf Growth FundOSK-UOB Equity TrustPacific Pearl FundRHB Capital FundSBB Premium Capital FundASM First Public FundASM Premier Fund
Type of Fund
Growth, EquityGrowth, EquityGrowth, EquityGrowth, EquitySyariah, Growth, EquityGrowth, EquityGrowth, EquityGrowth, EquityGrowth, EquityGrowth, EquityGrowth, EquityGrowth, EquityGrowth, EquityGrowth, EquityGrowth, EquityGrowth, EquityGrowth, Equity
Units inCirculation
(million)1998/99
151166384245235253658275310600118248278239304236215
Source : Investors* Guide To Malaysian Unit Trusts, 1999.
No. Unit Trust Fund Fund Manager 1998/99
56
7891011121314
15
1617
Asia UT Malaysia Progress FundBBMB Prime FundBHLB Emerging Co. Growth Fund
BHLB Pacific High Growth Fund
BIMB UT First FundHLB Growth Fund
KLMF Growth FundKLMF Industry FundKLMF Aggressive Growth FundKLMF Regular SavingMBF Growth FundOSK-UOB Equity TrustPacific Pearl FundRHB Capital Fund
SBB Premium Capital Fund
ASM First Public FundASM Premier Fund
Mushthaq Ahmad IbrahimKoh Huat SoonLee Chiah Cheang(external investment advisor)Lee Chiah Cheang(external investment advisor)Abdul Rahim Abu BakarArnold Lim(external investment advisor)Edmond Cheah Swee LengEdmond Cheah Swee LengChong Chang ChoongChong Chang ChoongPhilip Tan Chek BoonLee Seng YoungChong Sui SanDavid Lee Chuen Chieh(external investment advisor)Pearl Wong(external investment advisor)Zalinah A HamidRazali Haron
Source: Investors' Guide To Malaysian Unit Trusts, 1999.
PertanikaJ. Soc. Sci. & Hum. Vol. 8 No. 2 2000 109

Tan Yen Keng
% - 4 . 0 % - 2 0 % 0 .0% ' 2 .0% 4 .0% 6 0% 8
APPENDIX 2Asia Ut Malaysia Progress Fund (Asia Progress)
-6
40.0%
20.0%
0.0%
)% -4.0% -2.0% • 0
- 2 0 . 0 %
,0%
J / \
2 .0% 4 . 0 % 6.o% mo% 10. )%
APPENDIX 3BBMB PRIME FUND (BBMB PRIME)
o*̂ -——)% - 4 . 0 %
40.0%
20.0%
— - ^ 0.0% *+-2.0V 0./% 2.0% 4.0% 6.0% 8.0% 10.
O First Plot (98 Q1 to 98 Q4)
| Last Plot (99 Q3 to 00 Q2)
APPENDIX 4BHLB Pacific Emerging Co. Growth Fund (BHLB Emerging)
110 PertanikaJ. Soc. Sci. & Hum. Vol. 8 No. 2 2000

Unit Trust Performance Measurement: the Snail Trail Approach
-6 . %
A-4.0"»P -
fin nv
40.0% J
20 .0%
* *
1% 4 0% 6 0% 8 .0% 10 3%
APPENDIX 5NHLB Pacific High Growth (BHLB HGrowth)
2.0% 4.0% 6.0% 8.0% 10.
APPENDIX 6BIMB UT First (BIMB First)
4«A^(i% -4.0% -2.0% d*h% 2.0% 4.0% 6.0% 8.0% 10
-20.0%
APPENDIX 7HLB Growth Fund (HLB Growth)
0.0% 2.0% 4.0% 6.0% 8 0% 10
APPENDIX 8KLMF Industry Fund (KLMF Growth)
PertanikaJ. Soc. Sci. & Hum. Vol. 8 No. 2 2000 111

Tan Yen Keng
-e. )% -4 0%
40.0% .
20.0%
2 ^ 0 . # %
-40.0%
2.0%
1
4.0% 6.0% 0.0% 10. )%
APPENDIX 9KLMF Industry Fund (KLMF Industry)
) % - 4 . 0 %
40.0% :
20.0% \
~2THT O.OV
-20 .0% > |
0% 4
•
.0% 6.0% 8.0% 10.
APPENDIX 10KLMF Aggressive Growth Fund (KLMF AGrowth)
-6.
40.0%
20.0%
• 0.0%)% ©4TO% ^ j ^ % °- )%
^ » -40.0% i
2.0%
14.0% 6.0% 8.0% 10. m
APPENDIX 11KLMF Regular Saving (KLMF RSaving)
- 4 .0% -2 |0%
0.0% . J
20% 4 0% 6.0% 80% 10
APPENDIX 12ASM Premier Fund
112 Pertanika J. Soc. Sci. & Hum. Vol. 8 No. 2 2000

Unit Trust Performance Measurement: the Snail Trail Approach
-6 .
fin n<yn
40.0%
20.0%
0 . 0 % ^ ^ ^)% -4.0% -2.0% ^ * 0 . 0 %
- 2 0 . 0 ^ * ,
.An not
\T2.0% 4.0% ^Jp.0% 8.0% 10. )%
APPENDIX 13ASM First Public Fund (ASM FPF)
% - 4 . 0 % - 2 . 0 % | 0 . 0 % 2 .0% 4 / 0 % 6 . 0 % 8 .0% 10.
APPENDIX 14MBF Growth Fund (MBF Growth)
-6. m -< . 0 % -2
40.0% j
20.0%
.0% I.UW
-20.0%' j
• • 2 0% 4. 0% 6 . 0 % 6.0% 10.
APPENDIX 15OSK-UOB Equity Trust (OSK Equity)
-6.
40.0%
20.0%
-20.0%^ ^ | ? % 6.0% 10. »%
APPENDIX 16Pacific Pearl Fund (Pacific Pearl)
PertanikaJ. Soc. Sci. & Hum. Vol. 8 No. 2 2000 113

Tan Yen Keng
-6 . )% -4 . 0 % -2
40
"I
0%
0
no/.
1
1
* 2 0% 4 0% 6 . 0 % 8 . 0 % 10.
APPENDIX 17RHB Capital Fund (RHB Capital)
-6.
40.0% |
20.0%£
0.0% Jk)% -4.0% -2.0% O.ffV
-20.0% V2.0% 4.0% 6.0% 8.0% 10. m
APPENDIX 18SBB Premium Capital Fund (SBB PCapital)
114 PertanikaJ. Soc. Sci. & Hum. Vol. 8 No. 2 2000