unite for childrene-mail: [email protected] education for all mid-decade assessment 3 east asia and...
TRANSCRIPT

unite for children


Version printed for limited distribution 17 August 2009
Any part of this Progress Note may be freely reproduced with the appropriate acknowledgment.
Design and layout: Keen Media (Thailand) Co., Ltd.
Printed in Thailand
ISBN: 978-974-685-117-6
UNICEF East Asia and Pacific Regional Office19 Phra Atit RoadBangkok 10200Tel: (66 2) 356 9499Fax: (66 2) 280 7056E-mail: [email protected]

3Education for All Mid-Decade AssessmentEast Asia and Pacific
Acknowledgements
In 2005, National EFA Coordinators and education experts from throughout Asia and the Pacificagreed on a framework to undertake the EFA Mid Decade Assessment (MDA). The EFA MDAprocess included the resuscitation of National EFA teams, the preparation of National EFA MDAReport and regional capacity building and coordination efforts. The EFA Mid-Decade Assessment(MDA) process, coordinated under the auspices of the Regional Thematic Working Group onEFA, was initiated to review progress towards the goals of EFA and to identify remaining gaps,un-reached populations and areas of greatest inequity to ensure the goals are achieved in full by2015, with special attention to identifying the unreached and the disaggregation of disparities.
This report was developed by UNICEF EAPRO in collaboration with the East Asia and PacificRegional United Nations Girls’ Education Initiative (UNGEI) and in cooperation with UNESCOBangkok and the UNESCO Institute of Statistics office for Asia-Pacific (AIMS Unit), as a contribution to the larger set of results from the Asia and Pacific Education for All Mid-DecadeAssessment process.
The Indicators, which guided the National Reports and this Progress Note, are from the EFA MDATechnical Guidelines, which were developed by Technical Support Groups made up of staff fromvarious Regional EFA TWG partner organizations based in Bangkok. In the case of the GenderTechnical Support Group, acknowledgement should be made to contributions from core partnersin the UN Girls’ Education Initiative (UNGEI), who were instrumental in developing theGuidelines, providing feedback and guidance to gender chapters from national EFA MDA reportsand guiding the direction of this Progress Note. The East Asia and Pacific Regional UNGEI partners are: Baha’i International Community, Education Development Center (EDC),International Labour Organization (ILO) Regional Office for Asia and the Pacific, Oxfam GreatBritain, Plan Asia Regional Office, Save the Children - Southeast Asia and the Pacific RegionalOffice, Southeast Asian Ministers of Education Organization (SEAMEO) Secretariat, Joint UnitedNations Programme on HIV/AIDS (UNAIDS) Regional Support Team, Asia Pacific United NationsEconomic and Social Commission for Asia and the Pacific (UNESCAP), United NationsEducational, Scientific and Cultural Organization (UNESCO) Asia-Pacific Regional Bureau forEducation, United Nations Population Fund (UNFPA), United Nations Children’s Fund (UNICEF)East Asia and Pacific Regional Office, and World Vision Foundation of Thailand.
The Progress Note draws extensively on findings and data from national assessments and thusspecial acknowledgement must be given to those coordinators and teams, which led this important process in their countries. The Progress Note also draws extensively upon otherresearch, evaluations, household surveys and analytical reports – and we acknowledge theexcellent work done by a wide range of partners as cited in this Note.

Text for this report was originally prepared by Lucy Lazo and Mita Gupta with extensive guidance, review and input provided by technical experts and professionals – past and present– representing partner agencies within the East Asia and Pacific Regional United Nations Girls’Education Initiative (UNGEI). Special recognition goes to Aya Aoki, Chemba Raghavan, CliffMeyers, Jon Kapp, Leah Mosel, Leotes Lugo, Maki Hayashikawa, and Urmila Sarkar with specialsupport from Tanaporn Perapate.
Contents
Executive Summary: Main findings and recommendations 9
Chapter 1: Introduction 11
1.1 Monitoring and assessing Education for All 131.2 The EFA Mid-Decade Assessment (MDA): Identifying and reaching the unreached 141.3 EFA MDA National Reports 151.4 EFA MDA Progress Notes 161.5 Core indicators 181.6 Systems/policy indicators 201.7 Additional indicators 211.8 Organization of the report 21
Chapter 2: Trends and Patterns 23
2.1 Systems/policy indicators 232.1.1 Policies/legal platform 232.1.2 Gender budgeting 25
2.2 Core indicators 262.2.1 Gender parity in enrolment at all levels 262.2.2 Pre-primary education 282.2.3: Basic education 29
a Primary education enrolment 29b Survival rates 32c Out-of-school children 34d Transition to secondary education 36e Secondary education 40f Technical and vocational education 45g Teachers 46h Education governance 47i Curricula and textbooks 49j Teaching and learning process 50
2.2.4 Tertiary education 522.2.5 Adult literacy 54

Chapter 3: Cross Indicator and Cross Goal Analysis 57
3.1 Poverty and gender disparities 573.2 The link between education and employment:
Gender issues in the school to work transition 603.3 Factors affecting women’s literacy 653.4 The rural-urban divide 66
Chapter 4: Emerging Concerns, Gaps, Constraints and Challenges 69
Chapter 5: Conclusions and Recommendations 75
Annex I: Gender Core and Additional Indicators 81
Annex II: Gender Core Indicators by Country 99
Annex III: Gender Policy Indicators 125

References
List of BoxesBox 1: The Dakar EFA goals 12Box 2: Repetition rates 33Box 3: Lao PDR: Reaching unreached girls 35Box 4: Indonesia: Education towards eliminating girls’ exploitation 44Box 5: Cambodia: Quality standards for mainstreaming gender in education 47Box 6: The burden of household work 61Box 7: Political participation 64Box 8: Gender-based violence 68
List of TablesTable 1: Number of Indicators for EFA Goals 16Table 2: Status of EFA MDA Reporting 17Table 3: Gender Parity Index (GPI) of enrolment ratios for
East Asia and the Pacific 27Table 4: Gender disparities in survival rates to the last grade of
primary education, 1999 and 2004 32Table 5: Proportion of female teachers by sub-sector, 2000/01-2005/06 47
List of FiguresFigure 1: Gender Parity Index for gross enrolment ratio in
pre-primary education 28Figure 2: Gender Parity Index for net enrolment ratios in
primary education, 1999 and 2005 29Figure 3: Sub-national disparities in the Gender Parity Index for
net enrolment ratio in primary education 30Figure 4: Gender parity levels in Indonesia 31Figure 5: Gender parity index in net enrolment ratio in primary education,
Pacific 1999 and 2005 31Figure 6: Proportion of pupils starting grade 1 who reach grade 5 (survival rate),
Philippines by province, 2005-2006 33Figure 7: Out-of-primary school children by sex, 2005 34Figure 8: Gender parity index for transition to secondary education,
selected countries, 2004 37Figure 9: Attainment profiles of girls and boys ages 15-19, Lao PDR, 2000 38Figure 10: Gender parity in net attendance ratio in secondary or
higher education, Viet Nam 39Figure 11: Transition rate to secondary education in Cambodia, 2006-07 40Figure 12: Gender parity index in gross enrolment in secondary education,
East Asia, 1999-2005 40Figure 13: Gender parity index in gross enrolment in secondary education,
Pacific, 1999-2005 41Figure 14: Gross enrolment ratio for secondary education, 2005 42Figure 15: Gender parity index in net enrolment ratio in
secondary education in Mekong Sub-region and Myanmar 43

List of Figures (continues)Figure 16: Enrolment in technical and vocational education, 2005 45Figure 17: Disparities in the presence of male and female teachers 46Figure 18: Gender disparities in reading scores 50Figure 19: Gender differences in student performance on
the mathematics scale 51Figure 20: Gross enrolment ratio in tertiary education, 2005 53Figure 21: Per cent of female enrolment in tertiary fields of study 54Figure 22: Adult illiteracy (per cent) 55Figure 23: Adult illiteracy rate 55Figure 24: Tested functional literacy rate by ethnicity, Lao PDR, 2001 56Figure 25: Mongolia secondary school and higher education net attendance ratio
by wealth quintile 57Figure 26: Thailand secondary school and higher education net attendance ratio
by wealth quintile 58Figure 27: Viet Nam secondary school and higher education net attendance ratio
by wealth quintile 58Figure 28: Lao PDR, 2000, female/male attainment profile, ages 15-19 59Figure 29: Philippines, 2003, female/male attainment profile, ages 15-19 59Figure 30: Myanmar, 2000, female/male attainment profile, ages 15-19 60Figure 31: Estimated earned income 62Figure 32: Professional and technical personnel in urban areas by sector, 2002 63Figure 33: Literacy rate of women aged 14-24, Thailand 65Figure 34: Illiteracy rate, China, 2000 66Figure 35: Lao PDR, 2000, rural/urban attainment profile, ages 15-19 66Figure 36: Philippines, 2003, rural/urban attainment profile, ages 15-19 67

9Education for All Mid-Decade AssessmentEast Asia and Pacific
Executive Summary
Main findings and recommendations
This Progress Note on Gender Equality in Education for East Asia and the Pacific functions bothas a portrait of a region that overall continues to move towards its education goals and as a roadmap for the region’s way forward.
While disparities in goal achievements exist, positive progress has been made. Most notably,education enrollments have increased across the region, leading to greater gender parity andaccess to education. Furthermore, de jure gender equality is widespread throughout the region.Though it must be noted that all countries – and different areas within each country – have hadvarying degrees of success, the region as a whole can be seen as progressing towards a moreequitable and better future of education.
Though these growing accomplishments must be sustained, the region can also begin focusingon other aspects of gender equality in education. “Gender equality” includes parity within thequality of education received during the teaching and learning processes (gender equality ineducation). Beyond the classroom, gender equality can be achieved through education in termsof the types of opportunities available through education, including employment prospects. Asgreater numbers of girls go to school and at higher education levels than ever before, effortsmust be made for other benchmarks of parity – such as income levels, employment opportunities, leadership and decision-making power – to keep pace as well. Further efforts toinstitutionalize gender mainstreaming in education systems across the region should foster anorganizational culture in support of gender equality and ensure that a gender perspective isincorporated in education policies, plans and programmes at all levels.
Attention can also now turn to specific groups of children – both girls and boys – who continueto fall through the cracks of education systems. These particular disadvantaged groups includeethnic minorities, migrant communities, displaced populations, poor families, child labourers,people living in remote areas and people with disabilities. The various factors affecting thesegroups can compound their gender-related difficulties, thereby denying them their right to education. The attainment of EFA goal 5 by 2015 now depends considerably on targeting policy,strategy and programming to reach the unreached.
After presenting a picture of a region progressing positively – albeit unevenly and with plenty ofwork left to do – the progress note concludes with a road map of concrete recommendations toovercome fundamental obstacles to the achievement of the EFA goal on gender in education.

These recommendations include proposals to address multiple levels of bias; to close the gender gap against boys; and to move beyond parity in education planning and programming.In addition, this note proposes ways to address gender equality through education, includingstrategies to bridge the gender divide in fields of study in higher education; to strengthen linkages between education and the labour market; and to promote gender-responsive educationmanagement and governance and equality in the teaching profession. With these ideas for tacklingobstacles to gender equality in education, the note looks ahead to future achievements.
10 Gender Equality in EducationProgress Note

11Education for All Mid-Decade AssessmentEast Asia and Pacific
Chapter 1
Introduction
In 1948, the General Assembly of the United Nations adopted and proclaimed the UniversalDeclaration of Human Rights (UDHR), in which Article 26 asserts that “everyone has a right toeducation.” This fundamental right was further expanded in 1988 in the Convention on theRights of the Child (CRC), which stipulates that every child has a right to a basic education, ofgood quality, and in their own language. In 1990, using these documents as their guides, theUnited Nations Development Programme (UNDP), the United Nations Educational, Scientific andCultural Organization (UNESCO), the United Nations Children’s Fund (UNICEF) and the WorldBank organized the World Conference on Education for All (EFA).
In March 1990, 155 nations from around the world, as well as representatives from approximately150 organizations, met at the World Conference on Education for All in Jomtien, Thailand. Theparticipants of this conference, with supporting documentation in the UDHR and CRC, re-affirmed the universal right to education, and adopted the World Declaration on Education forAll: Meeting Basic Learning Needs to ensure that these rights could be fulfilled.
As per the Universal Declaration of Human Rights and the Convention on the Rights of the Child,conference discussions were anchored by the principle of the right of all children, young peopleand adults to education, and the recognition that urgent action needed to be taken to address thegrowing number of out-of-school children worldwide. An expanded concept of basic educationwas agreed upon that encompassed not only knowledge and skills but also the importance ofculture and value and finding ways in which people can live together in peace. A set of six targets were established as follows:
1. Expansion of early childhood care and development activities 2. Universal Primary Education by the year 2000 3. Improvement in learning achievement 4. Reduction of the adult illiteracy rate to one-half its 1990 level by the year 2000, with sufficient
emphasis on female literacy 5. Expansion of provisions of basic education and training in other essential skills required by
youth and adults 6. Increased acquisition by individuals and families of the knowledge, skills and values required
for better living and sound and sustainable development
It was anticipated at the time that an assessment would take place to review progress against the commitments made in Jomtien towards Education for All at the end of the decade, andaccordingly, the EFA 2000 Assessment was carried out. The findings were discussed at the World

12 Gender Equality in EducationProgress Note
Education Forum in Dakar, Senegal, in April 2000. The 1,100 participants assembled there notedthat, despite commitments made in Jomtien, unacceptably high numbers of children and adults,primarily girls and women, continued to be denied their right to an education. Furthermore, theassessment results indicated that the quality of education was falling short of the needs of societies. Thus, addressing persisting gender disparities and inequalities and focusing on reaching the unreached was recognized as necessary for Education for All to be achieved. Thisled to the development and adoption of the Dakar Framework for Action, which not only re-affirms the goal of education for all as laid out by the previous international conventions but also collectively commits the participating governments and organizations to six goals to be achievedby 2015, in line with the Millennium Development Goals (MDGs). Within the framework is a goaldedicated to achieving gender equality, described as:
Eliminating gender disparities in primary and secondary education by 2005 and achieving gender equality in education by 2015, with a focus on ensuring girls’ full and equal access to andachievement in basic education of good quality(Dakar Framework for Action, EFA Goal 5)
Box 1: The Dakar EFA Goals
The six EFA goals set in Dakar in 2000 are:
• Expanding and improving comprehensive early childhood care and education, especiallyfor the most vulnerable and disadvantaged children
• Ensuring that by 2015 all children, particularly girls, children in difficult circumstances and those belonging to ethnic minorities, have access to and complete free and compulsoryprimary education of good quality
• Ensuring that the learning needs of all young people and adults are met through equitable access to appropriate learning and life skills programmes
• Achieving a 50 per cent improvement in levels of adult literacy by 2015, especially for women, and equitable access to basic and continuing education for all adults
• Eliminating gender disparities in primary and secondary education by 2005, and achieving gender equality in education by 2015, with a focus on ensuring girls’ full and equal access to and achievement in basic education of good quality
• Improving all aspects of the quality of education and ensuring excellence of all so that recognized and measurable learning outcomes are achieved by all, especially in literacy, numeracy and essential life skills

13Education for All Mid-Decade AssessmentEast Asia and Pacific
This goal has two targets: the first, the deadline for which has already passed, was to attain gender parity in primary and secondary education by 2005, and the second was to achieve gender equality in education by 2015. The first target focuses on ensuring equality in numbersand proportions of girls and boys, women and men in various aspects of education at the primary and secondary level (e.g., enrolment, intake, percentage of female teachers, etc.). Thesecond target is much broader and more complex. Achieving gender equality in education goesbeyond a balance in numbers or proportions of girls and boys, men and women participating in education – it must also ensure equality in learning processes and outcomes, as well. Thus, it isnot just an issue of equality in access but also in the quality of education girls and boys receive,such as in the teaching and learning process in classrooms, in the support they receive for theireducation at home and in school, and in their opportunities beyond education, as they transitionto the workplace.
1.1 Monitoring and assessing Education For All
In 1996, at a meeting in Amman, Jordan, to assess progress midway through the Decade of EFA,partners agreed on 18 EFA Indicators (see Annex 1), which would provide the basis for the EFANational Reports to be prepared for the year 2000. There was great debate over the make up ofthese indicators, including for example whether Primary Gross Enrolment Rates (GER) orPrimary Net Enrolment Rates (NER) should be included amongst the 18 (NER was chosen). In theend, however, overall availability of data was factored in and consensus reigned. After theAmman meeting, countries were encouraged to use the remaining time before 2000 to achievethe EFA goals and to refine their education information management systems (EMIS) in order toreport on these indicators. Countries established National EFA Task Forces and Committees,made up of Ministry of Education officials, as well as staff from other relevant Ministries, NGOs,private sector and other relevant stakeholders. These National EFA Task Forces were responsiblefor preparing their National Reports for submission in Dakar. While countries were requested to disaggregate their data by male and female, further disaggregation by geographic location orother factors was not emphasized.
In April 2000, to mark the end of the decade of Education For All, 181 countries gathered in Dakar,Senegal, for the World Education Forum, submitting their national reports as input into the global review. At this meeting, governments and global partners re-assessed progress on theEFA goals and adopted the Dakar Framework for Action, Education for All: Meeting OurCollective Commitments.

1.2 The EFA Mid-Decade Assessment (MDA): Identifying and reaching the unreached
In mid-2005, three partners initiated the EFA MDA process: UNESCO Bangkok; the UNESCOInsititue of Statistics office for Asia-Pacific (AIMS Unit), and Regional UNICEF Offices for EastAsia Pacific, for South Asia and for Central Eastern Europe/Commonwealth of IndependentStates. In October 2005, these partners convened a joint meeting to launch the Asia EFA MidDecade Assessment process. Ministry of Education officials from 21 countries joined this meeting and initiated the MDA process to review progress made in the period from 2000 to 2005,with the goal of identifying ‘unreached’ populations and areas of greatest inequity.
The overall objectives for embarking on the Asia EFA MDA process were identified thus:
• Build national capacity to undertake monitoring and evaluation (M&E), MDA and Mid-Term Policy Reviews
• Assess progress and gaps in the achievement of the national and global targets of EFA• Identify and locate the remaining gaps in terms of quality and equity at sub-national levels,
with a focus on disadvantaged and excluded populations • Review, identify and locate the problems, issues, policies, strategies, actions and critical
factors of success/failure• Use results of the EFA MDA process to sharpen the national and regional focus policies and
strategies for attaining the EFA goals and the MDGs by 2015
The October 2005 meeting endorsed the establishment of six goal-based Technical SupportGroups (TSGs) to guide the process, the preparation of the EFA MDA Technical Guidelines with expanded indicators, and the processes to follow in preparing the National Reports and supporting EFA MDA data sets. The Asia EFA MDA Core Group, consisting of members of thethree key partners – UNESCO Bangkok, UIS AIMS Unit in Bangkok, and UNICEF Regional Officesin Asia – was also established. This Core Group was responsible for coordinating the overall EFAMDA process and reported directly to the Regional EFA Thematic Working Group.
In line with the objectives set in October 2005, the process of building national capacity was supported by the core partners as a key element in the EFA MDA process. A series of regionaland sub-regional workshops were held as part of the capactiy building process. Two regionalworkshops were held specifically for EFA Coordinators and Statisticians to help prepare data setswith disaggregated data. Sub-regional meetings were also supported to review draft findings of Sub-Regional Synthesis Reports, which were based on draft National Reports.Country-specific travel and missions by UNESCO, UNICEF and UIS staff provided hands-on technial support in analyzing findings and preparing the national EFA MDA reports.
Further, to support countries in the compilation and use of disaggregated data for analysis,EFAInfo software was developed. This software is based on the DevInfo software currently usedby the UN System to track progress at sub-national levels on specific development indicators.
14 Gender Equality in EducationProgress Note

15Education for All Mid-Decade AssessmentEast Asia and Pacific
Through EFAInfo, data sets can be uploaded by countries for the EFA MDA indicators and easilyturned into maps, graphs and charts. A series of sub-regional workshops were also held to support country treams in developing their skills to use EFAInfo. Technical support was provided to countries to customize EFAInfo in the national context and expand skills throughtraining on the administration and use of the tool.
The EFAInfo database contains not only the ‘Provisional EFA MDA data sets’ submitted with draftEFA MDA National Reports but also data from the GMR and UIS Digest, from UNICEF’s State ofthe World’s Children Report, from the UN Statistical Division’s data set on Gender (GenderInfo_),and from household surveys such as the Multiple Indicators Cluster Survey (MICS), theDemographic and Health Survey (DHS) and the Living Standards Measurement Survey (LSMS).Data from other key studies has been compiled on education-related issues such as language,ethnicity and disabilities, amongst other issues. The compilation of these data sets withinEFAInfo allows for regional analysis (using internationally comparable data) and more importantly, detailed sub-national analysis, which can be easily analyzed and presented. EFAInfoversion 1.2, with a complete set of data, will be available in early 2009 in both CD-ROM and web-based applications.
1.3 EFA MDA National Reports
As mentioned, for each of the Goals, regional Technical Support Groups (TSGs) were formed,bringing together teams of experts from the Asia region into groups to provide technical adviceand support to ensure the delivery of national assessment activities. The first task for TSGs wasto complete the EFA MDA Technical Guidelines. The Technical Guide spells out the indicators forcountries – their definitions, means of verification and sources. The TSGs prepared three sets ofindicators for each Goal:
• System/Process Indicators• Core Indicators• Additional Indicators (primarily using indicators from MICS/DHS)
In total, the EFA MDA Technical Guide contains 29 System/Process Indicators, 48 Core Indicatorsand 54 Additional Indicators spread over the 6 Goal areas (see Annex for complete list of QualityIndicators).

16 Gender Equality in EducationProgress Note
Table 1: Number of Indicators for EFA Goals
Later in the EFA MDA process, the TSGs were responsible for reviewing and providing feedbackon the draft National Reports, which were submitted by National EFA Committees through AIMS Unit in the UNESCO Regional Office in Bangkok. The EFA MDA National Reports werecompleted by participating countries to assess progress in achievements on the EFA goals; toidentify obstacles in achieving the EFA goals, and to identify the excluded or “unreached” targetpopulations. The process of preparing EFA MDA Reports emphasized the need for greater disaggregation of data sets, expecting countries to further break down EFA MDA core indicatorsby geographic sub regions (provinces/regions/districts), by area (urban/rural/remote), by sex, by private/public, by language, by age and if possible by ethnicity, socio-economic status, disability and religion/caste. The intent is to identify constraints and opportunities, to reset targets, and to create a proposed action agenda to achieve EFA goals in Asia and the Pacific by 2015.
1.4 EFA MDA Progress Notes
The EFA MDA Core Group agreed to two initiatives to capture the regional outcomes of the EFAMDA processes. UIS AIMS Unit agreed to undertake six Sub-Regional Synthesis Reports (SSRs)for the six UNESCO Sub-Regions, namely the Pacific, Insular South East Asia, Mekong SouthEast Asia, East Asia, South Asia and Central Asia. The SSRs summarize the EFA MDA NationalReports for each of the Goals and indicators in one document. For the second regional initiative,UNICEF agreed to undertake the 4 Progress Notes (ECCD, Life Skills, Gender, and Quality), eachof which focuses on just one Goal, covering UNICEF’s East Asia and Pacific Region (except forECCE which also includes the South Asia Region).
The key distinction between Progress Notes and SSRs, in addition to the geographic coverageand scope of Goals, is that the SSRs rely only upon the EFA MDA National Reports, while theProgress Notes include other sources of data, such as quantitative and qualitative studies and reports, data submitted as Provisional EFA MDA data sets, findings from international
Goals System/Process Core Additional Total
Early childhood 6 7 14 27
Access 6 10 9 25
Life skills 3 4 8 15
Literacy 3 4 8 15
Gender 4 12 6 22
Quality 7 11 9 27
Total 29 48 54 131

17Education for All Mid-Decade AssessmentEast Asia and Pacific
surveys such as MICS, DHS, LSMS, TIMMS, PISA and other regional and national surveys andassessments. Thus, the Progress Notes use a combination of international data and, whereverpossible, sub-regional or country case studies as a way to examine trends, apply lessons learnedover the past several years, and prepare for the future.
Table 2: Status of EFA MDA Reporting
EFA 2000 Report EFA NationalAction Plan
EFA MDA NationalReport
MICS, DHS, LSMSReports
GMR and AnnualUIS Statistics
Australia 3
Brunei 3
Cambodia 3 3 3 3 3
China 3 3 3 3
Cook Islands 3 3
Fiji 3 3 3 3
Indonesia 3 3 3 3 3
Japan 3
Kiribati 3 3
Korea (DPRK) 3 3 3
Korea (ROK) 3 3
Lao PDR 3 3 3 3 3
Malaysia 3 3 3
Marshall Islands 3 3
Micronesia 3 3
Mongolia 3 3 3 3 3
Myanmar 3 3 3 3
Nauru 3 3
New Zealand 3
Niue 3 3
Palau 3 3
Papua New Guinea 3 3 3
Philippines 3 3 3 3 3
Samoa 3 3 3
Singapore 3
Solomon Islands 3 3 3
Thailand 3 3 3 3
Timor-Leste 3 3
Tokelau 3 3
Tonga 3 3 3
Tuvalu 3
Vanuatu 3 3 3
Viet Nam 3 3 3 3

18 Gender Equality in EducationProgress Note
This Progress Note, therefore, attempts to synthesize national and regional data in an effort tosummarize the major issues and patterns of achievements, assess remaining disparities, andmake policy and programming recommendations for the period up to 2015. Qualitative and quantitative data analysis methods were used to assess progress and trends in identifying‘un-reached’ populations and determining the most important inputs and processes in order to improve the current situation. A summary of the status of EFA MDA Reporting and of the availability of national surveys and other sources of data is compiled below for review.
The Progress Notes are not intended as a means of comparing countries, or to identify high andlow achievers amongst Asian nations. National comparisons, where made, are done so usingGMR data, as this has been vetted by UIS Montreal, ensuring comparability of data. When usingProvisional EFA MDA data sets, as these are primarily based on national EMIS data, we cannotassure that the definitions used by different countries are indeed the same, thereby making anycross-country comparisons extremely difficult. Rather, more emphasis is placed on comparingsub-national data sets, especially on the differences and gaps existing between sub-national levels. In this way, even if definitions between countries vary, the disparity gaps, orthe breadth of disparity for similar indicators within countries, are what is being compared. In this regards, whether one country defines primary as five years and another at six years, the sub-national differences between districts in terms of their primary completion rates can still becompared. What we find, even if the definitions may vary slightly, is that some countries havevery little in the way of geographical disparities while others have huge gaps and sub-nationalinequities in their completion rates.
A set of indicators was developed by which to assess countries’ progress towards achieving the goals and targets of the Dakar Framework for Action. In relation to EFA Goal 5, the core indicators (please see Annex I) are a set of quantitative indicators for gender parity and equality. There are also what is termed system and policy indicators (see Annex II), which weredeveloped to allow countries to provide more qualitative data and information, beyond genderparity indices, to supplement quantitative data and analysis in connection with the larger goal ofgender equality. This note focused on the following key indicators.
1.5 Core indicators
Gender parity indices1 were used for the following indicators:
Adult literacy: This indicator assesses the extent to which women and men can equitably attain literacy, a keybasic means of making informed decisions and participating actively and fully in society. Also, parents’ literacy, particularly mothers’ literacy, can have an impact on the education and literacy levels of their children, and this is therefore an important indicator tomonitor.
1 The gender parity index (GPI) is the ratio of female to male values of a given indicator. A GPI of 1 (or within the band of 0.97 to 1.03) indicates parity between the sexes; a GPI above 1 (or above 1.03) indicates a disparity in favour of girls, and a GPI of below 1 (or below 0.97) indicates a disparity in favour of boys.

19Education for All Mid-Decade AssessmentEast Asia and Pacific
Gross enrolment ratio (GER) for early childhood care and education (ECCE): The enrolment ratio in organized early learning programmes of girls to boys regardless of age,this indicator measures the disparities between girls and boys in gaining a critical start to education and development. Participation in ECCE programmes have been shown to improvecognitive development and contribute to increased school participation, completion andachievement, among other benefits to children’s growth and development.
GER for primary/secondary education: The GPI for GER in primary and secondary education measures the disparities in enrolmentbetween girls and boys at these education levels, regardless of their age. This gives an indication of all girls and boys who are enrolled and may include repeaters and children underor beyond the designated official age of school-going children at a given education level.
Net enrolment ratio in primary/secondary education: This indicator assesses whether girls and boys are enrolling in primary and secondary educationat the appropriate age (i.e., the official age group corresponding to the given level of education)and in an equitable manner. Both this and the GER are important measures of participation inthe education of girls and boys.
Survival rate to grade 5: This index is the percentage of a cohort of girls and boys enrolled in the first grade of primaryeducation in a given school year who are expected to reach grade 5, regardless of repetition.Educational attainment to grade 5 is commonly considered the minimum level of educationrequired for sustainable literacy.
Transition rate to secondary education: This indicator measures disparities between girls and boys in progressing from primary to secondary education. It is calculated as a percentage of new entrants to the first grade of secondary education in a given year out of the number of students enrolled in the final grade ofprimary education the previous year.
Apart from the above gender parity indices, another quantitative indicator considered is:
Percentage of female teachers in primary/secondary/technical and vocational education. Thisindicator shows the gender composition of the teaching force and whether women are under- oroverrepresented at given education levels. This may have implications for girls’ enrolment at those levels of education, since it has been shown that the presence of female teachers can incertain contexts encourage the participation of girls in school. Furthermore, this may also pointto inequities in terms of seniority and remuneration in cases where pay scales and levels ofauthority may differ between different education levels.

20 Gender Equality in EducationProgress Note
1.6 Policy/system indicators
The policy/system indicators are as follows:
Legislative, policy and institutional reform that conform to the Convention on the Eliminationof All Forms of Discrimination against Women (CEDAW):This indicator assesses whether the necessary legal and institutional frameworks are in placethat support gender equality in education, using CEDAW as a basis. CEDAW, adopted by the UNGeneral Assembly in 1979, is an internationally binding instrument aimed at addressing discrimination against women and providing a legal basis for equality between women and men.Among the 30 articles of CEDAW is article 10, requiring states’ parties to ensure women’s equalrights with men to education. Under this article, women and men must have equal access to alllevels of education, and beyond access, governments are also obligated to ensure the elimination of gender stereotypes from textbooks and teaching and learning processes, thesame conditions for career and vocational guidance for girls and boys, and equal opportunitiesto participate in sports and physical education.
Percentage of the budget dedicated to gender programming within relevant Ministries:While laws and policies may exist as the foundation for ensuring gender equality in education,adequate funds must be allocated for their effective implementation. It is therefore important to consider the proportion of the education budget allotted for gender programming andaddressing gender disparities and inequalities in education.
Existence of policies to encourage girls’ participation in school (stipends, scholarships, etc.):In the context of existing legal frameworks, this indicator looks at the policies that have beenenacted to encourage girls’ participation (or boys’ participation, as disparities can be to their disadvantage as well) in school and to address gender disparities in education. This wouldinclude targeted measures – such as the provision of stipends and scholarships – that seek toredress historical and continuing disadvantages which prevent girls/women and boys/men fromoperating on a level playing field.
Gender review of education sector plan, including review of the curriculum, textbooks, educationfacilities, etc.:Ensuring girls and boys participate in school in equal numbers is one aspect of achieving gender equality. Beyond access, however, gender equality in education also encompasses girls’and boys’ experiences in school, in terms of equal and fair treatment by teachers and the genderresponsiveness of the curriculum and learning materials, as well as the learning environment.This indicator intends to assess whether education processes, materials, facilities, etc. are beingreviewed from a gender perspective in order to address gender biases. It would be important to note also how results of such gender analyses are utilized to inform education policies and programmes and whether these are being conducted in a systematic manner, aspart of regular education sector planning processes.

21Education for All Mid-Decade AssessmentEast Asia and Pacific
1.7 Additional indicators
In order to understand better the true extent of disparities and gaps in achievement of the goalsof EFA, data from household surveys were considered whenever available. The analysis of theseindicators, often presented as anecdotal in nature, allow the progress note to take a perspectivenot available through standard administrative data collection. Thus, throughout the progressnote, the reader will find analysis of socio-economic dimensions of education participation andachievement, more complex analysis of gender in education as it is influenced by economics andculture, and analysis based on the unit of the household. Presentation of this data, together withadministrative data generated by the Ministries of Education and shared with internationalorganizations, becomes a powerful tool in understanding more fully the achievements and gapsin achievement of EFA’s goals.
1.8 Organization of the Report
This progress note consists of five chapters. Following this introductory chapter, chapter 2 presents the key trends in gender in education in the region based on the system/policy and coreindicators mentioned above. Data and analysis – both quantitative and qualitative in nature – aredrawn from national EFA MDA reports whenever available, together with internationally-comparable data, as relevant and available. Chapter 3 discusses cross-indicator linkages such aspoverty and gender disparities, gender issues in employment and education, factors affectingwomen’s literacy and the rural-urban divide. Chapter 4 summarizes the key issues and emergingconcerns emanating from the data, while Chapter 5 outlines conclusions determined from the progress review, as well as proposed recommendations towards achieving gender equalityby 2015.


23Education for All Mid-Decade AssessmentEast Asia and Pacific
Chapter 2
Trends and Patterns
The East Asia-Pacific (EAP) region is home to almost two billion people – one third of the world’spopulation and some 580 million children. From Mongolia in the north to Tonga in the south, andfrom Western China to the Cook Islands, the EAP covers some of the world’s most diverse areas.The EAP region combines Eastern Asia, Southeastern Asia and Oceania and is comprised of 33 countries. These include countries that participated in EFA reporting in 2000 – Cambodia, China,Cook Islands, Fiji, Indonesia, Kiribati, DPR Korea, Lao PDR, Malaysia, Marshall Islands, FederatedStates of Micronesia, Mongolia, Myanmar, Nauru, Niue, Palau, Papua New Guinea, Philippines,Samoa, Solomon Islands, Thailand, Timor-Leste, Tokelau, Tonga, Tuvalu, Vanuatu, and Viet Nam;as well as those countries that did not prepare EFA National Reports – Australia, BruneiDarussalam, Japan, New Zealand, Republic of Korea, Singapore and South Korea.
This Progress Note reports primarily on those countries engaged in EFA Reporting. Where datais available, the Progress Note also looks at the status of industrialized countries in the region.
2.1 Systems/policy indicators
2.1.1 Policies/legal platform
There are sufficient legal bases for promoting gender equality in education, with a foundation ininternational treaties such as the Convention on the Rights of the Child (CRC) and the Conventionon the Elimination of All Forms of Discrimination Against Women (CEDAW), to which most countries in the region are party.1 This is further strengthened and supported by commitmentsto the Beijing Platform of Action, the Millennium Development Goals, the Dakar Framework forAction, Education For All, and the Universal Declaration of Human Rights, which provides for theright to education for every citizen.
Towards meeting their obligations to these treaties and agreements, some countries, such asIndonesia, Lao PDR and Viet Nam, have adopted laws stipulating the right to education of all citizens without discrimination, including on the basis of sex. In Myanmar, this is provided for in the national constitution. In the cases of Lao PDR, Mongolia and Thailand, the principle of
1 All countries in the East Asia and Pacific region are party to the CRC. Most are also party to CEDAW, with the exception of Nauru, Niue, Palau and Tonga.

24 Gender Equality in EducationProgress Note
non-discrimination is stated in the constitution, supported by gender equality laws and policies(in Mongolia, the law has been drafted). Other countries, such as Fiji, Indonesia, Lao PDR, and Malaysia, also have laws in place in support of women, gender equality or gender mainstreaming in general (in Lao PDR, in the context of poverty reduction). In Fiji, outcome 6 of the Sector Development Plan states the need to enhance equality for girls by making comprehensive efforts to eliminate gender discrimination at all levels.2 In Malaysia, the NationalPolicy for Women was formulated in 1989 to ensure equal opportunities and benefits of development for men and women and to account for women’s needs in all sectors of nationaldevelopment. Applied within the context of education, emphasis has been placed on providingspecial assistance to disadvantaged groups in accessing education and on the diversification ofeducational opportunities, particularly in scientific and technical fields, in which girls/women areunderrepresented.3
Cambodia is one of the few countries to have developed specific policies in support of genderequality in education or gender mainstreaming within the education system. The CambodianGender Education Policy was drafted in 2003, followed by the formulation of the GenderMainstreaming Strategy in Education for 2006-2010 and the development of Quality Standardsand Indicators for Gender Mainstreaming in Education in 2006.4 These efforts were taken in conjunction with a Sector Wide Approach (SWAp) and are therefore closely linked to sector plansand budget review processes that cover the full breadth of education programming.
In relation to these laws and policies, countries have taken a variety of measures towards achieving gender equality in education. Several countries have conducted gender reviews ofeducation systems or plans, such as Cambodia, where a gender appraisal was carried out of theEducation Strategic Plan of 2001-2005.5 A number of countries, including China, Lao PDR,Mongolia and Thailand, have reviewed their curricula and learning materials from a gender perspective to identify gender stereotypes and bias. In Lao PDR, curriculum developers alsoreceived gender training, from which they developed supplementary learning materials, a newprimary education curriculum and textbooks.6
Furthermore, some countries have established national mechanisms in support of their policiesfor gender equality in education. For example, in Indonesia, a dedicated unit has been set up inthe Ministry of National Education to plan for and monitor efforts to ensure equitable access toand benefits from education provisions in cooperation with the Coordinating Ministry ofWomen’s Empowerment, which has the overall responsibility for the gender mainstreaming ofgovernment policies and strategies in all sectors.7 Cambodia has formed a GenderMainstreaming Secretariat under the National Education for All Committee, tasked with ensuring the implementation of strategies towards achieving gender equality in education,including girls’ equal access to education, enhancing gender equity in education managementand delivery services, and strengthening general technical capacity in education programmingin policy-making. The Secretariat is advised by the Steering Committee of GenderMainstreaming, Ministry of Education, Youth and Sport.8 In Lao PDR, the Gender and Ethnic
2 EFA MDA Report, Fiji, p. 68.3 EFA MDA Report, Malaysia.4 EFA MDA Report, Cambodia, as of November 2007, p. 136.5 Ibid, p. 137.6 Education for All Mid-Decade Assessment and Fast Track Initiative Report, Lao PDR, 13 February 2008, p. 109.7 2007 EFA Mid Decade Assessment, Sustaining EFA Performance in Indonesia, EFA Secretariat, Ministry of National Education, Republic
of Indonesia, p. 21.

25Education for All Mid-Decade AssessmentEast Asia and Pacific
Minority Education Unit (GEMEU) provides support for gender mainstreaming in general education, and there is also an Education and Gender Donor Working Group, chaired by the ViceMinister of Education, which plays a coordinating role.9
While strides have been made in forming the legal framework and strategies to promote genderequality in education in the region, gaps remain between policy and practice and fulfilling obligations as per the CRC and CEDAW. The Committees for the Rights of the Child and on theElimination of Discrimination Against Women have noted, in response to country reports basedon these international instruments, that people from ethnic minority groups and living in rural and remote areas, particularly women and girls, continue to face obstacles to accessingeducation in the region.10 In Thailand, regional disparities were also cited, particularly affectingchildren, especially girls, in the southernmost provinces.11
The Committee on the Elimination of Discrimination Against Women also voiced concern regard-ing the persistence of patriarchal attitudes and deep-rooted stereotypes in relation to the rolesand responsibilities of women and men that lead to the disadvantaged position of women in thelabour market and in political and public life in countries across the region. This is also reflectedin the limited academic choices of girls in school, as well as in terms of their subject choices andfields of study. For example, the Committee raised concerns with regard to the low representa-tion of girls in non-traditional fields such as science and technology in Malaysia, thereby limit-ing their career choices and earning potential.12 Women similarly lag behind in these fields in Fiji,with schools predominantly offering courses such as home economics and typing to girls.13 Thegovernment has sought to address this issue by providing scholarships to girls, resulting in theirincreased enrolment in non-traditional fields.
Despite the development and enactment of laws and policies in support of gender mainstreamingaround the region, in some cases these need to be strengthened, along with the associatedimplementing bodies and mechanisms, for full compliance with CEDAW. For example, theCommittee has called on countries such as Singapore and Vanuatu to elevate the status of the key institutions responsible for gender mainstreaming so that those institutions can effectively carry out their role.14 In addition, the Committee has noted in several cases thatteacher training must incorporate gender perspectives in order to build the knowledge andcapacity of teachers in this regard.
2.1.2 Gender budgeting
While policies are in place promoting gender mainstreaming and gender equality in educationin the region, the question is whether adequate resources are allocated in support of these policy commitments. Some countries have moved towards introducing gender budget initiativesto facilitate gender analysis in the formulation of their national budgets and in the allocation of
8 EFA MDA Report, Cambodia, as of November 2007, p. 137.9 Education for All Mid-Decade Assessment and Fast Track Initiative Report, Lao PDR, 13 February 2008, p. 108.10 “Mapping the Intersections of CEDAW & CRC Concluding Observations: Review of the Most Recent Asian State Party Reports (as of
August 2007)”, UNICEF/Wellesley Centers for Women.11 Ibid.12 Ibid.13 Ibid.14 Ibid, Committee on the Elimination of Discrimination Against Women, Concluding Observations, Vanuatu, June 2007.

26 Gender Equality in EducationProgress Note
resources. For example, the Philippine government adopted a gender and development budgetpolicy requiring all government agencies to allocate at least five per cent of their budget for gender and development. This initiative, led by the National Commission on the Role of FilipinoWomen (NCRFW), had been seen as a strategic means of ensuring adequate funding for thePhilippine Plan for Gender-Responsive Development (PPGD) 1995-2025. The aim was not to limitfunding for gender and development to five per cent but rather to use these funds to ensure that gender equality is addressed in the remaining 95 per cent of the budget. NCRFW’s monitoring of this policy’s implementation revealed that by 1997 the gender and developmentbudget was at around one per cent, far below the five per cent mark.15 In Malaysia, the government, in cooperation with UNDP, piloted a gender budgeting initiative in four ministries,including the Ministry of Education.16 This was followed up with the development of a manual ongender budgeting. There is also some reported information on gender budget initiatives of varying scales in the Republic of Korea, Thailand and Viet Nam, as well as in some Pacific Island countries, including Fiji and the Marshall Islands. Australia pioneered gender budgeting, but dataand analysis on the portions of its education budgets allocated to promoting gender equality in education have proved very difficult to obtain.
2.2 Core indicators
2.2.1 Gender parity in enrolment at all levels
Considerable progress has been made in countries in the East Asia and Pacific region in raisingenrolment rates and towards achieving gender parity, particularly at the primary education leveland increasingly at the secondary education level as well. Of countries for which data were available, 14 reached part of the first target of EFA goal 5, achieving gender parity in primary education by 2005, while nine attained gender parity at the secondary education level. One country, the Republic of Korea, fully achieved the target, with gender parity in enrolment at boththe primary and secondary education levels.
Gender gaps in enrolment remain, however. At the primary education level, all of the countrieswhich missed the 2005 gender parity target had lower proportions of girls enrolled than boys.But gender disparities were not to the disadvantage of girls in all cases. At higher levels of education – secondary and tertiary – the situation was more varied, with disparities to the disadvantage of boys in some countries and girls in others.
In Cambodia and Lao PDR, far fewer girls are enrolled compared with boys at the secondary andtertiary education levels, and efforts are needed to raise the enrolment rates of girls to be on parwith that of boys. On the other hand, in the Philippines, Malaysia, and Mongolia, the opposite isthe case, with boys’ enrolment rates significantly lower than those of girls.
15 “Review of Gender Budget Initiatives”, Community Agency for Social Inquiry, p. 19-20, and UNIFEM website section on gender budget initiatives.
16 Manual on Gender Budgeting in Malaysia, Ministry of Women, Family and Community Development, Malaysia and UNDP, 2005.

27Education for All Mid-Decade AssessmentEast Asia and Pacific
Less girls/women Parity Less boys/men
Far from the goal(GPI below 0.80)
Intermediate (GPI0.80 to 0.94)
Close to the goal(GPI 0.95 to 0.96)
Goal achieved(GPI 0.97 to 1.03)
Close to the goal(GPI 1.04 to 1.05)
Intermediate (GPI1.06 to 1.25)
Far from the goal(GPI above 1.25)
Primary Education
Indonesia, LaoPDR, SolomonIslands, Thailand,Tonga
Australia, Brunei,Cambodia, Fiji,Japan, Republicof Korea,Malaysia,Marshall Islands,Mongolia,Myanmar, NewZealand,Philippines,Samoa, Vanuatu
Secondary Education
Cambodia, LaoPDR, Papua NewGuinea
Niue, SolomonIslands, Tokelau,Vanuatu
Australia China, CookIslands,Indonesia, Japan,Republic ofKorea, Myanmar,Singapore Timor-Leste, Viet Nam
Brunei, MarshallIslands, Thailand
Fiji, Kiribati,Malaysia,Micronesia,Mongolia, Nauru,New Zealand,Palau, Philippines,Samoa, Tonga
Tertiary Education
Cambodia,Indonesia,Republic of Korea,Lao PDR, Vanuatu,Viet Nam
Japan China Australia, Fiji,Philippines,Thailand
Brunei, Malaysia,Marshall Islands,Mongolia, NewZealand, Tonga
Table 3: Gender Parity Index (GPI) of enrolment ratios for East Asia and the Pacific
Among the Pacific Island countries, only the Cook Islands achieved gender parity in secondaryeducation by 2005. Most of the other countries in the sub-region face wide gender gaps in enrolment at the secondary and tertiary education levels. In Vanuatu, girls are at the disadvantagein both secondary and tertiary education. In Fiji, Kiribati, Micronesia, Nauru, Palau, Samoa andTonga, the proportion of boys enrolled in secondary education is considerably lower than that ofgirls. This is also the case in tertiary education for Fiji, the Marshall Islands and Tonga.
Gender disparities are not only limited to developing countries but are prevalent in developedcountries in the region as well. In New Zealand, for example, the proportion of girls enrolled insecondary and tertiary education is far higher than that of boys. Furthermore, Australia wasamong the countries that missed the first target of EFA goal 5 in 2005, with the proportion of girls enrolled slightly lower than that of boys at the secondary education level. Data indicate,however, that higher proportions of girls then continue their education beyond this point, withdisparities to the disadvantage of boys at the tertiary level. Conversely, enrolment rates of girlstrail those of boys in tertiary education in Japan and the Republic of Korea, with considerablyhigher proportions of boys pursuing higher education.
Note: This is based on the net enrolment ratio for primary education and the gross enrolment ratios for secondary and tertiary education forcountries for which data were available.Source: UNESCO, 2007, Education for All Global Monitoring Report 2008. Education for All by 2015: Will we make it?

28 Gender Equality in EducationProgress Note
0.90
Niue
Tonga
Samoa
Palau
Mongolia
Mala
ysia
Cook Isla
nds
Cambodia Fij
i
Lao P
DR
Philippin
es
Indones
ia
New Z
ealan
d
Mar
shall
Islan
ds
BruneiD
aruss
alam
Pacifi
c
Mac
ao, C
hina
Solom
on Islan
ds
Republic
of K
orea
Thailan
d
East A
sia
Papua N
ew G
uinea
Viet N
amChin
a
0.95
1.00
1.05
1.10
1.15
1.20
1.25
1.30
1.35
1.40
1999 2005
2.2.2 Pre-primary education
In pre-primary education, gender disparities tend to be to the disadvantage of boys, with higherproportions of girls enrolled. Several countries such as Niue, Tonga, Malaysia, Cambodia and Fijisaw disparities against boys worsen from 1999 to 2005. In the Cook Islands, the enrolment ratioof girls out of boys was within the gender parity band, but there has been a shift over time, andfar lower proportions of boys are enrolling than girls. In a few countries such as Papua NewGuinea, Viet Nam and China, the trend has been in the opposite direction, with lower proportionsof girls enrolling than boys and gaps widening since 1999. For the East Asia sub-region overall,this has also been the trend.
Figure 1: Gender Parity Index for gross enrolment ratio in pre-primary education
Source: UNESCO 2007, EFA Global Monitoring Report 2008
In looking at new entrants to primary grade 1 with some form of ECCE experience, in Mongolia,overall disparities exist to the disadvantage of boys. Interestingly, disparities intensified in urbanareas (1.14 GPI) but persisted in rural areas (1.07).17
Some countries have made strides towards closing the gender gap in pre-primary enrolment,including Lao PDR, the Philippines, the Marshall Islands and Brunei Darussalam. Lao PDR andthe Philippines are close to achieving gender parity, and the latter two countries are now withinthe gender parity band.
17 Mongolia Ministry of Education, Culture and Science, 2008

29Education for All Mid-Decade AssessmentEast Asia and Pacific
0.90
0.92
0.94
0.96
0.98
1.00
1.02
1.04
Philippin
es
East Asia
Cambodia
Maca
o, Chin
a
Lao PDR
Mongolia
Myanm
ar
Malaysia
Republic of K
orea
1999 2005
One consideration in looking at GPI at the pre-primary education level is that overall enrolmentratios for girls and boys may be quite low for many of the countries. For example, in Cambodia,the GPI for GER in pre-primary education is 1.08, indicating a disparity to the disadvantage ofboys. The GER, however, is only nine for males and 10 for females.17 Therefore, the trend in onedirection or another in some cases may be in relation to a relatively small segment of the population, and disparities may reverse – from the advantage of girls to the disadvantage of girls– at the primary education level once more children are enrolled. Furthermore, national figuresmay conceal local disparities, such as girls having less access to schools in rural, remote andpoor areas. Numbers also do not reflect differences in treatment and socialization of girls andboys, such as censure by teachers of what is considered gender atypical play (e.g. boys playingwith dolls) and whether girls have equal access to toys and instructional materials.18
2.2.3 Basic education
a. Primary education enrolment
Figure 2: Gender Parity Index for net enrolment ratios in primary education, 1999 and 2005
Source: UNESCO GMR 2008
Further examination of progress towards gender parity in enrolment at the primary educationlevel over time, from 1999 to 2005, reveals that a number of countries in the East Asia sub-regionachieved gender parity in primary education enrolment even prior to the target date of 2005, asper the Dakar Framework for Action, EFA Goal 5, and Millennium Development Goal 3. Some
17 2008 EFA Global Monitoring Report, p. 269, Table 3B. 18 Strong Foundations for Gender Equality in Early Childhood Care and Education, UNESCO Bangkok 2007.

30 Gender Equality in EducationProgress Note
0.50
Indonesia
Gen
der
Par
ity
Ind
ex
Cambodia Lao PDR Myanmar
Maximum National Minimum
Mongolia
0.60
0.70
0.80
0.90
1.00
1.10
1.20
countries made remarkable strides in this time period, including Mongolia, in which disparitiesto the disadvantage of boys diminished to near-parity. In Cambodia, gender parity was achievedby 2005, closing a wide gender gap to the disadvantage of girls that existed in 1999. In somecases, however, disparities are deepening and achievements in attaining gender parity appear to be in danger of being undone with the proportion of boys enrolling in comparison to girlsdropping, such as in Myanmar and the Philippines.
More importantly, further disaggregation of data reveals the range in the levels of disparity thatexists within countries which may not fully be reflected in national aggregate figures. InCambodia, Myanmar and Mongolia, for example, national level data indicate that gender parityhas been achieved in primary education enrolment. However, a closer look at the sub-nationallevel shows that there are significant disparities in parts of these countries – to the disadvantageof girls in Cambodia and to the disadvantage of boys in Myanmar and Mongolia. Another casefrom Indonesia illustrates how wide the range in disparity levels can be, from a very low enrolment ratio for girls compared with boys in one part of the country (GPI 0.56), to parity (1.01)in another.
Figure 3: Sub-national disparities in the Gender Parity Index for net enrolment ratio in primary education
Source: National EFA Report/Datasets
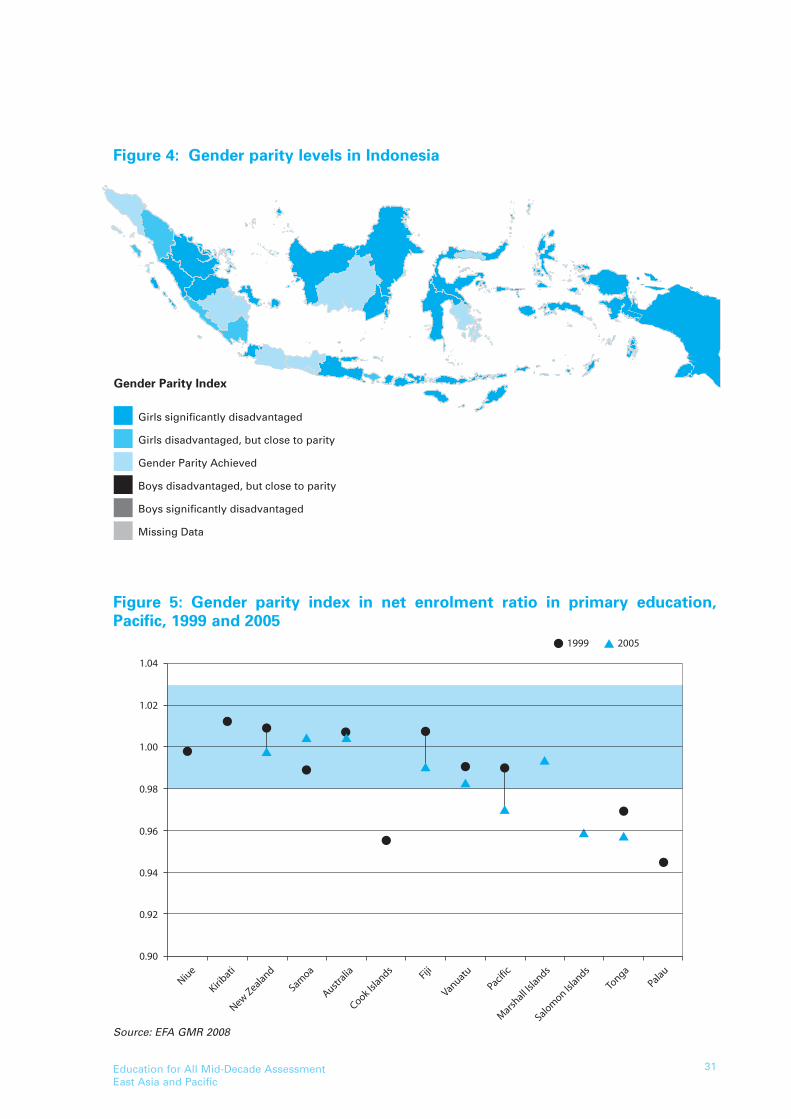
A map showing the gender parity levels in Indonesia (Figure 4) further pinpoints the regions of the country with the widest gaps and can be useful in identifying areas which may require targeted interventions. As can be seen, for example, in parts of Java and Kalimantan, the situation in neighbouring provinces may differ considerably based on the local context. As aresult, policies are needed that are responsive to these differences and their underlying causes.
31Education for All Mid-Decade AssessmentEast Asia and Pacific
0.90
Niue
Kiribati
New Zealand
Samoa
Australia
Cook Islands
Fiji
Vanuatu
Pacific
Marsh
all Isla
nds
Salom
on Islands
Tonga
Palau
0.92
1999 2005
0.94
0.96
0.98
1.00
1.02
1.04
Gender Parity Index
Girls significantly disadvantaged
Girls disadvantaged, but close to parity
Gender Parity Achieved
Boys disadvantaged, but close to parity
Boys significantly disadvantaged
Missing Data
Figure 4: Gender parity levels in Indonesia
Figure 5: Gender parity index in net enrolment ratio in primary education,Pacific, 1999 and 2005
Source: EFA GMR 2008

At the national level, most of the countries in the Pacific sub-region had achieved gender parity in primary education enrolment by 1999, well before the EFA Goal 5 target of 2005. Theexceptions were the Cook Islands, Palau, Solomon Islands, and Tonga, where the disparitieswere to the disadvantage of girls in all cases. In Tonga, the gender gap widened slightly since1999, from a GPI of 0.97 (or parity) to 0.96 in 2005. The GPI for Solomon Islands was also 0.96 in2005 – close to gender parity.
b. Survival rates
Table 4: Gender disparities in survival rates to the last grade of primary education, 1999 and 2004
Source: EFA GMR 2008
As is evident from the data presented above, much has been achieved in the region towardsachieving gender parity in primary education enrolment. It is also important to consider, however,whether girls and boys are staying on to complete at least a minimum level of basic educationfor sustainable literacy and other important foundational skills. One of the indicators in thisregard is the survival rate to grade 5, although availability of this data is limited. While disparitiesto the disadvantage of girls remain in some countries with regard to enrolment in primary education, data suggest that once girls are enrolled in school, they tend to stay in school at ratesequal to or higher than boys. In Lao PDR, for example, girls remain slightly disadvantaged interms of enrolment, but those who enter primary education survive at rates equal to their malecounterparts. In five countries, there were clear disparities resulting in higher survival rates forgirls, with Kiribati (1.16 GPI) and the Philippines (1.13 GPI) reporting the greatest disparitiesbetween the sexes. Disparities in favour of boys in terms of survival rates to grade 5 were only evident in Indonesia with a GPI of 0.94. In the majority of countries for which data wereavailable, gender parity was achieved in survival rate to grade 5.
32 Gender Equality in EducationProgress Note
Higher survival for boys(1 country)
Gender Parity achieved inSurvival Rate to Grade 5
by 2004 (8 countries)
Higher survival for girls(5 countries)
GPI GPI GPI
1999 2004 1999 2004 1999 2004
Indonesia … 0.94 Brunei Darussalam 1.00 1.01 Cambodia 0.93 1.05
Fiji 0.97 0.97 Kiribati … 1.16
Lao PDR 0.98 0.98 Myanmar … 1.06
Macao, China … 1.01 Philippines … 1.13
Malaysia … 0.99 Tonga … 1.07
Papua New Guinea 0.91 0.99
Republic of Korea 1.00 1.00
Viet Nam 1.08 0.99

33Education for All Mid-Decade AssessmentEast Asia and Pacific
In the Philippines, disparities favouring girls are consistent across all provinces but to varyingdegrees of severity. In provinces with the highest overall survival rates, the disparity betweenboys and girls tends to be smallest. Metro Manila reported the most equitable rates of survival between the sexes, with just over one percentage point separating boys and girls.Western Mindanao (10.55), Western Visayas (11.38) and Central Visayas (13.03) report the largestpercentage gaps between boys and girls.
Figure 6: Proportion of pupils starting grade 1 who reach grade 5 (survival rate),Philippines by province, 2005-2006
Source: Philippines EFA MDA Dataset
Box 2: Repetition Rates
Gendered differences can be measured in various aspects of school performance. Significant differences in the rates of those students who reach grade 5 have been outlined above. Similarly,we can see gender-based differences in repetition rates in primary education as well. InIndonesia, at the national level, the average repetition rate for children in grade 1 is seven percent. There is a more than two per cent difference in repetition rates amongst boys (8.07) andgirls (5.82). While this difference may seem insignificant, in a country with a large school-going population, 2 percentage points represents thousands of children, and significant inefficienciesof the education system. In general, Indonesia reports significant disparities in quality of education by province, with repetition rates ranging from below one per cent in Jakarta (0.7%)to more than eighteen per cent in Bangka Belitung (18.22%). The UNICEF Progress Note onQuality Education looks more closely at this dimension of quality education and the internal disparities that exist.
0
Centra
l Min
danao
Easte
rn V
isaya
s
Souther
n Min
danao
Norther
n Min
danao
Wes
tern
Min
danao
Cordille
ra R
egio
n
Wes
tern
Visa
yas
Mim
aropa
Centra
l Visa
yas
Centra
l Luzo
n
Met
ro M
anila
Iloco
s Reg
ion
Bicol R
egio
n
Carag
a
Calabar
zon
Cagay
an V
alley
20
10
30
40
50
per
cen
t 60
70
80
90
100 Female Male

34 Gender Equality in EducationProgress Note
Brunei Darussalam
Philippines
Mongolia
Australia
Myanmar
Marshall Islands
Solomon Islands
Malaysia
East Asia
Pacific
Vanuatu
Lao PDR
New Zealand
Macao, China
Fiji
Thailand
Republic of Korea
Cambodia
0 25 50
per cent
75 100
Female
Male
c. Out-of-school children
Figure 7: Out-of- primary-school children by sex, 2005
Source: UNESCO EFA GMR 2008
In spite of efforts towards universal primary education and gender parity, 9.5 million childrenremain out of school in the region, with the percentage of girls out-of-primary-school slightlyhigher at 52 per cent in East Asia and the Pacific. But national data suggest that percentages ofout-of-school children by sex also vary considerably by country, with girls accounting for up to80 per cent of all out-of-primary-school children in the Republic of Korea (82 per cent) andCambodia (85 per cent). Brunei Darussalam reported the largest disparity against boys, where 63per cent of the total out-of-primary-school population was male.

35Education for All Mid-Decade AssessmentEast Asia and Pacific
Box 3: Lao PDR: Reaching unreached girls
The Lao Basic Education Project (BEP) was initiated in 1998 by the Ministry of Education, LaoPDR, in cooperation with the Asian Development Bank. The primary objective of the project wasto improve education access for girls from ethnic minority groups who face multiple barriers toenrolment and retention in school, including extreme poverty, the lack of importance placed ongirls’ education, distance from school, and other cultural and linguistic barriers.
To meet the objective, a three-pronged approach was employed, as follows:
Expanded access, community mobilization and targeted assistance. Primary schools were constructed for easier access in ethnic minority communities. The focus was on buildingtwo and three-classrooms and multigrade schools in selected districts in 11 provinces.Furniture was also supplied to schools constructed under the project. In addition, DistrictEducation Bureau (DEB) offices were constructed and provided with the requisite furnitureand equipment. This was coupled with community mobilization campaigns to raise awareness of the importance of primary schooling for all children and to encourage parents to contribute to the village school’s development and send their children, particularly girls to school, allowing them to complete all five years of primary schooling.
Relevance, Quality and Efficiency. Parallel co-financing from AusAID for the Lao AustraliaBasic Education Project (LABEP) focused on creating an integrated quality improvementsystem. Such a system includes developing appropriate learning materials for school-agechildren who do not speak the national language, a common barrier to education for manyethnic minority children; providing additional support for teachers; and recruiting andtraining local teachers from ethnic minority groups. Furthermore, steps were taken toimprove the quality of pre-service training for teachers who would eventually teach inmultigrade classes; to recruit and train a cohort of four local trainees from ethnic minoritygroups and to provide sufficient numbers of ethnic teachers in schools where enrolmentshad increased. Core textbooks and teacher guides for use in project schools were also printed.
Improved management efficiencies. The capacity enhancement of the Ministry ofEducation to manage, plan and monitor the education sector through the effective use ofhigh quality and timely information was supported. This included the installation of a LocalArea Networking (LAN) in the Ministry. The Ministry also extended district level training ofeducation information management from the initial six DEBs in the pilot phase to all 52DEBs under the project. In addition, it was agreed that construction of 12 DEBs, includingthe initial six pilot DEBs, would be a priority so that they could be used as training centresfor staff of all 52 project DEBs.

36 Gender Equality in EducationProgress Note
Box 3: Lao PDR: Reaching unreached girls (continued)
The original target for construction under the project was 425 schools (of which 375 would bemultigrade schools) and 50 DEB offices. By the time the project was completed, including anextension period, 504 schools (of which 442 were multigrade schools) and 43 DEB offices wereconstructed. The number of schools built was 19 per cent over the target, and this resulted in aneed for more ethnic minority teachers to be trained. With the project extensions, loan fundswere able to support the training of an additional 112 ethnic minority trainees over a three-yearprogramme.
Regular annual surveys were conducted from 2002 to 2006 with a sample of 43 schools from districts in the first phase of the project. Results indicate that the project was especially successful at increasing the number of ethnic minority children attending and remaining atschool. In particular, the survival rate to grade 5 increased dramatically. The average annualincrease in survival rates to Grade 5 in all districts of provinces where BEP/LABEP has been implemented is more than double that of the national average annual increase, while the increase for provinces where only some districts have been included is similar to the national average.
There is a consistency of trends to indicate that BEP/LABEP has made a significant contributionto improving access and retention in these areas and that more ethnic minority children areattending schools for a higher number of grade levels. Analysis of project results, however, indicated some areas to further evaluate project outcomes, including assessing the effectivenessof LABEP supplementary materials, textbooks, and other learning materials and the placementof LABEP graduates in permanent teaching positions.
d. Transition to secondary education
Girls and boys are transitioning from primary to secondary education at relatively equal rates inmuch of the region. In Cambodia, Lao PDR, and Solomon Islands, however, fewer girls are goingon to secondary education than boys, while in Brunei, Tonga and Vanuatu, the situation is thereverse, with more girls transitioning to secondary education than boys.

37Education for All Mid-Decade AssessmentEast Asia and Pacific
Lao P
DR
Solom
on Islan
ds
Cambodia
Mya
nmar
Palau
Papua N
ew G
uinea
Indones
ia
Australi
a
Korea R
ep
Philippin
es
Samoa
Mongolia Fij
i
Brunei
Tonga
Vanuat
u
0.90
0.940.95 0.95
0.98 0.990.99 1.00 1.00 1.00
1.011.02 1.03 1.03
1.061.07
1.09
Gen
der
Par
ity
Ind
ex
0.95
1.00
1.05
1.10
1.15
Figure 8: Gender parity index for transition to secondary education, selected countries, 2004
vv
Source: EFA GMR 2008
Studies have been conducted in Lao PDR and Viet Nam to look into the reasons behind persistentdisparities between girls and boys in the transition to secondary education, particularly in the context of ethnic minority groups. In both countries, data indicate that girls in these communities are victims of bias on multiple levels, including on the basis of their sex and ethnicity. For example, in Viet Nam, school enrolment for males between 15-17 years of age is thesame (73 per cent) for both the majority Kinh ethnic group and ethnic minorities. However, for girls,there is still a 10 percentage point difference in enrolment based on ethnicity (71 per cent for Kinh,61 per cent for ethnic minorities).19 Furthermore, it is reported that at least one quarter of ethnicminority women are illiterate, and approximately one-fifth of ethnic minority girls have neverattended school20 – both statistics which are far higher than the national average.
Both studies point to economic and financial factors among the key barriers to girls’ ability tocontinue on to lower secondary school, with parents finding it difficult to cover the costs of sending their children to school, such as the cost of uniforms and school supplies. In addition,the burden of caring for siblings and household chores often falls on the shoulders of girls, preventing them from continuing their education. In the case of some of the communities in LaoPDR, certain cultural practices also pose obstacles for girls’ education. Exclusionary traditionspromoting early marriage and child-bearing, combined with school regulations regarding the
19 The Transition of Ethnic Minority Girls in Vietnam from Primary to Secondary Education, UNICEF Viet Nam, Ministry of Education and Training, Vietnam, and UNESCO Hanoi, 2008, p. 11.
20 Vietnam: Gender Situation Analysis, Asian Development Bank, 2005, p. iii.

38 Gender Equality in EducationProgress Note
1
0
Male Urban Male Rural
Female Urban Female Rural
0.2
0.4
0.6
0.8
1.0
Pro
po
rtio
n
Grade3 5 7 9
attendance of married and pregnant students, force girls to drop out or deny them re-entry toschool. Language was also a barrier in some cases.21 Other factors cited in the two studiesinclude the poor quality of teaching and learning, inadequate school infrastructure, perceptionsof girls and parents of the importance of girls’ education, as well as safety and security concerns.
Figure 9: Attainment profiles of girls and boys ages 15-19, Lao PDR, 2000
Source: Analysis of data based on MICS2, econ.worldbank.org/projects/edattain
Analysis of attainment profiles of boys and girls in Lao PDR further reveal disparities, which arebased on both gender and location. There are significant differences in the attainment profiles ofurban and rural dwellers. At every grade level, a much larger and consistent proportion of theurban population – both boys and girls – are attaining education when compared to the ruralpopulation. Very little difference is seen between boys and girls in urban areas. Amongst therural population, however, significant disparities exist favouring boys, with the gap widening atthe transition between primary and secondary education.
The study in Viet Nam further highlights the disparities that may exist at the sub-national level,in certain regions or communities, which may not be reflected in national aggregate statistics.National data indicate that gender parity has been achieved in secondary education enrolment(GPI for GER 0.97 in 2005).22 Digging deeper, disparities become more apparent. The study resultsdemonstrate the need for in-depth research to understand the reasons behind these disparities in these communities, which may vary based on the particular contexts and amongdifferent ethnic minority groups, for more targeted interventions to address these gaps.
21 Gender and Ethnicity in the Context of Equality and Access in Lao Education, Ministry of Education, Lao PDR and UNESCO Bangkok, 2003, pp. 33-34.
22 2008 EFA Global Monitoring Report, Annex, Table 8.

39Education for All Mid-Decade AssessmentEast Asia and Pacific
Gender Parity Index
Girls significantly disadvantaged
Girls disadvantaged, but close to parity
Gender Parity achieved
Boys disadvantaged, but close to parity
Boys significantly disadvantaged
Missing data
North East
North West
Red River Delta
North Central Coast
South Central Coast
Central Highlands
South East
Analysis from the 2006 Multiple Indicator Cluster Survey in Viet Nam shows what appear to bedistinct disparities by region – and thus ethnic groups – to the disadvantage of girls in the Northand boys in the South.
Figure 10: Gender parity in net attendance ratio in secondary or higher education, Viet Nam, 2006
Source: GSO Viet Nam, MICS3, 2006
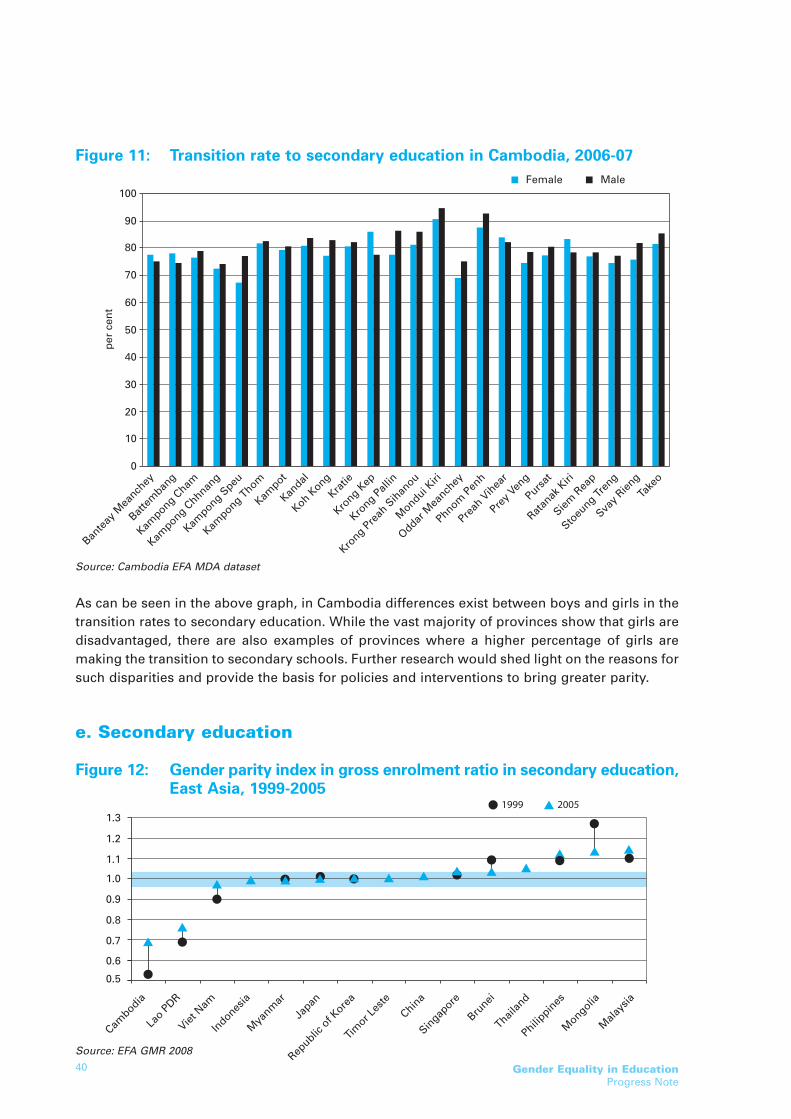
1999 2005
0.5
Cambodia
Lao P
DR
Viet N
am
Indones
ia
Mya
nmar
Japan
Republic
of K
orea
Timor L
este
China
Singap
ore
Brunei
Thailan
d
Philippin
es
Mongolia
Mala
ysia
0.6
0.7
0.8
0.9
1.0
1.1
1.2
1.3
40 Gender Equality in EducationProgress Note
0
10
Bante
ay M
eanch
ey
Batte
mban
g
Kampong C
ham
Kampong C
hhnang
Kampong S
peu
Kampong T
hom
Kampot
Kandal
Koh Kong
Kratie
Krong K
ep
Krong P
allin
Krong P
reah
Sih
anou
Mondui K
iri
Oddar M
eanch
ey
Phnom P
enh
Preah
Vih
ear
Prey V
eng
Pursat
Ratan
ak K
iri
Siem R
eap
Stoeu
ng Tren
g
Svay R
ieng
Take
o
20
30
40
50
per
cen
t
60
70
80
90
100Female Male
Figure 11: Transition rate to secondary education in Cambodia, 2006-07
Source: Cambodia EFA MDA dataset
As can be seen in the above graph, in Cambodia differences exist between boys and girls in the transition rates to secondary education. While the vast majority of provinces show that girls aredisadvantaged, there are also examples of provinces where a higher percentage of girls are making the transition to secondary schools. Further research would shed light on the reasons forsuch disparities and provide the basis for policies and interventions to bring greater parity.
e. Secondary education
Figure 12: Gender parity index in gross enrolment ratio in secondary education,East Asia, 1999-2005
Source: EFA GMR 2008

41Education for All Mid-Decade AssessmentEast Asia and Pacific
1999 2005
0.70
Papua N
ew G
uinea
Solom
on Islan
ds
Vanuat
u
Australi
a
Mar
shall
Islan
ds
Micr
onesia
(FS)
Fiji
New Z
ealan
dPala
u
Tonga
Samoa
Kiribat
i
0.75
0.80
0.85
0.90
0.95
1.00
1.05
1.10
1.15
1.20
In the East Asia sub-region, a number of countries achieved the gender parity target for secondaryeducation by 2005 – some prior to the target date – including Indonesia, Myanmar, Japan, theRepublic of Korea, Timor-Leste, China and Singapore. Viet Nam closed the gender gap to the disadvantage of girls since 1999 to reach gender parity in 2005 (at the national level). Brunei alsomoved towards gender parity over the period from 1999 to 2005, raising the level of boys’ enrolment closer to that of girls. Significant progress was made during this period in Mongoliain addressing the gender gap in enrolment, but boys’ enrolment still remains far lower than thatof girls. In the Philippines and Malaysia, disparities to the disadvantage of boys have worsenedslightly since 1999. In Cambodia and Lao PDR, girls’ enrolment continues to lag far behind thatof boys at the secondary education level, although the situation has improved over the years.
Figure 13: Gender parity index in gross enrolment ratio in secondary education,Pacific, 1999-2005
Source: EFA GMR 2008
Gender disparities in secondary education enrolment persist throughout the Pacific sub-region,to the disadvantage of girls in some cases and boys in others. Some countries have made stridessince 1999 towards gender parity, including Papua New Guinea and Solomon Islands, whichhave lessened the gap to the disadvantage of girls, as well as Fiji, Tonga and Kiribati, where boys’enrolment ratios have moved closer to that of girls. In Australia, however, the trend over timehas not been positive, with a move from gender parity in 1999 to disparities to the disadvantageof girls in 2005.

42 Gender Equality in EducationProgress Note
0
20
Australi
a
Viet N
am
Lao P
DR
Vanuat
u
Mya
nmar
Cambodia
Solom
on Islan
ds
Papua N
ew G
uinea
Timor-L
este
Indones
ia
Singap
ore
Thailan
d
Mala
ysia
China
Mar
shall
Islan
ds
Samoa
Philippin
es
Kiribat
i
Micr
onesia
(FS)
Fiji
Mongolia
Brunei
Daruss
alam
Tonga
Republic
of K
orea
Palau
Japan
New Z
ealan
d
40
60
80
100
120
140
160FemaleMale
Although several countries have achieved gender parity in secondary education in enrolment inthe region, it is important to note that overall enrolment ratios remain rather low in some cases.For example in Timor-Leste, while girls and boys are enrolling on an equal basis, the enrolmentratio is 52 per cent, meaning that nearly half of the secondary-education-age population is not inschool. Similarly, in Myanmar, the GPI is 0.99, but only 41 per cent of boys and 40 per cent ofgirls are enrolled in secondary education. Thus, concerted efforts must still be made to raise theenrolment ratios of both girls and boys.
Figure 14: Gross enrolment ratio for secondary education, 2005
Source: EFA GMR 2008
As the data above indicate, there are wide variations in terms of progress towards achieving gender parity in secondary education enrolment across the region. This is even the case whenconsidering the Mekong sub-region, with countries that share many similarities in history, culture and traditions. Of the five countries, only Myanmar has achieved gender parity in secondary education enrolment at the national level, although the enrolment ratios for girls andboys are low overall at around 40 per cent. Thailand is faced with a situation in which the proportion of boys enrolled in secondary education is far lower than that of girls, while in LaoPDR and Cambodia, the opposite is the case, with the gap to the disadvantage of girls. Viet Namis close to achieving gender parity, but efforts are still needed to raise the enrolment of girls tothe level of boys.

43Education for All Mid-Decade AssessmentEast Asia and Pacific
Gender Parity Index
Girls significantly disadvantaged
Girls disadvantaged, but close to parity
Gender Parity achieved
Boys disadvantaged, but close to parity
Boys significantly disadvantaged
Missing data
Myanmar
Thailand
Lao PDR
Viet Nam
Cambodia
Mon
Tanintharyi
Kayin
Kayah
Shan (East)
Shan (North)
Kachin
Shan (West)
Yangon
Bago
Magway
Mandalay
Sagaing
Chin
Rakhine
Ayeyarwady
Figure 15: Gender parity index in net enrolment ratio in secondary education in Mekong Sub-region and Myanmar
Source: EFA GMR 2008 and Myanmar EFA MDA Dataset
Looking more closely at Myanmar, where national level figures indicate gender parity has beenachieved, it can be seen that in actuality only two provinces, Sagaing and Mandalay, haveachieved gender parity. Otherwise, in most of the country, there are significant disparities, to thedisadvantage of girls in the western part of the country and to the disadvantage of boys in theeast and the south. The case of Myanmar illustrates how these gaps may be lost in the processof aggregation and underlines the importance of disaggregating data not only by sex but also byadministrative area, income levels, ethnicity, etc. to identify more accurately disparities andstrategies to address them.
44 Gender Equality in EducationProgress Note
Box 4: Indonesia: Education towards eliminating girls’ exploitation23
Karawang is a district in Indonesia where many girls are in danger of dropping out of school and becoming victims of commercial sexual exploitation, working as domestic labourers or marrying at a young age. In 2004, an estimated 400 cases of child trafficking were recorded inthe district. Some 340 of those cases involved the trafficking of children to the Middle East, mostly to Saudi Arabia, to become child domestic workers.
Overall, Karawang suffers from poverty, low literacy rates and low education levels. The district’s2001 Human Development Index was 60.9, and its Gender Development Index was a mere 0.46,indicating that girls’ quality of life and access to basic social services such as education are poor.This can be linked to long-standing gender bias in the community: girl children are the wealth of the family and are expected to boost the household income even at the expense of their education. Poverty leads to child labour, which is a major obstacle to the goal of education forall, since a child who is employed full time cannot attend school. Combining work and schooljeopardizes school attendance and performance, and child domestic workers often drop out dueto fatigue and the inability to keep up with their studies.
Beginning in 2004, the Indonesian Child Welfare Foundation (YKAI), a child rights and protectionorganization, carried out a project in collaboration with ILO and under the aegis of the InternationalProgramme on the Elimination of Child Labor (ILO-IPEC) to rehabilitate victims of child traffickingin Karawang. The project undertook several activities towards this overall objective:
1) Provision of direct education assistance - YKAI opened two centres where children received catch-up education, tutoring, vocational training, computer and English classes, and the opportunities to play sports and learn hobbies. This built their self-esteem and opened their minds to new possibilities. To increase the quality of education, YKAI set up a mobile library made up of four trucks, each outfitted with shelves to hold its share of 4,000 contributed books. The mobile library visited 25 primary schools in Karawang twice weekly.
2) Advocacy to prevent and eliminate the exploitation of child domestic workers - Parents and children were the main targets of the project, but it also aimed to encourage the participation of civil society and government institutions in the prevention and elimination of exploitation of child domestic laborers. The local government of Karawang was a valuable partner in social mobilization and agreed to draft a perda (equivalent of a local ordinance) on anti-trafficking with specific references to child domestic labor. To sensitize and engage the community in the process, YKAI established a viable communication channel – community radio, which was identified to be the best medium.
The resulting perda affirmed the intent of the Karawang district government to establish a “trafficking in children and women-free zone.” The legislation stresses the importance of education and reminds local governments of their obligaton to “ensure that each child can join the nine years of compulsory schooling.” Community participation and monitoring were
23 Towards Equal Opportunities for All, Empowering Girls Through Partnerships in Education, East Asia and Pacific Regional UNGEI, 2007, pp. 69-75.
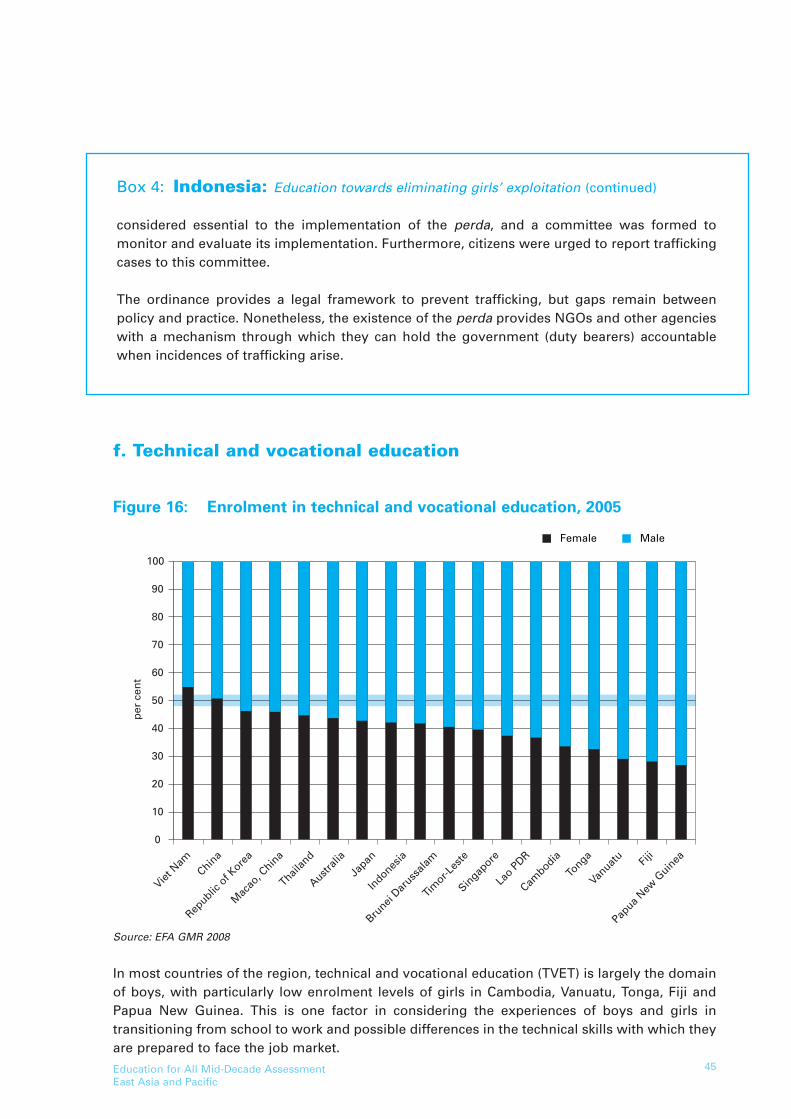
45Education for All Mid-Decade AssessmentEast Asia and Pacific
0
10
20
30
40
50
per
cen
t
60
70
80
90
100
Female Male
Viet N
amChin
a
Republic
of K
orea
Mac
ao, C
hina
Thailan
d
Australi
a
Japan
Indones
ia
Brunei
Daruss
alam
Timor-L
este
Singap
ore
Lao P
DR
Cambodia
Tonga
Vanuat
u Fiji
Papua N
ew G
uinea
f. Technical and vocational education
Figure 16: Enrolment in technical and vocational education, 2005
Source: EFA GMR 2008
In most countries of the region, technical and vocational education (TVET) is largely the domainof boys, with particularly low enrolment levels of girls in Cambodia, Vanuatu, Tonga, Fiji andPapua New Guinea. This is one factor in considering the experiences of boys and girls in transitioning from school to work and possible differences in the technical skills with which theyare prepared to face the job market.
Box 4: Indonesia: Education towards eliminating girls’ exploitation (continued)
considered essential to the implementation of the perda, and a committee was formed to monitor and evaluate its implementation. Furthermore, citizens were urged to report traffickingcases to this committee.
The ordinance provides a legal framework to prevent trafficking, but gaps remain between policy and practice. Nonetheless, the existence of the perda provides NGOs and other agencieswith a mechanism through which they can hold the government (duty bearers) accountablewhen incidences of trafficking arise.

46 Gender Equality in EducationProgress Note
FemaleMale
Niue
Pre-Primary Education Primary Education Secondary Education
Nauru
Macao, China
Philippines
Singapore
New Zealand
Myanmar
Viet Nam
Kiribati
Republic of Korea
Samoa
Brunei Darussalam
Tokelau
Malaysia
Japan
Indonesia
Thailand
Fiji
China
Lao PDR
Cambodia
PNG
Marshall Islands
Timor-Leste
0 25 50 75per cent per cent per cent
100 0 25 50 75 100 0 25 50 75 100
Niue
Nauru
Macao, China
Philippines
Singapore
New Zealand
Myanmar
Viet Nam
Kiribati
Republic of Korea
Samoa
Brunei Darussalam
Tokelau
Malaysia
Japan
Indonesia
Thailand
Fiji
China
Lao PDR
Cambodia
PNG
Marshall Islands
Timor-Leste
Niue
Nauru
Macao, China
Philippines
Singapore
New Zealand
Myanmar
Viet Nam
Kiribati
Republic of Korea
Samoa
Brunei Darussalam
Tokelau
Malaysia
Japan
Indonesia
Thailand
Fiji
China
Lao PDR
Cambodia
PNG
Marshall Islands
Timor-Leste
g. Teachers
Figure 17: Disparities in the presence of male and female teachers
Source: EFA GMR 2008
Viet Nam is the exception to the above trend, with more girls enrolled in TVET than boys, and inChina, girls’ enrolment is on par with that of boys. It is important to note, however, in the caseof Viet Nam that TVET constitutes only 5 per cent of total secondary education enrolment.Studies that take into account participation in informal and private training programmes and notjust publicly provided opportunities indicate that women in Viet Nam are at a disadvantage inacquiring needed skills, which limits their employment prospects24 and prospective salary levels.
24 The Gender Dimension of School to Work Transition: East Asia and the Pacific Region, Draft for Discussion, East Asia and Pacific Regional UNGEI, June 2008.

47Education for All Mid-Decade AssessmentEast Asia and Pacific
In many of the countries of the region, the teaching profession is highly feminized, particularlyat the lower education levels. With the exception of Papua New Guinea, where there are mostlymale teachers at all levels, all countries for which data is available have a predominantly femaleteaching force at the pre-primary education level. The majority of teachers at the primary education level are also female, except in Lao PDR, Cambodia, Papua New Guinea, the MarshallIslands and Timor-Leste. These countries also have more male teachers at the secondary education level, along with China and Indonesia.
Table 5: Proportion of female teachers by sub-sector in Lao PDR, 2001/01-2005/06
Source: Lao PDR EFA Mid-decade Report
While the majority of teachers overall are women, there are few female TVET teachers. Forexample, in Indonesia, female teachers are underrepresented in public secondary technical andvocational schools by a ratio of about 1:2.25 In Lao PDR, where there is generally a shortage offemale teachers, there are considerable less female teachers of TVET than primary and generalsecondary education.
h. Education governance
While the teaching profession is dominated by women, limited available data seem to indicatethat schools and education systems are being managed largely by men. In school administrationin Mongolia, for example, where far higher proportions of women go on to tertiary educationand women teachers outnumber their male counterparts, only 29.3 per cent of directors anddeans of general education schools, 16.1 per cent of heads of educational and cultural centers,10 per cent of directors of vocational training centers and 15.5 per cent of college and universitydirectors are women.26 In Cambodia, women comprise a mere seven per cent of school principals and nine per cent of vice principals. At the Ministry of Education, Youth and Sport,2005 data indicate that there are no female directors general at the central ministry. Amongdeputy directors general, only six per cent are females. At the provincial level, some four per cent
Year PrimarySecondary
General TVET
2000/01 43.8 40.9 29.8
2001/02 44.2 41.4 31.5
2002/03 44.4 42.0 31.9
2003/04 44.9 42.5 31.6
2004/05 45.9 42.7 30.5
2005/06 46.8 43.2 30.8
25 Combined Fourth and Fifth Periodic Reports of State Parties, CEDAW, Indonesia, 27 July 2005, p. 35.26 Mongolia CEDAW Report 12 April 2007:16.

48 Gender Equality in EducationProgress Note
Box 5: Cambodia: Quality standards for mainstreaming gender in education27
Educational processes can foster gender equality through the management of educational institutions and, most importantly, through classrooms and schools that walk the talk of genderequality. Towards this end, a set of quality standards have been developed by the Ministry ofEducation, Youth and Sports (MoEYS) in Cambodia, which serve as the basis for monitoring andassessing the extent to which gender concepts and practices are being incorporated in classrooms and schools and in the management processes of the Ministry.
The defined standards for the gender-responsiveness of the Ministry and its satellite officesinclude having an organizational culture conducive to promoting gender equality; the existenceof related policies and programmes; gender-sensitive leadership and staff; gender-responsivemanagement practices, which are based on the principle of non-discrimination28 and the implementation of necessary affirmative action measures; the use of gender budgeting; andmonitoring and evaluation of the gendered impacts of policies and programmes. In the case ofschools and classrooms, quality standards developed are based on outcomes in achieving gender equality in education (i.e., changes in knowledge, skills and attitudes), gender-responsiveteaching and learning processes and leadership and governance, the level of support nationallyand at the community level towards gender equality, and the gender sensitivity of learners.
Through the Quality Assurance Scheme and the use of these standards, progress toward theachievement of key outcomes in relation to gender equality in education will be tracked. In particular, such outcomes would include attaining gender parity at all levels of education andincreasing female involvement as leaders and monitors in schools. Qualitative and quantitativeindicators have been developed to enable the practical application of the standards and to generate data that will inform planning processes at MoEYS in Cambodia.
This quality assurance process intends to facilitate the assessment of the gender responsivenessof education processes and outcomes, although challenges remain in its operationalization at alllevels. While existing quantitative indicators are useful, they do not tell the whole story, and it isimportant to understand the processes that lead to desired educational outcomes, such aschanges in attitudes and values in support of gender equality in education. It is these attitudesand values that create the culture of gender equality and will enable Cambodian women to enjoyequality of treatment and equity in social benefits and entitlements between men and women.
27 Source: EFA MDA Country Report, Ministry of Education, Youth and Sports, Cambodia, 2008.28 Non-discrimination at the work place can be observed in the equal treatment of male and female employees in terms of job
assignments, working conditions, benefits and entitlements, performance evaluation and promotion. More gender responsive management would even go further by taking positive measures to correct disadvantages that women face in the organization. This could take the form of having quotas reserved for women in management, human resource development, personnel evaluation and promotion committees; preferential recruitment and selection of female teachers and non-teaching staff; special scholarships for female staff in the organization; training quotas for female employees; and subsistence allowances or cost of living subsidies for female teachers in remote, difficult to reach and/or hazardous locations.

of directors and deputy directors for education offices are women, and at the district level,women constitute only two per cent of directors of education offices.29 The situation in VietNam’s Ministry of Education and Training is similar, with only one female director, six deputydirectors and 11 directors of provincial departments who are women. The percentage of womenheadmasters is 100 per cent for pre-school, but only 34 per cent for primary education and 21per cent for secondary education. The numbers decrease even further at higher education levels, with less than eight per cent of college and university administrators being women. In2002, the proportions of female professors and associate professors were four and seven percent, respectively.30 Furthermore, in Thailand, based on a UNICEF study, out of the 50 schoolscovered in the study, 97 per cent of the principals were men, while 65 per cent of the teacherswere women.31
i. Curricula and textbooks
A number of countries have reported conducting gender scans of curricula, textbooks and learning materials. A review of school curricula and textbooks to identify and eliminate genderstereotypes and a revision of students’ and teachers’ guidebooks as well as textbooks on socialstudies, civic education, sports, and language was carried out by local authorities in some partsof China.32 In Mongolia, a gender audit was conducted of the national curriculum and textbooksin 2004-2005. Supplementary learning materials, a new primary education curriculum and textbooks were developed in Lao PDR following a gender review and training of curriculum writers. In Myanmar, a gender scan of life skills materials was undertaken to ensure that no gender stereotyping existed, including in illustrations and story lines. As in the case of Lao PDR,this was followed up with training for life skills curriculum designers and material developers.
In 2007, the Ministry of Thailand, supported by UNICEF, carried out a gender bias review of student textbooks from primary through secondary education, and trade books targeted at children in pre-school through grades 4-5. A broad range of textbooks was reviewed from allmajor subject areas. The results pointed to stereotypical portrayals of boys and girls, with boysappearing more than girls in the learning materials and boys being shown as more active andgirls as more passive. Boys were more often shown in leadership roles, while girls were usuallyfollowers. Overall, there was also a lack of female role models. For example, women were morefrequently portrayed as secretaries/assistants, nurses, and teachers than men and rarely as doctors, politicians, or police officers.
While some countries have made efforts in reviewing their curricula and learning materials froma gender perspective, this is not yet being done in a systematic manner. This was indicated inmany of the EFA Mid-Decade Assessment country reports as an area that requires attention,including in Indonesia, the Philippines, Cambodia and Myanmar.
49Education for All Mid-Decade AssessmentEast Asia and Pacific
29 Gender Mainstreaming Strategic Plan in Education, 2006-2010, Ministry of Education, Youth and Sport, Cambodia, Table 2, p. 20. 30 Combined Fifth and Sixth Reports of State Parties, Vietnam, CEDAW, 22 June 2005, p. 30.31 UNICEF Thailand Gender Report, 2007, p. 17.32 Article 10, Combined Fifth and Sixth Reports of State Parties, CEDAW, China, 10 June 2004, p. 33.

50 Gender Equality in EducationProgress Note
250
Fem
ale
sco
re
Male score
275
300
325
350
375
400
425
450
475
500
525
550
575
250 275 300 325 350 375 400 425 450 475 500 525 550 575
Females perform betterthan males
Males perform betterthan females
j. Teaching and learning process
Figure 18: Gender disparities in reading scores
Source: OECD, PISA 2006, Science Competencies for Tomorrow’s World
Research has shown that teachers may interact with and treat girls and boys differently, havingdifferent expectations for each. It has been found, for example, that teachers tend to call on boysmore often in class and ask them more complex questions requiring critical thinking skills, whileasking girls lower-order factual questions. This has been seen to be a factor influencing girls’underachievement. Thus, even when girls and boys enroll in school in equal numbers, theirexperiences may differ considerably. For example, a recent study conducted by UNICEF inThailand found that, while there were not many examples of blatant differential treatment of girlsand boys in classrooms, a greater number of higher-order questions were asked to boys (42 percent), compared with girls (32 per cent).33 Boys were also given more opportunities to take on
33 UNICEF Thailand Gender Report, 2007, p. 22.

51Education for All Mid-Decade AssessmentEast Asia and Pacific
Japan
Indonesia
Hong Kong-China
Australia
Chinese Taipei
Macao-China
New Zealand
Republic of Korea
20
17
16
14
13
11
11
9
-10 -5 0 5
Score Difference*Negative values indicate females scored higher than males; positive scores indicate males scored higher than females.Statistical significance seen in all results, except Korea and Thailand.
10 15 20 25
Thailand-7*
leadership roles than girls, while girls were usually given roles as assistants. While classroomobservation from a gender perspective has been conducted on a small scale in different parts ofthe region, there are few studies that have been carried out, and limited data exist.
Every three years, the Programme for International Student Assessment (PISA) survey of 15-year-olds in the principal industrialized nations is conducted under the auspices of theOrganization for Economic Co-operation and Development (OECD). This survey ascertains theextent to which students have acquired the necessary knowledge and skills to participate fully insociety and face future challenges as they complete compulsory basic education. The surveylooks at whether students are able to analyze, reason and communicate effectively and continuelearning throughout the course of their lives. The 2006 survey covered the 30 OECD countries,34
as well as 27 partner countries and economies, including Hong Kong-China, Indonesia, Macao-China, Chinese Taipei and Thailand from the East Asia and Pacific region. The assessmentconsisted of a two-hour test for students, as well as questionnaires responded to by students,school principals and parents.
Figure 19: Gender differences in student performance on the mathematics scale
Source: OECD, PISA 2006
34 OECD countries: Australia, Austria, Belgium, Canada, Czech Republic, Denmark, Finland, France, Germany, Greece, Hungary, Iceland, Ireland, Italy, Japan, Korea, Luxembourg, Mexico, Netherlands, New Zealand, Norway, Poland, Portugal, Slovak Republic, Spain, Sweden, Switzerland, Turkey, United Kingdom, United States.

52 Gender Equality in EducationProgress Note
Results from the survey indicate that females outperform males by wide margins in reading inthe majority of countries covered by the survey. In 12 countries, the gap in scores between girlsand boys was particularly large (at least 50 points), including in Thailand. In Korea, despite animprovement by 20 score points for boys between 2000 to 2006, over 60 per cent of females wereat high levels of reading proficiency compared to less than half (47 per cent) of boys. On theother hand, males consistently performed better than females in mathematics in the countriesand territories of the region participating in the survey, with the exception of Thailand, althoughgaps were not as wide as in the case of reading. While these findings are in line with cultural and traditional perceptions of girls being better at reading and boys being more proficient in mathematics, the Trends in International Mathematics and Science Study (TIMSS) 2003 onmathematics and science achievement compared students at the fourth or eighth grade levels in46 countries covered in the study and found that, on average, there was essentially no genderdifference in achievement in mathematics. In fact, of the countries involved in the study from theEast Asia and Pacific region, where there were significant differences, girls outperformed boys(in Singapore and the Philippines). These variations in findings may be due to differences in thestudy focus and research methodology utilized in each case, but they also underline what a number of researchers and scientists purport: neither sex possesses an innate aptitude in mathematics.35
Further research is warranted into possible factors affecting prevailing trends in achievement inthese subjects in the region. Attitudes and perception can play a role in this regard, as the PISAsurvey highlighted in the case of science. Gender differences in performance in science werenegligible, but self-perception of abilities in the subject varied significantly between boys andgirls. Males in Japan, Korea, Chinese Taipei, Hong Kong-China and Macao-China reported morepositive attitudes with regard to their abilities in the field of science than females.36
2.2.4 Tertiary Education
At the tertiary education level, only China can claim to have reached gender parity by 2005 (Table1) at the national level. The Chinese Government has devoted considerable effort to developinghigher education, and between 1998 and 2002, the percentage of female students in regular colleges and universities increased consistently annually, from 38.31 per cent in 1998 to 39.66per cent in 1999 and up to 43.95 in 2002.37 Overall enrolment ratios, however, for both womenand men in China, as in much of the region, remain quite low.
35 “Sex Differences in Intrinsic Aptitude for Mathematics and Science? A Critical Review”, Elizabeth S. Spelke, Harvard University, American Psychologist, Vol. 60, No. 9, December 2005, pp. 950-958.
36 PISA 2006: Science Competencies for Tomorrow’s World, 2007, OECD. 37 China CEDAW Report, 2004.

53Education for All Mid-Decade AssessmentEast Asia and Pacific
0
20
40
60
80
100
120
FemaleMale
New Z
ealan
d
Mongolia
Australi
a
Brunei
Daruss
alam
Philippin
es
Thailan
d Fiji
China
Lao P
DR
Cambodia
Indones
ia
Viet N
amJa
pan
Republic
of K
orea
38 East Asia Update, World Bank, 2005:69.
Figure 20: Gross enrolment ratio in tertiary education, 2005
Source: UNESCO EFA GMR 2008
It is interesting to note that the widest gaps in tertiary education enrolment are in the ‘developed’nations in the region, to the disadvantage of men in New Zealand, Australia and Brunei, and tothe disadvantage of women in the Republic of Korea and Japan.
In Mongolia, there is also a wide gap, in this case in favor of girls, which may reflect the perceived high opportunity cost of education or the lack of relevance of tertiary education forboys who are primarily herders.38 In stark contrast, in Timor-Leste, the youngest nation in theregion, the number of female university students is nearly half that of males, according to the2004 census. The number of tertiary education male graduates is 2.6 times the number of femalegraduates.

54 Gender Equality in EducationProgress Note
0
Health and welfare
Education
Humanities and arts
Social sciences, business and law
Agriculture
Science
Engineering, manufacturing andconstruction
10 20 30 40 50
Regional Average
60 70 80 90 100
Figure 21: Percent of female enrolment in tertiary fields of study
While women are moving on to tertiary education in greater numbers in some parts of theregion, there seems to be a divide along gender lines in terms of subject choice. Regional averages on female enrolment in fields of study show that women are in the majority in certainfields, such as health and welfare, education and humanities and arts, but are underrepresented– significantly in some cases – in others, such as engineering, manufacturing and constructionand science, which remain the realm of men. This trend holds true in both developing and developed countries of the region. As noted earlier, the Committee on the Elimination ofDiscrimination Against Women has raised this issue as one of concern in a number of countriesin the region, noting the related impact this may have on women’s professional choices andincome levels.
2.2.5. Adult literacy
In the East Asia and Pacific region, in absolute terms, adult illiterates are predominantly womenin most countries in the region, with the exception of the Philippines and Tonga. The total number of adult illiterates in the region is 125.6 million, out of which 70 per cent are women. Thepercentage of women among adult illiterates in the East Asia and Pacific region remains amongthe highest in the world, higher than South and West Asia (63 per cent) and Sub-Saharan Africa(62 per cent).
In relative terms, progress has been made in narrowing the gender divide, with the gender parity index for adult literacy rising from 0.84 in 1985-1994 to 0.93 in 1995-2004. As in mostregions of the world, however, women’s literacy rates continue to be lower than those of men,with particularly wide gaps in Cambodia, Lao PDR and Papua New Guinea. Fiji and Hong Kong-China have achieved gender parity, and Samoa and Mongolia are close to leveling the literacy rates of men and women. The exception to this overall trend is the Philippines, wherewomen have higher literacy rates than men.

Female Male
20
30
50
per
cen
t
70
90
10
0
Papua N
ew G
uinea
Lao P
DR
Cambodia
Mala
ysia
Mya
nmar
China
Indones
ia
Viet N
am
Singap
ore
Brunei
Daruss
alam
Thailan
d
Philippin
es Fiji
Hong Kong, C
hina (
SAR)
Mongolia
Samoa
40
60
80
100
55Education for All Mid-Decade AssessmentEast Asia and Pacific
0 25 50per cent
75 100
Female
Philippines
Tonga
Papua New Guinea
Samoa
Lao PDR
Malaysia
Brunei Darussalam
Thailand
Viet Nam
Indonesia
Myanmar
China
Cambodia
Macao, ChinaSingapore
Male
Figure 22: Adult illiteracy (per cent)
Source: UNESCO EFA GMR 2008
Figure 23: Adult literacy rate
Source: UNESCO EFA GMR 2008

56 Gender Equality in EducationProgress Note
80
85
90
95
100
60
Languag
e: Thai
Other
Languag
e
Moth
er’s
educa
tion: P
rimar
y
Moth
er’s
educa
tion: S
econdar
y+
Urban
Rural
Wea
lth in
dex q
uintil
es: P
oorest
Wea
lth in
dex q
uintil
es: S
econd
Wea
lth in
dex q
uintil
es: M
iddle
Wea
lth in
dex q
uintil
es: F
ourth
Wea
lth in
dex q
uintil
es: R
iches
t
65
70
75
The 2001 Lao PDR Literacy Study revealed further disparities in literacy rates within the country– by region and location, age, ethnicity and the effects of gender on all of the above.39 Literacyrates are significantly higher in urban areas for both men and women. Disparities exist, howeverbetween the sexes – with over an 11 per cent difference in rural areas and more than seven percent difference in urban areas amongst youth (15-24 years old).
Gender disparities between and within ethnic groups are more striking. Amongst adult populations (15-59 years old), huge gaps are seen between the sexes, with females consistentlyand dramatically disadvantaged. Amongst the adult Hmong-Yao population, gender parity infunctional literacy is only 0.31.
Figure 24: Tested functional literacy rate by ethnicity, Lao PDR, 2001
Source: Lao PDR Literary Survey, 2001
39 The Lao PDR Literacy Survey collected tested functional literacy data. It should be noted that tested functional literacy rates have been found to be significantly lower than self-reported literacy rates as typically collected in household surveys and census. In some cases differences have been as high as 20 per cent.

57Education for All Mid-Decade AssessmentEast Asia and Pacific
100
80
60
40Poorest Second Middle
Wealth Quintile
Fourth Richest
Female
Male
per
cen
tChapter 3
Cross Indicator and Cross-Goal Analysis
3.1 Poverty and gender disparities
Poverty is often a key factor affecting girls’ and boys’ education. Consideration of the opportunitycosts of lost income or the need for help with household work and childcare may affect parents’decisions in sending their sons or daughters to school. In Mongolia, for example, boys oftendrop out of school to contribute to household incomes by working with livestock. This is reflectedin the gaps in boys’ school attendance compared with that of girls, at all but the richest wealthquintiles, but particularly at the lower income quintiles. Recent research comissioned by UNICEFMongolia40 shed further light on this. Boys can often face conditions in the classroom, which discourage participation. This includes feelings of humiliation. Boys’ enrolment and attendancein secondary education is also an issue of concern in Thailand. Of note are the wider gaps in theattendance of boys compared with girls from middle income families, which raises questionsregarding the circumstances that create this condition. Are boys disenchanted with school anddropping out in search of job opportunities or other social or economic reasons? Furtherresearch may shed light on the reasons behind this trend.
Figure 25: Mongolia secondary school and higher education net attendance ratio by wealth quintile
Source: Mongolia MICS3, 2006
40 Research Report: Violence at school and kindergarten environment and the ways to eliminate it (Ulaanbaatar 2007)

58 Gender Equality in EducationProgress Note
100
80
60
40Poorest Second Middle
Wealth Quintile
Fourth Richest
Female
Male
per
cen
t
100
80
60
40Poorest Second Middle
Wealth Quintile
Fourth Richest
Female
Male
per
cen
t
In Viet Nam, girls’ secondary education enrolment and attendance is lower proportionally thanthat of boys. Data from the recent MICS survey suggests that poverty does seem to be a factorin lower attendance rates - for both boys and girls. This graph indicates a gap at the lowestincome quintile to the disadvantage of girls. Interestingly, at the middle to higher income levels,boys and girls participate at equal rates, with families placing relatively equal importance onboth girls’ and boys’ education. However, amongst the richest quintile of Vietnamese society, thegender gap is reversed and girls are found to attend secondary education at higher rates thantheir male counterparts.
Figure 26: Thailand secondary school and higher education net attendance ratio by wealth quintile
Source: NSO, MICS3, 2006
Figure 27: Viet Nam secondary school and higher education net attendance ratio by wealth quintile
Source: GSO, MICS3, 2006
The cases of Lao PDR and the Philippines further illustrate that it is not only a matter of gender thatcreate differences in education attainment but income level as well. In Lao PDR, amongst the poorest 20 per cent of population, girls fare worse than boys in that same quintile and

1
0
Rich 20% Male
Poor 40% Male
Rich 20% Female
Poor 40% Female
0.2
0.4
0.6
0.8
1.0
Pro
po
rtio
n
Grade
Source: Groups from an index of assets/house characteristics, based on analysis of data from DHS econ.worldbank.org/projects/edattain.
3 5 7 9
59Education for All Mid-Decade AssessmentEast Asia and Pacific
1
0
Rich 20% Male
Poor 40% Male
Rich 20% Female
Poor 40% Female
0.2
0.4
0.6
0.8
1.0
Pro
po
rtio
n
Grade
Source: Groups from an index of assets/house characteristics, based on analysis of data from MIC S2 econ.worldbank.org/projects/edattain.
3 5 7 9
achieving much lower levels of education than girls in the richest 20 per cent of the population.Among children from high income levels, a gender gap persists. In the Philippines, there is a widegap between the rich and the poor in education attainment, but no gender gap among children fromthe richest families. In this case, it is poor boys who attain the lowest levels of education, perhaps inline with findings that boys tend to drop out of school to contribute to family incomes.
Figure 28: Lao PDR, 2000, female/male attainment profile, ages 15-19
Figure 29: Philippines, 2003, female/male attainment profile, ages 15-19

60 Gender Equality in EducationProgress Note
1
0
Rich 20% Male
Poor 40% Male
Rich 20% Female
Poor 40% Female
0.2
0.4
0.6
0.8
1.0
Pro
po
rtio
n
Grade
Source: Groups from an index of assets/house characteristics, based on analysis of data from MIC S2 econ.worldbank.org/projects/edattain
3 5 7 9
Figure 30: Myanmar, 2000, female/male attainment profile, ages 15-19
Interestingly, in Myanmar, similar analysis of household survey data suggests much less variationin gender within and between the highest and lowest economic quintiles.
3.2 The link between education and employment: Gender issues in the school to work transition
As data for the region clearly demonstrate, women and girls are enrolling in increasing rates ineducation, with gender parity being achieved in a number of countries and higher proportionsof girls than boys enrolled in some cases in secondary and tertiary education. A study conducted by the East Asia and Pacific Regional United Nations Girls’ Education Initiative(UNGEI), however, indicates that education attainment is not necessarily leading to better labourmarket outcomes for women. Multiple cultural and social factors continue to relegate them totraditional roles and occupations, such as caregivers and domestic workers, that limit theirpotential in the job market.
61Education for All Mid-Decade AssessmentEast Asia and Pacific
Box 6: The burden of household work
In the East Asia and Pacific region, as in many other parts of the world, girls are often tasked withhelping with household work and caring for their younger siblings, leaving them less time tospend on their studies than boys or causing them to drop out of school. Some may face the tripleburden of housework, school work, as well as work outside the home, either paid on unpaid. Insome parts of the region, parents send their daughters into domestic service as a good meansof preparing them for marriage.
According to a study carried out by Plan Asia, three quarters of the children interviewed in VietNam indicated that girls carry more of the burden of doing housework, while boys have moretime to study. In Cambodia, housework was also reported to be the reason why families did notsend their girls to school until the age of eight. Parents felt this was justified and did not placeas much importance on girls’ education, given that ‘girls would just get married, stay at home,take care of their children and do housework.’ (pp. 23-24) In another study in Cambodia lookinginto the perceptions of girls, boys, parents and education officials regarding why girls are notgoing to school, the most commonly mentioned reason was that girls were needed to do housework, care for siblings and do farm work or earn money.
The situation is similar in Lao PDR, where a Ministry of Education/UNESCO study also pointedto poverty and the need for girls to help with household chores and look after younger siblingsas key reasons for girls’ absence and dropout from school. There was a clear perception of thistype of work being the responsibility of girls and women, while boys helped with farm work, andalso had more free time than girls. As in Cambodia, parents also tended to place less importanceon their daughters’ education in Lao PDR, as they did not perceive it to be a worthwhile investment, given that girls would eventually marry and live with their husbands’ families.
A UNICEF report on Thailand also shows that girls spend significantly more time than boys outside of school on household chores, including helping with the care of younger siblings,cooking and cleaning. These responsibilities were cited as a key reason for girls’ tardiness,absence or dropping out of school. On the other hand, boys were usually tardy or missed schoolbecause of helping out at home, oversleeping or being with friends.
Sources: Behind the Screen: An Inside Look at Gender Equality in Asia, Plan Asia Regional Office, 2007; The Impact of OverloadDomestic Work on Girls’ Education Opportunities, Ministry of Education, Lao PDR and UNESCO Bangkok, 2008; UNICEF ThailandGender Report, UNICEF Thailand, 2007.

62 Gender Equality in EducationProgress Note
FemaleMale
0
5,000
Solom
on Islan
ds
Lao P
DR
Mongolia
Papua N
ew G
uinea
Cambodia
Indones
ia
Viet N
am
Vanuat
u
Samoa
Philippin
es Fiji
China
Mala
ysia
Thailan
d
Republic
of K
orea
Brunei
Daruss
alam
Japan
Singap
ore
New Z
ealan
d
Hong Kong, C
hina (
SAR)
Australi
a
10,000
15,000
20,000
25,000
PP
P U
S$
30,000
35,000
40,000
45,000
Figure 31: Estimated earned income
Source: Human Development Report, 2007
The report stresses that emphasis should not only be placed on achieving parity in education butalso on overcoming any economic, social and political barriers that may prevent females fromfinding work that allows them to make use of their education and skills. The study goes on tonote that although economic growth in the region has led to greater and new opportunities forwomen, such as in service or certain industrial sectors, they appear at risk of being consigned tolow value-added and labour intensive positions, while men take on higher level positions andreceive higher pay. Engendered discrimination in the workplace is evident in the differentials inthe estimated earned income of males and females across the region. Interestingly, it is often inthe more developed countries in the region in which greatest disparities exist, despite higherincomes for both men and women. The largest disparities between earned income exist inMalaysia (0.36 GPI), Samoa (0.38), Republic of Korea (0.40), Brunei Darussalam (0.42) and Japan(0.45). Even the most equitable across the region – Cambodia (0.74) and Papua New Guinea(0.72) – are far from achieving gender parity.
In Indonesia, for example, women face greater difficulties than men in entering the workforce,especially those with lower levels of education who increasingly move into the informal labourmarket. Those who manage to penetrate the formal job market tend to find low-paying, lowskilled occupations. For example, in the manufacturing sector, women are overrepresented inthe textile, garment and footwear industries and various low value-added activities. In the public sector, they tend to be employed as teachers and nurses, which points to traditional gender stereotyping of women’s roles as caregivers. Very few women make it into high-levelmanagerial or political positions – only 17 per cent of managerial positions were held by womenin 2002, and only 11 per cent of those in government at the ministerial level are women.

63Education for All Mid-Decade AssessmentEast Asia and Pacific
1 Country Gender Assessment – Mongolia, Asian Development Bank and World Bank, 2005. 2 Ibid3 Country Gender Assessment – People’s Republic of China, Asian Development Bank, 2006.
FemaleMale
0
Farm
ing, f
orestr
y, an
imal
husban
dry, a
nd fish
ery
Min
ing an
d quar
ryin
g
Man
ufactu
ring
Producti
on and su
pply of e
lectri
city,
gas an
d wat
er
Constructi
on
Geolo
gical p
rosp
ectin
g and w
ater
conse
rvat
ion
Tran
sport,
stora
ge, post,
and te
lecom
munica
tions
Wholes
ale an
d reta
il tra
de and ca
terin
g serv
ices
Bankin
g and in
sura
nce
Real e
state
Social s
ervic
es
Health
care
, sports
and so
cial w
elfar
e
Educatio
n, cultu
re an
d arts,
radio
, film
, and te
levisi
on
Scientif
ic re
sear
ch an
d polyt
echnica
l ser
vices
Govern
men
t agen
cies,
party
agen
cies,
and so
cial o
rgan
izatio
ns
per
cen
t
Sector
10
20
30
40
50
60
70
80
90
100
While the gender gap in secondary and tertiary enrolment in Mongolia is in favour of women,data indicate that they are unable to profit from the higher levels of education they achieve.1 Mendominate sectors identified for economic growth, such as mining and transportation, in whichsalary levels are higher than those in health and education, where the workforce is largelyfemale. In addition, men hold significantly higher proportions of managerial positions, despitehaving lower levels of education and training than women. One clear example is in the field of education: although women comprise 75 per cent of the workforce in the sector, very few schoolprincipals are female. There are also indications that women at times earn less than their malecounterparts for the same jobs.2
In China, in spite of gains made in education and with women participating in the labour marketin greater proportions than ever before, they are still concentrated in low skill, low-paying jobsin the service sector, farming, forestry and herding or fishing. Most have yet to make it to the top-level management and professional positions predominantly held by men. The income ofwomen is also lower than men in all industries.3
Figure 32: Professional and technical personnel in urban areas of China by sector, 2002
Sources: Country Gender Assessment-People's Republic of China, Asian Development Bank, 2006

64 Gender Equality in EducationProgress Note
Mongolia
China
MyanmarLao PDR
Viet NamPhilippines
Brunei
Hong Kong, China
Macao, China
Malaysia
Indonesia
Timor Leste
Singapore
Thailand
Cambodia
Korea DPR
Korea REP Japan
The situation is similar in much of the region. Occupational segregation by sex has resulted inwidespread gender gaps in wages and salaries. Furthermore, as the case of Mongolia illustrates,even in cases where women are going on to higher levels of education in higher proportionsthan men, they are not able to gain equitable returns on their investments in their education dueto work place discrimination and gender stereotyping of their roles.
Box 7: Political participation
The lack of women educated at the tertiary level in many countries can act as a barrier to their participation in politics and government as suggested by the finding of an Inter-Parliamentary Unionsurvey in 1999: of 187 women who ran for office, especially those from developing countries and whowere interviewed, 73 per cent held an undergraduate degree and 14 per cent also held graduatedegrees. In countries in this region, however, there seem to be factors beyond education affectingwomen’s participation in political life. Considering the examples of Mongolia and the Philippines, higher proportions of women go on to tertiary education than men, yet less than seven per cent ofseats in national parliament are held by women in Mongolia and less than 16 per cent in the case ofthe Philippines. One factor may be peoples’ perceptions of women as leaders. The World ValuesSurvey (Round 4, 1999-2004) indicated that more than half of the people (55 per cent) surveyed in EastAsia and the Pacific agreed or strongly agreed that men make better political leaders than women.When women are appointed to ministerial positions, they tend to be placed in more ‘feminine’ fields.According to an IPU tally of 858 ministerial positions held by women in 183 countries, over one thirdwere in the areas of family, children, youth and social affairs or women’s affairs and education, whileonly 1.5 per cent were ministers of defence and one per cent were ministers of the economy.4
Source: Gender Index, 2007
4 The State of the World’s Children, UNICEF, 2007, pp. 54-55.
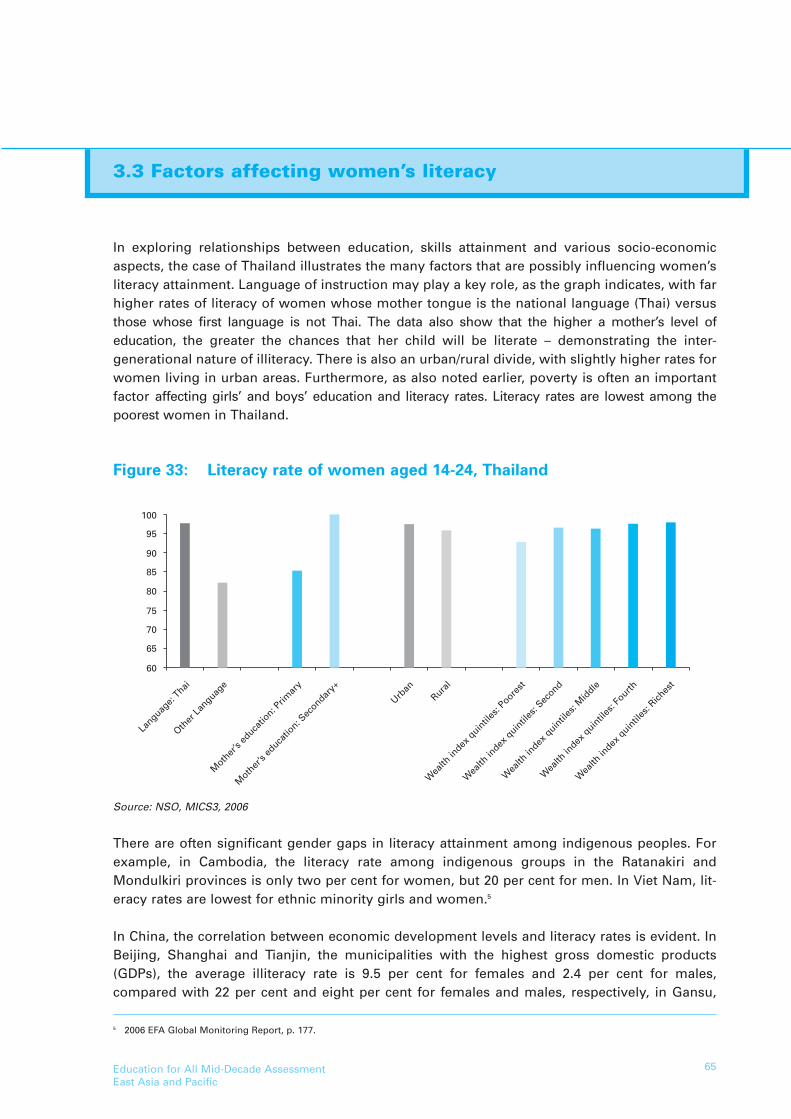
65Education for All Mid-Decade AssessmentEast Asia and Pacific
5 2006 EFA Global Monitoring Report, p. 177.
60
Languag
e: Thai
Other
Languag
e
Moth
er’s
educa
tion: P
rimar
y
Moth
er’s
educa
tion: S
econdar
y+
Urban
Rural
Wea
lth in
dex q
uintil
es: P
oorest
Wea
lth in
dex q
uintil
es: S
econd
Wea
lth in
dex q
uintil
es: M
iddle
Wea
lth in
dex q
uintil
es: F
ourth
Wea
lth in
dex q
uintil
es: R
iches
t
65
70
75
80
85
90
95
100
3.3 Factors affecting women’s literacy
In exploring relationships between education, skills attainment and various socio-economicaspects, the case of Thailand illustrates the many factors that are possibly influencing women’sliteracy attainment. Language of instruction may play a key role, as the graph indicates, with farhigher rates of literacy of women whose mother tongue is the national language (Thai) versusthose whose first language is not Thai. The data also show that the higher a mother’s level of education, the greater the chances that her child will be literate – demonstrating the inter-generational nature of illiteracy. There is also an urban/rural divide, with slightly higher rates forwomen living in urban areas. Furthermore, as also noted earlier, poverty is often an importantfactor affecting girls’ and boys’ education and literacy rates. Literacy rates are lowest among thepoorest women in Thailand.
Figure 33: Literacy rate of women aged 14-24, Thailand
Source: NSO, MICS3, 2006
There are often significant gender gaps in literacy attainment among indigenous peoples. Forexample, in Cambodia, the literacy rate among indigenous groups in the Ratanakiri andMondulkiri provinces is only two per cent for women, but 20 per cent for men. In Viet Nam, lit-eracy rates are lowest for ethnic minority girls and women.5
In China, the correlation between economic development levels and literacy rates is evident. InBeijing, Shanghai and Tianjin, the municipalities with the highest gross domestic products(GDPs), the average illiteracy rate is 9.5 per cent for females and 2.4 per cent for males, compared with 22 per cent and eight per cent for females and males, respectively, in Gansu,

66 Gender Equality in EducationProgress Note
1
0
Male Urban
Female Urban
Male Rural
Female Rural
0.2
0.4
0.6
0.8
1.0
Pro
po
rtio
n
Grade
Source: Groups from an index of assets/house characteristics, based on analysis of data from MIC S2 econ.worldbank.org/projects/edattain.
3 5 7 9
6 Country Gender Assessment – People’s Republic of China, Asian Development Bank, 2006.
0
Female
Per
cen
tag
e
Male
2
4
6
8
10
12
14
16
18
Urban
Rural
Guangxi, and Guizhou, the regions with the lowest GDPs in the country. The illiteracy rates forethnic minorities are even higher. For example, in Tibet, the illiteracy rate is 60.5 per cent forfemales and 34.4 per cent for males.6 The difference in literacy rates between urban and ruralareas is also pronounced.
Figure 34: Illiteracy rate, China, 2000
Source: China EFA MDA Report, 2008
3.4. The rural-urban divide
Figure 35: Lao PDR, 2000, rural/urban attainment profile, ages 15-19

67Education for All Mid-Decade AssessmentEast Asia and Pacific
7 Lao PDR Gender Profile, Gender Resource Information and Development Center (GRID)/World Bank, November 2005, pp. 54-59, and executive summary.
1
0
Male Urban
Female Urban
Male Rural
Female Rural
0.2
0.4
0.6
0.8
1.0
Pro
po
rtio
n
Grade
Source: Groups from an index of assets/house characteristics, based on analysis of data from MIC S2 econ.worldbank.org/projects/edattain.
3 5 7 9
Figure 36: Philippines, 2003, rural/urban attainment profile, ages 15-19
As the above example illustrated in terms of literacy rates, area of residence is also an importantfactor that may compound barriers girls and boys face to education attainment. In Lao PDR, thegap in education attainment between children living in urban areas and those in rural areas ispronounced, with children in urban areas achieving far higher levels of education. There appearto be, however, no or very slight gender disparities in education attainment among girls andboys living in urban areas. In rural areas on the other hand, girls attain significantly lower levelsof education than their male peers. Access to schools in rural areas is limited, with only 14 percent of the roads paved. Children living in remote, rural areas, mostly from ethnic minoritygroups, face particular difficulties in this regard. Poverty and linguistic barriers are often factorsaffecting their participation in education. Cultural practices, such as early marriage and the burden of household work, pose further obstacles for girls’ education. Parents are also less likely to send their girls to school when long distances are involved, as they fear for the safetyand security of their daughters. The unavailability of separate and functional toilets is also a keyfactor, particularly after girls reach puberty. Furthermore, the lack of female teachers is an issue,with parents in some communities preferring female teachers for their daughters.7 In thePhilippines, there are gender gaps in education attainment in both rural and urban areas, withgirls attaining higher levels of education in each case. It is the boys in rural areas who completethe lowest levels of education. Boys from poor families in both rural and urban areas are oftenpulled out of school to contribute to household incomes.

68 Gender Equality in EducationProgress Note
8 Addressing Gender based Violence in East and Southeast Asia, 2007, p. 1.9 http://www.unifem-eseasia.org/projects/evaw/evawindex.htm.10 East Asia Update, World Bank, 2005, p. 65.11 Intimate Partner Violence Against Women in Rural Vietnam – Different Socio-Demographic Factors are Associated with Different Forms
of Violence: Need for New Intervention Guidelines?, Nguyen Dang Vung et al, BMC Public Health 2008.
Box 8: Gender-based violence
Gender-based violence (GBV) is defined as “any act that results in, or is likely to result in physical, sexual or psychological harm or suffering to women, including threats of such acts,coercion or arbitrary deprivation of liberty, whether occurring in public or private life,” accordingto the UN Declaration on Violence Against Women.8 GBV can take place in the home, in schools,in the workplace, and in the community.
GBV is a major issue in much of the region.9 The exact magnitude of the problem is often difficult to assess given that it is not always reported by those affected due to social stigma, fearand other factors. Thus data is limited, and it is difficult to determine clear trends and patterns,as well as causal and preventive factors, such as links with education. At best, data are indicative. Data from Lao PDR finds that a woman’s level of education is a significant factor for influencing the occurrence of domestic violence in rural areas, with the higher the educationlevel, the greater the likelihood of abuse.10 In Cambodia, where the formal sector offers womenmore opportunities than men, there is concern that feelings of disempowerment among youngmen are increasingly translating into violence towards women. Strongly held cultural beliefs andtraditions, perceptions of male and female roles, and the realities of a changing, modern worldmay be threatening to men and women and lead to greater incidences of violence. A study inViet Nam noted the link between low levels of male and female education and poverty and physical/sexual abuse against women. The study found that if a husband had completed primaryeducation only, the risk of physical/sexual abuse was twice as high than if he were highly educated.11
As studies from Mongolia and Timor-Leste reveal, GBV is not always and only focused on girlsand women. Studies have found boys to be deterred from participating fully in education due tofear of violence. Further research is needed to understand better the dynamics and relationshipbetween education and gender-based violence. This complex issue requires work on manyfronts – not only education – including the formulation and implementation of related laws andpolicies where they do not exist and the establishment of institutional mechanisms for theirimplementation. Education to reduce GBV requires more than basic education and literacy. Itrequires education on human rights and women’s rights. Incorporating the notion of humanrights education, especially women’s rights, in the classrooms and the entire school system is achallenge for the future.

69Education for All Mid-Decade AssessmentEast Asia and Pacific
Chapter 4
Emerging Concerns, Gaps,Constraints and Challenges
Gender parity does not necessarily translate to gender equality
Significant strides have been made in the region towards levelling the field of education in termsof numbers to achieve gender parity. But equity in numbers does not translate into gender equality. As mentioned above, despite increased participation in education, including at highereducation levels, women continue to earn far less than men across the region and poverty disproportionately affects women. The fact that more girls are obtaining higher levels of education is apparently not leading to better education outcomes and opportunities for themcompared with boys, as research on education and links to labour market opportunities, as wellas other indicators on women’s empowerment and participation in decision-making positions,suggest. Women continue to be underrepresented in leadership positions, both in the public andprivate sectors, and their income levels remain far below those of men across the region.Women’s political participation and involvement in public life remains low in all countries in theregion. Further research is needed to understand the dynamics and implications underlying thisphenomenon in different country contexts and the role that public policy, advocacy and education could play in bringing about changes to gender inequality in society as a whole.
While ensuring the right to education in and of itself is also important – not just because certainoutcomes might occur – this should mean an education of good quality and with equal learningopportunities between girls and boys. The limited pool of qualitative research that has been conducted in the region suggests that gender stereotypes abound in curricula and learning materials, and girls and boys may not receive equal attention or be treated in the same mannerby their teachers. Added to this are societal perceptions and norms regarding the traditionalroles of girls/women and boys/men. Such perceptions often impact upon and limit the labourmarket and occupation opportunities afforded to women. As data support, ensuring that girlsand boys participate in school in equal numbers is necessary but not sufficient to lead to the 2015goal of gender equality in education. There may be the danger of a sense of complacency insome countries in the region based not only on their progress and success in attaining genderparity and meeting the first target of EFA Goal 5 but also on a limited understanding of genderequality as being solely gender parity.
The gender gap for boys
In a number of countries in the region, including Fiji, Mongolia, Malaysia, and the Philippines,lower proportions of boys compared with girls are going on to pursue secondary and tertiaryeducation. One reason for this is that boys are often co-opted to work full-time to earn money,putting an end to their formal learning. In Mongolia, for example, boys drop out of school to contribute to household incomes by working with livestock. Male child labour, in this case, isvery much influenced by poverty. Another factor reported by boys in Mongolia is the use of corporal punishment and public humiliation by teachers, which makes boys feel ashamed andreluctant to remain in school (“Research Report”, Ulaanbaatar 2007). Some data indicate, forexample in the case of Thailand, that boys from middle income families may also be attendingsecondary school in lower proportions than their female peers. This suggests that there may perhaps be other factors, apart from poverty and related opportunity costs of boys’ education,affecting this trend. Are boys growing disillusioned with education or seeing it as irrelevant totheir future endeavours? It would be important to consider the issue of boys’ education withinthe broader context of gender inequalities and persisting gender stereotypes – mostly to girls’ andwomen’s disadvantage – in society.
Lack of attention to qualitative indicators of gender equality in education
There has been considerable progress in the region in terms of collecting sex-disaggregated databased on quantitative indicators for gender equality in education. This has allowed for moreanalysis than ever before – even exploring multiple dimensions of disparities. Currently utilizedinternational measures, however, have been reviewed as incomplete or inadequate because theyeither fail to acknowledge context or they under-value the importance of gender in issues of education quality and achievement.1 Furthermore, data on qualitative aspects of education, suchas the gender responsiveness of curricula and learning materials and teaching and learningprocesses, is very limited. If this type of data does exist, it is not comprehensive nor is it collected systematically but rather through sporadic studies conducted from time to time, oftenthrough donor-funded projects. The scant data that do exist point to the stereotypical portrayal of the roles of girls and boys, women and men in curricula and textbooks, as well ascases of differential treatment in classrooms. These aspects of gender inequality are not reflected in gender parity figures and underline the fact that data on gender equality in education is not being captured. The EFA goal on Gender in Education is not only about accessand getting girls and boys to schools in equal numbers but also about their experiences oncethey are in school and the equality of their learning opportunities and outcomes. The lack of datain these areas has partly to do with a narrow understanding in some cases of gender equality ineducation as being equivalent to gender parity, as mentioned above. In addition, there is generally low capacity and lack of knowledge with regard to qualitative research methodsrequired for this type of analysis. It is only through an expanded research agenda, linked to advocacy for policy makers, that gender discrimination and stereotyping, currently perpetuatedby educators, systems, and the students themselves, can be transformed.
70 Gender Equality in EducationProgress Note
1 Beyond Access; Transforming policy and practice for gender equality in education, Oxfam, 2005, p. 65.
2 A Statistical Profile of the Teaching Profession, ILO and UNESCO, 2002, p. 15.3 Ibid, p. 37.
71Education for All Mid-Decade AssessmentEast Asia and Pacific
A feminized teaching force
The teaching profession is dominated by women in much of the region, particularly at the pre-primary and primary education levels. This gender imbalance raises the question of whymore men are not opting for this profession. Data on fields of study and numbers of femaleteachers seem to indicate that education and teaching, especially amongst younger children,may be perceived as ‘feminine’. Could this have to do with the traditional perception of womenin many cultures as nurturers and caregivers of children? Are salary levels a factor? That is, aremen seeking higher-paying jobs and therefore not taking on jobs as pre-school or primary teachers? There are more male teachers at the higher levels of education, which may be connectedwith a difference in terms of status, perceived or actual, or pay compared with pre-primary andprimary education. Traditionally, teachers at lower levels of education, the majority of whom arewomen, receive lower levels of pay.2 In some countries, there may be a significant difference inpay between a primary education teacher and a secondary education teacher, such as inMalaysia, where salaries of experienced upper secondary school teachers are more than 60 percent higher than that of their primary education counterparts.3 Perhaps it could also be the specialization in certain subjects with fewer women, such as mathematics, that result in greaternumbers of male teachers in secondary education rather than in lower levels of education. Somealso argue that it may be important for young boys to have male role models in school in theirearly years and also for children to see men as caregivers and teachers of young children alongside women. This, again, is an area that warrants further research.
Leadership in education: a man’s world
While females generally dominate the teaching profession in the region, they are underrepresented,by wide margins in many cases, at the higher levels of educational administration. Women seemto be facing difficulties in breaking through the proverbial ‘glass ceiling’ to management anddecision-making positions in the education sector even in cases where they have more education and training overall than men, as in the case of Mongolia, where women make up to90% of the primary teaching force (A Statistical Profile of the Teaching Profession, ILO andUNESCO, 2002, p.58), but only 16.1 per cent serve as heads of educational and cultural center;19 per cent hold the position of directors of vocational training centers and 15.5 per cent are inthe role of college and universities’ directors (Mongolia CEDAW Report, 12 April 2007: 16). InIndonesia, enabling more female teachers to reach high levels of qualification is critical if theshare of females in senior management positions is to increase. The broad pattern suggests thatfemale teaching staff are facing a qualification barrier in access to school principle and other senior management positions. This constitutes a potential constraint on improving and maintaining gender equity in secondary education (EFA Indonesia, 2008:129).
Given this situation, the barriers women face in their career advancement require deeper analysis and concrete, targeted strategies for overcoming them. This also requires more systematic collection and reporting of data in this regard to understand the full extent of the

72 Gender Equality in EducationProgress Note
problem. At present, there is not much related data in EFA MDA reports, as this was not identified as a core indicator, although it was included among the set of additional indicators.The data that is available, largely through CEDAW country reports, clearly point to the need formeasures to increase female participation in the higher echelons of education management andadministration.
The gender divide in fields of study
While girls are going on to tertiary education in higher proportions than boys in a number ofcountries in the region, they still tend to be pursuing fields traditionally seen as ‘feminine,’ suchas health and welfare, education, humanities and arts, and they are underrepresented in areassuch as engineering and science, which are dominated by men. The gender segregation in fieldsof study may have an impact on the kinds of jobs available to girls when they leave school andtheir level of pay when they enter the job market. It may also be the case that society has structured education to track girls into fields of study that lead to lower-paid jobs when compared to fields of study reserved for boys. Furthermore, the majority of students enrolled intechnical and vocational education programmes – often seen as a male domain – are boys(except in Viet Nam), a trend which may contribute further to placing girls at a disadvantage asthey transition to the workplace.
The large share of women among uneducated adults
Across East Asia and the Pacific, net enrolment ratio is high, but values for boys and girls havefallen slightly within the period of 1999 to 2005, from 96 to 94 for boys and from 95 to 93 for girls.The indicator remains within the range of gender parity. Still, despite these high figures, in termsof absolute numbers, the total number out of school children4 in 2005 was estimated at a total of9,524,000, of which 52 per cent are female.
As noted earlier, considerable progress has been made in the East Asia and Pacific region in raising adult literacy rates, from 82 per cent in 1985-1994 to 92 per cent in 1995-2004.5 The gender gap also narrowed in this period from a GPI of 0.84 to 0.93. In terms of absolute numbers, there was a decrease in the number of adult illiterates from 227.6 million people in1984-1994 to 125.6 million in 1995-2004. These results are largely due to concerted efforts inChina to address the issue of adult illiteracy. Women, however, consistently comprise the majority of adult illiterates, and the percentage of women among adult illiterates has actuallyincreased slightly from 69 per cent in 1985-1994 to 70 per cent in 1995-2004.6
The large numbers of out of school girls coupled with large illiterate populations have seriousimplications, not only for women and their empowerment but also for their families. The education of mothers, or more specifically their access to schooling, has been noted as having
4 Data reflect the actual number of children not enrolled at all, derived from the age-specific enrolment ratios of primary school age children, which measures the proportion of these who are enrolled either in primary or in secondary schools. See EFA Global Monitoring Report 2008 for further details and explanation.
5 Regional data for adult literacy is calculated using data for the most recent year available during the period specified. 6 2008 EFA Global Monitoring Report, p. 63.

an impact on the education attainment of her children, as noted above, and also on the healthand well-being of her children. For example, research shows that children of mothers with littleor no education are more than twice as likely to die in childhood or be malnourished than children of mothers with a secondary or higher level of education. Further efforts are required toaddress this significant and persistent gender gap.
The many faces of bias
As the data in the previous chapters reveal, gender parity indices for national aggregate figuresdo not fully reflect local realities and often mask disparities at the sub-national level. Children,particularly girls, among ethnic minorities, migrant families, or among those who are displacedby conflict or natural calamities, who live in poor and remote areas, or who work or have disabilities remain unreached as the most disadvantaged. Anecdotal evidence presentedthroughout this report attempts to highlight the information available on children in these conditions and contexts. Facing multiple barriers to participating in school, these children arealso vulnerable to various forms of exploitation and often denied their right to education andother social services. Disparities may be to the disadvantage of either girls or boys, dependingon the context and circumstances. In countries such as the Philippines and Mongolia, boys frompoor families are often pulled out of school to work and contribute to the family income. In VietNam, wide gender gaps persist among ethnic minority groups, with girls in the North East of thecountry kept at home to help with household work and the care of siblings, while boys amongstthe ethnic minorities of the Central Highlands are at a greater disadvantage in education thangirls. As described earlier, the contexts and situations affecting girls and boys could also vary significantly at the sub-national level. Greater awareness and recognition of the multifacetednature of disparities faced by girls and boys in the region are crucial, requiring the use of a broader bias framework, looking not only at gender bias, but other forms of bias that may compound gender disparities as well. To assess disparities accurately, it is therefore importantthat data is disaggregated by sex and by other factors such as ethnicity, disability, socioeconomicquintiles, remoteness and geographic location.
73Education for All Mid-Decade AssessmentEast Asia and Pacific


75Education for All Mid-Decade AssessmentEast Asia and Pacific
Chapter 5
Conclusions and recommendations
As data indicate, since the Jomtien World Conference on Education in 1990 until now, significantprogress has been made in the region in raising enrolment rates towards universal primary/basiceducation and in closing the gender gap, particularly at the primary education level. But childrencontinue to fall through the cracks of education systems, particularly girls and boys from disadvantaged groups such as ethnic minorities, migrant communities, displaced populations,poor families, child labourers, people living in remote areas and people with disabilities. Barriersto education that they already face due to their sex may be compounded by these factors, denying them their right to education. The attainment of EFA goal 5 by 2015 depends considerably on targeted policy, strategy and programming aimed at reaching these unreachedgirls and boys.
While disparities still favour boys in some cases, such as in Cambodia, Lao PDR, and Papua NewGuinea, where their enrolment rates are higher than those of girls in secondary education, keeping boys rather than girls in secondary school is a challenge for other countries such asMongolia, the Philippines, Malaysia and Thailand. Sometimes referred to as the ‘reverse’ gendergap, given that disparities have typically been to the disadvantage of girls, this trend requires further research into the reasons why boys are dropping out of school. These may differ from barriers to girls’ education and require the formulation of new strategies to address boys’ particular needs.
Greater numbers of girls going to school and at higher education levels than boys has not necessarily meant they are faring better in terms of income levels, employment opportunities,leadership and decision-making power. In general, de jure gender equality exists in the regionbut not de facto equality. Having laws and policies in place is necessary but not sufficient for gender equality. Achieving gender parity in education could mean that the ground is graduallybreaking and some steps in the journey to gender equality have been made, but more work andinvestment is needed to translate numerical parity in education into equality in learning processes and education outcomes, including equality in job opportunities and remunerationand political participation. Equality and empowerment in and through education is yet to be realized.
Further efforts are required for gender mainstreaming to be institutionalized in education systems across the region, fostering an organizational culture in support of gender equality andensuring that a gender perspective is incorporated into education policies, plans and programmesat all levels. In addition, critical linkages with reporting on and compliance with CEDAW and CRC,

76 Gender Equality in EducationProgress Note
the development of poverty reduction strategy papers and other national processes are neededfor a more holistic, comprehensive approach to achieving EFA Goal 5. This includes forming partnerships with other key stakeholders, including line ministries beyond Education, such asLabour and Social Affairs (noting the importance of education as both a prevention and responseto child labour) multilateral and bilateral agencies, NGOs and communities.
Based on progress made thus far and key issues and challenges identified in this paper forachieving gender equality in education, the following more specific recommendations are proposed for consideration towards meeting EFA Goal 5 by 2015.
Addressing multiple levels of bias:
• Collect data disaggregated by sex and other factors such as income quintiles, areas of residence, region/province/state, and among ethnic minority groups, working children, children who are disabled etc., to pinpoint/identify gender disparities more accurately which are not reflected in national aggregate figures.
• Conduct qualitative research to analyze reasons behind existing disparities. Cultural traditions and practices and perceptions of the roles of girls/women and boys/men, opportunity costs and other factors may influence parents’ decisions to send their sons and daughters to school. These may differ among ethnic groups and different communities and regions within a country, and it is important to identify the particular barriers faced in each case so that policies and interventions that address these disparities are appropriate and effective.
• Target interventions based on data and analysis, such as building extended primary schools that offer lower secondary classes for girls when distance to schools is an issue, as has been done in Cambodia. Scholarships and other incentives could be offered to poor children to prevent dropout – to boys, in cases where gender disparities are to their disadvantage and they are kept from school to work, or to girls in other instances where preference is given to boys’ education, particularly when cost is a factor or they are made to work either at home or outside of their homes. When language of instruction is an issue, in the case of ethnic minority children, bilingual education could be provided.
• Promote schools which proactively seek out-of-school girls and boys and encourage their families to send their children to school. Various mechanisms to track out-of-school children can be utilized to support schools in this endeavour, such as parent-teacher associations or involving students themselves in conducting mapping exercises to identify peers from their communities who are not in school.
Closing the gender gap against boys:
• Strengthen the monitoring of school attendance, repetition and dropout rates disaggregated by sex and create linkages with planning and programming. This will ensure that analysis of sex-disaggregated data is positioned to respond to the realities boys may be facing in particular conditions or socio-economic contexts.

77Education for All Mid-Decade AssessmentEast Asia and Pacific
• Complement quantitative data on gender gaps with qualitative research on factors affecting boys’ education and their continuation to secondary and tertiary levels of education. Are they dropping out to work and contribute to the family income? Are they enrolling in TVET programmes rather than in the regular secondary education track and then transitioning to the work place? Do they drop out due to peer pressure, teacher abuse or social-emotional issues, or do they drop out because they feel school and the curriculum to be irrelevant to their lives and to improving future employment prospects? Concurrently, look into the choices girls are making in terms of their education. Are they also enrolling in TVET programmes in similar proportions? What are their reasons for continuing on with their education, and what are their comparative employment opportunities?
• Revise curricula, particularly at the secondary education level, for greater relevance and links to the realities of girls’ and boys’ lives. In addition to academic content, ensure curriculum content relates to labour market needs and demand for marketable skills and knowledge.
• Be ready to provide skills-based training, linked to livelihoods, at secondary levels to ensure that school is relevant to the interests of boys.
• Advocate among parents and communities regarding the importance of sending boys (and girls) to school and completing their basic education. Concurrently, raise awareness among policy-makers on the issue of boys’ education, underlining the fact that gender issues do not only concern girls/women but also affect boys/men as well.
• Re-examine corporal punishment policies, as well as positive discipline approaches. Prevent teachers from using tactics which humiliate boys (and girls) in public or in front of peers.
Moving beyond gender parity:
• Raise awareness among policy-makers, community members and other key stakeholders regarding the full meaning of gender equality in education and that gender parity is not enough. This can be done through gender training targeted to different audiences and also with evidence-based advocacy campaigns using various media.
• Build capacity in conducting qualitative research and analysis, forming regional and local pools of expertise in this area. Form partnerships between universities and Ministries of Education for expertise-sharing and to promote evidence-based policy and practice towards achieving gender equality in education.
• Systematically conduct classroom observation from a gender perspective, with feedback to teachers and school administrators as part of regular school review and monitoring and evaluation processes. As a part of pre-service training, analyze teaching and learning processes,assessing whether girls and boys are able to participate in class on an equal basis (e.g., if girls and boys are called upon to present their work and to ask questions equally, if they are given equal opportunities to serve as class leaders and assistants, if they are offered encouragementand assistance from their teachers, etc.) and have the requisite learning materials and supplies.

• Review curricula, textbooks and learning materials on a regular basis, with such assessments incorporated into curricula/textbook reform processes. Identify and eliminate stereotypical depictions of girls/women and boys/men in illustrations and text and ensure the inclusion of positive female role models. Integrate gender concepts and knowledge in school curricula, starting from the pre-primary education level to establish and build upon a strong foundation for gender equality.
• Continue to develop and dialogue on new measures to capture the complexities of gender equality in the education system and beyond. Ensure systems and processes are in place, in which analysis and evidence can be fed directly into policy-making and educational programming.
• Provide gender training to teachers and headmasters as part of standard pre- and in-service training. Follow-up on training with monitoring visits to schools and classrooms to ensure the application of skills and knowledge gained and to assess changes in teaching and school management practices. Evaluate teachers and school administrators on their work in promotinggender equality in education as part of performance-assessment processes.
• Offer counselling services and guidance to students, especially girls, in considering choices in continuing on to higher education, TVET programmes and the transition from school to work. Follow-up with students after they leave school (through tracer studies, for example) to monitor job placement and salary scales of girls/women and boys/men to gain a better understanding of their experiences in this regard and the barriers faced. This may also serve to provide input in making education curricula more relevant to the needs of girls and boys.
Bridging the gender divide in fields of study:
• Conduct research on the expectations of teachers, parents and students of girls’ and boys’ education, employment prospects and future plans to gain insights on the reasons behind decisions to pursue particular subject areas and possible barriers to considering wider options.
• Actively encourage girls and boys to enroll in non-traditional subjects (e.g., education and health for boys and engineering and science for women). Possible strategies could include providing incentives, such as scholarships or extra credit in their coursework or recognizing girls/women and boys/men for achievements in these non-traditional fields. Develop linkages with public and private sector institutions to ensure that graduating students have opportunitiesin the world of work after their education is complete.
• Provide counselling and guidance to male and female students in terms of fields of study, their interests and strengths and related employment prospects or opportunities for further study and training.
• Promoting gender-responsive education management and governance and equality in the teaching profession.
78 Gender Equality in EducationProgress Note

• Systematically collect sex-disaggregated data (also disaggregated by region and urban-rural) on teachers at all levels, and of school/education managers for a better understanding of existing gender disparities.
• Review staff development policies and practices with regard to salaries, status, benefits, promotion and retirement age, identifying and addressing barriers for women in progressing in their careers in the field of education. Provide leadership/management training to women to build their capacity and employ affirmative action measures to increase the recruitment and hiring of qualified female head teachers and education administrators and managers.
• Encourage women to apply for secondary education, TVET and higher education teaching positions and men to apply for pre-primary education positions. Ensure pools of candidates for available positions include both women and men to the extent feasible.
79Education for All Mid-Decade AssessmentEast Asia and Pacific

Annex IGender Core and Additional Indicators
Annex I summarizes and presents background information on the core and additional indicatorsendorsed for the EFA MDA.
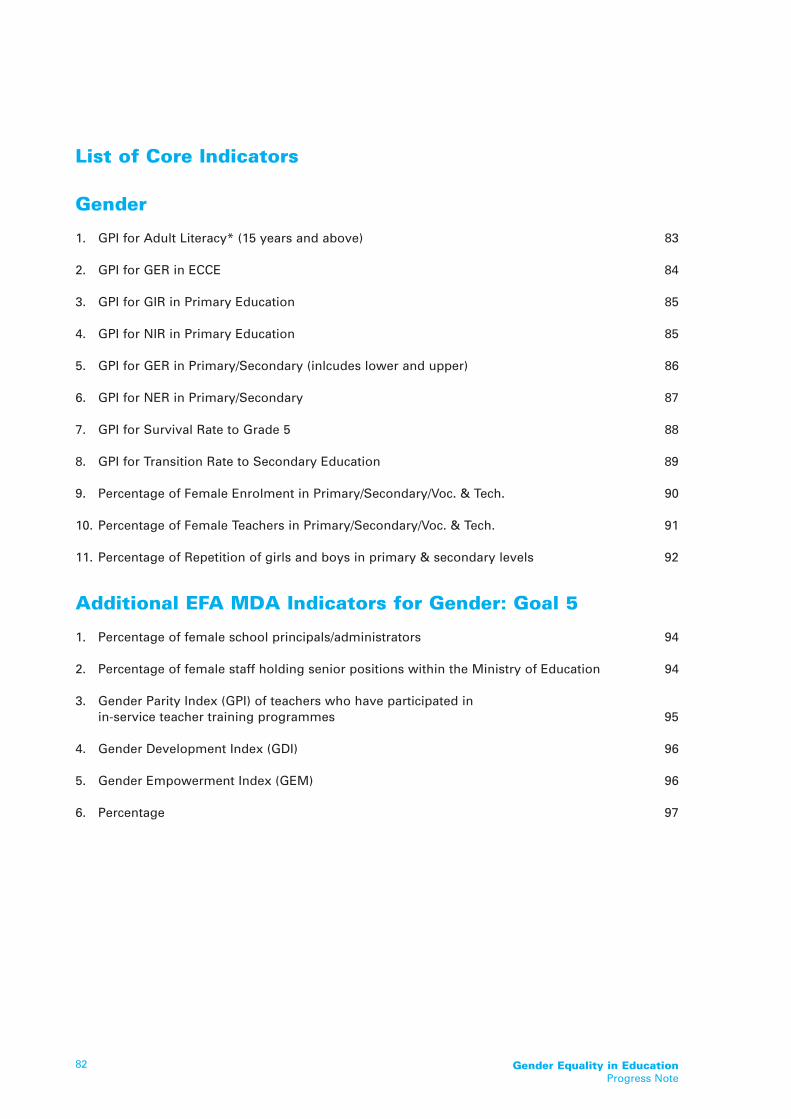
List of Core Indicators
Gender
1. GPI for Adult Literacy* (15 years and above) 83
2. GPI for GER in ECCE 84
3. GPI for GIR in Primary Education 85
4. GPI for NIR in Primary Education 85
5. GPI for GER in Primary/Secondary (inlcudes lower and upper) 86
6. GPI for NER in Primary/Secondary 87
7. GPI for Survival Rate to Grade 5 88
8. GPI for Transition Rate to Secondary Education 89
9. Percentage of Female Enrolment in Primary/Secondary/Voc. & Tech. 90
10. Percentage of Female Teachers in Primary/Secondary/Voc. & Tech. 91
11. Percentage of Repetition of girls and boys in primary & secondary levels 92
Additional EFA MDA Indicators for Gender: Goal 5
1. Percentage of female school principals/administrators 94
2. Percentage of female staff holding senior positions within the Ministry of Education 94
3. Gender Parity Index (GPI) of teachers who have participated in in-service teacher training programmes 95
4. Gender Development Index (GDI) 96
5. Gender Empowerment Index (GEM) 96
6. Percentage 97
82 Gender Equality in EducationProgress Note

Education for All Mid-Decade AssessmentEast Asia and Pacific
83
Annex IGender Core and Additional Indicators
A. Core EFA MDA Indicators for Gender: Goal 5
1. GPI for Adult Literacy
Definition and PurposeThe Literacy GPI is used to assess gender differences in literacy rates among adult populations.It is calculated as the literacy rate for females divided by the literacy rate for males. This indicator measures progress towards gender equity in literacy for women in relation to those formen. It also measures one presumed outcome of attending school and a key indicator of theempowerment of women in society. Literacy is a fundamental skill to empower women to takecontrol of their lives, to engage directly with authority and to gain access to the wider world oflearning. When compared over time, this indicator measures progress towards gender parity inliteracy and is especially revealing if disaggregated amongst subpopulations (i.e., ethnicity,caste, and socio-economic-cultural characteristics).
Method of Calculation and Data Required
Gender Parity Index Adult female literacy rate x 100for Adult Literacy = Adult male literacy rate
Possible Data SourceData required for calculating the GPI for adult literacy are usually collected through populationcensuses, household surveys and literacy surveys. Similar data may also be collected on a sample basis during household surveys in between population censuses in order to update theliteracy rates.
DisaggregationWhere data is available; the indicator can be disaggregated by region, urban/rural, social andethnic groups, linguistic groups, disabilities, and other vulnerable groups. Where national aggregate data are not available, sample data from household surveys may also be used to illustrate the situation in specific localities or for specific population groups.
InterpretationWhen the literacy GPI shows a value equal to one, the female literacy rate is equal to the maleliteracy rate. A value less than one indicates that proportionately fewer women than men havebasic literacy skills, and conversely, a value exceeding one indicates that proportionately fewermen than women have basic literacy skills. We can assume that there is no significant genderdisparity if the GPI value ranges between 0.97 and 1.03. Note that the value of the GPI may beaffected by differences in the life expectancy between men and women, especially for the olderage groups in countries where women on average live longer than men. In such cases, oneshould derive literacy GPIs by age group. Greater disparity can be expected amongst older populations, whereas for consecutively younger population cohorts, the gender gaps may havesignificantly narrowed over time through universal primary education.

Gender Equality in EducationProgress Note
84
Annex IGender Core and Additional Indicators
Limitations and ConstraintsAs mentioned in the section on literacy, data may only be available for certain years and forselected regions and groups, depending on the year of censuses and surveys. Different definitions of literacy in different countries and the use of proxy data also make data difficult tocompare. Disaggregated data on literacy and adult population by gender must be available to beable to calculate the GPI for different population groups and regions.
2. GPI for Gross Enrolment Rate (GER) in ECCE
Definition and PurposeThe GPI for GER in ECCE is used to assess gender differences in participation in organised earlylearning. It is calculated as the rate of GER in ECCE for girls divided by the rate for boys. The indicator measures progress towards gender parity in ensuring that all young children participate in organised ECCE programmes.
Method of Calculation and Data Required
Gender Parity Index GER in ECCE (Female) x 100for GER in ECCE = GER in ECCE (Male)
Possible Data SourceCountries usually collect the basic data for the above-mentioned indicator as part of the EMIS.Having such data by gender allows for the calculation of GPI for ECCE. If the data collected doesnot include community based- and/or home-based child care centres, this should be mentioned.
DisaggregationWhere data is available, the indicator can be disaggregated by region, urban/rural, social andethnic groups, linguistic groups, disabilities, and other vulnerable groups. It is especially interesting to compare ECCE GPI between private and public/community-based centres.
InterpretationA value of less than one indicates a difference in favour of males; a value above one indicates adifference in favour of females; a value close to one indicates gender parity. It can be assumed,however, that there is no disparity if GPI value ranges between 0.97 and 1.03. In many countries,one will find girls enrolled in government-run or community-based centres while boys are foundin more expensive private centres.
Limitations and ConstraintsDisaggregated data on enrolment in ECCE and the corresponding ECCE-aged population by gender must be available to calculate this GPI for different population groups and regions.
Education for All Mid-Decade AssessmentEast Asia and Pacific
85
Annex IGender Core and Additional Indicators
3. GPI for Gross Intake Rate (GIR) in Primary Education
Definition and PurposeThe GPI for Primary GIR is used to assess gender differences in intake rates between boys andgirls. It is calculated as a ratio: the primary intake rate for girls divided by the primary intake ratefor boys. This indicator measures progress towards gender parity in access to the first grade ofprimary education.
Method of Calculation and Data Required
Gender Parity Index GIR in Primary Education (Female) x 100for GIR in Primary Education = GIR in Primary Education (Male)
Possible Data SourceCountries usually collect the basic data for the above-mentioned indicator through the nationalEMIS. Nationally representative surveys, such as MICS or DHS can also provide comparative figures to the EMIS. Sub-national surveys allow for details to be gathered for specific sub-nationalpopulations.
DisaggregationWhere data are available, the indicator can be disaggregated by region, urban/rural, social andethnic groups, linguistic groups, disabilities, and other vulnerable groups.
InterpretationA value of less than one indicates a difference in favour of males; a value above one indicates adifference in favour of females; a value close to one indicates gender parity. It can be assumedthat there is no disparity if GPI value ranges between 0.97 and 1.03.
Limitations and ConstraintsDisaggregated data on new entrants to Grade 1 of primary education and on the school entranceage population by gender must be available to calculate and analyse the GPI for GIR in primaryeducation for different population groups and regions.
4. GPI for Net Intake Rate (NIR) in Primary Education
Definition and PurposeThe GPI for NIR in primary education is used to assess the gender differences between boys andgirls who entered Grade 1 of primary education at the appropriate age for intake. It is calculatedas the result of the female NIR in primary education (see Indicator 2.2.2) divided by the corresponding NIR for boys. This indicator measures in a more precise manner the gender disparities in access to Grade 1 of primary education.
Method of Calculation and Data Required
Gender Parity Index NIR in Primary Education (Female) x 100for NIR in Primary Education = NIR in Primary Education (Male)

Gender Equality in EducationProgress Note
86
Annex IGender Core and Additional Indicators
Possible Data SourceCountries usually collect the basic data for the above-mentioned indicator through the nationalEMIS. Nationally representative surveys, such as MICS or DHS, can also provide comparative figures to the EMIS. Sub-national surveys allow for details to be gatherd for specific sub-nationalpopulations.
DisaggregationWhere data is available, the indicator can be disaggregated by region, urban/rural, social andethnic groups, linguistic groups, disabilities, and other vulnerable groups.
InterpretationA value of less than one indicates a difference in favour of males; a value above one indicates adifference in favour of females; a value close to one indicates gender parity. It can be assumedthat there is no disparity if GPI value ranges between 0.97 and 1.03. The GPI for NIR gives a moreprecise comparison between girls and boys in regard to entering school at the right age.
Limitations and ConstraintsDisaggregated data on the number of new entrants of the official school-entrance age and the corresponding population by gender must be available to calculate this GPI for different population groups and regions.
5. GPI for GER in Primary and Secondary Education
Definition and PurposeThe GPI for Primary Secondary GER commonly used to assess gender differences in gross enrolment. It is calculated, in the case of primary education, as the primary GER for girls dividedby the primary GER for boys, or, in the case of secondary education, as the secondary GER forgirls divided by the secondary GER for boys. . It measures progress towards gender parity in therate of participation of girls and boys at these respective levels.
Methods of Calculation and Data Required
Gender Parity Index GER in Primary Education (Female) x 100for GER in Primary Education = GER in Primary Education (Male)
Gender Parity Index GER in Secondary Education (Female) x 100for GER in Secondary Education = GER in Secondary Education (Male)
Possible Data SourcesCountries usually collect the basic data for the above-mentioned indicator through the nationalEMIS. Nationally representative surveys, such as MICS or DHS can also provide comparative figures to the EMIS. Sub-national surveys allow for details to be gathers for specific sub-nationalpopulations.

Education for All Mid-Decade AssessmentEast Asia and Pacific
87
Annex IGender Core and Additional Indicators
DisaggregationWhere data is available, the indicator can be disaggregated by region, urban/rural, social andethnic groups, linguistic groups, disabilities, and other vulnerable groups.
InterpretationA value of less than one indicates a difference in favour of males; a value above one indicates adifference in favour of females; a value close to one indicates gender parity. It can be assumedthat there is no disparity if GPI value ranges between 0.97 and 1.03. It should be noted that whilethe value of .99 shows almost no disparity, and can be considered good, it is not necessarily anindicator of a healthy education system. For example, a GPI for Primary GER can be .99 with actual enrolment just 50 per cent for both and girls. Any difference between GPI for NER and GERmay be the result of either boys or girls being enrolled late or if there is preference given to keeping boys or girls in school longer, even after repeating grades.
Limitations and ConstraintsData on enrolment in primary or secondary education and the corresponding school-age population by gender must be available in order to calculate the GPIs. Further disaggregateddata by gender for different population groups and regions, if available, will enable comparisonsof GPIs across these dimensions.
6. GPI for NER in Primary and Secondary Education
Definition and PurposeThe GPI for Primary NER is used to assess gender differences in primary and secondary netenrolment. It is calculated as the female primary or secondary NER divided by the primary or secondary NER for males. The indicator measures in a more precise manner progress towardsgender parity in the rate of participation of girls and boys who are of the official school age forprimary and secondary education.
Methods of Calculation and Data Required
Gender Parity Index NER in Primary Education (Female) x 100for NER in Primary Education = NER in Primary Education (Male)
Gender Parity Index NER in Secondary Education (Female) x 100for NER in Secondary Education = NER in Secondary Education (Male)
Possible Data SourceCountries usually collect the basic data for the above-mentioned indicator through the nationalEMIS. Nationally representative surveys, such as MICS or DHS can also provide comparative figures to the EMIS. Sub-national surveys allow for details to be gathered for specific sub-nationalpopulations.

Gender Equality in EducationProgress Note
88
Annex IGender Core and Additional Indicators
DisaggregationWhere data is available, the indicator can be disaggregated by region, urban/rural, social andethnic groups, linguistic groups, disabilities, and other vulnerable groups.
InterpretationA value of less than one indicates a difference in favour of males; a value above one indicates adifference in favour of females; a value close to one indicates gender parity. It can be assumedthat there is no disparity if GPI value ranges between 0.97 and 1.03. It should be noted that whilethe value of .99 shows almost no disparity, and can be considered good, it is not necessarily anindicator of a healthy education system. For example, a GPI for Primary GER can be .99 with actual enrolment just 50 per cent for both boys and girls. Any difference between GPI for NERand GER may be the result of either boys or girls being enrolled later, or if there is preferencegiven to keeping boys or girls in school longer, even after repeating grades.
Limitation and ConstraintsDisaggregated data on the enrolment in primary or secondary education of children and youngpersons of the official primary or secondary school age, and the corresponding school-age population by gender must be available to calculate these two GPIs, and for different populationgroups and regions.
7. GPI for Survival Rate to Grade 5
Definition and PurposeThe GPI for the survival rate to Grade 5 is used to assess gender differences in the respectiveprobability of girls and boys reaching Grade 5 of primary education, at which stage the child islikely to complete primary education successfully and acquire basic literacy skills (see alsoIndicator 2.2.6). It is calculated as the result of the survival rate for girls divided by the corresponding survival rate for boy. The GPI for survival rate to Grade 5 can help to assess gender disparity in the probabilities of completing primary education.
Method of Calculation and Data Required
Gender Parity Index Survival rate to Grade 5 (Female) x 100for Survival rate to Grade 5 = Survival rate to Grade 5 (Male)
Possible Data SourceCountries usually collect the basic data for the above-mentioned indicator through the nationalEMIS. Nationally representative surveys, such as MICS or DHS can also provide comparative figures to the EMIS. Sub-national surveys allow for details to be gathered for specific sub-nationalpopulations.
DisaggregationWhere data are available, the indicator can be disaggregated by region, urban/rural, social andethnic groups, linguistic groups, disabilities, and other vulnerable groups.

Education for All Mid-Decade AssessmentEast Asia and Pacific
89
Annex IGender Core and Additional Indicators
InterpretationA value of less than one indicates a difference in favour of males; a value above one indicates adifference in favour of females; a value close to one indicates gender parity. It can be assumedthat there is no disparity if GPI value ranges between 0.97 and 1.03. This indicator may be usedto examine gender disparities among different population subgroups and geographic regions,and even among schools.
Limitations and ConstraintsDisaggregated data on enrolment and repeaters by grade for two consecutive years by gendermust be available to be able to calculate these two GPIs for different population groups andregions.
8. GPI for Transition Rate (TR) to Secondary Education
Definition and PurposeThe GPI for Secondary Transition Rates is calculated as the ratio of transition rates for girls divided by the transition rates for males. It would be wrong to mention as GPI for the ratio interms of absolute numbers. The indicator measures progress towards gender parity in completing primary and entering secondary education and should not be confused with parityin secondary enrolment rates in general.
Method of Calculation and Data Required
Gender Parity Index Transition rate to Secondary Education (Female) x 100for Transition rate to = Transition rate to Secondary Education (Male)Secondary Education
Possible Data SourceAs explained in indicator 2.2.7 in Part ll, Section 2, the basic data required for calculating the transition rate are usually collected through annual surveys of primary and secondary schoolsconducted by the national EMIS. Nationally representative surveys, such as MICS or DHS, canalso provide similar data. Sub-national surveys allow for details to be gathered for specific sub-national populations.
DisaggregationWhere data is available, the indicator can be disaggregated by region, urban/rural, social andethnic groups, linguistic groups, disabilities, and other vulnerable groups.
InterpretationA value of less than one indicates a difference in favour of males; a value above one indicates adifference in favour of females; a value close to one indicates gender parity. However it can be assumed that there is no disparity if GPI value ranges between 0.97 and 1.03. Considering that many children drop out in the last year of primary without taking the final school leavingexamination, the GPI Transition Rate allows deeper insight for analysis and potential policyaction.

Gender Equality in EducationProgress Note
90
Annex IGender Core and Additional Indicators
Limitations and ConstraintsDisaggregated data on enrolment in the last grade of primary education and new entrants to thefirst grade of secondary education by gender must be available to be able to calculate these twoGPIs for different population groups and regions.
9. Percentage of Female Enrolment in Primary, Secondary and Vocational and Technical Education
Definition and PurposeThis indicator refers to the number of girls enrolled expressed as a percentage of total enrolmentin each level and type of education, such as ECCE, primary, secondary, technical and vocationaleducation, literacy and continuing education, and higher education. This indicator helps toassess and compare the share of female pupils/students in each level and type of education andby other disaggregation methods.
Method of Calculation and Data RequiredDivide the total number of female enrolment by the total enrolment in a given school-year, andmultiply by 100. Following is the list of core indicators on female participation to assess theabove-mentioned goal.
% Female Number of female enrolment in primary education in school-year t x 100Enrolment pri, t = Total number of enrolment in primary education in school-year t
% Female Number of female enrolment in secondary education in school-year t x 100Enrolment Sec, t = Total number of enrolment in secondary education in school-year t
% Female Number of female enrolment in Voc/Tec education in school-year t x 100Enrolment VocTec, t = Total number of enrolment in Voc/Tec education in school-year t
Possible Data SourcesCountries usually collect the enrolment data through annual school census. It is important thatthe data are disaggregated by gender to be able to calculate the percentage of female enrolment.
DisaggregationWhere data are available, the indicator can be disaggregated by region, urban/rural, public/private schools, and by the socio-economic-cultural characteristics of the corresponding population groups.
InterpretationThis indicator shows the degree of female participation at these education levels. One may need,however, to look at the population structure of those particular age-groups to interpret correctly.
Limitations and ConstraintsCoverage of the data, especially in secondary level, may not be complete since some data coveronly public institutions or partial geographical distributions.
Education for All Mid-Decade AssessmentEast Asia and Pacific
91
Annex IGender Core and Additional Indicators
10. Percentage of Female Teachers in Primary, Secondary and Vocational and Technical Education
Definition and PurposeThe number of female teachers is expressed as a percentage of the total number of teachers inone particular education level, such as primary, secondary, and vocational and technical. Thisindicator helps to assess the proportion of female participation in such education level. Teachersare defined as persons whose professional activity involves the transmission of knowledge, attitudes and skills that are stipulated in a formal curriculum programme to students enrolled ina formal educational institution.
Method of Calculation and Data RequiredDivide the number of female teachers by the total number of teachers in a given school year, andmultiply by 100. Following is the list of core indicators on female participation to assess theabove-mentioned goal.
% Female Number of female teacher in primary education in school-year t x 100Teachers pri, t = Total number of teacher in primary education in school-year t
% Female Number of female teacher in secondary education in school-year t x 100Teachers Sec, t = Total number of teacher in secondary education in school-year t
% Female Number of female teacher in Voc/Tec education in school-year t x 100Teachers VocTec, t = Total number of teacher in Voc/Tec education in school-year t
Possible Data SourcesData on teachers can be either extracted from records or databases of education personnel orthrough the annual school census drawing summary data from school records. From suchrecords, information on the teachers’ gender, age, location, qualification, teacher trainingreceived, years of service, and other factors can enable the compilation of disaggregated data onteachers for cross-analysing the percentage of female teachers.
DisaggregationThis indicator can be calculated by level of education, by geographical location (region and rural-urban), by type of institutions (public and private), by teachers’ age-groups and by teachers’ qualifications.
InterpretationThis indicator shows the gender composition of the teaching force. It also helps in assessing the need for opportunities and/or incentives to encourage women to participate in teaching activities at a given level of education.
The number of female teachers approaching 50 per cent indicates gender parity in the composition of the teaching force. A value greater than 50 per cent indicates more opportunitiesfor women to participate in teaching activities at a specific level, grade or programme of education. If possible, this data should be analysed in relation to general labour market trendsfor females in the country, if such data are available.
Gender Equality in EducationProgress Note
92
Annex IGender Core and Additional Indicators
Limitations and ConstraintsThis indicator should be based on reliable data on teaching staff by gender (full and/or part-timeteachers) at each level of education. When calculating, care should be exercised to ensure thatthe number of female teachers and the total number of teachers correspond to the same type ofinstitution, full or part-time. Such calculation should include all staff involved in teaching. Thisindicator measures the level of gender representation in the teaching profession rather than theeffectiveness and quality of teaching.
11. Percentage of repetition of girls and boys by grade in primary andsecondary levels
Definition and PurposeThe percentage of repetition of girls and boys by grade is the proportion of pupils, by sex, whorepeat a grade. It measures the rate at which female and male pupils repeat grades. A high repetition rate implies high wastage ratio. It blocks access to schooling for other children sincethe school space is occupied by repeaters.
Method of CalculationThe repetition rate of grade g, year t is obtained by dividing the repeaters of grade g, year t+1,by enrolment in grade g, year t. The general formula will be as follows:
RR g,t = Number of female pupils repeating grade g, in school-year t+1 x 100Number of female pupils enrolled in grade g, in school-year t
Data on male and female students can be used to calculate the percentage by sex.
Possible Data SourcesThe data on repeaters and enrolment could be derived from the annual school census or survey.Household surveys or other administrative records may provide the necessary data for programmes run by the community or NGOs and private schools. In some cases, countries mayhave compiled the data from both public and private programmes.
DisaggregationRepetition Rates by grade in primary education can be disaggregated by grade, sex, region,urban/rural, social and ethnic groups, linguistic groups, disabilities, vulnerable groups, and public/private institutions.
InterpretationRepetition Rates should ideally approach zero per cent. High Repetition Rates indicate problemsin the internal efficiency of the education system and possibly a poor level of instruction. Whencompared across grades, the patterns can indicate specific grades with relatively higherRepetition Rates. In some cases, low Repetition Rates merely reflect policies or practices of automatic promotion. The maximum Repetition Rate and the number of grade repetitionsallowed may in some cases be determined by the education authorities in order to cope with

Education for All Mid-Decade AssessmentEast Asia and Pacific
93
Annex IGender Core and Additional Indicators
limited capacity at certain grade levels and to increase the flow of pupils through the educationcycle. Consequently, care should be taken in interpreting this indicator, especially when makingcomparisons between education systems.
Limitations and ConstraintsLike other student-flow rates, the Repetition Rate is derived by analyzing data on enrolment andrepeaters by grade for two consecutive years. It should be ensured that such data are consistentin terms of coverage over time and across grades. Special attention should be paid to avoidsome common errors that may bias these flow-rates, such as over-reporting of enrolmentsand/or repeaters (particularly in Grade 1), incorrect distinction between new entrants andrepeaters, and transfers of pupils between grades and schools.
Gender Equality in EducationProgress Note
94
Annex IGender Core and Additional Indicators
B. Additional EFA MDA Indicators for Gender: Goal 5
These Additional Indicators, while important in assessing the progress towards the EFA goals,are not necessarily readily available in most countries. However, countries that are able toinclude these indicators in their National Report are in a far better position get a clearer pictureand analysis of their progress and gaps in achieving the EFA goals. It is therefore recommendedthat countries include these indicators in their report to the maximum extent possible.
1. Percentage of female school principals/administrators
Definition and PurposeWhile gender ratios in the teaching profession, especially in primary grades, may reveal largenumbers of female teachers, we often find a glass ceiling when it comes to the number ofwomen in school management positions. Female school principals and school managers provide another level of role models for young girls and often result in more gender-sensitiveschool-based processes and operating procedures. Female school principals also bring changesto gender roles in society as headmasters are often active in community committees and decision-making processes and governance at the local level.
Method of Calculation
% Female Number of female Principals in school-year t x 100Principals, t = Total number of Principals in school -year t
InterpretationA percentage below 50 per cent entails fewer female principals, with the lower the number, thegreater the disparity. The same applies for numbers greater than 50 per cent, with increasinglyhigher numbers denoting an imbalance in the number of male principals.
A rate below 50 per cent means there are fewer female principals than male principals. The lowerthe percentage, the greater the gender disparity in favour of males. The reverse holds true fornumbers greater than 50 per cent. By comparing this indicator across regions and levels andtypes of schools, one can observe the differences and patterns and come up with appropriatemeasures to reduce such disparities, based on specific regional characteristics. When analysedover time, this indicator can show the changes, if any, of an increasing or decreasing trend forwomen to become school principals/administrators.
2. Percentage of female staff holding senior positions within the Ministry of Education
Definition and PurposeSenior management positions within Ministries of Education are often the domain of men, withfew women present. Such indicators denote whether women have broken through the ceiling oftechnical education staff and are engaged in policy debate and administration at the nationallevel.

Education for All Mid-Decade AssessmentEast Asia and Pacific
95
Annex IGender Core and Additional Indicators
Method of Calculation
Percentage of Female Number of female senior staff in school-year t x 100Senior Staff, t = Total number of senior staff in school -year t
InterpretationA percentage below 50 per cent means that there are fewer female than male senior staff. Thelower the number, the greater the gender disparity in favour of males. When analysed over time,this indicator can show the changes, if any, of an increasing or decreasing trend for women toassume senior positions within the Ministry of Education.
It will be especially interesting to analyse this indicator in relation to the indicators relating to thepercentage of female principals/administrators and the percentage of female teachers, in orderto get a better understanding of the overall trends and dynamics in women’s roles within theeducation system and the remaining gaps.
3. Gender Parity Index (GPI) of teachers who have participated in in-service teacher training programmes
Definition and PurposeOpportunities for in-service training, whether for upgrading certification or to refresh pedagogicalskills, should be opened equally to men and women. This indicator examines the extent to whichmale and female teachers who are currently in their teaching posts have had the opportunity forin-service teacher training and the disparities, if any.
Method of Calculation
% Female to male Percent of female teachers receiving in-service training x 100In-service training = Percent of male teachers receiving in-service training
InterpretationBy using the percentages of female and male teachers to calculate the GPI, this indicator takesinto account the respective sizes of the female and male teaching forces, in comparing their participation in in-service teacher training. A value less than one indicates a difference in favourof male teachers in terms of participation in in-service teacher training; a value above one indicates a difference in favour of female teachers; a value close to one indicates gender parity(between 0.97 and 1.03). This indicator can be disaggregated by location (region/district,urban/rural), and by level and type of education to analyse the gender differences and gaps.
4. Gender Development Index (GDI)
Definition and PurposeThis is a composite index measuring average achievement in the three basic dimensions captured in the human development index (HDI) – a long and healthy life, knowledge as

Gender Equality in EducationProgress Note
96
Annex IGender Core and Additional Indicators
measured by adult literacy rate and the combined primary, secondary and tertiary GER, and adecent standard of living – adjusted to account for inequalities between men and women.
Method of CalculationThe calculation of the GDI involves three steps.
First, female and male indices in each dimension are calculated according to this general formula:
actual value – minimum value x 100Dimension index = maximum value – minimum value
Second, the female and male indices in each dimension are combined in a way that penalisesdifferences in achievement between men and women. The resulting index, referred to as theequally distributed index, is calculated according to this general formula:
Equally distributed index = {{female population share (female index1- )] + [male population share (male index index1- )]}1/1-
This equation masures the aversion to inequality, where the GDI = 2. Thus the general equationbecomes:
Equally distributed index = {{female population share (female index-1)] + [male population share (male index-1)]}}-1
which gives the harmonic mean of the female and male indices.
Third, the GDI is calculated by combining the three equally distributed indices in an unweighedaverage. (For more details, see Technical Note 1 in HDE2005)
InterpretationThe greater the gender disparity in basic human development, the lower a country’s GDI relativeto its HDI. The GDI is simply the HDI discounted, or adjusted downwards, for gender equality.
5. Gender Empowerment Measure (GEM)
Definition and PurposeThe GEM is a composite index measuring gender inequality in three basic dimensions ofempowerment – economic participation and decision-making, political participation and decision-making and power over economic resources.
Method of CalculationFocusing on women’s opportunities rather than their capabilities, the GEM captures genderinequality in three key areas:• Political participation and decision-making power, as measured by women’s and men’s
percentage shares of parliamentary seats

Education for All Mid-Decade AssessmentEast Asia and Pacific
97
Annex IGender Core and Additional Indicators
• Economic participation and decision-making power, as measured by two indicators – women’s and men’s percentage shares of positions as legislators, senior officials and managers and women’s and men’s percentage shares of professional and technical positions
• Power over economic resources, as measured by women’s and men’s estimated earned income (PPP US$)
For each of these three dimensions, an equally distributed equivalence percentage (EDEP) is calculated, as a population-weighted average, according to the following general formula:
EDPE = {{female population share (female index1- )] + [male Population share (male index1-
)]}-1
For political and economic participation and decision-making, the EDEP is then indexed by dividing it by 50. The rationale for this indexation: in an ideal society, with equal empowermentof the genders, the GEM variables would equal 50 per cent, that is, women’s share would equalmen’s share for each variable.
Where a male or female index value is zero, the EDEP according to the above formula is notdefined. The limit of EDEP, however, when the index tends towards zero, is zero. Accordingly, inthese cases the value of the EDEP is set to zero.
Finally, the GEM is calculated as a simple average of the three indexed EDEPs. (For more details,see Technical note 1 in HDR2005)
InterpretationWhile the GDI focuses on expansion of capabilities, to take advantage of the opportunities of life.
6. Percentage of schools with separate toilet facilities for girls and boys
Definition and purposeThe lack of separate toilet facilities for girls has been a key cause for girls dropping out of schoolsand repeating class, especially in post-primary schools. By revealing the number and percentageof schools with and without separate toilet facilities, this indicator highlights the need and guidesinvestment in such facilities.
Method of calculation
Percentage of schools Number of schools with separate toilets in school-year t x 100With separate toilets, t = Total number of schools in school-year t
InterpretationThe lower the percentage, the greater the need for investment in school rehabilitation budgetsto ensure that separate toilet facilitites, with water, are available for girls.

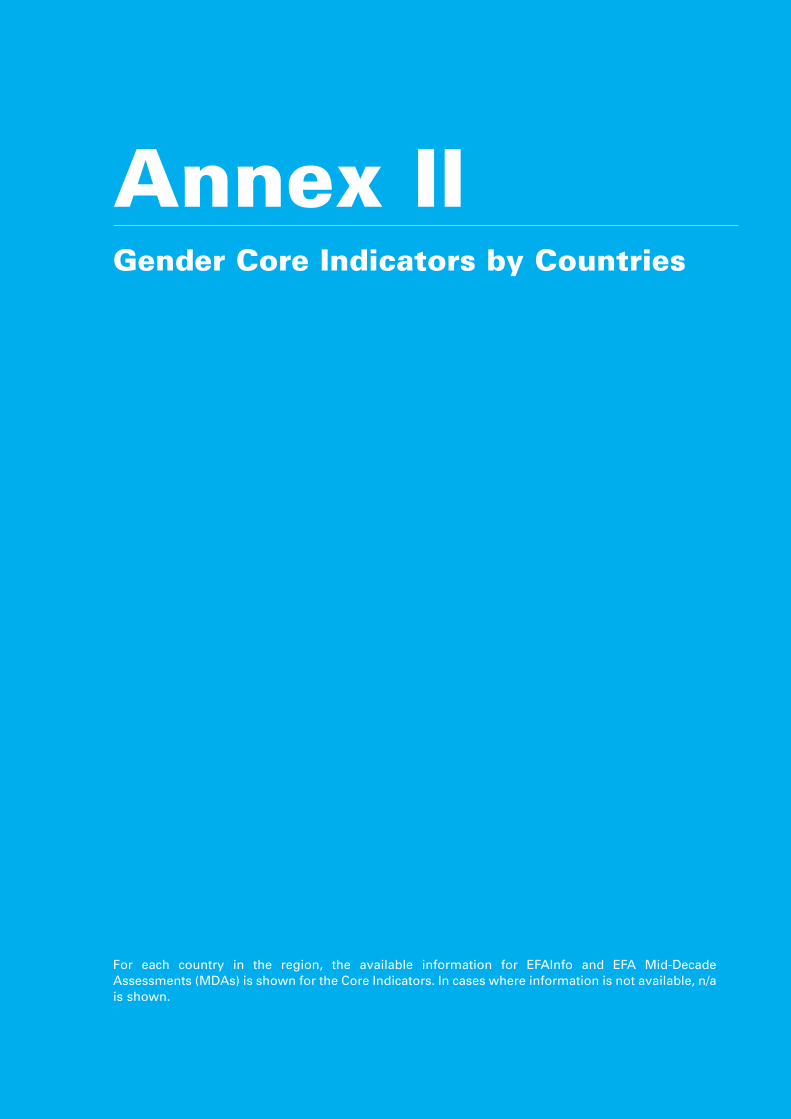
Annex IIGender Core Indicators by Countries
For each country in the region, the available information for EFAInfo and EFA Mid-DecadeAssessments (MDAs) is shown for the Core Indicators. In cases where information is not available, n/ais shown.

Gender Equality in EducationProgress Note
100
Contents
East Asia
China: Henan 101
China: Jiangsu 102
Yunan 103
Mongolia 104
South-East Asia
Cambodia 105
Indonesia 106
Lao PDR 107
Malaysia 108
Myanmar 109
Philippines 110
Thailand 111
Timor-Leste 112
Viet Nam 113
Pacific
Fiji 114
Kiribati 115
Marshall Islands 116
Palau 117
Papua New Guinea 118
Samoa 119
Solomon Islands 120
Tonga 121
Tuvalu 122
Vanuatu 123
Annex II
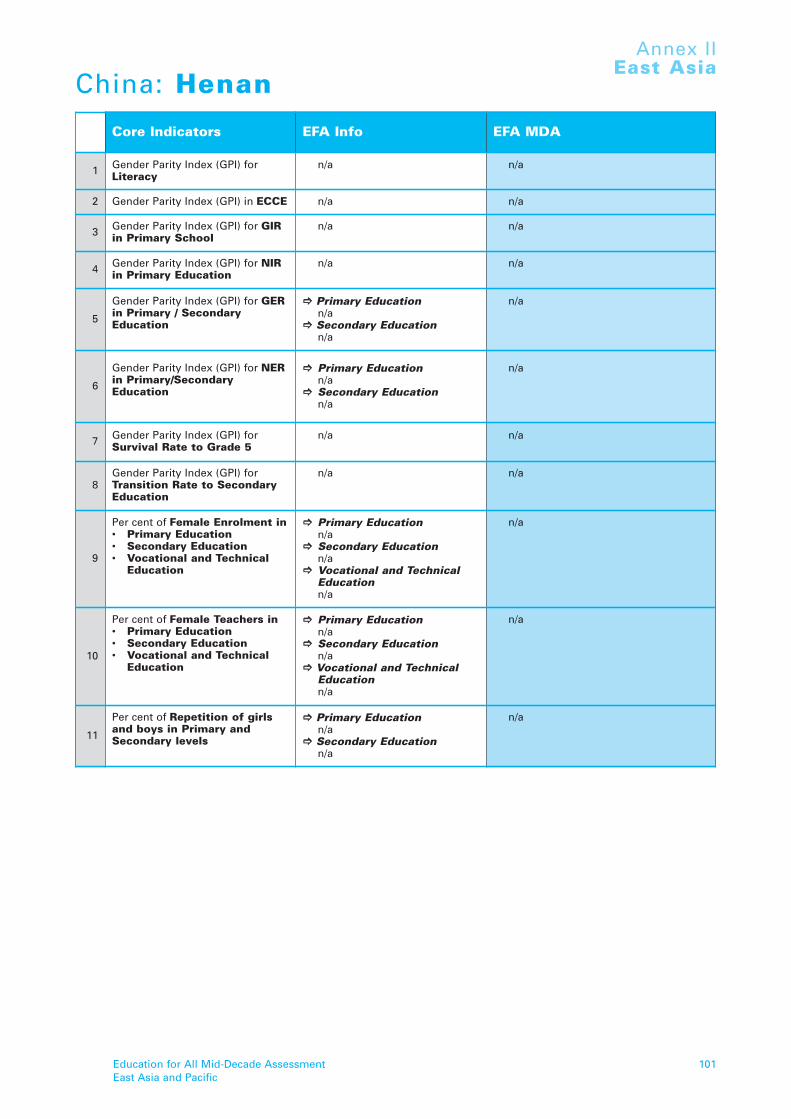
Education for All Mid-Decade AssessmentEast Asia and Pacific
101
Annex IIEast Asia
Core Indicators EFA Info EFA MDA
1 Gender Parity Index (GPI) forLiteracy
n/a n/a
2 Gender Parity Index (GPI) in ECCE n/a n/a
3 Gender Parity Index (GPI) for GIRin Primary School
n/a n/a
4 Gender Parity Index (GPI) for NIRin Primary Education
n/a n/a
5
Gender Parity Index (GPI) for GERin Primary / SecondaryEducation
]]
Primary Educationn/a
]]
Secondary Educationn/a
n/a
6
Gender Parity Index (GPI) for NERin Primary/SecondaryEducation
]]
Primary Educationn/a
]]
Secondary Educationn/a
n/a
7 Gender Parity Index (GPI) forSurvival Rate to Grade 5
n/a n/a
8Gender Parity Index (GPI) forTransition Rate to SecondaryEducation
n/a n/a
9
Per cent of Female Enrolment in • Primary Education• Secondary Education• Vocational and Technical
Education
]]
Primary Educationn/a
]]
Secondary Educationn/a
]]
Vocational and Technical Educationn/a
n/a
10
Per cent of Female Teachers in • Primary Education• Secondary Education• Vocational and Technical
Education
]]
Primary Educationn/a
]]
Secondary Educationn/a
]]
Vocational and Technical Educationn/a
n/a
11
Per cent of Repetition of girlsand boys in Primary andSecondary levels
]]
Primary Educationn/a
]]
Secondary Educationn/a
n/a
China: Henan

Gender Equality in EducationProgress Note
102
Annex IIEast Asia
China: Jiangsu
Core Indicators EFA Info EFA MDA
1 Gender Parity Index (GPI) forLiteracy
n/a n/a
2 Gender Parity Index (GPI) in ECCE n/a n/a
3 Gender Parity Index (GPI) for GIRin Primary School
n/a n/a
4 Gender Parity Index (GPI) for NIRin Primary Education
n/a n/a
5
Gender Parity Index (GPI) for GERin Primary / SecondaryEducation
]]
Primary Educationn/a
]]
Secondary Educationn/a
n/a
6
Gender Parity Index (GPI) for NERin Primary / SecondaryEducation
]]
Primary Educationn/a
]]
Secondary Educationn/a
n/a
7 Gender Parity Index (GPI) forSurvival Rate to Grade 5
n/a n/a
8Gender Parity Index (GPI) forTransition Rate to SecondaryEducation
n/a n/a
9
Per cent of Female Enrolment in Primary EducationSecondary EducationVocational and TechnicalEducation
]]
Primary Educationn/a
]]
Secondary Educationn/a
]]
Vocational and Technical Educationn/a
• Overall (data1990-2005)
10
Per cent of Female Teachers in Primary EducationSecondary EducationVocational and TechnicalEducation
]]
Primary Educationn/a
]]
Secondary Educationn/a
]]
Vocational and Technical Educationn/a
• Overall (data 1990-2005)
11
Per cent of Repetition of girlsand boys in Primary andSecondary levels
]]
Primary Educationn/a
]]
Secondary Educationn/a
n/a

Education for All Mid-Decade AssessmentEast Asia and Pacific
103
Annex IIEast Asia
Core Indicators EFA Info EFA MDA
1 Gender Parity Index (GPI) forLiteracy
n/a n/a
2 Gender Parity Index (GPI) in ECCE n/a n/a
3 Gender Parity Index (GPI) for GIRin Primary School
n/a n/a
4 Gender Parity Index (GPI) for NIRin Primary Education
n/a n/a
5
Gender Parity Index (GPI) for GERin Primary / SecondaryEducation
]]
Primary Educationn/a
]]
Secondary Educationn/a
n/a
6
Gender Parity Index (GPI) for NERin Primary / SecondaryEducation
]]
Primary Educationn/a
]]
Secondary Educationn/a
n/a
7 Gender Parity Index (GPI) forSurvival Rate to Grade 5
n/a n/a
8Gender Parity Index (GPI) forTransition Rate to SecondaryEducation
n/a n/a
9
Per cent of Female Enrolment in • Primary Education• Secondary Education• Vocational and
Technical Education
]]
Primary Educationn/a
]]
Secondary Educationn/a
]]
Vocational and Technical Educationn/a
n/a (data 2001-2006)
10
Per cent of Female Teachers in • Primary Education• Secondary Education• Vocational and
Technical Education
]]
Primary Educationn/a
]]
Secondary Educationn/a
]]
Vocational and Technical Educationn/a
n/a
11
Per cent of Repetition of girlsand boys in Primary andSecondary levels
]]
Primary Educationn/a
]]
Secondary Educationn/a
n/a
China: Yunan

Gender Equality in EducationProgress Note
104
Annex IIEast Asia
Mongolia
Core Indicators EFA Info EFA MDA
1 Gender Parity Index (GPI) forLiteracy
• Time 1, u/r n/a
2 Gender Parity Index (GPI) in ECCE • Time 3+, u/r, disability • Overall (data 2000-2005)
3 Gender Parity Index (GPI) for GIRin Primary School
• Time 3+, sub-national, m/f, u/r n/a
4 Gender Parity Index (GPI) for NIRin Primary Education
• Time 3+, sub-national, m/f, u/rn/a
5
Gender Parity Index (GPI) for GERin Primary / SecondaryEducation
]]
Primary Education• Time 3+, sub-national, m/f, u/r]]
Secondary Education• Time 3+, sub-national, m/f, u/r
]]
Primary Education• Overall (data 2000-2006)]]
Secondary Educationn/a
6
Gender Parity Index (GPI) for NERin Primary / SecondaryEducation
]]
Primary Education• Time 3+, sub-national, m/f, u/r]]
Secondary Education• Time 3+, sub-national, m/f
]]
Primary Education• Overall • m/f (data 2000-2006)]]
Secondary Education• Overall (data 2000-2006)
7Gender Parity Index (GPI) forSurvival Rate to Grade 5
• Time 3+, sub-national, m/f, location, wealth index quintile, mother’s education
n/a
8Gender Parity Index (GPI) forTransition Rate to SecondaryEducation
• Time 3+, sub-national, m/f, location, wealth index quintile, mother’s education
n/a
9
Per cent of Female Enrolment in • Primary Education• Secondary Education• Vocational and
Technical Education
]]
Primary Education• Time 3+, u/r]]
Secondary Education• Time 3+, total (no subgroup)]]
Vocational and Technical Education
• Time 3+, u/r
• overall data (data 2000-2005)
10
Per cent of Female Teachers in • Primary Education• Secondary Education• Vocational and
Technical Education
]]
Primary Education• Time 3+, u/r]]
Secondary Education• Time 3+, u/r]]
Vocational and Technical Education
• Time 3+, u/r
• overall for primary and secondary only (data 2000-2005)
11
Per cent of Repetition of girlsand boys in Primary andSecondary levels
]]
Primary Education• Time 3+, sub-national, m/f, GPI,
u/r]]
Secondary Education• Time 3+, sub-national, u/r
• girl’s data only (data 2000-2005)

Education for All Mid-Decade AssessmentEast Asia and Pacific
105
Annex IISouth-East Asia
Core Indicators EFA Info EFA MDA
1Gender Parity Index (GPI) forLiteracy
• Time 2 Youth Literacy (data 1998-2004)
• m/f• Urban/Rural/Remote
2 Gender Parity Index (GPI) in ECCE • Sub-national, time 3+, u/r • m/f (data 1999-2005)
• Urban/Rural/Remote
3 Gender Parity Index (GPI) for GIRin Primary School
• Time 3+, sub-national, u/r • Urban/Rural/Remote + m/f(data 2000-2006)
• Sub-national (data 2000, 2005)
4 Gender Parity Index (GPI) for NIRin Primary Education
• Time 3+, sub-national, u/r • Urban/Rural/Remote + m/f (data 2000-2005)
• Sub-national (data 2001, 2005)
5
Gender Parity Index (GPI) for GERin Primary/ SecondaryEducation
• Time 3+, sub-national, m/f ]]
Primary Education• m/f• Urban/Rural/Remote (data 2000-2005)
• Sub-national (data 2001, 2005)]]
Lower Secondary• m/f, Urban/Rural/Remote (data 2000-2005)
• Sub-national (data 2001, 2005)]]
Upper Secondarynone
6
Gender Parity Index (GPI) for NERin Primary/ SecondaryEducation
• Time 3+, sub-national, u/r ]]
Primary Education• m/f• Urban/Rural/Remote (data 2000-2005)
• Sub-national (data 2001, 2005)]]
Lower Secondary• Sex, Urban/Rural/Remote (data 2000-2005)
• Sub-national (data 2001, 2005)]]
Upper Secondarynone
7 Gender Parity Index (GPI) forSurvival Rate to Grade 5
• Time 3+ • m/f, Urban/Rural/Remote (data 1999-2004)
• Sub-national (data 2003, 2004)
8
Gender Parity Index (GPI) forTransition Rate to SecondaryEducation
• Time 3+, sub-national, u/r ]]
Primary to Lower Secondary• m/f, Urban/Rural/Remote (data 2000-2005)
• Sub-national (data 2001, 2005)]]
Lower Secondary to Upper Secondary
• m/f, Urban/Rural/Remote (data 2000-2005)
• Sub-national (data 2001, 2005)
9
Per cent of Female Enrolment in • Primary Education• Secondary Education• Vocational and Technical
Education
• u/r, Time 3+, sub-national ]]
Primary • Overall (data 1999-2005)
• Sub-national (data 2000, 2005)]]
Lower Secondary• Overall (data 1999-2005)
• Sub-national (data 2000, 2005)]]
Upper Secondary• Overall (data 1999-2005)
• Sub-national (data 2000, 2005)
10
Per cent of Female Teachers in • Primary Education• Secondary Education• Vocational and Technical
Education
• Time 3+, u/r, sub-national ]]
Primary• Overall (data 2000-2005)
• Sub-national (data 2000, 2005)]]
Secondary• Overall (data 2000-2005)
• Sub-national (data 2000, 2005)
11
Per cent of Repetition of girlsand boys in Primary andSecondary levels
• Time 3+, u/r ]]
Primary• Overall Female (data 2000-2005)
• Overall Male (data 2000-2005)]]
Lower Secondary• Overall Female (data 2000-2005)
• Overall Male (data 2000-2005)]]
Upper Secondary• Overall Female (data 2000-2005)
• Overall Male (data 2000-2005)
Cambodia

Gender Equality in EducationProgress Note
106
Annex IISouth-East Asia
Indonesia
Core Indicators EFA Info EFA MDA
1 Gender Parity Index (GPI) forLiteracy
• Time 3+, sub-national, u/r • m/f (data 1971-2005)
2 Gender Parity Index (GPI) in ECCE • Time 3+, sub-national, disability n/a
3 Gender Parity Index (GPI) for GIRin Primary School
• Time 3+, sub-national, m/f n/a
4 Gender Parity Index (GPI) for NIRin Primary Education
• Time 3+, sub-national, m/f • Province (data 2006)
5
Gender Parity Index (GPI) for GERin Primary / SecondaryEducation
]]
Primary Education• Time 3+, sub-national, m/f,
disability]]
Secondary Education• Time 3+, sub-national, m/f,
disability
]]
Primary Education• Overall (data 1995-2006)]]
Secondary Education• Junior Secondary (data 1995-2006)
• Senior Secondary (data 1995-2006)
6
Gender Parity Index (GPI) for NERin Primary / SecondaryEducation
]]
Primary Education• Time 3+, sub-national, m/f]]
Secondary Education• Time 3+, sub-national, m/f
]]
Primary Education• Overall (data 1995-2006)
• Province (data 2006)]]
Secondary Education• Junior Secondary Overall (data 1995-2006)
• Junior Secondary Region (data 2006)
• Senior Secondary Overall (data 1995-2006)
• Senior Secondary Region (data 2006)
7 Gender Parity Index (GPI) forSurvival Rate to Grade 5
• Time 3+, sub-national, m/f n/a
8Gender Parity Index (GPI) forTransition Rate to SecondaryEducation
• Time 3+, sub-national, m/f • m/f (data 2000-2006)
9
Per cent of Female Enrolment in • Primary Edu.• Secondary Edu.• Vocational and
Technical Edu.
]]
Primary Education• Time 3+, sub-national,u/r]]
Secondary Education• Time 3+, sub-national,u/r]]
Vocational and Technical Education
• Time 3+, sub-national,u/r
n/a
10
Per cent of Female Teachers in • Primary Education• Secondary Education• Vocational and
Technical Education
]]
Primary Education• Time 1, total (no subgroup)]]
Secondary Education• Time 1, total (no subgroup)]]
Vocational and Technical Educationn/a
• Overall
11
Per cent of Repetition of girlsand boys in Primary andSecondary levels
]]
Primary Education• Time 3+, sub-national, m/f, GPI]]
Secondary Educationn/a
n/a

Education for All Mid-Decade AssessmentEast Asia and Pacific
107
Annex IISouth-East Asia
Core Indicators EFA Info EFA MDA
1 Gender Parity Index (GPI) forLiteracy
n/a • Overall (data 2000& 2005)
2 Gender Parity Index (GPI) in ECCE • Time 3+ • Overall (data 2000, 2005)
3 Gender Parity Index (GPI) for GIRin Primary School
• Time 3+, sub-national, m/f • m/f (data 1991-2005)
• Region (data 2005)
4 Gender Parity Index (GPI) for NIRin Primary Education
• Time 3+, sub-national, m/f • m/f (data 1991-2005)
5
Gender Parity Index (GPI) for GERin Primary / SecondaryEducation
]]
Primary Education• Time 3+, sub-national, m/f]]
Secondary Education• Time 3+, sub-national, m/f,
disability
]]
Primary Education• M/f (data 2000-2005)]]
Lower Secondary• Overall (data 2000-2005)]]
Upper Secondary• Overall (data 2000, 2005)
6
Gender Parity Index (GPI) for NERin Primary / SecondaryEducation
]]
Primary Education• Time 3+, sub-national, m/f]]
Secondary Education• Time 3+, sub-national, m/f
]]
Primary Education• m/f (data 2000-2005)]]
Lower Secondary• Overall (data 2000-2005)]]
Upper Secondary• Overall (data 2000, 2005)
• Urban/Rural + Sub-national (data 2002)
7 Gender Parity Index (GPI) forSurvival Rate to Grade 5
• Time 3+, sub-national, m/f • Overall (data 1991-2004)
• m/f (data 2000&2005)
8
Gender Parity Index (GPI) forTransition Rate to SecondaryEducation
• Sub-national• 3-year/more
From Primary to Lower Secondary• Overall (data 2000, 2005)
From Lower Secondary to UpperSecondary• Sub-national (data 2004/5)
• m/f (data 2000-2005)
9
Per cent of Female Enrolment in • Primary Education• Secondary Education• Vocational and
Technical Education
]]
Primary Education• Time 3+, total (no subgroup)]]
Secondary Education• Time 3+, total (no subgroup)]]
Vocational and Technical Education
• Time 3+, total (no subgroup)
• Overall (data 2000, 2005/06)
10
Per cent of Female Teachers in • Primary Education• Secondary Education• Vocational and
Technical Education
]]
Primary Education• Time 3+, total (no subgroup)]]
Secondary Education• Time 3+, total (no subgroup)]]
Vocational and Technical Education
• Time 3+, total (no subgroup)
• Overall (data 2000, 2005/06)
11
Per cent of Repetition of girlsand boys in Primary andSecondary levels
]]
Primary Education• Time 3+, sub-national, m/f, GPI]]
Secondary Education• Time 3+, total (no subgroup)
]]
Primary• Grade (data 2000, 2005)]]
Lower Secondary• m/f (data 2000, 2005)
Lao PDR

Gender Equality in EducationProgress Note
108
Annex IISouth-East Asia
Malaysia
Core Indicators EFA Info EFA MDA
1 Gender Parity Index (GPI) forLiteracy
n/a n/a
2 Gender Parity Index (GPI) in ECCE • Time 3+ n/a
3 Gender Parity Index (GPI) for GIRin Primary School
• Time 3+, sub-national, m/f n/a
4 Gender Parity Index (GPI) for NIRin Primary Education
• Time 1, sub-national, m/f n/a
5
Gender Parity Index (GPI) for GERin Primary / SecondaryEducation
]]
Primary Education• Time 3+, sub-national, m/f]]
Secondary Education• Time 3+, sub-national, m/f,
disability
]]
Primary Education• Overall (data 2005)]]
Secondary Education• Overall (data 2005)
6
Gender Parity Index (GPI) for NERin Primary / SecondaryEducation
]]
Primary Education• Time 3+, sub-national, m/f]]
Secondary Education• Time 3+, sub-national, m/f
n/a
7 Gender Parity Index (GPI) forSurvival Rate to Grade 5
• Time 3+, sub-national, m/f n/a
8Gender Parity Index (GPI) forTransition Rate to SecondaryEducation
• Time 3+, sub-national, m/f n/a
9
Per cent of Female Enrolment in • Primary Education• Secondary Education• Vocational and
Technical Education
]]
Primary Education• Time 3+, total (no subgroup)]]
Secondary Education• Time 3+, total (no subgroup)]]
Vocational and Technical Education
• Time 3+, total (no subgroup)
]]
Primary• Overall (data 2005)]]
Secondary• Overall (data 2005)
10
Per cent of Female Teachers in • Primary Education• Secondary Education• Vocational and
Technical Education
]]
Primary Education• Time 2, total (no subgroup)]]
Secondary Education• Time 3+, total (no subgroup)]]
Vocational and TechnicalEducation• Time 3+, total (no subgroup)
n/a
11
Per cent of Repetition of girlsand boys in Primary andSecondary levels
]]
Primary Education n/a
]]
Secondary Educationn/a

Education for All Mid-Decade AssessmentEast Asia and Pacific
109
Annex IISouth-East Asia
Core Indicators EFA Info EFA MDA
1 Gender Parity Index (GPI) forLiteracy
n/a • Overall (data 2002-2005)
2 Gender Parity Index (GPI) in ECCE n/a n/a
3 Gender Parity Index (GPI) for GIRin Primary School
• Time 3+, sub-national, m/f, u/r • Overall (data 2000, 2005)
4 Gender Parity Index (GPI) for NIRin Primary Education
• Time 3+, sub-national, m/f, u/r • m/f (data 2000-2005)
5
Gender Parity Index (GPI) for GERin Primary / SecondaryEducation
]]
Primary Education• Time 3+, sub-national, m/f, u/r]]
Secondary Education• Time 3+, sub-national, m/f, u/r
]]
Primary and Secondary Education
• Overall (data 2000, 2005)
6
Gender Parity Index (GPI) for NERin Primary / SecondaryEducation
]]
Primary Education• Time 3+, sub-national, m/f, u/r]]
Secondary Education• Time 3+, sub-national, m/f, u/r
]]
Primary Education• m/f (data 2000-2005)
• Sub-national (data 2005)]]
Secondary Education• Overall (data 2000, 2005)
7 Gender Parity Index (GPI) forSurvival Rate to Grade 5
• Time 3+, sub-national, m/f, u/r • Sub-national (data 2002-2003)
8Gender Parity Index (GPI) forTransition Rate to SecondaryEducation
• Time 3+, sub-national, m/f n/a
9
Per cent of Female Enrolment in Primary EducationSecondary EducationVocational and TechnicalEducation
]]
Primary Education• Time 3+, total (no subgroup)]]
Secondary Education• Time 3+, total (no subgroup)]]
Vocational and Technical Educationn/a
]]
Primary/ Secondary• Urban/Rural (data 2003-2005)
10
Per cent of Female Teachers in • Primary Education• Secondary Education• Vocational and
Technical Education
]]
Primary Education• Time 3+, total (no subgroup)]]
Secondary Education• Time 3+, total (no subgroup)]]
Vocational and Technical Educationn/a
• Overall (data 2003-2005)
11
Per cent of Repetition of girlsand boys in Primary andSecondary levels
]]
Primary Education• Time 3+, sub-national, m/f, GPI,
u/r]]
Secondary Education• Time 3+, sub-national, total
(no subgroup)
• Repetition rate for girls only (data 2000-2005)
Myanmar
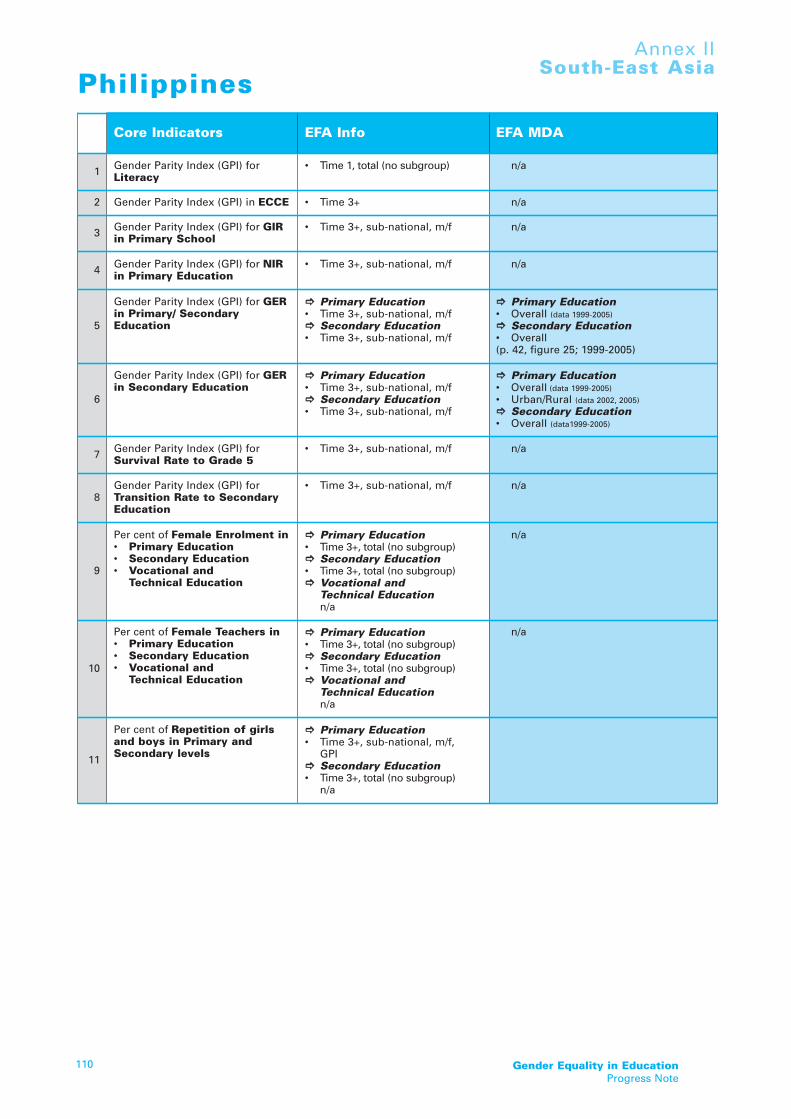
Gender Equality in EducationProgress Note
110
Annex IISouth-East Asia
Philippines
Core Indicators EFA Info EFA MDA
1 Gender Parity Index (GPI) forLiteracy
• Time 1, total (no subgroup) n/a
2 Gender Parity Index (GPI) in ECCE • Time 3+ n/a
3 Gender Parity Index (GPI) for GIRin Primary School
• Time 3+, sub-national, m/f n/a
4 Gender Parity Index (GPI) for NIRin Primary Education
• Time 3+, sub-national, m/f n/a
5
Gender Parity Index (GPI) for GERin Primary/ SecondaryEducation
]]
Primary Education• Time 3+, sub-national, m/f]]
Secondary Education• Time 3+, sub-national, m/f
]]
Primary Education• Overall (data 1999-2005)]]
Secondary Education• Overall (p. 42, figure 25; 1999-2005)
6
Gender Parity Index (GPI) for GERin Secondary Education
]]
Primary Education• Time 3+, sub-national, m/f]]
Secondary Education• Time 3+, sub-national, m/f
]]
Primary Education• Overall (data 1999-2005)
• Urban/Rural (data 2002, 2005)]]
Secondary Education• Overall (data1999-2005)
7 Gender Parity Index (GPI) forSurvival Rate to Grade 5
• Time 3+, sub-national, m/f n/a
8Gender Parity Index (GPI) forTransition Rate to SecondaryEducation
• Time 3+, sub-national, m/f n/a
9
Per cent of Female Enrolment in • Primary Education• Secondary Education• Vocational and
Technical Education
]]
Primary Education• Time 3+, total (no subgroup)]]
Secondary Education• Time 3+, total (no subgroup)]]
Vocational and Technical Educationn/a
n/a
10
Per cent of Female Teachers in • Primary Education• Secondary Education• Vocational and
Technical Education
]]
Primary Education• Time 3+, total (no subgroup)]]
Secondary Education• Time 3+, total (no subgroup)]]
Vocational and Technical Educationn/a
n/a
11
Per cent of Repetition of girlsand boys in Primary andSecondary levels
]]
Primary Education• Time 3+, sub-national, m/f,
GPI]]
Secondary Education• Time 3+, total (no subgroup)
n/a

Education for All Mid-Decade AssessmentEast Asia and Pacific
111
Annex IISouth-East Asia
Core Indicators EFA Info EFA MDA
1 Gender Parity Index (GPI) forLiteracy
n/a • m/f • Aged 15 over (data 2000, 2005)
2 Gender Parity Index (GPI) in ECCE n/a • overall (data 2000 - 2005)
3 Gender Parity Index (GPI) for GIRin Primary School
• Time 1, sub-national, m/f • overall (data 2000-2006)
4 Gender Parity Index (GPI) for NIRin Primary Education
n/a • overall (data 2000-2006)
5
Gender Parity Index (GPI) for GERin Primary / SecondaryEducation
]]
Primary Education• Time 3+, sub-national, m/f]]
Secondary Education• Time 1, sub-national
]]
Primary and Secondary Education
• overall (data 2000 - 2005)
6
Gender Parity Index (GPI) for NERin Primary / SecondaryEducation
]]
Primary Education• Time 3+, sub-national, m/f]]
Secondary Education• Time 3+, sub-national, m/f
]]
Primary and Secondary Education
• overall (data 2000 - 2005)
7 Gender Parity Index (GPI) forSurvival Rate to Grade 5
n/a • overall (data 2000-2004)
8Gender Parity Index (GPI) forTransition Rate to SecondaryEducation
n/a • overall (data 1999-2007)
9
Per cent of Female Enrolment in • Primary Education• Secondary Education• Vocational and
Technical Education
]]
Primary EducationTime 2, total (no subgroup)]]
Secondary Education• Time 1, total (no subgroup)]]
Vocational and Technical Education
• Time 1, total (no subgroup)
• overall (data 2000-2005)
10
Per cent of Female Teachers in • Primary Education• Secondary Education• Vocational and
Technical Education
]]
Primary Education• Time 2, total (no subgroup)]]
Secondary Education• Time 2, total (no subgroup)]]
Vocational and Technical Educationn/a
• BKK for primary and secondary education only (data 2000 – 2005)
11
Per cent of Repetition of girlsand boys in Primary andSecondary levels
]]
Primary Education• Time 1, sub-national, m/f]]
Secondary Educationn/a
• data for primary education only
Thailand

Gender Equality in EducationProgress Note
112
Annex IISouth-East Asia
Timor-Leste
Core Indicators EFA Info EFA MDA
1 Gender Parity Index (GPI) forLiteracy
n/a
2 Gender Parity Index (GPI) in ECCE • Time 1
3 Gender Parity Index (GPI) for GIRin Primary School
• Time 1
4 Gender Parity Index (GPI) for NIRin Primary Education
• Time 1
5
Gender Parity Index (GPI) for GERin Primary/SecondaryEducation
]]
Primary Education• Time 3+, m/f]]
Secondary Education• Time 1, total (no subgroup)
6
Gender Parity Index (GPI) for NERin Primary/SecondaryEducation
]]
Primary Education• Time 1, total (no subgroup)]]
Secondary Educationn/a
7 Gender Parity Index (GPI) forSurvival Rate to Grade 5
n/a
8Gender Parity Index (GPI) forTransition Rate to SecondaryEducation
n/a
9
Per cent of Female Enrolment in • Primary Education• Secondary Education• Vocational and
Technical Education
]]
Primary• Time 1, total (no subgroup)]]
Secondary• Time 1, total (no subgroup)]]
Vocational and Technical Educationn/a
10
Per cent of Female Teachers in • Primary Education• Secondary Education• Vocational and
Technical Education
]]
Primary• Time 1, total (no subgroup)]]
Secondary• Time 1, total (no subgroup)]]
Vocational and Technical Educationn/a
11
Per cent of Repetition of girlsand boys in Primary andSecondary levels
Only have girls]]
Primaryn/a
]]
Secondaryn/a

Education for All Mid-Decade AssessmentEast Asia and Pacific
113
Annex IISouth-East Asia
Viet Nam
Core Indicators EFA Info EFA MDA
1 Gender Parity Index (GPI) forLiteracy
• Time 3+, total (no subgroup) • Overall (data 2001-2005)
2 Gender Parity Index (GPI) in ECCE • Time 3+ • Overall (data 2001-2005)
3 Gender Parity Index (GPI) for GIR inPrimary School
• Time 2, sub-national, m/f • Overall (data 2001-2005)
• Sub-national (data 2004-2006)
4 Gender Parity Index (GPI) for NIR inPrimary Education
• Time 1, total (no subgroup) • Sub-national (data 2000, 2005)
5
Gender Parity Index (GPI) for GER inPrimary / Secondary Education
]]
Primary Education• Time 3+, sub-national, m/f]]
Secondary Education• Time 2, sub-national
]]
Primary Education• Overall (data 2000-2005)
• Sub-national (data 2000, 2005)]]
Secondary Education• Overall (data 2000-2005)
• Sub-national (data 2000, 2005)
6
Gender Parity Index (GPI) for NER inPrimary / Secondary Education
]]
Primary Education• Time 3+, sub-national, m/f]]
Secondary Education• Time 3+, sub-national, m/f
]]
Primary Education• Overall (data 2000-2005)
• Sub-national (data 2000, 2005)]]
Secondary Education• Overall (data 2000-2005)
7Gender Parity Index (GPI) forSurvival Rate to Grade 5
]]
Secondary Education• Time 3+, sub-national, m/f
n/a
8Gender Parity Index (GPI) forTransition Rate to SecondaryEducation
• Time 1, total (no subgroup) • Overall (data 2000-2005)• Sub-national (data 2000, 2005)
9
Per cent of Female Enrolment in • Primary Education• Secondary Education• Vocational and
Technical Education
]]
Primary Education• Time 2, total (no subgroup)]]
Secondary Education• Time 2, total (no subgroup)]]
Vocational and TechnicalEducation• Time 2, total (no subgroup)
• Primary overall (data 2000-2005)
• Primary by Sub-national (data 2000, 2005)
• Secondary overall (data 2000-2005)
• Secondary by Sub-national(data 2000, 2005)
10
Per cent of Female Teachers in • Primary Education• Secondary Education• Vocational and
Technical Education
]]
Primary Education• Time 2, total (no subgroup)]]
Secondary Education• Time 2, total (no subgroup)]]
Vocational and TechnicalEducation
n/a
n/a
11Per cent of Repetition of girls andboys in Primary and Secondarylevels
]]
Primary Education• Time 1, sub-national, m/f]]
Secondary Educationn/a
n/a
* repetition rate (overall and by Sub-national) is indicated on page 79; however, data is not disaggregated by gender
Gender Equality in EducationProgress Note
114
Annex IIPacific
Fiji
Core Indicators EFA Info EFA MDA
1 Gender Parity Index (GPI) forLiteracy n/a
n/a (data available by m/f ; 2000-2004)
2 Gender Parity Index (GPI) in ECCE • Time 2 n/a
3 Gender Parity Index (GPI) for GIR inPrimary School
• time1 n/a (data available by m/f unknown year)
4 Gender Parity Index (GPI) for NIR inPrimary Education
• time1 • Overall (data 2006)
5
Gender Parity Index (GPI) for GER inPrimary / Secondary Education ]]
Primary Education• Time 3+, m/f]]
Secondary Education• Time 2, total (no subgroup)
]]
Primary and SecondaryEducation
• Overall (data 2006)
6Gender Parity Index (GPI) for NER inPrimary / Secondary Education
]]
Primary Education• Time3+, m/f]]
Secondary Education• Time3+, m/f
]]
Primary Education• Overall (data 2006)]]
Secondary Education• Overall (data 2006)
7Gender Parity Index (GPI) forSurvival Rate to Grade 5
• Time3+, m/f • m/f (data unknown year)
Gender Parity Index (GPI) for
8 Transition Rate to SecondaryEducation
n/a n/a (data available by m/f unknown year)
9
Per cent of Female Enrolment in • Primary Education• Secondary Education• Vocational and
Technical Education
]]
Primary• Time2, total (no subgroup)]]
Secondary• Time2, total (no subgroup)]]
Vocational and Technical Education
• Time2, total (no subgroup)
]]
Primary (data unknown year)]]
Secondary (data unknown year)
10
Per cent of Female Teachers in • Primary Education• Secondary Education• Vocational and
Technical Education
]]
Primary• Time 1, total (no subgroup)]]
Secondary• Time 1, total (no subgroup)]]
Vocational and Technical Educationn/a
]]
Primary/ Secondary (data 2006)
11
Per cent of Repetition of girls andboys in Primary and Secondarylevels
• Only have girls]]
Primary• Time 1, m/f, total (no subgroup)]]
Secondaryn/a
• m/f (dat unknown year)
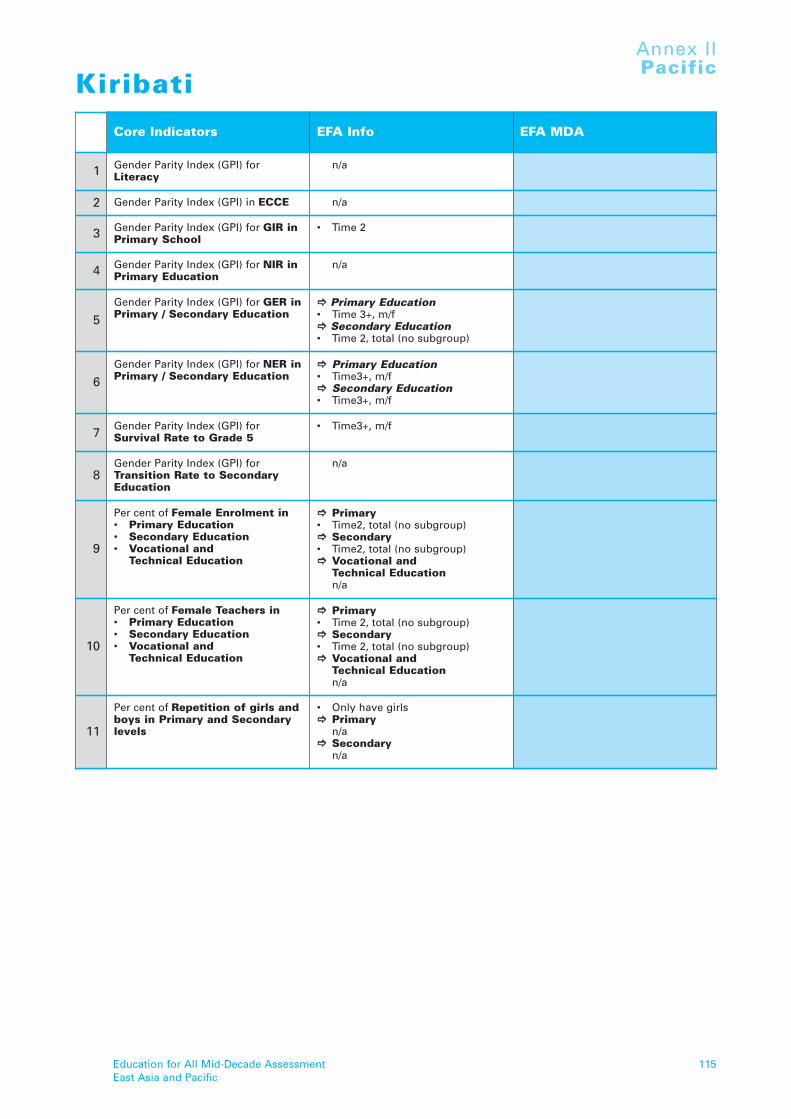
Education for All Mid-Decade AssessmentEast Asia and Pacific
115
Annex IIPacific
Kiribati
Core Indicators EFA Info EFA MDA
1 Gender Parity Index (GPI) forLiteracy
n/a
2 Gender Parity Index (GPI) in ECCE n/a
3 Gender Parity Index (GPI) for GIR inPrimary School
• Time 2
4 Gender Parity Index (GPI) for NIR inPrimary Education
n/a
5Gender Parity Index (GPI) for GER inPrimary / Secondary Education
]]
Primary Education• Time 3+, m/f]]
Secondary Education• Time 2, total (no subgroup)
6Gender Parity Index (GPI) for NER inPrimary / Secondary Education
]]
Primary Education• Time3+, m/f]]
Secondary Education• Time3+, m/f
7Gender Parity Index (GPI) forSurvival Rate to Grade 5
• Time3+, m/f
8Gender Parity Index (GPI) forTransition Rate to SecondaryEducation
n/a
9
Per cent of Female Enrolment in • Primary Education• Secondary Education• Vocational and
Technical Education
]]
Primary• Time2, total (no subgroup)]]
Secondary• Time2, total (no subgroup)]]
Vocational and Technical Educationn/a
10
Per cent of Female Teachers in • Primary Education• Secondary Education• Vocational and
Technical Education
]]
Primary• Time 2, total (no subgroup)]]
Secondary• Time 2, total (no subgroup)]]
Vocational and Technical Educationn/a
11
Per cent of Repetition of girls andboys in Primary and Secondarylevels
• Only have girls]]
Primaryn/a
]]
Secondaryn/a
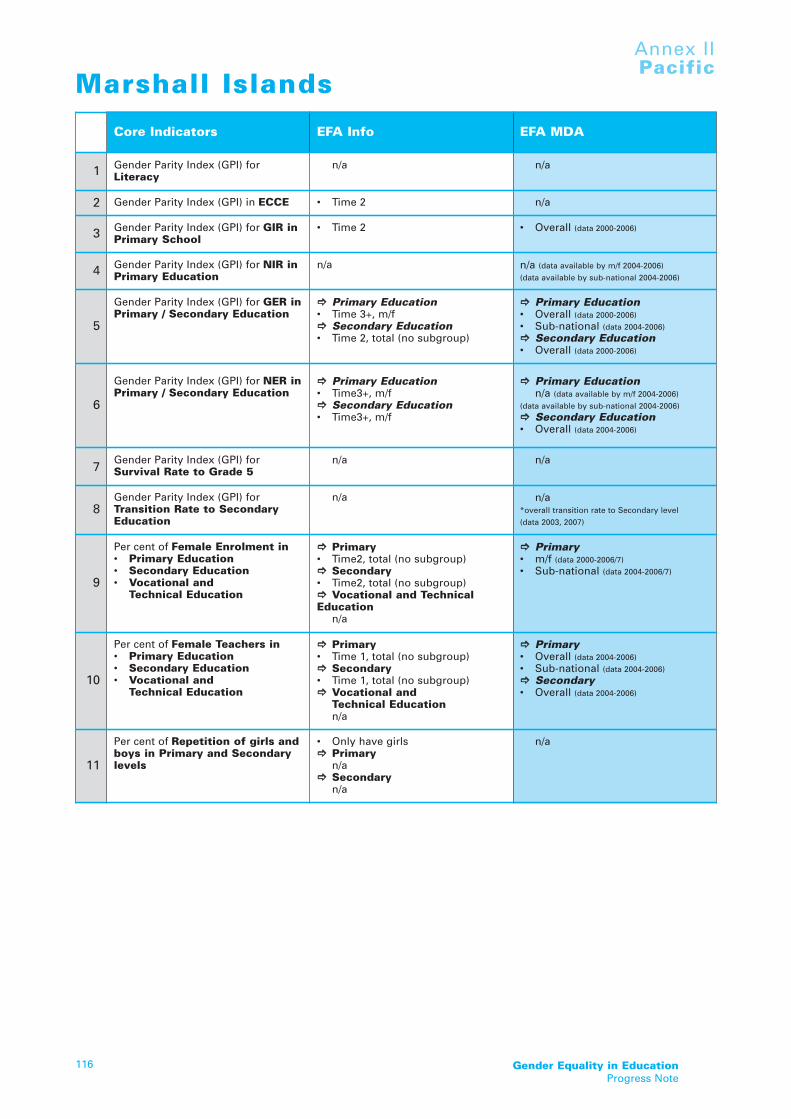
Gender Equality in EducationProgress Note
116
Annex IIPacific
Marshall Islands
Core Indicators EFA Info EFA MDA
1 Gender Parity Index (GPI) forLiteracy
n/a n/a
2 Gender Parity Index (GPI) in ECCE • Time 2 n/a
3 Gender Parity Index (GPI) for GIR inPrimary School
• Time 2 • Overall (data 2000-2006)
4 Gender Parity Index (GPI) for NIR inPrimary Education
n/a n/a (data available by m/f 2004-2006)
(data available by sub-national 2004-2006)
5
Gender Parity Index (GPI) for GER inPrimary / Secondary Education
]]
Primary Education• Time 3+, m/f]]
Secondary Education• Time 2, total (no subgroup)
]]
Primary Education• Overall (data 2000-2006)
• Sub-national (data 2004-2006)]]
Secondary Education• Overall (data 2000-2006)
6
Gender Parity Index (GPI) for NER inPrimary / Secondary Education
]]
Primary Education• Time3+, m/f]]
Secondary Education• Time3+, m/f
]]
Primary Educationn/a (data available by m/f 2004-2006)
(data available by sub-national 2004-2006)]]
Secondary Education• Overall (data 2004-2006)
7Gender Parity Index (GPI) forSurvival Rate to Grade 5
n/a n/a
8Gender Parity Index (GPI) forTransition Rate to SecondaryEducation
n/a n/a*overall transition rate to Secondary level
(data 2003, 2007)
9
Per cent of Female Enrolment in • Primary Education• Secondary Education• Vocational and
Technical Education
]]
Primary• Time2, total (no subgroup)]]
Secondary• Time2, total (no subgroup)]]
Vocational and TechnicalEducation
n/a
]]
Primary• m/f (data 2000-2006/7)
• Sub-national (data 2004-2006/7)
10
Per cent of Female Teachers in • Primary Education• Secondary Education• Vocational and
Technical Education
]]
Primary• Time 1, total (no subgroup)]]
Secondary• Time 1, total (no subgroup)]]
Vocational and Technical Educationn/a
]]
Primary• Overall (data 2004-2006)
• Sub-national (data 2004-2006)]]
Secondary• Overall (data 2004-2006)
11
Per cent of Repetition of girls andboys in Primary and Secondarylevels
• Only have girls]]
Primaryn/a
]]
Secondaryn/a
n/a
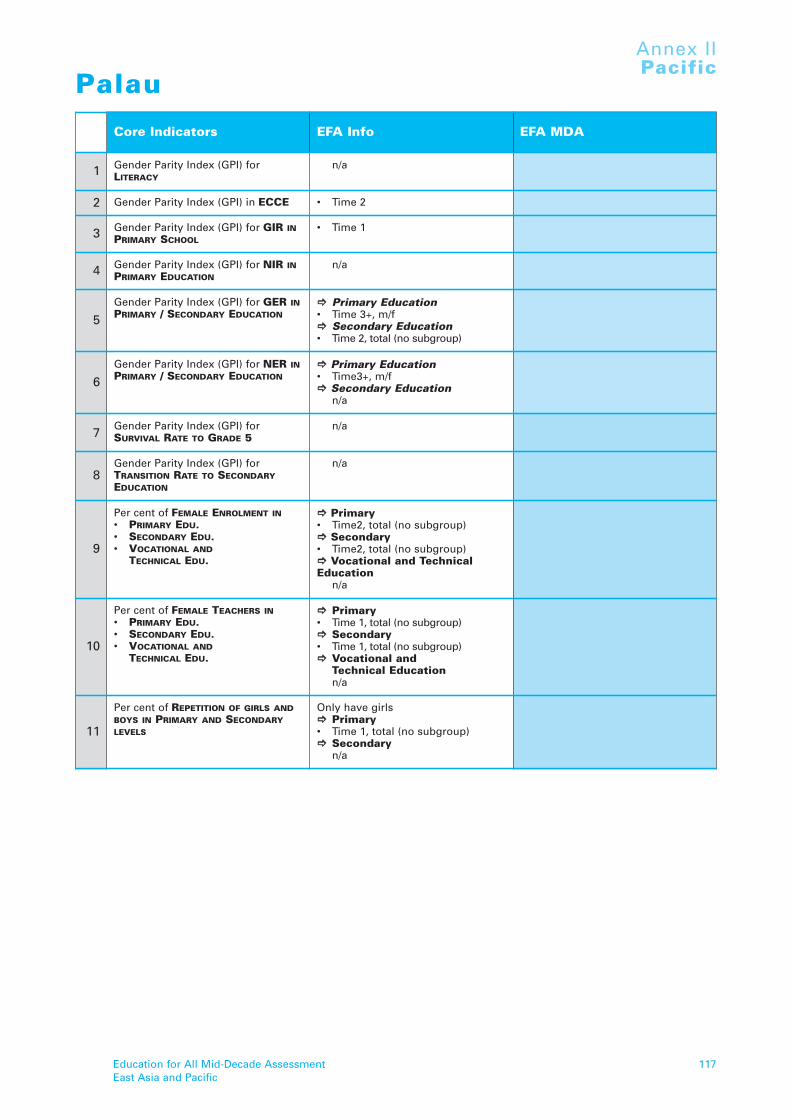
Education for All Mid-Decade AssessmentEast Asia and Pacific
117
Annex IIPacific
Palau
Core Indicators EFA Info EFA MDA
1 Gender Parity Index (GPI) forLITERACY
n/a
2 Gender Parity Index (GPI) in ECCE • Time 2
3 Gender Parity Index (GPI) for GIR INPRIMARY SCHOOL
• Time 1
4 Gender Parity Index (GPI) for NIR INPRIMARY EDUCATION
n/a
5Gender Parity Index (GPI) for GER INPRIMARY / SECONDARY EDUCATION
]]
Primary Education• Time 3+, m/f]]
Secondary Education• Time 2, total (no subgroup)
6Gender Parity Index (GPI) for NER INPRIMARY / SECONDARY EDUCATION
]]
Primary Education• Time3+, m/f]]
Secondary Educationn/a
7Gender Parity Index (GPI) forSURVIVAL RATE TO GRADE 5
n/a
8Gender Parity Index (GPI) forTRANSITION RATE TO SECONDARYEDUCATION
n/a
9
Per cent of FEMALE ENROLMENT IN• PRIMARY EDU.• SECONDARY EDU.• VOCATIONAL AND
TECHNICAL EDU.
]]
Primary• Time2, total (no subgroup)]]
Secondary• Time2, total (no subgroup)]]
Vocational and TechnicalEducation
n/a
10
Per cent of FEMALE TEACHERS IN• PRIMARY EDU.• SECONDARY EDU.• VOCATIONAL AND
TECHNICAL EDU.
]]
Primary• Time 1, total (no subgroup)]]
Secondary• Time 1, total (no subgroup)]]
Vocational and Technical Educationn/a
11
Per cent of REPETITION OF GIRLS ANDBOYS IN PRIMARY AND SECONDARYLEVELS
Only have girls]]
Primary• Time 1, total (no subgroup)]]
Secondaryn/a

Gender Equality in EducationProgress Note
118
Annex IIPacific
Papua New Guinea
Core Indicators EFA Info EFA MDA
1 Gender Parity Index (GPI) forLiteracy
• Time 3+, m/f
2 Gender Parity Index (GPI) in ECCE • Time 2
3 Gender Parity Index (GPI) for GIR inPrimary School
• Time 2
4 Gender Parity Index (GPI) for NIR inPrimary Education
n/a
5Gender Parity Index (GPI) for GER inPrimary / Secondary Education
]]
Primary Education• Time 3+, m/f]]
Secondary Education• Time 2, total (no subgroup)
6Gender Parity Index (GPI) for NER inPrimary / Secondary Education
]]
Primary Educationn/a
]]
Secondary Educationn/a
7Gender Parity Index (GPI) forSurvival Rate to Grade 5
• Time 3+, m/f
8Gender Parity Index (GPI) forTransition Rate to SecondaryEducation
n/a
9
Per cent of Female Enrolment in • Primary Education• Secondary Education• Vocational and
Technical Education
]]
Primary• Time2, total (no subgroup)]]
Secondary• Time2, total (no subgroup)]]
Vocational and Technical Education
• Time2, total (no subgroup)
10
Per cent of Female Teachers in • Primary Education• Secondary Education• Vocational and
Technical Education
]]
Primary• Time 2, total (no subgroup)]]
Secondary• Time 2, total (no subgroup)]]
Vocational and Technical Educationn/a
11
Per cent of Repetition of girls andboys in Primary and Secondarylevels
Only have girls]]
Primaryn/a
]]
Secondaryn/a

Education for All Mid-Decade AssessmentEast Asia and Pacific
119
Annex IIPacific
Samoa
Core Indicators EFA Info EFA MDA
1 Gender Parity Index (GPI) forLiteracy
n/a • Overall (data 1991)
2 Gender Parity Index (GPI) in ECCE • Time 2
3 Gender Parity Index (GPI) for GIR inPrimary School
• Time 2 • Overall (data 2000-2006)
4 Gender Parity Index (GPI) for NIR inPrimary Education
• Time 1 • Overall (data 2000-2006)
5Gender Parity Index (GPI) for GER inPrimary / Secondary Education
]]
Primary Education• Time 2]]
Secondary Education• Time 2
]]
Primary Education• Overall (data 2000-2006)]]
Secondary Education• Overall (data 2000-2006)
6Gender Parity Index (GPI) for NER inPrimary / Secondary Education
]]
Primary Education• Time 2]]
Secondary Education• Time 2
]]
Primary Education• Overall (data 2000-2006)]]
Secondary Education• Overall (data 2000-2006)
7Gender Parity Index (GPI) forSurvival Rate to Grade 5
• Time 3+, m/f • Overall (data 2001-2006)
*Survival Rate to Grade 8
8Gender Parity Index (GPI) forTransition Rate to SecondaryEducation
n/a • Overall (data 2000-2006)
9
Per cent of Female Enrolment in • Primary Education• Secondary Education• Vocational and
Technical Education• Time 2, total (no subgroup)
]]
Primary• m/f (data 2000-2006)]]
Secondary• m/f (data 2000-2006)]]
VTED• m/f (data 2000-2007)
10
Per cent of Female Teachers in • Primary Education• Secondary Education• Vocational and
Technical Education
• Time 2, total (no subgroup)]]
Primary• m/f (data 2000-2007)]]
Secondary• m/f (data 2000-2007)]]
VTEDn/a
11
Per cent of Repetition of girls andboys in Primary and Secondarylevels
• Time 1, m/f ]]
Primary (by Year 5)• m/f (data 2000-2005)]]
Lower Secondary (by Year 8)
• m/f (data 2000-2005)

Gender Equality in EducationProgress Note
120
Annex IIPacific
Solomon Islands
Core Indicators EFA Info EFA MDA
1 Gender Parity Index (GPI) forLiteracy
n/a
2 Gender Parity Index (GPI) in ECCE • Time 2
3 Gender Parity Index (GPI) for GIR inPrimary School
n/a
4 Gender Parity Index (GPI) for NIR inPrimary Education
n/a
5Gender Parity Index (GPI) for GER inPrimary / Secondary Education
]]
Primary Education• Time 3+, m/f]]
Secondary Education• Time 2, total (no subgroup)
6Gender Parity Index (GPI) for NER inPrimary / Secondary Education
]]
Primary Education• Time3+, m/f]]
Secondary Education• Time3+, m/f
7Gender Parity Index (GPI) forSurvival Rate to Grade 5
• Time 1, m/f
8Gender Parity Index (GPI) forTransition Rate to SecondaryEducation
n/a
9
Per cent of Female Enrolment in • Primary Education• Secondary Education• Vocational and
Technical Education
]]
Primary• Time2, total (no subgroup)]]
Secondary• Time2, total (no subgroup)]]
Vocational and Technical Educationn/a
10
Per cent of Female Teachers in • Primary Education• Secondary Education• Vocational and
Technical Education
]]
Primary• Time 1, total (no subgroup)]]
Secondary• Time 1, total (no subgroup)]]
Vocational and Technical Educationn/a
11
Per cent of Repetition of girls andboys in Primary and Secondarylevels
• Only have girls]]
Primaryn/a
]]
Secondaryn/a

Education for All Mid-Decade AssessmentEast Asia and Pacific
121
Annex IIPacific
Tonga
Core Indicators EFA Info EFA MDA
1 Gender Parity Index (GPI) forLiteracy
• Time 3+, m/f
2 Gender Parity Index (GPI) in ECCE • Time 2
3 Gender Parity Index (GPI) for GIR inPrimary School
• Time 2
4 Gender Parity Index (GPI) for NIR inPrimary Education
• Time 1
5Gender Parity Index (GPI) for GER inPrimary / Secondary Education
]]
Primary Education• Time 3+, m/f]]
Secondary Education• Time 2, total (no subgroup)
6Gender Parity Index (GPI) for NER inPrimary / Secondary Education
]]
Primary Education• Time3+, m/f]]
Secondary Education• Time3+, m/f
7Gender Parity Index (GPI) forSurvival Rate to Grade 5
• Time 3+, m/f
8Gender Parity Index (GPI) forTransition Rate to SecondaryEducation
n/a
9
Per cent of Female Enrolment in • Primary Education• Secondary Education• Vocational and
Technical Education
]]
Primary• Time2, total (no subgroup)]]
Secondary• Time2, total (no subgroup)]]
Vocational and Technical Education
• Time2, total (no subgroup)
10
Per cent of Female Teachers in • Primary Education• Secondary Education• Vocational and
Technical Education
]]
Primary• Time 2, total (no subgroup)]]
Secondary• Time 1, total (no subgroup)]]
Vocational and Technical Educationn/a
11
Per cent of Repetition of girls andboys in Primary and Secondarylevels
• Only have girls]]
Primaryn/a
]]
Secondaryn/a

Gender Equality in EducationProgress Note
122
Annex IIPacific
Tuvalu
Core Indicators EFA Info EFA MDA
1 Gender Parity Index (GPI) forLiteracy
n/a
2 Gender Parity Index (GPI) in ECCE • Time 1
3 Gender Parity Index (GPI) for GIR inPrimary School
• Time 2
4 Gender Parity Index (GPI) for NIR inPrimary Education
n/a
5Gender Parity Index (GPI) for GER inPrimary / Secondary Education
]]
Primary Education• Time 3+, m/f]]
Secondary Educationn/a
6Gender Parity Index (GPI) for NER inPrimary / Secondary Education
]]
Primary Educationn/a
]]
Secondary Educationn/a
7Gender Parity Index (GPI) forSurvival Rate to Grade 5
• Time 3+, total (no subgroup)
8Gender Parity Index (GPI) forTransition Rate to SecondaryEducation
n/a
9
Per cent of Female Enrolment in • Primary Education• Secondary Education• Vocational and
Technical Education
]]
Primary• Time2, total (no subgroup)]]
Secondary• n/a]]
Vocational and Technical Educationn/a
10
Per cent of Female Teachers in • Primary Education• Secondary Education• Vocational and
Technical Education
]]
Primaryn/a
]]
Secondaryn/a
]]
Vocational and Technical Educationn/a
11
Per cent of Repetition of girls andboys in Primary and Secondarylevels
• Only have girls]]
Primaryn/a
]]
Secondaryn/a

Education for All Mid-Decade AssessmentEast Asia and Pacific
123
Annex IIPacific
Vanuatu
Core Indicators EFA Info EFA MDA
1 Gender Parity Index (GPI) forLiteracy
• Time 2, total (no subgroup)
2 Gender Parity Index (GPI) in ECCE • Time 1
3 Gender Parity Index (GPI) for GIR inPrimary School
• Time 2
4 Gender Parity Index (GPI) for NIR inPrimary Education
• Time 1
5Gender Parity Index (GPI) for GER inPrimary / Secondary Education
]]
Primary Education• Time 3+, m/f]]
Secondary Education• Time 3+
6Gender Parity Index (GPI) for NER inPrimary / Secondary Education
]]
Primary Education• Time3+, m/f]]
Secondary Education• Time3+, m/f
7Gender Parity Index (GPI) forSurvival Rate to Grade 5
• Time 3+, m/f, total (no subgroup)
8Gender Parity Index (GPI) forTransition Rate to SecondaryEducation
n/a
9
Per cent of Female Enrolment in • Primary Education• Secondary Education• Vocational and
Technical Education
]]
Primary• Time2, total (no subgroup)]]
Secondary• Time2, total (no subgroup)]]
Vocational and Technical Education
• Time2, total (no subgroup)
10
Per cent of Female Teachers in • Primary Education• Secondary Education• Vocational and
Technical Education
]]
Primary• Time 2, total (no subgroup)]]
Secondary• Time 1, total (no subgroup)]]
Vocational and TechnicalEducation
n/a
11
Per cent of Repetition of girls andboys in Primary and Secondarylevels
• Only have girls]]
Primary• Time 1, m/f, total (no subgroup)]]
Secondaryn/a


Annex IIIGender Policy Indicators
Annex III presents the Gender Policy Indicators endorsed for the EFA MDA along with a brief overviewof country status in relation to those indicators.
Contents
Indicator 5.1.1 127
Legislative, policy and institutional reform exist that are in conformance with theConvention on the Elimination of All Forms of Discrimination against Women (CEDAW)
Indicator 5.1.2 131
Percentage of the budget dedicated to gender programming within relevant Ministries
Indicator 5.1.3 134
Existence of policies to encourage girl participation in school (stipends, scholarships, etc.)a) General policies could be: those regarding teachers’ status, recruitment, and
professional development.
b) More specific policies on gender mainstreaming in education (not only girls)
Indicator 5.1.4 138
Percentage of the budget dedicated to gender programming within relevant Ministries
Gender Equality in EducationProgress Note
126
Annex IIIGender Policy Indicators

Education for All Mid-Decade AssessmentEast Asia and Pacific
127
Annex IIIGender Policy Indicators
Indicator 5.1.1
Legislative, policy and institutional reform exist that are inconformance with the Convention on the Elimination of AllForms of Discrimination against Women (CEDAW)
CEDAW has clearly spelled out how gender discrimination is manifested in society and how thesecan be overcome and eliminated. This indicator allows countries to review their existing education legislation, policies and reforms in light of provisions within CEDAW. Responses to thisquestion allows the report to identify those specific aspects of legislation or policy that are eitherexemplary in terms of their promotion of gender equality, or that need to be revised or addressedbecause they are either gender discriminatory or allow for exploitation based on gender.
Means of Verification: Referring to actual policies and legislation is essential. It is also important that opportunities for stakeholder inputs and comments and review (possibly througha presentation of the draft response to a stakeholder team).
Brunei Darussalam YES – Legislative, policy and institutional reform exist that are in conformance with the
Convention on the Elimination of All Forms of Discrimination against Women (CEDAW)
RATIFIED CEDAW – Date of Accession, 24 May 2006 a
Cambodia YES – Legislative, policy and institutional reform exist that are in conformance with the
Convention on the Elimination of All Forms of Discrimination against Women (CEDAW)
RATIFIED CEDAW – Date of Accession, 15 October 1992 a
However, The Committee on the Rights of the Child (CRC) expressed concern at the fact
that primary education is not compulsory and that there are gender disparities in school
attendance. The Committee on the Rights of Women (CEDAW) is also concerned about
the disparity in school enrollment for males and females and the high drop-out rates of
girls. Early and forced marriages are among the obstacles that prevent girls from
continuing their education.
China YES – Legislative, policy and institutional reform exist that are in conformance with the
Convention on the Elimination of All Forms of Discrimination against Women (CEDAW)
RATIFIED CEDAW – Date of Accession, 4 November 1980 b
The Committee on the Rights of the Child (CRC) is concerned that the Penal Code does not
include all purposes and forms of sale of children.

Gender Equality in EducationProgress Note
128
Annex IIIGender Policy Indicators
Cook Islands YES – Legislative, policy and institutional reform exist that are in conformance with the
Convention on the Elimination of All Forms of Discrimination against Women (CEDAW)
RATIFIED CEDAW – Date of Accession, 11 August 2006 a
The Cook Islands adopted a National Policy in 1995 to develop Cook Islands women and
to ensure their rights to equal opportunities in human resource development and
decision making. The policy is being implemented through four strategies: involving
women in discussion and decision making about sustainable development; regular
consultations with communities through the Gender and Development Division (GADD);
community participation through churches, private sector, traditional leaders and
others; and integrating gender, population, environment and food security issues.
Fiji YES – Legislative, policy and institutional reform exist that are in conformance with the
Convention on the Elimination of All Forms of Discrimination against Women (CEDAW)
RATIFIED CEDAW – Date of Accession, 28 August 1995 a/b
Indonesia YES – Legislative, policy and institutional reform exist that are in conformance with the
Convention on the Elimination of All Forms of Discrimination against Women (CEDAW)
RATIFIED CEDAW – Date of Accession, 13 September 1984 b
Kiribati YES – Legislative, policy and institutional reform exist that are in conformance with the
Convention on the Elimination of All Forms of Discrimination against Women (CEDAW)
RATIFIED CEDAW – Date of Accession, 17 March 2004 a
Korea DPR YES – Legislative, policy and institutional reform exist that are in conformance with the
Convention on the Elimination of All Forms of Discrimination against Women (CEDAW)
RATIFIED CEDAW – Date of Accession, 27 February 2001 a
Lao PDR YES – Legislative, policy and institutional reform exist that are in conformance with the
Convention on the Elimination of All Forms of Discrimination against Women (CEDAW)
RATIFIED CEDAW – Date of Accession, 14 August 1981
Malaysia YES – Legislative, policy and institutional reform exist that are in conformance with the
Convention on the Elimination of All Forms of Discrimination against Women (CEDAW)
RATIFIED CEDAW – Date of Accession, 5 July 1995 a/b
Marshall Islands YES – Legislative, policy and institutional reform exist that are in conformance with the
Convention on the Elimination of All Forms of Discrimination against Women (CEDAW)
RATIFIED CEDAW – Date of Accession, 2 March 2006 a

Education for All Mid-Decade AssessmentEast Asia and Pacific
129
Annex IIIGender Policy Indicators
F.S. Micronesia YES – Legislative, policy and institutional reform exist that are in conformance with the
Convention on the Elimination of All Forms of Discrimination against Women (CEDAW)
RATIFIED CEDAW – Date of Accession, 1 Sept 2004 a
Mongolia YES – Legislative, policy and institutional reform exist that are in conformance with the
Convention on the Elimination of All Forms of Discrimination against Women (CEDAW)
RATIFIED CEDAW – Date of Accession, 20 July 1981 c
One of the prominent documents guiding state policy on Mongolian women is The
National Program for Advancement of Women’s Situation.
Myanmar YES – Legislative, policy and institutional reform exist that are in conformance with the
Convention on the Elimination of All Forms of Discrimination against Women (CEDAW)
RATIFIED CEDAW – Date of Accession, 22 July 1997 a/b.
Nauru UNKNOWN – It is unknown whether legislative, policy and institutional reform exist that
are in conformance with the Convention on the Elimination of All Forms of
Discrimination against Women (CEDAW).
Niue UNKNOWN – It is unknown whether legislative, policy and institutional reform exist that
are in conformance with the Convention on the Elimination of All Forms of
Discrimination against Women (CEDAW).
Palau UNKNOWN – It is unknown whether legislative, policy and institutional reform exist that
are in conformance with the Convention on the Elimination of All Forms of
Discrimination against Women (CEDAW).
Papua New Guinea YES – Legislative, policy and institutional reform exist that are in conformance with the
Convention on the Elimination of All Forms of Discrimination against Women (CEDAW)
RATIFIED CEDAW – Date of Accession, 12 January 1995 a
Philippines YES – Legislative, policy and institutional reform exist that are in conformance with the
Convention on the Elimination of All Forms of Discrimination against Women (CEDAW)
RATIFIED CEDAW – Date of Accession, 5 August 1981
Samoa YES – Legislative, policy and institutional reform exist that are in conformance with the
Convention on the Elimination of All Forms of Discrimination against Women (CEDAW)
RATIFIED CEDAW – Date of Accession, 25 Sept 1992 a

Gender Equality in EducationProgress Note
130
Annex IIIGender Policy Indicators
Solomon Islands YES – Legislative, policy and institutional reform exist that are in conformance with the
Convention on the Elimination of All Forms of Discrimination against Women (CEDAW)
RATIFIED CEDAW – Date of Accession, 6 May 2002
Thailand YES – Legislative, policy and institutional reform exist that are in conformance with the
Convention on the Elimination of All Forms of Discrimination against Women (CEDAW)
RATIFIED CEDAW – Date of Accession, 9 August 1985 a/b/c
There is a provision on gender equality endorsed in the constitution and there are
several measures the Government uses to encourage stakeholders to ensure gender
equality in education.
Timor-Leste YES – Legislative, policy and institutional reform exist that are in conformance with the
Convention on the Elimination of All Forms of Discrimination against Women (CEDAW)
RATIFIED CEDAW – Date of Accession, 16 April 2003 a
Tokelau UNKNOWN – It is unknown whether legislative, policy and institutional reform exist that
are in conformance with the Convention on the Elimination of All Forms of
Discrimination against Women (CEDAW).
Tonga CONFLICTING• Not a party to CEDAW Convention (according to CEDAW website)
• Tonga acceded to the CEDAW (according to EFA Country Report)
Tuvalu YES – Legislative, policy and institutional reform exist that are in conformance with the
Convention on the Elimination of All Forms of Discrimination against Women (CEDAW)
RATIFIED CEDAW – Date of Accession, 6 October 1999 a
Vanuatu YES – Legislative, policy and institutional reform exist that are in conformance with the
Convention on the Elimination of All Forms of Discrimination against Women (CEDAW)
RATIFIED CEDAW – Date of Accession, 8 September 1995 a
The Optional Protocol has not been ratified.
Viet Nam YES – Legislative, policy and institutional reform exist that are in conformance with the
Convention on the Elimination of All Forms of Discrimination against Women (CEDAW)
RATIFIED CEDAW – Date of Accession, 17 February 1982 b

Education for All Mid-Decade AssessmentEast Asia and Pacific
131
Annex IIIGender Policy Indicators
Indicator 5.1.2Percentage of the budget dedicated to gender programmingwithin relevant Ministries
Of the total education budget (and/or social welfare, and/or community development) what proportion is specifically allocated to gender programming? This should be ministry specific andnot for the government budget as a whole.
Means of Verification: Review of Ministry of Finance records, as well as budget breakdownswithin the specific finance departments of the ministries being reviewed.
Brunei Darussalam UNKNOWN – The percentage of budget dedicated to gender programming within
relevant Ministries is unknown.
Cambodia UNKNOWN – The Cambodia EFA MDA report mentions the importance of a separate
budget for gender programming, but it is unclear as to whether one exists. A special
budget was allocated for the construction of dormitories for female students from
remote areas.
China UNKNOWN – The percentage of budget dedicated to gender programming within
relevant Ministries is unknown.
Cook Islands UNKNOWN – The percentage of budget dedicated to gender programming within
relevant Ministries is unknown.
Fiji NO – There is no direct allocation from the budget for gender.
Indonesia UNKNOWN – The percentage of budget dedicated to gender programming within
relevant Ministries is unknown.
Kiribati UNKNOWN – The percentage of budget dedicated to gender programming within
relevant Ministries is unknown.
Korea DPR UNKNOWN – The percentage of budget dedicated to gender programming within
relevant Ministries is unknown.
Lao PDR UNKNOWN – The percentage of budget dedicated to gender programming within
relevant Ministries is unknown.

Gender Equality in EducationProgress Note
132
Annex IIIGender Policy Indicators
Malaysia UNKNOWN – The percentage of budget dedicated to gender programming within
relevant Ministries is unknown.
Marshall Islands UNKNOWN – The percentage of budget dedicated to gender programming within
relevant Ministries is unknown.
F.S. Micronesia UNKNOWN – The percentage of budget dedicated to gender programming within
relevant Ministries is unknown.
Mongolia UNKNOWN – Some progress was made in practicing gender sensitive budget planning
during the implementation of the first phase of the National Program for Gender Equity
(2003-05). There does not appear to be a percentage of the budget dedicated to gender
programming within relevant Ministries.
Myanmar UNKNOWN – There is a special fund under the Ministry of Education for EFA activities.
The percentage dedicated to gender programming is unknown.
Nauru UNKNOWN – The percentage of budget dedicated to gender programming within
relevant Ministries is unknown.
Niue UNKNOWN – The percentage of budget dedicated to gender programming within
relevant Ministries is unknown.
Palau UNKNOWN – The percentage of budget dedicated to gender programming within
relevant Ministries is unknown.
Papua New Guinea UNKNOWN – The percentage of budget dedicated to gender programming within
relevant Ministries is unknown.
Philippines UNKNOWN – The Philippines introduced the GAD Budget Policy in 1995 to fund the
implementation of the Plan for Gender Responsive Development (PPGD). The PPGD is a
strategic plan to translate the Women’s Convention and the Beijing Platform for Action
into policies, strategies, programs, and projects for Filipino women. All government
agencies are required to set aside a portion of their budget for GAD programs, projects,
and activities. As of October 2001, 130 agencies had submitted their GAD plans and a
budget totaling allocation of PhP 2.8 billion.
Samoa UNKNOWN – The percentage of budget dedicated to gender programming within
relevant Ministries is unknown.
Solomon Islands UNKNOWN – The percentage of budget dedicated to gender programming within
relevant Ministries is unknown.
Thailand UNKNOWN – The budget is classified by names of projects rather than activities. The
percentage dedicated to gender programming is unknown.
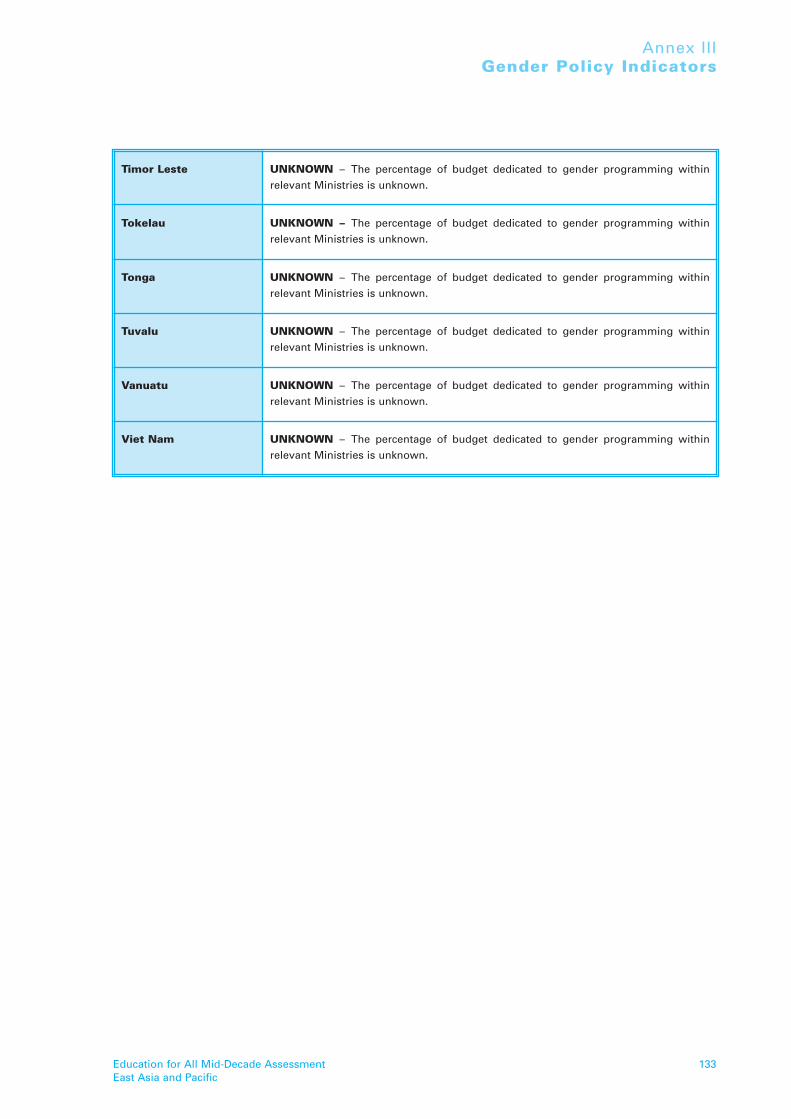
Education for All Mid-Decade AssessmentEast Asia and Pacific
133
Annex IIIGender Policy Indicators
Timor Leste UNKNOWN – The percentage of budget dedicated to gender programming within
relevant Ministries is unknown.
Tokelau UNKNOWN – The percentage of budget dedicated to gender programming within
relevant Ministries is unknown.
Tonga UNKNOWN – The percentage of budget dedicated to gender programming within
relevant Ministries is unknown.
Tuvalu UNKNOWN – The percentage of budget dedicated to gender programming within
relevant Ministries is unknown.
Vanuatu UNKNOWN – The percentage of budget dedicated to gender programming within
relevant Ministries is unknown.
Viet Nam UNKNOWN – The percentage of budget dedicated to gender programming within
relevant Ministries is unknown.
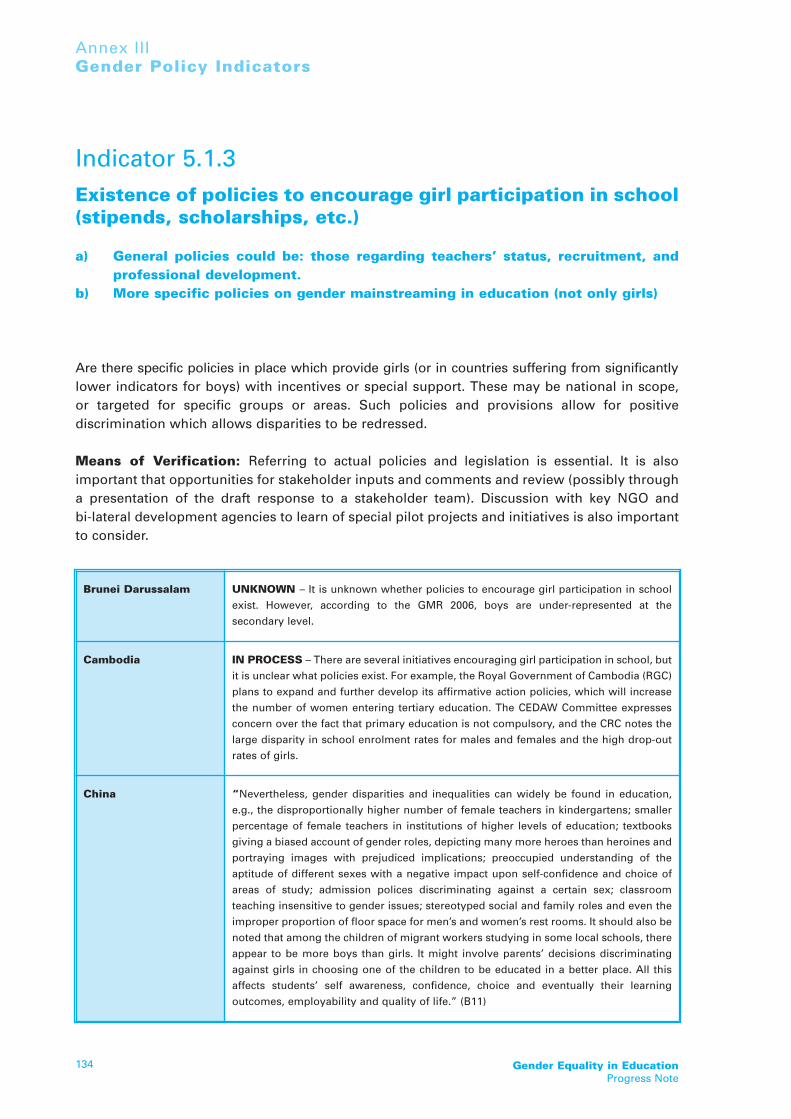
Gender Equality in EducationProgress Note
134
Annex IIIGender Policy Indicators
Indicator 5.1.3Existence of policies to encourage girl participation in school(stipends, scholarships, etc.)
a) General policies could be: those regarding teachers’ status, recruitment, and professional development.
b) More specific policies on gender mainstreaming in education (not only girls)
Are there specific policies in place which provide girls (or in countries suffering from significantlylower indicators for boys) with incentives or special support. These may be national in scope, or targeted for specific groups or areas. Such policies and provisions allow for positive discrimination which allows disparities to be redressed.
Means of Verification: Referring to actual policies and legislation is essential. It is also important that opportunities for stakeholder inputs and comments and review (possibly througha presentation of the draft response to a stakeholder team). Discussion with key NGO and bi-lateral development agencies to learn of special pilot projects and initiatives is also importantto consider.
Brunei Darussalam UNKNOWN – It is unknown whether policies to encourage girl participation in school
exist. However, according to the GMR 2006, boys are under-represented at the
secondary level.
Cambodia IN PROCESS – There are several initiatives encouraging girl participation in school, but
it is unclear what policies exist. For example, the Royal Government of Cambodia (RGC)
plans to expand and further develop its affirmative action policies, which will increase
the number of women entering tertiary education. The CEDAW Committee expresses
concern over the fact that primary education is not compulsory, and the CRC notes the
large disparity in school enrolment rates for males and females and the high drop-out
rates of girls.
China “Nevertheless, gender disparities and inequalities can widely be found in education,
e.g., the disproportionally higher number of female teachers in kindergartens; smaller
percentage of female teachers in institutions of higher levels of education; textbooks
giving a biased account of gender roles, depicting many more heroes than heroines and
portraying images with prejudiced implications; preoccupied understanding of the
aptitude of different sexes with a negative impact upon self-confidence and choice of
areas of study; admission polices discriminating against a certain sex; classroom
teaching insensitive to gender issues; stereotyped social and family roles and even the
improper proportion of floor space for men’s and women’s rest rooms. It should also be
noted that among the children of migrant workers studying in some local schools, there
appear to be more boys than girls. It might involve parents’ decisions discriminating
against girls in choosing one of the children to be educated in a better place. All this
affects students’ self awareness, confidence, choice and eventually their learning
outcomes, employability and quality of life.” (B11)

Education for All Mid-Decade AssessmentEast Asia and Pacific
135
Annex IIIGender Policy Indicators
Cook Islands UNKNOWN – It is unknown whether policies to encourage girl participation in school
exist. The Cook Islands, Education Act 1986-87 provides equal opportunities for all to
access education facilities and services, and states that the failure to enroll a child in
school is an offence.
Fiji IN PROCESS – The reports indicated that Fiji has identified several measures to
encourage girl participation in school. It is unclear as to what action has been taken.
The problem of a gender specific curriculum in Fiji was one of the concerns identified in
the Synthesis of Pacific EFA MDA Action Plans.
Indonesia YES – In Indonesia, females are under-represented in some cases, and in other cases
males are under-represented. According to the Indonesia CEDAW report the
Government has been promoting the “gender mainstreaming strategy” in order to
achieve gender equality in education.
Kiribati UNKNOWN – It is unknown whether policies to encourage girl participation in school
exist.
Korea DPR YES – According to the Korea DPR CEDAW Report, girls are ensured the same right and
opportunity as boys with respect to admission into school. Students are educated with
the same curriculum irrespective of their sec, but senior secondary school girls take
subjects such as, female hygienic. However, the CEDAW Committee expresses concern
that significantly fewer girls than boys attend higher education. The CEDAW Committee
recommends that the State party promote the enrolment of girls and address persistent
gender stereotypes.
Lao PDR YES – According to the Lao PDR CEDAW Report girls are ensured equal rights to boys
with respect to education and given access to the same curricula, examinations, and
teaching staff. However, the CRC expresses concern over the extremely low literacy rate
among ethnic minority women, and recommends that free and compulsory primary
education at the national level be implemented as soon as possible.
Malaysia UNKNOWN – It is unknown whether policies to encourage girl participation in school
exist. However, according to the GMR 2006, boys are under-represented at the
secondary level. The Ministry of Education has provided guidelines to eliminate gender
stereotypes in textbooks, but the CRC expresses concern about the persistence of
patriarchal attitudes and deep-rooted stereotypes regarding the roles and
responsibilities of women and men in the family and society.
Marshall Islands UNKNOWN – “Although it has been indicated earlier that promotion is automatic
regardless of performance, it appears from the data that there is a certain degree of
repetition.
For year 1996-7 repetition occurs throughout from Grades 1 to 5, with the highest in
Grade 1 and the lowest in Grade 5. Gender-wise, the figure for males is consistently
higher than females for all grades. The percentage of repetition is
less for both genders in the higher grades.”

Gender Equality in EducationProgress Note
136
Annex IIIGender Policy Indicators
F.S. MicronesiaMongolia
ES – In the teachers’ qualification training there are 16 hours on education gender
relations. Additionally, there are trainings on gender for general education school
teachers and deans. However, according to the GMR 2006, boys are under-represented
at the secondary level. Further, the CEDAW Committee is concerned about gender and
regional disparities in access to education and attendance in school in the rural areas.
Myanmar IN PROCESS – There are several education promotion programmes that have been
launched to carry out reform in curriculum, teacher education, and quality improvement
of education (intended to benefit both genders equally). Myanmar is making an effort to
address the gender imbalance in the teaching cadre through special efforts to recruit
male teachers (especially at the primary level). However, the CEDAW Committee
expresses concern for the low quality of education impacting more girls than boys.
Nauru UNKNOWN – It is unknown whether policies to encourage girl participation in school
exist.
Niue UNKNOWN – It is unknown whether policies to encourage girl participation in school
exist.
Palau UNKNOWN – It is unknown whether policies to encourage girl participation in school
exist.
Papua New Guinea UNKNOWN – It is unknown whether policies to encourage girl participation in school
exist.
Philippines UNKNOWN - It is unknown whether policies to encourage girl participation in school
exist. However, according to the GMR 2006, boys are under-represented at the
secondary level. Women tend to stay in school longer and a greater number pursue
higher education. Also, based on the number of beneficiaries of CHED scholarships,
women are being given more opportunities for a free education. The CRC recomends
that the State party take measures to bring about changes in traditional patriarchal
attitudes and in gender-role stereotyping.
Samoa UNKNOWN – There does not appear to have been a gender review of the education
sector plan. The problem of a Gender specific curriculum in Samoa was one of the
concerns identified in the Synthesis of Pacific EFA MDA Action Plans.
Solomon Islands “Problem: Cultural limitation of excessive female freedom” (B9)
“Solomon Islands proposes a series of weekly radio programmes highlighting the
importance of girls’ attendance at school.” (B9)
Thailand UNKNOWN – According to Thailand’s EFA MDA, there are student loan funds and
scholarships targeted at both male and females from low-income families, a bicycle
borrowing project, and NGOs such as the Sikkha Asia Foundation supporting libraries
and scholarships for disadvantaged children. It is unclear as to how many of these
projects support girl participation in schools and the CRC expresses concern at the
persistence of strong stereotypical attitudes about the roles and responsibilities of
women and men in the family and in society.
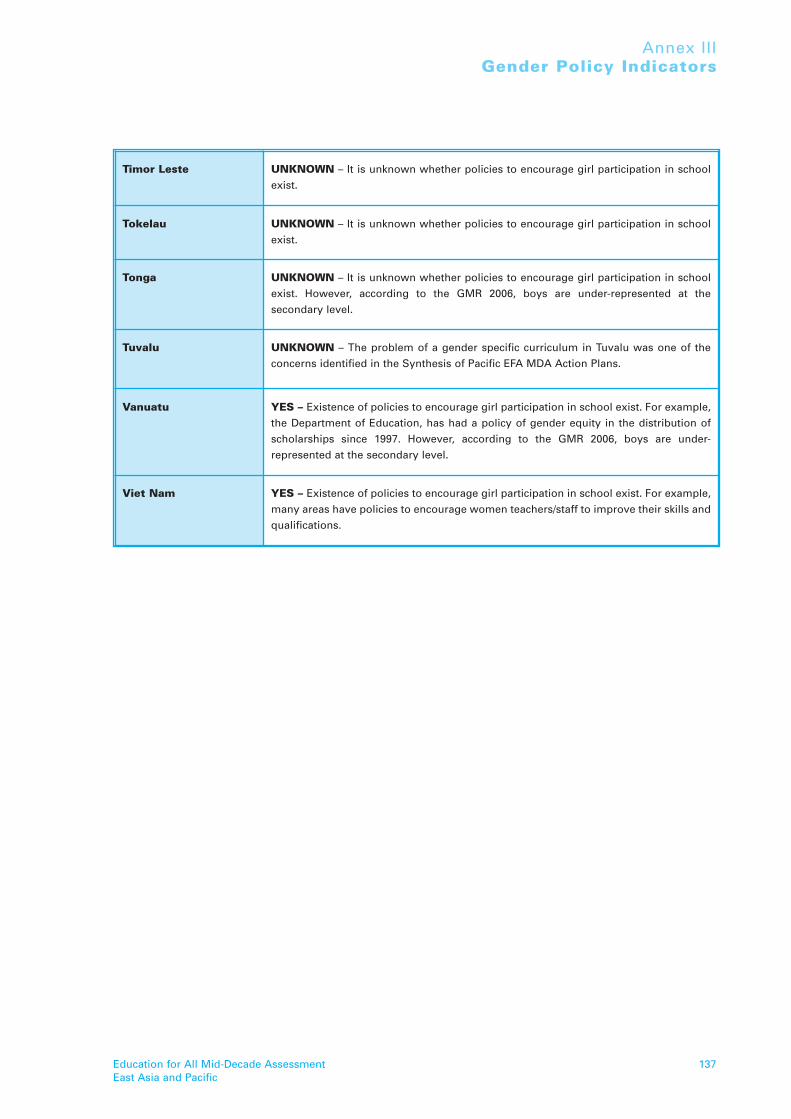
Education for All Mid-Decade AssessmentEast Asia and Pacific
137
Annex IIIGender Policy Indicators
Timor Leste UNKNOWN – It is unknown whether policies to encourage girl participation in school
exist.
Tokelau UNKNOWN – It is unknown whether policies to encourage girl participation in school
exist.
Tonga UNKNOWN – It is unknown whether policies to encourage girl participation in school
exist. However, according to the GMR 2006, boys are under-represented at the
secondary level.
Tuvalu UNKNOWN – The problem of a gender specific curriculum in Tuvalu was one of the
concerns identified in the Synthesis of Pacific EFA MDA Action Plans.
Vanuatu YES – Existence of policies to encourage girl participation in school exist. For example,
the Department of Education, has had a policy of gender equity in the distribution of
scholarships since 1997. However, according to the GMR 2006, boys are under-
represented at the secondary level.
Viet Nam YES – Existence of policies to encourage girl participation in school exist. For example,
many areas have policies to encourage women teachers/staff to improve their skills and
qualifications.

Gender Equality in EducationProgress Note
138
Annex IIIGender Policy Indicators
Indicator 5.1.4Gender review of education sector plan including review ofcurriculum, textbooks, education facilities, etc.
For countries with education sector plans, has there been a gender review? If there has, what hasthe review highlighted, both the positive aspects and those areas in need of improvement. Forthose countries that have not conducted a recent gender review of the sector plans, have thereat least been recent gender reviews of curriculum, textbooks, procedures, policies and humanresources? What were the key findings?
Means of Verification: Documentation and reports from the gender review process and recommendations
Brunei Darussalam UNKNOWN – It is unknown whether there has been a gender review of the education
sector plan.
Cambodia IN PROCESS – The Royal Government of Cambodia will review the curriculum and
course books to eliminate negative images of women, and stereotypes of both men and
women.
China UNKNOWN – It is unknown whether there has been a gender review of the education
sector plan. However, the CEDAW Committee has called upon the State party to
evaluate gender sensitivity of curriculum and textbooks.
Cook Islands YES – The Ministry of Education updated school curricula and educational resources to
ensure no gender stereotyping.
Fiji UNKNOWN – It is unknown whether there has been a gender review of the education
sector plan.
Indonesia UNKNOWN – It is unknown whether there has been a gender review of the education
sector plan. According to Indonesia’s EFA MDA Report several initiatives are in progress,
including establishing a gender sensitive program evaluation process. The Indonesia
CEDAW Report notes that gender inequalities remain in educational activities such as in
the teaching and learning process, in the textbooks, and teaching aids.
Kiribati UNKNOWN – It is unknown whether there has been a gender review of the education
sector plan.
Korea DPR UNKNOWN – It is unknown whether there has been a gender review of the education
sector plan. However, the Korea DPR CEDAW report states that her is no gender based
discrimination in textbooks, curricula, teaching methods, or scholarships.

Education for All Mid-Decade AssessmentEast Asia and Pacific
139
Annex IIIGender Policy Indicators
Lao PDR IN PROCESS – The Ministry of Education is aware of the gender-biases in the textbooks
and will include pictures with more balances views relate to gender roles when they are
renewed. Further, to ensure gender mainstreaming in primary education, Lao PDR has
produced gender mainstreamed supplementary materials (LABEB) and a new primary
curriculum and textbooks (EDPII).
Malaysia UNKNOWN – It is unknown whether there has been a gender review of the education
sector plan.
Marshall Islands UNKNOWN – It is unknown whether there has been a gender review of the education
sector plan.
F.S. Micronesia UNKNOWN – It is unknown whether there has been a gender review of the education
sector plan.
Mongolia UNKNOWN – It is unknown whether there has been a gender review of the education
sector plan.
Myanmar UNKNOWN – It is unknown whether there has been a gender review of the education
sector plan. There was a gender review of Life Skills materials, but whether there has
been a review of the entire education sector plan is unclear.
Nauru UNKNOWN – It is unknown whether there has been a gender review of the education
sector plan.
Niue UNKNOWN – It is unknown whether there has been a gender review of the education
sector plan.
Palau UNKNOWN – It is unknown whether there has been a gender review of the education
sector plan.
Papua New Guinea UNKNOWN – It is unknown whether there has been a gender review of the education
sector plan.
Philippines YES - The National Commission on the Role of Filipino Women (NCRFW) is a
policy-making advisory body responsible for integrating gender-fair education into the
basic education curriculum. The Gender and Development (GAD) Program of the
Deparmtent of Education reviewed the textbooks and curriculum after the passage of
the Republic Act 7192 in 1991. Perhaps there has been another review since that time.
Samoa YES – There are gender sensitization workshops for staff, careful monitoring so there is
no gender stereotyping in teachers guides and learning materials.
Solomon Islands UNKNOWN – It is unknown whether there has been a gender review of the education
sector plan.

Gender Equality in EducationProgress Note
140
Annex IIIGender Policy Indicators
Thailand UNKNOWN – The issue of gender parity is not an emphasis for Thailand and there is
little disaggregated data by gender. There are some training programs designed to
increase awareness on gender parity for secondary school students, but it is unclear if
there has been a gender review of the education sector plan.
Timor Leste UNKNOWN – It is unknown whether there has been a gender review of the education
sector plan.
Tokelau UNKNOWN – It is unknown whether there has been a gender review of the education
sector plan.
Tonga UNKNOWN – It is unknown whether there has been a gender review of the education
sector plan.
Tuvalu UNKNOWN – It is unknown whether there has been a gender review of the education
sector plan.
Vanuatu UNKNOWN – It is unknown whether there has been a gender review of the education
sector plan. However, the Vanuatu EFA-NAP Report recommends establishing
counseling/career development at all levels of educational institutions and gender
review in future curriculum development.
Viet Nam IN PROCESS – Some of the gender-bias in textbooks has already been reviewed and
changed. The Ministry of Education and Training is working to further eliminate gender
prejudice in education and training through textbook development.


unite for children