united nations conference on trade and development … · production most noticeably are...
TRANSCRIPT

11 April 2005
English Only
UNITED NATIONS CONFERENCE ON TRADE AND DEVELOPMENT
EFFECTS OF THE ‘EVERYTHING BUT ARMS’ INITIATIVE ON THE SUGAR INDUSTRIES OF THE LEAST DEVELOPED COUNTRIES
Report by the UNCTAD Secretariat
ABSTRACT This paper analyses the impact of the ‘Everything But Arms’ (EBA) initiative on the sugar industries of fourteen Least Developed Countries (LDCs) since it came into effect in 2001. It attempts to: (1) evaluate the extent to which LDCs benefit from the scheme; (2) explain why some countries have benefited or may benefit more than others; and (3) make policy suggestions concerning the characteristics of competitive LDC sugar industries. Static gains are analysed and it is found that the EBA provides support to fledgling export industries and can account for a large and stable share of total export earnings. In analysing dynamic gains, it is found that some LDCs are increasing sugar production significantly. It is hypothesized that increases in production are driven not by re-investment of financial gains from the EBA scheme to date, but by returns anticipated once duty and quota free access to the European Union (EU) is granted in 2009. Three cases are observed in which investment is provided by sugar producing firms based in non-EBA sugar exporting developing countries. The paper concludes by sketching a number of measures relevant to producers, policy-makers and investors in promising LDC sugar industries. UNCTAD/DITC/COM/2004/6

Disclaimer: The designations employed and the presentation of the material in this document do not imply the expression of any opinion whatsoever on the part of the secretariat of UNCTAD concerning the legal status of any country, territory, city or area, or of this authorities or concerning the definition of its frontiers or boundaries.
Leonela Santana Boado of the UNCTAD secretariat drafted this report. The author thanks Mike Hollis, Jesus Fernandez and Marijn Holwerda (UNCTAD) for their useful comments, suggestions and contributions. UNCTAD has a long history of work on trade preferences. Since the submission of the European Union initiative, it has published two major studies covering the issue: ‘Duty and Quota Free Market Access for LDCs: An Analysis of Quad Initiatives’, UNCTAD/DITC/TAB/Misc.7, prepared jointly by UNCTAD and Commonwealth Secretariats in 2001, and ‘The EU’s Everything But Arms Initiative and the Least-developed Countries’, prepared for a UNU-WIDER Meeting on the impact of WTO on Low-income Countries, Helsinki, 4-5 October 2002.
2
CONTENTS Chapter Paragraph Overview 1-7 1: THE ‘EVERYTHING BUT ARMS’ (EBA) INITIATIVE
A. The present EU Sugar Regime 8-25 B. Proposed reforms to the EU Sugar Regime 26-52
2: EFFECTS OF THE EBA INITIATIVE
A. Sugar production and exports in 14 selected LDCs 53-61 B. Effects of the EBA on the LDCs 62-86 C. Effects of the EBA on non-EBA ACP countries 87-88
3: CASE STUDIES OF SELECTED LDCs
A. Natural resource endowments 89-107 B. Transport infrastructure 108-110 C. Competitive private investors 111-126
4: CHARACTERISTICS OF SUCCESSFUL PRODUCTION, POLICIES AND INVESTMENTS
A. Factors contributing to successful production 127-133 B. Factors contributing to successful policy interventions 134-144 C. Factors contributing to successful private investment 145-152
Annexes 1 Sudan 153-161 2 Ethiopia 162-171 3 Malawi 172-180 4 Zambia 181-192 5 Bangladesh 193-206 6 Tanzania 207-218 7 Mozambique 219-233 8 Uganda 234-249 9 Nepal 250-259 10 Myanmar 260-265 11 Senegal 266-269 12 DR Congo 270-273 13 Burkina Faso 274-277 14 Madagascar 278-283
3

OVERVIEW
1. In March 2001, the European Commission adopted the ‘Everything But Arms’ (EBA) initiative to grant Least Developed Countries (LDCs) preferential access to the EU market. LDC sugar imports form part of the European Union (EU) sugar regime, which itself operates in the context of the Common Agricultural Policy (CAP). The workings of the regime are detailed in Chapter 1, Section A. The high, guaranteed price paid by the sugar regime is crucial to the success of the initiative since many LDCs are not at present highly competitive sugar exporters. The true value of preferential access over the longer term therefore lies in its ability to stimulate investment leading to increased efficiency, productivity and international competitiveness.1 By extending duty- and quota-free access to all goods except arms and ammunition, the EBA is consistent with the Millennium Development Goals (MDGs). While some LDCs are already significant exporters of sugar, as a group they are net importers. From 2009 each country will be able to export its entire local production to the EU (receiving above-world-market prices) and meet local sugar consumption needs through imports from the lower-priced world market.2 Reforms announced in July 2004 (and due to start in mid-2006, although delays are likely) are, however, likely to cut EU price levels by up to one-third and so disrupt this arrangement. 2. Section B discusses challenges to the EU sugar regime and some proposals for its reform. It argues that the value of the EBA is likely to be eroded, although at the time of writing it is not possible to say by what degree. Some likely implications for African, Caribbean and Pacific (ACP) and LDC exporters are outlined.
3. Chapter 2 contains the main findings of the paper. It focuses on the 14 LDCs that at present produce the greatest volumes of sugar, although only nine of the 14 were able to benefit from the EBA scheme in 2003/2004. The survey begins by analysing static gains and finds that the amount of foreign exchange earned by LDC sugar producers under the EBA initiative is small compared to net Official Development Assistance (ODA) at the national level. A different picture emerges when the amount of sugar exported under the EBA scheme is compared to total exports and exports under other preferential import initiatives. These comparisons allow identification of two distinct groups: those four countries for which the EBA quota accounts for a significant proportion of total exports (by volume) and those five for which it does not. The first group is composed of Ethiopia, Tanzania, Nepal and Burkina Faso; the second Sudan, Malawi, Zambia, Bangladesh, and Mozambique. It is argued that both groups benefit considerably from the high price paid to EBA sugar imports. The initiative therefore supports what is sometimes a fledgling export industry with little alternative preferential access in the first group and accounts for a large and stable share of total export earnings in the second. 4. In analysing dynamic gains, it is found that some countries are increasing sugar production volumes significantly. The paper hypothesizes that increases in production are driven not by re-investment of financial gains from the EBA scheme to date, but by returns anticipated once duty and quota access to the EU is granted in 2009. The countries increasing production most noticeably are Bangladesh, Mozambique and Tanzania. Tanzania and Mozambique have experienced significant investment by expanding Mauritian sugar companies, whereas Bangladesh is experiencing investment from a Thai sugar conglomerate.
1 The legal limitations of the EBA initiative must, however, be noted: as a unilateral, preferential measure it lacks the security that might be obtained were it placed in the context of concessions negotiated at the World Trade Organisation (WTO). 2 Association Des Organisations Professionnelles du Commerce des Sucres pour les Pays de l’Union Européenne (ASSUC), EBA – An Impact Assessment For The Sugar Sector, 25 January, 2001, http://www.sugartraders.co.uk/eba_impact_study.pdf.
4

It is suggested that the investing companies, all based in non-EBA sugar exporting countries, are investing in these LDCs with a view to taking advantage of EBA quota-free access in 2009. 5. The survey notes that different LDCs have adopted different routes to attracting FDI and stimulating domestic investment. These can be characterized broadly as privatization-liberalization and privatization-protectionism. While many LDCs have embarked on liberalising their economies, others have taken measures to protect local markets and any reduction of import barriers can be expected only after international competitiveness and profitability have increased. Thus, for example, Tanzania created in 2001 a Sugar Board to regulate and restrict imports. In 2000, Mozambique resisted International Monetary Fund (IMF) pressure to reduce import protection for its domestic industry. Finally, the Bangladeshi government increased in 2004 the price paid to domestic sugar producers in an attempt to stimulate production. While other LDCs have taken measures to protect their markets and not obtained FDI or productivity-enhancing local investment, the EBA initiative seems to have led to an ‘infant industry’ approach that has revived the sugar industry in the above-mentioned countries. Given the limited number of cases this study makes no attempt to judge whether openness or protection is the best way to further the development of LDC sugar industries. The finding to which attention is drawn is simply that the arrival of foreign companies is correlated with increases in the productivity, competitiveness and export orientation of certain LDC sugar industries.
6. Case studies of fourteen LDCs are provided in Chapter 3 to outline two factors affecting sugar industry export competitiveness: natural resource endowments and transport infrastructure. Section A gives data concerning production costs and Section B highlights the poor state of transportation infrastructure in many LDCs as one of the most serious constraints on the competitiveness of sugar exports. Some major sugar producing and exporting companies are discussed in Section C. Further details of the evolution of the sugar sector in the countries studied are given in the Annexes.
7. The paper concludes in Chapter 4 by sketching a number of measures relevant to policy makers, managers and investors in promising LDC sugar industries. Section A outlines some characteristics of efficient sugar production, including: large area under cultivation; access to irrigation; high daily processing capacity; and factory flexibility. Section B makes some recommendations concerning policy interventions likely to aid the development of the sector such as: careful privatisation; subsidies and tax incentives; and infrastructure development. Section C analyses factors contributing to successful private investment, including: financial strength, vertical integration and diversification.
5

Chapter 1
THE ‘EVERYTHING BUT ARMS’ (EBA) INITIATIVE A. The present EU Sugar Trade Regime 8. In March 2001, the European Commission adopted the EBA initiative to grant LDCs preferential access to the EU market. With regard to sugar imports, the EBA initiative operates as part of the EU sugar regime and gradually introduces duty-free access to LDC raw sugar at guaranteed prices, which have at times been three times higher than those of the world market. 9. The EU sugar regime was introduced in 1968 and as part of the EU Common Agricultural Policy (CAP) it covers the production, processing and marketing of beet and cane sugar within the now 25 member States. The purpose of the regime is to protect EU sugar producers by insulating the EU market from the world market. The main elements of the regime are:
• Minimum support prices for sugar produced within the EU; • Quotas for EU beet sugar production assigned to each member State; • Export refunds or subsidies; • Preferential zero-tariff fixed quotas for raw sugar from those ACP countries
who are signatories to the Sugar Protocol of the Cotonou Agreement (successor to the Lomé Convention), supplemented by Special Preferential Sugar (SPS) arrangements;
• Incrementally increasing zero-tariff quotas for sugar from the least developed countries as part of the ‘Everything But Arms’ agreement, which is to be fully liberalized in July 2009.
10. EU sugar producers and the main ACP sugar exporters have, however, expressed concern about the EBA initiative. Both believe that LDC exports may damage their own production and/or exports. In order to understand these concerns, it is important to analyse the EBA in the context of the mechanisms regulating the EU sugar regime.
11. The EU sugar regime supports the EU sugar industry by first guaranteeing farmers high prices for selling their sugar beet to processors and then guaranteeing sugar processors a high price for selling their refined sugar. Minimum support or ‘target’ prices are established by the Common Market Organization (CMO) and fixed by the Council of Ministers on the basis of the production cost for a standard quality of sugar in the most efficient growing region. This target price is implemented by setting a minimum import price (threshold price) at a higher level and an intervention price for white and raw sugar at a lower level.
12. Under the Uruguay Round Agreement on Agriculture (URAA), the EU was obliged to replace the ad valorem import duties by fixed standard tariffs with a gradual reduction of standard tariffs by a total of 20 per cent in six years.3 However, the EU was not required to reduce its internal price support specifically for sugar under the URAA because domestic support is measured as the Aggregate Measurement of Support (AMS), aggregated across all commodities and policy instruments. Subsequently, the total reduction of 20 per cent over a period of six years for domestic support commitments refer to the total levels of support, but not to individual commodities. Overall, the sector wide domestic support for sugar has been high compared to the other agricultural commodities in the EU due to the high intervention price for sugar.
3 A 20 per cent reduction from a base rate of €524/t to the current €419/t in six annual steps.
6

13. Production quotas are allocated in an attempt to prevent high guaranteed prices leading to surplus supply. Quotas for sugar A, which comprises 82 per cent of production and is intended solely for domestic consumption, and sugar B, which comprises 18 per cent of production and is intended for export (but incurs a levy to cover the difference between domestic and world market prices), are allocated to sugar processors on a country-by-country basis. Processors then licence beet farmers who receive the guaranteed price only for sugar produced under quota. 14. Every year, most of Europe’s excess sugar is disposed of in international markets (the rest is held as stocks). Production quotas and the requirement to export surpluses have ordered the relationship between supply and demand so that domestic prices for sugar have invariably remained higher than the support price, removing the need for producers to rely on institutional support. Much of the cost of the domestic system is therefore borne by EU consumers (who pay around three times more than the world market price).
15. When exported outside the EU, sugar produced under quota is granted a refund (or subsidy) roughly equal to the difference between the international and domestic (EU market) prices.4 Exporting surplus sugar with the support of export refunds appears to be a more attractive option for sugar producers than selling quota sugar to an intervention agency at the intervention price. Export refunds rather than the domestic support price have therefore constituted the main direct budgetary support for sugar producers. The cost of the regime amounted to almost €1.5 billion in 2002, making Europe’s farmers and processors the world’s biggest recipients of sugar subsidies. EU export totals have until recently included preferential raw sugar imports processed in the EU, which amounted to 1.9 million tones in 2003/2004. The EU typically exports at prices around one-third to one-half of the guaranteed internal price. 16. Non-quota sugar is produced because many farmers grow excess sugar beet. Member States are free to produce above quota levels but to avoid the negative impact that this out of quota sugar (called C sugar) might have on domestic prices, it must be entirely exported outside the EU market and, further, does not receive any support in term of export refunds. The high price for quota sugar constitutes, however, an implicit cross-subsidy and so non-quota sugar can often be exported profitably.
17. In the context of the WTO Agreement on Agriculture (AoA) and recognising the likely negative impact that subsidized exports might have in depressing international prices for sugar (outside the EU market), the EU has made commitments to reduce the total quantity of sugar that can be exported with the support of exports refunds and the total amount of export refunds involved when exporting refined sugar onto international markets.
18. Besides regulating the prices and quantities of sugar being produced within the Union, another pillar of the EU sugar regime to sustain internally high prices for sugar is a strict policy on imports. In 2004, tariffs reached €419/t. In addition, given the depressed international market prices for sugar during recent years, since 1995 the EU has made regular use of the Special Safeguard measure under Article 5 of the AoA, which allows the imposition of extra duty on sugar imports each time the c.i.f. price falls below a trigger price set at €531/t. The exact amount of such a duty is dependent upon the difference between the two prices.
19. The combination of these two duties renders importation of sugar possible only through preferential tariffs and quotas, with negligible importation of non-preferential sugar 4 Export refunds are equal to the intervention price plus the storage level, plus free-on-board (FOB) minus the world sugar price.
7

occurring. The EU preferential trade regime on sugar consists of its Sugar Protocol with ACP countries and India (under which 1,294,700 tonnes of cane sugar from 19 ACP states are imported annually levy free). This fixed total is supplemented by Special Preferential Sugar (SPS) arrangements to cover the Maximum Supply Needs (MSN) of those member States with raw cane sugar refining industries. Since the accession of Finland in 1997, the EU also has a commitment to import around 79,000 tonnes from Cuba and Brazil under Most Favoured Nation (MFN) arrangements. Such raw sugar is subject to a reduced customs duty of €98 per tonne and its price is freely negotiated without the support of a minimum guaranteed price.
20. The Sugar Protocol was extended under the Cotonou Agreement of 2000, the successor to the Lomé IV Convention. Under the Sugar Protocol, the EU undertakes, for an indefinite period of time, to purchase and import on a duty-free basis and at a guaranteed price (similar to that paid to quota sugar) specific quantities of cane sugar (raw or white equivalent) originating from 19 ACP countries. Under the EC-India Agreement, similar treatment is provided to 10,000 tonnes of sugar from India per year.
21. The Special Preferential Sugar (SPS) quotas were created with a view to ensuring adequate supplies of raw sugar to a total of seven refineries in Portugal, the UK, Finland and France, where their forecast MSN cannot be met by alternative supplies of raw sugar.5 The SPS quotas are, however, to be absorbed by the EBA initiative. This means that rising imports of EBA sugar will be mirrored by reductions in SPS sugar from ACP countries.6
22. Under the terms of the EBA initiative, sugar (like bananas and rice) is considered a sensitive product and so at present each EBA beneficiary is assigned a quota for duty-free raw sugar imports. Full liberalization of the raw cane sugar market for LDC exporters will be phased in between 1 July 2006 and 1 July 2009 by gradually reducing the import tariff to zero and eliminating quantitative restrictions. In the meantime, LDC raw sugar can be exported duty free within the limits of a tariff quota, which will grow from 74,185 tonnes (white-sugar equivalent) in 2001/2002 to 197,355 tonnes in 2008/2009 (July to June marketing year).
Table 1.1: Tariffs and quotas for EBA sugar
July/June
year Tariffs on
non-quota sugar Quotas in tonnes
white sugar equivalent (w.s.e) 2001/2002 full duty 74,185 2002/2003 full duty 85,313 2003/2004 full duty 98,110 2004/2005 full duty 112,827 2005/2006 full duty 129,751 2006/2007 20% duty reduction 149,213 2007/2008 50% duty reduction 171,595 2008/2009 80% duty reduction 197,335
5 MSN are met by community sugar; preferential sugar (ACP and EBA); MFN sugar; and that available from the French Overseas Departments (FOD). Where this total does not equal the MSN, additional duty-free (or highly reduced) tariff quotas are created: the SPS, for which EU refineries are obliged to pay a minimum purchase equal to the guaranteed price. The SPS quotas have remained fairly constant over time because: (1) the above sources produce to fixed quotas (with the exception of the FOD, for which output varies little) and (2) refinery capacity is fixed. 6 Four LDCs eligible to export sugar under the EBA initiative (Malawi, Tanzania, Uganda and Madagascar) already enjoy preferences under the ACP Sugar Protocol, although at present only Malawi and Tanzania possess EBA quotas.
8
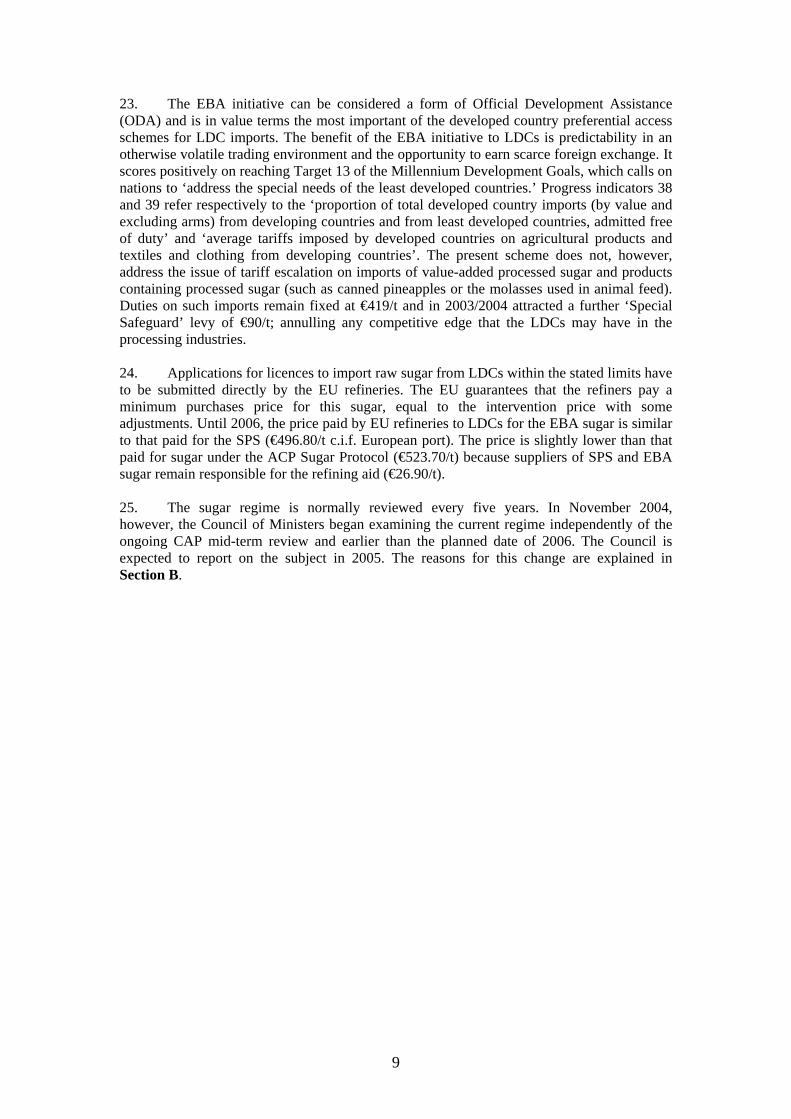
23. The EBA initiative can be considered a form of Official Development Assistance (ODA) and is in value terms the most important of the developed country preferential access schemes for LDC imports. The benefit of the EBA initiative to LDCs is predictability in an otherwise volatile trading environment and the opportunity to earn scarce foreign exchange. It scores positively on reaching Target 13 of the Millennium Development Goals, which calls on nations to ‘address the special needs of the least developed countries.’ Progress indicators 38 and 39 refer respectively to the ‘proportion of total developed country imports (by value and excluding arms) from developing countries and from least developed countries, admitted free of duty’ and ‘average tariffs imposed by developed countries on agricultural products and textiles and clothing from developing countries’. The present scheme does not, however, address the issue of tariff escalation on imports of value-added processed sugar and products containing processed sugar (such as canned pineapples or the molasses used in animal feed). Duties on such imports remain fixed at €419/t and in 2003/2004 attracted a further ‘Special Safeguard’ levy of €90/t; annulling any competitive edge that the LDCs may have in the processing industries.
24. Applications for licences to import raw sugar from LDCs within the stated limits have to be submitted directly by the EU refineries. The EU guarantees that the refiners pay a minimum purchases price for this sugar, equal to the intervention price with some adjustments. Until 2006, the price paid by EU refineries to LDCs for the EBA sugar is similar to that paid for the SPS (€496.80/t c.i.f. European port). The price is slightly lower than that paid for sugar under the ACP Sugar Protocol (€523.70/t) because suppliers of SPS and EBA sugar remain responsible for the refining aid (€26.90/t).
25. The sugar regime is normally reviewed every five years. In November 2004, however, the Council of Ministers began examining the current regime independently of the ongoing CAP mid-term review and earlier than the planned date of 2006. The Council is expected to report on the subject in 2005. The reasons for this change are explained in Section B.
9

B. Proposed reforms to the EU sugar regime 26. The EU sugar regime has remained largely unaltered since its inception in 1968. At present it fails to meet several of its own objectives and has come under increasing pressure for reform from both inside and outside the EU. Various proposals for change are examined in this section, which focuses primarily on those made by the European Commission in July 2004. Discussion of the Commission proposal began in earnest in late November and the Council is expected to draw up a review in early 2005. 27. The quota and price support system encourages systematic over-production in the EU. This has several negative consequences, as outlined below.
• Costs are increased. In 2002, export refunds from the EU budget amounted to €1.493bn.7 Consumers pay around €8bn more annually than they would in the absence of price support, or €64 for every family in the EU.8
• Surplus production places a strain on the environment, as sugar beet production requires three times more water than wheat.
• The system has failed to safeguard EU jobs. Over the last decade the sector has shed around 17,000 industry-related jobs. While there were 240 sugar mills in the EU in 1990, just 135 were left in 2001.9
• The most contentious issue arising from surplus production is that of C sugar, which from 1996/1997 to 2000/2001 constituted 23 per cent of UK production.10 All such sugar must be exported, which in 1999/2000 entailed the sale of some 3.4 million tonnes, compared to less than 1.5 million tonnes of surplus A and B sugar. Surplus production and C sugar exports are often blamed for precluding increases in preferential ACP and EBA imports; contributing to the depression of world prices; and diminishing South-South trade.
28. Domestic and international pressure for reform of the Sugar Regime has been increasing steadily and the apparent lack of progress precipitated the launch of a legal challenge by Brazil, Thailand and Australia. In September 2004, a Dispute Settlement panel of the WTO upheld their contention that subsidies for A and B sugar indirectly subsidize the production and export of C sugar. The panel also declared that in subsidizing the processing and consequent re-export of ACP and EBA preferential imports the EU is in violation of Uruguay Round commitments to reduce subsidized exports to no more than one million tonnes per annum. At present, the EU does not include refined exports of preferential ACP and EBA sugar imports in the totals for exports in receipt of subsidies, although export refunds are in fact paid to around 1.6 million tonnes of such sugar.11 It has been suggested that these two rulings could together lead to the removal of up to three million tonnes of subsidized EU sugar exports from the world market.12
7 Executive Brief: The Basic Sugar Regime, CTA, January 2004, http://agritrade.cta.int/sugar/executive_brief.htm. 8 ‘Dumping on the world: How EU sugar policies hurt poor countries’, Oxfam Briefing Paper, No. 61, Oxford: Oxfam GB, March, 2004, http://www.oxfam.org/eng/pdfs/bp61_sugar_dumping.pdf, p.12. 9 Press Release, ‘Sugar: Commission proposes more market-, consumer- and trade-friendly regime’, IP/04/915, Brussels, 14 July 2004, http://www.europa.eu.int/rapid/pressReleasesAction.do?reference=IP/04/915&format=HTML&aged=0&language=EN&guiLanguage=en . 10 ‘Submission to the DEFRA Consultation on Sugar Reform’, Action Aid, Cafod and Oxfam UK, January 2004, http://www.cafod.org.uk/var/storage/original/application/php0s6Mes.pdf, p.5. 11 European Union: Sugar Regime Under Pressure, Oxford Analytica, 12th August, 2004, http://www.oxan.com/db/item.asp?StoryDate=20040812&ProductCode=OADB&StoryNumber=1 . 12 http://web.worldbank.org/WBSITE/EXTERNAL/NEWS/0,,date:09-09-2004~menuPK:278083~pagePK:34392~piPK:34427~theSitePK:4607,00.html#Story4.
10

29. In light of mounting pressures various proposals for reform have been put forward. These can be broken down into the four main options listed below.13 In what follows emphasis is placed on how the reforms might affect the LDCs.
1. Market liberalization. 2. Maintaining the status quo. 3. Reduction in quotas. 4. Reduction in price.
30. The first option of market liberalization and effective dismantling of the Sugar Regime finds little support from LDCs and EU producers as it would mean an almost complete displacement of production and exports by more competitive countries such as Brazil, Thailand and Australia. The cost of compensating EU growers would also be prohibitive. 31. The second option of maintaining the status quo is likely to receive little support in Europe as it would entail large cuts in production. This is principally the result of the WTO ruling, which requires the EU to achieve equilibrium between preferential imports, production and consumption and thereby reduce subsidized exports. A large increase in imports is anticipated from 1 July 2009, when quotas are lifted on EBA sugar, because of the high prevailing guaranteed prices in the EU. In order to accommodate these imports without exceeding consumption levels and permitted export limits, EU production would have to be cut significantly. The only way around this problem would be to ignore the WTO ruling or re-impose quotas on the EBA countries. 32. The third option of reducing quotas is that favoured by the LDC countries themselves.14 They propose to defer the complete liberalisation of the tariff and quota system until 2019, on the condition that their 2004/2005 quotas are increased from 112,827 tonnes to 466,033 tonnes (reaching a maximum of 1,425,606 tonnes in 2012/2013) and that the high prices paid to producers are preserved close to current levels. Measures would be taken to respect rules of origin and so combat abuse of the quotas and there should be no impact on imports from the ACP countries. In capping EBA country imports, EU production would continue, although domestic quotas would need to be cut to around 13 million tonnes per annum. 33. The fourth option of a fall in the guaranteed price paid to producers received the most attention in the Commission Staff Paper. This would consist of a phased process, which would lead to a new market balance and result in the redundancy and eventual abolition of the quota system in the EU by 2013. The proportion by which the price would have to fall to make the EU sugar regime WTO-consistent depends on a variety of factors, although a 40 per cent reduction has been suggested. The price reduction process would involve several stages and for the period in which the quota system still operated quotas would have to be cut so as to discourage production of surplus C sugar. The Commission suggested imposing obligations to restrict the production of C sugar. The guaranteed price for preferential sugar, applicable only to sugar covered by the ACP Protocol and the Agreement with India, would also be cut (as would the refining aid) in the same proportions as the margins for sugar beet growers. This would mean a fall to around €290/t. The impact on ACP countries could therefore be expected to be significant, as would the cost of a compensation package to the EU budget. No reference is made to the EBA countries, although the effects of a price cut could be expected to be similar. Imports after restructuring is complete would total around 2.5 million tonnes with exports predicted to fall close to zero.
13 ‘Reforming the European Union’s sugar policy: Summary of impact assessment work’, Commission Staff Working Paper, September 2003. 14 Press Release, LDC Brussels Sugar Group, 3 March 2004.
11

34. The European Commission published a second paper on 14 July 2004 entitled ‘Accomplishing a sustainable agricultural model for Europe through the reformed CAP – sugar sector reform’.15 The paper develops further the idea of a fall in price option for reform of the EU sugar regime. 35. EU sugar production, refining and exporting would continue but the package is intended to reduce distortions in both the EU and world markets. The latest proposal focuses on reductions in price support and quotas and so has two main parts: 36. Price cuts: Abolition of the ‘intervention price’ of €632 paid to factories for every tonne of sugar produced. Taking 2003/4 as the base year, it will be superseded by a ‘reference price’ of €421/t, achieved in two steps over three years (a total cut of 33 per cent). In parallel, European sugar beet farmers will see their payments cut from €43.6/t to €27.4/t in 2007/8 (a total of 37 per cent). 37. Quota cuts: Reduction in the EU production quota by 2.8 million tonnes (from 17.4 million tonnes to 14.6 million tonnes) over four years, beginning in 2005. This is intended to bring production into line with consumption and so remove the need for export subsidies. 38. In 2003/2004 Europe consumed 16.3 million tonnes and produced 17.3 million tonnes of ‘A’ and ‘B’ quota sugar. Imports, almost all of which occur through preferential quotas, totalled almost 1.9 million tonnes in 2003/2004. This creates a ‘structural surplus’ of nearly 2.9 million tonnes, which has to be disposed of on world markets in order to maintain high prices within the EU. The Commission claims that cuts in quota production will lead to reductions in the amount of subsidised exports by around two million tonnes and, as the EU market reaches equilibrium, the eventual elimination of exports. This should cause world market prices to rise, with one model predicting an increase of 20-23 per cent.16 39. The July 2004 proposal makes few direct references to C sugar. The 2003 Commission Staff Paper suggestion to oblige producers to restrict production does not reappear in the latest Communication. EU success in tackling this problem depends ultimately on the manner in which reform proceeds. It is a question of; (1) discouraging growers from exceeding their quotas (this is where restrictions might be imposed); and (2) whether the reduced payments to factories will cover the fixed and variable costs of producing in-quota sugar and still allow them to produce C sugar at a marginal cost lower than the world price (plus freight and insurance costs); that is, profitably.17 It is not possible at this stage to predict whether the proposed reference price of €421/t and the quota of 14.6 million tonnes that would come into effect in 2008/2009 would allow C sugar to be produced profitably, since much depends on the efficiency of and quota allocated to each individual factory. 40. In addition, the Commission proposes to compensate EU producers for the loss of income entailed by the scheme. To this end, they will be offered direct support amounting to 60 per cent of projected losses. This will cost the EU budget approximately €1.340bn per annum.
15 'Accomplishing a sustainable agricultural model for Europe through the reformed CAP – sugar sector reform', Communication from the Commission to the Council and the European Parliament, Brussels, 14.7.2004 COM (2004) 499 final, http://europa.eu.int/comm/agriculture/capreform/sugarprop_en.pdf. 16 ‘Dumping on the world: How EU sugar policies hurt poor countries’, Oxfam Briefing Paper, No. 61, Oxford: Oxfam GB, March, 2004, http://www.oxfam.org/eng/pdfs/bp61_sugar_dumping.pdf, p.28, citing (footnote 54) B. Borrell and L. Hubbard (2000). 17 Executive Brief: The Basic Sugar Regime, CTA, January 2004, http://agritrade.cta.int/sugar/executive_brief.htm
12
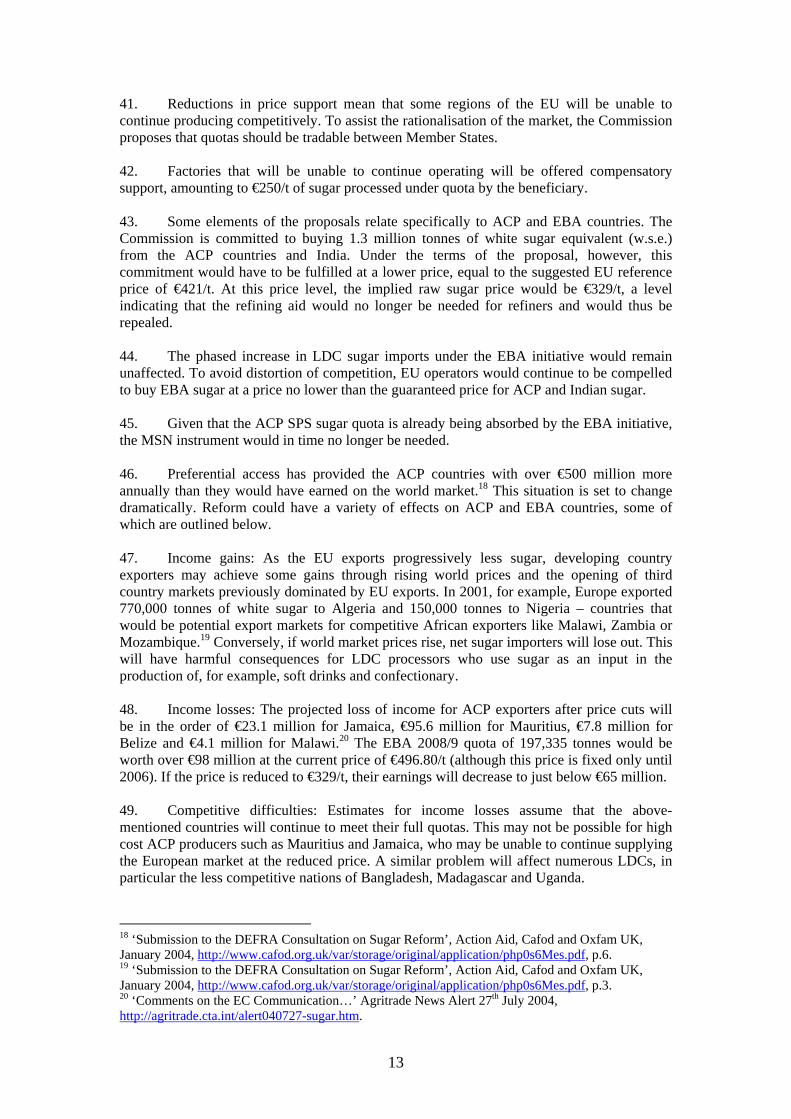
41. Reductions in price support mean that some regions of the EU will be unable to continue producing competitively. To assist the rationalisation of the market, the Commission proposes that quotas should be tradable between Member States. 42. Factories that will be unable to continue operating will be offered compensatory support, amounting to €250/t of sugar processed under quota by the beneficiary. 43. Some elements of the proposals relate specifically to ACP and EBA countries. The Commission is committed to buying 1.3 million tonnes of white sugar equivalent (w.s.e.) from the ACP countries and India. Under the terms of the proposal, however, this commitment would have to be fulfilled at a lower price, equal to the suggested EU reference price of €421/t. At this price level, the implied raw sugar price would be €329/t, a level indicating that the refining aid would no longer be needed for refiners and would thus be repealed. 44. The phased increase in LDC sugar imports under the EBA initiative would remain unaffected. To avoid distortion of competition, EU operators would continue to be compelled to buy EBA sugar at a price no lower than the guaranteed price for ACP and Indian sugar. 45. Given that the ACP SPS sugar quota is already being absorbed by the EBA initiative, the MSN instrument would in time no longer be needed. 46. Preferential access has provided the ACP countries with over €500 million more annually than they would have earned on the world market.18 This situation is set to change dramatically. Reform could have a variety of effects on ACP and EBA countries, some of which are outlined below. 47. Income gains: As the EU exports progressively less sugar, developing country exporters may achieve some gains through rising world prices and the opening of third country markets previously dominated by EU exports. In 2001, for example, Europe exported 770,000 tonnes of white sugar to Algeria and 150,000 tonnes to Nigeria – countries that would be potential export markets for competitive African exporters like Malawi, Zambia or Mozambique.19 Conversely, if world market prices rise, net sugar importers will lose out. This will have harmful consequences for LDC processors who use sugar as an input in the production of, for example, soft drinks and confectionary. 48. Income losses: The projected loss of income for ACP exporters after price cuts will be in the order of €23.1 million for Jamaica, €95.6 million for Mauritius, €7.8 million for Belize and €4.1 million for Malawi.20 The EBA 2008/9 quota of 197,335 tonnes would be worth over €98 million at the current price of €496.80/t (although this price is fixed only until 2006). If the price is reduced to €329/t, their earnings will decrease to just below €65 million. 49. Competitive difficulties: Estimates for income losses assume that the above-mentioned countries will continue to meet their full quotas. This may not be possible for high cost ACP producers such as Mauritius and Jamaica, who may be unable to continue supplying the European market at the reduced price. A similar problem will affect numerous LDCs, in particular the less competitive nations of Bangladesh, Madagascar and Uganda.
18 ‘Submission to the DEFRA Consultation on Sugar Reform’, Action Aid, Cafod and Oxfam UK, January 2004, http://www.cafod.org.uk/var/storage/original/application/php0s6Mes.pdf, p.6. 19 ‘Submission to the DEFRA Consultation on Sugar Reform’, Action Aid, Cafod and Oxfam UK, January 2004, http://www.cafod.org.uk/var/storage/original/application/php0s6Mes.pdf, p.3. 20 ‘Comments on the EC Communication…’ Agritrade News Alert 27th July 2004, http://agritrade.cta.int/alert040727-sugar.htm.
13

50. Low or stagnant export growth to the EU: The abolition of the MSN and SPS schemes and the fixing of the ACP Sugar Protocol quotas at 1.3 million tonnes per annum mean that additional imports will come primarily from the EBA countries. Despite large production quota cuts from 17.4 million tonnes to 14.6 million tonnes, total imports are forecast to increase by only 0.6 million tonnes, from 1.8 to 2.4 million tonnes.21 51. Adjustment assistance: The Commission recognizes that these measures will impose difficulties on the ACP countries, and so proposes entering into dialogue concerning adjustment assistance, including the establishment of programmes that focus on improving the competitiveness of the sugar sector where economically viable, and on supporting diversification where improvements in competitiveness in the sugar sector are not sustainable. The proposed reforms do not mention the issue of tariff escalation on imports of ACP and LDC processed sugar and so fall short of addressing this point. 52. On a final note, the Seventh Session of the ACP-EU Joint Parliamentary mission took place in Addis-Ababa (Ethiopia) from 16 to 19 February 2004. Adopted was a ‘Resolution on cotton and other commodities: problems encountered by ACP States’. Referring to trade in commodities, the resolution regretted 'that most developing countries have not benefited from added value either through processing basic commodities or from diversification to high-value cash crops'; and 'called on the Commission to promote the development of agro-industry in these countries and to encourage economic diversification and product processing of cotton, sugar and other commodities'.22
21 ‘Comments on the EC Communication…’, Agritrade News Alert 27 July 2004, http://agritrade.cta.int/alert040727-sugar.htm. 22 http://www.europarl.eu.int/intcoop/acp/60_07/pdf/resolution04_en.pdf
14
Chapter 2
EFFECTS OF THE EBA INITIATIVE A. Sugar production and exports in 14 selected LDCs 53. In 2004, world sugar production totalled 140 millions tonnes and world exports 45 million tonnes. The seven bigger producers: Brazil, India, the EU, China, USA, Thailand and Australia, together produced 92 million tonnes, around 65 per cent of world production. The four biggest exporters: Brazil, Thailand, the EU and Australia exported nearly 30 million tonnes, around 65 per cent of world exports. LDC sugar production is currently around 3 million tonnes and exports to the world market total around half a million tonnes. The 50 LDCs thus do not influence the world sugar market in any significant way.23
54. Of the 50 LDCs, 35 are net sugar importers with either a small or non-existent sugar sector. In 2001, the EBA Sugar Working group and the LDC Commercial Group on EBA Sugar selected 25 countries for future EBA sugar deliveries.24 This paper discusses only countries with a minimum annual production of 20,000 tonnes between 2000 and 2002 and so refers to 14 nations that have the potential to increase considerably their annual sugar production and hence exports to EU. Those countries are Bangladesh, Burkina Faso, Democratic Republic of Congo, Ethiopia, Madagascar, Malawi, Mozambique, Myanmar, Nepal, Senegal, Sudan, Tanzania, Uganda, and Zambia. It should be noted, however, that for the July-June marketing year 2003/2004, five of the fourteen countries have no quota allotted to them: Democratic Republic of Congo, Madagascar, Myanmar, Senegal and Uganda.
55. In 2002, Sudanese sugar production totalled 743,554 tonnes, more than 2.5 times more than its closest rival Ethiopia, which produced 286,898 tonnes. With regard to exports, however, Sudan sold only 22.4 per cent of the national produce (166,802 tonnes); around half the proportion achieved by Zambia (43.8 per cent; 102,033 of 232,755 tonnes). Between 2000 and 2002, Mozambican sugar production has multiplied by nearly four times while the increase in Sudanese production was only 10 per cent. These figures demonstrate that the fourteen countries selected for this study can show wide differences in production, production growth rates and absolute and relative volumes and values of exports. As such, the impact of the EBA Agreement should be expected to vary from country to country. 56. The following paragraphs present data on production and exports (in tabular and graphical form) and the evolution of the EBA quota, in aggregate and by country.
23 There are 50 LDCs on the United Nations list; 41 are ACP countries. The ACP LDCs are: Angola, Benin, Burkina Faso, Burundi, Cape Verde, Central African Republic, Chad, Comoros, Democratic Republic of Congo, Djibouti, Timor Leste, Equatorial Guinea, Ethiopia, Eritrea, Gambia, Guinea, Guinea-Bissau, Haiti, Kiribati, Liberia, Lesotho, Madagascar, Malawi, Mali, Mauritania, Mozambique, Niger, Rwanda, Samoa, Sao Tomé and Principe, Senegal, Sierra Leone, Solomon Islands, Somalia, Sudan, Zambia, Tanzania, Togo, Tuvalu, Uganda and Vanuatu. The nine non-ACP LDCs are: Afghanistan, Bangladesh, Bhutan, Cambodia, Laos, Maldives, Myanmar, Nepal and Yemen. 24 International Sugar Organization, ‘EBA: Implications for the World Sugar Market’, November 2002.
15

Table 1.2: Production and exports by country of origin (tonnes, w.s.e) (ranked by 2002 total production volumes)
Total production Total exports
2000 2001 2002 2000 2001 2002
ProductionForecast by
2009
1 Sudan 679,850 718,831 743,554 57,801 159,653 166,802 1,700,000
2 Ethiopia 250,869 305,000 286,898 64,652 50,000 87,137 275,000
3 Malawi 208,804 205,000 260,617 64,890 71,937 81,293 NA
4 Zambia 190,000 199,278 232,755 47,191 132,125 102,033 NA
5 Bangladesh 110,000 109,130 228,928 - - - NA
6 Tanzania 130,000 115,000 186,538 17,375 14,105 22,643 440,000
7 Mozambique 45,000 e 60,000 e 170,000 e 26,065 37,045 55,332 300,000
8 Uganda 130,000 140,000 160,000 - - - NA
9 Nepal 110,000 e 65,000 e 110,000 e - - - NA
10 Myanmar 75,000 125,000 e 100,000 e 2,922 33,213 11,822 NA
11 Senegal 90,000 e 95,000 e 95,000 e - - - NA
12 DR Congo 75,000 60,000 65,000 - - - NA
13 Burkina Faso 30,000 e 35,000 e 40,000 e 160 5 7,538 NA
14 Madagascar 70,000 50,000 32,253 24,765 21,981 1,481 NA
Source: International Sugar Organization (ISO), Statistical Bulletin, October 2003.
Table 1.3: Total production 2000-2002 (tonnes, w.s.e)
0
100'000
200'000
300'000
400'000
500'000
600'000
700'000
800'000
Sudan
Ethiop
ia
Malawi
Zambia
Bangla
desh
Tanza
nia
Mozam
bique
Ugand
aNep
al
Myanm
ar
Seneg
al
DR Con
go
Burkina
Faso
Madag
asca
r
2000
2001
2002
16

Table 1.4: Total exports 2000-2002 (tonnes w.s.e)
0
20'000
40'000
60'000
80'000
100'000
120'000
140'000
160'000
180'000
Sudan
Ethiop
ia
Malawi
Zambia
Bangla
desh
Tanza
nia
Mozam
bique
Ugand
aNep
al
Myanm
ar
Seneg
al
DR Con
go
Burkina
Faso
Madag
asca
r
2000
2001
2002
Source: International Sugar Organization (ISO), Statistical Bulletin, October 2003.
57. Implementation of duty and quota free access to the European market for LDC raw cane sugar will occur between 2001 and 2009. The duty-free quota increases by 15 per cent each year with tariff reduction on non-quota sugar beginning in 2006. The quota allows only for the importation of raw sugar for refining in the EU. 58. Those LDC countries wishing to participate in the EBA initiative are required to register their intention to supply sugar to the EU with the EBA Sugar Working group. In both 2001/2002 and 2002/2003 the quota was fully filled. 59. Every year the total EBA sugar quota is distributed between the registered countries according to the following formula:
- One-third of the total is distributed equally between all participants; - One-third is divided pro rata to the volume of sugar produced in the most recent
October/September crop cycle; and - One-third is divided in inverse ratio to GNP per capita.
60. The total quota is set to increase by 15 per cent per annum but the entry of new suppliers and the distribution formula means that the quota for each country increases at variable rates. Table 1.5 shows that Sudan has the highest quota and export volumes of the group selected. From 2001 to 2003, however, its quota increased by less than 5 per cent due to the entry of Nepal. In 2003/2004, its quota even decreased from the previous year. Of the fourteen countries studied only nine benefited in 2003/2004 from an EBA sugar quota.
17

Table 1.5: Deliveries of EBA sugar to the EU (tonnes, w.s.e)
LDC sugar producing country 2001/2002 2002/2003 2003/2004 actual actual scheduled Sudan 16,257 17,037 16,979 Ethiopia 14,298 14,689 15,249 Malawi 10,402 10,661 10,959 Zambia 8,758 9,017 9,538 Bangladesh No quota No quota 8,989 Tanzania 9,065 9,317 9,940 Mozambique 8,331 8,384 10,116 Nepal No quota 8,970 8,667 Burkina Faso 7,073 7,237 7,672 Total 74,185 85,313 98,110
Source: http://www.sugartraders.co.uk/ebastats.htm, Marketing years extend from July-June.
61. Having described the basic operation of the EBA initiative it is now possible to analyse its static and dynamic effects.
18

B. Effects of the EBA initiative on LDCs
62. Our analysis of the effects of the EBA sugar import initiative begins with the static financial gains to date, that is, the value of the EBA quota. To assist the evaluation of the extent to which the LDCs benefit from the scheme, gains from the EBA are compared to total ODA flows to each country.
Table 1.6: Comparison of EBA quota value and total ODA flows in selected LDCs
Country
EBA quota value in
million US$, 2002/3
Total ODA flows in
million US$, 2002
1 Sudan 8.1 351 2 Ethiopia 6.9 1,307 3 Malawi 5.0 377 4 Zambia 4.3 641 5 Bangladesh No quota 913 6 UR Tanzania 4.4 1,233 7 Mozambique 3.9 2,058 8 Uganda No quota 638 9 Nepal 4.3 365
10 Myanmar No quota 121 11 Senegal No quota 449 12 DR of Congo No quota 807 13 Burkina Faso 3.4 473 14 Madagascar No quota 373 Total 40.3 10,106
Source: Secretariat calculations, and for ODA flows, OECD, Aid Recipient Charts
http://www.oecd.org/countrylist/0,2578,en_2825_495602_25602317_1_1_1_1,00.html#b.
63. For all countries studied, the amount of foreign exchange earned through the EBA scheme is insignificant compared to net ODA. This suggests that if there are benefits to be found then it is at the sectoral level, in comparison with: (1) volumes exported to the world market; and (2) to other preferential access schemes. The following sections conflate the two comparisons for brevity and clarity. 64. Table 1.7 indicates the total amount of preferential quotas allocated to each country to allow comparison of the importance of the EBA relative to other preferential import schemes.
19

Table 1.7: Selected preferential LDC quotas for 2002-2003 (tonnes, w.s.e.)
EBA quota ACP quota SPS quota Tariff-rate quota, USA
1 Sudan 17,037 No quota No quota No quota 2 Ethiopia 14,689 No quota No quota No quota 3 Malawi 10,661 20,824 9,897 10,530 4 Zambia 9,017 No quota 12,862 No quota 5 Bangladesh No quota No quota No quota No quota 6 UR Tanzania 9,317 10,186 2,182 No quota 7 Mozambique 8,384 No quota No quota 13,690 8 Uganda No quota No quota No quota No quota 9 Nepal 8,970 No quota No quota No quota
10 Myanmar No quota No quota No quota No quota 11 Senegal No quota No quota No quota No quota 12 DR of Congo No quota 10,186 2,249 7,258 13 Burkina Faso 7,238 No quota No quota No quota 14 Madagascar No quota 10,760 No quota 7,258 Others No quota 1,242,744 190,107 1,078,459 Total 85,313 1,294,700 217,298 1,117,195
65. While there is considerable variation between export volumes, examination of the proportion of EBA and non-EBA exports to total exports of sugar over the last four years (Table 1.8 below) allows identification of two distinct groups.
Table 1.8: Selected preferential LDC quotas as a percentage of total exports
EBA quota as percentage of total
exports Non-EBA preferential quotas as percentage of total exports
01/2002 02/2003 03/2004 01/2003 02/2003 03/2004 Sudan 9 11 8 No quotas No quotas No quotas Ethiopia 18 45 26 No quotas No quotas No quotas Malawi 14 10 11 55 39 *39 Zambia 7 8 8 11 11 11 Bangladesh No quota No quota 14 No quotas No quotas No quotas Tanzania 43 43 44 57 57 *56 Mozambique 17 12 9 27 20 13 Nepal No quota 90 87 No quotas No quotas No quotas Burkina Faso 100 100 N/A No quotas No quotas No quotas *Scheduled Source: ISO, ‘Quarterly Market Outlook’, September 2002-September 2004. 66. The first group is composed of Ethiopia, Tanzania, Nepal and Burkina Faso. The proportion of sugar exported through the EBA initiative relative to total exports is large. In the Ethiopian case, the EBA quota represents more or less a third of total exports while the rest is not exported under any kind of preferential scheme. Just under half of Tanzanian exports are absorbed by the EBA arrangement while the other half goes to alternative preferential quota schemes. For Nepal and Burkina Faso, the EBA quota accounts for all or almost all of their exports and they have no other preferential import arrangements. The high guaranteed prices paid to these countries under the EBA initiative thus provide relatively stable support for the continuation of their sugar export industries, support which is all the
20

more important considering that only Tanzania has alternative preferential import scheme arrangements; the other three are almost completely dependent on the EBA for export sales.
67. The second group is composed of Sudan, Malawi, Zambia, Bangladesh, and Mozambique. The EBA quota forms a much smaller proportion of total exports than in the case of the first group. Sudan, Malawi and Zambia are among the most competitive sugar producers of all LDCs (see Chapter 3, Section A) and so the observation that their total exports vastly exceed their EBA quota is not unexpected. Malawi is, however, something of an anomaly in that while the EBA quota constitutes only 10 per cent of its total exports, it also benefits from the ACP and SPS preferential import schemes. In addition, Malawi receives a US tariff-rate quota and so around half its sugar exports are sold under some kind of preferential import scheme. Yet again, the high price paid to EBA sugar is significant to the sector as a whole: while the EBA quota represents only 10 per cent of Sudanese sugar exports by volume, if it is considered that such sugar receives around three times the world market price then it represents by value 25 per cent of Sudanese sugar exports.
68. Displaying the value of current EBA exports relative to total exports and total ODA does not, however, fully capture the economic effects of the EBA initiative. Perhaps more important are the dynamic effects of the programme, i.e. the extent to which it creates observable trends that can be projected into the future. One such dynamic is a sustained increase in sugar production since the announcement of the EBA initiative. It is quite possible that in some countries this process is driven not by re-investment of financial gains from the EBA initiative to date, but by the returns anticipated once duty and quota access to the EU is granted in 2009. 69. This possibility appears most clearly in examination of crop year statistics, which can differ considerably from marketing year statistics (Table 1.9). When this table is analysed in conjunction with other evidence a grouping emerges that may clarify the dynamic benefits of the EBA initiative.
Table 1.9: Selected LDC production and exports by crop year (October-September, thousand tonnes, w.s.e)
Production Exports 2000/01 2001/02 2002/03 2003/04 2000/01 2001/02 2002/03 2003/04 Sudan 773 750 714 780 53 180 150 205 Ethiopia 300 305 290 300 55 80 33 60 Malawi 205 255 260 255 70 75 105 105 Zambia 195 203 225 225 110 120 120 115 Bangladesh 105 195 190 120 0 0 10 65 Tanzania 115 170 195 220 15 20 20 25 Mozambique 55 125 200 260 30 50 70 110 Nepal 70 100 125 115 0 0 10 10 Burkina Faso 32 35 40 40 0 5 7 N/A
Source: ISO, ‘Quarterly Market Outlook’, September 2002-September 2004. 70. It can be seen from this data that three LDCs are linked by two factors: increase in production volumes and the arrival of foreign companies. Firstly, production has grown regularly in Tanzania and Mozambique over the last four years, almost doubling in the former and more than quadrupling in the latter. Production has also increased in Bangladesh, although the damaging floods of 2003 hampered expansion. These increases require explanation.
21

71. Secondly, Bangladesh, Tanzania and Mozambique have all experienced increased FDI in their sugar industries since the announcement of the EBA initiative in 2001. In Bangladesh, an abandoned state-owned processing plant has recently been re-opened after privatisation and joint investment by a Bangladeshi and a Thai sugar conglomerate.25 Tanzania and Mozambique, for their part, are two countries in which expanding Mauritian sugar companies have made significant investments (see Annexes 5, 6 and 7). 72. One explanation of why Mauritian sugar companies invest abroad is that costs of production are lower. This does not apply to Bangladesh, however, which is at present a higher cost producer than Thailand. A more parsimonious explanation for the correlation between increasing production volumes and the activities of foreign companies makes reference to one overriding economic incentive: in 2009 Bangladesh, Mozambique and Tanzania will enjoy duty and quota free access to European markets while Thailand and Mauritius will not. 73. The distinction between effects to date and anticipation of future gains makes it arguable that since its inception in 2001, the EBA initiative has contributed to the growth of the sugar industry in Malawi, Mozambique, Sudan, Tanzania and Zambia, where combined production grew by more than ten per cent in one year. If current investment projects become reality, Mozambique and Sudan alone could reach a combined production of two million tonnes by 2009. It can also be said that in some LDCs that are net importers (such as Bangladesh), the EBA appears to be stimulating investment, reviving sugar industries and leading to increased sugar production and exports at rates higher than internal consumption growth. This trend is likely to lead to more countries initiating exports to the EU.
74. This study has not uncovered any evidence of misallocation of resources to date, although without statements explaining why investors behave as they do, evaluating counterfactual situations (i.e. where investment would flow in the absence of the EBA scheme) is almost impossible. Nonetheless, the generous price differential offered by the EU appears not to be leading to the formation of high cost domestic production in regions that are not natural cane-growers.26 Mozambique, for example, has attracted FDI in its sugar industry and is among the lowest cost producers in the world.
75. Success in attracting FDI and encouraging domestic investment is limited to very few countries, however, and so cannot be simply a function of the EBA initiative and/or low production costs. One explanation of expanding investment activity appeals to the economic liberalisation process in which many LDCs are engaged. Indeed, partial liberalisation of the sugar market has in some cases forced domestic companies to undertake painful restructuring to stay competitive and this is both a cause and an effect of attracting investment. Looking at the positive effects of restructuring, local economies have benefited from a more dynamic sugar sector in terms of increased competition, better supply in the domestic market, improved technology, higher productivity, and superior know-how in the production process. Numbers of small suppliers have also increased, and some investors are assisting in the formation of independent mid-size landowners. More open and sophisticated market conditions and higher capital requirements are leading to a concentration of sugar production by a few large players with a significant market share. Such companies are diversified, vertically integrated, export-oriented, and belong to larger groups (or governments), which provide financial assurance.
25 New Age Business, http://www.newagebd.com/2004/aug/12/busi.html#2, 12th August 2004. 26 While Bangladesh is currently a high cost producer this is commonly attributed to inefficient sugar milling. There is little reason to believe that previously ineffective factory management and poor relations with suppliers cannot be overcome, causing ex-factory costs of production to fall dramatically. See EcoSecurities Ltd, Appendix A: Bangladesh Country Paper, http://www.cdmcapacity.dial.pipex.com/bangladesh/Bangladesh_country_paper.pdf, 2002.
22

76. Yet while many LDCs have embarked on liberalizing their economies, other producers have taken measures to protect their local sugar markets and encourage domestic production. This gives rise to an alternative explanation of how investment can be stimulated and made to work for the local economy, as illustrated by the following three examples. 77. The Tanzania Sugar Act of 2001 gives powers to the Tanzania Sugar Board to regulate sugar imports so as to protect local producers.27 In October 2003, the Kilombero sugar company (majority owned by the South African firm Illovo) requested that the Sugar Board place greater restrictions than the then-current 10 per cent duty on industrial sugar imports so that it could increase the price paid by domestic industrial users from $400 to $480 per tonne. The company argued that the move was necessary to finance investment in rehabilitating an old sugar mill and developing new cane land to feed it.28 78. In early 2000, two groups of investors, the Mauritian-owned sugar company Sena Holdings and the South African Tongaat Hulett group, threatened to withdraw from Mozambique unless the government resisted IMF pressure to reduce tariffs on sugar imports, arguing that their investments could take ten years to realize a profit at world market prices (it must be observed that while foreign investment predated29 the announcement of the EBA initiative, Mozambique has experienced increased investment since 2001).30 As a result, the IMF revised its policies in December 2000, ending a dispute that began in September 1999.31 79. Finally, raw sugar imports were banned in Bangladesh between 1997-2002.32 The measure failed to prevent smuggling of lower quality sugar from India, however, and the Import Policy Order 2003-2006 removed all restrictions.33 Nonetheless, in a bid to encourage local farmers to expand sugarcane cultivation, the government raised the cane procurement rate in the second semester of 2004 from Taka 41.5 to Taka 44 for the mill gate price and from Taka 41 to Taka 43 for the field price.34
80. As observed, these countries have all successfully drawn FDI to their sugar industries and, as has been noted, investors in Mozambique and Tanzania insisted that a protected domestic market was essential to the survival and expansion of the industry. Furthermore, any future reduction of import barriers can be expected only after international competitiveness 27 The East African, http://www.nationaudio.com/News/EastAfrican/26112001/Business/Business15.html, 19 November 2001. 28 The East African, http://www.nationaudio.com/News/EastAfrican/03112003/Regional/Regional39.html, 3 November, 2003; Business Times, http://www.bcstimes.com/cgi-bin/bt/viewnews.cgi?category=1&id=1066988192, 24 October, 2003; IPP Media, http://www.ippmedia.com/ipp/guardian/2004/07/05/15004.html, 5 July, 2004; Tanzania Development Gateway http://www.tanzaniagateway.org/output.asp?articleid=114&cat=News%20Highlight&catID=5, date not provided. 29 Mozambique News Agency, AIM Reports, http://www.poptel.org.uk/mozambique-news/newsletter/aim170.html#story9, 1 December 1999, http://www.poptel.org.uk/mozambique-news/newsletter/aim184.html#story4, 25 May 2000. 30 Tongaat-Hulett, http://www.huletts.co.za/Press-03-06-09.htm 31 Government of Mozambique, Memorandum of Economic and Financial Policies of the Government of Mozambique for 2000–01, http://www.imf.org/external/NP/LOI/2000/moz/02/INDEX.HTM, 1 December 2000; Africa Action, http://www.africaaction.org/docs01/cash0101.htm, January 30th, 2001. 32 US Trade Center, Dhaka, Country Commercial Guide FY 2003/4, http://www.usembassy-dhaka.org/state/USTC/CCG%202003-2004.pdf, July 2003 33 Australian High Commission, Dhaka, Bangladesh Commercial Guide 2004/2005, http://www.bangladesh.embassy.gov.au/Bangladesh_Commercial_Guide_2004-05.pdf, July 2004- 34 http://www.thedailystar.net/2004/09/02/d40902050357.htm.
23

and profitability has increased. There is very little to distinguish the investment regulations of Mozambique and Tanzania from similar LDCs and so it is arguable that a trade policy specific to the sugar sector was more important than an investment policy (as commonly defined) in attracting FDI. While other LDCs have taken measures to protect their markets and not obtained FDI or productivity-enhancing local investment, the EBA initiative does seem to have supported an infant industry approach to reviving the sugar industry in the above-mentioned countries (see Annexes 6 and 7). 81. It must be noted that the case of Bangladesh is somewhat different from that of Mozambique and Tanzania. While the Thai sugar conglomerate Ban Pong Group entered the country through a joint venture agreement, Bangladesh has experienced a sharp decline in foreign investment since 2001. This might be explained by poor implementation of several national investment policies.35 In the prevailing situation, the arrival of a Thai company is unlikely to be due to the existence (but effective non-implementation) of FDI incentive policies. It appears likely that in this country, the future evolution of the sugar sector will be shaped predominantly by the development of national business ventures through syndicated loans (see Annex 5). 82. In evaluating these explanations and the models on which they are based, problems related to both the privatization-liberalization and the privatization-protectionism routes to encouraging investment and stimulating production. In the course of any liberal privatisation process, FDI can displace local investment. Subsequent profits may be repatriated to the investing country with the result that local economies fail to capture entirely the benefits of increased competitiveness and exports. Competition between local and foreign investors and the final destination of net profits unfortunately lies outside the scope of this study and is a subject requiring further research. Yet regardless of whether foreign or local companies prevail in the privatisation process, concentrating ownership of production in the hands of private investors clearly has consequences for income distribution, the ability of government to provide rural employment and stimulate broad-based (agro) industrial development without crowding-out the private sector and, more generally, realise the wider objectives of the EBA regime.36 83. Turning next to the difficulties of privatisation and protectionism, the infant industry strategy (again regardless of whether the company is foreign or domestically owned) is rarely exploited to its best advantage. Import protection and lack of domestic competition are common to many LDC sugar industries yet improvements in international competitiveness are less so. Often governments simply shift support for inefficient public monopolies to still uncompetitive private ones. Unless actions are taken to drive the restructuring process forward, then as WTO negotiations and regional trade agreements increase the pressure to liberalise trade barriers and scale-back agricultural support such as marketing boards, LDC sugar production – whether financed by foreign or domestic investment – will come under threat. LDC sugar industries could find themselves unable to compete on domestic and international sugar markets and in a worst-case scenario, lose even the capability to deliver sugar to preferential markets. 84. Assessment of the effects of the EBA initiative would be incomplete without reference to two other potential problems: non-tariff barriers and trade distortion. As developed country tariff and quota barriers to trade in sugar decline, the use of product and process standards and technical regulations is likely to increase, as evidenced by many other agricultural products. Meeting quality control measures requires that producers make additional investments and so by increasing costs such regulations are effectively non-tariff
35 Industry Canada, Bangladesh Country Commercial Guide FY 2004: Invest Climate, http://strategis.ic.gc.ca/epic/internet/inimr-ri.nsf/en/gr117680e.html 36 This subject is given greater attention in Chapter 4, particularly paragraphs 134-136.
24
barriers to trade. Furthermore, health and safety standards are subject to change, which creates uncertainty about the conditions under which imports will be permitted. The tariff eliminations guaranteed through the EBA initiative thus address only some of the problems that LDCs have in exporting their products to the EU. Nevertheless, the limited supply capacities of LDCs, which initially promoted scepticism are giving way to a guarded optimism, supported by the emergence of potentially efficient companies capable of meeting quality controls and producing at competitive prices. 85. The high degree of regulation pertaining to the sugar market also appears to distort trade somewhat by encouraging under-invoicing and price discrimination. Some net exporters with protected markets and surplus stocks have sold more expensively in their domestic market than the foreign markets. Zambia has been criticised in the past by Kenya for exporting ex-factory at $280/t while selling to local buyers at $480/t. Overall, imports from less efficient producers and smuggling of agricultural commodities, particularly sugar, have experienced a dramatic increase in the last few years. This has distorted neighbouring markets and pushed some producers to bankruptcy. Reform of the wider rules-of-origin and the elimination of perverse incentives has therefore become a matter of some debate, since they tend to reduce the efficacy of the EBA initiative, but there is little reason to believe that the problem is insoluble. 86. For the LDCs that will be able to produce sugar at competitive prices by the year 2009 the questions on whether or not they will be able to transport their sugar to its final destination at a competitive cost remains. Given the limited number of cases and the high degree of heterogeneity between the different national sugar sectors, this study makes no attempt to judge whether openness or protection is the best way to further the development of LDC sugar industries. The modest findings noted here are the potential of FDI to galvanise sugar exports and the attractiveness of protected markets to foreign investors. Expanding on each of the factors outlined above is the task of Chapter 3. Section A surveys the natural conditions pertaining in each of the selected countries, Section B contains a brief discussion of LDC transport infrastructure and Section C profiles some export-competitive sugar producing companies. The extent to which the FDI-export relationship can be put to the service of the local economy and so make the EBA initiative consistent with the MDGs will be the subject of the policy recommendations put forward in Chapter 4.
25

C. Effects of the EBA initiative on non-EBA ACP countries 87. The main focus of this research is sugar-producing LDCs. It is nonetheless important to assess briefly some impacts of the EBA initiative on non-EBA countries. 88. The eventual transfer of the entire SPS quota to the EBA countries is a significant loss for the ACP countries as a whole. At a price of €496.8/t and a volume of 217,298 tonnes, the SPS quota was worth almost €108 million in 2002/3. Its loss will be a particular blow to Zimbabwe, for example, where the quota currently accounts for 48.4 per cent of total exports, and Swaziland, where it totals 30.7 per cent. To take a regional example, the impact of the EBA initiative on the Caribbean sugar industries remains at the centre of discussion. CARICOM countries have a 450,000 tonne quota of Protocol Sugar and an additional 75,000 tonnes of SPS. EBA threatens the survival of the sugar industries in many small economies dependent on sugar by undermining the benefits enjoyed by CARICOM producers in the European Union. While the EBA intends to help LDCs, it is likely to have the opposite effect on some ACP sugar-dependent countries. As a result a reorganisation of the Caribbean industry is likely to occur with inefficient producers exiting the business. One possible outcome is an expansion of the regional refining capacity, as the EU continues to import refined sugar. This alternative is already being evaluated by Trinidad & Tobago.
26

Chapter 3
CASE STUDIES OF SELECTED LDCs A. Natural resource endowments 89. Chapter 2 noted that low production costs, the existence of a reliable transport infrastructure and export-oriented production are critical in enabling countries to take advantage of the EBA initiative. The purpose of this Chapter is therefore to expand and attempt to explain the production and export trends observed earlier by more detailed reference to those three factors.
90. Among the most important factors determining export competitiveness of LDC sugar industries are natural resource endowments. With regard to the cultivation of sugar, endowments tend to vary widely among sugar producing LDCs. Some estimated data are given below for production costs in the relevant fourteen countries.
Table 2.1: Sugar production costs in selected LDCs
Estimation of costs, US$/t
source1 Source2 Source5 Source6
1 Sudan 2203 230 <350 2 Ethiopia 375 280 <350 3 Malawi 270 200 >350 300 4 Zambia 310 200 <350 310 5 Bangladesh 550 6 Tanzania 600 200 >350 7 Mozambique 175 2804 <350 8 Uganda 660 9 Nepal 10 Myanmar 11 Senegal >350 12 Burkina Faso >350 13 Congo >530 14 Madagascar 550 340 >530 1 Landell Mills Commodities Studies Ltd., ‘A world survey of sugar and HFCS field, factor and freight costs’, 1994 report. 2 Ulrich Sommer.’ Auswirkungen der Everything But Arms-Regelung (EBA) und der geplanten Wirtschaftspartnerschaftsabkommen (WPA) auf den Zuckermarkt der Europäischen Gemeinschaft‘, 2003 3 Kenana Sugar Company Report, September 2003, estimate 4 1994 value 5 agritrade, http://agritrade.cta.int/sugar/executive_brief.htm, January 2004 6 http://www.illovo.co.za/worldofsugar/internationalSugarStats.htm, September 2004
Sudan
91. Most of the sugar cane in Sudan is grown in large plantations owned by two agribusiness concerns – Kenana (in majority owned by Saudi and Kuwaiti interests) and the state-owned Sudanese Sugar Production Company. This allows producers to achieve maximum factory capacity utilisation, operate efficient irrigation systems and make optimal use of sugar by-products.
27

92. Sudan has abundant land (more than 140 million ha are available in the Blue and White Nile areas) and plenty of water for irrigation. As a result, the cost of production is low at around US $220/t. The country expects to produce sugar at $130 to $160/t in the near future. Its efficient port and its ability to produce high-quality sugar further support Sudan’s export competitiveness.
Ethiopia
93. Ethiopia produced sugar only for its own consumption until a few years ago, but the opening of a fourth sugar factory in 1999 allowed it to start exporting. The older sugar mills are being upgraded, and further expansion of production and processing capacity are planned. The government expects that the country will be able to export 100,000 tonnes of white sugar a year. The cost of the production of sugar in Ethiopia is relatively low due to the abundance of cheap labour, the highest cane yield productivity in the world, 120 t/ha, and very suitable climate and soil conditions.37
Malawi
94. In a study conducted by the Trade and Industrial Policy Secretariat (TIPS), Malawi was mentioned as one of the SADC economies having a comparative advantage in sugar production,38 and a recent independent international survey rated Malawi as one of the world's lowest cost producers.39 Rural agriculture in Malawi is traditionally rain fed and hence seasonal. An acute land shortage has led to over-use, soil degradation and small yields. However, large-scale estate commercial production of sugarcane under irrigation, by South Africa’s Illovo Sugar Ltd., is now well established in Chikwawa and Nkhotakota Districts; in addition, there is a growing number of small- and medium-sized sugar producers.
Zambia 95. Flat land, ideal soil and climatic conditions, combined with Nakambala's access to secure water supplies for irrigation from the Kafue River, favour the growing of sugar cane at comparatively low costs. The sugar cane industry in Zambia is, according to a report by the U.S. Agency for International Development, favoured by ideal climatic conditions.40 In addition, large plantations of sugarcane allow for economies of scale; Tate & Lyle, from the UK, controls most sugar production and processing, and exports to the EU and the world market. Some industry analysts rank Zambia as the third lowest cost producer in the world.41
Bangladesh
96. Bangladesh currently produces sugar mainly for the local market. There are some 150,000 sugar cane planters, and a number of factory plantations of 800-2,000 ha. Most sugar mills do not have their own cane plantation and depend on a large number of small farmers
37 Ulrich Sommer.’ Auswirkungen der Everything But Arms-Regelung (EBA) und der geplanten Wirtschaftspartnerschaftsabkommen (WPA) auf den Zuckermarkt der Europäischen Gemeinschaft‘, 2003. 38 Trade and Industrial Policy Secretariat, Revealed Comparative Advantage in SADC Economies (Johannesburg 2000). 39 Illovo Sugar, About Us, www.ilovosugar.com/about/groupprofile.htm. 40 U.S. Agency for International Development, Comparative Economic Advantage of Alternative Agricultural Production Activities in Zambia (1999). 41 International Union of Food, Agricultural, Hotel, Restaurant, Catering, Tobacco, and Allied Worker's Association (IUF), 'Tate & Lyle Sells Zambia Sugar to Illovo Sugar' (February 2001).
28

for their supply. As a result of fragmentation sugarcane yields are low at 20-21 tonnes per acre and production costs are high, about US $550/t. 97. Lower production capacity, poor recovery rate, low per acre yield causing inadequate sugarcane supply are the main reasons behind high local production costs, which reach around twice the international average. Other impediments to growth include frequent cyclones and floods, inadequate port facilities, insufficient power supplies, and slow implementation of economic reforms. Nonetheless, in 2004 national and foreign groups began investing massively in the sugar-refining sector.
Tanzania 98. According to Illovo (one of the world’s largest sugar producing firms from South Africa) Tanzania has excellent growing conditions, high yielding cane varieties and relatively low milling costs.42 The five sugar mills in the country currently produce far below full capacity but now that foreign ownership may have allowed significant additional investment in improved technology, the potential for a rapid increase in sugar production is strong.
Mozambique 99. The country has the capacity to produce at internationally competitive prices, as agriculture remains relatively low-cost through the abundant labour and the intensive utilisation of natural resources such as land and water.43 According to the Food and Agricultural Organisation (FAO) it is one of the world's low-cost producers.44 In a study conducted by SADC, Mozambique was mentioned as one of the SADC economies having a comparative advantage in sugar production.45 The High Commissioner of Mauritius in Mozambique stated recently that Mozambique has good conditions for producing sugar at competitive prices, which should enable Mozambique to produce sugar for a price of $180 per tonne, whereas Mauritius, despite its long experience in the area, produces sugar at $310 per tonne.46
100. In 2002, Mozambique exported 78,739 tonnes of sugar, earning the country a total of $18 million. Over half this figure - $9.9 million - came from the sugar sold to the European Union (9,140 tonnes) and the United States (13,248 tonnes).47 Since the announcement of the EBA scheme Mozambique saw an intensification of foreign investment in the sugar sector48), with companies from South Africa and Mauritius investing in four new sugar factories (in addition to two existing ones), which is set to increase production more than five-fold from 2001 to 2005.
Uganda
101. Uganda's soils were considered to be among the most fertile in the tropics. But nutrient depletion, erosion, and other signs of land degradation are increasing. “With two growing seasons a year, rates of depletion for crucial nutrients such as nitrogen, phosphorous, and potassium are among the highest in sub-Saharan Africa. Declining soil fertility is a
42 Illovo, International Sugar Statistics, http://www.illovo.co.za/worldofsugar/. 43 Allafrica.com, 'Sugar Industry Gets US$12m Boost' (September 2001), www.allafrica.com/stories/printable/200109130246.html. 44 South Africa's National Broadcaster, www.sabc.co.za/units/chanafr/news/001013.html. 45 Trade and Industrial Policy Secretariat, Revealed Comparative Advantage in SADC Economies (Johannesburg 2000). 46 ACIS, 'Sena company expands livestock production', www.acisofala.com/news_&_information.htm. 47 Mozambique News Agency, AIM Reports, No. 253, May 12th, 2003, http://www.poptel.org.uk/mozambique-news/newsletter/aim253.html#story5 48 Tongaat-Hulett, http://www.huletts.co.za/Press-03-06-09.htm
29

particularly serious and widespread problem, which severely limits crop yields, including for sugar”. 49 The sugar produced by the three mills in the country is for domestic consumption, and Uganda remains a net sugar importer. The high local prices, protected by import barriers, and a long distance from the nearest port make it unlikely that Uganda’s sugar sector will benefit from the EBA.
Nepal 102. Sugar is one of Nepal’s leading crops. Nepal's productivity of major crops measured by yield per hectare has not increased at the pace of its South Asian neighbours.50 From having the highest yield rate in 1961-63 it fell to the lowest in 1997-99. Seventy per cent of landholdings are smaller than 1 hectare and 40 per cent is smaller than 0.5 hectare. Capacity utilization of the sugar mills is less than 30%, and the country imports more than a third of its sugar consumption from India. The sugar industry, however, hopes to revive the sector and turn it into a large generator of export revenue.
Myanmar 103. Although Myanmar has large amounts of uncultivated land and extensive fresh water, it has not fulfilled its agricultural potential.51 In 1998/99 Myanmar had an average sugarcane yield of 47 Mt/ha.52 Its sugarcane production exceeds domestic demand, although the absence of the capacity to produce white sugar has for a long time constrained export potential. A white sugar factory has been built recently and the country may be able to expand its sugar exports, which now are largely to the regional market.
Senegal
104. Up to the end of the 1970s, Senegal was in the forefront of African agricultural innovation and development.53 Since then, however, the agricultural sector has been in decline and producing huge government deficits, with agricultural productivity growth trends stagnant. The country produces sugarcane under irrigation, with a sugarcane yield of 120 t/ha. Production and milling is controlled by the privately owned Compagnie Sucrière du Sénégal, which produces some 85,000 to 90,000 tonnes of white sugar a year, sold in the local market.
Democratic Republic of Congo 105. One of the two factories, at Kiliba, was ruined during the civil war and there is at present little incentive to rebuild it. The production at the remaining factory, Kwilu Ngongo, is low, due to a low average yield of 46 t/ha;54 however, it is possible that the company will export under the EBA in order to obtain hard currency.
49 International Food Policy Research Institute, ‘Opportunities to Reduce Hunger, Poverty, and Land Degradation in the Highlands of Uganda’, www.ifpri.org/media/lfl_results.htm50 Suman K. Sharma, Food security in Nepal, http://www.ifpri.org/themes/sai/conf042402/sharma.ppt. 51 International Monetary Fund, Myanmar: Recent Economic Developments (1999), http://www.imf.org/external/pubs/ft/scr/1999/cr99134.pdf. 52 Ibid. 53 Kelly, V.B. Diagana, T. Reardon, M. Gaye, and E. Crawford, Cash crop and foodgrain productivity in Senegal: Historical view, new survey evidence, and policy implications (1996), http://www.aec.msu.edu/agecon/fs2/polsyn/number7.pdf 54 Ulrich Sommer. ‘Auswirkungen der Everything But Arms-Regelung (EBA) und der geplanten Wirtschaftspartnerschaftsabkommen (WPA) auf den Zuckermarkt der Europäischen Gemeinschaft’, 2003
30

Burkina Faso
106. The Sosuco mill is a private operation managed by Groupe Vilgrain, a French agro-industrial conglomerate that also owns, among other things, sugar production facilities in Chad. The 4,000 ha dedicated to sugar growing show a high yield of 100 t/ha. Production is insufficient even to meet local demand, and there are no plans for expanding capacity. Exports under the EBA are unlikely, given the distance to the nearest port, and the tariff protection (and thus, high local prices) for the local market.
Madagascar 107. While Madagascar is a structural importer of sugar (primarily from South Africa), it also exports under both ACP and US sugar quotas. Although Madagascar's potential total of arable land is estimated at 35,602,000 ha, it used only 8.7 per cent of its potential in 1994.55 This severely reduces chances of profiting from economies of scale. Furthermore, with regard to land degradation severity, Madagascar is one of the highest ranked countries in Sub Saharan Africa. For sugar, the two producing groups, Sirama and SuCoMa, comprising five factories, built by a French sugar company in the 1950s, were nationalized, and more recently re-privatised (to Chinese interests). They suffer from a lack of investments, and a lack of sugarcane. Madagascar’s sugar sector is unlikely to benefit from the EBA in the short- to medium-term.
55 United Nations Food and Agricultural Organisation, TERRASTAT - Land resource potential and constraints statistics at country and regional level, http://www.fao.org/ag/agl/agll/terrastat/wsrout.asp?wsreport=7®ion=7&search=Display+statistics+%21.
31

B. Transport Infrastructure 108. The very poor state of transportation infrastructure in most LDCs is one of the largest constraints for sugar exports (see also Annexes). Transportation costs from mill to port in different LDCs can fluctuate from $2/t to more than $50/t. As can be seen in Table 2.2, in most LDCs, more than 12 per cent of the total value of imports relates to transport costs. In Brazil, a major sugar producer, the equivalent percentage is 3.7 per cent.56
Table 2.2: Freight Payments as share of merchandise imports (f.o.b.), year 2001
Country Freight Cost % Malawi 27.9 Uganda 23.2 Burkina Faso 14.4 Senegal 12.9 Tanzania 12.6 Ethiopia 10.0 Mozambique 10.0
Source: UNCTAD/LDC/112, 2001 109. According to a study conducted by USAID in September 2001, Southern African sugar exporters spend 20 per cent of their earnings on transportation and related expenses, with Malawi spending as much as 55.5 per cent. 110. Nevertheless, though transport costs to the ports are high, most LDCs have access to reasonably effective sugar ports. ASSUC states:
As regards exporting facilities, only the STAM terminal in Maputo, Mozambique is equipped for mechanical loading of bulk raw sugar onto vessels up to around 20,000 tonnes. The STAM terminal is used to export bulk raw sugar for refining from Swaziland, Zimbabwe, Zambia, South Africa and Mozambique. However, raw sugar can be loaded in bulk in many other LDC ports by means of the traditional (non-mechanical) method of bleeding bags over the ship’s rail; raw sugar is currently loaded in this way in Beira (from Malawi and Mozambique), Dar-es-Salaam (Tanzania), Pointe Noire (Congo-Brazzaville), Port Saint Louis (Madagascar) and Abidjan (Côte d’Ivoire), but could be loaded in this way from any other suitable LDC port, e.g. Mombasa, Djibouti, etc. We conclude that the lack of infrastructure to load bulk raw sugar for export is not a significant impediment to EBA bulk raw sugar trade with the EU.57
56 UNCTAD, Infrastructure Development in Landlocked and Transit Developing Countries: Foreign Aid, Private Investment and the Transport Cost Burden of Landlocked, Developing Countries, 28th June 2001, UNCTAD/LDC/112 57 ASSUC, EBA – An impact assessment for the Sugar Sector, 2001, www.sugartraders.co.uk/eba_impact_study.pdf
32
C. Competitive private investors
111. As the arrival of foreign companies is correlated with increases in the productivity, competitiveness and export orientation of certain LDC sugar industries, this section introduces some private companies that have responded successfully to national comparative advantages and/or are able to access finance and invest in infrastructural and technological improvements. The discussion is intended to serve illustrative purposes only; no endorsement of the companies identified should be inferred.
112. Some of the leading private investors in LDC sugar industries include Illovo; Tongaat-Hulett; Deep River Beau Champ and Quartier Francais; Companhia de Sena; and Vilgrain.
Illovo Group Ltd.
113. Illovo Group is a subsidiary of C.G. Smith Foods Limited, which has a balanced portfolio of managed operations in food manufacturing, processing and distribution. C.G. Smith, the parent company of C.G. Smith Foods, is one of the largest industrial companies listed on the Johannesburg Stock Exchange. 114. Illovo Sugar Ltd is Africa’s largest producer of sugar (2.2 million tonnes for the 2003/2004 cropping season) and a significant manufacturer of downstream products with agricultural and other interests extending over six Southern African countries including South Africa, Malawi, Swaziland, Mauritius, Tanzania and Mozambique. It also produces sugar from beet at the Monitor Sugar Company in the United States. Group sugar production derives from South Africa at 1.2 million tonnes, Malawi 240,000 tonnes, Swaziland 215,000 tonnes, Zambia 210,000 tonnes, Tanzania 95,000 tonnes, Mozambique 50,000 tonnes and the United States 160,000 tonnes58. 115. In Malawi, Illovo is the country’s sole sugar producer whilst in Zambia and South Africa, the group manufactures 99 per cent and 47 per cent respectively of all locally produced sugar. Illovo has significant access to preferential markets in Europe and the United States while Southern African operations outside South Africa also have access to the South African Customs Union market in terms of the Southern African Development Community (SADC) Sugar Protocol on Trade. Sugar in consumer packs is also supplied into other regional markets within Africa. The group, through the South African and Swaziland industries, also exports sugar into the world market.
Tongaat-Hulett Sugar Limited 116. Tongaat-Hulett is the holding of a diversified group comprising seven divisions: Sugar, Building Materials, Aluminium, Textiles, Starch & Glucose, and Property. A regional heavyweight in KwaZulu-Natal, Tongaat-Hulett has a continuing turnover of more than R5 billion, the bulk coming from the sugar division. 117. Tongaat-Hulett Sugar Ltd. operates seven sugar mills (including one in Mozambique) and a central sugar refinery, owns extensive cane farming estates and produces raw, refined and specialty sugars for local and export markets. 118. Tongaat-Hulett’s sugar production in 2002 increased to 1.3 million tonnes, 16 per cent up on 2001.59 The cane crush of 11 million tonnes in 2002 represents 84 per cent of installed capacity compared to 75 per cent in 2001. 58 Illovo, Illovo group statistics, http://www.illovo.co.za/worldofsugar/IllovoGroupStats.htm 59 Tongaat-Hulett Sugar Limited, Operations, http://www.huletts.co.za
33
Deep River Beau Champ
119. Deep River Beau Champ Ltd (DRBC) is a Mauritian company that became active internationally by acquiring, as part of a consortium, a majority stake in Tanganyika Planting Company Ltd. (TPC). TPC was privatised in 2000 and bought by the Sucrerie des Mascarareignes Ltd., whose main shareholder is DRBC (60 per cent) and Quartier Francais (40 per cent), from nearby Reunion. The latter manages 70 per cent of the sugar production on Reunion Island. 120. DRBC is part of the Consolidated Investment Enterprise Ltd. (CIEL) a Mauritian industry-based conglomerate. It has investments in Madagascar and Tanzania. Today the group gives employment to 12,500 Mauritians, 3000 Tanzanians and 2000 Madagascans. 121. TPC is located in the Kilimanjaro region, near Moshi, north Tanzania. It is one of three sugar companies in Tanzania. TPC is the largest sugar factory in Tanzania. The sugar estate covers an area of 13,000 ha and currently produces around 62,000 tonnes of sugar per annum even though it has the potential to produce around 85,500 tonnes. TPC has lately been rehabilitated at a cost of $15 million.60
Sena Holdings
122. Sena Holdings consists of four Mauritian companies: FUEL Group, ENL/Savannah, Compaignie d’Investissement et de Developpement Ltee and Kalua Properties Ltd and Stam Investment Ltd. Sena Holdings owns 75 per cent of the equity of Companhia de Sena, which comprises Marromeu and Luabo mills and estates (the other 25 per cent remain state-owned). The privatisation process was facilitated by a $65 million investment insurance guarantee from MIGA, part of the World Bank Group. 123. Luabo factory, sitting opposite Marromeu on the north bank of the Zambezi River, is presently not producing. Company sources say that they will rehabilitate it only if there is a guaranteed market for Mozambican sugar. The Mozambique News Agency claims that $120 million has already been spent on the Marromeu mill and plantation alone.61
124. The FAO notes that with an area of 7,880 ha, the Marromeu factory is thought to have the potential to produce 120,000 tonnes of sugar in 2009/10.62 The Mozambique News Agency cites a company source claiming that volumes of 150,000 tonnes per annum are said to be easily attainable.63
125. Mozambique is an attractive market for Mauritians looking to invest surplus capital. Mauritius itself has limited land availability and as a high cost sugar producer the future of preferential imports to the EU is uncertain. Mozambique, by contrast, is a low-cost producer party to the EBA initiative.
60 Gwang’Ombe, Renewable Energy Technologies in Tanzania, April 2004, www.afrepren.org/draftrpts/hbf/cogen_tz.pdf 61 ‘Sena Company Expands Livestock’, AIM Reports, No. 245, Mozambique News Agency, 16th December, 2002, http://www.poptel.org.uk/mozambique-news/newsletter/aim245.html 62 Proceedings of the FAO/Mozambique Sugar Conference’, Sugar and Development in Africa and the World: Sustainability, Diversification and Trade, Maputo, Mozambique, 10 – 12 October 2002, http://www.fao.org/es/esc/common/ecg/25853_en_Proceedings2.pdf, p.54 63 ‘Sena Company Expands Livestock’, AIM Reports, No. 245, Mozambique News Agency, 16th December, 2002, http://www.poptel.org.uk/mozambique-news/newsletter/aim245.html
34

Group Jean-Louis Vilgrain (JLV) 126. Vilgrain is a French group engaged in sugar production and refining, flour milling and trading, the bakery trade and the preparation of vacuum-packed and frozen meals. The group is active in France, Norway, the United States, Brazil, Chile and Africa. It has been involved in Africa’s sugar sector for more than fifty years. Its African arm, which accounts for close to half of its total operations, is called SOMDIAA – société d’organisation de management et de développement des industries alimentaires et agricoles. The privatisation of sugar factories in the 1990s allowed it to obtain considerable interests in several countries (previously, after most if its African sugar interests were nationalized in the years to 1970, SOMDIAA in several cases held minority shares, and managed the sugar companies on a management fee). It now controls sugar production and processing in Burkina Faso, Cameroon, Chad, Congo and Gabon.
35

Chapter 4
CHARACTERISTICS OF SUCCESSFUL PRODUCTION, POLICIES AND INVESTMENTS
A. Factors contributing to successful sugar production
127. This Chapter brings together the analysis of trends performed in Chapter 2 and the case studies outlined in Chapter 3 to offer some suggestions concerning the characteristics of efficient sugar production, policy interventions likely to be successful and desirable characteristics of private investment. The purpose is to outline how LDCs can benefit from the EBA initiative by overcoming supply-side constraints to take advantage of preferential access at above-world market prices. While the discussion takes place within the context of a liberalised investment climate and the modalities of privatisation, it should not be assumed that private ownership and investment is the only course open to LDC governments. Furthermore, while LDC governments are for the most part reducing their direct interests in sugar production (i.e. ownership of plantations and factories) they nonetheless retain a strong interest in the success of the newly privatised industries: privatisation and the arrival and departure of FDI can affect (directly and indirectly) government revenue. Expansion of production and exports also affects employment levels, balance of payments and has consequences for the environment; all of which are critical issues for producers, policy-makers and investors.
128. In addition, this Chapter notes the possibility for policy-makers to take advantage of the EBA initiative as a vehicle for poverty alleviation and the attainment of the MDGs. One purpose of the recommendations that follow is therefore to highlight some of the ways in which production, policies and investment can be made consistent with those ends. The suggestions made do not of course exhaust all of the available options and should not be assumed to be effective in every situation. 129. Large area under cultivation: Plantations should be as large as social and environmental conditions allow. Factories dependent on scattered smallholders cultivating plots of less than one hectare struggle to compete with producers in other countries where the average size of a farm can range from 80 ha (Australia) to more than 10,000 ha (Florida). Due to the high component of fixed cost in the sugar industry, large volumes and economies of scale are essential to staying competitive. 130. Access to irrigation: Crops must be irrigated and should not depend solely on potentially unpredictable seasonal rain. Access to water impacts directly on cane quality and factory capacity utilization since poor crops can reduce the overall operating period. Together with labour and soil fertility, irrigation is one of the most important elements determining sugar production costs.
131. Adequate supply and quality of cane: The ‘command area’ from which a mill draws its cane supplies should be close in order to minimise transportation costs. No growth can be attained in an industry that has no cane to crush and is always operating below capacity. In many regions this is no minor issue, and commonly depends on the transport infrastructure. The Harare sugar refinery in Zimbabwe, for instance, had to stop operations for two weeks in 2001 because of coal supply problems. Malawi’s rural farmers continually lack fertilisers and bare-earth roads become impassably muddy during the rainy season.
132. High daily processing capacity: Processing capacities should be greater than 5,000 tonnes per day to benefit from economies of scale. It is very difficult to provide a return on
36

invested capital when the capacity utilization rate is low and the factory is operational for only a fraction of the year. 133. Factory flexibility: Factories and mills should diversify their output to counterbalance the seasonal character of sugarcane growing and the volatility of the market. Brazil’s great advantage, for example, is its flexibility in the production mix between sugar and other sugar by-products, particularly ethanol.
37

B. Factors contributing to successful policy interventions 134. Governments can take a proactive role in facilitating and fostering the development of sugar export industries, as shown by the important case of a functioning national transport infrastructure. Additional interventions that have been successful in the past are outlined below. 135. Careful privatisation: A trend towards privatisation is under way in most of the LDCs studied but not all. Malawi, Mozambique, Tanzania, and Zambia have, to give just some examples, sold the majority of their state-owned sugar mills. Governmental policies vary widely from country to country, however, and thus the extent to which ownership has been transferred to domestic or foreign owners also varies. While privatisation can attract much needed capital to finance the investments necessary to improve LDC competitiveness, the sequencing and pace of the process is critical to success. On the one hand, for instance, the legal status of many LDC sugar mills has yet to be changed from state to private ownership, an essential step in building confidence in the privatisation process. On the other hand, many of those countries that have sold their mills to outside owners have in addition yet to confront them with a full range of business risks, including cutting off subsidies and permitting bankruptcy. It is to be observed finally that privatisation is not only the option pursued by LDCs: Ethiopia, Myanmar, and Sudan have tended to favour state investment, including joint ventures with other governments. Sudan, for example, has forged partnerships with Kuwait and Saudi Arabia (see Annexes 1, 2 and 10). 136. Labour issues: Where privatisation of sugar mills is considered desirable governments may need to assist the new owners implement restructuring measures, particularly labour rationalisation programmes. The sugar industry is politically very sensitive and it is common to see a large number of workers on mill payrolls, a potential source of inefficiency that can deter investors. In tackling this issue policy-makers must be aware that concentrating ownership of the physical means of sugar production while simultaneously rationalising the labour force can have immediate negative consequences for income distribution and the incidence of poverty in an industry characterised by low wages. It is imperative that if LDCs plan to take advantage of the preferences offered by the EBA initiative then they do so in a way that addresses these concerns. One possibility is to ring-fence windfall gains from the privatisation process and use such monies to finance rural and social adjustment and development programmes (social safety nets) for those affected. 137. Agrarian reform: In those countries undergoing land reforms, governments might allow farms to collectivise into bigger plots and thereby reduce costs. In some cases, the government might provide incentives for farmers to shift to other crops if their land is unsuitable for sugar cane. Like privatisation and labour rationalisation, any change in the status quo with regard to land ownership and access rights is politically sensitive and policy-makers must proceed with due diligence and in an inclusive manner. For example, agrarian reform programmes such as land resettlements can cause a contraction rather than an expansion of national economies: because of the manner in which they are commonly carried out, resettlements can create social unrest and force people to emigrate. 138. Regulatory environment: Governments can undertake structural reforms to clarify and eliminate rigidities in the regulatory framework. One possibility is to ease the rules requiring sugar exporters to register with a designated state-run authority. Another is to develop an investment policy. It has been noted that with regard to Bangladesh, Mozambique and Tanzania, investment policy appeared to play little role in attracting FDI to the sugar industry. Clearly, however, this does not entail that investment policies cannot assist a country in attracting beneficial investment. Where an investment policy is considered desirable, LDCs should pay close attention to the extent to which it creates incentives whose realisation is consistent with broader social, environmental and economic objectives and the MDGs. Some
38
features common to LDC investment policies are listed below, although the list is not exhaustive of all the possibilities and does not name all the countries applying the policies mentioned. Furthermore, no judgement is passed as to the effectiveness of these policies for the implementing country or their desirability as models for other LDCs.
• One-stop investment promotion shops (Bangladesh64, DRC65, Malawi66, Myanmar67); • Non-discrimination between foreign and domestic investors (Bangladesh, DRC,
Senegal68, Uganda69); • Import duty exemptions for capital goods (Bangladesh, DRC, Uganda); • Guarantees against nationalisation of foreign-owned assets (Mozambique70,
Tanzania71, Zambia72) • Tax incentives for socially beneficial investments (DRC)
139. As important as the content of any investment policy is its consistent and non-arbitrary application. Many LDCs suffer problems of weak implementation capacity and political interference, which serves to deter and distort domestic and foreign investment alike. The DRC’s 2002 Investment Code attempts to signal to investors the government’s intention to apply faithfully the provisions of the Code. It does this by promising to respond to a proposed investment project within 30 days; if no ruling is made, tax incentives for the investment must be granted automatically.73
140. Access to credit and subsidies: Governments can grant loans at favourable rates and consider the provision of subsidies during the developmental stage of production and milling for export. Landlocked countries in particular might need to provide support on inland transportation costs until higher traffic volumes bring unit costs down. In Bangladesh, for example, the government offered growers soft loans worth $12.28 million in 2001/02 to buy better quality seed and fertiliser and to raise the area under cane to 88,000 ha. 141. Sugar finance programmes: To complement the provision of soft loans, governments can establish financial programmes to target a variety of initiatives including: optimisation of harvesting machinery; improvement of fallow management; best use of cane varieties; 64 Bangladesh Export Promotion Bureau, Investment scenario, www.epbbd.com/InvestBan.html; Tradeport, Bangladesh Investment Climate Statement, www.tradeport.org/ts/countries/bangladesh/climate.html 65 US Country Commercial Guide FY 2002, http://usembassy.state.gov/kinshasa/wwwhccg7.html. See also related pages 66 SADC, SADC Trade, Industry and Investment Review 2004, http://www.sadcreview.com/country_profiles/malawi/malawi.htm67 The Union of Myanmar Ministry of Commerce, Trade and Investment opportunities, http://www.myanmar.com/Ministry/commerce/opportunities/FSopportunities.htm68 The U.S. Commercial Service, Senegal Country Commercial Guide FY 2003, http://www.dakarcom.com/CCG/ccg2003.htm69 UNCTAD, Investment Policy Review-Uganda, www.unctad.org/ipr/UGANDA.PDF70 Multilateral Investment Guarantee Agency (MIGA), FY 2002 Activities: Sub-Saharan Africa, http://www.miga.org/screens/services/ims/regions/africa.htm; SADC, Official SADC Trade, Industry and Investment Review 2001-Country Profiles: Mozambique, http://www.sadcreview.com/country%20profiles%202001/mozambique/mozaminvest.htm71 Tanzania Investment Centre, Introduction, www.tic.co.tz/IPA_Information.asp?hdnGroupID=28&hdnLevelID=2; SADC, SADC Trade, Industry and Investment Review 2004, http://www.sadcreview.com/country_profiles/tanzania/tanzania.htm; CIA, The World Factbook, http://www.cia.gov/cia/publications/factbook/geos/tz.html, November 30th, 2004 72 Zambia Investment Centre, Investment Incentives, www.zic.org.zm/IPA_Information.asp?hdnGroupID=5&hdnLevelID=173 US Country Commercial Guide FY 2002, http://usembassy.state.gov/kinshasa/wwwhccg7.html. See also related pages
39

adoption of best harvesting practices; and optimal use of irrigation resources so as to promote the environmental sustainability of sugar production. A clear example is provided by Australia, a main sugar competitor of LDCs. In 1997, Australia launched a five-year irrigation programme designed to encourage landholders to undertake irrigation practices. The scheme provides 22.5 per cent (up to a maximum of $150,000) of eligible costs of construction of new water storages for irrigation purposes. 142. Technical know-how: Policy-makers can promote an enabling environment in which maximum productivity, effective marketing, and wide distribution at affordable costs can be achieved. Along these lines, governments can assist industries in the training of technical personnel, equipment, markets, modes of distribution and storage facilities. For agriculture to develop, committed people with the necessary technical know-how must be involved. 143. Infrastructure: In more general terms, LDC governments can help their sugar industries by building and facilitating the development of the required infrastructure at rural and regional levels, including railways, highways, telecommunications, computers, banking, and advertising. Tanzania, for instance, is committed to allowing railways and ports to operate free of economic regulations. 144. Political stability: Governments obviously play a crucial role in maintaining a stable and peaceful socio-economic environment. Tanzania is one country recognised as being relatively free of ideological confrontation, ethnic strife and labour disputes.
40

C. Factors contributing to successful private investment
145. In order to compete successfully and meet their social and environmental obligations, privately owned factories should share the following characteristics. 146. Financial strength: The sugar industry is characterized by high volatility of prices, with consequent uncertainty and risks. World prices have frequently fallen below the cost of production, even for the most efficient operators. Several factors (outlined below) are common to LDCs and entail that companies must be financially strong in order to survive and succeed, especially in the initial stages. Companies should consider their risk management strategies very carefully and in particular seek to avoid passing unbearable risks onto growers. 147. Although exports in some countries have benefited from the weakness of their currencies (e.g. South Africa in 2003), strong working capital reserves are essential to withstand protracted low cycles. Mills that lack sufficient funds to offer immediate payment to the growers will be starved of cane and ultimately must close. Alternatively, these mills are forced to sell-off sugar inventories thereby flooding the market. Such outcomes do not aid poverty reduction and environmental management efforts. Sufficient capital reserves therefore reflect sound social and environmental as well as business practices. 148. The devastating floods of February 2000 in Mozambique forced the Illovo Sugar group to invest more than $10 million to resume production in the Maragra sugar mill. To take another example, the recent rain shortfall brought about by the worst drought experienced in Mauritius during this century had a serious impact on the DRBC’s growing and milling activities. In addition to the prevailing drought conditions, the passing of cyclone ‘Davina’ had a major impact on the eastern part of the island, causing severe damage to the growing canes as well as to some irrigation installations. As a result, the newly upgraded milling operation was unable to operate at full potential due to a lack of cane. Moreover, as a consequence of poor cane quality, sugar recovery was lower. 149. Vertical integration: Successful investors are normally well integrated into cane growing, sugar manufacturing, refining, packaging and distributing. In addition, they have strong ties with their suppliers. Illovo group has incentives in place to continuously improve the performance of its more than 220 suppliers. Tongaat-Hulett Azucar, a subsidiary of Tongaat-Hulett in Mozambique, markets the entire production of its Mozambican mills. 150. Diversification: Deep River Beau Champ is diversified into sugar, energy production, fruit and vegetable growing, deer farming and aquaculture. Illovo’s downstream production contributed R408 million to total revenue in 2001 and included syrup, furfural, furfural alcohol, ethyl alcohol, diacetyl, acetoin, pentanedione, lactulose, dextran and electricity. 151. Customer base and preferential market access: Illovo group supplies sugar and downstream products to a considerable range of domestic, regional and export markets. Sales to domestic markets in Southern Africa and the United States amounted to 62 per cent of its total revenue in the 2000/1 season, while exports to 83 countries amounted to 38 per cent. The group’s operations benefit from the fact that all sugar sold outside of Africa enters into favourably priced preferential markets in Europe and the United States. Illovo’s operations in Swaziland, Malawi, Mauritius and Tanzania exported almost 208,000 tonnes of sugar to Europe and the United States during the 2000/01 season. 152. Rural and social development activities: To gain public support, investors are increasingly developing social programmes to assist the communities in which they operate. Illovo set up housing committees to enable employees to have their own houses and has provided financial support to local schools. In South Africa the company set up a programme to promote medium-scale farming by selling land to prospective growers. The average size of
41

the plots under cane is about 100 ha. The company is now extending this scheme to other countries. Farms sales to growers in the past five years added up to 68 ha to the average farm in South Africa and 15 ha in Swaziland. The empowerment of previously disadvantaged people should benefit relations between companies and local communities.
42

Annexes 1. Sudan
Centrifugal sugar production, import, export and consumption (x1000t)
0
100
200
300
400
500
600
700
800
1993 1994 1995 1996 1997 1998 1999 2000 2001 2002
Production Imports Exports
Consumption 1993 485 4 75 500 1994 510 2 10 515 1995 486 4 17 460 1996 543 0 48 480 1997 538 1 80 480 1998 610 3 116 391 1999 635 0 85 396 2000 680 0 58 430 2001 719 95 159 523 2002 744 60 166 568
Source: International Sugar Organization, Statistical Bulletin, October 2003
Production
153. The sugar industry was introduced to Sudan in 1962 when the first sugar factory (Aljnaid) in Al Gezira state was founded. There are now five sugar factories in the country with a combined production capacity of 755,000 tonnes annually. 154. The Sudanese Sugar Public Corporation (SSCC) administers the four state-owned processing plants, which have a combined crushing capacity of 22,000 tons of sugarcane per day (355,00074 tons of sugar per year):
- Gunied Sugar Factory (60,000 tons) - New Halfa Sugar Factory (75,000 tons). The New Halfa sugar refining plant was
recently inaugurated. It is expected to export its 600 tons per day to the EU market. - Sennar Sugar Factory (110,000 tons) - Assalaya Sugar Factory (110,000 tons)
155. Production in these four factories is expected to increase from 355,000 tons to 450,000 tons by the end of 2004.75 SSC employs 8,000 permanent staff and an additional 10,000 during harvest time.
74 Bank of Sudan, Annual Report, 2002 75 International Union of Food, Agricultural, Hotel, Restaurant, Catering, Tobacco, and Allied Worker's Association (IUF), Information and Analysis for Unions in the Sugar Sector 2 (2001).
43

156. The fifth factory, Kenana, belongs to Kenana Sugar Company, which is a joint- venture between the government of Sudan and some Arab Countries, mainly Kuwait and Saudi Arabia. Kenana's shareholders include the Government of Sudan, the largest with a shareholding of 35.17 per cent, the Government of Kuwait, with 30.5 per cent, the Government of Saudi Arabia with 10.92 per cent, while several other Arab and Sudanese trade and development organisations and local banks hold the remaining shares.76 Kenana now occupies an area of 168,000 acres, of which 100,000 is under cultivation.77 The factory, which cost about $1 billion to set up in the 1970s recently underwent a $61 million capacity expansion program, which allowed output to increase from 300,000 tons to 405,000 tons of refined white sugar per year. In addition to white sugar, it produces sugar cubes, cane honey and molasses.78 The plant is located some 250 km south of Khartoum and 1,200 km from Port Sudan. The maximum length of cane haul of the factory is 35 km. 157. Total output in 2002 was 743,554 tons, raw value. Sugar production is expected to increase in the near future due to the rehabilitation of factories and the implementation of new projects:
- On October 2001 Sudan’s President committed to the White Nile sugar project, a $325 million joint venture involving Sudan, Egypt, Libya and South Africa. Located 150 km south of Khartoum, it is expected to produce 300,000 tonnes annually starting in 2004 at a production cost 15% lower than at Kenana. Inaugurated in April 2004, the capacity of the factory is as yet unconfirmed.
- In March 2002 Kenana Sugar company announced that it would raise its annual sugar production from 420,000 tons to 600,000 tons.
- The Turkish government announced on May 2002 the establishment of a factory in Sudan with a capacity of 300,000 tons per year.
- In July 2003, the Saudi Khuzah Investment and Financial Consultancies Company signed a memorandum of understanding with the Sudanese government and two private Sudanese firms to establish a sugar venture with a capital of 137 million dollars. Khuzah will hold 50 per cent, while Alwifaq Agricultural Company will take 25 per cent, Al-Basatah and Masarrat company 15 per cent and the Sudanese government the remaining 10 per cent of the shares of the Blue Nile Sugar Company. With headquarters in Sennar town, about 300 kilometres (190 miles) southeast of Khartounm, the company will produce 250,000 tonnes of sugar annually79.
- Production in the four factories owned by the government is expected to increase from 355,000 tons to 450,000 tons by the end of 2004.
158. In sum, sugar production in Sudan could reach 1.7 million tons, white value, from the current 750,000 tons in five or six years.
Imports 159. The country’s sugar market was liberalized in 2001. The drop in import duties caused an increase in imports. In 2002 Sudan imported a total of 60,837 tonnes raw value, of which 28,824 tonnes came from India and 30,675 tonnes from South Africa.80
76 Shell in the Middle East-Views, 'A story of sweet success', www.shell-me.com/english/oct2002/views1.htm. 77 Ibid. 78 Kenana, Annual Report and Accounts, 2001. 79 Agence France Presse, Khartoum, July 2003 80 International Sugar Organisation, Statistical Bulletin, October 2003.
44
Exports 160. In 2002 Sudan exported 166,802 tonnes of sugar.81 Under the EBA initiative, the country was entitled to ship 17,000 tons of sugar duty free to countries within the European Union. For the moment the EBA quota represents only 10% of all sugar exports but, as production costs in Sudan are among the lowest in-between all LDCs, the country could greatly benefit from a quota free access to the EU market after 2009.
Consumption 161. In 2002 567,795 tonnes were consumed.82 Due to population growth, economic expansion and better access to rural communities, consumption is expected to increase to 800,000 tons a year within the next four years. In terms of kilograms per head, consumption is expected to increase from the current 17kg to 25kg in four years.
81 Ibid. 82 Ibid.
45

2.Ethiopia
Centrifugal sugar production, import, export and consumption (x1000t)
0
50
100
150
200
250
300
350
1993 1994 1995 1996 1997 1998 1999 2000 2001 2002
Production Imports Exports Consumption1993 137 5 25 1421994 123 23 1 1071995 129 28 0 961996 172 38 20 2061997 172 7 30 1451998 173 4 35 1851999 235 17 40 1992000 251 4 65 2402001 305 33 50 2402002 287 0 87 211
Source: International Sugar Organization, Statistical Bulletin, October 2003
Production 162. There are four sugar factories in Ethiopia, located at Wonji, Shoa, Metahara and Finchaa. Annual production in 2002 was 287,000 tonnes.83 163. In 1999 the Wonji and Shoa factories, both located 160 km south of Addis Ababa, had an individual processing capacity of 3000 to 4000 tonnes daily.84 About 50,000 acres of irrigated cane fields supply the industry. There are plans to assign 10,000 hectares for sugar growing in the Amahra region. In 2001, expansion work was initiated at two of the four factories, Wonji and Shoa, with the objective of increasing their daily cane crushing capacity to 4000 tonnes.85
164. Ethiopia’s sugar production received a boost with the additional 85,000 tonnes per year produced at the mill in Finchaa, a new state-owned project that came on line in April 1999. The Finchaa factory has a daily capacity of 4,000 tonnes and increased Ethiopian sugar production by nearly 50%.86 At present Finchaa is the only factory producing high quality sugar, which requires less refinement. The older factories produce inferior grades.
83 International Sugar Organization, Statistical Bulletin, October 2003. 84 The Sugar Worker, 'Ethiopia: A net exporter in 1999/2000' (October 1999). 85 Association Des Organisations Professionnelles Du Commerce Des Sucres Pour Les Pays De L'Union Europeenne (ASSUC), EBA- An impact assessment for the Sugar sector (2001). 86 Tradeport, 'Sugar sweetens Ethiopian export prospects' (1999), www.tradeport.org/ts/countries/ethiopia/mrr/mark0035.ht.
46

165. Ethio-Trade-Ex Company, an Ethiopian Firm, is pursuing the formation of a sugar plant in the Amhara region, near lake Tana. The government already assigned a 15,000-acre plot for this purpose.
Imports 166. In the last fifteen years Ethiopia has imported refined sugar in small quantities. In the 1990s imports ranged from 1000 to 3000 tonnes. In 2001 Ethiopia imported a total of 33,284 tonnes but none in 2002.87
Exports
167. The opening of a fourth plant in early 1999 allowed Ethiopia to produce a surplus of sugar for the first time. Ethiopia earned over $8.6 million from exports of 57,044 tonnes of sugar in 2000/01 (Oct-Sept) compared with $5.2 million from 39,928 tonnes exported in 1999/00, according to the Ethiopian Sugar Industry Support Centre.88 While Ethiopia was exporting significant quantities of sugar throughout the 1980's, it experienced a dramatic fall in exports in the 1990's.89 In 1995/96 exports disappeared entirely, to climb back up to 87,137 tonnes in 2002. Disruptions in sugar processing because of equipment breakdowns and poor climatic conditions accounted for most of this decline.90
168. In 2002/03 exports of raw sugar to the EU under the EBA totalled 14,689 tonnes91. The country could reasonably export 100,000 tonnes of white sugar annually once further upgrades at Finchaa and Wonji/Shoa are completed. 169. In the past Ethiopia was able to export some sugar and molasses by restricting domestic consumption. These restrictions were recently removed. 170. In addition to the EU, the unique export market for the Ethiopian sugar is Djibouti.92
Consumption
171. In 2002 Ethiopia had an estimated consumption of 210,826 tonnes.93 Per capita consumption was therefore 3.2 kilogram.
87 International Sugar Organisation, Statistical Bulletin, October 2003 88 Financial Gazette, 'Ethiopia to sell US$7m sugar to EU' (March 2002). 89 Tradeport, 'Sugar sweetens Ethiopian export prospects'. 90 Ibid. 91 Sugar Traders Association of the United Kingdom, EBA sugar statistics. www.sugartraders.co.uk/ebastats.htm. 92 International Sugar Organization, Statistical Bulletin, October 2003. 93 Iibid.
47

3. Malawi
Centrifugal sugar production, import, export and consumption (x1000t)
0
50
100
150
200
250
300
1993 1994 1995 1996 1997 1998 1999 2000 2001 2002
Production Imports Exports
Consumption 1993 137 0 27 162 1994 213 12 43 149 1995 241 0 65 164 1996 234 0 57 173 1997 210 2 51 178 1998 210 15 67 158 1999 187 0 47 137 2000 209 5 65 127 2001 205 0 72 140 2002 261 0 81 145
Source: International Sugar Organization, Statistical Bulletin, October 2003 Production 172. The Malawi sugar industry comprises two large factories, Dwangwa and SUCOMA (Sugar Corporation of Malawi), both now operated by Illovo Sugar Ltd of South Africa. The sugar industry employs 10,000 persons and supports roughly 150,000 people. Illovo Sugar SA holds 60 per cent of SUCOMA following its acquisition of Lonrho Sugar in 1997, and the government owns about 30 per cent through Admarc Investment Holding Company. 173. A total of 215,533 tonnes of sugar, combining export raw, local raw and refined sugar, was produced at Dwangwa (80,277 tonnes) and Nchalo (135,256 tonnes) from January 2001 to the end of February 2002. From this, 57,438 tonnes was sold domestically. The company increased its production to 270,000 tonnes in 2003 through increased acreage and an out-grower program. 174. Much of the recent expansion of sugar production in Malawi, notably white sugar, has been achieved by means of a combination of significant investment and an increasing number of small planters turning to cane as a cash crop. Close to twelve thousand people have full-time employment in the sugar sector (10,206 on the plantations, 1,547 in the mills/refineries), while over three thousand are seasonally employed (mainly on the plantations). According to the LMC International, the industry is one of the lowest cost producers in the world.
48
Imports 175. In 2001 and 2002 no imports were registered for Malawi. In 2000 it imported 4,725 tonnes.94
Exports 176. Export surrender requirements were abolished in 1994, except on traditional products of tobacco, tea, and sugar. 177. In 2002 Malawi exported 81,293 tonnes of sugar. Exports are mostly in the form of raw sugar, the part of refined sugar having fast disappeared in 2002. The EU is the largest single buyer. The amount of the EBA sugar delivery was in 2002/03 of 10,959 tonnes, which corresponds to a third of the quantity exported to the EU. As the ACP sugar protocol allows 20,824 tonnes and the special preferential sugar import quota is of 10,000 tonnes it appears that Malawi did not use all its export opportunities. 178. Malawi also has a tariff-rate quota of 10,530 tonnes with the USA. Other main clients are the surrounding countries: Kenya, Mozambique, South Africa, Tanzania and Zimbabwe. Sugar exports are Malawi’s third foreign exchange earner (with about 7 per cent of the total), after tobacco and tea. 179. Considerable amounts of sugar are smuggled out of the country into Mozambique, Tanzania and Zambia. More than 20% of the sugar production is exiting through undocumented or informal trade.
Consumption 180. Consumption has stabilized since the mid nineties reaching 13.7 kg per capita in 2002.95 In 2002 Malawi had a total consumption of approximately 145,000 tonnes.96
94 International Sugar Organisation, Statistical Bulletin, October 2003 95 Ibid. 96 Ibid.
49

4. Zambia
Centrifugal sugar production, import, export and consumption (x1000t)
0
50
100
150
200
250
1993 1994 1995 1996 1997 1998 1999 2000 2001 2002
Production Imports Exports Consumption1993 147 0 51 861994 150 0 45 1051995 151 0 69 1521996 166 0 75 1541997 174 2 63 741998 173 3 87 851999 210 0 3 1152000 190 4 47 1452001 199 1 132 1022002 233 1 102 116
Source: International Sugar Organization, Statistical Bulletin, October 2003
Production 181. Zambia Sugar plc is the country’s major producer with a 97.5 per cent share of all domestically produced sugar. It was originally established as Ndola Sugar Company in 1960 and produced refined sugar from raw sugar imported from Zimbabwe. 182. The company also made jams but this operation was closed down in 1997. In 1990, the plant was moved to the current site at Nakambala, retaining the Ndola site for warehousing purposes. The company name was changed to Zambia Sugar Plc in 1995, the same year in which Tate and Lyle acquired a 50.9 per cent shareholding in the company. In 1996, it was listed on the Lusaka Stock Exchange. 183. In April 2001 the Illovo group successfully acquired 50.9 per cent of all shares, worth $11.4 million, which were previously held by Tate & Lyle. Following the rules of the Lusaka Stock Exchange (LuSE), the Illovo group acquired on equivalent terms 78 per cent of the stake owned by minority shareholders. The total consideration, including that paid to Tate & Lyle was about $20 million. Illovo now holds 89.7 per cent of the issued share capital in Zambia Sugar. 184. In 2002, the Nakambala factory, which has its own white sugar refinery, produced an estimated 208,000 tons of sugar.97 The plant is located some 100 km from the capital Lusaka and its operations extend over 10,000 ha of fully irrigated cane, with an average yield of 115 tonnes per hectare.
97 Environment Observatory, 'Poor Economy Affects Lusaka Sugar's Sales' (July 2002).
50
185. In addition to the cane supplied by the company’s own agricultural operations, a further 500,000 tonnes of cane is produced by large and small-scale growers with cane fields situated in close proximity to the factory. Small-scale farmers are represented by the Kaleya Smallholders Company, a joint development project set up by farmers, Zambia Sugar, and the Commonwealth Development Corporation (CDC.) Cultivated land extends over 2,156 hectares and is divided among approximately 160 growers. 186. The factory has two milling tandems with a combined crushing capacity of 400 tons of cane per hour. The average sucrose recovery is 12.15 per cent. Several brown and refined sugar products are packaged at the mill under the Whitespoon brand name. The sugar is fortified with Vitamin A in order to counter a general deficiency in Zambia and other Southern African countries. 187. India’s Sugar & General Engineering is to build a $5m integrated sugar plant near Lusaka for Consolidated Farming, which is part of Zambia’s Stable group. The project, to be commissioned by April 2003, is being funded by Kenya-based PTA Bank.
Imports 188. The country is a net exporter with smuggling of unfortified sugar still taking place. In 2002 Zambia imported 510 tonnes of sugar.
Exports 189. According to LMC International98 Zambia is amongst the top fives most efficient producers in the world, which explains why the amount of sugar exported under special quotas is only a minor part of all the exports. In 2002 Zambia exported 102,033 tons of sugar99 to African countries—mainly Republic of Congo, Rwanda and South Africa—and the European Union. For the 2002/03 period the EBA quota was of 9,016 tonnes. Although the country has no quota under the ACP Sugar Protocol, it obtained an allocation of 12,862 tonnes of Special Preferential Sugar for that period. In 2002 sugar accounted for 33 per cent of Zambian commodities exports.100
190. In 1999, Kenya put in place import tariffs on sugar. This has resulted into a drastic fall in Zambia’s sugar exports from 86,800 tons to 3,495 tons that year. Kenya had been one of Zambia’s biggest markets in the region. 191. Zambia has been recently criticized for off-loading sugar in the regional market at prices lower than those in its own domestic market.
Consumption 192. In 2002 Zambia had a sugar consumption of 115,598 tonnes (12 kg per capita).101 This is substantially less than the amount of sugar consumed in 2000 (145,000 tonnes), but higher than total sugar consumption in 2001 (102,447 tonnes).102
98 International Sugar Organisation, 'EBA Initiative: Implications for the World Sugar Market', November 2002. 99 International Sugar Organisation, Statistical Bulletin, October 2003 100 FAO, External Trade statistics. 101 International Sugar Organisation, Statistical Bulletin, October 2003 102 Ibid.
51

5. Bangladesh
Centrifugal sugar production, import, export and consumption (x1000t)
050
100150200250300350400
1993 1994 1995 1996 1997 1998 1999 2000 2001 2002
Production Imports Exports Consumption1993 205 85 0 3001994 249 53 0 3151995 278 28 0 2851996 194 104 0 2901997 138 140 0 3001998 159 100 0 2701999 162 165 0 3002000 110 237 0 3502001 109 223 0 3352002 229 151 0 375
Source: International Sugar Organization, Statistical Bulletin, October 2003 Production
193. There are fifteen state-owned mills run by the Bangladesh Sugar and Food Industries Corporation (BSFIC), which also is active in other sectors. The BSFIC provides soft loans ($12.28 million in 2001/02) and inputs for cane growing farmers. 194. In 2002 sugar production in Bangladesh reached 228,928 tonnes, exceeding a target of 183,000 tonnes fixed for the current crushing season. This was the first time since 1995 that the country produced more than 200,000 tons of sugar. Cane crushing continues at five sugar mills. Total annual demand is at about 400,000 tons.103
195. Since 1997, the area under cane has been decreasing as growers have switched to other crops with higher returns. From 80,000 ha planted in 1994/95, cane growing was down to 74,000 ha in 2000/01. 196. About one third of the sugar cane crop is used for the production of sugar; the rest is mainly used for the production of gur (63%) or consumed directly (6%). 197. Sugar cane growing supports about 600,000 families and millions of rural workers providing them with seasonal employment. 198. The first private sector sugar mills will begin commercial operation in 2005 targeting around 70,000 tonnes of annual sugar production from crushing sugarcane and processing
103 BBCNEWS World Edition, 'Sugar mill sweetens bitter retirement pill', www.news.bbc.co.uk/2/hi/business/2543483 (December 2002).
52

imported raw sugar. The Nitol group, which bought Kaliachapra Sugar Mills from the government and named it Nitol Sugar Industries Limited (NSIL), has reached a joint venture agreement with Thai sugar conglomerate Ban Pong Group to rehabilitate the mill, which has been closed for nearly a decade. This will be one of the first privately run mills to become active in 2005, and it hopes to process 70,000 tonnes of domestic and imported raw sugar.104 199. By buying the mill the Nitol Group, a locally based business conglomerates105 having interests in automobile distribution, transportation, aviation, cement, insurance and agro processing, seems to act similarly to other national groups that demonstrate interest for the national refining sugar sector. In September 2004 ten financial institutions led by the Standard Chartered Bank arranged a syndicated loan of 2,900 million takas106 (48 million US$) for a sugar refinery. It is the largest loan dedicated to that purpose in the history of Bangladesh. The Partex Group, active in processed food as well as in steel containers and cotton yarn, is planning to launch thanks to that capital the Partex Sugar Mills Ltd. 200. Following the same tendency, in November 2004 the Hong Kong and Shanghai Banking Corporation (HSBC) Ltd announced the syndication of a 1,640 million takas (27 million US$) term loan and working capital facility for City Sugar Industries Limited107 to establish a sugar refinery. The City group is one of the largest local conglomerates active in vegetable oil and other processed foods. A total of six Banks and three non-Banking financial institutions participated in the syndicated facility. 201. These elements show that investors believe in the sugar cane production potential from Bangladesh but concentrate themselves on the sugar mill component of the sugar value chain and not at the cane production level.
Imports 202. Bangladesh imported 150,662 tons of sugar, raw value, in 2002, down from 222,700 the previous year. 203. Sugar importation is controlled by two state-owned companies (one being the Trading Corporation of Bangladesh, TCB). Though international tenders are floated from time to time, only members of the Refined Sugar Association in London are allowed to bid. In India, only the sugar industry’s trading arm, Isgiec, is a member of RSA and thus in a position to bid. Consequently, tenders floated by Dhaka are usually allotted to global trading majors like Cargill, Sucden and Louis Dreyfus, which have been buying the quantities back-to-back from mills in southern India and shipping it to Chittagong. Thus, while some volume of Indian sugar is reaching Bangladesh, no Indian company is directly bidding in the tenders. Apart from these officially registered imports, large volumes of sugar are smuggled into the country every year from neighboring India. In the past traders have estimated these volumes at 200,000 tonnes per year.108
204. In June 2002 the government withdrew all quantitative restrictions on sugar import by private companies as a step toward trade liberalisation. Since this then, state-owned sugar mills have been facing a financial crisis, resulting from the flooding of the domestic market
104 New Age Business, http://www.newagebd.com/2004/aug/12/busi.html#2, 12th August, 2004 105 FinanzNachrichten, http://www.finanznachrichten.de/nachrichten-2004-11/artikel-4079956.asp 106 The Daily Star, http://www.thedailystar.net/2004/09/20/d40920050153.htm 107 HSBC, http://www.hsbc.com.bd/bd/aboutus/press/content/04dec02.htm 108 SaarcScan, 'Bangla sugar imports touches 2.3 lakh tonnes', www.saarcnet.org/saarcnetorg/dec2000.html (Ahmedabad 2000).
53

with imports from Brazil, India and Thailand.109 Huge financial losses occurred during the 2002/03 crushing season, with the blame falling on excess manpower, loss of production capacity due to backdated machinery and equipment.110
Exports
205. Until 2002 all Bangladeshi sugar production was destined for the domestic market.
Consumption 206. Bangladesh consumed 375,000 tons in 2002, slightly higher than the 335,000 tons consumed in 2001. One of the consequences of the abundance of the widespread sugar smuggling from India into Bangladesh has been the decline of the overall quality of sugar on the domestic market.111 Local consumers have in the past expressed their anger, as they were not able to get the locally produced fine quality sugar, which is driven off the market by the huge quantities of inferior smuggled sugar.
109 BBCNEWS World Edition, 'Sugar mill sweetens bitter retirement pill'. 110 The Independent, 'Sugar Mills of N region incurring losses', www.independent-bangladesh.com/news/dec/12/12122002ct.htm. 111 Ibid.
54

6. Tanzania
Centrifugal sugar production, import, export and consumption (x1000t)
0
25
50
75
100
125
150
175
200
225
1993 1994 1995 1996 1997 1998 1999 2000 2001 2002
Production Imports Exports
Consumption 1993 120 36 11 120 1994 124 25 11 139 1995 110 48 11 120 1996 100 71 13 160 1997 84 128 13 175 1998 110 129 22 200 1999 114 56 13 200 2000 130 89 17 208 2001 115 101 14 200 2002 187 82 23 165
Source: International Sugar Organization, Statistical Bulletin, October 2003 FAO STAT, Agriculture Data (for 1994)
Production
207. Tanzania has five sugar factories listed with a total processing capacity of 11,500 tonnes of cane per day. In 2002, they produced 186,538 tonnes of sugar, raw value, up by 62 per cent from 115,000 tonnes in 2001. The rise was attributed to better management of factories after the industry’s privatization. The industry is likely to see investments of $203 million over the next five years. The Sugar Development Corporation (SDC) expects output to reach 273,000 tonnes by 2004/05 and 440,000 tonnes by 2009/10. 208. Tanzania’s biggest sugar investor, South African Illovo Sugar Group, produces an average 60,000 tonnes of sugar annually at its two factories - Kilombero and Mtimbwa in the Morogoro Region, which accounts for 38 per cent of the country’s production. Both companies were state-owned before their privatization in 1998. Illovo’s most recent investment is a 200m bridge across the Great Ruaha River to improve operational efficiency between Kilombero’s two sugar factories. The company recently faced labour disputes in response to the restructuring process. 209. Tanzania’s second largest sugar factory, Tanganyika Planting Company Ltd (TPC Ltd), is located in the northern town of Moshi and employs 4,000 people. The sugar producer owns an estate of some 16,000 ha, but only 6,000 ha are used for sugar cane due to soil limitations—it is saline and contains too much water. The factory was privatised on September 2000 and bought by Sucrerie des Mascaraeignes Ltd whose main shareholders are Deep River Beau Champ (60 per cent) from Mauritius and Quartier Francais (40%) from the Reunion Island.
55
210. On April 2001 the company initiated the rehabilitation of the factory and its cane fields after receiving a $15 million loan from a Mauritian company (CIEL) and a banking consortium led by Barclays Bank. Production is expected to reach 40,000 tonnes this year and increase to 72,000 tonnes by 2006. 211. The other two factories are located in Bukoba and Dar es Salaam. Kagera Sugar Ltd. was handed over to Sugar Industries Limited in 2001. Prior to this, Kagera Saw Mills Limited and the Tanzanian government owned the factory. The change in ownership is part of the government’s economic reform program, which includes amongst others the privatisation of most of its corporations and parastatal organizations.
Imports 212. In 2002, imports amounted to 81,556 tonnes, the bulk of which was smuggled into the country. 213. Recently factories have had difficulty in selling their produce because of cheaper imported sugar. As a result, the three major sugar factories, including Kilombero, Mtibwa and TPC, were close to being shut down. Local producers were lobbying to impose a duty of $390 per tonne or to ban sugar imports altogether. Currently, sugar importers have to pay 25 per cent import-duty, 20 per cent suspended duty and 20 per cent Value Added Tax (VAT). 214. Due to irregularities in the issuance of the licenses to import sugar (the industry has been heavily implicated in corruption scandals in the past), former Minister of Industries and Trade Mr. Simba was forced to resign on November 2001. Right after this, the government announced a three-month moratorium on sugar importation to allow local producers to sell off their stocks. The government also stopped issuing licenses to sugar importers. Both moves have pushed up local sugar prices by more than 100% in recent months. 215. In addition, the Tanzania Sugar Act 2001 was passed by Parliament, which provides for a Sugar Board with wide ranging powers, where only registered cane farmers will be able to grow and sell cane, and mills will buy cane only from registered farmers. The board has no representative from traders or importing organisations such as the Confederation of Tanzania Industrialists and the Tanzania Chamber of Commerce and Industry. Hence, it is more likely to represent the interests of sugar producers at the expense of traders and importers. 216. On February 2002, the government reduced producer taxes per kilo in another attempt to help the local producers and reduce sugar prices. The Minister of Finance removed Tshs162 from every kilo of locally produced sugar. Unfortunately, this measure did not translate into lower retail prices because of a concentrated distribution network and, more importantly, because it coincided with the ban on importation of sugar, which used to supplement the local production.
Exports 217. Exports totalled 22,643112 tonnes in 2002, all of which went to the EU. Under the EBA scheme the Tanzanian quota for 2002/03 was 9,317tonnes.113 The ACP Sugar Protocol quota was 10,186114 tonnes and the imports under the Special Preferential Sugar were 2,182 tonnes.
112 International Sugar Organization, Statistical Bulletin, October 2003. 113 Sugar Traders Association of the United Kingdom, EBA sugar statistics. www.sugartraders.co.uk/ebastats.htm . 114 ACP sugar.
56

Consumption 218. Consumption stood at 164,518 tonnes in 2002, or about 4.5 kg per capita. All industrial sugar used by Tanzanian breweries, soft drink manufacturers and confectionery plants is imported.
57

7. Mozambique
Centrifugal sugar production, import, export and consumption (x1000t)
0
25
50
75
100
125
150
175
1993 1994 1995 1996 1997 1998 1999 2000 2001 2002
Production Imports Exports
Consumption 1993 20 74 0 70 1994 20 105 53 73 1995 30 55 48 60 1996 30 51 25 65 1997 42 61 59 50 1998 39 98 20 60 1999 46 56 0 70 2000 45 23 26 90 2001 60 54 37 95 2002 170 30 55 110
Source: International Sugar Organization, Statistical Bulletin, October 2003
Production 219. Over the last six years, about $300 million has been invested in rehabilitating the Mozambican sugar industry, devastated by a 16-year civil war that ended in 1992. This sector is already the country's single largest job employer, giving some 16,000 people work across the country. This year Mozambique’s newly revived sugar industry is expected to make the country self-sufficient and generate revenue from exports to Europe and the US. 220. After producing 60,000 tonnes of sugar in 2001, output jump sharply in 2003 to 170,000 tonnes, as all four renovated mills operated for a full season. The industry expects to produce 360,000 tonnes of raw and refined sugar in 2009. 221. Marromeu (Luabo and Marromeu mills) is the country’s largest sugar mill. Located near the port city of Beira, it was substantially damaged during the war and was only revived in 1998 by the majority Mauritian-owned sugar producer Companhia de Sena, which controls 75 per cent of the sugar project. The Mozambican government owns the remaining 25 per cent. 222. Companhia de Sena has invested more than $100 million since 1998 to rebuild the factory. In addition, a $12 million loan was recently received from the Development Bank of Southern Africa. The rehabilitation should allow production to reach 100,000 tons by 2003, up from 30,000 tons. The project also involves the rehabilitation of associated infrastructure and replanting of an area of 10,278 ha of sugar cane in a region northwest of Beira and next to the Zambezi river. This new area will be added to the existing 7,000 ha. This year Sena expects to refine 30 per cent of the sugar and export it to the European Union and the US. The remaining 70 per cent will be sold in northern Mozambique. The project that helped create
58
5,000 jobs is forecast to generate $43 million in turnover by 2004. The Marromeu initiative is expected to eventually cost $116 million and will serve as the anchor project for the Zambezi Valley Development Corridor. 223. The nation's second-largest sugar mill, Maragra, is located 75 km north of the capital Maputo. It has 2,200 permanent workers and employs up to a thousand seasonal workers when cane is being cut. Illovo Sugar Ltd of South Africa is the majority single shareholder of the Maragra mill as it holds 50 per cent of the shares. The public sector holds the balance. 224. Maragra’s 8,500 ha of cane — farmed by independent growers — were totally submerged when the nearby Incomati burst its banks during the floods that swept across southern and central Mozambique in February 2000. The factory, which is on an escarpment, was undamaged. The cost of repairing infrastructure was about $18.5 million, which came from Illovo. Production was partially resumed in 2001 with about 15,000 tons of sugar by the end of the milling season in October. The factory closed its doors in 1984 during the civil war. At its peak in 1972 output was 44,100 tons of raw sugar. About $45 million have been spent on rehabilitating the mill and fields since July 1997 and Illovo reported plans to invest a total of $240 million in the Maragra plantation. 225. Tongaat-Hulett Sugar Limited, a major South African sugar milling company with operations in several African countries, is the major stakeholder of the Mafambisse and Xinavane mills. After managing the Mafambisse mill for three years on behalf of the Mozambique government, Tongaat-Hulett exercised its option to acquire 75 per cent of shares in the mill and estate. Mafambisse is located 60 km from Beira and potential land under cultivation is expected to reach 10,000 ha in 2004. 226. In 1999, Tongaat-Hulett increased its stake in the Xinavane mill and estates to 49 per cent, while maintaining an option to buy a further 11 per cent from the government. Xinavane is located 130 km northwest of Maputo and has some 13,000 ha of land. 227. Government protection of the domestic market is thought to further increase Mozambique’s attractiveness to investors: imports of white sugar below $405/t incur a levy to make up the difference.115 Yet the regime is under stress: smuggling from Zimbabwe is estimated to bring in 70,000 tonnes per annum of illegal imports. The situation is made possible by the difference between the official and unofficial exchange rates, which mean that a tonne of sugar can be bought for as little as $70.116 Some success has been had in policing the importation of contraband, leading to a 79 per cent growth in sales of nationally produced sugar between 2001 and 2002. In conjunction with restrictions on legal imports of sugar, prices are reported to have stabilized.117
Imports
228. Domestic producers are struggling against competition from smugglers who import sugar from neighbouring countries, notably from Zimbabwe, where smugglers are taking advantage of the substantial fall in the Zimbabwean dollar, which makes sugar from Zimbabwe significantly cheaper than that produced locally. The government estimated the yearly trade in contraband at 77,000 tonnes. In 2002 official imports totalled 30,388 tonnes. 115 Sugar ‘Imports’ Hurt Mozambique, Malawi Here, June 26th, 2002, http://www.malawihere.com/viewnews.asp?id=365 116 FAO, 2002, p.62 117 Mozambique News Agency, AIM Reports, No. 253, May 12th, 2003, http://www.poptel.org.uk/mozambique-news/newsletter/aim253.html#story5.
59

229. In the past the IMF has been pushing to reduce the protection on sugar to no more than 20 per cent of the CIF price. However, after investors threatened to withdraw, the IMF agreed to allow Mozambique to retain protective tariffs to keep its own sugar competitively priced. 230. Mozambique enjoys an exemption from the Southern African Development Community (SADC) trade protocol on sensitive products such as sugar. This period of grace is temporary and after it is over, locally produced sugar will no longer be protected. Mozambique is committed to the SADC trade protocol, which aims to set up a free trade area in the region.
Exports 231. In 2002 total exports totalled 55,332 tonnes. Exports under the EBA agreement amounted to 8,384 tonnes. The Mozambicans also shipped 13,690 tonnes of sugar to the U.S. under a set preferential quota. 232. Mozambique hopes to increase the amount sold to Europe to 35,000 tonnes in the future. So far sugar is the only product Mozambique has been exporting under preferential access rules to the European Market.
Consumption 233. Sugar consumption in 2002 was about 110,000 tons up from 95,000 tons in 2001 (about 6 kg per capita). The largest market for sugar in Mozambique is the domestic consumer, with a soft drink company and small food firms forming a smaller part of the market.
60

8. Uganda
Centrifugal sugar production, import, export and consumption (x1000t)
0
25
50
75
100
125
150
175
200
1993 1994 1995 1996 1997 1998 1999 2000 2001 2002
Production Imports Exports
Consumption 1993 54 1 0 55 1994 48 15 0 65 1995 76 40 0 100 1996 109 6 0 100 1997 145 10 0 150 1998 111 7 0 150 1999 137 5 0 150 2000 130 28 0 155 2001 140 34 0 160 2002 160 22 0 180
Source: International Sugar Organization, Statistical Bulletin, October 2003
Production 234. Sugar refining is one of the main industries in Uganda, where more than 80 per cent of the workforce is employed in agriculture. 235. Uganda’s sugar production is shared out among three companies: the state-owned company Kinyara, the Kakira Sugar Works and Sugar Corporation of Uganda. In 2002 Uganda produced an estimated 160,000 tonnes of sugar. Even though production has constantly increased it is not enough to satisfy local demand. Ugandan companies are facing a difficult period as they experience a drop in sales because of the smuggled sugar from the Democratic Republic of Congo.118
236. The Kakira Sugar Works factory is located 80 km east of Kampala and accounts for about 50 per cent of Uganda’s sugar production. It currently has 8,000 ha119 under cultivation, and also buys sugar from small-scale farmers, or out growers, who have a further 8,000120 ha under cultivation. It is planed to expand that contribution to 11,000 ha.121 The factory has increased its annual sugar production to about 100,000 tonnes in 2004 from 60,000 tonnes in 2002. It has a labour force of 6,500 employees and 3,600 farmers.122
118 The New Vision, 'Cheap Smuggled Sugar Hurts Locally-Made Stocks' (August 2004). 119 Ms. Irene Makumbi, 'Impact of Globalisation on Forests in Uganda', (November 2002) 120 The New Vision, 'Kakira to Get a $2m Boost', (May 2004). 121 Ibid. 122 United World, 'NEPAD - Mozambique and Uganda' (July 2004).
61
237. In July 2000 the Ugandan government sold the 30 per cent stake it held in the Kakira Sugar Works Ltd. to the majority owner, the East African Holdings Ltd.123 East African Holdings Ltd is based in Bermuda and has a major stake in the Madhvani Group of Companies. The Madhvani Group manages the Kakira Sugar Works factory and plans to invest $2 million in improvements.124
238. In November 2001 the Ugandan government licensed Kakira Sugar Works to bring the Butamira forest reserve under sugar cultivation. Even though the Parliamentary Select Committee on Forestry has halted the process, a 49-year exploitation permit was issued on July 2002.125 239. Kakira Sugar is preparing to list on the Ugandan Securities Exchange.126
240. Recently, flash fires destroyed over 470 acres of sugarcane belonging to Kakira Sugar Works and out-growers’ holdings in Jinja and Mayuge districts.127
241. Kinyara Sugar Works, located in Masindi, 220 km northwest of Kampala, offers a livelihood to around 4,000 people. It is the second largest sugar company in Uganda and is managed by UK firm Booker Tate Ltd., on behalf of the Ugandan Government. It produces 50,000 tons per year and with a 38 per cent share of the Uganda’s sugar market, and along with Kikara is one of Uganda’s leading sugar producers.128 Kinyara owns 7,800 ha of farmland and receives cane from outgrowers who own a total of 3,000 ha of sugar plantations. 242. In March 2002 the government announced that Kinyara was to be privatised by the end of the year. The government has commissioned a survey of the Kinyara Sugar Works to determine its value ahead of the sale. Booker Tate Ltd is said to have expressed an interest in acquiring stakes in the corporation. 243. Instability in Uganda’s sugar market, however, caused by smuggling and cheap imports, could affect the price of Kinyara Sugar Works at privatization. Sales have been shrinking for the past year, as the market was flooded with cheap imports that made it difficult to sell local sugar. 244. Kinyara has yet to be privatized. Ministry of finance officials declared in June 2004 that the government still intends to sell the plant.129 Preference would be given to a core investor instead of being sold through a public offering on the Uganda Securities Exchange.130 In this way it is expected that the views of employees and growers will better be taken into account.131
245. The Sugar Corporation of Uganda Limited (SCOUL), based in Lugazi, is operated by the Mehta group. It employs directly and indirectly some 6,000 people. SCOUL can draw on over 8,500 hectares of cane fields and has initiated a project for over 400 committed growers
123 International Union of Food, Agricultural, Hotel, Restaurant, Catering, Tobacco, and Allied Worker's Association (IUF), Information and Analysis for Unions in the Sugar Sector, no. 3, July 2000. 124 The New Vision, 'Kakira to get a $2m boost', (May 2004). 125 Ms. Irene Makumbi, 'Impact of Globalisation on Forests in Uganda', (November 2002) 126 The Monitor, 'Kakira 'Upsets' Kinyara Sale Plans MPs resist 'Core Investor' Bid for Kinyara' (November 2002). 127 The New Vision, 'Fire Destroys Kakira Sugarcane' (February 2003). 128 The Monitor, 'Kakira 'Upsets' Kinyara Sale Plans MPs Resist 'Core Investor' Bid for Kinyara' (November 2002). 129 Minister of Finance, ‘Budget Speech’ (June 2004). 130 The New Vision, 'Kinyara Sale Gets Delayed' (February 2003). 131 The Weekly Observer, ‘Kinyara Sugar Sale Again on Hold’ (June 2004).
62
to be supported by the company. The factory’s sugar production in 2001 stood at 25,000 tonnes. In 2002 it increased its output by 33 per cent to 33,000 tonnes.132
Imports
246. In 2002 approximately 22,000 tonnes, raw value, were legally imported. Large amounts are also smuggled into the country from the Democratic Republic of Congo. SCOUL recently asked for Government intervention to oblige sugar importers to pay a higher duty. SCOUL has said that Uganda has the capacity to produce all the sugar needed in the country and has surplus quantities to export, but needs protection from cheap smuggled sugar. 247. In June 2002 The Ugandan government increased import duty on sugar from 10 per cent to 15 per cent in a bid to protect domestic production.133
Exports
248. For the period 1994-2002 no exports were registered134 and it is doubtful that Uganda could benefit from EBA access: the local prices are high because of the tariff protection and the country is land-locked.
Consumption 249. In 2002 Uganda consumed 180,000 tons of sugar, which comes to 7.5 kg per capita.
132 The New Vision, 'Sugar Corporation of Uganda Limited Output Reaches 33.000 Tonnes in 2002' (January 2003). 133 Morrissey and al., ‘ Uganda trade and poverty project’ (May 2003). 134 International Sugar Organization, Statistical Bulletin, October 2003.
63

9. Nepal
Centrifugal sugar production, import, export and consumption (x1000t)
0
25
50
75
100
125
150
1993 1994 1995 1996 1997 1998 1999 2000 2001 2002
Production Imports Exports
Consumption 1993 25 15 0 41 1994 40 14 0 50 1995 60 17 0 75 1996 80 0 0 80 1997 90 5 0 95 1998 120 42 0 130 1999 150 15 0 140 2000 110 1 0 115 2001 65 15 0 120 2002 110 0 0 125
Source: International Sugar Organization, Statistical Bulletin, October 2003
Production 250. There are eleven sugar mills in Nepal with a total production capacity of 200,000 tonnes a year. Domestic production in the calendar year 2002 was only 110,000 tonnes with output hit after a poor sugarcane crop in 2001, due of unfavourable weather. 251. The lack of sufficient sugarcane forces domestic sugar mills to produce below their normal capacity. Although sugarcane is cultivated in 49 districts of the country, only 20 districts of the Tarai region produce quality sugarcane that can be used in producing sugar. The low productivity of Nepali sugarcane (half of that of India) is one of the major reasons for the high price of sugarcane in Nepal. 252. The lack of effective contract law between the sugarcane producers and sugar mills has also discouraged sugarcane growers. Recent declines in the international price of sugar have endangered domestic sugar industries, highlighting the need to adopt modern technology and increase productivity by lowering the cost of production. The government regulates the distribution of all sensitive goods including sugar. 253. Sri Ram Sugar Mills, owned by Golchha Organization, is the largest sugar mill in Nepal with capacity to crush 2,500 MT of sugar cane per day. The mill, spread over 134 acres, is located in the sugarcane rich area, Rautahat. Sri Ram Sugar Mills recently entered into an agreement with ‘Delta-T’, an American Company, to start a project to produce ethanol in Nepal.
64

254. Eastern Sugar Mills Limited, a joint venture with the Golchha Organization, started production in 1998 and has the capacity to crush 2,500 tonnes of sugarcane per day. The mill is situated in Sunsari and is the largest in the eastern region. 255. Birganj Sugar Factory Ltd is situated in Birgunj, Narayani Zone. It has a production capacity of 1,500 tonnes per day and employs over one thousand workers. 256. Other sugar industries include Agro Nepal Ltd, Laxmi Lakhan Khandsad Mill Ltd, Lumbini Sugar Mills Ltd, Mahendra Sugar & General Industries, Morang Sugar Mills Ltd, Nepal Sugar Mills and Vashuling DMS Sugar Mills Ltd.
Imports 257. In 2002 Nepal imported 253 tonnes of raw sugar.135
Exports
258. In the years 2000, 2001 and 2002 Nepal did not export any sugar136 but in 2002/03 obtained and used an EBA quota of 8,970 tonnes. Nepal is the last country to join the EBA schema.
Consumption 259. Domestic consumption is estimated at 125,000 tonnes per year (2002)137, corresponding to 5 kg per capita.
135 International Sugar Organisation, Statistical Bulletin, October 2003 136 Ibid. 137 Ibid.
65

10. Myanmar
Centrifugal sugar production, import, export and consumption (x1000t)
0
20
40
60
80
100
120
140
1993 1994 1995 1996 1997 1998 1999 2000 2001 2002
Production Imports Exports Consumption1993 47 9 15 471994 48 6 15 501995 42 5 0 501996 46 22 0 551997 55 4 14 501998 51 1 2 311999 43 6 2 692000 75 52 3 852001 125 0 33 902002 100 0 12 100
Source: International Sugar Organization, Statistical Bulletin, October 2003
Production 260. Myanmar has, with 120,000 ha, a fairly large production of sugar cane. In 2002 total sugar output was estimated at 100,000 tonnes. Most of it is used for the production of non-refined sugars. In August 2002 there were 19 sugar factories, run by a state-owned company (the Myanmar Foodstuff Industries).138 Eight sugar mills were built in cooperation with four Chinese companies, Sutech Industries Co. of Thailand and Myanmar Sugarcane Enterprise. Myanmar grows sugarcane mainly in five divisions and states: Bago, Mandalay, Magway, Sagaing and Shan.139
261. In January 2001, the Ministry of Agriculture and Irrigation began construction of a white sugar factory with a capacity of about 70,000 tonnes. Given Myanmar’s current surplus sugar production this will further increase exports to regional and world markets. 262. In 2001/02 Myanmar cultivated 65,509 ha of sugarcane to produce 7.2 million tonnes of cane.140
Imports
263. In 2002 no imports were registered but in 2000, 51,583 tonnes of sugar were imported, a large rise from 1999.141
138 Xinhuanet, 'Myanmar's sugar production up in fiscal 2001-02' (August 2002). 139 Xinhuanet, 'Myanmar's sugar exports to rise sharply' (January 2002). 140 Xinhuanet, 'Myanmar's sugar production up in fiscal 2001-2002' (August 2002). 141 International Sugar Organization, Statistical Bulletin, October 2003.
66

Exports 264. In 2002 Myanmar exported 11,822 tonnes of sugar, mainly to Indonesia. Even though tariff preferences have temporally been withdrawn for Myanmar it still exported 2,407 tonnes to the EU in 2002.
Consumption 265. In 2002 Myanmar consumed around 100,000 tonnes of sugar.142 This corresponds to a per capita consumption of 2.4 kg.
142 Ibid.
67

11. Senegal
Centrifugal sugar production, import, export and consumption (x1000t)
0
25
50
75
100
125
150
175
200
1993 1994 1995 1996 1997 1998 1999 2000 2001 2002
Production Imports Exports
Consumption 1993 90 23 0 135 1994 95 50 0 145 1995 81 109 0 165 1996 85 83 0 175 1997 91 99 0 180 1998 90 41 0 170 1999 95 60 0 170 2000 90 69 0 165 2001 95 63 0 170 2002 95 82 0 175
Source: International Sugar Organization, Statistical Bulletin, October 2003
Production 266. There is only one sugar mill in Senegal, located in the Richard-Toll region. The CSS (Compagnie Sucrière du Sénégal) belongs to the French group Mimran. It is the second employer in the country, after the state, with 3000 permanent staff and an additional 2000 during harvest time. 95,000 tonnes of sugar was produced in 2002 from 7,500 hectares of sugarcane plantations.
Imports 267. In 2002 Senegal imported 82,390 tonnes of sugar.143
Exports 268. No exports were registered in 2001 and 2002.
Consumption 269. In 2002, 175,000 tons of sugar was consumed in Senegal, or 17 kg per capita.
143 International Sugar Organization, Statistical Bulletin, October 2003.
68

12. Democratic Republic Congo
Centrifugal sugar production, import, export and consumption (x1000t)
0
20
40
60
80
100
120
1993 1994 1995 1996 1997 1998 1999 2000 2001 2002
Production Imports Exports
Consumption 1993 85 34 0 105 1994 85 1 0 105 1995 80 32 0 110 1996 50 59 0 110 1997 86 7 0 90 1998 51 25 0 80 1999 65 11 0 75 2000 75 8 0 75 2001 60 11 0 75 2002 65 6 0 70
Source: International Sugar Organization, Statistical Bulletin, October 2003
Production 270. The civil war has meant that only one of the two factories is currently in operation in the country. Kiliba, situated in the east of the country, was ruined, and the other, Kwilu-Ngongo, is situated in the west of the country. The state maintains a 40 per cent share in the factory, while the rest belongs to the Belgian group Finasucre. The company has 3,000 permanent workers and hires a 1,000 more during the harvest; this makes it one of the country's largest employers. 600-650 tonnes of sugarcane are produced every year from a 10,000 ha of sugarcane plantations. The factory has a capacity of 5,000 tonnes sugarcane crushing per day. Production in 2002 totalled 65,000 tonnes.
Imports 271. In 2002 the Democratic Republic of Congo imported 6,207 tonnes of sugar.144
Exports
272. All sugar produced is intended for the local market but part is smuggled into Mozambique.
Consumption 273. Consumption in 2002 was estimated at 65,000 tonnes, which is equivalent to a per capita consumption of 1.3 kg.
144 International Sugar Organization, Statistical Bulletin, October 2003.
69

13. Burkina Faso
Centrifugal sugar production, import, export and consumption (x1000t)
0
10
20
30
40
50
60
70
1993 1994 1995 1996 1997 1998 1999 2000 2001 2002
Production Imports Exports
Consumption 1993 32 5 0 35 1994 33 1 0 35 1995 32 4 1 35 1996 33 7 0 35 1997 34 9 0 42 1998 30 23 0 50 1999 30 13 0 45 2000 30 12 0 50 2001 35 21 0 55 2002 40 37 8 60
Source: International Sugar Organization, Statistical Bulletin, October 2003
Production 274. There is only one mill in Burkina Faso: the Sosuco mill. It is a private company managed by Groupe Vilgrain, a French agro-industrial conglomerate. 4,000 ha are dedicated to the sugarcane growing. Production in 2002 totalled 40,000 tonnes.
Imports 275. Production meets just over half of domestic demand and so in 2002 imports of sugar amounted to 36,875 tonnes.
Exports 276. High local market prices maintained by tariff protection and the long distance to a suitable port suggested that Burkina Faso was unlikely to benefit from EBA145 The country has, however, been exporting to the EU since the introduction of the EBA initiative in 2001. EBA sugar exports amounted to 7,237 tonnes in 2002 and constituted the overwhelming majority of total exports.
Consumption 277. Domestic consumption was estimated at 60,000 tonnes in 2002, representing an average of less than 5kg per capita.
145ASSUC, EBA-An impact assessment for the Sugar Sector, January 2001.
70

14. Madagascar
Centrifugal sugar production, import, export and consumption (x1000t)
0
20
40
60
80
100
120
1993 1994 1995 1996 1997 1998 1999 2000 2001 2002
Production Imports Exports
Consumption 1993 104 1 12 85 1994 83 43 25 90 1995 94 21 15 78 1996 95 23 1 90 1997 96 5 7 95 1998 95 25 9 95 1999 85 8 24 95 2000 70 8 25 98 2001 50 58 22 97 2002 32 76 1 104
Source: International Sugar Organization, Statistical Bulletin, October 2003
Production 278. Four factories account for roughly 90 per cent of Madagascar’s sugar production: Ambilobe, Brickaville, Namakia and Nosy Be.146 Ambilobe is located 160 km south of Antsiranana and has a total of 3,340 ha of cane fields, of which 2,424 ha were cultivated in 1999.147 Ambilobe’s sugar refinery has an annual capacity of 60,000 tonnes. Brickaville is located 250 km west of Tananarive and has a total of 2,104 ha of cane fields, of which 486 ha are presently under cultivation.148 The factory has an annual capacity of 15,000 tonnes. Namakia is situated 70 km west of Katsepy and has total of 2,752 ha, of which 964 ha are currently cultivated.149 The Namakia factory has an annual capacity of 27,000 tonnes. The Namkia factory is specialized in the production of white sugar. The Nosy Be sugar factory is located on the volcanic island of Nosy Be, 100 km southwest of Ambilobe. The factory has 1,416 ha of land of which 850 ha are currently cultivated.150 The Nosy Be factory has an annual capacity of 15,000 tonnes. The second producing group on Madagascar, SuCoMa, owns a fifth factory. 279. All factories were built by Saint Louis Sucre, a French sugar producer, in the 1950s and 1960s. Recently, the mills have been suffering from under-investment and a lack of cane.151
146 SIRAMA Sucréries de Madagascar, http://takelaka.dts.mg/sirama/index.html. 147 SIRAMA Sucréries de Madagascar, Ambilobe, http://takelaka.dts.mg/sirama/page2.html. 148 SIRAMA Sucréries de Madagascar, Brickaville, http://takelaka.dts.mg/sirama/page5.html. 149 SIRAMA Sucréries de Madagascar, Namakia, http://takelaka.dts.mg/sirama/page3.html. 150 SIRAMA Sucréries de Madagascar, Nosy Be, http://takelaka.dts.mg/sirama/page4.html. 151 Association Des Organisations Professionnelles du Commerce Des Sucres Pour les Pays de l'Union Européenne (ASSUC), EBA- An impact assessment for the sugar sector (2001) 4.
71

280. In 2002 Madagascar produced a total of 32,253 tonnes sugar.152
Imports
281. In 2002 Madagascar imported 76,086 tonnes of sugar, all of which was supplied by South Africa.153
Exports
282. In 2002 Madagascar exported 1,481 tonnes of sugar154, all of it white sugar sent to the EU. Madagascar has preferential access to the EU through the ACP Sugar Protocol but the amount of exported sugar does not reach the 10,760 tonnes quota available. Madagascar also had an import quota through Special Preferential Sugar Schema until 2001, the year where the EBA schema started. Madagascar has yet to join.
Consumption 283. Sugar consumption was put at 104,444 tonnes in 2002, or 4.8 kg/capita, up from 97,500 tonnes in 2000 and 2001.
152 International Sugar Organization, Statistical Bulletin, October 2003. 153 Ibid. 154 Ibid.
72