united nations educational, - unescounesdoc.unesco.org/images/0012/001203/120311e.pdfhundred and...
TRANSCRIPT

Hundred and sixtieth Session
160 EX/28PARIS, 10 August 2000Original: French/English
Item 7.5 of the provisional agenda
GEOGRAPHICAL DISTRIBUTION OF THE STAFF
SUMMARY
In accordance with 30 C/Resolution 72 (November 1999) and157 EX/Decision 8.6 (October 1999), the Director-General submitshis annual report on trends in the geographical distribution of theSecretariat staff at 1 July 2000.
Decision required: paragraph 33.
United Nations Educational,Scientific and Cultural Organization Executive Board ex

160 EX/28
I. INTRODUCTION
1. This document is submitted in pursuance of 30 C/Resolution 72 and157 EX/Decision 8.6 inviting the Director-General to continue to report to the ExecutiveBoard once a year on the situation regarding the geographical distribution of staff members(occupying posts subject to that principle) and on the medium-term objectives that should beimplemented in order to reach a better geographical balance.
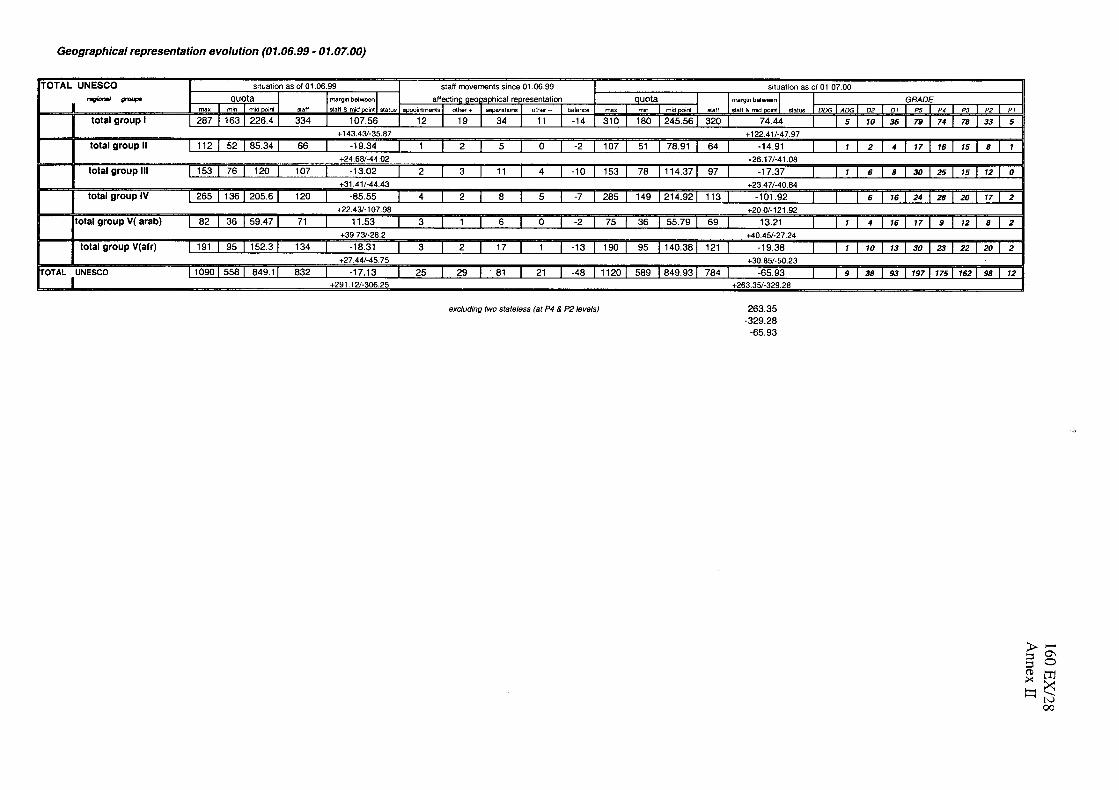
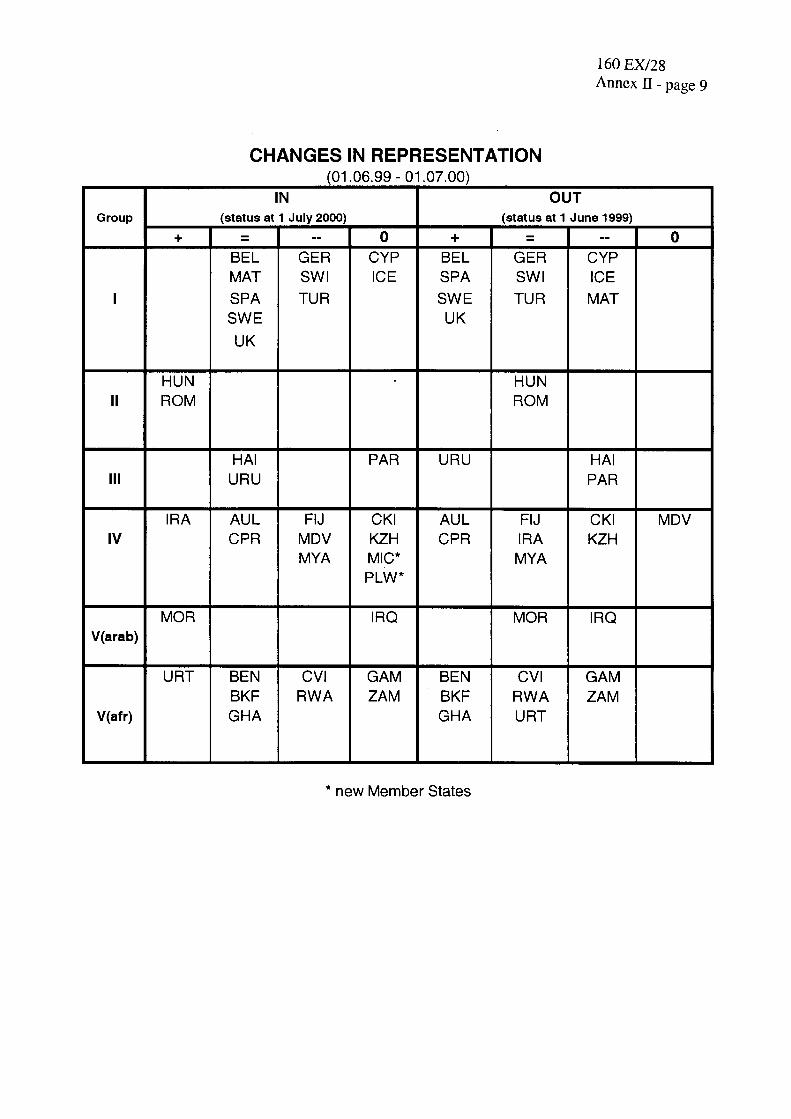
2. To assist in understanding this document, Annex I contains a glossary of technical termsand a table listing the most relevant decisions on geographical distribution adopted by theExecutive Board since its 56th session. Annex II contains tables, numbered from 1 to 10. Thefirst table of the Annex shows changes in geographical representation by regional groupbetween 1 June 1999 and 1 July 2000. The tables on pages 2 to 7 show changes ingeographical representation for each country. The table on page 8 shows all movements (since1 June 1999) affecting the situation as to geographical representation. The list of countrieswhose representation level has changed is given on page 9. This information is broken downby regional group, status of representation (+, =, -, 0)1 and by the direction of the change(entrance to or exit from the geographical category). The table on page 10 of Annex II showsthe level of over- or under-representation of over-represented and under-represented countriesas compared with the upper and lower limits of their respective quotas. Annex III shows, byregion, the number of external candidatures received during the period covered by this report.
II. TRENDS IN THE GEOGRAPHICAL DISTRIBUTION OF STAFF SINCE1 JUNE 1999 (ANNUAL REPORT)
A. General trends
3. Since 1 June 1999, the Organization has gained two new Member States, the Republicof Palau and the Federated States of Micronesia, bringing their number to 188. Table 1 belowgives a retrospective view of trends in the overall situation regarding geographical distributionsince 1 July 1997. It should be noted that in July 1997 there were 186 Member States,145 (78%) of which were represented; in July 1998, with the same number of Member States,151 (81.2%) were represented. In June 1999 the number of Member States remainedunchanged (186) and 149 (80.1%) of them were represented. As at 1 July 2000, of the188 Member States of UNESCO, only 142 (75.5%) were represented.
1. +: over-represented; =: within range; -: under-represented; 0: unrepresented.

160 EX/28 - page 2
Table 1
Level of representation 1 July 1997 1 June 1998 1 June 1999 1 July 2000 Variationsince 1 June
1999
Above range (+) 25 (13.4%) 28 (15.1%) 34 (18.3%) 29 (15.4%) -5
Within range (=) 80 (43.0%) 82 (44.1%) 69 (37.1%) 69 (36.7%) 0
Below range (-) 40 (21.5%) 41 (22.0%) 46 (24.7%) 44 (23.4%) -2
Total represented 145 (78.0%) 151 (81.2%) 149 (80.1%) 142 (75.5%) -7
Unrepresented (0) 41 (22.0%) 35 (18.8%) 37 (19.9%) 46 (24.5%) +9
Total Member States 186 (100%) 186 (100%) 186 (100%) 188 (100%) +2
4. Closer examination of the situation over the last three years shows that, after a relativeimprovement in 1997, 1998 and 1999, there has been some slippage this year. Indeed, thenumber of unrepresented countries has risen from 41 three years ago to 46. Over the sameperiod, the number of countries within range has dropped (69 in July 2000 as against 82 twoyears ago and 80 three years ago). In other words, the number of Member States representedhas fallen (142 as against 145 three years ago), and there are now greater numbers of over-and under-represented Member States (respectively 29 and 44 as against 25 and 40 three yearsago). This trend may be explained on the one hand by the fall in recruitment (due to budgetcuts) and, on the other, by a lack of applications from under-represented Member Stateswhilst there are always a large number of applications from Member States which are withinrange or over-represented.
5. It is also worth noting that only five changes of representation category (Germany /-/instead of /=/; Spain /=/ instead of /+/; Hungary, Morocco and the Philippines /+/ insteadof /=/) have occurred following the change in the upper and lower limits of the quotas ofMember States on 1 January 2000 (change in the scale of contributions to the regular budget,on the one hand, and in the rate of the contribution factor and membership factor, on theother).
6. The balance of “positive” movements (that is to say entries into the geographicalcategory: appointments, transfers and promotions from the General Service category to theProfessional category) against “negative” ones (that is to say departures from the geographicalcategory) during the three periods is as follows:
Table 2
1 July 1997-1 June 1998(155 EX/29)
2 June 1998-1 June 1999(157 EX/25)
2 June 1999-1 July 2000(Present report)
Entries 97 76 54
Departures 51 54 102
Balance +46 +22 -48

160 EX/28 - page 3
7. It may be deduced from the table that the overall balance for the most recent period(1 June 1999-1 July 2000) is relatively unfavourable, with 54 positive movements(25 appointments and 29 other entries into the geographical category) as against 102 negativemovements (81 separations and 21 other movements out of the geographical category), givinga difference of -48 in terms of individuals. Looking closer at the breakdown of the movementsof staff members affecting the situation as to geographical representation (see the table onpage 8, Annex II), it may be seen that most of the movements concerned over-represented orwithin-range Member States (26 and 19 positive movements respectively out of a total of 54,that is 83%). Although that result is an improvement on the previous period (30 and42 positive movements out of a total of 75, that is 95%), it is not entirely satisfactory. Thefigures may be explained by, among other things, the suspension of recruitment under theYoung Professionals Programme,2 due to budgetary restrictions.
8. Clearly, any progress towards more equitable geographical distribution depends on theneeds of programme execution and on a sufficient and continuous flow of applications fromunrepresented and under-represented Member States. However, the significant reduction inposts and staff over the last period and the decision to apply a zero nominal growth scenario,coupled with a 3% lapse factor, will make it even more difficult to rectify the geographicalbalance in the short term.3
B. Over-represented countries
9. The number of over-represented Member States has fallen by five (from 34 to 29) since1 June 1999. During the period under consideration, Hungary, Romania, Islamic Republic ofIran, Morocco and United Republic of Tanzania have entered this category, while Belgium,Spain, Sweden, United Kingdom, Uruguay, Australia, China, Benin, Burkina Faso and Ghanahave moved to the category of within-range countries (see the table on page 9 of Annex II).
10. It should be noted that 20 of the 29 over-represented Member States are over-represented by no more than four units: 9 by one unit and 11 others by two to four units.These 20 Member States account for only 35 units beyond the upper limit of their respectivequotas. However, the other 9 over-represented countries account for 133 units over and abovetheir ceilings.
11. In June 1999, the excess in relation to upper limit of the respective quotas of11 Member States (whose over-representation included at least five occupied posts) came to149 occupied posts (out of a total of 188 posts and 34 over-represented Member States). Thefollowing year, in July 2000, the situation as gauged by the same criteria had improved: nineStates had 133 occupied posts “too many” out of a total of 168 posts and 29 over-representedMember States (see the table on page 10 of Annex II).
C. Within-range countries
12. The number of countries within range has not changed since June 1999 (69 MemberStates). However, the change between the two dates was marked by the following movements:
2 It should be noted that in June 2000 the Director-General approved the appointment of 11 YoungProfessionals (six from unrepresented countries and five from under-represented countries) which shouldreflect favourably in the geographical distribution statistics that will appear in the next report.
3 During the period in question, only 82 geographical posts were created, as opposed to 105 posts abolished(a net reduction of 23 posts).

160 EX/28 - page 4
on the one hand, Malta and Haiti, hitherto under-represented, and (as stated above)Belgium, Spain, Sweden, United Kingdom, Uruguay, Australia, China, Benin, BurkinaFaso and Ghana, previously over-represented, entered this category;
furthermore, 12 countries previously in this category are now either over-represented(Hungary, Romania, Islamic Republic of Iran, Morocco and United Republic ofTanzania), or under-represented (Germany, Switzerland, Turkey, Fiji, Myanmar, CapeVerde and Rwanda).
13. It should be noted that 29 of the Member States within range are at the lower limit oftheir respective quotas and only 11 are at the upper limit.
D. Under-represented countries
14. The number of Member States below the lower limit of their quota has fallen from 46 to44 since 1 June 1999. This is the result of various movements during the period concerned.One previously unrepresented Member State (Maldives) and seven previously within-rangeMember States (Germany, Switzerland, Turkey, Fiji, Myanmar, Cape Verde and Rwanda) arenow under-represented. Among the 44 Member States under-represented as at 1 July 2000,40 fall only one unit below range, three fall between two and four units below, and just onefalls 27 units below (see the table on page 10 of Annex II).
E. Unrepresented countries
15. In this category there are 46 Member States. As is apparent from the precedingparagraphs, a single country entered the category of under-represented countries (Maldives)following the appointment of one of its nationals. There were, however, 10 movements in theopposite direction: the arrival in the Organization of two new Member States (the Republic ofPalau and the Federated States of Micronesia), the taking of leave without pay by two staffmembers (Cook Islands and Kazakhstan) and six separations (Cyprus, Iceland, Paraguay, Iraq,Gambia and Zambia).
F. Regional groups
16. Table 3 below shows the changes in Member States’ situations from 1 June 1999 to1 July 2000, broken down by status of representation and regional group:
Table 3
Groups* Above range (+) Within range (=) Below range (-) Unrepresented (0) Total
01.06.99 01.07.00 01.06.99 01.07.00 01.06.99 01.07.00 01.06.99 01.07.00 01.06.99 01.07.00
Group I 7 3 10 12 8 8 1 3 26 26
Group II 1 3 11 9 4 4 8 8 24 24
Group III 7 6 11 13 10 8 5 6 33 33
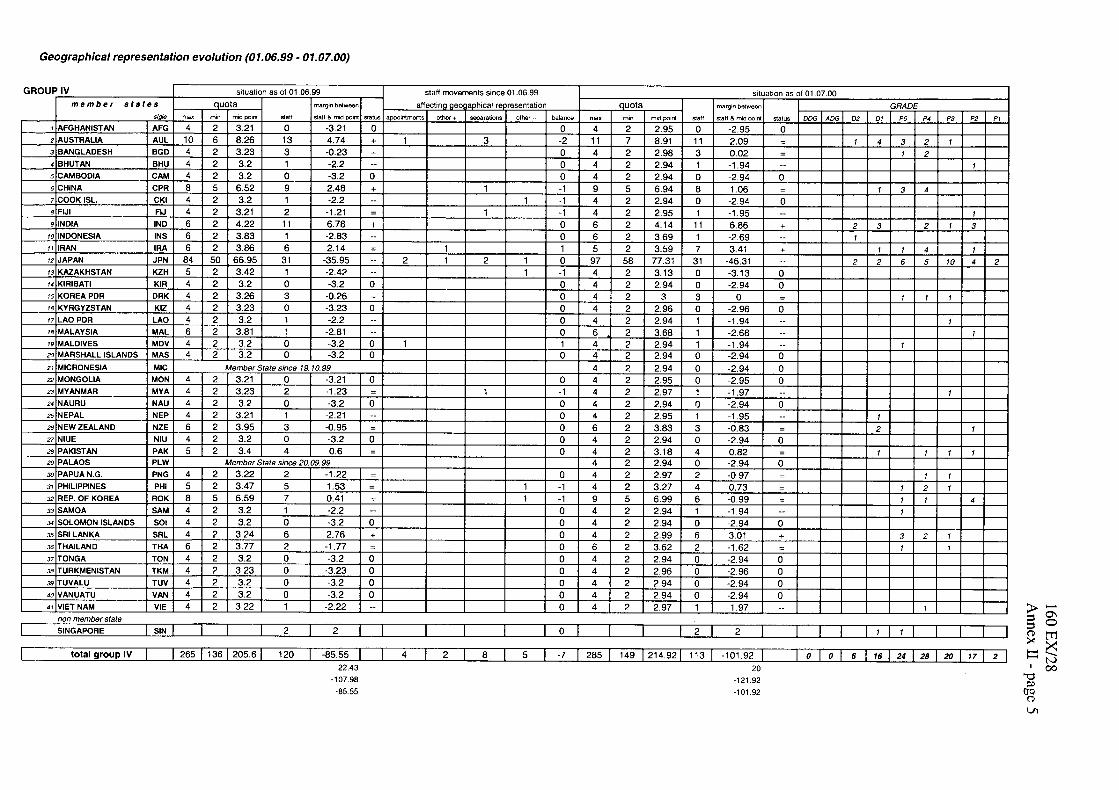
Group IV 4 3 11 10 10 11 14 17 39 41
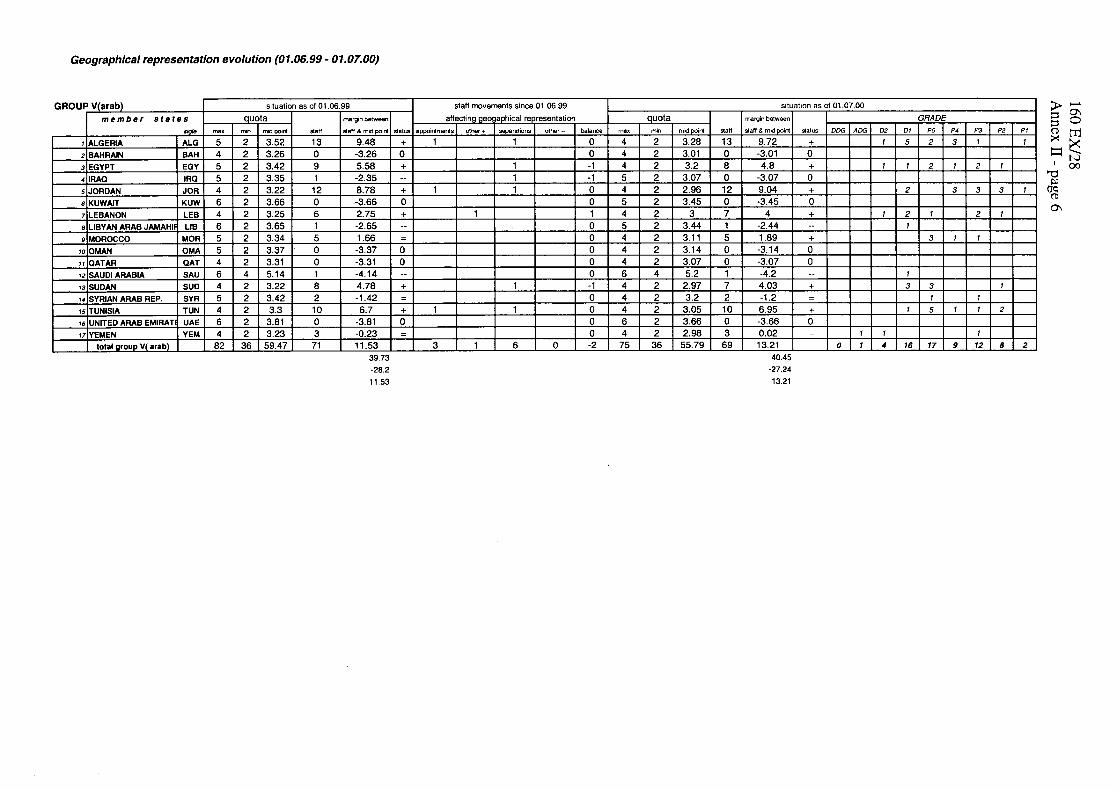
Group V(Ar) 6 7 3 2 3 2 5 6 17 17
Group V (Af) 9 7 23 23 11 11 4 6 47 47
Total 34 29 69 69 46 44 37 46 186 188
* Electoral groups: I - Western Europe and North America; II - Eastern Europe; III - Latin America and the Caribbean;IV - Asia and the Pacific; V(Ar) - Arab States; V(Af) - Africa.

160 EX/28 - page 5
17. It should be noted that the presentation of the situation by regional group, which is theusual practice in the report by the Director-General on geographical distribution, in no wayimplies any official recognition of regional quotas, which remains purely unofficial.4 Theprinciple of individual quotas for each Member State is the sole official criterion of theOrganization. In this annual report, this breakdown is solely for statistical purposes.
18. Table 4 below summarizes the trends in the number of staff occupying posts subject togeographical distribution between 1 June 1999 and 1 July 2000 within the different regionalgroups:
Table 4
1 June 1999 1 July 2000 Variation
Group I 334** 320* -14
Group II 66 64 -2
Group III 107 97 -10
Group IV 120*** 113*** -7
Group V(Ar) 71 69 -2
Group V(Af) 134 121 -13
Total 832 784 -48
* Including 30 United States nationals.** Including 32 United States nationals.*** Including 2 Singapore nationals.
19. The changes are the result of the combined effect of several different events havingeither a direct, immediate impact on geographical distribution (appointments, separations andtransfers) or an indirect, delayed effect (changes in the number of Member States or in theassessment of contributions, etc.). After bringing all these factors up to date, the situation withregard to geographical representation appears as shown in Annex II, pages 1 to 7, where thechanges in the geographical representation of each Member State may be seen, both within itsregional group and in relation to the Member States as a whole.
20. The table in Annex III gives the number of applications received during the periodunder consideration for posts open to recruitment, broken down by regional group and statusof geographical representation at the beginning of the period (1 June 1999). These statisticsshow that there has been no significant change in the average number of applications perunrepresented or under-represented Member State: respectively two and five applications asagainst two and four for the preceding period. On the other hand, the average number ofapplications per over-represented Member State has increased from 36 to 39.
4 Some agencies of the United Nations common system do not apply national quotas, but only use regionalquotas. For the most part, these are agencies without enough geographical posts to ensure that nationalquotas can be met.

160 EX/28 - page 6
III. CONCLUSIONS
21. Geographical distribution within the Secretariat, which is cyclic in nature, has entered aphase of relative regression. In order to improve the situation, the Secretariat proposes, whilstobserving the criteria of integrity, efficiency and technical competence for staff recruitmentstipulated in Article VI.4 of the Constitution, to apply a rigorous policy guided by thefollowing basic principles:
(a) maintenance of a margin for external recruitment, so as to allow the appointmentof nationals of unrepresented or under-represented countries whenever possible;
(b) maintenance, and, if possible, strengthening of the Young ProfessionalsProgramme for nationals of unrepresented or seriously under-representedcountries;
(c) exclusion, as far as possible, of the appointment of outside candidates from over-represented countries, or countries which are likely to become so, to posts subjectto the principle of geographical distribution.
22. In addition to the above list of basic principles, Member States should work togetherwith the Secretariat by submitting candidates who match the profiles for vacant posts andmeet the requirements arising from the multidisciplinary nature of the Organization’s activity.
23. Given the levels of non-representation, under-representation and over-representation,together with a scenario of budgetary restrictions, equitable geographical distribution mayonly be re-established by stages over several biennia. The concrete measures envisagedconsist in: (a) sending fresh recruitment missions to unrepresented and under-representedcountries;5 (b) building awareness among the National Commissions of the importance oftheir assistance in widely publicizing vacancy announcements; and (c) identifying otherpotential sources of recruitment.
IV. CRITERIA FOR GEOGRAPHICAL POSTS
24. The question of the criteria for determining which posts should and which should not besubject to geographical distribution (cf. 30 C/Resolution 72, II, para. 6; and157 EX/Decision 8.6, para. 8), was already raised in documents 157 EX/25 and 30 C/43.However, the governing bodies had to focus on other priorities and considered it appropriateto postpone examination of the issue to a later date.
25. Since the criteria are inseparably linked to the principles governing the method ofcalculating the quotas assigned to the Member States, it is worth recalling that these principleshave arisen from a long process marked by many decisions and resolutions adopted by thegoverning bodies. The key points of the process, the formula for calculating the quotas andthe glossary of technical terms are set out in Annex I. Basically, the procedures and methodsfor calculating the quotas for the distribution of geographical posts among the Member Statesrest on three concepts: the base figure, the desirable mid-point and the applicable range. Thecriteria for determining the geographic or non-geographic status of a post stem from theconcept of the base figure.
5 Two missions were sent by the Bureau of Personnel to seriously under-represented countries, inDecember 1997 and in the second half of 1998.

160 EX/28 - page 7
26. The base figure - as explained in the glossary of technical terms in Annex I - is a fixednumber of geographical posts used as the basis for calculating the quotas.6 This number mustbe as close as possible to the number of posts existing within the administration. The basefigure covers all established posts in the Professional category and the Principal Officer andDirector category (including Assistant Directors-General) financed from the regular budget ofthe Organization. The only exception traditionally made to this rule concerns the “language”posts (interpreters, translators and revisers). On the other hand, posts regarded as “semi-linguistic” (drafting and editorial staff) have, since 1984, been counted as posts subject togeographical distribution.7
27. Briefly, it may be stated that the definition of the status (geographical/non-geographical)of a post is based on three main considerations:
the duration of the post (established posts) - according to the definition of theUNESCO Manual, established posts are posts created at Headquarters and permanentunits away from Headquarters for a duration of at least one year (as opposed totemporary posts, the duration of which does not exceed 11 months);
its source of funding - this funding must consist of contributions provided by allthe Member States with a view to the execution of the programmes voted by theGeneral Conference. Only the regular budget (regular programme) meets theseconditions;
the nature of the functions - they must be such that they may be performed bycompetent specialists who may be nationals of any Member State whatsoever (asopposed to the linguistic functions, which can only be properly performed byincumbents whose mother tongue is one of the Organization’s working languages).
28. To come back to the question of the interdependence of the factors that influence thenorms of geographical representation, it should be noted that the room for manoeuvre isrelatively limited, since the applicable range of posts available for each Member Statedepends on the mid-point of its quota, which is directly related to the number of MemberStates, the number of posts subject to geographical distribution (the base figure) and theirassessed contributions to the budget. Given that the number of Member States and theirassessed contributions are factors that cannot be easily and/or arbitrarily altered, the onlypossibility would be an increase in the base figure used for calculating geographicaldistribution.
29. As things now stand, all the possible “reserves” of posts financed under the regularprogramme are exhausted. Indeed, it is difficult to imagine a situation in which the languageposts or temporary posts, which escape geographical distribution, could be subject to thissystem. In addition, the terms and conditions of the system of extrabudgetary funding arehardly compatible with geographical distribution.
6 In accordance with the above-mentioned norms and in pursuance of 25 C/Resolution 40, the base figurefor posts subject to geographical distribution was set at 850 posts, with effect from 1 January 1990. Thehistory of UNESCO has been marked by frequent alterations in the base figure (initially from 400 to1,100 and subsequently from 1,100 to 850).
7 They also include a very small number of “technical” posts (maintenance and operation of the buildingsand certain installations).
160 EX/28 - page 8
30. It is worth recalling that the idea of subjecting non-geographical posts8 to the system ofgeographical distribution is not new. One of the first attempts of this kind goes back to the17th session of the General Conference and the 92nd session of the Executive Board. Afterexamining the question, the governing bodies concluded that there were no grounds forincluding posts requiring special linguistic proficiency or posts financed from extrabudgetaryresources within the system of geographical distribution.
31. Clearly, moving a number of “semi-linguistic” posts (some 50 in all) into the non-geographic category would be at odds with the current approach. In fact, even without takinginto account the fact that these posts cover, to varying degrees, administrative functions (suchas those of the heads of translation sections) and programme management functions (posts ofeditors in the sectors, drafters, and OPI and UPO producers), such a measure would not becompatible either with an increase in the base figure to give as many posts as possible to eachMember State.
32. The two main considerations that have prevailed each time are the following:
some of these posts are funded from voluntary contributions not paid by all MemberStates;
if these posts became geographical posts it would follow logically that the quotasassigned to the Member States would have to be changed so as to reflect theircontributions to these extrabudgetary funds, which would result in an inordinateincrease in the levels of representation of some States.
33. The Executive Board may wish, in the light of the considerations set out in thisdocument, to adopt the following decision:
The Executive Board,
1. Recalling 30 C/Resolution 72 and 157 EX/Decision 8.6,
2. Having considered document 160 EX/28 and, in particular, the informationrelating to the criteria for geographical posts,
3. Takes note of the information contained in the document;
4. Confirms the need to strengthen the cooperation of the Member States that fallbelow the ideal levels of representation in order to ensure a sufficient number ofapplications to meet the Organization’s needs;
5. Invites the Director-General to apply the principles set out in document160 EX/28, paragraphs 21-23, with a view to improving the geographicaldistribution of the staff;
6. Invites the Director-General to submit to it at its 162nd session a report on thesituation concerning the geographical distribution of the staff.
8 As at 1 July 2000, the Secretariat had 262 staff members in posts not subject to the principle ofgeographical distribution: 97 under the regular programme, 34 under funds-in-trust (seven funds),68 under Member States’ trust funds (12 funds corresponding to 12 States) and 63 under other commonsystem funds (14 funds). Non-geographic staff assigned to posts under the regular programme: in additionto the post of Director-General, which is traditionally regarded as a non-geographical post, there were36 language posts, 37 NPOs (National Professional Officers), 12 staff members in the GS category whowere promoted on a personal basis to the Professional category and 11 temporary staff.

160 EX/28Annex I
ANNEX I
GLOSSARY OF TECHNICAL TERMS
Base figure Total number of geographical posts fixed as the basis forcalculating the quotas. In accordance with established practice,this number is slightly higher than the number ofadministratively existing posts (so as to cover possiblefluctuations).
Contribution factor Concept expressed as a fraction or a percentage determiningthat part of the base figure to be distributed among MemberStates on the basis of their assessed contributions to theregular budget.
Disparity, weighteddisparity
Difference between the number of a State’s nationals and itsmid-point (preceded by the mathematical sign +/-). For theweighted disparity - this is the same thing divided by the valueof the mid-point.
Equitable (representation,geographical distribution)
Situation when the number of nationals is as close as possibleto the mid-point (ideal representation).
Geographical posts (postssubject to the principle ofgeographical distribution)
Posts in the Professional category and above financed from theregular budget of the Organization, except for “language” posts(interpreters, translators and revisers). Posts regarded as “semi-linguistic” (drafting and editorial staff) are subject to theprinciple of geographical distribution.
Internal movement (ofstaff)
In this document the term refers to staff movements whichaffect geographical distribution (transfer from a non-geographical post to a geographical post and vice versa,promotion from the GS category to the Professional category,departure on/return from unpaid leave, etc.). Movements intothe geographical category are accompanied by a + sign, whilemovements in the opposite direction have a - sign.
Major factor(s) Term referring to the contribution factor and themembership factor.
Membership factor Right of each Member State to a number of posts (equal for allStates). This concept may be expressed as a fraction or as apercentage in determining that part of the base figure to beshared among Member States.
Method of calculation Calculation of the quotas begins with the calculation of themid-points. Since the methodology used by UNESCO is basedon two major factors, namely the membership factor and thecontribution factor, the mid-point is made up of these twoparts. The part of the mid-point corresponding to themembership factor is equal for all Member States and is fixed

160 EX/28Annex I - page 2
as a fraction of that part of the base figure belonging to themembership factor divided by the number of Member States. Inthe case of the current ratio (65/35) and with 188 MemberStates, the part of the mid-point belonging to the membershipfactor is as follows:
850 x 0.65188
The remaining part of the base figure is distributed amongMember States in proportion to their contribution to the regularbudget:
C‘n’ x 850 x 0.35100
where C‘n’ is the assessed contribution of a Member State ‘n’to the regular budget
100 is the constant determined on the basis of theassessed contributions of all Member States.
The two parts calculated in this way and then added togetherfor each Member State represent the mid-point (or idealgeographical representation of each Member State).
The upper and lower limits of the quotas extend 25% aboveand below the mid-point (except in the case of the smallestquotas, whose limits are extended to 4/2, 5/2 or 6/2) androunded off to the nearest whole number.
Population ordemographic factor
Term used to identify that part of the base figure to bedistributed among Member States on the basis of theirpopulation.
Quota Number of posts assigned to a Member State of theOrganization under the principle of geographical distribution. Itis defined by the desirable mid-point and the applicablerange (upper and lower limits of the quota).
Rates of under- or over-representation
Quantitative notion used to measure the extent to whichrepresentation deviates from the mid-point (ideal situation). Itrepresents the value of the weighted disparity multiplied bythe modulus of the disparity (or the square of the disparitydivided by the value of the mid-point preceded by the algebraicsign of the disparity).
Scale of contributions orassessed contributions
Contribution of a Member State to the regular budget expressedas a percentage.
160 EX/28Annex I - page 3
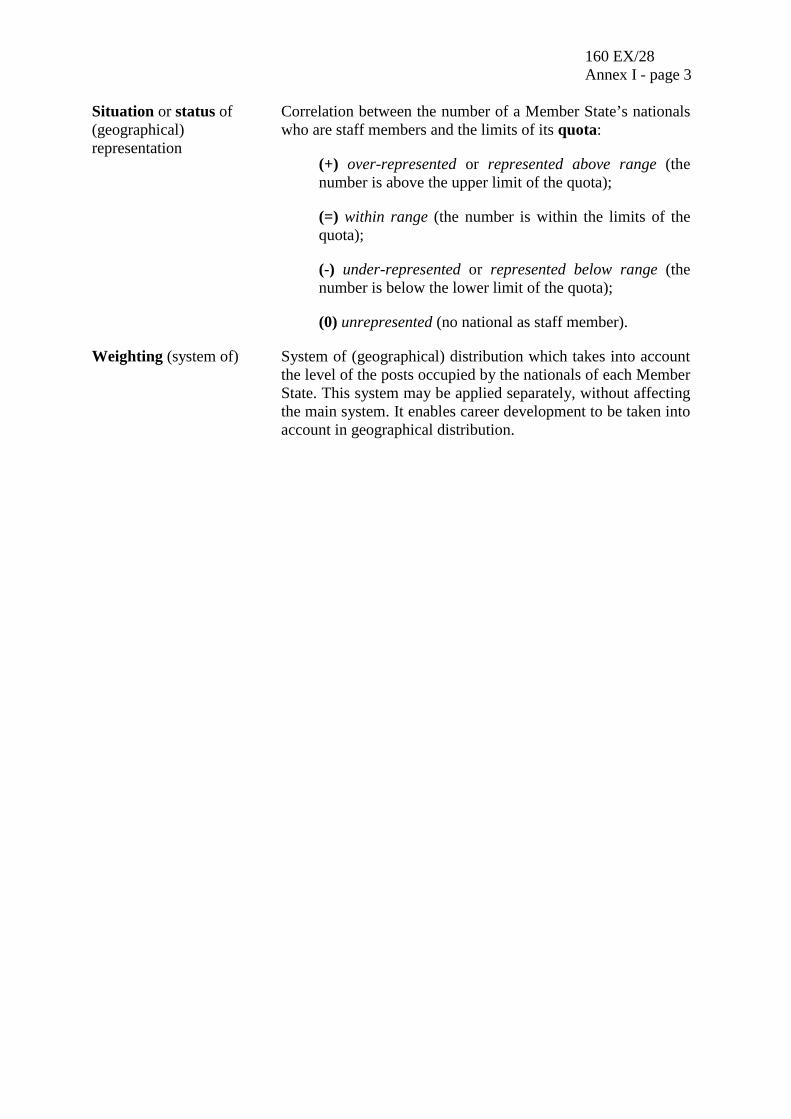
Situation or status of(geographical)representation
Correlation between the number of a Member State’s nationalswho are staff members and the limits of its quota:
(+) over-represented or represented above range (thenumber is above the upper limit of the quota);
(=) within range (the number is within the limits of thequota);
(-) under-represented or represented below range (thenumber is below the lower limit of the quota);
(0) unrepresented (no national as staff member).
Weighting (system of) System of (geographical) distribution which takes into accountthe level of the posts occupied by the nationals of each MemberState. This system may be applied separately, without affectingthe main system. It enables career development to be taken intoaccount in geographical distribution.

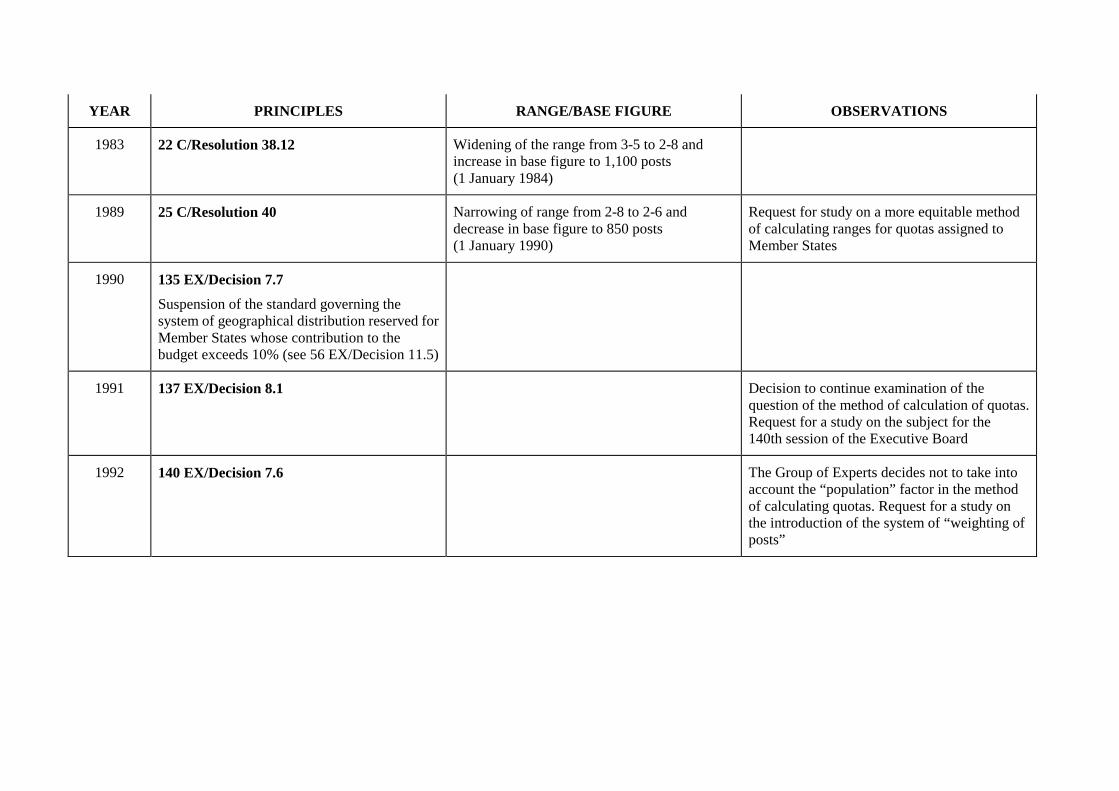
CHANGES IN THE METHOD OF ESTABLISHING THE QUOTASASSIGNED TO THE MEMBER STATES OF UNESCO
YEAR PRINCIPLES RANGE/BASE FIGURE OBSERVATIONS
1960 56 EX/Decision 11.5
The contribution of 1% to the budgetcorresponds to a base figure of 1% of the postsassigned
For Member States whose contribution to thebudget exceeds 10%, the upper margin of 25%does not have to be applied
The minimum quota must not be less than two
Max. = MP + 25%
Min. = MP – 25%
The total number of posts corresponding to themid-points of all Member States exceeds thenumber of posts in the base figure
1972 17 C/Resolution 22.1 Increase in the minimum number of posts from2 to 2-3
Same observation
1976 19 C/Resolution 26.1 Gradual widening of range from 2-3 to 2-5(1 January 1977) then to 3-5 (1 January 1979)
Request for a study to streamline the method ofcalculating quotas (104 EX/47)
1974 18 C/Resolution 26.1
Departure from the principle:
1 per cent of the budget ≈ 1 per cent of posts
Introduction of the principle of recruitmentplanning with a view to obtaining moreequitable geographical distribution
Since the introduction of the principle ofrecruitment planning with a view to obtainingmore equitable geographical distribution, thetotal number of posts corresponding to the mid-points of all Member States is equal to thenumber of posts in the base figure
YEAR PRINCIPLES RANGE/BASE FIGURE OBSERVATIONS
1983 22 C/Resolution 38.12 Widening of the range from 3-5 to 2-8 andincrease in base figure to 1,100 posts(1 January 1984)
1989 25 C/Resolution 40 Narrowing of range from 2-8 to 2-6 anddecrease in base figure to 850 posts(1 January 1990)
Request for study on a more equitable methodof calculating ranges for quotas assigned toMember States
1990 135 EX/Decision 7.7
Suspension of the standard governing thesystem of geographical distribution reserved forMember States whose contribution to thebudget exceeds 10% (see 56 EX/Decision 11.5)
1991 137 EX/Decision 8.1 Decision to continue examination of thequestion of the method of calculation of quotas.Request for a study on the subject for the140th session of the Executive Board
1992 140 EX/Decision 7.6 The Group of Experts decides not to take intoaccount the “population” factor in the methodof calculating quotas. Request for a study onthe introduction of the system of “weighting ofposts”
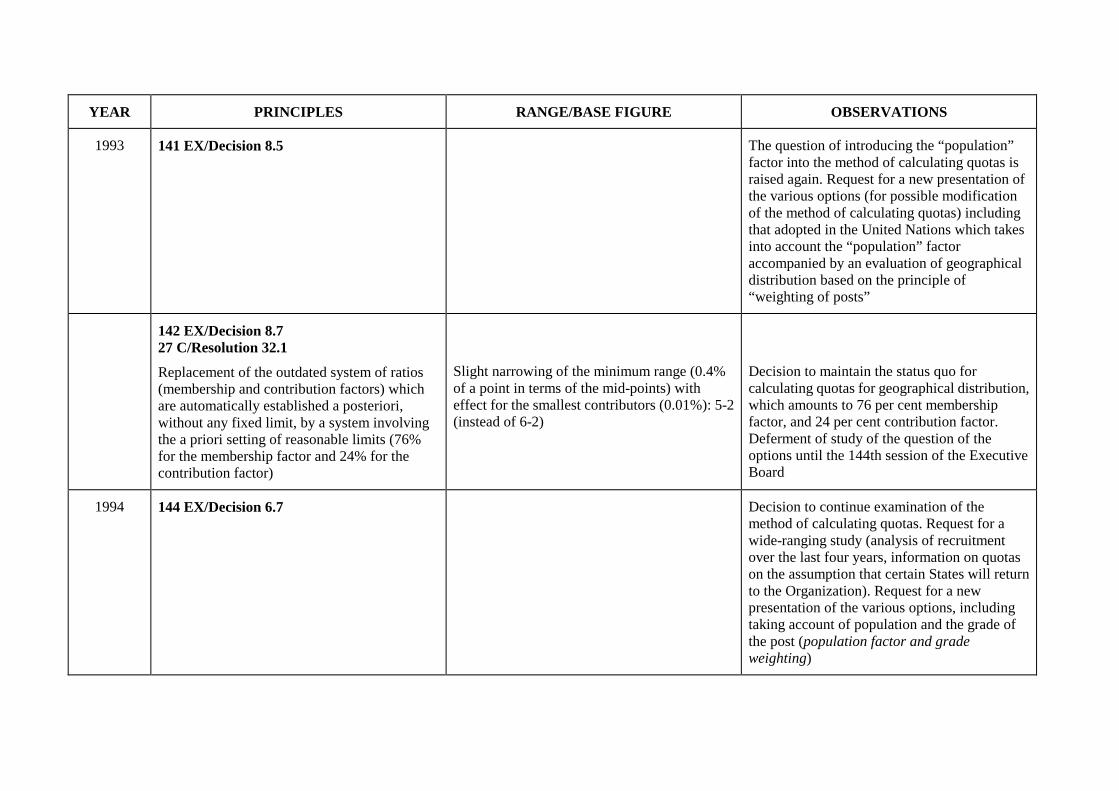
YEAR PRINCIPLES RANGE/BASE FIGURE OBSERVATIONS
1993 141 EX/Decision 8.5 The question of introducing the “population”factor into the method of calculating quotas israised again. Request for a new presentation ofthe various options (for possible modificationof the method of calculating quotas) includingthat adopted in the United Nations which takesinto account the “population” factoraccompanied by an evaluation of geographicaldistribution based on the principle of“weighting of posts”
142 EX/Decision 8.727 C/Resolution 32.1
Replacement of the outdated system of ratios(membership and contribution factors) whichare automatically established a posteriori,without any fixed limit, by a system involvingthe a priori setting of reasonable limits (76%for the membership factor and 24% for thecontribution factor)
Slight narrowing of the minimum range (0.4%of a point in terms of the mid-points) witheffect for the smallest contributors (0.01%): 5-2(instead of 6-2)
Decision to maintain the status quo forcalculating quotas for geographical distribution,which amounts to 76 per cent membershipfactor, and 24 per cent contribution factor.Deferment of study of the question of theoptions until the 144th session of the ExecutiveBoard
1994 144 EX/Decision 6.7 Decision to continue examination of themethod of calculating quotas. Request for awide-ranging study (analysis of recruitmentover the last four years, information on quotason the assumption that certain States will returnto the Organization). Request for a newpresentation of the various options, includingtaking account of population and the grade ofthe post (population factor and gradeweighting)

YEAR PRINCIPLES RANGE/BASE FIGURE OBSERVATIONS
145 EX/Decision 7.6 Decision not to take into account thepopulation factor and grade weighting,decision to recommend that the GeneralConference gradually improve the current76/24 formula, taking into account the practicesof the other organizations of the United Nationssystem; invitation to formulate proposalsincluding options aimed at achieving theseresults
1995 147 EX/Decision 7.1228 C/Resolution 29.2
Slight narrowing of the minimum range witheffect for the smallest contributors (0.01%): 4-2(instead of 5-2)
Decision to alter the ratios for the membershipfactor and the contribution factor to 70 per centand 30 per cent respectively. Request for thepreparation of the next phase of the medium-term objectives with a view to achieving amore equitable geographical distribution
1996 150 EX/Decision 6.7 Confirmation of the principles set out in thedocument concerning the medium-termobjectives with a view to achieving a moreequitable geographical distribution
1997 152 EX/Decision 8.5 Decision to recommend that the GeneralConference maintain the status quo regardingthe ratios for the membership factor and thecontribution factor (70 per cent and 30 per centrespectively), postponing to a later date the re-examination of the question of quotas(30th session of the General Conference).

YEAR PRINCIPLES RANGE/BASE FIGURE OBSERVATIONS
29 C/Resolution 78 Confirmation of the recommendation made bythe Executive Board at its 152nd sesseion.
Decision to apply the principles outlined indocument 29 C/41 (maintenance of a marginfor external recruitment, so as to allow theappointment of nationals of unrepresented orunder-represented countries; non-appointment,as far as possible, of candidates from over-represented countries, or countries likely tobecome so, to posts subject to the principle ofgeographical distribution) with a view toimproving the geographical distribution of thestaff, bearing in mind Article VI.4 of theConstitution
Establishment of an effective strategy toincrease the number of candidates from under-represented and unrepresented countries.
1998 155 EX/Decision 7.5 Confirmation of principles with a view toimproving the geographical distribution of thestaff. Invitation to submit a report on thegeographical distribution of staff, withconsideration of the criteria determiningwhether or not a post is subject to geographicaldistribution

YEAR PRINCIPLES RANGE/BASE FIGURE OBSERVATIONS
1999 157 EX/Decision 8.630 C/Resolution 72.II
Modification of the quotas for all MemberStates following changes to the scale ofassessments (assessed contributions) andchanges in the ratio applicable to the two majorfactors (membership factor and contributionfactor)
Decision to change the ratio applicable to themembership factor and contribution factor,fixing it at 65% and 35% respectively. Newexamination of the criteria used to determinethe geographical/non-geographical status ofposts.