united states - annual report
TRANSCRIPT

Source: Erin Energy Corp., 10-K, March 24, 2016 Powered by Morningstar Document Research. The information contained herein may not be copied, adapted or distributed and is not warranted to be accurate, complete or timely. The user assumes all risks for any damages or losses arising from any use of this information, except to the extent such damages or losses cannot be limited or excluded by applicable law. Past financial performance is no guarantee of future results.
UNITED STATES
SECURITIES AND EXCHANGE COMMISSION Washington, D.C. 20549
____________________________________________________________________________________________
FORM 10-K ____________________________________________________________________________________________
ANNUAL REPORT PURSUANT TO SECTION 13 OR 15(d) OF THE SECURITIES EXCHANGE ACT
OF 1934 For the fiscal year ended December 31, 2015
OR
TRANSITION REPORT PURSUANT TO SECTION 13 OR 15(d) OF THE SECURITIES EXCHANGE
ACT OF 1934 For the transition period from: to
001-34525
(Commission File Number) ____________________________________________________________________________________________
ERIN ENERGY CORPORATION (Exact name of registrant as specified in its charter)
____________________________________________________________________________________________
Delaware 30-0349798
(State or Other Jurisdiction
of Incorporation or Organization)
(I.R.S. Employer
Identification No.)
1330 Post Oak Blvd., Suite 2250, Houston, TX 77056
(Address of Principal Executive Office) (Zip Code)
(713) 797-2940
(Registrant’s telephone number, including area code) ____________________________________________________________________________________________
Securities registered pursuant to Section 12(b) of the Act:
Common Stock, $0.001 par value
Securities registered pursuant to Section 12(g) of the Act:
None ____________________________________________________________________________________________
Indicate by check mark if the registrant is a well-known seasoned issuer, as defined in Rule 405 of the Securities Act. Yes No
Indicate by check mark if the registrant is not required to file reports pursuant to Section 13 or Section 15(d) of the Act. Yes No
Indicate by check mark whether the registrant (1) has filed all reports required to be filed by Section 13 or 15(d) of the Securities Exchange Act of 1934 during the
preceding 12 months (or for such shorter period that the registrant was required to file such reports), and (2) has been subject to such filing requirements for the past 90 days. Yes No
Indicate by check mark whether the registrant has submitted electronically and posted on its corporate Web site, if any, every Interactive Data File required to be submitted and posted pursuant to Rule 405 of Regulation S-T (§ 232.405 of this chapter) during the preceding 12 months (or for such shorter period that the registrant
was required to submit and post such files). Yes No
Indicate by check mark if disclosure of delinquent filers pursuant to Item 405 of Regulation S-K (§229.405 of this chapter) is not contained herein, and will not be contained, to the best of registrant’s knowledge, in definitive proxy or information statements incorporated by reference in Part III of this Form 10-K or any amendment
to this Form 10-K.
Indicate by check mark whether the registrant is a large accelerated filer, an accelerated filer, a non-accelerated filer, or a smaller reporting company. See definition of
“large accelerated filer”, “accelerated filer” and “smaller reporting company” in Rule 12b-2 of the Exchange Act. Large accelerated filer Accelerated filer Non-accelerated filer Smaller reporting company
Indicate by check mark whether the registrant is a shell company (as defined in Rule 12b-2 of the Exchange Act). Yes No
The aggregate market value of the voting and non-voting common stock held by non-affiliates of the registrant as of the last business day of the registrant’s most
recently completed second fiscal quarter was approximately $352,126,588 based on a share price of $3.91. All executive officers and directors of the registrant have been deemed, solely for the purpose of the forgoing calculation, to be “affiliates” of the registrant.
As of March 1, 2016, there were 212,014,383 shares of Common Stock outstanding.
DOCUMENTS INCORPORATED BY REFERENCE
Portions of the definitive Proxy Statement or Form 10-K/A relating to the Company’s Annual Meeting of Stockholders to be held in May 2016 are incorporated by
reference in Part III of this report.

Source: Erin Energy Corp., 10-K, March 24, 2016 Powered by Morningstar Document Research. The information contained herein may not be copied, adapted or distributed and is not warranted to be accurate, complete or timely. The user assumes all risks for any damages or losses arising from any use of this information, except to the extent such damages or losses cannot be limited or excluded by applicable law. Past financial performance is no guarantee of future results.
Erin Energy Corporation
FORM 10-K
TABLE OF CONTENTS
Page
Glossary of Oil and Gas Terms
PART I
Item 1. Description of Business 4
Item 1A. Risk Factors 10
Item 1B. Unresolved Staff Comments 25
Item 2. Properties 25
Item 3. Legal Proceedings 31
Item 4. Mine Safety Disclosures 31
PART II
Item 5.
Market for Registrant’s Common Equity, Related Stockholder Matters and Issuer Purchases of Equity Securities 32
Item 6. Selected Financial Data 35
Item 7. Management’s Discussion and Analysis of Financial Condition and Results of Operations 35
Item 7A. Quantitative and Qualitative Disclosures About Market Risk 44
Item 8. Financial Statements and Supplemental Data 44
Item 9. Changes in and Disagreements with Accountants on Accounting and Financial Disclosure 45
Item 9A. Controls and Procedures 45
Item 9B. Other Information 48
PART III
Item 10. Directors, Executive Officers and Corporate Governance 48
Item 11. Executive Compensation 48
Item 12. Security Ownership of Certain Beneficial Owners and Management and Related Stockholder Matters 48
Item 13. Certain Relationships and Related Transactions, and Director Independence 48
Item 14. Principal Accountant Fees and Services 48
PART IV
Item 15. Exhibits, Financial Statements and Schedules 49
Signatures 55
2

Source: Erin Energy Corp., 10-K, March 24, 2016 Powered by Morningstar Document Research. The information contained herein may not be copied, adapted or distributed and is not warranted to be accurate, complete or timely. The user assumes all risks for any damages or losses arising from any use of this information, except to the extent such damages or losses cannot be limited or excluded by applicable law. Past financial performance is no guarantee of future results.
GLOSSARY OF SELECTED OIL AND GAS TERMS
The following is a description of the meanings of certain oil and gas industry terms and acronyms used in this report:
2-D seismic data - 2-D seismic survey data has been the standard acquisition technique used to image geologic formations over a
broad area. 2-D seismic data is collected by a single line of energy sources which reflect seismic waves to a single line of geophones.
When processed, 2-D seismic data produces an image of a single vertical plane of subsurface data.
3-D seismic data - 3-D seismic data is collected using a grid of energy sources, which are generally spread over several miles. A 3-D
seismic survey produces a three dimensional image of the subsurface geology by collecting seismic data along parallel lines and
creating a cube of information that can be divided into various planes, thus improving visualization. Consequently, 3-D seismic data
provide more reliable information than 2-D seismic data.
Bbl - One stock tank barrel, or 42 US gallons liquid volume, of crude oil or other liquid hydrocarbons.
BOPD - One barrel of oil per day.
MBbl - One thousand Bbls.
Development well - A well drilled into a proved natural gas or oil reservoir to the depth of a stratigraphic horizon known to be
productive.
Exploratory well - A well drilled to find a new field or to find a new reservoir in a field previously found to be productive of natural
gas or crude oil in another reservoir.
Field - An area consisting of either a single reservoir or multiple reservoirs all grouped on or related to the same individual geological
structural feature and/or stratigraphic condition.
Gross oil and gas wells or acres - The Company’s gross wells or gross acres represent the total number of wells or acres in which the
Company owns a working interest.
Net oil and gas wells or acres - Determined by multiplying “gross” oil and natural gas wells or acres by the working interest that the
Company owns in such wells or acres represented by the underlying properties.
Productive well - A well that is found to be capable of producing hydrocarbons in sufficient quantities such that proceeds from the sale
of the production exceed production expenses and taxes.
Prospect - A specific geographic area which, based on supporting geological, geophysical or other data and also preliminary economic
analysis using reasonably anticipated prices and costs, is deemed to have potential for the discovery of commercial hydrocarbons.
Proved developed reserves - Has the meaning given to such term in Rule 4-10(a)(3) of Regulation S-X, which defines proved
developed reserves as reserves that can be expected to be recovered through existing wells with existing equipment and operating
methods. Additional oil and gas expected to be obtained through the application of fluid injection or other improved recovery
techniques for supplementing the natural forces and mechanisms of primary recovery should be included as proved developed reserves
only after testing by a pilot project or after the operation of an installed program has confirmed through production response that
increased recovery will be achieved.
Proved oil and gas reserves – Proved oil and gas reserves are those quantities of oil and gas, which, by analysis of geoscience and
engineering data, can be estimated with reasonable certainty to be economically producible, from a given date forward, from known
reservoirs, and under existing economic conditions, operating methods, and government regulations, prior to the time at which
contracts providing the right to operate expire, unless evidence indicates that renewal is reasonably certain, regardless of whether
deterministic or probabilistic methods are used for the estimation. The project to extract the hydrocarbons must have commenced or
the operator must be reasonably certain that it will commence the project within a reasonable time.
Proved undeveloped reserves - Has the meaning given to such term in Rule 4-10(a)(4) of Regulation S-X, which defines proved
undeveloped reserves as reserves that are expected to be recovered from new wells on undrilled acreage, or from existing wells
3

Source: Erin Energy Corp., 10-K, March 24, 2016 Powered by Morningstar Document Research. The information contained herein may not be copied, adapted or distributed and is not warranted to be accurate, complete or timely. The user assumes all risks for any damages or losses arising from any use of this information, except to the extent such damages or losses cannot be limited or excluded by applicable law. Past financial performance is no guarantee of future results.
where a relatively major expenditure is required for recompletion. Reserves on undrilled acreage shall be limited to those drilling units
offsetting productive units that are reasonably certain of production when drilled. Proved reserves for other undrilled units can be
claimed only where it can be demonstrated with certainty that there is continuity of production from the existing productive formation.
Under no circumstances should estimates for proved undeveloped reserves be attributable to any acreage for which an application of
fluid injection or other improved recovery technique is contemplated, unless such techniques have been proved effective by actual
tests in the area and in the same reservoir.
Standardized measure of proved reserves - The present value, discounted at 10%, of the future net cash flows attributable to estimated
net proved reserves, as estimated in the Company’s independent engineer’s reserve report.
Unproved properties or unevaluated leasehold - Properties with no proved reserves.
PART I
ITEM 1. DESCRIPTION OF BUSINESS
This Annual Report on Form 10-K and the documents incorporated herein by reference contain forward-looking statements based on
expectations, estimates and projections as of the date of this filing. These statements by their nature are subject to risks, uncertainties
and assumptions, and are influenced by various factors. As a consequence, actual results may differ materially from those in the
forward-looking statements. See Item 1A Risk Factors of this Form 10-K for a discussion of risk factors.
Unless the context otherwise requires, the terms “we,” “us,” “our,” “Company” and “the Company” refer to Erin Energy Corporation,
a Delaware corporation originally organized in 1979, and its subsidiaries. The Company’s corporate headquarters is located in
Houston, Texas. For more information about Erin Energy Corporation, visit www.erinenergy.com.
GENERAL
Erin Energy Corporation is an independent oil and gas exploration and production company focused on energy resources in Africa.
Our strategy is to acquire and develop high-potential exploration and production assets in Africa, and to explore and develop those
assets through strategic partnerships with national oil companies, indigenous local partners and other independent oil companies. We
seek to build and operate a strategic portfolio of high-impact exploration and near-term development projects with significant
production, reserves and resources growth potential.
We actively manage investments and on-going operations by limiting capital exposure through farm-outs at various stages of
exploration and development to share risks and costs. We prioritize on building a strong technical and operational team and place an
emphasis on the utilization of modern oil field technologies that mature our assets, reduce the cost of our projects and improve the
efficiency of our operations.
Our shares are traded on both the NYSE MKT and on the Johannesburg Stock Exchange under the symbol “ERN.”
Our asset portfolio consists of nine licenses across four countries covering an area of approximately 10 million acres (approximately
40,000 square kilometers). We own producing properties and conduct exploration activities as an operator offshore Nigeria and
conduct exploration activities as an operator onshore and offshore Kenya, offshore The Gambia, and offshore Ghana.
Our operating subsidiaries include Erin Petroleum Nigeria Limited (“EPNL”), CAMAC Energy Kenya Limited, Erin Energy Gambia
Ltd., and Erin Energy Ghana Limited.
We conduct certain business transactions with our majority shareholder, CAMAC Energy Holdings Limited (“CEHL”) and its
affiliates, which include CAMAC International Nigeria Limited (“CINL”) and Allied Energy Plc (“Allied”). See Note 10. —Related
Party Transactions to the Notes to Consolidated Financial Statements for further information.
Our Executive Chairman of the Board of Directors and Chief Executive Officer, Dr. Kase Lawal, is a director of each of the above
listed related parties. He indirectly owns 27.7% of CEHL, which is the majority shareholder of the Company. As a result, he may be
deemed to have an indirect material interest in transactions contemplated with CEHL and any of its affiliates. On March 14, 2016, the
Company announced that Dr. Lawal is retiring from service as a member and the Executive Chairman of the Board of Directors and
the Chief Executive Officer of the Company effective as of the first day after the Company’s 2016
4

Source: Erin Energy Corp., 10-K, March 24, 2016 Powered by Morningstar Document Research. The information contained herein may not be copied, adapted or distributed and is not warranted to be accurate, complete or timely. The user assumes all risks for any damages or losses arising from any use of this information, except to the extent such damages or losses cannot be limited or excluded by applicable law. Past financial performance is no guarantee of future results.
annual meeting of stockholders. Further, the Company announced that John Hofmeister, a current member of the Board of Directors
and subject to his reelection, would succeed Dr. Lawal as the Chairman of the Board of Directors, and Segun Omidele, the current
Chief Operating Officer, would succeed Dr. Lawal as the Chief Executive Officer.
OIL AND GAS ACTIVITIES
Nigeria
In April 2010, we acquired certain economic interests in the Oyo field located within a portion of Oil Mining Leases 120 and 121 (the
"OMLs") offshore Nigeria through the purchase of certain of Allied’s and CINL’s rights in the Production Sharing Contract (the
“PSC”) relating to the Oyo field in exchange for cash and the issuance to CEHL of shares of our common stock. As a result of this
transaction, CEHL became the majority shareholder of the Company. The oilfield operations for the OMLs, including the Oyo field,
were governed by the PSC, pursuant to which Nigerian Agip Exploration Limited ("NAE") was initially designated as the operator.
In February 2011, we acquired all of Allied’s and CINL’s rights in the PSC outside the Oyo field for cash and an agreement to make
additional payments, contingent upon completion of specified milestones in any future exploration and development area of the OMLs
outside of the Oyo field.
In June 2012, Allied acquired all of NAE’s participating interest in the OMLs and all of NAE’s interest in the PSC. As a result of this
transaction, Allied became the operator of the OMLs and the holder of the interests in the PSC apart from the interests previously
acquired by the Company in 2010 and 2011.
In September 2013, drilling operations commenced on the development well Oyo-7. Based on logging-while-drilling (“LWD”) data,
the well encountered gross oil pay of 133 feet (net oil pay of 115 feet) and gross gas pay of 103 feet (net gas pay of 93 feet) in the gas
cap from the then producing Pliocene reservoir, with excellent reservoir quality. The well was temporarily suspended. As a secondary
objective, the well Oyo-7 confirmed the presence of hydrocarbons in the deeper Miocene formation. This marked the first time a well
had been successfully drilled into the Miocene formation in OML 120. Hydrocarbons were encountered in three intervals totaling
approximately 65 feet, as interpreted from the LWD data. The Company is currently making plans for further exploratory activities in
the Miocene formation.
In February 2014, an affiliate of the Company entered into a long-term contract for the Floating Production, Storage and Offloading
vessel ("FPSO") Armada Perdana . The contract provides for an initial term of seven years beginning January 1, 2014, with an
automatic extension for an additional term of two years unless terminated by the Company with prior notice.
In February 2014, the Company acquired all remaining economic interests in the PSC and related assets, contracts and rights
pertaining to the OMLs located offshore Nigeria, including the producing Oyo field (the “Allied Assets”), from Allied (the “Allied
Transaction”) pursuant to a Transfer Agreement entered into in November 2013 by the Company and its affiliates, and Allied (the
“Transfer Agreement”). In consideration for the Allied Assets, the Company issued 82.9 million shares of the Company’s common
stock, delivered to Allied a $50.0 million convertible subordinated promissory note (the “Convertible Subordinated Note”) and paid
$170.0 million in cash. As a result of the Allied Transaction, the Company now owns 100% of the economic interest in the OMLs. See
Note 4. — Acquisitions to the Notes to Consolidated Financial Statements for additional information on the Allied Transaction. The
Allied Assets included two producing wells as of the transaction date: wells Oyo-5 and Oyo-6.
In August 2014, the Company drilled well Oyo-8 to a total vertical depth of approximately 6,059 feet (approximately 1,847 meters)
and successfully encountered four new oil and gas reservoirs with total gross hydrocarbon thickness of 112 feet in the eastern fault
block, based on results from the LWD data, reservoir pressure measurement, and reservoir fluid sampling. The well was temporarily
suspended.
In September 2014, the Company shut-in both wells Oyo-5 and Oyo-6 and successfully removed their flow lines and other subsea
equipment for relocation to wells Oyo-7 and Oyo-8 as planned. The Company also initiated temporary plug and abandonment
activities for well Oyo-5.
In March 2015, the Company finished completion operations for well Oyo-8, and successfully hooked it up to the FPSO. Production
commenced in May 2015. In April 2015, the Company completed plug and abandonment activities for well Oyo-6
5

Source: Erin Energy Corp., 10-K, March 24, 2016 Powered by Morningstar Document Research. The information contained herein may not be copied, adapted or distributed and is not warranted to be accurate, complete or timely. The user assumes all risks for any damages or losses arising from any use of this information, except to the extent such damages or losses cannot be limited or excluded by applicable law. Past financial performance is no guarantee of future results.
and subsequently initiated well Oyo-7's horizontal completion activities. The Company commenced production from well Oyo-7 in
June 2015.
The enforcement of certain control measures implemented by the Nigerian government with regards to the quarterly exportation and
sale of crude oil products from Nigeria has had an impact on the Company’s operations. Petroleum producers are required to obtain
export permits quarterly for crude oil liftings. During the period from May to September 2015, the Company produced approximately
1.5 million Bbls of crude oil but only sold approximately 0.6 million Bbls due to unexpected delays in the issuance of export permits
for the quarter ending September 30, 2015. The resulting crude oil inventory of approximately 0.9 million Bbls, as of September 30,
2015, was approaching the Company’s crude oil storage capacity on its FPSO. As a result, the Company had to curtail production by
temporarily shutting-in well Oyo-8 in September 2015. The Company subsequently received a permit to export approximately 1.3
million Bbls from October to December 2015.
Subsequent attempts to reestablish production from well Oyo-8 were unsuccessful, due to the failure of the subsurface controlled
safety valve. The Company has since made several unsuccessful attempts to open the valve using normal procedures and has now
decided to embark on a light intervention, using an intervention vessel, to bring the well back to production. The Company expects to
complete the intervention in April 2016 and re-establish production.
In the three months ended September 30, 2015, average daily production was approximately 11,600 BOPD (approximately 10,200
BOPD net to the Company). In the three months ended December 31, 2015, the average daily production was approximately 2,900
BOPD (approximately 2,500 BOPD net to the Company).
Current plans include completing the scheduled light intervention to re-establish production from well Oyo-8, drilling a development
well in the Oyo field, and drilling a potential high-impact exploration well in the Miocene formation of the OMLs, subject to capital
and rig availability.
Kenya
In May 2012, the Company, through a wholly owned subsidiary, entered into four production sharing contracts with the Government
of the Republic of Kenya, covering onshore exploration blocks L1B and L16, and new offshore exploration blocks L27 and L28 (the
“Kenya PSCs”). The Company is the operator of all blocks with the Government having the right to participate up to 20%, either
directly or through an appointee, in any area subsequent to declaration of a commercial discovery. The Company is responsible for all
exploration expenditures.
Blocks L1B and L16
The Kenya PSCs for onshore blocks L1B and L16 each provided for an initial exploration period with specified minimum work
obligations during that period. Prior to the end of the initial exploration period, the Company was required, for each block, to i)
conduct a gravity and magnetic survey and ii) acquire, process and interpret 2-D seismic data.
The initial exploration period for onshore blocks L1B and L16 ended in June 2015. Having satisfied all material contractual
obligations under the initial exploration period, the Company received approval from the Kenya Ministry of Energy and Petroleum to
enter into the First Additional Exploration Period for both blocks.
The First Additional Exploration Period for both blocks will last two contract years, through July 2017. In accordance with certain
provisions of the Kenya PSCs for onshore blocks L1B and L16, the Company relinquished 25% of its original acreage on block L1B;
however, the Company was allowed to retain the totality of its original acreage in block L16. Further, in accordance with the Kenya
PSCs, during the First Additional Exploration Period, the Company is obligated, for each block, to (i) acquire, process and interpret
high density 300 square kilometer 3-D seismic data at a minimum expenditure of $12.0 million and (ii) drill one exploration well to a
minimum depth of 3,000 meters at a minimum expenditure of $20.0 million.
The Company plans to pursue completion of the work program and is considering the possibility of farming-out a portion of its rights
to both blocks to potential partners.
Blocks L27 and L28
The Kenya PSCs for offshore blocks L27 and L28 each provided for an initial exploration period of three years, through August 2015,
with specified minimum work obligations during that period. Prior to the end of the initial exploration period, the Company
6

Source: Erin Energy Corp., 10-K, March 24, 2016 Powered by Morningstar Document Research. The information contained herein may not be copied, adapted or distributed and is not warranted to be accurate, complete or timely. The user assumes all risks for any damages or losses arising from any use of this information, except to the extent such damages or losses cannot be limited or excluded by applicable law. Past financial performance is no guarantee of future results.
is required to, for each block, i) conduct a regional geological and geophysical study, ii) reprocess and re-interpret previous 2-D
seismic data and iii) acquire, process and interpret 1,500 square kilometers of 3-D seismic data.
In March 2014, the Company, through its participation in a multi-client combined gravity/magnetic and 2-D seismic survey,
completed its required gravity/magnetic and 2-D seismic data acquisition for both blocks.
The Company received approval from the Kenya Ministry of Energy and Petroleum for an 18-month extension of the Initial
Exploration Period for blocks L27 and L28, which will now last through February 2017. The remaining contractual obligation under
the initial exploration period is for the Company to acquire, process and interpret 1,500 square kilometers of 3-D seismic data over
both offshore blocks.
The Company plans to pursue completion of the work program, and is also considering the possibility of farming-out a portion of its
rights to both offshore blocks to potential partners. Upon completion of the work program, the Company has the right to apply for up
to two additional two-year exploration periods, with specified additional minimum work obligations, including the acquisition of
seismic data and the drilling of one exploratory well on each block during each additional period.
The Gambia
In May 2012, the Company, through a wholly owned subsidiary, signed two Petroleum Exploration, Development & Production
Licenses with The Republic of The Gambia, for offshore exploration blocks A2 and A5 (the “Gambia Licenses”). For both blocks, the
Company is the operator, with the Gambian National Petroleum Company (“GNPCo”) having the right to elect to participate up to a
15% interest, following approval of a development and production plan. The Company is responsible for all expenditures prior to such
approval even if the GNPCo elects to participate.
The Gambia Licenses provide for an initial exploration period of four years with specified minimum work obligations during that
period. Prior to the end of the initial exploration period, the Company is required, for each block, to i) conduct a regional geological
study, ii) acquire, process and interpret 750 square kilometers of 3-D seismic data, and iii) drill one exploration well to a maximum
total depth of 5,000 meters below mean sea level and evaluate the drilling results.
In May 2015, the term of the initial exploration period for both blocks A2 and A5 was extended by two years through December 2018,
following an amendment agreement (the "Gambia Licenses Amendment") entered into with The Republic of The Gambia. As of
December 31, 2015, the remaining contractual obligations, as amended pursuant to the Gambia Licenses Amendment for both blocks,
is for the Company to (i) complete the processing and interpretation of approximately 1,600 square kilometers of 3-D seismic data that
was acquired in September 2015 and (ii) drill one exploration well on either block A2 or A5 and evaluate the drilling results. As
consideration for the Gambia Licenses Amendment, the Company agreed to (i) pay a $1.0 million extension fee, (ii) provide a full
well guarantee on either block at such time that the Company enters into a farm-in agreement with a partner, and (iii) pay the annual
contractual Training and Resources Expenses into a Government of Gambia bank account in The Gambia.
The 3-D seismic processing by an outside contractor is ongoing and is expected to be completed by the third quarter of 2016. The
Company intends to pursue completion of the work program, and is also considering the possibility of farming-out a portion of its
rights to both blocks to potential partners.
Ghana
In April 2014, the Company, through an indirect 50%-owned subsidiary, signed a Petroleum Agreement with the Republic of Ghana
(the “Petroleum Agreement”) relating to the Expanded Shallow Water Tano block offshore Ghana ("ESWT"). The Contracting
Parties, which hold 90% of the participating interest in the block, are Erin Energy Ghana Limited as the operator, GNPC Exploration
and Production Company Limited, and Base Energy (collectively the “Contracting Parties”), holding 60%, 25%, and 15% share of the
participating interest of the Contracting Parties, respectively. The Ghana National Petroleum Corporation initially has a 10% carried
interest through the exploration phase, and will have the option to acquire an additional paying interest of up to 10% following a
declaration of commercial discovery. The Company owns 50% of its subsidiary Erin Energy Ghana Limited. The remaining 50%
interest is owned by an affiliate of the Company’s majority shareholder.
The ESWT block contains three previously discovered fields (the "Fields") and the work program requires the Contracting Parties to
determine, within nine months of the effective date of the Petroleum Agreement, the economic viability of developing the Fields. In
addition, the Petroleum Agreement provides for an initial exploration period of two years from the effective date
7

Source: Erin Energy Corp., 10-K, March 24, 2016 Powered by Morningstar Document Research. The information contained herein may not be copied, adapted or distributed and is not warranted to be accurate, complete or timely. The user assumes all risks for any damages or losses arising from any use of this information, except to the extent such damages or losses cannot be limited or excluded by applicable law. Past financial performance is no guarantee of future results.
of the Petroleum Agreement, with specified work obligations during that period, including the reprocessing of existing 2-D and 3-D
seismic data and the drilling of one exploration well on the ESWT block. The Contracting Parties have the right to apply for a first
extension period of one and one-half years and a second extension period of up to two and one-half years. Each extension period has
specified additional minimum work obligations, including (i) conducting geological and geophysical studies during the first extension
period and (ii) drilling one exploration well during the first extension period and, depending on the length of the extension, one or two
wells during the second extension period.
In January 2015, the Petroleum Agreement became effective, following the signing of a Joint Operating Agreement between the
Contracting Parties.
In October 2015, at the completion of the initial technical and commercial evaluation of the Fields, the Contracting Parties concluded
that certain fiscal terms in the Petroleum Agreement had to be adjusted in order to achieve commerciality of the Fields under current
economic conditions. The Contracting Parties have presented this conclusion to the relevant government entities. The Ghanian
Government is currently reviewing the requests for adjustment of the fiscal terms.
Segment Information
For information related to our financial performance by segment, see Note 14. — Segment Information to the Notes to Consolidated
Financial Statements.
REGULATION
General
Our operations and our ability to finance and fund our growth strategy are affected by political developments and laws and regulations
in the areas in which we operate. In particular, oil and natural gas production operations and economics are affected by:
• changes in
governments;
• civil
unrest;
• price and currency
controls;
• limitations on oil and natural gas production and
exports;
• tax, environmental, safety and other laws relating to the petroleum
industry;
• changes in laws relating to the petroleum
industry;
• changes in administrative regulations and the interpretation and application of such rules and regulations; and
• changes in contract interpretation and policies of contract
adherence.
In any country in which we may do business, the oil and natural gas industry legislation and agency regulation are periodically
changed, sometimes retroactively, for a variety of political, economic, environmental and other reasons. Numerous governmental
departments and agencies issue rules and regulations binding on the oil and natural gas industry, some of which carry substantial
penalties for the failure to comply. The regulatory burden on the oil and natural gas industry increases our cost of doing business and
our potential for economic loss.
Environmental and Government Regulation
Various federal, state, local and international laws and regulations relating to the discharge of materials into the environment, the
disposal of oil and natural gas wastes, or otherwise relating to the protection of the environment may affect our operations and costs.
We are committed to the protection of the environment and believe we are in material compliance with the applicable laws and
regulations. However, regulatory requirements may, and often do, change and become more stringent, and there can be no assurance
that future regulations will not have a material adverse effect on our financial position, results of operations
8

Source: Erin Energy Corp., 10-K, March 24, 2016 Powered by Morningstar Document Research. The information contained herein may not be copied, adapted or distributed and is not warranted to be accurate, complete or timely. The user assumes all risks for any damages or losses arising from any use of this information, except to the extent such damages or losses cannot be limited or excluded by applicable law. Past financial performance is no guarantee of future results.
Source: Erin Energy Corp., 10-K, March 24, 2016 Powered by Morningstar Document Research. The information contained herein may not be copied, adapted or distributed and is not warranted to be accurate, complete or timely. The user assumes all risks for any damages or losses arising from any use of this information, except to the extent such damages or losses cannot be limited or excluded by applicable law. Past financial performance is no guarantee of future results.
and cash flows. During the years ended December 31, 2015, 2014 and 2013, we did not have any significant expenditures relating to
environmental and government regulation.
MARKETING AND PRICING
We currently derive the totality of our revenue from the sale of crude oil in Nigeria. As a result, our revenues and ultimate
profitability, the value of our reserves, our access to capital and our growth are substantially subject to the prevailing prices of crude
oil. Prevailing prices for such commodities are subject to wide fluctuations for macro-economic reasons beyond our control.
Historically, prices received for crude oil sales have been volatile and unpredictable, and such volatility and unpredictability is
expected to continue.
COMPETITION
We compete with numerous large international oil companies and smaller oil companies that target opportunities in markets similar to
ours, including the natural gas and petroleum markets. Many of these companies have far greater economic, political and material
resources at their disposal. Our management team has prior experience in the fields of petroleum engineering, geology, field
development, production, operations, international business development, and finance and experience in management and executive
positions with international energy companies. Nevertheless, the markets in which we operate and plan to operate are highly
competitive and the Company may not be able to compete successfully against its current and future competitors. See Item 1A. Risk
Factors for risk factors associated with competition in the oil and gas industry.
RISK MANAGEMENT AND INSURANCE PROGRAM
Insurance Program
In accordance with industry practice, the Company maintains insurance against many, but not all, potential perils confronting our
operations and in coverage amounts and deductible levels that we believe to be economic. Consistent with that profile, our insurance
program is structured to provide us financial protection from significant losses resulting from damages to, or the loss of, physical
assets or loss of human life and liability claims of third parties, including such occurrences as well blow-outs and weather events that
result in oil spills and damage to our wells and/or platforms. Our goal is to balance the cost of insurance with our assessment of the
potential risk of an adverse event. We maintain insurance at levels that we believe are appropriate and consistent with industry
practice and statutory regulations and we regularly review our risks of loss and the cost and availability of insurance and revise our
insurance program accordingly.
We continuously monitor regulatory changes and regulatory responses and their impact on the insurance market and our overall risk
profile, and adjust our risk and insurance program to provide protection at optimum levels, weighing the cost of insurance against the
potential and magnitude of disruption to our operations and cash flows.
Currently, the Company has operator’s extra expense insurance coverage up to $250.0 million per occurrence with respect to dr illing
and $75.0 million per occurrence with respect to all other wells. This includes coverage for re-drilling and restoration of wells as well
as coverage for resultant environmental damage, including voluntary clean-up. The Company also carries physical damage coverage
on offshore assets that is subject to full replacement cost limits. Both of these coverages, operator’s extra expense and physical
damage, are subject to certain customary exclusions and limitations and to deductibles generally ranging from approximately $0.3
million to $2.0 million per occurrence, which must be met prior to recovery. In addition, the Company carries third party liability
insurance, which includes pollution insurance, up to a limit of $50.0 million. This program includes coverage for bodily injury and
property damage to third parties, including sudden and accidental pollution liability coverage. The company also carries Cargo
Insurance of up to $15.0 million per shipment and construction all risks insurance of $25.0 million per occurrence.
Health, Safety and Environmental Program
Our Health, Safety and Environmental (“HSE”) Program is supervised by an HSE officer who reports to senior management to ensure
compliance with all applicable state and federal regulations. Its implementation and execution is the direct responsibility of the
respective country managers in all the countries in which we operate. We have in place an HSE policy that mandates compliance with
all relevant HSE regulations and industry standards in the various countries in which we operate. The policy is designed with the joint
goals of zero injuries and accidents, no risk to occupational health, and no damage to the environment.
9
Source: Erin Energy Corp., 10-K, March 24, 2016 Powered by Morningstar Document Research. The information contained herein may not be copied, adapted or distributed and is not warranted to be accurate, complete or timely. The user assumes all risks for any damages or losses arising from any use of this information, except to the extent such damages or losses cannot be limited or excluded by applicable law. Past financial performance is no guarantee of future results.
EMPLOYEES
At December 31, 2015, the Company had a total of 84 full-time employees, of which 40 were employed in the United States, and 44 in
Africa. We have been successful in attracting a talented team of industry professionals that has been instrumental in achieving
significant growth and success for the Company. In addition to our employees, we utilize the services of various independent
contractors and service providers to perform certain professional services, as needed.
During 2016, the Company may need to hire additional personnel in certain operational positions as needed. The number and skill sets
of individual employees will be primarily dependent on the relative rates of growth of the Company’s different projects and the extent
to which operations and development activities are executed internally or contracted to outside parties. In order for us to attract and
retain qualified personnel, we will have to offer competitive salaries to present and future employees.
AVAILABLE INFORMATION
The Company files or furnishes Annual Reports on Form 10-K, Quarterly Reports on Form 10-Q, Current Reports on Form 8-K,
registrations statements and other items with the Securities and Exchange Commission (“SEC”). We also make available, free of
charge on our Internet website (http://www.erinenergy.com), our Annual Report on Form 10-K, Quarterly Reports on Form 10-Q,
Current Reports on Form 8-K, and if applicable, amendments to those reports filed or furnished pursuant to Section 13(a) of the
Securities Exchange Act of 1934, as amended (the “Exchange Act”) as soon as reasonably practicable after we electronically file such
material with, or furnish it to, the SEC. Forms 3, 4 and 5 filed with respect to our equity securities under Section 16(a) of the
Exchange Act are also available on our website. We will also make available to any shareholder, without charge, copies of our Annual
Report on Form 10-K as filed with the SEC. Individuals wishing to obtain this report, or any other filing, should submit a request to
Erin Energy Corporation, 1330 Post Oak Boulevard, Suite 2250, Houston, TX 77056, Attention: Investor Relations.
The public may also read and copy any materials that we file with the SEC at the SEC’s Public Reference Room at 100 F Street NE,
Washington, DC 20549-0213. The public may obtain information on the operation of the Public Reference Room by calling the SEC
at 1-800-SEC-0330. Also, the SEC maintains an Internet website that contains reports, proxy and information statements, and other
information regarding issuers, including us, that file electronically with the SEC. The public can obtain any documents that we file
with the SEC at http://www.sec.gov.
ITEM 1A. RISK FACTORS
CAUTIONARY STATEMENT RELEVANT TO FORWARD-LOOKING INFORMATION
This Annual Report on Form 10-K includes “forward-looking statements” within the meaning of Section 27A of the Securities Act of
1933, as amended, and Section 21E of the Exchange Act. All statements, other than statements of historical fact, in this report,
including, without limitation, statements regarding our future financial position, business strategy, budgets, projected revenues,
projected costs and plans and objectives of management for future operations, are, or may be deemed to be, forward-looking
statements. Such forward-looking statements involve assumptions, known and unknown risks, uncertainties and other factors, which
may cause the actual results, performance or achievements of the Company, to be materially different from historical earnings and
those presently anticipated or projected or any future results, performance or achievements expressed or implied by such
forward-looking statements contained in this report.
In addition, forward-looking statements generally can be identified by the use of forward-looking terminology such as “anticipate,”
“believe,” “continue,” “could,” “estimate,” “expect,” “forecast,” “goal,” “intend,” “may,” “objective,” “plan,” “potential,” “predict,”
“project,” “should,” “will,” “will likely,” or similar expressions. Although we believe that the expectations reflected in such
forward-looking statements are reasonable, we can give no assurance that such expectations will prove to have been correct. We
caution you not to place undue reliance on any such forward-looking statements, which speak only as of the date made. Important
factors that could affect our financial performance and that could cause actual results for future periods to differ materially from our
expectations include, but are not limited to:
• the supply, demand and market prices of oil and
natural gas;
• our current and future
indebtedness;
• our ability to raise capital to fund our current and future
operations;
• our ability to develop oil and gas
reserves;
• competition from other companies in the energy
market;

Source: Erin Energy Corp., 10-K, March 24, 2016 Powered by Morningstar Document Research. The information contained herein may not be copied, adapted or distributed and is not warranted to be accurate, complete or timely. The user assumes all risks for any damages or losses arising from any use of this information, except to the extent such damages or losses cannot be limited or excluded by applicable law. Past financial performance is no guarantee of future results.
10
Source: Erin Energy Corp., 10-K, March 24, 2016 Powered by Morningstar Document Research. The information contained herein may not be copied, adapted or distributed and is not warranted to be accurate, complete or timely. The user assumes all risks for any damages or losses arising from any use of this information, except to the extent such damages or losses cannot be limited or excluded by applicable law. Past financial performance is no guarantee of future results.
• political instability and foreign government regulations over international
operations;
• our lack of diversification of production and
reserves;
• compliance and enforcement of restriction on production and
exports;
• compliance and enforcement of environmental laws and
regulations;
• our ability to achieve
profitability;
• our dependency on third parties to enable us to produce and deliver oil and gas; and
• other factors disclosed under Item 1. Description of Business, Item 1A. Risk Factors, Item 2. Properties, Item 7.
Management’s Discussion and Analysis of Financial Condition and Results of Operations , Item 7A. Quantitative and
Qualitative Disclosures About Market Risk and elsewhere in this report.
We have based our forward-looking statements on our management’s beliefs and assumptions based on information available to our
management at the time the statements are made. We caution you that assumptions, beliefs, expectations, intentions and projections
about future events may and often do vary materially from actual results. Therefore, we cannot assure you that actual results will not
differ materially from those expressed or implied by our forward-looking statements.
Some of the factors that could cause actual results to differ from those expressed or implied in forward-looking statements are
described in this Item 1A. Risk Factors and in other sections of this Annual Report on Form 10-K. Should one or more of these risks
or uncertainties materialize, or should underlying assumptions prove incorrect, actual outcomes may vary materially from those
indicated. All subsequent written and oral forward-looking statements attributable to us or persons acting on our behalf are expressly
qualified in their entirety by reference to these risks and uncertainties. You should not place undue reliance on our forward-looking
statements. Each forward-looking statement speaks only as of the date of the particular statement, and, except as required by law, we
undertake no duty to update or revise any forward-looking statement.
Risks Related to the Company’s Business
We have substantial indebtedness and may incur substantially more debt. Higher levels of indebtedness make us more vulnerable
to economic downturns and adverse developments in our business.
As of December 31, 2015, we had approximately $50.0 million outstanding in aggregate principal under our Convertible Subordinated
Note, $45.0 million, net of discount, under our borrowing facility with Allied in the form of a convertible note (the "2015 Convertible
Note"), $96.5 million, net of discount, under our credit facility with a Nigerian bank (the "Term Loan Facility"), and $25.0 million
under our borrowing facility with Allied in the form of a promissory note (the "Allied Promissory Note"), and we may incur additional
indebtedness in the future. Our level of indebtedness has, or could have, important consequences to our business because:
• a substantial portion of our cash flows from operations will be dedicated to interest and principal payments and may not be
available for operations, working capital, capital expenditures, expansion, acquisitions, general corporate or other purposes;
• it may impair our ability to obtain additional financing in the future for acquisitions, capital expenditures or general corporate
purposes;
• it may limit our flexibility in planning for, or reacting to, changes in our business and industry; and
• we may be substantially more leveraged than some of our competitors, which may place us at a relative competitive
disadvantage and make us more vulnerable to downturns in our business, our industry or the economy in general.
In addition, the terms of the Term Loan Facility restrict, and the terms of any future indebtedness including any future credit facility
may restrict our ability to incur additional indebtedness and grant liens because of debt or financial covenants we are, or may be,
required to meet. Thus, we may not be able to obtain sufficient capital to grow our business or implement our business strategy and
may lose opportunities to acquire interests in oil properties or related businesses because of our inability to fund such growth.
Our ability to comply with restrictions and covenants, including those in the Term Loan Facility or in any future credit facility, is
uncertain and will be affected by the levels of cash flow from our operations and events or circumstances beyond our control. Our
failure to comply with any of the restrictions and covenants in the Term Loan Facility could result in a default, which could permit the
lenders to accelerate repayments and foreclose on the collateral securing such indebtedness.

Source: Erin Energy Corp., 10-K, March 24, 2016 Powered by Morningstar Document Research. The information contained herein may not be copied, adapted or distributed and is not warranted to be accurate, complete or timely. The user assumes all risks for any damages or losses arising from any use of this information, except to the extent such damages or losses cannot be limited or excluded by applicable law. Past financial performance is no guarantee of future results.
We may not be able to generate or obtain sufficient cash to service all of our indebtedness or trade payables, and we may be forced
to take other actions to satisfy our obligations under our indebtedness and trade payables, which may not be successful.
11

Source: Erin Energy Corp., 10-K, March 24, 2016 Powered by Morningstar Document Research. The information contained herein may not be copied, adapted or distributed and is not warranted to be accurate, complete or timely. The user assumes all risks for any damages or losses arising from any use of this information, except to the extent such damages or losses cannot be limited or excluded by applicable law. Past financial performance is no guarantee of future results.
We may be unable to generate sufficient cash flow from operations or to obtain alternative sources of financing in an amount
sufficient to fund our liquidity needs. Our operating cash inflows are typically used for capital expenditures, operating expenses, debt
service costs and working capital needs.
As a result of the current low commodity prices and the Company’s low oil production volumes due to the currently shut-in of well
Oyo-8, we have experienced a reduction in our available liquidity and we may not have the ability to generate sufficient cash flows
from operations and, therefore, sufficient liquidity to meet our anticipated working capital, debt service and other liquidity needs. As
of December 31, 2015, we had available unrestricted cash of approximately $8.4 million and total current assets of approximately
$26.6 million. Conversely, we had total current liabilities of $341.4 million, of which $213.1 million include accounts payable and
accrued liabilities. Based upon the current commodity prices, we do not expect our cash flow from operations to be sufficient to repay
our indebtedness or trade payables in the near term. We are currently evaluating strategic alternatives to address our liquidity issues
and high debt levels. These efforts include, among others, i) working on re-establishing production from well Oyo-8, ii) obtaining
additional funds through public or private financing sources, iii) restructuring existing debts from lenders, iv) obtaining forbearance of
debt from trade creditors, v) reducing ongoing operating costs, vi) minimizing projected capital costs for the 2016 exploration and
development campaign and vii) farming-out a portion of our rights to certain of our oil and gas properties. There can be no assurances
that sufficient liquidity can be raised from one or more of these actions or that these actions can be consummated within the period
needed to meet future obligations.
We will continue to evaluate our ability to make debt payments in light of our liquidity constraints and as we continue to explore
various strategic initiatives. Any failure to make future principal or interest payments on our indebtedness or to cure any payment
default within any applicable grace period may result in an event of default under the applicable debt agreement or instrument. As a
result, if we are unable to service our debt obligations generally, and if we are unable to successfully refinance our debt obligations or
effect a similar alternative transaction, we cannot assure you that the Company will continue in its current state or that your investment
in the Company will retain any value.
Our business requires substantial additional capital. If we are unable to raise additional capital on acceptable terms in the future,
our ability to execute our business plan may be impaired.
The Company’s business activities require substantial capital from outside sources as well as from internally-generated sources.
Although our majority shareholder has historically provided the Company with additional funding in the past, there can be no
assurances that our majority shareholder will provide any funds in the future or, if the funds are provided, that the terms under which
the funds are provided will be acceptable to us. The Company’s ability to finance a portion of its working capital and capital
expenditure requirements with cash flow from operations will be subject to a number of variables, such as:
• level of production from existing and
new wells;
• prices of oil and
natural gas;
• success and timing of development of proved undeveloped
reserves;
• remedial work to improve a well’s producing capability;
• direct costs and general and administrative expenses of
operations;
• reserves, including a reserve for the estimated costs of eventually plugging and abandoning the wells;
• indemnification obligations of the Company for losses or liabilities incurred in connection with the Company’s activities;
• general economic, financial, competitive, legislative, regulatory and other factors beyond the Company’s control; and
• ability to farm-out portions of the Company’s rights under its various petroleum licenses.
The ongoing significant decline in oil and natural gas prices may make it more difficult for us to obtain additional financing. The
Company might not generate or sustain cash flows at sufficient levels to finance its business activities. When and if the Company
generates significant revenues, if such revenues were to decrease due to lower oil prices, decreased production or other factors, and if
the Company were unable to obtain capital through reasonable financing arrangements, its ability to execute its business plan would
be limited, and it could be required to discontinue operations.

Source: Erin Energy Corp., 10-K, March 24, 2016 Powered by Morningstar Document Research. The information contained herein may not be copied, adapted or distributed and is not warranted to be accurate, complete or timely. The user assumes all risks for any damages or losses arising from any use of this information, except to the extent such damages or losses cannot be limited or excluded by applicable law. Past financial performance is no guarantee of future results.
The Company may continue to incur losses for a significant period of time and may not be able to achieve profitability.
12

Source: Erin Energy Corp., 10-K, March 24, 2016 Powered by Morningstar Document Research. The information contained herein may not be copied, adapted or distributed and is not warranted to be accurate, complete or timely. The user assumes all risks for any damages or losses arising from any use of this information, except to the extent such damages or losses cannot be limited or excluded by applicable law. Past financial performance is no guarantee of future results.
In addition to our interests in the OMLs, including the Oyo field, we have signed four production sharing contracts in Kenya, two
exploration licenses in The Gambia and a petroleum agreement in Ghana. As we are still in the early stages of exploration and have
yet to drill on our Kenyan, Gambian, and Ghanaian blocks, we expect to continue to incur significant expenses relating to our
identification of drilling prospects and investment costs relating to exploration. Additionally, fixed commitments, including salaries
and fees for employees and consultants, rent and other contractual commitments may be substantial and are likely to increase as
exploration drilling is scheduled and personnel are retained. Drilling projects generally require a significant period of time before they
produce resources and generate profits. Our production in the Oyo field may or may not result in net earnings in excess of our losses
on other ventures under development or in the start-up phase. We may not achieve or sustain profitability on a quarterly or annual
basis, or at all.
The geographic concentration of our properties offshore Nigeria, Kenya, The Gambia and Ghana subjects us to an increased risk
of loss of revenue or curtailment of production from factors specifically affecting offshore Nigeria, Kenya, The Gambia and
Ghana.
Our properties are concentrated in four countries: Nigeria, Kenya, The Gambia and Ghana, and all of the value of our production and
reserves is concentrated in a single oilfield offshore Nigeria. Any failure to sustain production, production problems or reduction in
reserve estimates related to the Oyo field would adversely impact our business. In addition, some or all of these properties could be
affected should such regions experience:
• severe weather or natural
disasters;
• moratoria on drilling or permitting
delays;
• delays in or the inability to obtain regulatory
approvals;
• delays or decreases in
production;
• delays or decreases in the availability of drilling rigs and related equipment, facilities, personnel or services;
• delays or decreases in the availability of capacity to transport, gather or process production; and/or
• changes in the regulatory, political and fiscal
environments.
We maintain insurance coverage for only a portion of these risks. There also may be certain risks covered by insurance where the
policy does not reimburse us for all of the costs related to a loss. We do not carry business interruption insurance.
Due to the concentrated nature of our portfolio of properties, a number of our properties could experience any of the same conditions
at the same time, resulting in a relatively greater impact on our results of operations than they might have on other companies that
have a more diversified portfolio of properties.
The loss of key employees could adversely affect the Company’s ability to operate.
The Company believes that its success depends on the continued service of its key employees, as well as the Company’s ability to hire
additional key employees, as needed. Each of the Company’s key employees has the right to terminate his/her employment at any time
without penalty under his/her employment agreement. The unexpected loss of the services of any of these key employees, or the
Company’s failure to find suitable replacements within a reasonable period of time thereafter, could have a material adverse effect on
the Company’s ability to execute its business plan and, therefore, on its financial condition and results of operations.
Failure to effectively execute our exploration and development projects could result in significant delays and/or cost over-runs,
including the delay of any future production, which could negatively impact our operating results, liquidity and financial position.
We currently have a number of exploration projects, all of which are in the early stages of the project development life-cycle, in
addition to our Oyo field development project. Our exploration projects will require substantial additional evaluation and analysis,
including drilling and, in the event a commercial discovery occurs, the expenditure of substantial amounts of capital, prior to preparing
a development plan and seeking formal project sanction. First production from these exploration projects, in the event a discovery is
made, is not expected for several years. Our Oyo field development project and some of our exploration projects are located in
challenging deepwater environments and may entail significant technical challenges, including subsea tiebacks to a floating,
production, storage and offloading vessel or production platform, pressure maintenance systems, gas re-injection systems, and other
specialized infrastructure.
13

Source: Erin Energy Corp., 10-K, March 24, 2016 Powered by Morningstar Document Research. The information contained herein may not be copied, adapted or distributed and is not warranted to be accurate, complete or timely. The user assumes all risks for any damages or losses arising from any use of this information, except to the extent such damages or losses cannot be limited or excluded by applicable law. Past financial performance is no guarantee of future results.
This level of development activity and complexity requires significant effort from our management and technical personnel and places
additional requirements on our financial resources and internal financial controls. In addition, we have increased dependency on
third-party technology and service providers and other supply chain participants for these complex projects. We may not be able to
fully execute these projects due to:
• inability to obtain sufficient and timely
financing;
• inability to attract and/or retain sufficient quantity of personnel with the skills required to bring these complex projects to
production on schedule and on budget;
• significant delays in delivery of essential items or performance of services, cost overruns, supplier insolvency, or other
critical supply failure could adversely affect project development;
• lack of partner or government approval for
projects;
• civil disturbances, anti-development activities, legal challenges or other interruptions which could prevent access; and
• drilling hazards or accidents or natural
disasters.
We may not be able to compensate for, or fully mitigate, these risks.
The Company’s failure to capitalize on existing petroleum agreements could result in an inability by the Company to generate
sufficient revenues and continue operations.
The Company has a 100% economic interest in, and operatorship of, the OMLs in Nigeria, including the Oyo field. The Company has
also entered into definitive petroleum agreements with Kenya, The Gambia, and Ghana. The Company’s business strategy includes
spreading the risk of oil and natural gas exploration, development and drilling, and ownership of interests in oil and natural gas
properties by participating in multiple projects and joint ventures. Failure of the Company to capitalize on its existing contracts could
have a material adverse effect on the Company’s business and results of operations.
Under the terms of our various petroleum agreements, we are required to drill wells, declare any discoveries and conduct certain
development activities in order to retain exploration and production rights and failure to do so may result in substantial license
renewal costs or loss of our interests in the undeveloped parts of our license areas.
In order to protect our exploration and production rights in our license areas, we must meet various drilling and declaration
requirements. In general, unless we make and declare discoveries within certain time periods specified in our various petroleum
agreements and leases, our interests in the undeveloped parts of our license areas may lapse and we may be subject to significant
penalties or be required to make additional payments in order to maintain such licenses. We can make no assurances that we will
receive an extension of the relevant exploration periods for any of our prospects or what the terms of the extensions might be.
Our proved reserves are based on many assumptions that may turn out to be inaccurate. Any significant inaccuracies in these
reserve estimates or underlying assumptions could materially affect the quantities and present value of our reserves . Of our total
estimated proved reserves at December 31, 2015, 4.4 million Bbls were proved undeveloped reserves which ultimately may be less
than currently estimated.
The process of estimating oil and natural gas reserves is complex. It requires interpretations of available technical data and many
assumptions, including assumptions relating to current and future economic conditions and commodity prices. Any significant
inaccuracies in these interpretations or assumptions could materially affect the estimated quantities. In the case of production sharing
contracts, the quantities allocable to a part-interest owner’s share are affected by the assumptions of that owner’s future participation
in funding of operating and capital costs. Actual future production, prices, revenues, taxes, development expenditures, operating
expenses and quantities of recoverable oil and natural gas reserves will vary from estimates. Any significant variance could materially
affect the estimated quantities and present value of reserves disclosed. In addition, estimates of proved reserves reflect production
history, results of exploration and development, prevailing prices and other factors, many of which are beyond our control. Due to the
limited production history, the estimates of future production associated with such properties may be subject to greater variance to
actual production than would be the case with properties having a longer production history.
Our exploration projects remain subject to varying degrees of additional evaluation, analysis and partner and regulatory approvals
prior to official project sanction and production.
14

Source: Erin Energy Corp., 10-K, March 24, 2016 Powered by Morningstar Document Research. The information contained herein may not be copied, adapted or distributed and is not warranted to be accurate, complete or timely. The user assumes all risks for any damages or losses arising from any use of this information, except to the extent such damages or losses cannot be limited or excluded by applicable law. Past financial performance is no guarantee of future results.
A discovery made by the initial exploration well on a prospect does not ensure that we will ultimately develop or produce
hydrocarbons from such prospect or that a development project will be economically viable or successful. Following a discovery by an
initial exploration well, substantial additional evaluation, analysis, expenditure of capital and partner and regulatory approvals will
need to be performed and obtained prior to official project sanction and development, which may include (i) the drilling of appraisal
wells, (ii) the evaluation and analysis of well logs, reservoir core samples, fluid samples and the results of production tests from both
exploration and appraisal wells, and (iii) the preparation of a development plan which includes economic assumptions on future oil
and gas prices, the costs of drilling development wells, and the construction or leasing of offshore production facilities and
transportation infrastructure. Regulatory approvals are also required to proceed with certain development plans.
Any of the foregoing steps of evaluation and analysis may render a particular development project uneconomic, and we may
ultimately decide to abandon the project, despite the fact that the initial exploration well, or subsequent appraisal or development
wells, discovered hydrocarbons. We may also decide to abandon a project based on forecasted oil and gas prices or the inability to
obtain sufficient financing. We may not be successful in obtaining partner or regulatory approvals to develop a particular discovery,
which could prevent us from proceeding with development and ultimately producing hydrocarbons from such discovery, even if we
believe a development would be economically successful.
The Company’s oil and gas operations are subject to various risks beyond the Company’s control.
The Company expects to produce, transport and market potentially toxic materials and purchase, handle and dispose of other
potentially toxic materials in the course of its business. The Company’s operations will produce byproducts, which may be considered
pollutants. Any of these activities could result in liability, either as a result of an accidental, unlawful discharge or as a result of new
findings on the effects of the Company’s operations on human health or the environment. Additionally, the Company’s oil and gas
operations may also involve one or more of the following risks:
• fires and
explosions;
• blow-outs and oil
spills;
• pipe or cement failures and casing
collapses;
• uncontrollable flows of oil, gas, formation water, or drilling
fluids;
• embedded oilfield drilling and
services tools;
• abnormally pressured
formations;
• natural
disaster;
• vandalism and
terrorism; and
• environmental
hazards.
In the event that any of the foregoing events occur, the Company could incur substantial losses as a result of (i) injury or loss of life;
(ii) severe damage or destruction of property, natural resources or equipment; (iii) pollution and other environmental damage; (iv)
investigatory and clean-up responsibilities; (v) regulatory investigation and penalties; (vi) suspension of its operations; or (vii) repairs
to resume operations. If the Company experiences any of these problems, its ability to conduct operations could be adversely affected.
Additionally, offshore operations are subject to a variety of risks, such as capsizing, collisions and damage or loss from typhoons or
other adverse weather conditions. These conditions could cause substantial damage to facilities and interrupt production.
The Company is dependent on others for the storage and transportation of all of its oil and gas which could result in significant
operational costs to the Company and depletion of capital.
The Company does not own storage or transportation facilities and, therefore, will depend upon third parties to store and transport all
of its oil and gas resources when and if produced. The Company will likely be subject to price changes and termination provisions in
any contracts it may enter into with these third-party service providers. The Company may not be able to identify such third parties for
any particular project. Even if such sources are initially identified, the Company may not be able to identify alternative storage and
transportation providers in the event of contract price increases or termination. In the event the Company is unable to find acceptable
third-party service providers, it would be required to contract for its own storage facilities and employees to transport the Company’s
resources. The Company may not have sufficient capital available to assume these obligations, and its inability to do so could result in

Source: Erin Energy Corp., 10-K, March 24, 2016 Powered by Morningstar Document Research. The information contained herein may not be copied, adapted or distributed and is not warranted to be accurate, complete or timely. The user assumes all risks for any damages or losses arising from any use of this information, except to the extent such damages or losses cannot be limited or excluded by applicable law. Past financial performance is no guarantee of future results.
the cessation of its business.
15

Source: Erin Energy Corp., 10-K, March 24, 2016 Powered by Morningstar Document Research. The information contained herein may not be copied, adapted or distributed and is not warranted to be accurate, complete or timely. The user assumes all risks for any damages or losses arising from any use of this information, except to the extent such damages or losses cannot be limited or excluded by applicable law. Past financial performance is no guarantee of future results.
Drilling wells is speculative, often involving significant costs that may be more than our estimates and may not result in any
discoveries or additions to our future production or reserves. Any material inaccuracies in drilling costs, estimates or underlying
assumptions will materially affect our business.
Exploring for and developing oil reserves involves a high degree of operational and financial risk, which precludes definitive
statements as to the time required and costs involved in reaching certain objectives. The budgeted costs of drilling, completing and
operating exploration, appraisal and development wells are often exceeded and can increase significantly when drilling costs rise due
to a tightening in the supply of various types of oilfield equipment and related services. Drilling may be unsuccessful for many
reasons, including geological conditions, weather, cost overruns, equipment shortages and mechanical difficulties. Exploration wells
bear a much greater risk of financial loss than development wells. In the past we have experienced unsuccessful drilling efforts.
Moreover, the successful drilling of an oil well does not necessarily result in a profit on investment. A variety of factors, both
geological and market-related, can cause a well or an entire development project to become uneconomic or only marginally economic.
Our initial drilling sites, and any potential additional sites that may be developed, require significant additional exploration and
appraisal, regulatory approval and commitments of resources prior to commercial development. We face additional risks due to i) a
general lack of infrastructure in areas in which we operate, ii) underdeveloped oil and gas industries in areas in which we operate, and
iii) increased transportation expenses due to geographic remoteness. Thus, this may require either a single well to be exceptionally
productive, or the existence of multiple successful wells, to allow for the development of a commercially viable field. If our actual
drilling and development costs are significantly more than our estimated costs, we may not be able to continue our business operations
as proposed and would be forced to modify our plan of operation.
We contract with third parties to conduct drilling and related services on our development and exploration prospects for us. Such third
parties may not perform the services they provide us on schedule or within budget. The ongoing decline in oil and gas prices may have
an adverse impact on certain third parties from which we contract drilling, development and related oilfield services, which in turn
could affect such companies' ability to perform such services for us and result in delays to our exploration, appraisal and development
activities. Furthermore, the drilling equipment, facilities and infrastructure owned and operated by the third parties we contract with is
highly complex and subject to malfunction and breakdown. Any malfunctions or breakdowns may be outside our control and result in
delays, which could be substantial. Any delays in our drilling campaign caused by equipment, facility or equipment malfunction or
breakdown could materially increase our costs of drilling and cause an adverse effect on our business, financial position and results of
operations.
An interruption in the supply of materials, resources or services, including storage and transportation of oil and gas, could limit
the Company’s operations and cause unprofitability.
The Company obtains, and will need to obtain materials, resources and services, including, but not limited to, specialized chemicals,
specialty muds, drilling fluids, pipe, drill-string and geological and geophysical mapping and interpretation services to carry out its
operations. There may be only a limited number of manufacturers and suppliers of these materials, resources and services.
Additionally, these manufacturers and suppliers may experience difficulty in supplying such materials, resources and services to the
Company sufficient to meet its needs or may terminate or fail to renew contracts for supplying these materials, resources or services
on terms the Company finds acceptable including, without limitation, acceptable pricing terms.
The Company does not presently carry business interruption insurance policies in Africa and will be at risk of incurring business
interruption loss due to theft, accidents or natural disasters.
The Company does not presently carry any policies of insurance in Africa to help protect itself from interruptions to its business. In
the event that the Company were to incur business interruption losses with respect to one or more incidents, this could adversely affect
its operations, and it may not have the necessary capital to maintain business operations.
Our business partner, CEHL, is a related party, and our executive chairman and CEO is a principal owner and one of the directors
of CEHL, which may result in real or perceived conflicts of interest.
Dr. Kase Lawal, the Company’s Executive Chairman and member of the Board of Directors, and Chief Executive Officer, is a director
of each of CEHL, CINL, and Allied, also entities constituting the CEHL Group. Dr. Lawal also owns 27.7% of CAMAC International
Limited, which indirectly owns 100% of CEHL. CINL and Allied are each wholly owned subsidiaries of CEHL. As a result, Dr.
Lawal may be deemed to have an indirect material interest in any transactions with CEHL including the agreements entered into with
CEHL in April 2010, the OMLs transaction, the Promissory Note, the Convertible Subordinated Note, and the 2015 Convertible Note
with Allied (see Note 9. — Debt to the Notes to Consolidated Financial Statements for further information regarding the Promissory
Note, the Convertible Subordinated Note and the 2015 Convertible Note) and the Transfer Agreement
16

Source: Erin Energy Corp., 10-K, March 24, 2016 Powered by Morningstar Document Research. The information contained herein may not be copied, adapted or distributed and is not warranted to be accurate, complete or timely. The user assumes all risks for any damages or losses arising from any use of this information, except to the extent such damages or losses cannot be limited or excluded by applicable law. Past financial performance is no guarantee of future results.
with Allied (see Note 4. — Acquisitions to the Notes to Consolidated Financial Statements for further information). These
relationships may result in conflicts of interest. Although processes and procedures are in place within the Company to guard against
such potential conflicts of interest, we may not be able to prove that these agreements are equivalent to arm’s length transactions.
Should our transactions not provide the value equivalent of arm’s length transactions, our results of operations may suffer, and we
may be subject to costly shareholder litigation.
If CEHL, our majority shareholder, loses its status as an indigenous Nigerian oil and gas operator, we would no longer be eligible
for preferential treatment in the acquisition of oil and gas assets and oil and gas licensing rounds in Nigeria.
The Company by virtue of our majority stockholder, CEHL, which has indigenous status in Nigeria, is eligible for preferential
treatment under the Nigerian Content Development Act with respect to the acquisition of oil and gas assets and in oil and gas licensing
rounds in Nigeria. If CEHL were to lose its status as an indigenous Nigerian oil and gas company due to its affiliation with our
U.S.-based company or otherwise, or if CEHL’s majority interest in us were to be diluted or reduced due to additional issuances of
equity by the Company, or if CEHL were to sell or transfer its interest in the Company or otherwise, we may lose our status as an
indigenous Nigerian oil and gas operator. As a result, we would lose one of our key advantages in the Nigerian oil and gas market, and
our results of operations could materially suffer.
Applicable Nigerian income tax rates could adversely affect the value of the OMLs, including the Oyo field.
Income derived from our contractual interests in the Oyo field, and EPNL, as acquiring subsidiary in the transactions through which
we obtained these contractual interests, are subject to the jurisdiction of the Nigerian taxing authorities. The Nigerian government
applies different petroleum profit tax rates upon income derived from Nigerian oil operations ranging from 50% to 85% based on a
number of factors. The final determination of the tax liabilities with respect to the OMLs involves the interpretation of local tax laws
and related authorities. In addition, changes in the operating environment, including changes in tax law and currency/repatriation
controls, could impact the determination of tax liabilities with respect to the OMLs for a tax year. While we believe the petroleum
profit tax rate applicable to the OMLs is 50%, the actual applicable rate could be higher, which could result in a material decrease in
the profits allocable to the Company under the OMLs.
The passage into law of the Nigerian Petroleum Industry Bill could create additional fiscal and regulatory burdens on the parties
to the OMLs, which could have a material adverse effect on the profitability of the production.
A Petroleum Industry Bill (“PIB”) is currently undergoing legislative review at the Nigerian National Assembly. The draft PIB seeks
to introduce significant changes to legislation governing the oil and gas sector in Nigeria, including new fiscal regulatory and tax
obligations and expanded fiscal and regulatory oversight that may impose additional operational and regulatory burdens on the
Company and impact the economic benefits anticipated by the Company. Any such fiscal and regulatory changes could have a
negative impact on the profits allocable to the Company under the OMLs.
The OMLs are located in an area where there are high security risks which could result in harm to the Oyo field operations and
our interest in the Oyo field and the remainder of the OMLs.
There are risks inherent to oil production in Nigeria. The Oyo field is located approximately 75 kilometers (46 miles) off the Nigerian
coast in deep water. Despite undertaking various security measures and being situated 75 kilometers offshore the Nigerian coast, the
FPSO vessel currently being used for storing petroleum production in the Oyo field may become subject to terrorist acts and other acts
of hostility like piracy. Such actions could adversely impact our overall business, financial condition and operations. Our facilities are
subject to these substantial security risks and our financial condition and results of operations may materially suffer as a result.
Terrorist acts and regional hostilities around the world in recent years have led to increases in insurance premium rates and the
implementation of special “war risk” premiums for certain areas. Such increases in insurance rates may adversely affect our
profitability with respect to the Oyo field asset.
Maritime disasters and other operational risks may adversely impact our financial condition and results of operations.
The operation of the FPSO vessel has an inherent risk of maritime disaster, environmental mishaps, cargo and property losses or
damage and business interruptions caused by, among others:
• mechanical failure and dry dock
repairs;
• vessel off hire periods and labor
strikes;
• human error and adverse
weather; and
17
Source: Erin Energy Corp., 10-K, March 24, 2016 Powered by Morningstar Document Research. The information contained herein may not be copied, adapted or distributed and is not warranted to be accurate, complete or timely. The user assumes all risks for any damages or losses arising from any use of this information, except to the extent such damages or losses cannot be limited or excluded by applicable law. Past financial performance is no guarantee of future results.
• political action, civil conflict, terrorism and piracy in the vessel's home country or operation site or to the vessel's supply.
Any of these circumstances could adversely affect the operation of the FPSO vessel and result in loss of revenues or increased costs
and adversely affect our profitability.
Events of default may occur under our debt instruments. If events of default occur or lenders under these debt instruments
accelerate the obligations thereunder, cross-defaults will exist under certain of our remaining indebtedness and we will not be able
to repay the obligations that become immediately due.
Events of default may occur under our debt instruments. If events of default occur or lenders under these debt instruments accelerate
the obligations thereunder, cross-defaults will exist under certain of our remaining indebtedness, including the Convertible
Subordinated Note, the 2015 Convertible Note, the Term Loan Facility and the Promissory Note, and we will not be able to repay the
obligations that become immediately due. If any of our debt obligations are accelerated due to the future events of default or
cross-defaults, we may not be able to repay the obligations that become immediately due and will have severe liquidity restraints.
Risks Related to the Company’s Industry
Continuation of the recent decline in oil and natural gas prices may adversely affect our business, financial condition and results
of operations.
Oil and gas prices are in the midst of a severe and prolonged downturn. The significant decline in oil and gas prices over the past
eighteen months has had, and will continue to have, a significant adverse effect on our business, results of operations, liquidity and
market price of our common stock. The prices received for the Oyo field production will heavily influence our revenue, profitability,
access to capital and future rate of growth. Oil is a commodity, and its price is subject to wide fluctuations in response to relatively
minor changes in supply and demand. Historically the market for oil has been volatile. The oil market will likely continue to be
volatile in the future. The prices received and the levels of production depend on numerous factors beyond our control. These factors
include:
• global economic
conditions;
• changes in global supply of and demand for oil or
natural gas;
• actions of the Organization of Petroleum Exporting Countries with respect to production levels and pricing;
• price and quantity of imports of
foreign oil;
• local and international political, economic and weather
conditions;
• political and military conflicts in oil producing regions or other geographical areas or acts of terrorism in the U.S. or
elsewhere;
• domestic and international relations, regulations and tax
policies;
• effects from the actions of other oil producing
countries;
• global oil exploration and production
levels;
• global oil inventory
levels;
• the development, exploitation, price and availability of alternative
fuels;
• reduction in energy consumption due to technological
advances;
• speculation by investors in oil and
gas; and
• proximity and capacity of transportation pipelines and
facilities.
Significant and prolonged declines in crude oil and natural gas prices, such as the decline we are currently experiencing, may have the

Source: Erin Energy Corp., 10-K, March 24, 2016 Powered by Morningstar Document Research. The information contained herein may not be copied, adapted or distributed and is not warranted to be accurate, complete or timely. The user assumes all risks for any damages or losses arising from any use of this information, except to the extent such damages or losses cannot be limited or excluded by applicable law. Past financial performance is no guarantee of future results.
following effects on our business:
• limiting our financial condition, liquidity and/or ability to fund planned capital expenditures and operations;
• reducing the amount of crude oil and natural gas that we can produce economically;
• causing us to delay or postpone some of our capital
projects;
• reducing our revenues, operating income and
cash flows;
• limiting our access to sources of capital, such as equity and long-term
debt;
• reducing the carrying value of our crude oil and natural gas
properties;
• reducing the carrying value of
goodwill; and/or
• reducing the market price of our
common stock.
18

Source: Erin Energy Corp., 10-K, March 24, 2016 Powered by Morningstar Document Research. The information contained herein may not be copied, adapted or distributed and is not warranted to be accurate, complete or timely. The user assumes all risks for any damages or losses arising from any use of this information, except to the extent such damages or losses cannot be limited or excluded by applicable law. Past financial performance is no guarantee of future results.
The Company may not be successful in finding, acquiring, or developing sufficient petroleum reserves, and a failure to do so could
materially adversely affect our financial position, liquidity and ability to continue operations.
The Company operates solely in the petroleum extractive business; therefore, if it is not successful in finding crude oil and natural gas
sources with good prospects for future production, and exploiting such sources, its business will not be profitable and it may be forced
to terminate its operations. Exploring and exploiting oil and gas or other sources of energy entails significant risks, which risks can
only be partially mitigated by technology and experienced personnel. The Company or any venture it acquires or participates in may
not be successful in finding petroleum or other energy sources, or if it is successful in doing so, the Company may not be successful in
developing such resources and producing quantities sufficient to permit the Company to conduct profitable operations. The
Company’s future success will depend in large part on the success of its drilling programs and creating and maintaining an inventory
of projects. Creating and maintaining an inventory of projects depends on many factors, including, among other things, obtaining
rights to explore, develop and produce hydrocarbons in promising areas, drilling success, an ability to bring long lead-time, capital
intensive projects to completion on budget and schedule and efficient and profitable operation of mature properties. The Company’s
inability to successfully identify and exploit crude oil and natural gas sources would have a material adverse effect on its business and
results of operations and could result in the cessation of its business operations.
In addition to the numerous operating risks described in more detail in this report, exploration and exploitation of energy sources
involve the risk that no commercially productive oil or gas reservoirs will be discovered or, if discovered, that the cost or timing of
drilling, completing and producing wells will not result in profitable operations. The Company’s drilling operations may be curtailed,
delayed or abandoned as a result of a variety of factors, including:
• adverse weather
conditions;
• unexpected drilling
conditions;
• irregularities in
formations;
• pressure
irregularities;
• equipment failures or
accidents;
• inability to comply with governmental
requirements;
• shortages or delays in the availability of
drillings rigs;
• shortages or delays in the availability of other oilfield equipment and services;
and
• shortages or unavailability of qualified labor to complete the drilling programs according to the business plan schedule.
Our offshore production and exploration activities will involve special risks that could adversely affect operations.
Offshore operations are subject to a variety of operating risks specific to the marine environment, such as capsizing, collisions and
damage or loss from hurricanes or other adverse weather conditions. These conditions can cause substantial damage to facilities and
interrupt our operations. As a result, we could incur substantial expenses that could reduce or eliminate the funds available for
exploration, development or leasehold acquisitions, or result in loss of equipment and properties.
Deepwater exploration and production generally involves greater operational and financial risks than on the shelf. Deepwater drilling
generally requires more time and more advanced drilling technologies, involving a higher risk of technological failure and usually
higher drilling costs. Such risks are particularly applicable to our deepwater operations in the Oyo field. In addition, there may be
production risks of which we are currently unaware. Whether we use existing pipeline infrastructure, participate in the development of
new subsea infrastructure or use floating production systems to transport oil from producing wells, if any, these operations may
require substantial time for installation, or encounter mechanical difficulties and equipment failures that could result in significant cost
overruns and delays. Furthermore, operations in frontier areas generally lack the physical and oilfield service infrastructure present in
more mature basins. As a result, a significant amount of time may elapse between a discovery and the marketing of the associated
hydrocarbons, increasing both the financial and operational risk involved with these operations. Because of the lack and high cost of
this infrastructure, oil and gas discoveries we make in the deepwater, if any, may never be economically producible.
In addition, in the event of a well control incident, containment and, potentially, cleanup activities for offshore drilling are costly. The
resulting regulatory costs or penalties, and the results of third party lawsuits, as well as associated legal and support expenses,

Source: Erin Energy Corp., 10-K, March 24, 2016 Powered by Morningstar Document Research. The information contained herein may not be copied, adapted or distributed and is not warranted to be accurate, complete or timely. The user assumes all risks for any damages or losses arising from any use of this information, except to the extent such damages or losses cannot be limited or excluded by applicable law. Past financial performance is no guarantee of future results.
including costs to address negative publicity, could well exceed the actual costs of containment and cleanup. As a result, a well control
incident could result in substantial liabilities for us, and have a significant negative impact on our earnings, cash flows, liquidity,
financial position, and stock price.
19

Source: Erin Energy Corp., 10-K, March 24, 2016 Powered by Morningstar Document Research. The information contained herein may not be copied, adapted or distributed and is not warranted to be accurate, complete or timely. The user assumes all risks for any damages or losses arising from any use of this information, except to the extent such damages or losses cannot be limited or excluded by applicable law. Past financial performance is no guarantee of future results.
The energy market in which the Company operates is highly competitive.
Competition in the oil and gas industry is intense, particularly with respect to access to drilling rigs and other services, the acquisition
of properties and the hiring and retention of technical personnel. The Company expects competition in the market to remain intense
because of the increasing global demand for energy, and that competition will increase significantly as new companies enter the
market and current competitors continue to seek new sources of energy and leverage existing sources. Many of the Company’s
competitors, including large oil companies, have an established presence in the areas we do business and have longer operating
histories, significantly greater financial, technical, marketing, development, extraction and other resources and greater name
recognition than the Company does. As a result, they may be able to respond more quickly to new or emerging technologies, changes
in regulations affecting the industry, newly discovered resources and exploration opportunities, as well as to large swings in oil and
natural gas prices. In addition, increased competition could result in lower energy prices, reduced margins and loss of market share,
any of which could harm the Company’s business. Furthermore, increased competition may harm the Company’s ability to secure
ventures on terms favorable to it and may lead to higher costs and reduced profitability, which may seriously harm its business.
Hedging transactions may limit the Company’s potential gains and increase the Company’s potential losses.
To date, the Company has not entered into any hedging transactions but may do so in the future. In the event that the Company
chooses not to hedge its exposure to reductions in oil and gas prices, it could be subject to significant reduction in prices which could
have a material adverse impact on its profitability. Alternatively, the Company may elect to enter into hedging transactions with
respect to a portion of its production to achieve more predictable cash flow and to reduce its exposure to price fluctuations. The use of
hedging transactions could limit future revenues from price increases and could expose the Company to adverse changes in basis risk,
the relationship between the price of the specific oil or gas being hedged and the price of the commodity underlying the futures
contracts or other instruments used in the hedging transaction. Hedging transactions also involve the risk that the counterparty does
not satisfy its obligations.
The Company may be required to take non-cash asset write-downs.
Under applicable accounting rules, the Company has recorded an impairment charge of $281.8 million, including a charge of $249.2
million to write down the carrying value of its oil and gas properties as of December 31, 2015 to their estimated fair values, and a
charge of $32.6 million to write-off the carrying value of well Oyo-5 from work in progress because the Company no longer intends to
recomplete it into a water injection well under current plans. The Company may record additional impairment charges in future
periods if oil and natural gas prices do not recover or if there are substantial downward adjustments to its estimated proved reserves,
increases in its estimates of development costs or deterioration in its exploration results. Accounting standards require the Company to
review its long-lived assets for possible impairment whenever changes in circumstances indicate that the carrying amount of an asset
may not be fully recoverable over time. In such cases, if the asset’s estimated undiscounted future net cash flows are less than its
carrying amount, impairment exists. Any impairment write-down, which would equal the excess of the carrying amount of the assets
being written down over their estimated fair value, would have a negative impact on the Company’s earnings, which could be
material.
Cyber incidents may adversely impact our operations.
We have become increasingly dependent upon digital technologies to operate our exploration, development and production business.
We depend on digital technology to estimate quantities of oil and gas reserves, process and record financial and operating data,
analyze seismic and drilling information and communicate with our employees and third-party partners. Unauthorized access to our
seismic data, reserves information or other proprietary information could lead to data corruption, communication interruption or other
operational disruptions in our exploration or production operations. Also, nearly all of the oil and gas distribution systems in the world
are dependent on digital technologies. The U.S. government has issued public warnings that indicate that energy assets might be
specific targets of cyber security threats. Deliberate attacks on, or unintentional events affecting, our systems or infrastructure or the
systems or infrastructure of third parties could lead to corruption or loss of our proprietary data and potentially sensitive data, delays in
production or delivery of oil or natural gas, difficulty in completing and settling transactions, challenges in maintaining our books and
records, environmental damage, communication interruptions, other operational disruptions and third-party liability. We have not
suffered any material losses relating to such attacks; however, there is no assurance that we will not suffer such losses in the
future. Although historically we have not incurred material expenditures for protective measures related to potential cyber-attacks, as
cyber-attacks continue to evolve, we may be required
20

Source: Erin Energy Corp., 10-K, March 24, 2016 Powered by Morningstar Document Research. The information contained herein may not be copied, adapted or distributed and is not warranted to be accurate, complete or timely. The user assumes all risks for any damages or losses arising from any use of this information, except to the extent such damages or losses cannot be limited or excluded by applicable law. Past financial performance is no guarantee of future results.
to expend significant additional resources to continue to modify or enhance our protective measures or to investigate and remediate
any vulnerabilities to cyber-attacks.
Risks Related to International Operations
The Company’s international operations subject it to certain risks inherent in conducting business in Sub-Saharan Africa,
including political instability and foreign government regulation, which could significantly impact the Company’s ability to
operate in such countries and impact the Company’s results of operations.
The Company conducts substantially all of its business in Sub-Saharan Africa. The Company’s present and future international
operations in foreign countries are, and will be, subject to risks generally associated with conducting businesses in foreign countries,
such as:
• laws and regulations that may be materially different from those of the United
States;
• changes in applicable laws and
regulations;
• challenges to or failure of
title;
• labor and political
unrest;
• currency
fluctuations;
• changes in economic and political
conditions;
• export and import
restrictions;
• tariffs, customs, duties and other trade
barriers;
• difficulties in staffing and managing
operations;
• longer time period and difficulties in collecting accounts receivable and enforcing agreements;
• possible loss of properties due to nationalization or
expropriation; and
• limitations on repatriation of income or
capital.
Specifically, foreign governments may enact and enforce laws and regulations requiring increased ownership by businesses and/or
state agencies in energy producing businesses and the facilities used by these businesses, which could adversely affect the Company’s
ownership interests in then existing ventures. The Company’s ownership structure may not be adequate to accomplish the Company’s
business objectives in Nigeria or in any other foreign jurisdiction where the Company may operate. Foreign governments also may
impose additional taxes and/or royalties on the Company’s business, which would adversely affect the Company’s profitability and
value of our foreign assets, including its interests in the OMLs. In certain locations, governments have imposed restrictions, controls
and taxes, and in others, political conditions have existed that may threaten the safety of employees and the Company’s continued
presence in those countries. Internal unrest, acts of violence or strained relations between a foreign government and the Company or
other governments may adversely affect its operations. These developments may, at times, significantly affect the Company’s results
of operations and must be carefully considered by its management when evaluating the level of current and future activity in such
countries.
The future success of the Company’s operations may also be adversely affected by risks associated with international activities,
including economic and labor conditions, political instability, risk of war, nationalization or other expropriation of private enterprises,
repatriation, termination, renegotiation or modification of existing contracts, tax laws (including host-country import-export, excise
and income taxes and United States taxes on foreign subsidiaries), restrictions on currency conversion, devaluations of currency,
restrictions or prohibitions on dividend payments to stockholders or changes in government policies, laws or regulations. For example,
the Nigerian government has implemented certain control measures with regards to the quarterly exportation and sale of crude oil
products from Nigeria. Accordingly, petroleum producers are required to obtain export permits quarterly for crude oil liftings. During
the period from May to September 2015, the Company produced approximately 1.5 million Bbls of crude oil but only sold

Source: Erin Energy Corp., 10-K, March 24, 2016 Powered by Morningstar Document Research. The information contained herein may not be copied, adapted or distributed and is not warranted to be accurate, complete or timely. The user assumes all risks for any damages or losses arising from any use of this information, except to the extent such damages or losses cannot be limited or excluded by applicable law. Past financial performance is no guarantee of future results.
approximately 0.6 million Bbls due to unexpected delays in the issuance of export permits for the quarter ending September 30, 2015.
Realization of any of these factors could materially and adversely affect our financial position, results of operations and cash flows
and result in the loss of all or substantially all of the Company’s assets or in a total loss of your investment in the Company.
We are subject to extensive environmental regulations.
Our operations are subject to extensive national, state and local environmental regulations. Environmental rules and regulations cover
oil exploration and development activities as well as transportation, refining and production activities. These regulations establish,
among others, quality standards for hydrocarbon products, air emissions, water discharges and waste disposal, environmental
standards for abandoned crude oil wells, remedies for soil, water pollution and the general storage, handling,
21
Source: Erin Energy Corp., 10-K, March 24, 2016 Powered by Morningstar Document Research. The information contained herein may not be copied, adapted or distributed and is not warranted to be accurate, complete or timely. The user assumes all risks for any damages or losses arising from any use of this information, except to the extent such damages or losses cannot be limited or excluded by applicable law. Past financial performance is no guarantee of future results.
transportation and treatment of hydrocarbons. Non-compliance with environmental laws may result in fines, restrictions on
operations or other sanctions. We are also subject to state and local environmental regulations issued by the regional environmental
authorities, which oversee compliance with each state’s environmental laws and regulations by oil and gas companies. If we fail to
comply with any of these national or local environmental regulations we could be subject to administrative and criminal penalties,
including warnings, fines and facilities closure orders.
In Nigeria, where we are currently producing, environmental regulations will substantially impact our operations and business results
as a result of the creation of the Federal Ministry of Environment (“FME”) in 1999 and the enactment of more rigorous laws, such as
the Environmental Guidelines and Standards for the Petroleum Industry in Nigeria (EGASPIN) 2002. Under the Environmental
Impact Assessment Act of 1992, all exploratory project drilling must have an environmental impact assessment approved by the FME
and must receive an environmental permit from the local authorities. We are required to prevent the escape of petroleum into any
water, well, spring, stream river, lake reservoir, estuary or harbor, and government inspectors may examine our premises to ensure that
we comply with the regulations. The Department of Petroleum Resources also regulates environmental issues by requiring operators in
the oil and gas industry to obtain permits for oil-related effluent discharges from point sources and oil-related project development.
Compliance and enforcement of environmental laws and regulations, including those related to climate change, may affect
operations and cause the Company to incur significant expenditures.
Extensive national, regional and local environmental laws and regulations in Africa are expected to have a significant impact on the
Company’s operations. These laws and regulations set various standards regulating certain aspects of health and environmental
quality, which provide for user fees, penalties and other liabilities for the violation of these standards. As new environmental laws and
regulations are enacted and existing laws are repealed, interpretation, application and enforcement of the laws may become
inconsistent. Compliance with applicable local laws in the future could require significant expenditures, which may adversely affect
the Company’s operations. The enactment of any such laws, rules or regulations in the future may have a negative impact on the
Company’s projected growth, which could decrease projected revenues or increase costs. In addition, non-governmental organizations
concerned with the environment may take an interest in the Company’s operations and attempt to disrupt or halt operations in areas
deemed environmentally sensitive. The Company’s response to these efforts could require unforeseen expenditures, cause delays in
execution, and affect operations.
We may be exposed to liabilities under the U.S. Foreign Corrupt Practices Act, which could have a material adverse effect on our
business, and the continued existence of official corruption and bribery in Africa, and the inability or unwillingness of authorities
to combat such corruption, may negatively impact our ability to fairly and effectively compete.
We are subject to the U.S. Foreign Corrupt Practices Act (“FCPA”) and other laws that prohibit improper payments or offers of
payments to foreign governments and their officials and political parties for the purpose of obtaining or retaining business. We do
business and may do additional business in the future in countries and regions in which we may face, directly or indirectly, corrupt
demands by officials, tribal or insurgent organizations, or private entities. Thus, we face the risk of unauthorized payments or offers of
payments by one of our employees or consultants, given that these parties may not always be subject to our control. Our existing
safeguards and any future improvements may prove to be less than effective, and our employees and consultants may engage in
conduct for which we might be held responsible. In the future, we may be partnered with other companies with whom we are
unfamiliar. Violations of the FCPA may result in severe criminal or civil sanctions, and we may be subject to other liabilities, which
could negatively affect our business, operating results and financial condition.
Official corruption and bribery remains a serious concern in Sub-Saharan Africa. For example, the 2014 Transparency International
report ranked Nigeria 136 out of 177 countries in terms of corruption perceptions. In an attempt to combat corruption in the oil and gas
sector, the National Assembly passed the Nigeria Extractive Industries Transparency Initiative Act 2007. This action permitted
Nigeria to become a candidate country under the Extractive Industries Transparency Initiative (“EITI”), the first step in bringing
transparency to all material oil, gas and mining payments to the Nigerian government. In addition, Nigeria has amended its banking
laws to permit the government to bring corrupt bank officials to justice. Several notable cases have been brought, but, to date, few
significant cases have been successful and bank regulatory oversight remains a concern. Thus, increased diligence may be required in
working with or through Nigerian banks or with Nigerian governmental authorities, and interactions with government officials may
need to be monitored. To the extent that such efforts to increase transparency are unsuccessful, and competitors utilize the existence of
corruptive practices in order to secure an unfair advantage, our financial condition and results of operations may suffer.
22

Source: Erin Energy Corp., 10-K, March 24, 2016 Powered by Morningstar Document Research. The information contained herein may not be copied, adapted or distributed and is not warranted to be accurate, complete or timely. The user assumes all risks for any damages or losses arising from any use of this information, except to the extent such damages or losses cannot be limited or excluded by applicable law. Past financial performance is no guarantee of future results.
A deterioration of relations between the United States and Nigeria or other African governments could have a material adverse
effect on the Company, the market price of the Company’s common stock and the value of the Company’s investments.
At various times during recent years, the United States has had significant disagreements over political, economic and security issues
with governments in Sub-Saharan Africa. Additional controversies may arise in the future. Any political or trade controversies,
whether or not directly related to the Company’s business, could have a material adverse effect on the Company, the market price of
the Company’s common stock and the value of the Company’s investments in Sub-Saharan Africa.
Risks Related to the Company’s Stock
CAMAC Energy Holdings Limited is our majority stockholder, and it may take actions that conflict with the interests of other
stockholders.
Following the Allied Transaction, CEHL beneficially owned approximately 56.7% of our outstanding shares of our common stock and
continues to own a majority interest. CEHL controls the power to elect our directors, to appoint members of management and to
approve all actions requiring the approval of the holders of our common stock, including adopting amendments to our Certificate of
Incorporation and approving mergers, acquisitions or sales of all or substantially all of our assets, subject to certain restrictive
covenants. The interests of CEHL as our controlling stockholder could conflict with your interests as a holder of Company common
stock. For example, CEHL as our controlling stockholder may have an interest in pursuing acquisitions, divestitures, financings or
other transactions that, in its judgment, could enhance its equity investment even though such transactions might involve risks to you,
as minority holders of the Company.
The Company’s stockholders may not be able to enforce United States civil liabilities claims.
Many of the Company’s assets are and are expected to continue to be located outside the United States and held through one or more
subsidiaries incorporated under the laws of foreign jurisdictions. Substantially all of the Company’s operations are and are expected to
continue to be conducted in Africa. In addition, some of the Company’s directors and officers, including directors and officers of its
subsidiaries, may be residents of countries other than the United States. All or a substantial portion of the assets of these persons may
be located outside the United States. As a result, it may be difficult for shareholders to effect service of process within the United
States upon these persons. In addition, there is uncertainty as to whether the foreign courts would recognize or enforce judgments of
United States courts obtained against the Company or such persons predicated upon the civil liability provisions of the securities laws
of the United States or any state thereof or be competent to hear original actions brought in these countries against the Company or
such persons predicated upon the securities laws of the United States or any state thereof.
The market price of the Company’s common stock may be adversely affected by a number of factors related to the Company’s
performance, the performance of other energy-related companies and the stock market in general.
The market prices of securities of energy companies are extremely volatile and sometimes reach unsustainable levels that bear no
relationship to the past or present operating performance of such companies.
Factors that may contribute to the volatility of the trading price of the Company’s Common Stock include, among others:
• financial predictions and recommendations by stock analysts concerning energy companies and companies competing in the
Company’s market in general, and concerning the Company in particular;
• the Company’s quarterly results of operations or variances between the Company’s actual quarterly results of operations and
predictions by stock analysts;
• public announcements of regulatory changes or new ventures relating to the Company’s business or its competitors, or
acquisitions, joint ventures or strategic alliances by the Company or its competitors;
• investor perception of the Company’s business prospects or those of the oil and gas industry in general;
• the timing of commencement of production of new
wells;
• the operating and stock price performance of other companies that investors or stock analysts may deem comparable to the
Company;
• large purchases or sales of the Company’s common stock; and
• general economic and financial
conditions.
23

Source: Erin Energy Corp., 10-K, March 24, 2016 Powered by Morningstar Document Research. The information contained herein may not be copied, adapted or distributed and is not warranted to be accurate, complete or timely. The user assumes all risks for any damages or losses arising from any use of this information, except to the extent such damages or losses cannot be limited or excluded by applicable law. Past financial performance is no guarantee of future results.
In addition to the foregoing factors, the trading prices for equity securities in the stock market in general, and of energy-related
companies in particular, have been subject to wide fluctuations that may be unrelated to the operating performance of the particular
company affected by such fluctuations. Consequently, broad market fluctuations may have an adverse effect on the trading price of
our common stock regardless of the Company’s results of operations.
The limited market for the Company’s common stock may adversely affect trading prices or the ability of a shareholder to sell the
Company’s shares in the public market at or near ask prices or at all if a shareholder needs to liquidate its shares.
The market price for shares of the Company’s common stock has been, and is expected to continue to be, volatile. Numerous factors
beyond the Company’s control may have a significant effect on the market price for shares of the Company’s common stock,
including the fact that the Company is a small company that is relatively unknown to stock analysts, stock brokers, institutional
investors and others in the investment community that generate or influence sales volumes. There may be periods of several days or
more when trading activity in the Company’s shares is minimal as compared to a seasoned issuer which has a large and steady volume
of trading activity that will generally support continuous sales without an adverse effect on share price. Due to these conditions,
investors may not be able to sell their shares at or near ask prices or at all if investors desire to liquidate their shares.
Our common stock is listed on the Johannesburg Stock Exchange (“JSE”). However, a trading market may not successfully
develop on the JSE.
There is a limited trading market for our common stock on the JSE. An active trading market may not successfully develop on the
JSE, or if it does, it may not be sustained. In addition, we cannot assure what effect our listing on the JSE will have on our trading
market on the NYSE MKT. In 2014, we issued an aggregate of 62.8 million shares of our common stock to the Public Investment
Corporation (SOC) Limited (“PIC”) of South Africa in a private placement. If PIC chooses to sell those shares on the JSE, sales of a
large number of shares could have a negative effect on the market price of our shares on the JSE, which could have a negative effect
on the market price of our shares on the NYSE MKT.
Substantial sales of the Company’s common stock could cause the Company’s stock price to fall.
The potential for substantial amounts of our common stock to be sold in the public market may adversely affect prevailing market
prices for our common stock and could impair the Company’s ability to raise capital through the sale of its equity securities.
Additionally, we may issue and register a greater number of shares of common stock in order to meet our obligations to pay up to
$50.0 million in oil and gas milestone payments under the Transfer Agreement or upon conversion of the Convertible Subordinated
Note. All of such shares would be eligible for registration under a registration rights agreement.
Conversion of the Convertible Subordinated Note or the 2015 Convertible Note, in the event of a default thereunder, may dilute the
ownership interest of existing stockholders.
The conversion of some or all of the Convertible Subordinated Note or the 2015 Convertible Note, in the event of a default thereunder,
may dilute the ownership interests of existing stockholders. The Convertible Subordinated Note is convertible into 12.7 million shares
of our common stock, which represents approximately 6.01% of our currently outstanding shares. The Convertible Subordinated Note
is subject to anti-dilution adjustment provisions, including provisions that make it convertible into the same percentage of our
outstanding shares if we issue shares of common stock or any convertible security at a price per share less than the conversion price.
The 2015 Convertible Note is convertible into shares of the Company’s common stock upon the occurrence and continuation of an
event of default thereunder, at the sole option of the holder. The number of shares issuable upon conversion is equal to the sum of the
principal amount and the accrued and unpaid interest divided by the conversion price, defined as the volume weighted average of the
closing sales prices on the NYSE MKT for a share of common stock for the five complete trading days immediately preceding the
conversion date. Any sales in the public market of the shares of our common stock issuable upon such conversions could adversely
affect prevailing market prices of our common stock. In addition, the anticipated conversion of the Convertible Subordinated Note or
the 2015 Convertible Note into shares of our common stock could depress the price of our common stock.
The Company’s issuance of preferred stock could adversely affect the value of the Company’s common stock.
The Company’s Amended and Restated Certificate of Incorporation authorizes the issuance of up to 50.0 million shares of preferred
stock, which shares constitute what is commonly referred to as “blank check” preferred stock. This preferred stock may be issued by
the Board of Directors from time to time on any number of occasions, without stockholder approval, as one
24

Source: Erin Energy Corp., 10-K, March 24, 2016 Powered by Morningstar Document Research. The information contained herein may not be copied, adapted or distributed and is not warranted to be accurate, complete or timely. The user assumes all risks for any damages or losses arising from any use of this information, except to the extent such damages or losses cannot be limited or excluded by applicable law. Past financial performance is no guarantee of future results.
or more separate series of shares comprised of any number of the authorized but unissued shares of preferred stock, designated by
resolution of the Board of Directors, stating the name and number of shares of each series and setting forth separately for such series
the relative rights, privileges and preferences thereof, including, if any, the: (i) rate of dividends payable thereon; (ii) price, terms and
conditions of redemption; (iii) voluntary and involuntary liquidation preferences; (iv) provisions of a sinking fund for redemption or
repurchase; (v) terms of conversion to common stock, including conversion price; and (vi) voting rights. The designation of such
shares could be dilutive of the interest of the holders of our common stock. The ability to issue such preferred stock could also give
the Company’s Board of Directors the ability to hinder or discourage any attempt to gain control of the Company by a merger, tender
offer at a control premium price, proxy contest or otherwise.
The Company’s executive officers, directors and major stockholders, including CEHL and PIC, hold a controlling interest in the
Company’s common stock and may be able to prevent other stockholders from influencing significant corporate decisions.
The executive officers, directors and holders of 5% or more of the outstanding common stock, if acting together, would be able to
control all matters requiring approval by stockholders, including the election of Directors and the approval of significant corporate
transactions. This concentration of ownership may also have the effect of delaying, deterring or preventing a change in control and
may make some transactions more difficult or impossible to complete without the support of these stockholders.
ITEM 1B. UNRESOLVED STAFF COMMENTS
None.
ITEM 2. PROPERTIES
EXECUTIVE OFFICES AND INTERNATIONAL FACILITIES
We have six leased office facilities located in Houston, Texas (the “Houston Facility”), Lagos, Nigeria (the “Lagos Facility”), Nairobi,
Kenya (the “Kenya Facility”), Banjul, The Gambia (the “Gambia Facility”), Accra, Ghana (the "Ghana Facility"), and Johannesburg,
South Africa (the “Johannesburg Facility”).
Our corporate headquarters is located at our Houston Facility at 1330 Post Oak Boulevard, Houston, Texas, 77056. The Houston
Facility covers approximately 13,200 square feet of office space and is under a lease which commenced on July 1, 2012, and ends on
October 31, 2019. Current base rental expense is approximately $27,800 per month plus an allocated share of operating expenses.
The Nigeria Facility covers approximately 7,500 square feet of office space and is under short-term arrangements with a related party.
Current base rental expense is approximately $20,300 a month.
The Kenya Facility covers approximately 5,400 square feet of office space and is under lease which commenced on November 1,
2012, and ends November 30, 2017. Current base rental expense is approximately $6,900 per month, plus service charges.
The Gambia Facility covers approximately 2,700 square feet of office space and is under a renewable lease, which commenced on
March 1, 2015, for a one-year fixed term. Current base rental expense is approximately $1,200 per month.
The Ghana Facility covers approximately 4,000 square feet of office space under a lease which commenced on May 1, 2015, and ends
on April 30, 2017. Current base rental expense is approximately $14,500 per month.
The Johannesburg Facility covers approximately 3,300 square feet of office space under a lease which commenced on February 1,
2015, and ends on February 28, 2020. Current base rental expense is approximately $5,200 per month.
We do not foresee significant difficulty in renewing or replacing these leases under current market conditions, or in adding additional
space when required.
OIL AND GAS LEASEHOLDS
The map below sets forth a visual representation of the geographical locations of our oil and gas properties on the continent of Africa.
25

Source: Erin Energy Corp., 10-K, March 24, 2016 Powered by Morningstar Document Research. The information contained herein may not be copied, adapted or distributed and is not warranted to be accurate, complete or timely. The user assumes all risks for any damages or losses arising from any use of this information, except to the extent such damages or losses cannot be limited or excluded by applicable law. Past financial performance is no guarantee of future results.
Nigeria
In February 2014, the Company acquired, from a related party, the outstanding economic interests not already owned by the Company
in the OMLs offshore Nigeria. Pursuant to this transaction, the Company now owns 100% of the development and exploration rights
over approximately 0.4 million acres offshore Nigeria. The OMLs contain the Oyo field which has been in production since December
2009.
Kenya
In May 2012, the Company entered into four production and sharing contracts with the Government of the Republic of Kenya,
covering onshore exploration blocks L1B and L16, and offshore exploration blocks L27 and L28. During the Initial Exploration
Period, the Company's exploration rights over blocks L1B and L16 covered an area of 3.1 million acres and 0.9 million acres,
respectively. After successfully completing its required work commitments, the Company entered the First Additional Exploration
Period for blocks L1B and L16. In accordance with certain provisions of the Kenya PSCs, the Company relinquished 25% of its
original acreage on block L1B; however, the Company was allowed to retain the totality of its original acreage on block L16.
26
Source: Erin Energy Corp., 10-K, March 24, 2016 Powered by Morningstar Document Research. The information contained herein may not be copied, adapted or distributed and is not warranted to be accurate, complete or timely. The user assumes all risks for any damages or losses arising from any use of this information, except to the extent such damages or losses cannot be limited or excluded by applicable law. Past financial performance is no guarantee of future results.
As a result, the Company's new acreage is 2.3 million acres for block L1B and 0.9 million acres for block L16, respectively.
Exploration rights over approximately 2.6 million acres were awarded for each of blocks L27 and L28.
Gambia
In May 2012, the Company signed two Petroleum Exploration, Development & Production Licenses with The Republic of The
Gambia for offshore exploration blocks A2 and A5. For both blocks, the Company is the operator, with the GNPCo having the right to
elect to participate up to a 15% interest, following approval of a development and production plan. The Company is responsible for all
expenditures prior to such approval even if the GNPCo elects to participate. The Gambia licenses awarded to the Company cover
exploration rights over approximately 0.3 million acres each for blocks A2 and A5.
Ghana
In April 2014, the Company, through a 50% owned Ghanaian subsidiary, signed a Petroleum Agreement relating to the Expanded
Shallow Water Tano block in Ghana. The Company, which is a member of a contracting party signatory to the Petroleum Agreement,
has been named technical operator and holds an indirect 30% participating interest in the block. The block contains three discovered
fields, and the work program requires the consortium to determine the economic viability of developing the discovered fields. The
Ghana Petroleum Agreement awarded the Company exploration rights over approximately 0.4 million gross acres (0.1 million net
acres).
RESERVES
The information included in this Annual Report on Form 10-K about our rights to our proved reserves as of December 31,
2015, represents evaluations prepared by DeGolyer and MacNaughton (“D&M”), an independent petroleum engineering and
geoscience advisory firm. D&M has prepared evaluations on 100 percent of our rights to our proved reserves and the estimates of
proved crude oil reserves attributable to our net interests in oil and gas properties as of December 31, 2015. The scope and results of
D&M’s procedures are summarized in a letter that is included as an exhibit to this Annual Report on Form 10-K. For further
information on reserves, including information on future net cash flows and the standardized measure of discounted future net cash
flows, please refer to the Supplemental Data on Oil and Gas Exploration and Producing Activities (Unaudited) within Item 8 of
this report. The totality of our proved reserves are located offshore Nigeria in the OMLs.
Internal Controls over Reserve Estimation
Our policies regarding internal controls over the recording of reserve estimation require reserves to be in compliance with the SEC
definitions and guidance and that they are prepared by the use of appropriate geologic, petroleum engineering, and evaluation
principles and techniques that are in accordance with practices generally recognized by the petroleum industry.
We obtain services of contracted reservoir engineers with extensive industry experience who meet the professional qualifications of
reserves estimators and reserves auditors as defined by the “Standards Pertaining to the Estimating and Auditing of Oil and Gas
Reserves Information,” approved by the Board of the Society of Petroleum Engineers in 2001 and revised in 2007.
The reserves estimates shown herein have been independently prepared by D&M, a leading international petroleum engineering
consultancy. Within D&M, the technical person primarily responsible for preparing the estimates set forth in the D&M reserves report
incorporated herein is Lloyd W. Cade. Mr. Cade has over 33 years of experience in oil and gas reservoir studies and reserve
estimations. He is a Registered Professional Engineer in the State of Texas, License No. 74615.
We have on staff reservoir engineers with extensive industry experience, who meet professional qualifications of reserves
estimators and reserves auditors as defined by the “Standards Pertaining to the Estimating and Auditing of Oil and Gas Reserves
Information,” approved by the Board of the Society of Petroleum Engineers in 2001 and revised in 2007.
Our engineering staff with the primary responsibility to coordinate and review third-party reserves reports provided by D&M are Mr.
Okwudiri Uzoh and Ms. Toyin Badru. Mr. Uzoh, our Technical Vice-President, has over 24 years of experience in the oil and gas
industry mainly in reservoir engineering and engineering management. He holds a Master’s degree in Petroleum Engineering from
University of Houston. Mr. Uzoh is also a registered professional engineer of Alberta, License no. 113154 and a member of the
Society of Petroleum Engineers. Ms. Toyin Badru, our Senior Reservoir Engineer, has over 10 years of experience in the oil and gas
industry and holds a Bachelor's degree in Petroleum engineering from the university of Ibadan, Nigeria and an MS in Petroleum
engineering from Stanford University, California. She has worked in reservoir simulation
27

Source: Erin Energy Corp., 10-K, March 24, 2016 Powered by Morningstar Document Research. The information contained herein may not be copied, adapted or distributed and is not warranted to be accurate, complete or timely. The user assumes all risks for any damages or losses arising from any use of this information, except to the extent such damages or losses cannot be limited or excluded by applicable law. Past financial performance is no guarantee of future results.
consulting groups as well as multi-disciplinary asset teams in both Nigeria and the United states. She is a member of the Society of
Petroleum Engineers.
Compliance with reserve bookings is the responsibility of the Company. The reserves estimates prepared by D&M were reviewed and
approved by our management. The process performed by D&M to prepare reserve amounts includes the estimation of reserve
quantities, future producing rates, future net revenue and the present value of such future net revenue, before income tax. In the
conduct of their preparation of the reserve estimates, D&M did not independently verify the accuracy and completeness of certain
information and data furnished by us with respect to ownership interests, oil production data, current costs of operation and
development, current prices for production, agreements relating to current and future operations and sale of production and various
other information and data that were accepted as presented. Furthermore, D&M did not perform a field examination of the properties,
as this was not deemed necessary for the preparation of their report. However, if in the course of their evaluation something came to
their attention which brought into question the validity or sufficiency of any such information or data, D&M did not rely on such
information or data until they had satisfactorily resolved their questions relating thereto.
Technologies Used in Reserves Estimates
Estimates of reserves were prepared by the use of appropriate geologic, petroleum engineering, and evaluation principles and
techniques that are in accordance with practices generally recognized by the petroleum industry as presented in the publication of the
Society of Petroleum Engineers entitled “Standards Pertaining to the Estimating and Auditing of Oil and Gas Reserves Information
(Revision as of February 19, 2007).” The method or combination of methods used in the analysis was tempered by experience with
similar reservoirs, stage of development, quality and completeness of basic data and production history.
Estimates of original oil in-place were obtained from a detailed and properly constructed proved case static and dynamic model for the
Oyo field. This model was well history matched and applied to predict the future performance of the field based on existing and
approved future developments. Only gas injection which has been proven in the Oyo field as a feasible recovery process was applied
in the proved reserves estimation. Results from this analysis was determined to be aligned with performance data from similar
reservoirs.
Because these estimates depend on many assumptions, any or all of which may differ substantially from actual results, the oil reserves
estimates obtained for the Oyo field may be different from the quantities of oil that are ultimately recovered.
28

Source: Erin Energy Corp., 10-K, March 24, 2016 Powered by Morningstar Document Research. The information contained herein may not be copied, adapted or distributed and is not warranted to be accurate, complete or timely. The user assumes all risks for any damages or losses arising from any use of this information, except to the extent such damages or losses cannot be limited or excluded by applicable law. Past financial performance is no guarantee of future results.
Summary of Crude Oil Reserves
Set forth below is a summary of our net oil proved reserves as of December 31, 2015, 2014, and 2013, respectively:
Years Ended December 31,
2015 2014 2013
Proved developed reserves (in MBbls) 7,594
—
321
Proved undeveloped reserves (in MBbls) 4,390
9,051
8,219
Total proved reserves (in MBbls) 11,984
9,051
8,540
Standardized measure of proved reserves (in thousands) $ 161,967
$ 237,049
$ 101,267
The Company annually reviews all proved undeveloped reserves (“PUDs”) to ensure an appropriate development plan exists. The
Company’s PUDs are generally expected to be converted to proved developed reserves within five years of the date they are first
classified as PUDs.
The 4.4 million barrels in PUDs as of December 31, 2015 represent the estimated recoverable volumes associated with the Company’s
well Oyo-9 which is expected to be drilled and completed in 2017. The 832 MBbls increase in PUDs in 2014 as compared to 2013 is
due to a revision in estimates subsequent to a new full reservoir study of the Oyo field conducted in 2014.
The standardized measure of discounted net future cash flows is the present value of estimated future net cash inflows from proved oil
reserves, less future development and production costs and future income tax expenses, discounted at 10% per annum to reflect timing
of future net cash flows. As of December 31, 2015, the standardized measure of our proved reserves was approximately $162.0
million, as compared to $237.0 million and $101.3 million as of December 31, 2014 and 2013, respectively. The decrease in the
standardized measure of our proved reserves in 2015 as compared to 2014 is primarily due to the decline in crude oil commodity
prices. The standardized measure of discounted future net cash flow should not be construed as the current market value of the
estimated oil and natural gas reserves attributable to the Company’s properties.
SEC reporting rules require companies to prepare reserve estimates using reserve definitions and pricing based on 12-month historical
un-weighted first-day-of-the-month average prices, rather than year-end prices. Our estimated net proved reserves and standardized
measure were determined using index prices for oil and were held constant throughout the life of the assets. The average
first-day-of-the-month commodity prices during the 12-month periods ending on December 31, 2015, 2014, and 2013, were $53.51,
$100.37, and $108.63 per barrel of crude oil, respectively, including price differentials.
VOLUMES, PRICES, AND PRODUCTION COSTS
Production and sales volumes net to the Company, as well as sales prices and production costs for the years 2015, 2014, and 2013 are
shown below. The totality of the production and sales volumes for each period presented were originated from the Oyo field offshore
Nigeria. Years Ended December 31,
2015 (1) 2014 (2) 2013
Aggregate production volumes (MBbls) 1,564
364
707
Average daily production (BOPD) 6,400
1,300
2,000
Sales volumes (MBbls) 1,449
506
591
Average sales prices ($ / Bbls) $ 47.24
$ 106.41
$ 107.84
Average production cost per barrel ($ / Bbls) $ 54.72
$ 199.50
$ 99.61
(1) In 2015, average daily production and average production cost per barrel were computed over a period of 8 months, since production commenced in May 2015.

Source: Erin Energy Corp., 10-K, March 24, 2016 Powered by Morningstar Document Research. The information contained herein may not be copied, adapted or distributed and is not warranted to be accurate, complete or timely. The user assumes all risks for any damages or losses arising from any use of this information, except to the extent such damages or losses cannot be limited or excluded by applicable law. Past financial performance is no guarantee of future results.
(2) In 2014, average daily production and average production cost per barrel were computed over a period of 9 months, since both producing wells were shut-in in
September 2014.
29

Source: Erin Energy Corp., 10-K, March 24, 2016 Powered by Morningstar Document Research. The information contained herein may not be copied, adapted or distributed and is not warranted to be accurate, complete or timely. The user assumes all risks for any damages or losses arising from any use of this information, except to the extent such damages or losses cannot be limited or excluded by applicable law. Past financial performance is no guarantee of future results.
Production volumes increased in 2015 as compared to 2014 following the successful redevelopment campaign of the Oyo field that
brought online two new producing wells. Production volumes decreased from 2013 to 2014 due to the natural decline of production
from the then producing wells Oyo-5 and Oyo-6.
DRILLING ACTIVITY
In November 2013, the well Oyo-7 was drilled offshore Nigeria. The primary objective of the well was to establish production from
the producing Pliocene formation. The well was completed horizontally as a producing well in June 2015. The secondary objective
was to explore for the presence of hydrocarbons in the deeper Miocene formation. Hydrocarbons were encountered in three intervals
totaling approximately 65 feet, as interpreted by LWD data. Management is making plans to further explore the Miocene formation.
In August 2014, the Company drilled the vertical portion of well Oyo-8 offshore Nigeria. The primary objective of the well was to
establish production from the producing Pliocene formation. The secondary objective was to confirm the presence of hydrocarbons in
an area in the eastern fault block of the Oyo field. The Company successfully encountered four new oil and gas reservoirs in the
eastern fault block, with total gross hydrocarbon thickness of 112 feet, based on results from LWD data, reservoir pressure data, and
reservoir fluid sampling techniques. Management completed a detailed evaluation of the results and has future development plans in
the area.
In March 2015, the Company finished completion operations for well Oyo-8, and successfully hooked it up to the FPSO. Production
commenced in May 2015.
ACREAGE AND PRODUCTIVE WELLS
The table below sets forth the acreage under lease and the number of productive oil wells for the Company as of December 31, 2015.
Productive oil wells consist of producing wells and wells capable of producing in commercial quantities, including wells awaiting
connection to production facilities. Developed Acres Undeveloped Acres Productive oil wells
(In thousands) Gross Net Gross Net Gross Net
Nigeria 10
10
429
429
2
2
Kenya —
—
8,371
8,371
—
—
The Gambia —
—
659
659
—
—
Ghana —
—
373
112
—
—
Total 10
10
9,832
9,571
2
2
In Nigeria, the Company finished completion operations for well Oyo-8 in March 2015, successfully tied it into the FPSO, and
commenced production in May 2015. In April 2015, the Company initiated horizontal completion activities for well Oyo-7 and
commenced production in June 2015.
Remaining lease terms
Nigeria
The current lease for the Nigeria acreage expires in February 2021.
Kenya blocks L1B and L16
Total acreage for the Kenya blocks L1B and L16 is approximately 3.2 million, net to the Company. Having satisfied all material
contractual obligations under the initial exploration period, the Company received approval from the Kenya Ministry of Energy and
Petroleum to enter into the First Additional Exploration Period for both blocks. The First Additional Exploration Period for both
blocks will last two contract years, through July 2017.
Kenya blocks L27 and L28
30

Source: Erin Energy Corp., 10-K, March 24, 2016 Powered by Morningstar Document Research. The information contained herein may not be copied, adapted or distributed and is not warranted to be accurate, complete or timely. The user assumes all risks for any damages or losses arising from any use of this information, except to the extent such damages or losses cannot be limited or excluded by applicable law. Past financial performance is no guarantee of future results.

Source: Erin Energy Corp., 10-K, March 24, 2016 Powered by Morningstar Document Research. The information contained herein may not be copied, adapted or distributed and is not warranted to be accurate, complete or timely. The user assumes all risks for any damages or losses arising from any use of this information, except to the extent such damages or losses cannot be limited or excluded by applicable law. Past financial performance is no guarantee of future results.
Total acreage for the Kenya blocks L27 and L28 is approximately 5.1 million, net to the Company. The initial exploration period for
both blocks ended in August 2015. The Company received approval from the Kenya Ministry of Energy and Petroleum for an
18-month extension of the Initial Exploration Period for blocks L27 and L28, which will now last through February 2017.
The Gambia
In accordance with the Gambia Licenses Amendment entered into with The Republic of The Gambia in May 2015, the term of the
initial exploration period for both blocks A2 and A5 was extended by two years through December 2018.
Ghana
Although the Ghana Petroleum Agreement was signed in April 2014, it only became effective in January 2015 following the signing
of a Joint Operating Agreement among the joint venture partners. In October 2015, the Company completed its economic and
commercial evaluation of the three previously discovered fields, and is currently working with its joint venture partners and relevant
government entities on discussion of fiscal terms towards the declaration of commercial viability. The remaining lease term for the
Ghana acreage under the current exploration period expires in January 2017.
DELIVERY COMMITMENTS
As of December 31, 2015, we had no delivery commitments.
ITEM 3. LEGAL PROCEEDINGS
From time to time, the Company may be involved in various legal proceedings and claims in the ordinary course of business. As of
December 31, 2015, and through the filing date of this report, the Company does not believe the ultimate resolution of such actions or
potential actions of which the Company is currently aware will have a material effect on its consolidated financial position or results
of operations.
On June 28, 2015, the Company, CPL and an affiliate of CEHL, the Company's majority shareholder (collectively, the "Erin Parties")
entered into a Settlement Agreement with Northern Offshore International Drilling Company Ltd. ("Northern"), pursuant to which the
parties agreed (i) to settle all disputes and release all claims relating to the daywork drilling contract for Northern’s drillship Energy
Searcher and (ii) to terminate the arbitration proceedings in London. Under the terms of the Settlement Agreement, neither the Erin
Parties nor Northern paid any amounts to the other to settle the disputes, and each party agreed to bear its own legal fees and to share
equally the arbitration costs. As a result of the settlement, the Company recorded a reduction in accounts payable and accrued
liabilities of approximately $24.3 million.
On January 22, 2016, a request for arbitration was filed with the London Court of International Arbitration by Transocean Offshore
Gulf of Guinea VII Limited and Indigo Drilling Limited, as Claimants, against the Company and its Nigerian subsidiary, Erin
Petroleum Nigeria Limited (fka CAMAC Petroleum Limited), as Respondents (the “Arbitration”). The Arbitration is in relation to a
drilling contract entered into by the Claimants and CAMAC Petroleum Limited, and a parent company guarantee provided by the
Company in relation thereto. The Claimants are seeking an order that the Respondents pay the sum of approximately $20.2 million
together with interest and costs. The Company is in the process of obtaining legal advice in relation to the Arbitration.
On February 5, 2016, a class action and derivative complaint was filed in the Delaware Chancery Court purportedly on behalf of the
Company and on behalf of a putative class of persons who were stockholders as of the date the Company (1) acquired the Allied
Assets pursuant to the Transfer Agreement and (2) issued shares to the PIC in a private placement (collectively the “February 2014
Transactions”). The complaint alleges the February 2014 Transactions were unfair to the Company and purports to assert derivative
claims against (1) the seven individuals who served on our Board at the time of the February 2014 Transactions and (2) our majority
shareholder, CEHL. The complaint also purports to assert a direct breach of fiduciary duty claim on behalf of the putative class
against the seven individuals who served on our Board at the time of the February 2014 Transactions on the grounds that they
purportedly caused the Company to disseminate a false and misleading proxy statement in connection with the 2014 Transactions, and
a direct claim for aiding and abetting against Dr. Lawal. The plaintiff is seeking, on behalf of the Company and the putative class, an
undisclosed amount of compensatory damages. The Company is named solely as a nominal defendant against whom the plaintiff
seeks no recovery.
ITEM 4. MINE SAFETY DISCLOSURES
31

Source: Erin Energy Corp., 10-K, March 24, 2016 Powered by Morningstar Document Research. The information contained herein may not be copied, adapted or distributed and is not warranted to be accurate, complete or timely. The user assumes all risks for any damages or losses arising from any use of this information, except to the extent such damages or losses cannot be limited or excluded by applicable law. Past financial performance is no guarantee of future results.
Not applicable.
PART II
ITEM 5. MARKET FOR THE REGISTRANT'S COMMON EQUITY, RELATED STOCKHOLDER MATTERS
AND ISSUER PURCHASES OF EQUITY SECURITIES
Market Information for Common Stock
Our common stock is currently listed on the NYSE MKT under the symbol “ERN”. It commenced listing on the NYSE MKT in
November 2009 under the symbol “PAP”. In addition to our listing on the NYSE MKT, in February 2014, our common stock became
also listed on the Johannesburg Stock Exchange (“JSE”).
The following table sets forth the range of the high and low sales prices per share of our common stock for the periods indicated on
the NYSE MKT, the principal market for the trading of our common stock, under the symbol “ERN”:
Period High Low
2015
First quarter $ 3.24
$ 1.56
Second quarter $ 8.76
$ 3.24
Third quarter $ 4.77
$ 3.35
Fourth quarter $ 4.78
$ 2.88
2014
First quarter $ 5.22
$ 3.18
Second quarter $ 5.10
$ 3.48
Third quarter $ 4.38
$ 2.82
Fourth quarter $ 3.54
$ 1.74
The above high and low sales prices per share of our common stock reflect the effect of both the Company’s February 21, 2014 stock
dividend payment, which was accounted for as a stock split due to its large nature, and the April 22, 2015, 6-for-1 reverse stock split.
See Note 2. - Basis of Presentation and Significant Accounting Policies to the Notes to Consolidated Financial Statements for
further information.
Capital Structure
Common Stock
The Company is authorized to issue up to 416.7 million shares of $0.001 par value common stock. As of December 31, 2015, there
were approximately 211.6 million such shares issued and outstanding.
Effective April 22, 2015, the Company implemented a reverse stock split, whereby each six shares of outstanding common stock
pre-split was converted into one share of common stock post-split (the “reverse stock split”).
Preferred Stock
The Company is authorized to issue up to 50.0 million shares of $0.001 par value preferred stock and to designate the dividend rate,
voting and other rights, restrictions and preferences for each series of preferred stock. No preferred stock was issued and outstanding
as of December 31, 2015.
Common Stock Warrants and Options

Source: Erin Energy Corp., 10-K, March 24, 2016 Powered by Morningstar Document Research. The information contained herein may not be copied, adapted or distributed and is not warranted to be accurate, complete or timely. The user assumes all risks for any damages or losses arising from any use of this information, except to the extent such damages or losses cannot be limited or excluded by applicable law. Past financial performance is no guarantee of future results.
As of March 1, 2016, the Company had warrants outstanding to purchase an aggregate of 2.9 million shares of common stock at prices
per share ranging from $2.46 to $7.85.
32

Source: Erin Energy Corp., 10-K, March 24, 2016 Powered by Morningstar Document Research. The information contained herein may not be copied, adapted or distributed and is not warranted to be accurate, complete or timely. The user assumes all risks for any damages or losses arising from any use of this information, except to the extent such damages or losses cannot be limited or excluded by applicable law. Past financial performance is no guarantee of future results.
As of March 1, 2016, an aggregate of approximately 2.0 million shares of common stock were issuable upon exercise of outstanding
stock options.
Holders of Common Stock
As of March 1, 2016, there were approximately 78 holders of record of our common stock. In many instances, a broker or other entity
holds shares in street name for one or more customers who beneficially own the shares.
Dividend Policy
The Company has not paid any cash dividends in the past, and does not anticipate paying any cash dividends on its common stock in
the foreseeable future.
In 2014, in conjunction with the Allied Transaction, our Board of Directors authorized the declaration and execution of a stock
dividend whereby each holder of one share of common stock on record as of the close of business on February 13, 2014, carried the
right to receive 1.4348 additional shares of common stock. See Note 2. - Basis of Presentation and Significant Accounting Policies
to the Notes to Consolidated Financial Statements for additional information.
Securities Authorized for Issuance under Equity Compensation Plans
Upon adoption of the 2009 Equity Incentive Plan (“2009 Plan”) by our Board of Directors in June 2009, our Board of Directors
resolved to (i) discontinue further grants and awards of equity securities under the 2007 Stock Plan (the “2007 Plan”), except the
issuance of our stock upon exercise of issued and outstanding options issued pursuant to the 2007 Plan, and (ii) amend the 2007 Plan
to reduce the number of shares available for issuance under the 2007 Plan to 0.4 million shares, down from 0.7 million shares, and to
further reduce the number of shares available for issuance thereunder by such number of shares that from time to time may be returned
for issuance under the 2007 Plan upon expiration or termination of any option issued thereunder or repurchase of any restricted stock
issued thereunder, and to return all such shares to the Company’s treasury.
In February 13, 2014, our stockholders approved the amendment to the 2009 Plan at a special meeting of stockholders. On
February 18, 2014, we executed the amendment to the 2009 Plan, thereby increasing the number of shares that may be granted
thereunder to 16.7 million shares.
The following table sets forth information with respect to the equity compensation plans available to our directors, officers, and
employees at December 31, 2015:
Plan Category
Number of
Securities to
be Issued
Upon
Exercise of
Outstanding
Options,
Warrants
and Rights
(a)
Weighted-
Average
Exercise
Price of
Outstanding
Options,
Warrants
and Rights
(b)
Number of
Securities
Available For
Future
Issuance
Under 2009
Equity
Compensation
Plan
(Excluding
Securities
Reflected in
Column (a))
(c)
Equity compensation plans approved by security holders 3,639,243
(1) $ 2.29
9,752,876
Warrants approved by security holders 2,935,128
(2) $ 3.61
6,574,371
9,752,876
(
1)
Includes the 2009 Equity
Incentive Plan.

Source: Erin Energy Corp., 10-K, March 24, 2016 Powered by Morningstar Document Research. The information contained herein may not be copied, adapted or distributed and is not warranted to be accurate, complete or timely. The user assumes all risks for any damages or losses arising from any use of this information, except to the extent such damages or losses cannot be limited or excluded by applicable law. Past financial performance is no guarantee of future results.
(2) Remaining warrants exercisable for shares of common stock issued in 2014 and 2015 to service providers and to the holder of the Company's 2015 Convertible
Note, respectively, which issuances were approved by the stockholders of the Company.
The above outstanding common stock warrants and options reflect the effect of the Company’s payment of the February 2014 stock
dividend and the April 2015 reverse stock split.
33

Source: Erin Energy Corp., 10-K, March 24, 2016 Powered by Morningstar Document Research. The information contained herein may not be copied, adapted or distributed and is not warranted to be accurate, complete or timely. The user assumes all risks for any damages or losses arising from any use of this information, except to the extent such damages or losses cannot be limited or excluded by applicable law. Past financial performance is no guarantee of future results.
Performance Graph
The following graph compares the yearly percentage change in the Company’s cumulative total stockholder return on its common
shares with the cumulative total return of the S&P 500 Index and the SPDR Oil and Gas Exploration and Production Index. The
selected indices are accessible to our stockholders in newspapers, the internet and other readily available sources. This graph assumes
a $100 investment in Erin Energy Corporation, the S&P 500 and the Energy Select Sector SPDR at the close of trading on
December 31, 2010, and assumes the reinvestment of all dividends, if any.
This Performance Graph shall not be deemed to be incorporated by reference into our SEC filings and should not constitute soliciting
material or otherwise be considered filed under the Securities Act of 1933, as amended, or the Securities Exchange Act of 1934, as
amended.
Recent Sales of Unregistered Securities
In September 2014, the Company entered into a consulting agreement (the "Agreement”) with a consultant, pursuant to which the
consultant agreed to represent the Company for a term of one-year in investors’ communications and public relations with existing and
prospective shareholders, brokers, and other investment professionals with respect to the Company’s current and proposed activities,
and to consult with the Company’s management concerning such activities.
As partial consideration under the Agreement, as amended in March 2015, the Company agreed to issue an aggregate of 52,083 shares
of the Company’s common stock to the consultant. The Company issued the above shares in reliance on an exemption from
registration of the shares provided by Section 4(a)(2) of the Securities Act of 1933, as amended (the “Securities Act”), as a transaction
by an issuer not involving any public offering.
In March 2015, the Company entered into a borrowing facility with Allied pursuant to the 2015 Convertible Note, allowing the
Company to borrow up to $50.0 million for general corporate purposes. As of December 31, 2015, the Company has drawn $48.0
million under the note and issued to Allied warrants to purchase approximately 2.6 million shares of the Company’s common stock at
prices ranging from $2.46 to $7.85 per share. For further information, see Note 9. - Debt to the Notes to Consolidated Financial
Statements.
34

Source: Erin Energy Corp., 10-K, March 24, 2016 Powered by Morningstar Document Research. The information contained herein may not be copied, adapted or distributed and is not warranted to be accurate, complete or timely. The user assumes all risks for any damages or losses arising from any use of this information, except to the extent such damages or losses cannot be limited or excluded by applicable law. Past financial performance is no guarantee of future results.
Stock Repurchases
The Company did not repurchase any shares of its common stock during the year ended December 31, 2015.
ITEM 6. SELECTED FINANCIAL DATA
Years Ended December 31,
(In thousands, except per share information) 2015 2014 2013 2012 2011
Statement of Income Data
Revenues $ 68,429
$ 53,844
$ 63,736
$ 74,667
$ 37,922
Net loss attributable to Erin Energy Corporation $ (451,497 ) $ (96,062 ) $ (43,525 ) $ (29,529 ) $ (24,913 )
Net loss per common share attributable to Erin Energy
Corporation
Basic $ (2.13 ) $ (0.49 ) $ (0.30 ) $ (0.30 ) $ (0.42 )
Diluted $ (2.13 ) $ (0.49 ) $ (0.30 ) $ (0.30 ) $ (0.42 )
Cash Flow Data
Net cash (used in) provided by operating activities $ 2,145
$ (33,547 ) $ (36,625 ) $ 9,434
$ (14,654 )
As of December 31,
(In thousands) 2015 2014 2013 2012 2011
Balance Sheet Data
Property plant and equipment, net $ 349,505
$ 596,329
$ 435,787
$ 363,724
$ 196,222
Total assets $ 376,160
$ 638,443
$ 454,224
$ 377,043
$ 230,870
Long-term debt $ 140,615
$ 168,097
$ 8,189
$ 25,759
$ 6,000
The above presented earnings per share amounts reflect the effect of the Stock Dividend paid in February 2014, which was accounted
for as a stock split due to its large nature, and the April 2015 6-for-1 reverse stock split. See Note 2. - Basis of Presentation and
Significant Accounting Policies to the Notes to Consolidated Financial Statements for further information.
For more information on results of operations and financial condition, see Item 7. – Management’s Discussion and Analysis of
Financial Condition and Results of Operations .
ITEM 7. MANAGEMENT’S DISCUSSION AND ANALYSIS OF FINANCIAL CONDITION AND RESULTS OF
OPERATIONS
The following discussion of the Company’s historical performance and financial condition should be read together with Item 6,
Selected Financial Data and the consolidated financial statements and related notes in Item 8 of this report. This discussion
contains forward-looking statements based on the views and beliefs of our management, as well as assumptions and estimates made by
our management. These statements by their nature are subject to risks and uncertainties, and are influenced by various factors. As a
consequence, actual results may differ materially from those in the forward-looking statements. See Item 1A. Risk Factors of this
report for the discussion of risk factors.
The terms “we,” “us,” “our,” “Company,” and “our Company” refer to Erin Energy Corporation and its subsidiaries.
The Company’s operating subsidiaries include Erin Petroleum Nigeria Limited, CAMAC Energy Kenya Limited, Erin Energy Gambia
Ltd., and Erin Energy Ghana Limited. The Company also conducts certain business transactions with its majority shareholder,
CAMAC Energy Holdings Limited (“CEHL”), and its affiliates, which include Allied Energy Plc (“Allied”). See Note 10. — Related
Party Transactions to the Notes to Consolidated Financial Statements for further information.
OVERVIEW
Nigeria

Source: Erin Energy Corp., 10-K, March 24, 2016 Powered by Morningstar Document Research. The information contained herein may not be copied, adapted or distributed and is not warranted to be accurate, complete or timely. The user assumes all risks for any damages or losses arising from any use of this information, except to the extent such damages or losses cannot be limited or excluded by applicable law. Past financial performance is no guarantee of future results.
35

Source: Erin Energy Corp., 10-K, March 24, 2016 Powered by Morningstar Document Research. The information contained herein may not be copied, adapted or distributed and is not warranted to be accurate, complete or timely. The user assumes all risks for any damages or losses arising from any use of this information, except to the extent such damages or losses cannot be limited or excluded by applicable law. Past financial performance is no guarantee of future results.
In March 2015, the Company finished completion operations for well Oyo-8, and successfully hooked it up to the FPSO. Production
commenced in May 2015. In April 2015, the Company completed plug and abandonment activities for well Oyo-6, a well that was
previously shut-in in 2014. Subsequently, the Company initiated horizontal completion activities for well Oyo-7. The Company
commenced production from well Oyo-7 in June 2015.
The enforcement of certain control measures implemented by the Nigerian government with regards to the quarterly exportation and
sale of crude oil products from Nigeria has had an impact on the Company’s operations. Petroleum producers are required to obtain
export permits quarterly for crude oil liftings. During the period from May to September 2015, the Company produced approximately
1.5 million Bbls of crude oil but only sold approximately 0.6 million Bbls due to the unexpected delays in the issuance of export
permits for the quarter ending September 30, 2015. The resulting crude oil inventory of approximately 0.9 million Bbls, as of
September 30, 2015 was approaching the Company’s crude oil storage capacity on its FPSO. As a result, the Company had to curtail
production by temporarily shutting-in well Oyo-8 in September 2015. The Company subsequently received a permit to export
approximately 1.3 million Bbls from October to December 2015.
Subsequent attempts to reestablish production from well Oyo-8 were unsuccessful, due to the failure of the subsurface controlled
safety valve. The Company has since made several unsuccessful attempts to open the valve using normal procedures and has now
decided to embark on a light intervention, using an intervention vessel, to bring the well back to production. The Company expects to
complete the intervention in April 2016 and reestablish production.
In the three months ended September 30, 2015, average daily production was approximately 11,600 BOPD (approximately 10,200
BOPD net to the Company). In the three months ended December 31, 2015, the average daily production was approximately 2,900
BOPD (approximately 2,500 BOPD net to the Company).
Current plans include completing the needed repairs to re-establish production from well Oyo-8, drilling a development well in the
Oyo field, and drilling a potential high-impact exploration well in the Miocene formation of the OMLs, depending on capital and rig
availability.
Kenya
Blocks L1B and L16
The initial exploration period for onshore blocks L1B and L16 ended in June 2015. Having satisfied all material contractual
obligations under the initial exploration period, the Company received approval from the Kenya Ministry of Energy and Petroleum to
enter into the First Additional Exploration Period for both blocks. The First Additional Exploration Period for both blocks will last
two contract years, through July 2017. In accordance with certain provisions of the Kenya PSCs for onshore blocks L1B and L16, the
Company relinquished 25% of its original acreage on block L1B; however, the Company was allowed to retain the totality of its
original acreage in block L16. Further, in accordance with the Kenya PSCs, during the First Additional Exploration Period, the
Company is obligated, for each block, to (i) acquire, process and interpret high density 300 square kilometer 3-D seismic data at a
minimum expenditure of $12.0 million, and (ii) drill one exploration well to a minimum depth of 3,000 meters at a minimum
expenditure of $20.0 million.
The Company plans to pursue completion of the work program, and is also considering the possibility of farming-out a portion of its
rights to both blocks to potential partners.
Blocks L27 and L28
The Kenya PSCs for offshore blocks L27 and L28 each provide for an initial exploration period of three years, through August 2015,
with specified minimum work obligations during that period. Prior to the end of the initial exploration period, the Company is required
to conduct, for each block, i) a regional geological and geophysical study, ii) reprocess and re-interpret previous 2-D seismic data and
iii) acquire, process and interpret 1,500 square kilometers of 3-D seismic data.
In August 2015, the Company received approval from the Kenya Ministry of Energy and Petroleum for an 18-month extension of the
Initial Exploration Period for blocks L27 and L28, which will now last through February 2017. The remaining contractual obligation
under the initial exploration period is for the Company to acquire, process and interpret 3-D seismic data over both offshore blocks.
36

Source: Erin Energy Corp., 10-K, March 24, 2016 Powered by Morningstar Document Research. The information contained herein may not be copied, adapted or distributed and is not warranted to be accurate, complete or timely. The user assumes all risks for any damages or losses arising from any use of this information, except to the extent such damages or losses cannot be limited or excluded by applicable law. Past financial performance is no guarantee of future results.
The Company plans to pursue completion of the work program, and is also considering the possibility of farming-out a portion of its
rights to both offshore blocks to potential partners. Upon completion of the work program, the Company has the right to apply for up
to two additional two-year exploration periods, with specified additional minimum work obligations, including the acquisition of
seismic data and the drilling of one exploratory well on each block during each additional period.
The Gambia
In May 2015, the term of the initial exploration period for both blocks A2 and A5 was extended by two years through December 2018
as provided for under the Gambia Licenses Amendment entered into with The Republic of the Gambia in May 2015. As of September
30, 2015, the remaining contractual obligations, pursuant to The Gambia Licenses Amendment under the Gambia Licenses for both
blocks, is for the Company to (i) complete the processing and interpretation of approximately 1,600 square kilometers of 3-D seismic
data that was acquired in September 2015 and (ii) drill one exploration well on either block A2 or A5 and evaluate the drilling results.
As consideration for the Gambia Licenses Amendment, the Company agreed to (i) pay a $1.0 million extension fee, (ii) provide a full
well guarantee on either block at such time that the Company enters into a farm-in agreement with a partner, and (iii) pay the annual
contractual Training and Resources Expenses into a Government of Gambia bank account in The Gambia.
The 3-D seismic processing by an outside contractor is ongoing and is expected to be completed by the third quarter of 2016. The
Company intends to pursue completion of the work program, and is also considering the possibility of farming-out a portion of its
rights to both blocks to potential partners.
Ghana
In January 2015, the Petroleum Agreement entered into with the Republic of Ghana relating to the ESWT block offshore Ghana
became effective, following the signing of a Joint Operating Agreement between the Contracting Parties. In October 2015, at the
completion of the initial technical and commercial evaluation of the Fields, the Contracting Parties concluded that certain fiscal terms
in the Petroleum Agreement had to be adjusted in order to achieve commerciality of the Fields under current economic conditions.
The Contracting Parties have presented this conclusion to the relevant government entities. The Ghanian Government is currently
reviewing the requests for adjustment of the fiscal terms.
RESULTS OF OPERATIONS – CONTINUING OPERATIONS
Oil Revenues
Revenue is recognized when an oil lifting occurs. Crude oil revenues for 2015 were $68.4 million, as compared to $53.8 million and
$63.7 million for 2014 and 2013, respectively. In 2015, the Company sold approximately 1,449,000 net barrels of oil at an average
price of $47.24/Bbl. In 2014, the Company sold approximately 506,000 net barrels of oil at an average price of $106.41/Bbl. In 2013,
the Company sold approximately 591,000 net barrels of oil at an average price of $107.84/Bbl. The revenue increase in 2015
compared to 2014 and 2013 was due to the increase in sales volumes made possible by the re-development of the Oyo field, partially
offset by the decline in oil commodity prices as compared to prior years.
During 2015, 2014 and 2013, the net daily production from the Oyo field, over the days when production occurred, was approximately
6,400 BOPD, 1,300 BOPD and 2,000 BOPD, respectively.
Operating Costs and Expenses
Production Costs
Production costs were $90.1 million for 2015, as compared to $80.3 million in 2014 and $84.4 million for 2013. Production costs
include costs directly related to the production of hydrocarbons. The $9.8 million increase in production costs in 2015 as compared to
2014 was primarily due to a $21.9 million increase in FPSO related costs following a scheduled price increase, a $5.1 million higher
cost for production equipment rentals, a $5.0 million provision for Niger Delta taxes (“NDDC”), and a $3.9 million higher oil lifting
cost, partially offset by $26.0 million agreed-upon retroactive FPSO operating day rate cost reductions.
Production costs were lower in 2014 as compared to 2013 principally due to lower FPSO related costs.
Crude Oil Inventory (Increase) Decrease
37
Source: Erin Energy Corp., 10-K, March 24, 2016 Powered by Morningstar Document Research. The information contained herein may not be copied, adapted or distributed and is not warranted to be accurate, complete or timely. The user assumes all risks for any damages or losses arising from any use of this information, except to the extent such damages or losses cannot be limited or excluded by applicable law. Past financial performance is no guarantee of future results.
The Company matches production expenses with crude oil sales. Any production expenses associated with unsold crude oil inventory
are capitalized with a corresponding offset to operating costs. The capitalized crude oil inventory costs are subsequently expensed
when crude oil is sold.
Workover Expenses
In 2015, the Company spent approximately $1.0 million to repair a control module associated with its well Oyo-4 that is currently
operating as a gas injection well. The expenditure was recorded as a workover expense. There were no workover expenses incurred for
2014 and 2013.
Exploration Expenses
Exploration expenses were $16.4 million for 2015, as compared to $14.3 million in 2014 and $5.5 million in 2013. Exploration
expenses consist of drilling costs for unsuccessful wells, and costs for acquiring and processing seismic data, as well as other
geological and geophysical costs as required.
The $16.4 million exploration expenditures in 2015 include $7.7 million spent in Kenya primarily for 2-D seismic acquisition and
processing, $5.1 million spent in The Gambia primarily for 3-D seismic acquisition, $1.8 million spent in Ghana for exploration
activities, and $1.8 million spent in Nigeria for certain additional exploration studies.
The $14.3 million exploration expenditures in 2014 include $12.1 million in Kenya principally for a 2-D seismic acquisition
campaign, $1.3 million in The Gambia for certain contractual lease commitments, $0.5 million in Ghana for the preliminary
exploration evaluation study of the block, and $0.4 million in Nigeria for the evaluation of certain oil and gas prospects.
In 2013, the Company incurred $5.5 million of exploration expenses, including $2.1 million spent at the corporate level for
exploration activities, $2.5 million related to Kenya, $0.6 million related to The Gambia, and $0.3 million related to Nigeria.
Depreciation, Depletion, and Amortization (“DD&A”)
DD&A expenses, including ARO accretion, for 2015 were $99.1 million, as compared to $23.8 million in 2014 . DD&A expenses,
including ARO accretion, increased in 2015 primarily due to higher crude oil production and sales volumes, as well as higher
depletion rates as a result of additional investment in oil and gas properties.
DD&A expenses for 2014, including accretion, were $23.8 million, as compared to $16.9 million in 2013. In September 2014, the
Company determined that, based on the current operating plan and the equipment to be utilized, its estimated cost to plug and abandon
certain wells should be revised upwards. The higher asset retirement cost estimate caused an increase in the oil field asset cost basis in
2014, which resulted in an increased average depletion rate as compared to 2013.
Average depletion rates were $68.4/Bbl, $47.0/Bbl, and $28.6/Bbl in 2015, 2014, and 2013, respectively.
Impairment of oil and gas properties
The Company reviews its long-lived assets for possible impairment whenever facts and circumstances indicate that the carrying value
of the said assets may not be recoverable over time under existing market conditions. In December 2015, the Company recorded an
impairment charge of $281.8 million for the year ended December 31, 2015, including a charge of $249.2 million to write down the
carrying value of its oil and gas properties to their estimated fair market values, and a charge of $32.6 million to write-off the carrying
value of well Oyo-5 from work in progress because the Company no longer intends to recomplete it into a water injection well under
current plans. There were no impairment charges for the years ended December 31, 2014 and 2013.
Loss on Settlement of Asset Retirement Obligations
In April 2015, the Company completed plug and abandonment (P&A) activities for well Oyo-6, which was previously shut-in. Actual
P&A expenditures exceeded estimated P&A liabilities by $3.7 million in 2015. Accordingly, the Company recognized a $3.7 million
loss on settlement of its asset retirement obligations during 2015. No P&A activity occurred during 2014 and 2013.
38

Source: Erin Energy Corp., 10-K, March 24, 2016 Powered by Morningstar Document Research. The information contained herein may not be copied, adapted or distributed and is not warranted to be accurate, complete or timely. The user assumes all risks for any damages or losses arising from any use of this information, except to the extent such damages or losses cannot be limited or excluded by applicable law. Past financial performance is no guarantee of future results.
General and Administrative (“G&A”)
G&A expenses for 2015 were $15.9 million, as compared to $14.3 million and $14.5 million for 2014 and 2013, respectively. The
increase in 2015 is primarily due to increased overhead costs incurred to support the Company's foreign operations and certain higher
employee separation costs recognized in May 2015, partially offset by lower charges for consulting services incurred as compared to
the same period in 2014 in relation to a consulting agreement for investor relations services. In 2014, G&A expenditures decreased as
compared to 2013, primarily due to lower transaction costs incurred, partially offset by higher corporate overhead costs to support the
development of the Oyo field offshore Nigeria and the Company’s expanding exploration activities. In addition, the Company
incurred non-cash stock-based compensation expenses of $5.0 million, $3.1 million, and $2.0 million for the years 2015, 2014, and
2013, respectively.
Other Income (Expense)
The Company recorded other expense of $15.5 million in 2015, as compared to other expense of $3.0 million in 2014 and other
income of $38,000 in 2013. In 2015, the Company recorded $18.0 million in interest expense on borrowings, net of capitalized
interest, partially offset by a $2.5 million gain on foreign currency transactions.
In 2014, the Company recognized $4.4 million interest expense on borrowings and $0.4 million other tax related expenditures in
Nigeria, partially offset by $1.8 million gain on foreign currency transactions. In 2013, the Company recognized foreign currency
gains of $0.3 million, partially offset by interest expense associated with the Promissory Note.
Income Taxes
Income taxes were nil for the years 2015, 2014 and 2013. The Company had negative taxable earnings in Nigeria, and therefore was
not subject to Petroleum Profit Taxes for each of the years 2015, 2014 and 2013.
Headline Earnings
In February 2014, the Company’s common stock became listed on the Johannesburg Stock Exchange (“JSE”). The Company is
required to publish all documents filed with the U.S. Securities and Exchange Commission (“SEC”) on the JSE. The JSE requires that
we calculate and publicly disclose Headline Earnings Per Share (“HEPS”) which, per the SEC, is considered a non-GAAP
measurement.
As defined in the Circular 3/2009 of The South African Institute of Chartered Accountants, headline earnings is an additional earnings
number that excludes separately identifiable remeasurements, net of related tax and related non-controlling interest.
Basic and diluted HEPS is calculated using net loss adjusted for impairment on oil and gas properties for the year ended December 31,
2015. For the years ended December 31, 2014 and 2013, there were no separately identifiable remeasurements based on the criteria
outlined in circular 3/2009 and HEPS was the same as net loss per share as disclosed on the audited consolidated statements of
operations. The number of shares used to calculate basic and diluted HEPS is the same as basic and diluted loss per share.
39

Source: Erin Energy Corp., 10-K, March 24, 2016 Powered by Morningstar Document Research. The information contained herein may not be copied, adapted or distributed and is not warranted to be accurate, complete or timely. The user assumes all risks for any damages or losses arising from any use of this information, except to the extent such damages or losses cannot be limited or excluded by applicable law. Past financial performance is no guarantee of future results.
Reconciliation of net loss used to calculate basic and diluted loss per share and basic and diluted HEPS are as follows:
Years Ended December 31,
(In thousands, except for per share amounts) 2015 2014 2013
Net loss attributable to Erin Energy Corporation $ (451,497 ) $ (96,062 ) $ (43,525 )
Adjustments:
Impairment of oil and gas properties 281,768
—
—
Net loss used to calculate headline earnings $ (169,729 ) $ (96,062 ) $ (43,525 )
Weighted average number of shares used to calculate basic net loss per share
and basic HEPS 211,616
194,745
146,452
Weighted average number of shares used to calculate dilutive net loss per
share and diluted HEPS 211,616
194,745
146,452
Headline earnings per share:
Basic $ (0.80 ) $ (0.49 ) $ (0.30 )
Diluted $ (0.80 ) $ (0.49 ) $ (0.30 )
LIQUIDITY AND CAPITAL RESOURCES
Cash Flows
The table below sets forth a summary of the Company’s cash flows for the years ended December 31, 2015, 2014, and 2013:
Years Ended December 31,
(In thousands) 2015 2014 2013
Net cash (used in) provided by operating activities $ 2,145
$ (33,547 ) $ (36,625 )
Net cash used in investing activities $ (84,039 ) $ (298,510 ) $ (602 )
Net cash provided by financing activities $ 63,886
$ 357,037
$ 33,584
Effect of exchange rate changes on cash $ 1,228
$ —
$ —
Net increase (decrease) in cash and cash equivalents $ (16,780 ) $ 24,980
$ (3,643 )
Cash Flows from Operating Activities
The increase in net cash provided by operating activities of $35.7 million in 2015 as compared to 2014 was primarily due to a
combination of higher revenues and increased vendor financing.
The decrease in net cash used in operating activities of $3.1 million in 2014 as compared to 2013 was due to i) a $52.8 million higher
net loss in 2014 caused by lower revenues and higher operating costs, ii) a $26.2 million higher negative non-cash adjustment to net
income, principally due to a $32.9 million non-cash offset of crude oil sales receivables against a related party liability, partially offset
by $7.0 million higher non-cash DD&A adjustment, and iii) a $82.0 million positive variance in the changes in operating assets and
liabilities, principally due to increased vendor financing and sale of crude oil inventory.
Cash Flows from Investing Activities
The $84.0 million cash used in investing activities in 2015 was primarily for additions to property, plant and equipment as part of the
Oyo field redevelopment campaign in the OMLs.

Source: Erin Energy Corp., 10-K, March 24, 2016 Powered by Morningstar Document Research. The information contained herein may not be copied, adapted or distributed and is not warranted to be accurate, complete or timely. The user assumes all risks for any damages or losses arising from any use of this information, except to the extent such damages or losses cannot be limited or excluded by applicable law. Past financial performance is no guarantee of future results.
40

Source: Erin Energy Corp., 10-K, March 24, 2016 Powered by Morningstar Document Research. The information contained herein may not be copied, adapted or distributed and is not warranted to be accurate, complete or timely. The user assumes all risks for any damages or losses arising from any use of this information, except to the extent such damages or losses cannot be limited or excluded by applicable law. Past financial performance is no guarantee of future results.
The cash used in investing activities in 2014 consists of a $170.0 million payment to Allied, as partial consideration for the acquisition
of the Allied Assets, and $128.5 million addition to property, plant and equipment principally as part of the Oyo field redevelopment
campaign in the OMLs. Net cash used in investing activities of $0.6 million in 2013 consisted primarily of office infrastructure
expenditures.
Cash Flows from Financing Activities
In 2015, of the $63.9 million cash from financing activities, $62.4 million was from sources related to the Company, and $1.9 million
was obtained from the issuance of common stock pursuant to the exercise of stock warrants.
The increase in net cash provided by financing activities of $323.5 million in 2014 as compared to 2013 consisted of the $270.0
million investment from the PIC, $108.6 million borrowings, net of debt issuance costs, $0.9 million funding from a non-controlling
interest owner for their share of the Ghana exploration expenditures, $0.4 million for the issuance of stock pursuant to employee stock
option exercises, partially offset by a $12.4 million adjustment to the net assets of Allied in connection with the Allied Transaction
and a $10.4 million funding to an escrow account to secure certain repayments under the Term Loan Facility. Net cash provided by
financing activities for 2013 consisted primarily of a $29.2 million positive adjustment to the net assets of Allied in connection with
the Allied Transaction and $4.4 million of net borrowings under the Promissory Note.
Capital Resources
Our primary cash requirements are for capital expenditures for the continued development of the Oyo field in Nigeria, operating
expenditures for the Oyo field, exploration activities in unevaluated leaseholds, working capital needs, and interest and principal
payments under current indebtedness.
As a result of the current low commodity prices and the Company’s low oil production volumes due to the currently shut-in of well
Oyo-8, we have not been able to generate sufficient cash from operations to satisfy certain obligations as they became due. As of
December 31, 2015, we had available unrestricted cash of approximately $8.4 million and total current assets of approximately $26.6
million. Conversely, we had total current liabilities of $341.4 million, of which $213.1 million include accounts payable and accrued
liabilities. Further, pursuant to the Term Loan Facility, we will owe a total of approximately $9.0 million for quarterly principal and
interest on March 31, 2016. In addition, the lender, under the Term Loan Facility, has the right to unilaterally review the terms and
conditions of the Term Loan Facility and, among other things, terminate the Term Loan Facility and accelerate its maturity based on
any adverse information putting the Term Loan Facility at risk. See Note 9. - Debt to the Notes to Consolidated Financial Statements
for further information.
We are currently pursuing a number of actions, including i) working on re-establishing production from well Oyo-8, ii) obtaining
additional funds through public or private financing sources, iii) restructuring existing debts from lenders, iv) obtaining forbearance of
debt from trade creditors, v) reducing ongoing operating costs, vi) minimizing projected capital costs for the 2016 exploration and
development campaign and vii) farming-out a portion of our rights to certain of our oil and gas properties. There can be no assurances
that sufficient liquidity can be raised from one or more of these actions or that these actions can be consummated within the period
needed to meet future obligations.
Although we believe that we will be able to generate sufficient liquidity from the measures described above, our current circumstances
raise substantial doubt about our ability to continue to realize the carrying value of our assets and operate as a going concern.
41
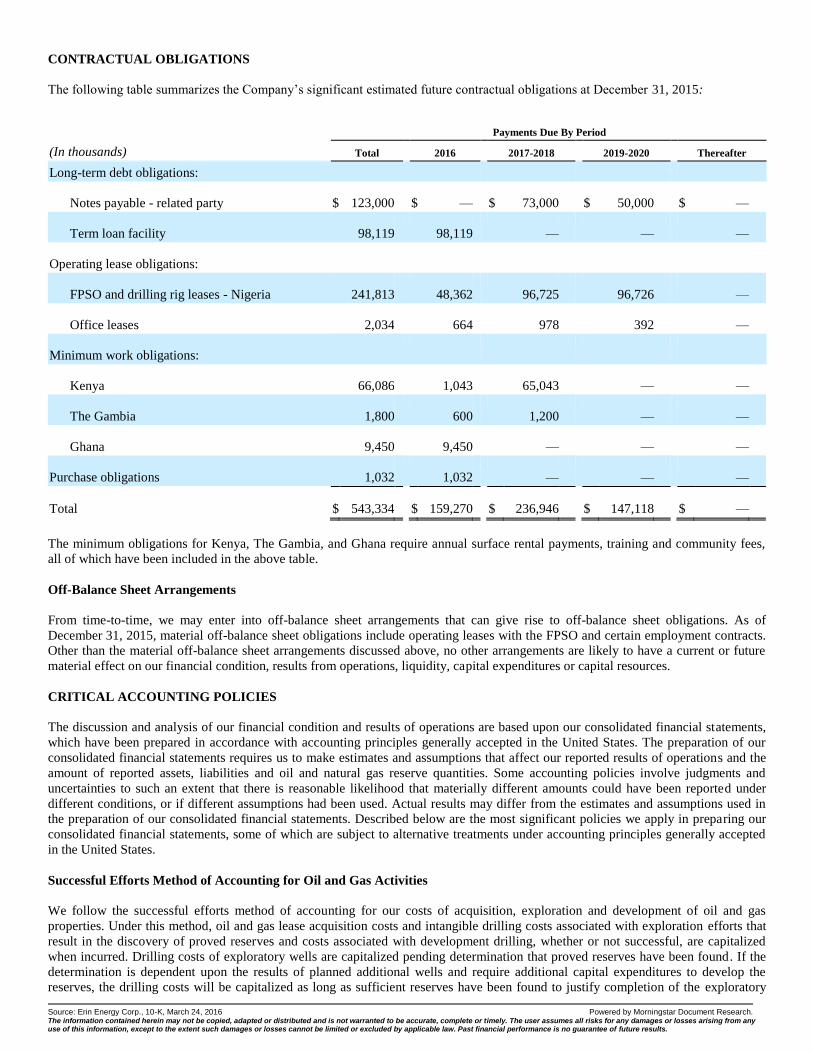
Source: Erin Energy Corp., 10-K, March 24, 2016 Powered by Morningstar Document Research. The information contained herein may not be copied, adapted or distributed and is not warranted to be accurate, complete or timely. The user assumes all risks for any damages or losses arising from any use of this information, except to the extent such damages or losses cannot be limited or excluded by applicable law. Past financial performance is no guarantee of future results.
CONTRACTUAL OBLIGATIONS
The following table summarizes the Company’s significant estimated future contractual obligations at December 31, 2015:
Payments Due By Period
(In thousands) Total 2016 2017-2018 2019-2020 Thereafter
Long-term debt obligations:
Notes payable - related party $ 123,000
$ —
$ 73,000
$ 50,000
$ —
Term loan facility 98,119
98,119
—
—
—
Operating lease obligations:
FPSO and drilling rig leases - Nigeria 241,813
48,362
96,725
96,726
—
Office leases 2,034
664
978
392
—
Minimum work obligations:
Kenya 66,086
1,043
65,043
—
—
The Gambia 1,800
600
1,200
—
—
Ghana 9,450
9,450
—
—
—
Purchase obligations 1,032
1,032
—
—
—
Total $ 543,334
$ 159,270
$ 236,946
$ 147,118
$ —
The minimum obligations for Kenya, The Gambia, and Ghana require annual surface rental payments, training and community fees,
all of which have been included in the above table.
Off-Balance Sheet Arrangements
From time-to-time, we may enter into off-balance sheet arrangements that can give rise to off-balance sheet obligations. As of
December 31, 2015, material off-balance sheet obligations include operating leases with the FPSO and certain employment contracts.
Other than the material off-balance sheet arrangements discussed above, no other arrangements are likely to have a current or future
material effect on our financial condition, results from operations, liquidity, capital expenditures or capital resources.
CRITICAL ACCOUNTING POLICIES
The discussion and analysis of our financial condition and results of operations are based upon our consolidated financial statements,
which have been prepared in accordance with accounting principles generally accepted in the United States. The preparation of our
consolidated financial statements requires us to make estimates and assumptions that affect our reported results of operations and the
amount of reported assets, liabilities and oil and natural gas reserve quantities. Some accounting policies involve judgments and
uncertainties to such an extent that there is reasonable likelihood that materially different amounts could have been reported under
different conditions, or if different assumptions had been used. Actual results may differ from the estimates and assumptions used in
the preparation of our consolidated financial statements. Described below are the most significant policies we apply in preparing our
consolidated financial statements, some of which are subject to alternative treatments under accounting principles generally accepted
in the United States.
Successful Efforts Method of Accounting for Oil and Gas Activities
We follow the successful efforts method of accounting for our costs of acquisition, exploration and development of oil and gas
properties. Under this method, oil and gas lease acquisition costs and intangible drilling costs associated with exploration efforts that
result in the discovery of proved reserves and costs associated with development drilling, whether or not successful, are capitalized
when incurred. Drilling costs of exploratory wells are capitalized pending determination that proved reserves have been found. If the
determination is dependent upon the results of planned additional wells and require additional capital expenditures to develop the
reserves, the drilling costs will be capitalized as long as sufficient reserves have been found to justify completion of the exploratory

Source: Erin Energy Corp., 10-K, March 24, 2016 Powered by Morningstar Document Research. The information contained herein may not be copied, adapted or distributed and is not warranted to be accurate, complete or timely. The user assumes all risks for any damages or losses arising from any use of this information, except to the extent such damages or losses cannot be limited or excluded by applicable law. Past financial performance is no guarantee of future results.
well as a producing well, and additional wells are underway or firmly planned to complete the evaluation of the well. Exploratory
wells not meeting the criteria for continued capitalization are expensed when such a determination is made. Other exploration costs are
expensed as incurred.
42

Source: Erin Energy Corp., 10-K, March 24, 2016 Powered by Morningstar Document Research. The information contained herein may not be copied, adapted or distributed and is not warranted to be accurate, complete or timely. The user assumes all risks for any damages or losses arising from any use of this information, except to the extent such damages or losses cannot be limited or excluded by applicable law. Past financial performance is no guarantee of future results.
Depreciation, depletion and amortization costs for productive oil and gas properties are recorded on a unit-of-production basis. For
other depreciable property, depreciation is recorded on a straight-line basis over the estimated useful life of the assets, which range
between three to five years, or the lease term if shorter. Repairs and maintenance charges, including workover costs, are charged to
expense as incurred.
Impairment of Long-Lived Assets
We review our long-lived assets in property, plant and equipment for impairment each reporting period, or whenever changes in
circumstances indicate that the carrying amount of assets may not be fully recoverable. Possible indicators of impairment include
lower expected future oil and gas prices, actual or expected future development or operating costs significantly higher than previously
anticipated, significant downward oil and gas reserve revisions, or when changes in other circumstances indicate the carrying amount
of an asset may not be recoverable.
An impairment loss is recognized for proved properties when the estimated undiscounted future cash flows expected to result from the
asset are less than its carrying amount. We estimate the future undiscounted cash flows of the affected properties to judge the
recoverability of carrying amounts. Cash flows are determined on the basis of reasonable and documented assumptions that represent
the best estimate of the future economic conditions during the remaining useful life of the asset. Our cash flow projections into the
future include assumptions on variables, such as future sales, sales prices, operating costs, economic conditions, market competition
and inflation. Prices used to quantify the expected future cash flows are estimated based on forward prices prevailing in the
marketplace and management’s long-term planning assumptions. Impairment is measured by the excess of carrying amount over the
fair value of the assets.
In December 2015, the Company recorded an impairment charge of $281.8 million, including a charge of $249.2 million to write
down the carrying value of its oil and gas properties to their estimated fair market values, and a charge of $32.6 million to write-off
the carrying value of well Oyo-5 from work in progress because the Company no longer intends to recomplete it into a water injection
well under current plans. There were no impairment charges for the years ended December 31, 2014 and 2013.
Unevaluated leasehold costs are assessed for impairment at the end of each reporting period and transferred to proved oil and gas
properties to the extent they are associated with successful exploration activities. Significant unevaluated leasehold costs are assessed
individually for impairment, based on our current exploration plans, and any indicated impairment is charged to expense.
Asset Retirement Obligations
We recognize a liability for asset retirement obligations ("ARO") in accordance with applicable accounting standards. These standards
require that the fair value of a liability for an asset retirement obligation be recognized in the period in which it is incurred. The ARO
liability represents the present value, using a credit-adjusted risk free interest rate, of the estimated site restoration costs with a
corresponding increase to the carrying amount of the related long-lived assets. See Note 8. — Asset Retirement Obligations to the
Notes to Consolidated Financial Statements for further information.
Revenue Recognition
Revenues are recognized when crude oil is delivered to a buyer. The recognition criteria are satisfied when there exists a signed
contract with defined pricing, delivery, and acceptance, as defined in a contract, and there is no significant uncertainty of
collectability. Crude oil revenues are recorded net of royalties.
Stock-Based Compensation
We recognize all stock-based payments to employees, including grants of employee stock options, in the consolidated financial
statements based on their grant-date fair values. We value our stock options awarded using the Black-Scholes option pricing model.
Restricted stock awards are valued at the grant date closing market price. Stock-based compensation costs are recognized over the
vesting period, which is the period during which the employee is required to provide service in exchange for the award. Stock-based
compensation paid to non-employees are valued at the fair value of the goods and services provided at the applicable measurement
date and charged to expense as services are rendered.
RECENTLY ISSUED ACCOUNTING STANDARDS
43
Source: Erin Energy Corp., 10-K, March 24, 2016 Powered by Morningstar Document Research. The information contained herein may not be copied, adapted or distributed and is not warranted to be accurate, complete or timely. The user assumes all risks for any damages or losses arising from any use of this information, except to the extent such damages or losses cannot be limited or excluded by applicable law. Past financial performance is no guarantee of future results.
For more information on recently issued accounting standards, see Note 2. - Basis of Presentationand Significant Accounting Policies
to the Notes to Consolidated Financial Statements.
ITEM 7A. QUANTITATIVE AND QUALITATIVE DISCLOSURES ABOUT MARKET RISK
We may be exposed to certain market risks related to changes in foreign currency exchange, interest rates, and commodity prices.
Foreign Currency Exchange Risk
Our results of operations and financial condition are affected by currency exchange rates. While oil sales are denominated in U.S.
dollars, portions of our capital and operating costs in Nigeria are denominated in Naira, the Nigerian local currency. Similarly,
portions of our exploration costs in Kenya, The Gambia, and Ghana are denominated in each country’s respective local currency.
Historically, the exchange rate between the U.S. dollar and the local currencies in the countries in which we operate has fluctuated
widely in response to international political conditions, general macro economic conditions, and other factors beyond our control.
The weighted average exchange rate between the U.S. dollar and the Nigerian Naira was 195.10 Naira per each U.S. dollar in the year
ended December 31, 2015. For the year ended December 31, 2015, a 10% fluctuation in the weighted average exchange rate between
the U.S. dollar and the Nigerian Naira would have had an approximate $2.8 million impact on our capital and operating costs in
Nigeria.
To date, we have not engaged in hedging activities to hedge our foreign currency exposure in our foreign operations. In the future, we
may enter into hedging instruments to manage our foreign currency exchange risk or continue to be subject to exchange rate risk.
Commodity Price Risk
As an independent oil producer, our revenue, other income and profitability, reserves values, access to capital and future rate of
growth are substantially dependent upon the prevailing prices of crude oil. Prevailing prices for such commodities are subject to wide
fluctuations in response to relatively minor changes in supply and demand and a variety of additional factors beyond our control.
Prices received for oil sales have been volatile and unpredictable, and such volatility is expected to continue.
Historically, realized commodity prices received for our crude oil sales have been tied to the Brent oil prices. Prices received have
been volatile and unpredictable. For the year ended December 31, 2015, a $10.00 fluctuation in the prices received for our crude oil
sales would have had an approximate $14.5 million impact on our revenues.
We do not currently engage in hedging activities to hedge our exposure to commodity price risks. In the future, we may enter into
hedging instruments to manage our exposure to fluctuations in commodity prices.
Interest Rate Risk
We are exposed to changes in interest rates, primarily from possible fluctuations in the London Interbank Borrowing Rate (“LIBOR”).
The interest rates on our debt obligations are stated at floating rates tied to the LIBOR. Currently, we do not use interest rate derivative
instruments to manage exposure to interest rate changes. For the year ended December 31, 2015, the weighted average interest rate on
our variable rate debt was 11.02%. Assuming our current level of borrowings, a 100 basis point increase in the interest rates we pay
under our various debt facilities would result in an increase of our interest expense by $2.2 million over a twelve month period.
ITEM 8. FINANCIAL STATEMENTS AND SUPPLEMENTAL DATA
The Company’s Consolidated Financial Statements and the accompanying Notes that are filed as part of this Annual Report are listed
under Item 15 . Exhibits, Financial Statements and Schedules and are set forth immediately following the signature pages of
this Form 10-K.
44

Source: Erin Energy Corp., 10-K, March 24, 2016 Powered by Morningstar Document Research. The information contained herein may not be copied, adapted or distributed and is not warranted to be accurate, complete or timely. The user assumes all risks for any damages or losses arising from any use of this information, except to the extent such damages or losses cannot be limited or excluded by applicable law. Past financial performance is no guarantee of future results.
ITEM 9. CHANGES IN AND DISAGREEMENTS WITH ACCOUNTANTS ON ACCOUNTING AND FINANCIAL
DISCLOSURE
None.
ITEM 9A. CONTROLS AND PROCEDURES
Evaluation of Disclosure Controls and Procedures
We maintain disclosure controls and procedures that are designed to ensure that information required to be disclosed in our reports
under the Securities Exchange Act of 1934, as amended (the “Exchange Act”), is recorded, processed, summarized and reported
within the time periods specified in the SEC’s rules and forms, and that such information is accumulated and communicated to
management, including our Chief Executive Officer (“CEO”) and Principal Financial Officer (“PFO”), as appropriate, to allow timely
decisions regarding required disclosures.
Our management, with the participation of our CEO and PFO, evaluated the effectiveness of our disclosure controls and procedures.
Based on their evaluation, as of the end of the period covered by this Form 10-K, our CEO and PFO have concluded that the
Company’s disclosure controls and procedures (as defined in Rules 13a-15(e) and 15d-15(e) under the Exchange Act) were effective.
Management’s Report On Internal Control Over Financial Reporting
Our management is responsible for establishing and maintaining adequate internal control over financial reporting. Internal control
over financial reporting is defined in Rules 13a-15(f) and 15d-15(f) promulgated under the Exchange Act as a process designed by, or
under the supervision of, our principal executive and principal financial officers and is effected by our board of directors, management
and other personnel, to provide reasonable assurance regarding the reliability of financial reporting and the preparation of financial
statements for external purposes in accordance with generally accepted accounting principles (“GAAP”) and includes those policies
and procedures that:
• pertain to the maintenance of records that, in reasonable detail, accurately and fairly reflect our transactions and dispositions
of our assets;
• provide reasonable assurance that transactions are recorded as necessary to permit preparation of our financial statements in
accordance with GAAP, and that our receipts and expenditures are being made only in accordance with authorizations of our
management and directors; and
• provide reasonable assurance regarding prevention or timely detection of unauthorized acquisition, use or disposition of our
assets that could have a material effect on our financial statements.
Because of its inherent limitations, a system of internal control over financial reporting can provide only reasonable assurance and
may not prevent or detect misstatements. Furthermore, because of changes in conditions, effectiveness of internal controls over
financial reporting may vary over time. Our system contains self-monitoring mechanisms, and actions are taken to correct deficiencies
as they are identified.
Management assessed the effectiveness of our internal control over financial reporting as of December 31, 2015, based on the criteria
described in the 2013 Internal Control—Integrated Framework issued by the Committee of Sponsoring Organizations of the Treadway
Commission.
Based on this assessment, management, including the Company’s CEO and PFO, concluded that our internal control over financial
reporting was effective as of December 31, 2015.
Grant Thornton LLP, the independent registered public accounting firm that audited our consolidated financial statements included in
this Form 10-K, has audited the effectiveness of our internal control over financial reporting as of December 31, 2015, as stated in
their report, which is included herein.
45

Source: Erin Energy Corp., 10-K, March 24, 2016 Powered by Morningstar Document Research. The information contained herein may not be copied, adapted or distributed and is not warranted to be accurate, complete or timely. The user assumes all risks for any damages or losses arising from any use of this information, except to the extent such damages or losses cannot be limited or excluded by applicable law. Past financial performance is no guarantee of future results.
Changes in Internal Control Over Financial Reporting
No change in the Company’s internal control over financial reporting (as defined in Rules 13a-15(f) and 15d-15(f) under the Exchange
Act) occurred during the fiscal quarter ended December 31, 2015, that has materially affected, or is reasonably likely to materially
affect, our internal control over financial reporting.
46

Source: Erin Energy Corp., 10-K, March 24, 2016 Powered by Morningstar Document Research. The information contained herein may not be copied, adapted or distributed and is not warranted to be accurate, complete or timely. The user assumes all risks for any damages or losses arising from any use of this information, except to the extent such damages or losses cannot be limited or excluded by applicable law. Past financial performance is no guarantee of future results.
REPORT OF INDEPENDENT REGISTERED PUBLIC ACCOUNTING FIRM
Board of Directors and Shareholders
Erin Energy Corporation
We have audited the internal control over financial reporting of Erin Energy Corporation (a Delaware corporation) and subsidiaries
(the “Company”) as of December 31, 2015, based on criteria established in the 2013 Internal Control-Integrated Framework issued
by the Committee of Sponsoring Organizations of the Treadway Commission (COSO). The Company’s management is responsible
for maintaining effective internal control over financial reporting and for its assessment of the effectiveness of internal control over
financial reporting, included in the accompanying Management’s Report on Internal Control Over Financial Reporting. Our
responsibility is to express an opinion on the Company’s internal control over financial reporting based on our audit.
We conducted our audit in accordance with the standards of the Public Company Accounting Oversight Board (United States). Those
standards require that we plan and perform the audit to obtain reasonable assurance about whether effective internal control over
financial reporting was maintained in all material respects. Our audit included obtaining an understanding of internal control over
financial reporting, assessing the risk that a material weakness exists, testing and evaluating the design and operating effectiveness of
internal control based on the assessed risk, and performing such other procedures as we considered necessary in the circumstances.
We believe that our audit provides a reasonable basis for our opinion.
A company’s internal control over financial reporting is a process designed to provide reasonable assurance regarding the reliability of
financial reporting and the preparation of financial statements for external purposes in accordance with generally accepted accounting
principles. A company’s internal control over financial reporting includes those policies and procedures that (1) pertain to the
maintenance of records that, in reasonable detail, accurately and fairly reflect the transactions and dispositions of the assets of the
company; (2) provide reasonable assurance that transactions are recorded as necessary to permit preparation of financial statements in
accordance with generally accepted accounting principles, and that receipts and expenditures of the company are being made only in
accordance with authorizations of management and directors of the company; and (3) provide reasonable assurance regarding
prevention or timely detection of unauthorized acquisition, use, or disposition of the company’s assets that could have a material effect
on the financial statements.
Because of its inherent limitations, internal control over financial reporting may not prevent or detect misstatements. Also, projections
of any evaluation of effectiveness to future periods are subject to the risk that controls may become inadequate because of changes in
conditions, or that the degree of compliance with the policies or procedures may deteriorate.
In our opinion, the Company maintained, in all material respects, effective internal control over financial reporting as of December 31,
2015, based on criteria established in the 2013 Internal Control-Integrated Framework issued by COSO.
We also have audited, in accordance with the standards of the Public Company Accounting Oversight Board (United States), the
consolidated financial statements of the Company as of and for the year ended December 31, 2015, and our report dated March 23,
2016 expressed an unqualified opinion on those financial statements.
/s/ GRANT THORNTON LLP
Houston, Texas
March 23, 2016
47

Source: Erin Energy Corp., 10-K, March 24, 2016 Powered by Morningstar Document Research. The information contained herein may not be copied, adapted or distributed and is not warranted to be accurate, complete or timely. The user assumes all risks for any damages or losses arising from any use of this information, except to the extent such damages or losses cannot be limited or excluded by applicable law. Past financial performance is no guarantee of future results.
ITEM 9B. OTHER INFORMATION
On March 11, 2016, the Board of Directors adopted the First Amendment to the Company’s Amended and Restated Bylaws (the “First
Amendment”). The First Amendment includes the following:
• updates the Company’s name from CAMAC Energy Inc. to Erin Energy Corporation;
• changes the director removal procedure to allow for the removal of a director with or without cause by a majority vote of the
stockholders;
• makes the appointment of certain officers permissive rather than mandatory;
and
• removes the requirement that the Chief Executive Officer also be a
director.
The foregoing description of the terms of the First Amendment does not purport to be complete and is subject to, and qualified in its
entirety by, reference to the complete text of the First Amendment, a copy of which was filed on March 17, 2016 as Exhibit 3.1 to our
Current Report on Form 8-K and incorporated by reference herein.
PART III
ITEM 10. DIRECTORS, EXECUTIVE OFFICERS AND CORPORATE GOVERNANCE
The information required by this item will be included in the Company’s Definitive Proxy Statement (the “Proxy Statement”) for its
2016 annual meeting of shareholders, and is incorporated by reference. The Proxy Statement will be filed with the SEC within 120
days subsequent to December 31, 2015.
ITEM 11. EXECUTIVE COMPENSATION
The information required under Item 11 of Form 10-K will be set forth in the 2016 Proxy Statement and is incorporated herein by
reference.
ITEM 12. SECURITY OWNERSHIP OF CERTAIN BENEFICIAL OWNERS AND MANAGEMENT AND RELATED
STOCKHOLDER MATTERS
The information required under Item 12 of Form 10-K will be set forth in the 2016 Proxy Statement and is incorporated herein by
reference.
ITEM 13. CERTAIN RELATIONSHIPS AND RELATED TRANSACTIONS, AND DIRECTOR INDEPENDENCE
The information required under Item 13 of Form 10-K will be set forth in the 2016 Proxy Statement and is incorporated herein by
reference.
ITEM 14. PRINCIPAL ACCOUNTANT FEES AND SERVICES
The information required under Item 14 of Form 10-K will be set forth in the 2016 Proxy Statement and is incorporated herein by
reference.
48

Source: Erin Energy Corp., 10-K, March 24, 2016 Powered by Morningstar Document Research. The information contained herein may not be copied, adapted or distributed and is not warranted to be accurate, complete or timely. The user assumes all risks for any damages or losses arising from any use of this information, except to the extent such damages or losses cannot be limited or excluded by applicable law. Past financial performance is no guarantee of future results.
PART IV
ITEM 15. EXHIBITS, FINANCIAL STATEMENTS AND SCHEDULES
(a) Documents filed as part of this Annual Report:
The following is an index of the financial statements, schedules and exhibits included in this Form 10-K or incorporated herein by
reference.
(1) Consolidated Financial Statements
Reports of Independent Registered Public Accounting Firm F-1
Consolidated Balance Sheets at December 31, 2015 and 2014 F-2
Consolidated Statements of Operations for the years ended December 31, 2015, 2014 and 2013 F-3
Consolidated Statements of Comprehensive Loss for the years ended December 31, 2015, 2014 and 2013 F-4
Consolidated Statements of Equity for the years ended December 31, 2015, 2014 and 2013 F-5
Consolidated Statements of Cash Flows for the years ended December 31, 2015, 2014 and 2013 F-6
Notes to Consolidated Financial Statements F-7
(2) Consolidated Financial Statement Schedules
Supplemental Data on Oil and Gas Exploration and Producing Activities (Unaudited) S-1
Schedules not included have been omitted because they are not applicable or the required information is shown in the
consolidated financial statements or notes
(3) Exhibits
49

Source: Erin Energy Corp., 10-K, March 24, 2016 Powered by Morningstar Document Research. The information contained herein may not be copied, adapted or distributed and is not warranted to be accurate, complete or timely. The user assumes all risks for any damages or losses arising from any use of this information, except to the extent such damages or losses cannot be limited or excluded by applicable law. Past financial performance is no guarantee of future results.
The following exhibits are filed with the report: Exhibit Number Description
2.1
Transfer Agreement, dated as of November 19, 2013, by and among CAMAC Energy Inc., CAMAC Petroleum
Limited, CAMAC Energy Holdings Limited, CAMAC International (Nigeria) Limited and Allied Energy Plc
(incorporated by reference to Exhibit 2.1 of our Form 8-K filed on November 22, 2013).
3.1
Certificate of Amendment of the Amended and Restated Certificate of Incorporation of the Company, dated February
13, 2014 (incorporated by reference to Exhibit 3.1 of our Form 8-K filed on February 19, 2014).
3.2
Certificate of Amendment of the Amended and Restated Certificate of Incorporation of the Company, dated April 7,
2010 (incorporated by reference to Exhibit 3.1 of our Form 8-K filed on April 13, 2010).
3.3
Amended and Restated Certificate of Incorporation of the Company, dated May 3, 2007 (incorporated by reference to
Exhibit 3.1 of our Form 10-SB filed on August 16, 2007).
3.4
Amended and Restated Bylaws of the Company as of April 11, 2011 (incorporated by reference to Exhibit 3.1 of our
Quarterly Report on Form 10-Q filed on May 3, 2011).
3.5
Certificate of Amendment of the Amended and Restated Certificate of Incorporation of the Company as of April 22,
2015 (incorporated by reference to Exhibit 3.4 of our Quarterly Report on Form 10-Q filed on May 8, 2015).
3.6
First Amendment to the Amended and Restated Bylaws of the Company adopted on March 11, 2016(incorporated by
reference to Exhibit 3.1 of our Form 8-K filed on March 17, 2016).
4.1
Specimen Common Stock Certificate (incorporated by reference to Exhibit 4.1 of our Form 10-SB filed on August
16, 2007).
4.2
Form of Common Stock Warrant (incorporated by reference to Exhibit 4.2 of our Form 10-SB filed on August 16,
2007).
4.3
Company 2007 Stock Plan (incorporated by reference to Exhibit 10.1 of our Form 10-SB filed on August 16, 2007). *
4.4
Company 2009 Equity Incentive Plan (incorporated by reference to Registration Statement on Form S-8 filed on July
1, 2011).*
4.5
First Amendment to the Company’s Amended 2009 Equity Incentive Plan, dated February 18, 2014 (incorporated by
reference to Exhibit 99.1 of our Form 8-K filed on February 19, 2014).
4.6
Form of Series A Warrant (incorporated by reference to Exhibit 4.1 of our Current Report on Form 8-K filed on
February 12, 2010).
4.7
Form of Series C Warrant (incorporated by reference to Exhibit 4.1 of our Current Report on Form 8-K filed on
March 3, 2010).
4.8
Registration Rights Agreement, by and between the Company and CAMAC Energy Holdings Limited, dated April 7,
2010 (incorporated by reference to Exhibit 4.1 of our Current Report on Form 8-K filed on April 13, 2010).
4.9
Form of Warrant (incorporated by reference to Exhibit 4.1 of our Current Report on Form 8-K filed on December 23,
2010).
4.10
Registration Rights Agreement, dated as of February 15, 2011, by and among the Company, CAMAC Energy
Holdings Limited, Allied Energy Plc, and CAMAC International (Nigeria) Limited (incorporated by reference to
Exhibit 4.1 of our Current Report on Form 8-K filed on February 16, 2011).
4.11
Registration Rights Agreement, dated February 21, 2014, by and between the Company and Allied Energy Plc
(incorporated by reference to Exhibit 4.1 of our Current Report on Form 8-K filed on February 27, 2014).
4.12
Registration Rights Agreement, dated February 21, 2014, by and between the Company and The Public Investment
Corporation (SOC) Limited (incorporated by reference to Exhibit 4.3 of our Current Report on Form 8-K filed on
February 27, 2014).
10.1
Form of Securities Purchase Agreement, dated February 10, 2010 (incorporated by reference to Exhibit 4.1 of our
Current Report on Form 8-K filed on February 12, 2010).
10.2
Company 2007 Stock Plan form of Stock Option Agreement (incorporated by reference to Exhibit 10.2 of our Form
10-SB filed on August 15, 2007). *
10.3
Company 2007 Stock Plan form of Restricted Stock Agreement (incorporated by reference to Exhibit 10.3 of our
Form 10-SB filed on August 15, 2007). *
10.4
Form of Indemnification Agreement for Officers (incorporated by reference to Exhibit 10.4 of our Annual Report on
Form 10-K filed on April 15, 2013). *

Source: Erin Energy Corp., 10-K, March 24, 2016 Powered by Morningstar Document Research. The information contained herein may not be copied, adapted or distributed and is not warranted to be accurate, complete or timely. The user assumes all risks for any damages or losses arising from any use of this information, except to the extent such damages or losses cannot be limited or excluded by applicable law. Past financial performance is no guarantee of future results.
50

Source: Erin Energy Corp., 10-K, March 24, 2016 Powered by Morningstar Document Research. The information contained herein may not be copied, adapted or distributed and is not warranted to be accurate, complete or timely. The user assumes all risks for any damages or losses arising from any use of this information, except to the extent such damages or losses cannot be limited or excluded by applicable law. Past financial performance is no guarantee of future results.
Exhibit Number Description
10.5
Form of Indemnification Agreement for Directors (incorporated by reference to Exhibit 10.5 of our Annual Report on
Form 10-K filed on April 15, 2013). *
10.6
Company 2009 Equity Incentive Plan form of Stock Option Agreement (incorporated by reference to Exhibit 10.5 of
our Annual Report on Form 10-K filed on March 2, 2010).*
10.7
Purchase and Sale Agreement, dated November 18, 2009, by and among the Company, CAMAC Energy Holdings
Limited, CAMAC International (Nigeria) Limited, and Allied Energy Plc. (incorporated by reference to Exhibit 10.1
of our Current Report on Form 8-K filed on November 23, 2009).
10.8
Form of Securities Purchase Agreement, dated March 2, 2010 (incorporated by reference to Exhibit 10.1 of our
Current Report on Form 8-K filed March 3, 2010).
10.9
Production Sharing Contract , dated July 22, 2005, by and between Allied Energy Resources Nigeria Limited,
CAMAC International (Nigeria) Limited, and Nigerian Agip Exploration Limited (incorporated by reference to
Annex E on our Form DEF 14A filed March 19, 2010).
10.10
Agreement Novating Production Sharing Contract, by and among Allied Energy Plc, CAMAC International (Nigeria)
Limited, Nigerian Agip Exploration Limited, and CAMAC Petroleum Limited, dated April 7, 2010 (incorporated by
reference to Exhibit 10.1 of our Current Report on Form 8-K dated April 13, 2010).
10.11
The Oyo Field Agreement, by and among Allied Energy Plc, CAMAC Energy Holdings Limited and CAMAC
Petroleum Limited, dated April 7, 2010 (incorporated by reference to Exhibit 10.2 of our Current Report on Form 8-K
filed on April 13, 2010).
10.12
The Right of First Refusal Agreement, by and among the Company, CAMAC Energy Holdings Limited, CAMAC
International (Nigeria) Limited, and Allied Energy Plc, dated April 7, 2010 (incorporated by reference to Exhibit 10.3
of our Current Report on Form 8-K filed on April 13, 2010).
10.13
Purchase and Continuation Agreement, dated December 10, 2010, by and among CAMAC Energy Inc., CAMAC
Petroleum Limited, CAMAC Energy Holdings Limited, Allied Energy Plc, and CAMAC International (Nigeria)
Limited (incorporated by reference to Exhibit 10.1 of our Current Report on Form 8-K filed on December 13, 2010).
10.14
Form of Securities Purchase Agreement (incorporated by reference to Exhibit 10.1 of our Current Report filed on
December 23, 2010).
10.15
Limited Waiver Agreement Related to Purchase and Continuation Agreement, dated as of February 15, 2011, by and
among CAMAC Energy Inc., CAMAC Petroleum Inc., CAMAC Energy Holdings Limited, Allied Energy Plc, and
CAMAC International (Nigeria) Limited (incorporated by reference to Exhibit 10.1 of our Current Report on Form
8-K filed on February 16, 2011).
10.16
Second Agreement Novating Production Sharing Contract, dated as of February 15, 2011, by and among Allied
Energy Plc, CAMAC International (Nigeria) Limited, Nigerian Agip Exploration Limited, and CAMAC Petroleum
Limited (incorporated by reference to Exhibit 10.2 of our Current Report on Form 8-K filed on February 16, 2011).
10.17
Amended and Restated Oyo field Agreement Hereby Renamed OML 120/121 Management Agreement, dated as of
February 15, 2011, by and among CAMAC Petroleum Limited, CAMAC Energy Holdings Limited, and Allied
Energy Plc (incorporated by reference to Exhibit 10.4 of our Current Report on Form 8-K filed on February 16,
2011).
10.18
Promissory Note Agreement dated June 6, 2011 by and among CAMAC Petroleum Limited and Allied Energy Plc.
(incorporated by reference to Exhibit 10.2 of our Current Report on Form 8-K filed on June 9, 2011).
10.19
Guaranty Agreement dated June 6, 2011 by and among CAMAC Energy Inc. and Allied Energy Plc. (incorporated by
reference to Exhibit 10.2 of our Current Report on Form 8-K filed on June 9, 2011).
10.20
Executive Employment Agreement dated September 1, 2011 by and between Nicholas J. Evanoff and the Company
(incorporated by reference to Exhibit 10.1 of our Current Report on Form 8-K filed on September 7, 2011).*
10.21
Executive Employment Agreement dated September 1, 2011 by and between Babatunde Omidele and the Company
(incorporated by reference to Exhibit 10.2 of our Current Report on Form 8-K filed on September 7, 2011).*
10.22
Executive Consulting Agreement effective March 1, 2012 by and between Earl W. McNiel and the Company
(incorporated by reference to Exhibit 10.47 of our Annual Report on Form 10-K filed on March 15, 2012).*

Source: Erin Energy Corp., 10-K, March 24, 2016 Powered by Morningstar Document Research. The information contained herein may not be copied, adapted or distributed and is not warranted to be accurate, complete or timely. The user assumes all risks for any damages or losses arising from any use of this information, except to the extent such damages or losses cannot be limited or excluded by applicable law. Past financial performance is no guarantee of future results.
10.23
Production Sharing Contract, by and between the Government of the Republic of Kenya and CAMAC Energy Kenya
Limited, dated May 10, 2012, relating to Block L1B (incorporated by reference to Exhibit 10.4 of our Form 10-Q
filed on May 9, 2012).
51

Source: Erin Energy Corp., 10-K, March 24, 2016 Powered by Morningstar Document Research. The information contained herein may not be copied, adapted or distributed and is not warranted to be accurate, complete or timely. The user assumes all risks for any damages or losses arising from any use of this information, except to the extent such damages or losses cannot be limited or excluded by applicable law. Past financial performance is no guarantee of future results.
Exhibit Number Description
10.24
Production Sharing Contract, by and between the Government of the Republic of Kenya and CAMAC Energy Kenya
Limited, dated May 10, 2012, relating to Block L16 (incorporated by reference to Exhibit 10.5 of our Form 10-Q filed
on May 9, 2012).
10.25
Production Sharing Contract, by and between the Government of the Republic of Kenya and CAMAC Energy Kenya
Limited, dated May 10, 2012, relating to Block L27 (incorporated by reference to Exhibit 10.6 of our Form 10-Q filed
on May 9, 2012).
10.26
Production Sharing Contract, by and between the Government of the Republic of Kenya and CAMAC Energy Kenya
Limited, dated May 10, 2012, relating to Block L28 (incorporated by reference to Exhibit 10.7 of our Form 10-Q filed
on May 9, 2012).
10.27
Petroleum (Exploration, Development and Production) License, by and between the Republic of The Gambia and
CAMAC Energy A2 Gambia Ltd., dated May 24, 2012, relating to Block A2 (incorporated by reference to Exhibit
10.8 of our Form 10-Q filed on May 9, 2012).
10.28
Petroleum (Exploration, Development and Production) License, by and between the Republic of The Gambia and
CAMAC Energy A5 Gambia Ltd., dated May 24, 2012, relating to Block A5 (incorporated by reference to Exhibit
10.9 of our Form 10-Q filed on May 9, 2012).
10.29
Share Sale and Purchase Agreement, by and between Leyshon Resources Limited and CAMAC Energy Inc., dated
July 22, 2012 (incorporated by reference to Exhibit 10.1 of our Form 10-Q filed on November 9, 2013).
10.3
Executive Employment Agreement dated February 27, 2013 by and between Earl W. McNiel and the Company
(incorporated by reference to Exhibit 10.38 of our Annual Report on Form 10-K filed April 15, 2013).*
10.31
Amended and Extended Maturity Date of the Promissory Note dated June 6, 2011, amended August 3, 2012, by and
among CAMAC Petroleum Limited and Allied Energy Plc (incorporated by reference to Exhibit 10.39 of our Form
10-K filed on April 15, 2013).
10.32
Amended and Extended Maturity Date of the Promissory Note dated June 6, 2011, amended March 25, 2013, by and
among CAMAC Petroleum Limited and Allied Energy Plc (incorporated by reference to Exhibit 10.40 of our Form
10-K filed on April 15, 2013).
10.33
Technical Services Agreement, by and between Allied Energy Plc and CAMAC Petroleum Limited, dated January
10, 2013 (incorporated by reference to Exhibit 10.41 of our Form 10-K filed on April 15, 2013).
10.34
Amended and Restated Promissory Note, effective September 10, 2013, by and among CAMAC Petroleum Limited
and Allied Energy Plc (incorporated by reference to Exhibit 10.1 of our Form 10-Q filed on November 14, 2013).
10.35
Amendment No. 1 to Guaranty Agreement, effective September 10, 2013, by and among the Company and Allied
Energy Plc (incorporated by reference to Exhibit 10.2 of our Form 10-Q filed on November 14, 2013).
10.36
Equitable Share Mortgage Arrangement, effective September 10, 2013, by and among the Company and Allied
Energy Plc (incorporated by reference to Exhibit 10.3 of our Form 10-Q filed on November 14, 2013).
10.37
Executive Employment Agreement, dated September 1, 2013, by and between Heidi Wong and the Company
(incorporated by reference to Exhibit 10.4 of our Form 10-Q filed on November 14, 2013).*
10.38
Share Purchase Agreement, effective as of November 18, 2013, by and between CAMAC Energy Inc. and Public
Investment Corporation (SOC) Limited (incorporated by reference to Exhibit 10.1 of our Form 8-K filed on
November 22, 2013).
10.39
Third Agreement Novating Production Sharing Contract, dated as of November 19, 2013, by and among Allied
Energy Plc, CAMAC International (Nigeria) Limited and CAMAC Petroleum Limited (incorporated by reference to
Exhibit 10.2 of our Form 8-K filed on November 22, 2013).
10.40
Convertible Subordinated Note, dated February 21, 2014, by and between the Company and Allied Energy Plc.
(incorporated by reference to Exhibit 4.2 of our Form 8-K filed on February 27, 2014).
10.41
Assignment and Bill of Sale, dated February 21, 2014, by and between Allied Energy Plc and CAMAC Petroleum
Limited (incorporated by reference to Exhibit 10.1 of our Form 8-K filed on February 27, 2014).
10.42
Right of First Refusal and Corporate Opportunities Agreement, dated February 21, 2014, by and among the Company
and CAMAC Energy Holdings Limited (incorporated by reference to Exhibit 10.2 of our Form 8-K filed on February
27, 2014).
10.43
Corporate Guarantee, dated July 22, 2014, by CAMAC Energy Inc. to Zenith Bank PLC (incorporated by reference to
Exhibit 10.43 to the Company’s Annual Report on Form 10-K filed on March 16, 2015).
52

Source: Erin Energy Corp., 10-K, March 24, 2016 Powered by Morningstar Document Research. The information contained herein may not be copied, adapted or distributed and is not warranted to be accurate, complete or timely. The user assumes all risks for any damages or losses arising from any use of this information, except to the extent such damages or losses cannot be limited or excluded by applicable law. Past financial performance is no guarantee of future results.

Source: Erin Energy Corp., 10-K, March 24, 2016 Powered by Morningstar Document Research. The information contained herein may not be copied, adapted or distributed and is not warranted to be accurate, complete or timely. The user assumes all risks for any damages or losses arising from any use of this information, except to the extent such damages or losses cannot be limited or excluded by applicable law. Past financial performance is no guarantee of future results.
Exhibit Number Description
10.44
Term Loan Facility Agreement for the Expansion and Development of the Oil Block OML 120 and 121, dated
September 30, 2014, among CAMAC Petroleum Limited and Zenith Bank PLC (incorporated by reference to Exhibit
10.44 to the Company’s Annual Report on Form 10-K filed on March 16, 2015).
10.45
Corporate Guarantee, dated December 15, 2014, by CAMAC Energy Inc. to Zenith Bank PLC (incorporated by
reference to Exhibit 10.45 to the Company’s Annual Report on Form 10-K filed on March 16, 2015).
10.46
Joint Operating Agreement, dated January 23, 2015, among GNPC Exploration and Production Company Limited,
CAMAC Energy Ghana Limited, and Base Energy Ghana Limited (incorporated by reference to Exhibit 10.46 to the
Company’s Annual Report on Form 10-K filed on March 16, 2015).
10.47
Extension of Maturity Date for the Second Amended and Restated Promissory Note, dated March 9, 2015, among
CAMAC Petroleum Limited and Allied Energy Plc (incorporated by reference to Exhibit 10.47 to the Company’s
Annual Report on Form 10-K filed on March 16, 2015).
10.48
Convertible Note, dated March 11, 2015, by and between the Company and Allied Energy Plc (incorporated by
reference to Exhibit 10.48 to the Company’s Annual Report on Form 10-K filed on March 16, 2015).
10.49
Common Stock Purchase Warrant, dated March 11, 2015, by and between the Company and Allied Energy Plc
(incorporated by reference to Exhibit 10.49 to the Company’s Annual Report on Form 10-K filed on March 16,
2015).
10.50
Offer of Employment as Senior Vice President and Chief Financial Officer, dated April 28, 2015, by and between the
Company and Christopher J. Hearne (incorporated by reference to Exhibit 10.2 on Form 8-K filed on May 8, 2015).
10.51
Separation Agreement and General Release of Claims, dated May 6, 2015, by and between the Company and Earl W.
McNiel (incorporated by reference to Exhibit 10.1 on Form 8-K filed on May 8, 2015).
10.52
Block A2 License Amendment, dated May 25, 2015, by and between the CAMAC Energy Gambia Limited and The
Republic of the Gambia (incorporated by reference to Exhibit 10.1 on Form 8-K filed on May 29, 2015).
10.53
Block A5 License Amendment, dated May 25, 2015, by and between the CAMAC Energy Gambia Limited and The
Republic of the Gambia (incorporated by reference to Exhibit 10.2 on Form 8-K filed on May 29, 2015).
10.54
Offer of Employment as Senior Vice President and Chief Financial Officer, dated September 10, 2015, by and
between the Company and Daniel Ogbonna (incorporated by reference to Exhibit 10.1 on Form 8-K filed on
September 15, 2015).
10.55
Amended and Extended Maturity Date of the Promissory Note dated June 6, 2011, amended October 19, 2015, by
and among CAMAC Petroleum Limited and Allied Energy Plc (incorporated by reference to Exhibit 10.2 on Form
10-Q filed on November 9, 2015).
10.56
Offer of Employment as Senior Vice President, General Counsel and Secretary, dated November 12, 2015, by and
between the Company and Jean-Michel Malek (incorporated by reference to Exhibit 10.1 on Form 8-K filed on
November 18, 2015).
10.57
Extension of Maturity Date for the 2015 Convertible Note dated March 11, 2015, amended March 16, 2016, by and
among Erin Energy Corporation and Allied Energy Plc.
21.1 Subsidiaries of the Company.
23.1 Consent of Grant Thornton LLP, Independent Registered Public Accounting Firm, filed herewith.
23.2 Consent of DeGolyer and MacNaughton.
31.1
Certification of Chief Executive Officer Pursuant to 15 U.S.C. § 7241, as Adopted Pursuant to Section 302 of the
Sarbanes-Oxley Act of 2002.
31.2
Certification of Principle Financial and Accounting Officer Pursuant to 15 U.S.C. § 7241, as Adopted Pursuant to
Section 302 of the Sarbanes-Oxley Act of 2002.
32.1
Certification of Chief Executive Officer Pursuant to 18 U.S.C. § 1350, as Adopted Pursuant to Section 906 of the
Sarbanes-Oxley Act of 2002.
32.2
Certification of Principle Financial and Accounting Officer Pursuant to 18 U.S.C. § 1350, as Adopted Pursuant to
Section 906 of the Sarbanes-Oxley Act of 2002.
99.1 Report of DeGolyer and MacNaughton.
101. INS XBRL Instance Document.
101. SCH XBRL Schema Document.
101. CAL XBRL Calculation Linkbase Document.

Source: Erin Energy Corp., 10-K, March 24, 2016 Powered by Morningstar Document Research. The information contained herein may not be copied, adapted or distributed and is not warranted to be accurate, complete or timely. The user assumes all risks for any damages or losses arising from any use of this information, except to the extent such damages or losses cannot be limited or excluded by applicable law. Past financial performance is no guarantee of future results.
53

Source: Erin Energy Corp., 10-K, March 24, 2016 Powered by Morningstar Document Research. The information contained herein may not be copied, adapted or distributed and is not warranted to be accurate, complete or timely. The user assumes all risks for any damages or losses arising from any use of this information, except to the extent such damages or losses cannot be limited or excluded by applicable law. Past financial performance is no guarantee of future results.
Exhibit Number Description
101. DEF XBRL Taxonomy Extension Definition Linkbase Document.
101. LAB XBRL Label Linkbase Document.
101. PRE XBRL Presentation Linkbase Document.
* Indicates a management contract or compensatory plan or arrangement.
54

Source: Erin Energy Corp., 10-K, March 24, 2016 Powered by Morningstar Document Research. The information contained herein may not be copied, adapted or distributed and is not warranted to be accurate, complete or timely. The user assumes all risks for any damages or losses arising from any use of this information, except to the extent such damages or losses cannot be limited or excluded by applicable law. Past financial performance is no guarantee of future results.
SIGNATURES
Pursuant to the requirements of Section 13 or 15(d) of the Securities Exchange Act of 1934, the Registrant has duly caused this
report to be signed on its behalf by the undersigned, thereunto duly authorized.
Dated: March 23, 2016
Erin Energy Corporation
By: /s/ Dr. Kase Lukman Lawal
Dr. Kase Lukman Lawal
Chief Executive Officer
(Principal Executive Officer)
By: /s/ Daniel Ogbonna
Daniel Ogbonna
Senior Vice President and Chief Financial Officer
(Principal Financial Officer)
Pursuant to the requirements of the Securities Exchange Act of 1934, this report has been signed below by the following persons on
behalf of registrant and in the capacities and on the dates indicated.
Title Date
/s/ DR. KASE LUKMAN LAWAL Director and Chief Executive Officer March 23, 2016
Dr. Kase Lukman Lawal (Principal Executive Officer)
/s/ DANIEL OGBONNA Senior Vice President and Chief Financial Officer March 23, 2016
Daniel Ogbonna (Principal Financial Officer)
/s/ ADAMA TRAORE Vice President, Controller and Chief Accounting Officer March 23, 2016
Adama Traore (Principal Accounting Officer)
/s/ DR. LEE PATRICK BROWN Director March 23, 2016
Dr. Lee Patrick Brown
/s/ WILLIAM J. CAMPBELL Director March 23, 2016
William J. Campbell
/s/ DUDU HLATSHWAYO Director March 23, 2016
Dudu Hlatshwayo
/s/ JOHN HOFMEISTER Director March 23, 2016
John Hofmeister
/s/ IRA WAYNE MCCONNELL Director March 23, 2016
Ira Wayne McConnell
/s/ HAZEL O’LEARY Director March 23, 2016
Hazel O’Leary
55

Source: Erin Energy Corp., 10-K, March 24, 2016 Powered by Morningstar Document Research. The information contained herein may not be copied, adapted or distributed and is not warranted to be accurate, complete or timely. The user assumes all risks for any damages or losses arising from any use of this information, except to the extent such damages or losses cannot be limited or excluded by applicable law. Past financial performance is no guarantee of future results.
REPORT OF INDEPENDENT REGISTERED PUBLIC ACCOUNTING FIRM
Board of Directors and Shareholders
Erin Energy Corporation
We have audited the accompanying consolidatedbalance sheets of Erin Energy Corporation (a Delaware corporation) and subsidiaries
(the “Company”) as of December 31, 2015 and 2014, and the related consolidated statements of operations, comprehensive loss,
changes in equity (capital deficiency), and cash flows for each of the three years in the period ended December 31, 2015. These
financial statements are the responsibility of the Company’s management. Our responsibility is to express an opinion on these
financial statements based on our audits.
We conducted our audits in accordance with the standards of the Public Company Accounting Oversight Board (United States). Those
standards require that we plan and perform the audit to obtain reasonable assurance about whether the financial statements are free of
material misstatement. An audit includes examining, on a test basis, evidence supporting the amounts and disclosures in the financial
statements. An audit also includes assessing the accounting principles used and significant estimates made by management, as well as
evaluating the overall financial statement presentation. We believe that our audits provide a reasonable basis for our opinion.
In our opinion, the consolidated financial statements referred to above present fairly, in all material respects, the financial position of
Erin Energy Corporation and subsidiaries as of December 31, 2015 and 2014, and the results of their operations and their cash flows
for each of the three years in the period ended December 31, 2015 in conformity with accounting principles generally accepted in the
United States of America.
The accompanying consolidated financial statements have been prepared assuming that the Company will continue as a going
concern. As discussed in Note 3 to the financial statements, the Company incurred net losses in each of the years ended December 31,
2015, 2014 and 2013, and as of December 31, 2015, the Company’s current liabilities exceeded its current assets by $314.8 million.
These conditions, along with other matters as set forth in Note 3, raise substantial doubt about the Company’s ability to continue as a
going concern. Management’s plans in regard to these matters are also described in Note 3. The consolidated financial statements do
not include any adjustments that might result from the outcome of this uncertainty.
We also have audited, in accordance with the standards of the Public Company Accounting Oversight Board (United States), the
Company’s internal control over financial reporting as of December 31, 2015, based on criteria established in the 2013 Internal
Control-Integrated Framework issued by the Committee of Sponsoring Organizations of the Treadway Commission (COSO), and
our report dated March 23, 2016 expressed an unqualified opinion thereon.
/s/ GRANT THORNTON LLP
Houston, Texas
March 23, 2016
F-1

Source: Erin Energy Corp., 10-K, March 24, 2016 Powered by Morningstar Document Research. The information contained herein may not be copied, adapted or distributed and is not warranted to be accurate, complete or timely. The user assumes all risks for any damages or losses arising from any use of this information, except to the extent such damages or losses cannot be limited or excluded by applicable law. Past financial performance is no guarantee of future results.
ERIN ENERGY CORPORATION
CONSOLIDATED BALANCE SHEETS
(In thousands, except for share and per share data)
As of December 31,
2015 2014
ASSETS
Current assets:
Cash and cash equivalents $ 8,363
$ 25,143
Restricted cash 8,661
1,496
Accounts receivable - trade 1,029
—
Accounts receivable - partners 287
496
Accounts receivable - related party 1,186
624
Accounts receivable - other 28
54
Crude oil inventory 4,789
1,089
Prepaids and other current assets 2,245
2,929
Total current assets 26,588
31,831
Property, plant and equipment:
Oil and gas properties (successful efforts method of accounting), net 348,331
595,269
Other property, plant and equipment, net 1,174
1,060
Total property, plant and equipment, net 349,505
596,329
Other non-current assets
Restricted cash —
8,909
Debt issuance costs —
1,307
Other non-current assets 67
67
Other assets, net 67
10,283
Total assets $ 376,160
$ 638,443
LIABILITIES AND EQUITY (CAPITAL DEFICIENCY)
Current liabilities:
Accounts payable and accrued liabilities $ 213,120
$ 108,047
Accounts payable and accrued liabilities - related party 30,133
9,391
Asset retirement obligations —
12,703
Current portion of long-term debt - Term loan facility 98,119
6,200
Total current liabilities 341,372
136,341
Term loan facility —
93,000
Long-term notes payable - related party 120,006
61,185
Asset retirement obligations 20,609 13,830

Source: Erin Energy Corp., 10-K, March 24, 2016 Powered by Morningstar Document Research. The information contained herein may not be copied, adapted or distributed and is not warranted to be accurate, complete or timely. The user assumes all risks for any damages or losses arising from any use of this information, except to the extent such damages or losses cannot be limited or excluded by applicable law. Past financial performance is no guarantee of future results.
Other long-term liabilities —
82
Total liabilities 481,987
304,438
Commitments and contingencies (Note 11)
Equity (Capital deficiency):
Preferred stock $0.001 par value - 50,000,000 shares authorized; none issued and outstanding as of
December 31, 2015 and 2014, respectively —
—
Common stock $0.001 par value - 416,666,667 shares authorized; 211,615,773 and
210,307,502 shares outstanding as of December 31, 2015 and 2014, respectively 212
210
Additional paid-in capital 789,615
778,095
Accumulated deficit (896,451 ) (444,954 )
Total equity (deficit) - Erin Energy Corporation (106,624 ) 333,351
Non-controlling interests 797
654
Total equity (capital deficiency) (105,827 ) 334,005
Total liabilities and equity (capital deficiency) $ 376,160
$ 638,443
The accompanying notes are an integral part of these consolidated financial statements.
F-2

Source: Erin Energy Corp., 10-K, March 24, 2016 Powered by Morningstar Document Research. The information contained herein may not be copied, adapted or distributed and is not warranted to be accurate, complete or timely. The user assumes all risks for any damages or losses arising from any use of this information, except to the extent such damages or losses cannot be limited or excluded by applicable law. Past financial performance is no guarantee of future results.
ERIN ENERGY CORPORATION
CONSOLIDATED STATEMENTS OF OPERATIONS
(In thousands, except for per share amounts)
Years Ended December 31,
2015 2014 2013
Revenues:
Crude oil sales, net of royalties $ 68,429
$ 53,844
$ 63,736
Operating costs and expenses:
Production costs 90,079
80,296
84,431
Crude oil inventory (increase) decrease (2,502 ) 14,512
(14,004 )
Workover expenses 972
—
—
Exploratory expenses 16,437
14,283
5,501
Depreciation, depletion and amortization 99,110
23,756
16,875
Impairment of oil and gas properties 281,768
—
—
Loss on settlement of asset retirement obligations 3,653
—
—
General and administrative expenses 15,905
14,322
14,460
Total operating costs and expenses 505,422
147,169
107,263
Operating loss (436,993 ) (93,325 ) (43,527 )
Other income (expense):
Currency transaction gain (loss) 2,520
1,758
224
Interest expense (17,986 ) (4,383 ) (99 )
Other, net —
(358 ) (87 )
Total other income (expense) (15,466 ) (2,983 ) 38
Loss from continuing operations before income taxes (452,459 ) (96,308 ) (43,489 )
Income tax expense —
—
—
Net loss from continuing operations (452,459 ) (96,308 ) (43,489 )
Discontinued operations
Net loss from discontinued operations, net of tax —
—
(36 )
Net loss from discontinued operations —
—
(36 )
Net loss before non-controlling interest from continuing operations (452,459 ) (96,308 ) (43,525 )
Net loss attributable to non-controlling interest 962
246
—
Net loss attributable to Erin Energy Corporation $ (451,497 ) $ (96,062 ) $ (43,525 )
Net loss per common share attributable to Erin Energy Corporation - basic:
Continuing operations $ (2.13 ) $ (0.49 ) $ (0.30 )
Discontinued operations $ —
$ —
$ —
Total $ (2.13 ) $ (0.49 ) $ (0.30 )

Source: Erin Energy Corp., 10-K, March 24, 2016 Powered by Morningstar Document Research. The information contained herein may not be copied, adapted or distributed and is not warranted to be accurate, complete or timely. The user assumes all risks for any damages or losses arising from any use of this information, except to the extent such damages or losses cannot be limited or excluded by applicable law. Past financial performance is no guarantee of future results.
Net loss per common share attributable to Erin Energy Corporation - diluted:
Continuing operations $ (2.13 ) $ (0.49 ) $ (0.30 )
Discontinued operations $ —
$ —
$ —
Total $ (2.13 ) $ (0.49 ) $ (0.30 )
Weighted-average common shares outstanding:
Basic 211,616
194,745
146,452
Diluted 211,616
194,745
146,452
The accompanying notes are an integral part of these consolidated financial statements.
F-3

Source: Erin Energy Corp., 10-K, March 24, 2016 Powered by Morningstar Document Research. The information contained herein may not be copied, adapted or distributed and is not warranted to be accurate, complete or timely. The user assumes all risks for any damages or losses arising from any use of this information, except to the extent such damages or losses cannot be limited or excluded by applicable law. Past financial performance is no guarantee of future results.
ERIN ENERGY CORPORATION
CONSOLIDATED STATEMENTS OF COMPREHENSIVE LOSS
(In thousands)
Years Ended December 31,
2015 2014 2013
Net loss, including non-controlling interest $ (452,459 ) $ (96,308 ) $ (43,525 )
Other comprehensive income (loss):
Foreign currency transactions —
—
(224 )
Total other comprehensive (loss) income —
—
(224 )
Comprehensive loss (452,459 ) (96,308 ) (43,749 )
Comprehensive loss attributable to non-controlling interests 962
246
—
Comprehensive loss attributable to Erin Energy Corporation $ (451,497 ) $ (96,062 ) $ (43,749 )
The accompanying notes are an integral part of these consolidated financial statements.
F-4

Source: Erin Energy Corp., 10-K, March 24, 2016 Powered by Morningstar Document Research. The information contained herein may not be copied, adapted or distributed and is not warranted to be accurate, complete or timely. The user assumes all risks for any damages or losses arising from any use of this information, except to the extent such damages or losses cannot be limited or excluded by applicable law. Past financial performance is no guarantee of future results.
ERIN ENERGY CORPORATION
CONSOLIDATED STATEMENTS OF CHANGES IN EQUITY (CAPITAL DEFICIENCY)
(In thousands) Common Stock
Additional
Paid-in Capital
Accumulated
Deficit
Accumulated Other
Comprehensive
Income (Loss)
Non-controlling
Interest
Total
Equity
Shares Amount
At December 31, 2012 146,254
$ 146
$ 638,405
$ (305,367 ) $ 224
$ (6 ) $ 333,402
Vesting of restricted
stock 383
—
2
—
—
—
2
Stock-based
compensation —
—
2,013
—
—
—
2,013
Realized foreign
currency gain —
—
—
—
(224 ) —
(224 )
Adjustments to
non-controlling
interest —
—
—
—
—
6
6
Net loss —
—
—
(43,525 ) —
—
(43,525 )
Net assets contributed
by parent —
—
61,205
—
—
—
61,205
Allied Transaction
adjustments —
—
35,067
—
—
—
35,067
December 31, 2013 146,637
146
736,692
(348,892 ) —
—
387,946
Common stock issued 63,671
64
270,351
—
—
—
270,415
Stock-based
compensation —
—
3,492
—
—
—
3,492
Non-controlling
interest —
—
—
—
—
900
900
Net loss —
—
—
(96,062 ) —
(246 ) (96,308 )
Allied acquisition —
—
(220,000 ) —
—
—
(220,000 )
Allied Transaction
adjustments —
—
(12,440 ) —
—
—
(12,440 )
December 31, 2014 210,308
210
778,095
(444,954 ) —
654
334,005
Common stock issued 1,308
2
1,978
—
—
—
1,980
Stock-based
compensation —
—
4,631
—
—
—
4,631
Warrants issued with
debt —
—
4,911
—
—
—
4,911
Non-controlling
interest —
—
—
—
—
1,105
1,105
Net loss —
—
—
(451,497 ) —
(962 ) (452,459 )
December 31, 2015 211,616
$ 212
$ 789,615
$ (896,451 ) $ —
$ 797
$ (105,827 )
The accompanying notes are an integral part of these consolidated financial statements.
F-5

Source: Erin Energy Corp., 10-K, March 24, 2016 Powered by Morningstar Document Research. The information contained herein may not be copied, adapted or distributed and is not warranted to be accurate, complete or timely. The user assumes all risks for any damages or losses arising from any use of this information, except to the extent such damages or losses cannot be limited or excluded by applicable law. Past financial performance is no guarantee of future results.
ERIN ENERGY CORPORATION
CONSOLIDATED STATEMENTS OF CASH FLOWS
(In thousands) Years Ended December 31, 2015
2015 2014 2013
Cash flows from operating activities
Net loss, including non-controlling interest $ (452,459 ) $ (96,308 ) $ (43,525 )
Adjustments to reconcile net loss to cash (used in) provided by operating activities:
Depreciation, depletion and amortization 97,179
21,590
14,640
Impairment of oil and gas properties 281,768
—
—
Asset retirement obligation accretion 1,931
2,166
2,235
Amortization of debt issuance costs 2,766
147
—
Loss on settlement of asset retirement obligations 3,653
—
—
Related party liability offset —
(32,880 ) —
Unrealized currency transaction (gain) loss (2,520 ) (1,572 ) (224 )
Share-based compensation 5,027
3,095
2,013
Payments to settle asset retirement obligations (16,640 ) —
—
Other —
(17 ) 16
Changes in operating assets and liabilities:
(Increase) decrease in accounts receivable (804 ) 562
(3,046 )
(Increase) decrease in crude oil inventory (2,502 ) 14,512
(14,004 )
(Increase) decrease in prepaids and other current assets 746
(1,672 ) 156
(Increase) decrease in other non-current assets —
(15 ) —
Increase in accounts payable and accrued liabilities 84,000
56,845
5,114
Net cash provided by (used in) operating activities 2,145
(33,547 ) (36,625 )
Cash flows from investing activities
Capital expenditures (84,039 ) (128,510 ) (602 )
Allied transaction —
(170,000 ) —
Net cash used in investing activities (84,039 ) (298,510 ) (602 )
Cash flows from financing activities
Proceeds from the issuance of common stock —
270,000
—
Proceeds from the exercise of stock options and warrants 1,855
415
—
Proceeds from (repayments of) term loan facility (337 ) 100,000
—
Debt issuance costs —
(2,082 ) —
Proceeds from note payable - related party, net 61,815
10,649
4,350
Funds restricted for debt service —
(10,405 ) —
Allied Transaction adjustments —
(12,440 ) 29,234
Funding from non-controlling interest 553
900
—
Net cash provided by financing activities 63,886 357,037 33,584

Source: Erin Energy Corp., 10-K, March 24, 2016 Powered by Morningstar Document Research. The information contained herein may not be copied, adapted or distributed and is not warranted to be accurate, complete or timely. The user assumes all risks for any damages or losses arising from any use of this information, except to the extent such damages or losses cannot be limited or excluded by applicable law. Past financial performance is no guarantee of future results.
Effect of exchange rate on cash and cash equivalents 1,228
—
—
Net increase (decrease) in cash and cash equivalents (16,780 ) 24,980
(3,643 )
Cash and cash equivalents at beginning of year 25,143
163
3,806
Cash and cash equivalents at end of year $ 8,363
$ 25,143
$ 163
Supplemental disclosure of cash flow information
Cash paid for:
Interest, net $ 11,114
$ 8
$ 99
Supplemental disclosure of non-cash investing and financing activities:
Issuance of common shares for settlement of liabilities $ 125
$ —
$ —
Discount on notes payable pursuant to issuance of warrants $ 4,911
$ —
$ —
Reduction in accounts payable from settlement of Northern Offshore contingency $ 24,307
$ —
$ —
Receivable from non-controlling interest $ 552
$ —
$ —
Related party accounts payable, net, settled with related party notes payable $ —
$ (32,880 ) $ 1,274
Non-cash gain from asset retirement obligation extinguishment $ —
$ —
$ 5,833
Change in asset retirement obligation estimate $ (4,284 ) $ 3,766
$ —
Net assets contributed by parent $ —
$ —
$ 61,205
The accompanying notes are an integral part of these consolidated financial statements
F-6

Source: Erin Energy Corp., 10-K, March 24, 2016 Powered by Morningstar Document Research. The information contained herein may not be copied, adapted or distributed and is not warranted to be accurate, complete or timely. The user assumes all risks for any damages or losses arising from any use of this information, except to the extent such damages or losses cannot be limited or excluded by applicable law. Past financial performance is no guarantee of future results.
ERIN ENERGY CORPORATION
NOTES TO CONSOLIDATED FINANCIAL STATEMENTS
NOTE 1. — COMPANY DESCRIPTION
Erin Energy Corporation (NYSE MKT: ERN, JSE: ERN) is an independent exploration and production company engaged in the
acquisition and development of energy resources in Africa. The Company’s asset portfolio consists of nine licenses across four
countries covering an area of approximately 40,000 square kilometers (approximately 10 million acres). The Company owns
producing properties and conducts exploration activities offshore Nigeria, conducts exploration activities offshore Ghana and The
Gambia, and both offshore and onshore Kenya.
The Company is headquartered in Houston, Texas and has offices in Lagos, Nigeria, Nairobi, Kenya, Banjul, The Gambia, Accra,
Ghana and Johannesburg, South Africa.
The Company’s operating subsidiaries include Erin Petroleum Nigeria Limited (“EPNL”), CAMAC Energy Kenya Limited, Erin
Energy Gambia Ltd., and Erin Energy Ghana Limited. The terms “we,” “us,” “our,” “the Company,” and “our Company” refer to Erin
Energy Corporation and its subsidiaries.
The Company also conducts certain business transactions with its majority shareholder, CAMAC Energy Holdings Limited
(“CEHL”), and its affiliates, which include Allied Energy Plc (“Allied”). See Note 10. — Related Party Transactions for further
information.
The Company’s Executive Chairman of the Board of Directors, and Chief Executive Officer, is a director of each of the above listed
related parties. He indirectly owns 27.7% of CEHL, which is the majority shareholder of the Company. As a result, he may be deemed
to have an indirect material interest in transactions contemplated with any of the above companies and their affiliates.
NOTE 2. — BASIS OF PRESENTATION AND SIGNIFICANT ACCOUNTING POLICIES
Basis of Presentation
The accompanying consolidated financial statements include the accounts of the Company and its wholly owned and majority-owned
direct and indirect subsidiaries, and have been prepared in accordance with generally accepted accounting principles in the United
States (“U.S. GAAP”) pursuant to the rules and regulations of the Securities and Exchange Commission (the “SEC”). All significant
intercompany transactions and balances have been eliminated in consolidation. The consolidated financial statements reflect all
adjustments that are, in the opinion of management, necessary for a fair presentation of the consolidated financial position and results
of operations for the indicated periods. All such adjustments are of a normal recurring nature.
In January 2014, the Company’s Board of Directors declared a stock dividend on all shares of the Company’s outstanding common
stock entitling stockholders of record as of the close of business on February 13, 2014, to receive an additional 1.4348 shares of
common stock for every share of common stock held (the “Stock Dividend”). Payment of the Stock Dividend was effected on
February 21, 2014. Because the Stock Dividend exceeded 25% of the total shares of common stock outstanding prior to the
distribution, it was considered a large stock dividend. Accordingly, it has been accounted for as a stock split under current accounting
rules. The effect is a retroactive adjustment to the financial statements and associated footnotes as if the dividend had occurred at the
beginning of the first period presented.
In February 2014, the Company completed the acquisition of the remaining economic interests that it did not already own in the
Production Sharing Contract covering Oil Mining Leases 120 and 121 located offshore Nigeria (the “OMLs”), which include the
currently producing Oyo field (the “Allied Assets”), from Allied (the “Allied Transaction”). Pursuant to the terms of the Transfer
Agreement entered into with Allied, the Company issued approximately 82.9 million shares of common stock to Allied, as partial
consideration for the Allied Assets. Allied is a subsidiary of CEHL, the Company’s majority shareholder, and deemed to be under
common control. Accordingly, the net assets acquired from Allied were recorded at their respective carrying values as of the
acquisition date. The shares issued to Allied and the financial statements presented for all periods included herein are presented as
though the transfer of the Allied Assets had occurred in June 2012, the effective date when Allied acquired the Allied Assets from an
independent third party. See Note 4. — Acquisitions for further information.
F-7

Source: Erin Energy Corp., 10-K, March 24, 2016 Powered by Morningstar Document Research. The information contained herein may not be copied, adapted or distributed and is not warranted to be accurate, complete or timely. The user assumes all risks for any damages or losses arising from any use of this information, except to the extent such damages or losses cannot be limited or excluded by applicable law. Past financial performance is no guarantee of future results.
ERIN ENERGY CORPORATION
NOTES TO CONSOLIDATED FINANCIAL STATEMENTS
Effective April 22, 2015, the Company implemented a reverse stock split, whereby each six shares of outstanding common stock
pre-split was converted into one share of common stock post-split (the “reverse stock split”). All share and per share amounts for all
periods presented herein have been adjusted to reflect the reverse stock split as if it had occurred at the beginning of the first period
presented.
Significant Accounting Policies
Principles of Consolidation
The consolidated financial statements include the accounts and activities of the Company, subsidiaries in which the Company has a
controlling financial interest, and entities for which the Company is the primary beneficiary. All material intercompany accounts and
transactions have been eliminated in consolidation.
Use of Estimates
The preparation of consolidated financial statements in conformity with U.S. GAAP requires management to make estimates based on
assumptions. Estimates affect the reported amounts of assets and liabilities, disclosure of contingent liabilities, and the reported
amounts of revenues and expenses during the reporting periods. Accordingly, accounting estimates require the exercise of judgment.
While management believes that the estimates and assumptions used in the preparation of the Company’s consolidated financial
statements are appropriate, actual results could differ from those estimates.
Estimates that may have a significant effect on the Company’s financial position and results from operations include share-based
compensation assumptions, oil and natural gas reserve quantities, impairment of oil and gas properties, depletion and amortization
relating to oil and gas properties, asset retirement obligation assumptions, and income taxes. The accounting estimates used in the
preparation of the consolidated financial statements may change as new events occur, more experience is acquired, additional
information is obtained and our operating environment changes.
Cash and Cash Equivalents
Cash and cash equivalents include cash on hand, demand deposits and short-term investments with initial maturities of three months or
less.
Restricted Cash
Restricted cash consists of cash deposits that are contractually restricted for withdrawal or required to be maintained in a reserve bank
account for a specific period of time, as provided for under certain agreements with third parties.
Restricted cash as of December 31, 2015 and 2014, consists of $8.7 million and $10.4 million, respectively, held in a debt service
reserve account to secure certain interest and principal repayments pursuant to the Term Loan Facility in Nigeria.
Accounts Receivable and Allowance for Doubtful Accounts
Accounts receivable are accounted for at cost less allowance for doubtful accounts. The Company establishes provisions for losses on
accounts receivable if it is determined that collection of all or a part of an outstanding balance is not probable. Collectability is
reviewed regularly and an allowance is established or adjusted, as necessary, using the specific identification method. As of
December 31, 2015 and 2014, no allowance for doubtful accounts was necessary.
As of December 31, 2015 , the Company had a $1.0 million trade receivable for the remaining balance owed from its December 2015
crude oil sale. As of December 31, 2014, the trade receivable balance was nil.
Partner accounts receivable consist of balances owed from joint venture (“JV”) partners. As of December 31, 2015 and 2014, the
Company was owed $0.3 million and $0.5 million from its Ghana JV partners for their share of the expenditures incurred in the
Shallow Water Tano block, pursuant to the Ghana JV Joint Operating Agreement.
F-8

Source: Erin Energy Corp., 10-K, March 24, 2016 Powered by Morningstar Document Research. The information contained herein may not be copied, adapted or distributed and is not warranted to be accurate, complete or timely. The user assumes all risks for any damages or losses arising from any use of this information, except to the extent such damages or losses cannot be limited or excluded by applicable law. Past financial performance is no guarantee of future results.
ERIN ENERGY CORPORATION
NOTES TO CONSOLIDATED FINANCIAL STATEMENTS
Crude Oil Inventory
Inventories of crude oil are valued at the lower of cost or market using the first-in, first-out method and include certain costs directly
related to the production process. The Company had crude oil inventory of $4.8 million and $1.1 million as of December 31, 2015 and
2014, respectively.
Successful Efforts Method of Accounting for Oil and Gas Activities
The Company follows the successful efforts method of accounting for its costs of acquisition, exploration and development of oil and
gas properties. Under this method, oil and gas lease acquisition costs and intangible drilling costs associated with exploration efforts
that result in the discovery of proved reserves and costs associated with development drilling, whether or not successful, are
capitalized when incurred. Drilling costs of exploratory wells are capitalized pending determination that proved reserves have been
found. If the determination is dependent upon the results of planned additional wells and require additional capital expenditures to
develop the reserves, the drilling costs will be capitalized as long as sufficient reserves have been found to justify completion of the
exploratory well as a producing well, and additional wells are underway or firmly planned to complete the evaluation of the well.
Exploratory wells not meeting the criteria for continued capitalization are expensed when such a determination is made. Other
exploration costs are expensed as incurred.
A portion of the Company’s oil and gas properties include oilfield materials and supplies inventory to be used in connection with the
Company’s drilling program. These inventories are stated at the lower of cost or market, which approximates fair value, and they are
regularly assessed for obsolescence. Oilfield materials and supplies inventory balances were $30.0 million and $30.5 million at
December 31, 2015 and 2014, respectively.
Depreciation, depletion and amortization costs for productive oil and gas properties are recorded on a unit-of-production basis. For
other depreciable property, depreciation is recorded on a straight-line basis over the estimated useful life of the assets, which range
between three to five years, or the lease term if shorter. Repairs and maintenance charges, including workover costs, are charged to
expense as incurred.
Impairment of Long-Lived Assets
The Company reviews its long-lived assets in property, plant and equipment for impairment each reporting period, or whenever
changes in circumstances indicate that the carrying amount of assets may not be fully recoverable. Possible indicators of impairment
include lower expected future oil and gas prices, actual or expected future development or operating costs significantly higher than
previously anticipated, significant downward oil and gas reserve revisions, or when changes in other circumstances indicate the
carrying amount of an asset may not be recoverable.
An impairment loss is recognized for proved properties when the estimated undiscounted future cash flows expected to result from the
asset are less than its carrying amount. The Company estimates the future undiscounted cash flows of the affected properties to judge
the recoverability of carrying amounts. Cash flows are determined on the basis of reasonable and documented assumptions that
represent the best estimate of the future economic conditions during the remaining useful life of the asset. The Company’s cash flow
projections into the future include assumptions on variables, such as future sales, sales prices, operating costs, economic conditions,
market competition and inflation. Prices used to quantify the expected future cash flows are estimated based on forward prices
prevailing in the marketplace and management’s long-term planning assumptions. Impairment is measured by the excess of carrying
amount over the fair value of the assets.
Unevaluated leasehold costs are assessed for impairment at the end of each reporting period and transferred to proved oil and gas
properties to the extent they are associated with successful exploration activities. Significant unevaluated leasehold costs are assessed
individually for impairment, based on the Company’s current exploration plans, and any indicated impairment is charged to
expense.
Asset Retirement Obligations
The Company accounts for asset retirement obligations in accordance with applicable accounting guidelines, which require that the
fair value of a liability for an asset retirement obligation be recognized in the period in which it is incurred. Specifically, the
F-9
Source: Erin Energy Corp., 10-K, March 24, 2016 Powered by Morningstar Document Research. The information contained herein may not be copied, adapted or distributed and is not warranted to be accurate, complete or timely. The user assumes all risks for any damages or losses arising from any use of this information, except to the extent such damages or losses cannot be limited or excluded by applicable law. Past financial performance is no guarantee of future results.
ERIN ENERGY CORPORATION
NOTES TO CONSOLIDATED FINANCIAL STATEMENTS
Company records a liability for the present value, using a credit-adjusted risk free interest rate, of the estimated site restoration costs
with a corresponding increase to the carrying amount of the related long-lived assets.
Revenues
Revenues are recognized when crude oil is delivered to a buyer. The recognition criteria are satisfied when there exists a signed
contract with defined pricing, delivery, and acceptance, as defined in a contract, and there is no significant uncertainty of
collectability. Crude oil revenues are recorded net of royalties.
Income Taxes
The Company provides for income taxes using the asset and liability method of accounting for income taxes in accordance with
applicable accounting rules. Under the asset and liability method, deferred tax assets and liabilities are recognized for temporary
differences between the tax bases of assets and liabilities and their carrying values for financial reporting purposes and for operating
loss and tax credit carry-forwards. Deferred tax assets and liabilities are measured using enacted tax rates expected to apply to taxable
income in the years in which those temporary differences are expected to be recovered or settled. The effect on deferred tax assets and
liabilities of a change in tax rates is recognized in income in the period that includes the enactment date. A valuation allowance is
established to reduce deferred tax assets to their net realizable amounts if it is more likely than not that the related tax benefits will not
be fully realized.
The Company routinely evaluates any tax deduction and tax refund positions in a two-step process. The first step is to determine
whether it is more likely than not that a tax position will be sustained. If that test is met, the second step is to determine the amount of
benefit or expense to recognize in the consolidated financial statements. See Note 13. — Income Taxes for further information.
Debt Issuance Costs
Debt issuance costs consist of certain costs paid to lenders in the process of securing a borrowing facility. Debt issuance costs incurred
are capitalized and subsequently charged to interest expense over the term of the related debt, using the effective interest rate method.
As of December 31, 2015 and 2014, unamortized debt issuance costs were $1.6 million and $1.9 million, of which nil and $1.3 million
was classified as long-term, respectively. The current portion of the debt issuance costs, which was $1.6 million and $0.6 million as of
December 31, 2015 and 2014, respectively, was recorded in prepaids and other current assets.
Capitalized Interest
The Company capitalizes interest costs for qualifying oil and gas properties. The capitalization period begins when expenditures are
incurred on qualified properties, activities begin which are necessary to prepare the property for production, and interest costs have
been incurred. The capitalization period continues as long as these events occur. Capitalized interest is added to the cost of the
underlying assets and is depleted using the unit-of-production method in the same manner as the underlying assets.
During the years ended December 31, 2015 and 2014, the Company capitalized $2.2 million and $0.3 million, respectively, in interest
cost as additions to property, plant and equipment related to the Oyo field redevelopment campaign.
Stock-Based Compensation
The Company recognizes all stock-based payments to employees, including grants of employee stock options, in the consolidated
financial statements based on their grant-date fair values. The Company values its stock options awarded using the Black-Scholes
option pricing model. Restricted stock awards are valued at the grant date closing market price. Stock-based compensation costs are
recognized over the vesting period, which is the period during which the employee is required to provide service in exchange for the
award. Stock-based compensation paid to non-employees are valued at the fair value of the goods or services provided at the
applicable measurement date and charged to expense as services are rendered.
Reporting and Functional Currency
F-10

Source: Erin Energy Corp., 10-K, March 24, 2016 Powered by Morningstar Document Research. The information contained herein may not be copied, adapted or distributed and is not warranted to be accurate, complete or timely. The user assumes all risks for any damages or losses arising from any use of this information, except to the extent such damages or losses cannot be limited or excluded by applicable law. Past financial performance is no guarantee of future results.
ERIN ENERGY CORPORATION
NOTES TO CONSOLIDATED FINANCIAL STATEMENTS
The Company has adopted the U.S. dollar as the functional currency for all of its foreign subsidiaries. Gains and losses on foreign
currency transactions are included in results of operations.
Net Earnings (Loss) Per Common Share
Basic net earnings or loss per common share is computed by dividing net earnings or loss by the weighted average number of shares
of common stock outstanding at the end of the reporting period. Diluted net earnings or loss per share is computed by dividing net
earnings or loss by the fully dilutive common stock equivalent, which consists of shares outstanding, augmented by potentially
dilutive shares issuable upon the exercise of the Company’s stock options, non-vested restricted stock awards, and stock warrants and
conversion of the Convertible Subordinated Note, calculated using the treasury stock method.
The table below sets forth the number of stock options, warrants, non-vested restricted stock, and shares issuable upon conversion of
Convertible Subordinated Note that were excluded from dilutive shares outstanding during the years ended December 31, 2015, 2014
and 2013, as these securities are anti-dilutive because the Company was in a loss position each year.
Years Ended December 31,
(In thousands) 2015 2014 2013
Stock options 1,101
1,038
—
Stock warrants 541
6
—
Non-vested restricted stock awards 1,275
997
359
Convertible note 12,379
10,932
—
15,296
12,973
359
Upon the occurrence of certain events, the Company is also contingently liable to make additional payments to Allied, under the
Transfer Agreement, up to an additional amount totaling $50.0 million in cash, or the equivalent in shares of the Company’s common
stock, at Allied’s option. See Note 11. — Commitments and Contingencies for further information.
Non-Controlling Interests
The Company reports its non-controlling interests as a separate component of equity. The Company also presents the consolidated net
loss and the portion of the consolidated net loss allocable to the non-controlling interests and to the shareholders of the Company
separately in its consolidated statements of operations. Losses attributable to the non-controlling interests are allocated to the
non-controlling interests even when those losses are in excess of the non-controlling interests’ investment basis.
As of December 31, 2015 and 2014, the non-controlling interest recorded in equity was $0.8 million and $0.7 million, respectively,
attributable to the joint ownership of an affiliate in our Erin Energy Ghana Limited subsidiary.
Fair Value Measurements
Fair value is defined as the amount at which an asset (or liability) could be bought (or incurred) or sold (or settled) in an orderly
transaction between market participants at the measurement date. The established framework for measuring fair value establishes a
fair value hierarchy based on the quality of inputs used to measure fair value, and includes certain disclosure requirements. Fair value
estimates are based on either (i) actual market data or (ii) assumptions that other market participants would use in pricing an asset or
liability, including estimates of risk.
F-11

Source: Erin Energy Corp., 10-K, March 24, 2016 Powered by Morningstar Document Research. The information contained herein may not be copied, adapted or distributed and is not warranted to be accurate, complete or timely. The user assumes all risks for any damages or losses arising from any use of this information, except to the extent such damages or losses cannot be limited or excluded by applicable law. Past financial performance is no guarantee of future results.
ERIN ENERGY CORPORATION
NOTES TO CONSOLIDATED FINANCIAL STATEMENTS
There are three levels of valuation hierarchy for disclosure of fair value measurements. The valuation hierarchy categorizes assets and
liabilities measured at fair value into one of three different levels depending on the observability of the inputs employed in the
measurement. The three levels are defined as follows: Level 1 - Unadjusted quoted prices in active markets that are accessible at the measurement date for identical, unrestricted assets or
liabilities. The Company considers active markets as those in which transactions for the assets or liabilities occur in
sufficient frequency and volume to provide pricing information on an on-going basis.
Level 2 - Quoted prices in markets that are not active, or inputs which are observable, either directly or indirectly, for
substantially the full term of the asset or liability. Substantially all of these inputs are observable in the marketplace
throughout the term, can be derived from observable data, or supported by observable levels at which transactions are
executed in the marketplace.
Level 3 - Inputs that are unobservable and significant to the fair value measurement (including the Company’s own assumptions in
determining fair value).
The Company’s assessment of the significance of a particular input to the fair value measurement in its entirety requires judgment and
considers factors specific to the asset or liability.
Fair Value on a Non-Recurring Basis
The Company used discounted cash flow techniques to determine the estimated fair value of its oil and gas properties as part of the
Company's analysis for impairment. Accordingly, the Company estimated the present value of expected future net cash flows from the
Oyo field, discounted using risk-adjusted cost of capital. Significant Level 3 assumptions used in the calculation include the
Company's estimate of future crude oil prices, production costs, development costs, and anticipated production of proved reserves, as
well as appropriate risk-adjusted probable and possible reserves.
The following table presents information about the Company’s oil and gas properties measured at fair value on a non-recurring basis:
Level 3
As of December 31,
(in thousands) 2015 2014
Value of oil and gas properties (1) $ 272,848
$ —
(1) This represents non-financial assets that are measured at fair value on a non-recurring basis due to impairments. This is the fair value of the asset base that was
subjected to impairment and does not reflect the entire asset balance as presented on the accompanying balance sheets. Please see Note 5. — Property, Plant
and Equipment for further information.
There was no impairment to the Company's oil and gas properties for the year ended December 31, 2014.
Fair Value of Financial Instruments
The carrying amounts of the Company’s financial instruments, which include cash and cash equivalents, restricted cash, accounts
receivable, inventory, deposits, accounts payable and accrued liabilities, and debts at floating interest rates, approximate their fair
values at December 31, 2015 and 2014, respectively, principally due to the short-term nature, maturities or nature of interest rates of
the above listed items.
Risks and Uncertainties
The Company’s producing properties are located offshore Nigeria.
Substantially all of the Company’s crude oil available for sale is sold under spot sales contracts and is delivered Free on Board
("FOB") at the point of transfer from the FPSO, as is customary in the industry.
F-12

Source: Erin Energy Corp., 10-K, March 24, 2016 Powered by Morningstar Document Research. The information contained herein may not be copied, adapted or distributed and is not warranted to be accurate, complete or timely. The user assumes all risks for any damages or losses arising from any use of this information, except to the extent such damages or losses cannot be limited or excluded by applicable law. Past financial performance is no guarantee of future results.
ERIN ENERGY CORPORATION
NOTES TO CONSOLIDATED FINANCIAL STATEMENTS
During 2015, the Company sold its crude oil under spot sales contracts with two (2) customers. The Company believes that the
potential loss of one or both of these customers would not prevent it from selling its crude oil, as it will find other buyers for its crude
oil.
Reclassification
Certain reclassifications have been made to the 2014 and 2013 consolidated financial statements to conform to the 2015 presentation.
These reclassifications were not material to the accompanying consolidated financial statements.
Recently Issued Accounting Standards
In January 2015, the Financial Accounting Standards Board (“FASB”) issued Accounting Standards Update (“ASU”) No. 2015-01,
Income Statement - Extraordinary and Unusual Items (Subtopic 225-20): Simplifying Income Statement Presentation by Eliminating
the Concept of Extraordinary Items. ASU No. 2015-01 eliminates from US GAAP the concept of extraordinary items, and is
effective for fiscal years beginning after December 15, 2015. The Company will adopt this standards update, as required, beginning
with the first quarter of 2016. The adoption of this standards update is not expected to have a material impact on the Company’s
consolidated financial statements.
In February 2015, the FASB issued ASU No. 2015-02, Consolidation (Topic 810): Amendments to the Consolidation Analysis. ASU
No. 2015-02 affects reporting entities that are required to evaluate whether they should consolidate certain legal entities. ASU No.
2015-02 is effective for interim and annual periods beginning after December 15, 2015, and the Company will adopt this standards
update, as required, beginning with the first quarter of 2016. The adoption of this standards update is not expected to have a material
impact on the Company’s consolidated financial statements.
In April 2015, the FASB issued ASU No. 2015-03, Interest - Imputation of Interest (Subtopic 835-30): Simplifying the Presentation of
Debt Issuance Costs, which is guidance for the reporting of debt issuance costs related to a recognized debt liability on an entity's
balance sheet. Under the guidance, an entity must report debt issuance costs as a direct deduction from the carrying amount of that
debt liability, consistent with the treatment for debt discounts. ASU No. 2015-03 is effective for interim and annual periods beginning
after December 15, 2015; early adoption is permitted for financial statements that have not been previously issued. The Company will
adopt this standards update beginning with the first quarter of 2016. The adoption of this standards update is not expected to have a
material impact on the Company’s consolidated financial statements.
In July 2015, the FASB issued ASU No. 2015-11, Inventory (Topic 330): Simplifying the Measurement of Inventory. ASU No.
2015-11 simplifies the subsequent measurement of inventory by requiring inventory to be measured at the lower of cost and net
realizable value. The FASB defines net realizable value as the “estimated selling price in the ordinary course of business, less
reasonably predictable costs of completion, disposal, and transportation.” Under current guidance, an entity subsequently measures
inventory at the lower of cost or market, with market defined as the replacement cost, net realizable value or net realizable value less a
normal profit margin. An entity uses current replacement cost provided that it is not above net realizable value (i.e. the ceiling) or
below net realizable value less an “approximately normal profit margin” (i.e. the floor). ASU No. 2015-11 eliminates this analysis for
entities within the scope of the guidance. ASU No. 2015-11 applies to entities that recognize inventory within the scope of ASC 330,
except for inventory measured under the LIFO method or the retail inventory method. ASU No. 2015-11 is effective for interim and
annual periods beginning after December 15, 2016, and the Company will adopt this standards update, as required, beginning with the
first quarter of 2017. The adoption of this standards update is not expected to have a material impact on the Company’s consolidated
financial statements.
In August 2015, the FASB issued ASU No. 2015-14, Revenue from Contracts with Customers (Topic 606): Deferral of Effective Date.
ASU 2015-14 defers the effective date of revenue standard ASU 2014-09 by one year for all entities. Public business entities, certain
not-for-profit entities, and certain employee benefit plans should apply the guidance in ASU No. 2014-09 to annual reporting periods
beginning after December 15, 2017, including interim reporting periods within that reporting period. Earlier application is permitted
only as of annual reporting periods beginning after December 15, 2016, including interim reporting periods within that reporting
period. With the issuance of ASU No. 2015-14, the Company is required to adopt revenue standard ASU No. 2014-09 beginning with
the first quarter of 2018. The Company is continuing to evaluate the impact of the adoption of this guidance on its consolidated
financial statements.
F-13

Source: Erin Energy Corp., 10-K, March 24, 2016 Powered by Morningstar Document Research. The information contained herein may not be copied, adapted or distributed and is not warranted to be accurate, complete or timely. The user assumes all risks for any damages or losses arising from any use of this information, except to the extent such damages or losses cannot be limited or excluded by applicable law. Past financial performance is no guarantee of future results.
ERIN ENERGY CORPORATION
NOTES TO CONSOLIDATED FINANCIAL STATEMENTS
In August 2015, the FASB issued ASU No. 2015-15, Interest - Imputation of Interest (Subtopic 835-30): Presentation and Subsequent
Measurement of Debt Issuance Costs Associated with Line-of-Credit Arrangements - Amendments to SEC Paragraphs Pursuant to
Staff Announcement at June 18, 2015 EITF Meeting. ASU 2015-15 addresses line-of-credit arrangements that were omitted from
Accounting Standards Update No. 2015-03. Under the guidance, the SEC staff would not object to an entity deferring and presenting
debt issuance costs related to a line-of-credit arrangement as an asset and subsequently amortizing the deferred debt issuance costs
ratably over the term of the line-of-credit arrangement, regardless of whether there are any outstanding borrowings on the
line-of-credit arrangement. ASU No. 2015-15 is effective for interim and annual periods beginning after December 15, 2015; early
adoption is permitted for financial statements that have not been previously issued. The Company will adopt this standards update
beginning with the first quarter of 2016. The adoption of this standards update is not expected to have a material impact on the
Company’s consolidated financial statements.
In September 2015, the FASB issued ASU No. 2015-16, Business Combinations (Topic 805): Simplifying the Accounting for
Measurement-Period Adjustments. Under ASU No. 2015-16, an acquirer must recognize adjustments to provisional amounts in
business combinations that are identified during the measurement period in the reporting period in which the adjustment amounts are
determined, including the cumulative effect of the change in provisional amount as if the accounting had been completed at the
acquisition date. The adjustments related to previous reporting periods since the acquisition date must be disclosed by income
statement line item either on the face of the income statement or in the notes. ASU No. 2015-16 is effective for interim and annual
periods beginning after December 15, 2016, and the Company will adopt this standards update, as required, beginning with the first
quarter of 2017. The adoption of this standards update is not expected to have a material impact on the Company’s consolidated
financial statements.
In November 2015, the FASB issued ASU No. 2015-17, Income Taxes (Topic 704): Balance Sheet Classification of Deferred Taxes.
ASU No. 2015-17 eliminates the current requirement for organizations to present deferred tax liabilities and assets as current and
non-current in a classified balance sheet. Instead, organizations will be required to classify all deferred tax assets and liabilities as
non-current. ASU No. 2015-17 is effective for interim and annual periods beginning after December 15, 2016, and the Company will
adopt this standards update, as required, beginning with the first quarter of 2017. The adoption of this standards update is not expected
to have a material impact on the Company’s consolidated financial statements.
NOTE 3. - LIQUIDITY AND GOING CONCERN
The Company has incurred losses from operations in each of the years ended December 31, 2015, 2014 and 2013. As of December 31,
2015, the Company's total current liabilities of $341.4 million exceeded its total current assets of $26.6 million, resulting in a working
capital deficit of $314.8 million. As a result of the current low commodity prices and the Company’s low oil production volumes due
to the currently shut-in well Oyo-8, the Company has not been able to generate sufficient cash from operations to satisfy certain
obligations as they became due. Further, pursuant to the Company's indebtedness under the Term Loan Facility, it will owe a total of
approximately $9.0 million for quarterly principal and interest on March 31, 2016. In addition, the lender, under the Term Loan
Facility, has the right to unilaterally review the terms and conditions of the Term Loan Facility and, among other things, terminate the
Term Loan Facility and accelerate its maturity based on any adverse information putting the Term Loan Facility at risk. See Note 9. -
Debt for further information.
The Company is currently pursuing a number of actions, including i) working on re-establishing production from well Oyo-8, ii)
obtaining additional funds through public or private financing sources, iii) restructuring existing debts from lenders, iv) obtaining
forbearance of debt from trade creditors, v) reducing ongoing operating costs, vi) minimizing projected capital costs for the 2016
exploration and development campaign and vii) farming-out a portion of our rights to certain of our oil and gas properties. There can
be no assurances that sufficient liquidity can be raised from one or more of these actions or that these actions can be consummated
within the period needed to meet certain obligations.
The Company's consolidated financial statements have been prepared under the assumption that it will continue as a going concern,
which assumes the continuity of operations, the realization of assets and the satisfaction of liabilities as they come due in the normal
course of business. Although the Company believes that it will be able to generate sufficient liquidity from the measures described
above, its current circumstances raise substantial doubt about its ability to continue to operate as a going concern. The accompanying
consolidated financial statements do not include any adjustments that might result from the outcome of this uncertainty.
NOTE 4. — ACQUISITIONS
F-14

Source: Erin Energy Corp., 10-K, March 24, 2016 Powered by Morningstar Document Research. The information contained herein may not be copied, adapted or distributed and is not warranted to be accurate, complete or timely. The user assumes all risks for any damages or losses arising from any use of this information, except to the extent such damages or losses cannot be limited or excluded by applicable law. Past financial performance is no guarantee of future results.
ERIN ENERGY CORPORATION
NOTES TO CONSOLIDATED FINANCIAL STATEMENTS
The Allied Assets
In February 2014, the Company completed the Allied Transaction, thereby acquiring the Allied Assets. Pursuant to the terms of the
Transfer Agreement, the Company, as partial consideration for the Allied Assets, paid $170.0 million in cash, issued approximately
82.9 million shares of the Company’s common stock and delivered a $50.0 million Convertible Subordinated Note to Allied (the
“Convertible Subordinated Note”).
To fund the cash portion of the Allied Transaction and a portion of the anticipated capital expenditures for development of the Oyo
field, the Company also entered into a Share Purchase Agreement (the “Share Purchase Agreement”) with the Public Investment
Corporation (SOC) Limited, a state-owned company incorporated in the Republic of South Africa (“PIC”), for an aggregate cash
investment of $270.0 million through a private placement of 62.8 million shares of common stock (the “Private
Placement”). Additional contingent payments are owed to Allied upon the occurrence of certain future events. See Note 11. —
Commitments and Contingencies for additional information regarding the contingent payments due to Allied.
The table below sets forth a summary of the contractual purchase consideration paid for the Allied Assets (In thousands):
Cash consideration paid $ 170,000
Erin Energy Corporation common stock (1) —
Long-term convertible subordinated note payable - related party 50,000
Total purchase price $ 220,000
Asset acquired and liabilities assumed as of February 21, 2014:
Property, plant and equipment, net 248,736
Accounts payable (25,429 )
Asset retirement obligations (20,890 )
Net assets acquired 202,417
Excess of consideration paid over carrying value of assets acquired $ 17,583
(1) Since the cash and debt consideration exceeds the carrying value of the assets acquired, no value was assigned to the shares issued
Because Allied is a wholly owned subsidiary of CEHL, the Company’s majority shareholder, Allied and the Company are deemed
under common control. Accordingly, the net assets acquired from Allied were recorded at their respective carrying values as of the
acquisition date. The consolidated financial statements, included herein, are presented as though the Allied Transaction had occurred
in June 2012, the date Allied acquired the Allied Assets from an independent third party.
For the periods prior to January 1, 2014, the Allied Assets were recorded as if CEHL had acquired the Allied Assets and contributed
them to the Company. This includes the cost to acquire the Allied Assets from a third party in June 2012, as well as costs related to the
drilling of the Oyo-7 well incurred by Allied in 2013.
The table below shows the carrying values of the net Allied Assets deemed contributed by our parent company at their respective
periods ( in thousands ):
Years ended December 31
2013 2012
Asset acquired and liabilities assumed:
Property, plant and equipment, net $ 61,205
$ 214,710
Asset retirement obligations —
(23,785 )

Source: Erin Energy Corp., 10-K, March 24, 2016 Powered by Morningstar Document Research. The information contained herein may not be copied, adapted or distributed and is not warranted to be accurate, complete or timely. The user assumes all risks for any damages or losses arising from any use of this information, except to the extent such damages or losses cannot be limited or excluded by applicable law. Past financial performance is no guarantee of future results.
Net assets acquired $ 61,205
$ 190,925
Because these assets were deemed paid for by CEHL and contributed to the Company, they have been treated as non-cash transactions
in the accompanying Consolidated Statements of Cash Flows.
F-15

Source: Erin Energy Corp., 10-K, March 24, 2016 Powered by Morningstar Document Research. The information contained herein may not be copied, adapted or distributed and is not warranted to be accurate, complete or timely. The user assumes all risks for any damages or losses arising from any use of this information, except to the extent such damages or losses cannot be limited or excluded by applicable law. Past financial performance is no guarantee of future results.
ERIN ENERGY CORPORATION
NOTES TO CONSOLIDATED FINANCIAL STATEMENTS
Award of the Tano Block in Ghana
In April 2014, the Company, through an indirect 50%-owned subsidiary, signed a Petroleum Agreement with the Republic of Ghana
(the “Petroleum Agreement”) for the Expanded Shallow Water Tano block offshore Ghana ("ESWT"). The contracting parties, which
hold 90% of the participating interest in the block, are Erin Energy Ghana Limited as the operator, GNPC Exploration and Production
Company Limited, and Base Energy (collectively the "Contracting Parties"), holding 60%, 25%, and 15% share of the participating
interest of the Contracting Parties, respectively. The Ghana National Petroleum Company initially has a 10% carried interest through
the exploration phase, and will have the option to acquire an additional paying interest of up to 10% following a declaration of
commercial discovery.
The ESWT block contains three previously discovered fields (the "Fields") and the work program requires the Contracting Parties to
determine, within nine months of the effective date of the Petroleum Agreement, the economic viability of developing the Fields. In
addition, the Petroleum Agreement provides for an initial exploration period of two years from the effective date of the Petroleum
Agreement, with specified work obligations during that period, including the reprocessing of existing 2-D and 3-D seismic data and
the drilling of one exploration well on the ESWT block. The Contracting Parties have the right to apply for a first extension period of
one and one-half years and a second extension period of up to two and one-half years. Each extension period has specified additional
minimum work obligations, including (i) conducting geological and geophysical studies during the first extension period and (ii)
drilling one exploration well during the first extension period and, depending on the length of the extension, one or two wells during
the second extension period.
In January 2015, the Petroleum Agreement became effective, following the signing of a Joint Operating Agreement between the
Contracting Parties.
In October 2015, at the completion of the initial technical and commercial evaluation of the Fields, the Contracting Parties concluded
that certain fiscal terms in the Petroleum Agreement had to be adjusted in order to achieve commerciality of the Fields under current
economic conditions. The Contracting Parties have presented this conclusion to the relevant government entities. The Ghanian
Government is currently reviewing the requests for adjustment of the fiscal terms.
NOTE 5. — PROPERTY, PLANT AND EQUIPMENT
Property, plant and equipment were comprised of the following:
As of December 31,
(In thousands) 2015 2014
Wells and production facilities $ 329,133
$ 33,690
Proved properties 386,196
386,196
Work in progress and other 65,043
261,346
Oilfield assets 780,372
681,232
Accumulated depletion (442,481 ) (95,403 )
Oilfield assets, net 337,891
585,829
Unevaluated leaseholds 10,440
9,440
Oil and gas properties, net 348,331
595,269
Other property and equipment 2,963
2,324
Accumulated depreciation (1,789 ) (1,264 )
Other property and equipment, net 1,174
1,060
Total property, plant and equipment, net $ 349,505
$ 596,329

Source: Erin Energy Corp., 10-K, March 24, 2016 Powered by Morningstar Document Research. The information contained herein may not be copied, adapted or distributed and is not warranted to be accurate, complete or timely. The user assumes all risks for any damages or losses arising from any use of this information, except to the extent such damages or losses cannot be limited or excluded by applicable law. Past financial performance is no guarantee of future results.
All of the Company’s oilfield assets are located offshore Nigeria in the OMLs. “Work-in-progress and other” includes suspended costs
for wells that are not yet completed, as well as warehouse inventory items purchased as part of the redevelopment plan of the Oyo
field.
F-16

Source: Erin Energy Corp., 10-K, March 24, 2016 Powered by Morningstar Document Research. The information contained herein may not be copied, adapted or distributed and is not warranted to be accurate, complete or timely. The user assumes all risks for any damages or losses arising from any use of this information, except to the extent such damages or losses cannot be limited or excluded by applicable law. Past financial performance is no guarantee of future results.
ERIN ENERGY CORPORATION
NOTES TO CONSOLIDATED FINANCIAL STATEMENTS
The Company’s unevaluated leasehold costs include costs to acquire the rights to the exploration acreage in its various oil and gas
properties. The $10.4 million unevaluated leasehold cost as of December 31, 2015 includes the $1.0 million payment during 2015 to
extend the initial exploration period for the Gambia Licenses and the $1.2 million payment in 2014 to acquire rights to the Ghana
properties.
Impairment of Oil and Gas Properties
The Company used discounted cash flow techniques to determine the estimated fair value of its oil and gas properties as part of the
Company's analysis for impairment. Accordingly, the Company estimated the present value of expected future net cash flows from the
Oyo field, discounted using risk-adjusted cost of capital. Significant Level 3 assumptions used in the calculation include the
Company's estimate of future crude oil prices, production costs, development costs, and anticipated production of proved reserves, as
well as appropriate risk-adjusted probable and possible reserves.
In December 2015, the Company concluded that the carrying value of its oilfield assets would not be recoverable under current market
conditions. Accordingly, the Company recorded a non-cash impairment charge of $249.2 million to reduce the carrying value of its oil
and gas properties to their estimated fair values as of December 31, 2015. In addition, the Company recorded a charge of $32.6 million
to write-off the carrying value of well Oyo-5 from work in progress because the Company no longer intends to recomplete it into a
water injection well under current plans. There were no impairment charges recorded for the years ended December 31, 2014.
NOTE 6. — SUSPENDED EXPLORATORY WELL COSTS
In November 2013, the Company achieved both its primary and secondary drilling objectives for the well Oyo-7. The primary drilling
objective was to establish production from the existing Pliocene reservoir. The secondary drilling objective was to confirm the
presence of hydrocarbons in the deeper Miocene formation. Hydrocarbons were encountered in three Miocene intervals totaling
approximately 65 feet, as interpreted by the logging-while-drilling (“LWD”) data. Plans are underway to secure a rig to drill at least
one exploration well in the nearby G-Prospect. The primary objective of the G-Prospect is to target the same Miocene-age sediments
as the ones found in the Oyo-7 exploratory drilling objective. As of December 31, 2015 and 2014, the Company’s suspended
exploratory well costs were $26.5 million for the costs related to the Miocene exploratory drilling activities.
In August 2014, the Company drilled well Oyo-8 to a total vertical depth of approximately 6,059 feet (approximately 1,847 meters)
and successfully encountered four new oil and gas reservoirs in the eastern fault block, with total gross hydrocarbon thickness of 112
feet, based on results from the LWD data, reservoir pressure measurement, and reservoir fluid sampling. Management has completed a
detailed evaluation of the results and has future development plans in the area. Suspended exploratory well costs were $6.5 million at
December 31, 2015 and 2014 for the costs related to the Pliocene exploration drilling activities in the eastern fault block.
NOTE 7. — ACCOUNTS PAYABLE AND ACCRUED LIABILITIES
The table below sets forth a summary of the Company’s accounts payable and accrued liabilities at December 31, 2015 and 2014: As of December 31,
(In thousands) 2015 2014
Accounts payable - vendors $ 153,085
$ 79,512
Amounts due to government entities 53,119
24,515
Accrued interest 2,510
394
Accrued payroll and benefits 629
1,792
Other liabilities 3,777
1,834
$ 213,120
$ 108,047
F-17

Source: Erin Energy Corp., 10-K, March 24, 2016 Powered by Morningstar Document Research. The information contained herein may not be copied, adapted or distributed and is not warranted to be accurate, complete or timely. The user assumes all risks for any damages or losses arising from any use of this information, except to the extent such damages or losses cannot be limited or excluded by applicable law. Past financial performance is no guarantee of future results.
ERIN ENERGY CORPORATION
NOTES TO CONSOLIDATED FINANCIAL STATEMENTS
NOTE 8. —ASSET RETIREMENT OBLIGATIONS
The Company’s asset retirement obligations primarily represent the estimated fair value of the amounts that will be incurred to plug,
abandon and remediate its producing properties at the end of their productive lives. Significant inputs used in determining such
obligations include, but are not limited to, estimates of plugging and abandonment costs, estimated future inflation rates and changes
in property lives. The inputs used in the fair value determination were based on Level 3 inputs, which were essentially management's
assumptions.
The following table summarizes changes in the Company’s asset retirement obligations during the years ended December 31, 2015
and 2014:
(In thousands) 2015 2014
Asset retirement obligations at January 1 $ 26,533
$ 20,601
Accretion expense 1,931
2,166
Additions 9,416
—
Revisions in estimated liabilities (4,284 ) 3,766
Loss on settlement of asset retirement obligations 3,653
—
Payments to settle asset retirement obligations (16,640 ) —
Asset retirement obligations at December 31 $ 20,609
$ 26,533
In April 2015, the Company completed plug and abandonment ("P&A") activities for well Oyo-6 that was previously shut-in. Actual
P&A expenditures exceeded estimated P&A liabilities by approximately $3.7 million. Accordingly, the Company recorded a $3.7
million loss on settlement of asset retirement obligations.
Accretion expense is recognized as a component of depreciation, depletion and amortization expense in the accompanying
consolidated statements of operations.
The table below shows the current and long-term portions of the Company's asset retirement obligations as of the end of December 31,
2015 and 2014:
As of December 31,
(In thousands) 2015 2014
Asset retirement obligations, current portion $ —
$ 12,703
Asset retirement obligations, long-term portion 20,609
13,830
$ 20,609
$ 26,533
NOTE 9. — DEBT
Short-Term Debt:
Promissory Note - Short-Term (Related Party)
In September 2015, the Company borrowed $2.0 million under a 30-day promissory note agreement entered into with an entity related
to the Company's majority shareholder (the “2015 Short-Term Note”). The 2015 Short-Term Note accrued interest at a rate of the
30-day London Interbank Offered Rate (“LIBOR”) plus 3% per annum, and was fully repaid in October 2015.
Short-Term Borrowing - Glencore Advances

Source: Erin Energy Corp., 10-K, March 24, 2016 Powered by Morningstar Document Research. The information contained herein may not be copied, adapted or distributed and is not warranted to be accurate, complete or timely. The user assumes all risks for any damages or losses arising from any use of this information, except to the extent such damages or losses cannot be limited or excluded by applicable law. Past financial performance is no guarantee of future results.
In July 2015, the Company received $13.0 million as an advance under a stand-alone spot sales contract with Glencore Energy UK
(the “July Advance”). Interest accrued on the July Advance at the rate of the 30-day LIBOR plus 6.5% per annum. Repayment of the
July Advance was made from the July crude oil lifting.
F-18

Source: Erin Energy Corp., 10-K, March 24, 2016 Powered by Morningstar Document Research. The information contained herein may not be copied, adapted or distributed and is not warranted to be accurate, complete or timely. The user assumes all risks for any damages or losses arising from any use of this information, except to the extent such damages or losses cannot be limited or excluded by applicable law. Past financial performance is no guarantee of future results.
ERIN ENERGY CORPORATION
NOTES TO CONSOLIDATED FINANCIAL STATEMENTS
In August 2015, the Company received a $26.5 million advance under a stand-alone spot sales contract with Glencore Energy UK Ltd.
(the “August Advance”). Interest accrued on the August Advance at the rate of 30-day LIBOR plus 6.5% per annum. Repayment of
the August Advance was made from the September and October 2015 crude oil liftings.
Term Loan Facility
In September 2014, the Company, through its wholly owned subsidiary EPNL, entered into a credit facility with a Nigerian bank (the
"Bank") for a five-year senior secured term loan providing initial borrowing capacity of up to $100.0 million (the “Term Loan
Facility”). 90% of the Term Loan Facility is available in U.S. dollars, while the remaining 10% is available in Nigerian Naira. U.S.
dollar borrowings under the Term Loan Facility currently bear interest at the rate of LIBOR plus 10.8%. The obligations under the
Term Loan Facility include a legal charge over the OMLs and an assignment of proceeds from oil sales. The obligations of EPNL
have been guaranteed by the Company and rank in priority with all its other obligations. Proceeds from the Term Loan Facility were
used for the further expansion and development of the Oyo field in Nigeria.
Upon executing the Term Loan Facility, the Company paid fees totaling $2.6 million, including $0.5 million billed and paid during
2015, which were recorded as debt issuance costs and are being amortized over the life of the Term Loan Facility using the effective
interest method. As of December 31, 2015, $1.6 million of the debt issuance costs remained unamortized. During the year ended
December 31, 2015, the Company made principal payments on the Naira portion of the Term Loan Facility totaling to $0.3 million.
As of December 31, 2015, the Company recognized an unrealized foreign currency gain of $1.6 million on the Naira portion of the
loan, reducing the net balance under the Term Loan Facility to $98.1 million. Accrued interest for the Term Loan Facility was $2.5
million as of December 31, 2015.
Under the Term Loan Facility, the following events, among others, constitute events of default: EPNL failing to pay any amounts due
within thirty days of the due date; bankruptcy, insolvency, liquidation or dissolution of EPNL; a material breach of the Loan
Agreement by EPNL that remains unremedied within thirty days of written notice by EPNL; or a representation or warranty of EPNL
proves to have been incorrect or materially inaccurate when made. Upon any event of default, all outstanding principal and interest
under any loans will become immediately due and payable. As of the date of this report, the Company was out of compliance with the
funding requirement for a debt service reserve account ("DSRA"). However, the Bank has agreed to waive its rights under the default
provisions of the Term Loan Facility, as it relates to the funding requirement of the DSRA through December 31, 2016.
Pursuant to the Term Loan Facility, the Company will owe approximately $9.0 million for quarterly principal and interest on March
31, 2016. Further, the Bank has the right to unilaterally review the terms and conditions of the Term Loan Facility and, among other
things, terminate the Term Loan Facility and accelerate its maturity based on any adverse information putting the Term Loan Facility
at risk. The Company is engaged in discussions with the Bank to, among other things, reduce and/or defer interest and principal
repayments through March 31, 2017. Although the Company believes that its discussions with the Bank will yield favorable results,
there can be no assurances that the Bank will agree to the Company’s requests. Accordingly, the obligation under the Term Loan
Facility is classified as a current liability as of December 31, 2015 in the consolidated financial statements.
Long-Term Debt:
As of December 31, 2015, the Company’s long-term debt, excluding asset retirement obligations, was $120.0 million, consisting of
$25.0 million owed under a Promissory Note, $50.0 million Convertible Subordinated Note , and $45.0 million, net of discount, under
a 2015 Convertible Note.
Allied, a related party, is the holder of each of the Promissory Note, the Convertible Subordinated Note, and the 2015 Convertible
Note (the “Allied Notes”). Each of the Allied Notes contains certain default and cross-default provisions, including failure to pay
interest and principal amounts when due, and default under other indebtedness. As of December 31, 2015, the Company was not in
compliance with the default provisions of each of the Allied Notes, with respect to the payment of quarterly interest. Further, the risk
of cross-default exists for each of the Allied Notes if the holder of the Term Loan Facility exercises its right to terminate the Term
Loan Facility and accelerate its maturity. In March 2016, Allied agreed to waive its rights under all default provisions of each of the
Allied Notes through March 2017.
F-19

Source: Erin Energy Corp., 10-K, March 24, 2016 Powered by Morningstar Document Research. The information contained herein may not be copied, adapted or distributed and is not warranted to be accurate, complete or timely. The user assumes all risks for any damages or losses arising from any use of this information, except to the extent such damages or losses cannot be limited or excluded by applicable law. Past financial performance is no guarantee of future results.
ERIN ENERGY CORPORATION
NOTES TO CONSOLIDATED FINANCIAL STATEMENTS
Promissory Note – Long-Term
The Company has a $25.0 million borrowing facility under a Promissory Note (the “Promissory Note”) with Allied. Interest accrues
on the outstanding principal under the Promissory Note at a rate of the 30-day LIBOR plus 2% per annum, payable quarterly. In
October 2015, the Promissory Note was amended to extend the maturity date by one year to July 2017. The entire $25.0 million
facility amount can be utilized for general corporate purposes. The stock of the Company’s subsidiary that holds the exploration
licenses in The Gambia and Kenya were pledged as collateral to secure the Promissory Note, pursuant to an Equitable Share Mortgage
arrangement. As of December 31, 2015, the outstanding principal and accrued interest under the Promissory Note was $25.0 million
and $0.9 million, respectively.
Convertible Subordinated Note – Long-Term
As partial consideration in connection with the February 2014 acquisition of the Allied Assets, the Company issued a $50.0 million
Convertible Subordinated Note in favor of Allied (the “Convertible Subordinated Note”). Interest on the Convertible Subordinated
Note accrues at a rate per annum of one-month LIBOR plus 5%, payable quarterly in cash until the maturity of the Convertible
Subordinated Note five years from the closing of the Allied Transaction.
At the election of the holder, the Convertible Subordinated Note is convertible into shares of the Company’s common stock at an
initial conversion price of $4.2984 per share, subject to anti-dilution adjustments. The Convertible Subordinated Note is subordinated
to the Company’s existing and future senior indebtedness and is subject to acceleration upon an Event of Default (as defined in the
Convertible Subordinated Note). The following events, among others, constitute an Event of Default under the Convertible
Subordinated Note: the Company failing to pay interest within thirty days of the due date; the Company failing to pay principal when
due; bankruptcy, insolvency, liquidation or dissolution of the Company; a material breach of the Convertible Subordinated Note
agreement by the Company that remains unremedied within ten days of such material breach; or a representation or warranty of the
Company proves to have been incorrect or materially inaccurate when made. Upon any event of default, all outstanding principal and
interest under any loans will become immediately due and payable. Interest is due and payable quarterly on the Convertible
Subordinated Note. As of December 31, 2015, the Company owed $5.2 million in interest under the Convertible Subordinated Note.
The Company may, at its option, prepay the Convertible Subordinated Note in whole or in part, at any time, without premium or
penalty. Further, the Convertible Subordinated Note is subject to mandatory prepayment upon (i) the Company’s issuance of capital
stock or incurrence of indebtedness, the proceeds of which the Company does not apply to repayment of senior indebtedness or
(ii) any capital markets debt issuance to the extent the net proceeds of such issuance exceed $250.0 million. Allied may assign all or
any part of its rights and obligations under the Convertible Subordinated Note to any person upon written notice to the Company. As
of December 31, 2015, the outstanding principal under the Convertible Subordinated Note was $50.0 million.
2015 Convertible Note – Related Party
In March 2015, the Company entered into a new borrowing facility with Allied in the form of a Convertible Note (the “2015
Convertible Note”), allowing the Company to borrow up to $50.0 million for general corporate purposes. In March 2016, the maturity
date of the 2015 Convertible Note was extended to December 2017. Interest accrues at the rate of LIBOR plus 5%, and is payable
quarterly.
The 2015 Convertible Note is convertible into shares of the Company’s common stock upon the occurrence and continuation of an
event of default, at the sole option of the holder. The number of shares issuable upon conversion is equal to the sum of the principal
amount and the accrued and unpaid interest divided by the conversion price, defined as the volume weighted average of the closing
sales prices on the NYSE MKT for a share of common stock for the five complete trading days immediately preceding the conversion
date.
As of December 31, 2015, the Company had borrowed $48.0 million under the note and issued to Allied warrants to purchase
approximately 2.6 million shares of the Company’s common stock at prices ranging from $2.46 to $7.85 per share. The total fair
market value of the warrants amounting to $4.9 million based on the Black-Scholes option pricing model was recorded as a discount
from the note, and is being amortized using the effective interest method over the life of the note. As of December 31, 2015, the
unamortized balance of the note discount was $3.0 million.
F-20

Source: Erin Energy Corp., 10-K, March 24, 2016 Powered by Morningstar Document Research. The information contained herein may not be copied, adapted or distributed and is not warranted to be accurate, complete or timely. The user assumes all risks for any damages or losses arising from any use of this information, except to the extent such damages or losses cannot be limited or excluded by applicable law. Past financial performance is no guarantee of future results.
ERIN ENERGY CORPORATION
NOTES TO CONSOLIDATED FINANCIAL STATEMENTS
Additional warrants are issuable in connection with future borrowings, with the per share price for those warrants determined based on
the market price of the Company’s common stock at the time of such future borrowings. As of December 31, 2015, the outstanding
balance of the 2015 Convertible Note, net of discount, was $45.0 million. Accrued interest on the 2015 Convertible Note was $2.0
million as of December 31, 2015.
NOTE 10. — RELATED PARTY TRANSACTIONS
Assets and Liabilities
The Company has transactions in the normal course of business with its shareholders, CEHL and their affiliates. The table below sets
forth the related party assets and liabilities as of December 31, 2015 and 2014:
As of December 31,
(In thousands) 2015 2014
Accounts receivable, CEHL $ 1,186
$ 624
Accounts payable and accrued liabilities, CEHL $ 30,133
$ 9,391
Long-term notes payable - related party, CEHL $ 120,006
$ 61,185
As of December 31, 2015 and 2014, the Company owed $30.1 million and $9.4 million, respectively, to affiliates primarily for
logistical and support services in relation to the Company's oilfield operations in Nigeria, as well as accrued interest on the various
related party notes payable. As of December 31, 2015 and 2014, accrued and unpaid interest on the various related party notes payable
were $8.3 million and $2.8 million, respectively.
In September 2015, the Company borrowed $2.0 million from an entity related to CEHL under a 30-day Promissory Note. The
Company repaid the Promissory Note in October 2015. See Note 9. — Debt for further information.
As of December 31, 2015, the Company had a combined note payable balance of $120.0 million owed to an affiliate, consisting of a
$50.0 million Convertible Subordinated Note, $25.0 million in borrowings under the Promissory Note, and $45.0 million borrowing
under the 2015 Convertible Note, net of discount. As of December 31, 2014, the Company had a long-term note payable balance of
$61.2 million owed to an affiliate, consisting of the $50.0 million Convertible Subordinated Note and $11.2 million borrowings under
the Promissory Note. See Note 9. — Debt for further information.
Results from Operations
The table below sets forth the transactions incurred with affiliates during the years ended December 31, 2015, 2014 and 2013:
Year Ended December 31,
(In thousands) 2015 2014 2013
Total operating (income) and expenses, CEHL $ 15,106
$ 14,449
$ (1,167 )
Interest expense, CEHL $ 5,490
$ 2,414
$ 99
Certain affiliates of the Company provides procurement and logistical support services to the Company’s operations. In connection
therewith, during the year ended December 31, 2015 and 2014, the Company incurred operating costs amounting to approximately
$15.1 million and $14.4 million, respectively.
During the year ended December 31, 2015 and 2014, the Company incurred interest expense, excluding debt discount amortization,
totaling approximately $5.5 million and $2.4 million, respectively, in relation to related party notes payable.
F-21

Source: Erin Energy Corp., 10-K, March 24, 2016 Powered by Morningstar Document Research. The information contained herein may not be copied, adapted or distributed and is not warranted to be accurate, complete or timely. The user assumes all risks for any damages or losses arising from any use of this information, except to the extent such damages or losses cannot be limited or excluded by applicable law. Past financial performance is no guarantee of future results.
ERIN ENERGY CORPORATION
NOTES TO CONSOLIDATED FINANCIAL STATEMENTS
Non-controlling Interests
In April 2014, the Company, through its 50% ownership of its Erin Energy Ghana Limited subsidiary, signed a Petroleum Agreement
with the Republic of Ghana relating to the Expanded Shallow Water Tano block offshore Ghana. An affiliate of the Company’s
majority shareholder owns the remaining 50% non-controlling interest in the Erin Energy Ghana Limited subsidiary. See Note 4. —
Acquisitions for further information.
NOTE 11. — COMMITMENTS AND CONTINGENCIES
Commitments
The following table summarizes the Company’s significant future commitments on non-cancellable operating leases and estimated
obligations arising from its minimum work obligations at December 31, 2015:
Payments Due By Period
(In thousands) Total 2016 2017 2018 2019 2020 Thereafter
Operating lease obligations:
FPSO and drilling rig
leases - Nigeria $ 241,813
$ 48,362
$ 48,363
$ 48,362
$ 48,363
$ 48,363
$ —
Office leases 2,034
664
553
425
378
14
—
Minimum work obligations:
Kenya 66,086
1,043
65,043
—
—
—
—
The Gambia 1,800
600
600
600
—
—
—
Ghana 9,450
9,450
—
—
—
—
—
Total $ 321,183
$ 60,119
$ 114,559
$ 49,387
$ 48,741
$ 48,377
$ —
In February 2014, a long-term contract was signed for the floating, production, storage, and offloading vessel (“FPSO”) Armada
Perdana , which is the vessel currently connected to the Company’s productive wells, Oyo-7 and Oyo-8, offshore Nigeria. The
contract provides for an initial term of seven years beginning January 1, 2014, with an automatic extension for an additional term of
two years unless terminated by the Company with prior notice. The FPSO can process up to 40,000 barrels of liquid per day, with a
storage capacity of approximately one million barrels. In June 2015, the operator of the FPSO agreed to a price reduction for the
operating day rates incurred by the Company for the period from July 2014 to April 2015. This resulted in a $26.0 million reduction in
previously accrued production costs. The remaining annual minimum commitment per the terms of the agreement is approximately
$48.4 million per year through 2020.
The Company also has commitments related to four production sharing contracts with the Government of the Republic of Kenya (the
“Kenya PSCs”), two Petroleum Exploration, Development & Production Licenses with the Republic of The Gambia (the “Gambia
Licenses”), and one Petroleum Agreement with the Republic of Ghana. In all cases, the Company entered into these commitments
through a subsidiary. To maintain compliance and ownership, the Company is required to fulfill certain minimum work obligations
and to make certain payments as stated in each of the Kenya PSCs, the Gambia Licenses, and the Ghana Petroleum Agreement. The
table above sets forth the Company's future contractual obligations with regards to the minimum work obligations in each country.
The Company rents office space and miscellaneous office equipment under non-cancelable operating leases. Office rent expense, net
of sublease income, for the years ended December 31, 2015, 2014 and 2013, was $0.9 million, $1.0 million and $0.7 million,
respectively. At December 31, 2015, minimum future rental commitments for operating leases were a total of $2.0 million.
Contingencies
Legal Contingencies
F-22

Source: Erin Energy Corp., 10-K, March 24, 2016 Powered by Morningstar Document Research. The information contained herein may not be copied, adapted or distributed and is not warranted to be accurate, complete or timely. The user assumes all risks for any damages or losses arising from any use of this information, except to the extent such damages or losses cannot be limited or excluded by applicable law. Past financial performance is no guarantee of future results.

Source: Erin Energy Corp., 10-K, March 24, 2016 Powered by Morningstar Document Research. The information contained herein may not be copied, adapted or distributed and is not warranted to be accurate, complete or timely. The user assumes all risks for any damages or losses arising from any use of this information, except to the extent such damages or losses cannot be limited or excluded by applicable law. Past financial performance is no guarantee of future results.
ERIN ENERGY CORPORATION
NOTES TO CONSOLIDATED FINANCIAL STATEMENTS
From time to time, the Company may be involved in various legal proceedings and claims in the ordinary course of business. As of
December 31, 2015, and through the filing date of this report, the Company does not believe the ultimate resolution of such actions or
potential actions of which the Company is currently aware will have a material effect on its consolidated financial position or results
of operations.
On June 28, 2015, the Company, CPL and an affiliate of CEHL, the Company's majority shareholder (collectively, the "Erin Parties")
entered into a Settlement Agreement with Northern Offshore International Drilling Company Ltd. ("Northern"), pursuant to which the
parties agreed (i) to settle all disputes and release all claims relating to the daywork drilling contract for Northern’s drillship Energy
Searcher and (ii) to terminate the arbitration proceedings in London. Under the terms of the Settlement Agreement, neither the Erin
Parties nor Northern paid any amounts to the other to settle the disputes, and each party agreed to bear its own legal fees and to share
equally the arbitration costs. As a result of the settlement, the Company recorded a reduction in accounts payable and accrued
liabilities of approximately $24.3 million.
On January 22, 2016, a request for arbitration was filed with the London Court of International Arbitration by Transocean Offshore
Gulf of Guinea VII Limited and Indigo Drilling Limited, as Claimants, against the Company and its Nigerian subsidiary, Erin
Petroleum Nigeria Limited (fka CAMAC Petroleum Limited), as Respondents (the “Arbitration”). The Arbitration is in relation to a
drilling contract entered into by the Claimants and CAMAC Petroleum Limited, and a parent company guarantee provided by the
Company in relation thereto. The Claimants are seeking an order that the Respondents pay the sum of approximately $20.2 million
together with interest and costs. The Company is in the process of obtaining legal advice in relation to the Arbitration.
On February 5, 2016, a class action and derivative complaint was filed in the Delaware Chancery Court purportedly on behalf of the
Company and on behalf of a putative class of persons who were stockholders as of the date the Company (1) acquired the Allied
Assets pursuant to the Transfer Agreement and (2) issued shares to the PIC in a private placement (collectively the “February 2014
Transactions”). The complaint alleges the February 2014 Transactions were unfair to the Company and purports to assert derivative
claims against (1) the seven individuals who served on our Board at the time of the February 2014 Transactions and (2) our majority
shareholder, CEHL. The complaint also purports to assert a direct breach of fiduciary duty claim on behalf of the putative class
against the seven individuals who served on our Board at the time of the February 2014 Transactions on the grounds that they
purportedly caused the Company to disseminate a false and misleading proxy statement in connection with the 2014 Transactions, and
a direct claim for aiding and abetting against Dr. Lawal. The plaintiff is seeking, on behalf of the Company and the putative class, an
undisclosed amount of compensatory damages. The Company is named solely as a nominal defendant against whom the plaintiff
seeks no recovery.
Unrecognized Loss Contingency
As of December 31, 2015, the Company has not accrued penalty and interest related to certain outstanding transactional tax
obligations in Nigeria, including withholding taxes, value-added taxes, Nigerian Oil and Gas Industry Content Development Act
(NCD) tax, Cabotage taxes, and Niger Delta Development Corporation taxes (NDDC). As of the date of this report, the Company
believes that, based on its experience with local practices in Nigeria, the likelihood of being assessed penalty and interest is reasonably
possible, with an estimated liability up to $8.2 million.
Contingency under the Allied Transfer Agreement
As provided for under the Transfer Agreement with Allied, the Company is required to make the following additional payments upon
the occurrence of certain future events: (i) $25.0 million cash or the equivalent in shares of the Company’s common stock, within
fifteen days following the approval of a development plan by the Nigerian Department of Petroleum Resources ("DPR") with respect
to a first new discovery of hydrocarbons in a non-Oyo field area; and (ii) $25.0 million cash or the equivalent in shares of the
Company’s common stock within fifteen days starting from the commencement of the first hydrocarbon production in commercial
quantities in a non-Oyo field area. The number of shares to be issued shall be determined by calculating the average closing price of
the Company’s common stock over a period of thirty days, counted back from the first business day immediately prior to the approval
of a development plan by DPR or the date of the first hydrocarbon production in commercial quantities, as applicable.
Contingency under the 2015 Convertible Note
F-23

Source: Erin Energy Corp., 10-K, March 24, 2016 Powered by Morningstar Document Research. The information contained herein may not be copied, adapted or distributed and is not warranted to be accurate, complete or timely. The user assumes all risks for any damages or losses arising from any use of this information, except to the extent such damages or losses cannot be limited or excluded by applicable law. Past financial performance is no guarantee of future results.
ERIN ENERGY CORPORATION
NOTES TO CONSOLIDATED FINANCIAL STATEMENTS
As part of the condition to the extension of the maturity date of the 2015 Convertible Note entered into in March 2016, the Company
is required to (i) pay to Allied an amount equal to ten percent (10%) of any successful debt fundraising event completed during the
remaining term of the 2015 Convertible Note ; and (ii) pay to Allied an amount equal to twenty percent (20%) of any successful
equity fundraising event completed during the remaining term of the 2015 Convertible Note.
NOTE 12. — STOCK BASED COMPENSATION
Under the Company’s amended 2009 Equity Incentive Plan (“2009 Plan”), the Company may issue restricted stock awards and stock
options to result in issuance of a maximum aggregate of 16.7 million shares of common stock. Options awarded expire between five
and ten years from the date of the grant, or a shorter term as fixed by the Board of Directors. In February 2014, the Company executed
an amendment to the 2009 Plan, thereby increasing the number of shares that may be granted thereunder to 16.7 million shares.
Stock Options
During 2015, the Company granted approximately 0.4 million stock options with a three year vesting period. The table below sets
forth a summary of stock option activity for the year ended December 31, 2015.
Shares
Underlying
Options
(In Thousands) Weighted-Average
Exercise Price
Weighted-Average
Remaining
Contractual Term
(Years)
Stock Options
Outstanding at December 31, 2014 2,395
$2.10 3.0
Granted 400
$5.29 4.8
Exercised (5 ) $1.92 —
Forfeited (258 ) $5.41 —
Expired —
— —
Outstanding at December 31, 2015 2,532
$2.29 1.6
Expected to vest 622
$3.10 3.7
Exercisable at December 31, 2015 1,910
$2.02 1.0
The total intrinsic value of options outstanding and options exercisable were $2.6 million and $2.3 million, respectively, at
December 31, 2015. The total intrinsic values realized by recipients on options exercised were $0.01 million, $0.9 million, and nil in
2015, 2014 and 2013, respectively.
The Company recorded compensation expense relative to stock options in 2015, 2014 and 2013 of $1.3 million, $1.3 million and $1.1
million, respectively. As of December 31, 2015, there were approximately $0.8 million of total unrecognized compensation cost
related to stock options, with $0.5 million, $0.2 million and $0.1 million to be recognized during the years ended December 31, 2016,
2017 and 2018, respectively.
The fair values of stock options used in recording compensation expense are computed using the Black-Scholes option pricing model.
The table below shows the weighted-average amounts and the assumptions used in the model for options awarded in each year under
equity incentive plans.
2015 2014 2013
Expected price volatility 77.1% - 83.1%
87.7 % 77.9 %
Risk free interest rate (U.S. treasury bonds) 1.0 to 1.2 %
1.1 % 0.5 %
Expected annual dividend yield —
—
—

Source: Erin Energy Corp., 10-K, March 24, 2016 Powered by Morningstar Document Research. The information contained herein may not be copied, adapted or distributed and is not warranted to be accurate, complete or timely. The user assumes all risks for any damages or losses arising from any use of this information, except to the extent such damages or losses cannot be limited or excluded by applicable law. Past financial performance is no guarantee of future results.
Expected option term (years) 3.0
3.0
3.5
Weighted-average grant date fair value per share $ 2.73
$ 1.92
$ 1.38
F-24

Source: Erin Energy Corp., 10-K, March 24, 2016 Powered by Morningstar Document Research. The information contained herein may not be copied, adapted or distributed and is not warranted to be accurate, complete or timely. The user assumes all risks for any damages or losses arising from any use of this information, except to the extent such damages or losses cannot be limited or excluded by applicable law. Past financial performance is no guarantee of future results.
ERIN ENERGY CORPORATION
NOTES TO CONSOLIDATED FINANCIAL STATEMENTS
Stock Warrants
The table below sets forth a summary of stock warrant activity for the year ended December 31, 2015.
Shares
Underlying
Warrants
(In Thousands) Weighted-Average
Exercise Price
Weighted-Average
Remaining
Contractual Term
(Years)
Stock warrants
Outstanding at December 31, 2014 2,416
$6.37 1.4
Granted 2,635
$3.64 4.3
Exercised (286 ) $6.46 —
Forfeited (1,830 ) $6.85 —
Expired —
— —
Outstanding at December 31, 2015 2,935
$3.61 4.2
Expected to vest —
— —
Exercisable at December 31, 2015 2,935
$3.61 4.2
The total intrinsic value of warrants outstanding and exercisable was $1.2 million at December 31, 2015.
During the year ended December 31, 2015, in connection with the execution of the 2015 Convertible Note, the Company issued to
Allied warrants to purchase approximately 2.6 million shares of the Company’s common stock at exercise prices ranging from$2.46 to
$7.85 per share. The warrants are exercisable at any time starting from the date of issuance and have a five-year term.
During the year ended December 31, 2014, as compensation for services received, the Company issued warrants to a service provider
to purchase 0.3 million shares of common stock at an exercise price of approximately $3.36. The warrants are exercisable at any time
starting from the date of issuance and have a five year term. During the years ended December 31, 2015 and 2014, the Company
recognized stock-based compensation expense of $0.4 million and $0.1 million, respectively, related to these warrants, based on the
Black-Scholes option pricing model.
The table below shows the weighted-average amounts and the assumptions used in the model for warrants issued during each year.
2015 2014
Expected price volatility 76.8% - 83.2%
82.7 %
Risk free interest rate (U.S. treasury bonds) 0.8% - 1.1%
1.1 %
Expected annual dividend yield —
—
Expected option term (years) 3.0
3.0
Weighted-average grant date fair value per share $ 1.86
$ 1.80
Restricted Stock Awards (“RSA”)
In addition to stock options, the Company’s 2009 Plan allows for the grant of restricted stock awards (“RSAs”). The Company
determines the fair value of RSAs based on the market price of its common stock on the date of grant. Compensation cost for RSAs is
recognized on a straight-line basis over the vesting or service period and is net of forfeitures.

Source: Erin Energy Corp., 10-K, March 24, 2016 Powered by Morningstar Document Research. The information contained herein may not be copied, adapted or distributed and is not warranted to be accurate, complete or timely. The user assumes all risks for any damages or losses arising from any use of this information, except to the extent such damages or losses cannot be limited or excluded by applicable law. Past financial performance is no guarantee of future results.
F-25

Source: Erin Energy Corp., 10-K, March 24, 2016 Powered by Morningstar Document Research. The information contained herein may not be copied, adapted or distributed and is not warranted to be accurate, complete or timely. The user assumes all risks for any damages or losses arising from any use of this information, except to the extent such damages or losses cannot be limited or excluded by applicable law. Past financial performance is no guarantee of future results.
ERIN ENERGY CORPORATION
NOTES TO CONSOLIDATED FINANCIAL STATEMENTS
The table below sets forth a summary of RSA activity for the year ended December 31, 2015.
Shares
(In Thousands)
Weighted-Average
Grant Date Fair
Value
Restricted Stock
Non-vested at December 31, 2014 1,007
$3.12
Granted 1,292
$3.27
Vested (965 ) $3.18
Forfeited (220 ) $3.24
Non-vested as of December 31, 2015 1,114
$3.21
During the year ended December 31, 2015, the Company granted performance-based restricted stock awards ("PBRSAs") to certain
officers totaling 0.4 million shares. Each grant will vest if the individuals remain employed three years from the date of grant and the
Company achieves specific performance objectives at the end of the designated performance period. Up to 50% additional shares may
be awarded if performance objectives are exceeded. None of the PBRSAs will vest if certain minimum performance goals are not met.
The performance conditions are based on the Company’s total shareholder return over the performance period compared to an industry
peer group of companies. Total estimated compensation expense, net of forfeitures, is $0.3 million over three years.
The Company recorded compensation expense relative to RSAs, including PBRSAs, in 2015, 2014 and 2013 of $3.3 million, $1.7
million and $0.9 million, respectively.
The total grant date fair value of RSA shares that vested during 2015 and 2014 was approximately $3.1 million and $2.8 million,
respectively. As of December 31, 2015, there were approximately $1.6 million of total unrecognized compensation cost related to
non-vested RSAs, with $1.3 million and $0.3 million to be recognized during the years ended December 31, 2016 and 2017,
respectively.
NOTE 13. — INCOME TAXES
Following is a reconciliation of the expected statutory U.S. Federal income tax provision to the actual income tax expense for the
respective periods: Years Ended December 31,
(In thousands) 2015 2014 2013
Net loss attributable to Erin Energy Corporation before income tax expense $ (451,497 ) $ (96,062 ) $ (43,525 )
Expected income tax provision at statutory rate of 35% (158,024 ) (33,622 ) (15,234 )
Increase (decrease) due to:
Foreign rate differential (62,551 ) (10,083 ) (3,581 )
Change in valuation allowance 267,190
98,376
20,205
Investment tax credit - Nigeria (35,580 ) (40,765 ) (15,302 )
Non-deductible expenses and other (11,035 ) (13,906 ) 13,912
Total income tax expense $ —
$ —
$ —
F-26

Source: Erin Energy Corp., 10-K, March 24, 2016 Powered by Morningstar Document Research. The information contained herein may not be copied, adapted or distributed and is not warranted to be accurate, complete or timely. The user assumes all risks for any damages or losses arising from any use of this information, except to the extent such damages or losses cannot be limited or excluded by applicable law. Past financial performance is no guarantee of future results.
ERIN ENERGY CORPORATION
NOTES TO CONSOLIDATED FINANCIAL STATEMENTS
Significant components of our deferred tax assets are as follows: As of December 31,
(In thousands) 2015 2014
Basis difference in fixed assets $ 22,173
$ (100,798 )
Unused capital allowances 506,795
407,899
Net operating losses 88,391
54,673
Other 12,239
621
629,598
362,395
Valuation allowance (629,598 ) (362,395 )
Net deferred income tax assets $ —
$ —
The majority of the Company’s basis difference in fixed assets and unused capital allowances were generated from its Nigerian
operations. The Company’s foreign net operating losses in Nigeria are not subject to expiration, and can be carried forward
indefinitely. The foreign operating losses in The Gambia, Kenya and Ghana are included in the respective subsidiaries cost oil
accounts, which will be offset against future taxable revenues.
Management assesses the available positive and negative evidence to estimate if existing deferred tax assets will be utilized. Based on
current facts and circumstances related to its Nigerian operations, Management has determined that it cannot demonstrate that it is
more likely than not that the Nigerian losses and unutilized capital allowances will be utilized to reduce the Company’s petroleum
profit tax liability within the foreseeable future.
Furthermore, since the Company does not currently have any revenue generating activities either in the U.S. or in any of its
non-Nigerian subsidiaries, it cannot demonstrate that it is more likely than not that any of the related deferred tax assets will be
utilized in the foreseeable future.
On the basis of this assessment, valuation allowances of $629.6 million and $362.4 million were recorded as of December 31, 2015
and 2014, respectively.
At December 31, 2015 and 2014, the Company was subject to foreign and United States federal taxes only, with no allocations made
to state and local taxes.
The following table summarizes the tax years that remain subject to examination by major tax jurisdictions:
United States: 2007 - 2015
Nigeria: 2010 - 2015
Kenya: 2012 - 2015
The Gambia: 2012 - 2015
NOTE 14. — SEGMENT INFORMATION
The Company’s current operations are based in Nigeria, Kenya, The Gambia, and Ghana. Management reviews and evaluates the
operations of each geographic segment separately. Segments include exploration for and production of hydrocarbons where
commercial reserves have been found and developed. Revenues and expenditures are recognized at the relevant geographical location.
The Company evaluates each segment based on operating income (loss).
F-27

Source: Erin Energy Corp., 10-K, March 24, 2016 Powered by Morningstar Document Research. The information contained herein may not be copied, adapted or distributed and is not warranted to be accurate, complete or timely. The user assumes all risks for any damages or losses arising from any use of this information, except to the extent such damages or losses cannot be limited or excluded by applicable law. Past financial performance is no guarantee of future results.
ERIN ENERGY CORPORATION
NOTES TO CONSOLIDATED FINANCIAL STATEMENTS
The table below sets forth segment activity for the years ended December 31, 2015, 2014, and 2013.
(In thousands) Nigeria Kenya The Gambia Ghana Corporate and
Other Total
For the Years Ended December
31,
2015
Revenues $ 68,429
$ —
$ —
$ —
$ —
$ 68,429
Operating loss $ (408,008 ) $ (8,038 ) $ (5,209 ) $ (1,931 ) $ (13,807 ) $ (436,993 )
2014
Revenues $ 53,844
$ —
$ —
$ —
$ —
$ 53,844
Operating loss $ (64,716 ) $ (12,130 ) $ (1,347 ) $ (492 ) $ (14,640 ) $ (93,325 )
2013
Revenues $ 63,736
$ —
$ —
$ —
$ —
$ 63,736
Operating loss $ (23,705 ) $ (3,404 ) $ (1,070 ) $ —
$ (15,348 ) $ (43,527 )
The table below sets forth the total assets by segment as of December 31, 2015 and 2014.
(In thousands) Nigeria Kenya The Gambia Ghana Corporate and
Other Total
Total Assets
December 31, 2015 $ 368,327
$ 1,399
$ 3,016
$ 2,447
$ 971
$ 376,160
December 31, 2014 $ 609,243
$ 8,527
$ 2,739
$ 1,413
$ 16,521
$ 638,443
NOTE 15. — SELECTED UNAUDITED QUARTERLY FINANCIAL DATA (In thousands, except for per share amounts)
Three Months Ended,
March 31, 2015 June 30, 2015 September 30, 2015 December 31, 2015
Total revenues $ —
$ —
$ 28,667
$ 39,762
Operating loss $ (32,031 ) $ (5,821 ) $ (53,423 ) $ (345,718 )
Net loss attributable to Erin Energy Corporation $ (33,059 ) $ (9,162 ) $ (58,682 ) $ (350,594 )
Net loss per common share attributable to
Erin Energy Corporation
Basic $ (0.16 ) $ (0.04 ) $ (0.28 ) $ (1.66 )
Diluted $ (0.16 ) $ (0.04 ) $ (0.28 ) $ (1.66 )
Three Months Ended,
March 31, 2014 June 30, 2014 September 30, 2014 December 31, 2014
Total revenues $ 19,894
$ 14,940
$ 19,010
$ —
Operating loss $ (14,683 ) $ (11,271 ) $ (41,546 ) $ (25,825 )
Net loss attributable to Erin Energy Corporation $ (14,858 ) $ (11,930 ) $ (42,223 ) $ (27,051 )
Net loss per common share attributable to
Erin Energy Corporation

Source: Erin Energy Corp., 10-K, March 24, 2016 Powered by Morningstar Document Research. The information contained herein may not be copied, adapted or distributed and is not warranted to be accurate, complete or timely. The user assumes all risks for any damages or losses arising from any use of this information, except to the extent such damages or losses cannot be limited or excluded by applicable law. Past financial performance is no guarantee of future results.
Basic $ (0.13 ) $ (0.06 ) $ (0.20 ) $ (0.13 )
Diluted $ (0.13 ) $ (0.06 ) $ (0.20 ) $ (0.13 )
NOTE 16. — SUBSEQUENT EVENTS
Subsequent to December 31, 2015, the Company issued 0.2 million shares of common stock as a result of the exercise of stock
F-28

Source: Erin Energy Corp., 10-K, March 24, 2016 Powered by Morningstar Document Research. The information contained herein may not be copied, adapted or distributed and is not warranted to be accurate, complete or timely. The user assumes all risks for any damages or losses arising from any use of this information, except to the extent such damages or losses cannot be limited or excluded by applicable law. Past financial performance is no guarantee of future results.
ERIN ENERGY CORPORATION
NOTES TO CONSOLIDATED FINANCIAL STATEMENTS
options.
In February 2016, the Company granted to employees approximately 0.7 million shares of restricted stock, and granted
performance-based restricted stock awards (PBRSA) to certain officers totaling 0.5 million shares.
F-29

Source: Erin Energy Corp., 10-K, March 24, 2016 Powered by Morningstar Document Research. The information contained herein may not be copied, adapted or distributed and is not warranted to be accurate, complete or timely. The user assumes all risks for any damages or losses arising from any use of this information, except to the extent such damages or losses cannot be limited or excluded by applicable law. Past financial performance is no guarantee of future results.
ERIN ENERGY CORPORATION
SUPPLEMENTAL DATA ON OIL AND GAS EXPLORATION AND PRODUCING ACTIVITIES (UNAUDITED)
The unaudited supplemental information on oil and gas exploration and production activities for 2015, 2014 and 2013 has been
presented in accordance with Financial Accounting Standards Board Accounting Standards Codification Topic 932, Extractive
Activities—Oil and Gas. The totality of the Company’s proved reserves are located offshore Nigeria.
Estimated Net Proved Crude Oil Reserves
The following estimates of the net proved crude oil reserves in Nigeria are based on evaluations prepared by third-party reservoir
engineers DeGolyer and MacNaughton (“D&M”). D&M has prepared evaluations on 100 percent of our rights to proved reserves and
the estimates of proved crude oil reserves attributable to our net interests in oil and gas properties for the year ended December 31,
2015. Reserve volumes and values were determined under the method prescribed by the SEC, which requires the application of the
12-month average price calculated as the unweighted arithmetic average of the first-day-of-the-month price for each month within the
12-month prior period to the end of the reporting period and current costs held constant throughout the projected reserve life. The
average first-day-of-the-month commodity prices during the 12-month periods ending on December 31, 2015, 2014, and 2013, were
$53.51, $100.37, and $108.63 per barrel of crude oil, respectively, including price differentials.
Reserve estimates are inherently imprecise and estimates of new discoveries are more imprecise than those of producing properties.
Accordingly, reserve estimates are expected to change as additional performance data becomes available.
Crude Oil
(MBbls)
International
December 31, 2012 14,009
Revisions (4,878 )
Production (591 )
December 31, 2013 8,540
Revisions 875
Production (364 )
December 31, 2014 9,051
Revisions 4,497
Production (1,564 )
December 31, 2015 11,984
Proved developed reserves
December 31, 2013 321
December 31, 2014 —
December 31, 2015 7,594
Proved undeveloped reserves
December 31, 2013 8,219
December 31, 2014 9,051
December 31, 2015 4,390
The 4,497 MBbl upward revision in our proved reserves for the year ended December 31, 2015 is primarily due to the excellent
performance of one of our producing wells, as well as better projected performance for one of our planned wells. The 875 MBbl

Source: Erin Energy Corp., 10-K, March 24, 2016 Powered by Morningstar Document Research. The information contained herein may not be copied, adapted or distributed and is not warranted to be accurate, complete or timely. The user assumes all risks for any damages or losses arising from any use of this information, except to the extent such damages or losses cannot be limited or excluded by applicable law. Past financial performance is no guarantee of future results.
upward revision in our proved reserves for the year ended December 31, 2014 was due to a revision in estimates, subsequent to a new
full reservoir study on the Oyo field conducted in 2014. The 4,878 MBbl downward revision in our proved reserves for the year ended
December 31, 2012 was due to certain PUDs in the eastern fault block of the Oyo field being downgraded to probable reserves as a
result of new information.
S-1

Source: Erin Energy Corp., 10-K, March 24, 2016 Powered by Morningstar Document Research. The information contained herein may not be copied, adapted or distributed and is not warranted to be accurate, complete or timely. The user assumes all risks for any damages or losses arising from any use of this information, except to the extent such damages or losses cannot be limited or excluded by applicable law. Past financial performance is no guarantee of future results.
ERIN ENERGY CORPORATION
SUPPLEMENTAL DATA ON OIL AND GAS EXPLORATION AND PRODUCING ACTIVITIES (UNAUDITED)
Capitalized Costs
The Company follows the successful efforts method of accounting for capitalization of costs of oil and gas producing activities.
Capitalized costs include the cost of properties, equipment and facilities for oil and gas producing activities. Capitalized costs for
proved properties include costs for oil and gas leaseholds where proved reserves have been identified, development wells, and related
equipment and facilities, including development wells in progress. Capitalized costs for unproved properties include costs for
acquiring oil and gas leaseholds where no proved reserves have been identified, including costs of exploratory wells that are in the
process of drilling or in active completion and costs of exploratory wells suspended or waiting on completion. Amounts below include
only activities classified as exploration and producing. As of December 31,
(In thousands) 2015 2014
International
Proved properties $ 717,324
$ 617,745
Unproved properties 43,470
42,470
Materials and equipment 30,018
30,457
Total capitalized costs 790,812
690,672
Accumulated depreciation, depletion and amortization (442,481 ) (95,403 )
Net capitalized costs $ 348,331
$ 595,269
Costs Incurred in Oil and Gas Property Acquisition, Exploration and Development
Amounts reported as costs incurred include both capitalized costs and costs charged to expense when incurred for oil and gas property
acquisition, exploration, and development activities. Exploration costs presented below include the costs of drilling and equipping
successful and unsuccessful exploration wells during the year, geological and geophysical expenses, and the costs of retaining
undeveloped leaseholds. Development costs include the costs of drilling and equipping development wells, and construction of related
production facilities. Costs associated with corporate activities are not included. Years Ended December 31,
(In thousands) 2015 2014 2013
International
Property acquisitions
Proved (1) $ —
$ —
$ 61,205
Unproved 1,000
1,200
—
Exploration (2) 16,437
20,813
32,006
Development 135,966
162,742
34,700
Total costs incurred $ 153,403
$ 184,755
$ 127,911
(1) Costs incurred by parent and contributed to the Company. See Note 4. — Acquisitions to the Notes to Consolidated Financial Statements for further
information.
(2) Includes capitalized exploratory drilling costs, as well as other geological and geophysical costs.
S-2

Source: Erin Energy Corp., 10-K, March 24, 2016 Powered by Morningstar Document Research. The information contained herein may not be copied, adapted or distributed and is not warranted to be accurate, complete or timely. The user assumes all risks for any damages or losses arising from any use of this information, except to the extent such damages or losses cannot be limited or excluded by applicable law. Past financial performance is no guarantee of future results.
ERIN ENERGY CORPORATION
SUPPLEMENTAL DATA ON OIL AND GAS EXPLORATION AND PRODUCING ACTIVITIES (UNAUDITED)
Results of Continuing Operations
Results of continuing operations for producing activities consist of all activities within the oil and gas exploration and production
operations. Years Ended December 31,
(In thousands) 2015 2014 2013
International
Revenues $ 68,429
$ 53,844
$ 63,736
Production, G&A and other costs (94,299 ) (94,808 ) (70,399 )
Exploratory expenses (1,706 ) (364 ) (267 )
Depreciation, depletion and amortization (98,664 ) (23,388 ) (16,585 )
Impairment of oil and gas properties (281,768 ) —
—
Results from oil and gas producing activities $ (408,008 ) $ (64,716 ) $ (23,515 )
Standardized Measure of Discounted Future Net Cash Flows
Standardized Measure of Discounted Future Net Cash Flows reflects the Company’s estimated future net revenues, net of estimated
income taxes, to be generated from the production of proved reserves, determined in accordance with the rules and regulations of the
SEC (using the average of the first-day-of-the-month commodity prices during the 12-month period ended on December 31, 2015)
without giving effect to non-property related expenses such as DD&A expense and discounted at 10% per year. Amounts below for
production sold and production costs exclude royalties. The standardized measure of discounted future net cash flow should not be
construed as the current market value of the estimated oil and natural gas reserves attributable to the Company’s oil and gas properties.
Years Ended December 31,
(In thousands) 2015 2014 2013
International
Future cash inflows from production sold $ 641,351
$ 908,521
$ 921,396
Future production costs (330,583 ) (399,186 ) (475,703 )
Future development costs (95,081 ) (209,728 ) (287,468 )
Future income taxes (27,921 ) (37,422 ) (28,620 )
Future net cash flows before discount 187,766
262,185
129,605
Discount at 10% annual rate (25,799 ) (25,136 ) (28,338 )
Standardized measure of discounted future cash flows $ 161,967
$ 237,049
$ 101,267
S-3
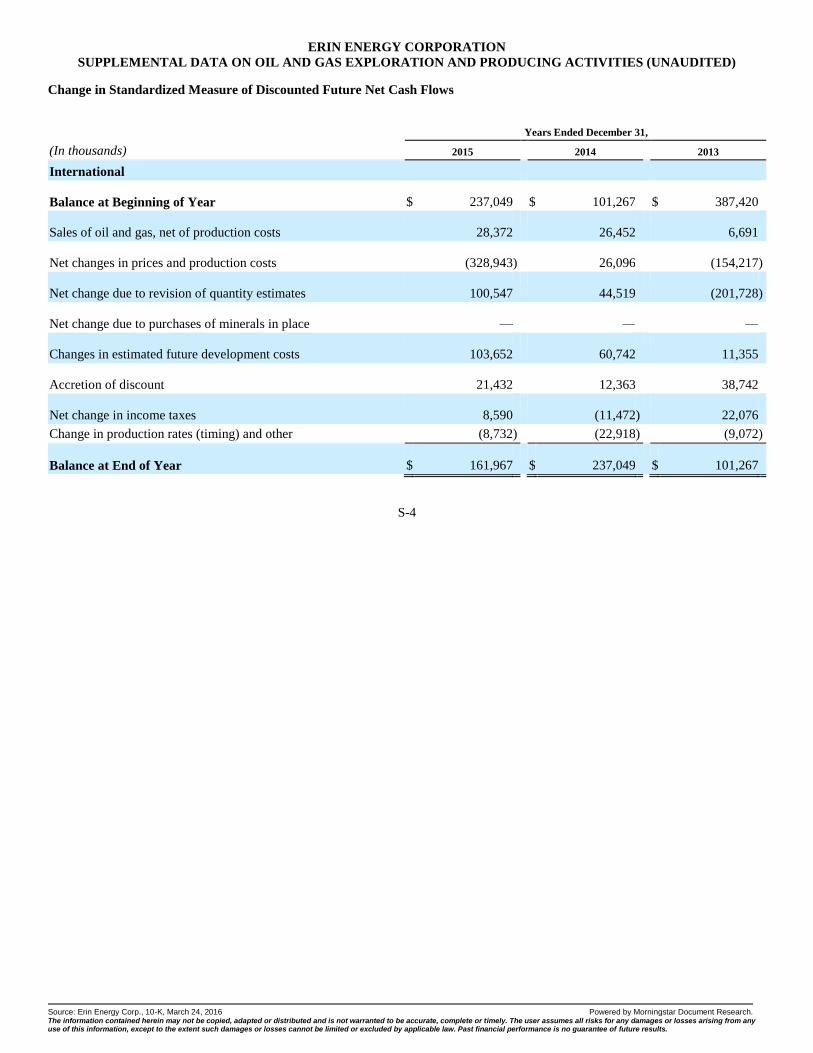
Source: Erin Energy Corp., 10-K, March 24, 2016 Powered by Morningstar Document Research. The information contained herein may not be copied, adapted or distributed and is not warranted to be accurate, complete or timely. The user assumes all risks for any damages or losses arising from any use of this information, except to the extent such damages or losses cannot be limited or excluded by applicable law. Past financial performance is no guarantee of future results.
ERIN ENERGY CORPORATION
SUPPLEMENTAL DATA ON OIL AND GAS EXPLORATION AND PRODUCING ACTIVITIES (UNAUDITED)
Change in Standardized Measure of Discounted Future Net Cash Flows
Years Ended December 31,
(In thousands) 2015 2014 2013
International
Balance at Beginning of Year $ 237,049
$ 101,267
$ 387,420
Sales of oil and gas, net of production costs 28,372
26,452
6,691
Net changes in prices and production costs (328,943 ) 26,096
(154,217 )
Net change due to revision of quantity estimates 100,547
44,519
(201,728 )
Net change due to purchases of minerals in place —
—
—
Changes in estimated future development costs 103,652
60,742
11,355
Accretion of discount 21,432
12,363
38,742
Net change in income taxes 8,590
(11,472 ) 22,076
Change in production rates (timing) and other (8,732 ) (22,918 ) (9,072 )
Balance at End of Year $ 161,967
$ 237,049
$ 101,267
S-4
Source: Erin Energy Corp., 10-K, March 24, 2016 Powered by Morningstar Document Research. The information contained herein may not be copied, adapted or distributed and is not warranted to be accurate, complete or timely. The user assumes all risks for any damages or losses arising from any use of this information, except to the extent such damages or losses cannot be limited or excluded by applicable law. Past financial performance is no guarantee of future results.
March 14, 2016
Erin Energy Corporation f/k/a CAMAC Energy Inc.
1330 Post Oak Blvd., Suite 2250
Houston, Texas 77056
Attention: Chief Financial Officer
Re: Extension of Maturity Date for Convertible Note Due dated March 11, 2015 and due December
31, 2016 (the "Note")
Dear Sir:
Per your request and pursuant to Section 10 of the Note, this letter serves as an amendment to the Note, whereby
the Maturity Date is hereby extended to December 31, 2017 and all references to "December 31, 2016" in the Note
is hereby changed to "December 31, 2017".
Lender understands that Borrower shall participate in certain capital fundraising efforts within the next twelve (12)
month period. Thus, in consideration of the above extension, upon the first successful debt fundraising event (the
"Debt Fundraising Event") and the first successful equity fundraising event (the “Equity Fundraising Event”)
completed during the term of the Note, Borrower shall be obliged as follows:
1. Borrower shall pay to Lender an amount equal to ten percent (10%) of any debt raised in the Debt
Fundraising Event toward the balance of all accounts then due and payable to the following members of the
CAMAC group of companies:
a
.
CAMAC International
Corporation
b
.
CAMAC Nigeria
Limited
c
.
CAMAC International
Limited
d
.
Oceanic Consultants
Nigeria Limited
2. Borrower shall pay to Lender an amount equal to twenty percent (20%) of any equity raised in the Equity
Fundraising Event toward the outstanding balances due under any and all promissory notes, including the
Note, currently extended to Borrower by Lender.
All other terms and conditions of the Note shall remain as provided in the Note.
Please indicate your acceptance of the terms of this letter by signing below.
Sincerely,
ACKNOWLEDGED AND AGREED TO BY:

Source: Erin Energy Corp., 10-K, March 24, 2016 Powered by Morningstar Document Research. The information contained herein may not be copied, adapted or distributed and is not warranted to be accurate, complete or timely. The user assumes all risks for any damages or losses arising from any use of this information, except to the extent such damages or losses cannot be limited or excluded by applicable law. Past financial performance is no guarantee of future results.
Plot 1649, Olosa Street I Victoria Island, Lagos, Nigeria I Tel: +2341 4603357-9 I Fax: +234 1 2704271 Dr. Kase Lukman Lawal, Chairman
Kamoru A. Lawal, Mickey Lawal, lyabo Adegbemile, Kio Clement Bestmann, Adekule Alli, Olayide Olufemi, Directors

Source: Erin Energy Corp., 10-K, March 24, 2016 Powered by Morningstar Document Research. The information contained herein may not be copied, adapted or distributed and is not warranted to be accurate, complete or timely. The user assumes all risks for any damages or losses arising from any use of this information, except to the extent such damages or losses cannot be limited or excluded by applicable law. Past financial performance is no guarantee of future results.
Exhibit 21.1
SUBSIDIARIES OF THE COMPANY
Erin Petroleum Nigeria Limited
CAMAC Energy Ltd.
CAMAC Energy Kenya Limited
Erin Energy Ghana A5 Ltd.
Erin Energy Gambia Ltd.
CAMAC Energy International Ltd.
CAMAC Energy Ghana Limited
Erin Energy Finance Ltd.
CAMAC Energy Sierra Leone
CAMAC Energy Chad Ltd.
Erin Energy Services Limited
1

Source: Erin Energy Corp., 10-K, March 24, 2016 Powered by Morningstar Document Research. The information contained herein may not be copied, adapted or distributed and is not warranted to be accurate, complete or timely. The user assumes all risks for any damages or losses arising from any use of this information, except to the extent such damages or losses cannot be limited or excluded by applicable law. Past financial performance is no guarantee of future results.
Exhibit 23.1
CONSENT OF INDEPENDENT REGISTERED PUBLIC ACCOUNTING FIRM
We have issued our reports dated March 23, 2016, with respect to the consolidated financial statements included in the
Annual Report of Erin Energy Corporation on Form 10-K for the year ended December 31, 2015. We consent to the
incorporation by reference of said reports in the Registration Statements of Erin Energy Corporation on Forms S-8 (Files
No. 333-175294, 333-160737, 333-194503 and 333-152061) and on Forms S-3 (Files No. 333-163869, 333-167013,
333-201177 and 333-205911).
/s/ GRANT HTORNTON LLP
Houston, Texas
March 23, 2016

Source: Erin Energy Corp., 10-K, March 24, 2016 Powered by Morningstar Document Research. The information contained herein may not be copied, adapted or distributed and is not warranted to be accurate, complete or timely. The user assumes all risks for any damages or losses arising from any use of this information, except to the extent such damages or losses cannot be limited or excluded by applicable law. Past financial performance is no guarantee of future results.
Exhibit 23.2
DeGolyer and MacNaughton
5001 Spring Valley Road
Suite 800 East
Dallas, Texas 75244
March 22, 2016
Erin Energy Corporation
1330 Post Oak Boulevard
Suite 2550
Houston, Texas 77056
Ladies and Gentlemen:
We hereby consent to the incorporation by reference into the United States Securities and Exchange Commission
Registration Statements on Form S-3 (File numbers 333-163869, 333-167013, 333-201177, and 333-205911) and Form S-8 (File
numbers 333-152061, 333-160737, 333-175294, and 333-194503) of Erin Energy Corporation (Erin), both to be filed on or about
March 22, 2016, of (a) the references to DeGolyer and MacNaughton contained in “Part I, Item 2,” “List of Exhibits” and in the
section “Supplemental Data on Oil and Gas Exploration and Producing Activities (Unaudited)” and (b) our third-party letter report
dated March 4, 2016, containing our opinion on the proved reserves as of December 31, 2015, attributable to the interest owned by
Erin in the Oyo field offshore Nigeria, which report is included as “Exhibit 99.1” (both (a) and (b)) in Erin's Form 10-K to be filed on
or about March 22, 2016.
Very truly yours,
/s/ DeGolyer and MacNaughton
DeGOLYER and MacNAUGHTON
Texas Registered Engineering Firm F-716

Source: Erin Energy Corp., 10-K, March 24, 2016 Powered by Morningstar Document Research. The information contained herein may not be copied, adapted or distributed and is not warranted to be accurate, complete or timely. The user assumes all risks for any damages or losses arising from any use of this information, except to the extent such damages or losses cannot be limited or excluded by applicable law. Past financial performance is no guarantee of future results.
Exhibit 31.1
CERTIFICATION PURSUANT TO
15 U.S.C. § 7241
AS ADOPTED PURSUANT TO
SECTION 302 OF THE SARBANES-OXLEY ACT OF 2002
I, Dr. Kase Lukman Lawal, certify that: 1. I have reviewed this Annual Report on Form 10-K of Erin Energy
Corporation;
2. Based on my knowledge, this report does not contain any untrue statement of a material fact or omit to state a material fact
necessary to make the statements made, in light of the circumstances under which such statements were made, not misleading
with respect to the period covered by this report;
3. Based on my knowledge, the financial statements and other financial information included in this report, fairly present, in all
material respects the financial condition, results of operations and cash flows of the registrant as of, and for, the periods presented
in this report;
4. The registrant’s other certifying officer and I are responsible for establishing and maintaining disclosure controls and procedures
(as defined in Exchange Act Rules 13a-15(e) and 15d-15(e)) and internal control over financial reporting (as defined in Exchange
Act Rules 13a-15(f) and 15d-15(f)) for the registrant and have:
(a) Designed such disclosure controls and procedures, or caused such disclosure controls and procedures to be designed under
our supervision, to ensure that material information relating to the registrant, including its consolidated subsidiaries, is made
known to us by others within those entities, particularly during the period in which this report is being prepared;
(b) Designed such internal control over financial reporting, or caused such internal control over financial reporting to be
designed under our supervision, to provide reasonable assurance regarding the reliability of financial reporting and the
preparation of the financial statements for external purposes in accordance with generally accepted accounting
principles;
(c) Evaluated the effectiveness of the registrant’s disclosure controls and procedures and presented in this report our conclusions
about the effectiveness of the disclosure controls and procedures, as of the end of the period covered by this report based on
such evaluation; and
(d) Disclosed in this report any change in the registrant’s internal control over financial reporting that occurred during the
registrant’s most recent fiscal quarter (the registrant’s fourth fiscal quarter in the case of an annual report) that has materially
affected, or is reasonably likely to materially affect, the registrant’s internal control over financial reporting; and
5. The registrant’s other certifying officer and I have disclosed, based on our most recent evaluation of internal control over
financial reporting, to the registrant’s auditors and the audit committee of the registrant’s Board of Directors:
(a) All significant deficiencies and material weaknesses in the design or operation of internal control over financial reporting
which are reasonably likely to adversely affect the registrant’s ability to record, process, summarize, and report financial
information; and
(b) Any fraud, whether or not material, that involves management or other employees who have a significant role in the
registrant’s internal control over financial reporting.
Date: March 23, 2016 /s/ Dr. Kase Lukman Lawal
Dr. Kase Lukman Lawal
Chief Executive Officer
(Principal Executive Officer)

Source: Erin Energy Corp., 10-K, March 24, 2016 Powered by Morningstar Document Research. The information contained herein may not be copied, adapted or distributed and is not warranted to be accurate, complete or timely. The user assumes all risks for any damages or losses arising from any use of this information, except to the extent such damages or losses cannot be limited or excluded by applicable law. Past financial performance is no guarantee of future results.
Exhibit 31.2
CERTIFICATION PURSUANT TO
15 U.S.C. § 7241
AS ADOPTED PURSUANT TO
SECTION 302 OF THE SARBANES-OXLEY ACT OF 2002
I, Daniel Ogbonna, certify that: 1. I have reviewed this Annual Report on Form 10-K of Erin Energy
Corporation;
2. Based on my knowledge, this report does not contain any untrue statement of a material fact or omit to state a material fact
necessary to make the statements made, in light of the circumstances under which such statements were made, not misleading
with respect to the period covered by this report;
3. Based on my knowledge, the financial statements and other financial information included in this report, fairly present, in all
material respects the financial condition, results of operations and cash flows of the registrant as of, and for, the periods presented
in this report;
4. The registrant’s other certifying officer and I are responsible for establishing and maintaining disclosure controls and procedures
(as defined in Exchange Act Rules 13a-15(e) and 15d-15(e)) and internal control over financial reporting (as defined in Exchange
Act Rules 13a-15(f) and 15d-15(f)) for the registrant and have:
(a) Designed such disclosure controls and procedures, or caused such disclosure controls and procedures to be designed under
our supervision, to ensure that material information relating to the registrant, including its consolidated subsidiaries, is made
known to us by others within those entities, particularly during the period in which this report is being prepared;
(b) Designed such internal control over financial reporting, or caused such internal control over financial reporting to be
designed under our supervision, to provide reasonable assurance regarding the reliability of financial reporting and the
preparation of the financial statements for external purposes in accordance with generally accepted accounting
principles;
(c) Evaluated the effectiveness of the registrant’s disclosure controls and procedures and presented in this report our conclusions
about the effectiveness of the disclosure controls and procedures, as of the end of the period covered by this report based on
such evaluation; and
(d) Disclosed in this report any change in the registrant’s internal control over financial reporting that occurred during the
registrant’s most recent fiscal quarter (the registrant’s fourth fiscal quarter in the case of an annual report) that has materially
affected, or is reasonably likely to materially affect, the registrant’s internal control over financial reporting; and
5. The registrant’s other certifying officer and I have disclosed, based on our most recent evaluation of internal control over
financial reporting, to the registrant’s auditors and the audit committee of the registrant’s Board of Directors:
(a) All significant deficiencies and material weaknesses in the design or operation of internal control over financial reporting
which are reasonably likely to adversely affect the registrant’s ability to record, process, summarize, and report financial
information; and
(b) Any fraud, whether or not material, that involves management or other employees who have a significant role in the
registrant’s internal control over financial reporting.
Date: March 23, 2016 /s/ Daniel Ogbonna
Daniel Ogbonna
Senior Vice President and Chief Financial Officer
(Principal Financial Officer)

Source: Erin Energy Corp., 10-K, March 24, 2016 Powered by Morningstar Document Research. The information contained herein may not be copied, adapted or distributed and is not warranted to be accurate, complete or timely. The user assumes all risks for any damages or losses arising from any use of this information, except to the extent such damages or losses cannot be limited or excluded by applicable law. Past financial performance is no guarantee of future results.
Exhibit 32.1
CERTIFICATION PURSUANT TO
18 U.S.C. § 1350
AS ADOPTED PURSUANT TO
SECTION 906 OF THE SARBANES-OXLEY ACT OF 2002
The undersigned hereby certifies, in his capacity as the Principal Executive Officer of Erin Energy Corporation (the “Company”), that
the Annual Report of the Company on Form 10-K for the year ended December 31, 2015 fully complies with the requirements of
Section 13(a) or 15(d) of the Securities Exchange Act of 1934, as amended, and that the information contained in such report fairly
presents, in all material respects, the financial condition and the results of operations of the Company.
Date: March 23, 2016 /s/ Dr. Kase Lukman Lawal
Dr. Kase Lukman Lawal
Chief Executive Officer
(Principal Executive Officer)

Source: Erin Energy Corp., 10-K, March 24, 2016 Powered by Morningstar Document Research. The information contained herein may not be copied, adapted or distributed and is not warranted to be accurate, complete or timely. The user assumes all risks for any damages or losses arising from any use of this information, except to the extent such damages or losses cannot be limited or excluded by applicable law. Past financial performance is no guarantee of future results.
Exhibit 32.2
CERTIFICATION PURSUANT TO
18 U.S.C. § 1350
AS ADOPTED PURSUANT TO
SECTION 906 OF THE SARBANES-OXLEY ACT OF 2002
The undersigned hereby certifies, in his capacity as the Principal Financial Officer of Erin Energy Corporation (the “Company”), that
the Annual Report of the Company on Form 10-K for the year ended December 31, 2015 fully complies with the requirements of
Section 13(a) or 15(d) of the Securities Exchange Act of 1934, as amended, and that the information contained in such report fairly
presents, in all material respects, the financial condition and the results of operations of the Company.
Date: March 23, 2016 /s/ Daniel Ogbonna
Daniel Ogbonna
Senior Vice President and Chief Financial Officer
(Principal Financial Officer)

Source: Erin Energy Corp., 10-K, March 24, 2016 Powered by Morningstar Document Research. The information contained herein may not be copied, adapted or distributed and is not warranted to be accurate, complete or timely. The user assumes all risks for any damages or losses arising from any use of this information, except to the extent such damages or losses cannot be limited or excluded by applicable law. Past financial performance is no guarantee of future results.
DeGolyer and MacNaughton 5001 Spring Valley Road
Suite 800 East
Dallas, Texas 75244
March 4, 2016
Erin Energy Corporation
1330 Post Oak Boulevard
Suite 2250
Houston, Texas 77056
Ladies and Gentlemen:
Pursuant to your request, we have conducted an independent evaluation to serve as a reserves audit of the extent
and value of the proved oil reserves, as of December 31, 2015, of a 100-percent working interest which Erin Energy
Corporation (Erin Energy) has represented that it owns in the Oyo field in Oil Mining Lease (OML) 120, offshore Nigeria.
This evaluation was completed on March 4, 2016. Erin Energy has represented that this property accounts for 100 percent,
on a net equivalent barrel basis, of Erin Energy’s net proved reserves as of December 31, 2015. The net proved reserves
estimates have been prepared in accordance with the reserves definitions of Rules 4–10(a) (1)–(32) of Regulation S–X of
the Securities and Exchange Commission (SEC) of the United States. This report was prepared in accordance with
guidelines specified in Item 1202 (a)(8) of Regulation S-K and is to be used for inclusion in certain SEC filings by Erin
Energy.
Reserves included herein are expressed as net reserves. Gross reserves are defined as the total estimated
petroleum to be produced from these properties after December 31, 2015. Net reserves are defined as that portion of the
gross reserves attributable to the interests owned by Erin Energy after deducting a royalty of 12 percent.
Values shown herein are expressed in terms of future gross revenue, future net revenue, and present worth.
Future gross revenue is that revenue which will accrue to the appraised interests from the production and sale of the
estimated net reserves. Future net revenue is calculated by deducting estimated operating expenses, capital costs,
abandonment costs (where applicable), and taxes from the

Source: Erin Energy Corp., 10-K, March 24, 2016 Powered by Morningstar Document Research. The information contained herein may not be copied, adapted or distributed and is not warranted to be accurate, complete or timely. The user assumes all risks for any damages or losses arising from any use of this information, except to the extent such damages or losses cannot be limited or excluded by applicable law. Past financial performance is no guarantee of future results.
2
DeGolyer and MacNaughton
future gross revenue. Operating expenses include field operating expenses, estimated expenses of direct supervision, and
an allocation of overhead that directly relates to production activities. Future United States income taxes have not been
taken into account in the preparation of this report. Present worth is defined as future net revenue discounted at a specified
arbitrary discount rate compounded monthly over the expected period of realization. Present worth should not be
construed as fair market value because no consideration was given to additional factors that influence the prices at which
properties are bought and sold. In this report, present worth values, using a discount rate of 10 percent, are reported as
totals.
Estimates of oil reserves and future net revenue should be regarded only as estimates that may change as further
production history and additional information become available. Not only are such reserves and revenue estimates based
on that information which is currently available, but such estimates are also subject to the uncertainties inherent in the
application of judgmental factors in interpreting such information.
Data used in this evaluation were obtained from reviews with Erin Energy personnel, Erin Energy files, from
records on file with the appropriate regulatory agencies, and from public sources. In the preparation of this report we have
relied, without independent verification, upon such information furnished by Erin Energy with respect to property
interests, production from such properties, current costs of operation and development, current prices for production,
agreements relating to current and future operations and sale of production, and various other information and data that
were accepted as represented. A field examination of the properties was not considered necessary for the purposes of this
report.
Methodology and Procedures
Estimates of reserves were prepared by the use of appropriate geologic, petroleum engineering, and evaluation
principles and techniques that are in accordance with practices generally recognized by the petroleum industry as
presented in the publication of the Society of Petroleum Engineers entitled “Standards Pertaining to the Estimating and
Auditing of Oil and Gas Reserves Information (Revision as of February 19, 2007).” The method or combination of
methods used in the analysis of each reservoir was tempered by experience with similar reservoirs, stage of development,
quality and completeness of basic data, and production history.
When applicable, the volumetric method was used to estimate the original oil in place (OOIP). Structure and
isopach maps were constructed to estimate reservoir volume. Electrical logs, radioactivity logs, core analyses, and other
available data were used to prepare these maps as well

Source: Erin Energy Corp., 10-K, March 24, 2016 Powered by Morningstar Document Research. The information contained herein may not be copied, adapted or distributed and is not warranted to be accurate, complete or timely. The user assumes all risks for any damages or losses arising from any use of this information, except to the extent such damages or losses cannot be limited or excluded by applicable law. Past financial performance is no guarantee of future results.
3
DeGolyer and MacNaughton
as to estimate representative values for porosity and water saturation. A history-matched dynamic model was available
and applicable, and model results were used to estimate recovery factors and reserves production forecasts.
In the analyses of production profiles, reserves were estimated only to the limits of economic production which
were prior to the expiration of the production license.
Oil quantities are those resulting from normal field separation and are expressed in terms of 42 United States
gallons per barrel and are reported in thousands of barrels (10 3 bbl).
Definition of Reserves
Petroleum reserves included in this report are classified as proved. Only proved reserves have been evaluated for
this report. Reserves classifications used in this report are in accordance with the reserves definitions of Rules 4–10(a)
(1)–(32) of Regulation S–X of the SEC. Reserves are judged to be economically producible in future years from known
reservoirs under existing economic and operating conditions and assuming continuation of current regulatory practices
using conventional production methods and equipment. In the analyses of production‑ decline curves, reserves were
estimated only to the limit of economic rates of production under existing economic and operating conditions using prices
and costs consistent with the effective date of this report, including consideration of changes in existing prices provided
only by contractual arrangements but not including escalations based upon future conditions. The petroleum reserves are
classified as follows:
Proved oil and gas reserves – Proved oil and gas reserves are those quantities of oil and gas, which, by analysis
of geoscience and engineering data, can be estimated with reasonable certainty to be economically
producible—from a given date forward, from known reservoirs, and under existing economic conditions,
operating methods, and government regulations—prior to the time at which contracts providing the right to
operate expire, unless evidence indicates that renewal is reasonably certain, regardless of whether deterministic
or probabilistic methods are used for the estimation. The project to extract the hydrocarbons must have
commenced or the operator must be reasonably certain that it will commence the project within a reasonable
time.
(i) The area of the reservoir considered as proved includes:

Source: Erin Energy Corp., 10-K, March 24, 2016 Powered by Morningstar Document Research. The information contained herein may not be copied, adapted or distributed and is not warranted to be accurate, complete or timely. The user assumes all risks for any damages or losses arising from any use of this information, except to the extent such damages or losses cannot be limited or excluded by applicable law. Past financial performance is no guarantee of future results.
4
DeGolyer and MacNaughton
(A) The area identified by drilling and limited by fluid contacts, if any, and (B) Adjacent undrilled portions
of the reservoir that can, with reasonable certainty, be judged to be continuous with it and to contain
economically producible oil or gas on the basis of available geoscience and engineering data.
(ii) In the absence of data on fluid contacts, proved quantities in a reservoir are limited by the lowest known
hydrocarbons (LKH) as seen in a well penetration unless geoscience, engineering, or performance data and
reliable technology establishes a lower contact with reasonable certainty.
(iii) Where direct observation from well penetrations has defined a highest known oil (HKO) elevation and
the potential exists for an associated gas cap, proved oil reserves may be assigned in the structurally higher
portions of the reservoir only if geoscience, engineering, or performance data and reliable technology
establish the higher contact with reasonable certainty.
(iv) Reserves which can be produced economically through application of improved recovery techniques
(including, but not limited to, fluid injection) are included in the proved classification when:
(A) Successful testing by a pilot project in an area of the reservoir with properties no more favorable than in
the reservoir as a whole, the operation of an installed program in the reservoir or an analogous reservoir, or
other evidence using reliable technology establishes the reasonable certainty of the engineering analysis on
which the project or program was based; and (B) The project has been approved for development by all
necessary parties and entities, including governmental entities.
(v) Existing economic conditions include prices and costs at which economic producibility from a reservoir
is to be determined. The price shall be the average price during the 12‑month period prior to the ending date
of the period covered by the report, determined as an unweighted arithmetic average of the
first-day-of-the-month price for each month within such period, unless prices are defined by contractual
arrangements, excluding escalations based upon future conditions.
Source: Erin Energy Corp., 10-K, March 24, 2016 Powered by Morningstar Document Research. The information contained herein may not be copied, adapted or distributed and is not warranted to be accurate, complete or timely. The user assumes all risks for any damages or losses arising from any use of this information, except to the extent such damages or losses cannot be limited or excluded by applicable law. Past financial performance is no guarantee of future results.
5
DeGolyer and MacNaughton
Developed oil and gas reserves – Developed oil and gas reserves are reserves of any category that can be
expected to be recovered:
(i) Through existing wells with existing equipment and operating methods or in which the cost of the
required equipment is relatively minor compared to the cost of a new well; and
(ii) Through installed extraction equipment and infrastructure operational at the time of the reserves estimate
if the extraction is by means not involving a well.
Undeveloped oil and gas reserves – Undeveloped oil and gas reserves are reserves of any category that are
expected to be recovered from new wells on undrilled acreage, or from existing wells where a relatively major
expenditure is required for recompletion.
(i) Reserves on undrilled acreage shall be limited to those directly offsetting development spacing areas that
are reasonably certain of production when drilled, unless evidence using reliable technology exists that
establishes reasonable certainty of economic producibility at greater distances.
(ii) Undrilled locations can be classified as having undeveloped reserves only if a development plan has been
adopted indicating that they are scheduled to be drilled within five years, unless the specific circumstances
justify a longer time.
(iii) Under no circumstances shall estimates for undeveloped reserves be attributable to any acreage for
which an application of fluid injection or other improved recovery technique is contemplated, unless such
techniques have been proved effective by actual projects in the same reservoir or an analogous reservoir, as
defined in [section 210.4–10 (a) Definitions], or by other evidence using reliable technology establishing
reasonable certainty.
The extent to which probable and possible reserves ultimately may be recategorized as proved reserves is
dependent upon future drilling, testing, and well performance. The degree of risk to be applied in evaluating probable and
possible reserves is influenced by economic and

Source: Erin Energy Corp., 10-K, March 24, 2016 Powered by Morningstar Document Research. The information contained herein may not be copied, adapted or distributed and is not warranted to be accurate, complete or timely. The user assumes all risks for any damages or losses arising from any use of this information, except to the extent such damages or losses cannot be limited or excluded by applicable law. Past financial performance is no guarantee of future results.
6
DeGolyer and MacNaughton
technological factors as well as the time element. No probable or possible reserves have been evaluated for this report.
Primary Economic Assumptions
Oil Price
Erin Energy has represented that the oil price was based on a Brent oil reference price. The reference price
was calculated as the unweighted arithmetic average of the first day-of-the-month price for each month
within the 12‑month period prior to the end of the reporting period. The 12-month average reference price is
U.S.$54.25 per barrel. Erin Energy supplied differentials to the Brent reference price and has represented
that the 12-month average oil price for the Oyo field was U.S.$53.51 per barrel. This price was held constant
for the life of the field.
Operating Expenses, Capital Costs, and Abandonment Costs
Estimates of future operating expenses were based on current expenses. In certain cases, future expenses,
either higher or lower than current expenses, may have been used because of anticipated changed operating
conditions, but no general escalation that might result from inflation was applied. Future capital expenditures
were estimated using current capital costs and were not escalated for inflation. Abandonment costs are
included and have not been escalated for inflation.
Summary of Oil Reserves and Revenue
The estimates of the net oil proved reserves, as of December 31, 2015, attributable to the interests owned by Erin
Energy in the Oyo field, offshore Nigeria, are summarized as follows, expressed in thousands of barrels (10 3 bbl):
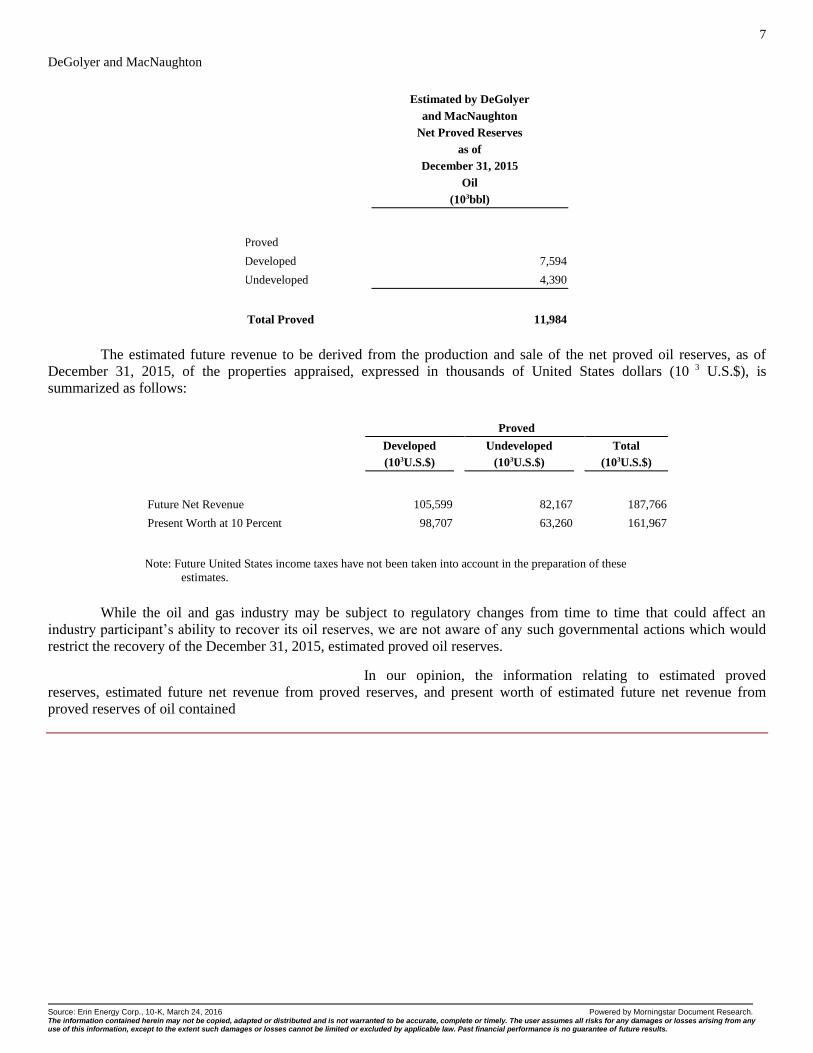
Source: Erin Energy Corp., 10-K, March 24, 2016 Powered by Morningstar Document Research. The information contained herein may not be copied, adapted or distributed and is not warranted to be accurate, complete or timely. The user assumes all risks for any damages or losses arising from any use of this information, except to the extent such damages or losses cannot be limited or excluded by applicable law. Past financial performance is no guarantee of future results.
7
DeGolyer and MacNaughton
Estimated by DeGolyer
and MacNaughton
Net Proved Reserves
as of
December 31, 2015
Oil
(103bbl)
Proved
Developed 7,594
Undeveloped 4,390
Total Proved 11,984
The estimated future revenue to be derived from the production and sale of the net proved oil reserves, as of
December 31, 2015, of the properties appraised, expressed in thousands of United States dollars (10 3 U.S.$), is
summarized as follows:
Proved
Developed
(103U.S.$)
Undeveloped
(103U.S.$)
Total
(103U.S.$)
Future Net Revenue 105,599 82,167 187,766
Present Worth at 10 Percent 98,707 63,260 161,967
Note: Future United States income taxes have not been taken into account in the preparation of these
estimates.
While the oil and gas industry may be subject to regulatory changes from time to time that could affect an
industry participant’s ability to recover its oil reserves, we are not aware of any such governmental actions which would
restrict the recovery of the December 31, 2015, estimated proved oil reserves.
In our opinion, the information relating to estimated proved
reserves, estimated future net revenue from proved reserves, and present worth of estimated future net revenue from
proved reserves of oil contained

Source: Erin Energy Corp., 10-K, March 24, 2016 Powered by Morningstar Document Research. The information contained herein may not be copied, adapted or distributed and is not warranted to be accurate, complete or timely. The user assumes all risks for any damages or losses arising from any use of this information, except to the extent such damages or losses cannot be limited or excluded by applicable law. Past financial performance is no guarantee of future results.
8
DeGolyer and MacNaughton
in this report has been prepared in accordance with Paragraphs 932-235-50-4, 932‑ 235-50-6, 932-235-50-7,
932‑ 235‑ 50-9, 932-235-50-30, and 932-235-50-31(a), (b), and (e) of the Accounting Standards Update 932-235-50,
Extractive Industries – Oil and Gas (Topic 932): Oil and Gas Reserve Estimation and Disclosures (January 2010) of the
Financial Accounting Standards Board and Rules 4–10(a) (1)–(32) of Regulation S–X and Rules 302(b), 1201, 1202(a)
(1), (2), (3), (4), (8), and 1203(a) of Regulation S–K of the Securities and Exchange Commission; provided, however, that
(i) future United States income tax expenses have not been taken into account in estimating the future net revenue and
present worth values set forth herein and (ii) estimates of the proved developed and proved undeveloped reserves are not
presented at the beginning of the year.
To the extent the above-enumerated rules, regulations, and statements require determinations of an accounting or
legal nature, we, as engineers, are necessarily unable to express an opinion as to whether the above-described information
is in accordance therewith or sufficient therefor.
DeGolyer and MacNaughton is an independent petroleum engineering consulting firm that has been providing
petroleum consulting services throughout the world since 1936. DeGolyer and MacNaughton does not have any financial
interest, including stock ownership, in Erin Energy. Our fees were not contingent on the results of our evaluation. This
letter report has been prepared at the request of Erin Energy. DeGolyer and MacNaughton has used all assumptions, data,
procedures, and methods that it considers necessary and appropriate to prepare this report.
Submitted,
/s/ Lloyd W. Cade
DeGOLYER and MacNAUGHTON Texas Registered Engineering Firm F-716
/s/ Lloyd W. Cade
Lloyd W. Cade, P.E.
[SEAL] Senior Vice President
DeGolyer and MacNaughton

Source: Erin Energy Corp., 10-K, March 24, 2016 Powered by Morningstar Document Research. The information contained herein may not be copied, adapted or distributed and is not warranted to be accurate, complete or timely. The user assumes all risks for any damages or losses arising from any use of this information, except to the extent such damages or losses cannot be limited or excluded by applicable law. Past financial performance is no guarantee of future results.
DeGolyer and MacNaughton
CERTIFICATE of QUALIFICATION
I, Lloyd W. Cade, Petroleum Engineer with DeGolyer and MacNaughton, 5001 Spring Valley Road, Suite 800
East, Dallas, Texas, 75244 U.S.A., hereby certify:
1. That I am a Senior Vice President with DeGolyer and MacNaughton, which company did prepare the letter report
addressed to Erin Energy dated March 4, 2016, and that I, as Senior Vice President, was responsible for the
preparation of this report.
2. That I attended Kansas State University, and that I graduated with a Bachelor of Science degree in Mechanical
Engineering in the year 1982; that I am a Registered Professional Engineer in the State of Texas; that I am a
member of the International Society of Petroleum Engineers; and that I have in excess of 33 years of experience
in oil and gas reservoir studies and reserves evaluations.
SIGNED: March 4, 2016

Source: Erin Energy Corp., 10-K, March 24, 2016 Powered by Morningstar Document Research. The information contained herein may not be copied, adapted or distributed and is not warranted to be accurate, complete or timely. The user assumes all risks for any damages or losses arising from any use of this information, except to the extent such damages or losses cannot be limited or excluded by applicable law. Past financial performance is no guarantee of future results.