united states cancer statistics - cdc wonder · national program of cancer registries (npcr)...
TRANSCRIPT

UnitedStates
CancerStatistics
1999 INCIDENCE PUBLICATION YEAR 2002
D E PA R T M E N T O F H E A LT H A N D H U M A N S E R V I C E S

Suggested citation: U.S. Cancer Statistics Working Group. United States Cancer Statistics:1999 Incidence. Atlanta (GA): Department of Health and Human Services, Centers for Disease Control and Prevention and National Cancer Institute; 2002.
All material in this report is in the public domain and may be reproduced or copied without permission. However, citation as to source is requested.
National Program of Cancer Registries (NPCR)National Center for Chronic Disease
Prevention and Health PromotionCenters for Disease Control and Prevention4770 Buford Highway, MS K-53Atlanta, GA 30341-3717Phone: (770) 488-4783Fax: (770) 488-4759Web address: http://www.cdc.gov/cancer/npcr/
Surveillance, Epidemiology, and End Results (SEER) Program
Surveillance Research Program, DCCPSNational Cancer Institute, NIH6116 Executive Boulevard, MSC 8316Bethesda, MD 20892-8316Phone: (301) 496-8510Fax: (301) 496-9949Web address: http://seer.cancer.gov
For more information, contact

UnitedStates
CancerStatistics
1999 Incidence
U.S. Cancer Statistics Working Group
ii
U.S. Cancer Statistics Working Group
Senior Editors
Centers for Disease Control and Prevention National Cancer Institute
Paul Gargiullo, PhD Brenda K. Edwards, PhD Irene Hall, PhD Eric J. (Rocky) Feuer, PhDMary D. Hutton, MPH, CTR Benjamin F. Hankey, ScDPatricia M. Jamison, MPH Lynn A.G. Ries, MS Hannah K. Weir, PhD Phyllis A. Wingo, PhD, MS
Contributing Editors
Centers for Disease North American Association Control and Prevention National Cancer Institute of Central Cancer Registries
James A. Enders, MPH, CTR Barnali Das, PhD Vivien W. Chen, PhDJessica B. King, MPH Michael Fay, PhD Dennis Deapen, DrPHKathleen McDavid, PhD, MPH Linda W. Pickle, PhDJoseph D. Rogers, BSTrevor D. Thompson, BS

iii
The Centers for Disease Control and Prevention and the NationalCancer Institute thank the staff in state and metropolitan area cancerregistries for their commitment to cancer surveillance and controlprograms. The consistent efforts of registry staff to collect complete,timely, and high-quality cancer incidence data are essential formonitoring progress toward reducing the burden of cancer in theUnited States. See Appendix A for a list of state and metropolitan areacancer registries.
We thank the National Program of Cancer Registries’ ScientificWorkgroup members for their assistance in designing and reviewingthis document, and we thank the National Program of CancerRegistries’ Logistics Workgroup members for their work on operationaland data quality issues related to the data presented here. See AppendixB for lists of the workgroup members.
National partner organizations are crucial to the success of cancerregistration and cancer surveillance in the United States. Thisdocument, and many advances in cancer surveillance in the UnitedStates, would not have been possible without the tireless efforts andmany achievements of these organizations. The Centers for DiseaseControl and Prevention and the National Cancer Institute gratefullyacknowledge and thank the American Cancer Society, the AmericanCollege of Surgeons Commission on Cancer, the American JointCommittee on Cancer, the National Cancer Registrars Association, andour collaborating partner, the North American Association of CentralCancer Registries, for their support for cancer registration and cancersurveillance provided over many years. Appendix C has contactinformation for these national partner organizations.
We thank Helen McClintock and Mary Kaeser, MEd, for their excellenteditorial services.
Acknowledgments

Ordering Information
The U.S. Cancer Statistics report will be published annually. Printed copies are available fromthe following:
Centers for Disease Control and PreventionNational Center for Chronic Disease
Prevention and Health PromotionDivision of Cancer Prevention and ControlAttn: Publications, Mail Stop K–644770 Buford Highway, NortheastAtlanta, GA 30341-3717
All sections of this report are available on the Web sites listed below:
• http://www.cdc.gov/cancer/npcr/uscs/• http://seer.cancer.gov/statistics/
iv
v
PrefaceUnited States Cancer Statistics: 1999 Incidence is a joint publication of theCenters for Disease Control and Prevention (CDC) in Atlanta,Georgia, and the National Cancer Institute (NCI) in Bethesda,Maryland, in collaboration with the North American Association ofCentral Cancer Registries (NAACCR) in Springfield, Illinois. This isthe first joint report from the two federal programs that supportpopulation-based cancer registries in the United States: CDC’s NationalProgram of Cancer Registries (NPCR) and NCI’s Surveillance,Epidemiology, and End Results (SEER) Program. The report contains,for the first time, official federal government cancer statistics for morethan 1 million invasive cancer cases diagnosed during 1999 amongresidents of 37 states, 6 metropolitan areas, and the District ofColumbia, geographic areas in which approximately 78% of the U.S.population reside. Data from population-based central cancer registriesin these states and metropolitan areas meet the selected criteria forinclusion in this report (see “Registry Eligibility Criteria”).
Beginning with 1999 data, the Department of Health and HumanServices adopted the 2000 U.S. standard population for age adjustment.1–5
Therefore, the age-adjusted rates presented in this report are adjusted tothe new 2000 U.S. standard population, and caution should be used whencomparing these data with previously published cancer incidence ratesthat were adjusted to the 1970 U.S. standard population.


vii
This report has five major sections:
• Technical Notes
• Cancer Incidence: All Areas Combined
• Cancer Incidence, by U.S. Census Region and Division, State, and Metropolitan Area
• State and Metropolitan Area Incidence Rates for Most Common Cancers
• Appendices
Technical Notes. In this section, we describe the background for the report and provideinformation about the two federal programs that support cancer registration in the UnitedStates and their collaborating partner, the North American Association of Central CancerRegistries. Also provided are (1) criteria required for inclusion of a registry’s data in thereport and (2) information about the data sources and the statistical methods used inpreparing the report. Suggestions for interpreting the data conclude the technical notes.
Statistical tables and figures are the primary focus of the report. The next three sectionsof the report provide tables and figures.
Cancer Incidence: All Areas Combined. Figure 1 is a map showing all the states andmetropolitan areas that contributed data to the report. Tables 1.1 through 1.4 providecancer incidence rates by sex and race (all races, white, black) for all the contributingareas combined. Tables 1.1 and 1.2 provide crude and age-adjusted incidence rates, bysex and race, for invasive cancers at 66 selected primary sites for males and 70 selectedprimary sites for females (including in situ breast cancer), and for invasive cancers at allsites combined; case counts used in calculating the rates in Tables 1.1 and 1.2 are inAppendix D. Tables 1.3 and 1.4 provide age-specific incidence rates for all cancer sitescombined, by sex and race.
Cancer Incidence, by U.S. Census Region and Division, State, and MetropolitanArea. Figure 2 is a map showing the states and metropolitan areas, by U.S. census regionand division, that contributed data to the report. Tables 2.1.1 through 2.25.2 show theincidence rates for U.S. census regions and divisions, states, and metropolitan areas bysex and race (all races, white, black), for invasive cancers at each of 23 major primarysites, in situ female breast cancer, and invasive cancers at all sites combined. Case countsused in calculating the rates in Tables 2.1.1 through 2.25.2 are in Appendix E.
State and Metropolitan Area Incidence Rates for Most Common Cancers. Figures3.1 through 3.44 are a set of bar graphs for each of the 44 contributing state ormetropolitan area cancer registries. The graphs rank the incidence rates for the 15cancer sites with the highest age-adjusted incidence rates within sex- and race-specificpopulation subgroups in each state or metropolitan area. The rates are the same as thoseshown in Tables 2.1.1 through 2.25.2, with the following exception: for populations ofless than 50,000, incidence rates were not ranked and therefore are not shown. Casecounts used to calculate the rates for these figures are in Appendix E.
Appendices. These supplement information in the report and assist readers ininterpreting the data in the statistical tables and figures.
Format and Content of the Report


ix
Acknowledgments . . . . . . . . . . . . . . . . . . . . . . . . . . . . . . . . . . . . . . . . . . . . . . . . . . . . . . . . . . . . . . . . . . . . . iii
Preface . . . . . . . . . . . . . . . . . . . . . . . . . . . . . . . . . . . . . . . . . . . . . . . . . . . . . . . . . . . . . . . . . . . . . . . . . . . . . . . v
Format and Content of the Report. . . . . . . . . . . . . . . . . . . . . . . . . . . . . . . . . . . . . . . . . . . . . . . . . . . . . . . . vii
TECHNICAL NOTES
Background . . . . . . . . . . . . . . . . . . . . . . . . . . . . . . . . . . . . . . . . . . . . . . . . . . . . . . . . . . . . . . . . . . . . . . . . . 1
Federal Programs . . . . . . . . . . . . . . . . . . . . . . . . . . . . . . . . . . . . . . . . . . . . . . . . . . . . . . . . . . . . . . . . . . . . 1
Surveillance, Epidemiology, and End Results (SEER) Program . . . . . . . . . . . . . . . . . . . . . . . . . . . . 1
National Program of Cancer Registries (NPCR) . . . . . . . . . . . . . . . . . . . . . . . . . . . . . . . . . . . . . . . . 3
Collaborating Partner . . . . . . . . . . . . . . . . . . . . . . . . . . . . . . . . . . . . . . . . . . . . . . . . . . . . . . . . . . . . . . . . . 4
North American Association of Central Cancer Registries (NAACCR) . . . . . . . . . . . . . . . . . . . . . . 4
Registry Eligibility Criteria . . . . . . . . . . . . . . . . . . . . . . . . . . . . . . . . . . . . . . . . . . . . . . . . . . . . . . . . . . . . 4
Data Sources . . . . . . . . . . . . . . . . . . . . . . . . . . . . . . . . . . . . . . . . . . . . . . . . . . . . . . . . . . . . . . . . . . . . . . . . 5
Incidence Data . . . . . . . . . . . . . . . . . . . . . . . . . . . . . . . . . . . . . . . . . . . . . . . . . . . . . . . . . . . . . . . . . . . 5
Population Data . . . . . . . . . . . . . . . . . . . . . . . . . . . . . . . . . . . . . . . . . . . . . . . . . . . . . . . . . . . . . . . . . . 5
Statistical Methods . . . . . . . . . . . . . . . . . . . . . . . . . . . . . . . . . . . . . . . . . . . . . . . . . . . . . . . . . . . . . . . . . . . 6
Incidence Rates . . . . . . . . . . . . . . . . . . . . . . . . . . . . . . . . . . . . . . . . . . . . . . . . . . . . . . . . . . . . . . . . . . 6
Crude Incidence Rates. . . . . . . . . . . . . . . . . . . . . . . . . . . . . . . . . . . . . . . . . . . . . . . . . . . . . . . . . . . . . 6
Age-Adjusted Incidence Rates . . . . . . . . . . . . . . . . . . . . . . . . . . . . . . . . . . . . . . . . . . . . . . . . . . . . . . . 6
Confidence Intervals . . . . . . . . . . . . . . . . . . . . . . . . . . . . . . . . . . . . . . . . . . . . . . . . . . . . . . . . . . . . . . 7
Suppression of Incidence Rates and Case Counts . . . . . . . . . . . . . . . . . . . . . . . . . . . . . . . . . . . . . . . 8
Inclusion of Incidence Rates and Counts for U.S. Census Regions and Divisions . . . . . . . . . . . . . . 8
Inclusion of Incidence Rates and Counts for the United States. . . . . . . . . . . . . . . . . . . . . . . . . . . . . 9
Interpreting the Data . . . . . . . . . . . . . . . . . . . . . . . . . . . . . . . . . . . . . . . . . . . . . . . . . . . . . . . . . . . . . . . . . 9
References . . . . . . . . . . . . . . . . . . . . . . . . . . . . . . . . . . . . . . . . . . . . . . . . . . . . . . . . . . . . . . . . . . . . . . . . . 11
CANCER INCIDENCE: ALL AREAS COMBINED
Figure 1 Geographic areas covered by SEER and NPCR registries that contributed data to United States Cancer Statistics: 1999 Incidence . . . . . . . . . . . . . . . . . . . 15
Table 1.1 Invasive cancer incidence rates by primary site and race (all races, white, black), United States: SEER and NPCR registries that meet quality criteria. Males, 1999 . . . . . . . . . . . . . . . . . . . . . . . . . . . . . . . . . . . . . . . . . . . . . . . . . . . . . . . . . . . . 16
Table of Contents

United States Cancer Statistics: 1999 Incidence
x
Table 1.2 Invasive cancer incidence rates by primary site and race (all races, white, black), United States: SEER and NPCR registries that meet quality criteria. Females, 1999. . . . . . . . . . . . . . . . . . . . . . . . . . . . . . . . . . . . . . . . . . . . . . . . . . . . . . . . . . . 18
Table 1.3 All cancer sites combined. Invasive cancer incidence rates by age and race (all races, white, black), United States: SEER and NPCR registries that meet quality criteria. Males, 1999 . . . . . . . . . . . . . . . . . . . . . . . . . . . . . . . . . . . . . . . . . . . 20
Table 1.4 All cancer sites combined. Invasive cancer incidence rates by age and race (all races, white, black), United States: SEER and NPCR registries that meet quality criteria. Females, 1999. . . . . . . . . . . . . . . . . . . . . . . . . . . . . . . . . . . . . . . . . . . . . . 21
CANCER INCIDENCE, BY U.S. CENSUS REGION AND DIVISION, STATE, AND METROPOLITAN AREA
Figure 2 SEER and NPCR registries that contributed data to United States Cancer Statistics: 1999 Incidence, by U.S. census region and division . . . . . . . . . . . . . . . . . . . . . . 23
Tables 2.1.1– Invasive cancer incidence rates by U.S. census region and division, state2.25.2 and metropolitan area, and race (all races, white, black), United States:
SEER and NPCR registries that meet quality criteria
Table 2.1.1 All cancer sites combined, males, 1999. . . . . . . . . . . . . . . . . . . . . . . . . . . . . . . . . . . 24
Table 2.1.2 All cancer sites combined, females, 1999 . . . . . . . . . . . . . . . . . . . . . . . . . . . . . . . . . 26
Table 2.2.1 Cancer of the oral cavity and pharynx, males, 1999 . . . . . . . . . . . . . . . . . . . . . . . . . 28
Table 2.2.2 Cancer of the oral cavity and pharynx, females, 1999 . . . . . . . . . . . . . . . . . . . . . . . 30
Table 2.3.1 Cancer of the esophagus, males, 1999 . . . . . . . . . . . . . . . . . . . . . . . . . . . . . . . . . . . 32
Table 2.3.2 Cancer of the esophagus, females, 1999 . . . . . . . . . . . . . . . . . . . . . . . . . . . . . . . . . . 34
Table 2.4.1 Cancer of the stomach, males, 1999 . . . . . . . . . . . . . . . . . . . . . . . . . . . . . . . . . . . . . 36
Table 2.4.2 Cancer of the stomach, females, 1999 . . . . . . . . . . . . . . . . . . . . . . . . . . . . . . . . . . . 38
Table 2.5.1 Cancer of the colon and rectum, males, 1999 . . . . . . . . . . . . . . . . . . . . . . . . . . . . . 40
Table 2.5.2 Cancer of the colon and rectum, females, 1999 . . . . . . . . . . . . . . . . . . . . . . . . . . . . 42
Table 2.6.1 Cancer of the liver and intrahepatic bile duct, males, 1999 . . . . . . . . . . . . . . . . . . . 44
Table 2.6.2 Cancer of the liver and intrahepatic bile duct, females, 1999 . . . . . . . . . . . . . . . . . 46
Table 2.7.1 Cancer of the pancreas, males, 1999. . . . . . . . . . . . . . . . . . . . . . . . . . . . . . . . . . . . . 48
Table 2.7.2 Cancer of the pancreas, females, 1999 . . . . . . . . . . . . . . . . . . . . . . . . . . . . . . . . . . . 50
Table 2.8.1 Cancer of the larynx, males, 1999. . . . . . . . . . . . . . . . . . . . . . . . . . . . . . . . . . . . . . . 52
Table 2.8.2 Cancer of the larynx, females, 1999 . . . . . . . . . . . . . . . . . . . . . . . . . . . . . . . . . . . . . 54
Table 2.9.1 Cancer of the lung and bronchus, males, 1999. . . . . . . . . . . . . . . . . . . . . . . . . . . . . 56
Table 2.9.2 Cancer of the lung and bronchus, females, 1999 . . . . . . . . . . . . . . . . . . . . . . . . . . . 58
Table 2.10.1 Melanomas of the skin, males, 1999 . . . . . . . . . . . . . . . . . . . . . . . . . . . . . . . . . . . . . 60

Technical Notes
xi
Table 2.10.2 Melanomas of the skin, females, 1999 . . . . . . . . . . . . . . . . . . . . . . . . . . . . . . . . . . . 62
Table 2.11 Cancer of the breast, females, 1999 . . . . . . . . . . . . . . . . . . . . . . . . . . . . . . . . . . . . . 64
Table 2.12 Cancer of the breast, in situ, females, 1999. . . . . . . . . . . . . . . . . . . . . . . . . . . . . . . . 66
Table 2.13 Cancer of the cervix uteri, females, 1999 . . . . . . . . . . . . . . . . . . . . . . . . . . . . . . . . . 68
Table 2.14 Cancer of the corpus uteri, females, 1999 . . . . . . . . . . . . . . . . . . . . . . . . . . . . . . . . 70
Table 2.15 Cancer of the ovary, females, 1999 . . . . . . . . . . . . . . . . . . . . . . . . . . . . . . . . . . . . . . 72
Table 2.16 Cancer of the prostate, males, 1999 . . . . . . . . . . . . . . . . . . . . . . . . . . . . . . . . . . . . . 74
Table 2.17 Cancer of the testis, males, 1999. . . . . . . . . . . . . . . . . . . . . . . . . . . . . . . . . . . . . . . . 76
Table 2.18.1 Cancer of the urinary bladder, males, 1999 . . . . . . . . . . . . . . . . . . . . . . . . . . . . . . . 78
Table 2.18.2 Cancer of the urinary bladder, females, 1999 . . . . . . . . . . . . . . . . . . . . . . . . . . . . . . 80
Table 2.19.1 Cancer of the kidney and renal pelvis, males, 1999 . . . . . . . . . . . . . . . . . . . . . . . . . 82
Table 2.19.2 Cancer of the kidney and renal pelvis, females, 1999. . . . . . . . . . . . . . . . . . . . . . . . 84
Table 2.20.1 Cancer of the brain and other nervous system, males, 1999 . . . . . . . . . . . . . . . . . . 86
Table 2.20.2 Cancer of the brain and other nervous system, females, 1999. . . . . . . . . . . . . . . . . 88
Table 2.21.1 Cancer of the thyroid, males, 1999. . . . . . . . . . . . . . . . . . . . . . . . . . . . . . . . . . . . . . 90
Table 2.21.2 Cancer of the thyroid, females, 1999 . . . . . . . . . . . . . . . . . . . . . . . . . . . . . . . . . . . . 92
Table 2.22.1 Hodgkin lymphoma, males, 1999 . . . . . . . . . . . . . . . . . . . . . . . . . . . . . . . . . . . . . . . 94
Table 2.22.2 Hodgkin lymphoma, females, 1999 . . . . . . . . . . . . . . . . . . . . . . . . . . . . . . . . . . . . . 96
Table 2.23.1 Non-Hodgkin lymphoma, males, 1999 . . . . . . . . . . . . . . . . . . . . . . . . . . . . . . . . . . 98
Table 2.23.2 Non-Hodgkin lymphoma, females, 1999 . . . . . . . . . . . . . . . . . . . . . . . . . . . . . . . . 100
Table 2.24.1 Multiple myeloma, males, 1999 . . . . . . . . . . . . . . . . . . . . . . . . . . . . . . . . . . . . . . . 102
Table 2.24.2 Multiple myeloma, females, 1999 . . . . . . . . . . . . . . . . . . . . . . . . . . . . . . . . . . . . . . 104
Table 2.25.1 Leukemias, males, 1999. . . . . . . . . . . . . . . . . . . . . . . . . . . . . . . . . . . . . . . . . . . . . . 106
Table 2.25.2 Leukemias, females, 1999 . . . . . . . . . . . . . . . . . . . . . . . . . . . . . . . . . . . . . . . . . . . . 108
STATE AND METROPOLITAN AREA INCIDENCE RATES FOR MOST COMMON CANCERS
Figures 3.1– Invasive cancer incidence rates for the 15 primary sites with the highest 3.44 age-adjusted incidence rates within race- and sex-specific categories
Figure 3.1 Alaska, 1999 . . . . . . . . . . . . . . . . . . . . . . . . . . . . . . . . . . . . . . . . . . . . . . . . . . . . . . 111
Figure 3.2 Arizona, 1999. . . . . . . . . . . . . . . . . . . . . . . . . . . . . . . . . . . . . . . . . . . . . . . . . . . . . . 112
Figure 3.3 California, 1999 . . . . . . . . . . . . . . . . . . . . . . . . . . . . . . . . . . . . . . . . . . . . . . . . . . . . 113
Figure 3.4 Los Angeles, 1999 . . . . . . . . . . . . . . . . . . . . . . . . . . . . . . . . . . . . . . . . . . . . . . . . . . 114

United States Cancer Statistics: 1999 Incidence
xii
Figure 3.5 San Francisco-Oakland, 1999 . . . . . . . . . . . . . . . . . . . . . . . . . . . . . . . . . . . . . . . . . 115
Figure 3.6 San José-Monterey, 1999 . . . . . . . . . . . . . . . . . . . . . . . . . . . . . . . . . . . . . . . . . . . . 116
Figure 3.7 Colorado, 1999 . . . . . . . . . . . . . . . . . . . . . . . . . . . . . . . . . . . . . . . . . . . . . . . . . . . . 117
Figure 3.8 Connecticut, 1999 . . . . . . . . . . . . . . . . . . . . . . . . . . . . . . . . . . . . . . . . . . . . . . . . . . 118
Figure 3.9 Delaware, 1999 . . . . . . . . . . . . . . . . . . . . . . . . . . . . . . . . . . . . . . . . . . . . . . . . . . . . 119
Figure 3.10 District of Columbia, 1999 . . . . . . . . . . . . . . . . . . . . . . . . . . . . . . . . . . . . . . . . . . . 120
Figure 3.11 Florida, 1999 . . . . . . . . . . . . . . . . . . . . . . . . . . . . . . . . . . . . . . . . . . . . . . . . . . . . . . 121
Figure 3.12 Atlanta, 1999 . . . . . . . . . . . . . . . . . . . . . . . . . . . . . . . . . . . . . . . . . . . . . . . . . . . . . . 122
Figure 3.13 Hawaii, 1999 . . . . . . . . . . . . . . . . . . . . . . . . . . . . . . . . . . . . . . . . . . . . . . . . . . . . . . 123
Figure 3.14 Idaho, 1999 . . . . . . . . . . . . . . . . . . . . . . . . . . . . . . . . . . . . . . . . . . . . . . . . . . . . . . . 124
Figure 3.15 Illinois, 1999 . . . . . . . . . . . . . . . . . . . . . . . . . . . . . . . . . . . . . . . . . . . . . . . . . . . . . . 125
Figure 3.16 Iowa, 1999 . . . . . . . . . . . . . . . . . . . . . . . . . . . . . . . . . . . . . . . . . . . . . . . . . . . . . . . . 126
Figure 3.17 Kansas, 1999 . . . . . . . . . . . . . . . . . . . . . . . . . . . . . . . . . . . . . . . . . . . . . . . . . . . . . . 127
Figure 3.18 Kentucky, 1999 . . . . . . . . . . . . . . . . . . . . . . . . . . . . . . . . . . . . . . . . . . . . . . . . . . . . 128
Figure 3.19 Louisiana, 1999 . . . . . . . . . . . . . . . . . . . . . . . . . . . . . . . . . . . . . . . . . . . . . . . . . . . . 129
Figure 3.20 Maryland, 1999 . . . . . . . . . . . . . . . . . . . . . . . . . . . . . . . . . . . . . . . . . . . . . . . . . . . . 130
Figure 3.21 Massachusetts, 1999 . . . . . . . . . . . . . . . . . . . . . . . . . . . . . . . . . . . . . . . . . . . . . . . . 131
Figure 3.22 Michigan, 1999 . . . . . . . . . . . . . . . . . . . . . . . . . . . . . . . . . . . . . . . . . . . . . . . . . . . . 132
Figure 3.23 Detroit, 1999 . . . . . . . . . . . . . . . . . . . . . . . . . . . . . . . . . . . . . . . . . . . . . . . . . . . . . . 133
Figure 3.24 Minnesota, 1999 . . . . . . . . . . . . . . . . . . . . . . . . . . . . . . . . . . . . . . . . . . . . . . . . . . . 134
Figure 3.25 Missouri, 1999 . . . . . . . . . . . . . . . . . . . . . . . . . . . . . . . . . . . . . . . . . . . . . . . . . . . . . 135
Figure 3.26 Montana, 1999. . . . . . . . . . . . . . . . . . . . . . . . . . . . . . . . . . . . . . . . . . . . . . . . . . . . . 136
Figure 3.27 Nebraska, 1999 . . . . . . . . . . . . . . . . . . . . . . . . . . . . . . . . . . . . . . . . . . . . . . . . . . . . 137
Figure 3.28 New Hampshire, 1999 . . . . . . . . . . . . . . . . . . . . . . . . . . . . . . . . . . . . . . . . . . . . . . 138
Figure 3.29 New Jersey, 1999 . . . . . . . . . . . . . . . . . . . . . . . . . . . . . . . . . . . . . . . . . . . . . . . . . . . 139
Figure 3.30 New Mexico, 1999. . . . . . . . . . . . . . . . . . . . . . . . . . . . . . . . . . . . . . . . . . . . . . . . . . 140
Figure 3.31 New York, 1999 . . . . . . . . . . . . . . . . . . . . . . . . . . . . . . . . . . . . . . . . . . . . . . . . . . . . 141
Figure 3.32 North Carolina, 1999 . . . . . . . . . . . . . . . . . . . . . . . . . . . . . . . . . . . . . . . . . . . . . . . 142
Figure 3.33 North Dakota, 1999 . . . . . . . . . . . . . . . . . . . . . . . . . . . . . . . . . . . . . . . . . . . . . . . . 143
Figure 3.34 Ohio, 1999 . . . . . . . . . . . . . . . . . . . . . . . . . . . . . . . . . . . . . . . . . . . . . . . . . . . . . . . . 144
Figure 3.35 Oregon, 1999. . . . . . . . . . . . . . . . . . . . . . . . . . . . . . . . . . . . . . . . . . . . . . . . . . . . . . 145
Figure 3.36 Pennsylvania, 1999 . . . . . . . . . . . . . . . . . . . . . . . . . . . . . . . . . . . . . . . . . . . . . . . . . 146

Technical Notes
xiii
Figure 3.37 Rhode Island, 1999 . . . . . . . . . . . . . . . . . . . . . . . . . . . . . . . . . . . . . . . . . . . . . . . . . 147
Figure 3.38 South Carolina, 1999. . . . . . . . . . . . . . . . . . . . . . . . . . . . . . . . . . . . . . . . . . . . . . . . 148
Figure 3.39 Utah, 1999 . . . . . . . . . . . . . . . . . . . . . . . . . . . . . . . . . . . . . . . . . . . . . . . . . . . . . . . . 149
Figure 3.40 Washington, 1999 . . . . . . . . . . . . . . . . . . . . . . . . . . . . . . . . . . . . . . . . . . . . . . . . . . 150
Figure 3.41 Seattle-Puget Sound, 1999 . . . . . . . . . . . . . . . . . . . . . . . . . . . . . . . . . . . . . . . . . . . 151
Figure 3.42 West Virginia, 1999. . . . . . . . . . . . . . . . . . . . . . . . . . . . . . . . . . . . . . . . . . . . . . . . . 152
Figure 3.43 Wisconsin, 1999 . . . . . . . . . . . . . . . . . . . . . . . . . . . . . . . . . . . . . . . . . . . . . . . . . . . 153
Figure 3.44 Wyoming, 1999 . . . . . . . . . . . . . . . . . . . . . . . . . . . . . . . . . . . . . . . . . . . . . . . . . . . . 154
APPENDICES
Appendix A State and Metropolitan Area Cancer Registries
Appendix B National Program of Cancer Registries: Scientific Workgroup members and Logistics Workgroup members
Appendix C National partner organizations
Appendix D Invasive cancer incidence, case counts by primary site, sex, and race (all races, white, black), United States: NPCR and SEER Program registries that meet quality criteria, 1999
Appendix E Invasive cancer incidence counts by U.S. census region and division, state and metropolitan area, sex, and race (all races, white, black), United States: SEER and NPCR registries that meet quality criteria, 1999
Appendix F State and metropolitan area cancer registries by current federal fundingsource, 2002
Appendix G State and metropolitan area cancer registries by federal funding source and first diagnosis year for which cancer cases were reportable to CDC’s NPCR or NCI’s SEER Program
Appendix H Achievement of selected data quality criteria by state and SEER metropolitan area cancer registries, 1999
Appendix I SEER site groups for primary cancer sites based on ICD–O–2
Appendix J Projected population counts by U.S. census region and division, state and SEERmetropolitan area, sex, and race (all races, white, black), 1999
Appendix K 1970 and 2000 U.S. standard population weights
Appendix L Estimating bias-corrected incidence rates for U.S. census regions and divisions
Appendix M U.S. population median age in years by state, sex, and race (all races, white, black), 2000
List of abbreviations . . . . . . . . . . . . . . . . . . . . . . . . . . . . . . . . . . . . . . . . . . . . . . . . . . . . . . . Inside back cover


Technical Notes

Background Cancer is the second leading cause of death amongAmericans.6–8 In the United States, one of every fourdeaths is due to cancer. The American CancerSociety estimates that, in 2002, about 1,284,900Americans will receive a new diagnosis of cancer andabout 555,500 Americans will die of this disease.The National Cancer Institute (NCI) estimatesthat approximately 8.9 million Americans are nowalive with a history of cancer.4 These estimates do not include in situ cancer or the approximately 1 million cases of basal and squamous cell skincancers expected to be diagnosed this year.
According to the 2002 annual report to the nationon the status of cancer, age-adjusted cancer deathrates—as well as age-specific cancer death rates in all age groups—are declining and age-adjustedcancer incidence rates stabilized from 1995 to1999.9 Even if the age-adjusted incidence ratesremain stable, however, the number of Americansdiagnosed with cancer is expected to double in thenext 50 years, from 1.3 million to 2.6 million peryear.9 The anticipated growth and aging of the U.S.population are factors that will increase the numberof people who are diagnosed with, and treated for,cancer.9
The National Institutes of Health estimates that, in2002, the overall annual cost of cancer will beabout $171.6 billion, broken down as follows:10
• Direct medical costs, including healthexpenditures: $60.9 billion.
• Indirect morbidity costs associated with lostproductivity due to illness: $15.5 billion.
• Indirect mortality costs associated with lostproductivity due to premature death: $95.2 billion.
These costs are likely to increase because of theanticipated growth and aging of the U.S. population.
There are effective primary and secondaryprevention measures that could substantially reducethe number of new cancer cases and prevent manycancer-related deaths. To reduce the nation’s cancerburden, we must reduce the prevalence of
behavioral and environmental factors that increasecancer risk, and we must ensure that high-qualityscreening services and evidence-based treatmentprotocols are available and accessible, particularlyto medically underserved populations.11
Information derived from population-based centralcancer registries is critical for directing effectivelocation- or population-specific cancer preventionand control programs that focus on preventingbehaviors that put people at increased risk for cancer (e.g., smoking) and on reducingenvironmental risk factors (e.g., occupationalexposure to known carcinogens). Such informationis also essential for identifying when and wherecancer-screening programs should be set up orimproved and for making long-term plans foradequate diagnostic and treatment resources.Pooled data at the national, U.S. census region, and U.S. census division levels will help federal and state public health officials establish, prioritize,and monitor national public health surveillanceinitiatives and track progress toward the nationalgoals and objectives set forth in Healthy People 2010.12
Cancer registries collect data about the occurrenceof cancer (incidence), the types of cancer that occur(morphology), the site in the body where the cancerfirst occurred (primary site), the extent of disease atthe time of diagnosis (stage), the planned first courseof treatment received by cancer patients,13,14 and theoutcome of treatment and clinical management(vital status). Cancer data are reported to statewideand metropolitan area cancer registries from avariety of medical facilities, including hospitals,physicians’ offices, radiation facilities, freestandingsurgical centers, and pathology laboratories.
Federal Programs
Surveillance, Epidemiology, and EndResults (SEER) Program
In 1971, Congress passed the National Cancer Act that mandated the collection, analysis, anddissemination of data useful for the prevention,diagnosis, and treatment of cancer.15 This mandateled to the establishment of the Surveillance,Epidemiology, and End Results (SEER) Program.16
A continuing program of the NCI, SEER consists
Technical Notes
1

of population-based cancer registries that routinelycollect data on all cancers that occur amongresidents of the participating geographic areas.Trends since 1973 in cancer incidence and patientsurvival in the United States are derived from thisdatabase.
The goals of the SEER Program are as follows:
• Assemble and report, on a periodic basis,estimates of cancer incidence, survival, andmortality in the United States.
• Monitor annual cancer incidence trends inorder to identify unusual changes in specificforms of cancer that occur in populationsubgroups, which are defined by geographicand demographic characteristics.
• Provide continuing information on trendsover time in the extent of disease atdiagnosis, trends in therapy, and associatedchanges in patient survival.
• Promote studies designed to identify factorsamenable to cancer control interventions,such as (a) environmental, occupational,socioeconomic, dietary, and health-relatedexposures; (b) screening practices, earlydetection, and treatment; and (c)determinants of length and quality of patientsurvival.
• Promote research studies measuringprogress in cancer control and etiology,including linkage of information from thebiomedical and social sciences.
• Promote specialty training in epidemiology,biostatistics, surveillance research, andtumor registry methodology, operations,and management.
• Develop new statistical methods, models,and software for the analysis andpresentation of national and small-areacancer statistics.
The SEER Program is an authoritative source ofinformation on cancer incidence and survival in theUnited States. Case ascertainment for SEER began
on January 1, 1973, in Connecticut, Hawaii, Iowa,New Mexico, and Utah and in the metropolitanareas of Detroit and San Francisco-Oakland. During1974–1975, the metropolitan area of Atlanta andthe 13-county Seattle-Puget Sound area wereadded. In 1978, 10 predominantly black ruralcounties in Georgia were added, followed in 1980by the addition of American Indians residing inArizona. Three other geographic areas participatedin the SEER Program but left the program prior to1990: New Orleans, Louisiana (1974–1977); fourcounties in New Jersey (1979–1989); and PuertoRico (1973–1989). The NCI also funds a cancerregistry that, with technical assistance from SEER,collects information on cancer cases among AlaskaNatives residing in Alaska. In 1992, the SEERProgram was expanded to increase coverage ofminority populations, especially Hispanics, byadding Los Angeles County and four counties inthe San José-Monterey area south of San Francisco.In 2001, the SEER Program further expanded itscoverage by providing additional funds to the NPCRregistries in California, Kentucky, Louisiana, andNew Jersey (see Web site http://surveillance.cancer.gov/expansion.html). Appendix F is a map of the United States that shows the location ofSEER registries. Appendix G shows the firstdiagnosis year for which data were reported to NCI for each SEER area.
The SEER Program currently collects andpublishes cancer incidence and survival data fromthese population-based cancer registries andsupplemental registries. With its recent expansionin 2001, SEER coverage increased from 14% to26% of the U.S. population (from about 39 millionto nearly 74 million people). The 2001 expansionincreased SEER coverage to 23% of AfricanAmericans, 40% of Hispanics (32% of non-MexicanHispanics), 45% of American Indians and AlaskaNatives, 53% of Asians, and 70% of NativeHawaiians and Pacific Islanders. Information onmore than 3 million in situ and invasive cancer casesis included in the SEER database, and approximately170,000 new cases are accessioned each year withinSEER catchment areas. The SEER registriesroutinely collect data on patient demographics,primary tumor site, morphology, stage at diagnosis,and first course of treatment. They also activelyfollow all patients for information on vital status(alive or dead).
United States Cancer Statistics: 1999 Incidence
2

For more information on the SEER Program, visitits Web site at http://seer.cancer.gov.
National Program of Cancer Registries (NPCR)
Recognizing the need for more complete local,state, regional, and national cancer incidence data,Congress established the National Program ofCancer Registries (NPCR) by enacting the CancerRegistries Amendment Act, Public Law 102-515, in 1992 and reauthorizing the program in 1998.17
Congress mandated the Centers for DiseaseControl and Prevention (CDC) to provide funds to states and territories to improve or enhanceexisting cancer registries; plan for and implementregistries where they did not exist; develop modellegislation and regulations for states and territoriesto enhance the viability of registry operations; setstandards for data completeness, timeliness, andquality; provide training for registry personnel; andhelp establish a computerized reporting and data-processing system. Federal funds are provided tostate and territorial health departments (or theirauthorized agencies) at a ratio of 3:1 to match statesupport for the central cancer registry.
NPCR’s goals are to rapidly establish andstandardize the reporting of cancer within andamong the states in order to build state andnational capacity to do the following:18
• Monitor the cancer burden.
• Identify cancer incidence variation forethnic groups and for regions within a state,between states, and between regions.
• Provide data for research.
• Provide guidance for health resourceallocation.
• Respond to public concern and inquiries about cancer.
• Improve planning for future health careneeds.
• Evaluate cancer prevention and controlactivities.
NPCR registries routinely collect data on patientdemographics, primary site, morphology, stage atdiagnosis, and first course of treatment. They alsoconduct passive follow-up for vital status (confirmingdeaths through linkage with state and national deathrecords).
Before NPCR was established, 10 states had nocancer registry and many states with a cancerregistry lacked the resources and legislative supportto collect needed data.19 In 1994, the first 37 statesreceived funding from CDC to participate inNPCR; 5 additional states and the District ofColumbia joined in 1995, and 3 more states and 3 territories joined in 1997.20 In 2002, CDC fundsa total of 49 statewide and territorial cancerregistries at two levels: planning for a new registryor enhancement for an existing one. Two states(South Dakota and Tennessee) and 2 territories(Palau and the Virgin Islands) receive funds to planfor and establish a registry; 43 states, 1 territory(Puerto Rico), and the District of Columbia receivefunds to enhance their cancer registries (AppendixF). NPCR registries cover 96% of the U.S.population. NPCR registries whose data for the1999 diagnosis year meet criteria for inclusion inthis report cover 73% of the U.S. population (73% of the white population, 69% of the blackpopulation, and 72% of the Hispanic population).
In 2000, CDC began the NPCR–Cancer SurveillanceSystem (NPCR–CSS) to receive, evaluate, anddisseminate data from NPCR registries. NPCR–CSSis designed to provide cancer incidence data to meetCDC’s public health surveillance responsibilities andto help monitor progress toward NPCR goals. InJanuary 2001, NPCR registries began annuallyreporting their incidence data to CDC. NPCRregistries report incidence data to CDC from theirNPCR reference year forward. The “NPCRreference year” is the first diagnosis year for which astate or territorial cancer registry collected data withthe assistance of NPCR funds. The NPCR referenceyear for each state and territory is shown in AppendixG. Data from the SEER metropolitan areas andSEER special population cancer registries operatingin Alaska, Arizona, California, Georgia, Michigan,and Washington are reported to their respectiveNPCR state cancer registry for inclusion in the state’sincidence data and are transmitted to CDC as part of the state’s annual data submission. In January 2002,
Technical Notes
3

CDC received information on more than 5.3 millioninvasive cancer cases diagnosed during 1995–1999,including more than 1.1 million invasive cancer casesdiagnosed in 1999.
For more information on NPCR, visit its Web siteat http://www.cdc.gov/cancer/npcr/.
Collaborating Partner
North American Association ofCentral Cancer Registries (NAACCR)
Both the SEER Program and NPCR work closelywith the North American Association of CentralCancer Registries (NAACCR) to promote standardsfor cancer surveillance in the United States andCanada. Established in 1987, NAACCR is anumbrella organization for population-based cancerregistries, governmental agencies, professionalassociations, and private groups in North Americainterested in improving the quality and use of cancerregistry data. The mission of NAACCR is to supportand coordinate the development, enhancement, andapplication of cancer registration techniques inpopulation-based groups in a consistent manner, so that quality data may be used for cancer controland epidemiologic research, public health programs,and patient care to reduce the burden of cancer in North America. For more information, seehttp://www.naaccr.org/about/index.html. All stateand metropolitan area registries participating inSEER and NPCR are members of NAACCR.
In 1997, NAACCR began voluntary annual reviewsof member registries to determine their ability toproduce complete, accurate, and timely data.Registries report their data to NAACCR in earlyDecember each year. NAACCR evaluates the datausing standard, objective measures and thenrecognizes those registries that meet the higheststandards for data quality.21,22 For more informationon the certification program, visit the Web site:http://www.naaccr.org/Certification/index.html.
In 1997, when NAACCR began its registrycertification program with an evaluation of 1995incidence data, 9 NPCR registries and all 10 SEERregistries were certified. In 2002, after NAACCRevaluated the 1999 incidence data, 32 NPCR
registries and all 10 SEER registries were certified.(Data from San Francisco-Oakland and San José-Monterey are combined and evaluated as theGreater Bay Area.)
For more information on NAACCR, visit its Website at http://www.naaccr.org.
Registry Eligibility Criteria Data included in this report are from statewide or metropolitan area cancer registries that havehigh quality cancer incidence data for 1999 asdemonstrated by meeting the following data qualitycriteria for all cancer sites combined:
• Case ascertainment is 90% or more complete. The registry data include at least 90% of the expected, unduplicated cases where theexpected cases are estimated by using methodsdeveloped by NAACCR.5,21–23 Because somecancer patients receive diagnostic or treatmentservices at more than one reporting facility,cancer registries perform a procedure knownas “unduplication” to ensure that each cancercase is counted only once.24
• No more than 5% of cases are ascertained solely onthe basis of a death certificate. The proportionof cases ascertained solely on the basis of adeath certificate, with no other informationon the case available after the registry hascompleted a routine procedure known as“death clearance and followback,”24–26 is one measure of the completeness of caseascertainment.
• No more than 3% of cases are missinginformation on sex.
• No more than 3% of cases are missinginformation on age.
• No more than 5% of cases are missinginformation on race.
• At least 97% of the registry’s records passed a setof single-field and inter-field computerized edits.Computerized edits are computer programsthat test the validity and logic of data
United States Cancer Statistics: 1999 Incidence
4

components. For example, if (a) a patientreceived a diagnosis of cancer in 1999, (b)the patient’s age was reported as 80 years,and (c) the patient’s year of birth was reportedas 1942, a computerized edit could, withouthuman intervention, identify these componentsas incompatible. The computerized editsapplied to the data in this report were designedby the SEER Program for use by SEERregistries. During the 1990s, these editswere expanded and incorporated intoNAACCR standards (http://www.naaccr.org/standards) and into editing softwaredesigned and maintained by CDC (http://www.cdc.gov/cancer/edits/edits.htm).
Data from 37 state cancer registries (32 NPCR and5 SEER), the District of Columbia (NPCR), and 6 SEER metropolitan areas (Atlanta, Detroit, Los Angeles, San Francisco-Oakland, San José-Monterey, and Seattle-Puget Sound) are includedin this report. In total, these registries cover 78% ofthe U.S. population (Figure 1) (78% of the U.S.white population, 72% of the U.S. black population,and 77% of the U.S. Hispanic population). AppendixH shows state-specific measures for the data qualitycriteria used to determine which registries’ datawere eligible for inclusion in this report. NPCRregistries whose data are not included in this reportwere allowed to choose whether to have their dataquality information listed in Appendix H.
Data Sources
Incidence Data
Data from registries in the SEER Program werereported to NCI as of November 1, 2001, and madeavailable through the SEER Program public usedata file, released in April 2002 (http://www.seer.cancer.gov/publicdata/). Data from the registriesparticipating in NPCR were reported to CDC as of January 31, 2002. For this report, data fromCalifornia, Kentucky, Louisiana, and New Jerseyare as reported to CDC as of January 31, 2002.
SEER and NPCR cancer registries consider asreportable all incident cases with a behavior code of2 (in situ, non-invasive) or 3 (malignant or invasive,primary site only) in the International Classification
of Diseases for Oncology, 2nd edition (ICD–O–2),27
with the exception of in situ cancer of the cervix.Basal and squamous cell carcinomas of the skin arealso excluded, with the exception of those on theskin of the genital organs.28
Both SEER and NPCR data were collected andreported by using uniform data items and codes asdocumented by NAACCR, which provides forcomparability of data items collected by the twofederal programs.14,28 All information on primarycancer sites was coded according to the ICD–O–2,27
and cancer sites listed in this publication weredefined according to SEER recodes, which definestandard groupings of primary cancer sites (AppendixI).4 In situ bladder cancers were recoded to invasivebladder cases because the data for distinguishingbetween in situ and invasive bladder cases are notalways available or reliable. Case counts and rateswere calculated for invasive cancers. The report alsoincludes counts and rates for in situ breast cancercases in females; these are reported separately and arenot included in counts or rates for the “all sites”category. Case counts and rates for leukemias werecalculated for acute and chronic lymphocyticleukemia, acute and chronic myeloid leukemia, andother leukemias. The “other leukemias” categoryincludes other lymphocytic leukemias, other myeloidleukemias, all monocytic leukemias, and all otherleukemias. Non-reportable cancers and cancers inpatients of unknown sex or age were omitted from allcalculations, but cases in patients of unknown racewere included in the “all races” category. Counts ofcases used in this report are in Appendices D and E.
Of the cases included in this report, 93.8% wereconfirmed by positive microscopic findings(histology, cytology, or unspecified microscopymethod) indicative of cancer.28 Other methods usedto confirm the diagnosis of cancer were positivelaboratory test results or markers indicative ofcancer (0.3%), direct visualization (0.2%),radiography or other imaging techniques (2.1%),and clinical diagnosis only (0.6%). For 3% of thecases, it was unknown whether the diagnosis wasmicroscopically confirmed.
Population Data
The population estimates for the denominators ofincidence rates are race- (all races, white, black) and
Technical Notes
5

sex-specific county population estimates aggregatedto the state or metropolitan area level. The countypopulation estimates incorporated into NCI’sSEER*Stat software to calculate cancer incidenceand mortality rates are available at http://www.seer.cancer.gov. The SEER*Stat population estimates are a slight modification of the annual time series ofJuly 1 county population estimates (by age, sex, race,and Hispanic origin) produced by the PopulationEstimates Program of the U.S. Bureau of the Census(Census Bureau) with support from NCI through aninteragency agreement. The Census Bureau’spopulation estimates are available on its Web site athttp://eire.census.gov/popest/data/counties.php. The procedures used by the Census Bureau toproduce its county estimates are documented athttp://www.census.gov/population/estimates/county/casrh_doc.txt. The 1999 race- and sex-specificpopulation estimates from the U.S. Bureau of theCensus, as available from SEER*Stat, are projectedestimates and did not reflect results from theenumerated 2000 census.
Specific documentation regarding modificationsmade by NCI to Census Bureau estimates is given athttp://www.seer.cancer.gov. Briefly, the modificationaffects only population estimates for Hawaii and isbased on information from the EpidemiologyProgram of the Hawaii Cancer Research Center.The modified population estimates were obtained bySEER using survey data collected by the HawaiiDepartment of Health to address concerns that theNative Hawaiian population had been undercountedin previous censuses. The “Hawaii-adjustment” to Census Bureau estimates has the net result ofreducing the estimated white population andincreasing the estimated Asian and Pacific Islanderpopulation in the state. Census Bureau estimates forthe total population, black population, and AmericanIndian and Alaska Native populations in Hawaii areunaffected.
NCI recently made an additional modification toits use of Census Bureau estimates in order tocalculate the age-specific rates needed for age-adjustment according to the 2000 U.S. standardpopulation.1,2 Prior to implementing the use of the2000 U.S. standard population, NCI used a singleage category for 0- to 4-year-olds for age adjustment.NCI currently uses Census Bureau estimates tosubdivide this age group into younger than 1 year
and 1–4 years of age. Population estimates for all agescombined, by state and SEER metropolitan area,race and sex, for 1999, are shown in Appendix J.
Statistical Methods
Incidence Rates
Crude and age-adjusted incidence rates are per100,000 population. Incidence rates are for invasivecancers and in situ female breast cancer, unlessotherwise specified. An exception is the incidencerate for cancer of the urinary bladder, whichincludes both in situ and invasive cancers. Cancerincidence rates include multiple primary cancersthat occur in single patients; for example, if apatient has more than one primary cancer, eachcancer is counted as a separate case according tostandard rules for counting multiple primarycancers.14 For cancers that occur only in one sex,such as cancers of the prostate or uterine cervix, thepopulation denominators used to calculateincidence rates are for the specific sex only.
Crude Incidence Rates
The crude incidence rates presented in this reportare the total number of new cancer cases diagnosedin 1999 in a population category of interest dividedby the at-risk population for that category,multiplied by 100,000.
Age-Adjusted Incidence Rates
Because the occurrence of many cancers increaseswith age and because the age distribution of apopulation (i.e., the number of people in particularage categories) can change over time and can bedifferent for different populations, researchers mustage-adjust incidence rates so that they can make avalid comparison between one year’s rates and thoseof another year or between one geographic area’srates and those of another area. Age-adjusting therates ensures that any differences in incidence fromone year to another or from one geographic area toanother are not actually due to differences in agedistribution.
The standard used to age-adjust the rates for thisreport was the 2000 U.S. standard population, in
United States Cancer Statistics: 1999 Incidence
6

accordance with a 1998 Department of Health andHuman Services recommendation.1,2 The 2000 U.S.standard population is based on the proportion ofthe population in specific age groups (e.g., youngerthan 1 year, 1–4 years, 5–9 years, 10–14 years, 15–19 years, . . . 85 years or older) in 2000. Theproportions of the population in these age groupsserve as weights for calculating age-adjustedincidence rates. The weights for the 2000 U.S.standard population are in Appendix K. Note thatthe 2000 U.S. standard population weights are notrace- or sex-specific, so they do not adjust fordifferences in race or sex between geographic areasor among population groups. They do, however,provide the basis for adjustment for differences inthe age distributions across groups defined by sex,race, geography, or other categories.
The 2000 U.S. standard population weights used for this report are the estimated age distribution ofthe U.S. population across 5-year age categories.29
These standard weights are used to compute age-adjusted incidence rates by the method of directstandardization as implemented in NCI SEER*Statsoftware and described as follows:3 If Ij is thenumber of incident cases diagnosed in 1999 in agecategory j, and Pj is the population size at risk in agecategory j, then the incidence rate Rj in age categoryj is defined as
If wj is the 2000 U.S. standard population weightfor age category j, then the age-adjusted (directlystandardized) incidence rate Radj is computed as
Note from the multiplier in the formula thatincidence rates are expressed as cases per 100,000population.
Confidence Intervals
Cancer registries have data included in this report if theregistry’s case ascertainment for cancers diagnosed in 1999among residents of the state or metropolitan area is atleast 90% complete.5,21–23 However, even if all theregistries were able to collect data on 100% of diagnosedcancer cases, there would still be some uncertainty incomputed cancer statistics such as crude and age-adjusted
incidence rates. This uncertainty arises because manyfactors contribute to a cancer incidence rate in any givenyear or state, and some of these factors exhibit randombehavior. For example, there is uncertainty about whethercancer will develop in an individual in any given year.Chance also plays a role in determining when a cancer isdetected and diagnosed, and when the data on that cancerare included in the registry. When large numbers of aparticular cancer are diagnosed in any given year, theeffects of chance are small relative to the large incidencerate. With rare cancers, however, the incidence rates aresmall and the chance occurrence of more or fewer cases ina given year can markedly affect the rate.
To estimate the extent of this uncertainty, a statisticalframework known as superpopulation sampling isapplied. Under this framework, the observed cancercases are but one outcome among many outcomesthat could have occurred as a result of an underlyingrandom process. In general, in superpopulationmodeling, certain features of the mechanism thoughtto have generated the observed data are specified.30
The standard superpopulation model used for ratesfor vital statistics is the Poisson process,31 whichassigns to rare events more uncertainty relative to the size of the rate than it does to common events.The population risk profile is posited to influencethe underlying Poisson process from which ratesarise, and only a single realization of that process is observed. Parameters are estimated for theunderlying disease process. In the current report, a single parameter is estimated to represent theincidence rate and its variability. However, thePoisson model is capable of estimating separateparameters that represent contributions to the ratefrom various population risk factors, the effects ofcancer control interventions, and other attributesof the population risk profile in any particular year.
The range of plausible underlying disease rates thatmay have generated the observed rate is expressedthrough a confidence interval. For this report, we usedconfidence intervals that are expected to include thetrue underlying rate 95% of the time. Confidenceintervals in this report were computed by usingSEER*Stat Version 4.2 software and are based on the gamma method.32 These gamma intervals areapproximations to exact Poisson confidence intervals.The gamma method performs better than othermethods, especially for small incidence rates or forpopulations with age distributions that differ from the
Technical Notes
7
Rj = —Ij
Pj
Radj = ∑ wj Rj x 100,000j

standard age distribution. Various factors such aspopulation heterogeneity can sometimes lead to“extra-Poisson” variation in which the rates are morevariable than would be predicted by a Poisson model.No attempt was made to correct for this. In addition,as discussed in “Interpreting the Data,” the confidenceintervals do not account for systematic (i.e., non-random) biases in the incidence rates.
Users of this report who want to know if thedifferences between the incidence rates of variousgroups are statistically significant may considerexamining whether the confidence intervals overlap.The use of overlapping confidence intervals to testfor statistically significant differences between twoincidence rates is not advised because the practicemore frequently fails to detect significant differencesthan does standard hypothesis testing.33 Anotherconsideration when comparing differences betweenrates is public health importance. For some rates inthis report, numerators and denominators are largeand standard errors are therefore small, with theresult that some statistically significant differencesmay be so small as to lack importance, especially forpopulation-based public health program decisions.
Suppression of Incidence Rates and Case Counts
When the numbers of cases used to computeincidence rates are small, those rates tend to have poor reliability.31 Therefore, to discouragemisinterpretation and misuse of rates or counts thatare unstable because of the small numbers of cases,incidence rates and case counts are not shown intables and figures if the case counts are less than 16. A case count of less than approximately 16results in a standard error of the incidence rate that is approximately 25% or more as large as theincidence rate itself. Equivalently, a case count ofless than approximately 16 results in the width ofthe 95% confidence interval around the rate beingat least as large as the rate itself. These relationshipswere derived under the assumption of a Poissonprocess and with the standard population agedistribution close to the observed population agedistribution.
Another important reason for employing a cellsuppression threshold value is to protect theconfidentiality of patients whose data are included
in a report by reducing or eliminating the risk of identity disclosure.34,35 The cell suppressionthreshold value of 16, which was selected to reducemisuse and misinterpretation of unstable rates andcounts in this report, is more than sufficient toprotect patient confidentiality given the low levelof geographic and clinical detail provided in thereport.36
Because the incidence rates shown in the state-,sex-, and race-specific bar graphs in Figures 3.1through 3.44 do not contain confidence intervals to indicate their reliability, we applied a datasuppression criterion in addition to the thresholdvalue of 16 cases: in these figures, incidence ratesare not ranked or shown for any population groupsof less than 50,000 persons.
Inclusion of Incidence Rates and Counts for U.S. Census Regions and Divisions
Rates for U.S. census regions and divisions werecalculated by aggregating data reported from thestates in each region and division. Only data fromstate registries that met the criteria for inclusionin this report (see “Registry Eligibility Criteria”)were included in calculations of rates for U.S.census regions and divisions. There is a potentialfor bias in the rates for census regions anddivisions where data for some states wereexcluded. We considered the extent of potentialbias in regions or divisions with incomplete dataand made the following determination: in thisreport, incidence rates for U.S. census regions anddivisions are reported only if (1) at least 78% ofthe population is covered by cancer registries thatmeet the criteria for inclusion in this report and(2) 95% confidence intervals around the observedage-adjusted region or division incidence rates foreach of four major cancer sites (female breast,male prostate, male and female colorectal, maleand female lung and bronchus) for the region ordivision include estimated “bias-corrected” regionor division rates (see Appendix L) for each ofthose cancer sites.
On the basis of these analyses, the observed ratesfor the following census regions or divisions arepublished in this report: the Northeast region andthe New England and Middle Atlantic divisions;
United States Cancer Statistics: 1999 Incidence
8
the Midwest region and the West North Centraldivision; and the West region and the Pacificdivision.
Case counts for U.S. census regions and divisionsare in Appendix E if all state cancer registries in theregion or division met the criteria for inclusion inthis report, with the following exception: the regionor division count is suppressed if the count forexactly one state in the region or division issuppressed due to a count of less than 16.
Inclusion of Incidence Rates andCounts for the United States
Cancer incidence rates for the United States, asshown in Tables 1.1 through 1.4 and in one row ofTables 2.2.2 through 2.25.2, are aggregate ratesbased on more than 1 million cancer cases reportedfrom central cancer registries in 37 states, 6metropolitan areas, and the District of Columbia,geographic areas in which approximately 78% of the U.S. population resides. The U.S. rates inthis report did not meet the statistical criteria forinclusion that were applied to rates and counts forU.S. census regions and divisions (see “Inclusionof Incidence Rates and Counts for U.S. CensusRegions and Divisions”).
Case counts for the U.S. rates for all ages combinedare in Appendix D. The U.S. case counts areprovided only to allow readers the opportunity toverify the crude rates by recalculation. Readers arecautioned that the U.S. counts in this report are not estimates of the number of cancer cases thatoccurred or that were reported during 1999 in theentire United States. In addition, because the 22%of the U.S. population that is not covered by registries whose data are in this report may differ in important ways from the 78% of the U.S.population that is covered, it should not be assumedthat these counts represent 78% of the cancer casesthat occurred or were reported during 1999 in the entire United States.
Interpreting the DataBoth crude and age-adjusted incidence rates arepresented in this report. Crude rates are helpful in determining the need for services for a given
population, relative to another population,regardless of size. Crude rates are influenced by the underlying age distribution of the state’spopulation. Even if two states have the same age-adjusted rates, the state with the relatively olderpopulation (as demonstrated by having a highermedian age) will have higher crude rates becauseincidence rates for most cancers increase withincreasing age. A table of the median age of eachstate’s population is in Appendix M to help with theinterpretation of the crude rates. Ideally, crude,age-adjusted, and age-specific rates are used inplanning for population-based cancer preventionand control interventions.2
Published age-adjusted cancer incidence rates fordiagnosis years before 1999 were calculated byusing the 1970 U.S. standard population. Beginningwith the first publication of data for the 1999diagnosis year, cancer incidence rates are age-adjusted to the 2000 U.S. standard population.This change conforms to Department of Healthand Human Services policy for reporting death and disease rates.1,2 This policy was motivated by a need to standardize age-adjustment proceduresacross government agencies.1 The change from the 1970 to the 2000 U.S. standard updates thecalculation of age-adjusted rates to more closelyreflect the current age distribution of the U.S.population and the current burden of cancer. Dueto the aging of the U.S. population, the 2000 U.S.standard population gives more weight to older age categories than did the 1970 standardpopulation.2,9,37 Appendix K compares thedifferences in age distributions between the 1970 and the 2000 U.S. standard populations.
Because cancer incidence increases with age, thechange to the 2000 U.S. standard populationresults in higher incidence rates for most cancers.Therefore, caution should be used when comparingthe data published here with previously publishedcancer incidence rates adjusted to standardpopulations other than the 2000 U.S. standardpopulation.
There are other reasons to use caution wheninterpreting these data. Data quality is routinelyevaluated by the SEER Program and NPCR.20,38
This evaluation includes (1) re-abstracting and re-coding studies and (2) casefinding studies, both of
Technical Notes
9

which are conducted with registries from time totime to provide information on errors in the dataand data completeness. Even though the cancerregistries whose data are included in this reportmet data quality criteria for all invasive sitescombined, the completeness and quality of site-specific data may vary. The observed rates mayhave been influenced by differences in thetimeliness, completeness, and accuracy of the datafrom one registry to another, from one reportingperiod to another, and from one primary cancersite to another.
Completeness and accuracy of the data may alsobe affected by the time interval allowed forreporting data to the two federal programs. Forthis reason, the completeness and accuracy ofdata on specific cancer sites may vary. For thisreport of 1999 data, the SEER and NPCR timeinterval for reporting data differed by 3 months.NCI (SEER) allowed an interval of 22 monthsafter the close of the diagnosis year (datasubmission November 1, 2001) and CDC(NPCR) allowed an interval of 25 months afterthe close of the diagnosis year (data submissionJanuary 31, 2002).
Delays in reporting of cancer cases can affecttimely and accurate calculation of cancer incidencerates.39 Cases are reported continuously tostatewide and metropolitan area cancer registries in accordance with statutory and contractualreporting requirements. After the initial submissionof the most recent year’s data to the federal fundingagency, cancer registries continue to revise andupdate their data on the basis of new informationreceived. Therefore, some 1999 cancer cases willhave been reported to statewide and metropolitanarea cancer registries after these registriessubmitted their 1999 data to either NCI or CDC.For this reason, incidence rates and case countsreported directly by statewide or metropolitan areacancer registries may differ from those included inthis publication. Reporting delays appear to bemore of a problem for cancers that are usuallydiagnosed and treated in nonhospital settings such as physician offices (e.g., prostate cancer,melanoma of the skin). Methods to adjust incidencerates for reporting delay exist39 but were notapplied to the data in the current report.
Incidence rates are also influenced by the choice ofpopulation files. As described in “PopulationData,” the denominators for our incidence rateswere race- and sex-specific population estimatesthat were projected from the 1990 census. Becausesome state health departments use customized statepopulation projections in calculating incidencerates, the rates published in this report may differslightly from those published by individual states.
Rates in this report are for cancer cases diagnosedin 1999, the year just before the 2000 decennialcensus. When the final detailed race-specific datafrom the enumerated 2000 census are available,they will be used with the 1990 census data toprovide intercensal race-specific populationestimates for 1999 (expected in 2003), which willbe more accurate than the projected 1999populations used in this report. Preliminary 2000census results indicate that there are sizabledifferences with some of the projected populationestimates. The problems appear to be more acutefor smaller geographic areas and populations withlimited numbers of people. Specifically, in somemetropolitan areas the projected 1999 black population variesconsiderably from the enumerated 2000 censuscounts. For example, the 1999 populations forblacks in one SEER metropolitan area appear to differ from the 2000 census counts by more than 20%, and rates based on projected versuspreliminary local intercensal (incorporating 2000census data) estimates differed by approximately19%. We anticipate that cancer incidence rates,and in fact all population-based data that used race-specific 1999 projected estimates for populationdenominators, may need to be adjusted after the 2000 census data are final. The adjustmentsmay result not only in different rates but also indifferent relationships between rates in geographicareas and among different populations.
There is yet another reason for caution wheninterpreting incidence rates based on projected1999 population counts. For the 2000 census,respondents for the first time were given theopportunity to identify themselves as being of morethan one race. Studies are in progress to determinethe appropriate corrections needed to adjust forthis change in procedures for collecting census dataon race.40
United States Cancer Statistics: 1999 Incidence
10

Rates for populations according to Hispanicethnicity and racial populations other than blackand white are not included in this report. Stateswith a high proportion of Hispanics may havedifferent incidence patterns than states with a low proportion of Hispanics. Data collectionprocedures for identifying specific racial and ethnicpopulations vary widely from registry to registry.41
Further study of the quality of data on race andethnicity is ongoing; we expect that future UnitedStates Cancer Statistics reports will have cancerstatistics on Hispanics and other ethnic and racialpopulations.
Rates for a census region or division, or thecountry as a whole, may not have met thestatistical criteria for inclusion due to bias. This bias arises if, within the region, division, or country, the sub-area for which data areavailable has rates that are substantially differentfrom the rates in the sub-area for which data arenot available. Merely increasing the coverage maynot reduce bias unless the covered area is similarto the missing area in terms of cancer rates orproportions. It is possible to have some bias even if the percentage of coverage is high and millionsof cases are recorded. As the proportion of theU.S. population covered by cancer registries withhigh quality data approaches 100% and thecovered area becomes more representative of theentire country, the reported U.S. rate is expectedto move closer to a true U.S. rate.
Geographic variation in cancer incidence rates maybe the result of regional differences in the exposureof the population to known or unknown riskfactors.42–44 A comparison of incidence rates basedon data from all SEER registries combined andfrom all NPCR registries combined revealed thatthe two federal programs had different cancerincidence rates. NPCR reported higher incidencerates for tobacco-related cancers and for coloncancer than did SEER. The relationship wasreversed for melanoma, prostate cancer, femalebreast cancer, and cancers that are more commonamong Asian and Pacific Islander populations (e.g.,stomach cancer and cancer of the liver andintrahepatic bile duct). The rates for cancer sitesclassified as ill-defined were higher in NPCR thanin SEER. These registry program differences mayarise from differences in socio-demographic
population characteristics (e.g., age, race andethnicity, geographic region, urban or ruralresidence), screening use, health behaviors (e.g.,using tobacco, eating poorly, not engaging inregular physical activity), exposure to cancer-causing agents, or registry operations factors (e.g.,completeness, timeliness, specificity in codingcancer site). Methodologic work is under way toinvestigate variability associated with known factorsthat affect cancer rates and risks by using model-based statistical techniques and other approachesfor surveillance research. Studies are also inprogress to evaluate differences in registryoperations. Work continues to ensure the reportingof high-quality data.
References1. Anderson RN, Rosenberg HM. Report of the
second workshop on age adjustment. In: Vitaland Health Statistics, vol. 4, no. 30. Hyattsville(MD): National Center for Health Statistics;1998. HHS Publication No. (PHS) 99-1467.
2. Anderson RN, Rosenberg HM. Agestandardization of death rates: implementation of the year 2000 standard. In: National VitalStatistics Reports, vol. 47, no. 3. Hyattsville (MD):National Center for Health Statistics; 1998. HHS Publication No. (PHS) 99-1120.
3. Breslow NE, Day NE, Heseltine E, editors.Statistical Methods in Cancer Research: vol. II: The Design and Analysis of Cohort Studies. Lyon(France): International Agency for CancerResearch; 1987. IARC scientific publication No. 82.
4. Ries LAG, Eisner MP, Kosary CL, Hankey BF,Miller BA, Clegg L, Edwards BK, editors.SEER Cancer Statistics Review, 1973-1999.Bethesda (MD): National Cancer Institute;2002. Also available from: URL: http://www.seer.cancer.gov/csr/1973_1999 [accessed 2002,Jun 14].
Technical Notes
11

5. Wu XC, Hotes JL, Fulton PJ, Cormier M,Correa CN, McLaughlin CC, Kosary C, HoweHL, Chen VW, editors. Cancer in NorthAmerica, 1995-1999: vol. 1: Incidence.Springfield (IL): North American Associationof Central Cancer Registries; 2002.
6. American Cancer Society. Cancer Facts andFigures 2002. Atlanta (GA): American CancerSociety; 2002. Also available from: URL:http://www.cancer.org [accessed 2002, Jun 17].
7. Centers for Disease Control and Prevention(CDC). The Burden of Chronic Diseases and TheirRisk Factors: National and State Perspectives.Atlanta (GA): CDC; 2002.
8. Jemal A, Thomas A, Murray T, Thun M.Cancer statistics 2002. CA: A Cancer Journal for Clinicians 2002;52:23-47.
9. Edwards BK, Howe HL, Ries LAG, Thun MJ,Rosenberg HM, Yancik R, Wingo PA, Jemal A,Feigal EG. Annual report to the nation on thestatus of cancer, 1973-1999: featuringimplications of age and aging on U.S. cancerburden. Cancer 2002; 94:2766-2792.
10. National Heart, Lung, and Blood Institute(NHLBI). Fact Book, Fiscal Year 2001. Bethesda(MD): NHLBI; 2001
11. Haynes MA, Smedley BD, editors. The UnequalBurden of Cancer: An Assessment of NIH Researchand Programs for Ethnic Minorities and theMedically Underserved. Washington (DC):National Academy Press; 1999.
12. Department of Health and Human Services.Healthy People 2010, 2nd ed. with Understandingand Improving Health and Objectives forImproving Health. 2 vols. Washington (DC):U.S. Government Printing Office; 2000.
13. American College of Surgeons Commission onCancer. Standards of the Commission on Cancer:vol. II: Registry Operations and Data Standards(ROADS). Chicago (IL): American College ofSurgeons Commission on Cancer; 1996,revised 1998.
14. SEER (Surveillance, Epidemiology, and EndResults Program). The SEER Program CodeManual. 3rd ed. Bethesda (MD): NationalCancer Institute; 1998. NIH Publication No.98-1999.
15. The National Cancer Act of 1971, Pub. L. 92-218, 85 Stat. 1828 (Dec. 23, 1971). Availablefrom: URL: http://www3.cancer.gov/legis/1971canc.html [accessed 2002, Aug 8].
16. Hankey BF, Ries LA, Edwards BK. TheSurveillance, Epidemiology, and End ResultsProgram: a national resource. CancerEpidemiology, Biomarkers and Prevention1999;8(12):1117-1121.
17. Cancer Registries Amendment Act, Pub. L.102-515, 106 Stat. 3372 (Oct. 24, 1992). Alsoavailable from: URL: http://www.cdc.gov/cancer/npcr/npcrpdfs/publaw.pdf [accessed2002, Jun 14].
18. Centers for Disease Control and Prevention(CDC). Program Announcement #00027,National Program of Cancer Registries. Atlanta(GA): CDC; 1999.
19. State cancer registries: status of authorizinglegislation and enabling regulations—UnitedStates, October 1993. MMWR 1994;43(4):71-75.
20. Hutton MD, Simpson LD, Miller DS, WeirHK, McDavid K, Hall HI. Progress towardnationwide cancer surveillance: an evaluation of the National Program of Cancer Registries,1994-1999. Journal of Registry Management2001;28(3):113-120.
21. Tucker TC, Howe HL, Weir HK. Certificationof population-based cancer registries. Journal ofRegistry Management 1999; 26(1):24-27.
22. Tucker TC, Howe HL. Measuring the qualityof central cancer registries: the NAACCRperspective. Journal of Registry Management2001;28:41-44.
United States Cancer Statistics: 1999 Incidence
12

23. Howe HL. Conclusions of the Workgroup for HighQuality Criteria for Data Use: The NAACCRNarrative. Springfield (IL): North AmericanAssociation of Central Cancer Registries; 2001.
24. North American Association of Central CancerRegistries (NAACCR). Standards for CancerRegistries: vol. III: Standards for Completeness,Quality, Analysis and Management of Data.Springfield (IL): NAACCR; 2000.
25. Menck HR, West DW. Central cancerregistries. In: Hutchison CL, Roffers SD, FritzAG. Cancer Registry Management: Principles andPractice. Lenexa (KS): National CancerRegistrars Association; 1997. p. 395-422.
26. Seiffert JE, Hoyler SS, McKeen K, Potts M.Casefinding, abstracting, and death clearance.In: Menck H, Smart C, editors. Central CancerRegistries: Design, Management, and Use. Chur(Switzerland): Harwood Academic Publishers;1994. p. 35-63.
27. Percy C, Van Holten V, Muir C, editors.International Classification of Diseases forOncology. 2nd ed. Geneva (Switzerland): WorldHealth Organization; 1990.
28. Hultstrom D, editor. Standards for CancerRegistries: vol. II: Data Standards and DataDictionary, version 9.1. 6th ed. Springfield (IL):North American Association of Central CancerRegistries; 2001.
29. Klein RJ, Schoenborn CA. Age adjustmentusing the 2000 projected U.S. population.Healthy People Statistical Notes, no. 20.Hyattsville (MD): National Center for HealthStatistics; 2001.
30. Sarndal C-E, Swensson B, Wretman J. Model-Assisted Survey Sampling. New York: Springer-Verlag; 1992, p. 22.
31. Brillinger DR. The natural variability of vitalrates and associated statistics (with discussion).Biometrics 1986;42:693-734.
32. Fay MP, Feuer EJ. Confidence intervals fordirectly standardized rates: a method based onthe gamma distribution. Statistics in Medicine1997;16:791-801.
33. Schenker N, Gentleman JF. On judging thesignificance of differences by examining theoverlap between confidence intervals. TheAmerican Statistician 2001;55(3):182-186.
34. Doyle P, Lane JI, Theeuwes JM, Zayatz LM,editors. Confidentiality, Disclosure, and DataAccess: Theory and Practical Application forStatistical Agencies. Amsterdam (Holland):Elsevier Science; 2001.
35. Federal Committee on Statistical Methodology.Report on Statistical Disclosure LimitationMethodology (statistical working paper 22).Washington (DC): Office of Management andBudget; 1994. Available from: URL: http://www.fcsm.gov/working-papers/wp22.html [accessed2002, Aug 15].
36. National Center for Health Statistics (NCHS).NCHS Staff Manual on Confidentiality. Hyattsville(MD): NCHS; 1997. HHS Publication No.(PHS) 84-1244.
37. Hoyert DL, Arias E, Smith BL, Murphy SL,Kochanek KD. Deaths: final data for 1999.National Vital Statistics Reports, vol. 49, no.8.Hyattsville (MD): National Center for HealthStatistics; 2001.
38. Fritz A. The SEER Program’s commitment todata quality. Journal of Registry Management2001;28(1):35-40.
39. Clegg, LX, Midthune DN, Feuer EJ, Fay MP,Hankey BF. Cancer incidence rates adjusted forreporting delay. In: Ries LAG, Eisner MP,Kosary CL, Hankey BF, Miller BA, Clegg L,Edwards BK, editors. SEER Cancer StatisticsReview, 1973-1997. Bethesda (MD): NationalCancer Institute; 2000. p. 483-489. Availablefrom: URL: http://seer.cancer.gov/csr/1973_1997/delay.pdf [accessed 2002, Jun 14].
Technical Notes
13
40. Sondik EJ, Lucas JW, Madans JH, Smith SS.Race/ethnicity and the 2000 census:implications for public health. American Journalof Public Health 2000;90(11):1709-1713.
41. O’Malley C, Hu K, West D. North AmericanAssociation of Central Cancer Registries: Race andEthnicity Identifier Assessment Project. Springfield(IL): North American Association of CentralCancer Registries; 2002. p. 2-55. Availablefrom: URL: http://www.naaccr.org/stats/EpiReports.html [accessed 2002, May 15].
42. Centers for Disease Control and Prevention(CDC). Behavioral Risk Factor Surveillance SystemUser’s Guide. Atlanta (GA): CDC; 1998. Alsoavailable from: URL: http://www.cdc.gov/brfss.
43. Devesa SS, Grauman DJ, Blot WJ, PennelloGA, Hoover RN, Fraumeni JF. Atlas of CancerMortality in the United States, 1950-1994.Bethesda (MD): National Cancer Institute;1999. NIH Publication No. 99-4564.
44. Howe HL, Keller JE, Lehnherr M. Relationbetween population density and cancerincidence, Illinois, 1986-1990. American Journalof Epidemiology 1993;138:29-36.
United States Cancer Statistics: 1999 Incidence
14
Cancer Incidence: All Areas Combined


Cancer Incidence: A
ll Areas C
ombined15

United States C
ancer Statistics: 1999 Incidence
16
Table 1.1: Invasive Cancer Incidence Rates by Primary Site and Race (All Races, White, Black),United States: SEER and NPCR Registries That Meet Quality Criteria∗†
Males, 1999
All Races White BlackAge-Adjusted Crude Age-Adjusted Crude Age-Adjusted Crude
Primary Site Rate‡§ (CI) Rate‡ (CI) Rate‡§ (CI) Rate‡ (CI) Rate‡§ (CI) Rate‡ (CI)
All Sites 552.3 (550.8-553.9) 498.2 (496.9-499.6) 542.0 (540.4-543.6) 519.5 (518.0-521.0) 617.4 (611.6-623.3) 389.4 (385.9-393.0)
Oral Cavity and Pharynx 15.8 ( 15.5- 16.0) 14.6 ( 14.4- 14.8) 15.2 ( 15.0- 15.5) 14.9 ( 14.6- 15.1) 19.2 ( 18.3- 20.2) 13.6 ( 12.9- 14.2)
Lip 1.6 ( 1.5- 1.6) 1.4 ( 1.3- 1.5) 1.7 ( 1.6- 1.8) 1.6 ( 1.5- 1.7) ∼ ∼Tongue 3.8 ( 3.7- 3.9) 3.5 ( 3.4- 3.7) 3.8 ( 3.7- 3.9) 3.7 ( 3.6- 3.8) 4.0 ( 3.6- 4.5) 2.9 ( 2.6- 3.2)
Salivary Gland 1.5 ( 1.4- 1.6) 1.4 ( 1.3- 1.4) 1.5 ( 1.5- 1.6) 1.5 ( 1.4- 1.5) 1.2 ( 0.9- 1.4) 0.8 ( 0.6- 1.0)
Floor of Mouth 1.2 ( 1.1- 1.2) 1.1 ( 1.0- 1.2) 1.1 ( 1.1- 1.2) 1.1 ( 1.1- 1.2) 1.7 ( 1.4- 2.0) 1.2 ( 1.0- 1.4)
Gum and Other Mouth 2.1 ( 2.0- 2.2) 1.9 ( 1.8- 2.0) 2.0 ( 1.9- 2.1) 1.9 ( 1.8- 2.0) 2.9 ( 2.5- 3.3) 2.0 ( 1.8- 2.3)
Nasopharynx 0.8 ( 0.8- 0.9) 0.8 ( 0.8- 0.9) 0.6 ( 0.6- 0.7) 0.6 ( 0.6- 0.7) 1.0 ( 0.8- 1.3) 0.8 ( 0.7- 1.0)
Tonsil 2.1 ( 2.0- 2.2) 2.0 ( 1.9- 2.1) 2.1 ( 2.0- 2.2) 2.1 ( 2.0- 2.2) 2.9 ( 2.6- 3.3) 2.1 ( 1.8- 2.4)
Oropharynx 0.6 ( 0.6- 0.7) 0.6 ( 0.5- 0.6) 0.6 ( 0.5- 0.6) 0.5 ( 0.5- 0.6) 1.5 ( 1.2- 1.8) 1.0 ( 0.8- 1.2)
Hypopharynx 1.5 ( 1.4- 1.6) 1.4 ( 1.3- 1.4) 1.3 ( 1.3- 1.4) 1.3 ( 1.2- 1.4) 2.9 ( 2.5- 3.3) 1.9 ( 1.7- 2.2)
Other Oral Cavity and Pharynx 0.6 ( 0.5- 0.6) 0.5 ( 0.5- 0.6) 0.5 ( 0.5- 0.6) 0.5 ( 0.5- 0.6) 1.1 ( 0.9- 1.4) 0.7 ( 0.6- 0.9)
Digestive System 112.0 (111.3-112.7) 99.3 ( 98.7- 99.9) 108.9 (108.2-109.6) 102.9 (102.2-103.6) 130.6 (127.9-133.3) 80.3 ( 78.7- 81.9)
Esophagus 8.8 ( 8.6- 8.9) 7.9 ( 7.8- 8.1) 8.4 ( 8.2- 8.6) 8.1 ( 7.9- 8.3) 13.0 ( 12.2- 13.9) 8.3 ( 7.8- 8.8)
Stomach 11.0 ( 10.8- 11.3) 9.7 ( 9.5- 9.9) 10.0 ( 9.8- 10.2) 9.4 ( 9.2- 9.6) 17.5 ( 16.5- 18.6) 10.3 ( 9.7- 10.9)
Small Intestine 2.0 ( 1.9- 2.1) 1.8 ( 1.7- 1.9) 1.9 ( 1.8- 2.0) 1.8 ( 1.7- 1.9) 3.0 ( 2.6- 3.5) 1.9 ( 1.6- 2.1)
Colon and Rectum 66.4 ( 65.9- 66.9) 58.6 ( 58.1- 59.0) 66.0 ( 65.4- 66.5) 62.1 ( 61.6- 62.6) 67.9 ( 65.9- 69.9) 41.2 ( 40.0- 42.3)
Colon excluding Rectum 46.9 ( 46.4- 47.3) 41.0 ( 40.6- 41.4) 46.3 ( 45.8- 46.8) 43.3 ( 42.8- 43.7) 52.0 ( 50.2- 53.7) 31.0 ( 30.0- 32.0)
Rectum and Rectosigmoid Junction 19.5 ( 19.2- 19.8) 17.6 ( 17.3- 17.8) 19.6 ( 19.3- 20.0) 18.8 ( 18.5- 19.1) 15.9 ( 15.0- 16.9) 10.2 ( 9.6- 10.8)
Anus, Anal Canal and Anorectum 1.2 ( 1.1- 1.2) 1.1 ( 1.0- 1.1) 1.2 ( 1.1- 1.2) 1.1 ( 1.0- 1.2) 1.3 ( 1.1- 1.6) 1.0 ( 0.8- 1.2)
Liver and Intrahepatic Bile Duct 7.0 ( 6.9- 7.2) 6.4 ( 6.3- 6.6) 6.1 ( 5.9- 6.3) 5.9 ( 5.7- 6.0) 9.6 ( 8.9- 10.4) 6.5 ( 6.1- 7.0)
Gallbladder 0.8 ( 0.7- 0.9) 0.7 ( 0.6- 0.7) 0.8 ( 0.7- 0.8) 0.7 ( 0.7- 0.8) 0.9 ( 0.7- 1.2) 0.5 ( 0.4- 0.6)
Other Biliary 1.6 ( 1.5- 1.6) 1.4 ( 1.3- 1.4) 1.6 ( 1.5- 1.6) 1.4 ( 1.4- 1.5) 1.2 ( 1.0- 1.5) 0.8 ( 0.6- 0.9)
Pancreas 12.3 ( 12.0- 12.5) 10.9 ( 10.7- 11.1) 12.1 ( 11.8- 12.3) 11.4 ( 11.2- 11.7) 15.2 ( 14.3- 16.2) 9.4 ( 8.8- 9.9)
Retroperitoneum 0.4 ( 0.4- 0.5) 0.4 ( 0.4- 0.4) 0.4 ( 0.4- 0.5) 0.4 ( 0.4- 0.5) 0.4 ( 0.3- 0.6) 0.3 ( 0.2- 0.4)
Peritoneum, Omentum and Mesentery 0.2 ( 0.2- 0.2) 0.2 ( 0.2- 0.2) 0.2 ( 0.2- 0.2) 0.2 ( 0.2- 0.2) ∼ ∼Other Digestive Organs 0.3 ( 0.3- 0.4) 0.3 ( 0.2- 0.3) 0.3 ( 0.3- 0.4) 0.3 ( 0.3- 0.3) 0.3 ( 0.2- 0.5) 0.2 ( 0.1- 0.3)
Respiratory System 100.0 ( 99.3-100.6) 90.0 ( 89.4- 90.5) 98.5 ( 97.8- 99.1) 94.5 ( 93.8- 95.1) 125.0 (122.3-127.6) 78.0 ( 76.5- 79.6)
Nose, Nasal Cavity and Middle Ear 0.8 ( 0.8- 0.9) 0.8 ( 0.7- 0.8) 0.8 ( 0.8- 0.9) 0.8 ( 0.7- 0.9) 1.0 ( 0.7- 1.2) 0.7 ( 0.5- 0.8)
Larynx 7.9 ( 7.7- 8.1) 7.3 ( 7.1- 7.4) 7.6 ( 7.4- 7.8) 7.4 ( 7.2- 7.6) 12.1 ( 11.3- 12.9) 7.9 ( 7.4- 8.4)
Lung and Bronchus 89.1 ( 88.5- 89.7) 80.0 ( 79.5- 80.6) 87.8 ( 87.2- 88.5) 84.2 ( 83.6- 84.8) 110.7 (108.3-113.3) 68.7 ( 67.2- 70.2)
Pleura 1.8 ( 1.7- 1.9) 1.6 ( 1.5- 1.7) 1.9 ( 1.8- 2.0) 1.8 ( 1.7- 1.9) 0.8 ( 0.6- 1.1) 0.5 ( 0.4- 0.6)
Trachea and Other Respiratory Organs 0.3 ( 0.3- 0.4) 0.3 ( 0.3- 0.3) 0.3 ( 0.3- 0.4) 0.3 ( 0.3- 0.4) 0.4 ( 0.2- 0.5) 0.3 ( 0.2- 0.4)
Bones and Joints 1.1 ( 1.0- 1.1) 1.0 ( 1.0- 1.1) 1.1 ( 1.0- 1.2) 1.1 ( 1.0- 1.1) 0.8 ( 0.6- 1.0) 0.8 ( 0.6- 1.0)
Soft Tissue including Heart 3.3 ( 3.2- 3.5) 3.1 ( 3.0- 3.2) 3.3 ( 3.1- 3.4) 3.2 ( 3.0- 3.3) 3.6 ( 3.2- 4.0) 2.8 ( 2.5- 3.1)
Skin excluding Basal and Squamous 21.5 ( 21.2- 21.8) 19.8 ( 19.5- 20.1) 22.8 ( 22.5- 23.2) 22.1 ( 21.8- 22.4) 4.1 ( 3.7- 4.5) 3.3 ( 3.0- 3.6)
Melanomas of the Skin 19.0 ( 18.7- 19.3) 17.6 ( 17.3- 17.8) 20.5 ( 20.2- 20.8) 19.9 ( 19.6- 20.2) 1.2 ( 1.0- 1.5) 0.8 ( 0.6- 1.0)
Other Non-Epithelial Skin 2.5 ( 2.4- 2.6) 2.3 ( 2.2- 2.4) 2.3 ( 2.2- 2.4) 2.2 ( 2.1- 2.3) 2.9 ( 2.5- 3.3) 2.5 ( 2.2- 2.8)
Breast 1.5 ( 1.4- 1.6) 1.4 ( 1.3- 1.4) 1.5 ( 1.4- 1.5) 1.4 ( 1.3- 1.5) 2.1 ( 1.8- 2.5) 1.3 ( 1.1- 1.5)
Male Genital System 168.6 (167.7-169.4) 153.1 (152.3-153.8) 159.6 (158.7-160.4) 154.4 (153.6-155.3) 231.6 (228.0-235.2) 142.5 (140.4-144.7)
Prostate 162.0 (161.2-162.8) 146.5 (145.8-147.2) 152.3 (151.5-153.2) 147.1 (146.3-148.0) 229.3 (225.7-232.9) 140.6 (138.5-142.7)
Testis 5.5 ( 5.3- 5.6) 5.6 ( 5.5- 5.8) 6.2 ( 6.0- 6.3) 6.3 ( 6.1- 6.5) 1.4 ( 1.1- 1.6) 1.3 ( 1.1- 1.5)
Penis 0.9 ( 0.8- 0.9) 0.8 ( 0.7- 0.8) 0.8 ( 0.8- 0.9) 0.8 ( 0.7- 0.9) 0.7 ( 0.5- 0.9) 0.4 ( 0.3- 0.6)
Other Male Genital Organs 0.2 ( 0.2- 0.3) 0.2 ( 0.2- 0.2) 0.2 ( 0.2- 0.2) 0.2 ( 0.2- 0.2) 0.2 ( 0.1- 0.4) 0.2 ( 0.1- 0.3)
continued

Cancer Incidence: A
ll Areas C
ombined17
Table 1.1: Invasive Cancer Incidence Rates by Primary Site and Race (All Races, White, Black),United States: SEER and NPCR Registries That Meet Quality Criteria∗† (continued)
Males, 1999
All Races White BlackAge-Adjusted Crude Age-Adjusted Crude Age-Adjusted Crude
Primary Site Rate‡§ (CI) Rate‡ (CI) Rate‡§ (CI) Rate‡ (CI) Rate‡§ (CI) Rate‡ (CI)
Urinary System 55.7 ( 55.2- 56.2) 49.4 ( 48.9- 49.8) 57.7 ( 57.2- 58.3) 54.7 ( 54.2- 55.2) 35.0 ( 33.6- 36.5) 21.3 ( 20.5- 22.2)
Urinary Bladder‖ 38.3 ( 37.9- 38.7) 33.5 ( 33.2- 33.9) 40.2 ( 39.8- 40.7) 37.7 ( 37.3- 38.1) 17.9 ( 16.9- 19.0) 10.0 ( 9.5- 10.6)
Kidney and Renal Pelvis 16.0 ( 15.8- 16.3) 14.7 ( 14.5- 14.9) 16.1 ( 15.8- 16.4) 15.6 ( 15.4- 15.9) 16.3 ( 15.4- 17.3) 10.9 ( 10.3- 11.5)
Ureter 0.9 ( 0.8- 0.9) 0.8 ( 0.7- 0.8) 0.9 ( 0.8- 1.0) 0.9 ( 0.8- 0.9) 0.3 ( 0.2- 0.4) 0.2 ( 0.1- 0.2)
Other Urinary Organs 0.5 ( 0.4- 0.5) 0.4 ( 0.4- 0.5) 0.5 ( 0.4- 0.5) 0.4 ( 0.4- 0.5) 0.5 ( 0.3- 0.7) 0.3 ( 0.2- 0.4)
Eye and Orbit 0.9 ( 0.8- 0.9) 0.8 ( 0.7- 0.9) 0.9 ( 0.8- 1.0) 0.9 ( 0.8- 0.9) 0.3 ( 0.2- 0.4) 0.3 ( 0.2- 0.4)
Brain and Other Nervous System 7.9 ( 7.7- 8.1) 7.5 ( 7.3- 7.7) 8.3 ( 8.1- 8.5) 8.2 ( 8.0- 8.4) 4.5 ( 4.1- 5.0) 3.8 ( 3.4- 4.1)
Brain 7.5 ( 7.3- 7.6) 7.1 ( 6.9- 7.3) 7.9 ( 7.7- 8.1) 7.8 ( 7.6- 7.9) 4.2 ( 3.7- 4.6) 3.5 ( 3.1- 3.8)
Cranial Nerves and Other Nervous System 0.4 ( 0.4- 0.5) 0.4 ( 0.4- 0.4) 0.4 ( 0.4- 0.5) 0.4 ( 0.4- 0.5) 0.4 ( 0.3- 0.6) 0.3 ( 0.2- 0.4)
Endocrine System 4.3 ( 4.2- 4.4) 4.2 ( 4.1- 4.3) 4.5 ( 4.3- 4.6) 4.4 ( 4.3- 4.6) 2.5 ( 2.2- 2.9) 2.0 ( 1.7- 2.3)
Thyroid 3.6 ( 3.5- 3.7) 3.5 ( 3.4- 3.6) 3.8 ( 3.6- 3.9) 3.8 ( 3.6- 3.9) 1.8 ( 1.5- 2.1) 1.3 ( 1.1- 1.5)
Other Endocrine including Thymus 0.7 ( 0.6- 0.8) 0.7 ( 0.6- 0.7) 0.7 ( 0.6- 0.7) 0.7 ( 0.6- 0.7) 0.8 ( 0.6- 1.0) 0.7 ( 0.5- 0.8)
Lymphomas 25.1 ( 24.8- 25.4) 23.2 ( 22.9- 23.5) 25.4 ( 25.0- 25.7) 24.5 ( 24.2- 24.8) 19.6 ( 18.6- 20.6) 15.0 ( 14.4- 15.8)
Hodgkin Lymphoma 3.2 ( 3.1- 3.3) 3.1 ( 3.0- 3.2) 3.2 ( 3.1- 3.4) 3.2 ( 3.1- 3.4) 2.9 ( 2.6- 3.2) 2.7 ( 2.4- 3.0)
Non-Hodgkin Lymphoma 22.0 ( 21.7- 22.3) 20.0 ( 19.7- 20.3) 22.1 ( 21.8- 22.5) 21.3 ( 21.0- 21.6) 16.7 ( 15.8- 17.6) 12.4 ( 11.7- 13.0)
Multiple Myeloma 6.0 ( 5.8- 6.2) 5.3 ( 5.2- 5.5) 5.6 ( 5.4- 5.7) 5.3 ( 5.1- 5.4) 10.8 ( 10.0- 11.6) 6.6 ( 6.2- 7.1)
Leukemias 14.5 ( 14.3- 14.8) 13.0 ( 12.8- 13.3) 14.8 ( 14.5- 15.1) 14.0 ( 13.8- 14.3) 10.5 ( 9.8- 11.3) 7.2 ( 6.7- 7.7)
Acute Lymphocytic 1.5 ( 1.5- 1.6) 1.5 ( 1.5- 1.6) 1.6 ( 1.5- 1.7) 1.6 ( 1.5- 1.7) 0.9 ( 0.7- 1.1) 0.9 ( 0.8- 1.1)
Chronic Lymphocytic 4.2 ( 4.1- 4.3) 3.7 ( 3.5- 3.8) 4.3 ( 4.1- 4.4) 4.0 ( 3.9- 4.1) 3.1 ( 2.7- 3.5) 1.8 ( 1.5- 2.0)
Acute Myeloid 4.4 ( 4.3- 4.6) 4.0 ( 3.9- 4.1) 4.5 ( 4.3- 4.6) 4.3 ( 4.1- 4.4) 3.3 ( 2.9- 3.8) 2.3 ( 2.0- 2.6)
Chronic Myeloid 1.8 ( 1.7- 1.9) 1.6 ( 1.6- 1.7) 1.8 ( 1.7- 1.9) 1.7 ( 1.6- 1.8) 1.5 ( 1.2- 1.8) 1.0 ( 0.9- 1.2)
Other Leukemias 2.6 ( 2.5- 2.7) 2.2 ( 2.1- 2.3) 2.6 ( 2.5- 2.7) 2.4 ( 2.3- 2.5) 1.8 ( 1.5- 2.1) 1.1 ( 0.9- 1.3)
Miscellaneous 14.4 ( 14.1- 14.6) 12.6 ( 12.4- 12.8) 14.1 ( 13.8- 14.3) 13.1 ( 12.9- 13.4) 17.2 ( 16.3- 18.3) 10.6 ( 10.1- 11.2)
∗ Data are from selected statewide and metropolitan area cancer registries that meet the following data quality criteria for all invasive cancer sites combined: case
ascertainment is at least 90% complete; ≥ 97% of cases pass a standard set of computerized edits; ≤ 5% of cases were ascertained by death certificate only; ≤ 3% of
cases are missing information on sex; ≤ 5% of cases are missing information on race; ≤ 3% of cases are missing information on age. See Appendix H for registry-specific
data quality information. Rates cover approximately 78% of the U.S. population.
† Excludes basal and squamous cell carcinomas of the skin except when these occur on the skin of the genital organs, and in situ cancers except urinary bladder.
‡ Rates are per 100,000 persons. Population denominators for 1999 are projected from the 1990 census and may not accurately reflect the 1999 population size. Caution
should be used in interpreting rates based on these projected populations.
§ Rates are age-adjusted to the 2000 U.S. standard population.
‖ Includes invasive and in situ.
∼ Rates are suppressed if fewer than 16 cases were reported in the specific site-race category.

United States C
ancer Statistics: 1999 Incidence
18
Table 1.2: Invasive Cancer Incidence Rates by Primary Site and Race (All Races, White, Black),United States: SEER and NPCR Registries that Meet Quality Criteria∗†
Females, 1999
All Races White BlackAge-Adjusted Crude Age-Adjusted Crude Age-Adjusted Crude
Primary Site Rate‡§ (CI) Rate‡ (CI) Rate‡§ (CI) Rate‡ (CI) Rate‡§ (CI) Rate‡ (CI)
All Sites 420.1 (418.9-421.2) 457.9 (456.7-459.2) 423.8 (422.5-425.1) 487.4 (486.0-488.9) 381.7 (378.0-385.4) 313.2 (310.2-316.3)
Oral Cavity and Pharynx 6.3 ( 6.2- 6.5) 6.9 ( 6.7- 7.0) 6.2 ( 6.0- 6.3) 7.1 ( 7.0- 7.3) 6.3 ( 5.8- 6.8) 5.3 ( 4.9- 5.7)
Lip 0.3 ( 0.3- 0.4) 0.4 ( 0.3- 0.4) 0.3 ( 0.3- 0.4) 0.4 ( 0.4- 0.5) ∼ ∼Tongue 1.6 ( 1.5- 1.6) 1.7 ( 1.6- 1.8) 1.5 ( 1.5- 1.6) 1.8 ( 1.7- 1.9) 1.2 ( 1.0- 1.5) 1.0 ( 0.9- 1.2)
Salivary Gland 0.9 ( 0.8- 0.9) 0.9 ( 0.9- 1.0) 0.9 ( 0.8- 0.9) 1.0 ( 0.9- 1.1) 0.8 ( 0.6- 0.9) 0.6 ( 0.5- 0.8)
Floor of Mouth 0.5 ( 0.4- 0.5) 0.5 ( 0.5- 0.6) 0.5 ( 0.4- 0.5) 0.6 ( 0.5- 0.6) 0.5 ( 0.4- 0.7) 0.4 ( 0.3- 0.6)
Gum and Other Mouth 1.4 ( 1.3- 1.5) 1.5 ( 1.5- 1.6) 1.4 ( 1.3- 1.4) 1.6 ( 1.5- 1.7) 1.3 ( 1.1- 1.5) 1.1 ( 0.9- 1.2)
Nasopharynx 0.4 ( 0.3- 0.4) 0.4 ( 0.3- 0.4) 0.3 ( 0.2- 0.3) 0.3 ( 0.3- 0.3) 0.5 ( 0.4- 0.6) 0.4 ( 0.3- 0.6)
Tonsil 0.6 ( 0.6- 0.6) 0.6 ( 0.6- 0.7) 0.6 ( 0.5- 0.6) 0.7 ( 0.6- 0.7) 0.8 ( 0.6- 1.0) 0.7 ( 0.5- 0.8)
Oropharynx 0.2 ( 0.2- 0.2) 0.2 ( 0.2- 0.2) 0.2 ( 0.2- 0.2) 0.2 ( 0.2- 0.2) 0.3 ( 0.2- 0.5) 0.3 ( 0.2- 0.4)
Hypopharynx 0.4 ( 0.3- 0.4) 0.4 ( 0.3- 0.4) 0.3 ( 0.3- 0.4) 0.4 ( 0.4- 0.4) 0.5 ( 0.4- 0.7) 0.4 ( 0.3- 0.5)
Other Oral Cavity and Pharynx 0.2 ( 0.2- 0.2) 0.2 ( 0.2- 0.2) 0.2 ( 0.2- 0.2) 0.2 ( 0.2- 0.3) 0.3 ( 0.2- 0.4) 0.2 ( 0.1- 0.3)
Digestive System 75.0 ( 74.5- 75.5) 85.4 ( 84.9- 86.0) 72.7 ( 72.2- 73.2) 89.0 ( 88.4- 89.6) 90.3 ( 88.5- 92.2) 70.9 ( 69.4- 72.3)
Esophagus 2.2 ( 2.1- 2.2) 2.5 ( 2.4- 2.5) 2.0 ( 1.9- 2.1) 2.5 ( 2.4- 2.6) 3.6 ( 3.2- 4.0) 2.9 ( 2.6- 3.2)
Stomach 5.1 ( 5.0- 5.2) 5.9 ( 5.7- 6.0) 4.4 ( 4.3- 4.6) 5.5 ( 5.3- 5.7) 9.1 ( 8.5- 9.7) 7.0 ( 6.6- 7.5)
Small Intestine 1.4 ( 1.3- 1.5) 1.5 ( 1.5- 1.6) 1.3 ( 1.3- 1.4) 1.6 ( 1.5- 1.6) 2.2 ( 1.9- 2.5) 1.7 ( 1.5- 2.0)
Colon and Rectum 48.5 ( 48.1- 48.9) 55.3 ( 54.9- 55.7) 47.6 ( 47.2- 48.0) 58.4 ( 57.9- 58.9) 54.0 ( 52.6- 55.4) 42.5 ( 41.4- 43.6)
Colon excluding Rectum 36.5 ( 36.1- 36.8) 41.9 ( 41.5- 42.3) 35.6 ( 35.2- 36.0) 44.1 ( 43.7- 44.6) 43.2 ( 41.9- 44.5) 33.9 ( 32.9- 34.9)
Rectum and Rectosigmoid Junction 12.0 ( 11.8- 12.2) 13.4 ( 13.2- 13.6) 12.0 ( 11.8- 12.2) 14.3 ( 14.1- 14.5) 10.8 ( 10.2- 11.4) 8.6 ( 8.1- 9.1)
Anus, Anal Canal and Anorectum 1.5 ( 1.4- 1.5) 1.6 ( 1.5- 1.7) 1.5 ( 1.4- 1.6) 1.7 ( 1.6- 1.8) 1.3 ( 1.1- 1.5) 1.1 ( 0.9- 1.3)
Liver and Intrahepatic Bile Duct 2.8 ( 2.7- 2.9) 3.2 ( 3.1- 3.3) 2.5 ( 2.4- 2.6) 3.1 ( 2.9- 3.2) 3.5 ( 3.1- 3.9) 2.8 ( 2.5- 3.1)
Gallbladder 1.5 ( 1.4- 1.6) 1.7 ( 1.6- 1.8) 1.5 ( 1.4- 1.5) 1.8 ( 1.7- 1.9) 1.6 ( 1.3- 1.9) 1.2 ( 1.0- 1.4)
Other Biliary 1.1 ( 1.1- 1.2) 1.3 ( 1.2- 1.4) 1.1 ( 1.0- 1.2) 1.4 ( 1.3- 1.5) 1.0 ( 0.8- 1.2) 0.7 ( 0.6- 0.9)
Pancreas 9.6 ( 9.4- 9.7) 11.0 ( 10.8- 11.2) 9.2 ( 9.0- 9.4) 11.4 ( 11.2- 11.6) 13.1 ( 12.4- 13.8) 10.1 ( 9.5- 10.6)
Retroperitoneum 0.4 ( 0.3- 0.4) 0.4 ( 0.3- 0.4) 0.4 ( 0.3- 0.4) 0.4 ( 0.4- 0.4) 0.4 ( 0.3- 0.6) 0.4 ( 0.3- 0.5)
Peritoneum, Omentum and Mesentery 0.8 ( 0.7- 0.8) 0.8 ( 0.8- 0.9) 0.8 ( 0.8- 0.9) 1.0 ( 0.9- 1.0) 0.3 ( 0.2- 0.5) 0.3 ( 0.2- 0.4)
Other Digestive Organs 0.3 ( 0.2- 0.3) 0.3 ( 0.3- 0.3) 0.3 ( 0.2- 0.3) 0.3 ( 0.3- 0.4) 0.2 ( 0.2- 0.4) 0.2 ( 0.1- 0.3)
Respiratory System 56.1 ( 55.7- 56.5) 62.0 ( 61.5- 62.5) 57.2 ( 56.7- 57.6) 67.2 ( 66.6- 67.7) 53.4 ( 52.0- 54.8) 42.7 ( 41.6- 43.8)
Nose, Nasal Cavity and Middle Ear 0.5 ( 0.5- 0.6) 0.6 ( 0.5- 0.6) 0.5 ( 0.5- 0.6) 0.6 ( 0.6- 0.7) 0.4 ( 0.3- 0.6) 0.4 ( 0.3- 0.5)
Larynx 1.7 ( 1.7- 1.8) 1.9 ( 1.8- 1.9) 1.7 ( 1.6- 1.8) 1.9 ( 1.8- 2.0) 2.4 ( 2.2- 2.8) 2.0 ( 1.8- 2.3)
Lung and Bronchus 53.4 ( 52.9- 53.8) 59.0 ( 58.6- 59.5) 54.4 ( 54.0- 54.9) 64.1 ( 63.5- 64.6) 50.3 ( 48.9- 51.7) 40.1 ( 39.0- 41.2)
Pleura 0.3 ( 0.3- 0.4) 0.4 ( 0.3- 0.4) 0.4 ( 0.3- 0.4) 0.4 ( 0.4- 0.5) 0.1 ( 0.1- 0.2) 0.1 ( 0.1- 0.2)
Trachea and Other Respiratory Organs 0.1 ( 0.1- 0.1) 0.1 ( 0.1- 0.2) 0.1 ( 0.1- 0.1) 0.1 ( 0.1- 0.2) ∼ ∼Bones and Joints 0.8 ( 0.7- 0.9) 0.8 ( 0.8- 0.9) 0.8 ( 0.8- 0.9) 0.9 ( 0.8- 0.9) 0.6 ( 0.5- 0.8) 0.6 ( 0.5- 0.8)
Soft Tissue including Heart 2.4 ( 2.3- 2.5) 2.6 ( 2.5- 2.7) 2.4 ( 2.3- 2.5) 2.7 ( 2.6- 2.8) 2.3 ( 2.0- 2.6) 2.1 ( 1.8- 2.3)
Skin excluding Basal and Squamous 13.2 ( 13.0- 13.4) 13.9 ( 13.7- 14.2) 14.4 ( 14.2- 14.7) 15.6 ( 15.4- 15.9) 2.0 ( 1.8- 2.3) 1.8 ( 1.6- 2.0)
Melanomas of the Skin 12.1 ( 11.9- 12.3) 12.7 ( 12.5- 12.9) 13.4 ( 13.1- 13.6) 14.4 ( 14.2- 14.7) 0.9 ( 0.7- 1.1) 0.7 ( 0.6- 0.9)
Other Non-Epithelial Skin 1.1 ( 1.1- 1.2) 1.2 ( 1.2- 1.3) 1.1 ( 1.0- 1.1) 1.2 ( 1.2- 1.3) 1.2 ( 1.0- 1.4) 1.1 ( 0.9- 1.3)
Breast 134.1 (133.4-134.8) 143.2 (142.5-143.9) 136.3 (135.5-137.0) 152.7 (151.9-153.5) 112.7 (110.7-114.7) 94.9 ( 93.3- 96.6)
Female Genital System 53.9 ( 53.5- 54.3) 57.4 ( 56.9- 57.9) 54.6 ( 54.1- 55.0) 60.7 ( 60.2- 61.3) 46.5 ( 45.3- 47.8) 39.1 ( 38.1- 40.2)
Cervix 9.5 ( 9.3- 9.6) 9.7 ( 9.5- 9.9) 8.8 ( 8.6- 9.0) 9.2 ( 9.0- 9.4) 13.9 ( 13.2- 14.6) 12.3 ( 11.8- 13.0)
Corpus 23.9 ( 23.6- 24.2) 25.6 ( 25.3- 25.9) 24.6 ( 24.3- 25.0) 27.7 ( 27.4- 28.1) 17.3 ( 16.5- 18.1) 14.0 ( 13.4- 14.7)
Uterus, NOS 0.7 ( 0.7- 0.8) 0.8 ( 0.7- 0.9) 0.7 ( 0.6- 0.7) 0.8 ( 0.7- 0.8) 1.4 ( 1.1- 1.6) 1.1 ( 0.9- 1.3)
Ovary 16.2 ( 15.9- 16.4) 17.2 ( 17.0- 17.5) 16.8 ( 16.6- 17.1) 18.8 ( 18.5- 19.1) 10.6 ( 10.0- 11.3) 8.9 ( 8.4- 9.4)
Vagina 0.7 ( 0.6- 0.7) 0.8 ( 0.7- 0.8) 0.6 ( 0.6- 0.7) 0.7 ( 0.7- 0.8) 1.2 ( 1.0- 1.4) 1.0 ( 0.8- 1.1)
Vulva 2.3 ( 2.2- 2.4) 2.6 ( 2.5- 2.7) 2.4 ( 2.3- 2.5) 2.9 ( 2.7- 3.0) 1.6 ( 1.3- 1.8) 1.3 ( 1.1- 1.5)
Other Female Genital Organs 0.6 ( 0.6- 0.7) 0.7 ( 0.6- 0.7) 0.6 ( 0.6- 0.7) 0.7 ( 0.6- 0.8) 0.6 ( 0.5- 0.8) 0.5 ( 0.4- 0.7)
continued

Cancer Incidence: A
ll Areas C
ombined19
Table 1.2: Invasive Cancer Incidence Rates by Primary Site and Race (All Races, White, Black),United States: SEER and NPCR Registries that Meet Quality Criteria∗† (continued)
Females, 1999
All Races White BlackAge-Adjusted Crude Age-Adjusted Crude Age-Adjusted Crude
Primary Site Rate‡§ (CI) Rate‡ (CI) Rate‡§ (CI) Rate‡ (CI) Rate‡§ (CI) Rate‡ (CI)
Urinary System 19.0 ( 18.8- 19.3) 21.3 ( 21.0- 21.5) 19.5 ( 19.2- 19.7) 23.2 ( 22.9- 23.5) 16.3 ( 15.5- 17.1) 13.0 ( 12.4- 13.6)
Urinary Bladder‖ 10.0 ( 9.8- 10.2) 11.4 ( 11.2- 11.6) 10.4 ( 10.2- 10.6) 12.7 ( 12.4- 12.9) 7.1 ( 6.6- 7.7) 5.4 ( 5.0- 5.8)
Kidney and Renal Pelvis 8.4 ( 8.2- 8.5) 9.1 ( 9.0- 9.3) 8.4 ( 8.2- 8.6) 9.7 ( 9.5- 9.9) 8.7 ( 8.2- 9.3) 7.2 ( 6.7- 7.7)
Ureter 0.5 ( 0.4- 0.5) 0.5 ( 0.5- 0.6) 0.5 ( 0.4- 0.5) 0.6 ( 0.5- 0.6) 0.2 ( 0.1- 0.3) 0.1 ( 0.1- 0.2)
Other Urinary Organs 0.2 ( 0.1- 0.2) 0.2 ( 0.2- 0.2) 0.1 ( 0.1- 0.2) 0.2 ( 0.2- 0.2) 0.3 ( 0.2- 0.4) 0.2 ( 0.2- 0.3)
Eye and Orbit 0.6 ( 0.6- 0.7) 0.7 ( 0.6- 0.7) 0.7 ( 0.6- 0.7) 0.7 ( 0.7- 0.8) 0.2 ( 0.2- 0.3) 0.2 ( 0.2- 0.3)
Brain and Other Nervous System 5.7 ( 5.5- 5.8) 6.0 ( 5.8- 6.1) 6.0 ( 5.8- 6.1) 6.5 ( 6.4- 6.7) 3.6 ( 3.3- 4.0) 3.2 ( 2.9- 3.5)
Brain 5.3 ( 5.1- 5.4) 5.6 ( 5.4- 5.7) 5.6 ( 5.5- 5.8) 6.1 ( 6.0- 6.3) 3.2 ( 2.9- 3.6) 2.9 ( 2.6- 3.2)
Cranial Nerves and Other Nervous System 0.4 ( 0.3- 0.4) 0.4 ( 0.4- 0.4) 0.4 ( 0.3- 0.4) 0.4 ( 0.4- 0.5) 0.4 ( 0.3- 0.5) 0.3 ( 0.2- 0.4)
Endocrine System 10.4 ( 10.2- 10.6) 10.6 ( 10.4- 10.8) 10.7 ( 10.5- 10.9) 11.0 ( 10.8- 11.2) 6.5 ( 6.0- 7.0) 6.0 ( 5.6- 6.4)
Thyroid 9.9 ( 9.7- 10.1) 10.0 ( 9.8- 10.2) 10.2 ( 10.0- 10.4) 10.4 ( 10.2- 10.7) 5.9 ( 5.5- 6.4) 5.4 ( 5.0- 5.8)
Other Endocrine including Thymus 0.5 ( 0.5- 0.6) 0.5 ( 0.5- 0.6) 0.5 ( 0.5- 0.6) 0.5 ( 0.5- 0.6) 0.6 ( 0.5- 0.8) 0.5 ( 0.4- 0.7)
Lymphomas 18.3 ( 18.0- 18.5) 19.9 ( 19.7- 20.2) 18.8 ( 18.5- 19.0) 21.6 ( 21.3- 21.9) 12.7 ( 12.1- 13.4) 11.1 ( 10.5- 11.7)
Hodgkin Lymphoma 2.5 ( 2.4- 2.6) 2.6 ( 2.5- 2.7) 2.7 ( 2.6- 2.8) 2.7 ( 2.6- 2.8) 1.9 ( 1.7- 2.2) 1.9 ( 1.7- 2.2)
Non-Hodgkin Lymphoma 15.7 ( 15.5- 16.0) 17.4 ( 17.1- 17.6) 16.1 ( 15.8- 16.3) 18.9 ( 18.6- 19.1) 10.8 ( 10.2- 11.4) 9.2 ( 8.7- 9.7)
Multiple Myeloma 4.1 ( 4.0- 4.3) 4.6 ( 4.5- 4.8) 3.7 ( 3.6- 3.8) 4.5 ( 4.3- 4.6) 8.2 ( 7.7- 8.8) 6.4 ( 6.0- 6.9)
Leukemias 8.8 ( 8.6- 8.9) 9.6 ( 9.5- 9.8) 8.9 ( 8.7- 9.1) 10.3 ( 10.1- 10.5) 7.0 ( 6.5- 7.5) 5.9 ( 5.5- 6.3)
Acute Lymphocytic 1.2 ( 1.1- 1.2) 1.2 ( 1.1- 1.2) 1.2 ( 1.2- 1.3) 1.2 ( 1.1- 1.3) 0.7 ( 0.6- 0.9) 0.7 ( 0.6- 0.9)
Chronic Lymphocytic 2.1 ( 2.0- 2.2) 2.4 ( 2.3- 2.5) 2.1 ( 2.0- 2.2) 2.6 ( 2.5- 2.7) 1.5 ( 1.2- 1.7) 1.1 ( 0.9- 1.3)
Acute Myeloid 3.1 ( 3.0- 3.2) 3.4 ( 3.2- 3.5) 3.1 ( 3.0- 3.2) 3.6 ( 3.5- 3.7) 2.6 ( 2.3- 3.0) 2.2 ( 2.0- 2.5)
Chronic Myeloid 1.1 ( 1.0- 1.1) 1.2 ( 1.1- 1.3) 1.1 ( 1.0- 1.1) 1.2 ( 1.2- 1.3) 1.0 ( 0.8- 1.2) 0.8 ( 0.7- 1.0)
Other Leukemias 1.3 ( 1.3- 1.4) 1.5 ( 1.5- 1.6) 1.4 ( 1.3- 1.4) 1.7 ( 1.6- 1.8) 1.2 ( 1.0- 1.4) 1.0 ( 0.8- 1.1)
Miscellaneous 11.3 ( 11.1- 11.5) 13.0 ( 12.8- 13.3) 11.1 ( 10.9- 11.3) 13.8 ( 13.5- 14.0) 12.9 ( 12.2- 13.6) 10.1 ( 9.5- 10.6)
Breast, in situ ¶ 28.8 ( 28.5- 29.1) 30.1 ( 29.8- 30.4) 29.3 ( 28.9- 29.6) 31.7 ( 31.4- 32.1) 22.5 ( 21.6- 23.4) 18.8 ( 18.1- 19.6)
∗ Data are from selected statewide and metropolitan area cancer registries that meet the following data quality criteria for all invasive cancer sites combined: case
ascertainment is at least 90% complete; ≥ 97% of cases pass a standard set of computerized edits; ≤ 5% of cases were ascertained by death certificate only; ≤ 3% of
cases are missing information on sex; ≤ 5% of cases are missing information on race; ≤ 3% of cases are missing information on age. See Appendix H for registry-specific
data quality information. Rates cover approximately 78% of the U.S. population.
† Excludes basal and squamous cell carcinomas of the skin except when these occur on the skin of the genital organs, and in situ cancers except urinary bladder.
‡ Rates are per 100,000 persons. Population denominators for 1999 are projected from the 1990 census and may not accurately reflect the 1999 population size. Caution
should be used in interpreting rates based on these projected populations.
§ Rates are age-adjusted to the 2000 U.S. standard population.
‖ Includes invasive and in situ.
¶ Rates for in situ female breast cancer are listed separately and are not included in rates for the "all sites" category.
∼ Rates are suppressed if fewer than 16 cases were reported in the specific site-race category.

United States C
ancer Statistics: 1999 Incidence
20
Table 1.3: All Cancer Sites Combined. Invasive Cancer Incidence Rates by Age andRace (All Races, White, Black), United States: SEER and NPCR Registries thatMeet Quality Criteria∗†
Males, 1999
Age-Specific Rate‡ (CI)Age at Diagnosis (Years) All Races White Black
<1 26.2 ( 23.6- 28.9) 27.4 ( 24.4- 30.5) 17.9 ( 12.7- 24.6)1-4 20.2 ( 19.1- 21.4) 21.2 ( 19.9- 22.5) 13.1 ( 10.7- 15.8)5-9 12.0 ( 11.3- 12.8) 12.1 ( 11.3- 13.0) 11.0 ( 9.2- 13.1)10-14 12.3 ( 11.6- 13.1) 12.9 ( 12.0- 13.8) 9.2 ( 7.5- 11.1)15-19 20.7 ( 19.7- 21.7) 21.0 ( 19.9- 22.2) 18.4 ( 16.0- 21.1)20-24 31.8 ( 30.5- 33.1) 33.7 ( 32.2- 35.3) 17.0 ( 14.5- 19.8)25-29 48.0 ( 46.4- 49.6) 50.9 ( 49.0- 52.8) 28.9 ( 25.5- 32.6)30-34 65.4 ( 63.6- 67.3) 67.2 ( 65.1- 69.2) 50.6 ( 46.1- 55.4)35-39 87.3 ( 85.4- 89.3) 87.7 ( 85.5- 89.8) 79.5 ( 74.1- 85.3)40-44 143.4 ( 140.9- 146.0) 140.2 ( 137.5- 143.0) 160.4 ( 152.4- 168.8)45-49 271.5 ( 267.8- 275.3) 259.6 ( 255.7- 263.7) 369.0 ( 355.3- 383.1)50-54 531.0 ( 525.3- 536.7) 507.2 ( 501.1- 513.2) 761.8 ( 739.0- 785.1)55-59 975.0 ( 966.2- 983.9) 938.7 ( 929.4- 948.0) 1343.1 (1308.2-1378.8)60-64 1583.8 (1571.3-1596.5) 1536.9 (1523.6-1550.2) 2031.1 (1982.9-2080.2)65-69 2327.2 (2311.0-2343.4) 2294.5 (2277.3-2311.7) 2509.9 (2453.1-2567.8)70-74 2864.5 (2845.6-2883.5) 2826.5 (2806.6-2846.4) 2967.5 (2896.7-3039.5)75-79 3068.3 (3046.4-3090.3) 3016.1 (2993.4-3039.0) 3245.2 (3156.9-3335.4)80-84 3152.7 (3124.1-3181.5) 3107.8 (3078.1-3137.7) 3188.1 (3067.3-3312.5)85+ 3065.5 (3031.3-3099.9) 3049.7 (3014.0-3085.8) 2866.0 (2735.7-3000.9)
∗ Data are from selected statewide and metropolitan area cancer registries that meet the following data quality criteria: case ascertainment is at
least 90% complete; ≥ 97% of cases pass a standard set of computerized edits; ≤ 5% of cases were ascertained by death certificate only; ≤ 3% of
cases are missing information on sex; ≤ 5% of cases are missing information on race; ≤ 3% of cases are missing information on age. Rates cover
approximately 78% of the U.S. population.
† Excludes basal and squamous cell carcinomas of the skin except when these occur on the skin of the genital organs, and in situ cancers except
urinary bladder.
‡ Rates are per 100,000 persons. Population denominators for 1999 are projected from the 1990 census and may not accurately reflect the 1999
population size. Caution should be used in interpreting rates based on these projected populations.

Cancer Incidence: A
ll Areas C
ombined21
Table 1.4: All Cancer Sites Combined. Invasive Cancer Incidence Rates by Age andRace (All Races, White, Black), United States: SEER and NPCR Registries thatMeet Quality Criteria∗†
Females, 1999
Age-Specific Rate‡ (CI)Age at Diagnosis (Years) All Races White Black
<1 19.5 ( 17.3- 22.0) 19.6 ( 17.1- 22.3) 15.2 ( 10.3- 21.5)1-4 17.9 ( 16.9- 19.1) 18.7 ( 17.4- 20.0) 13.6 ( 11.2- 16.4)5-9 9.7 ( 9.0- 10.4) 9.8 ( 9.0- 10.6) 7.6 ( 6.1- 9.4)10-14 12.4 ( 11.6- 13.2) 12.5 ( 11.6- 13.5) 11.0 ( 9.1- 13.1)15-19 19.0 ( 18.0- 20.0) 19.6 ( 18.5- 20.8) 13.9 ( 11.8- 16.4)20-24 34.6 ( 33.3- 36.1) 35.8 ( 34.2- 37.4) 25.1 ( 22.0- 28.5)25-29 63.2 ( 61.3- 65.0) 65.7 ( 63.6- 67.9) 47.3 ( 43.1- 51.8)30-34 102.4 ( 100.2- 104.7) 102.9 ( 100.4- 105.5) 93.5 ( 87.7- 99.6)35-39 162.8 ( 160.2- 165.5) 163.3 ( 160.4- 166.3) 151.5 ( 144.4- 158.9)40-44 265.7 ( 262.3- 269.1) 264.8 ( 261.0- 268.5) 252.8 ( 243.3- 262.6)45-49 410.9 ( 406.4- 415.4) 412.0 ( 407.1- 417.1) 383.1 ( 370.3- 396.2)50-54 605.9 ( 599.9- 611.8) 609.1 ( 602.6- 615.6) 566.9 ( 549.3- 585.0)55-59 833.4 ( 825.6- 841.3) 846.2 ( 837.6- 854.8) 737.0 ( 714.2- 760.3)60-64 1104.3 (1094.4-1114.3) 1121.2 (1110.4-1132.1) 1003.1 ( 973.9-1033.0)65-69 1385.0 (1373.5-1396.5) 1413.5 (1401.0-1426.1) 1181.5 (1147.8-1215.9)70-74 1677.2 (1664.3-1690.1) 1694.8 (1681.1-1708.6) 1527.9 (1485.3-1571.5)75-79 1888.2 (1873.7-1902.9) 1897.3 (1881.9-1912.8) 1755.1 (1703.1-1808.2)80-84 1998.5 (1980.7-2016.4) 2002.4 (1983.8-2021.2) 1823.5 (1756.3-1892.6)85+ 1873.1 (1855.7-1890.7) 1871.6 (1853.4-1890.0) 1762.1 (1695.6-1830.5)
∗ Data are from selected statewide and metropolitan area cancer registries that meet the following data quality criteria: case ascertainment is at
least 90% complete; ≥ 97% of cases pass a standard set of computerized edits; ≤ 5% of cases were ascertained by death certificate only; ≤ 3% of
cases are missing information on sex; ≤ 5% of cases are missing information on race; ≤ 3% of cases are missing information on age. Rates cover
approximately 78% of the U.S. population.
† Excludes basal and squamous cell carcinomas of the skin except when these occur on the skin of the genital organs, and in situ cancers except
urinary bladder.
‡ Rates are per 100,000 persons. Population denominators for 1999 are projected from the 1990 census and may not accurately reflect the 1999
population size. Caution should be used in interpreting rates based on these projected populations.

Cancer Incidence, by U.S. Census Region and Division,
State, and Metropolitan Area


Cancer Incidence, by U
.S. Census R
egion and Division, State, and M
etropolitan Area
23

United States C
ancer Statistics: 1999 Incidence
24
Table 2.1.1: All Cancer Sites Combined. Invasive Cancer Incidence Rates by U.S. Census Region and Division, Stateand Metropolitan Area, and Race (All Races, White, Black), United States: SEER and NPCR Registries that MeetQuality Criteria∗†
Males, 1999
All Races White BlackAge-Adjusted Crude Age-Adjusted Crude Age-Adjusted Crude
Area Rate‡§ (CI) Rate‡ (CI) Rate‡§ (CI) Rate‡ (CI) Rate‡§ (CI) Rate‡ (CI)
United States 552.3 (550.8- 553.9) 498.2 (496.9-499.6) 542.0 (540.4- 543.6) 519.5 (518.0-521.0) 617.4 (611.6- 623.3) 389.4 (385.9-393.0)
Northeast 573.0 (569.9- 576.1) 545.8 (542.9-548.8) 564.9 (561.6- 568.2) 574.3 (570.9-577.6) 595.6 (584.5- 607.0) 395.1 (388.0-402.3)
New England 586.4 (579.8- 593.0) 548.3 (542.2-554.5) 578.9 (572.3- 585.7) 568.7 (562.2-575.3) 615.9 (579.7- 654.4) 329.7 (311.5-348.7)
Connecticut 580.6 (568.6- 592.9) 558.8 (547.2-570.5) 570.1 (557.7- 582.7) 579.9 (567.4-592.7) 623.0 (568.0- 683.1) 362.7 (332.5-394.9)
Maine
Massachusetts 588.6 (579.5- 597.7) 547.9 (539.5-556.4) 579.7 (570.5- 589.1) 570.5 (561.5-579.7) 613.6 (562.5- 669.5) 312.0 (287.8-337.7)
New Hampshire 534.1 (513.8- 555.0) 457.2 (440.1-474.7) 533.0 (512.7- 554.0) 461.4 (444.1-479.3) ∼ ∼Rhode Island 644.7 (621.7- 668.4) 628.8 (606.5-651.8) 650.0 (626.4- 674.4) 663.8 (639.9-688.4) 654.1 (506.6- 844.6) 305.8 (241.3-382.2)
Vermont
Middle Atlantic 569.1 (565.6- 572.6) 545.1 (541.7-548.5) 560.4 (556.6- 564.2) 576.1 (572.3-580.0) 593.6 (581.9- 605.5) 404.4 (396.7-412.2)
New Jersey 606.9 (598.9- 615.0) 565.6 (558.2-573.1) 609.0 (600.4- 617.7) 615.9 (607.2-624.6) 669.4 (641.9- 698.2) 436.3 (419.3-453.8)
New York 537.9 (532.8- 543.0) 495.0 (490.4-499.7) 531.0 (525.5- 536.6) 530.2 (524.7-535.7) 517.6 (503.0- 532.5) 352.2 (342.8-361.8)
Pennsylvania 587.4 (581.3- 593.7) 607.2 (600.9-613.6) 567.7 (561.4- 574.1) 612.1 (605.4-618.9) 718.2 (691.5- 745.9) 514.4 (495.6-533.7)
Midwest
East North Central
Illinois 558.8 (552.2- 565.4) 479.8 (474.2-485.4) 539.8 (532.9- 546.8) 492.4 (486.1-498.7) 631.0 (609.3- 653.4) 395.2 (382.1-408.6)
Indiana
Michigan 607.8 (600.3- 615.4) 534.3 (527.8-540.9) 588.2 (580.3- 596.1) 542.7 (535.5-549.9) 713.1 (688.2- 738.8) 484.1 (467.5-501.2)
Detroit 633.1 (621.1- 645.3) 560.5 (550.1-571.1) 607.5 (594.3- 621.0) 572.7 (560.5-585.2) 736.1 (707.1- 766.1) 541.5 (520.4-563.3)
Ohio 555.4 (548.8- 562.1) 509.8 (503.8-515.9) 531.8 (525.0- 538.7) 506.1 (499.7-512.5) 623.4 (599.1- 648.6) 432.5 (416.2-449.3)
Wisconsin 540.9 (531.5- 550.5) 493.3 (484.8-502.0) 532.7 (523.2- 542.4) 508.7 (499.7-517.9) 726.8 (653.8- 808.8) 316.7 (288.2-347.3)
West North Central 548.4 (543.3- 553.5) 506.0 (501.4-510.8) 536.2 (531.0- 541.4) 514.5 (509.6-519.5) 657.5 (627.1- 689.1) 375.3 (358.7-392.6)
Iowa 554.4 (542.0- 566.9) 552.0 (539.8-564.5) 545.1 (532.7- 557.6) 554.8 (542.3-567.5) 724.2 (584.6- 894.7) 356.3 (291.7-430.9)
Kansas 553.4 (540.0- 567.0) 499.9 (487.8-512.1) 534.1 (520.6- 547.8) 501.0 (488.4-513.8) 729.9 (649.2- 819.0) 406.7 (363.2-454.0)
Minnesota 561.5 (551.2- 571.9) 487.8 (478.9-496.8) 550.5 (540.2- 561.0) 499.6 (490.3-509.1) 609.3 (513.3- 725.4) 248.5 (214.4-286.5)
Missouri 533.4 (524.3- 542.7) 497.9 (489.4-506.5) 522.4 (513.0- 532.0) 510.3 (501.2-519.6) 647.8 (610.6- 687.1) 412.9 (389.8-437.0)
Nebraska 545.5 (529.0- 562.4) 509.0 (493.6-524.7) 525.3 (508.9- 542.2) 506.7 (490.9-522.9) 545.2 (438.7- 676.7) 304.4 (247.9-369.8)
North Dakota 534.1 (508.6- 560.6) 524.9 (499.9-550.8) 534.4 (508.7- 561.2) 549.3 (522.8-576.7) ∼ ∼South Dakota
South
South Atlantic
Delaware 568.3 (542.7- 595.0) 523.3 (500.1-547.2) 550.8 (523.6- 579.4) 554.1 (527.1-582.0) 688.7 (608.7- 779.0) 420.9 (374.4-471.5)
District of Columbia 667.1 (634.0- 701.5) 636.9 (605.6-669.3) 453.9 (407.4- 506.0) 408.6 (367.8-452.8) 758.7 (714.5- 805.3) 759.5 (715.5-805.5)
Florida 587.5 (582.3- 592.7) 688.2 (682.3-694.3) 582.1 (576.7- 587.5) 753.3 (746.4-760.2) 627.3 (606.4- 648.9) 359.4 (348.3-370.7)
Georgia
Atlanta 532.6 (515.7- 550.0) 334.7 (324.8-344.7) 479.0 (460.9- 497.7) 347.2 (334.8-359.9) 748.1 (701.3- 797.9) 316.9 (299.6-334.9)
Maryland 567.3 (557.0- 577.9) 475.2 (466.7-483.8) 542.2 (530.7- 553.8) 509.4 (498.8-520.1) 592.3 (567.6- 618.2) 364.7 (350.5-379.3)
North Carolina 499.5 (491.7- 507.4) 439.0 (432.3-445.8) 490.0 (481.5- 498.7) 468.8 (460.8-476.8) 551.5 (530.7- 573.1) 357.9 (344.8-371.4)
South Carolina 578.3 (566.4- 590.5) 508.2 (498.1-518.5) 557.5 (544.3- 571.0) 546.2 (533.6-559.0) 642.7 (615.4- 671.0) 414.7 (397.7-432.3)
Virginia
West Virginia 579.5 (563.7- 595.7) 600.0 (583.8-616.5) 570.5 (554.6- 586.8) 595.8 (579.4-612.6) 630.8 (529.6- 746.3) 510.7 (429.0-603.4)
East South Central
Alabama
Kentucky 599.9 (588.1- 612.0) 531.0 (520.7-541.4) 575.2 (563.2- 587.3) 521.7 (511.1-532.4) 599.7 (548.9- 654.5) 393.2 (360.7-427.8)
Mississippi
Tennessee
continued

Cancer Incidence, by U
.S. Census R
egion and Division, State, and M
etropolitan Area
25
Table 2.1.1: All Cancer Sites Combined. Invasive Cancer Incidence Rates by U.S. Census Region and Division, Stateand Metropolitan Area, and Race (All Races, White, Black), United States: SEER and NPCR Registries that MeetQuality Criteria∗† (continued)
Males, 1999
All Races White BlackAge-Adjusted Crude Age-Adjusted Crude Age-Adjusted Crude
Area Rate‡§ (CI) Rate‡ (CI) Rate‡§ (CI) Rate‡ (CI) Rate‡§ (CI) Rate‡ (CI)
West South Central
Arkansas
Louisiana 579.6 (568.1- 591.3) 480.7 (471.3-490.1) 556.9 (544.0- 570.2) 520.4 (508.6-532.5) 670.7 (645.1- 697.1) 414.0 (398.6-429.8)
Oklahoma
Texas
West 509.4 (506.5- 512.3) 416.7 (414.4-419.0) 507.4 (504.4- 510.5) 432.7 (430.1-435.3) 557.6 (542.3- 573.3) 340.6 (331.7-349.7)
Mountain
Arizona 458.9 (449.8- 468.1) 421.6 (413.3-429.9) 465.0 (455.6- 474.5) 453.0 (443.9-462.2) 457.9 (390.6- 536.5) 238.7 (207.7-273.0)
Colorado 503.1 (491.8- 514.7) 396.4 (387.7-405.1) 505.1 (493.4- 517.0) 407.1 (398.0-416.4) 424.6 (366.4- 492.3) 257.0 (225.0-292.4)
Idaho 503.6 (484.5- 523.3) 428.4 (412.3-444.9) 506.5 (487.2- 526.4) 436.8 (420.3-453.7) ∼ ∼Montana 507.2 (485.9- 529.2) 495.5 (474.9-516.7) 487.8 (466.6- 509.7) 497.9 (476.5-520.1) ∼ ∼Nevada
New Mexico 466.6 (450.9- 482.7) 402.7 (389.3-416.3) 478.9 (462.4- 495.9) 442.2 (427.1-457.6) 345.6 (259.2- 457.9) 241.5 (182.9-312.8)
Utah 490.7 (474.3- 507.6) 330.9 (320.1-342.1) 496.6 (479.9- 513.8) 341.6 (330.3-353.2) ∼ ∼Wyoming 542.1 (510.5- 575.4) 475.7 (448.6-504.0) 543.8 (511.8- 577.4) 486.2 (458.2-515.5) ∼ ∼
Pacific 519.1 (515.7- 522.4) 420.2 (417.5-422.9) 516.2 (512.6- 519.9) 435.4 (432.4-438.5) 577.4 (560.8- 594.4) 356.7 (346.9-366.7)
Alaska 526.8 (489.5- 567.5) 306.2 (287.5-325.9) 501.8 (461.8- 545.8) 318.8 (297.0-341.8) 771.0 (484.9-1252.5) 260.9 (179.6-366.4)
California 506.3 (502.4- 510.2) 399.0 (395.9-402.0) 500.4 (496.2- 504.7) 412.5 (409.1-416.0) 577.2 (559.8- 595.1) 365.6 (355.0-376.4)
San Francisco-Oakland 521.1 (510.3- 532.0) 457.2 (447.8-466.7) 516.2 (503.6- 529.0) 484.9 (473.1-496.8) 554.0 (518.6- 591.5) 409.7 (384.3-436.4)
San Jose-Monterey 490.6 (475.8- 505.8) 366.3 (355.4-377.4) 480.4 (464.3- 497.0) 379.9 (367.3-392.8) 551.1 (440.2- 693.6) 229.6 (189.0-276.2)
Los Angeles 497.1 (489.5- 504.7) 367.8 (362.2-373.3) 490.1 (481.6- 498.7) 369.1 (362.8-375.5) 597.5 (571.7- 624.4) 433.9 (415.7-452.7)
Hawaii 478.0 (460.2- 496.3) 463.6 (446.4-481.3) 635.8 (593.2- 680.8) 506.0 (472.7-541.1) 297.3 (178.6- 478.4) 115.6 ( 72.4-175.0)
Oregon 556.5 (544.8- 568.5) 525.2 (514.2-536.5) 551.5 (539.6- 563.7) 535.8 (524.3-547.5) 617.8 (499.3- 761.7) 338.5 (278.0-408.3)
Washington 574.9 (565.3- 584.6) 486.8 (478.8-495.0) 565.0 (555.1- 575.0) 500.7 (492.0-509.5) 592.8 (526.6- 667.5) 313.2 (280.4-348.7)
Seattle-Puget Sound 590.9 (579.0- 603.0) 491.2 (481.4-501.1) 596.6 (584.1- 609.3) 523.7 (512.9-534.7) 630.9 (557.2- 714.4) 330.4 (294.5-369.5)
∗ Data are from selected statewide and metropolitan area cancer registries that meet the following data quality criteria for all invasive cancer sites combined: case
ascertainment is at least 90% complete; ≥ 97% of cases pass a standard set of computerized edits; ≤ 5% of cases were ascertained by death certificate only; ≤ 3% of
cases are missing information on sex; ≤ 5% of cases are missing information on race; ≤ 3% of cases are missing information on age. See Appendix H for registry-specific
data quality information. U.S. rates cover approximately 78% of the U.S. population.
† Excludes basal and squamous cell carcinomas of the skin except when these occur on the skin of the genital organs, and in situ cancers except urinary bladder.
‡ Rates are per 100,000 persons. Population denominators for 1999 are projected from the 1990 census and may not accurately reflect the 1999 population size. Caution
should be used in interpreting rates based on these projected populations.
§ Rates are age-adjusted to the 2000 U.S. standard population.
∼ Rates are suppressed if fewer than 16 cases were reported in the specific area-race category.
Notes: Cases from suppressed rates are included in the U.S. and region/division rates. Observed region/division age-adjusted incidence rates are presented for
regions/divisions with ≥ 78% of the population covered by registries that meet the data quality criteria specified above, and if the 95% confidence intervals
around the observed region/division rates for each of four major cancers include "bias-corrected" estimated region/division rates (see technical notes) for
each of those cancers. U.S rates are as presented in Table 1.1. California, Washington, and Michigan state rates each include cases from the SEER metropolitan
areas.

United States C
ancer Statistics: 1999 Incidence
26
continued
Table 2.1.2: All Cancer Sites Combined. Invasive Cancer Incidence Rates by U.S. Census Region and Division, Stateand Metropolitan Area, and Race (All Races, White, Black), United States: SEER and NPCR Registries that MeetQuality Criteria∗†
Females, 1999
All Races White BlackAge-Adjusted Crude Age-Adjusted Crude Age-Adjusted Crude
Area Rate‡§ (CI) Rate‡ (CI) Rate‡§ (CI) Rate‡ (CI) Rate‡§ (CI) Rate‡ (CI)
United States 420.1 (418.9- 421.2) 457.9 (456.7-459.2) 423.8 (422.5- 425.1) 487.4 (486.0-488.9) 381.7 (378.0- 385.4) 313.2 (310.2-316.3)
Northeast 438.6 (436.2- 441.0) 509.3 (506.6-512.1) 442.3 (439.7- 444.9) 543.5 (540.4-546.7) 367.9 (361.0- 375.0) 320.8 (314.8-326.9)
New England 454.3 (449.2- 459.4) 518.4 (512.7-524.2) 453.4 (448.1- 458.7) 540.2 (534.0-546.4) 361.0 (338.7- 384.5) 259.6 (244.0-275.9)
Connecticut 458.0 (448.4- 467.7) 532.3 (521.3-543.4) 457.1 (447.1- 467.3) 558.5 (546.5-570.7) 388.6 (354.3- 425.6) 306.9 (280.5-335.1)
Maine
Massachusetts 451.5 (444.5- 458.6) 516.0 (508.1-523.9) 449.6 (442.4- 456.9) 539.3 (530.9-547.9) 342.1 (311.2- 375.5) 230.7 (210.5-252.3)
New Hampshire 427.7 (411.5- 444.4) 437.1 (420.6-454.0) 424.7 (408.4- 441.4) 437.6 (420.9-454.7) ∼ ∼Rhode Island 487.0 (469.2- 505.4) 584.3 (563.6-605.6) 495.7 (477.3- 514.8) 617.1 (594.9-639.9) 400.1 (294.7- 540.5) 229.0 (174.3-295.3)
Vermont
Middle Atlantic 434.1 (431.4- 436.8) 506.6 (503.5-509.7) 438.7 (435.7- 441.7) 544.7 (541.0-548.3) 368.7 (361.3- 376.1) 329.0 (322.5-335.6)
New Jersey 450.0 (444.0- 456.1) 513.3 (506.5-520.2) 463.3 (456.6- 470.0) 568.2 (560.1-576.4) 402.0 (384.8- 420.0) 335.0 (320.9-349.6)
New York 423.9 (419.9- 427.8) 479.0 (474.6-483.4) 431.5 (427.1- 436.0) 523.8 (518.5-529.1) 332.0 (322.9- 341.4) 297.8 (289.7-306.1)
Pennsylvania 438.5 (433.8- 443.3) 544.1 (538.3-549.9) 433.2 (428.2- 438.2) 557.7 (551.4-564.0) 436.5 (419.7- 453.9) 409.6 (393.9-425.9)
Midwest
East North Central
Illinois 426.2 (421.2- 431.2) 455.6 (450.3-460.9) 424.7 (419.3- 430.2) 480.4 (474.4-486.5) 415.5 (401.4- 430.0) 340.1 (328.7-351.9)
Indiana
Michigan 432.6 (427.1- 438.3) 459.5 (453.6-465.4) 431.0 (425.1- 437.1) 480.0 (473.4-486.7) 432.1 (415.9- 448.8) 361.4 (347.9-375.2)
Detroit 436.1 (427.6- 444.7) 472.7 (463.5-482.1) 435.7 (426.0- 445.6) 509.3 (498.0-520.8) 439.7 (421.1- 458.9) 388.2 (371.8-405.0)
Ohio 422.8 (417.8- 427.9) 472.3 (466.7-477.9) 417.8 (412.5- 423.1) 483.3 (477.2-489.4) 390.1 (374.4- 406.4) 337.6 (324.1-351.7)
Wisconsin 405.3 (398.0- 412.8) 443.6 (435.6-451.6) 403.3 (395.8- 411.0) 460.1 (451.6-468.7) 449.9 (403.9- 500.6) 264.3 (239.2-291.4)
West North Central 413.6 (409.6- 417.6) 460.6 (456.3-465.0) 409.5 (405.4- 413.6) 471.9 (467.3-476.6) 409.5 (390.0- 429.9) 308.1 (293.5-323.2)
Iowa 417.6 (407.9- 427.5) 499.5 (488.1-511.0) 415.3 (405.5- 425.3) 506.1 (494.5-517.9) 428.3 (339.2- 535.3) 291.3 (231.7-361.6)
Kansas 416.4 (406.0- 427.1) 460.8 (449.4-472.4) 411.6 (400.9- 422.5) 470.2 (458.2-482.5) 381.1 (333.0- 434.6) 292.2 (255.6-332.5)
Minnesota 422.8 (414.7- 430.9) 443.0 (434.7-451.5) 416.4 (408.3- 424.7) 454.0 (445.2-462.9) 405.0 (337.0- 485.0) 203.9 (172.3-239.6)
Missouri 410.6 (403.5- 417.8) 461.2 (453.3-469.2) 408.2 (400.7- 415.8) 477.7 (469.1-486.4) 421.4 (397.1- 446.8) 346.7 (326.9-367.4)
Nebraska 406.0 (393.1- 419.2) 456.8 (442.6-471.4) 398.2 (385.2- 411.6) 460.4 (445.6-475.5) 321.3 (252.2- 405.7) 222.9 (176.2-278.2)
North Dakota 364.3 (344.5- 385.0) 418.9 (396.7-442.0) 365.2 (345.1- 386.3) 435.5 (412.1-459.9) ∼ ∼South Dakota
South
South Atlantic
Delaware 457.5 (437.0- 478.7) 489.3 (467.5-511.9) 459.3 (436.9- 482.7) 534.4 (508.5-561.3) 443.9 (390.0- 503.9) 329.7 (290.7-372.4)
District of Columbia 422.0 (399.7- 445.4) 495.6 (469.7-522.5) 392.5 (353.5- 436.9) 416.7 (376.3-460.3) 422.5 (395.1- 451.9) 525.9 (492.4-561.1)
Florida 441.6 (437.4- 445.8) 577.3 (572.0-582.7) 449.1 (444.6- 453.7) 639.7 (633.5-645.9) 377.0 (364.0- 390.4) 277.0 (267.7-286.5)
Georgia
Atlanta 405.1 (393.3- 417.3) 331.4 (321.9-341.2) 392.2 (378.7- 406.1) 369.0 (356.4-382.0) 452.1 (425.2- 480.6) 266.5 (251.6-282.0)
Maryland 415.2 (407.6- 423.0) 424.9 (417.1-432.9) 423.2 (414.2- 432.3) 482.4 (472.2-492.8) 382.7 (366.8- 399.2) 300.1 (288.0-312.6)
North Carolina 374.3 (368.5- 380.2) 403.5 (397.2-409.8) 383.1 (376.5- 389.8) 443.0 (435.5-450.7) 338.8 (325.9- 352.0) 294.5 (283.4-306.0)
South Carolina 377.8 (369.6- 386.2) 401.9 (393.2-410.8) 381.5 (371.9- 391.3) 444.6 (433.5-456.0) 358.7 (342.6- 375.4) 304.7 (291.1-318.8)
Virginia
West Virginia 432.5 (420.4- 444.8) 535.9 (521.2-551.0) 429.2 (417.0- 441.7) 534.5 (519.5-549.8) 419.2 (351.1- 497.8) 470.0 (395.7-554.3)
East South Central
Alabama
Kentucky 430.4 (421.8- 439.2) 470.3 (461.0-479.8) 427.3 (418.4- 436.3) 476.1 (466.3-486.1) 422.0 (387.4- 459.0) 366.3 (336.4-398.1)
Mississippi
Tennessee

Cancer Incidence, by U
.S. Census R
egion and Division, State, and M
etropolitan Area
27
Table 2.1.2: All Cancer Sites Combined. Invasive Cancer Incidence Rates by U.S. Census Region and Division, Stateand Metropolitan Area, and Race (All Races, White, Black), United States: SEER and NPCR Registries that MeetQuality Criteria∗† (continued)
Females, 1999
All Races White BlackAge-Adjusted Crude Age-Adjusted Crude Age-Adjusted Crude
Area Rate‡§ (CI) Rate‡ (CI) Rate‡§ (CI) Rate‡ (CI) Rate‡§ (CI) Rate‡ (CI)
West South Central
Arkansas
Louisiana 391.0 (382.9- 399.1) 398.5 (390.4-406.8) 396.4 (386.8- 406.1) 450.7 (439.9-461.6) 382.1 (366.6- 398.1) 309.9 (297.5-322.7)
Oklahoma
Texas
West 405.0 (402.7- 407.3) 400.2 (397.9-402.4) 414.4 (411.9- 417.0) 424.1 (421.5-426.7) 368.2 (357.5- 379.2) 284.8 (276.6-293.1)
Mountain
Arizona 375.0 (367.5- 382.6) 396.0 (388.1-404.1) 385.4 (377.5- 393.5) 427.5 (418.7-436.3) 260.5 (218.8- 308.8) 173.2 (146.5-203.4)
Colorado 391.6 (383.0- 400.4) 382.2 (373.8-390.8) 394.2 (385.3- 403.4) 393.7 (384.7-402.7) 311.9 (268.2- 361.8) 230.4 (199.5-264.6)
Idaho 397.1 (381.5- 413.2) 393.8 (378.5-409.7) 400.3 (384.6- 416.7) 402.0 (386.2-418.3) ∼ ∼Montana 385.4 (368.3- 403.3) 434.2 (415.1-454.1) 379.3 (361.9- 397.5) 444.1 (423.9-464.9) ∼ ∼Nevada
New Mexico 361.4 (349.0- 374.3) 359.2 (346.8-371.9) 377.5 (364.2- 391.3) 395.9 (381.9-410.3) 157.8 (102.9- 233.7) 120.8 ( 79.6-175.7)
Utah 349.6 (337.1- 362.4) 278.2 (268.3-288.3) 354.2 (341.4- 367.4) 286.4 (276.2-297.0) ∼ ∼Wyoming 387.8 (363.6- 413.5) 401.7 (376.7-428.0) 387.9 (363.4- 414.0) 408.7 (382.9-435.8) ∼ ∼
Pacific 414.8 (412.1- 417.6) 409.3 (406.7-412.0) 426.9 (423.9- 430.0) 436.6 (433.5-439.7) 381.7 (370.1- 393.6) 299.7 (290.7-308.9)
Alaska 437.5 (407.3- 469.9) 308.1 (288.4-328.8) 428.4 (394.3- 465.3) 316.3 (293.1-340.8) 255.0 (134.8- 498.2) 149.5 ( 87.1-239.3)
California 405.3 (402.2- 408.4) 392.9 (389.9-395.9) 418.8 (415.3- 422.3) 421.7 (418.2-425.2) 382.5 (370.4- 394.9) 307.8 (298.1-317.7)
San Francisco-Oakland 414.1 (405.6- 422.7) 447.3 (438.2-456.6) 444.7 (434.1- 455.4) 513.2 (501.2-525.5) 366.1 (341.0- 392.5) 322.8 (301.0-345.9)
San Jose-Monterey 398.3 (386.5- 410.3) 378.2 (367.0-389.6) 408.8 (395.5- 422.4) 408.0 (394.8-421.5) 302.1 (229.6- 393.4) 171.3 (133.6-216.5)
Los Angeles 385.9 (380.1- 391.8) 362.0 (356.6-367.5) 403.5 (396.6- 410.4) 384.2 (377.8-390.8) 376.7 (359.6- 394.3) 336.6 (321.4-352.3)
Hawaii 392.1 (376.9- 407.7) 430.9 (414.3-448.0) 444.0 (410.8- 479.5) 443.1 (410.3-477.9) 252.0 (147.1- 411.1) 148.2 ( 92.9-224.4)
Oregon 442.9 (433.3- 452.6) 493.5 (482.9-504.3) 445.3 (435.6- 455.3) 509.3 (498.2-520.6) 398.3 (314.7- 498.0) 268.3 (212.8-333.9)
Washington 455.2 (447.5- 463.0) 460.6 (452.8-468.5) 455.1 (447.0- 463.3) 478.6 (470.2-487.2) 383.2 (334.0- 438.7) 245.9 (215.6-279.2)
Seattle-Puget Sound 466.0 (456.6- 475.6) 469.3 (459.8-478.9) 476.7 (466.6- 486.9) 502.7 (492.1-513.5) 390.8 (337.4- 451.5) 244.8 (212.8-280.1)
∗ Data are from selected statewide and metropolitan area cancer registries that meet the following data quality criteria for all invasive cancer sites combined: case
ascertainment is at least 90% complete; ≥ 97% of cases pass a standard set of computerized edits; ≤ 5% of cases were ascertained by death certificate only; ≤ 3% of
cases are missing information on sex; ≤ 5% of cases are missing information on race; ≤ 3% of cases are missing information on age. See Appendix H for registry-specific
data quality information. U.S. rates cover approximately 78% of the U.S. population.
† Excludes basal and squamous cell carcinomas of the skin except when these occur on the skin of the genital organs, and in situ cancers except urinary bladder.
‡ Rates are per 100,000 persons. Population denominators for 1999 are projected from the 1990 census and may not accurately reflect the 1999 population size. Caution
should be used in interpreting rates based on these projected populations.
§ Rates are age-adjusted to the 2000 U.S. standard population.
∼ Rates are suppressed if fewer than 16 cases were reported in the specific area-race category.
Notes: Cases from suppressed rates are included in the U.S. and region/division rates. Observed region/division age-adjusted incidence rates are presented for
regions/divisions with ≥ 78% of the population covered by registries that meet the data quality criteria specified above, and if the 95% confidence intervals
around the observed region/division rates for each of four major cancers include "bias-corrected" estimated region/division rates (see technical notes) for
each of those cancers. U.S rates are as presented in Table 1.2. California, Washington, and Michigan state rates each include cases from the SEER metropolitan
areas.

United States C
ancer Statistics: 1999 Incidence
28
continued
Table 2.2.1: Cancer of the Oral Cavity and Pharynx. Invasive Cancer Incidence Rates by U.S. Census Region andDivision, State and Metropolitan Area, and Race (All Races, White, Black), United States: SEER and NPCR Registriesthat Meet Quality Criteria∗†
Males, 1999
All Races White BlackAge-Adjusted Crude Age-Adjusted Crude Age-Adjusted Crude
Area Rate‡§ (CI) Rate‡ (CI) Rate‡§ (CI) Rate‡ (CI) Rate‡§ (CI) Rate‡ (CI)
United States 15.8 ( 15.5- 16.0) 14.6 ( 14.4- 14.8) 15.2 ( 15.0- 15.5) 14.9 ( 14.6- 15.1) 19.2 ( 18.3- 20.2) 13.6 ( 12.9- 14.2)
Northeast 15.4 ( 14.9- 15.9) 14.9 ( 14.4- 15.4) 14.7 ( 14.1- 15.2) 15.0 ( 14.4- 15.5) 17.6 ( 15.9- 19.6) 12.8 ( 11.6- 14.2)
New England 16.0 ( 15.0- 17.2) 15.2 ( 14.2- 16.2) 15.6 ( 14.6- 16.8) 15.5 ( 14.4- 16.6) 20.8 ( 15.0- 29.0) 12.3 ( 9.0- 16.4)
Connecticut 16.0 ( 14.1- 18.1) 15.5 ( 13.6- 17.6) 15.4 ( 13.4- 17.6) 15.7 ( 13.7- 17.9) 23.0 ( 14.5- 37.0) 15.7 ( 10.0- 23.6)
Maine
Massachusetts 16.2 ( 14.7- 17.8) 15.3 ( 13.9- 16.8) 15.8 ( 14.3- 17.4) 15.7 ( 14.2- 17.3) 19.8 ( 11.7- 33.7) 10.2 ( 6.2- 15.7)
New Hampshire 15.2 ( 12.0- 19.2) 13.5 ( 10.7- 16.8) 15.1 ( 11.9- 19.1) 13.5 ( 10.7- 16.9) ∼ ∼Rhode Island 16.1 ( 12.6- 20.2) 15.5 ( 12.2- 19.5) 16.1 ( 12.6- 20.5) 16.2 ( 12.7- 20.5) ∼ ∼Vermont
Middle Atlantic 15.2 ( 14.6- 15.7) 14.8 ( 14.2- 15.4) 14.3 ( 13.7- 14.9) 14.8 ( 14.2- 15.4) 17.3 ( 15.5- 19.4) 12.9 ( 11.6- 14.4)
New Jersey 14.3 ( 13.1- 15.6) 13.7 ( 12.6- 14.9) 14.0 ( 12.8- 15.4) 14.3 ( 13.0- 15.7) 15.9 ( 12.3- 20.7) 12.1 ( 9.4- 15.4)
New York 15.3 ( 14.4- 16.2) 14.5 ( 13.7- 15.3) 14.4 ( 13.5- 15.3) 14.5 ( 13.6- 15.5) 15.2 ( 12.9- 17.8) 11.6 ( 9.9- 13.4)
Pennsylvania 15.5 ( 14.6- 16.6) 16.0 ( 14.9- 17.0) 14.5 ( 13.5- 15.6) 15.4 ( 14.4- 16.5) 23.9 ( 19.3- 29.5) 17.3 ( 14.0- 21.2)
Midwest
East North Central
Illinois 16.0 ( 15.0- 17.1) 14.4 ( 13.5- 15.4) 15.2 ( 14.1- 16.4) 14.3 ( 13.3- 15.4) 21.5 ( 18.0- 25.8) 15.6 ( 13.1- 18.4)
Indiana
Michigan 15.4 ( 14.2- 16.6) 14.1 ( 13.1- 15.2) 14.7 ( 13.5- 16.0) 14.0 ( 12.9- 15.2) 21.0 ( 17.1- 25.6) 15.7 ( 12.8- 19.1)
Detroit 16.3 ( 14.5- 18.4) 15.1 ( 13.4- 16.9) 14.3 ( 12.3- 16.5) 13.8 ( 12.0- 15.9) 25.1 ( 20.1- 31.1) 19.6 ( 15.8- 24.1)
Ohio 13.0 ( 12.0- 14.1) 12.2 ( 11.3- 13.2) 12.5 ( 11.5- 13.5) 12.1 ( 11.2- 13.2) 15.5 ( 12.0- 19.9) 11.3 ( 8.8- 14.2)
Wisconsin 17.2 ( 15.6- 19.0) 16.3 ( 14.7- 17.9) 16.5 ( 14.9- 18.2) 16.2 ( 14.6- 17.9) 43.4 ( 26.2- 71.6) 18.2 ( 11.9- 26.7)
West North Central 16.2 ( 15.3- 17.1) 15.2 ( 14.4- 16.0) 15.7 ( 14.9- 16.6) 15.3 ( 14.4- 16.2) 18.0 ( 13.6- 23.7) 11.8 ( 9.0- 15.2)
Iowa 16.7 ( 14.6- 19.0) 16.7 ( 14.6- 18.9) 16.6 ( 14.5- 18.9) 16.9 ( 14.7- 19.2) ∼ ∼Kansas 16.4 ( 14.2- 18.9) 15.0 ( 13.0- 17.3) 15.5 ( 13.3- 18.0) 14.7 ( 12.6- 17.0) ∼ ∼Minnesota 16.9 ( 15.2- 18.7) 15.1 ( 13.5- 16.7) 16.6 ( 14.9- 18.5) 15.5 ( 13.9- 17.2) ∼ ∼Missouri 15.4 ( 13.9- 17.1) 14.8 ( 13.4- 16.3) 14.9 ( 13.3- 16.6) 14.8 ( 13.3- 16.5) 18.3 ( 12.9- 25.9) 13.2 ( 9.3- 18.1)
Nebraska 15.1 ( 12.4- 18.1) 14.2 ( 11.8- 17.1) 14.4 ( 11.8- 17.4) 14.0 ( 11.5- 16.9) ∼ ∼North Dakota 16.4 ( 12.2- 21.7) 15.9 ( 11.8- 20.9) 16.2 ( 11.9- 21.5) 16.3 ( 12.0- 21.6) ∼ ∼South Dakota
South
South Atlantic
Delaware 17.5 ( 13.3- 22.8) 16.6 ( 12.7- 21.4) 16.1 ( 11.8- 21.8) 16.4 ( 12.0- 21.8) ∼ ∼District of Columbia 24.5 ( 18.7- 31.9) 24.6 ( 18.8- 31.7) ∼ ∼ 29.1 ( 21.1- 39.6) 29.4 ( 21.3- 39.6)
Florida 20.0 ( 19.1- 21.0) 22.3 ( 21.2- 23.4) 19.7 ( 18.7- 20.8) 23.9 ( 22.7- 25.2) 20.3 ( 16.9- 24.4) 12.7 ( 10.7- 15.0)
Georgia
Atlanta 13.4 ( 11.1- 16.3) 10.2 ( 8.5- 12.1) 11.4 ( 9.0- 14.6) 9.7 ( 7.7- 12.0) 20.3 ( 14.1- 29.8) 11.8 ( 8.7- 15.7)
Maryland 16.4 ( 14.8- 18.2) 14.8 ( 13.3- 16.4) 15.7 ( 13.8- 17.7) 15.4 ( 13.6- 17.4) 18.0 ( 14.3- 22.7) 13.3 ( 10.7- 16.3)
North Carolina 16.0 ( 14.6- 17.5) 14.5 ( 13.3- 15.7) 14.5 ( 13.1- 16.1) 14.1 ( 12.7- 15.5) 22.7 ( 19.0- 27.2) 16.9 ( 14.1- 20.0)
South Carolina 19.9 ( 17.9- 22.3) 18.6 ( 16.7- 20.6) 18.6 ( 16.4- 21.2) 19.2 ( 16.9- 21.7) 23.7 ( 19.0- 29.6) 17.1 ( 13.8- 20.9)
Virginia
West Virginia 16.3 ( 13.8- 19.2) 17.8 ( 15.1- 20.8) 15.5 ( 13.1- 18.4) 17.2 ( 14.5- 20.2) ∼ ∼East South Central
Alabama
Kentucky 15.4 ( 13.6- 17.3) 14.5 ( 12.8- 16.3) 14.5 ( 12.7- 16.5) 13.9 ( 12.2- 15.8) 19.7 ( 12.0- 31.7) 14.6 ( 8.9- 22.5)
Mississippi
Tennessee

Cancer Incidence, by U
.S. Census R
egion and Division, State, and M
etropolitan Area
29
Table 2.2.1: Cancer of the Oral Cavity and Pharynx. Invasive Cancer Incidence Rates by U.S. Census Region andDivision, State and Metropolitan Area, and Race (All Races, White, Black), United States: SEER and NPCR Registriesthat Meet Quality Criteria∗† (continued)
Males, 1999
All Races White BlackAge-Adjusted Crude Age-Adjusted Crude Age-Adjusted Crude
Area Rate‡§ (CI) Rate‡ (CI) Rate‡§ (CI) Rate‡ (CI) Rate‡§ (CI) Rate‡ (CI)
West South Central
Arkansas
Louisiana 20.2 ( 18.2- 22.4) 17.8 ( 16.1- 19.7) 19.1 ( 16.8- 21.7) 18.6 ( 16.4- 21.0) 24.3 ( 19.9- 29.5) 17.0 ( 14.0- 20.4)
Oklahoma
Texas
West 14.4 ( 13.9- 14.9) 12.2 ( 11.8- 12.6) 14.6 ( 14.0- 15.1) 12.8 ( 12.3- 13.2) 13.6 ( 11.3- 16.2) 8.9 ( 7.5- 10.5)
Mountain
Arizona 12.1 ( 10.7- 13.7) 11.2 ( 9.9- 12.7) 12.3 ( 10.9- 14.0) 12.0 ( 10.6- 13.6) ∼ ∼Colorado 11.2 ( 9.6- 13.1) 9.4 ( 8.1- 10.8) 11.4 ( 9.7- 13.3) 9.8 ( 8.4- 11.3) ∼ ∼Idaho 14.5 ( 11.5- 18.1) 13.0 ( 10.3- 16.1) 14.5 ( 11.5- 18.2) 13.2 ( 10.5- 16.4) ∼ ∼Montana 12.4 ( 9.4- 16.3) 13.0 ( 9.8- 16.8) 12.4 ( 9.3- 16.3) 13.5 ( 10.2- 17.6) ∼ ∼Nevada
New Mexico 14.0 ( 11.4- 17.0) 12.5 ( 10.2- 15.1) 14.7 ( 12.0- 17.9) 13.9 ( 11.4- 16.9) ∼ ∼Utah 10.5 ( 8.3- 13.3) 7.4 ( 5.8- 9.2) 10.7 ( 8.4- 13.6) 7.6 ( 6.0- 9.5) ∼ ∼Wyoming 13.9 ( 9.2- 20.4) 12.4 ( 8.4- 17.8) 13.3 ( 8.7- 19.8) 12.1 ( 8.0- 17.5) ∼ ∼
Pacific 15.2 ( 14.6- 15.8) 12.8 ( 12.3- 13.3) 15.5 ( 14.8- 16.1) 13.4 ( 12.9- 14.0) 14.6 ( 12.2- 17.6) 9.7 ( 8.1- 11.4)
Alaska 17.4 ( 11.6- 27.1) 12.6 ( 9.0- 17.1) 12.5 ( 7.2- 23.1) 10.5 ( 6.8- 15.4) ∼ ∼California 15.3 ( 14.6- 16.0) 12.5 ( 12.0- 13.1) 15.6 ( 14.8- 16.3) 13.1 ( 12.5- 13.7) 15.4 ( 12.8- 18.6) 10.5 ( 8.8- 12.5)
San Francisco-Oakland 16.3 ( 14.5- 18.3) 14.9 ( 13.2- 16.7) 16.4 ( 14.3- 18.9) 15.8 ( 13.8- 18.1) 14.2 ( 9.1- 21.8) 10.6 ( 6.9- 15.7)
San Jose-Monterey 14.0 ( 11.7- 16.8) 11.2 ( 9.3- 13.2) 13.6 ( 11.0- 16.6) 11.1 ( 9.1- 13.5) ∼ ∼Los Angeles 13.9 ( 12.7- 15.2) 10.7 ( 9.8- 11.7) 14.1 ( 12.7- 15.6) 10.8 ( 9.7- 11.9) 16.4 ( 12.6- 21.3) 13.2 ( 10.2- 16.8)
Hawaii 13.7 ( 10.9- 17.2) 13.6 ( 10.7- 16.9) 16.8 ( 10.7- 25.4) 14.8 ( 9.6- 21.8) ∼ ∼Oregon 16.4 ( 14.5- 18.6) 16.0 ( 14.1- 18.1) 16.7 ( 14.7- 18.9) 16.7 ( 14.7- 18.9) ∼ ∼Washington 14.1 ( 12.7- 15.7) 12.5 ( 11.2- 13.9) 14.3 ( 12.8- 15.9) 13.2 ( 11.9- 14.7) ∼ ∼
Seattle-Puget Sound 14.5 ( 12.7- 16.4) 12.8 ( 11.3- 14.5) 15.2 ( 13.3- 17.3) 14.1 ( 12.4- 16.1) ∼ ∼∗ Data are from selected statewide and metropolitan area cancer registries that meet the following data quality criteria for all invasive cancer sites combined: case
ascertainment is at least 90% complete; ≥ 97% of cases pass a standard set of computerized edits; ≤ 5% of cases were ascertained by death certificate only; ≤ 3% of
cases are missing information on sex; ≤ 5% of cases are missing information on race; ≤ 3% of cases are missing information on age. See Appendix H for registry-specific
data quality information. U.S. rates cover approximately 78% of the U.S. population.
† Invasive cancers only
‡ Rates are per 100,000 persons. Population denominators for 1999 are projected from the 1990 census and may not accurately reflect the 1999 population size. Caution
should be used in interpreting rates based on these projected populations.
§ Rates are age-adjusted to the 2000 U.S. standard population.
∼ Rates are suppressed if fewer than 16 cases were reported in the specific area-race category.
Notes: Cases from suppressed rates are included in the U.S. and region/division rates. Observed region/division age-adjusted incidence rates are presented for
regions/divisions with ≥ 78% of the population covered by registries that meet the data quality criteria specified above, and if the 95% confidence intervals
around the observed region/division rates for each of four major cancers include "bias-corrected" estimated region/division rates (see technical notes) for
each of those cancers. U.S rates are as presented in Table 1.1. California, Washington, and Michigan state rates each include cases from the SEER metropolitan
areas.

United States C
ancer Statistics: 1999 Incidence
30
Table 2.2.2: Cancer of the Oral Cavity and Pharynx. Invasive Cancer Incidence Rates by U.S. Census Region andDivision, State and Metropolitan Area, and Race (All Races, White, Black), United States: SEER and NPCR Registriesthat Meet Quality Criteria∗†
Females, 1999
All Races White BlackAge-Adjusted Crude Age-Adjusted Crude Age-Adjusted Crude
Area Rate‡§ (CI) Rate‡ (CI) Rate‡§ (CI) Rate‡ (CI) Rate‡§ (CI) Rate‡ (CI)
United States 6.3 ( 6.2- 6.5) 6.9 ( 6.7- 7.0) 6.2 ( 6.0- 6.3) 7.1 ( 7.0- 7.3) 6.3 ( 5.8- 6.8) 5.3 ( 4.9- 5.7)
Northeast 6.3 ( 6.0- 6.6) 7.3 ( 7.0- 7.7) 6.1 ( 5.8- 6.4) 7.6 ( 7.2- 7.9) 6.2 ( 5.3- 7.2) 5.5 ( 4.7- 6.3)
New England 7.1 ( 6.5- 7.8) 8.1 ( 7.4- 8.9) 7.1 ( 6.4- 7.8) 8.3 ( 7.6- 9.1) ∼ ∼Connecticut 6.6 ( 5.5- 7.9) 7.9 ( 6.6- 9.3) 6.6 ( 5.5- 8.0) 8.2 ( 6.8- 9.8) ∼ ∼Maine
Massachusetts 7.4 ( 6.6- 8.4) 8.4 ( 7.4- 9.5) 7.3 ( 6.4- 8.3) 8.7 ( 7.6- 9.8) ∼ ∼New Hampshire 6.8 ( 4.9- 9.3) 6.7 ( 4.8- 9.1) 6.9 ( 4.9- 9.4) 6.9 ( 4.9- 9.3) ∼ ∼Rhode Island 7.3 ( 5.3- 10.0) 8.7 ( 6.4- 11.7) 7.1 ( 5.1- 10.0) 8.7 ( 6.2- 11.8) ∼ ∼Vermont
Middle Atlantic 6.1 ( 5.7- 6.4) 7.1 ( 6.7- 7.5) 5.8 ( 5.5- 6.2) 7.3 ( 6.9- 7.7) 6.3 ( 5.4- 7.3) 5.7 ( 4.9- 6.6)
New Jersey 7.1 ( 6.3- 7.9) 8.1 ( 7.2- 9.0) 6.9 ( 6.1- 7.8) 8.6 ( 7.6- 9.6) 7.7 ( 5.6- 10.5) 6.8 ( 5.0- 9.2)
New York 5.7 ( 5.3- 6.2) 6.4 ( 5.9- 7.0) 5.5 ( 5.0- 6.0) 6.7 ( 6.1- 7.3) 5.4 ( 4.3- 6.7) 4.8 ( 3.8- 6.0)
Pennsylvania 5.9 ( 5.4- 6.5) 7.5 ( 6.8- 8.2) 5.5 ( 5.0- 6.1) 7.3 ( 6.6- 8.1) 7.4 ( 5.3- 10.0) 6.9 ( 5.0- 9.3)
Midwest
East North Central
Illinois 6.5 ( 5.9- 7.1) 6.8 ( 6.2- 7.5) 6.3 ( 5.7- 7.1) 7.0 ( 6.3- 7.8) 6.8 ( 5.1- 8.8) 5.8 ( 4.4- 7.5)
Indiana
Michigan 6.6 ( 5.9- 7.3) 7.0 ( 6.3- 7.8) 6.5 ( 5.8- 7.3) 7.2 ( 6.5- 8.1) 6.2 ( 4.4- 8.5) 5.2 ( 3.7- 7.1)
Detroit 6.8 ( 5.7- 7.9) 7.3 ( 6.2- 8.5) 6.7 ( 5.5- 8.0) 7.9 ( 6.5- 9.4) 6.1 ( 4.1- 8.8) 5.5 ( 3.7- 7.8)
Ohio 5.9 ( 5.3- 6.5) 6.6 ( 6.0- 7.3) 5.8 ( 5.2- 6.4) 6.7 ( 6.0- 7.4) 6.1 ( 4.3- 8.5) 5.4 ( 3.8- 7.4)
Wisconsin 6.2 ( 5.3- 7.2) 6.7 ( 5.8- 7.8) 6.2 ( 5.3- 7.2) 7.0 ( 6.0- 8.1) ∼ ∼West North Central 5.6 ( 5.1- 6.1) 6.3 ( 5.8- 6.8) 5.5 ( 5.0- 6.0) 6.4 ( 5.9- 7.0) 5.4 ( 3.4- 8.2) 4.2 ( 2.7- 6.3)
Iowa 5.0 ( 4.0- 6.2) 6.1 ( 4.9- 7.5) 5.0 ( 4.0- 6.2) 6.2 ( 5.0- 7.6) ∼ ∼Kansas 5.4 ( 4.3- 6.7) 6.3 ( 5.0- 7.8) 5.3 ( 4.2- 6.7) 6.5 ( 5.1- 8.1) ∼ ∼Minnesota 6.1 ( 5.2- 7.2) 6.4 ( 5.4- 7.4) 5.8 ( 4.9- 6.9) 6.3 ( 5.3- 7.4) ∼ ∼Missouri 5.5 ( 4.7- 6.4) 6.1 ( 5.2- 7.1) 5.4 ( 4.6- 6.4) 6.3 ( 5.4- 7.4) ∼ ∼Nebraska 6.3 ( 4.8- 8.2) 7.3 ( 5.6- 9.3) 6.2 ( 4.7- 8.1) 7.3 ( 5.5- 9.4) ∼ ∼North Dakota 4.9 ( 2.9- 8.0) 6.0 ( 3.6- 9.3) 4.8 ( 2.8- 7.9) 6.0 ( 3.6- 9.5) ∼ ∼South Dakota
South
South Atlantic
Delaware 5.8 ( 3.7- 8.8) 5.9 ( 3.8- 8.9) 6.5 ( 4.0- 10.1) 7.0 ( 4.3- 10.7) ∼ ∼District of Columbia 6.4 ( 3.9- 10.2) 7.6 ( 4.7- 11.6) ∼ ∼ ∼ ∼Florida 7.9 ( 7.4- 8.5) 10.3 ( 9.6- 11.0) 8.0 ( 7.4- 8.6) 11.3 ( 10.5- 12.2) 6.0 ( 4.5- 7.9) 4.8 ( 3.6- 6.2)
Georgia
Atlanta 6.2 ( 4.8- 7.9) 4.9 ( 3.8- 6.2) 6.4 ( 4.7- 8.4) 5.7 ( 4.2- 7.5) 5.0 ( 2.7- 9.0) 3.5 ( 2.0- 5.8)
Maryland 6.2 ( 5.3- 7.2) 6.3 ( 5.4- 7.3) 5.7 ( 4.7- 6.9) 6.5 ( 5.4- 7.9) 6.8 ( 4.8- 9.3) 5.3 ( 3.8- 7.2)
North Carolina 5.9 ( 5.2- 6.7) 6.4 ( 5.6- 7.2) 5.8 ( 5.0- 6.7) 6.8 ( 5.9- 7.8) 6.3 ( 4.6- 8.3) 5.5 ( 4.0- 7.2)
South Carolina 6.8 ( 5.7- 8.0) 7.2 ( 6.1- 8.5) 6.5 ( 5.3- 7.9) 7.7 ( 6.3- 9.3) 7.2 ( 5.1- 9.9) 6.3 ( 4.5- 8.6)
Virginia
West Virginia 5.8 ( 4.5- 7.4) 7.4 ( 5.7- 9.3) 5.9 ( 4.6- 7.6) 7.6 ( 5.9- 9.6) ∼ ∼East South Central
Alabama
Kentucky 6.1 ( 5.1- 7.2) 6.6 ( 5.6- 7.8) 6.1 ( 5.1- 7.3) 6.7 ( 5.6- 8.0) ∼ ∼Mississippi
Tennessee
continued
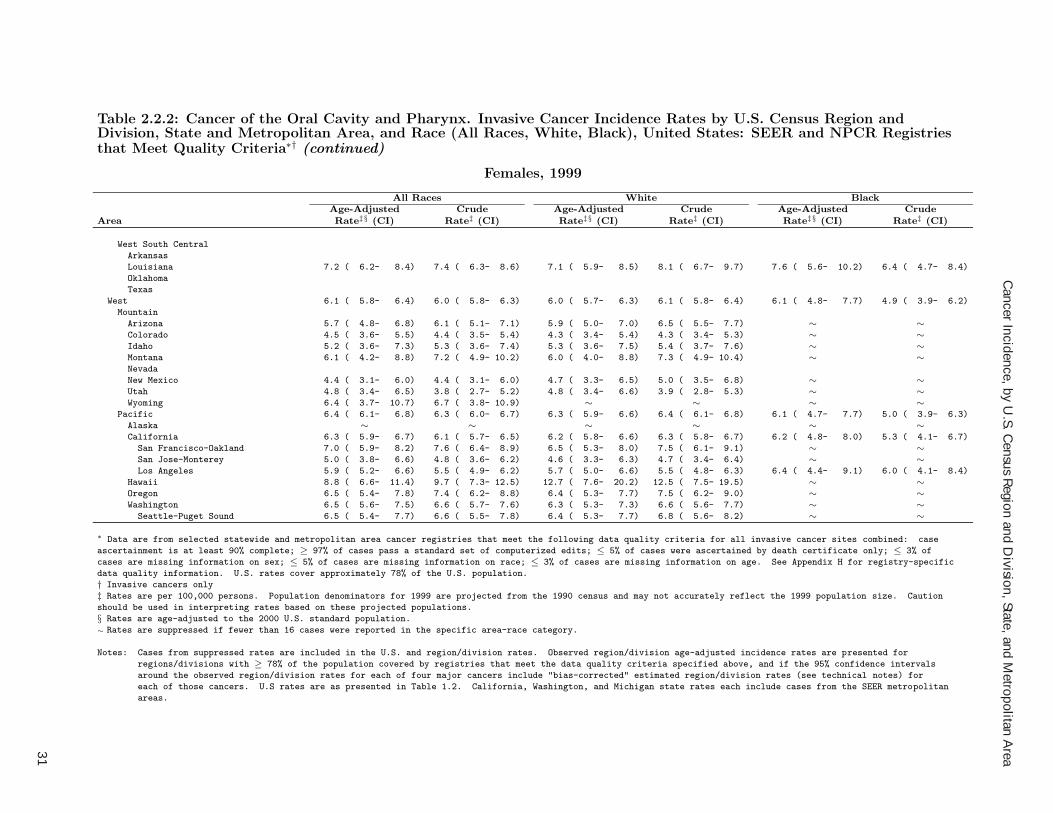
Cancer Incidence, by U
.S. Census R
egion and Division, State, and M
etropolitan Area
31
Table 2.2.2: Cancer of the Oral Cavity and Pharynx. Invasive Cancer Incidence Rates by U.S. Census Region andDivision, State and Metropolitan Area, and Race (All Races, White, Black), United States: SEER and NPCR Registriesthat Meet Quality Criteria∗† (continued)
Females, 1999
All Races White BlackAge-Adjusted Crude Age-Adjusted Crude Age-Adjusted Crude
Area Rate‡§ (CI) Rate‡ (CI) Rate‡§ (CI) Rate‡ (CI) Rate‡§ (CI) Rate‡ (CI)
West South Central
Arkansas
Louisiana 7.2 ( 6.2- 8.4) 7.4 ( 6.3- 8.6) 7.1 ( 5.9- 8.5) 8.1 ( 6.7- 9.7) 7.6 ( 5.6- 10.2) 6.4 ( 4.7- 8.4)
Oklahoma
Texas
West 6.1 ( 5.8- 6.4) 6.0 ( 5.8- 6.3) 6.0 ( 5.7- 6.3) 6.1 ( 5.8- 6.4) 6.1 ( 4.8- 7.7) 4.9 ( 3.9- 6.2)
Mountain
Arizona 5.7 ( 4.8- 6.8) 6.1 ( 5.1- 7.1) 5.9 ( 5.0- 7.0) 6.5 ( 5.5- 7.7) ∼ ∼Colorado 4.5 ( 3.6- 5.5) 4.4 ( 3.5- 5.4) 4.3 ( 3.4- 5.4) 4.3 ( 3.4- 5.3) ∼ ∼Idaho 5.2 ( 3.6- 7.3) 5.3 ( 3.6- 7.4) 5.3 ( 3.6- 7.5) 5.4 ( 3.7- 7.6) ∼ ∼Montana 6.1 ( 4.2- 8.8) 7.2 ( 4.9- 10.2) 6.0 ( 4.0- 8.8) 7.3 ( 4.9- 10.4) ∼ ∼Nevada
New Mexico 4.4 ( 3.1- 6.0) 4.4 ( 3.1- 6.0) 4.7 ( 3.3- 6.5) 5.0 ( 3.5- 6.8) ∼ ∼Utah 4.8 ( 3.4- 6.5) 3.8 ( 2.7- 5.2) 4.8 ( 3.4- 6.6) 3.9 ( 2.8- 5.3) ∼ ∼Wyoming 6.4 ( 3.7- 10.7) 6.7 ( 3.8- 10.9) ∼ ∼ ∼ ∼
Pacific 6.4 ( 6.1- 6.8) 6.3 ( 6.0- 6.7) 6.3 ( 5.9- 6.6) 6.4 ( 6.1- 6.8) 6.1 ( 4.7- 7.7) 5.0 ( 3.9- 6.3)
Alaska ∼ ∼ ∼ ∼ ∼ ∼California 6.3 ( 5.9- 6.7) 6.1 ( 5.7- 6.5) 6.2 ( 5.8- 6.6) 6.3 ( 5.8- 6.7) 6.2 ( 4.8- 8.0) 5.3 ( 4.1- 6.7)
San Francisco-Oakland 7.0 ( 5.9- 8.2) 7.6 ( 6.4- 8.9) 6.5 ( 5.3- 8.0) 7.5 ( 6.1- 9.1) ∼ ∼San Jose-Monterey 5.0 ( 3.8- 6.6) 4.8 ( 3.6- 6.2) 4.6 ( 3.3- 6.3) 4.7 ( 3.4- 6.4) ∼ ∼Los Angeles 5.9 ( 5.2- 6.6) 5.5 ( 4.9- 6.2) 5.7 ( 5.0- 6.6) 5.5 ( 4.8- 6.3) 6.4 ( 4.4- 9.1) 6.0 ( 4.1- 8.4)
Hawaii 8.8 ( 6.6- 11.4) 9.7 ( 7.3- 12.5) 12.7 ( 7.6- 20.2) 12.5 ( 7.5- 19.5) ∼ ∼Oregon 6.5 ( 5.4- 7.8) 7.4 ( 6.2- 8.8) 6.4 ( 5.3- 7.7) 7.5 ( 6.2- 9.0) ∼ ∼Washington 6.5 ( 5.6- 7.5) 6.6 ( 5.7- 7.6) 6.3 ( 5.3- 7.3) 6.6 ( 5.6- 7.7) ∼ ∼
Seattle-Puget Sound 6.5 ( 5.4- 7.7) 6.6 ( 5.5- 7.8) 6.4 ( 5.3- 7.7) 6.8 ( 5.6- 8.2) ∼ ∼∗ Data are from selected statewide and metropolitan area cancer registries that meet the following data quality criteria for all invasive cancer sites combined: case
ascertainment is at least 90% complete; ≥ 97% of cases pass a standard set of computerized edits; ≤ 5% of cases were ascertained by death certificate only; ≤ 3% of
cases are missing information on sex; ≤ 5% of cases are missing information on race; ≤ 3% of cases are missing information on age. See Appendix H for registry-specific
data quality information. U.S. rates cover approximately 78% of the U.S. population.
† Invasive cancers only
‡ Rates are per 100,000 persons. Population denominators for 1999 are projected from the 1990 census and may not accurately reflect the 1999 population size. Caution
should be used in interpreting rates based on these projected populations.
§ Rates are age-adjusted to the 2000 U.S. standard population.
∼ Rates are suppressed if fewer than 16 cases were reported in the specific area-race category.
Notes: Cases from suppressed rates are included in the U.S. and region/division rates. Observed region/division age-adjusted incidence rates are presented for
regions/divisions with ≥ 78% of the population covered by registries that meet the data quality criteria specified above, and if the 95% confidence intervals
around the observed region/division rates for each of four major cancers include "bias-corrected" estimated region/division rates (see technical notes) for
each of those cancers. U.S rates are as presented in Table 1.2. California, Washington, and Michigan state rates each include cases from the SEER metropolitan
areas.

United States C
ancer Statistics: 1999 Incidence
32
Table 2.3.1: Cancer of the Esophagus. Invasive Cancer Incidence Rates by U.S. Census Region and Division, Stateand Metropolitan Area, and Race (All Races, White, Black), United States: SEER and NPCR Registries that MeetQuality Criteria∗†
Males, 1999
All Races White BlackAge-Adjusted Crude Age-Adjusted Crude Age-Adjusted Crude
Area Rate‡§ (CI) Rate‡ (CI) Rate‡§ (CI) Rate‡ (CI) Rate‡§ (CI) Rate‡ (CI)
United States 8.8 ( 8.6- 8.9) 7.9 ( 7.8- 8.1) 8.4 ( 8.2- 8.6) 8.1 ( 7.9- 8.3) 13.0 ( 12.2- 13.9) 8.3 ( 7.8- 8.8)
Northeast 9.2 ( 8.8- 9.6) 8.8 ( 8.4- 9.1) 8.8 ( 8.4- 9.2) 9.0 ( 8.6- 9.4) 13.2 ( 11.6- 15.1) 8.7 ( 7.6- 9.8)
New England 10.1 ( 9.3- 11.0) 9.5 ( 8.7- 10.3) 10.0 ( 9.1- 10.9) 9.8 ( 9.0- 10.8) 15.9 ( 10.4- 24.2) 7.8 ( 5.2- 11.2)
Connecticut 9.3 ( 7.8- 11.0) 9.0 ( 7.6- 10.6) 9.1 ( 7.6- 10.8) 9.3 ( 7.8- 11.1) ∼ ∼Maine
Massachusetts 10.8 ( 9.6- 12.2) 10.1 ( 9.0- 11.3) 10.7 ( 9.5- 12.1) 10.5 ( 9.3- 11.8) ∼ ∼New Hampshire 9.4 ( 6.9- 12.7) 8.1 ( 6.0- 10.8) 9.4 ( 6.8- 12.6) 8.1 ( 6.0- 10.8) ∼ ∼Rhode Island 9.2 ( 6.7- 12.5) 9.2 ( 6.7- 12.4) 9.2 ( 6.6- 12.5) 9.6 ( 6.9- 13.0) ∼ ∼Vermont
Middle Atlantic 8.9 ( 8.5- 9.3) 8.5 ( 8.1- 9.0) 8.5 ( 8.0- 8.9) 8.7 ( 8.2- 9.2) 13.0 ( 11.3- 14.9) 8.8 ( 7.7- 10.0)
New Jersey 8.6 ( 7.6- 9.6) 8.0 ( 7.2- 9.0) 8.5 ( 7.5- 9.5) 8.6 ( 7.6- 9.7) 12.2 ( 8.6- 17.0) 7.7 ( 5.6- 10.4)
New York 8.5 ( 7.9- 9.2) 7.9 ( 7.3- 8.5) 8.0 ( 7.3- 8.7) 8.0 ( 7.3- 8.7) 12.5 ( 10.3- 15.0) 8.6 ( 7.2- 10.2)
Pennsylvania 9.6 ( 8.8- 10.4) 9.8 ( 9.0- 10.7) 9.0 ( 8.3- 9.9) 9.7 ( 8.9- 10.6) 14.9 ( 11.2- 19.6) 10.4 ( 7.9- 13.5)
Midwest
East North Central
Illinois 10.1 ( 9.2- 11.0) 8.7 ( 8.0- 9.5) 9.4 ( 8.5- 10.3) 8.6 ( 7.8- 9.5) 16.2 ( 12.9- 20.2) 10.2 ( 8.2- 12.5)
Indiana
Michigan 10.3 ( 9.3- 11.3) 9.1 ( 8.3- 10.0) 10.2 ( 9.2- 11.3) 9.5 ( 8.6- 10.5) 11.8 ( 8.8- 15.6) 8.2 ( 6.1- 10.7)
Detroit 8.7 ( 7.3- 10.2) 7.8 ( 6.6- 9.2) 8.5 ( 7.0- 10.2) 8.1 ( 6.7- 9.7) 10.3 ( 7.2- 14.5) 7.9 ( 5.5- 10.9)
Ohio 10.2 ( 9.3- 11.1) 9.4 ( 8.6- 10.3) 9.9 ( 9.0- 10.9) 9.6 ( 8.8- 10.6) 12.2 ( 8.9- 16.6) 7.8 ( 5.8- 10.4)
Wisconsin 9.5 ( 8.3- 10.9) 8.7 ( 7.6- 9.9) 9.2 ( 8.0- 10.5) 8.8 ( 7.6- 10.0) ∼ ∼West North Central 8.1 ( 7.5- 8.7) 7.5 ( 6.9- 8.1) 8.0 ( 7.3- 8.6) 7.7 ( 7.1- 8.3) 11.5 ( 7.9- 16.5) 6.9 ( 4.8- 9.6)
Iowa 8.6 ( 7.1- 10.3) 8.6 ( 7.1- 10.3) 8.3 ( 6.8- 10.0) 8.5 ( 7.0- 10.2) ∼ ∼Kansas 6.9 ( 5.5- 8.6) 6.4 ( 5.1- 7.9) 6.4 ( 5.0- 8.0) 6.0 ( 4.7- 7.6) ∼ ∼Minnesota 8.8 ( 7.6- 10.3) 7.7 ( 6.6- 8.9) 8.9 ( 7.7- 10.4) 8.1 ( 7.0- 9.4) ∼ ∼Missouri 7.9 ( 6.8- 9.1) 7.4 ( 6.4- 8.5) 7.8 ( 6.7- 9.1) 7.6 ( 6.5- 8.8) 8.9 ( 5.1- 14.9) 5.9 ( 3.4- 9.4)
Nebraska 8.3 ( 6.4- 10.7) 7.9 ( 6.0- 10.0) 8.3 ( 6.4- 10.7) 8.1 ( 6.2- 10.4) ∼ ∼North Dakota 6.2 ( 3.7- 9.7) 6.0 ( 3.6- 9.4) 6.3 ( 3.8- 10.0) 6.4 ( 3.9- 10.1) ∼ ∼South Dakota
South
South Atlantic
Delaware 7.9 ( 5.3- 11.9) 7.6 ( 5.1- 11.0) 7.9 ( 5.0- 12.2) 8.4 ( 5.4- 12.5) ∼ ∼District of Columbia 13.8 ( 9.5- 19.6) 13.5 ( 9.3- 19.0) ∼ ∼ 20.7 ( 14.0- 29.8) 21.2 ( 14.4- 30.1)
Florida 9.9 ( 9.2- 10.6) 11.4 ( 10.7- 12.2) 9.5 ( 8.8- 10.2) 12.2 ( 11.3- 13.1) 13.3 ( 10.5- 16.9) 7.8 ( 6.2- 9.6)
Georgia
Atlanta 8.0 ( 6.1- 10.6) 5.0 ( 3.9- 6.4) 5.9 ( 4.0- 8.5) 4.2 ( 3.0- 5.8) 16.8 ( 10.3- 26.9) 6.8 ( 4.5- 9.9)
Maryland 10.3 ( 9.0- 11.8) 8.7 ( 7.6- 9.9) 9.6 ( 8.2- 11.3) 9.1 ( 7.7- 10.6) 13.2 ( 9.9- 17.7) 8.5 ( 6.4- 11.0)
North Carolina 7.3 ( 6.4- 8.3) 6.4 ( 5.6- 7.3) 6.5 ( 5.5- 7.6) 6.2 ( 5.3- 7.2) 11.6 ( 8.8- 15.3) 7.6 ( 5.8- 9.8)
South Carolina 11.5 ( 9.9- 13.3) 10.5 ( 9.0- 12.0) 8.6 ( 7.0- 10.5) 8.4 ( 6.9- 10.2) 22.1 ( 17.6- 27.8) 15.8 ( 12.6- 19.5)
Virginia
West Virginia 7.8 ( 6.1- 10.0) 8.0 ( 6.3- 10.1) 7.6 ( 5.9- 9.8) 7.9 ( 6.1- 10.0) ∼ ∼East South Central
Alabama
Kentucky 7.8 ( 6.5- 9.3) 7.0 ( 5.9- 8.3) 7.5 ( 6.2- 9.1) 6.9 ( 5.7- 8.2) ∼ ∼Mississippi
Tennessee
continued

Cancer Incidence, by U
.S. Census R
egion and Division, State, and M
etropolitan Area
33
Table 2.3.1: Cancer of the Esophagus. Invasive Cancer Incidence Rates by U.S. Census Region and Division, Stateand Metropolitan Area, and Race (All Races, White, Black), United States: SEER and NPCR Registries that MeetQuality Criteria∗† (continued)
Males, 1999
All Races White BlackAge-Adjusted Crude Age-Adjusted Crude Age-Adjusted Crude
Area Rate‡§ (CI) Rate‡ (CI) Rate‡§ (CI) Rate‡ (CI) Rate‡§ (CI) Rate‡ (CI)
West South Central
Arkansas
Louisiana 9.7 ( 8.2- 11.3) 8.0 ( 6.9- 9.3) 8.3 ( 6.8- 10.1) 7.8 ( 6.4- 9.4) 14.3 ( 10.8- 18.8) 9.0 ( 6.8- 11.5)
Oklahoma
Texas
West 7.3 ( 6.9- 7.6) 5.9 ( 5.6- 6.2) 7.4 ( 7.1- 7.8) 6.3 ( 6.0- 6.6) 7.6 ( 5.9- 9.8) 4.4 ( 3.5- 5.6)
Mountain
Arizona 6.9 ( 5.8- 8.1) 6.3 ( 5.3- 7.4) 7.0 ( 5.9- 8.3) 6.8 ( 5.7- 8.0) ∼ ∼Colorado 6.9 ( 5.6- 8.5) 5.0 ( 4.0- 6.0) 6.9 ( 5.5- 8.5) 5.1 ( 4.1- 6.3) ∼ ∼Idaho 6.0 ( 4.1- 8.5) 5.3 ( 3.6- 7.4) 6.1 ( 4.2- 8.7) 5.4 ( 3.7- 7.6) ∼ ∼Montana 12.4 ( 9.3- 16.3) 12.3 ( 9.2- 16.0) 12.0 ( 8.9- 16.0) 12.5 ( 9.3- 16.5) ∼ ∼Nevada
New Mexico 7.7 ( 5.8- 10.1) 6.7 ( 5.0- 8.6) 8.2 ( 6.1- 10.7) 7.6 ( 5.7- 9.8) ∼ ∼Utah 5.6 ( 4.0- 7.8) 3.9 ( 2.8- 5.2) 5.7 ( 4.0- 7.8) 4.0 ( 2.8- 5.4) ∼ ∼Wyoming ∼ ∼ ∼ ∼ ∼ ∼
Pacific 7.4 ( 7.0- 7.8) 5.9 ( 5.6- 6.3) 7.6 ( 7.2- 8.1) 6.4 ( 6.0- 6.7) 7.7 ( 5.8- 10.0) 4.5 ( 3.4- 5.7)
Alaska ∼ ∼ ∼ ∼ ∼ ∼California 7.0 ( 6.6- 7.5) 5.5 ( 5.1- 5.8) 7.2 ( 6.7- 7.8) 5.9 ( 5.5- 6.3) 7.8 ( 5.8- 10.3) 4.6 ( 3.5- 6.0)
San Francisco-Oakland 7.8 ( 6.5- 9.3) 6.7 ( 5.6- 8.0) 8.1 ( 6.6- 9.9) 7.4 ( 6.0- 9.0) ∼ ∼San Jose-Monterey 7.4 ( 5.7- 9.6) 5.4 ( 4.1- 6.9) 8.7 ( 6.6- 11.3) 6.7 ( 5.1- 8.6) ∼ ∼Los Angeles 6.3 ( 5.5- 7.2) 4.6 ( 4.0- 5.2) 6.2 ( 5.3- 7.3) 4.6 ( 4.0- 5.4) 6.5 ( 4.0- 10.3) 4.5 ( 2.8- 6.7)
Hawaii 7.3 ( 5.3- 9.9) 7.1 ( 5.1- 9.6) ∼ ∼ ∼ ∼Oregon 7.9 ( 6.5- 9.4) 7.3 ( 6.1- 8.8) 7.9 ( 6.5- 9.5) 7.6 ( 6.3- 9.1) ∼ ∼Washington 9.1 ( 7.9- 10.4) 7.8 ( 6.8- 8.9) 9.2 ( 8.0- 10.6) 8.3 ( 7.2- 9.5) ∼ ∼
Seattle-Puget Sound 9.4 ( 8.0- 11.1) 8.0 ( 6.8- 9.4) 9.8 ( 8.3- 11.5) 8.8 ( 7.4- 10.3) ∼ ∼∗ Data are from selected statewide and metropolitan area cancer registries that meet the following data quality criteria for all invasive cancer sites combined: case
ascertainment is at least 90% complete; ≥ 97% of cases pass a standard set of computerized edits; ≤ 5% of cases were ascertained by death certificate only; ≤ 3% of
cases are missing information on sex; ≤ 5% of cases are missing information on race; ≤ 3% of cases are missing information on age. See Appendix H for registry-specific
data quality information. U.S. rates cover approximately 78% of the U.S. population.
† Invasive cancers only
‡ Rates are per 100,000 persons. Population denominators for 1999 are projected from the 1990 census and may not accurately reflect the 1999 population size. Caution
should be used in interpreting rates based on these projected populations.
§ Rates are age-adjusted to the 2000 U.S. standard population.
∼ Rates are suppressed if fewer than 16 cases were reported in the specific area-race category.
Notes: Cases from suppressed rates are included in the U.S. and region/division rates. Observed region/division age-adjusted incidence rates are presented for
regions/divisions with ≥ 78% of the population covered by registries that meet the data quality criteria specified above, and if the 95% confidence intervals
around the observed region/division rates for each of four major cancers include "bias-corrected" estimated region/division rates (see technical notes) for
each of those cancers. U.S rates are as presented in Table 1.1. California, Washington, and Michigan state rates each include cases from the SEER metropolitan
areas.

United States C
ancer Statistics: 1999 Incidence
34
Table 2.3.2: Cancer of the Esophagus. Invasive Cancer Incidence Rates by U.S. Census Region and Division, Stateand Metropolitan Area, and Race (All Races, White, Black), United States: SEER and NPCR Registries that MeetQuality Criteria∗†
Females, 1999
All Races White BlackAge-Adjusted Crude Age-Adjusted Crude Age-Adjusted Crude
Area Rate‡§ (CI) Rate‡ (CI) Rate‡§ (CI) Rate‡ (CI) Rate‡§ (CI) Rate‡ (CI)
United States 2.2 ( 2.1- 2.2) 2.5 ( 2.4- 2.5) 2.0 ( 1.9- 2.1) 2.5 ( 2.4- 2.6) 3.6 ( 3.2- 4.0) 2.9 ( 2.6- 3.2)
Northeast 2.3 ( 2.1- 2.5) 2.8 ( 2.6- 3.0) 2.1 ( 1.9- 2.3) 2.8 ( 2.6- 3.0) 3.7 ( 3.1- 4.5) 3.3 ( 2.7- 4.0)
New England 2.5 ( 2.2- 3.0) 3.0 ( 2.6- 3.5) 2.3 ( 1.9- 2.7) 2.9 ( 2.5- 3.4) 5.4 ( 3.1- 9.2) 4.0 ( 2.3- 6.5)
Connecticut 3.1 ( 2.4- 4.0) 3.6 ( 2.8- 4.6) 2.5 ( 1.9- 3.4) 3.2 ( 2.4- 4.3) ∼ ∼Maine
Massachusetts 2.2 ( 1.7- 2.7) 2.6 ( 2.1- 3.3) 1.9 ( 1.5- 2.5) 2.6 ( 2.0- 3.2) ∼ ∼New Hampshire 2.6 ( 1.5- 4.3) 2.6 ( 1.5- 4.3) 2.6 ( 1.5- 4.3) 2.7 ( 1.5- 4.4) ∼ ∼Rhode Island 3.2 ( 1.9- 5.1) 4.1 ( 2.5- 6.2) 3.1 ( 1.8- 5.1) 4.2 ( 2.6- 6.5) ∼ ∼Vermont
Middle Atlantic 2.2 ( 2.1- 2.4) 2.8 ( 2.5- 3.0) 2.0 ( 1.9- 2.2) 2.8 ( 2.5- 3.0) 3.5 ( 2.8- 4.3) 3.2 ( 2.6- 3.9)
New Jersey 2.5 ( 2.1- 3.0) 3.0 ( 2.5- 3.6) 2.4 ( 1.9- 2.9) 3.2 ( 2.6- 3.9) 3.6 ( 2.2- 5.8) 3.0 ( 1.8- 4.7)
New York 2.4 ( 2.1- 2.7) 2.8 ( 2.5- 3.1) 2.1 ( 1.8- 2.4) 2.8 ( 2.4- 3.2) 3.6 ( 2.7- 4.7) 3.3 ( 2.5- 4.3)
Pennsylvania 1.9 ( 1.7- 2.3) 2.6 ( 2.2- 3.0) 1.8 ( 1.5- 2.2) 2.5 ( 2.1- 3.0) 3.2 ( 1.9- 5.1) 3.1 ( 1.8- 4.8)
Midwest
East North Central
Illinois 2.0 ( 1.7- 2.4) 2.2 ( 1.9- 2.6) 1.8 ( 1.5- 2.2) 2.1 ( 1.8- 2.6) 3.7 ( 2.5- 5.4) 2.9 ( 1.9- 4.1)
Indiana
Michigan 2.1 ( 1.7- 2.5) 2.3 ( 1.9- 2.7) 1.9 ( 1.5- 2.3) 2.2 ( 1.8- 2.7) 3.5 ( 2.2- 5.4) 2.8 ( 1.7- 4.3)
Detroit 2.1 ( 1.6- 2.8) 2.4 ( 1.7- 3.1) 1.8 ( 1.2- 2.5) 2.2 ( 1.5- 3.0) 3.6 ( 2.1- 5.9) 3.1 ( 1.8- 5.0)
Ohio 2.3 ( 2.0- 2.7) 2.7 ( 2.3- 3.2) 2.1 ( 1.7- 2.5) 2.5 ( 2.1- 3.0) 3.9 ( 2.4- 5.9) 3.2 ( 2.0- 4.8)
Wisconsin 2.3 ( 1.8- 2.9) 2.7 ( 2.1- 3.4) 2.2 ( 1.7- 2.8) 2.7 ( 2.0- 3.4) ∼ ∼West North Central 1.8 ( 1.5- 2.0) 2.1 ( 1.8- 2.4) 1.7 ( 1.5- 2.0) 2.1 ( 1.8- 2.5) ∼ ∼Iowa 1.6 ( 1.1- 2.4) 2.2 ( 1.5- 3.1) 1.7 ( 1.1- 2.4) 2.3 ( 1.5- 3.2) ∼ ∼Kansas 1.5 ( 1.0- 2.3) 1.8 ( 1.1- 2.6) 1.6 ( 1.0- 2.4) 1.9 ( 1.2- 2.9) ∼ ∼Minnesota 2.0 ( 1.5- 2.6) 2.3 ( 1.7- 3.0) 2.0 ( 1.5- 2.6) 2.4 ( 1.8- 3.1) ∼ ∼Missouri 1.9 ( 1.4- 2.4) 2.2 ( 1.7- 2.8) 1.6 ( 1.2- 2.1) 2.0 ( 1.5- 2.6) ∼ ∼Nebraska 1.5 ( 0.9- 2.5) 1.9 ( 1.1- 3.1) 1.6 ( 0.9- 2.6) 2.0 ( 1.1- 3.3) ∼ ∼North Dakota ∼ ∼ ∼ ∼ ∼ ∼South Dakota
South
South Atlantic
Delaware ∼ ∼ ∼ ∼ ∼ ∼District of Columbia ∼ ∼ ∼ ∼ ∼ ∼Florida 2.5 ( 2.2- 2.9) 3.6 ( 3.2- 4.0) 2.4 ( 2.1- 2.7) 3.8 ( 3.3- 4.3) 3.8 ( 2.6- 5.5) 2.6 ( 1.8- 3.7)
Georgia
Atlanta 2.5 ( 1.6- 3.7) 1.9 ( 1.2- 2.8) ∼ ∼ ∼ ∼Maryland 2.5 ( 1.9- 3.1) 2.5 ( 2.0- 3.2) 2.3 ( 1.7- 3.0) 2.7 ( 1.9- 3.5) 3.3 ( 1.9- 5.3) 2.3 ( 1.4- 3.7)
North Carolina 1.8 ( 1.4- 2.3) 2.0 ( 1.6- 2.5) 1.5 ( 1.1- 2.0) 1.8 ( 1.4- 2.4) 3.2 ( 2.0- 4.8) 2.7 ( 1.7- 4.0)
South Carolina 2.7 ( 2.0- 3.5) 2.9 ( 2.2- 3.7) 1.5 ( 1.0- 2.3) 1.9 ( 1.2- 2.8) 6.1 ( 4.1- 8.7) 5.0 ( 3.4- 7.1)
Virginia
West Virginia 2.0 ( 1.3- 3.1) 2.6 ( 1.6- 3.8) 2.0 ( 1.3- 3.2) 2.6 ( 1.6- 3.8) ∼ ∼East South Central
Alabama
Kentucky 1.7 ( 1.2- 2.4) 2.0 ( 1.4- 2.7) 1.8 ( 1.3- 2.5) 2.1 ( 1.5- 2.9) ∼ ∼Mississippi
Tennessee
continued

Cancer Incidence, by U
.S. Census R
egion and Division, State, and M
etropolitan Area
35
Table 2.3.2: Cancer of the Esophagus. Invasive Cancer Incidence Rates by U.S. Census Region and Division, Stateand Metropolitan Area, and Race (All Races, White, Black), United States: SEER and NPCR Registries that MeetQuality Criteria∗† (continued)
Females, 1999
All Races White BlackAge-Adjusted Crude Age-Adjusted Crude Age-Adjusted Crude
Area Rate‡§ (CI) Rate‡ (CI) Rate‡§ (CI) Rate‡ (CI) Rate‡§ (CI) Rate‡ (CI)
West South Central
Arkansas
Louisiana 2.2 ( 1.6- 2.9) 2.2 ( 1.7- 3.0) 2.3 ( 1.6- 3.2) 2.7 ( 1.9- 3.7) ∼ ∼Oklahoma
Texas
West 2.0 ( 1.8- 2.2) 2.0 ( 1.8- 2.2) 2.0 ( 1.9- 2.2) 2.2 ( 2.0- 2.3) 3.2 ( 2.3- 4.5) 2.4 ( 1.7- 3.2)
Mountain
Arizona 1.6 ( 1.2- 2.2) 1.8 ( 1.3- 2.4) 1.7 ( 1.2- 2.3) 2.0 ( 1.4- 2.7) ∼ ∼Colorado 1.8 ( 1.2- 2.5) 1.7 ( 1.2- 2.4) 1.7 ( 1.2- 2.4) 1.7 ( 1.2- 2.4) ∼ ∼Idaho ∼ ∼ ∼ ∼ ∼ ∼Montana ∼ ∼ ∼ ∼ ∼ ∼Nevada
New Mexico ∼ ∼ ∼ ∼ ∼ ∼Utah ∼ ∼ ∼ ∼ ∼ ∼Wyoming ∼ ∼ ∼ ∼ ∼ ∼
Pacific 2.2 ( 2.0- 2.4) 2.2 ( 2.0- 2.4) 2.2 ( 2.0- 2.5) 2.4 ( 2.1- 2.6) 3.4 ( 2.3- 4.7) 2.5 ( 1.7- 3.5)
Alaska ∼ ∼ ∼ ∼ ∼ ∼California 2.2 ( 2.0- 2.4) 2.1 ( 1.9- 2.4) 2.2 ( 2.0- 2.5) 2.3 ( 2.1- 2.6) 3.6 ( 2.5- 5.1) 2.8 ( 1.9- 3.9)
San Francisco-Oakland 2.4 ( 1.8- 3.2) 2.6 ( 2.0- 3.4) 2.4 ( 1.7- 3.4) 3.0 ( 2.1- 4.0) ∼ ∼San Jose-Monterey 2.4 ( 1.5- 3.5) 2.3 ( 1.5- 3.3) 2.5 ( 1.6- 3.8) 2.6 ( 1.6- 3.9) ∼ ∼Los Angeles 1.8 ( 1.5- 2.3) 1.8 ( 1.4- 2.2) 1.9 ( 1.4- 2.4) 1.9 ( 1.5- 2.4) 3.3 ( 1.9- 5.5) 2.9 ( 1.7- 4.7)
Hawaii ∼ ∼ ∼ ∼ ∼ ∼Oregon 2.4 ( 1.8- 3.2) 2.7 ( 2.0- 3.7) 2.4 ( 1.8- 3.3) 2.9 ( 2.1- 3.8) ∼ ∼Washington 2.2 ( 1.7- 2.8) 2.2 ( 1.7- 2.8) 2.4 ( 1.8- 3.0) 2.5 ( 1.9- 3.2) ∼ ∼
Seattle-Puget Sound 2.4 ( 1.7- 3.1) 2.4 ( 1.7- 3.1) 2.6 ( 1.9- 3.5) 2.8 ( 2.0- 3.7) ∼ ∼∗ Data are from selected statewide and metropolitan area cancer registries that meet the following data quality criteria for all invasive cancer sites combined: case
ascertainment is at least 90% complete; ≥ 97% of cases pass a standard set of computerized edits; ≤ 5% of cases were ascertained by death certificate only; ≤ 3% of
cases are missing information on sex; ≤ 5% of cases are missing information on race; ≤ 3% of cases are missing information on age. See Appendix H for registry-specific
data quality information. U.S. rates cover approximately 78% of the U.S. population.
† Invasive cancers only
‡ Rates are per 100,000 persons. Population denominators for 1999 are projected from the 1990 census and may not accurately reflect the 1999 population size. Caution
should be used in interpreting rates based on these projected populations.
§ Rates are age-adjusted to the 2000 U.S. standard population.
∼ Rates are suppressed if fewer than 16 cases were reported in the specific area-race category.
Notes: Cases from suppressed rates are included in the U.S. and region/division rates. Observed region/division age-adjusted incidence rates are presented for
regions/divisions with ≥ 78% of the population covered by registries that meet the data quality criteria specified above, and if the 95% confidence intervals
around the observed region/division rates for each of four major cancers include "bias-corrected" estimated region/division rates (see technical notes) for
each of those cancers. U.S rates are as presented in Table 1.2. California, Washington, and Michigan state rates each include cases from the SEER metropolitan
areas.

United States C
ancer Statistics: 1999 Incidence
36
Table 2.4.1: Cancer of the Stomach. Invasive Cancer Incidence Rates by U.S. Census Region and Division, Stateand Metropolitan Area, and Race (All Races, White, Black), United States: SEER and NPCR Registries that MeetQuality Criteria∗†
Males, 1999
All Races White BlackAge-Adjusted Crude Age-Adjusted Crude Age-Adjusted Crude
Area Rate‡§ (CI) Rate‡ (CI) Rate‡§ (CI) Rate‡ (CI) Rate‡§ (CI) Rate‡ (CI)
United States 11.0 ( 10.8- 11.3) 9.7 ( 9.5- 9.9) 10.0 ( 9.8- 10.2) 9.4 ( 9.2- 9.6) 17.5 ( 16.5- 18.6) 10.3 ( 9.7- 10.9)
Northeast 13.5 ( 13.0- 14.0) 12.6 ( 12.1- 13.0) 12.6 ( 12.1- 13.1) 12.5 ( 12.0- 13.0) 19.0 ( 16.9- 21.3) 11.5 ( 10.3- 12.8)
New England 12.2 ( 11.2- 13.2) 11.1 ( 10.2- 12.0) 11.6 ( 10.6- 12.6) 11.1 ( 10.2- 12.0) 20.9 ( 14.5- 30.0) 10.5 ( 7.4- 14.3)
Connecticut 13.0 ( 11.2- 15.0) 12.4 ( 10.7- 14.2) 12.4 ( 10.7- 14.5) 12.6 ( 10.8- 14.6) ∼ ∼Maine
Massachusetts 12.1 ( 10.8- 13.5) 10.8 ( 9.7- 12.1) 11.2 ( 9.9- 12.6) 10.6 ( 9.4- 11.9) 25.7 ( 15.7- 41.5) 12.2 ( 7.8- 18.1)
New Hampshire 9.0 ( 6.6- 12.3) 7.8 ( 5.7- 10.4) 9.2 ( 6.7- 12.4) 8.0 ( 5.8- 10.6) ∼ ∼Rhode Island 13.0 ( 9.9- 16.8) 12.6 ( 9.6- 16.2) 13.0 ( 9.8- 16.9) 13.3 ( 10.1- 17.2) ∼ ∼Vermont
Middle Atlantic 13.9 ( 13.4- 14.5) 13.0 ( 12.5- 13.6) 12.9 ( 12.3- 13.5) 13.0 ( 12.4- 13.6) 18.8 ( 16.6- 21.2) 11.7 ( 10.4- 13.1)
New Jersey 14.9 ( 13.7- 16.3) 13.6 ( 12.4- 14.8) 14.5 ( 13.2- 15.9) 14.4 ( 13.1- 15.8) 20.2 ( 15.4- 26.4) 11.6 ( 9.0- 14.8)
New York 14.8 ( 13.9- 15.6) 13.2 ( 12.5- 14.0) 13.5 ( 12.6- 14.4) 13.1 ( 12.3- 14.0) 16.9 ( 14.2- 20.0) 10.4 ( 8.8- 12.1)
Pennsylvania 12.2 ( 11.3- 13.2) 12.4 ( 11.5- 13.3) 11.3 ( 10.4- 12.3) 12.0 ( 11.1- 13.0) 22.4 ( 17.8- 28.0) 15.3 ( 12.2- 19.0)
Midwest
East North Central
Illinois 11.1 ( 10.2- 12.1) 9.4 ( 8.6- 10.2) 10.1 ( 9.2- 11.1) 9.0 ( 8.2- 9.9) 16.1 ( 12.8- 20.2) 10.0 ( 8.0- 12.3)
Indiana
Michigan 10.9 ( 9.9- 12.0) 9.2 ( 8.3- 10.1) 10.1 ( 9.1- 11.3) 9.0 ( 8.1- 10.0) 15.6 ( 12.0- 20.1) 9.8 ( 7.6- 12.5)
Detroit 13.7 ( 11.9- 15.7) 11.4 ( 10.0- 13.0) 13.0 ( 11.1- 15.2) 11.7 ( 10.0- 13.6) 15.7 ( 11.5- 20.9) 10.9 ( 8.1- 14.4)
Ohio 9.3 ( 8.5- 10.3) 8.4 ( 7.6- 9.2) 8.2 ( 7.4- 9.2) 7.7 ( 6.9- 8.5) 18.1 ( 14.1- 23.2) 12.1 ( 9.5- 15.2)
Wisconsin 9.9 ( 8.7- 11.3) 8.9 ( 7.8- 10.2) 9.6 ( 8.4- 11.0) 9.1 ( 7.9- 10.4) ∼ ∼West North Central 9.1 ( 8.4- 9.8) 8.3 ( 7.7- 8.9) 8.6 ( 8.0- 9.3) 8.2 ( 7.5- 8.8) 17.4 ( 12.5- 23.7) 9.0 ( 6.6- 12.1)
Iowa 9.2 ( 7.6- 10.9) 9.1 ( 7.6- 10.8) 9.2 ( 7.6- 10.9) 9.3 ( 7.7- 11.1) ∼ ∼Kansas 9.6 ( 7.9- 11.6) 8.6 ( 7.1- 10.3) 9.0 ( 7.3- 11.0) 8.4 ( 6.8- 10.2) ∼ ∼Minnesota 10.2 ( 8.9- 11.8) 8.7 ( 7.6- 10.0) 9.8 ( 8.4- 11.3) 8.7 ( 7.5- 10.0) ∼ ∼Missouri 8.5 ( 7.4- 9.8) 7.8 ( 6.7- 8.9) 7.7 ( 6.6- 9.0) 7.4 ( 6.3- 8.6) 17.5 ( 11.7- 25.5) 10.7 ( 7.3- 15.3)
Nebraska 6.2 ( 4.5- 8.2) 5.8 ( 4.2- 7.7) 5.7 ( 4.1- 7.7) 5.5 ( 4.0- 7.4) ∼ ∼North Dakota 10.7 ( 7.4- 15.1) 10.5 ( 7.2- 14.7) 10.9 ( 7.5- 15.5) 11.2 ( 7.7- 15.7) ∼ ∼South Dakota
South
South Atlantic
Delaware 10.0 ( 6.9- 14.4) 9.3 ( 6.4- 13.0) 8.6 ( 5.5- 13.3) 8.7 ( 5.6- 12.9) ∼ ∼District of Columbia 15.7 ( 10.9- 22.1) 14.3 ( 10.0- 19.9) ∼ ∼ 17.3 ( 11.1- 26.0) 17.1 ( 11.1- 25.2)
Florida 10.8 ( 10.1- 11.6) 12.6 ( 11.8- 13.4) 10.0 ( 9.3- 10.8) 12.9 ( 12.0- 13.8) 19.3 ( 15.7- 23.8) 10.2 ( 8.4- 12.3)
Georgia
Atlanta 9.2 ( 7.1- 11.9) 5.8 ( 4.6- 7.3) 6.3 ( 4.3- 9.1) 4.4 ( 3.1- 6.1) 15.1 ( 8.8- 25.2) 6.0 ( 3.9- 9.0)
Maryland 10.5 ( 9.1- 12.1) 8.3 ( 7.3- 9.6) 8.4 ( 7.0- 10.0) 7.8 ( 6.5- 9.2) 18.3 ( 13.7- 24.2) 9.2 ( 7.1- 11.8)
North Carolina 9.0 ( 8.0- 10.2) 7.6 ( 6.7- 8.5) 6.6 ( 5.7- 7.8) 6.2 ( 5.3- 7.2) 21.0 ( 16.9- 25.9) 12.7 ( 10.3- 15.4)
South Carolina 10.8 ( 9.2- 12.7) 9.2 ( 7.9- 10.7) 8.5 ( 6.9- 10.5) 7.9 ( 6.5- 9.6) 19.2 ( 14.8- 24.9) 12.4 ( 9.6- 15.8)
Virginia
West Virginia 8.1 ( 6.2- 10.3) 7.9 ( 6.2- 10.0) 8.1 ( 6.2- 10.4) 8.0 ( 6.2- 10.1) ∼ ∼East South Central
Alabama
Kentucky 9.2 ( 7.8- 10.9) 7.9 ( 6.7- 9.3) 8.9 ( 7.4- 10.5) 7.8 ( 6.6- 9.2) ∼ ∼Mississippi
Tennessee
continued

Cancer Incidence, by U
.S. Census R
egion and Division, State, and M
etropolitan Area
37
Table 2.4.1: Cancer of the Stomach. Invasive Cancer Incidence Rates by U.S. Census Region and Division, Stateand Metropolitan Area, and Race (All Races, White, Black), United States: SEER and NPCR Registries that MeetQuality Criteria∗† (continued)
Males, 1999
All Races White BlackAge-Adjusted Crude Age-Adjusted Crude Age-Adjusted Crude
Area Rate‡§ (CI) Rate‡ (CI) Rate‡§ (CI) Rate‡ (CI) Rate‡§ (CI) Rate‡ (CI)
West South Central
Arkansas
Louisiana 10.6 ( 9.1- 12.3) 8.6 ( 7.4- 9.9) 8.5 ( 7.0- 10.3) 7.9 ( 6.5- 9.5) 17.2 ( 13.2- 22.2) 10.0 ( 7.7- 12.7)
Oklahoma
Texas
West 10.6 ( 10.2- 11.0) 8.5 ( 8.1- 8.8) 9.4 ( 9.0- 9.9) 7.9 ( 7.5- 8.2) 13.9 ( 11.5- 16.9) 7.6 ( 6.3- 9.0)
Mountain
Arizona 8.5 ( 7.3- 9.9) 7.8 ( 6.7- 9.0) 8.4 ( 7.2- 9.8) 8.2 ( 7.0- 9.5) ∼ ∼Colorado 7.9 ( 6.5- 9.6) 6.0 ( 4.9- 7.1) 7.6 ( 6.1- 9.2) 5.8 ( 4.8- 7.0) ∼ ∼Idaho 7.6 ( 5.4- 10.6) 6.1 ( 4.3- 8.3) 7.3 ( 5.1- 10.3) 5.9 ( 4.2- 8.2) ∼ ∼Montana 8.4 ( 5.9- 11.8) 8.2 ( 5.7- 11.3) 8.2 ( 5.7- 11.6) 8.3 ( 5.8- 11.7) ∼ ∼Nevada
New Mexico 8.6 ( 6.6- 11.2) 7.2 ( 5.6- 9.3) 7.8 ( 5.8- 10.3) 7.0 ( 5.3- 9.2) ∼ ∼Utah 8.0 ( 6.0- 10.6) 5.1 ( 3.8- 6.6) 7.9 ( 5.9- 10.5) 5.2 ( 3.8- 6.8) ∼ ∼Wyoming ∼ ∼ ∼ ∼ ∼ ∼
Pacific 11.5 ( 11.0- 12.0) 9.1 ( 8.7- 9.5) 10.1 ( 9.6- 10.6) 8.4 ( 7.9- 8.8) 14.0 ( 11.4- 17.1) 7.9 ( 6.5- 9.5)
Alaska 13.4 ( 7.5- 23.8) 6.8 ( 4.2- 10.2) ∼ ∼ ∼ ∼California 11.6 ( 11.0- 12.3) 9.0 ( 8.5- 9.4) 10.4 ( 9.8- 11.1) 8.5 ( 8.0- 9.0) 14.6 ( 11.8- 17.9) 8.6 ( 7.0- 10.4)
San Francisco-Oakland 12.3 ( 10.7- 14.1) 10.6 ( 9.2- 12.1) 10.0 ( 8.3- 11.9) 9.3 ( 7.7- 11.0) 20.4 ( 13.8- 29.6) 13.6 ( 9.3- 19.2)
San Jose-Monterey 11.6 ( 9.4- 14.2) 8.3 ( 6.8- 10.2) 8.4 ( 6.4- 11.0) 6.5 ( 4.9- 8.4) ∼ ∼Los Angeles 14.8 ( 13.5- 16.2) 10.7 ( 9.8- 11.7) 13.4 ( 12.0- 14.9) 9.9 ( 8.9- 11.0) 12.6 ( 9.2- 17.3) 9.3 ( 6.8- 12.4)
Hawaii 21.0 ( 17.3- 25.1) 20.2 ( 16.7- 24.1) 13.9 ( 8.1- 22.4) 10.6 ( 6.3- 16.8) ∼ ∼Oregon 8.6 ( 7.2- 10.3) 8.0 ( 6.7- 9.5) 8.1 ( 6.7- 9.8) 7.8 ( 6.4- 9.3) ∼ ∼Washington 10.0 ( 8.8- 11.4) 8.4 ( 7.3- 9.5) 9.5 ( 8.3- 10.9) 8.4 ( 7.3- 9.6) ∼ ∼
Seattle-Puget Sound 11.2 ( 9.6- 13.0) 9.1 ( 7.8- 10.5) 10.3 ( 8.7- 12.1) 8.9 ( 7.5- 10.4) ∼ ∼∗ Data are from selected statewide and metropolitan area cancer registries that meet the following data quality criteria for all invasive cancer sites combined: case
ascertainment is at least 90% complete; ≥ 97% of cases pass a standard set of computerized edits; ≤ 5% of cases were ascertained by death certificate only; ≤ 3% of
cases are missing information on sex; ≤ 5% of cases are missing information on race; ≤ 3% of cases are missing information on age. See Appendix H for registry-specific
data quality information. U.S. rates cover approximately 78% of the U.S. population.
† Invasive cancers only
‡ Rates are per 100,000 persons. Population denominators for 1999 are projected from the 1990 census and may not accurately reflect the 1999 population size. Caution
should be used in interpreting rates based on these projected populations.
§ Rates are age-adjusted to the 2000 U.S. standard population.
∼ Rates are suppressed if fewer than 16 cases were reported in the specific area-race category.
Notes: Cases from suppressed rates are included in the U.S. and region/division rates. Observed region/division age-adjusted incidence rates are presented for
regions/divisions with ≥ 78% of the population covered by registries that meet the data quality criteria specified above, and if the 95% confidence intervals
around the observed region/division rates for each of four major cancers include "bias-corrected" estimated region/division rates (see technical notes) for
each of those cancers. U.S rates are as presented in Table 1.1. California, Washington, and Michigan state rates each include cases from the SEER metropolitan
areas.

United States C
ancer Statistics: 1999 Incidence
38
Table 2.4.2: Cancer of the Stomach. Invasive Cancer Incidence Rates by U.S. Census Region and Division, Stateand Metropolitan Area, and Race (All Races, White, Black), United States: SEER and NPCR Registries that MeetQuality Criteria∗†
Females, 1999
All Races White BlackAge-Adjusted Crude Age-Adjusted Crude Age-Adjusted Crude
Area Rate‡§ (CI) Rate‡ (CI) Rate‡§ (CI) Rate‡ (CI) Rate‡§ (CI) Rate‡ (CI)
United States 5.1 ( 5.0- 5.2) 5.9 ( 5.7- 6.0) 4.4 ( 4.3- 4.6) 5.5 ( 5.3- 5.7) 9.1 ( 8.5- 9.7) 7.0 ( 6.6- 7.5)
Northeast 5.9 ( 5.6- 6.2) 7.4 ( 7.1- 7.7) 5.3 ( 5.1- 5.6) 7.3 ( 6.9- 7.6) 9.0 ( 8.0- 10.3) 7.5 ( 6.6- 8.5)
New England 5.3 ( 4.8- 5.8) 6.6 ( 6.0- 7.3) 5.1 ( 4.5- 5.6) 6.8 ( 6.1- 7.5) 7.7 ( 4.7- 12.2) 5.0 ( 3.1- 7.7)
Connecticut 6.2 ( 5.2- 7.4) 7.9 ( 6.6- 9.4) 6.0 ( 4.9- 7.2) 8.2 ( 6.8- 9.8) ∼ ∼Maine
Massachusetts 4.8 ( 4.1- 5.5) 6.0 ( 5.2- 6.9) 4.6 ( 3.9- 5.3) 6.1 ( 5.2- 7.1) ∼ ∼New Hampshire 4.0 ( 2.6- 5.9) 4.4 ( 2.9- 6.5) 3.9 ( 2.5- 5.8) 4.4 ( 2.9- 6.4) ∼ ∼Rhode Island 6.6 ( 4.8- 9.0) 8.9 ( 6.5- 11.9) 6.4 ( 4.6- 9.0) 9.1 ( 6.6- 12.2) ∼ ∼Vermont
Middle Atlantic 6.1 ( 5.8- 6.4) 7.6 ( 7.3- 8.0) 5.4 ( 5.1- 5.7) 7.4 ( 7.0- 7.9) 9.2 ( 8.0- 10.5) 7.8 ( 6.8- 8.9)
New Jersey 6.6 ( 5.9- 7.3) 8.0 ( 7.1- 8.9) 5.9 ( 5.2- 6.7) 8.0 ( 7.1- 9.1) 9.0 ( 6.5- 12.2) 7.2 ( 5.2- 9.6)
New York 6.6 ( 6.1- 7.1) 7.8 ( 7.3- 8.4) 5.7 ( 5.2- 6.2) 7.6 ( 7.0- 8.2) 9.0 ( 7.5- 10.7) 7.6 ( 6.4- 9.0)
Pennsylvania 5.2 ( 4.7- 5.7) 7.1 ( 6.5- 7.8) 4.8 ( 4.3- 5.3) 6.8 ( 6.2- 7.6) 9.5 ( 7.2- 12.4) 9.0 ( 6.8- 11.7)
Midwest
East North Central
Illinois 5.1 ( 4.6- 5.7) 5.8 ( 5.2- 6.4) 4.5 ( 4.0- 5.1) 5.5 ( 4.9- 6.2) 8.4 ( 6.5- 10.9) 6.4 ( 4.9- 8.2)
Indiana
Michigan 5.3 ( 4.7- 5.9) 5.8 ( 5.2- 6.6) 4.5 ( 3.9- 5.1) 5.3 ( 4.6- 6.1) 11.0 ( 8.5- 14.0) 8.8 ( 6.8- 11.2)
Detroit 6.7 ( 5.7- 7.8) 7.5 ( 6.4- 8.8) 5.7 ( 4.7- 6.9) 7.2 ( 5.9- 8.6) 10.0 ( 7.4- 13.4) 8.6 ( 6.3- 11.4)
Ohio 4.6 ( 4.1- 5.1) 5.4 ( 4.8- 6.1) 4.0 ( 3.6- 4.6) 5.1 ( 4.5- 5.7) 9.2 ( 6.9- 12.1) 7.6 ( 5.6- 9.9)
Wisconsin 3.5 ( 2.9- 4.3) 4.2 ( 3.4- 5.0) 3.4 ( 2.7- 4.1) 4.2 ( 3.4- 5.1) ∼ ∼West North Central 3.5 ( 3.1- 3.8) 4.3 ( 3.9- 4.7) 3.3 ( 2.9- 3.6) 4.2 ( 3.8- 4.7) 4.9 ( 3.0- 7.7) 3.7 ( 2.2- 5.7)
Iowa 3.2 ( 2.4- 4.2) 4.1 ( 3.2- 5.3) 3.1 ( 2.4- 4.1) 4.2 ( 3.2- 5.4) ∼ ∼Kansas 3.3 ( 2.5- 4.3) 4.0 ( 3.0- 5.2) 3.2 ( 2.3- 4.2) 4.0 ( 2.9- 5.3) ∼ ∼Minnesota 4.1 ( 3.4- 4.9) 4.8 ( 4.0- 5.7) 4.0 ( 3.3- 4.9) 5.0 ( 4.1- 6.0) ∼ ∼Missouri 3.2 ( 2.6- 3.9) 3.8 ( 3.1- 4.6) 2.8 ( 2.2- 3.5) 3.6 ( 2.8- 4.4) ∼ ∼Nebraska 3.6 ( 2.5- 5.0) 4.7 ( 3.4- 6.4) 3.1 ( 2.1- 4.5) 4.3 ( 3.0- 6.0) ∼ ∼North Dakota 3.5 ( 2.0- 6.0) 5.3 ( 3.1- 8.6) 3.6 ( 2.0- 6.2) 5.7 ( 3.3- 9.1) ∼ ∼South Dakota
South
South Atlantic
Delaware 6.5 ( 4.3- 9.5) 7.2 ( 4.8- 10.5) 5.4 ( 3.3- 8.5) 6.7 ( 4.1- 10.3) ∼ ∼District of Columbia 10.7 ( 7.5- 15.3) 13.4 ( 9.4- 18.4) ∼ ∼ 10.9 ( 7.1- 16.9) 14.9 ( 9.8- 21.9)
Florida 4.9 ( 4.5- 5.3) 6.9 ( 6.4- 7.5) 4.4 ( 3.9- 4.8) 6.9 ( 6.2- 7.5) 10.7 ( 8.5- 13.3) 7.0 ( 5.6- 8.7)
Georgia
Atlanta 5.5 ( 4.2- 7.2) 4.1 ( 3.1- 5.3) 4.4 ( 3.0- 6.2) 3.9 ( 2.7- 5.4) 8.9 ( 5.4- 14.1) 4.6 ( 2.9- 7.1)
Maryland 4.3 ( 3.5- 5.1) 4.4 ( 3.7- 5.3) 3.3 ( 2.5- 4.2) 4.0 ( 3.1- 5.0) 6.9 ( 4.9- 9.6) 5.1 ( 3.6- 6.9)
North Carolina 4.3 ( 3.7- 5.0) 4.7 ( 4.1- 5.5) 3.5 ( 2.9- 4.2) 4.2 ( 3.5- 5.0) 8.0 ( 6.1- 10.3) 6.8 ( 5.2- 8.8)
South Carolina 4.5 ( 3.7- 5.5) 4.9 ( 4.0- 5.9) 3.8 ( 2.9- 4.9) 4.5 ( 3.5- 5.8) 7.1 ( 4.9- 9.8) 5.8 ( 4.1- 8.1)
Virginia
West Virginia 3.5 ( 2.5- 4.8) 4.6 ( 3.3- 6.2) 3.5 ( 2.5- 4.8) 4.6 ( 3.3- 6.2) ∼ ∼East South Central
Alabama
Kentucky 4.6 ( 3.8- 5.6) 5.2 ( 4.3- 6.3) 4.4 ( 3.5- 5.4) 5.0 ( 4.0- 6.1) ∼ ∼Mississippi
Tennessee
continued

Cancer Incidence, by U
.S. Census R
egion and Division, State, and M
etropolitan Area
39
Table 2.4.2: Cancer of the Stomach. Invasive Cancer Incidence Rates by U.S. Census Region and Division, Stateand Metropolitan Area, and Race (All Races, White, Black), United States: SEER and NPCR Registries that MeetQuality Criteria∗† (continued)
Females, 1999
All Races White BlackAge-Adjusted Crude Age-Adjusted Crude Age-Adjusted Crude
Area Rate‡§ (CI) Rate‡ (CI) Rate‡§ (CI) Rate‡ (CI) Rate‡§ (CI) Rate‡ (CI)
West South Central
Arkansas
Louisiana 5.7 ( 4.8- 6.8) 5.9 ( 5.0- 7.0) 3.8 ( 2.9- 4.8) 4.5 ( 3.5- 5.7) 11.5 ( 8.9- 14.6) 8.9 ( 6.9- 11.3)
Oklahoma
Texas
West 5.4 ( 5.1- 5.6) 5.4 ( 5.1- 5.7) 4.5 ( 4.3- 4.8) 4.8 ( 4.5- 5.0) 10.2 ( 8.4- 12.2) 7.3 ( 6.0- 8.7)
Mountain
Arizona 3.8 ( 3.1- 4.6) 4.1 ( 3.4- 5.0) 3.5 ( 2.8- 4.3) 4.1 ( 3.3- 5.0) ∼ ∼Colorado 4.5 ( 3.6- 5.5) 4.3 ( 3.4- 5.2) 4.2 ( 3.3- 5.2) 4.1 ( 3.2- 5.1) ∼ ∼Idaho 3.7 ( 2.4- 5.6) 3.8 ( 2.5- 5.7) 3.8 ( 2.4- 5.7) 4.0 ( 2.5- 5.9) ∼ ∼Montana ∼ ∼ ∼ ∼ ∼ ∼Nevada
New Mexico 6.0 ( 4.5- 7.9) 5.9 ( 4.4- 7.7) 5.4 ( 3.9- 7.3) 5.6 ( 4.1- 7.6) ∼ ∼Utah 4.6 ( 3.3- 6.3) 3.6 ( 2.6- 5.0) 4.8 ( 3.4- 6.5) 3.8 ( 2.7- 5.2) ∼ ∼Wyoming ∼ ∼ ∼ ∼ ∼ ∼
Pacific 5.8 ( 5.5- 6.1) 5.8 ( 5.5- 6.2) 4.7 ( 4.4- 5.1) 5.0 ( 4.7- 5.4) 10.3 ( 8.5- 12.6) 7.5 ( 6.2- 9.1)
Alaska 7.4 ( 4.0- 13.4) 5.4 ( 3.1- 8.8) ∼ ∼ ∼ ∼California 6.1 ( 5.7- 6.5) 6.0 ( 5.7- 6.4) 5.2 ( 4.8- 5.6) 5.4 ( 5.0- 5.8) 10.5 ( 8.5- 12.9) 7.9 ( 6.4- 9.6)
San Francisco-Oakland 7.6 ( 6.5- 8.8) 8.4 ( 7.2- 9.8) 6.0 ( 4.9- 7.4) 7.4 ( 6.0- 9.0) 11.7 ( 7.5- 17.5) 10.0 ( 6.5- 14.7)
San Jose-Monterey 6.9 ( 5.5- 8.7) 6.6 ( 5.2- 8.3) 6.0 ( 4.5- 7.9) 6.2 ( 4.7- 8.1) ∼ ∼Los Angeles 7.4 ( 6.6- 8.2) 7.1 ( 6.3- 7.9) 6.2 ( 5.4- 7.1) 6.1 ( 5.3- 7.0) 10.8 ( 8.0- 14.2) 9.1 ( 6.7- 12.0)
Hawaii 11.3 ( 8.9- 14.2) 12.7 ( 10.0- 15.9) ∼ ∼ ∼ ∼Oregon 2.9 ( 2.2- 3.7) 3.3 ( 2.5- 4.3) 2.7 ( 2.0- 3.5) 3.3 ( 2.4- 4.3) ∼ ∼Washington 4.6 ( 3.8- 5.4) 4.7 ( 3.9- 5.6) 3.8 ( 3.1- 4.6) 4.1 ( 3.4- 5.0) ∼ ∼
Seattle-Puget Sound 4.5 ( 3.6- 5.6) 4.6 ( 3.7- 5.7) 3.7 ( 2.9- 4.7) 4.0 ( 3.1- 5.1) ∼ ∼∗ Data are from selected statewide and metropolitan area cancer registries that meet the following data quality criteria for all invasive cancer sites combined: case
ascertainment is at least 90% complete; ≥ 97% of cases pass a standard set of computerized edits; ≤ 5% of cases were ascertained by death certificate only; ≤ 3% of
cases are missing information on sex; ≤ 5% of cases are missing information on race; ≤ 3% of cases are missing information on age. See Appendix H for registry-specific
data quality information. U.S. rates cover approximately 78% of the U.S. population.
† Invasive cancers only
‡ Rates are per 100,000 persons. Population denominators for 1999 are projected from the 1990 census and may not accurately reflect the 1999 population size. Caution
should be used in interpreting rates based on these projected populations.
§ Rates are age-adjusted to the 2000 U.S. standard population.
∼ Rates are suppressed if fewer than 16 cases were reported in the specific area-race category.
Notes: Cases from suppressed rates are included in the U.S. and region/division rates. Observed region/division age-adjusted incidence rates are presented for
regions/divisions with ≥ 78% of the population covered by registries that meet the data quality criteria specified above, and if the 95% confidence intervals
around the observed region/division rates for each of four major cancers include "bias-corrected" estimated region/division rates (see technical notes) for
each of those cancers. U.S rates are as presented in Table 1.2. California, Washington, and Michigan state rates each include cases from the SEER metropolitan
areas.
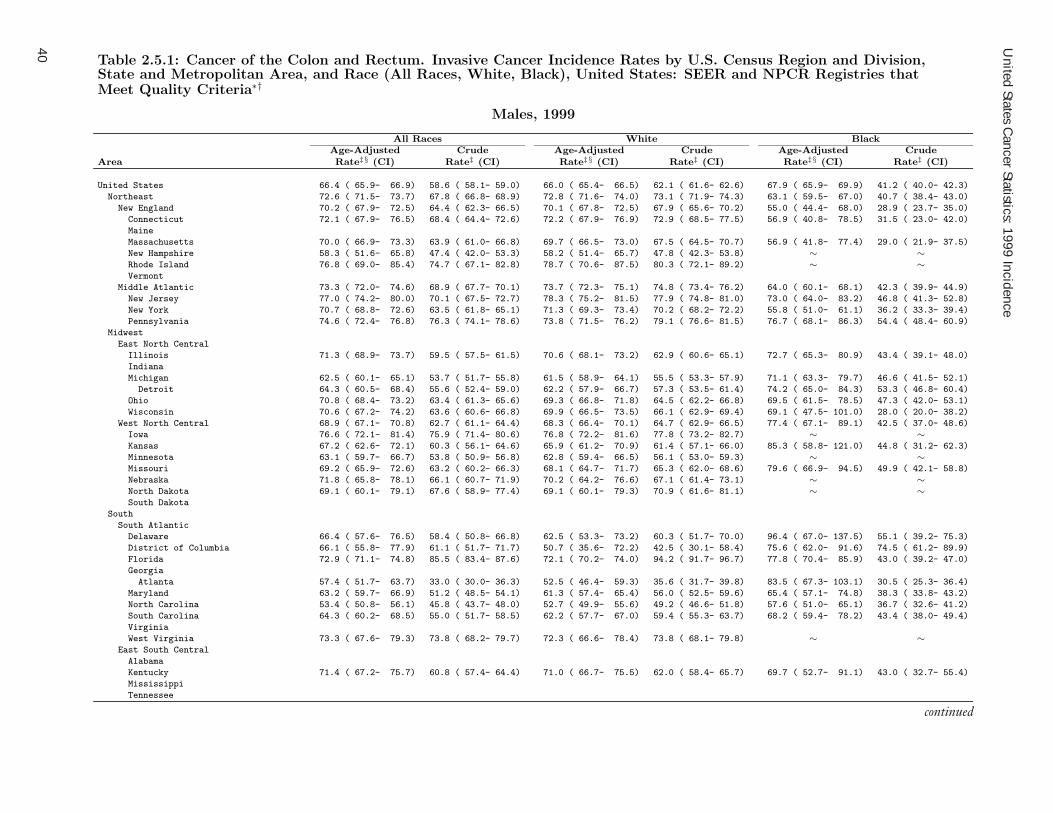
United States C
ancer Statistics: 1999 Incidence
40
Table 2.5.1: Cancer of the Colon and Rectum. Invasive Cancer Incidence Rates by U.S. Census Region and Division,State and Metropolitan Area, and Race (All Races, White, Black), United States: SEER and NPCR Registries thatMeet Quality Criteria∗†
Males, 1999
All Races White BlackAge-Adjusted Crude Age-Adjusted Crude Age-Adjusted Crude
Area Rate‡§ (CI) Rate‡ (CI) Rate‡§ (CI) Rate‡ (CI) Rate‡§ (CI) Rate‡ (CI)
United States 66.4 ( 65.9- 66.9) 58.6 ( 58.1- 59.0) 66.0 ( 65.4- 66.5) 62.1 ( 61.6- 62.6) 67.9 ( 65.9- 69.9) 41.2 ( 40.0- 42.3)
Northeast 72.6 ( 71.5- 73.7) 67.8 ( 66.8- 68.9) 72.8 ( 71.6- 74.0) 73.1 ( 71.9- 74.3) 63.1 ( 59.5- 67.0) 40.7 ( 38.4- 43.0)
New England 70.2 ( 67.9- 72.5) 64.4 ( 62.3- 66.5) 70.1 ( 67.8- 72.5) 67.9 ( 65.6- 70.2) 55.0 ( 44.4- 68.0) 28.9 ( 23.7- 35.0)
Connecticut 72.1 ( 67.9- 76.5) 68.4 ( 64.4- 72.6) 72.2 ( 67.9- 76.9) 72.9 ( 68.5- 77.5) 56.9 ( 40.8- 78.5) 31.5 ( 23.0- 42.0)
Maine
Massachusetts 70.0 ( 66.9- 73.3) 63.9 ( 61.0- 66.8) 69.7 ( 66.5- 73.0) 67.5 ( 64.5- 70.7) 56.9 ( 41.8- 77.4) 29.0 ( 21.9- 37.5)
New Hampshire 58.3 ( 51.6- 65.8) 47.4 ( 42.0- 53.3) 58.2 ( 51.4- 65.7) 47.8 ( 42.3- 53.8) ∼ ∼Rhode Island 76.8 ( 69.0- 85.4) 74.7 ( 67.1- 82.8) 78.7 ( 70.6- 87.5) 80.3 ( 72.1- 89.2) ∼ ∼Vermont
Middle Atlantic 73.3 ( 72.0- 74.6) 68.9 ( 67.7- 70.1) 73.7 ( 72.3- 75.1) 74.8 ( 73.4- 76.2) 64.0 ( 60.1- 68.1) 42.3 ( 39.9- 44.9)
New Jersey 77.0 ( 74.2- 80.0) 70.1 ( 67.5- 72.7) 78.3 ( 75.2- 81.5) 77.9 ( 74.8- 81.0) 73.0 ( 64.0- 83.2) 46.8 ( 41.3- 52.8)
New York 70.7 ( 68.8- 72.6) 63.5 ( 61.8- 65.1) 71.3 ( 69.3- 73.4) 70.2 ( 68.2- 72.2) 55.8 ( 51.0- 61.1) 36.2 ( 33.3- 39.4)
Pennsylvania 74.6 ( 72.4- 76.8) 76.3 ( 74.1- 78.6) 73.8 ( 71.5- 76.2) 79.1 ( 76.6- 81.5) 76.7 ( 68.1- 86.3) 54.4 ( 48.4- 60.9)
Midwest
East North Central
Illinois 71.3 ( 68.9- 73.7) 59.5 ( 57.5- 61.5) 70.6 ( 68.1- 73.2) 62.9 ( 60.6- 65.1) 72.7 ( 65.3- 80.9) 43.4 ( 39.1- 48.0)
Indiana
Michigan 62.5 ( 60.1- 65.1) 53.7 ( 51.7- 55.8) 61.5 ( 58.9- 64.1) 55.5 ( 53.3- 57.9) 71.1 ( 63.3- 79.7) 46.6 ( 41.5- 52.1)
Detroit 64.3 ( 60.5- 68.4) 55.6 ( 52.4- 59.0) 62.2 ( 57.9- 66.7) 57.3 ( 53.5- 61.4) 74.2 ( 65.0- 84.3) 53.3 ( 46.8- 60.4)
Ohio 70.8 ( 68.4- 73.2) 63.4 ( 61.3- 65.6) 69.3 ( 66.8- 71.8) 64.5 ( 62.2- 66.8) 69.5 ( 61.5- 78.5) 47.3 ( 42.0- 53.1)
Wisconsin 70.6 ( 67.2- 74.2) 63.6 ( 60.6- 66.8) 69.9 ( 66.5- 73.5) 66.1 ( 62.9- 69.4) 69.1 ( 47.5- 101.0) 28.0 ( 20.0- 38.2)
West North Central 68.9 ( 67.1- 70.8) 62.7 ( 61.1- 64.4) 68.3 ( 66.4- 70.1) 64.7 ( 62.9- 66.5) 77.4 ( 67.1- 89.1) 42.5 ( 37.0- 48.6)
Iowa 76.6 ( 72.1- 81.4) 75.9 ( 71.4- 80.6) 76.8 ( 72.2- 81.6) 77.8 ( 73.2- 82.7) ∼ ∼Kansas 67.2 ( 62.6- 72.1) 60.3 ( 56.1- 64.6) 65.9 ( 61.2- 70.9) 61.4 ( 57.1- 66.0) 85.3 ( 58.8- 121.0) 44.8 ( 31.2- 62.3)
Minnesota 63.1 ( 59.7- 66.7) 53.8 ( 50.9- 56.8) 62.8 ( 59.4- 66.5) 56.1 ( 53.0- 59.3) ∼ ∼Missouri 69.2 ( 65.9- 72.6) 63.2 ( 60.2- 66.3) 68.1 ( 64.7- 71.7) 65.3 ( 62.0- 68.6) 79.6 ( 66.9- 94.5) 49.9 ( 42.1- 58.8)
Nebraska 71.8 ( 65.8- 78.1) 66.1 ( 60.7- 71.9) 70.2 ( 64.2- 76.6) 67.1 ( 61.4- 73.1) ∼ ∼North Dakota 69.1 ( 60.1- 79.1) 67.6 ( 58.9- 77.4) 69.1 ( 60.1- 79.3) 70.9 ( 61.6- 81.1) ∼ ∼South Dakota
South
South Atlantic
Delaware 66.4 ( 57.6- 76.5) 58.4 ( 50.8- 66.8) 62.5 ( 53.3- 73.2) 60.3 ( 51.7- 70.0) 96.4 ( 67.0- 137.5) 55.1 ( 39.2- 75.3)
District of Columbia 66.1 ( 55.8- 77.9) 61.1 ( 51.7- 71.7) 50.7 ( 35.6- 72.2) 42.5 ( 30.1- 58.4) 75.6 ( 62.0- 91.6) 74.5 ( 61.2- 89.9)
Florida 72.9 ( 71.1- 74.8) 85.5 ( 83.4- 87.6) 72.1 ( 70.2- 74.0) 94.2 ( 91.7- 96.7) 77.8 ( 70.4- 85.9) 43.0 ( 39.2- 47.0)
Georgia
Atlanta 57.4 ( 51.7- 63.7) 33.0 ( 30.0- 36.3) 52.5 ( 46.4- 59.3) 35.6 ( 31.7- 39.8) 83.5 ( 67.3- 103.1) 30.5 ( 25.3- 36.4)
Maryland 63.2 ( 59.7- 66.9) 51.2 ( 48.5- 54.1) 61.3 ( 57.4- 65.4) 56.0 ( 52.5- 59.6) 65.4 ( 57.1- 74.8) 38.3 ( 33.8- 43.2)
North Carolina 53.4 ( 50.8- 56.1) 45.8 ( 43.7- 48.0) 52.7 ( 49.9- 55.6) 49.2 ( 46.6- 51.8) 57.6 ( 51.0- 65.1) 36.7 ( 32.6- 41.2)
South Carolina 64.3 ( 60.2- 68.5) 55.0 ( 51.7- 58.5) 62.2 ( 57.7- 67.0) 59.4 ( 55.3- 63.7) 68.2 ( 59.4- 78.2) 43.4 ( 38.0- 49.4)
Virginia
West Virginia 73.3 ( 67.6- 79.3) 73.8 ( 68.2- 79.7) 72.3 ( 66.6- 78.4) 73.8 ( 68.1- 79.8) ∼ ∼East South Central
Alabama
Kentucky 71.4 ( 67.2- 75.7) 60.8 ( 57.4- 64.4) 71.0 ( 66.7- 75.5) 62.0 ( 58.4- 65.7) 69.7 ( 52.7- 91.1) 43.0 ( 32.7- 55.4)
Mississippi
Tennessee
continued

Cancer Incidence, by U
.S. Census R
egion and Division, State, and M
etropolitan Area
41
Table 2.5.1: Cancer of the Colon and Rectum. Invasive Cancer Incidence Rates by U.S. Census Region and Division,State and Metropolitan Area, and Race (All Races, White, Black), United States: SEER and NPCR Registries thatMeet Quality Criteria∗† (continued)
Males, 1999
All Races White BlackAge-Adjusted Crude Age-Adjusted Crude Age-Adjusted Crude
Area Rate‡§ (CI) Rate‡ (CI) Rate‡§ (CI) Rate‡ (CI) Rate‡§ (CI) Rate‡ (CI)
West South Central
Arkansas
Louisiana 70.5 ( 66.5- 74.7) 57.1 ( 53.9- 60.4) 69.1 ( 64.5- 73.9) 63.4 ( 59.3- 67.7) 77.3 ( 68.6- 86.9) 45.7 ( 40.6- 51.1)
Oklahoma
Texas
West 57.1 ( 56.1- 58.1) 45.4 ( 44.6- 46.2) 56.7 ( 55.7- 57.8) 47.1 ( 46.2- 47.9) 60.9 ( 55.7- 66.4) 35.4 ( 32.6- 38.4)
Mountain
Arizona 54.7 ( 51.6- 58.0) 49.4 ( 46.6- 52.3) 55.6 ( 52.3- 59.0) 53.4 ( 50.3- 56.6) 56.6 ( 33.0- 93.8) 26.9 ( 17.2- 40.0)
Colorado 54.8 ( 51.0- 58.9) 41.2 ( 38.4- 44.1) 54.8 ( 50.8- 58.9) 42.1 ( 39.2- 45.2) 39.3 ( 24.1- 65.3) 26.7 ( 17.1- 39.7)
Idaho 52.2 ( 46.1- 58.9) 43.3 ( 38.3- 48.8) 52.3 ( 46.1- 59.1) 44.1 ( 38.9- 49.7) ∼ ∼Montana 63.3 ( 55.9- 71.6) 60.5 ( 53.5- 68.3) 59.7 ( 52.3- 67.9) 59.4 ( 52.2- 67.4) ∼ ∼Nevada
New Mexico 53.5 ( 48.2- 59.2) 45.5 ( 41.1- 50.2) 54.9 ( 49.4- 61.0) 50.2 ( 45.2- 55.5) ∼ ∼Utah 50.7 ( 45.4- 56.4) 32.9 ( 29.5- 36.5) 51.2 ( 45.8- 57.0) 33.9 ( 30.4- 37.7) ∼ ∼Wyoming 65.9 ( 55.1- 78.5) 56.4 ( 47.3- 66.7) 67.1 ( 56.1- 80.0) 58.7 ( 49.2- 69.4) ∼ ∼
Pacific 58.0 ( 56.8- 59.1) 45.6 ( 44.7- 46.5) 57.4 ( 56.2- 58.7) 47.1 ( 46.1- 48.2) 62.9 ( 57.4- 68.9) 36.9 ( 33.8- 40.2)
Alaska 67.3 ( 54.0- 84.3) 36.0 ( 29.8- 43.1) 53.5 ( 40.6- 71.1) 31.0 ( 24.5- 38.8) ∼ ∼California 57.1 ( 55.8- 58.4) 43.6 ( 42.6- 44.6) 56.8 ( 55.4- 58.3) 45.5 ( 44.4- 46.7) 64.0 ( 58.2- 70.5) 38.4 ( 35.1- 42.1)
San Francisco-Oakland 60.0 ( 56.3- 63.9) 51.0 ( 47.9- 54.2) 60.2 ( 55.9- 64.8) 55.4 ( 51.5- 59.5) 52.6 ( 41.6- 66.1) 35.6 ( 28.4- 44.1)
San Jose-Monterey 54.1 ( 49.2- 59.5) 39.1 ( 35.6- 42.8) 54.4 ( 49.0- 60.4) 41.2 ( 37.1- 45.6) 85.4 ( 44.6- 164.4) 36.9 ( 21.9- 58.3)
Los Angeles 56.8 ( 54.2- 59.4) 40.5 ( 38.7- 42.4) 55.6 ( 52.7- 58.6) 40.4 ( 38.4- 42.6) 68.5 ( 59.7- 78.5) 47.4 ( 41.5- 53.9)
Hawaii 61.8 ( 55.5- 68.7) 59.5 ( 53.4- 66.0) 59.3 ( 46.8- 74.4) 46.6 ( 36.9- 58.1) ∼ ∼Oregon 56.7 ( 53.0- 60.7) 52.8 ( 49.3- 56.4) 56.3 ( 52.5- 60.3) 54.0 ( 50.3- 57.8) ∼ ∼Washington 62.1 ( 58.9- 65.4) 51.1 ( 48.5- 53.8) 61.5 ( 58.2- 64.9) 53.1 ( 50.3- 56.0) 47.9 ( 31.2- 74.0) 27.4 ( 18.3- 39.3)
Seattle-Puget Sound 61.0 ( 57.2- 65.1) 49.2 ( 46.2- 52.4) 61.4 ( 57.3- 65.6) 52.4 ( 49.0- 55.9) 52.7 ( 34.0- 82.6) 30.1 ( 20.0- 43.5)
∗ Data are from selected statewide and metropolitan area cancer registries that meet the following data quality criteria for all invasive cancer sites combined: case
ascertainment is at least 90% complete; ≥ 97% of cases pass a standard set of computerized edits; ≤ 5% of cases were ascertained by death certificate only; ≤ 3% of
cases are missing information on sex; ≤ 5% of cases are missing information on race; ≤ 3% of cases are missing information on age. See Appendix H for registry-specific
data quality information. U.S. rates cover approximately 78% of the U.S. population.
† Invasive cancers only
‡ Rates are per 100,000 persons. Population denominators for 1999 are projected from the 1990 census and may not accurately reflect the 1999 population size. Caution
should be used in interpreting rates based on these projected populations.
§ Rates are age-adjusted to the 2000 U.S. standard population.
∼ Rates are suppressed if fewer than 16 cases were reported in the specific area-race category.
Notes: Cases from suppressed rates are included in the U.S. and region/division rates. Observed region/division age-adjusted incidence rates are presented for
regions/divisions with ≥ 78% of the population covered by registries that meet the data quality criteria specified above, and if the 95% confidence intervals
around the observed region/division rates for each of four major cancers include "bias-corrected" estimated region/division rates (see technical notes) for
each of those cancers. U.S rates are as presented in Table 1.1. California, Washington, and Michigan state rates each include cases from the SEER metropolitan
areas.

United States C
ancer Statistics: 1999 Incidence
42
Table 2.5.2: Cancer of the Colon and Rectum. Invasive Cancer Incidence Rates by U.S. Census Region and Division,State and Metropolitan Area, and Race (All Races, White, Black), United States: SEER and NPCR Registries thatMeet Quality Criteria∗†
Females, 1999
All Races White BlackAge-Adjusted Crude Age-Adjusted Crude Age-Adjusted Crude
Area Rate‡§ (CI) Rate‡ (CI) Rate‡§ (CI) Rate‡ (CI) Rate‡§ (CI) Rate‡ (CI)
United States 48.5 ( 48.1- 48.9) 55.3 ( 54.9- 55.7) 47.6 ( 47.2- 48.0) 58.4 ( 57.9- 58.9) 54.0 ( 52.6- 55.4) 42.5 ( 41.4- 43.6)
Northeast 53.2 ( 52.4- 54.0) 65.9 ( 64.9- 66.9) 52.6 ( 51.7- 53.4) 70.5 ( 69.4- 71.6) 53.2 ( 50.5- 56.0) 44.7 ( 42.5- 47.0)
New England 52.7 ( 51.0- 54.4) 64.7 ( 62.7- 66.7) 52.1 ( 50.3- 53.8) 67.7 ( 65.5- 69.9) 56.0 ( 47.2- 66.2) 37.3 ( 31.6- 43.8)
Connecticut 54.2 ( 51.1- 57.5) 68.0 ( 64.1- 72.0) 52.8 ( 49.6- 56.2) 71.1 ( 66.9- 75.5) 68.5 ( 54.2- 85.8) 50.7 ( 40.4- 63.0)
Maine
Massachusetts 51.2 ( 49.0- 53.6) 63.1 ( 60.4- 65.9) 50.8 ( 48.5- 53.2) 66.7 ( 63.7- 69.8) 47.3 ( 35.9- 61.5) 29.4 ( 22.5- 37.7)
New Hampshire 47.4 ( 42.2- 53.2) 50.2 ( 44.8- 56.2) 46.7 ( 41.5- 52.5) 50.0 ( 44.5- 56.0) ∼ ∼Rhode Island 61.8 ( 55.8- 68.4) 80.9 ( 73.3- 89.0) 62.3 ( 56.2- 69.1) 85.6 ( 77.4- 94.3) ∼ ∼Vermont
Middle Atlantic 53.3 ( 52.4- 54.3) 66.2 ( 65.1- 67.4) 52.7 ( 51.7- 53.7) 71.4 ( 70.1- 72.7) 52.9 ( 50.1- 55.8) 45.7 ( 43.3- 48.2)
New Jersey 52.6 ( 50.6- 54.6) 63.1 ( 60.8- 65.6) 52.7 ( 50.5- 54.9) 70.1 ( 67.3- 73.0) 55.9 ( 49.4- 63.1) 44.4 ( 39.3- 49.9)
New York 53.5 ( 52.1- 54.9) 63.5 ( 61.9- 65.1) 52.7 ( 51.2- 54.2) 69.2 ( 67.3- 71.2) 49.8 ( 46.2- 53.5) 43.1 ( 40.0- 46.3)
Pennsylvania 53.5 ( 51.9- 55.1) 72.6 ( 70.5- 74.7) 52.7 ( 51.1- 54.4) 75.1 ( 72.8- 77.4) 58.0 ( 51.9- 64.6) 54.2 ( 48.6- 60.4)
Midwest
East North Central
Illinois 50.4 ( 48.7- 52.1) 56.4 ( 54.6- 58.3) 48.9 ( 47.1- 50.7) 59.5 ( 57.3- 61.6) 57.2 ( 51.9- 62.8) 45.3 ( 41.2- 49.7)
Indiana
Michigan 47.2 ( 45.4- 49.0) 51.8 ( 49.9- 53.9) 45.8 ( 43.9- 47.7) 53.6 ( 51.5- 55.9) 54.1 ( 48.5- 60.3) 44.6 ( 40.0- 49.7)
Detroit 47.9 ( 45.1- 50.8) 53.4 ( 50.3- 56.6) 45.4 ( 42.4- 48.6) 56.1 ( 52.4- 60.0) 56.6 ( 50.0- 63.9) 49.4 ( 43.7- 55.6)
Ohio 50.0 ( 48.3- 51.7) 58.6 ( 56.7- 60.6) 48.3 ( 46.6- 50.1) 59.3 ( 57.2- 61.4) 55.5 ( 49.6- 61.9) 46.9 ( 41.9- 52.3)
Wisconsin 47.3 ( 44.8- 49.8) 55.1 ( 52.3- 58.0) 46.3 ( 43.9- 48.9) 56.9 ( 53.9- 60.0) 67.7 ( 49.6- 91.1) 34.0 ( 25.4- 44.6)
West North Central 48.9 ( 47.6- 50.3) 58.5 ( 56.9- 60.1) 48.3 ( 47.0- 49.7) 60.3 ( 58.7- 62.0) 55.1 ( 47.9- 63.0) 39.7 ( 34.5- 45.3)
Iowa 55.0 ( 51.7- 58.5) 72.6 ( 68.3- 77.1) 55.1 ( 51.7- 58.7) 74.3 ( 69.9- 78.9) ∼ ∼Kansas 48.0 ( 44.6- 51.6) 57.0 ( 53.1- 61.2) 46.9 ( 43.4- 50.5) 58.1 ( 53.9- 62.5) 58.6 ( 40.5- 82.5) 43.2 ( 29.9- 60.4)
Minnesota 45.5 ( 43.0- 48.2) 50.6 ( 47.8- 53.5) 44.6 ( 42.1- 47.3) 52.1 ( 49.2- 55.2) 64.2 ( 38.0- 103.9) 27.7 ( 16.9- 42.8)
Missouri 48.9 ( 46.6- 51.4) 58.4 ( 55.6- 61.3) 48.3 ( 45.8- 50.8) 60.8 ( 57.7- 63.9) 54.6 ( 46.0- 64.4) 43.8 ( 36.9- 51.6)
Nebraska 50.7 ( 46.4- 55.4) 61.6 ( 56.4- 67.1) 50.5 ( 46.0- 55.2) 63.3 ( 57.9- 69.1) ∼ ∼North Dakota 42.0 ( 35.7- 49.2) 52.5 ( 44.8- 61.1) 41.6 ( 35.2- 48.9) 54.4 ( 46.3- 63.4) ∼ ∼South Dakota
South
South Atlantic
Delaware 54.4 ( 47.6- 62.0) 59.7 ( 52.3- 67.9) 51.6 ( 44.4- 59.7) 62.6 ( 53.9- 72.2) 79.9 ( 57.3- 109.1) 54.9 ( 39.8- 74.0)
District of Columbia 55.3 ( 47.7- 64.2) 68.6 ( 59.2- 79.1) 34.3 ( 23.8- 51.0) 39.7 ( 28.0- 54.8) 66.1 ( 55.9- 78.4) 86.1 ( 72.9-101.1)
Florida 53.0 ( 51.6- 54.4) 75.3 ( 73.4- 77.3) 52.1 ( 50.6- 53.5) 82.7 ( 80.5- 85.0) 58.1 ( 52.9- 63.7) 40.1 ( 36.6- 43.8)
Georgia
Atlanta 43.5 ( 39.6- 47.7) 33.4 ( 30.4- 36.6) 38.4 ( 34.2- 43.0) 35.1 ( 31.3- 39.2) 65.5 ( 55.0- 77.6) 33.2 ( 28.1- 39.0)
Maryland 45.6 ( 43.1- 48.2) 47.3 ( 44.7- 49.9) 42.6 ( 39.9- 45.5) 51.9 ( 48.6- 55.4) 50.1 ( 44.2- 56.5) 36.1 ( 32.0- 40.6)
North Carolina 42.1 ( 40.2- 44.1) 46.6 ( 44.5- 48.7) 41.0 ( 38.9- 43.2) 49.5 ( 46.9- 52.1) 47.5 ( 42.7- 52.6) 40.6 ( 36.5- 44.9)
South Carolina 44.1 ( 41.3- 47.0) 47.5 ( 44.5- 50.6) 41.2 ( 38.1- 44.4) 49.6 ( 45.9- 53.4) 51.4 ( 45.4- 58.1) 42.6 ( 37.6- 48.1)
Virginia
West Virginia 52.2 ( 48.2- 56.5) 68.4 ( 63.2- 73.9) 52.0 ( 47.9- 56.4) 68.6 ( 63.3- 74.2) 61.0 ( 36.7- 96.8) 66.7 ( 40.7-103.0)
East South Central
Alabama
Kentucky 52.2 ( 49.3- 55.3) 58.6 ( 55.3- 62.0) 51.3 ( 48.4- 54.5) 59.1 ( 55.6- 62.7) 62.6 ( 49.7- 77.9) 54.3 ( 43.2- 67.4)
Mississippi
Tennessee
continued

Cancer Incidence, by U
.S. Census R
egion and Division, State, and M
etropolitan Area
43
Table 2.5.2: Cancer of the Colon and Rectum. Invasive Cancer Incidence Rates by U.S. Census Region and Division,State and Metropolitan Area, and Race (All Races, White, Black), United States: SEER and NPCR Registries thatMeet Quality Criteria∗† (continued)
Females, 1999
All Races White BlackAge-Adjusted Crude Age-Adjusted Crude Age-Adjusted Crude
Area Rate‡§ (CI) Rate‡ (CI) Rate‡§ (CI) Rate‡ (CI) Rate‡§ (CI) Rate‡ (CI)
West South Central
Arkansas
Louisiana 47.5 ( 44.8- 50.4) 49.1 ( 46.2- 52.0) 46.5 ( 43.3- 49.9) 54.6 ( 50.9- 58.5) 50.6 ( 45.0- 56.8) 39.8 ( 35.4- 44.5)
Oklahoma
Texas
West 42.5 ( 41.7- 43.2) 42.7 ( 41.9- 43.4) 41.8 ( 41.1- 42.6) 44.3 ( 43.4- 45.1) 52.7 ( 48.5- 57.1) 37.8 ( 34.9- 40.9)
Mountain
Arizona 40.0 ( 37.6- 42.5) 43.7 ( 41.1- 46.4) 41.0 ( 38.5- 43.6) 47.6 ( 44.7- 50.6) 33.6 ( 19.2- 55.5) 19.8 ( 11.5- 31.6)
Colorado 39.4 ( 36.6- 42.3) 37.5 ( 34.9- 40.3) 39.0 ( 36.2- 41.9) 38.3 ( 35.5- 41.2) 45.3 ( 29.1- 68.3) 31.1 ( 20.5- 45.2)
Idaho 38.7 ( 34.0- 43.9) 39.9 ( 35.1- 45.2) 38.7 ( 34.0- 43.9) 40.5 ( 35.6- 45.9) ∼ ∼Montana 41.9 ( 36.4- 48.0) 49.1 ( 42.8- 56.1) 40.0 ( 34.6- 46.1) 49.2 ( 42.7- 56.5) ∼ ∼Nevada
New Mexico 32.3 ( 28.7- 36.3) 32.1 ( 28.5- 36.1) 34.2 ( 30.3- 38.5) 36.2 ( 32.1- 40.8) ∼ ∼Utah 35.4 ( 31.5- 39.7) 27.7 ( 24.6- 31.0) 35.6 ( 31.6- 39.9) 28.4 ( 25.3- 31.9) ∼ ∼Wyoming 48.4 ( 40.1- 58.1) 50.7 ( 42.1- 60.6) 48.1 ( 39.8- 57.9) 51.6 ( 42.7- 61.8) ∼ ∼
Pacific 43.8 ( 42.9- 44.7) 44.0 ( 43.2- 44.9) 43.0 ( 42.0- 43.9) 45.7 ( 44.7- 46.7) 54.7 ( 50.2- 59.5) 40.0 ( 36.7- 43.4)
Alaska 49.6 ( 39.0- 62.5) 29.6 ( 23.7- 36.5) 38.6 ( 27.8- 52.8) 22.4 ( 16.6- 29.7) ∼ ∼California 42.9 ( 41.9- 43.9) 42.4 ( 41.4- 43.4) 42.3 ( 41.2- 43.4) 44.3 ( 43.2- 45.5) 55.2 ( 50.5- 60.2) 41.7 ( 38.2- 45.4)
San Francisco-Oakland 45.9 ( 43.2- 48.8) 51.3 ( 48.2- 54.5) 44.8 ( 41.6- 48.2) 55.5 ( 51.6- 59.6) 55.4 ( 45.8- 66.6) 46.7 ( 38.7- 56.0)
San Jose-Monterey 38.4 ( 34.8- 42.3) 36.5 ( 33.1- 40.2) 38.8 ( 34.8- 43.1) 39.6 ( 35.6- 44.0) ∼ ∼Los Angeles 42.2 ( 40.3- 44.1) 40.1 ( 38.3- 41.9) 40.9 ( 38.8- 43.2) 40.6 ( 38.5- 42.7) 52.5 ( 46.1- 59.4) 45.4 ( 40.0- 51.4)
Hawaii 48.0 ( 42.9- 53.6) 54.0 ( 48.3- 60.3) 43.5 ( 33.7- 55.6) 44.1 ( 34.2- 56.0) ∼ ∼Oregon 48.4 ( 45.3- 51.6) 56.5 ( 52.9- 60.2) 48.1 ( 45.0- 51.3) 58.1 ( 54.4- 62.0) ∼ ∼Washington 44.3 ( 42.0- 46.8) 45.9 ( 43.4- 48.4) 43.2 ( 40.8- 45.7) 47.1 ( 44.5- 49.8) 53.0 ( 34.6- 78.5) 27.9 ( 18.4- 40.6)
Seattle-Puget Sound 45.7 ( 42.8- 48.7) 46.7 ( 43.7- 49.8) 45.4 ( 42.4- 48.6) 49.5 ( 46.2- 52.9) 59.8 ( 39.0- 88.9) 31.3 ( 20.6- 45.6)
∗ Data are from selected statewide and metropolitan area cancer registries that meet the following data quality criteria for all invasive cancer sites combined: case
ascertainment is at least 90% complete; ≥ 97% of cases pass a standard set of computerized edits; ≤ 5% of cases were ascertained by death certificate only; ≤ 3% of
cases are missing information on sex; ≤ 5% of cases are missing information on race; ≤ 3% of cases are missing information on age. See Appendix H for registry-specific
data quality information. U.S. rates cover approximately 78% of the U.S. population.
† Invasive cancers only
‡ Rates are per 100,000 persons. Population denominators for 1999 are projected from the 1990 census and may not accurately reflect the 1999 population size. Caution
should be used in interpreting rates based on these projected populations.
§ Rates are age-adjusted to the 2000 U.S. standard population.
∼ Rates are suppressed if fewer than 16 cases were reported in the specific area-race category.
Notes: Cases from suppressed rates are included in the U.S. and region/division rates. Observed region/division age-adjusted incidence rates are presented for
regions/divisions with ≥ 78% of the population covered by registries that meet the data quality criteria specified above, and if the 95% confidence intervals
around the observed region/division rates for each of four major cancers include "bias-corrected" estimated region/division rates (see technical notes) for
each of those cancers. U.S rates are as presented in Table 1.2. California, Washington, and Michigan state rates each include cases from the SEER metropolitan
areas.

United States C
ancer Statistics: 1999 Incidence
44
Table 2.6.1: Cancer of the Liver and Intrahepatic Bile Duct. Invasive Cancer Incidence Rates by U.S. Census Regionand Division, State and Metropolitan Area, and Race (All Races, White, Black), United States: SEER and NPCRRegistries that Meet Quality Criteria∗†
Males, 1999
All Races White BlackAge-Adjusted Crude Age-Adjusted Crude Age-Adjusted Crude
Area Rate‡§ (CI) Rate‡ (CI) Rate‡§ (CI) Rate‡ (CI) Rate‡§ (CI) Rate‡ (CI)
United States 7.0 ( 6.9- 7.2) 6.4 ( 6.3- 6.6) 6.1 ( 5.9- 6.3) 5.9 ( 5.7- 6.0) 9.6 ( 8.9- 10.4) 6.5 ( 6.1- 7.0)
Northeast 7.8 ( 7.4- 8.2) 7.5 ( 7.2- 7.9) 6.8 ( 6.5- 7.2) 6.9 ( 6.6- 7.3) 11.1 ( 9.7- 12.7) 7.9 ( 6.9- 9.0)
New England 6.9 ( 6.2- 7.7) 6.5 ( 5.9- 7.2) 6.3 ( 5.7- 7.1) 6.2 ( 5.6- 7.0) 13.0 ( 8.5- 20.2) 7.5 ( 5.0- 10.8)
Connecticut 7.5 ( 6.2- 9.1) 7.3 ( 6.0- 8.7) 6.8 ( 5.5- 8.3) 6.9 ( 5.6- 8.4) ∼ ∼Maine
Massachusetts 6.8 ( 5.8- 7.8) 6.4 ( 5.5- 7.3) 6.2 ( 5.3- 7.3) 6.2 ( 5.3- 7.2) ∼ ∼New Hampshire 6.1 ( 4.2- 8.8) 5.4 ( 3.7- 7.6) 6.0 ( 4.1- 8.7) 5.4 ( 3.6- 7.6) ∼ ∼Rhode Island 6.5 ( 4.4- 9.4) 6.3 ( 4.2- 9.0) 5.7 ( 3.7- 8.6) 5.7 ( 3.7- 8.4) ∼ ∼Vermont
Middle Atlantic 8.1 ( 7.7- 8.5) 7.8 ( 7.4- 8.2) 7.0 ( 6.5- 7.4) 7.2 ( 6.7- 7.6) 10.9 ( 9.4- 12.6) 8.0 ( 6.9- 9.1)
New Jersey 7.0 ( 6.1- 7.9) 6.5 ( 5.7- 7.3) 6.4 ( 5.5- 7.4) 6.4 ( 5.5- 7.3) 9.8 ( 6.8- 14.0) 6.9 ( 4.9- 9.4)
New York 9.2 ( 8.5- 9.8) 8.6 ( 7.9- 9.2) 8.1 ( 7.4- 8.8) 8.1 ( 7.4- 8.8) 9.3 ( 7.5- 11.5) 6.7 ( 5.5- 8.2)
Pennsylvania 7.3 ( 6.6- 8.0) 7.6 ( 6.9- 8.3) 5.9 ( 5.3- 6.6) 6.4 ( 5.7- 7.1) 16.6 ( 12.9- 21.3) 12.6 ( 9.8- 15.9)
Midwest
East North Central
Illinois 7.4 ( 6.7- 8.2) 6.5 ( 5.8- 7.2) 6.3 ( 5.6- 7.1) 5.8 ( 5.2- 6.6) 12.5 ( 9.6- 16.1) 7.8 ( 6.0- 9.9)
Indiana
Michigan 8.1 ( 7.2- 9.0) 7.2 ( 6.4- 8.0) 7.6 ( 6.7- 8.5) 7.0 ( 6.2- 7.9) 10.4 ( 7.6- 14.0) 7.3 ( 5.4- 9.6)
Detroit 8.9 ( 7.6- 10.5) 8.0 ( 6.8- 9.3) 8.3 ( 6.8- 10.0) 7.8 ( 6.4- 9.4) 10.7 ( 7.5- 15.0) 8.1 ( 5.7- 11.1)
Ohio 5.6 ( 4.9- 6.3) 5.1 ( 4.5- 5.7) 4.7 ( 4.1- 5.4) 4.4 ( 3.8- 5.1) 11.8 ( 8.8- 15.9) 8.5 ( 6.3- 11.1)
Wisconsin 5.9 ( 5.0- 7.0) 5.5 ( 4.6- 6.4) 5.9 ( 4.9- 7.0) 5.6 ( 4.7- 6.7) ∼ ∼West North Central 5.1 ( 4.6- 5.6) 4.7 ( 4.3- 5.2) 4.5 ( 4.0- 5.0) 4.4 ( 3.9- 4.8) 12.0 ( 8.4- 17.0) 7.7 ( 5.5- 10.5)
Iowa 5.3 ( 4.1- 6.7) 5.2 ( 4.1- 6.6) 4.9 ( 3.8- 6.3) 5.0 ( 3.9- 6.3) ∼ ∼Kansas 4.7 ( 3.5- 6.1) 4.3 ( 3.2- 5.6) 4.4 ( 3.3- 5.9) 4.2 ( 3.1- 5.5) ∼ ∼Minnesota 5.1 ( 4.2- 6.2) 4.6 ( 3.8- 5.6) 4.3 ( 3.4- 5.3) 4.0 ( 3.2- 4.9) ∼ ∼Missouri 5.3 ( 4.4- 6.3) 5.0 ( 4.2- 5.9) 4.5 ( 3.7- 5.5) 4.4 ( 3.6- 5.4) 12.4 ( 7.9- 19.2) 8.3 ( 5.3- 12.4)
Nebraska 4.8 ( 3.4- 6.6) 4.5 ( 3.2- 6.3) 4.5 ( 3.1- 6.4) 4.5 ( 3.1- 6.2) ∼ ∼North Dakota ∼ ∼ ∼ ∼ ∼ ∼South Dakota
South
South Atlantic
Delaware 4.8 ( 2.7- 8.3) 4.4 ( 2.5- 7.1) ∼ ∼ ∼ ∼District of Columbia 11.9 ( 7.9- 17.4) 11.9 ( 8.0- 17.1) ∼ ∼ 14.7 ( 9.2- 22.8) 15.0 ( 9.4- 22.8)
Florida 7.1 ( 6.5- 7.7) 8.1 ( 7.5- 8.8) 6.6 ( 6.0- 7.2) 8.4 ( 7.7- 9.1) 9.7 ( 7.4- 12.9) 6.1 ( 4.7- 7.7)
Georgia
Atlanta 5.9 ( 4.2- 8.1) 3.7 ( 2.8- 5.0) 4.1 ( 2.5- 6.5) 2.7 ( 1.7- 4.0) ∼ ∼Maryland 6.0 ( 4.9- 7.2) 4.9 ( 4.1- 5.9) 5.0 ( 3.9- 6.3) 4.5 ( 3.5- 5.6) 7.4 ( 5.0- 11.0) 5.0 ( 3.4- 6.9)
North Carolina 4.2 ( 3.5- 5.0) 3.8 ( 3.2- 4.5) 4.0 ( 3.3- 4.9) 3.9 ( 3.2- 4.7) 4.5 ( 2.9- 7.0) 3.3 ( 2.2- 4.8)
South Carolina 5.3 ( 4.3- 6.7) 4.7 ( 3.8- 5.8) 5.1 ( 3.9- 6.6) 5.0 ( 3.9- 6.4) 5.5 ( 3.3- 8.9) 3.9 ( 2.4- 6.0)
Virginia
West Virginia 5.5 ( 4.1- 7.4) 5.5 ( 4.1- 7.3) 5.1 ( 3.7- 7.0) 5.1 ( 3.7- 6.9) ∼ ∼East South Central
Alabama
Kentucky 5.6 ( 4.5- 6.9) 4.8 ( 3.9- 5.9) 5.4 ( 4.3- 6.8) 4.7 ( 3.8- 5.9) ∼ ∼Mississippi
Tennessee
continued
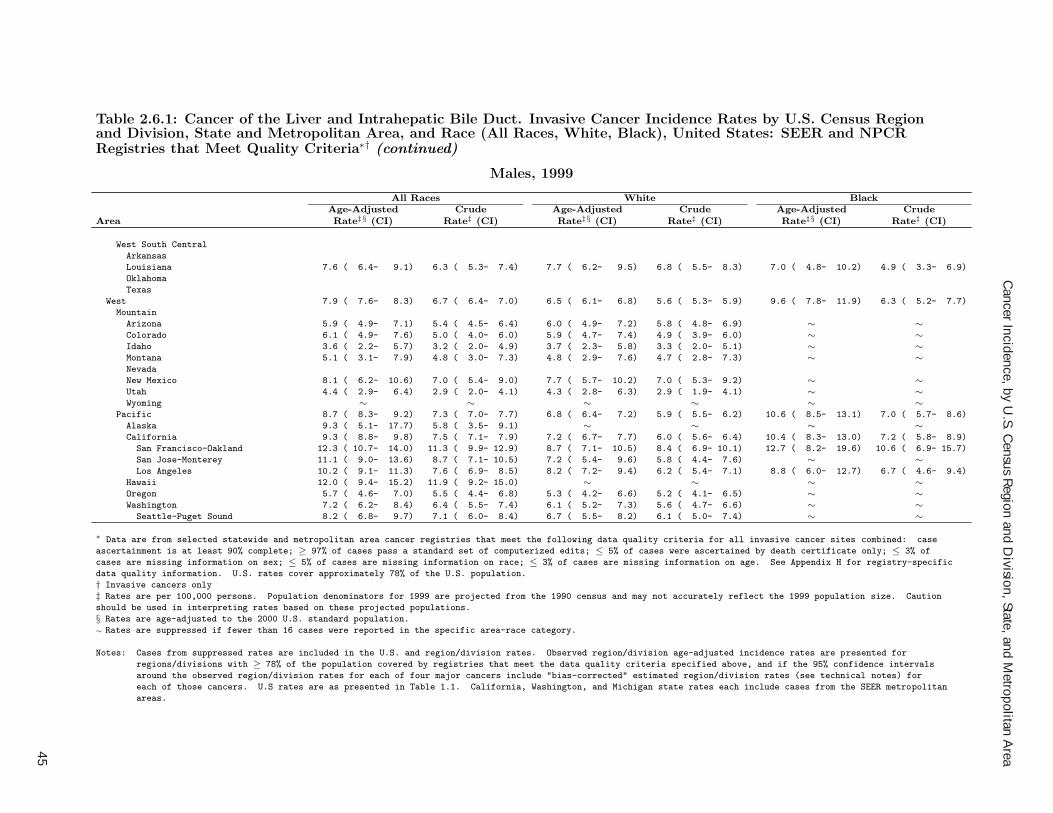
Cancer Incidence, by U
.S. Census R
egion and Division, State, and M
etropolitan Area
45
Table 2.6.1: Cancer of the Liver and Intrahepatic Bile Duct. Invasive Cancer Incidence Rates by U.S. Census Regionand Division, State and Metropolitan Area, and Race (All Races, White, Black), United States: SEER and NPCRRegistries that Meet Quality Criteria∗† (continued)
Males, 1999
All Races White BlackAge-Adjusted Crude Age-Adjusted Crude Age-Adjusted Crude
Area Rate‡§ (CI) Rate‡ (CI) Rate‡§ (CI) Rate‡ (CI) Rate‡§ (CI) Rate‡ (CI)
West South Central
Arkansas
Louisiana 7.6 ( 6.4- 9.1) 6.3 ( 5.3- 7.4) 7.7 ( 6.2- 9.5) 6.8 ( 5.5- 8.3) 7.0 ( 4.8- 10.2) 4.9 ( 3.3- 6.9)
Oklahoma
Texas
West 7.9 ( 7.6- 8.3) 6.7 ( 6.4- 7.0) 6.5 ( 6.1- 6.8) 5.6 ( 5.3- 5.9) 9.6 ( 7.8- 11.9) 6.3 ( 5.2- 7.7)
Mountain
Arizona 5.9 ( 4.9- 7.1) 5.4 ( 4.5- 6.4) 6.0 ( 4.9- 7.2) 5.8 ( 4.8- 6.9) ∼ ∼Colorado 6.1 ( 4.9- 7.6) 5.0 ( 4.0- 6.0) 5.9 ( 4.7- 7.4) 4.9 ( 3.9- 6.0) ∼ ∼Idaho 3.6 ( 2.2- 5.7) 3.2 ( 2.0- 4.9) 3.7 ( 2.3- 5.8) 3.3 ( 2.0- 5.1) ∼ ∼Montana 5.1 ( 3.1- 7.9) 4.8 ( 3.0- 7.3) 4.8 ( 2.9- 7.6) 4.7 ( 2.8- 7.3) ∼ ∼Nevada
New Mexico 8.1 ( 6.2- 10.6) 7.0 ( 5.4- 9.0) 7.7 ( 5.7- 10.2) 7.0 ( 5.3- 9.2) ∼ ∼Utah 4.4 ( 2.9- 6.4) 2.9 ( 2.0- 4.1) 4.3 ( 2.8- 6.3) 2.9 ( 1.9- 4.1) ∼ ∼Wyoming ∼ ∼ ∼ ∼ ∼ ∼
Pacific 8.7 ( 8.3- 9.2) 7.3 ( 7.0- 7.7) 6.8 ( 6.4- 7.2) 5.9 ( 5.5- 6.2) 10.6 ( 8.5- 13.1) 7.0 ( 5.7- 8.6)
Alaska 9.3 ( 5.1- 17.7) 5.8 ( 3.5- 9.1) ∼ ∼ ∼ ∼California 9.3 ( 8.8- 9.8) 7.5 ( 7.1- 7.9) 7.2 ( 6.7- 7.7) 6.0 ( 5.6- 6.4) 10.4 ( 8.3- 13.0) 7.2 ( 5.8- 8.9)
San Francisco-Oakland 12.3 ( 10.7- 14.0) 11.3 ( 9.9- 12.9) 8.7 ( 7.1- 10.5) 8.4 ( 6.9- 10.1) 12.7 ( 8.2- 19.6) 10.6 ( 6.9- 15.7)
San Jose-Monterey 11.1 ( 9.0- 13.6) 8.7 ( 7.1- 10.5) 7.2 ( 5.4- 9.6) 5.8 ( 4.4- 7.6) ∼ ∼Los Angeles 10.2 ( 9.1- 11.3) 7.6 ( 6.9- 8.5) 8.2 ( 7.2- 9.4) 6.2 ( 5.4- 7.1) 8.8 ( 6.0- 12.7) 6.7 ( 4.6- 9.4)
Hawaii 12.0 ( 9.4- 15.2) 11.9 ( 9.2- 15.0) ∼ ∼ ∼ ∼Oregon 5.7 ( 4.6- 7.0) 5.5 ( 4.4- 6.8) 5.3 ( 4.2- 6.6) 5.2 ( 4.1- 6.5) ∼ ∼Washington 7.2 ( 6.2- 8.4) 6.4 ( 5.5- 7.4) 6.1 ( 5.2- 7.3) 5.6 ( 4.7- 6.6) ∼ ∼
Seattle-Puget Sound 8.2 ( 6.8- 9.7) 7.1 ( 6.0- 8.4) 6.7 ( 5.5- 8.2) 6.1 ( 5.0- 7.4) ∼ ∼∗ Data are from selected statewide and metropolitan area cancer registries that meet the following data quality criteria for all invasive cancer sites combined: case
ascertainment is at least 90% complete; ≥ 97% of cases pass a standard set of computerized edits; ≤ 5% of cases were ascertained by death certificate only; ≤ 3% of
cases are missing information on sex; ≤ 5% of cases are missing information on race; ≤ 3% of cases are missing information on age. See Appendix H for registry-specific
data quality information. U.S. rates cover approximately 78% of the U.S. population.
† Invasive cancers only
‡ Rates are per 100,000 persons. Population denominators for 1999 are projected from the 1990 census and may not accurately reflect the 1999 population size. Caution
should be used in interpreting rates based on these projected populations.
§ Rates are age-adjusted to the 2000 U.S. standard population.
∼ Rates are suppressed if fewer than 16 cases were reported in the specific area-race category.
Notes: Cases from suppressed rates are included in the U.S. and region/division rates. Observed region/division age-adjusted incidence rates are presented for
regions/divisions with ≥ 78% of the population covered by registries that meet the data quality criteria specified above, and if the 95% confidence intervals
around the observed region/division rates for each of four major cancers include "bias-corrected" estimated region/division rates (see technical notes) for
each of those cancers. U.S rates are as presented in Table 1.1. California, Washington, and Michigan state rates each include cases from the SEER metropolitan
areas.
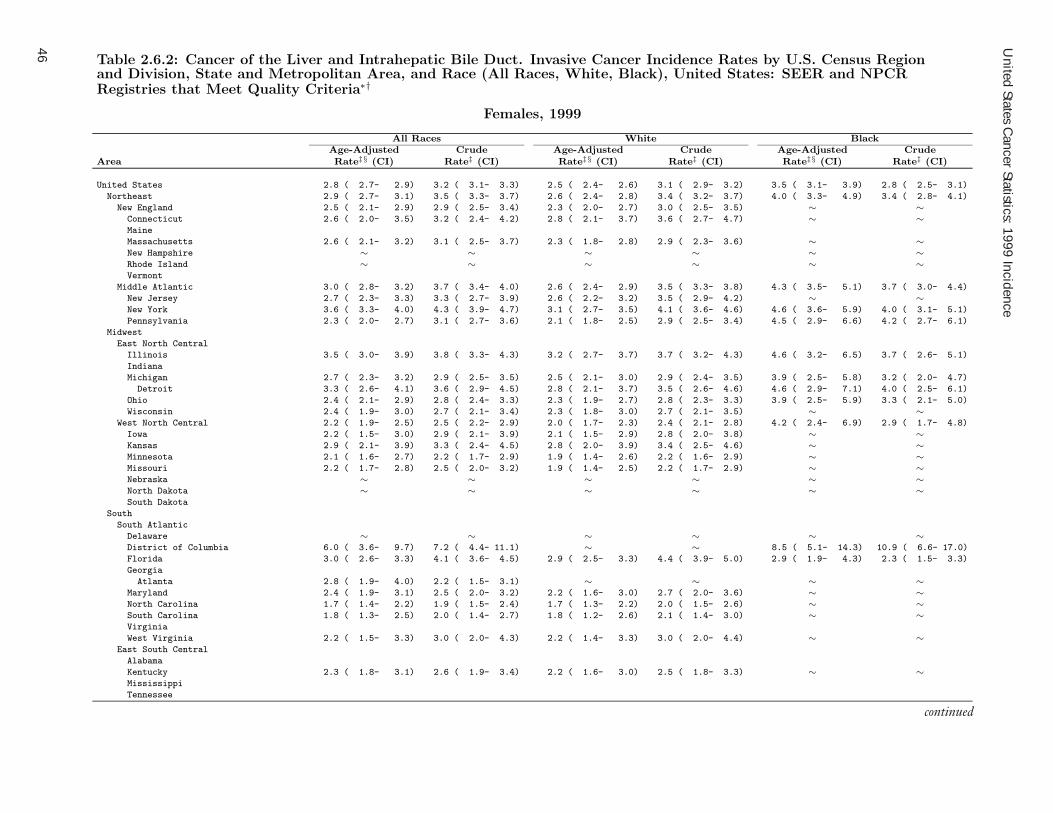
United States C
ancer Statistics: 1999 Incidence
46
Table 2.6.2: Cancer of the Liver and Intrahepatic Bile Duct. Invasive Cancer Incidence Rates by U.S. Census Regionand Division, State and Metropolitan Area, and Race (All Races, White, Black), United States: SEER and NPCRRegistries that Meet Quality Criteria∗†
Females, 1999
All Races White BlackAge-Adjusted Crude Age-Adjusted Crude Age-Adjusted Crude
Area Rate‡§ (CI) Rate‡ (CI) Rate‡§ (CI) Rate‡ (CI) Rate‡§ (CI) Rate‡ (CI)
United States 2.8 ( 2.7- 2.9) 3.2 ( 3.1- 3.3) 2.5 ( 2.4- 2.6) 3.1 ( 2.9- 3.2) 3.5 ( 3.1- 3.9) 2.8 ( 2.5- 3.1)
Northeast 2.9 ( 2.7- 3.1) 3.5 ( 3.3- 3.7) 2.6 ( 2.4- 2.8) 3.4 ( 3.2- 3.7) 4.0 ( 3.3- 4.9) 3.4 ( 2.8- 4.1)
New England 2.5 ( 2.1- 2.9) 2.9 ( 2.5- 3.4) 2.3 ( 2.0- 2.7) 3.0 ( 2.5- 3.5) ∼ ∼Connecticut 2.6 ( 2.0- 3.5) 3.2 ( 2.4- 4.2) 2.8 ( 2.1- 3.7) 3.6 ( 2.7- 4.7) ∼ ∼Maine
Massachusetts 2.6 ( 2.1- 3.2) 3.1 ( 2.5- 3.7) 2.3 ( 1.8- 2.8) 2.9 ( 2.3- 3.6) ∼ ∼New Hampshire ∼ ∼ ∼ ∼ ∼ ∼Rhode Island ∼ ∼ ∼ ∼ ∼ ∼Vermont
Middle Atlantic 3.0 ( 2.8- 3.2) 3.7 ( 3.4- 4.0) 2.6 ( 2.4- 2.9) 3.5 ( 3.3- 3.8) 4.3 ( 3.5- 5.1) 3.7 ( 3.0- 4.4)
New Jersey 2.7 ( 2.3- 3.3) 3.3 ( 2.7- 3.9) 2.6 ( 2.2- 3.2) 3.5 ( 2.9- 4.2) ∼ ∼New York 3.6 ( 3.3- 4.0) 4.3 ( 3.9- 4.7) 3.1 ( 2.7- 3.5) 4.1 ( 3.6- 4.6) 4.6 ( 3.6- 5.9) 4.0 ( 3.1- 5.1)
Pennsylvania 2.3 ( 2.0- 2.7) 3.1 ( 2.7- 3.6) 2.1 ( 1.8- 2.5) 2.9 ( 2.5- 3.4) 4.5 ( 2.9- 6.6) 4.2 ( 2.7- 6.1)
Midwest
East North Central
Illinois 3.5 ( 3.0- 3.9) 3.8 ( 3.3- 4.3) 3.2 ( 2.7- 3.7) 3.7 ( 3.2- 4.3) 4.6 ( 3.2- 6.5) 3.7 ( 2.6- 5.1)
Indiana
Michigan 2.7 ( 2.3- 3.2) 2.9 ( 2.5- 3.5) 2.5 ( 2.1- 3.0) 2.9 ( 2.4- 3.5) 3.9 ( 2.5- 5.8) 3.2 ( 2.0- 4.7)
Detroit 3.3 ( 2.6- 4.1) 3.6 ( 2.9- 4.5) 2.8 ( 2.1- 3.7) 3.5 ( 2.6- 4.6) 4.6 ( 2.9- 7.1) 4.0 ( 2.5- 6.1)
Ohio 2.4 ( 2.1- 2.9) 2.8 ( 2.4- 3.3) 2.3 ( 1.9- 2.7) 2.8 ( 2.3- 3.3) 3.9 ( 2.5- 5.9) 3.3 ( 2.1- 5.0)
Wisconsin 2.4 ( 1.9- 3.0) 2.7 ( 2.1- 3.4) 2.3 ( 1.8- 3.0) 2.7 ( 2.1- 3.5) ∼ ∼West North Central 2.2 ( 1.9- 2.5) 2.5 ( 2.2- 2.9) 2.0 ( 1.7- 2.3) 2.4 ( 2.1- 2.8) 4.2 ( 2.4- 6.9) 2.9 ( 1.7- 4.8)
Iowa 2.2 ( 1.5- 3.0) 2.9 ( 2.1- 3.9) 2.1 ( 1.5- 2.9) 2.8 ( 2.0- 3.8) ∼ ∼Kansas 2.9 ( 2.1- 3.9) 3.3 ( 2.4- 4.5) 2.8 ( 2.0- 3.9) 3.4 ( 2.5- 4.6) ∼ ∼Minnesota 2.1 ( 1.6- 2.7) 2.2 ( 1.7- 2.9) 1.9 ( 1.4- 2.6) 2.2 ( 1.6- 2.9) ∼ ∼Missouri 2.2 ( 1.7- 2.8) 2.5 ( 2.0- 3.2) 1.9 ( 1.4- 2.5) 2.2 ( 1.7- 2.9) ∼ ∼Nebraska ∼ ∼ ∼ ∼ ∼ ∼North Dakota ∼ ∼ ∼ ∼ ∼ ∼South Dakota
South
South Atlantic
Delaware ∼ ∼ ∼ ∼ ∼ ∼District of Columbia 6.0 ( 3.6- 9.7) 7.2 ( 4.4- 11.1) ∼ ∼ 8.5 ( 5.1- 14.3) 10.9 ( 6.6- 17.0)
Florida 3.0 ( 2.6- 3.3) 4.1 ( 3.6- 4.5) 2.9 ( 2.5- 3.3) 4.4 ( 3.9- 5.0) 2.9 ( 1.9- 4.3) 2.3 ( 1.5- 3.3)
Georgia
Atlanta 2.8 ( 1.9- 4.0) 2.2 ( 1.5- 3.1) ∼ ∼ ∼ ∼Maryland 2.4 ( 1.9- 3.1) 2.5 ( 2.0- 3.2) 2.2 ( 1.6- 3.0) 2.7 ( 2.0- 3.6) ∼ ∼North Carolina 1.7 ( 1.4- 2.2) 1.9 ( 1.5- 2.4) 1.7 ( 1.3- 2.2) 2.0 ( 1.5- 2.6) ∼ ∼South Carolina 1.8 ( 1.3- 2.5) 2.0 ( 1.4- 2.7) 1.8 ( 1.2- 2.6) 2.1 ( 1.4- 3.0) ∼ ∼Virginia
West Virginia 2.2 ( 1.5- 3.3) 3.0 ( 2.0- 4.3) 2.2 ( 1.4- 3.3) 3.0 ( 2.0- 4.4) ∼ ∼East South Central
Alabama
Kentucky 2.3 ( 1.8- 3.1) 2.6 ( 1.9- 3.4) 2.2 ( 1.6- 3.0) 2.5 ( 1.8- 3.3) ∼ ∼Mississippi
Tennessee
continued

Cancer Incidence, by U
.S. Census R
egion and Division, State, and M
etropolitan Area
47
Table 2.6.2: Cancer of the Liver and Intrahepatic Bile Duct. Invasive Cancer Incidence Rates by U.S. Census Regionand Division, State and Metropolitan Area, and Race (All Races, White, Black), United States: SEER and NPCRRegistries that Meet Quality Criteria∗† (continued)
Females, 1999
All Races White BlackAge-Adjusted Crude Age-Adjusted Crude Age-Adjusted Crude
Area Rate‡§ (CI) Rate‡ (CI) Rate‡§ (CI) Rate‡ (CI) Rate‡§ (CI) Rate‡ (CI)
West South Central
Arkansas
Louisiana 2.7 ( 2.1- 3.5) 2.8 ( 2.1- 3.6) 2.9 ( 2.1- 3.8) 3.4 ( 2.5- 4.5) ∼ ∼Oklahoma
Texas
West 3.2 ( 3.0- 3.5) 3.2 ( 3.0- 3.4) 2.7 ( 2.5- 2.9) 2.9 ( 2.7- 3.1) 3.3 ( 2.3- 4.5) 2.4 ( 1.7- 3.3)
Mountain
Arizona 2.2 ( 1.7- 2.9) 2.4 ( 1.8- 3.1) 2.1 ( 1.6- 2.8) 2.4 ( 1.8- 3.2) ∼ ∼Colorado 2.4 ( 1.8- 3.2) 2.3 ( 1.7- 3.1) 2.3 ( 1.7- 3.1) 2.3 ( 1.6- 3.1) ∼ ∼Idaho 2.6 ( 1.5- 4.2) 2.7 ( 1.6- 4.3) 2.6 ( 1.5- 4.3) 2.8 ( 1.6- 4.5) ∼ ∼Montana ∼ ∼ ∼ ∼ ∼ ∼Nevada
New Mexico 3.3 ( 2.2- 4.8) 3.3 ( 2.2- 4.7) 3.2 ( 2.1- 4.7) 3.4 ( 2.2- 5.0) ∼ ∼Utah 2.7 ( 1.7- 4.1) 2.1 ( 1.4- 3.2) 2.7 ( 1.7- 4.1) 2.2 ( 1.4- 3.3) ∼ ∼Wyoming ∼ ∼ ∼ ∼ ∼ ∼
Pacific 3.5 ( 3.3- 3.8) 3.5 ( 3.3- 3.8) 2.9 ( 2.7- 3.2) 3.0 ( 2.8- 3.3) 3.5 ( 2.5- 4.9) 2.6 ( 1.9- 3.6)
Alaska ∼ ∼ ∼ ∼ ∼ ∼California 3.6 ( 3.3- 3.9) 3.5 ( 3.3- 3.8) 3.0 ( 2.7- 3.3) 3.1 ( 2.8- 3.4) 3.4 ( 2.4- 4.9) 2.6 ( 1.8- 3.7)
San Francisco-Oakland 3.7 ( 2.9- 4.6) 4.0 ( 3.2- 5.0) 2.4 ( 1.7- 3.3) 2.8 ( 2.0- 3.9) ∼ ∼San Jose-Monterey 3.4 ( 2.3- 4.7) 3.1 ( 2.2- 4.3) 2.0 ( 1.2- 3.2) 2.0 ( 1.2- 3.2) ∼ ∼Los Angeles 4.5 ( 3.9- 5.1) 4.2 ( 3.6- 4.8) 4.1 ( 3.4- 4.8) 4.0 ( 3.3- 4.7) 3.6 ( 2.1- 5.7) 3.1 ( 1.8- 4.9)
Hawaii 4.3 ( 2.9- 6.3) 4.9 ( 3.3- 7.1) ∼ ∼ ∼ ∼Oregon 2.8 ( 2.1- 3.6) 3.1 ( 2.3- 4.1) 2.5 ( 1.8- 3.3) 2.9 ( 2.1- 3.8) ∼ ∼Washington 3.3 ( 2.7- 4.0) 3.4 ( 2.7- 4.1) 2.6 ( 2.0- 3.3) 2.9 ( 2.2- 3.6) ∼ ∼
Seattle-Puget Sound 3.7 ( 2.9- 4.7) 3.8 ( 3.0- 4.7) 3.0 ( 2.2- 3.9) 3.2 ( 2.4- 4.2) ∼ ∼∗ Data are from selected statewide and metropolitan area cancer registries that meet the following data quality criteria for all invasive cancer sites combined: case
ascertainment is at least 90% complete; ≥ 97% of cases pass a standard set of computerized edits; ≤ 5% of cases were ascertained by death certificate only; ≤ 3% of
cases are missing information on sex; ≤ 5% of cases are missing information on race; ≤ 3% of cases are missing information on age. See Appendix H for registry-specific
data quality information. U.S. rates cover approximately 78% of the U.S. population.
† Invasive cancers only
‡ Rates are per 100,000 persons. Population denominators for 1999 are projected from the 1990 census and may not accurately reflect the 1999 population size. Caution
should be used in interpreting rates based on these projected populations.
§ Rates are age-adjusted to the 2000 U.S. standard population.
∼ Rates are suppressed if fewer than 16 cases were reported in the specific area-race category.
Notes: Cases from suppressed rates are included in the U.S. and region/division rates. Observed region/division age-adjusted incidence rates are presented for
regions/divisions with ≥ 78% of the population covered by registries that meet the data quality criteria specified above, and if the 95% confidence intervals
around the observed region/division rates for each of four major cancers include "bias-corrected" estimated region/division rates (see technical notes) for
each of those cancers. U.S rates are as presented in Table 1.2. California, Washington, and Michigan state rates each include cases from the SEER metropolitan
areas.

United States C
ancer Statistics: 1999 Incidence
48
Table 2.7.1: Cancer of the Pancreas. Invasive Cancer Incidence Rates by U.S. Census Region and Division, State andMetropolitan Area, and Race (All Races, White, Black), United States: SEER and NPCR Registries that Meet QualityCriteria∗†
Males, 1999
All Races White BlackAge-Adjusted Crude Age-Adjusted Crude Age-Adjusted Crude
Area Rate‡§ (CI) Rate‡ (CI) Rate‡§ (CI) Rate‡ (CI) Rate‡§ (CI) Rate‡ (CI)
United States 12.3 ( 12.0- 12.5) 10.9 ( 10.7- 11.1) 12.1 ( 11.8- 12.3) 11.4 ( 11.2- 11.7) 15.2 ( 14.3- 16.2) 9.4 ( 8.8- 9.9)
Northeast 13.5 ( 13.0- 14.0) 12.7 ( 12.2- 13.1) 13.3 ( 12.8- 13.8) 13.3 ( 12.8- 13.8) 15.7 ( 13.9- 17.7) 10.1 ( 9.0- 11.3)
New England 13.2 ( 12.2- 14.3) 12.1 ( 11.2- 13.1) 13.1 ( 12.1- 14.2) 12.7 ( 11.7- 13.7) 14.0 ( 9.1- 21.6) 7.8 ( 5.2- 11.2)
Connecticut 13.3 ( 11.6- 15.4) 12.6 ( 10.9- 14.5) 13.1 ( 11.3- 15.2) 13.2 ( 11.4- 15.2) 19.4 ( 10.6- 34.3) 10.9 ( 6.3- 17.8)
Maine
Massachusetts 13.3 ( 12.0- 14.8) 12.2 ( 11.0- 13.5) 13.2 ( 11.9- 14.7) 12.8 ( 11.5- 14.3) ∼ ∼New Hampshire 12.9 ( 9.9- 16.7) 10.8 ( 8.3- 13.8) 12.9 ( 9.9- 16.7) 10.9 ( 8.4- 14.0) ∼ ∼Rhode Island 12.4 ( 9.3- 16.2) 11.7 ( 8.9- 15.3) 12.6 ( 9.5- 16.6) 12.6 ( 9.5- 16.4) ∼ ∼Vermont
Middle Atlantic 13.6 ( 13.0- 14.1) 12.8 ( 12.3- 13.3) 13.3 ( 12.7- 13.9) 13.6 ( 13.0- 14.2) 15.9 ( 14.0- 18.0) 10.4 ( 9.2- 11.7)
New Jersey 13.8 ( 12.6- 15.1) 12.6 ( 11.5- 13.7) 13.2 ( 11.9- 14.5) 13.1 ( 11.9- 14.4) 19.1 ( 14.6- 25.0) 11.6 ( 9.0- 14.8)
New York 13.7 ( 12.9- 14.6) 12.4 ( 11.7- 13.1) 13.9 ( 13.0- 14.9) 13.7 ( 12.9- 14.7) 13.4 ( 11.1- 16.2) 8.4 ( 7.0- 10.0)
Pennsylvania 13.3 ( 12.3- 14.2) 13.7 ( 12.7- 14.7) 12.6 ( 11.7- 13.6) 13.6 ( 12.6- 14.6) 19.7 ( 15.6- 24.9) 14.4 ( 11.4- 18.0)
Midwest
East North Central
Illinois 13.2 ( 12.2- 14.3) 11.2 ( 10.4- 12.1) 12.7 ( 11.6- 13.8) 11.5 ( 10.6- 12.5) 16.6 ( 13.2- 20.8) 10.1 ( 8.1- 12.4)
Indiana
Michigan 12.1 ( 11.1- 13.2) 10.6 ( 9.7- 11.6) 11.4 ( 10.4- 12.6) 10.5 ( 9.5- 11.6) 18.4 ( 14.6- 23.0) 12.7 ( 10.1- 15.7)
Detroit 12.2 ( 10.6- 14.0) 10.8 ( 9.4- 12.4) 10.9 ( 9.2- 12.9) 10.3 ( 8.7- 12.1) 18.2 ( 13.9- 23.6) 13.5 ( 10.4- 17.3)
Ohio 11.4 ( 10.4- 12.4) 10.4 ( 9.6- 11.3) 11.4 ( 10.4- 12.4) 10.8 ( 9.9- 11.8) 11.5 ( 8.4- 15.6) 7.8 ( 5.8- 10.4)
Wisconsin 11.9 ( 10.6- 13.4) 10.8 ( 9.6- 12.2) 11.7 ( 10.4- 13.3) 11.2 ( 9.9- 12.6) ∼ ∼West North Central 11.6 ( 10.8- 12.3) 10.6 ( 9.9- 11.3) 11.3 ( 10.5- 12.1) 10.8 ( 10.1- 11.5) 19.5 ( 14.6- 26.0) 10.8 ( 8.2- 14.1)
Iowa 10.7 ( 9.0- 12.6) 10.6 ( 8.9- 12.4) 10.4 ( 8.8- 12.3) 10.5 ( 8.9- 12.4) ∼ ∼Kansas 13.4 ( 11.4- 15.7) 11.9 ( 10.1- 13.9) 12.9 ( 10.8- 15.2) 11.8 ( 9.9- 13.9) ∼ ∼Minnesota 10.4 ( 9.0- 11.9) 9.0 ( 7.9- 10.3) 10.2 ( 8.8- 11.7) 9.3 ( 8.0- 10.7) ∼ ∼Missouri 12.7 ( 11.3- 14.2) 11.8 ( 10.5- 13.2) 12.5 ( 11.1- 14.1) 12.1 ( 10.8- 13.7) 14.6 ( 9.6- 21.9) 9.4 ( 6.2- 13.6)
Nebraska 11.6 ( 9.3- 14.3) 10.8 ( 8.7- 13.3) 11.1 ( 8.8- 13.8) 10.7 ( 8.5- 13.3) ∼ ∼North Dakota 7.2 ( 4.5- 10.9) 7.0 ( 4.4- 10.6) 7.3 ( 4.6- 11.2) 7.5 ( 4.7- 11.3) ∼ ∼South Dakota
South
South Atlantic
Delaware 12.6 ( 9.0- 17.5) 11.2 ( 8.0- 15.2) 12.4 ( 8.6- 17.8) 12.2 ( 8.5- 17.0) ∼ ∼District of Columbia 17.2 ( 12.2- 23.6) 16.4 ( 11.7- 22.3) ∼ ∼ 19.3 ( 12.8- 28.3) 19.1 ( 12.7- 27.7)
Florida 13.1 ( 12.3- 13.9) 15.3 ( 14.4- 16.2) 12.9 ( 12.1- 13.7) 16.7 ( 15.7- 17.7) 16.4 ( 13.2- 20.5) 9.0 ( 7.4- 11.0)
Georgia
Atlanta 12.8 ( 10.2- 16.0) 7.6 ( 6.2- 9.3) 10.8 ( 8.2- 14.3) 7.5 ( 5.8- 9.6) 22.0 ( 14.2- 33.3) 8.6 ( 5.9- 12.0)
Maryland 11.3 ( 9.9- 12.9) 9.5 ( 8.3- 10.7) 10.9 ( 9.3- 12.7) 10.2 ( 8.8- 11.9) 12.8 ( 9.5- 17.3) 8.2 ( 6.2- 10.6)
North Carolina 12.2 ( 11.0- 13.5) 10.4 ( 9.4- 11.5) 12.2 ( 10.8- 13.7) 11.3 ( 10.1- 12.6) 12.5 ( 9.6- 16.3) 8.1 ( 6.2- 10.4)
South Carolina 12.5 ( 10.8- 14.6) 10.3 ( 8.9- 11.9) 12.7 ( 10.6- 15.0) 11.6 ( 9.8- 13.6) 12.4 ( 8.9- 17.2) 7.8 ( 5.6- 10.5)
Virginia
West Virginia 10.6 ( 8.6- 13.1) 11.0 ( 8.9- 13.5) 10.4 ( 8.4- 12.9) 10.8 ( 8.7- 13.3) ∼ ∼East South Central
Alabama
Kentucky 12.0 ( 10.3- 13.8) 10.3 ( 8.9- 11.8) 11.7 ( 10.0- 13.7) 10.3 ( 8.8- 11.9) ∼ ∼Mississippi
Tennessee
continued

Cancer Incidence, by U
.S. Census R
egion and Division, State, and M
etropolitan Area
49
Table 2.7.1: Cancer of the Pancreas. Invasive Cancer Incidence Rates by U.S. Census Region and Division, State andMetropolitan Area, and Race (All Races, White, Black), United States: SEER and NPCR Registries that Meet QualityCriteria∗† (continued)
Males, 1999
All Races White BlackAge-Adjusted Crude Age-Adjusted Crude Age-Adjusted Crude
Area Rate‡§ (CI) Rate‡ (CI) Rate‡§ (CI) Rate‡ (CI) Rate‡§ (CI) Rate‡ (CI)
West South Central
Arkansas
Louisiana 13.1 ( 11.3- 15.0) 10.4 ( 9.1- 11.9) 11.6 ( 9.7- 13.7) 10.4 ( 8.8- 12.3) 18.9 ( 14.7- 24.1) 10.9 ( 8.5- 13.8)
Oklahoma
Texas
West 11.2 ( 10.8- 11.6) 9.0 ( 8.6- 9.3) 11.3 ( 10.8- 11.8) 9.4 ( 9.1- 9.8) 11.7 ( 9.6- 14.3) 7.2 ( 5.9- 8.6)
Mountain
Arizona 9.8 ( 8.5- 11.2) 8.9 ( 7.8- 10.2) 10.0 ( 8.6- 11.5) 9.7 ( 8.4- 11.1) ∼ ∼Colorado 11.3 ( 9.6- 13.2) 8.3 ( 7.1- 9.7) 11.2 ( 9.4- 13.2) 8.4 ( 7.1- 9.8) ∼ ∼Idaho 9.4 ( 7.0- 12.5) 8.2 ( 6.1- 10.7) 9.6 ( 7.1- 12.7) 8.4 ( 6.3- 11.1) ∼ ∼Montana 12.8 ( 9.6- 16.9) 12.1 ( 9.0- 15.8) 12.9 ( 9.6- 17.1) 12.8 ( 9.5- 16.7) ∼ ∼Nevada
New Mexico 13.5 ( 11.0- 16.5) 11.8 ( 9.6- 14.3) 13.0 ( 10.4- 16.1) 12.2 ( 9.8- 15.0) ∼ ∼Utah 11.2 ( 8.8- 14.1) 7.2 ( 5.6- 9.0) 11.4 ( 8.9- 14.4) 7.4 ( 5.8- 9.3) ∼ ∼Wyoming 16.4 ( 11.3- 23.5) 14.5 ( 10.1- 20.2) 16.0 ( 10.9- 23.0) 14.2 ( 9.8- 20.0) ∼ ∼
Pacific 11.2 ( 10.7- 11.7) 8.9 ( 8.5- 9.3) 11.4 ( 10.8- 11.9) 9.4 ( 9.0- 9.9) 12.2 ( 9.9- 15.0) 7.5 ( 6.1- 9.0)
Alaska 10.6 ( 5.6- 19.9) 5.8 ( 3.5- 9.1) ∼ ∼ ∼ ∼California 11.0 ( 10.4- 11.6) 8.4 ( 8.0- 8.9) 11.1 ( 10.5- 11.8) 9.0 ( 8.5- 9.5) 12.3 ( 9.9- 15.3) 7.8 ( 6.4- 9.6)
San Francisco-Oakland 10.7 ( 9.2- 12.4) 9.4 ( 8.1- 10.8) 10.1 ( 8.4- 12.1) 9.6 ( 8.0- 11.4) 14.8 ( 9.6- 22.5) 11.0 ( 7.2- 16.2)
San Jose-Monterey 12.6 ( 10.2- 15.3) 8.9 ( 7.3- 10.8) 11.7 ( 9.3- 14.6) 8.9 ( 7.1- 11.1) ∼ ∼Los Angeles 10.8 ( 9.7- 12.1) 7.7 ( 7.0- 8.6) 11.5 ( 10.2- 12.9) 8.3 ( 7.4- 9.3) 11.0 ( 7.8- 15.4) 8.3 ( 6.0- 11.3)
Hawaii 10.8 ( 8.3- 13.9) 10.3 ( 7.9- 13.3) 13.5 ( 7.9- 21.9) 10.0 ( 5.8- 16.1) ∼ ∼Oregon 12.3 ( 10.7- 14.3) 11.7 ( 10.1- 13.4) 12.1 ( 10.4- 14.1) 11.8 ( 10.2- 13.7) ∼ ∼Washington 12.2 ( 10.8- 13.7) 10.2 ( 9.1- 11.4) 12.2 ( 10.8- 13.8) 10.7 ( 9.5- 12.1) ∼ ∼
Seattle-Puget Sound 13.0 ( 11.2- 14.9) 10.6 ( 9.2- 12.1) 13.1 ( 11.3- 15.1) 11.4 ( 9.8- 13.1) ∼ ∼∗ Data are from selected statewide and metropolitan area cancer registries that meet the following data quality criteria for all invasive cancer sites combined: case
ascertainment is at least 90% complete; ≥ 97% of cases pass a standard set of computerized edits; ≤ 5% of cases were ascertained by death certificate only; ≤ 3% of
cases are missing information on sex; ≤ 5% of cases are missing information on race; ≤ 3% of cases are missing information on age. See Appendix H for registry-specific
data quality information. U.S. rates cover approximately 78% of the U.S. population.
† Invasive cancers only
‡ Rates are per 100,000 persons. Population denominators for 1999 are projected from the 1990 census and may not accurately reflect the 1999 population size. Caution
should be used in interpreting rates based on these projected populations.
§ Rates are age-adjusted to the 2000 U.S. standard population.
∼ Rates are suppressed if fewer than 16 cases were reported in the specific area-race category.
Notes: Cases from suppressed rates are included in the U.S. and region/division rates. Observed region/division age-adjusted incidence rates are presented for
regions/divisions with ≥ 78% of the population covered by registries that meet the data quality criteria specified above, and if the 95% confidence intervals
around the observed region/division rates for each of four major cancers include "bias-corrected" estimated region/division rates (see technical notes) for
each of those cancers. U.S rates are as presented in Table 1.1. California, Washington, and Michigan state rates each include cases from the SEER metropolitan
areas.

United States C
ancer Statistics: 1999 Incidence
50
Table 2.7.2: Cancer of the Pancreas. Invasive Cancer Incidence Rates by U.S. Census Region and Division, State andMetropolitan Area, and Race (All Races, White, Black), United States: SEER and NPCR Registries that Meet QualityCriteria∗†
Females, 1999
All Races White BlackAge-Adjusted Crude Age-Adjusted Crude Age-Adjusted Crude
Area Rate‡§ (CI) Rate‡ (CI) Rate‡§ (CI) Rate‡ (CI) Rate‡§ (CI) Rate‡ (CI)
United States 9.6 ( 9.4- 9.7) 11.0 ( 10.8- 11.2) 9.2 ( 9.0- 9.4) 11.4 ( 11.2- 11.6) 13.1 ( 12.4- 13.8) 10.1 ( 9.5- 10.6)
Northeast 10.4 ( 10.1- 10.8) 13.0 ( 12.6- 13.5) 10.2 ( 9.8- 10.6) 13.7 ( 13.2- 14.2) 12.9 ( 11.6- 14.3) 10.5 ( 9.4- 11.7)
New England 9.9 ( 9.1- 10.6) 12.1 ( 11.2- 13.0) 9.9 ( 9.1- 10.7) 12.8 ( 11.9- 13.8) 10.1 ( 6.4- 15.1) 6.3 ( 4.1- 9.2)
Connecticut 10.1 ( 8.8- 11.6) 12.8 ( 11.2- 14.7) 10.2 ( 8.8- 11.8) 13.9 ( 12.0- 15.9) ∼ ∼Maine
Massachusetts 9.8 ( 8.9- 10.9) 12.1 ( 10.9- 13.3) 9.9 ( 8.9- 11.0) 12.9 ( 11.6- 14.3) ∼ ∼New Hampshire 9.4 ( 7.2- 12.2) 9.9 ( 7.5- 12.7) 9.4 ( 7.1- 12.2) 9.9 ( 7.5- 12.8) ∼ ∼Rhode Island 9.1 ( 7.0- 11.9) 12.4 ( 9.6- 15.9) 9.2 ( 6.9- 12.1) 13.1 ( 10.0- 16.8) ∼ ∼Vermont
Middle Atlantic 10.6 ( 10.2- 11.0) 13.3 ( 12.8- 13.8) 10.3 ( 9.9- 10.7) 14.0 ( 13.4- 14.6) 13.2 ( 11.8- 14.7) 11.1 ( 9.9- 12.3)
New Jersey 11.0 ( 10.1- 12.0) 13.4 ( 12.3- 14.5) 10.9 ( 10.0- 12.0) 14.6 ( 13.3- 15.9) 14.5 ( 11.1- 18.6) 10.3 ( 8.0- 13.2)
New York 11.3 ( 10.7- 12.0) 13.6 ( 12.8- 14.3) 11.0 ( 10.3- 11.7) 14.6 ( 13.7- 15.5) 13.0 ( 11.2- 15.0) 11.0 ( 9.5- 12.7)
Pennsylvania 9.5 ( 8.8- 10.2) 12.8 ( 11.9- 13.7) 9.1 ( 8.4- 9.8) 12.9 ( 12.0- 13.9) 13.0 ( 10.2- 16.3) 12.1 ( 9.5- 15.2)
Midwest
East North Central
Illinois 10.1 ( 9.4- 10.9) 11.4 ( 10.5- 12.2) 9.6 ( 8.8- 10.4) 11.7 ( 10.8- 12.7) 13.5 ( 11.0- 16.4) 10.3 ( 8.4- 12.5)
Indiana
Michigan 10.8 ( 9.9- 11.7) 11.9 ( 10.9- 12.9) 9.9 ( 9.1- 10.9) 11.7 ( 10.6- 12.7) 17.4 ( 14.3- 21.2) 14.0 ( 11.4- 16.9)
Detroit 11.7 ( 10.3- 13.1) 13.0 ( 11.6- 14.7) 10.3 ( 8.9- 11.9) 12.8 ( 11.1- 14.7) 17.6 ( 14.0- 21.8) 15.0 ( 11.9- 18.6)
Ohio 8.8 ( 8.1- 9.5) 10.4 ( 9.6- 11.3) 8.4 ( 7.7- 9.2) 10.4 ( 9.6- 11.4) 12.9 ( 10.1- 16.2) 10.9 ( 8.6- 13.7)
Wisconsin 10.0 ( 8.9- 11.2) 11.8 ( 10.5- 13.1) 9.4 ( 8.4- 10.6) 11.8 ( 10.4- 13.2) 28.6 ( 17.1- 45.7) 13.7 ( 8.5- 21.0)
West North Central 8.5 ( 8.0- 9.1) 10.1 ( 9.5- 10.8) 8.2 ( 7.6- 8.7) 10.2 ( 9.5- 10.9) 16.0 ( 12.3- 20.5) 11.6 ( 8.9- 14.8)
Iowa 7.7 ( 6.5- 9.1) 10.3 ( 8.7- 12.0) 7.4 ( 6.2- 8.8) 10.2 ( 8.6- 12.0) ∼ ∼Kansas 8.8 ( 7.4- 10.4) 10.5 ( 8.9- 12.4) 8.7 ( 7.2- 10.3) 10.8 ( 9.0- 12.8) ∼ ∼Minnesota 6.9 ( 5.9- 8.0) 7.5 ( 6.4- 8.6) 6.7 ( 5.7- 7.8) 7.6 ( 6.5- 8.9) ∼ ∼Missouri 10.2 ( 9.2- 11.4) 12.3 ( 11.1- 13.7) 9.6 ( 8.5- 10.8) 12.2 ( 10.8- 13.6) 17.2 ( 12.6- 23.1) 14.0 ( 10.2- 18.7)
Nebraska 8.1 ( 6.4- 10.1) 9.8 ( 7.8- 12.1) 7.9 ( 6.2- 10.0) 9.9 ( 7.9- 12.4) ∼ ∼North Dakota 8.1 ( 5.4- 11.7) 10.1 ( 6.9- 14.2) 8.3 ( 5.6- 12.0) 10.7 ( 7.3- 15.2) ∼ ∼South Dakota
South
South Atlantic
Delaware 12.1 ( 9.0- 16.0) 13.2 ( 9.8- 17.3) 12.4 ( 9.0- 16.8) 15.1 ( 11.0- 20.1) ∼ ∼District of Columbia 10.7 ( 7.5- 15.2) 13.4 ( 9.4- 18.4) ∼ ∼ 12.2 ( 8.1- 18.6) 16.1 ( 10.7- 23.2)
Florida 10.2 ( 9.6- 10.8) 14.5 ( 13.7- 15.4) 10.0 ( 9.4- 10.7) 15.9 ( 14.9- 16.9) 12.5 ( 10.1- 15.3) 8.5 ( 6.9- 10.3)
Georgia
Atlanta 9.1 ( 7.3- 11.2) 6.7 ( 5.4- 8.3) 7.0 ( 5.3- 9.1) 6.3 ( 4.7- 8.2) 17.6 ( 12.2- 24.8) 8.0 ( 5.6- 11.0)
Maryland 9.1 ( 8.0- 10.3) 9.4 ( 8.3- 10.6) 8.6 ( 7.4- 9.9) 10.4 ( 8.9- 12.0) 11.7 ( 8.9- 15.1) 7.9 ( 6.1- 10.2)
North Carolina 9.2 ( 8.3- 10.1) 10.4 ( 9.4- 11.4) 8.5 ( 7.6- 9.5) 10.5 ( 9.4- 11.8) 12.6 ( 10.2- 15.4) 10.6 ( 8.6- 13.0)
South Carolina 9.4 ( 8.1- 10.8) 10.1 ( 8.8- 11.6) 8.2 ( 6.8- 9.7) 9.8 ( 8.2- 11.6) 13.7 ( 10.7- 17.4) 11.2 ( 8.7- 14.1)
Virginia
West Virginia 6.5 ( 5.1- 8.2) 8.5 ( 6.8- 10.6) 6.6 ( 5.2- 8.3) 8.7 ( 6.9- 10.8) ∼ ∼East South Central
Alabama
Kentucky 9.3 ( 8.1- 10.7) 10.6 ( 9.2- 12.1) 9.0 ( 7.8- 10.4) 10.5 ( 9.1- 12.1) 13.3 ( 7.7- 21.5) 11.3 ( 6.6- 18.0)
Mississippi
Tennessee
continued

Cancer Incidence, by U
.S. Census R
egion and Division, State, and M
etropolitan Area
51
Table 2.7.2: Cancer of the Pancreas. Invasive Cancer Incidence Rates by U.S. Census Region and Division, State andMetropolitan Area, and Race (All Races, White, Black), United States: SEER and NPCR Registries that Meet QualityCriteria∗† (continued)
Females, 1999
All Races White BlackAge-Adjusted Crude Age-Adjusted Crude Age-Adjusted Crude
Area Rate‡§ (CI) Rate‡ (CI) Rate‡§ (CI) Rate‡ (CI) Rate‡§ (CI) Rate‡ (CI)
West South Central
Arkansas
Louisiana 10.0 ( 8.8- 11.4) 10.4 ( 9.1- 11.8) 9.2 ( 7.9- 10.8) 11.0 ( 9.4- 12.9) 12.5 ( 9.8- 15.7) 9.7 ( 7.6- 12.2)
Oklahoma
Texas
West 8.8 ( 8.5- 9.2) 8.9 ( 8.5- 9.2) 8.8 ( 8.4- 9.1) 9.3 ( 8.9- 9.7) 10.7 ( 8.9- 12.8) 7.7 ( 6.4- 9.1)
Mountain
Arizona 8.3 ( 7.3- 9.5) 9.2 ( 8.0- 10.5) 8.3 ( 7.2- 9.5) 9.7 ( 8.4- 11.1) ∼ ∼Colorado 8.3 ( 7.1- 9.7) 7.9 ( 6.7- 9.2) 8.3 ( 7.0- 9.7) 8.1 ( 6.9- 9.5) ∼ ∼Idaho 12.7 ( 10.1- 15.8) 13.1 ( 10.4- 16.2) 12.9 ( 10.2- 16.1) 13.5 ( 10.7- 16.8) ∼ ∼Montana 7.4 ( 5.3- 10.3) 9.0 ( 6.4- 12.3) 7.4 ( 5.3- 10.4) 9.5 ( 6.8- 13.0) ∼ ∼Nevada
New Mexico 8.5 ( 6.7- 10.7) 8.5 ( 6.7- 10.6) 8.9 ( 7.0- 11.2) 9.5 ( 7.4- 11.9) ∼ ∼Utah 6.4 ( 4.8- 8.4) 5.0 ( 3.8- 6.6) 6.4 ( 4.8- 8.4) 5.1 ( 3.8- 6.7) ∼ ∼Wyoming 6.3 ( 3.6- 10.6) 6.7 ( 3.8- 10.9) ∼ ∼ ∼ ∼
Pacific 9.0 ( 8.6- 9.4) 9.1 ( 8.7- 9.5) 8.9 ( 8.5- 9.3) 9.5 ( 9.0- 9.9) 10.6 ( 8.7- 12.8) 7.8 ( 6.4- 9.4)
Alaska 13.0 ( 7.8- 21.0) 7.1 ( 4.4- 10.9) 13.2 ( 7.5- 22.5) 7.8 ( 4.5- 12.5) ∼ ∼California 8.6 ( 8.2- 9.1) 8.5 ( 8.1- 9.0) 8.6 ( 8.2- 9.2) 9.1 ( 8.6- 9.6) 10.5 ( 8.5- 12.8) 8.0 ( 6.5- 9.7)
San Francisco-Oakland 8.3 ( 7.1- 9.5) 9.3 ( 8.0- 10.7) 8.3 ( 7.0- 9.9) 10.6 ( 9.0- 12.5) 8.5 ( 5.0- 13.6) 7.2 ( 4.3- 11.4)
San Jose-Monterey 8.6 ( 6.9- 10.5) 8.1 ( 6.5- 9.9) 8.5 ( 6.7- 10.7) 8.6 ( 6.7- 10.7) ∼ ∼Los Angeles 8.1 ( 7.3- 9.0) 7.7 ( 7.0- 8.6) 8.3 ( 7.4- 9.4) 8.2 ( 7.3- 9.2) 8.4 ( 6.0- 11.5) 7.3 ( 5.2- 9.9)
Hawaii 11.6 ( 9.1- 14.6) 13.0 ( 10.3- 16.3) ∼ ∼ ∼ ∼Oregon 10.4 ( 9.0- 12.0) 12.2 ( 10.6- 14.0) 10.3 ( 8.9- 11.9) 12.6 ( 10.9- 14.5) ∼ ∼Washington 9.2 ( 8.2- 10.4) 9.5 ( 8.4- 10.7) 9.1 ( 8.0- 10.3) 9.9 ( 8.7- 11.1) ∼ ∼
Seattle-Puget Sound 10.7 ( 9.3- 12.2) 10.9 ( 9.5- 12.4) 10.6 ( 9.2- 12.2) 11.5 ( 10.0- 13.3) ∼ ∼∗ Data are from selected statewide and metropolitan area cancer registries that meet the following data quality criteria for all invasive cancer sites combined: case
ascertainment is at least 90% complete; ≥ 97% of cases pass a standard set of computerized edits; ≤ 5% of cases were ascertained by death certificate only; ≤ 3% of
cases are missing information on sex; ≤ 5% of cases are missing information on race; ≤ 3% of cases are missing information on age. See Appendix H for registry-specific
data quality information. U.S. rates cover approximately 78% of the U.S. population.
† Invasive cancers only
‡ Rates are per 100,000 persons. Population denominators for 1999 are projected from the 1990 census and may not accurately reflect the 1999 population size. Caution
should be used in interpreting rates based on these projected populations.
§ Rates are age-adjusted to the 2000 U.S. standard population.
∼ Rates are suppressed if fewer than 16 cases were reported in the specific area-race category.
Notes: Cases from suppressed rates are included in the U.S. and region/division rates. Observed region/division age-adjusted incidence rates are presented for
regions/divisions with ≥ 78% of the population covered by registries that meet the data quality criteria specified above, and if the 95% confidence intervals
around the observed region/division rates for each of four major cancers include "bias-corrected" estimated region/division rates (see technical notes) for
each of those cancers. U.S rates are as presented in Table 1.2. California, Washington, and Michigan state rates each include cases from the SEER metropolitan
areas.

United States C
ancer Statistics: 1999 Incidence
52
Table 2.8.1: Cancer of the Larynx. Invasive Cancer Incidence Rates by U.S. Census Region and Division, State andMetropolitan Area, and Race (All Races, White, Black), United States: SEER and NPCR Registries that Meet QualityCriteria∗†
Males, 1999
All Races White BlackAge-Adjusted Crude Age-Adjusted Crude Age-Adjusted Crude
Area Rate‡§ (CI) Rate‡ (CI) Rate‡§ (CI) Rate‡ (CI) Rate‡§ (CI) Rate‡ (CI)
United States 7.9 ( 7.7- 8.1) 7.3 ( 7.1- 7.4) 7.6 ( 7.4- 7.8) 7.4 ( 7.2- 7.6) 12.1 ( 11.3- 12.9) 7.9 ( 7.4- 8.4)
Northeast 8.3 ( 7.9- 8.6) 8.0 ( 7.6- 8.4) 8.0 ( 7.6- 8.4) 8.3 ( 7.9- 8.7) 10.8 ( 9.3- 12.4) 7.3 ( 6.4- 8.4)
New England 8.6 ( 7.8- 9.4) 8.2 ( 7.4- 9.0) 8.4 ( 7.7- 9.3) 8.4 ( 7.6- 9.2) 13.5 ( 8.7- 20.9) 7.2 ( 4.8- 10.5)
Connecticut 8.3 ( 6.9- 9.9) 8.2 ( 6.8- 9.7) 8.1 ( 6.7- 9.8) 8.4 ( 7.0- 10.1) ∼ ∼Maine
Massachusetts 8.5 ( 7.5- 9.7) 8.1 ( 7.1- 9.1) 8.3 ( 7.2- 9.5) 8.3 ( 7.2- 9.4) 16.2 ( 9.1- 29.2) 8.1 ( 4.6- 13.2)
New Hampshire 8.5 ( 6.2- 11.6) 7.4 ( 5.4- 10.0) 8.6 ( 6.3- 11.8) 7.6 ( 5.5- 10.2) ∼ ∼Rhode Island 10.3 ( 7.5- 13.8) 9.9 ( 7.2- 13.1) 10.0 ( 7.3- 13.6) 10.1 ( 7.3- 13.5) ∼ ∼Vermont
Middle Atlantic 8.1 ( 7.7- 8.6) 7.9 ( 7.5- 8.4) 7.9 ( 7.4- 8.3) 8.2 ( 7.8- 8.7) 10.5 ( 9.0- 12.2) 7.3 ( 6.3- 8.4)
New Jersey 7.5 ( 6.7- 8.5) 7.1 ( 6.3- 8.0) 7.1 ( 6.2- 8.2) 7.3 ( 6.4- 8.3) 12.0 ( 8.7- 16.5) 8.4 ( 6.2- 11.2)
New York 8.0 ( 7.4- 8.7) 7.6 ( 7.0- 8.2) 8.0 ( 7.3- 8.7) 8.1 ( 7.5- 8.8) 8.6 ( 6.9- 10.8) 6.0 ( 4.8- 7.4)
Pennsylvania 8.7 ( 7.9- 9.4) 9.0 ( 8.2- 9.8) 8.2 ( 7.4- 9.0) 8.9 ( 8.1- 9.7) 13.5 ( 10.1- 17.9) 9.8 ( 7.4- 12.9)
Midwest
East North Central
Illinois 9.1 ( 8.3- 9.9) 8.0 ( 7.3- 8.8) 8.3 ( 7.4- 9.2) 7.7 ( 6.9- 8.5) 14.7 ( 11.8- 18.4) 10.2 ( 8.2- 12.5)
Indiana
Michigan 8.0 ( 7.2- 8.9) 7.2 ( 6.5- 8.0) 7.4 ( 6.6- 8.3) 7.0 ( 6.2- 7.9) 13.8 ( 10.5- 17.9) 9.4 ( 7.2- 12.0)
Detroit 7.3 ( 6.1- 8.7) 6.7 ( 5.6- 8.0) 6.0 ( 4.8- 7.4) 5.9 ( 4.8- 7.3) 13.4 ( 9.8- 18.0) 10.0 ( 7.4- 13.4)
Ohio 8.3 ( 7.5- 9.2) 7.8 ( 7.1- 8.6) 8.1 ( 7.3- 9.0) 7.9 ( 7.1- 8.7) 9.3 ( 6.7- 12.9) 6.8 ( 4.9- 9.3)
Wisconsin 6.7 ( 5.7- 7.9) 6.3 ( 5.3- 7.3) 6.4 ( 5.4- 7.5) 6.2 ( 5.3- 7.3) ∼ ∼West North Central 7.6 ( 7.0- 8.2) 7.1 ( 6.6- 7.7) 7.4 ( 6.8- 8.0) 7.2 ( 6.6- 7.8) 13.2 ( 9.3- 18.4) 7.9 ( 5.6- 10.7)
Iowa 8.0 ( 6.6- 9.7) 8.1 ( 6.7- 9.7) 8.0 ( 6.5- 9.6) 8.2 ( 6.7- 9.8) ∼ ∼Kansas 7.2 ( 5.7- 8.9) 6.6 ( 5.3- 8.1) 6.8 ( 5.3- 8.5) 6.5 ( 5.1- 8.1) ∼ ∼Minnesota 6.7 ( 5.7- 8.0) 5.9 ( 5.0- 7.0) 6.7 ( 5.7- 8.0) 6.2 ( 5.2- 7.3) ∼ ∼Missouri 8.9 ( 7.8- 10.2) 8.5 ( 7.4- 9.6) 8.5 ( 7.3- 9.8) 8.4 ( 7.3- 9.7) 14.0 ( 9.1- 21.1) 9.4 ( 6.2- 13.6)
Nebraska 6.6 ( 5.0- 8.8) 6.4 ( 4.8- 8.4) 6.6 ( 4.9- 8.8) 6.6 ( 4.9- 8.6) ∼ ∼North Dakota ∼ ∼ ∼ ∼ ∼ ∼South Dakota
South
South Atlantic
Delaware 10.5 ( 7.4- 14.8) 10.1 ( 7.1- 13.9) 10.1 ( 6.8- 14.8) 10.5 ( 7.1- 14.9) ∼ ∼District of Columbia 14.2 ( 9.8- 20.1) 13.9 ( 9.6- 19.5) ∼ ∼ 17.5 ( 11.4- 26.0) 17.8 ( 11.6- 26.0)
Florida 10.0 ( 9.3- 10.7) 11.5 ( 10.7- 12.3) 9.8 ( 9.1- 10.5) 12.4 ( 11.5- 13.3) 11.9 ( 9.2- 15.6) 6.7 ( 5.3- 8.4)
Georgia
Atlanta 7.0 ( 5.2- 9.3) 4.5 ( 3.4- 5.8) 6.2 ( 4.4- 8.7) 4.8 ( 3.4- 6.5) 11.7 ( 6.1- 21.2) 4.5 ( 2.7- 7.2)
Maryland 8.8 ( 7.6- 10.2) 7.8 ( 6.7- 8.9) 7.9 ( 6.6- 9.4) 7.7 ( 6.4- 9.1) 13.1 ( 9.8- 17.6) 8.3 ( 6.3- 10.8)
North Carolina 9.1 ( 8.1- 10.2) 8.3 ( 7.4- 9.3) 8.3 ( 7.3- 9.5) 8.3 ( 7.2- 9.4) 13.5 ( 10.5- 17.3) 9.0 ( 7.0- 11.3)
South Carolina 9.1 ( 7.7- 10.8) 8.3 ( 7.1- 9.7) 8.3 ( 6.8- 10.1) 8.4 ( 6.9- 10.1) 12.3 ( 8.9- 16.8) 8.5 ( 6.2- 11.4)
Virginia
West Virginia 10.4 ( 8.5- 12.8) 11.4 ( 9.2- 13.8) 10.1 ( 8.1- 12.5) 11.1 ( 8.9- 13.6) ∼ ∼East South Central
Alabama
Kentucky 9.5 ( 8.1- 11.1) 9.0 ( 7.7- 10.4) 9.4 ( 8.0- 11.0) 9.1 ( 7.8- 10.6) ∼ ∼Mississippi
Tennessee
continued

Cancer Incidence, by U
.S. Census R
egion and Division, State, and M
etropolitan Area
53
Table 2.8.1: Cancer of the Larynx. Invasive Cancer Incidence Rates by U.S. Census Region and Division, State andMetropolitan Area, and Race (All Races, White, Black), United States: SEER and NPCR Registries that Meet QualityCriteria∗† (continued)
Males, 1999
All Races White BlackAge-Adjusted Crude Age-Adjusted Crude Age-Adjusted Crude
Area Rate‡§ (CI) Rate‡ (CI) Rate‡§ (CI) Rate‡ (CI) Rate‡§ (CI) Rate‡ (CI)
West South Central
Arkansas
Louisiana 10.3 ( 8.9- 11.9) 9.2 ( 8.0- 10.6) 9.1 ( 7.6- 10.9) 9.2 ( 7.7- 10.9) 14.6 ( 11.2- 18.8) 9.7 ( 7.5- 12.4)
Oklahoma
Texas
West 5.9 ( 5.6- 6.2) 4.9 ( 4.6- 5.1) 5.9 ( 5.6- 6.2) 5.1 ( 4.8- 5.4) 10.2 ( 8.2- 12.5) 6.5 ( 5.3- 7.8)
Mountain
Arizona 5.7 ( 4.7- 6.9) 5.2 ( 4.4- 6.3) 5.6 ( 4.6- 6.8) 5.5 ( 4.5- 6.6) ∼ ∼Colorado 5.3 ( 4.2- 6.6) 4.3 ( 3.5- 5.3) 5.4 ( 4.3- 6.8) 4.5 ( 3.6- 5.6) ∼ ∼Idaho 7.6 ( 5.4- 10.4) 6.6 ( 4.7- 8.9) 7.7 ( 5.5- 10.6) 6.8 ( 4.9- 9.2) ∼ ∼Montana 6.3 ( 4.1- 9.2) 6.4 ( 4.2- 9.2) 5.8 ( 3.8- 8.8) 6.1 ( 4.0- 9.1) ∼ ∼Nevada
New Mexico 6.5 ( 4.8- 8.7) 5.7 ( 4.2- 7.6) 6.7 ( 4.9- 9.1) 6.4 ( 4.7- 8.5) ∼ ∼Utah 3.5 ( 2.3- 5.3) 2.4 ( 1.5- 3.5) 3.6 ( 2.3- 5.5) 2.5 ( 1.6- 3.7) ∼ ∼Wyoming ∼ ∼ ∼ ∼ ∼ ∼
Pacific 6.0 ( 5.7- 6.4) 4.9 ( 4.6- 5.2) 6.0 ( 5.6- 6.4) 5.1 ( 4.8- 5.4) 10.8 ( 8.7- 13.4) 6.8 ( 5.5- 8.3)
Alaska ∼ ∼ ∼ ∼ ∼ ∼California 5.9 ( 5.5- 6.4) 4.7 ( 4.4- 5.0) 5.8 ( 5.4- 6.3) 4.8 ( 4.4- 5.2) 11.1 ( 8.8- 13.8) 7.1 ( 5.7- 8.8)
San Francisco-Oakland 7.2 ( 6.0- 8.6) 6.5 ( 5.4- 7.7) 7.3 ( 5.9- 9.0) 6.9 ( 5.6- 8.5) 13.2 ( 8.3- 20.6) 9.8 ( 6.2- 14.6)
San Jose-Monterey 5.4 ( 4.0- 7.3) 4.0 ( 2.9- 5.3) 5.8 ( 4.1- 8.0) 4.5 ( 3.2- 6.1) ∼ ∼Los Angeles 6.5 ( 5.6- 7.4) 4.8 ( 4.2- 5.4) 6.2 ( 5.3- 7.3) 4.6 ( 4.0- 5.4) 10.5 ( 7.4- 14.8) 7.9 ( 5.6- 10.8)
Hawaii 5.9 ( 4.1- 8.3) 5.8 ( 4.0- 8.1) 14.3 ( 8.5- 22.8) 11.2 ( 6.8- 17.5) ∼ ∼Oregon 6.1 ( 4.9- 7.5) 5.9 ( 4.7- 7.2) 6.1 ( 4.9- 7.5) 6.0 ( 4.8- 7.4) ∼ ∼Washington 6.6 ( 5.6- 7.7) 5.6 ( 4.8- 6.5) 6.5 ( 5.5- 7.7) 5.8 ( 4.9- 6.8) ∼ ∼
Seattle-Puget Sound 6.0 ( 4.9- 7.4) 5.0 ( 4.1- 6.1) 6.1 ( 4.9- 7.5) 5.4 ( 4.3- 6.6) ∼ ∼∗ Data are from selected statewide and metropolitan area cancer registries that meet the following data quality criteria for all invasive cancer sites combined: case
ascertainment is at least 90% complete; ≥ 97% of cases pass a standard set of computerized edits; ≤ 5% of cases were ascertained by death certificate only; ≤ 3% of
cases are missing information on sex; ≤ 5% of cases are missing information on race; ≤ 3% of cases are missing information on age. See Appendix H for registry-specific
data quality information. U.S. rates cover approximately 78% of the U.S. population.
† Invasive cancers only
‡ Rates are per 100,000 persons. Population denominators for 1999 are projected from the 1990 census and may not accurately reflect the 1999 population size. Caution
should be used in interpreting rates based on these projected populations.
§ Rates are age-adjusted to the 2000 U.S. standard population.
∼ Rates are suppressed if fewer than 16 cases were reported in the specific area-race category.
Notes: Cases from suppressed rates are included in the U.S. and region/division rates. Observed region/division age-adjusted incidence rates are presented for
regions/divisions with ≥ 78% of the population covered by registries that meet the data quality criteria specified above, and if the 95% confidence intervals
around the observed region/division rates for each of four major cancers include "bias-corrected" estimated region/division rates (see technical notes) for
each of those cancers. U.S rates are as presented in Table 1.1. California, Washington, and Michigan state rates each include cases from the SEER metropolitan
areas.
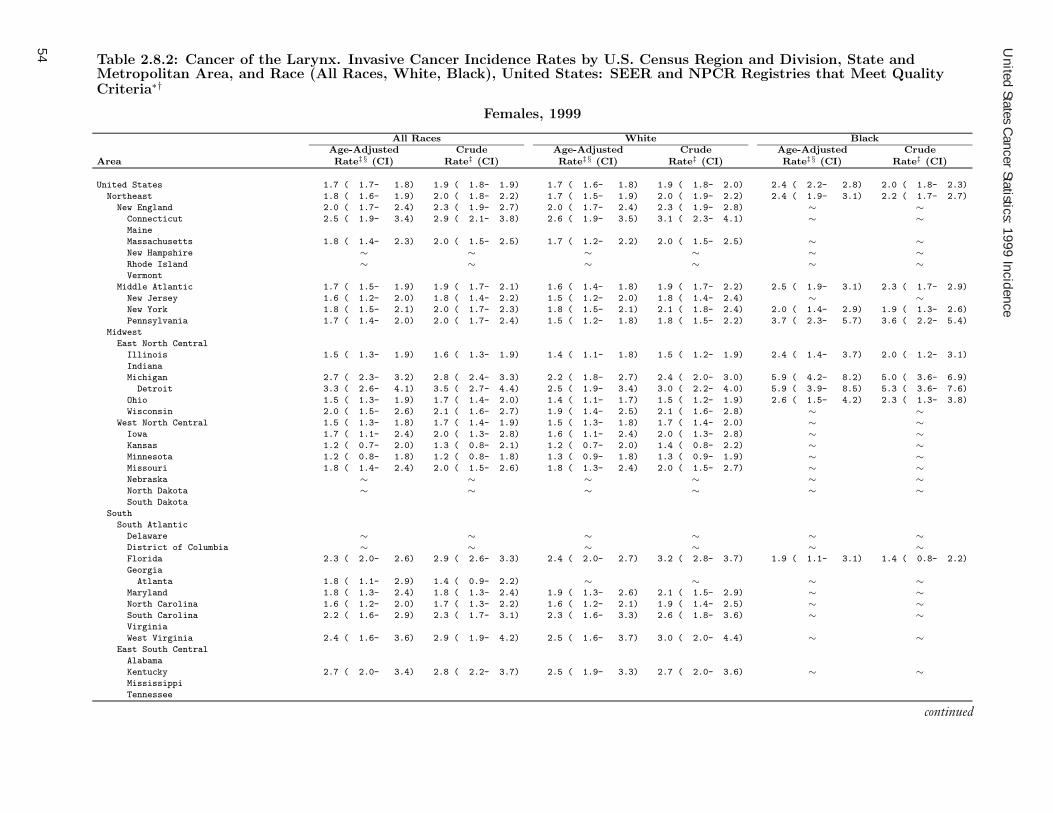
United States C
ancer Statistics: 1999 Incidence
54
Table 2.8.2: Cancer of the Larynx. Invasive Cancer Incidence Rates by U.S. Census Region and Division, State andMetropolitan Area, and Race (All Races, White, Black), United States: SEER and NPCR Registries that Meet QualityCriteria∗†
Females, 1999
All Races White BlackAge-Adjusted Crude Age-Adjusted Crude Age-Adjusted Crude
Area Rate‡§ (CI) Rate‡ (CI) Rate‡§ (CI) Rate‡ (CI) Rate‡§ (CI) Rate‡ (CI)
United States 1.7 ( 1.7- 1.8) 1.9 ( 1.8- 1.9) 1.7 ( 1.6- 1.8) 1.9 ( 1.8- 2.0) 2.4 ( 2.2- 2.8) 2.0 ( 1.8- 2.3)
Northeast 1.8 ( 1.6- 1.9) 2.0 ( 1.8- 2.2) 1.7 ( 1.5- 1.9) 2.0 ( 1.9- 2.2) 2.4 ( 1.9- 3.1) 2.2 ( 1.7- 2.7)
New England 2.0 ( 1.7- 2.4) 2.3 ( 1.9- 2.7) 2.0 ( 1.7- 2.4) 2.3 ( 1.9- 2.8) ∼ ∼Connecticut 2.5 ( 1.9- 3.4) 2.9 ( 2.1- 3.8) 2.6 ( 1.9- 3.5) 3.1 ( 2.3- 4.1) ∼ ∼Maine
Massachusetts 1.8 ( 1.4- 2.3) 2.0 ( 1.5- 2.5) 1.7 ( 1.2- 2.2) 2.0 ( 1.5- 2.5) ∼ ∼New Hampshire ∼ ∼ ∼ ∼ ∼ ∼Rhode Island ∼ ∼ ∼ ∼ ∼ ∼Vermont
Middle Atlantic 1.7 ( 1.5- 1.9) 1.9 ( 1.7- 2.1) 1.6 ( 1.4- 1.8) 1.9 ( 1.7- 2.2) 2.5 ( 1.9- 3.1) 2.3 ( 1.7- 2.9)
New Jersey 1.6 ( 1.2- 2.0) 1.8 ( 1.4- 2.2) 1.5 ( 1.2- 2.0) 1.8 ( 1.4- 2.4) ∼ ∼New York 1.8 ( 1.5- 2.1) 2.0 ( 1.7- 2.3) 1.8 ( 1.5- 2.1) 2.1 ( 1.8- 2.4) 2.0 ( 1.4- 2.9) 1.9 ( 1.3- 2.6)
Pennsylvania 1.7 ( 1.4- 2.0) 2.0 ( 1.7- 2.4) 1.5 ( 1.2- 1.8) 1.8 ( 1.5- 2.2) 3.7 ( 2.3- 5.7) 3.6 ( 2.2- 5.4)
Midwest
East North Central
Illinois 1.5 ( 1.3- 1.9) 1.6 ( 1.3- 1.9) 1.4 ( 1.1- 1.8) 1.5 ( 1.2- 1.9) 2.4 ( 1.4- 3.7) 2.0 ( 1.2- 3.1)
Indiana
Michigan 2.7 ( 2.3- 3.2) 2.8 ( 2.4- 3.3) 2.2 ( 1.8- 2.7) 2.4 ( 2.0- 3.0) 5.9 ( 4.2- 8.2) 5.0 ( 3.6- 6.9)
Detroit 3.3 ( 2.6- 4.1) 3.5 ( 2.7- 4.4) 2.5 ( 1.9- 3.4) 3.0 ( 2.2- 4.0) 5.9 ( 3.9- 8.5) 5.3 ( 3.6- 7.6)
Ohio 1.5 ( 1.3- 1.9) 1.7 ( 1.4- 2.0) 1.4 ( 1.1- 1.7) 1.5 ( 1.2- 1.9) 2.6 ( 1.5- 4.2) 2.3 ( 1.3- 3.8)
Wisconsin 2.0 ( 1.5- 2.6) 2.1 ( 1.6- 2.7) 1.9 ( 1.4- 2.5) 2.1 ( 1.6- 2.8) ∼ ∼West North Central 1.5 ( 1.3- 1.8) 1.7 ( 1.4- 1.9) 1.5 ( 1.3- 1.8) 1.7 ( 1.4- 2.0) ∼ ∼Iowa 1.7 ( 1.1- 2.4) 2.0 ( 1.3- 2.8) 1.6 ( 1.1- 2.4) 2.0 ( 1.3- 2.8) ∼ ∼Kansas 1.2 ( 0.7- 2.0) 1.3 ( 0.8- 2.1) 1.2 ( 0.7- 2.0) 1.4 ( 0.8- 2.2) ∼ ∼Minnesota 1.2 ( 0.8- 1.8) 1.2 ( 0.8- 1.8) 1.3 ( 0.9- 1.8) 1.3 ( 0.9- 1.9) ∼ ∼Missouri 1.8 ( 1.4- 2.4) 2.0 ( 1.5- 2.6) 1.8 ( 1.3- 2.4) 2.0 ( 1.5- 2.7) ∼ ∼Nebraska ∼ ∼ ∼ ∼ ∼ ∼North Dakota ∼ ∼ ∼ ∼ ∼ ∼South Dakota
South
South Atlantic
Delaware ∼ ∼ ∼ ∼ ∼ ∼District of Columbia ∼ ∼ ∼ ∼ ∼ ∼Florida 2.3 ( 2.0- 2.6) 2.9 ( 2.6- 3.3) 2.4 ( 2.0- 2.7) 3.2 ( 2.8- 3.7) 1.9 ( 1.1- 3.1) 1.4 ( 0.8- 2.2)
Georgia
Atlanta 1.8 ( 1.1- 2.9) 1.4 ( 0.9- 2.2) ∼ ∼ ∼ ∼Maryland 1.8 ( 1.3- 2.4) 1.8 ( 1.3- 2.4) 1.9 ( 1.3- 2.6) 2.1 ( 1.5- 2.9) ∼ ∼North Carolina 1.6 ( 1.2- 2.0) 1.7 ( 1.3- 2.2) 1.6 ( 1.2- 2.1) 1.9 ( 1.4- 2.5) ∼ ∼South Carolina 2.2 ( 1.6- 2.9) 2.3 ( 1.7- 3.1) 2.3 ( 1.6- 3.3) 2.6 ( 1.8- 3.6) ∼ ∼Virginia
West Virginia 2.4 ( 1.6- 3.6) 2.9 ( 1.9- 4.2) 2.5 ( 1.6- 3.7) 3.0 ( 2.0- 4.4) ∼ ∼East South Central
Alabama
Kentucky 2.7 ( 2.0- 3.4) 2.8 ( 2.2- 3.7) 2.5 ( 1.9- 3.3) 2.7 ( 2.0- 3.6) ∼ ∼Mississippi
Tennessee
continued

Cancer Incidence, by U
.S. Census R
egion and Division, State, and M
etropolitan Area
55
Table 2.8.2: Cancer of the Larynx. Invasive Cancer Incidence Rates by U.S. Census Region and Division, State andMetropolitan Area, and Race (All Races, White, Black), United States: SEER and NPCR Registries that Meet QualityCriteria∗† (continued)
Females, 1999
All Races White BlackAge-Adjusted Crude Age-Adjusted Crude Age-Adjusted Crude
Area Rate‡§ (CI) Rate‡ (CI) Rate‡§ (CI) Rate‡ (CI) Rate‡§ (CI) Rate‡ (CI)
West South Central
Arkansas
Louisiana 2.5 ( 1.9- 3.3) 2.6 ( 1.9- 3.3) 2.5 ( 1.8- 3.4) 2.8 ( 2.0- 3.8) 2.8 ( 1.6- 4.5) 2.3 ( 1.3- 3.6)
Oklahoma
Texas
West 1.3 ( 1.2- 1.5) 1.3 ( 1.2- 1.4) 1.4 ( 1.2- 1.5) 1.4 ( 1.2- 1.5) 2.1 ( 1.4- 3.2) 1.6 ( 1.1- 2.4)
Mountain
Arizona 1.7 ( 1.2- 2.3) 1.8 ( 1.3- 2.4) 1.8 ( 1.3- 2.4) 2.0 ( 1.4- 2.7) ∼ ∼Colorado 1.3 ( 0.8- 1.9) 1.2 ( 0.8- 1.8) 1.3 ( 0.8- 1.9) 1.3 ( 0.8- 1.9) ∼ ∼Idaho ∼ ∼ ∼ ∼ ∼ ∼Montana ∼ ∼ ∼ ∼ ∼ ∼Nevada
New Mexico ∼ ∼ ∼ ∼ ∼ ∼Utah ∼ ∼ ∼ ∼ ∼ ∼Wyoming ∼ ∼ ∼ ∼ ∼ ∼
Pacific 1.3 ( 1.2- 1.5) 1.3 ( 1.1- 1.4) 1.4 ( 1.2- 1.6) 1.4 ( 1.2- 1.6) 2.3 ( 1.5- 3.5) 1.8 ( 1.2- 2.6)
Alaska ∼ ∼ ∼ ∼ ∼ ∼California 1.2 ( 1.1- 1.4) 1.2 ( 1.0- 1.3) 1.3 ( 1.1- 1.5) 1.3 ( 1.1- 1.5) 2.1 ( 1.3- 3.3) 1.6 ( 1.0- 2.5)
San Francisco-Oakland 1.1 ( 0.7- 1.7) 1.2 ( 0.8- 1.7) 1.3 ( 0.8- 2.1) 1.5 ( 0.9- 2.3) ∼ ∼San Jose-Monterey ∼ ∼ ∼ ∼ ∼ ∼Los Angeles 1.1 ( 0.8- 1.4) 1.0 ( 0.7- 1.3) 1.1 ( 0.7- 1.5) 1.0 ( 0.7- 1.4) ∼ ∼
Hawaii ∼ ∼ ∼ ∼ ∼ ∼Oregon 1.5 ( 1.0- 2.2) 1.7 ( 1.1- 2.4) 1.6 ( 1.1- 2.3) 1.8 ( 1.2- 2.6) ∼ ∼Washington 1.6 ( 1.2- 2.2) 1.6 ( 1.2- 2.2) 1.6 ( 1.2- 2.2) 1.6 ( 1.2- 2.2) ∼ ∼
Seattle-Puget Sound 1.5 ( 1.0- 2.1) 1.5 ( 1.0- 2.1) 1.3 ( 0.9- 2.0) 1.4 ( 0.9- 2.1) ∼ ∼∗ Data are from selected statewide and metropolitan area cancer registries that meet the following data quality criteria for all invasive cancer sites combined: case
ascertainment is at least 90% complete; ≥ 97% of cases pass a standard set of computerized edits; ≤ 5% of cases were ascertained by death certificate only; ≤ 3% of
cases are missing information on sex; ≤ 5% of cases are missing information on race; ≤ 3% of cases are missing information on age. See Appendix H for registry-specific
data quality information. U.S. rates cover approximately 78% of the U.S. population.
† Invasive cancers only
‡ Rates are per 100,000 persons. Population denominators for 1999 are projected from the 1990 census and may not accurately reflect the 1999 population size. Caution
should be used in interpreting rates based on these projected populations.
§ Rates are age-adjusted to the 2000 U.S. standard population.
∼ Rates are suppressed if fewer than 16 cases were reported in the specific area-race category.
Notes: Cases from suppressed rates are included in the U.S. and region/division rates. Observed region/division age-adjusted incidence rates are presented for
regions/divisions with ≥ 78% of the population covered by registries that meet the data quality criteria specified above, and if the 95% confidence intervals
around the observed region/division rates for each of four major cancers include "bias-corrected" estimated region/division rates (see technical notes) for
each of those cancers. U.S rates are as presented in Table 1.2. California, Washington, and Michigan state rates each include cases from the SEER metropolitan
areas.

United States C
ancer Statistics: 1999 Incidence
56
Table 2.9.1: Cancer of the Lung and Bronchus. Invasive Cancer Incidence Rates by U.S. Census Region and Division,State and Metropolitan Area, and Race (All Races, White, Black), United States: SEER and NPCR Registries thatMeet Quality Criteria∗†
Males, 1999
All Races White BlackAge-Adjusted Crude Age-Adjusted Crude Age-Adjusted Crude
Area Rate‡§ (CI) Rate‡ (CI) Rate‡§ (CI) Rate‡ (CI) Rate‡§ (CI) Rate‡ (CI)
United States 89.1 ( 88.5- 89.7) 80.0 ( 79.5- 80.6) 87.8 ( 87.2- 88.5) 84.2 ( 83.6- 84.8) 110.7 (108.3- 113.3) 68.7 ( 67.2- 70.2)
Northeast 86.8 ( 85.6- 88.0) 82.7 ( 81.6- 83.9) 86.0 ( 84.7- 87.3) 87.9 ( 86.6- 89.2) 97.2 ( 92.7- 101.9) 63.1 ( 60.3- 66.0)
New England 88.2 ( 85.7- 90.8) 82.3 ( 80.0- 84.7) 87.9 ( 85.3- 90.5) 86.5 ( 84.0- 89.1) 93.8 ( 79.9- 110.0) 48.5 ( 41.7- 56.1)
Connecticut 84.5 ( 79.9- 89.2) 81.1 ( 76.8- 85.7) 83.8 ( 79.1- 88.7) 85.4 ( 80.7- 90.4) 95.5 ( 74.8- 121.5) 55.4 ( 44.0- 68.9)
Maine
Massachusetts 88.1 ( 84.6- 91.7) 81.9 ( 78.6- 85.2) 87.7 ( 84.2- 91.4) 86.5 ( 83.0- 90.1) 85.7 ( 67.3- 109.3) 42.2 ( 33.6- 52.3)
New Hampshire 83.5 ( 75.7- 92.1) 70.9 ( 64.3- 78.0) 83.7 ( 75.7- 92.3) 71.9 ( 65.2- 79.2) ∼ ∼Rhode Island 105.0 ( 95.9- 114.8) 103.4 ( 94.5-113.0) 105.4 ( 96.0- 115.4) 108.9 ( 99.3-119.2) ∼ ∼Vermont
Middle Atlantic 86.4 ( 85.1- 87.8) 82.8 ( 81.5- 84.1) 85.4 ( 84.0- 86.9) 88.4 ( 86.9- 89.9) 97.6 ( 92.9- 102.6) 65.1 ( 62.1- 68.3)
New Jersey 86.1 ( 83.1- 89.2) 80.1 ( 77.3- 82.9) 85.1 ( 81.9- 88.4) 86.4 ( 83.1- 89.7) 107.4 ( 96.5- 119.4) 69.1 ( 62.5- 76.3)
New York 80.7 ( 78.7- 82.7) 73.9 ( 72.1- 75.7) 81.8 ( 79.7- 84.0) 81.9 ( 79.7- 84.1) 74.1 ( 68.6- 79.9) 49.7 ( 46.2- 53.4)
Pennsylvania 94.2 ( 91.8- 96.8) 98.3 ( 95.7-100.9) 89.9 ( 87.4- 92.5) 98.2 ( 95.5-100.9) 147.2 (135.1- 160.2) 103.2 ( 94.9-112.1)
Midwest
East North Central
Illinois 95.8 ( 93.1- 98.6) 81.7 ( 79.4- 84.0) 92.4 ( 89.6- 95.4) 83.9 ( 81.4- 86.6) 126.3 (116.7- 136.6) 78.3 ( 72.5- 84.4)
Indiana
Michigan 94.6 ( 91.6- 97.6) 82.7 ( 80.2- 85.3) 90.9 ( 87.8- 94.0) 83.5 ( 80.7- 86.3) 127.6 (117.2- 138.8) 86.3 ( 79.4- 93.7)
Detroit 100.5 ( 95.7- 105.4) 88.6 ( 84.5- 92.8) 93.5 ( 88.3- 98.9) 88.0 ( 83.2- 92.9) 133.4 (121.2- 146.6) 98.0 ( 89.1-107.5)
Ohio 102.5 ( 99.7- 105.4) 94.3 ( 91.7- 96.9) 99.7 ( 96.7- 102.6) 95.3 ( 92.5- 98.1) 123.3 (112.6- 135.0) 84.2 ( 77.0- 91.7)
Wisconsin 83.0 ( 79.3- 86.7) 75.5 ( 72.2- 78.9) 81.5 ( 77.8- 85.3) 77.8 ( 74.3- 81.5) 135.0 (104.4- 175.4) 57.5 ( 45.7- 71.3)
West North Central 88.8 ( 86.8- 90.9) 82.0 ( 80.1- 83.9) 86.8 ( 84.8- 88.9) 83.5 ( 81.5- 85.5) 134.8 (121.4- 149.5) 77.1 ( 69.7- 85.1)
Iowa 88.0 ( 83.1- 93.0) 88.1 ( 83.2- 93.1) 87.6 ( 82.8- 92.8) 89.8 ( 84.8- 95.0) 148.1 ( 86.9- 244.5) 67.2 ( 41.1-103.8)
Kansas 91.9 ( 86.5- 97.5) 82.6 ( 77.8- 87.7) 90.4 ( 84.9- 96.2) 84.7 ( 79.6- 90.1) 131.4 ( 98.7- 172.9) 72.9 ( 55.2- 94.5)
Minnesota 74.4 ( 70.7- 78.3) 64.3 ( 61.1- 67.6) 73.2 ( 69.5- 77.1) 66.2 ( 62.8- 69.7) 123.5 ( 85.2- 183.4) 49.7 ( 35.2- 68.2)
Missouri 105.2 (101.2- 109.4) 98.5 ( 94.7-102.3) 102.4 ( 98.2- 106.7) 100.5 ( 96.4-104.6) 136.0 (119.4- 154.5) 87.7 ( 77.2- 99.2)
Nebraska 78.3 ( 72.1- 84.9) 73.1 ( 67.4- 79.2) 75.6 ( 69.5- 82.2) 73.1 ( 67.2- 79.4) 130.3 ( 81.9- 206.0) 72.3 ( 46.3-107.6)
North Dakota 69.3 ( 60.4- 79.3) 68.6 ( 59.7- 78.4) 68.6 ( 59.7- 78.7) 71.2 ( 61.9- 81.5) ∼ ∼South Dakota
South
South Atlantic
Delaware 109.9 ( 98.7- 122.2) 100.4 ( 90.4-111.2) 107.8 ( 96.0- 121.0) 108.4 ( 96.7-121.2) 130.9 ( 96.4- 176.8) 74.9 ( 56.1- 97.9)
District of Columbia 111.4 ( 98.2- 126.2) 105.7 ( 93.2-119.5) 63.7 ( 46.7- 87.0) 53.7 ( 39.6- 71.2) 134.6 (116.4- 155.2) 134.7 (116.5-154.8)
Florida 101.8 ( 99.6- 103.9) 120.7 (118.2-123.2) 101.3 ( 99.1- 103.6) 133.5 (130.6-136.4) 110.4 (101.7- 119.8) 61.6 ( 57.1- 66.4)
Georgia
Atlanta 89.1 ( 82.1- 96.7) 51.6 ( 47.7- 55.6) 80.8 ( 73.3- 89.1) 54.1 ( 49.2- 59.2) 123.2 (104.3- 145.4) 50.1 ( 43.4- 57.6)
Maryland 92.1 ( 87.9- 96.5) 75.7 ( 72.3- 79.2) 90.0 ( 85.4- 94.9) 83.7 ( 79.4- 88.1) 104.5 ( 94.2- 115.9) 62.5 ( 56.7- 68.7)
North Carolina 103.2 ( 99.7- 106.9) 89.8 ( 86.8- 92.9) 101.9 ( 98.0- 105.9) 97.1 ( 93.5-100.8) 111.8 (102.4- 121.9) 70.6 ( 64.8- 76.7)
South Carolina 109.5 (104.4- 114.9) 97.1 ( 92.7-101.6) 108.9 (103.2- 115.0) 108.0 (102.4-113.7) 110.8 ( 99.8- 122.9) 72.7 ( 65.7- 80.3)
Virginia
West Virginia 126.3 (119.1- 134.0) 133.6 (126.0-141.5) 126.4 (119.0- 134.1) 134.8 (127.1-142.9) 96.2 ( 59.5- 148.0) 77.7 ( 48.1-118.8)
East South Central
Alabama
Kentucky 135.6 (130.0- 141.4) 120.7 (115.8-125.7) 136.6 (130.9- 142.6) 124.7 (119.5-130.0) 115.9 ( 94.2- 141.7) 75.7 ( 61.9- 91.8)
Mississippi
Tennessee
continued

Cancer Incidence, by U
.S. Census R
egion and Division, State, and M
etropolitan Area
57
Table 2.9.1: Cancer of the Lung and Bronchus. Invasive Cancer Incidence Rates by U.S. Census Region and Division,State and Metropolitan Area, and Race (All Races, White, Black), United States: SEER and NPCR Registries thatMeet Quality Criteria∗† (continued)
Males, 1999
All Races White BlackAge-Adjusted Crude Age-Adjusted Crude Age-Adjusted Crude
Area Rate‡§ (CI) Rate‡ (CI) Rate‡§ (CI) Rate‡ (CI) Rate‡§ (CI) Rate‡ (CI)
West South Central
Arkansas
Louisiana 114.9 (109.9- 120.2) 95.3 ( 91.2- 99.6) 107.5 (101.9- 113.4) 100.7 ( 95.5-106.1) 142.1 (130.5- 154.6) 87.7 ( 80.7- 95.1)
Oklahoma
Texas
West 72.1 ( 71.0- 73.2) 57.7 ( 56.9- 58.6) 72.3 ( 71.1- 73.4) 60.5 ( 59.5- 61.5) 91.8 ( 85.6- 98.5) 54.3 ( 50.7- 58.0)
Mountain
Arizona 75.8 ( 72.2- 79.6) 69.5 ( 66.2- 73.0) 76.8 ( 73.0- 80.7) 75.0 ( 71.3- 78.8) 88.6 ( 61.9- 127.2) 47.1 ( 33.9- 63.6)
Colorado 63.2 ( 59.1- 67.5) 47.3 ( 44.4- 50.4) 63.5 ( 59.3- 68.0) 48.8 ( 45.7- 52.1) 53.8 ( 34.1- 84.4) 30.0 ( 19.8- 43.7)
Idaho 69.0 ( 62.0- 76.6) 57.7 ( 51.9- 64.0) 69.5 ( 62.4- 77.2) 59.1 ( 53.1- 65.5) ∼ ∼Montana 76.6 ( 68.5- 85.5) 74.4 ( 66.6- 82.9) 74.0 ( 65.9- 82.9) 75.4 ( 67.2- 84.3) ∼ ∼Nevada
New Mexico 60.5 ( 54.9- 66.6) 50.8 ( 46.2- 55.9) 62.0 ( 56.1- 68.4) 56.1 ( 50.8- 61.8) ∼ ∼Utah 44.3 ( 39.4- 49.6) 28.8 ( 25.7- 32.3) 43.7 ( 38.8- 49.1) 29.1 ( 25.9- 32.7) ∼ ∼Wyoming 68.9 ( 57.9- 81.7) 59.7 ( 50.4- 70.3) 69.4 ( 58.2- 82.3) 61.3 ( 51.6- 72.2) ∼ ∼
Pacific 74.1 ( 72.8- 75.4) 58.7 ( 57.7- 59.7) 74.6 ( 73.2- 76.0) 61.7 ( 60.5- 62.9) 95.4 ( 88.7- 102.6) 57.0 ( 53.1- 61.1)
Alaska 77.3 ( 63.7- 94.3) 43.0 ( 36.2- 50.8) 74.5 ( 59.9- 93.6) 45.5 ( 37.5- 54.8) ∼ ∼California 70.5 ( 69.1- 72.0) 54.3 ( 53.1- 55.4) 70.3 ( 68.8- 72.0) 56.8 ( 55.6- 58.1) 94.3 ( 87.3- 101.9) 57.8 ( 53.6- 62.2)
San Francisco-Oakland 68.9 ( 65.0- 73.0) 58.9 ( 55.6- 62.4) 63.8 ( 59.4- 68.5) 58.7 ( 54.6- 62.9) 88.3 ( 74.4- 104.4) 64.0 ( 54.2- 75.1)
San Jose-Monterey 62.5 ( 57.2- 68.3) 44.4 ( 40.6- 48.3) 62.2 ( 56.4- 68.6) 46.9 ( 42.6- 51.6) 110.6 ( 61.1- 198.3) 38.9 ( 23.4- 60.8)
Los Angeles 64.1 ( 61.4- 66.9) 46.1 ( 44.2- 48.1) 60.4 ( 57.4- 63.5) 44.3 ( 42.1- 46.5) 98.0 ( 87.4- 109.6) 68.3 ( 61.2- 76.0)
Hawaii 69.1 ( 62.5- 76.3) 67.3 ( 60.8- 74.2) 90.5 ( 74.8- 108.9) 69.7 ( 57.7- 83.4) ∼ ∼Oregon 86.1 ( 81.5- 90.9) 80.5 ( 76.3- 85.0) 85.5 ( 80.8- 90.4) 82.6 ( 78.1- 87.3) 132.4 ( 80.5- 212.2) 68.3 ( 42.8-103.4)
Washington 86.6 ( 82.9- 90.5) 72.0 ( 68.9- 75.1) 86.6 ( 82.7- 90.6) 75.4 ( 72.1- 78.9) 112.0 ( 84.9- 148.0) 58.5 ( 44.8- 75.0)
Seattle-Puget Sound 90.3 ( 85.7- 95.2) 73.2 ( 69.5- 77.1) 90.9 ( 86.0- 96.0) 78.1 ( 73.9- 82.4) 118.7 ( 88.5- 159.5) 60.3 ( 45.5- 78.3)
∗ Data are from selected statewide and metropolitan area cancer registries that meet the following data quality criteria for all invasive cancer sites combined: case
ascertainment is at least 90% complete; ≥ 97% of cases pass a standard set of computerized edits; ≤ 5% of cases were ascertained by death certificate only; ≤ 3% of
cases are missing information on sex; ≤ 5% of cases are missing information on race; ≤ 3% of cases are missing information on age. See Appendix H for registry-specific
data quality information. U.S. rates cover approximately 78% of the U.S. population.
† Invasive cancers only
‡ Rates are per 100,000 persons. Population denominators for 1999 are projected from the 1990 census and may not accurately reflect the 1999 population size. Caution
should be used in interpreting rates based on these projected populations.
§ Rates are age-adjusted to the 2000 U.S. standard population.
∼ Rates are suppressed if fewer than 16 cases were reported in the specific area-race category.
Notes: Cases from suppressed rates are included in the U.S. and region/division rates. Observed region/division age-adjusted incidence rates are presented for
regions/divisions with ≥ 78% of the population covered by registries that meet the data quality criteria specified above, and if the 95% confidence intervals
around the observed region/division rates for each of four major cancers include "bias-corrected" estimated region/division rates (see technical notes) for
each of those cancers. U.S rates are as presented in Table 1.1. California, Washington, and Michigan state rates each include cases from the SEER metropolitan
areas.

United States C
ancer Statistics: 1999 Incidence
58
Table 2.9.2: Cancer of the Lung and Bronchus. Invasive Cancer Incidence Rates by U.S. Census Region and Division,State and Metropolitan Area, and Race (All Races, White, Black), United States: SEER and NPCR Registries thatMeet Quality Criteria∗†
Females, 1999
All Races White BlackAge-Adjusted Crude Age-Adjusted Crude Age-Adjusted Crude
Area Rate‡§ (CI) Rate‡ (CI) Rate‡§ (CI) Rate‡ (CI) Rate‡§ (CI) Rate‡ (CI)
United States 53.4 ( 52.9- 53.8) 59.0 ( 58.6- 59.5) 54.4 ( 54.0- 54.9) 64.1 ( 63.5- 64.6) 50.3 ( 48.9- 51.7) 40.1 ( 39.0- 41.2)
Northeast 53.7 ( 52.9- 54.6) 63.7 ( 62.8- 64.7) 54.8 ( 53.9- 55.7) 69.4 ( 68.3- 70.5) 45.8 ( 43.3- 48.3) 39.3 ( 37.2- 41.5)
New England 58.3 ( 56.5- 60.2) 67.3 ( 65.3- 69.4) 58.7 ( 56.8- 60.6) 71.0 ( 68.8- 73.3) 49.3 ( 41.1- 58.7) 33.6 ( 28.1- 39.8)
Connecticut 54.3 ( 51.0- 57.7) 63.9 ( 60.1- 67.8) 54.7 ( 51.4- 58.3) 68.2 ( 64.1- 72.5) 50.2 ( 38.3- 65.1) 38.4 ( 29.4- 49.2)
Maine
Massachusetts 59.0 ( 56.5- 61.6) 68.4 ( 65.5- 71.3) 59.0 ( 56.5- 61.7) 72.1 ( 69.1- 75.3) 51.3 ( 39.4- 66.0) 31.8 ( 24.6- 40.4)
New Hampshire 61.0 ( 54.9- 67.6) 61.6 ( 55.5- 68.1) 61.0 ( 54.9- 67.6) 62.1 ( 55.9- 68.8) ∼ ∼Rhode Island 65.2 ( 58.9- 72.1) 78.9 ( 71.4- 87.0) 66.6 ( 60.0- 73.8) 84.1 ( 76.0- 92.8) ∼ ∼Vermont
Middle Atlantic 52.4 ( 51.5- 53.4) 62.6 ( 61.6- 63.8) 53.6 ( 52.6- 54.6) 68.8 ( 67.5- 70.1) 45.4 ( 42.9- 48.1) 40.1 ( 37.8- 42.4)
New Jersey 55.5 ( 53.4- 57.6) 64.5 ( 62.1- 67.0) 57.2 ( 54.9- 59.6) 72.6 ( 69.7- 75.5) 51.5 ( 45.4- 58.3) 42.0 ( 37.1- 47.4)
New York 51.5 ( 50.1- 52.9) 59.2 ( 57.6- 60.7) 54.4 ( 52.8- 56.0) 67.8 ( 65.9- 69.8) 36.6 ( 33.6- 39.8) 32.3 ( 29.7- 35.1)
Pennsylvania 51.9 ( 50.3- 53.5) 66.7 ( 64.7- 68.7) 50.6 ( 49.0- 52.3) 67.8 ( 65.7- 70.1) 63.7 ( 57.3- 70.5) 59.7 ( 53.8- 66.1)
Midwest
East North Central
Illinois 54.8 ( 53.0- 56.6) 58.8 ( 56.9- 60.8) 54.0 ( 52.1- 56.0) 62.0 ( 59.8- 64.2) 62.0 ( 56.5- 67.8) 49.9 ( 45.5- 54.5)
Indiana
Michigan 57.4 ( 55.4- 59.5) 61.2 ( 59.1- 63.4) 56.5 ( 54.3- 58.7) 63.5 ( 61.1- 66.0) 66.8 ( 60.5- 73.7) 54.5 ( 49.3- 60.0)
Detroit 59.6 ( 56.5- 62.8) 65.3 ( 61.9- 68.9) 59.0 ( 55.5- 62.7) 70.5 ( 66.4- 74.9) 63.8 ( 56.8- 71.5) 55.1 ( 49.0- 61.6)
Ohio 56.1 ( 54.3- 58.0) 63.9 ( 61.8- 66.0) 55.3 ( 53.5- 57.3) 65.5 ( 63.3- 67.8) 60.8 ( 54.7- 67.5) 52.3 ( 47.0- 58.0)
Wisconsin 46.9 ( 44.4- 49.5) 51.2 ( 48.5- 54.0) 46.3 ( 43.8- 49.0) 53.0 ( 50.2- 56.0) 65.0 ( 48.1- 87.0) 36.0 ( 27.1- 46.8)
West North Central 50.6 ( 49.3- 52.0) 56.7 ( 55.1- 58.2) 50.0 ( 48.6- 51.5) 58.1 ( 56.5- 59.8) 61.8 ( 54.2- 70.1) 44.8 ( 39.4- 50.8)
Iowa 46.2 ( 43.0- 49.5) 56.1 ( 52.4- 60.1) 46.1 ( 42.9- 49.4) 57.0 ( 53.2- 61.1) ∼ ∼Kansas 52.8 ( 49.1- 56.7) 58.4 ( 54.4- 62.6) 53.3 ( 49.5- 57.4) 61.1 ( 56.8- 65.6) 48.1 ( 31.9- 69.9) 35.6 ( 23.6- 51.4)
Minnesota 45.8 ( 43.2- 48.6) 47.4 ( 44.7- 50.2) 45.0 ( 42.4- 47.8) 48.7 ( 45.8- 51.6) 87.4 ( 57.1- 130.6) 40.2 ( 26.9- 57.8)
Missouri 59.2 ( 56.6- 62.0) 67.2 ( 64.2- 70.3) 58.9 ( 56.1- 61.8) 69.9 ( 66.6- 73.3) 61.9 ( 52.8- 72.2) 49.9 ( 42.5- 58.1)
Nebraska 44.4 ( 40.2- 48.8) 51.3 ( 46.6- 56.3) 43.1 ( 39.0- 47.6) 51.5 ( 46.6- 56.7) ∼ ∼North Dakota 37.2 ( 31.1- 44.2) 43.1 ( 36.1- 50.9) 36.8 ( 30.7- 44.0) 44.3 ( 37.1- 52.5) ∼ ∼South Dakota
South
South Atlantic
Delaware 65.8 ( 58.2- 74.1) 70.8 ( 62.7- 79.7) 66.0 ( 57.7- 75.2) 78.3 ( 68.6- 89.0) 65.4 ( 45.5- 91.8) 46.0 ( 32.2- 63.7)
District of Columbia 50.8 ( 43.3- 59.4) 60.6 ( 51.8- 70.5) 39.6 ( 27.9- 57.5) 41.9 ( 29.8- 57.3) 55.4 ( 46.0- 66.8) 71.8 ( 59.7- 85.5)
Florida 62.9 ( 61.4- 64.5) 87.0 ( 84.9- 89.1) 65.5 ( 63.8- 67.2) 99.8 ( 97.3-102.2) 39.1 ( 34.9- 43.6) 28.0 ( 25.1- 31.2)
Georgia
Atlanta 55.1 ( 50.6- 59.8) 41.4 ( 38.0- 44.9) 55.6 ( 50.5- 61.2) 49.6 ( 45.0- 54.5) 52.7 ( 43.6- 63.4) 27.9 ( 23.2- 33.2)
Maryland 57.0 ( 54.1- 59.9) 58.0 ( 55.2- 61.0) 58.7 ( 55.4- 62.2) 68.3 ( 64.5- 72.2) 55.2 ( 49.1- 61.9) 40.0 ( 35.7- 44.8)
North Carolina 51.0 ( 48.9- 53.2) 56.1 ( 53.8- 58.5) 53.8 ( 51.4- 56.3) 64.4 ( 61.5- 67.4) 38.3 ( 34.0- 43.0) 32.3 ( 28.7- 36.2)
South Carolina 46.2 ( 43.4- 49.2) 49.9 ( 46.9- 53.1) 50.4 ( 47.0- 54.0) 60.7 ( 56.7- 65.0) 32.9 ( 28.1- 38.3) 27.1 ( 23.1- 31.5)
Virginia
West Virginia 67.5 ( 63.0- 72.4) 87.3 ( 81.4- 93.5) 67.0 ( 62.3- 71.9) 87.0 ( 81.0- 93.3) 82.5 ( 54.2- 121.8) 93.3 ( 62.0-134.9)
East South Central
Alabama
Kentucky 70.4 ( 67.0- 74.0) 77.6 ( 73.8- 81.5) 69.8 ( 66.3- 73.5) 78.7 ( 74.7- 82.8) 82.2 ( 67.2- 99.6) 70.2 ( 57.5- 84.9)
Mississippi
Tennessee
continued
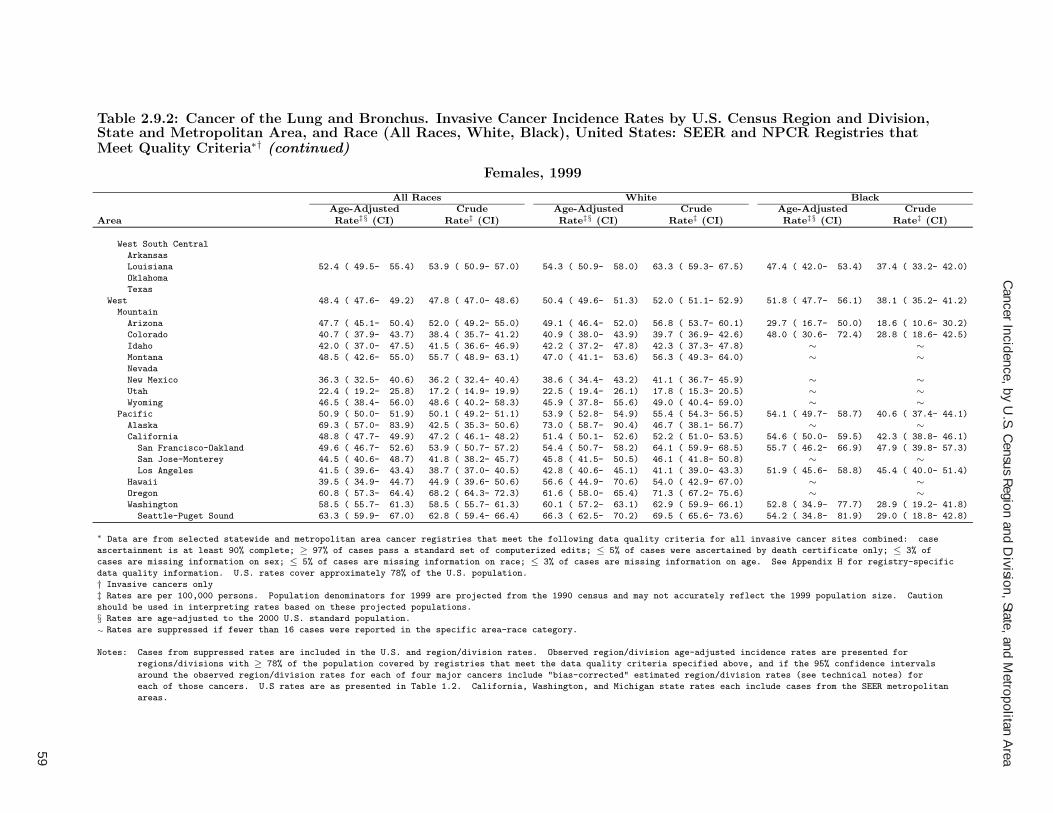
Cancer Incidence, by U
.S. Census R
egion and Division, State, and M
etropolitan Area
59
Table 2.9.2: Cancer of the Lung and Bronchus. Invasive Cancer Incidence Rates by U.S. Census Region and Division,State and Metropolitan Area, and Race (All Races, White, Black), United States: SEER and NPCR Registries thatMeet Quality Criteria∗† (continued)
Females, 1999
All Races White BlackAge-Adjusted Crude Age-Adjusted Crude Age-Adjusted Crude
Area Rate‡§ (CI) Rate‡ (CI) Rate‡§ (CI) Rate‡ (CI) Rate‡§ (CI) Rate‡ (CI)
West South Central
Arkansas
Louisiana 52.4 ( 49.5- 55.4) 53.9 ( 50.9- 57.0) 54.3 ( 50.9- 58.0) 63.3 ( 59.3- 67.5) 47.4 ( 42.0- 53.4) 37.4 ( 33.2- 42.0)
Oklahoma
Texas
West 48.4 ( 47.6- 49.2) 47.8 ( 47.0- 48.6) 50.4 ( 49.6- 51.3) 52.0 ( 51.1- 52.9) 51.8 ( 47.7- 56.1) 38.1 ( 35.2- 41.2)
Mountain
Arizona 47.7 ( 45.1- 50.4) 52.0 ( 49.2- 55.0) 49.1 ( 46.4- 52.0) 56.8 ( 53.7- 60.1) 29.7 ( 16.7- 50.0) 18.6 ( 10.6- 30.2)
Colorado 40.7 ( 37.9- 43.7) 38.4 ( 35.7- 41.2) 40.9 ( 38.0- 43.9) 39.7 ( 36.9- 42.6) 48.0 ( 30.6- 72.4) 28.8 ( 18.6- 42.5)
Idaho 42.0 ( 37.0- 47.5) 41.5 ( 36.6- 46.9) 42.2 ( 37.2- 47.8) 42.3 ( 37.3- 47.8) ∼ ∼Montana 48.5 ( 42.6- 55.0) 55.7 ( 48.9- 63.1) 47.0 ( 41.1- 53.6) 56.3 ( 49.3- 64.0) ∼ ∼Nevada
New Mexico 36.3 ( 32.5- 40.6) 36.2 ( 32.4- 40.4) 38.6 ( 34.4- 43.2) 41.1 ( 36.7- 45.9) ∼ ∼Utah 22.4 ( 19.2- 25.8) 17.2 ( 14.9- 19.9) 22.5 ( 19.4- 26.1) 17.8 ( 15.3- 20.5) ∼ ∼Wyoming 46.5 ( 38.4- 56.0) 48.6 ( 40.2- 58.3) 45.9 ( 37.8- 55.6) 49.0 ( 40.4- 59.0) ∼ ∼
Pacific 50.9 ( 50.0- 51.9) 50.1 ( 49.2- 51.1) 53.9 ( 52.8- 54.9) 55.4 ( 54.3- 56.5) 54.1 ( 49.7- 58.7) 40.6 ( 37.4- 44.1)
Alaska 69.3 ( 57.0- 83.9) 42.5 ( 35.3- 50.6) 73.0 ( 58.7- 90.4) 46.7 ( 38.1- 56.7) ∼ ∼California 48.8 ( 47.7- 49.9) 47.2 ( 46.1- 48.2) 51.4 ( 50.1- 52.6) 52.2 ( 51.0- 53.5) 54.6 ( 50.0- 59.5) 42.3 ( 38.8- 46.1)
San Francisco-Oakland 49.6 ( 46.7- 52.6) 53.9 ( 50.7- 57.2) 54.4 ( 50.7- 58.2) 64.1 ( 59.9- 68.5) 55.7 ( 46.2- 66.9) 47.9 ( 39.8- 57.3)
San Jose-Monterey 44.5 ( 40.6- 48.7) 41.8 ( 38.2- 45.7) 45.8 ( 41.5- 50.5) 46.1 ( 41.8- 50.8) ∼ ∼Los Angeles 41.5 ( 39.6- 43.4) 38.7 ( 37.0- 40.5) 42.8 ( 40.6- 45.1) 41.1 ( 39.0- 43.3) 51.9 ( 45.6- 58.8) 45.4 ( 40.0- 51.4)
Hawaii 39.5 ( 34.9- 44.7) 44.9 ( 39.6- 50.6) 56.6 ( 44.9- 70.6) 54.0 ( 42.9- 67.0) ∼ ∼Oregon 60.8 ( 57.3- 64.4) 68.2 ( 64.3- 72.3) 61.6 ( 58.0- 65.4) 71.3 ( 67.2- 75.6) ∼ ∼Washington 58.5 ( 55.7- 61.3) 58.5 ( 55.7- 61.3) 60.1 ( 57.2- 63.1) 62.9 ( 59.9- 66.1) 52.8 ( 34.9- 77.7) 28.9 ( 19.2- 41.8)
Seattle-Puget Sound 63.3 ( 59.9- 67.0) 62.8 ( 59.4- 66.4) 66.3 ( 62.5- 70.2) 69.5 ( 65.6- 73.6) 54.2 ( 34.8- 81.9) 29.0 ( 18.8- 42.8)
∗ Data are from selected statewide and metropolitan area cancer registries that meet the following data quality criteria for all invasive cancer sites combined: case
ascertainment is at least 90% complete; ≥ 97% of cases pass a standard set of computerized edits; ≤ 5% of cases were ascertained by death certificate only; ≤ 3% of
cases are missing information on sex; ≤ 5% of cases are missing information on race; ≤ 3% of cases are missing information on age. See Appendix H for registry-specific
data quality information. U.S. rates cover approximately 78% of the U.S. population.
† Invasive cancers only
‡ Rates are per 100,000 persons. Population denominators for 1999 are projected from the 1990 census and may not accurately reflect the 1999 population size. Caution
should be used in interpreting rates based on these projected populations.
§ Rates are age-adjusted to the 2000 U.S. standard population.
∼ Rates are suppressed if fewer than 16 cases were reported in the specific area-race category.
Notes: Cases from suppressed rates are included in the U.S. and region/division rates. Observed region/division age-adjusted incidence rates are presented for
regions/divisions with ≥ 78% of the population covered by registries that meet the data quality criteria specified above, and if the 95% confidence intervals
around the observed region/division rates for each of four major cancers include "bias-corrected" estimated region/division rates (see technical notes) for
each of those cancers. U.S rates are as presented in Table 1.2. California, Washington, and Michigan state rates each include cases from the SEER metropolitan
areas.

United States C
ancer Statistics: 1999 Incidence
60
Table 2.10.1: Melanomas of the Skin. Invasive Cancer Incidence Rates by U.S. Census Region and Division, Stateand Metropolitan Area, and Race (All Races, White, Black), United States: SEER and NPCR Registries that MeetQuality Criteria∗†
Males, 1999
All Races White BlackAge-Adjusted Crude Age-Adjusted Crude Age-Adjusted Crude
Area Rate‡§ (CI) Rate‡ (CI) Rate‡§ (CI) Rate‡ (CI) Rate‡§ (CI) Rate‡ (CI)
United States 19.0 ( 18.7- 19.3) 17.6 ( 17.3- 17.8) 20.5 ( 20.2- 20.8) 19.9 ( 19.6- 20.2) 1.2 ( 1.0- 1.5) 0.8 ( 0.6- 1.0)
Northeast 16.7 ( 16.2- 17.2) 16.1 ( 15.6- 16.7) 18.3 ( 17.7- 18.9) 18.7 ( 18.1- 19.3) ∼ ∼New England 22.3 ( 21.0- 23.6) 21.4 ( 20.2- 22.6) 22.9 ( 21.6- 24.2) 22.8 ( 21.5- 24.2) ∼ ∼Connecticut 25.6 ( 23.1- 28.2) 25.1 ( 22.7- 27.7) 26.2 ( 23.6- 29.0) 26.8 ( 24.2- 29.7) ∼ ∼Maine
Massachusetts 19.7 ( 18.1- 21.4) 18.9 ( 17.4- 20.6) 20.2 ( 18.6- 22.0) 20.4 ( 18.7- 22.2) ∼ ∼New Hampshire 23.2 ( 19.2- 28.0) 20.8 ( 17.3- 24.8) 23.6 ( 19.5- 28.4) 21.3 ( 17.7- 25.4) ∼ ∼Rhode Island 25.6 ( 21.2- 30.8) 24.8 ( 20.5- 29.6) 26.8 ( 22.1- 32.2) 27.0 ( 22.3- 32.3) ∼ ∼Vermont
Middle Atlantic 15.0 ( 14.5- 15.6) 14.6 ( 14.0- 15.1) 16.8 ( 16.1- 17.5) 17.2 ( 16.6- 17.9) ∼ ∼New Jersey 19.1 ( 17.7- 20.6) 18.2 ( 16.9- 19.6) 22.3 ( 20.7- 24.0) 22.8 ( 21.2- 24.5) ∼ ∼New York 11.8 ( 11.1- 12.6) 11.1 ( 10.4- 11.8) 13.8 ( 12.9- 14.7) 13.9 ( 13.0- 14.8) ∼ ∼Pennsylvania 17.0 ( 15.9- 18.1) 17.3 ( 16.2- 18.4) 17.3 ( 16.2- 18.5) 18.3 ( 17.1- 19.5) ∼ ∼
Midwest
East North Central
Illinois 14.9 ( 13.9- 16.0) 13.4 ( 12.5- 14.3) 16.3 ( 15.1- 17.5) 15.4 ( 14.3- 16.5) ∼ ∼Indiana
Michigan 22.3 ( 20.9- 23.7) 20.2 ( 18.9- 21.5) 23.5 ( 22.0- 25.1) 22.3 ( 20.9- 23.8) ∼ ∼Detroit 20.6 ( 18.5- 22.9) 18.6 ( 16.7- 20.6) 25.2 ( 22.6- 28.1) 24.3 ( 21.8- 26.9) ∼ ∼
Ohio 16.6 ( 15.4- 17.7) 15.5 ( 14.5- 16.6) 16.4 ( 15.2- 17.6) 15.9 ( 14.8- 17.1) ∼ ∼Wisconsin 13.0 ( 11.6- 14.5) 12.3 ( 11.0- 13.7) 13.4 ( 12.0- 15.0) 13.2 ( 11.7- 14.7) ∼ ∼
West North Central 17.1 ( 16.2- 18.0) 16.0 ( 15.2- 16.9) 16.6 ( 15.8- 17.6) 16.1 ( 15.3- 17.0) ∼ ∼Iowa 20.1 ( 17.8- 22.6) 19.9 ( 17.6- 22.3) 18.9 ( 16.7- 21.4) 19.1 ( 16.8- 21.6) ∼ ∼Kansas 21.8 ( 19.2- 24.6) 20.0 ( 17.6- 22.6) 20.3 ( 17.8- 23.2) 19.2 ( 16.8- 21.8) ∼ ∼Minnesota 19.7 ( 17.8- 21.7) 18.0 ( 16.4- 19.8) 19.4 ( 17.6- 21.4) 18.4 ( 16.7- 20.3) ∼ ∼Missouri 12.4 ( 11.0- 13.8) 11.7 ( 10.4- 13.0) 13.3 ( 11.8- 14.9) 13.0 ( 11.6- 14.6) ∼ ∼Nebraska 14.6 ( 12.0- 17.6) 13.9 ( 11.4- 16.7) 11.4 ( 9.1- 14.2) 11.0 ( 8.8- 13.6) ∼ ∼North Dakota 10.5 ( 7.2- 14.9) 10.5 ( 7.2- 14.7) 10.8 ( 7.4- 15.3) 11.2 ( 7.7- 15.7) ∼ ∼South Dakota
South
South Atlantic
Delaware 16.0 ( 12.0- 21.2) 15.0 ( 11.3- 19.5) 18.1 ( 13.5- 24.1) 18.5 ( 13.8- 24.2) ∼ ∼District of Columbia 10.8 ( 7.1- 16.0) 11.1 ( 7.3- 16.1) 19.8 ( 11.4- 34.9) 19.0 ( 11.1- 30.5) ∼ ∼Florida 21.9 ( 20.8- 22.9) 24.6 ( 23.5- 25.8) 23.2 ( 22.1- 24.4) 28.3 ( 27.0- 29.7) ∼ ∼Georgia
Atlanta 21.8 ( 18.6- 25.5) 15.6 ( 13.5- 17.9) 26.0 ( 22.1- 30.5) 21.5 ( 18.5- 24.9) ∼ ∼Maryland 22.1 ( 20.1- 24.2) 19.3 ( 17.6- 21.1) 28.4 ( 25.8- 31.1) 27.4 ( 25.0- 30.0) ∼ ∼North Carolina 17.1 ( 15.7- 18.6) 15.5 ( 14.2- 16.8) 20.7 ( 19.0- 22.5) 20.1 ( 18.5- 21.8) ∼ ∼South Carolina 21.7 ( 19.5- 24.2) 19.6 ( 17.7- 21.7) 27.5 ( 24.7- 30.7) 27.3 ( 24.6- 30.3) ∼ ∼Virginia
West Virginia 19.2 ( 16.4- 22.3) 20.0 ( 17.1- 23.2) 17.5 ( 14.9- 20.6) 18.6 ( 15.8- 21.8) ∼ ∼East South Central
Alabama
Kentucky 22.4 ( 20.3- 24.8) 21.0 ( 19.0- 23.1) 22.2 ( 19.9- 24.6) 21.0 ( 18.9- 23.3) ∼ ∼Mississippi
Tennessee
continued

Cancer Incidence, by U
.S. Census R
egion and Division, State, and M
etropolitan Area
61
Table 2.10.1: Melanomas of the Skin. Invasive Cancer Incidence Rates by U.S. Census Region and Division, Stateand Metropolitan Area, and Race (All Races, White, Black), United States: SEER and NPCR Registries that MeetQuality Criteria∗† (continued)
Males, 1999
All Races White BlackAge-Adjusted Crude Age-Adjusted Crude Age-Adjusted Crude
Area Rate‡§ (CI) Rate‡ (CI) Rate‡§ (CI) Rate‡ (CI) Rate‡§ (CI) Rate‡ (CI)
West South Central
Arkansas
Louisiana 12.1 ( 10.5- 13.9) 10.2 ( 8.9- 11.6) 15.2 ( 13.1- 17.5) 14.4 ( 12.4- 16.5) ∼ ∼Oklahoma
Texas
West 22.1 ( 21.5- 22.7) 19.0 ( 18.5- 19.5) 24.1 ( 23.5- 24.8) 21.4 ( 20.9- 22.0) ∼ ∼Mountain
Arizona 20.1 ( 18.2- 22.1) 18.4 ( 16.7- 20.2) 20.9 ( 19.0- 23.1) 20.1 ( 18.2- 22.1) ∼ ∼Colorado 24.4 ( 22.0- 27.0) 21.1 ( 19.1- 23.2) 25.7 ( 23.2- 28.4) 22.7 ( 20.6- 25.0) ∼ ∼Idaho 24.0 ( 20.1- 28.6) 21.4 ( 18.0- 25.4) 24.5 ( 20.5- 29.2) 22.1 ( 18.5- 26.2) ∼ ∼Montana 13.3 ( 10.0- 17.4) 12.7 ( 9.6- 16.6) 11.8 ( 8.7- 15.9) 11.8 ( 8.7- 15.6) ∼ ∼Nevada
New Mexico 17.7 ( 14.8- 21.1) 15.8 ( 13.2- 18.7) 19.3 ( 16.1- 23.0) 18.3 ( 15.3- 21.6) ∼ ∼Utah 28.4 ( 24.6- 32.6) 20.4 ( 17.7- 23.3) 29.4 ( 25.5- 33.7) 21.4 ( 18.6- 24.5) ∼ ∼Wyoming 28.1 ( 21.4- 36.5) 25.7 ( 19.7- 33.0) 28.7 ( 21.8- 37.3) 26.7 ( 20.5- 34.3) ∼ ∼
Pacific 22.2 ( 21.5- 22.9) 18.9 ( 18.4- 19.5) 24.6 ( 23.8- 25.4) 21.7 ( 21.0- 22.4) ∼ ∼Alaska 14.4 ( 8.3- 24.6) 8.3 ( 5.5- 12.1) 15.2 ( 8.8- 27.0) 10.1 ( 6.5- 14.9) ∼ ∼California 22.1 ( 21.3- 22.9) 18.3 ( 17.7- 19.0) 24.4 ( 23.4- 25.3) 20.9 ( 20.1- 21.7) ∼ ∼
San Francisco-Oakland 19.0 ( 17.0- 21.2) 17.5 ( 15.7- 19.4) 24.9 ( 22.2- 27.8) 24.3 ( 21.8- 27.1) ∼ ∼San Jose-Monterey 20.3 ( 17.5- 23.5) 16.7 ( 14.4- 19.2) 20.5 ( 17.3- 24.1) 17.4 ( 14.8- 20.3) ∼ ∼Los Angeles 17.4 ( 16.0- 18.9) 13.5 ( 12.5- 14.6) 21.4 ( 19.7- 23.3) 16.8 ( 15.4- 18.2) ∼ ∼
Hawaii 19.6 ( 16.2- 23.6) 19.1 ( 15.8- 23.0) 55.2 ( 43.4- 69.4) 47.2 ( 37.5- 58.8) ∼ ∼Oregon 23.7 ( 21.4- 26.3) 23.2 ( 20.9- 25.7) 24.4 ( 21.9- 27.0) 24.4 ( 22.0- 27.0) ∼ ∼Washington 23.3 ( 21.5- 25.3) 21.2 ( 19.6- 23.0) 25.3 ( 23.3- 27.4) 23.8 ( 21.9- 25.8) ∼ ∼
Seattle-Puget Sound 23.4 ( 21.2- 25.9) 21.3 ( 19.3- 23.4) 25.7 ( 23.3- 28.4) 24.4 ( 22.1- 26.9) ∼ ∼∗ Data are from selected statewide and metropolitan area cancer registries that meet the following data quality criteria for all invasive cancer sites combined: case
ascertainment is at least 90% complete; ≥ 97% of cases pass a standard set of computerized edits; ≤ 5% of cases were ascertained by death certificate only; ≤ 3% of
cases are missing information on sex; ≤ 5% of cases are missing information on race; ≤ 3% of cases are missing information on age. See Appendix H for registry-specific
data quality information. U.S. rates cover approximately 78% of the U.S. population.
† Invasive cancers only
‡ Rates are per 100,000 persons. Population denominators for 1999 are projected from the 1990 census and may not accurately reflect the 1999 population size. Caution
should be used in interpreting rates based on these projected populations.
§ Rates are age-adjusted to the 2000 U.S. standard population.
∼ Rates are suppressed if fewer than 16 cases were reported in the specific area-race category.
Notes: Cases from suppressed rates are included in the U.S. and region/division rates. Observed region/division age-adjusted incidence rates are presented for
regions/divisions with ≥ 78% of the population covered by registries that meet the data quality criteria specified above, and if the 95% confidence intervals
around the observed region/division rates for each of four major cancers include "bias-corrected" estimated region/division rates (see technical notes) for
each of those cancers. U.S rates are as presented in Table 1.1. California, Washington, and Michigan state rates each include cases from the SEER metropolitan
areas.

United States C
ancer Statistics: 1999 Incidence
62
Table 2.10.2: Melanomas of the Skin. Invasive Cancer Incidence Rates by U.S. Census Region and Division, Stateand Metropolitan Area, and Race (All Races, White, Black), United States: SEER and NPCR Registries that MeetQuality Criteria∗†
Females, 1999
All Races White BlackAge-Adjusted Crude Age-Adjusted Crude Age-Adjusted Crude
Area Rate‡§ (CI) Rate‡ (CI) Rate‡§ (CI) Rate‡ (CI) Rate‡§ (CI) Rate‡ (CI)
United States 12.1 ( 11.9- 12.3) 12.7 ( 12.5- 12.9) 13.4 ( 13.1- 13.6) 14.4 ( 14.2- 14.7) 0.9 ( 0.7- 1.1) 0.7 ( 0.6- 0.9)
Northeast 10.4 ( 10.0- 10.7) 11.5 ( 11.0- 11.9) 11.6 ( 11.1- 12.0) 13.2 ( 12.8- 13.7) ∼ ∼New England 14.9 ( 14.0- 15.9) 16.2 ( 15.2- 17.2) 15.3 ( 14.3- 16.3) 17.0 ( 16.0- 18.2) ∼ ∼Connecticut 15.9 ( 14.1- 17.9) 17.3 ( 15.4- 19.4) 16.1 ( 14.2- 18.2) 18.0 ( 15.9- 20.3) ∼ ∼Maine
Massachusetts 13.9 ( 12.6- 15.2) 15.1 ( 13.8- 16.5) 14.3 ( 13.0- 15.7) 16.1 ( 14.7- 17.6) ∼ ∼New Hampshire 19.0 ( 15.7- 22.8) 19.7 ( 16.3- 23.6) 19.1 ( 15.8- 23.0) 20.0 ( 16.5- 23.9) ∼ ∼Rhode Island 12.9 ( 10.1- 16.3) 15.0 ( 11.8- 18.7) 13.6 ( 10.7- 17.3) 16.3 ( 12.8- 20.3) ∼ ∼Vermont
Middle Atlantic 9.0 ( 8.6- 9.4) 10.0 ( 9.6- 10.5) 10.3 ( 9.9- 10.8) 11.9 ( 11.4- 12.5) ∼ ∼New Jersey 11.5 ( 10.6- 12.6) 12.8 ( 11.7- 13.9) 13.8 ( 12.6- 15.0) 15.9 ( 14.6- 17.3) ∼ ∼New York 7.3 ( 6.8- 7.8) 8.0 ( 7.4- 8.6) 8.8 ( 8.1- 9.4) 10.0 ( 9.3- 10.8) ∼ ∼Pennsylvania 9.9 ( 9.2- 10.7) 11.3 ( 10.5- 12.2) 10.3 ( 9.5- 11.1) 12.0 ( 11.1- 13.0) ∼ ∼
Midwest
East North Central
Illinois 8.7 ( 8.0- 9.4) 9.0 ( 8.3- 9.8) 9.9 ( 9.1- 10.8) 10.6 ( 9.7- 11.6) ∼ ∼Indiana
Michigan 15.3 ( 14.2- 16.4) 15.7 ( 14.6- 16.8) 16.7 ( 15.5- 17.9) 17.6 ( 16.3- 18.9) ∼ ∼Detroit 13.3 ( 11.8- 14.9) 13.9 ( 12.4- 15.6) 17.1 ( 15.1- 19.2) 18.6 ( 16.5- 20.9) ∼ ∼
Ohio 11.0 ( 10.2- 11.9) 11.6 ( 10.8- 12.6) 11.3 ( 10.4- 12.2) 12.1 ( 11.2- 13.1) ∼ ∼Wisconsin 9.1 ( 8.0- 10.3) 9.4 ( 8.3- 10.6) 9.4 ( 8.2- 10.6) 9.9 ( 8.7- 11.3) ∼ ∼
West North Central 11.9 ( 11.2- 12.6) 12.5 ( 11.8- 13.3) 11.6 ( 10.9- 12.4) 12.5 ( 11.7- 13.2) ∼ ∼Iowa 14.2 ( 12.4- 16.2) 15.5 ( 13.5- 17.6) 13.4 ( 11.7- 15.5) 14.9 ( 13.0- 17.1) ∼ ∼Kansas 12.4 ( 10.6- 14.4) 13.1 ( 11.3- 15.2) 11.2 ( 9.5- 13.2) 12.2 ( 10.3- 14.3) ∼ ∼Minnesota 15.6 ( 14.1- 17.3) 15.9 ( 14.4- 17.6) 15.4 ( 13.9- 17.1) 16.0 ( 14.4- 17.8) ∼ ∼Missouri 7.4 ( 6.5- 8.5) 8.0 ( 7.0- 9.1) 7.9 ( 6.9- 9.1) 8.8 ( 7.7- 10.0) ∼ ∼Nebraska 13.9 ( 11.5- 16.7) 14.0 ( 11.6- 16.7) 11.5 ( 9.2- 14.1) 11.7 ( 9.4- 14.3) ∼ ∼North Dakota 6.5 ( 4.0- 10.1) 6.9 ( 4.3- 10.5) 6.5 ( 4.0- 10.3) 7.0 ( 4.4- 10.8) ∼ ∼South Dakota
South
South Atlantic
Delaware 10.7 ( 7.7- 14.5) 11.1 ( 8.0- 15.0) 12.2 ( 8.7- 16.8) 13.4 ( 9.6- 18.2) ∼ ∼District of Columbia 5.9 ( 3.6- 9.7) 7.2 ( 4.4- 11.1) ∼ ∼ ∼ ∼Florida 12.3 ( 11.6- 13.1) 14.6 ( 13.7- 15.4) 13.5 ( 12.7- 14.4) 16.7 ( 15.7- 17.8) ∼ ∼Georgia
Atlanta 10.9 ( 9.1- 13.0) 10.2 ( 8.6- 12.0) 14.1 ( 11.8- 16.9) 14.4 ( 12.0- 17.1) ∼ ∼Maryland 14.4 ( 13.1- 16.0) 14.9 ( 13.5- 16.5) 20.0 ( 18.0- 22.1) 21.7 ( 19.6- 24.0) ∼ ∼North Carolina 11.3 ( 10.3- 12.3) 11.7 ( 10.7- 12.8) 14.0 ( 12.7- 15.4) 15.2 ( 13.8- 16.6) ∼ ∼South Carolina 13.2 ( 11.7- 14.8) 13.7 ( 12.1- 15.4) 17.5 ( 15.5- 19.9) 19.0 ( 16.8- 21.5) ∼ ∼Virginia
West Virginia 11.5 ( 9.5- 13.9) 12.8 ( 10.6- 15.3) 10.4 ( 8.5- 12.7) 11.7 ( 9.5- 14.1) ∼ ∼East South Central
Alabama
Kentucky 16.4 ( 14.7- 18.3) 17.2 ( 15.4- 19.1) 16.5 ( 14.7- 18.4) 17.4 ( 15.6- 19.4) ∼ ∼Mississippi
Tennessee
continued

Cancer Incidence, by U
.S. Census R
egion and Division, State, and M
etropolitan Area
63
Table 2.10.2: Melanomas of the Skin. Invasive Cancer Incidence Rates by U.S. Census Region and Division, Stateand Metropolitan Area, and Race (All Races, White, Black), United States: SEER and NPCR Registries that MeetQuality Criteria∗† (continued)
Females, 1999
All Races White BlackAge-Adjusted Crude Age-Adjusted Crude Age-Adjusted Crude
Area Rate‡§ (CI) Rate‡ (CI) Rate‡§ (CI) Rate‡ (CI) Rate‡§ (CI) Rate‡ (CI)
West South Central
Arkansas
Louisiana 6.5 ( 5.5- 7.7) 6.6 ( 5.6- 7.7) 9.1 ( 7.7- 10.7) 9.8 ( 8.3- 11.5) ∼ ∼Oklahoma
Texas
West 14.4 ( 14.0- 14.9) 14.3 ( 13.8- 14.7) 15.8 ( 15.4- 16.3) 15.9 ( 15.4- 16.4) 1.3 ( 0.8- 2.1) 1.2 ( 0.7- 1.8)
Mountain
Arizona 12.4 ( 11.0- 13.9) 12.5 ( 11.1- 14.0) 13.6 ( 12.0- 15.2) 14.0 ( 12.5- 15.7) ∼ ∼Colorado 16.9 ( 15.2- 18.8) 17.0 ( 15.3- 18.9) 18.0 ( 16.1- 20.0) 18.3 ( 16.4- 20.3) ∼ ∼Idaho 15.8 ( 12.8- 19.4) 15.3 ( 12.4- 18.7) 16.3 ( 13.2- 19.9) 15.8 ( 12.8- 19.3) ∼ ∼Montana 9.5 ( 6.8- 12.9) 9.7 ( 7.0- 13.1) 8.9 ( 6.2- 12.4) 9.3 ( 6.6- 12.7) ∼ ∼Nevada
New Mexico 9.8 ( 7.8- 12.1) 9.6 ( 7.7- 11.9) 10.6 ( 8.5- 13.3) 10.8 ( 8.6- 13.4) ∼ ∼Utah 17.5 ( 14.8- 20.5) 14.6 ( 12.4- 17.1) 18.3 ( 15.5- 21.4) 15.4 ( 13.1- 18.0) ∼ ∼Wyoming 12.5 ( 8.4- 18.0) 13.0 ( 8.8- 18.5) 12.9 ( 8.7- 18.6) 13.6 ( 9.2- 19.3) ∼ ∼
Pacific 14.6 ( 14.1- 15.1) 14.4 ( 13.9- 15.0) 16.3 ( 15.7- 16.9) 16.3 ( 15.7- 16.9) 1.2 ( 0.7- 2.1) 1.1 ( 0.7- 1.8)
Alaska 7.2 ( 4.2- 12.5) 6.5 ( 3.9- 10.1) 9.1 ( 5.3- 16.0) 8.7 ( 5.2- 13.6) ∼ ∼California 13.9 ( 13.3- 14.5) 13.5 ( 13.0- 14.1) 15.2 ( 14.5- 15.9) 15.1 ( 14.4- 15.8) ∼ ∼
San Francisco-Oakland 13.3 ( 11.8- 14.9) 14.2 ( 12.6- 15.9) 18.4 ( 16.3- 20.8) 20.2 ( 17.9- 22.8) ∼ ∼San Jose-Monterey 14.5 ( 12.4- 17.0) 14.2 ( 12.1- 16.5) 13.6 ( 11.2- 16.2) 13.6 ( 11.3- 16.3) ∼ ∼Los Angeles 11.0 ( 10.1- 12.0) 10.5 ( 9.6- 11.4) 13.8 ( 12.6- 15.2) 13.1 ( 11.9- 14.4) ∼ ∼
Hawaii 9.7 ( 7.4- 12.6) 10.3 ( 7.9- 13.3) 26.9 ( 19.3- 36.9) 27.7 ( 19.9- 37.4) ∼ ∼Oregon 16.5 ( 14.7- 18.6) 17.4 ( 15.5- 19.5) 16.6 ( 14.7- 18.7) 17.7 ( 15.7- 19.9) ∼ ∼Washington 19.4 ( 17.8- 21.0) 19.6 ( 18.0- 21.3) 21.3 ( 19.5- 23.1) 21.9 ( 20.2- 23.8) ∼ ∼
Seattle-Puget Sound 18.9 ( 17.0- 20.9) 19.2 ( 17.4- 21.3) 20.9 ( 18.9- 23.2) 21.9 ( 19.7- 24.2) ∼ ∼∗ Data are from selected statewide and metropolitan area cancer registries that meet the following data quality criteria for all invasive cancer sites combined: case
ascertainment is at least 90% complete; ≥ 97% of cases pass a standard set of computerized edits; ≤ 5% of cases were ascertained by death certificate only; ≤ 3% of
cases are missing information on sex; ≤ 5% of cases are missing information on race; ≤ 3% of cases are missing information on age. See Appendix H for registry-specific
data quality information. U.S. rates cover approximately 78% of the U.S. population.
† Invasive cancers only
‡ Rates are per 100,000 persons. Population denominators for 1999 are projected from the 1990 census and may not accurately reflect the 1999 population size. Caution
should be used in interpreting rates based on these projected populations.
§ Rates are age-adjusted to the 2000 U.S. standard population.
∼ Rates are suppressed if fewer than 16 cases were reported in the specific area-race category.
Notes: Cases from suppressed rates are included in the U.S. and region/division rates. Observed region/division age-adjusted incidence rates are presented for
regions/divisions with ≥ 78% of the population covered by registries that meet the data quality criteria specified above, and if the 95% confidence intervals
around the observed region/division rates for each of four major cancers include "bias-corrected" estimated region/division rates (see technical notes) for
each of those cancers. U.S rates are as presented in Table 1.2. California, Washington, and Michigan state rates each include cases from the SEER metropolitan
areas.

United States C
ancer Statistics: 1999 Incidence
64
Table 2.11: Cancer of the Breast. Invasive Cancer Incidence Rates by U.S. Census Region and Division, State andMetropolitan Area, and Race (All Races, White, Black), United States: SEER and NPCR Registries that Meet QualityCriteria∗†
Females, 1999
All Races White BlackAge-Adjusted Crude Age-Adjusted Crude Age-Adjusted Crude
Area Rate‡§ (CI) Rate‡ (CI) Rate‡§ (CI) Rate‡ (CI) Rate‡§ (CI) Rate‡ (CI)
United States 134.1 (133.4- 134.8) 143.2 (142.5-143.9) 136.3 (135.5- 137.0) 152.7 (151.9-153.5) 112.7 (110.7- 114.7) 94.9 ( 93.3- 96.6)
Northeast 136.1 (134.8- 137.5) 153.6 (152.1-155.1) 138.5 (137.0- 140.0) 164.1 (162.4-165.8) 101.9 ( 98.3- 105.7) 90.9 ( 87.7- 94.2)
New England 145.1 (142.2- 148.1) 160.7 (157.5-163.9) 145.1 (142.1- 148.2) 167.0 (163.6-170.5) 107.3 ( 95.5- 120.2) 79.9 ( 71.4- 89.2)
Connecticut 150.1 (144.6- 155.8) 169.6 (163.5-176.0) 149.3 (143.5- 155.3) 176.3 (169.6-183.2) 121.8 (103.2- 143.2) 98.4 ( 83.7-114.9)
Maine
Massachusetts 144.7 (140.7- 148.7) 160.3 (156.0-164.8) 145.1 (141.0- 149.4) 168.1 (163.4-172.9) 94.4 ( 79.0- 112.4) 67.4 ( 56.7- 79.6)
New Hampshire 137.9 (128.7- 147.6) 138.6 (129.4-148.3) 136.3 (127.1- 146.1) 138.1 (128.9-147.9) ∼ ∼Rhode Island 139.7 (130.1- 150.0) 159.6 (148.9-170.9) 142.1 (132.1- 152.8) 168.0 (156.5-180.1) 133.0 ( 76.9- 226.3) 77.6 ( 47.4-119.9)
Vermont
Middle Atlantic 133.5 (132.0- 135.1) 151.4 (149.7-153.1) 136.3 (134.7- 138.0) 163.1 (161.1-165.1) 101.4 ( 97.6- 105.3) 92.4 ( 88.9- 95.9)
New Jersey 139.6 (136.2- 143.0) 155.4 (151.7-159.2) 145.8 (142.0- 149.7) 172.6 (168.1-177.1) 109.0 (100.3- 118.4) 94.2 ( 86.7-102.1)
New York 128.7 (126.5- 130.9) 141.8 (139.5-144.3) 132.7 (130.2- 135.2) 155.1 (152.3-158.1) 90.1 ( 85.4- 94.9) 82.9 ( 78.7- 87.3)
Pennsylvania 136.2 (133.5- 138.9) 163.3 (160.1-166.5) 135.1 (132.3- 138.0) 167.7 (164.3-171.1) 125.1 (116.1- 134.6) 116.7 (108.3-125.5)
Midwest
East North Central
Illinois 136.6 (133.7- 139.5) 142.9 (140.0-145.9) 137.0 (133.9- 140.2) 150.6 (147.2-154.0) 122.2 (114.7- 130.1) 102.4 ( 96.1-108.9)
Indiana
Michigan 131.6 (128.5- 134.7) 137.8 (134.6-141.1) 132.8 (129.5- 136.2) 145.3 (141.7-149.0) 121.7 (113.3- 130.7) 103.4 ( 96.2-110.9)
Detroit 129.9 (125.3- 134.7) 139.0 (134.0-144.1) 131.8 (126.4- 137.3) 150.9 (144.8-157.2) 125.0 (115.2- 135.4) 111.6 (102.9-120.8)
Ohio 135.8 (132.9- 138.7) 148.5 (145.4-151.7) 134.3 (131.3- 137.4) 151.9 (148.5-155.3) 117.9 (109.4- 127.0) 103.4 ( 96.0-111.3)
Wisconsin 132.8 (128.6- 137.1) 142.3 (137.8-146.9) 132.2 (127.9- 136.7) 147.4 (142.6-152.3) 140.8 (116.7- 169.7) 89.0 ( 74.7-105.3)
West North Central 133.1 (130.8- 135.4) 144.1 (141.6-146.5) 132.9 (130.6- 135.3) 148.5 (145.9-151.2) 120.5 (110.1- 131.6) 92.7 ( 84.8-101.2)
Iowa 132.3 (126.8- 138.1) 153.2 (146.9-159.6) 132.8 (127.2- 138.6) 156.2 (149.8-162.8) 127.3 ( 81.7- 191.2) 88.8 ( 57.5-131.1)
Kansas 135.8 (129.8- 142.0) 145.7 (139.3-152.3) 134.6 (128.4- 141.0) 148.6 (141.8-155.5) 110.9 ( 86.1- 141.1) 87.7 ( 68.2-110.9)
Minnesota 140.1 (135.4- 144.9) 143.9 (139.2-148.8) 139.5 (134.8- 144.4) 148.9 (144.0-154.1) 107.0 ( 74.1- 152.4) 55.5 ( 39.6- 75.5)
Missouri 127.7 (123.7- 131.8) 138.9 (134.6-143.3) 127.5 (123.3- 131.8) 144.2 (139.5-149.1) 125.1 (112.2- 139.2) 104.3 ( 93.6-116.0)
Nebraska 130.4 (123.0- 138.1) 142.9 (135.0-151.2) 129.9 (122.4- 137.7) 146.2 (137.9-154.8) 112.9 ( 74.2- 167.2) 80.0 ( 53.2-115.6)
North Dakota 130.3 (118.4- 143.1) 144.6 (131.7-158.4) 130.8 (118.7- 144.0) 150.3 (136.7-164.9) ∼ ∼South Dakota
South
South Atlantic
Delaware 138.0 (126.8- 150.0) 145.5 (133.8-158.1) 137.9 (125.6- 151.2) 157.3 (143.4-172.2) 127.8 (100.6- 161.1) 100.9 ( 79.9-125.8)
District of Columbia 138.0 (125.3- 152.0) 157.0 (142.6-172.5) 162.8 (137.9- 193.2) 167.5 (142.3-196.0) 126.3 (111.3- 143.4) 150.4 (132.7-169.8)
Florida 132.9 (130.5- 135.2) 166.3 (163.4-169.1) 136.5 (134.0- 139.1) 184.9 (181.6-188.2) 100.3 ( 93.8- 107.2) 76.4 ( 71.6- 81.5)
Georgia
Atlanta 141.3 (134.4- 148.4) 119.4 (113.7-125.3) 139.8 (131.9- 148.1) 133.8 (126.2-141.7) 144.2 (129.8- 159.9) 94.3 ( 85.5-103.7)
Maryland 137.0 (132.6- 141.5) 139.6 (135.2-144.2) 139.6 (134.4- 144.9) 155.3 (149.6-161.2) 127.7 (118.9- 137.1) 106.9 ( 99.7-114.4)
North Carolina 123.2 (119.8- 126.6) 131.0 (127.5-134.7) 125.8 (122.0- 129.7) 143.2 (138.9-147.6) 110.9 (103.6- 118.5) 97.4 ( 91.1-104.1)
South Carolina 125.6 (120.9- 130.5) 132.7 (127.7-137.8) 127.2 (121.7- 133.0) 147.2 (140.8-153.8) 114.9 (105.9- 124.4) 99.6 ( 91.9-107.8)
Virginia
West Virginia 123.5 (117.0- 130.3) 149.9 (142.1-157.9) 122.7 (116.1- 129.5) 149.8 (141.9-158.0) 116.5 ( 81.7- 162.5) 126.7 ( 89.6-173.9)
East South Central
Alabama
Kentucky 126.8 (122.1- 131.6) 136.7 (131.7-141.9) 125.7 (120.9- 130.7) 138.1 (132.9-143.6) 126.8 (108.1- 147.8) 110.0 ( 93.9-128.0)
Mississippi
Tennessee
continued
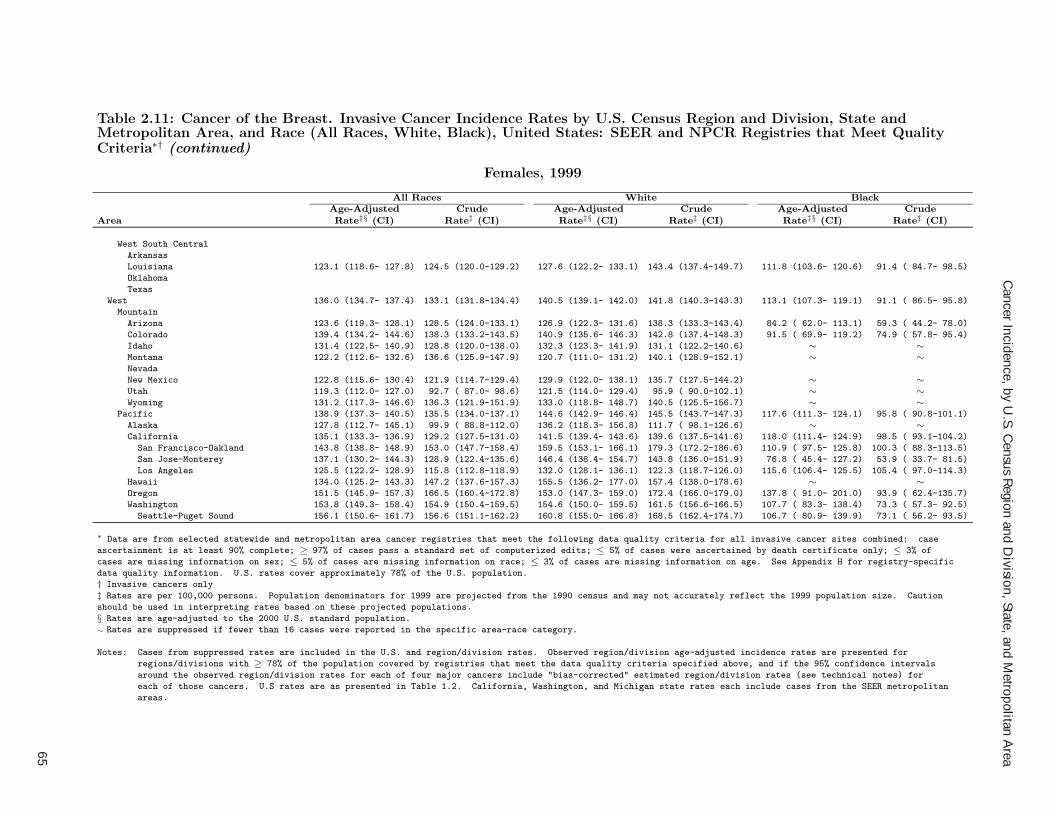
Cancer Incidence, by U
.S. Census R
egion and Division, State, and M
etropolitan Area
65
Table 2.11: Cancer of the Breast. Invasive Cancer Incidence Rates by U.S. Census Region and Division, State andMetropolitan Area, and Race (All Races, White, Black), United States: SEER and NPCR Registries that Meet QualityCriteria∗† (continued)
Females, 1999
All Races White BlackAge-Adjusted Crude Age-Adjusted Crude Age-Adjusted Crude
Area Rate‡§ (CI) Rate‡ (CI) Rate‡§ (CI) Rate‡ (CI) Rate‡§ (CI) Rate‡ (CI)
West South Central
Arkansas
Louisiana 123.1 (118.6- 127.8) 124.5 (120.0-129.2) 127.6 (122.2- 133.1) 143.4 (137.4-149.7) 111.8 (103.6- 120.6) 91.4 ( 84.7- 98.5)
Oklahoma
Texas
West 136.0 (134.7- 137.4) 133.1 (131.8-134.4) 140.5 (139.1- 142.0) 141.8 (140.3-143.3) 113.1 (107.3- 119.1) 91.1 ( 86.5- 95.8)
Mountain
Arizona 123.6 (119.3- 128.1) 128.5 (124.0-133.1) 126.9 (122.3- 131.6) 138.3 (133.3-143.4) 84.2 ( 62.0- 113.1) 59.3 ( 44.2- 78.0)
Colorado 139.4 (134.2- 144.6) 138.3 (133.2-143.5) 140.9 (135.6- 146.3) 142.8 (137.4-148.3) 91.5 ( 69.9- 119.2) 74.9 ( 57.8- 95.4)
Idaho 131.4 (122.5- 140.9) 128.8 (120.0-138.0) 132.3 (123.3- 141.9) 131.1 (122.2-140.6) ∼ ∼Montana 122.2 (112.6- 132.6) 136.6 (125.9-147.9) 120.7 (111.0- 131.2) 140.1 (128.9-152.1) ∼ ∼Nevada
New Mexico 122.8 (115.6- 130.4) 121.9 (114.7-129.4) 129.9 (122.0- 138.1) 135.7 (127.5-144.2) ∼ ∼Utah 119.3 (112.0- 127.0) 92.7 ( 87.0- 98.6) 121.5 (114.0- 129.4) 95.9 ( 90.0-102.1) ∼ ∼Wyoming 131.2 (117.3- 146.6) 136.3 (121.9-151.9) 133.0 (118.8- 148.7) 140.5 (125.5-156.7) ∼ ∼
Pacific 138.9 (137.3- 140.5) 135.5 (134.0-137.1) 144.6 (142.9- 146.4) 145.5 (143.7-147.3) 117.6 (111.3- 124.1) 95.8 ( 90.8-101.1)
Alaska 127.8 (112.7- 145.1) 99.9 ( 88.8-112.0) 136.2 (118.3- 156.8) 111.7 ( 98.1-126.6) ∼ ∼California 135.1 (133.3- 136.9) 129.2 (127.5-131.0) 141.5 (139.4- 143.6) 139.6 (137.5-141.6) 118.0 (111.4- 124.9) 98.5 ( 93.1-104.2)
San Francisco-Oakland 143.8 (138.8- 148.9) 153.0 (147.7-158.4) 159.5 (153.1- 166.1) 179.3 (172.2-186.6) 110.9 ( 97.5- 125.8) 100.3 ( 88.3-113.5)
San Jose-Monterey 137.1 (130.2- 144.3) 128.9 (122.4-135.6) 146.4 (138.4- 154.7) 143.8 (136.0-151.9) 76.8 ( 45.4- 127.2) 53.9 ( 33.7- 81.5)
Los Angeles 125.5 (122.2- 128.9) 115.8 (112.8-118.9) 132.0 (128.1- 136.1) 122.3 (118.7-126.0) 115.6 (106.4- 125.5) 105.4 ( 97.0-114.3)
Hawaii 134.0 (125.2- 143.3) 147.2 (137.6-157.3) 155.5 (136.2- 177.0) 157.4 (138.0-178.6) ∼ ∼Oregon 151.5 (145.9- 157.3) 166.5 (160.4-172.8) 153.0 (147.3- 159.0) 172.4 (166.0-179.0) 137.8 ( 91.0- 201.0) 93.9 ( 62.4-135.7)
Washington 153.8 (149.3- 158.4) 154.9 (150.4-159.5) 154.6 (150.0- 159.5) 161.5 (156.6-166.5) 107.7 ( 83.3- 138.4) 73.3 ( 57.3- 92.5)
Seattle-Puget Sound 156.1 (150.6- 161.7) 156.6 (151.1-162.2) 160.8 (155.0- 166.8) 168.5 (162.4-174.7) 106.7 ( 80.9- 139.9) 73.1 ( 56.2- 93.5)
∗ Data are from selected statewide and metropolitan area cancer registries that meet the following data quality criteria for all invasive cancer sites combined: case
ascertainment is at least 90% complete; ≥ 97% of cases pass a standard set of computerized edits; ≤ 5% of cases were ascertained by death certificate only; ≤ 3% of
cases are missing information on sex; ≤ 5% of cases are missing information on race; ≤ 3% of cases are missing information on age. See Appendix H for registry-specific
data quality information. U.S. rates cover approximately 78% of the U.S. population.
† Invasive cancers only
‡ Rates are per 100,000 persons. Population denominators for 1999 are projected from the 1990 census and may not accurately reflect the 1999 population size. Caution
should be used in interpreting rates based on these projected populations.
§ Rates are age-adjusted to the 2000 U.S. standard population.
∼ Rates are suppressed if fewer than 16 cases were reported in the specific area-race category.
Notes: Cases from suppressed rates are included in the U.S. and region/division rates. Observed region/division age-adjusted incidence rates are presented for
regions/divisions with ≥ 78% of the population covered by registries that meet the data quality criteria specified above, and if the 95% confidence intervals
around the observed region/division rates for each of four major cancers include "bias-corrected" estimated region/division rates (see technical notes) for
each of those cancers. U.S rates are as presented in Table 1.2. California, Washington, and Michigan state rates each include cases from the SEER metropolitan
areas.

United States C
ancer Statistics: 1999 Incidence
66
Table 2.12: Cancer of the Breast. In Situ Cancer Incidence Rates by U.S. Census Region and Division, State andMetropolitan Area, and Race (All Races, White, Black), United States: SEER and NPCR Registries that Meet QualityCriteria∗†
Females, 1999
All Races White BlackAge-Adjusted Crude Age-Adjusted Crude Age-Adjusted Crude
Area Rate‡§ (CI) Rate‡ (CI) Rate‡§ (CI) Rate‡ (CI) Rate‡§ (CI) Rate‡ (CI)
United States 28.8 ( 28.5- 29.1) 30.1 ( 29.8- 30.4) 29.3 ( 28.9- 29.6) 31.7 ( 31.4- 32.1) 22.5 ( 21.6- 23.4) 18.8 ( 18.1- 19.6)
Northeast 34.4 ( 33.7- 35.1) 37.4 ( 36.6- 38.1) 35.1 ( 34.4- 35.9) 39.5 ( 38.7- 40.4) 24.0 ( 22.3- 25.8) 21.4 ( 19.9- 23.0)
New England 43.1 ( 41.5- 44.8) 45.7 ( 44.0- 47.5) 43.0 ( 41.3- 44.7) 47.1 ( 45.3- 49.0) 27.0 ( 21.4- 33.8) 20.5 ( 16.3- 25.5)
Connecticut 40.2 ( 37.3- 43.3) 43.5 ( 40.4- 46.8) 40.1 ( 37.0- 43.3) 45.0 ( 41.7- 48.6) 30.9 ( 22.2- 42.5) 26.0 ( 18.7- 35.1)
Maine
Massachusetts 47.0 ( 44.7- 49.4) 49.7 ( 47.3- 52.2) 46.7 ( 44.3- 49.2) 51.2 ( 48.6- 53.9) 26.2 ( 18.4- 36.7) 18.3 ( 13.0- 25.1)
New Hampshire 36.4 ( 31.7- 41.5) 36.5 ( 31.8- 41.6) 36.3 ( 31.6- 41.5) 36.6 ( 31.9- 41.8) ∼ ∼Rhode Island 35.8 ( 30.9- 41.2) 39.1 ( 33.9- 44.9) 37.1 ( 32.0- 43.0) 41.8 ( 36.2- 48.1) ∼ ∼Vermont
Middle Atlantic 31.8 ( 31.1- 32.6) 34.8 ( 34.0- 35.7) 32.5 ( 31.7- 33.4) 37.0 ( 36.0- 37.9) 23.6 ( 21.8- 25.5) 21.5 ( 19.9- 23.3)
New Jersey 34.4 ( 32.7- 36.2) 37.0 ( 35.2- 38.9) 36.9 ( 35.0- 39.0) 41.6 ( 39.5- 43.9) 23.0 ( 19.2- 27.6) 20.2 ( 16.8- 24.0)
New York 31.2 ( 30.1- 32.3) 33.4 ( 32.2- 34.6) 32.1 ( 30.8- 33.4) 35.7 ( 34.3- 37.1) 20.4 ( 18.2- 22.8) 18.7 ( 16.7- 20.8)
Pennsylvania 31.0 ( 29.7- 32.3) 35.5 ( 34.0- 37.0) 30.4 ( 29.0- 31.8) 35.8 ( 34.2- 37.4) 33.1 ( 28.5- 38.1) 30.8 ( 26.6- 35.5)
Midwest
East North Central
Illinois 27.0 ( 25.7- 28.3) 27.6 ( 26.3- 28.9) 27.3 ( 25.9- 28.7) 29.0 ( 27.5- 30.5) 19.5 ( 16.6- 22.9) 16.3 ( 13.9- 19.0)
Indiana
Michigan 32.0 ( 30.5- 33.6) 32.8 ( 31.3- 34.5) 32.2 ( 30.5- 33.9) 34.2 ( 32.5- 36.1) 30.7 ( 26.5- 35.3) 26.0 ( 22.5- 30.0)
Detroit 39.4 ( 36.9- 42.1) 41.5 ( 38.8- 44.3) 40.6 ( 37.6- 43.8) 45.1 ( 41.8- 48.6) 34.4 ( 29.4- 40.1) 30.7 ( 26.3- 35.7)
Ohio 27.5 ( 26.2- 28.8) 29.4 ( 28.0- 30.8) 27.3 ( 26.0- 28.8) 30.0 ( 28.5- 31.5) 22.2 ( 18.5- 26.3) 19.3 ( 16.2- 22.9)
Wisconsin 26.9 ( 25.0- 28.9) 27.7 ( 25.8- 29.8) 27.0 ( 25.0- 29.1) 28.7 ( 26.6- 30.9) 26.5 ( 16.9- 41.1) 17.0 ( 11.1- 24.9)
West North Central 24.6 ( 23.7- 25.7) 25.7 ( 24.7- 26.8) 24.9 ( 23.9- 25.9) 26.8 ( 25.7- 27.9) 14.3 ( 10.9- 18.5) 11.0 ( 8.4- 14.2)
Iowa 25.8 ( 23.3- 28.4) 28.4 ( 25.7- 31.3) 26.2 ( 23.8- 28.9) 29.4 ( 26.6- 32.3) ∼ ∼Kansas 23.1 ( 20.6- 25.8) 23.7 ( 21.1- 26.4) 22.4 ( 19.9- 25.2) 23.6 ( 21.0- 26.5) ∼ ∼Minnesota 28.7 ( 26.6- 30.9) 28.6 ( 26.5- 30.8) 28.4 ( 26.3- 30.7) 29.4 ( 27.2- 31.7) ∼ ∼Missouri 21.6 ( 20.0- 23.3) 23.1 ( 21.3- 24.9) 22.2 ( 20.5- 24.1) 24.5 ( 22.6- 26.6) 15.5 ( 11.2- 21.1) 13.1 ( 9.5- 17.6)
Nebraska 25.3 ( 22.1- 28.9) 26.2 ( 22.9- 29.9) 25.9 ( 22.5- 29.6) 27.4 ( 23.9- 31.3) ∼ ∼North Dakota 21.1 ( 16.5- 26.7) 22.9 ( 18.0- 28.8) 21.5 ( 16.7- 27.3) 24.2 ( 18.9- 30.4) ∼ ∼South Dakota
South
South Atlantic
Delaware 39.3 ( 33.4- 46.0) 40.6 ( 34.5- 47.5) 40.8 ( 34.1- 48.5) 44.8 ( 37.6- 53.1) 29.6 ( 17.6- 48.1) 24.3 ( 14.6- 37.9)
District of Columbia 29.0 ( 23.3- 36.0) 32.8 ( 26.4- 40.3) 36.5 ( 25.2- 54.1) 36.5 ( 25.3- 51.0) 23.1 ( 17.1- 31.3) 28.7 ( 21.3- 37.8)
Florida 27.3 ( 26.2- 28.4) 33.0 ( 31.7- 34.3) 28.3 ( 27.2- 29.6) 36.6 ( 35.1- 38.1) 18.8 ( 16.0- 21.9) 14.4 ( 12.4- 16.7)
Georgia
Atlanta 30.7 ( 27.5- 34.1) 25.9 ( 23.3- 28.8) 31.8 ( 28.0- 35.9) 30.4 ( 26.8- 34.3) 29.2 ( 22.9- 36.9) 18.8 ( 15.0- 23.3)
Maryland 32.8 ( 30.7- 35.0) 33.3 ( 31.1- 35.6) 33.0 ( 30.5- 35.7) 36.0 ( 33.3- 38.9) 29.8 ( 25.6- 34.6) 24.8 ( 21.4- 28.6)
North Carolina 25.4 ( 23.9- 27.0) 26.7 ( 25.1- 28.4) 26.6 ( 24.8- 28.4) 29.8 ( 27.8- 31.8) 20.8 ( 17.7- 24.3) 18.0 ( 15.3- 21.0)
South Carolina 23.4 ( 21.4- 25.6) 24.7 ( 22.6- 26.9) 24.2 ( 21.8- 26.8) 27.6 ( 24.8- 30.5) 21.6 ( 17.7- 26.0) 18.1 ( 14.9- 21.8)
Virginia
West Virginia 24.3 ( 21.5- 27.5) 28.8 ( 25.5- 32.5) 24.3 ( 21.4- 27.5) 29.1 ( 25.7- 32.9) ∼ ∼East South Central
Alabama
Kentucky 22.8 ( 20.8- 24.9) 24.3 ( 22.2- 26.5) 23.2 ( 21.1- 25.4) 25.2 ( 22.9- 27.5) ∼ ∼Mississippi
Tennessee
continued
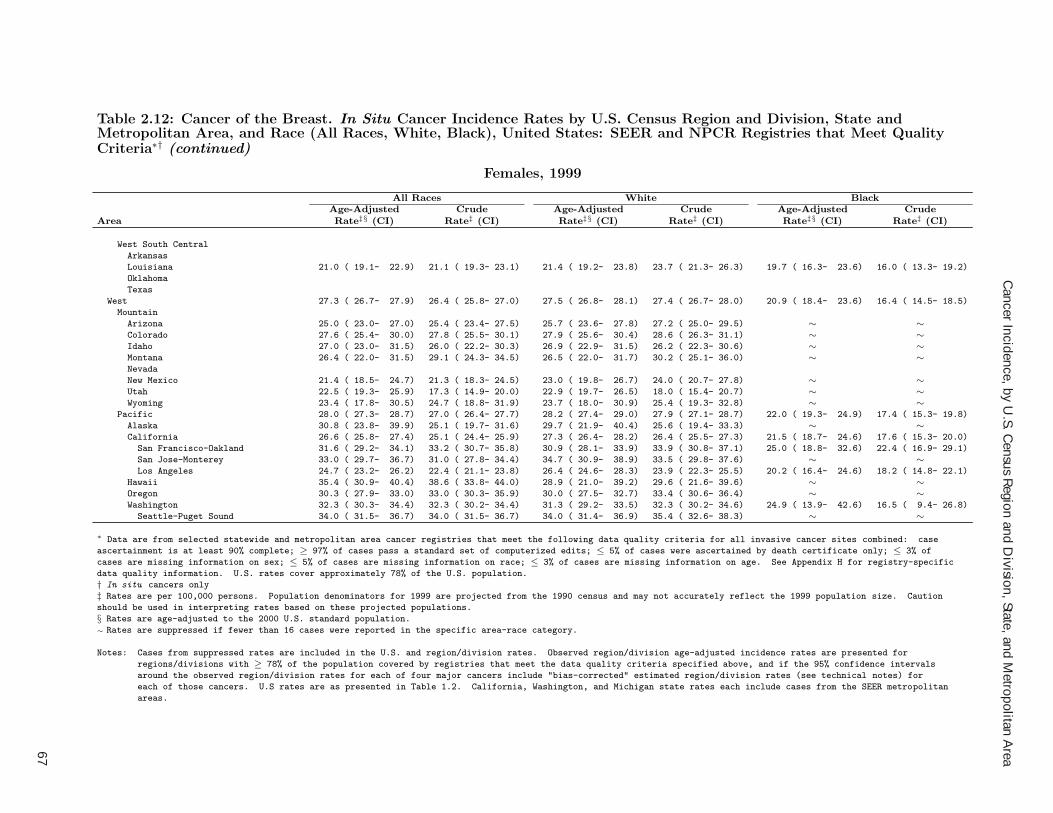
Cancer Incidence, by U
.S. Census R
egion and Division, State, and M
etropolitan Area
67
Table 2.12: Cancer of the Breast. In Situ Cancer Incidence Rates by U.S. Census Region and Division, State andMetropolitan Area, and Race (All Races, White, Black), United States: SEER and NPCR Registries that Meet QualityCriteria∗† (continued)
Females, 1999
All Races White BlackAge-Adjusted Crude Age-Adjusted Crude Age-Adjusted Crude
Area Rate‡§ (CI) Rate‡ (CI) Rate‡§ (CI) Rate‡ (CI) Rate‡§ (CI) Rate‡ (CI)
West South Central
Arkansas
Louisiana 21.0 ( 19.1- 22.9) 21.1 ( 19.3- 23.1) 21.4 ( 19.2- 23.8) 23.7 ( 21.3- 26.3) 19.7 ( 16.3- 23.6) 16.0 ( 13.3- 19.2)
Oklahoma
Texas
West 27.3 ( 26.7- 27.9) 26.4 ( 25.8- 27.0) 27.5 ( 26.8- 28.1) 27.4 ( 26.7- 28.0) 20.9 ( 18.4- 23.6) 16.4 ( 14.5- 18.5)
Mountain
Arizona 25.0 ( 23.0- 27.0) 25.4 ( 23.4- 27.5) 25.7 ( 23.6- 27.8) 27.2 ( 25.0- 29.5) ∼ ∼Colorado 27.6 ( 25.4- 30.0) 27.8 ( 25.5- 30.1) 27.9 ( 25.6- 30.4) 28.6 ( 26.3- 31.1) ∼ ∼Idaho 27.0 ( 23.0- 31.5) 26.0 ( 22.2- 30.3) 26.9 ( 22.9- 31.5) 26.2 ( 22.3- 30.6) ∼ ∼Montana 26.4 ( 22.0- 31.5) 29.1 ( 24.3- 34.5) 26.5 ( 22.0- 31.7) 30.2 ( 25.1- 36.0) ∼ ∼Nevada
New Mexico 21.4 ( 18.5- 24.7) 21.3 ( 18.3- 24.5) 23.0 ( 19.8- 26.7) 24.0 ( 20.7- 27.8) ∼ ∼Utah 22.5 ( 19.3- 25.9) 17.3 ( 14.9- 20.0) 22.9 ( 19.7- 26.5) 18.0 ( 15.4- 20.7) ∼ ∼Wyoming 23.4 ( 17.8- 30.5) 24.7 ( 18.8- 31.9) 23.7 ( 18.0- 30.9) 25.4 ( 19.3- 32.8) ∼ ∼
Pacific 28.0 ( 27.3- 28.7) 27.0 ( 26.4- 27.7) 28.2 ( 27.4- 29.0) 27.9 ( 27.1- 28.7) 22.0 ( 19.3- 24.9) 17.4 ( 15.3- 19.8)
Alaska 30.8 ( 23.8- 39.9) 25.1 ( 19.7- 31.6) 29.7 ( 21.9- 40.4) 25.6 ( 19.4- 33.3) ∼ ∼California 26.6 ( 25.8- 27.4) 25.1 ( 24.4- 25.9) 27.3 ( 26.4- 28.2) 26.4 ( 25.5- 27.3) 21.5 ( 18.7- 24.6) 17.6 ( 15.3- 20.0)
San Francisco-Oakland 31.6 ( 29.2- 34.1) 33.2 ( 30.7- 35.8) 30.9 ( 28.1- 33.9) 33.9 ( 30.8- 37.1) 25.0 ( 18.8- 32.6) 22.4 ( 16.9- 29.1)
San Jose-Monterey 33.0 ( 29.7- 36.7) 31.0 ( 27.8- 34.4) 34.7 ( 30.9- 38.9) 33.5 ( 29.8- 37.6) ∼ ∼Los Angeles 24.7 ( 23.2- 26.2) 22.4 ( 21.1- 23.8) 26.4 ( 24.6- 28.3) 23.9 ( 22.3- 25.5) 20.2 ( 16.4- 24.6) 18.2 ( 14.8- 22.1)
Hawaii 35.4 ( 30.9- 40.4) 38.6 ( 33.8- 44.0) 28.9 ( 21.0- 39.2) 29.6 ( 21.6- 39.6) ∼ ∼Oregon 30.3 ( 27.9- 33.0) 33.0 ( 30.3- 35.9) 30.0 ( 27.5- 32.7) 33.4 ( 30.6- 36.4) ∼ ∼Washington 32.3 ( 30.3- 34.4) 32.3 ( 30.2- 34.4) 31.3 ( 29.2- 33.5) 32.3 ( 30.2- 34.6) 24.9 ( 13.9- 42.6) 16.5 ( 9.4- 26.8)
Seattle-Puget Sound 34.0 ( 31.5- 36.7) 34.0 ( 31.5- 36.7) 34.0 ( 31.4- 36.9) 35.4 ( 32.6- 38.3) ∼ ∼∗ Data are from selected statewide and metropolitan area cancer registries that meet the following data quality criteria for all invasive cancer sites combined: case
ascertainment is at least 90% complete; ≥ 97% of cases pass a standard set of computerized edits; ≤ 5% of cases were ascertained by death certificate only; ≤ 3% of
cases are missing information on sex; ≤ 5% of cases are missing information on race; ≤ 3% of cases are missing information on age. See Appendix H for registry-specific
data quality information. U.S. rates cover approximately 78% of the U.S. population.
† In situ cancers only
‡ Rates are per 100,000 persons. Population denominators for 1999 are projected from the 1990 census and may not accurately reflect the 1999 population size. Caution
should be used in interpreting rates based on these projected populations.
§ Rates are age-adjusted to the 2000 U.S. standard population.
∼ Rates are suppressed if fewer than 16 cases were reported in the specific area-race category.
Notes: Cases from suppressed rates are included in the U.S. and region/division rates. Observed region/division age-adjusted incidence rates are presented for
regions/divisions with ≥ 78% of the population covered by registries that meet the data quality criteria specified above, and if the 95% confidence intervals
around the observed region/division rates for each of four major cancers include "bias-corrected" estimated region/division rates (see technical notes) for
each of those cancers. U.S rates are as presented in Table 1.2. California, Washington, and Michigan state rates each include cases from the SEER metropolitan
areas.

United States C
ancer Statistics: 1999 Incidence
68
Table 2.13: Cancer of the Cervix Uteri. Invasive Cancer Incidence Rates by U.S. Census Region and Division, Stateand Metropolitan Area, and Race (All Races, White, Black), United States: SEER and NPCR Registries that MeetQuality Criteria∗†
Females, 1999
All Races White BlackAge-Adjusted Crude Age-Adjusted Crude Age-Adjusted Crude
Area Rate‡§ (CI) Rate‡ (CI) Rate‡§ (CI) Rate‡ (CI) Rate‡§ (CI) Rate‡ (CI)
United States 9.5 ( 9.3- 9.6) 9.7 ( 9.5- 9.9) 8.8 ( 8.6- 9.0) 9.2 ( 9.0- 9.4) 13.9 ( 13.2- 14.6) 12.3 ( 11.8- 13.0)
Northeast 9.3 ( 8.9- 9.6) 9.9 ( 9.5- 10.3) 8.3 ( 7.9- 8.7) 9.0 ( 8.6- 9.4) 14.5 ( 13.2- 15.9) 13.4 ( 12.2- 14.7)
New England 7.4 ( 6.8- 8.1) 7.9 ( 7.2- 8.6) 6.8 ( 6.2- 7.5) 7.4 ( 6.7- 8.2) 12.1 ( 8.6- 16.9) 10.0 ( 7.2- 13.6)
Connecticut 8.3 ( 7.0- 9.7) 8.9 ( 7.6- 10.5) 7.8 ( 6.5- 9.3) 8.7 ( 7.2- 10.3) 11.1 ( 6.3- 19.1) 9.9 ( 5.7- 16.1)
Maine
Massachusetts 6.8 ( 6.0- 7.8) 7.2 ( 6.3- 8.2) 6.0 ( 5.2- 6.9) 6.5 ( 5.6- 7.5) 14.7 ( 9.2- 22.8) 11.6 ( 7.4- 17.2)
New Hampshire 6.5 ( 4.6- 8.8) 6.7 ( 4.8- 9.1) 6.2 ( 4.4- 8.6) 6.5 ( 4.7- 8.9) ∼ ∼Rhode Island 9.6 ( 7.1- 12.7) 9.9 ( 7.4- 13.0) 9.8 ( 7.2- 13.1) 10.4 ( 7.7- 13.7) ∼ ∼Vermont
Middle Atlantic 9.8 ( 9.4- 10.3) 10.5 ( 10.1- 11.0) 8.8 ( 8.4- 9.3) 9.6 ( 9.1- 10.0) 14.8 ( 13.4- 16.3) 13.8 ( 12.5- 15.2)
New Jersey 10.5 ( 9.6- 11.5) 11.2 ( 10.2- 12.3) 10.1 ( 9.1- 11.2) 11.0 ( 9.9- 12.2) 16.5 ( 13.3- 20.3) 15.0 ( 12.1- 18.3)
New York 9.9 ( 9.3- 10.6) 10.6 ( 9.9- 11.2) 8.4 ( 7.8- 9.1) 9.2 ( 8.5- 9.9) 14.0 ( 12.2- 15.9) 13.1 ( 11.5- 15.0)
Pennsylvania 9.3 ( 8.6- 10.1) 9.9 ( 9.1- 10.7) 8.5 ( 7.8- 9.3) 9.2 ( 8.4- 10.0) 15.5 ( 12.5- 19.0) 14.7 ( 11.8- 18.0)
Midwest
East North Central
Illinois 10.7 ( 10.0- 11.6) 10.9 ( 10.1- 11.8) 9.4 ( 8.5- 10.2) 9.7 ( 8.9- 10.6) 18.4 ( 15.7- 21.6) 16.2 ( 13.8- 18.9)
Indiana
Michigan 8.3 ( 7.5- 9.1) 8.5 ( 7.7- 9.3) 7.5 ( 6.8- 8.4) 7.8 ( 7.0- 8.7) 13.5 ( 10.8- 16.6) 11.8 ( 9.5- 14.6)
Detroit 9.0 ( 7.8- 10.4) 9.4 ( 8.2- 10.8) 7.0 ( 5.8- 8.4) 7.5 ( 6.2- 9.0) 15.5 ( 12.3- 19.4) 14.3 ( 11.3- 17.8)
Ohio 8.7 ( 8.0- 9.5) 9.0 ( 8.3- 9.8) 8.6 ( 7.9- 9.5) 9.0 ( 8.2- 9.9) 9.5 ( 7.2- 12.3) 8.6 ( 6.5- 11.1)
Wisconsin 9.8 ( 8.6- 11.1) 9.8 ( 8.6- 11.0) 8.9 ( 7.7- 10.2) 9.0 ( 7.8- 10.3) 20.2 ( 12.5- 32.8) 16.4 ( 10.6- 24.1)
West North Central 8.6 ( 8.0- 9.2) 8.7 ( 8.1- 9.3) 8.1 ( 7.5- 8.7) 8.3 ( 7.7- 9.0) 12.6 ( 9.6- 16.4) 11.0 ( 8.4- 14.2)
Iowa 10.2 ( 8.6- 12.0) 10.1 ( 8.6- 11.9) 9.5 ( 8.0- 11.3) 9.6 ( 8.0- 11.3) ∼ ∼Kansas 9.3 ( 7.7- 11.1) 9.3 ( 7.7- 11.0) 8.8 ( 7.2- 10.7) 8.9 ( 7.3- 10.8) ∼ ∼Minnesota 7.5 ( 6.4- 8.7) 7.6 ( 6.5- 8.8) 7.1 ( 6.1- 8.3) 7.4 ( 6.3- 8.6) ∼ ∼Missouri 8.8 ( 7.7- 9.9) 9.1 ( 8.0- 10.2) 8.3 ( 7.2- 9.5) 8.7 ( 7.5- 9.9) 12.5 ( 8.8- 17.4) 11.3 ( 7.9- 15.5)
Nebraska 8.5 ( 6.6- 10.8) 8.3 ( 6.5- 10.5) 7.9 ( 6.1- 10.2) 7.8 ( 6.0- 10.0) ∼ ∼North Dakota 5.8 ( 3.4- 9.2) 5.7 ( 3.4- 8.9) 6.0 ( 3.5- 9.7) 6.0 ( 3.6- 9.5) ∼ ∼South Dakota
South
South Atlantic
Delaware 7.9 ( 5.4- 11.2) 8.5 ( 5.9- 12.0) 7.9 ( 5.1- 11.8) 8.7 ( 5.7- 12.7) ∼ ∼District of Columbia 13.5 ( 9.6- 18.7) 14.8 ( 10.6- 20.1) ∼ ∼ 15.3 ( 10.2- 22.8) 16.6 ( 11.1- 23.9)
Florida 11.5 ( 10.8- 12.3) 12.2 ( 11.4- 13.0) 10.9 ( 10.1- 11.7) 11.7 ( 10.9- 12.6) 17.8 ( 15.2- 20.7) 14.5 ( 12.4- 16.8)
Georgia
Atlanta 10.5 ( 8.8- 12.5) 10.1 ( 8.5- 11.9) 7.6 ( 6.0- 9.7) 8.2 ( 6.4- 10.4) 17.8 ( 13.0- 24.2) 12.2 ( 9.2- 15.8)
Maryland 8.2 ( 7.2- 9.4) 8.5 ( 7.4- 9.7) 6.7 ( 5.6- 8.0) 7.3 ( 6.1- 8.7) 10.8 ( 8.4- 13.8) 9.5 ( 7.4- 11.9)
North Carolina 9.5 ( 8.6- 10.5) 9.9 ( 8.9- 10.9) 8.7 ( 7.7- 9.8) 9.3 ( 8.2- 10.5) 12.8 ( 10.4- 15.6) 11.5 ( 9.4- 14.0)
South Carolina 11.3 ( 9.9- 12.9) 11.7 ( 10.3- 13.3) 9.6 ( 8.1- 11.4) 10.2 ( 8.6- 12.1) 16.2 ( 13.0- 20.1) 14.3 ( 11.4- 17.6)
Virginia
West Virginia 13.4 ( 11.2- 16.0) 14.3 ( 12.0- 17.0) 13.5 ( 11.3- 16.2) 14.4 ( 12.1- 17.2) ∼ ∼East South Central
Alabama
Kentucky 10.8 ( 9.4- 12.3) 11.1 ( 9.7- 12.7) 10.5 ( 9.1- 12.0) 10.9 ( 9.5- 12.5) 14.1 ( 8.4- 22.2) 12.6 ( 7.6- 19.7)
Mississippi
Tennessee
continued

Cancer Incidence, by U
.S. Census R
egion and Division, State, and M
etropolitan Area
69
Table 2.13: Cancer of the Cervix Uteri. Invasive Cancer Incidence Rates by U.S. Census Region and Division, Stateand Metropolitan Area, and Race (All Races, White, Black), United States: SEER and NPCR Registries that MeetQuality Criteria∗† (continued)
Females, 1999
All Races White BlackAge-Adjusted Crude Age-Adjusted Crude Age-Adjusted Crude
Area Rate‡§ (CI) Rate‡ (CI) Rate‡§ (CI) Rate‡ (CI) Rate‡§ (CI) Rate‡ (CI)
West South Central
Arkansas
Louisiana 12.3 ( 10.9- 13.9) 12.1 ( 10.7- 13.6) 10.7 ( 9.1- 12.5) 11.0 ( 9.4- 12.9) 16.5 ( 13.5- 20.0) 14.2 ( 11.6- 17.1)
Oklahoma
Texas
West 8.9 ( 8.6- 9.3) 8.8 ( 8.5- 9.2) 8.9 ( 8.5- 9.3) 8.8 ( 8.5- 9.2) 9.2 ( 7.7- 11.0) 8.2 ( 6.8- 9.7)
Mountain
Arizona 7.7 ( 6.7- 9.0) 7.6 ( 6.5- 8.8) 8.0 ( 6.8- 9.3) 7.9 ( 6.8- 9.2) ∼ ∼Colorado 6.6 ( 5.5- 7.8) 6.6 ( 5.5- 7.8) 6.5 ( 5.4- 7.7) 6.6 ( 5.5- 7.8) ∼ ∼Idaho 6.2 ( 4.4- 8.6) 5.9 ( 4.2- 8.1) 6.4 ( 4.5- 8.9) 6.1 ( 4.3- 8.4) ∼ ∼Montana 8.6 ( 6.1- 12.0) 8.6 ( 6.1- 11.8) 8.4 ( 5.8- 11.9) 8.5 ( 5.9- 11.9) ∼ ∼Nevada
New Mexico 7.6 ( 5.8- 9.7) 7.4 ( 5.7- 9.4) 7.9 ( 6.0- 10.2) 7.9 ( 6.0- 10.1) ∼ ∼Utah 6.2 ( 4.7- 8.1) 5.1 ( 3.9- 6.7) 6.2 ( 4.7- 8.2) 5.2 ( 3.9- 6.8) ∼ ∼Wyoming 10.0 ( 6.3- 15.2) 9.6 ( 6.1- 14.5) 10.3 ( 6.5- 15.8) 10.1 ( 6.4- 15.1) ∼ ∼
Pacific 9.5 ( 9.1- 10.0) 9.5 ( 9.1- 9.9) 9.5 ( 9.1- 10.0) 9.5 ( 9.1- 10.0) 9.8 ( 8.1- 11.8) 8.7 ( 7.2- 10.4)
Alaska 7.3 ( 4.1- 12.9) 6.1 ( 3.6- 9.7) ∼ ∼ ∼ ∼California 10.1 ( 9.6- 10.6) 9.9 ( 9.4- 10.4) 10.3 ( 9.7- 10.8) 10.1 ( 9.6- 10.7) 9.8 ( 8.1- 11.9) 8.9 ( 7.3- 10.7)
San Francisco-Oakland 6.7 ( 5.7- 7.9) 7.3 ( 6.2- 8.5) 6.8 ( 5.5- 8.3) 7.5 ( 6.1- 9.1) 7.7 ( 4.5- 12.4) 7.2 ( 4.3- 11.4)
San Jose-Monterey 7.6 ( 6.0- 9.4) 7.4 ( 5.9- 9.1) 6.9 ( 5.3- 8.9) 6.9 ( 5.3- 8.8) ∼ ∼Los Angeles 12.7 ( 11.7- 13.8) 12.2 ( 11.2- 13.2) 13.9 ( 12.6- 15.2) 13.1 ( 12.0- 14.4) 10.2 ( 7.7- 13.4) 10.0 ( 7.5- 13.0)
Hawaii 9.6 ( 7.3- 12.4) 9.8 ( 7.5- 12.7) 11.4 ( 6.7- 18.5) 11.9 ( 7.0- 18.7) ∼ ∼Oregon 8.5 ( 7.2- 10.0) 8.7 ( 7.4- 10.2) 8.5 ( 7.1- 10.0) 8.7 ( 7.3- 10.3) ∼ ∼Washington 7.5 ( 6.6- 8.6) 7.7 ( 6.7- 8.8) 7.1 ( 6.1- 8.2) 7.3 ( 6.3- 8.5) ∼ ∼
Seattle-Puget Sound 6.1 ( 5.1- 7.3) 6.3 ( 5.3- 7.6) 6.1 ( 5.0- 7.4) 6.4 ( 5.3- 7.8) ∼ ∼∗ Data are from selected statewide and metropolitan area cancer registries that meet the following data quality criteria for all invasive cancer sites combined: case
ascertainment is at least 90% complete; ≥ 97% of cases pass a standard set of computerized edits; ≤ 5% of cases were ascertained by death certificate only; ≤ 3% of
cases are missing information on sex; ≤ 5% of cases are missing information on race; ≤ 3% of cases are missing information on age. See Appendix H for registry-specific
data quality information. U.S. rates cover approximately 78% of the U.S. population.
† Invasive cancers only
‡ Rates are per 100,000 persons. Population denominators for 1999 are projected from the 1990 census and may not accurately reflect the 1999 population size. Caution
should be used in interpreting rates based on these projected populations.
§ Rates are age-adjusted to the 2000 U.S. standard population.
∼ Rates are suppressed if fewer than 16 cases were reported in the specific area-race category.
Notes: Cases from suppressed rates are included in the U.S. and region/division rates. Observed region/division age-adjusted incidence rates are presented for
regions/divisions with ≥ 78% of the population covered by registries that meet the data quality criteria specified above, and if the 95% confidence intervals
around the observed region/division rates for each of four major cancers include "bias-corrected" estimated region/division rates (see technical notes) for
each of those cancers. U.S rates are as presented in Table 1.2. California, Washington, and Michigan state rates each include cases from the SEER metropolitan
areas.

United States C
ancer Statistics: 1999 Incidence
70
Table 2.14: Cancer of the Corpus Uteri. Invasive Cancer Incidence Rates by U.S. Census Region and Division, Stateand Metropolitan Area, and Race (All Races, White, Black), United States: SEER and NPCR Registries that MeetQuality Criteria∗†
Females, 1999
All Races White BlackAge-Adjusted Crude Age-Adjusted Crude Age-Adjusted Crude
Area Rate‡§ (CI) Rate‡ (CI) Rate‡§ (CI) Rate‡ (CI) Rate‡§ (CI) Rate‡ (CI)
United States 24.6 ( 24.3- 24.9) 26.4 ( 26.1- 26.7) 25.3 ( 25.0- 25.6) 28.5 ( 28.2- 28.9) 18.6 ( 17.8- 19.5) 15.1 ( 14.4- 15.8)
Northeast 28.3 ( 27.7- 28.9) 32.0 ( 31.3- 32.7) 29.1 ( 28.4- 29.8) 34.5 ( 33.7- 35.3) 19.8 ( 18.2- 21.5) 17.4 ( 16.0- 18.9)
New England 28.4 ( 27.1- 29.7) 31.1 ( 29.7- 32.5) 28.6 ( 27.3- 30.0) 32.6 ( 31.1- 34.2) 14.6 ( 10.5- 20.1) 10.5 ( 7.6- 14.2)
Connecticut 28.2 ( 25.8- 30.7) 31.7 ( 29.1- 34.5) 29.2 ( 26.7- 31.9) 34.2 ( 31.3- 37.3) 14.1 ( 8.3- 23.1) 11.1 ( 6.6- 17.6)
Maine
Massachusetts 28.8 ( 27.0- 30.7) 31.5 ( 29.6- 33.5) 28.7 ( 26.8- 30.6) 32.8 ( 30.7- 34.9) 14.9 ( 9.2- 23.5) 10.1 ( 6.3- 15.5)
New Hampshire 26.4 ( 22.4- 30.9) 25.9 ( 22.1- 30.3) 26.2 ( 22.3- 30.8) 26.0 ( 22.1- 30.4) ∼ ∼Rhode Island 28.5 ( 24.2- 33.3) 32.7 ( 27.9- 38.0) 29.3 ( 24.9- 34.4) 34.9 ( 29.7- 40.6) ∼ ∼Vermont
Middle Atlantic 28.3 ( 27.6- 29.0) 32.3 ( 31.5- 33.1) 29.2 ( 28.5- 30.0) 35.1 ( 34.2- 36.1) 20.4 ( 18.7- 22.2) 18.3 ( 16.8- 19.9)
New Jersey 29.8 ( 28.3- 31.4) 33.2 ( 31.5- 35.0) 31.6 ( 29.8- 33.4) 37.5 ( 35.4- 39.6) 22.0 ( 18.1- 26.5) 18.6 ( 15.4- 22.3)
New York 26.4 ( 25.5- 27.4) 29.4 ( 28.3- 30.5) 26.8 ( 25.7- 27.9) 31.7 ( 30.4- 33.0) 21.2 ( 18.9- 23.6) 19.1 ( 17.1- 21.2)
Pennsylvania 30.1 ( 28.8- 31.4) 36.0 ( 34.5- 37.5) 31.0 ( 29.7- 32.4) 38.2 ( 36.6- 39.9) 17.0 ( 13.8- 20.7) 16.0 ( 13.0- 19.5)
Midwest
East North Central
Illinois 24.2 ( 23.1- 25.5) 25.3 ( 24.1- 26.6) 25.1 ( 23.8- 26.5) 27.5 ( 26.1- 29.0) 17.1 ( 14.3- 20.3) 14.0 ( 11.7- 16.5)
Indiana
Michigan 26.8 ( 25.4- 28.2) 28.0 ( 26.6- 29.5) 28.2 ( 26.7- 29.8) 30.9 ( 29.2- 32.6) 16.9 ( 13.8- 20.5) 14.1 ( 11.5- 17.0)
Detroit 25.7 ( 23.7- 27.9) 27.6 ( 25.4- 29.9) 27.6 ( 25.2- 30.2) 31.8 ( 29.1- 34.8) 19.1 ( 15.4- 23.5) 16.8 ( 13.6- 20.6)
Ohio 26.9 ( 25.7- 28.3) 29.5 ( 28.2- 31.0) 27.3 ( 25.9- 28.7) 30.8 ( 29.3- 32.4) 18.2 ( 14.9- 22.1) 15.5 ( 12.7- 18.8)
Wisconsin 25.9 ( 24.1- 27.9) 27.5 ( 25.6- 29.6) 26.4 ( 24.5- 28.4) 29.1 ( 27.0- 31.3) ∼ ∼West North Central 26.8 ( 25.8- 27.9) 29.3 ( 28.3- 30.5) 27.0 ( 26.0- 28.1) 30.5 ( 29.4- 31.7) 20.6 ( 16.3- 25.6) 15.2 ( 12.1- 18.9)
Iowa 28.6 ( 26.0- 31.3) 32.8 ( 30.0- 35.9) 28.6 ( 26.1- 31.4) 33.5 ( 30.6- 36.7) ∼ ∼Kansas 26.2 ( 23.6- 29.0) 28.8 ( 26.0- 31.8) 26.3 ( 23.6- 29.2) 29.9 ( 26.9- 33.1) ∼ ∼Minnesota 27.4 ( 25.4- 29.6) 28.1 ( 26.1- 30.3) 27.2 ( 25.2- 29.4) 29.1 ( 26.9- 31.4) ∼ ∼Missouri 25.9 ( 24.2- 27.8) 28.8 ( 26.9- 30.9) 26.5 ( 24.6- 28.5) 30.5 ( 28.4- 32.8) 20.4 ( 15.4- 26.7) 16.7 ( 12.6- 21.8)
Nebraska 27.8 ( 24.5- 31.4) 30.8 ( 27.2- 34.8) 27.8 ( 24.4- 31.6) 31.6 ( 27.9- 35.8) ∼ ∼North Dakota 23.0 ( 18.3- 28.8) 25.8 ( 20.5- 32.0) 23.7 ( 18.8- 29.7) 27.5 ( 21.9- 34.2) ∼ ∼South Dakota
South
South Atlantic
Delaware 27.1 ( 22.3- 32.7) 28.7 ( 23.6- 34.6) 29.4 ( 23.9- 35.9) 33.8 ( 27.5- 41.1) ∼ ∼District of Columbia 17.2 ( 13.0- 22.8) 20.2 ( 15.3- 26.2) 24.8 ( 15.6- 40.5) 24.7 ( 15.7- 37.1) 13.2 ( 8.8- 19.7) 17.2 ( 11.6- 24.6)
Florida 23.1 ( 22.1- 24.1) 29.9 ( 28.7- 31.1) 23.4 ( 22.3- 24.4) 32.7 ( 31.3- 34.1) 23.6 ( 20.4- 27.3) 16.7 ( 14.4- 19.1)
Georgia
Atlanta 18.1 ( 15.6- 20.8) 14.8 ( 12.8- 16.9) 18.7 ( 15.8- 21.9) 17.8 ( 15.1- 20.8) 17.5 ( 12.4- 24.2) 9.1 ( 6.5- 12.3)
Maryland 23.5 ( 21.7- 25.4) 23.7 ( 21.9- 25.7) 25.9 ( 23.7- 28.3) 28.8 ( 26.4- 31.4) 15.6 ( 12.4- 19.3) 11.6 ( 9.3- 14.2)
North Carolina 20.0 ( 18.7- 21.4) 21.6 ( 20.2- 23.1) 20.2 ( 18.7- 21.8) 23.3 ( 21.6- 25.1) 20.2 ( 17.1- 23.7) 17.1 ( 14.5- 20.0)
South Carolina 19.3 ( 17.5- 21.2) 20.6 ( 18.7- 22.7) 18.8 ( 16.7- 21.1) 22.0 ( 19.6- 24.6) 21.0 ( 17.3- 25.5) 17.5 ( 14.4- 21.1)
Virginia
West Virginia 26.2 ( 23.3- 29.4) 32.0 ( 28.5- 35.9) 26.3 ( 23.3- 29.6) 32.3 ( 28.7- 36.3) ∼ ∼East South Central
Alabama
Kentucky 18.9 ( 17.1- 20.8) 20.6 ( 18.7- 22.7) 18.7 ( 16.9- 20.7) 20.8 ( 18.8- 23.0) 12.7 ( 7.3- 20.5) 11.3 ( 6.6- 18.0)
Mississippi
Tennessee
continued
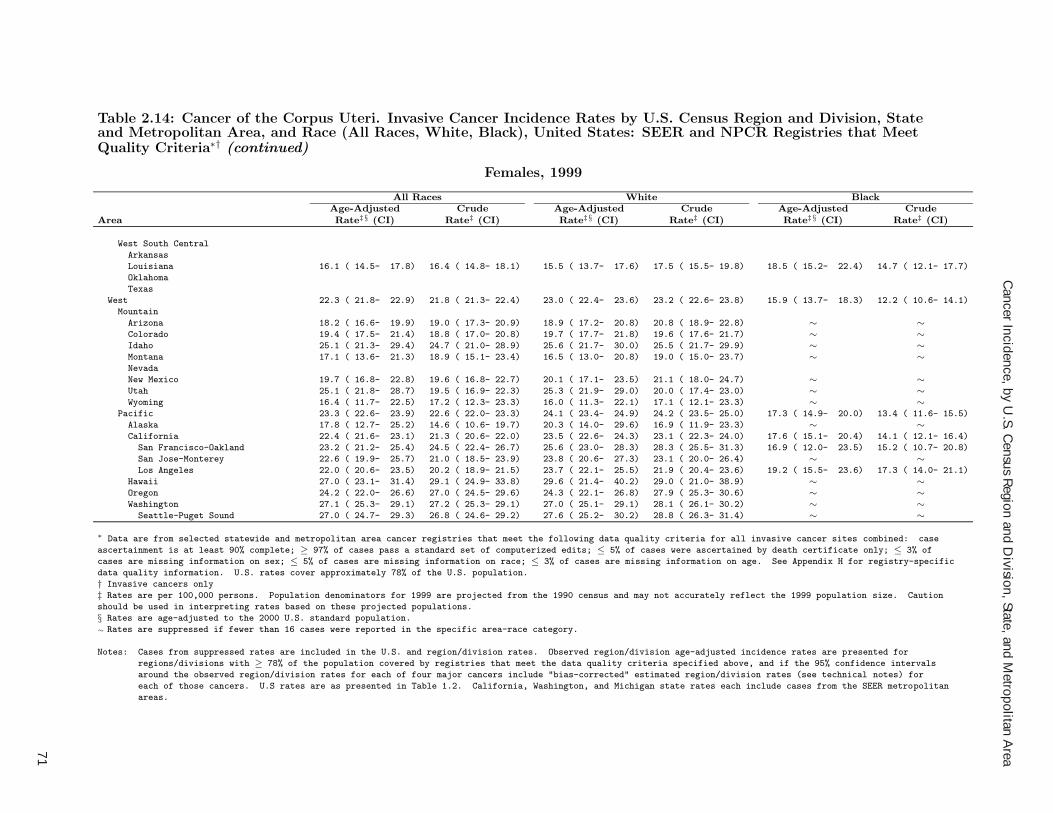
Cancer Incidence, by U
.S. Census R
egion and Division, State, and M
etropolitan Area
71
Table 2.14: Cancer of the Corpus Uteri. Invasive Cancer Incidence Rates by U.S. Census Region and Division, Stateand Metropolitan Area, and Race (All Races, White, Black), United States: SEER and NPCR Registries that MeetQuality Criteria∗† (continued)
Females, 1999
All Races White BlackAge-Adjusted Crude Age-Adjusted Crude Age-Adjusted Crude
Area Rate‡§ (CI) Rate‡ (CI) Rate‡§ (CI) Rate‡ (CI) Rate‡§ (CI) Rate‡ (CI)
West South Central
Arkansas
Louisiana 16.1 ( 14.5- 17.8) 16.4 ( 14.8- 18.1) 15.5 ( 13.7- 17.6) 17.5 ( 15.5- 19.8) 18.5 ( 15.2- 22.4) 14.7 ( 12.1- 17.7)
Oklahoma
Texas
West 22.3 ( 21.8- 22.9) 21.8 ( 21.3- 22.4) 23.0 ( 22.4- 23.6) 23.2 ( 22.6- 23.8) 15.9 ( 13.7- 18.3) 12.2 ( 10.6- 14.1)
Mountain
Arizona 18.2 ( 16.6- 19.9) 19.0 ( 17.3- 20.9) 18.9 ( 17.2- 20.8) 20.8 ( 18.9- 22.8) ∼ ∼Colorado 19.4 ( 17.5- 21.4) 18.8 ( 17.0- 20.8) 19.7 ( 17.7- 21.8) 19.6 ( 17.6- 21.7) ∼ ∼Idaho 25.1 ( 21.3- 29.4) 24.7 ( 21.0- 28.9) 25.6 ( 21.7- 30.0) 25.5 ( 21.7- 29.9) ∼ ∼Montana 17.1 ( 13.6- 21.3) 18.9 ( 15.1- 23.4) 16.5 ( 13.0- 20.8) 19.0 ( 15.0- 23.7) ∼ ∼Nevada
New Mexico 19.7 ( 16.8- 22.8) 19.6 ( 16.8- 22.7) 20.1 ( 17.1- 23.5) 21.1 ( 18.0- 24.7) ∼ ∼Utah 25.1 ( 21.8- 28.7) 19.5 ( 16.9- 22.3) 25.3 ( 21.9- 29.0) 20.0 ( 17.4- 23.0) ∼ ∼Wyoming 16.4 ( 11.7- 22.5) 17.2 ( 12.3- 23.3) 16.0 ( 11.3- 22.1) 17.1 ( 12.1- 23.3) ∼ ∼
Pacific 23.3 ( 22.6- 23.9) 22.6 ( 22.0- 23.3) 24.1 ( 23.4- 24.9) 24.2 ( 23.5- 25.0) 17.3 ( 14.9- 20.0) 13.4 ( 11.6- 15.5)
Alaska 17.8 ( 12.7- 25.2) 14.6 ( 10.6- 19.7) 20.3 ( 14.0- 29.6) 16.9 ( 11.9- 23.3) ∼ ∼California 22.4 ( 21.6- 23.1) 21.3 ( 20.6- 22.0) 23.5 ( 22.6- 24.3) 23.1 ( 22.3- 24.0) 17.6 ( 15.1- 20.4) 14.1 ( 12.1- 16.4)
San Francisco-Oakland 23.2 ( 21.2- 25.4) 24.5 ( 22.4- 26.7) 25.6 ( 23.0- 28.3) 28.3 ( 25.5- 31.3) 16.9 ( 12.0- 23.5) 15.2 ( 10.7- 20.8)
San Jose-Monterey 22.6 ( 19.9- 25.7) 21.0 ( 18.5- 23.9) 23.8 ( 20.6- 27.3) 23.1 ( 20.0- 26.4) ∼ ∼Los Angeles 22.0 ( 20.6- 23.5) 20.2 ( 18.9- 21.5) 23.7 ( 22.1- 25.5) 21.9 ( 20.4- 23.6) 19.2 ( 15.5- 23.6) 17.3 ( 14.0- 21.1)
Hawaii 27.0 ( 23.1- 31.4) 29.1 ( 24.9- 33.8) 29.6 ( 21.4- 40.2) 29.0 ( 21.0- 38.9) ∼ ∼Oregon 24.2 ( 22.0- 26.6) 27.0 ( 24.5- 29.6) 24.3 ( 22.1- 26.8) 27.9 ( 25.3- 30.6) ∼ ∼Washington 27.1 ( 25.3- 29.1) 27.2 ( 25.3- 29.1) 27.0 ( 25.1- 29.1) 28.1 ( 26.1- 30.2) ∼ ∼
Seattle-Puget Sound 27.0 ( 24.7- 29.3) 26.8 ( 24.6- 29.2) 27.6 ( 25.2- 30.2) 28.8 ( 26.3- 31.4) ∼ ∼∗ Data are from selected statewide and metropolitan area cancer registries that meet the following data quality criteria for all invasive cancer sites combined: case
ascertainment is at least 90% complete; ≥ 97% of cases pass a standard set of computerized edits; ≤ 5% of cases were ascertained by death certificate only; ≤ 3% of
cases are missing information on sex; ≤ 5% of cases are missing information on race; ≤ 3% of cases are missing information on age. See Appendix H for registry-specific
data quality information. U.S. rates cover approximately 78% of the U.S. population.
† Invasive cancers only
‡ Rates are per 100,000 persons. Population denominators for 1999 are projected from the 1990 census and may not accurately reflect the 1999 population size. Caution
should be used in interpreting rates based on these projected populations.
§ Rates are age-adjusted to the 2000 U.S. standard population.
∼ Rates are suppressed if fewer than 16 cases were reported in the specific area-race category.
Notes: Cases from suppressed rates are included in the U.S. and region/division rates. Observed region/division age-adjusted incidence rates are presented for
regions/divisions with ≥ 78% of the population covered by registries that meet the data quality criteria specified above, and if the 95% confidence intervals
around the observed region/division rates for each of four major cancers include "bias-corrected" estimated region/division rates (see technical notes) for
each of those cancers. U.S rates are as presented in Table 1.2. California, Washington, and Michigan state rates each include cases from the SEER metropolitan
areas.

United States C
ancer Statistics: 1999 Incidence
72
Table 2.15: Cancer of the Ovary. Invasive Cancer Incidence Rates by U.S. Census Region and Division, State andMetropolitan Area, and Race (All Races, White, Black), United States: SEER and NPCR Registries that Meet QualityCriteria∗†
Females, 1999
All Races White BlackAge-Adjusted Crude Age-Adjusted Crude Age-Adjusted Crude
Area Rate‡§ (CI) Rate‡ (CI) Rate‡§ (CI) Rate‡ (CI) Rate‡§ (CI) Rate‡ (CI)
United States 16.2 ( 15.9- 16.4) 17.2 ( 17.0- 17.5) 16.8 ( 16.6- 17.1) 18.8 ( 18.5- 19.1) 10.6 ( 10.0- 11.3) 8.9 ( 8.4- 9.4)
Northeast 16.9 ( 16.4- 17.4) 19.0 ( 18.5- 19.5) 17.4 ( 16.9- 18.0) 20.5 ( 19.9- 21.1) 11.1 ( 10.0- 12.4) 9.8 ( 8.7- 10.9)
New England 15.8 ( 14.8- 16.8) 17.5 ( 16.5- 18.6) 15.9 ( 14.9- 17.0) 18.4 ( 17.2- 19.5) 5.6 ( 3.2- 9.4) 4.3 ( 2.5- 6.8)
Connecticut 15.7 ( 14.0- 17.6) 17.9 ( 16.0- 20.1) 16.1 ( 14.3- 18.2) 19.3 ( 17.2- 21.7) ∼ ∼Maine
Massachusetts 16.0 ( 14.7- 17.4) 17.7 ( 16.3- 19.3) 16.0 ( 14.7- 17.5) 18.4 ( 16.9- 20.1) ∼ ∼New Hampshire 14.1 ( 11.3- 17.4) 14.3 ( 11.4- 17.6) 14.3 ( 11.4- 17.7) 14.6 ( 11.7- 18.0) ∼ ∼Rhode Island 16.2 ( 13.0- 20.0) 18.5 ( 14.9- 22.6) 16.7 ( 13.4- 20.7) 19.6 ( 15.9- 24.1) ∼ ∼Vermont
Middle Atlantic 17.2 ( 16.7- 17.8) 19.4 ( 18.8- 20.1) 17.9 ( 17.3- 18.5) 21.2 ( 20.5- 21.9) 11.7 ( 10.4- 13.1) 10.5 ( 9.4- 11.7)
New Jersey 18.0 ( 16.8- 19.3) 20.0 ( 18.6- 21.4) 18.9 ( 17.5- 20.3) 22.2 ( 20.6- 23.8) 12.5 ( 9.6- 16.1) 10.5 ( 8.1- 13.4)
New York 16.4 ( 15.6- 17.2) 18.0 ( 17.2- 18.9) 17.2 ( 16.3- 18.1) 20.0 ( 18.9- 21.0) 11.2 ( 9.6- 13.1) 10.1 ( 8.6- 11.7)
Pennsylvania 18.0 ( 17.1- 19.1) 21.2 ( 20.1- 22.4) 18.3 ( 17.3- 19.4) 22.2 ( 21.0- 23.5) 12.5 ( 9.8- 15.8) 11.8 ( 9.2- 14.8)
Midwest
East North Central
Illinois 16.3 ( 15.4- 17.4) 17.1 ( 16.1- 18.1) 17.2 ( 16.1- 18.3) 18.8 ( 17.6- 20.0) 10.9 ( 8.7- 13.5) 9.2 ( 7.4- 11.3)
Indiana
Michigan 16.6 ( 15.5- 17.7) 17.4 ( 16.3- 18.6) 16.9 ( 15.8- 18.2) 18.5 ( 17.2- 19.9) 13.6 ( 10.9- 16.9) 11.7 ( 9.4- 14.4)
Detroit 16.6 ( 15.0- 18.4) 17.8 ( 16.0- 19.6) 17.3 ( 15.4- 19.4) 19.8 ( 17.6- 22.1) 15.0 ( 11.8- 18.9) 13.5 ( 10.6- 17.0)
Ohio 15.4 ( 14.5- 16.4) 16.8 ( 15.7- 17.8) 15.9 ( 14.9- 17.0) 17.8 ( 16.6- 19.0) 10.0 ( 7.6- 12.9) 8.9 ( 6.8- 11.4)
Wisconsin 13.9 ( 12.6- 15.4) 14.8 ( 13.4- 16.4) 14.2 ( 12.8- 15.7) 15.6 ( 14.1- 17.3) ∼ ∼West North Central 16.6 ( 15.8- 17.4) 17.8 ( 17.0- 18.7) 16.7 ( 15.9- 17.5) 18.5 ( 17.6- 19.5) 9.8 ( 6.9- 13.4) 7.3 ( 5.2- 10.0)
Iowa 17.4 ( 15.4- 19.5) 20.0 ( 17.8- 22.5) 17.0 ( 15.1- 19.2) 20.1 ( 17.8- 22.5) ∼ ∼Kansas 15.2 ( 13.2- 17.3) 16.3 ( 14.2- 18.6) 15.4 ( 13.4- 17.7) 17.0 ( 14.8- 19.5) ∼ ∼Minnesota 17.9 ( 16.2- 19.6) 18.2 ( 16.6- 20.0) 17.5 ( 15.9- 19.3) 18.6 ( 16.8- 20.4) ∼ ∼Missouri 15.5 ( 14.2- 17.0) 17.0 ( 15.5- 18.6) 16.1 ( 14.6- 17.7) 18.2 ( 16.6- 20.0) 10.5 ( 7.0- 15.3) 8.5 ( 5.7- 12.3)
Nebraska 17.4 ( 14.8- 20.4) 18.5 ( 15.7- 21.6) 17.6 ( 14.9- 20.7) 19.0 ( 16.1- 22.2) ∼ ∼North Dakota 15.8 ( 11.8- 20.8) 17.3 ( 13.0- 22.5) 16.1 ( 12.0- 21.3) 18.1 ( 13.6- 23.6) ∼ ∼South Dakota
South
South Atlantic
Delaware 15.5 ( 11.9- 19.9) 16.3 ( 12.5- 20.8) 17.0 ( 12.8- 22.2) 19.1 ( 14.4- 24.7) ∼ ∼District of Columbia 10.0 ( 6.8- 14.6) 11.5 ( 7.9- 16.3) ∼ ∼ 7.5 ( 4.2- 13.1) 9.2 ( 5.3- 14.9)
Florida 17.7 ( 16.9- 18.6) 22.3 ( 21.2- 23.3) 18.6 ( 17.7- 19.6) 25.2 ( 24.0- 26.5) 11.9 ( 9.7- 14.5) 8.8 ( 7.2- 10.7)
Georgia
Atlanta 15.4 ( 13.2- 17.9) 12.7 ( 10.9- 14.7) 16.2 ( 13.5- 19.2) 15.3 ( 12.8- 18.1) 13.0 ( 8.8- 18.8) 7.5 ( 5.2- 10.5)
Maryland 13.2 ( 11.9- 14.7) 13.4 ( 12.0- 14.8) 14.9 ( 13.2- 16.7) 16.5 ( 14.7- 18.5) 8.6 ( 6.4- 11.5) 6.6 ( 4.9- 8.7)
North Carolina 15.1 ( 13.9- 16.3) 16.0 ( 14.8- 17.3) 16.7 ( 15.4- 18.2) 18.8 ( 17.3- 20.5) 8.9 ( 6.9- 11.3) 7.8 ( 6.1- 9.9)
South Carolina 12.8 ( 11.3- 14.4) 13.6 ( 12.1- 15.3) 13.4 ( 11.6- 15.3) 15.6 ( 13.5- 17.8) 11.0 ( 8.4- 14.3) 9.4 ( 7.1- 12.1)
Virginia
West Virginia 14.6 ( 12.4- 17.1) 17.6 ( 15.0- 20.5) 15.0 ( 12.8- 17.6) 18.2 ( 15.5- 21.2) ∼ ∼East South Central
Alabama
Kentucky 14.2 ( 12.7- 15.9) 15.4 ( 13.8- 17.2) 14.4 ( 12.8- 16.2) 15.9 ( 14.1- 17.8) ∼ ∼Mississippi
Tennessee
continued

Cancer Incidence, by U
.S. Census R
egion and Division, State, and M
etropolitan Area
73
Table 2.15: Cancer of the Ovary. Invasive Cancer Incidence Rates by U.S. Census Region and Division, State andMetropolitan Area, and Race (All Races, White, Black), United States: SEER and NPCR Registries that Meet QualityCriteria∗† (continued)
Females, 1999
All Races White BlackAge-Adjusted Crude Age-Adjusted Crude Age-Adjusted Crude
Area Rate‡§ (CI) Rate‡ (CI) Rate‡§ (CI) Rate‡ (CI) Rate‡§ (CI) Rate‡ (CI)
West South Central
Arkansas
Louisiana 12.9 ( 11.5- 14.5) 13.1 ( 11.6- 14.7) 13.8 ( 12.1- 15.8) 15.4 ( 13.4- 17.5) 11.2 ( 8.7- 14.2) 9.3 ( 7.2- 11.7)
Oklahoma
Texas
West 16.3 ( 15.8- 16.8) 16.0 ( 15.5- 16.5) 17.0 ( 16.5- 17.6) 17.2 ( 16.7- 17.7) 10.7 ( 9.0- 12.7) 8.7 ( 7.3- 10.2)
Mountain
Arizona 13.9 ( 12.5- 15.5) 14.3 ( 12.9- 15.9) 14.7 ( 13.1- 16.3) 15.7 ( 14.1- 17.5) ∼ ∼Colorado 16.8 ( 15.1- 18.7) 16.6 ( 14.9- 18.5) 17.2 ( 15.4- 19.2) 17.3 ( 15.5- 19.3) ∼ ∼Idaho 16.0 ( 13.0- 19.5) 15.8 ( 12.8- 19.2) 16.3 ( 13.2- 19.9) 16.3 ( 13.3- 19.9) ∼ ∼Montana 16.7 ( 13.3- 20.9) 18.7 ( 14.9- 23.2) 17.1 ( 13.5- 21.4) 19.7 ( 15.7- 24.5) ∼ ∼Nevada
New Mexico 17.1 ( 14.5- 20.1) 17.0 ( 14.4- 19.9) 17.3 ( 14.5- 20.5) 18.0 ( 15.1- 21.3) ∼ ∼Utah 16.0 ( 13.5- 19.0) 13.1 ( 11.1- 15.5) 16.4 ( 13.8- 19.4) 13.6 ( 11.5- 16.1) ∼ ∼Wyoming 12.9 ( 8.9- 18.5) 13.4 ( 9.2- 18.9) 12.0 ( 8.1- 17.6) 12.7 ( 8.5- 18.2) ∼ ∼
Pacific 16.6 ( 16.0- 17.1) 16.2 ( 15.7- 16.7) 17.4 ( 16.8- 18.1) 17.6 ( 16.9- 18.2) 11.3 ( 9.4- 13.5) 9.2 ( 7.7- 11.0)
Alaska 18.0 ( 12.3- 26.0) 12.9 ( 9.1- 17.7) 19.4 ( 12.8- 29.2) 15.1 ( 10.4- 21.2) ∼ ∼California 16.2 ( 15.6- 16.8) 15.6 ( 15.0- 16.2) 17.1 ( 16.4- 17.9) 17.0 ( 16.3- 17.7) 11.7 ( 9.7- 14.0) 9.7 ( 8.1- 11.6)
San Francisco-Oakland 17.0 ( 15.3- 18.8) 18.1 ( 16.3- 20.0) 19.0 ( 16.8- 21.4) 21.3 ( 18.9- 23.9) 12.1 ( 8.0- 17.9) 10.8 ( 7.1- 15.7)
San Jose-Monterey 17.3 ( 14.9- 20.0) 16.7 ( 14.4- 19.2) 18.2 ( 15.5- 21.2) 18.1 ( 15.4- 21.1) ∼ ∼Los Angeles 15.6 ( 14.5- 16.8) 14.6 ( 13.5- 15.7) 16.7 ( 15.3- 18.1) 15.5 ( 14.2- 16.9) 10.8 ( 8.1- 14.2) 9.8 ( 7.4- 12.8)
Hawaii 14.4 ( 11.6- 17.7) 15.4 ( 12.4- 18.9) 16.4 ( 10.5- 24.6) 16.5 ( 10.7- 24.3) ∼ ∼Oregon 16.3 ( 14.5- 18.3) 17.9 ( 15.9- 20.0) 16.7 ( 14.8- 18.7) 18.7 ( 16.6- 21.0) ∼ ∼Washington 19.2 ( 17.6- 20.8) 19.2 ( 17.6- 20.9) 19.4 ( 17.8- 21.2) 20.1 ( 18.4- 21.9) ∼ ∼
Seattle-Puget Sound 20.6 ( 18.7- 22.8) 20.7 ( 18.7- 22.8) 21.6 ( 19.5- 23.9) 22.6 ( 20.4- 24.9) ∼ ∼∗ Data are from selected statewide and metropolitan area cancer registries that meet the following data quality criteria for all invasive cancer sites combined: case
ascertainment is at least 90% complete; ≥ 97% of cases pass a standard set of computerized edits; ≤ 5% of cases were ascertained by death certificate only; ≤ 3% of
cases are missing information on sex; ≤ 5% of cases are missing information on race; ≤ 3% of cases are missing information on age. See Appendix H for registry-specific
data quality information. U.S. rates cover approximately 78% of the U.S. population.
† Invasive cancers only
‡ Rates are per 100,000 persons. Population denominators for 1999 are projected from the 1990 census and may not accurately reflect the 1999 population size. Caution
should be used in interpreting rates based on these projected populations.
§ Rates are age-adjusted to the 2000 U.S. standard population.
∼ Rates are suppressed if fewer than 16 cases were reported in the specific area-race category.
Notes: Cases from suppressed rates are included in the U.S. and region/division rates. Observed region/division age-adjusted incidence rates are presented for
regions/divisions with ≥ 78% of the population covered by registries that meet the data quality criteria specified above, and if the 95% confidence intervals
around the observed region/division rates for each of four major cancers include "bias-corrected" estimated region/division rates (see technical notes) for
each of those cancers. U.S rates are as presented in Table 1.2. California, Washington, and Michigan state rates each include cases from the SEER metropolitan
areas.

United States C
ancer Statistics: 1999 Incidence
74
Table 2.16: Cancer of the Prostate. Invasive Cancer Incidence Rates by U.S. Census Region and Division, Stateand Metropolitan Area, and Race (All Races, White, Black), United States: SEER and NPCR Registries that MeetQuality Criteria∗†
Males, 1999
All Races White BlackAge-Adjusted Crude Age-Adjusted Crude Age-Adjusted Crude
Area Rate‡§ (CI) Rate‡ (CI) Rate‡§ (CI) Rate‡ (CI) Rate‡§ (CI) Rate‡ (CI)
United States 162.0 (161.2- 162.8) 146.5 (145.8-147.2) 152.3 (151.5- 153.2) 147.1 (146.3-148.0) 229.3 (225.7- 232.9) 140.6 (138.5-142.7)
Northeast 167.0 (165.3- 168.6) 160.3 (158.7-161.9) 158.0 (156.3- 159.7) 162.6 (160.8-164.4) 231.0 (224.1- 238.2) 150.2 (145.9-154.7)
New England 174.0 (170.4- 177.6) 162.8 (159.5-166.2) 167.5 (163.9- 171.1) 165.1 (161.6-168.7) 243.9 (221.3- 268.7) 126.8 (115.6-138.7)
Connecticut 166.5 (160.1- 173.1) 160.5 (154.4-166.9) 156.4 (150.0- 163.1) 159.9 (153.4-166.7) 232.1 (199.3- 270.1) 133.4 (115.4-153.6)
Maine
Massachusetts 180.1 (175.1- 185.2) 167.8 (163.2-172.5) 173.7 (168.7- 178.8) 171.6 (166.6-176.6) 259.8 (226.5- 298.1) 125.0 (109.9-141.6)
New Hampshire 151.7 (141.1- 163.1) 129.3 (120.3-138.8) 149.8 (139.1- 161.1) 129.3 (120.2-138.9) ∼ ∼Rhode Island 185.1 (172.9- 198.0) 180.6 (168.7-193.1) 184.9 (172.4- 198.1) 189.5 (176.8-202.8) 233.5 (152.0- 360.5) 111.2 ( 73.9-160.7)
Vermont
Middle Atlantic 164.9 (163.0- 166.8) 159.6 (157.8-161.4) 155.0 (153.0- 157.0) 161.7 (159.7-163.8) 229.6 (222.3- 237.1) 153.6 (148.9-158.4)
New Jersey 188.4 (184.0- 192.9) 176.8 (172.7-181.0) 182.0 (177.4- 186.8) 186.6 (181.8-191.4) 273.1 (255.4- 292.0) 172.0 (161.4-183.2)
New York 151.1 (148.4- 153.8) 140.0 (137.5-142.5) 138.5 (135.7- 141.3) 140.0 (137.2-142.9) 210.1 (200.8- 219.7) 139.7 (133.8-145.8)
Pennsylvania 169.0 (165.7- 172.3) 177.5 (174.1-181.0) 159.4 (156.1- 162.7) 175.1 (171.5-178.8) 241.7 (226.4- 258.0) 172.6 (161.7-183.9)
Midwest
East North Central
Illinois 155.2 (151.8- 158.7) 132.9 (129.9-135.8) 143.7 (140.2- 147.3) 131.3 (128.1-134.6) 206.1 (193.7- 219.4) 124.1 (116.9-131.8)
Indiana
Michigan 202.2 (197.9- 206.6) 177.7 (173.9-181.5) 185.8 (181.4- 190.3) 172.1 (168.1-176.2) 290.3 (274.4- 306.9) 193.1 (182.6-203.9)
Detroit 219.0 (212.0- 226.2) 194.4 (188.2-200.6) 196.3 (188.8- 204.0) 186.7 (179.7-193.9) 299.4 (280.9- 318.9) 217.4 (204.1-231.3)
Ohio 153.6 (150.1- 157.1) 141.6 (138.5-144.8) 138.5 (135.1- 142.0) 132.6 (129.4-136.0) 222.1 (207.8- 237.3) 154.1 (144.4-164.3)
Wisconsin 161.2 (156.1- 166.4) 146.6 (142.0-151.3) 156.8 (151.7- 162.1) 149.9 (145.0-154.9) 278.5 (233.9- 332.6) 113.5 ( 96.7-132.4)
West North Central 162.3 (159.6- 165.1) 150.0 (147.5-152.6) 156.2 (153.4- 159.0) 150.7 (148.0-153.4) 220.0 (202.3- 239.1) 119.2 (109.9-129.1)
Iowa 154.4 (147.9- 161.0) 154.7 (148.2-161.3) 148.2 (141.8- 154.8) 152.1 (145.6-158.8) 311.2 (219.4- 436.2) 141.2 (101.7-190.8)
Kansas 169.4 (162.0- 177.0) 152.4 (145.7-159.2) 159.5 (152.2- 167.1) 149.6 (142.7-156.7) 264.7 (216.3- 321.8) 140.7 (115.6-169.6)
Minnesota 181.7 (175.8- 187.7) 155.7 (150.7-160.8) 177.1 (171.2- 183.1) 159.4 (154.2-164.8) 177.1 (123.9- 252.9) 56.2 ( 40.7- 75.8)
Missouri 139.9 (135.3- 144.6) 132.6 (128.3-137.1) 133.5 (128.8- 138.3) 133.0 (128.3-137.7) 214.4 (192.9- 237.9) 132.1 (119.1-146.0)
Nebraska 174.4 (165.1- 184.1) 163.0 (154.4-172.0) 164.4 (155.3- 174.0) 159.6 (150.7-168.8) 153.6 (100.2- 234.0) 87.4 ( 58.5-125.5)
North Dakota 192.9 (177.7- 209.0) 190.2 (175.3-206.1) 193.4 (178.1- 209.8) 200.0 (184.2-216.9) ∼ ∼South Dakota
South
South Atlantic
Delaware 163.3 (149.9- 178.0) 152.5 (140.1-165.7) 149.7 (135.8- 164.9) 153.4 (139.4-168.4) 243.4 (197.4- 300.1) 148.3 (121.3-179.5)
District of Columbia 234.7 (215.2- 255.6) 222.1 (203.8-241.6) 144.0 (118.5- 175.4) 128.7 (106.3-154.5) 275.0 (248.7- 303.6) 276.9 (250.6-305.2)
Florida 155.5 (152.9- 158.1) 188.5 (185.3-191.6) 148.9 (146.3- 151.7) 201.1 (197.5-204.7) 228.5 (215.9- 241.9) 127.0 (120.4-133.7)
Georgia
Atlanta 172.4 (163.0- 182.3) 105.8 (100.3-111.5) 142.1 (132.5- 152.4) 102.6 ( 95.9-109.6) 301.4 (272.4- 333.6) 118.3 (107.8-129.5)
Maryland 184.7 (178.8- 190.7) 153.7 (148.9-158.6) 157.0 (150.9- 163.3) 148.5 (142.8-154.4) 225.6 (210.2- 242.1) 132.0 (123.6-140.9)
North Carolina 140.8 (136.7- 145.0) 124.7 (121.1-128.3) 129.8 (125.5- 134.2) 126.2 (122.1-130.4) 195.9 (183.6- 209.0) 124.4 (116.8-132.4)
South Carolina 176.1 (169.6- 182.9) 154.0 (148.5-159.8) 152.8 (146.0- 159.9) 151.7 (145.1-158.5) 255.8 (238.4- 274.4) 156.2 (145.9-167.2)
Virginia
West Virginia 144.8 (137.0- 153.0) 151.7 (143.6-160.1) 141.0 (133.2- 149.3) 149.1 (141.0-157.6) 213.0 (156.3- 284.4) 173.9 (127.8-231.3)
East South Central
Alabama
Kentucky 155.5 (149.4- 161.7) 135.9 (130.7-141.2) 132.8 (127.0- 138.7) 119.5 (114.4-124.7) 199.9 (170.8- 233.2) 127.4 (109.2-147.8)
Mississippi
Tennessee
continued

Cancer Incidence, by U
.S. Census R
egion and Division, State, and M
etropolitan Area
75
Table 2.16: Cancer of the Prostate. Invasive Cancer Incidence Rates by U.S. Census Region and Division, Stateand Metropolitan Area, and Race (All Races, White, Black), United States: SEER and NPCR Registries that MeetQuality Criteria∗† (continued)
Males, 1999
All Races White BlackAge-Adjusted Crude Age-Adjusted Crude Age-Adjusted Crude
Area Rate‡§ (CI) Rate‡ (CI) Rate‡§ (CI) Rate‡ (CI) Rate‡§ (CI) Rate‡ (CI)
West South Central
Arkansas
Louisiana 163.1 (157.0- 169.4) 133.9 (129.0-139.0) 147.5 (140.9- 154.4) 138.2 (132.1-144.5) 218.2 (203.5- 233.7) 130.0 (121.4-139.0)
Oklahoma
Texas
West 156.3 (154.7- 157.9) 126.5 (125.2-127.8) 150.8 (149.2- 152.5) 127.8 (126.4-129.2) 212.3 (202.9- 222.0) 127.8 (122.3-133.4)
Mountain
Arizona 114.4 (110.0- 119.1) 106.9 (102.7-111.1) 114.5 (110.0- 119.3) 113.9 (109.4-118.6) 140.9 (105.0- 188.7) 69.5 ( 53.3- 89.1)
Colorado 166.7 (160.2- 173.5) 130.3 (125.3-135.3) 167.4 (160.7- 174.3) 133.9 (128.7-139.3) 148.4 (116.7- 189.7) 94.6 ( 75.5-117.0)
Idaho 157.4 (146.8- 168.7) 132.4 (123.6-141.8) 158.6 (147.9- 170.0) 135.5 (126.4-145.1) ∼ ∼Montana 157.1 (145.5- 169.5) 155.7 (144.2-167.8) 149.8 (138.3- 162.1) 155.9 (144.0-168.5) ∼ ∼Nevada
New Mexico 148.2 (139.5- 157.5) 128.1 (120.6-135.9) 153.2 (144.0- 163.0) 142.8 (134.3-151.7) 122.5 ( 73.1- 199.8) 84.7 ( 51.7-130.8)
Utah 182.8 (172.8- 193.3) 119.6 (113.1-126.4) 185.3 (175.0- 196.0) 124.0 (117.3-131.1) ∼ ∼Wyoming 172.0 (154.6- 191.1) 152.2 (137.0-168.6) 172.4 (154.8- 191.7) 155.7 (140.1-172.7) ∼ ∼
Pacific 159.7 (157.9- 161.6) 127.5 (126.0-129.0) 152.3 (150.3- 154.3) 127.1 (125.4-128.8) 222.4 (212.2- 233.0) 135.4 (129.4-141.6)
Alaska 155.8 (136.1- 179.0) 86.1 ( 76.3- 96.8) 160.6 (138.2- 187.3) 94.7 ( 83.0-107.6) 377.6 (201.8- 761.0) 134.4 ( 78.3-215.2)
California 154.7 (152.5- 156.9) 119.9 (118.3-121.6) 144.3 (142.0- 146.6) 117.5 (115.7-119.4) 222.6 (211.9- 233.8) 139.2 (132.7-145.9)
San Francisco-Oakland 162.1 (156.1- 168.3) 140.0 (134.8-145.3) 154.6 (147.7- 161.7) 143.1 (136.8-149.6) 204.5 (183.3- 227.9) 149.7 (134.5-166.2)
San Jose-Monterey 166.1 (157.5- 175.2) 120.3 (114.1-126.7) 156.8 (147.6- 166.5) 121.5 (114.5-128.9) 150.0 (102.9- 230.2) 71.7 ( 50.0- 99.8)
Los Angeles 156.6 (152.4- 160.9) 113.9 (110.8-117.0) 144.8 (140.2- 149.6) 107.0 (103.6-110.5) 236.9 (220.9- 254.1) 172.4 (161.0-184.4)
Hawaii 135.5 (126.1- 145.5) 131.2 (122.1-140.7) 183.8 (160.9- 209.3) 139.4 (122.1-158.3) ∼ ∼Oregon 176.2 (169.6- 183.0) 165.8 (159.6-172.2) 173.1 (166.4- 179.9) 168.0 (161.6-174.7) 224.6 (156.2- 319.6) 121.1 ( 86.1-165.6)
Washington 182.4 (177.0- 187.9) 153.0 (148.5-157.6) 175.2 (169.7- 180.8) 154.5 (149.7-159.4) 207.9 (169.9- 254.8) 107.5 ( 88.7-129.2)
Seattle-Puget Sound 187.5 (180.8- 194.4) 154.3 (148.9-159.9) 189.4 (182.4- 196.6) 165.3 (159.2-171.5) 217.2 (175.5- 269.1) 111.9 ( 91.4-135.6)
∗ Data are from selected statewide and metropolitan area cancer registries that meet the following data quality criteria for all invasive cancer sites combined: case
ascertainment is at least 90% complete; ≥ 97% of cases pass a standard set of computerized edits; ≤ 5% of cases were ascertained by death certificate only; ≤ 3% of
cases are missing information on sex; ≤ 5% of cases are missing information on race; ≤ 3% of cases are missing information on age. See Appendix H for registry-specific
data quality information. U.S. rates cover approximately 78% of the U.S. population.
† Invasive cancers only
‡ Rates are per 100,000 persons. Population denominators for 1999 are projected from the 1990 census and may not accurately reflect the 1999 population size. Caution
should be used in interpreting rates based on these projected populations.
§ Rates are age-adjusted to the 2000 U.S. standard population.
∼ Rates are suppressed if fewer than 16 cases were reported in the specific area-race category.
Notes: Cases from suppressed rates are included in the U.S. and region/division rates. Observed region/division age-adjusted incidence rates are presented for
regions/divisions with ≥ 78% of the population covered by registries that meet the data quality criteria specified above, and if the 95% confidence intervals
around the observed region/division rates for each of four major cancers include "bias-corrected" estimated region/division rates (see technical notes) for
each of those cancers. U.S rates are as presented in Table 1.1. California, Washington, and Michigan state rates each include cases from the SEER metropolitan
areas.
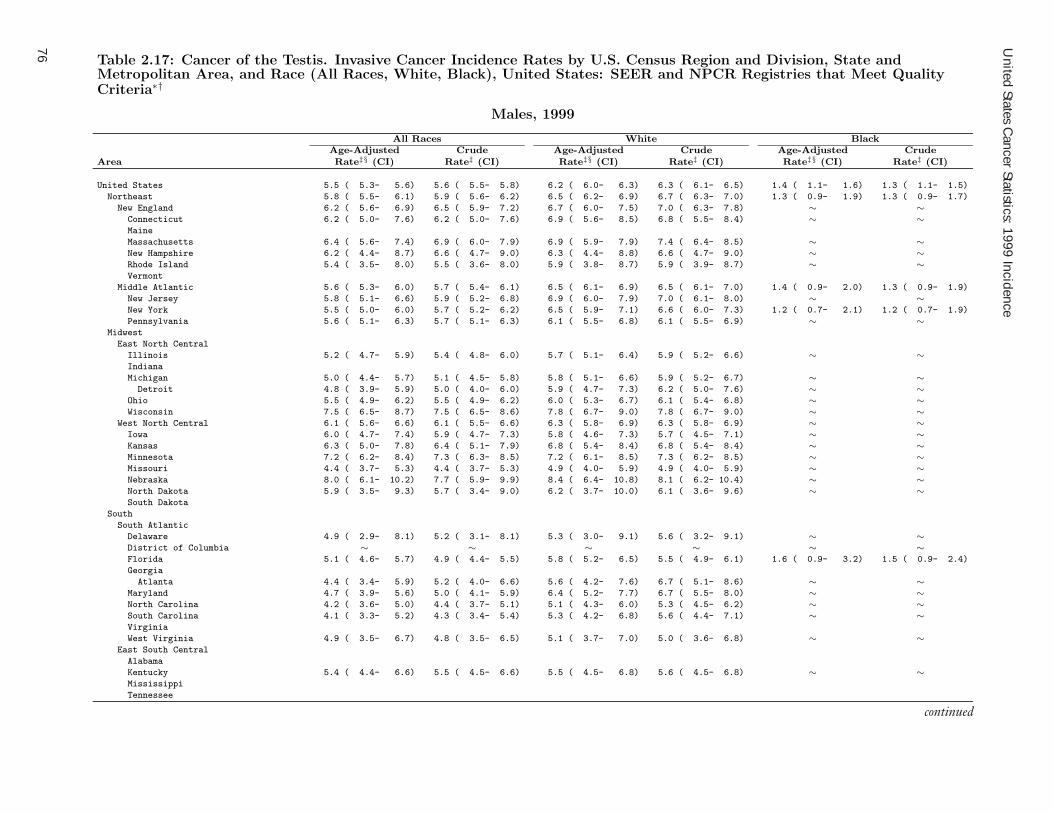
United States C
ancer Statistics: 1999 Incidence
76
Table 2.17: Cancer of the Testis. Invasive Cancer Incidence Rates by U.S. Census Region and Division, State andMetropolitan Area, and Race (All Races, White, Black), United States: SEER and NPCR Registries that Meet QualityCriteria∗†
Males, 1999
All Races White BlackAge-Adjusted Crude Age-Adjusted Crude Age-Adjusted Crude
Area Rate‡§ (CI) Rate‡ (CI) Rate‡§ (CI) Rate‡ (CI) Rate‡§ (CI) Rate‡ (CI)
United States 5.5 ( 5.3- 5.6) 5.6 ( 5.5- 5.8) 6.2 ( 6.0- 6.3) 6.3 ( 6.1- 6.5) 1.4 ( 1.1- 1.6) 1.3 ( 1.1- 1.5)
Northeast 5.8 ( 5.5- 6.1) 5.9 ( 5.6- 6.2) 6.5 ( 6.2- 6.9) 6.7 ( 6.3- 7.0) 1.3 ( 0.9- 1.9) 1.3 ( 0.9- 1.7)
New England 6.2 ( 5.6- 6.9) 6.5 ( 5.9- 7.2) 6.7 ( 6.0- 7.5) 7.0 ( 6.3- 7.8) ∼ ∼Connecticut 6.2 ( 5.0- 7.6) 6.2 ( 5.0- 7.6) 6.9 ( 5.6- 8.5) 6.8 ( 5.5- 8.4) ∼ ∼Maine
Massachusetts 6.4 ( 5.6- 7.4) 6.9 ( 6.0- 7.9) 6.9 ( 5.9- 7.9) 7.4 ( 6.4- 8.5) ∼ ∼New Hampshire 6.2 ( 4.4- 8.7) 6.6 ( 4.7- 9.0) 6.3 ( 4.4- 8.8) 6.6 ( 4.7- 9.0) ∼ ∼Rhode Island 5.4 ( 3.5- 8.0) 5.5 ( 3.6- 8.0) 5.9 ( 3.8- 8.7) 5.9 ( 3.9- 8.7) ∼ ∼Vermont
Middle Atlantic 5.6 ( 5.3- 6.0) 5.7 ( 5.4- 6.1) 6.5 ( 6.1- 6.9) 6.5 ( 6.1- 7.0) 1.4 ( 0.9- 2.0) 1.3 ( 0.9- 1.9)
New Jersey 5.8 ( 5.1- 6.6) 5.9 ( 5.2- 6.8) 6.9 ( 6.0- 7.9) 7.0 ( 6.1- 8.0) ∼ ∼New York 5.5 ( 5.0- 6.0) 5.7 ( 5.2- 6.2) 6.5 ( 5.9- 7.1) 6.6 ( 6.0- 7.3) 1.2 ( 0.7- 2.1) 1.2 ( 0.7- 1.9)
Pennsylvania 5.6 ( 5.1- 6.3) 5.7 ( 5.1- 6.3) 6.1 ( 5.5- 6.8) 6.1 ( 5.5- 6.9) ∼ ∼Midwest
East North Central
Illinois 5.2 ( 4.7- 5.9) 5.4 ( 4.8- 6.0) 5.7 ( 5.1- 6.4) 5.9 ( 5.2- 6.6) ∼ ∼Indiana
Michigan 5.0 ( 4.4- 5.7) 5.1 ( 4.5- 5.8) 5.8 ( 5.1- 6.6) 5.9 ( 5.2- 6.7) ∼ ∼Detroit 4.8 ( 3.9- 5.9) 5.0 ( 4.0- 6.0) 5.9 ( 4.7- 7.3) 6.2 ( 5.0- 7.6) ∼ ∼
Ohio 5.5 ( 4.9- 6.2) 5.5 ( 4.9- 6.2) 6.0 ( 5.3- 6.7) 6.1 ( 5.4- 6.8) ∼ ∼Wisconsin 7.5 ( 6.5- 8.7) 7.5 ( 6.5- 8.6) 7.8 ( 6.7- 9.0) 7.8 ( 6.7- 9.0) ∼ ∼
West North Central 6.1 ( 5.6- 6.6) 6.1 ( 5.5- 6.6) 6.3 ( 5.8- 6.9) 6.3 ( 5.8- 6.9) ∼ ∼Iowa 6.0 ( 4.7- 7.4) 5.9 ( 4.7- 7.3) 5.8 ( 4.6- 7.3) 5.7 ( 4.5- 7.1) ∼ ∼Kansas 6.3 ( 5.0- 7.8) 6.4 ( 5.1- 7.9) 6.8 ( 5.4- 8.4) 6.8 ( 5.4- 8.4) ∼ ∼Minnesota 7.2 ( 6.2- 8.4) 7.3 ( 6.3- 8.5) 7.2 ( 6.1- 8.5) 7.3 ( 6.2- 8.5) ∼ ∼Missouri 4.4 ( 3.7- 5.3) 4.4 ( 3.7- 5.3) 4.9 ( 4.0- 5.9) 4.9 ( 4.0- 5.9) ∼ ∼Nebraska 8.0 ( 6.1- 10.2) 7.7 ( 5.9- 9.9) 8.4 ( 6.4- 10.8) 8.1 ( 6.2- 10.4) ∼ ∼North Dakota 5.9 ( 3.5- 9.3) 5.7 ( 3.4- 9.0) 6.2 ( 3.7- 10.0) 6.1 ( 3.6- 9.6) ∼ ∼South Dakota
South
South Atlantic
Delaware 4.9 ( 2.9- 8.1) 5.2 ( 3.1- 8.1) 5.3 ( 3.0- 9.1) 5.6 ( 3.2- 9.1) ∼ ∼District of Columbia ∼ ∼ ∼ ∼ ∼ ∼Florida 5.1 ( 4.6- 5.7) 4.9 ( 4.4- 5.5) 5.8 ( 5.2- 6.5) 5.5 ( 4.9- 6.1) 1.6 ( 0.9- 3.2) 1.5 ( 0.9- 2.4)
Georgia
Atlanta 4.4 ( 3.4- 5.9) 5.2 ( 4.0- 6.6) 5.6 ( 4.2- 7.6) 6.7 ( 5.1- 8.6) ∼ ∼Maryland 4.7 ( 3.9- 5.6) 5.0 ( 4.1- 5.9) 6.4 ( 5.2- 7.7) 6.7 ( 5.5- 8.0) ∼ ∼North Carolina 4.2 ( 3.6- 5.0) 4.4 ( 3.7- 5.1) 5.1 ( 4.3- 6.0) 5.3 ( 4.5- 6.2) ∼ ∼South Carolina 4.1 ( 3.3- 5.2) 4.3 ( 3.4- 5.4) 5.3 ( 4.2- 6.8) 5.6 ( 4.4- 7.1) ∼ ∼Virginia
West Virginia 4.9 ( 3.5- 6.7) 4.8 ( 3.5- 6.5) 5.1 ( 3.7- 7.0) 5.0 ( 3.6- 6.8) ∼ ∼East South Central
Alabama
Kentucky 5.4 ( 4.4- 6.6) 5.5 ( 4.5- 6.6) 5.5 ( 4.5- 6.8) 5.6 ( 4.5- 6.8) ∼ ∼Mississippi
Tennessee
continued

Cancer Incidence, by U
.S. Census R
egion and Division, State, and M
etropolitan Area
77
Table 2.17: Cancer of the Testis. Invasive Cancer Incidence Rates by U.S. Census Region and Division, State andMetropolitan Area, and Race (All Races, White, Black), United States: SEER and NPCR Registries that Meet QualityCriteria∗† (continued)
Males, 1999
All Races White BlackAge-Adjusted Crude Age-Adjusted Crude Age-Adjusted Crude
Area Rate‡§ (CI) Rate‡ (CI) Rate‡§ (CI) Rate‡ (CI) Rate‡§ (CI) Rate‡ (CI)
West South Central
Arkansas
Louisiana 3.7 ( 2.9- 4.7) 3.6 ( 2.8- 4.5) 4.9 ( 3.8- 6.3) 4.9 ( 3.8- 6.2) ∼ ∼Oklahoma
Texas
West 5.7 ( 5.4- 5.9) 5.9 ( 5.6- 6.2) 6.3 ( 6.0- 6.6) 6.5 ( 6.2- 6.8) 1.5 ( 0.9- 2.5) 1.5 ( 0.9- 2.2)
Mountain
Arizona 5.5 ( 4.6- 6.6) 5.4 ( 4.5- 6.4) 5.9 ( 4.9- 7.1) 5.8 ( 4.8- 6.9) ∼ ∼Colorado 7.5 ( 6.4- 8.9) 7.7 ( 6.5- 9.0) 7.6 ( 6.4- 9.0) 7.7 ( 6.5- 9.1) ∼ ∼Idaho 6.3 ( 4.5- 8.9) 5.9 ( 4.2- 8.2) 6.4 ( 4.5- 9.0) 5.9 ( 4.2- 8.2) ∼ ∼Montana 6.3 ( 4.1- 9.4) 5.9 ( 3.9- 8.7) 6.2 ( 3.9- 9.4) 5.9 ( 3.8- 8.8) ∼ ∼Nevada
New Mexico 5.7 ( 4.2- 7.7) 5.5 ( 4.0- 7.3) 5.8 ( 4.2- 8.0) 5.5 ( 4.0- 7.5) ∼ ∼Utah 4.3 ( 3.1- 6.0) 4.4 ( 3.3- 5.9) 4.4 ( 3.2- 6.1) 4.6 ( 3.3- 6.1) ∼ ∼Wyoming ∼ ∼ ∼ ∼ ∼ ∼
Pacific 5.5 ( 5.2- 5.9) 5.8 ( 5.5- 6.2) 6.3 ( 6.0- 6.7) 6.7 ( 6.3- 7.1) 1.3 ( 0.7- 2.4) 1.3 ( 0.8- 2.0)
Alaska 8.4 ( 5.5- 15.3) 8.3 ( 5.5- 12.1) 10.4 ( 6.7- 19.3) 10.5 ( 6.8- 15.4) ∼ ∼California 5.3 ( 4.9- 5.6) 5.6 ( 5.2- 6.0) 6.1 ( 5.7- 6.6) 6.5 ( 6.1- 7.0) 1.3 ( 0.7- 2.5) 1.3 ( 0.7- 2.1)
San Francisco-Oakland 6.3 ( 5.2- 7.4) 6.9 ( 5.8- 8.1) 7.9 ( 6.6- 9.6) 8.8 ( 7.3- 10.5) ∼ ∼San Jose-Monterey 5.5 ( 4.3- 7.1) 6.2 ( 4.9- 7.8) 6.6 ( 5.1- 8.5) 7.3 ( 5.6- 9.3) ∼ ∼Los Angeles 3.9 ( 3.4- 4.5) 4.3 ( 3.7- 4.9) 4.9 ( 4.2- 5.7) 5.3 ( 4.6- 6.1) ∼ ∼
Hawaii 5.2 ( 3.6- 7.5) 5.3 ( 3.6- 7.5) ∼ ∼ ∼ ∼Oregon 7.2 ( 5.9- 8.6) 7.2 ( 6.0- 8.6) 7.4 ( 6.1- 9.0) 7.4 ( 6.1- 8.9) ∼ ∼Washington 6.1 ( 5.3- 7.1) 6.4 ( 5.5- 7.4) 6.4 ( 5.5- 7.5) 6.6 ( 5.6- 7.7) ∼ ∼
Seattle-Puget Sound 5.9 ( 4.9- 7.1) 6.3 ( 5.3- 7.5) 6.5 ( 5.4- 7.9) 7.0 ( 5.8- 8.3) ∼ ∼∗ Data are from selected statewide and metropolitan area cancer registries that meet the following data quality criteria for all invasive cancer sites combined: case
ascertainment is at least 90% complete; ≥ 97% of cases pass a standard set of computerized edits; ≤ 5% of cases were ascertained by death certificate only; ≤ 3% of
cases are missing information on sex; ≤ 5% of cases are missing information on race; ≤ 3% of cases are missing information on age. See Appendix H for registry-specific
data quality information. U.S. rates cover approximately 78% of the U.S. population.
† Invasive cancers only
‡ Rates are per 100,000 persons. Population denominators for 1999 are projected from the 1990 census and may not accurately reflect the 1999 population size. Caution
should be used in interpreting rates based on these projected populations.
§ Rates are age-adjusted to the 2000 U.S. standard population.
∼ Rates are suppressed if fewer than 16 cases were reported in the specific area-race category.
Notes: Cases from suppressed rates are included in the U.S. and region/division rates. Observed region/division age-adjusted incidence rates are presented for
regions/divisions with ≥ 78% of the population covered by registries that meet the data quality criteria specified above, and if the 95% confidence intervals
around the observed region/division rates for each of four major cancers include "bias-corrected" estimated region/division rates (see technical notes) for
each of those cancers. U.S rates are as presented in Table 1.1. California, Washington, and Michigan state rates each include cases from the SEER metropolitan
areas.

United States C
ancer Statistics: 1999 Incidence
78
Table 2.18.1: Cancer of the Urinary Bladder. Invasive Cancer Incidence Rates by U.S. Census Region and Division,State and Metropolitan Area, and Race (All Races, White, Black), United States: SEER and NPCR Registries thatMeet Quality Criteria∗†
Males, 1999
All Races White BlackAge-Adjusted Crude Age-Adjusted Crude Age-Adjusted Crude
Area Rate‡§ (CI) Rate‡ (CI) Rate‡§ (CI) Rate‡ (CI) Rate‡§ (CI) Rate‡ (CI)
United States 38.3 ( 37.9- 38.7) 33.5 ( 33.2- 33.9) 40.2 ( 39.8- 40.7) 37.7 ( 37.3- 38.1) 17.9 ( 16.9- 19.0) 10.0 ( 9.5- 10.6)
Northeast 43.0 ( 42.1- 43.9) 40.0 ( 39.2- 40.8) 45.4 ( 44.5- 46.3) 45.6 ( 44.6- 46.5) 17.6 ( 15.6- 19.8) 10.4 ( 9.3- 11.6)
New England 45.3 ( 43.5- 47.2) 41.5 ( 39.8- 43.2) 46.0 ( 44.1- 48.0) 44.5 ( 42.7- 46.4) 26.1 ( 18.2- 36.8) 11.0 ( 7.9- 14.9)
Connecticut 46.0 ( 42.6- 49.6) 43.5 ( 40.4- 46.9) 46.7 ( 43.2- 50.4) 47.1 ( 43.6- 50.9) 32.2 ( 19.5- 51.1) 15.1 ( 9.4- 22.8)
Maine
Massachusetts 43.5 ( 41.0- 46.1) 39.5 ( 37.3- 41.8) 44.0 ( 41.5- 46.7) 42.6 ( 40.1- 45.1) 21.3 ( 11.7- 37.2) 8.6 ( 5.0- 13.8)
New Hampshire 43.1 ( 37.3- 49.5) 35.5 ( 30.9- 40.7) 43.6 ( 37.8- 50.1) 36.4 ( 31.6- 41.7) ∼ ∼Rhode Island 55.8 ( 49.2- 63.1) 54.3 ( 47.9- 61.4) 57.2 ( 50.4- 64.8) 58.6 ( 51.6- 66.2) ∼ ∼Vermont
Middle Atlantic 42.3 ( 41.3- 43.3) 39.6 ( 38.7- 40.5) 45.2 ( 44.1- 46.3) 45.9 ( 44.8- 47.0) 16.7 ( 14.7- 19.0) 10.3 ( 9.1- 11.6)
New Jersey 45.9 ( 43.7- 48.2) 41.7 ( 39.8- 43.8) 50.3 ( 47.8- 52.8) 50.2 ( 47.8- 52.8) 16.2 ( 12.0- 21.6) 9.9 ( 7.4- 12.8)
New York 38.7 ( 37.3- 40.1) 34.5 ( 33.3- 35.8) 42.0 ( 40.4- 43.6) 41.2 ( 39.7- 42.8) 14.7 ( 12.2- 17.7) 8.8 ( 7.4- 10.5)
Pennsylvania 45.0 ( 43.3- 46.8) 45.9 ( 44.1- 47.7) 46.2 ( 44.4- 48.1) 49.4 ( 47.4- 51.3) 22.1 ( 17.5- 27.7) 15.0 ( 11.9- 18.6)
Midwest
East North Central
Illinois 37.8 ( 36.1- 39.6) 31.3 ( 29.9- 32.7) 39.1 ( 37.2- 41.0) 34.7 ( 33.1- 36.4) 18.8 ( 14.9- 23.4) 10.2 ( 8.2- 12.5)
Indiana
Michigan 41.9 ( 39.9- 44.0) 35.4 ( 33.8- 37.2) 44.1 ( 42.0- 46.4) 39.3 ( 37.4- 41.3) 22.6 ( 18.3- 27.9) 14.4 ( 11.6- 17.6)
Detroit 41.5 ( 38.4- 44.8) 34.9 ( 32.4- 37.7) 46.5 ( 42.8- 50.5) 41.8 ( 38.6- 45.3) 23.8 ( 18.7- 30.1) 16.6 ( 13.1- 20.8)
Ohio 41.2 ( 39.4- 43.1) 36.3 ( 34.7- 38.0) 41.4 ( 39.4- 43.4) 38.0 ( 36.3- 39.8) 22.1 ( 17.5- 27.8) 13.7 ( 10.9- 17.0)
Wisconsin 37.6 ( 35.1- 40.3) 33.5 ( 31.3- 35.8) 38.3 ( 35.8- 41.0) 35.9 ( 33.6- 38.4) ∼ ∼West North Central 36.8 ( 35.5- 38.2) 33.2 ( 32.1- 34.5) 37.1 ( 35.8- 38.5) 35.0 ( 33.7- 36.3) 18.7 ( 13.6- 25.3) 9.6 ( 7.1- 12.7)
Iowa 38.6 ( 35.4- 42.1) 38.2 ( 35.1- 41.6) 38.2 ( 35.0- 41.7) 38.8 ( 35.5- 42.2) ∼ ∼Kansas 34.7 ( 31.4- 38.3) 30.7 ( 27.8- 33.9) 34.3 ( 30.9- 37.9) 31.7 ( 28.6- 35.0) ∼ ∼Minnesota 37.5 ( 34.8- 40.3) 31.5 ( 29.3- 33.9) 37.2 ( 34.5- 40.1) 32.9 ( 30.5- 35.4) ∼ ∼Missouri 34.7 ( 32.3- 37.2) 31.6 ( 29.5- 33.8) 36.1 ( 33.6- 38.7) 34.5 ( 32.2- 37.0) 15.6 ( 10.2- 23.2) 9.7 ( 6.5- 14.0)
Nebraska 40.4 ( 35.9- 45.3) 36.7 ( 32.6- 41.1) 40.5 ( 36.0- 45.5) 38.3 ( 34.0- 42.9) ∼ ∼North Dakota 40.5 ( 33.6- 48.3) 39.4 ( 32.7- 46.9) 40.8 ( 33.9- 48.9) 41.7 ( 34.7- 49.8) ∼ ∼South Dakota
South
South Atlantic
Delaware 33.9 ( 27.8- 41.3) 30.3 ( 24.9- 36.5) 34.6 ( 28.1- 42.7) 34.5 ( 28.1- 42.0) ∼ ∼District of Columbia 19.9 ( 14.4- 27.0) 18.0 ( 13.1- 24.2) ∼ ∼ 18.7 ( 12.2- 27.8) 17.8 ( 11.6- 26.0)
Florida 41.4 ( 40.1- 42.8) 49.5 ( 47.9- 51.2) 43.4 ( 41.9- 44.9) 57.9 ( 56.0- 59.8) 12.6 ( 9.6- 16.5) 6.4 ( 5.0- 8.0)
Georgia
Atlanta 29.2 ( 25.1- 34.0) 15.2 ( 13.2- 17.5) 32.4 ( 27.6- 38.1) 20.5 ( 17.6- 23.7) 18.6 ( 11.2- 29.8) 5.8 ( 3.7- 8.7)
Maryland 30.4 ( 28.0- 33.0) 24.2 ( 22.4- 26.2) 34.7 ( 31.8- 37.9) 31.6 ( 29.0- 34.4) 12.1 ( 8.8- 16.7) 7.3 ( 5.4- 9.6)
North Carolina 31.7 ( 29.6- 33.8) 26.3 ( 24.7- 28.0) 34.2 ( 31.9- 36.6) 31.4 ( 29.4- 33.6) 18.4 ( 14.4- 23.3) 9.9 ( 7.8- 12.3)
South Carolina 34.9 ( 32.0- 38.2) 28.9 ( 26.5- 31.4) 39.5 ( 36.0- 43.4) 37.0 ( 33.8- 40.4) 16.7 ( 12.3- 22.4) 9.5 ( 7.0- 12.4)
Virginia
West Virginia 39.8 ( 35.7- 44.3) 40.6 ( 36.5- 45.1) 40.1 ( 35.9- 44.7) 41.2 ( 37.0- 45.8) ∼ ∼East South Central
Alabama
Kentucky 37.0 ( 34.1- 40.2) 31.7 ( 29.2- 34.3) 37.2 ( 34.2- 40.5) 32.8 ( 30.2- 35.6) 23.5 ( 13.7- 38.1) 13.1 ( 7.8- 20.7)
Mississippi
Tennessee
continued

Cancer Incidence, by U
.S. Census R
egion and Division, State, and M
etropolitan Area
79
Table 2.18.1: Cancer of the Urinary Bladder. Invasive Cancer Incidence Rates by U.S. Census Region and Division,State and Metropolitan Area, and Race (All Races, White, Black), United States: SEER and NPCR Registries thatMeet Quality Criteria∗† (continued)
Males, 1999
All Races White BlackAge-Adjusted Crude Age-Adjusted Crude Age-Adjusted Crude
Area Rate‡§ (CI) Rate‡ (CI) Rate‡§ (CI) Rate‡ (CI) Rate‡§ (CI) Rate‡ (CI)
West South Central
Arkansas
Louisiana 32.9 ( 30.1- 35.9) 25.7 ( 23.6- 28.0) 37.5 ( 34.1- 41.2) 33.4 ( 30.5- 36.6) 18.7 ( 14.4- 23.9) 10.5 ( 8.1- 13.2)
Oklahoma
Texas
West 34.8 ( 34.0- 35.5) 27.3 ( 26.7- 27.9) 36.6 ( 35.8- 37.5) 30.2 ( 29.5- 30.9) 18.3 ( 15.4- 21.5) 10.1 ( 8.7- 11.8)
Mountain
Arizona 39.3 ( 36.6- 42.1) 35.0 ( 32.6- 37.4) 40.2 ( 37.5- 43.2) 38.2 ( 35.6- 41.0) ∼ ∼Colorado 32.0 ( 29.1- 35.1) 24.5 ( 22.4- 26.8) 31.7 ( 28.8- 34.9) 24.9 ( 22.7- 27.3) ∼ ∼Idaho 35.5 ( 30.5- 41.1) 29.9 ( 25.8- 34.5) 35.3 ( 30.3- 40.9) 30.2 ( 26.0- 34.9) ∼ ∼Montana 34.2 ( 28.8- 40.4) 32.8 ( 27.6- 38.6) 33.2 ( 27.9- 39.5) 33.4 ( 28.0- 39.5) ∼ ∼Nevada
New Mexico 27.5 ( 23.8- 31.8) 22.9 ( 19.8- 26.4) 28.7 ( 24.7- 33.2) 25.7 ( 22.2- 29.6) ∼ ∼Utah 36.0 ( 31.5- 40.9) 22.8 ( 20.0- 25.9) 36.8 ( 32.2- 41.9) 23.9 ( 21.0- 27.1) ∼ ∼Wyoming 42.5 ( 33.8- 53.1) 35.7 ( 28.5- 44.0) 43.3 ( 34.4- 54.0) 37.1 ( 29.7- 45.8) ∼ ∼
Pacific 34.6 ( 33.7- 35.5) 26.9 ( 26.2- 27.6) 37.0 ( 36.0- 38.0) 30.1 ( 29.3- 31.0) 18.2 ( 15.2- 21.7) 10.3 ( 8.7- 12.1)
Alaska 33.8 ( 24.1- 47.5) 16.6 ( 12.5- 21.7) 36.4 ( 25.1- 52.9) 18.5 ( 13.6- 24.7) ∼ ∼California 33.2 ( 32.1- 34.2) 25.0 ( 24.2- 25.8) 35.7 ( 34.5- 36.8) 28.4 ( 27.5- 29.3) 17.4 ( 14.4- 21.0) 10.2 ( 8.5- 12.1)
San Francisco-Oakland 30.2 ( 27.6- 32.9) 25.7 ( 23.6- 28.1) 34.4 ( 31.2- 37.9) 31.7 ( 28.8- 34.9) 15.6 ( 9.9- 23.9) 10.6 ( 6.9- 15.7)
San Jose-Monterey 28.9 ( 25.3- 32.9) 20.4 ( 17.9- 23.2) 31.3 ( 27.2- 35.9) 23.7 ( 20.6- 27.1) ∼ ∼Los Angeles 30.3 ( 28.4- 32.3) 21.1 ( 19.8- 22.5) 33.3 ( 31.1- 35.7) 23.9 ( 22.3- 25.6) 17.6 ( 13.2- 23.2) 11.5 ( 8.7- 15.0)
Hawaii 20.9 ( 17.3- 25.1) 20.2 ( 16.7- 24.1) 40.2 ( 29.9- 53.1) 30.7 ( 22.9- 40.3) ∼ ∼Oregon 42.8 ( 39.6- 46.3) 39.7 ( 36.7- 42.9) 42.6 ( 39.3- 46.2) 40.8 ( 37.7- 44.2) ∼ ∼Washington 40.6 ( 38.0- 43.3) 32.9 ( 30.8- 35.1) 39.7 ( 37.1- 42.5) 34.0 ( 31.7- 36.3) ∼ ∼
Seattle-Puget Sound 43.1 ( 39.9- 46.6) 34.1 ( 31.6- 36.8) 44.0 ( 40.6- 47.6) 37.1 ( 34.2- 40.1) ∼ ∼∗ Data are from selected statewide and metropolitan area cancer registries that meet the following data quality criteria for all invasive cancer sites combined: case
ascertainment is at least 90% complete; ≥ 97% of cases pass a standard set of computerized edits; ≤ 5% of cases were ascertained by death certificate only; ≤ 3% of
cases are missing information on sex; ≤ 5% of cases are missing information on race; ≤ 3% of cases are missing information on age. See Appendix H for registry-specific
data quality information. U.S. rates cover approximately 78% of the U.S. population.
† Includes invasive and in situ
‡ Rates are per 100,000 persons. Population denominators for 1999 are projected from the 1990 census and may not accurately reflect the 1999 population size. Caution
should be used in interpreting rates based on these projected populations.
§ Rates are age-adjusted to the 2000 U.S. standard population.
∼ Rates are suppressed if fewer than 16 cases were reported in the specific area-race category.
Notes: Cases from suppressed rates are included in the U.S. and region/division rates. Observed region/division age-adjusted incidence rates are presented for
regions/divisions with ≥ 78% of the population covered by registries that meet the data quality criteria specified above, and if the 95% confidence intervals
around the observed region/division rates for each of four major cancers include "bias-corrected" estimated region/division rates (see technical notes) for
each of those cancers. U.S rates are as presented in Table 1.1. California, Washington, and Michigan state rates each include cases from the SEER metropolitan
areas.

United States C
ancer Statistics: 1999 Incidence
80
Table 2.18.2: Cancer of the Urinary Bladder. Invasive Cancer Incidence Rates by U.S. Census Region and Division,State and Metropolitan Area, and Race (All Races, White, Black), United States: SEER and NPCR Registries thatMeet Quality Criteria∗†
Females, 1999
All Races White BlackAge-Adjusted Crude Age-Adjusted Crude Age-Adjusted Crude
Area Rate‡§ (CI) Rate‡ (CI) Rate‡§ (CI) Rate‡ (CI) Rate‡§ (CI) Rate‡ (CI)
United States 10.0 ( 9.8- 10.2) 11.4 ( 11.2- 11.6) 10.4 ( 10.2- 10.6) 12.7 ( 12.4- 12.9) 7.1 ( 6.6- 7.7) 5.4 ( 5.0- 5.8)
Northeast 11.6 ( 11.2- 12.0) 14.2 ( 13.8- 14.7) 12.2 ( 11.7- 12.6) 16.0 ( 15.4- 16.5) 6.4 ( 5.5- 7.4) 5.3 ( 4.6- 6.2)
New England 12.9 ( 12.0- 13.7) 15.5 ( 14.5- 16.6) 12.9 ( 12.1- 13.9) 16.5 ( 15.4- 17.6) 7.9 ( 4.7- 12.5) 4.8 ( 2.9- 7.4)
Connecticut 13.3 ( 11.8- 15.1) 16.2 ( 14.4- 18.3) 13.7 ( 12.1- 15.6) 17.6 ( 15.6- 19.9) ∼ ∼Maine
Massachusetts 12.3 ( 11.2- 13.5) 14.8 ( 13.5- 16.2) 12.3 ( 11.1- 13.5) 15.7 ( 14.2- 17.2) ∼ ∼New Hampshire 12.5 ( 9.9- 15.6) 13.3 ( 10.6- 16.5) 12.3 ( 9.7- 15.4) 13.3 ( 10.5- 16.5) ∼ ∼Rhode Island 14.9 ( 12.1- 18.3) 20.2 ( 16.5- 24.5) 15.2 ( 12.3- 18.8) 21.5 ( 17.6- 26.2) ∼ ∼Vermont
Middle Atlantic 11.2 ( 10.8- 11.7) 13.8 ( 13.3- 14.4) 11.9 ( 11.4- 12.4) 15.8 ( 15.2- 16.4) 6.3 ( 5.4- 7.4) 5.4 ( 4.6- 6.3)
New Jersey 11.1 ( 10.2- 12.1) 13.4 ( 12.3- 14.5) 11.8 ( 10.8- 12.9) 15.6 ( 14.3- 17.0) 6.6 ( 4.5- 9.4) 5.1 ( 3.5- 7.2)
New York 11.0 ( 10.4- 11.6) 13.0 ( 12.3- 13.7) 12.0 ( 11.3- 12.8) 15.5 ( 14.6- 16.4) 4.9 ( 3.8- 6.2) 4.2 ( 3.3- 5.3)
Pennsylvania 11.6 ( 10.9- 12.4) 15.5 ( 14.5- 16.5) 11.8 ( 11.0- 12.6) 16.4 ( 15.3- 17.5) 9.7 ( 7.3- 12.6) 9.0 ( 6.8- 11.7)
Midwest
East North Central
Illinois 10.2 ( 9.5- 11.0) 11.4 ( 10.6- 12.3) 10.4 ( 9.6- 11.3) 12.5 ( 11.5- 13.5) 9.3 ( 7.2- 11.8) 6.8 ( 5.3- 8.7)
Indiana
Michigan 10.9 ( 10.0- 11.8) 11.9 ( 11.0- 12.9) 11.1 ( 10.2- 12.1) 12.9 ( 11.9- 14.1) 8.8 ( 6.6- 11.5) 7.0 ( 5.3- 9.2)
Detroit 11.1 ( 9.8- 12.6) 12.4 ( 11.0- 14.0) 11.5 ( 10.0- 13.1) 14.0 ( 12.2- 16.0) 9.8 ( 7.2- 13.1) 8.4 ( 6.2- 11.2)
Ohio 10.8 ( 10.0- 11.6) 12.5 ( 11.7- 13.5) 10.7 ( 9.9- 11.6) 13.1 ( 12.1- 14.1) 8.0 ( 5.8- 10.7) 6.5 ( 4.8- 8.7)
Wisconsin 10.4 ( 9.3- 11.7) 11.9 ( 10.6- 13.3) 10.7 ( 9.5- 11.9) 12.7 ( 11.4- 14.2) ∼ ∼West North Central 8.8 ( 8.2- 9.4) 10.4 ( 9.7- 11.0) 8.7 ( 8.1- 9.3) 10.7 ( 10.0- 11.4) 6.8 ( 4.4- 10.1) 4.8 ( 3.1- 7.0)
Iowa 8.4 ( 7.1- 9.8) 10.8 ( 9.2- 12.6) 8.2 ( 6.9- 9.7) 10.8 ( 9.2- 12.7) ∼ ∼Kansas 10.2 ( 8.6- 11.9) 12.2 ( 10.4- 14.2) 9.8 ( 8.3- 11.6) 12.3 ( 10.5- 14.5) ∼ ∼Minnesota 10.1 ( 8.9- 11.4) 11.0 ( 9.7- 12.4) 10.0 ( 8.8- 11.3) 11.5 ( 10.1- 12.9) ∼ ∼Missouri 7.7 ( 6.8- 8.8) 9.1 ( 8.0- 10.3) 7.7 ( 6.8- 8.8) 9.5 ( 8.3- 10.8) 7.7 ( 4.7- 12.0) 6.1 ( 3.7- 9.4)
Nebraska 7.3 ( 5.7- 9.3) 8.8 ( 6.9- 11.1) 7.3 ( 5.7- 9.3) 9.0 ( 7.1- 11.4) ∼ ∼North Dakota 8.9 ( 6.2- 12.6) 11.3 ( 7.9- 15.7) 8.8 ( 6.0- 12.6) 11.7 ( 8.2- 16.3) ∼ ∼South Dakota
South
South Atlantic
Delaware 13.2 ( 10.0- 17.2) 14.5 ( 10.9- 18.8) 13.2 ( 9.7- 17.7) 16.1 ( 11.8- 21.3) ∼ ∼District of Columbia 11.7 ( 8.3- 16.3) 14.8 ( 10.6- 20.1) ∼ ∼ 10.6 ( 6.9- 16.5) 14.9 ( 9.8- 21.9)
Florida 11.1 ( 10.4- 11.7) 15.9 ( 15.1- 16.8) 11.5 ( 10.8- 12.2) 18.3 ( 17.2- 19.3) 7.9 ( 6.0- 10.2) 5.2 ( 4.0- 6.6)
Georgia
Atlanta 9.8 ( 8.0- 12.0) 7.2 ( 5.9- 8.8) 9.1 ( 7.1- 11.5) 8.1 ( 6.3- 10.2) 13.2 ( 8.7- 19.4) 6.2 ( 4.1- 9.0)
Maryland 9.8 ( 8.7- 11.0) 10.2 ( 9.1- 11.5) 10.7 ( 9.3- 12.2) 13.0 ( 11.4- 14.8) 5.2 ( 3.4- 7.7) 3.5 ( 2.3- 5.1)
North Carolina 8.4 ( 7.5- 9.3) 9.3 ( 8.4- 10.3) 9.2 ( 8.3- 10.3) 11.2 ( 10.0- 12.5) 4.5 ( 3.1- 6.3) 3.8 ( 2.6- 5.3)
South Carolina 7.6 ( 6.5- 8.8) 8.2 ( 7.0- 9.6) 7.6 ( 6.4- 9.1) 9.4 ( 7.8- 11.1) 7.1 ( 4.9- 9.8) 5.8 ( 4.1- 8.1)
Virginia
West Virginia 13.8 ( 11.8- 16.1) 17.9 ( 15.3- 20.9) 13.7 ( 11.6- 16.1) 17.9 ( 15.2- 20.9) ∼ ∼East South Central
Alabama
Kentucky 8.9 ( 7.8- 10.3) 10.1 ( 8.7- 11.5) 8.9 ( 7.7- 10.3) 10.3 ( 8.9- 11.8) ∼ ∼Mississippi
Tennessee
continued

Cancer Incidence, by U
.S. Census R
egion and Division, State, and M
etropolitan Area
81
Table 2.18.2: Cancer of the Urinary Bladder. Invasive Cancer Incidence Rates by U.S. Census Region and Division,State and Metropolitan Area, and Race (All Races, White, Black), United States: SEER and NPCR Registries thatMeet Quality Criteria∗† (continued)
Females, 1999
All Races White BlackAge-Adjusted Crude Age-Adjusted Crude Age-Adjusted Crude
Area Rate‡§ (CI) Rate‡ (CI) Rate‡§ (CI) Rate‡ (CI) Rate‡§ (CI) Rate‡ (CI)
West South Central
Arkansas
Louisiana 7.4 ( 6.3- 8.6) 7.6 ( 6.5- 8.8) 7.7 ( 6.4- 9.1) 8.9 ( 7.5- 10.6) 6.6 ( 4.7- 9.1) 5.2 ( 3.7- 7.1)
Oklahoma
Texas
West 8.6 ( 8.2- 8.9) 8.6 ( 8.3- 8.9) 9.1 ( 8.7- 9.5) 9.6 ( 9.2- 10.0) 6.2 ( 4.8- 7.8) 4.3 ( 3.4- 5.5)
Mountain
Arizona 9.3 ( 8.2- 10.6) 10.2 ( 9.0- 11.6) 9.7 ( 8.5- 11.0) 11.3 ( 9.9- 12.8) ∼ ∼Colorado 9.1 ( 7.8- 10.5) 8.7 ( 7.4- 10.0) 9.4 ( 8.0- 10.9) 9.2 ( 7.9- 10.7) ∼ ∼Idaho 7.2 ( 5.2- 9.7) 7.2 ( 5.2- 9.6) 7.3 ( 5.3- 9.9) 7.4 ( 5.4- 9.9) ∼ ∼Montana 10.4 ( 7.8- 13.7) 12.4 ( 9.3- 16.1) 10.5 ( 7.8- 13.9) 13.2 ( 9.9- 17.2) ∼ ∼Nevada
New Mexico 7.9 ( 6.1- 10.0) 7.8 ( 6.1- 9.9) 8.4 ( 6.5- 10.7) 8.9 ( 6.9- 11.3) ∼ ∼Utah 8.3 ( 6.5- 10.5) 6.5 ( 5.1- 8.2) 8.4 ( 6.6- 10.7) 6.8 ( 5.3- 8.6) ∼ ∼Wyoming 9.2 ( 5.8- 14.1) 9.6 ( 6.1- 14.5) 9.4 ( 5.9- 14.4) 10.1 ( 6.4- 15.1) ∼ ∼
Pacific 8.5 ( 8.1- 8.9) 8.5 ( 8.1- 8.9) 9.1 ( 8.6- 9.5) 9.6 ( 9.1- 10.0) 6.4 ( 4.9- 8.1) 4.6 ( 3.6- 5.9)
Alaska 10.8 ( 6.0- 18.3) 5.4 ( 3.1- 8.8) ∼ ∼ ∼ ∼California 8.2 ( 7.8- 8.7) 8.1 ( 7.7- 8.6) 8.9 ( 8.4- 9.4) 9.3 ( 8.8- 9.8) 6.3 ( 4.8- 8.2) 4.7 ( 3.6- 6.1)
San Francisco-Oakland 9.0 ( 7.8- 10.3) 9.9 ( 8.6- 11.4) 9.9 ( 8.4- 11.6) 12.0 ( 10.3- 14.0) ∼ ∼San Jose-Monterey 7.4 ( 5.8- 9.2) 7.0 ( 5.5- 8.7) 7.9 ( 6.2- 10.0) 8.1 ( 6.3- 10.2) ∼ ∼Los Angeles 7.3 ( 6.5- 8.1) 7.0 ( 6.2- 7.8) 8.0 ( 7.1- 9.0) 7.9 ( 7.0- 8.9) 7.1 ( 4.9- 10.0) 6.0 ( 4.1- 8.4)
Hawaii 5.4 ( 3.8- 7.6) 6.1 ( 4.3- 8.4) ∼ ∼ ∼ ∼Oregon 9.8 ( 8.5- 11.4) 11.4 ( 9.8- 13.1) 9.9 ( 8.5- 11.5) 11.9 ( 10.2- 13.7) ∼ ∼Washington 9.6 ( 8.5- 10.7) 9.8 ( 8.6- 11.0) 9.4 ( 8.3- 10.6) 10.1 ( 8.9- 11.4) ∼ ∼
Seattle-Puget Sound 10.0 ( 8.7- 11.5) 10.1 ( 8.7- 11.6) 10.4 ( 8.9- 12.0) 11.1 ( 9.6- 12.8) ∼ ∼∗ Data are from selected statewide and metropolitan area cancer registries that meet the following data quality criteria for all invasive cancer sites combined: case
ascertainment is at least 90% complete; ≥ 97% of cases pass a standard set of computerized edits; ≤ 5% of cases were ascertained by death certificate only; ≤ 3% of
cases are missing information on sex; ≤ 5% of cases are missing information on race; ≤ 3% of cases are missing information on age. See Appendix H for registry-specific
data quality information. U.S. rates cover approximately 78% of the U.S. population.
† Includes invasive and in situ
‡ Rates are per 100,000 persons. Population denominators for 1999 are projected from the 1990 census and may not accurately reflect the 1999 population size. Caution
should be used in interpreting rates based on these projected populations.
§ Rates are age-adjusted to the 2000 U.S. standard population.
∼ Rates are suppressed if fewer than 16 cases were reported in the specific area-race category.
Notes: Cases from suppressed rates are included in the U.S. and region/division rates. Observed region/division age-adjusted incidence rates are presented for
regions/divisions with ≥ 78% of the population covered by registries that meet the data quality criteria specified above, and if the 95% confidence intervals
around the observed region/division rates for each of four major cancers include "bias-corrected" estimated region/division rates (see technical notes) for
each of those cancers. U.S rates are as presented in Table 1.2. California, Washington, and Michigan state rates each include cases from the SEER metropolitan
areas.

United States C
ancer Statistics: 1999 Incidence
82
Table 2.19.1: Cancer of the Kidney and Renal Pelvis. Invasive Cancer Incidence Rates by U.S. Census Region andDivision, State and Metropolitan Area, and Race (All Races, White, Black), United States: SEER and NPCR Registriesthat Meet Quality Criteria∗†
Males, 1999
All Races White BlackAge-Adjusted Crude Age-Adjusted Crude Age-Adjusted Crude
Area Rate‡§ (CI) Rate‡ (CI) Rate‡§ (CI) Rate‡ (CI) Rate‡§ (CI) Rate‡ (CI)
United States 16.0 ( 15.8- 16.3) 14.7 ( 14.5- 14.9) 16.1 ( 15.8- 16.4) 15.6 ( 15.4- 15.9) 16.3 ( 15.4- 17.3) 10.9 ( 10.3- 11.5)
Northeast 17.3 ( 16.8- 17.9) 16.7 ( 16.2- 17.3) 17.6 ( 17.0- 18.2) 18.0 ( 17.5- 18.6) 14.8 ( 13.1- 16.7) 10.2 ( 9.0- 11.4)
New England 16.8 ( 15.7- 17.9) 16.0 ( 14.9- 17.0) 16.6 ( 15.5- 17.8) 16.6 ( 15.5- 17.7) 18.8 ( 13.2- 27.0) 11.0 ( 7.9- 14.9)
Connecticut 16.3 ( 14.4- 18.5) 16.0 ( 14.1- 18.1) 16.3 ( 14.3- 18.5) 16.8 ( 14.8- 19.1) ∼ ∼Maine
Massachusetts 17.4 ( 15.9- 19.0) 16.5 ( 15.0- 18.0) 17.1 ( 15.6- 18.8) 17.1 ( 15.5- 18.7) 20.3 ( 12.5- 33.7) 12.2 ( 7.8- 18.1)
New Hampshire 13.2 ( 10.2- 16.9) 11.7 ( 9.1- 14.8) 13.4 ( 10.3- 17.1) 12.0 ( 9.3- 15.1) ∼ ∼Rhode Island 18.2 ( 14.5- 22.6) 17.8 ( 14.2- 22.0) 18.5 ( 14.7- 23.1) 19.0 ( 15.1- 23.5) ∼ ∼Vermont
Middle Atlantic 17.5 ( 16.9- 18.1) 17.0 ( 16.4- 17.6) 17.9 ( 17.2- 18.6) 18.5 ( 17.9- 19.2) 14.3 ( 12.6- 16.3) 10.0 ( 8.9- 11.3)
New Jersey 18.1 ( 16.8- 19.6) 17.2 ( 16.0- 18.6) 18.5 ( 17.1- 20.1) 19.1 ( 17.6- 20.7) 17.6 ( 13.3- 23.3) 11.1 ( 8.5- 14.2)
New York 17.0 ( 16.1- 17.9) 15.9 ( 15.1- 16.8) 17.9 ( 16.9- 19.0) 18.1 ( 17.1- 19.2) 10.6 ( 8.7- 12.9) 7.6 ( 6.3- 9.2)
Pennsylvania 17.8 ( 16.8- 18.9) 18.4 ( 17.3- 19.6) 17.4 ( 16.3- 18.6) 18.8 ( 17.6- 20.0) 21.4 ( 17.1- 26.8) 15.5 ( 12.4- 19.2)
Midwest
East North Central
Illinois 16.4 ( 15.3- 17.5) 14.3 ( 13.4- 15.3) 16.2 ( 15.0- 17.5) 15.0 ( 13.9- 16.1) 16.9 ( 13.7- 20.9) 11.7 ( 9.5- 14.2)
Indiana
Michigan 16.6 ( 15.4- 17.9) 15.0 ( 13.9- 16.1) 16.2 ( 14.9- 17.6) 15.3 ( 14.1- 16.6) 20.2 ( 16.3- 24.8) 14.7 ( 11.9- 17.9)
Detroit 16.7 ( 14.8- 18.8) 15.1 ( 13.4- 16.9) 16.2 ( 14.1- 18.5) 15.6 ( 13.6- 17.7) 18.9 ( 14.6- 24.3) 14.4 ( 11.1- 18.3)
Ohio 15.8 ( 14.7- 16.9) 14.8 ( 13.8- 15.8) 15.7 ( 14.5- 16.9) 15.2 ( 14.1- 16.3) 14.9 ( 11.4- 19.3) 10.6 ( 8.2- 13.5)
Wisconsin 18.5 ( 16.8- 20.4) 17.1 ( 15.6- 18.8) 18.2 ( 16.5- 20.1) 17.6 ( 15.9- 19.4) 26.2 ( 13.5- 50.7) 11.2 ( 6.4- 18.2)
West North Central 16.8 ( 15.9- 17.7) 15.6 ( 14.8- 16.5) 16.6 ( 15.7- 17.6) 16.1 ( 15.2- 17.0) 22.0 ( 16.6- 28.9) 12.4 ( 9.5- 15.9)
Iowa 17.4 ( 15.3- 19.7) 17.5 ( 15.4- 19.8) 17.3 ( 15.1- 19.6) 17.8 ( 15.6- 20.1) ∼ ∼Kansas 15.5 ( 13.4- 18.0) 14.2 ( 12.2- 16.4) 15.5 ( 13.2- 18.0) 14.6 ( 12.5- 16.9) ∼ ∼Minnesota 16.1 ( 14.5- 18.0) 14.5 ( 13.0- 16.1) 16.0 ( 14.3- 17.9) 15.0 ( 13.4- 16.7) ∼ ∼Missouri 17.5 ( 15.9- 19.3) 16.5 ( 14.9- 18.1) 17.3 ( 15.6- 19.1) 17.0 ( 15.4- 18.8) 22.9 ( 16.1- 32.1) 13.5 ( 9.6- 18.5)
Nebraska 16.0 ( 13.3- 19.2) 15.0 ( 12.4- 17.9) 16.2 ( 13.4- 19.4) 15.6 ( 12.9- 18.7) ∼ ∼North Dakota 16.6 ( 12.4- 21.9) 16.2 ( 12.1- 21.3) 16.6 ( 12.3- 22.0) 17.0 ( 12.6- 22.3) ∼ ∼South Dakota
South
South Atlantic
Delaware 15.3 ( 11.3- 20.5) 13.9 ( 10.4- 18.3) 15.4 ( 11.1- 21.2) 15.3 ( 11.1- 20.6) ∼ ∼District of Columbia 14.8 ( 10.2- 20.9) 13.9 ( 9.6- 19.5) ∼ ∼ 17.3 ( 11.1- 26.0) 17.1 ( 11.1- 25.2)
Florida 16.4 ( 15.6- 17.3) 18.9 ( 18.0- 20.0) 16.6 ( 15.7- 17.6) 21.1 ( 19.9- 22.3) 13.2 ( 10.5- 16.7) 8.2 ( 6.6- 10.1)
Georgia
Atlanta 16.6 ( 13.8- 19.9) 11.0 ( 9.3- 13.0) 14.2 ( 11.3- 17.9) 10.6 ( 8.6- 13.1) 25.8 ( 18.3- 36.6) 12.6 ( 9.3- 16.6)
Maryland 15.1 ( 13.5- 16.9) 13.4 ( 12.0- 14.9) 15.4 ( 13.6- 17.5) 15.1 ( 13.3- 17.1) 14.6 ( 11.2- 19.1) 10.1 ( 7.8- 12.8)
North Carolina 14.2 ( 13.0- 15.6) 13.0 ( 11.8- 14.2) 13.9 ( 12.5- 15.4) 13.6 ( 12.3- 15.1) 15.1 ( 12.0- 19.0) 10.9 ( 8.7- 13.5)
South Carolina 16.6 ( 14.7- 18.7) 15.2 ( 13.5- 17.1) 17.6 ( 15.3- 20.1) 17.8 ( 15.6- 20.2) 13.6 ( 10.0- 18.2) 9.5 ( 7.0- 12.4)
Virginia
West Virginia 16.6 ( 14.1- 19.6) 17.3 ( 14.7- 20.3) 16.2 ( 13.6- 19.2) 16.9 ( 14.3- 19.9) ∼ ∼East South Central
Alabama
Kentucky 16.8 ( 15.0- 18.9) 15.6 ( 13.9- 17.5) 16.5 ( 14.6- 18.7) 15.7 ( 13.9- 17.7) 22.6 ( 13.6- 36.0) 14.6 ( 8.9- 22.5)
Mississippi
Tennessee
continued

Cancer Incidence, by U
.S. Census R
egion and Division, State, and M
etropolitan Area
83
Table 2.19.1: Cancer of the Kidney and Renal Pelvis. Invasive Cancer Incidence Rates by U.S. Census Region andDivision, State and Metropolitan Area, and Race (All Races, White, Black), United States: SEER and NPCR Registriesthat Meet Quality Criteria∗† (continued)
Males, 1999
All Races White BlackAge-Adjusted Crude Age-Adjusted Crude Age-Adjusted Crude
Area Rate‡§ (CI) Rate‡ (CI) Rate‡§ (CI) Rate‡ (CI) Rate‡§ (CI) Rate‡ (CI)
West South Central
Arkansas
Louisiana 19.0 ( 17.0- 21.2) 16.3 ( 14.6- 18.1) 18.0 ( 15.8- 20.5) 17.3 ( 15.2- 19.7) 22.8 ( 18.4- 28.2) 14.6 ( 11.8- 17.8)
Oklahoma
Texas
West 14.0 ( 13.5- 14.5) 11.7 ( 11.4- 12.1) 14.3 ( 13.8- 14.8) 12.5 ( 12.0- 12.9) 14.8 ( 12.5- 17.6) 9.6 ( 8.2- 11.3)
Mountain
Arizona 15.0 ( 13.4- 16.7) 13.8 ( 12.3- 15.4) 14.9 ( 13.3- 16.7) 14.5 ( 13.0- 16.3) ∼ ∼Colorado 14.2 ( 12.4- 16.2) 11.8 ( 10.3- 13.4) 14.1 ( 12.2- 16.2) 12.0 ( 10.5- 13.7) ∼ ∼Idaho 11.8 ( 9.1- 15.1) 10.4 ( 8.0- 13.3) 11.8 ( 9.1- 15.2) 10.6 ( 8.1- 13.5) ∼ ∼Montana 14.5 ( 11.2- 18.7) 14.6 ( 11.2- 18.6) 13.9 ( 10.6- 18.1) 14.5 ( 11.0- 18.7) ∼ ∼Nevada
New Mexico 12.6 ( 10.1- 15.5) 11.1 ( 9.0- 13.6) 12.6 ( 10.0- 15.6) 11.8 ( 9.4- 14.5) ∼ ∼Utah 11.9 ( 9.5- 14.7) 8.4 ( 6.7- 10.3) 12.0 ( 9.6- 14.9) 8.6 ( 6.9- 10.6) ∼ ∼Wyoming 14.1 ( 9.4- 20.7) 12.0 ( 8.1- 17.3) 14.0 ( 9.2- 20.6) 12.1 ( 8.0- 17.5) ∼ ∼
Pacific 14.1 ( 13.5- 14.6) 11.7 ( 11.2- 12.1) 14.6 ( 14.0- 15.2) 12.6 ( 12.0- 13.1) 15.0 ( 12.5- 18.0) 9.9 ( 8.3- 11.7)
Alaska 21.6 ( 14.4- 32.8) 13.5 ( 9.8- 18.2) 17.8 ( 11.3- 29.3) 13.3 ( 9.2- 18.7) ∼ ∼California 13.7 ( 13.1- 14.3) 11.0 ( 10.5- 11.5) 14.4 ( 13.7- 15.1) 12.1 ( 11.5- 12.7) 14.6 ( 12.0- 17.8) 9.7 ( 8.1- 11.6)
San Francisco-Oakland 13.5 ( 11.8- 15.3) 12.1 ( 10.6- 13.7) 15.1 ( 13.0- 17.4) 14.6 ( 12.6- 16.7) 12.0 ( 7.2- 19.4) 8.5 ( 5.2- 13.1)
San Jose-Monterey 10.3 ( 8.3- 12.7) 8.3 ( 6.7- 10.1) 11.1 ( 8.9- 13.9) 9.4 ( 7.5- 11.6) ∼ ∼Los Angeles 13.8 ( 12.6- 15.1) 10.5 ( 9.6- 11.5) 14.8 ( 13.3- 16.3) 11.4 ( 10.3- 12.5) 13.7 ( 10.2- 18.4) 10.7 ( 8.0- 14.0)
Hawaii 13.5 ( 10.7- 16.9) 13.4 ( 10.6- 16.7) 19.4 ( 12.8- 28.5) 17.1 ( 11.5- 24.6) ∼ ∼Oregon 15.2 ( 13.3- 17.2) 14.7 ( 12.9- 16.7) 14.8 ( 12.9- 16.9) 14.7 ( 12.8- 16.8) ∼ ∼Washington 15.1 ( 13.6- 16.8) 13.2 ( 11.9- 14.6) 14.7 ( 13.2- 16.4) 13.3 ( 11.9- 14.8) ∼ ∼
Seattle-Puget Sound 15.0 ( 13.1- 17.0) 12.8 ( 11.3- 14.5) 14.9 ( 13.0- 17.1) 13.4 ( 11.7- 15.2) ∼ ∼∗ Data are from selected statewide and metropolitan area cancer registries that meet the following data quality criteria for all invasive cancer sites combined: case
ascertainment is at least 90% complete; ≥ 97% of cases pass a standard set of computerized edits; ≤ 5% of cases were ascertained by death certificate only; ≤ 3% of
cases are missing information on sex; ≤ 5% of cases are missing information on race; ≤ 3% of cases are missing information on age. See Appendix H for registry-specific
data quality information. U.S. rates cover approximately 78% of the U.S. population.
† Invasive cancers only
‡ Rates are per 100,000 persons. Population denominators for 1999 are projected from the 1990 census and may not accurately reflect the 1999 population size. Caution
should be used in interpreting rates based on these projected populations.
§ Rates are age-adjusted to the 2000 U.S. standard population.
∼ Rates are suppressed if fewer than 16 cases were reported in the specific area-race category.
Notes: Cases from suppressed rates are included in the U.S. and region/division rates. Observed region/division age-adjusted incidence rates are presented for
regions/divisions with ≥ 78% of the population covered by registries that meet the data quality criteria specified above, and if the 95% confidence intervals
around the observed region/division rates for each of four major cancers include "bias-corrected" estimated region/division rates (see technical notes) for
each of those cancers. U.S rates are as presented in Table 1.1. California, Washington, and Michigan state rates each include cases from the SEER metropolitan
areas.
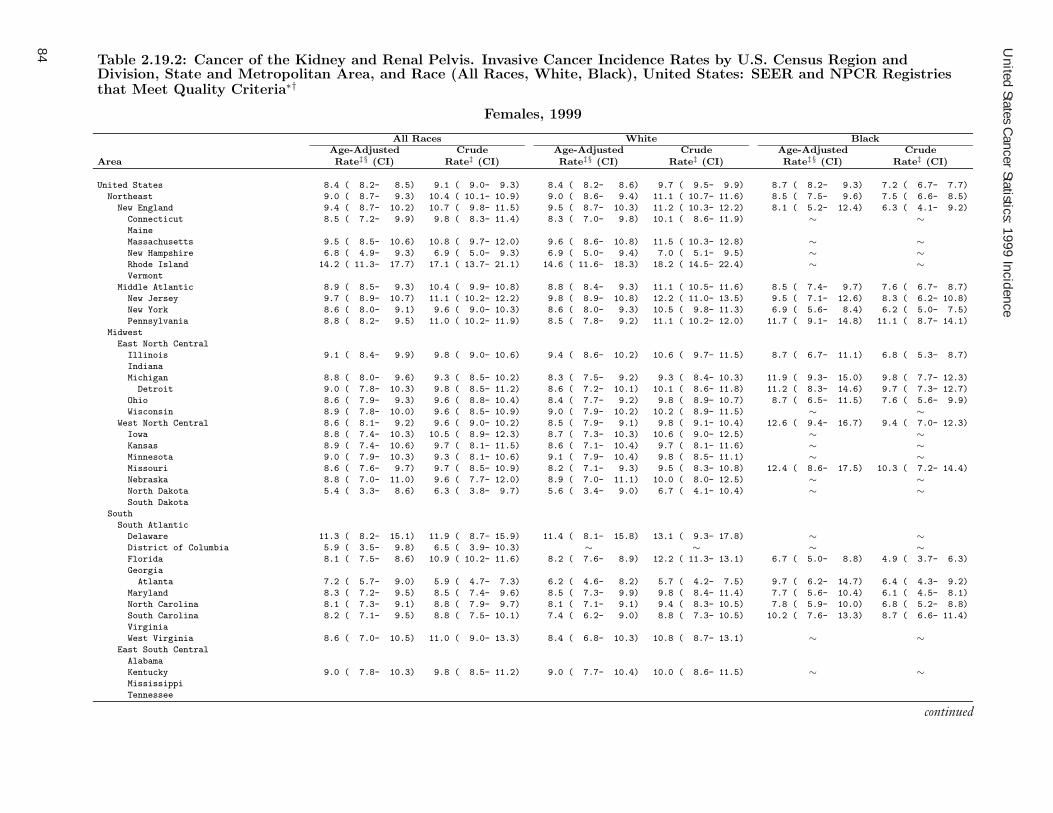
United States C
ancer Statistics: 1999 Incidence
84
Table 2.19.2: Cancer of the Kidney and Renal Pelvis. Invasive Cancer Incidence Rates by U.S. Census Region andDivision, State and Metropolitan Area, and Race (All Races, White, Black), United States: SEER and NPCR Registriesthat Meet Quality Criteria∗†
Females, 1999
All Races White BlackAge-Adjusted Crude Age-Adjusted Crude Age-Adjusted Crude
Area Rate‡§ (CI) Rate‡ (CI) Rate‡§ (CI) Rate‡ (CI) Rate‡§ (CI) Rate‡ (CI)
United States 8.4 ( 8.2- 8.5) 9.1 ( 9.0- 9.3) 8.4 ( 8.2- 8.6) 9.7 ( 9.5- 9.9) 8.7 ( 8.2- 9.3) 7.2 ( 6.7- 7.7)
Northeast 9.0 ( 8.7- 9.3) 10.4 ( 10.1- 10.9) 9.0 ( 8.6- 9.4) 11.1 ( 10.7- 11.6) 8.5 ( 7.5- 9.6) 7.5 ( 6.6- 8.5)
New England 9.4 ( 8.7- 10.2) 10.7 ( 9.8- 11.5) 9.5 ( 8.7- 10.3) 11.2 ( 10.3- 12.2) 8.1 ( 5.2- 12.4) 6.3 ( 4.1- 9.2)
Connecticut 8.5 ( 7.2- 9.9) 9.8 ( 8.3- 11.4) 8.3 ( 7.0- 9.8) 10.1 ( 8.6- 11.9) ∼ ∼Maine
Massachusetts 9.5 ( 8.5- 10.6) 10.8 ( 9.7- 12.0) 9.6 ( 8.6- 10.8) 11.5 ( 10.3- 12.8) ∼ ∼New Hampshire 6.8 ( 4.9- 9.3) 6.9 ( 5.0- 9.3) 6.9 ( 5.0- 9.4) 7.0 ( 5.1- 9.5) ∼ ∼Rhode Island 14.2 ( 11.3- 17.7) 17.1 ( 13.7- 21.1) 14.6 ( 11.6- 18.3) 18.2 ( 14.5- 22.4) ∼ ∼Vermont
Middle Atlantic 8.9 ( 8.5- 9.3) 10.4 ( 9.9- 10.8) 8.8 ( 8.4- 9.3) 11.1 ( 10.5- 11.6) 8.5 ( 7.4- 9.7) 7.6 ( 6.7- 8.7)
New Jersey 9.7 ( 8.9- 10.7) 11.1 ( 10.2- 12.2) 9.8 ( 8.9- 10.8) 12.2 ( 11.0- 13.5) 9.5 ( 7.1- 12.6) 8.3 ( 6.2- 10.8)
New York 8.6 ( 8.0- 9.1) 9.6 ( 9.0- 10.3) 8.6 ( 8.0- 9.3) 10.5 ( 9.8- 11.3) 6.9 ( 5.6- 8.4) 6.2 ( 5.0- 7.5)
Pennsylvania 8.8 ( 8.2- 9.5) 11.0 ( 10.2- 11.9) 8.5 ( 7.8- 9.2) 11.1 ( 10.2- 12.0) 11.7 ( 9.1- 14.8) 11.1 ( 8.7- 14.1)
Midwest
East North Central
Illinois 9.1 ( 8.4- 9.9) 9.8 ( 9.0- 10.6) 9.4 ( 8.6- 10.2) 10.6 ( 9.7- 11.5) 8.7 ( 6.7- 11.1) 6.8 ( 5.3- 8.7)
Indiana
Michigan 8.8 ( 8.0- 9.6) 9.3 ( 8.5- 10.2) 8.3 ( 7.5- 9.2) 9.3 ( 8.4- 10.3) 11.9 ( 9.3- 15.0) 9.8 ( 7.7- 12.3)
Detroit 9.0 ( 7.8- 10.3) 9.8 ( 8.5- 11.2) 8.6 ( 7.2- 10.1) 10.1 ( 8.6- 11.8) 11.2 ( 8.3- 14.6) 9.7 ( 7.3- 12.7)
Ohio 8.6 ( 7.9- 9.3) 9.6 ( 8.8- 10.4) 8.4 ( 7.7- 9.2) 9.8 ( 8.9- 10.7) 8.7 ( 6.5- 11.5) 7.6 ( 5.6- 9.9)
Wisconsin 8.9 ( 7.8- 10.0) 9.6 ( 8.5- 10.9) 9.0 ( 7.9- 10.2) 10.2 ( 8.9- 11.5) ∼ ∼West North Central 8.6 ( 8.1- 9.2) 9.6 ( 9.0- 10.2) 8.5 ( 7.9- 9.1) 9.8 ( 9.1- 10.4) 12.6 ( 9.4- 16.7) 9.4 ( 7.0- 12.3)
Iowa 8.8 ( 7.4- 10.3) 10.5 ( 8.9- 12.3) 8.7 ( 7.3- 10.3) 10.6 ( 9.0- 12.5) ∼ ∼Kansas 8.9 ( 7.4- 10.6) 9.7 ( 8.1- 11.5) 8.6 ( 7.1- 10.4) 9.7 ( 8.1- 11.6) ∼ ∼Minnesota 9.0 ( 7.9- 10.3) 9.3 ( 8.1- 10.6) 9.1 ( 7.9- 10.4) 9.8 ( 8.5- 11.1) ∼ ∼Missouri 8.6 ( 7.6- 9.7) 9.7 ( 8.5- 10.9) 8.2 ( 7.1- 9.3) 9.5 ( 8.3- 10.8) 12.4 ( 8.6- 17.5) 10.3 ( 7.2- 14.4)
Nebraska 8.8 ( 7.0- 11.0) 9.6 ( 7.7- 12.0) 8.9 ( 7.0- 11.1) 10.0 ( 8.0- 12.5) ∼ ∼North Dakota 5.4 ( 3.3- 8.6) 6.3 ( 3.8- 9.7) 5.6 ( 3.4- 9.0) 6.7 ( 4.1- 10.4) ∼ ∼South Dakota
South
South Atlantic
Delaware 11.3 ( 8.2- 15.1) 11.9 ( 8.7- 15.9) 11.4 ( 8.1- 15.8) 13.1 ( 9.3- 17.8) ∼ ∼District of Columbia 5.9 ( 3.5- 9.8) 6.5 ( 3.9- 10.3) ∼ ∼ ∼ ∼Florida 8.1 ( 7.5- 8.6) 10.9 ( 10.2- 11.6) 8.2 ( 7.6- 8.9) 12.2 ( 11.3- 13.1) 6.7 ( 5.0- 8.8) 4.9 ( 3.7- 6.3)
Georgia
Atlanta 7.2 ( 5.7- 9.0) 5.9 ( 4.7- 7.3) 6.2 ( 4.6- 8.2) 5.7 ( 4.2- 7.5) 9.7 ( 6.2- 14.7) 6.4 ( 4.3- 9.2)
Maryland 8.3 ( 7.2- 9.5) 8.5 ( 7.4- 9.6) 8.5 ( 7.3- 9.9) 9.8 ( 8.4- 11.4) 7.7 ( 5.6- 10.4) 6.1 ( 4.5- 8.1)
North Carolina 8.1 ( 7.3- 9.1) 8.8 ( 7.9- 9.7) 8.1 ( 7.1- 9.1) 9.4 ( 8.3- 10.5) 7.8 ( 5.9- 10.0) 6.8 ( 5.2- 8.8)
South Carolina 8.2 ( 7.1- 9.5) 8.8 ( 7.5- 10.1) 7.4 ( 6.2- 9.0) 8.8 ( 7.3- 10.5) 10.2 ( 7.6- 13.3) 8.7 ( 6.6- 11.4)
Virginia
West Virginia 8.6 ( 7.0- 10.5) 11.0 ( 9.0- 13.3) 8.4 ( 6.8- 10.3) 10.8 ( 8.7- 13.1) ∼ ∼East South Central
Alabama
Kentucky 9.0 ( 7.8- 10.3) 9.8 ( 8.5- 11.2) 9.0 ( 7.7- 10.4) 10.0 ( 8.6- 11.5) ∼ ∼Mississippi
Tennessee
continued

Cancer Incidence, by U
.S. Census R
egion and Division, State, and M
etropolitan Area
85
Table 2.19.2: Cancer of the Kidney and Renal Pelvis. Invasive Cancer Incidence Rates by U.S. Census Region andDivision, State and Metropolitan Area, and Race (All Races, White, Black), United States: SEER and NPCR Registriesthat Meet Quality Criteria∗† (continued)
Females, 1999
All Races White BlackAge-Adjusted Crude Age-Adjusted Crude Age-Adjusted Crude
Area Rate‡§ (CI) Rate‡ (CI) Rate‡§ (CI) Rate‡ (CI) Rate‡§ (CI) Rate‡ (CI)
West South Central
Arkansas
Louisiana 9.9 ( 8.7- 11.3) 10.2 ( 8.9- 11.6) 10.1 ( 8.7- 11.8) 11.6 ( 10.0- 13.5) 9.5 ( 7.2- 12.3) 7.8 ( 6.0- 10.1)
Oklahoma
Texas
West 7.3 ( 7.0- 7.7) 7.2 ( 6.9- 7.5) 7.6 ( 7.3- 8.0) 7.8 ( 7.5- 8.2) 8.6 ( 7.0- 10.4) 6.7 ( 5.5- 8.1)
Mountain
Arizona 7.7 ( 6.6- 8.8) 8.1 ( 7.0- 9.3) 7.8 ( 6.7- 9.0) 8.7 ( 7.4- 10.0) ∼ ∼Colorado 7.2 ( 6.0- 8.5) 7.0 ( 5.9- 8.2) 7.2 ( 6.0- 8.5) 7.2 ( 6.0- 8.5) ∼ ∼Idaho 11.3 ( 8.8- 14.4) 11.0 ( 8.6- 13.9) 11.4 ( 8.8- 14.5) 11.2 ( 8.7- 14.2) ∼ ∼Montana 9.8 ( 7.2- 13.1) 11.0 ( 8.2- 14.6) 9.8 ( 7.2- 13.2) 11.5 ( 8.4- 15.2) ∼ ∼Nevada
New Mexico 8.6 ( 6.8- 10.8) 8.6 ( 6.8- 10.8) 8.9 ( 7.0- 11.3) 9.5 ( 7.4- 11.9) ∼ ∼Utah 5.2 ( 3.8- 7.0) 4.0 ( 2.9- 5.4) 5.3 ( 3.8- 7.1) 4.1 ( 3.0- 5.6) ∼ ∼Wyoming 6.6 ( 3.7- 10.9) 6.7 ( 3.8- 10.9) 6.7 ( 3.9- 11.3) 7.0 ( 4.0- 11.4) ∼ ∼
Pacific 7.2 ( 6.9- 7.6) 7.1 ( 6.7- 7.5) 7.6 ( 7.2- 8.0) 7.7 ( 7.3- 8.1) 9.1 ( 7.4- 11.1) 7.3 ( 5.9- 8.8)
Alaska 8.2 ( 4.8- 14.0) 6.5 ( 3.9- 10.1) ∼ ∼ ∼ ∼California 7.0 ( 6.6- 7.5) 6.8 ( 6.4- 7.2) 7.4 ( 6.9- 7.9) 7.4 ( 7.0- 7.9) 8.8 ( 7.1- 10.9) 7.2 ( 5.8- 8.8)
San Francisco-Oakland 6.4 ( 5.3- 7.5) 6.8 ( 5.7- 8.1) 6.7 ( 5.5- 8.2) 7.7 ( 6.3- 9.4) 7.2 ( 4.2- 11.8) 6.8 ( 4.0- 10.9)
San Jose-Monterey 7.4 ( 5.9- 9.2) 7.0 ( 5.5- 8.7) 7.7 ( 6.0- 9.8) 7.8 ( 6.0- 9.8) ∼ ∼Los Angeles 7.8 ( 7.0- 8.7) 7.3 ( 6.5- 8.1) 8.3 ( 7.3- 9.3) 7.8 ( 6.9- 8.8) 10.6 ( 7.9- 13.9) 9.4 ( 7.1- 12.4)
Hawaii 5.3 ( 3.7- 7.5) 5.9 ( 4.1- 8.2) ∼ ∼ ∼ ∼Oregon 7.8 ( 6.5- 9.2) 8.6 ( 7.2- 10.1) 8.0 ( 6.7- 9.5) 9.1 ( 7.6- 10.7) ∼ ∼Washington 8.1 ( 7.1- 9.2) 8.2 ( 7.2- 9.3) 8.1 ( 7.0- 9.2) 8.6 ( 7.5- 9.8) ∼ ∼
Seattle-Puget Sound 7.7 ( 6.6- 9.0) 7.8 ( 6.6- 9.1) 7.7 ( 6.4- 9.1) 8.1 ( 6.8- 9.6) ∼ ∼∗ Data are from selected statewide and metropolitan area cancer registries that meet the following data quality criteria for all invasive cancer sites combined: case
ascertainment is at least 90% complete; ≥ 97% of cases pass a standard set of computerized edits; ≤ 5% of cases were ascertained by death certificate only; ≤ 3% of
cases are missing information on sex; ≤ 5% of cases are missing information on race; ≤ 3% of cases are missing information on age. See Appendix H for registry-specific
data quality information. U.S. rates cover approximately 78% of the U.S. population.
† Invasive cancers only
‡ Rates are per 100,000 persons. Population denominators for 1999 are projected from the 1990 census and may not accurately reflect the 1999 population size. Caution
should be used in interpreting rates based on these projected populations.
§ Rates are age-adjusted to the 2000 U.S. standard population.
∼ Rates are suppressed if fewer than 16 cases were reported in the specific area-race category.
Notes: Cases from suppressed rates are included in the U.S. and region/division rates. Observed region/division age-adjusted incidence rates are presented for
regions/divisions with ≥ 78% of the population covered by registries that meet the data quality criteria specified above, and if the 95% confidence intervals
around the observed region/division rates for each of four major cancers include "bias-corrected" estimated region/division rates (see technical notes) for
each of those cancers. U.S rates are as presented in Table 1.2. California, Washington, and Michigan state rates each include cases from the SEER metropolitan
areas.
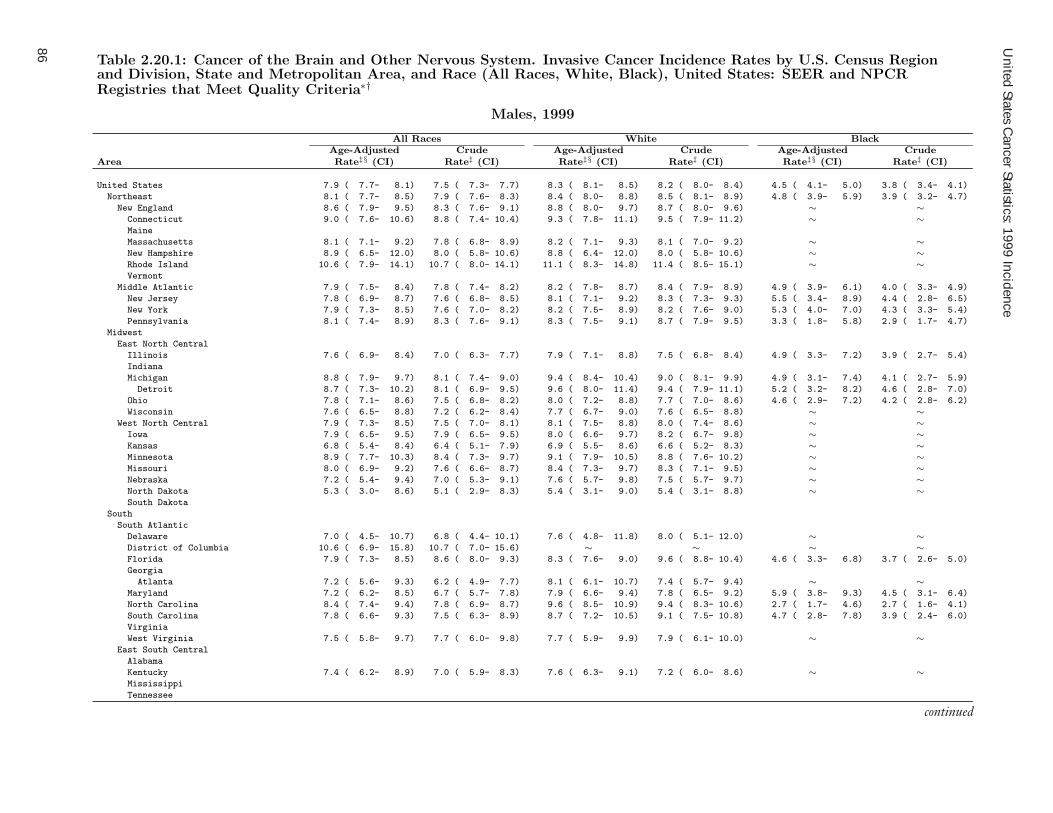
United States C
ancer Statistics: 1999 Incidence
86
Table 2.20.1: Cancer of the Brain and Other Nervous System. Invasive Cancer Incidence Rates by U.S. Census Regionand Division, State and Metropolitan Area, and Race (All Races, White, Black), United States: SEER and NPCRRegistries that Meet Quality Criteria∗†
Males, 1999
All Races White BlackAge-Adjusted Crude Age-Adjusted Crude Age-Adjusted Crude
Area Rate‡§ (CI) Rate‡ (CI) Rate‡§ (CI) Rate‡ (CI) Rate‡§ (CI) Rate‡ (CI)
United States 7.9 ( 7.7- 8.1) 7.5 ( 7.3- 7.7) 8.3 ( 8.1- 8.5) 8.2 ( 8.0- 8.4) 4.5 ( 4.1- 5.0) 3.8 ( 3.4- 4.1)
Northeast 8.1 ( 7.7- 8.5) 7.9 ( 7.6- 8.3) 8.4 ( 8.0- 8.8) 8.5 ( 8.1- 8.9) 4.8 ( 3.9- 5.9) 3.9 ( 3.2- 4.7)
New England 8.6 ( 7.9- 9.5) 8.3 ( 7.6- 9.1) 8.8 ( 8.0- 9.7) 8.7 ( 8.0- 9.6) ∼ ∼Connecticut 9.0 ( 7.6- 10.6) 8.8 ( 7.4- 10.4) 9.3 ( 7.8- 11.1) 9.5 ( 7.9- 11.2) ∼ ∼Maine
Massachusetts 8.1 ( 7.1- 9.2) 7.8 ( 6.8- 8.9) 8.2 ( 7.1- 9.3) 8.1 ( 7.0- 9.2) ∼ ∼New Hampshire 8.9 ( 6.5- 12.0) 8.0 ( 5.8- 10.6) 8.8 ( 6.4- 12.0) 8.0 ( 5.8- 10.6) ∼ ∼Rhode Island 10.6 ( 7.9- 14.1) 10.7 ( 8.0- 14.1) 11.1 ( 8.3- 14.8) 11.4 ( 8.5- 15.1) ∼ ∼Vermont
Middle Atlantic 7.9 ( 7.5- 8.4) 7.8 ( 7.4- 8.2) 8.2 ( 7.8- 8.7) 8.4 ( 7.9- 8.9) 4.9 ( 3.9- 6.1) 4.0 ( 3.3- 4.9)
New Jersey 7.8 ( 6.9- 8.7) 7.6 ( 6.8- 8.5) 8.1 ( 7.1- 9.2) 8.3 ( 7.3- 9.3) 5.5 ( 3.4- 8.9) 4.4 ( 2.8- 6.5)
New York 7.9 ( 7.3- 8.5) 7.6 ( 7.0- 8.2) 8.2 ( 7.5- 8.9) 8.2 ( 7.6- 9.0) 5.3 ( 4.0- 7.0) 4.3 ( 3.3- 5.4)
Pennsylvania 8.1 ( 7.4- 8.9) 8.3 ( 7.6- 9.1) 8.3 ( 7.5- 9.1) 8.7 ( 7.9- 9.5) 3.3 ( 1.8- 5.8) 2.9 ( 1.7- 4.7)
Midwest
East North Central
Illinois 7.6 ( 6.9- 8.4) 7.0 ( 6.3- 7.7) 7.9 ( 7.1- 8.8) 7.5 ( 6.8- 8.4) 4.9 ( 3.3- 7.2) 3.9 ( 2.7- 5.4)
Indiana
Michigan 8.8 ( 7.9- 9.7) 8.1 ( 7.4- 9.0) 9.4 ( 8.4- 10.4) 9.0 ( 8.1- 9.9) 4.9 ( 3.1- 7.4) 4.1 ( 2.7- 5.9)
Detroit 8.7 ( 7.3- 10.2) 8.1 ( 6.9- 9.5) 9.6 ( 8.0- 11.4) 9.4 ( 7.9- 11.1) 5.2 ( 3.2- 8.2) 4.6 ( 2.8- 7.0)
Ohio 7.8 ( 7.1- 8.6) 7.5 ( 6.8- 8.2) 8.0 ( 7.2- 8.8) 7.7 ( 7.0- 8.6) 4.6 ( 2.9- 7.2) 4.2 ( 2.8- 6.2)
Wisconsin 7.6 ( 6.5- 8.8) 7.2 ( 6.2- 8.4) 7.7 ( 6.7- 9.0) 7.6 ( 6.5- 8.8) ∼ ∼West North Central 7.9 ( 7.3- 8.5) 7.5 ( 7.0- 8.1) 8.1 ( 7.5- 8.8) 8.0 ( 7.4- 8.6) ∼ ∼Iowa 7.9 ( 6.5- 9.5) 7.9 ( 6.5- 9.5) 8.0 ( 6.6- 9.7) 8.2 ( 6.7- 9.8) ∼ ∼Kansas 6.8 ( 5.4- 8.4) 6.4 ( 5.1- 7.9) 6.9 ( 5.5- 8.6) 6.6 ( 5.2- 8.3) ∼ ∼Minnesota 8.9 ( 7.7- 10.3) 8.4 ( 7.3- 9.7) 9.1 ( 7.9- 10.5) 8.8 ( 7.6- 10.2) ∼ ∼Missouri 8.0 ( 6.9- 9.2) 7.6 ( 6.6- 8.7) 8.4 ( 7.3- 9.7) 8.3 ( 7.1- 9.5) ∼ ∼Nebraska 7.2 ( 5.4- 9.4) 7.0 ( 5.3- 9.1) 7.6 ( 5.7- 9.8) 7.5 ( 5.7- 9.7) ∼ ∼North Dakota 5.3 ( 3.0- 8.6) 5.1 ( 2.9- 8.3) 5.4 ( 3.1- 9.0) 5.4 ( 3.1- 8.8) ∼ ∼South Dakota
South
South Atlantic
Delaware 7.0 ( 4.5- 10.7) 6.8 ( 4.4- 10.1) 7.6 ( 4.8- 11.8) 8.0 ( 5.1- 12.0) ∼ ∼District of Columbia 10.6 ( 6.9- 15.8) 10.7 ( 7.0- 15.6) ∼ ∼ ∼ ∼Florida 7.9 ( 7.3- 8.5) 8.6 ( 8.0- 9.3) 8.3 ( 7.6- 9.0) 9.6 ( 8.8- 10.4) 4.6 ( 3.3- 6.8) 3.7 ( 2.6- 5.0)
Georgia
Atlanta 7.2 ( 5.6- 9.3) 6.2 ( 4.9- 7.7) 8.1 ( 6.1- 10.7) 7.4 ( 5.7- 9.4) ∼ ∼Maryland 7.2 ( 6.2- 8.5) 6.7 ( 5.7- 7.8) 7.9 ( 6.6- 9.4) 7.8 ( 6.5- 9.2) 5.9 ( 3.8- 9.3) 4.5 ( 3.1- 6.4)
North Carolina 8.4 ( 7.4- 9.4) 7.8 ( 6.9- 8.7) 9.6 ( 8.5- 10.9) 9.4 ( 8.3- 10.6) 2.7 ( 1.7- 4.6) 2.7 ( 1.6- 4.1)
South Carolina 7.8 ( 6.6- 9.3) 7.5 ( 6.3- 8.9) 8.7 ( 7.2- 10.5) 9.1 ( 7.5- 10.8) 4.7 ( 2.8- 7.8) 3.9 ( 2.4- 6.0)
Virginia
West Virginia 7.5 ( 5.8- 9.7) 7.7 ( 6.0- 9.8) 7.7 ( 5.9- 9.9) 7.9 ( 6.1- 10.0) ∼ ∼East South Central
Alabama
Kentucky 7.4 ( 6.2- 8.9) 7.0 ( 5.9- 8.3) 7.6 ( 6.3- 9.1) 7.2 ( 6.0- 8.6) ∼ ∼Mississippi
Tennessee
continued

Cancer Incidence, by U
.S. Census R
egion and Division, State, and M
etropolitan Area
87
Table 2.20.1: Cancer of the Brain and Other Nervous System. Invasive Cancer Incidence Rates by U.S. Census Regionand Division, State and Metropolitan Area, and Race (All Races, White, Black), United States: SEER and NPCRRegistries that Meet Quality Criteria∗† (continued)
Males, 1999
All Races White BlackAge-Adjusted Crude Age-Adjusted Crude Age-Adjusted Crude
Area Rate‡§ (CI) Rate‡ (CI) Rate‡§ (CI) Rate‡ (CI) Rate‡§ (CI) Rate‡ (CI)
West South Central
Arkansas
Louisiana 6.5 ( 5.4- 7.8) 5.8 ( 4.8- 6.9) 7.6 ( 6.1- 9.3) 7.3 ( 6.0- 8.9) 3.3 ( 1.9- 5.7) 2.9 ( 1.7- 4.5)
Oklahoma
Texas
West 7.8 ( 7.4- 8.1) 7.1 ( 6.8- 7.4) 8.3 ( 8.0- 8.7) 7.7 ( 7.4- 8.1) 4.6 ( 3.4- 6.2) 3.7 ( 2.8- 4.7)
Mountain
Arizona 7.6 ( 6.5- 8.8) 7.2 ( 6.2- 8.4) 7.8 ( 6.7- 9.2) 7.8 ( 6.6- 9.1) ∼ ∼Colorado 8.1 ( 6.8- 9.6) 7.5 ( 6.4- 8.8) 8.2 ( 6.9- 9.8) 7.7 ( 6.5- 9.1) ∼ ∼Idaho 11.2 ( 8.6- 14.4) 10.4 ( 8.0- 13.3) 11.5 ( 8.8- 14.8) 10.7 ( 8.3- 13.7) ∼ ∼Montana 5.1 ( 3.2- 7.8) 5.2 ( 3.3- 7.9) 5.2 ( 3.2- 8.0) 5.4 ( 3.4- 8.2) ∼ ∼Nevada
New Mexico 7.8 ( 6.0- 10.1) 7.2 ( 5.6- 9.3) 8.0 ( 6.1- 10.5) 7.7 ( 5.8- 10.0) ∼ ∼Utah 8.0 ( 6.1- 10.3) 6.5 ( 5.1- 8.2) 8.1 ( 6.3- 10.5) 6.6 ( 5.1- 8.4) ∼ ∼Wyoming 10.1 ( 6.3- 15.8) 9.5 ( 6.0- 14.3) 10.4 ( 6.5- 16.2) 9.9 ( 6.3- 14.9) ∼ ∼
Pacific 7.7 ( 7.3- 8.1) 6.9 ( 6.6- 7.3) 8.4 ( 8.0- 8.9) 7.7 ( 7.3- 8.2) 4.5 ( 3.2- 6.2) 3.6 ( 2.6- 4.7)
Alaska 7.2 ( 3.9- 14.7) 5.2 ( 3.0- 8.4) ∼ ∼ ∼ ∼California 7.6 ( 7.1- 8.0) 6.7 ( 6.3- 7.1) 8.3 ( 7.7- 8.8) 7.4 ( 7.0- 7.9) 4.8 ( 3.5- 6.7) 3.9 ( 2.9- 5.1)
San Francisco-Oakland 8.2 ( 6.9- 9.6) 7.7 ( 6.6- 9.1) 9.3 ( 7.7- 11.2) 9.3 ( 7.7- 11.0) ∼ ∼San Jose-Monterey 8.1 ( 6.4- 10.1) 7.0 ( 5.6- 8.7) 8.7 ( 6.8- 11.2) 7.7 ( 6.0- 9.7) ∼ ∼Los Angeles 6.8 ( 6.0- 7.7) 5.8 ( 5.1- 6.5) 7.6 ( 6.6- 8.7) 6.5 ( 5.7- 7.4) 4.2 ( 2.5- 7.3) 3.6 ( 2.2- 5.8)
Hawaii 4.8 ( 3.2- 6.9) 4.7 ( 3.2- 6.9) ∼ ∼ ∼ ∼Oregon 8.1 ( 6.8- 9.6) 8.0 ( 6.7- 9.5) 8.3 ( 7.0- 10.0) 8.4 ( 7.0- 9.9) ∼ ∼Washington 9.2 ( 8.1- 10.5) 8.5 ( 7.5- 9.7) 9.6 ( 8.4- 10.9) 9.0 ( 7.9- 10.3) ∼ ∼
Seattle-Puget Sound 9.3 ( 7.9- 10.9) 8.6 ( 7.3- 10.0) 10.0 ( 8.5- 11.8) 9.5 ( 8.1- 11.1) ∼ ∼∗ Data are from selected statewide and metropolitan area cancer registries that meet the following data quality criteria for all invasive cancer sites combined: case
ascertainment is at least 90% complete; ≥ 97% of cases pass a standard set of computerized edits; ≤ 5% of cases were ascertained by death certificate only; ≤ 3% of
cases are missing information on sex; ≤ 5% of cases are missing information on race; ≤ 3% of cases are missing information on age. See Appendix H for registry-specific
data quality information. U.S. rates cover approximately 78% of the U.S. population.
† Invasive cancers only
‡ Rates are per 100,000 persons. Population denominators for 1999 are projected from the 1990 census and may not accurately reflect the 1999 population size. Caution
should be used in interpreting rates based on these projected populations.
§ Rates are age-adjusted to the 2000 U.S. standard population.
∼ Rates are suppressed if fewer than 16 cases were reported in the specific area-race category.
Notes: Cases from suppressed rates are included in the U.S. and region/division rates. Observed region/division age-adjusted incidence rates are presented for
regions/divisions with ≥ 78% of the population covered by registries that meet the data quality criteria specified above, and if the 95% confidence intervals
around the observed region/division rates for each of four major cancers include "bias-corrected" estimated region/division rates (see technical notes) for
each of those cancers. U.S rates are as presented in Table 1.1. California, Washington, and Michigan state rates each include cases from the SEER metropolitan
areas.

United States C
ancer Statistics: 1999 Incidence
88
Table 2.20.2: Cancer of the Brain and Other Nervous System. Invasive Cancer Incidence Rates by U.S. Census Regionand Division, State and Metropolitan Area, and Race (All Races, White, Black), United States: SEER and NPCRRegistries that Meet Quality Criteria∗†
Females, 1999
All Races White BlackAge-Adjusted Crude Age-Adjusted Crude Age-Adjusted Crude
Area Rate‡§ (CI) Rate‡ (CI) Rate‡§ (CI) Rate‡ (CI) Rate‡§ (CI) Rate‡ (CI)
United States 5.7 ( 5.5- 5.8) 6.0 ( 5.8- 6.1) 6.0 ( 5.8- 6.1) 6.5 ( 6.4- 6.7) 3.6 ( 3.3- 4.0) 3.2 ( 2.9- 3.5)
Northeast 5.9 ( 5.7- 6.2) 6.6 ( 6.3- 6.9) 6.3 ( 6.0- 6.6) 7.2 ( 6.8- 7.5) 3.6 ( 2.9- 4.3) 3.3 ( 2.7- 4.0)
New England 6.4 ( 5.8- 7.0) 6.9 ( 6.3- 7.6) 6.5 ( 5.9- 7.2) 7.3 ( 6.6- 8.0) ∼ ∼Connecticut 5.9 ( 4.9- 7.2) 6.5 ( 5.3- 7.8) 6.1 ( 4.9- 7.4) 6.8 ( 5.6- 8.3) ∼ ∼Maine
Massachusetts 6.7 ( 5.9- 7.7) 7.3 ( 6.4- 8.3) 7.0 ( 6.1- 8.0) 7.8 ( 6.8- 8.9) ∼ ∼New Hampshire 5.4 ( 3.7- 7.6) 5.3 ( 3.6- 7.4) 5.3 ( 3.6- 7.6) 5.2 ( 3.5- 7.4) ∼ ∼Rhode Island 6.7 ( 4.7- 9.2) 8.0 ( 5.7- 10.8) 6.8 ( 4.7- 9.5) 8.2 ( 5.9- 11.3) ∼ ∼Vermont
Middle Atlantic 5.8 ( 5.5- 6.2) 6.5 ( 6.1- 6.8) 6.2 ( 5.8- 6.6) 7.2 ( 6.7- 7.6) 3.6 ( 2.9- 4.4) 3.3 ( 2.7- 4.1)
New Jersey 6.4 ( 5.7- 7.2) 7.0 ( 6.3- 7.9) 6.9 ( 6.1- 7.8) 8.0 ( 7.1- 9.1) 3.5 ( 2.1- 5.6) 3.2 ( 1.9- 4.9)
New York 5.8 ( 5.3- 6.3) 6.3 ( 5.8- 6.8) 6.3 ( 5.7- 6.8) 7.1 ( 6.5- 7.7) 3.4 ( 2.6- 4.5) 3.2 ( 2.4- 4.2)
Pennsylvania 5.6 ( 5.0- 6.2) 6.4 ( 5.8- 7.0) 5.7 ( 5.1- 6.4) 6.7 ( 6.0- 7.4) 4.0 ( 2.6- 6.0) 3.9 ( 2.5- 5.8)
Midwest
East North Central
Illinois 5.4 ( 4.8- 5.9) 5.6 ( 5.0- 6.2) 5.7 ( 5.0- 6.3) 6.2 ( 5.5- 6.9) 3.5 ( 2.4- 5.1) 3.2 ( 2.1- 4.5)
Indiana
Michigan 6.0 ( 5.3- 6.7) 6.3 ( 5.6- 7.0) 6.3 ( 5.6- 7.1) 6.9 ( 6.1- 7.7) 3.4 ( 2.1- 5.2) 2.9 ( 1.8- 4.4)
Detroit 5.1 ( 4.2- 6.1) 5.4 ( 4.4- 6.5) 5.5 ( 4.4- 6.8) 6.2 ( 5.0- 7.6) 3.2 ( 1.8- 5.3) 2.9 ( 1.7- 4.8)
Ohio 5.8 ( 5.2- 6.4) 6.2 ( 5.6- 6.9) 5.9 ( 5.3- 6.6) 6.5 ( 5.8- 7.2) 4.0 ( 2.6- 6.0) 3.5 ( 2.2- 5.2)
Wisconsin 6.2 ( 5.3- 7.2) 6.5 ( 5.6- 7.6) 6.2 ( 5.3- 7.2) 6.7 ( 5.7- 7.8) ∼ ∼West North Central 5.8 ( 5.3- 6.3) 6.2 ( 5.7- 6.7) 6.0 ( 5.5- 6.5) 6.5 ( 6.0- 7.1) ∼ ∼Iowa 5.0 ( 4.0- 6.3) 5.7 ( 4.6- 7.1) 5.1 ( 4.0- 6.4) 5.8 ( 4.7- 7.2) ∼ ∼Kansas 5.3 ( 4.2- 6.7) 5.7 ( 4.5- 7.1) 5.6 ( 4.4- 7.0) 6.1 ( 4.8- 7.6) ∼ ∼Minnesota 6.1 ( 5.2- 7.2) 6.2 ( 5.2- 7.2) 6.4 ( 5.4- 7.6) 6.6 ( 5.6- 7.7) ∼ ∼Missouri 5.9 ( 5.1- 6.9) 6.5 ( 5.6- 7.5) 6.3 ( 5.4- 7.3) 7.0 ( 6.0- 8.2) ∼ ∼Nebraska 6.5 ( 5.0- 8.5) 7.2 ( 5.5- 9.2) 6.3 ( 4.7- 8.2) 7.0 ( 5.3- 9.1) ∼ ∼North Dakota 4.5 ( 2.6- 7.5) 5.3 ( 3.1- 8.6) 4.7 ( 2.7- 7.9) 5.7 ( 3.3- 9.1) ∼ ∼South Dakota
South
South Atlantic
Delaware 6.7 ( 4.4- 9.8) 7.0 ( 4.6- 10.2) 7.0 ( 4.4- 10.7) 7.7 ( 4.9- 11.5) ∼ ∼District of Columbia ∼ ∼ ∼ ∼ ∼ ∼Florida 5.8 ( 5.3- 6.4) 6.9 ( 6.3- 7.5) 6.0 ( 5.5- 6.6) 7.6 ( 6.9- 8.3) 3.7 ( 2.6- 5.2) 3.3 ( 2.4- 4.5)
Georgia
Atlanta 5.4 ( 4.1- 6.9) 4.6 ( 3.6- 5.9) 6.7 ( 5.0- 8.7) 6.4 ( 4.8- 8.3) ∼ ∼Maryland 5.3 ( 4.5- 6.3) 5.4 ( 4.6- 6.4) 5.5 ( 4.5- 6.7) 6.0 ( 4.9- 7.2) 4.0 ( 2.7- 6.0) 3.8 ( 2.5- 5.4)
North Carolina 4.8 ( 4.2- 5.6) 5.0 ( 4.4- 5.8) 5.5 ( 4.7- 6.4) 5.9 ( 5.0- 6.8) 2.7 ( 1.7- 4.1) 2.5 ( 1.5- 3.7)
South Carolina 5.0 ( 4.1- 6.1) 5.2 ( 4.2- 6.3) 5.4 ( 4.3- 6.8) 5.9 ( 4.7- 7.4) 4.0 ( 2.5- 6.2) 3.6 ( 2.2- 5.4)
Virginia
West Virginia 6.0 ( 4.6- 7.8) 6.7 ( 5.2- 8.6) 6.0 ( 4.6- 7.8) 6.8 ( 5.2- 8.7) ∼ ∼East South Central
Alabama
Kentucky 5.1 ( 4.2- 6.1) 5.4 ( 4.4- 6.5) 5.1 ( 4.1- 6.2) 5.5 ( 4.5- 6.6) ∼ ∼Mississippi
Tennessee
continued

Cancer Incidence, by U
.S. Census R
egion and Division, State, and M
etropolitan Area
89
Table 2.20.2: Cancer of the Brain and Other Nervous System. Invasive Cancer Incidence Rates by U.S. Census Regionand Division, State and Metropolitan Area, and Race (All Races, White, Black), United States: SEER and NPCRRegistries that Meet Quality Criteria∗† (continued)
Females, 1999
All Races White BlackAge-Adjusted Crude Age-Adjusted Crude Age-Adjusted Crude
Area Rate‡§ (CI) Rate‡ (CI) Rate‡§ (CI) Rate‡ (CI) Rate‡§ (CI) Rate‡ (CI)
West South Central
Arkansas
Louisiana 4.9 ( 4.0- 5.9) 4.9 ( 4.1- 5.9) 5.0 ( 4.0- 6.3) 5.4 ( 4.3- 6.7) 4.8 ( 3.2- 6.9) 4.1 ( 2.8- 5.8)
Oklahoma
Texas
West 5.5 ( 5.2- 5.8) 5.5 ( 5.2- 5.7) 5.9 ( 5.6- 6.2) 6.0 ( 5.7- 6.3) 3.3 ( 2.4- 4.4) 2.9 ( 2.1- 3.9)
Mountain
Arizona 6.2 ( 5.3- 7.3) 6.5 ( 5.5- 7.6) 6.7 ( 5.6- 7.8) 7.1 ( 6.0- 8.3) ∼ ∼Colorado 5.4 ( 4.4- 6.5) 5.3 ( 4.3- 6.4) 5.4 ( 4.4- 6.5) 5.3 ( 4.3- 6.4) ∼ ∼Idaho 6.0 ( 4.2- 8.4) 5.9 ( 4.2- 8.1) 6.2 ( 4.4- 8.6) 6.1 ( 4.3- 8.4) ∼ ∼Montana 7.0 ( 4.8- 10.0) 7.4 ( 5.1- 10.4) 6.9 ( 4.7- 10.0) 7.6 ( 5.1- 10.7) ∼ ∼Nevada
New Mexico 5.3 ( 3.9- 7.1) 5.2 ( 3.8- 6.9) 5.5 ( 4.0- 7.5) 5.6 ( 4.1- 7.6) ∼ ∼Utah 5.3 ( 3.9- 7.0) 4.7 ( 3.5- 6.1) 5.4 ( 4.0- 7.2) 4.8 ( 3.6- 6.4) ∼ ∼Wyoming ∼ ∼ ∼ ∼ ∼ ∼
Pacific 5.4 ( 5.1- 5.7) 5.4 ( 5.1- 5.7) 5.9 ( 5.5- 6.2) 5.9 ( 5.6- 6.3) 3.4 ( 2.5- 4.7) 3.1 ( 2.2- 4.1)
Alaska 7.4 ( 4.2- 13.1) 5.8 ( 3.4- 9.2) ∼ ∼ ∼ ∼California 5.2 ( 4.8- 5.5) 5.1 ( 4.7- 5.4) 5.7 ( 5.3- 6.1) 5.7 ( 5.3- 6.1) 3.5 ( 2.5- 4.9) 3.2 ( 2.3- 4.3)
San Francisco-Oakland 5.5 ( 4.5- 6.6) 5.8 ( 4.8- 6.9) 6.7 ( 5.4- 8.2) 7.3 ( 5.9- 8.9) ∼ ∼San Jose-Monterey 5.9 ( 4.6- 7.6) 5.8 ( 4.5- 7.4) 6.3 ( 4.7- 8.2) 6.3 ( 4.8- 8.2) ∼ ∼Los Angeles 4.8 ( 4.2- 5.5) 4.6 ( 4.0- 5.3) 5.5 ( 4.7- 6.3) 5.3 ( 4.6- 6.2) 4.5 ( 2.8- 6.8) 4.2 ( 2.6- 6.3)
Hawaii 3.8 ( 2.4- 5.8) 3.9 ( 2.5- 5.8) ∼ ∼ ∼ ∼Oregon 5.1 ( 4.1- 6.3) 5.4 ( 4.3- 6.6) 5.2 ( 4.1- 6.4) 5.5 ( 4.4- 6.8) ∼ ∼Washington 7.2 ( 6.3- 8.3) 7.2 ( 6.3- 8.3) 7.4 ( 6.4- 8.5) 7.5 ( 6.5- 8.6) ∼ ∼
Seattle-Puget Sound 7.0 ( 5.9- 8.2) 6.9 ( 5.8- 8.2) 7.3 ( 6.1- 8.7) 7.4 ( 6.2- 8.9) ∼ ∼∗ Data are from selected statewide and metropolitan area cancer registries that meet the following data quality criteria for all invasive cancer sites combined: case
ascertainment is at least 90% complete; ≥ 97% of cases pass a standard set of computerized edits; ≤ 5% of cases were ascertained by death certificate only; ≤ 3% of
cases are missing information on sex; ≤ 5% of cases are missing information on race; ≤ 3% of cases are missing information on age. See Appendix H for registry-specific
data quality information. U.S. rates cover approximately 78% of the U.S. population.
† Invasive cancers only
‡ Rates are per 100,000 persons. Population denominators for 1999 are projected from the 1990 census and may not accurately reflect the 1999 population size. Caution
should be used in interpreting rates based on these projected populations.
§ Rates are age-adjusted to the 2000 U.S. standard population.
∼ Rates are suppressed if fewer than 16 cases were reported in the specific area-race category.
Notes: Cases from suppressed rates are included in the U.S. and region/division rates. Observed region/division age-adjusted incidence rates are presented for
regions/divisions with ≥ 78% of the population covered by registries that meet the data quality criteria specified above, and if the 95% confidence intervals
around the observed region/division rates for each of four major cancers include "bias-corrected" estimated region/division rates (see technical notes) for
each of those cancers. U.S rates are as presented in Table 1.2. California, Washington, and Michigan state rates each include cases from the SEER metropolitan
areas.
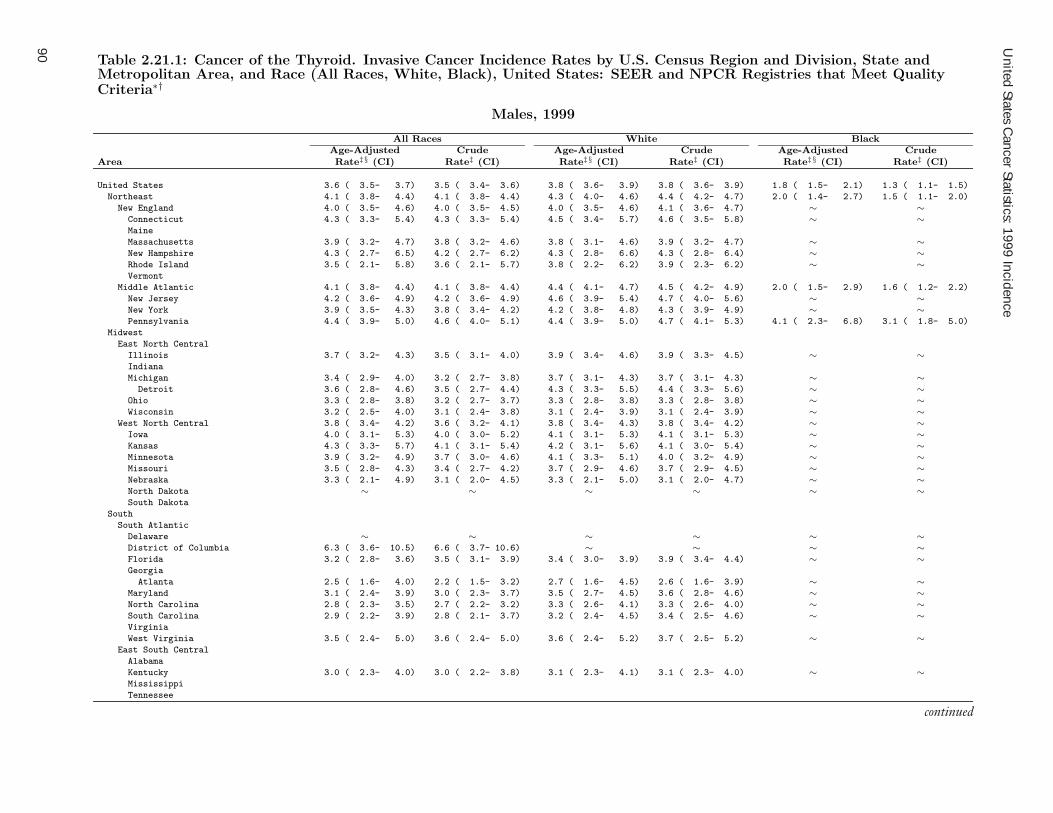
United States C
ancer Statistics: 1999 Incidence
90
Table 2.21.1: Cancer of the Thyroid. Invasive Cancer Incidence Rates by U.S. Census Region and Division, State andMetropolitan Area, and Race (All Races, White, Black), United States: SEER and NPCR Registries that Meet QualityCriteria∗†
Males, 1999
All Races White BlackAge-Adjusted Crude Age-Adjusted Crude Age-Adjusted Crude
Area Rate‡§ (CI) Rate‡ (CI) Rate‡§ (CI) Rate‡ (CI) Rate‡§ (CI) Rate‡ (CI)
United States 3.6 ( 3.5- 3.7) 3.5 ( 3.4- 3.6) 3.8 ( 3.6- 3.9) 3.8 ( 3.6- 3.9) 1.8 ( 1.5- 2.1) 1.3 ( 1.1- 1.5)
Northeast 4.1 ( 3.8- 4.4) 4.1 ( 3.8- 4.4) 4.3 ( 4.0- 4.6) 4.4 ( 4.2- 4.7) 2.0 ( 1.4- 2.7) 1.5 ( 1.1- 2.0)
New England 4.0 ( 3.5- 4.6) 4.0 ( 3.5- 4.5) 4.0 ( 3.5- 4.6) 4.1 ( 3.6- 4.7) ∼ ∼Connecticut 4.3 ( 3.3- 5.4) 4.3 ( 3.3- 5.4) 4.5 ( 3.4- 5.7) 4.6 ( 3.5- 5.8) ∼ ∼Maine
Massachusetts 3.9 ( 3.2- 4.7) 3.8 ( 3.2- 4.6) 3.8 ( 3.1- 4.6) 3.9 ( 3.2- 4.7) ∼ ∼New Hampshire 4.3 ( 2.7- 6.5) 4.2 ( 2.7- 6.2) 4.3 ( 2.8- 6.6) 4.3 ( 2.8- 6.4) ∼ ∼Rhode Island 3.5 ( 2.1- 5.8) 3.6 ( 2.1- 5.7) 3.8 ( 2.2- 6.2) 3.9 ( 2.3- 6.2) ∼ ∼Vermont
Middle Atlantic 4.1 ( 3.8- 4.4) 4.1 ( 3.8- 4.4) 4.4 ( 4.1- 4.7) 4.5 ( 4.2- 4.9) 2.0 ( 1.5- 2.9) 1.6 ( 1.2- 2.2)
New Jersey 4.2 ( 3.6- 4.9) 4.2 ( 3.6- 4.9) 4.6 ( 3.9- 5.4) 4.7 ( 4.0- 5.6) ∼ ∼New York 3.9 ( 3.5- 4.3) 3.8 ( 3.4- 4.2) 4.2 ( 3.8- 4.8) 4.3 ( 3.9- 4.9) ∼ ∼Pennsylvania 4.4 ( 3.9- 5.0) 4.6 ( 4.0- 5.1) 4.4 ( 3.9- 5.0) 4.7 ( 4.1- 5.3) 4.1 ( 2.3- 6.8) 3.1 ( 1.8- 5.0)
Midwest
East North Central
Illinois 3.7 ( 3.2- 4.3) 3.5 ( 3.1- 4.0) 3.9 ( 3.4- 4.6) 3.9 ( 3.3- 4.5) ∼ ∼Indiana
Michigan 3.4 ( 2.9- 4.0) 3.2 ( 2.7- 3.8) 3.7 ( 3.1- 4.3) 3.7 ( 3.1- 4.3) ∼ ∼Detroit 3.6 ( 2.8- 4.6) 3.5 ( 2.7- 4.4) 4.3 ( 3.3- 5.5) 4.4 ( 3.3- 5.6) ∼ ∼
Ohio 3.3 ( 2.8- 3.8) 3.2 ( 2.7- 3.7) 3.3 ( 2.8- 3.8) 3.3 ( 2.8- 3.8) ∼ ∼Wisconsin 3.2 ( 2.5- 4.0) 3.1 ( 2.4- 3.8) 3.1 ( 2.4- 3.9) 3.1 ( 2.4- 3.9) ∼ ∼
West North Central 3.8 ( 3.4- 4.2) 3.6 ( 3.2- 4.1) 3.8 ( 3.4- 4.3) 3.8 ( 3.4- 4.2) ∼ ∼Iowa 4.0 ( 3.1- 5.3) 4.0 ( 3.0- 5.2) 4.1 ( 3.1- 5.3) 4.1 ( 3.1- 5.3) ∼ ∼Kansas 4.3 ( 3.3- 5.7) 4.1 ( 3.1- 5.4) 4.2 ( 3.1- 5.6) 4.1 ( 3.0- 5.4) ∼ ∼Minnesota 3.9 ( 3.2- 4.9) 3.7 ( 3.0- 4.6) 4.1 ( 3.3- 5.1) 4.0 ( 3.2- 4.9) ∼ ∼Missouri 3.5 ( 2.8- 4.3) 3.4 ( 2.7- 4.2) 3.7 ( 2.9- 4.6) 3.7 ( 2.9- 4.5) ∼ ∼Nebraska 3.3 ( 2.1- 4.9) 3.1 ( 2.0- 4.5) 3.3 ( 2.1- 5.0) 3.1 ( 2.0- 4.7) ∼ ∼North Dakota ∼ ∼ ∼ ∼ ∼ ∼South Dakota
South
South Atlantic
Delaware ∼ ∼ ∼ ∼ ∼ ∼District of Columbia 6.3 ( 3.6- 10.5) 6.6 ( 3.7- 10.6) ∼ ∼ ∼ ∼Florida 3.2 ( 2.8- 3.6) 3.5 ( 3.1- 3.9) 3.4 ( 3.0- 3.9) 3.9 ( 3.4- 4.4) ∼ ∼Georgia
Atlanta 2.5 ( 1.6- 4.0) 2.2 ( 1.5- 3.2) 2.7 ( 1.6- 4.5) 2.6 ( 1.6- 3.9) ∼ ∼Maryland 3.1 ( 2.4- 3.9) 3.0 ( 2.3- 3.7) 3.5 ( 2.7- 4.5) 3.6 ( 2.8- 4.6) ∼ ∼North Carolina 2.8 ( 2.3- 3.5) 2.7 ( 2.2- 3.2) 3.3 ( 2.6- 4.1) 3.3 ( 2.6- 4.0) ∼ ∼South Carolina 2.9 ( 2.2- 3.9) 2.8 ( 2.1- 3.7) 3.2 ( 2.4- 4.5) 3.4 ( 2.5- 4.6) ∼ ∼Virginia
West Virginia 3.5 ( 2.4- 5.0) 3.6 ( 2.4- 5.0) 3.6 ( 2.4- 5.2) 3.7 ( 2.5- 5.2) ∼ ∼East South Central
Alabama
Kentucky 3.0 ( 2.3- 4.0) 3.0 ( 2.2- 3.8) 3.1 ( 2.3- 4.1) 3.1 ( 2.3- 4.0) ∼ ∼Mississippi
Tennessee
continued

Cancer Incidence, by U
.S. Census R
egion and Division, State, and M
etropolitan Area
91
Table 2.21.1: Cancer of the Thyroid. Invasive Cancer Incidence Rates by U.S. Census Region and Division, State andMetropolitan Area, and Race (All Races, White, Black), United States: SEER and NPCR Registries that Meet QualityCriteria∗† (continued)
Males, 1999
All Races White BlackAge-Adjusted Crude Age-Adjusted Crude Age-Adjusted Crude
Area Rate‡§ (CI) Rate‡ (CI) Rate‡§ (CI) Rate‡ (CI) Rate‡§ (CI) Rate‡ (CI)
West South Central
Arkansas
Louisiana 3.0 ( 2.3- 4.0) 2.8 ( 2.1- 3.6) 3.4 ( 2.5- 4.6) 3.5 ( 2.6- 4.6) ∼ ∼Oklahoma
Texas
West 3.7 ( 3.5- 3.9) 3.4 ( 3.2- 3.6) 3.7 ( 3.5- 4.0) 3.5 ( 3.3- 3.7) 1.9 ( 1.2- 3.0) 1.5 ( 0.9- 2.2)
Mountain
Arizona 3.7 ( 2.9- 4.6) 3.5 ( 2.8- 4.3) 3.8 ( 3.0- 4.8) 3.7 ( 2.9- 4.6) ∼ ∼Colorado 3.3 ( 2.6- 4.4) 3.2 ( 2.5- 4.1) 3.3 ( 2.5- 4.3) 3.2 ( 2.4- 4.1) ∼ ∼Idaho 4.0 ( 2.6- 6.2) 3.7 ( 2.3- 5.5) 4.1 ( 2.6- 6.3) 3.8 ( 2.4- 5.7) ∼ ∼Montana 5.5 ( 3.5- 8.4) 5.5 ( 3.5- 8.1) 5.4 ( 3.3- 8.3) 5.4 ( 3.4- 8.2) ∼ ∼Nevada
New Mexico 4.0 ( 2.8- 5.9) 3.7 ( 2.6- 5.3) 4.5 ( 3.1- 6.5) 4.3 ( 3.0- 6.1) ∼ ∼Utah 3.8 ( 2.6- 5.6) 3.1 ( 2.1- 4.4) 3.8 ( 2.5- 5.6) 3.1 ( 2.1- 4.4) ∼ ∼Wyoming ∼ ∼ ∼ ∼ ∼ ∼
Pacific 3.6 ( 3.4- 3.9) 3.4 ( 3.1- 3.6) 3.6 ( 3.3- 3.9) 3.4 ( 3.2- 3.7) 1.8 ( 1.1- 3.1) 1.4 ( 0.9- 2.2)
Alaska 6.4 ( 3.6- 13.6) 5.5 ( 3.3- 8.7) ∼ ∼ ∼ ∼California 3.4 ( 3.1- 3.7) 3.0 ( 2.8- 3.3) 3.5 ( 3.1- 3.8) 3.2 ( 2.9- 3.5) 1.9 ( 1.1- 3.3) 1.5 ( 0.9- 2.3)
San Francisco-Oakland 3.0 ( 2.3- 4.0) 3.1 ( 2.3- 3.9) 3.0 ( 2.1- 4.1) 3.1 ( 2.3- 4.2) ∼ ∼San Jose-Monterey 4.9 ( 3.6- 6.6) 4.3 ( 3.2- 5.7) 5.4 ( 3.9- 7.3) 4.8 ( 3.5- 6.5) ∼ ∼Los Angeles 3.5 ( 2.9- 4.1) 3.0 ( 2.5- 3.5) 3.6 ( 3.0- 4.4) 3.1 ( 2.6- 3.8) ∼ ∼
Hawaii 6.3 ( 4.5- 8.8) 6.3 ( 4.4- 8.6) ∼ ∼ ∼ ∼Oregon 3.9 ( 3.0- 5.0) 3.9 ( 3.0- 5.0) 3.7 ( 2.9- 4.9) 3.9 ( 2.9- 5.0) ∼ ∼Washington 4.2 ( 3.5- 5.1) 4.1 ( 3.3- 4.9) 4.0 ( 3.3- 4.9) 4.0 ( 3.2- 4.8) ∼ ∼
Seattle-Puget Sound 4.4 ( 3.5- 5.5) 4.3 ( 3.4- 5.3) 4.5 ( 3.5- 5.7) 4.5 ( 3.6- 5.7) ∼ ∼∗ Data are from selected statewide and metropolitan area cancer registries that meet the following data quality criteria for all invasive cancer sites combined: case
ascertainment is at least 90% complete; ≥ 97% of cases pass a standard set of computerized edits; ≤ 5% of cases were ascertained by death certificate only; ≤ 3% of
cases are missing information on sex; ≤ 5% of cases are missing information on race; ≤ 3% of cases are missing information on age. See Appendix H for registry-specific
data quality information. U.S. rates cover approximately 78% of the U.S. population.
† Invasive cancers only
‡ Rates are per 100,000 persons. Population denominators for 1999 are projected from the 1990 census and may not accurately reflect the 1999 population size. Caution
should be used in interpreting rates based on these projected populations.
§ Rates are age-adjusted to the 2000 U.S. standard population.
∼ Rates are suppressed if fewer than 16 cases were reported in the specific area-race category.
Notes: Cases from suppressed rates are included in the U.S. and region/division rates. Observed region/division age-adjusted incidence rates are presented for
regions/divisions with ≥ 78% of the population covered by registries that meet the data quality criteria specified above, and if the 95% confidence intervals
around the observed region/division rates for each of four major cancers include "bias-corrected" estimated region/division rates (see technical notes) for
each of those cancers. U.S rates are as presented in Table 1.1. California, Washington, and Michigan state rates each include cases from the SEER metropolitan
areas.

United States C
ancer Statistics: 1999 Incidence
92
Table 2.21.2: Cancer of the Thyroid. Invasive Cancer Incidence Rates by U.S. Census Region and Division, State andMetropolitan Area, and Race (All Races, White, Black), United States: SEER and NPCR Registries that Meet QualityCriteria∗†
Females, 1999
All Races White BlackAge-Adjusted Crude Age-Adjusted Crude Age-Adjusted Crude
Area Rate‡§ (CI) Rate‡ (CI) Rate‡§ (CI) Rate‡ (CI) Rate‡§ (CI) Rate‡ (CI)
United States 9.9 ( 9.7- 10.1) 10.0 ( 9.8- 10.2) 10.2 ( 10.0- 10.4) 10.4 ( 10.2- 10.7) 5.9 ( 5.5- 6.4) 5.4 ( 5.0- 5.8)
Northeast 11.4 ( 11.0- 11.8) 11.8 ( 11.4- 12.2) 11.7 ( 11.3- 12.2) 12.2 ( 11.8- 12.7) 6.6 ( 5.7- 7.6) 6.2 ( 5.4- 7.1)
New England 10.6 ( 9.8- 11.4) 11.0 ( 10.1- 11.8) 10.6 ( 9.7- 11.5) 11.1 ( 10.2- 12.0) 7.9 ( 5.1- 11.9) 6.8 ( 4.5- 9.8)
Connecticut 10.9 ( 9.4- 12.6) 11.3 ( 9.8- 13.0) 11.1 ( 9.4- 12.9) 11.6 ( 9.9- 13.4) ∼ ∼Maine
Massachusetts 10.6 ( 9.5- 11.7) 11.0 ( 9.9- 12.2) 10.5 ( 9.3- 11.7) 11.1 ( 9.9- 12.4) ∼ ∼New Hampshire 7.0 ( 5.0- 9.4) 7.2 ( 5.2- 9.7) 7.1 ( 5.1- 9.6) 7.4 ( 5.4- 9.9) ∼ ∼Rhode Island 13.9 ( 10.9- 17.6) 14.0 ( 11.0- 17.6) 14.0 ( 10.8- 17.9) 14.2 ( 11.0- 18.0) ∼ ∼Vermont
Middle Atlantic 11.6 ( 11.1- 12.1) 12.0 ( 11.5- 12.5) 12.1 ( 11.6- 12.6) 12.6 ( 12.1- 13.2) 6.4 ( 5.5- 7.5) 6.1 ( 5.3- 7.1)
New Jersey 11.0 ( 10.0- 12.0) 11.4 ( 10.4- 12.5) 11.8 ( 10.7- 13.1) 12.4 ( 11.2- 13.6) 5.1 ( 3.4- 7.5) 4.6 ( 3.1- 6.6)
New York 11.3 ( 10.6- 12.0) 11.7 ( 11.0- 12.4) 12.0 ( 11.3- 12.9) 12.5 ( 11.7- 13.4) 5.3 ( 4.2- 6.6) 5.1 ( 4.0- 6.2)
Pennsylvania 12.5 ( 11.6- 13.4) 13.0 ( 12.1- 13.9) 12.3 ( 11.4- 13.3) 13.0 ( 12.0- 14.0) 11.3 ( 8.7- 14.4) 10.7 ( 8.2- 13.6)
Midwest
East North Central
Illinois 10.1 ( 9.4- 11.0) 10.1 ( 9.4- 11.0) 10.9 ( 10.0- 11.9) 11.0 ( 10.1- 12.0) 3.7 ( 2.6- 5.3) 3.5 ( 2.4- 4.8)
Indiana
Michigan 10.2 ( 9.3- 11.1) 10.3 ( 9.5- 11.3) 10.3 ( 9.4- 11.3) 10.6 ( 9.6- 11.6) 8.1 ( 6.1- 10.6) 7.3 ( 5.5- 9.5)
Detroit 10.3 ( 9.0- 11.7) 10.6 ( 9.3- 12.1) 11.0 ( 9.4- 12.8) 11.6 ( 10.0- 13.5) 7.4 ( 5.2- 10.2) 7.0 ( 4.9- 9.5)
Ohio 7.6 ( 6.9- 8.4) 7.8 ( 7.1- 8.5) 7.8 ( 7.1- 8.6) 8.1 ( 7.3- 8.9) 3.5 ( 2.2- 5.4) 3.2 ( 2.0- 4.8)
Wisconsin 8.5 ( 7.5- 9.7) 8.6 ( 7.5- 9.8) 9.0 ( 7.8- 10.2) 9.1 ( 8.0- 10.4) ∼ ∼West North Central 9.9 ( 9.3- 10.6) 9.9 ( 9.3- 10.6) 10.0 ( 9.3- 10.7) 10.1 ( 9.5- 10.8) 6.8 ( 4.6- 9.8) 5.7 ( 3.9- 8.1)
Iowa 9.7 ( 8.1- 11.4) 9.8 ( 8.3- 11.5) 9.6 ( 8.1- 11.4) 9.8 ( 8.2- 11.6) ∼ ∼Kansas 10.5 ( 8.8- 12.4) 10.5 ( 8.9- 12.4) 10.5 ( 8.7- 12.5) 10.6 ( 8.9- 12.6) ∼ ∼Minnesota 9.9 ( 8.7- 11.2) 9.8 ( 8.6- 11.2) 9.8 ( 8.6- 11.2) 9.9 ( 8.6- 11.2) ∼ ∼Missouri 10.0 ( 8.9- 11.2) 10.2 ( 9.0- 11.4) 10.3 ( 9.1- 11.7) 10.6 ( 9.3- 12.0) 7.0 ( 4.2- 10.9) 6.1 ( 3.7- 9.4)
Nebraska 9.2 ( 7.3- 11.6) 9.1 ( 7.1- 11.3) 9.6 ( 7.5- 12.0) 9.4 ( 7.4- 11.8) ∼ ∼North Dakota 9.5 ( 6.4- 13.7) 9.7 ( 6.6- 13.8) 9.6 ( 6.4- 14.0) 10.1 ( 6.8- 14.4) ∼ ∼South Dakota
South
South Atlantic
Delaware 13.2 ( 9.8- 17.3) 13.7 ( 10.3- 17.9) 13.5 ( 9.8- 18.3) 14.4 ( 10.4- 19.4) ∼ ∼District of Columbia 14.8 ( 10.8- 20.2) 16.6 ( 12.2- 22.1) ∼ ∼ 14.7 ( 9.7- 21.9) 16.6 ( 11.1- 23.9)
Florida 8.8 ( 8.1- 9.5) 9.2 ( 8.5- 9.8) 9.4 ( 8.6- 10.2) 9.9 ( 9.1- 10.7) 6.1 ( 4.7- 7.9) 5.3 ( 4.1- 6.7)
Georgia
Atlanta 9.4 ( 7.8- 11.2) 9.3 ( 7.7- 11.0) 9.9 ( 8.0- 12.3) 10.4 ( 8.4- 12.8) 7.5 ( 4.8- 11.7) 6.4 ( 4.3- 9.2)
Maryland 10.6 ( 9.4- 11.9) 10.9 ( 9.7- 12.2) 11.9 ( 10.4- 13.6) 12.4 ( 10.8- 14.2) 7.0 ( 5.2- 9.4) 6.9 ( 5.2- 9.0)
North Carolina 6.5 ( 5.8- 7.4) 6.6 ( 5.8- 7.5) 7.3 ( 6.3- 8.3) 7.5 ( 6.5- 8.5) 3.7 ( 2.5- 5.3) 3.5 ( 2.4- 4.9)
South Carolina 6.7 ( 5.7- 8.0) 7.0 ( 5.9- 8.2) 7.6 ( 6.3- 9.2) 8.1 ( 6.7- 9.8) 4.6 ( 3.0- 6.8) 4.2 ( 2.8- 6.2)
Virginia
West Virginia 10.9 ( 8.9- 13.3) 11.4 ( 9.4- 13.8) 11.1 ( 9.1- 13.6) 11.7 ( 9.5- 14.1) ∼ ∼East South Central
Alabama
Kentucky 9.0 ( 7.7- 10.4) 9.2 ( 8.0- 10.6) 9.1 ( 7.8- 10.6) 9.4 ( 8.1- 10.9) ∼ ∼Mississippi
Tennessee
continued

Cancer Incidence, by U
.S. Census R
egion and Division, State, and M
etropolitan Area
93
Table 2.21.2: Cancer of the Thyroid. Invasive Cancer Incidence Rates by U.S. Census Region and Division, State andMetropolitan Area, and Race (All Races, White, Black), United States: SEER and NPCR Registries that Meet QualityCriteria∗† (continued)
Females, 1999
All Races White BlackAge-Adjusted Crude Age-Adjusted Crude Age-Adjusted Crude
Area Rate‡§ (CI) Rate‡ (CI) Rate‡§ (CI) Rate‡ (CI) Rate‡§ (CI) Rate‡ (CI)
West South Central
Arkansas
Louisiana 7.6 ( 6.5- 8.8) 7.5 ( 6.4- 8.8) 8.5 ( 7.1- 10.2) 8.8 ( 7.4- 10.4) 6.1 ( 4.3- 8.4) 5.2 ( 3.7- 7.1)
Oklahoma
Texas
West 10.1 ( 9.7- 10.5) 10.0 ( 9.6- 10.3) 10.1 ( 9.7- 10.5) 10.0 ( 9.6- 10.4) 5.0 ( 3.9- 6.3) 4.8 ( 3.8- 6.0)
Mountain
Arizona 9.6 ( 8.4- 10.9) 9.3 ( 8.2- 10.6) 10.0 ( 8.7- 11.5) 9.9 ( 8.6- 11.3) ∼ ∼Colorado 10.7 ( 9.3- 12.2) 10.9 ( 9.5- 12.4) 10.6 ( 9.2- 12.2) 10.9 ( 9.4- 12.5) ∼ ∼Idaho 8.5 ( 6.3- 11.2) 8.1 ( 6.1- 10.7) 8.4 ( 6.2- 11.2) 8.1 ( 6.0- 10.7) ∼ ∼Montana 15.3 ( 11.9- 19.5) 15.3 ( 11.9- 19.4) 15.3 ( 11.7- 19.7) 15.4 ( 11.8- 19.6) ∼ ∼Nevada
New Mexico 11.5 ( 9.4- 14.0) 11.3 ( 9.2- 13.8) 12.4 ( 10.0- 15.2) 12.5 ( 10.1- 15.3) ∼ ∼Utah 12.4 ( 10.2- 15.0) 10.7 ( 8.9- 12.9) 12.2 ( 10.0- 14.8) 10.5 ( 8.6- 12.7) ∼ ∼Wyoming 8.3 ( 5.0- 13.3) 8.0 ( 4.8- 12.4) 8.3 ( 4.9- 13.4) 7.9 ( 4.7- 12.4) ∼ ∼
Pacific 9.9 ( 9.5- 10.3) 9.8 ( 9.4- 10.2) 9.8 ( 9.4- 10.3) 9.8 ( 9.3- 10.3) 5.1 ( 3.9- 6.5) 4.9 ( 3.8- 6.2)
Alaska 10.7 ( 7.2- 16.5) 10.2 ( 6.9- 14.5) 9.1 ( 5.4- 15.8) 9.2 ( 5.6- 14.1) ∼ ∼California 9.6 ( 9.2- 10.1) 9.5 ( 9.0- 10.0) 9.8 ( 9.3- 10.4) 9.7 ( 9.2- 10.3) 4.5 ( 3.4- 6.0) 4.4 ( 3.3- 5.7)
San Francisco-Oakland 8.1 ( 7.0- 9.5) 8.6 ( 7.4- 10.0) 8.6 ( 7.2- 10.4) 9.2 ( 7.7- 11.0) ∼ ∼San Jose-Monterey 10.1 ( 8.3- 12.1) 10.2 ( 8.4- 12.2) 9.8 ( 7.9- 12.1) 9.9 ( 7.9- 12.2) ∼ ∼Los Angeles 10.4 ( 9.5- 11.4) 10.1 ( 9.2- 11.0) 11.2 ( 10.1- 12.4) 10.8 ( 9.7- 11.9) 4.2 ( 2.7- 6.4) 4.2 ( 2.6- 6.3)
Hawaii 12.0 ( 9.4- 15.2) 12.4 ( 9.7- 15.5) ∼ ∼ ∼ ∼Oregon 8.6 ( 7.3- 10.1) 8.8 ( 7.5- 10.4) 8.8 ( 7.4- 10.4) 9.1 ( 7.6- 10.7) ∼ ∼Washington 11.5 ( 10.3- 12.8) 11.6 ( 10.4- 12.9) 10.8 ( 9.6- 12.2) 11.0 ( 9.8- 12.4) ∼ ∼
Seattle-Puget Sound 12.2 ( 10.7- 13.8) 12.4 ( 10.9- 14.1) 11.9 ( 10.4- 13.7) 12.4 ( 10.8- 14.1) ∼ ∼∗ Data are from selected statewide and metropolitan area cancer registries that meet the following data quality criteria for all invasive cancer sites combined: case
ascertainment is at least 90% complete; ≥ 97% of cases pass a standard set of computerized edits; ≤ 5% of cases were ascertained by death certificate only; ≤ 3% of
cases are missing information on sex; ≤ 5% of cases are missing information on race; ≤ 3% of cases are missing information on age. See Appendix H for registry-specific
data quality information. U.S. rates cover approximately 78% of the U.S. population.
† Invasive cancers only
‡ Rates are per 100,000 persons. Population denominators for 1999 are projected from the 1990 census and may not accurately reflect the 1999 population size. Caution
should be used in interpreting rates based on these projected populations.
§ Rates are age-adjusted to the 2000 U.S. standard population.
∼ Rates are suppressed if fewer than 16 cases were reported in the specific area-race category.
Notes: Cases from suppressed rates are included in the U.S. and region/division rates. Observed region/division age-adjusted incidence rates are presented for
regions/divisions with ≥ 78% of the population covered by registries that meet the data quality criteria specified above, and if the 95% confidence intervals
around the observed region/division rates for each of four major cancers include "bias-corrected" estimated region/division rates (see technical notes) for
each of those cancers. U.S rates are as presented in Table 1.2. California, Washington, and Michigan state rates each include cases from the SEER metropolitan
areas.
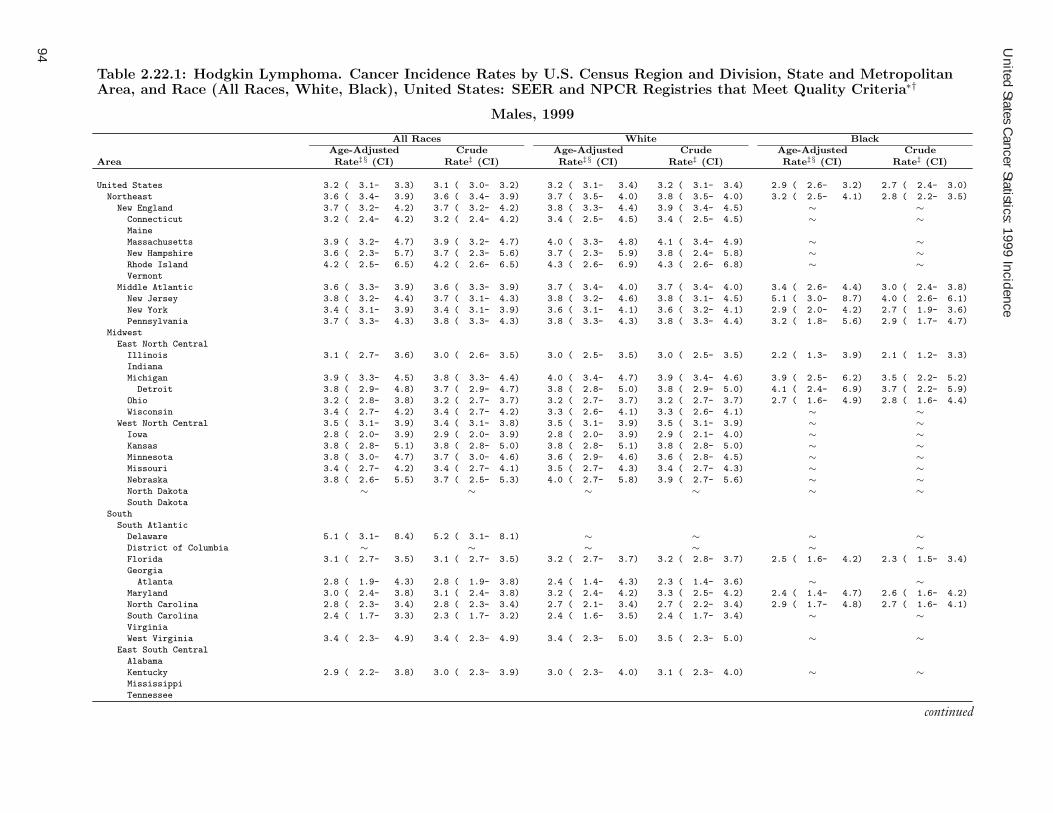
United States C
ancer Statistics: 1999 Incidence
94
Table 2.22.1: Hodgkin Lymphoma. Cancer Incidence Rates by U.S. Census Region and Division, State and MetropolitanArea, and Race (All Races, White, Black), United States: SEER and NPCR Registries that Meet Quality Criteria∗†
Males, 1999
All Races White BlackAge-Adjusted Crude Age-Adjusted Crude Age-Adjusted Crude
Area Rate‡§ (CI) Rate‡ (CI) Rate‡§ (CI) Rate‡ (CI) Rate‡§ (CI) Rate‡ (CI)
United States 3.2 ( 3.1- 3.3) 3.1 ( 3.0- 3.2) 3.2 ( 3.1- 3.4) 3.2 ( 3.1- 3.4) 2.9 ( 2.6- 3.2) 2.7 ( 2.4- 3.0)
Northeast 3.6 ( 3.4- 3.9) 3.6 ( 3.4- 3.9) 3.7 ( 3.5- 4.0) 3.8 ( 3.5- 4.0) 3.2 ( 2.5- 4.1) 2.8 ( 2.2- 3.5)
New England 3.7 ( 3.2- 4.2) 3.7 ( 3.2- 4.2) 3.8 ( 3.3- 4.4) 3.9 ( 3.4- 4.5) ∼ ∼Connecticut 3.2 ( 2.4- 4.2) 3.2 ( 2.4- 4.2) 3.4 ( 2.5- 4.5) 3.4 ( 2.5- 4.5) ∼ ∼Maine
Massachusetts 3.9 ( 3.2- 4.7) 3.9 ( 3.2- 4.7) 4.0 ( 3.3- 4.8) 4.1 ( 3.4- 4.9) ∼ ∼New Hampshire 3.6 ( 2.3- 5.7) 3.7 ( 2.3- 5.6) 3.7 ( 2.3- 5.9) 3.8 ( 2.4- 5.8) ∼ ∼Rhode Island 4.2 ( 2.5- 6.5) 4.2 ( 2.6- 6.5) 4.3 ( 2.6- 6.9) 4.3 ( 2.6- 6.8) ∼ ∼Vermont
Middle Atlantic 3.6 ( 3.3- 3.9) 3.6 ( 3.3- 3.9) 3.7 ( 3.4- 4.0) 3.7 ( 3.4- 4.0) 3.4 ( 2.6- 4.4) 3.0 ( 2.4- 3.8)
New Jersey 3.8 ( 3.2- 4.4) 3.7 ( 3.1- 4.3) 3.8 ( 3.2- 4.6) 3.8 ( 3.1- 4.5) 5.1 ( 3.0- 8.7) 4.0 ( 2.6- 6.1)
New York 3.4 ( 3.1- 3.9) 3.4 ( 3.1- 3.9) 3.6 ( 3.1- 4.1) 3.6 ( 3.2- 4.1) 2.9 ( 2.0- 4.2) 2.7 ( 1.9- 3.6)
Pennsylvania 3.7 ( 3.3- 4.3) 3.8 ( 3.3- 4.3) 3.8 ( 3.3- 4.3) 3.8 ( 3.3- 4.4) 3.2 ( 1.8- 5.6) 2.9 ( 1.7- 4.7)
Midwest
East North Central
Illinois 3.1 ( 2.7- 3.6) 3.0 ( 2.6- 3.5) 3.0 ( 2.5- 3.5) 3.0 ( 2.5- 3.5) 2.2 ( 1.3- 3.9) 2.1 ( 1.2- 3.3)
Indiana
Michigan 3.9 ( 3.3- 4.5) 3.8 ( 3.3- 4.4) 4.0 ( 3.4- 4.7) 3.9 ( 3.4- 4.6) 3.9 ( 2.5- 6.2) 3.5 ( 2.2- 5.2)
Detroit 3.8 ( 2.9- 4.8) 3.7 ( 2.9- 4.7) 3.8 ( 2.8- 5.0) 3.8 ( 2.9- 5.0) 4.1 ( 2.4- 6.9) 3.7 ( 2.2- 5.9)
Ohio 3.2 ( 2.8- 3.8) 3.2 ( 2.7- 3.7) 3.2 ( 2.7- 3.7) 3.2 ( 2.7- 3.7) 2.7 ( 1.6- 4.9) 2.8 ( 1.6- 4.4)
Wisconsin 3.4 ( 2.7- 4.2) 3.4 ( 2.7- 4.2) 3.3 ( 2.6- 4.1) 3.3 ( 2.6- 4.1) ∼ ∼West North Central 3.5 ( 3.1- 3.9) 3.4 ( 3.1- 3.8) 3.5 ( 3.1- 3.9) 3.5 ( 3.1- 3.9) ∼ ∼Iowa 2.8 ( 2.0- 3.9) 2.9 ( 2.0- 3.9) 2.8 ( 2.0- 3.9) 2.9 ( 2.1- 4.0) ∼ ∼Kansas 3.8 ( 2.8- 5.1) 3.8 ( 2.8- 5.0) 3.8 ( 2.8- 5.1) 3.8 ( 2.8- 5.0) ∼ ∼Minnesota 3.8 ( 3.0- 4.7) 3.7 ( 3.0- 4.6) 3.6 ( 2.9- 4.6) 3.6 ( 2.8- 4.5) ∼ ∼Missouri 3.4 ( 2.7- 4.2) 3.4 ( 2.7- 4.1) 3.5 ( 2.7- 4.3) 3.4 ( 2.7- 4.3) ∼ ∼Nebraska 3.8 ( 2.6- 5.5) 3.7 ( 2.5- 5.3) 4.0 ( 2.7- 5.8) 3.9 ( 2.7- 5.6) ∼ ∼North Dakota ∼ ∼ ∼ ∼ ∼ ∼South Dakota
South
South Atlantic
Delaware 5.1 ( 3.1- 8.4) 5.2 ( 3.1- 8.1) ∼ ∼ ∼ ∼District of Columbia ∼ ∼ ∼ ∼ ∼ ∼Florida 3.1 ( 2.7- 3.5) 3.1 ( 2.7- 3.5) 3.2 ( 2.7- 3.7) 3.2 ( 2.8- 3.7) 2.5 ( 1.6- 4.2) 2.3 ( 1.5- 3.4)
Georgia
Atlanta 2.8 ( 1.9- 4.3) 2.8 ( 1.9- 3.8) 2.4 ( 1.4- 4.3) 2.3 ( 1.4- 3.6) ∼ ∼Maryland 3.0 ( 2.4- 3.8) 3.1 ( 2.4- 3.8) 3.2 ( 2.4- 4.2) 3.3 ( 2.5- 4.2) 2.4 ( 1.4- 4.7) 2.6 ( 1.6- 4.2)
North Carolina 2.8 ( 2.3- 3.4) 2.8 ( 2.3- 3.4) 2.7 ( 2.1- 3.4) 2.7 ( 2.2- 3.4) 2.9 ( 1.7- 4.8) 2.7 ( 1.6- 4.1)
South Carolina 2.4 ( 1.7- 3.3) 2.3 ( 1.7- 3.2) 2.4 ( 1.6- 3.5) 2.4 ( 1.7- 3.4) ∼ ∼Virginia
West Virginia 3.4 ( 2.3- 4.9) 3.4 ( 2.3- 4.9) 3.4 ( 2.3- 5.0) 3.5 ( 2.3- 5.0) ∼ ∼East South Central
Alabama
Kentucky 2.9 ( 2.2- 3.8) 3.0 ( 2.3- 3.9) 3.0 ( 2.3- 4.0) 3.1 ( 2.3- 4.0) ∼ ∼Mississippi
Tennessee
continued
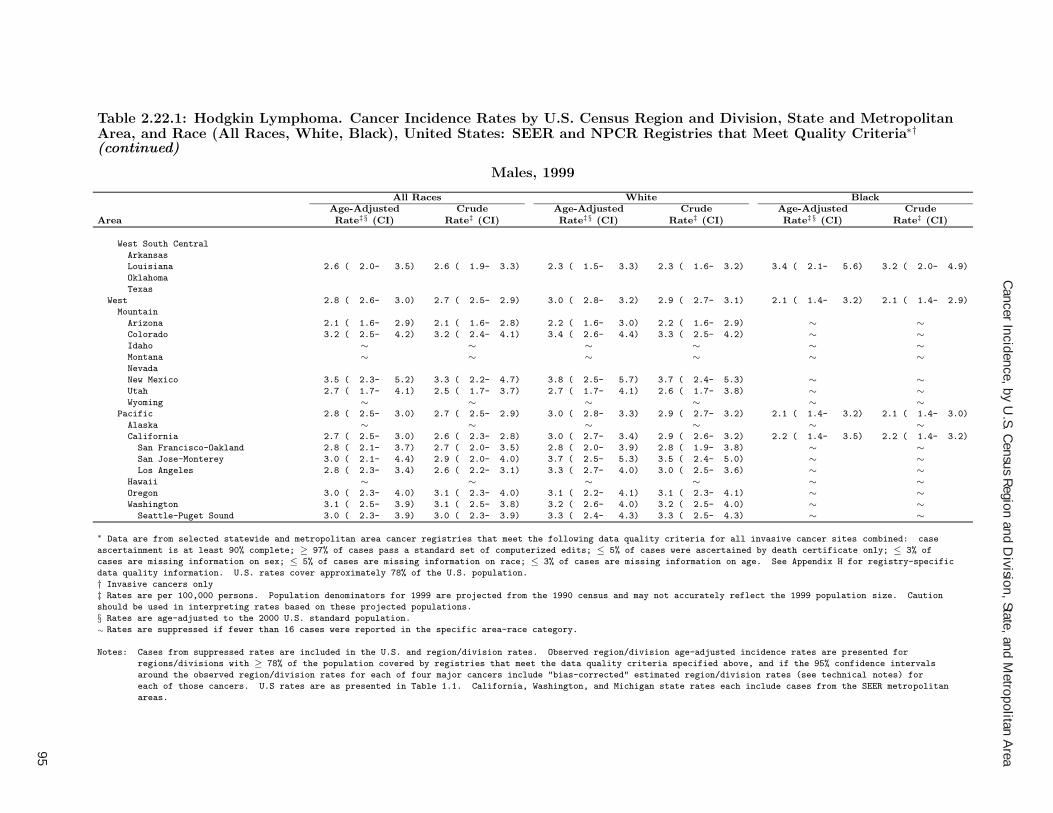
Cancer Incidence, by U
.S. Census R
egion and Division, State, and M
etropolitan Area
95
Table 2.22.1: Hodgkin Lymphoma. Cancer Incidence Rates by U.S. Census Region and Division, State and MetropolitanArea, and Race (All Races, White, Black), United States: SEER and NPCR Registries that Meet Quality Criteria∗†(continued)
Males, 1999
All Races White BlackAge-Adjusted Crude Age-Adjusted Crude Age-Adjusted Crude
Area Rate‡§ (CI) Rate‡ (CI) Rate‡§ (CI) Rate‡ (CI) Rate‡§ (CI) Rate‡ (CI)
West South Central
Arkansas
Louisiana 2.6 ( 2.0- 3.5) 2.6 ( 1.9- 3.3) 2.3 ( 1.5- 3.3) 2.3 ( 1.6- 3.2) 3.4 ( 2.1- 5.6) 3.2 ( 2.0- 4.9)
Oklahoma
Texas
West 2.8 ( 2.6- 3.0) 2.7 ( 2.5- 2.9) 3.0 ( 2.8- 3.2) 2.9 ( 2.7- 3.1) 2.1 ( 1.4- 3.2) 2.1 ( 1.4- 2.9)
Mountain
Arizona 2.1 ( 1.6- 2.9) 2.1 ( 1.6- 2.8) 2.2 ( 1.6- 3.0) 2.2 ( 1.6- 2.9) ∼ ∼Colorado 3.2 ( 2.5- 4.2) 3.2 ( 2.4- 4.1) 3.4 ( 2.6- 4.4) 3.3 ( 2.5- 4.2) ∼ ∼Idaho ∼ ∼ ∼ ∼ ∼ ∼Montana ∼ ∼ ∼ ∼ ∼ ∼Nevada
New Mexico 3.5 ( 2.3- 5.2) 3.3 ( 2.2- 4.7) 3.8 ( 2.5- 5.7) 3.7 ( 2.4- 5.3) ∼ ∼Utah 2.7 ( 1.7- 4.1) 2.5 ( 1.7- 3.7) 2.7 ( 1.7- 4.1) 2.6 ( 1.7- 3.8) ∼ ∼Wyoming ∼ ∼ ∼ ∼ ∼ ∼
Pacific 2.8 ( 2.5- 3.0) 2.7 ( 2.5- 2.9) 3.0 ( 2.8- 3.3) 2.9 ( 2.7- 3.2) 2.1 ( 1.4- 3.2) 2.1 ( 1.4- 3.0)
Alaska ∼ ∼ ∼ ∼ ∼ ∼California 2.7 ( 2.5- 3.0) 2.6 ( 2.3- 2.8) 3.0 ( 2.7- 3.4) 2.9 ( 2.6- 3.2) 2.2 ( 1.4- 3.5) 2.2 ( 1.4- 3.2)
San Francisco-Oakland 2.8 ( 2.1- 3.7) 2.7 ( 2.0- 3.5) 2.8 ( 2.0- 3.9) 2.8 ( 1.9- 3.8) ∼ ∼San Jose-Monterey 3.0 ( 2.1- 4.4) 2.9 ( 2.0- 4.0) 3.7 ( 2.5- 5.3) 3.5 ( 2.4- 5.0) ∼ ∼Los Angeles 2.8 ( 2.3- 3.4) 2.6 ( 2.2- 3.1) 3.3 ( 2.7- 4.0) 3.0 ( 2.5- 3.6) ∼ ∼
Hawaii ∼ ∼ ∼ ∼ ∼ ∼Oregon 3.0 ( 2.3- 4.0) 3.1 ( 2.3- 4.0) 3.1 ( 2.2- 4.1) 3.1 ( 2.3- 4.1) ∼ ∼Washington 3.1 ( 2.5- 3.9) 3.1 ( 2.5- 3.8) 3.2 ( 2.6- 4.0) 3.2 ( 2.5- 4.0) ∼ ∼
Seattle-Puget Sound 3.0 ( 2.3- 3.9) 3.0 ( 2.3- 3.9) 3.3 ( 2.4- 4.3) 3.3 ( 2.5- 4.3) ∼ ∼∗ Data are from selected statewide and metropolitan area cancer registries that meet the following data quality criteria for all invasive cancer sites combined: case
ascertainment is at least 90% complete; ≥ 97% of cases pass a standard set of computerized edits; ≤ 5% of cases were ascertained by death certificate only; ≤ 3% of
cases are missing information on sex; ≤ 5% of cases are missing information on race; ≤ 3% of cases are missing information on age. See Appendix H for registry-specific
data quality information. U.S. rates cover approximately 78% of the U.S. population.
† Invasive cancers only
‡ Rates are per 100,000 persons. Population denominators for 1999 are projected from the 1990 census and may not accurately reflect the 1999 population size. Caution
should be used in interpreting rates based on these projected populations.
§ Rates are age-adjusted to the 2000 U.S. standard population.
∼ Rates are suppressed if fewer than 16 cases were reported in the specific area-race category.
Notes: Cases from suppressed rates are included in the U.S. and region/division rates. Observed region/division age-adjusted incidence rates are presented for
regions/divisions with ≥ 78% of the population covered by registries that meet the data quality criteria specified above, and if the 95% confidence intervals
around the observed region/division rates for each of four major cancers include "bias-corrected" estimated region/division rates (see technical notes) for
each of those cancers. U.S rates are as presented in Table 1.1. California, Washington, and Michigan state rates each include cases from the SEER metropolitan
areas.

United States C
ancer Statistics: 1999 Incidence
96
Table 2.22.2: Hodgkin Lymphoma. Cancer Incidence Rates by U.S. Census Region and Division, State and MetropolitanArea, and Race (All Races, White, Black), United States: SEER and NPCR Registries that Meet Quality Criteria∗†
Females, 1999
All Races White BlackAge-Adjusted Crude Age-Adjusted Crude Age-Adjusted Crude
Area Rate‡§ (CI) Rate‡ (CI) Rate‡§ (CI) Rate‡ (CI) Rate‡§ (CI) Rate‡ (CI)
United States 2.5 ( 2.4- 2.6) 2.6 ( 2.5- 2.7) 2.7 ( 2.6- 2.8) 2.7 ( 2.6- 2.8) 1.9 ( 1.7- 2.2) 1.9 ( 1.7- 2.2)
Northeast 2.8 ( 2.6- 3.1) 2.9 ( 2.7- 3.1) 3.0 ( 2.8- 3.3) 3.1 ( 2.9- 3.4) 1.8 ( 1.4- 2.4) 1.9 ( 1.5- 2.4)
New England 3.1 ( 2.7- 3.6) 3.2 ( 2.8- 3.7) 3.2 ( 2.8- 3.8) 3.3 ( 2.9- 3.9) ∼ ∼Connecticut 3.1 ( 2.3- 4.1) 3.1 ( 2.4- 4.1) 3.2 ( 2.3- 4.3) 3.2 ( 2.3- 4.2) ∼ ∼Maine
Massachusetts 3.2 ( 2.6- 3.8) 3.3 ( 2.7- 3.9) 3.3 ( 2.7- 4.1) 3.5 ( 2.8- 4.2) ∼ ∼New Hampshire 2.9 ( 1.7- 4.6) 3.1 ( 1.9- 4.9) 2.9 ( 1.8- 4.7) 3.2 ( 1.9- 5.0) ∼ ∼Rhode Island 3.0 ( 1.7- 5.0) 3.1 ( 1.8- 5.1) 3.3 ( 1.9- 5.6) 3.4 ( 1.9- 5.5) ∼ ∼Vermont
Middle Atlantic 2.8 ( 2.5- 3.0) 2.8 ( 2.6- 3.1) 3.0 ( 2.7- 3.2) 3.0 ( 2.8- 3.3) 1.9 ( 1.4- 2.4) 1.9 ( 1.5- 2.5)
New Jersey 3.0 ( 2.5- 3.6) 3.0 ( 2.5- 3.6) 3.2 ( 2.6- 3.9) 3.3 ( 2.7- 3.9) 2.6 ( 1.5- 4.3) 2.7 ( 1.6- 4.3)
New York 2.7 ( 2.4- 3.1) 2.8 ( 2.5- 3.1) 3.0 ( 2.6- 3.5) 3.1 ( 2.7- 3.5) 1.6 ( 1.1- 2.4) 1.7 ( 1.1- 2.4)
Pennsylvania 2.6 ( 2.3- 3.1) 2.8 ( 2.4- 3.2) 2.7 ( 2.3- 3.2) 2.9 ( 2.5- 3.4) ∼ ∼Midwest
East North Central
Illinois 2.4 ( 2.0- 2.8) 2.4 ( 2.0- 2.8) 2.6 ( 2.2- 3.1) 2.6 ( 2.2- 3.1) ∼ ∼Indiana
Michigan 2.7 ( 2.3- 3.2) 2.7 ( 2.3- 3.2) 2.8 ( 2.3- 3.4) 2.9 ( 2.4- 3.4) 2.4 ( 1.4- 3.8) 2.4 ( 1.4- 3.8)
Detroit 3.0 ( 2.3- 3.9) 3.1 ( 2.4- 4.0) 3.4 ( 2.5- 4.4) 3.5 ( 2.6- 4.6) ∼ ∼Ohio 2.2 ( 1.8- 2.6) 2.3 ( 1.9- 2.7) 2.2 ( 1.8- 2.7) 2.3 ( 1.9- 2.8) ∼ ∼Wisconsin 2.7 ( 2.1- 3.4) 2.7 ( 2.1- 3.4) 2.9 ( 2.2- 3.6) 2.9 ( 2.3- 3.7) ∼ ∼
West North Central 2.8 ( 2.5- 3.2) 2.8 ( 2.5- 3.2) 2.8 ( 2.4- 3.1) 2.8 ( 2.4- 3.2) ∼ ∼Iowa 2.9 ( 2.1- 3.9) 2.9 ( 2.1- 3.9) 2.9 ( 2.1- 4.0) 2.9 ( 2.1- 3.9) ∼ ∼Kansas 2.3 ( 1.5- 3.3) 2.3 ( 1.6- 3.3) 2.4 ( 1.6- 3.5) 2.4 ( 1.6- 3.5) ∼ ∼Minnesota 3.1 ( 2.4- 3.9) 3.2 ( 2.5- 4.0) 2.9 ( 2.3- 3.7) 3.1 ( 2.4- 3.9) ∼ ∼Missouri 2.9 ( 2.3- 3.6) 2.9 ( 2.3- 3.6) 2.9 ( 2.3- 3.7) 2.9 ( 2.3- 3.7) ∼ ∼Nebraska 2.7 ( 1.7- 4.1) 2.7 ( 1.7- 4.1) 2.3 ( 1.4- 3.7) 2.4 ( 1.4- 3.7) ∼ ∼North Dakota ∼ ∼ ∼ ∼ ∼ ∼South Dakota
South
South Atlantic
Delaware ∼ ∼ ∼ ∼ ∼ ∼District of Columbia ∼ ∼ ∼ ∼ ∼ ∼Florida 2.6 ( 2.2- 3.0) 2.6 ( 2.3- 3.0) 2.7 ( 2.3- 3.2) 2.8 ( 2.4- 3.2) 1.9 ( 1.1- 3.0) 1.7 ( 1.1- 2.6)
Georgia
Atlanta 2.5 ( 1.7- 3.6) 2.4 ( 1.6- 3.4) 2.9 ( 1.8- 4.3) 2.7 ( 1.8- 4.1) ∼ ∼Maryland 2.4 ( 1.8- 3.0) 2.4 ( 1.9- 3.1) 2.6 ( 1.9- 3.4) 2.7 ( 1.9- 3.5) ∼ ∼North Carolina 2.4 ( 1.9- 2.9) 2.4 ( 2.0- 2.9) 2.4 ( 1.9- 3.1) 2.4 ( 1.9- 3.1) 2.4 ( 1.5- 3.7) 2.5 ( 1.5- 3.7)
South Carolina 2.0 ( 1.4- 2.7) 2.0 ( 1.5- 2.8) 2.1 ( 1.4- 3.1) 2.1 ( 1.4- 3.0) ∼ ∼Virginia
West Virginia 3.0 ( 2.0- 4.4) 3.2 ( 2.2- 4.6) 3.1 ( 2.0- 4.5) 3.2 ( 2.2- 4.6) ∼ ∼East South Central
Alabama
Kentucky 2.1 ( 1.5- 2.8) 2.1 ( 1.5- 2.8) 2.1 ( 1.5- 2.8) 2.1 ( 1.5- 2.9) ∼ ∼Mississippi
Tennessee
continued

Cancer Incidence, by U
.S. Census R
egion and Division, State, and M
etropolitan Area
97
Table 2.22.2: Hodgkin Lymphoma. Cancer Incidence Rates by U.S. Census Region and Division, State and MetropolitanArea, and Race (All Races, White, Black), United States: SEER and NPCR Registries that Meet Quality Criteria∗†(continued)
Females, 1999
All Races White BlackAge-Adjusted Crude Age-Adjusted Crude Age-Adjusted Crude
Area Rate‡§ (CI) Rate‡ (CI) Rate‡§ (CI) Rate‡ (CI) Rate‡§ (CI) Rate‡ (CI)
West South Central
Arkansas
Louisiana 2.7 ( 2.1- 3.5) 2.8 ( 2.1- 3.6) 3.0 ( 2.2- 4.0) 3.0 ( 2.2- 4.1) 2.3 ( 1.4- 3.8) 2.4 ( 1.4- 3.8)
Oklahoma
Texas
West 2.3 ( 2.1- 2.5) 2.3 ( 2.1- 2.5) 2.4 ( 2.2- 2.6) 2.4 ( 2.2- 2.6) 1.7 ( 1.1- 2.5) 1.7 ( 1.1- 2.4)
Mountain
Arizona 2.1 ( 1.6- 2.8) 2.1 ( 1.5- 2.7) 2.1 ( 1.5- 2.8) 2.1 ( 1.5- 2.8) ∼ ∼Colorado 2.2 ( 1.6- 3.0) 2.2 ( 1.6- 2.9) 2.2 ( 1.6- 3.0) 2.1 ( 1.5- 2.9) ∼ ∼Idaho 2.8 ( 1.7- 4.5) 2.9 ( 1.7- 4.5) 2.9 ( 1.7- 4.7) 3.0 ( 1.8- 4.7) ∼ ∼Montana ∼ ∼ ∼ ∼ ∼ ∼Nevada
New Mexico ∼ ∼ ∼ ∼ ∼ ∼Utah 2.3 ( 1.5- 3.5) 2.4 ( 1.6- 3.6) 2.5 ( 1.6- 3.7) 2.6 ( 1.7- 3.7) ∼ ∼Wyoming ∼ ∼ ∼ ∼ ∼ ∼
Pacific 2.3 ( 2.1- 2.5) 2.3 ( 2.1- 2.5) 2.5 ( 2.3- 2.8) 2.5 ( 2.3- 2.8) 1.6 ( 1.0- 2.5) 1.6 ( 1.0- 2.5)
Alaska ∼ ∼ ∼ ∼ ∼ ∼California 2.3 ( 2.1- 2.5) 2.3 ( 2.1- 2.5) 2.5 ( 2.2- 2.8) 2.5 ( 2.2- 2.8) 1.5 ( 0.9- 2.4) 1.5 ( 0.9- 2.4)
San Francisco-Oakland 2.2 ( 1.6- 3.0) 2.3 ( 1.7- 3.1) 2.4 ( 1.7- 3.5) 2.5 ( 1.7- 3.5) ∼ ∼San Jose-Monterey 2.0 ( 1.3- 3.0) 2.0 ( 1.3- 3.0) 2.4 ( 1.5- 3.6) 2.4 ( 1.5- 3.6) ∼ ∼Los Angeles 2.7 ( 2.2- 3.2) 2.7 ( 2.2- 3.2) 3.0 ( 2.5- 3.7) 3.0 ( 2.5- 3.6) ∼ ∼
Hawaii ∼ ∼ ∼ ∼ ∼ ∼Oregon 2.7 ( 1.9- 3.6) 2.6 ( 1.9- 3.5) 2.7 ( 1.9- 3.7) 2.6 ( 1.9- 3.6) ∼ ∼Washington 2.6 ( 2.1- 3.3) 2.6 ( 2.1- 3.3) 2.6 ( 2.0- 3.3) 2.6 ( 2.0- 3.3) ∼ ∼
Seattle-Puget Sound 2.9 ( 2.2- 3.7) 2.9 ( 2.2- 3.8) 3.2 ( 2.4- 4.2) 3.2 ( 2.4- 4.2) ∼ ∼∗ Data are from selected statewide and metropolitan area cancer registries that meet the following data quality criteria for all invasive cancer sites combined: case
ascertainment is at least 90% complete; ≥ 97% of cases pass a standard set of computerized edits; ≤ 5% of cases were ascertained by death certificate only; ≤ 3% of
cases are missing information on sex; ≤ 5% of cases are missing information on race; ≤ 3% of cases are missing information on age. See Appendix H for registry-specific
data quality information. U.S. rates cover approximately 78% of the U.S. population.
† Invasive cancers only
‡ Rates are per 100,000 persons. Population denominators for 1999 are projected from the 1990 census and may not accurately reflect the 1999 population size. Caution
should be used in interpreting rates based on these projected populations.
§ Rates are age-adjusted to the 2000 U.S. standard population.
∼ Rates are suppressed if fewer than 16 cases were reported in the specific area-race category.
Notes: Cases from suppressed rates are included in the U.S. and region/division rates. Observed region/division age-adjusted incidence rates are presented for
regions/divisions with ≥ 78% of the population covered by registries that meet the data quality criteria specified above, and if the 95% confidence intervals
around the observed region/division rates for each of four major cancers include "bias-corrected" estimated region/division rates (see technical notes) for
each of those cancers. U.S rates are as presented in Table 1.2. California, Washington, and Michigan state rates each include cases from the SEER metropolitan
areas.

United States C
ancer Statistics: 1999 Incidence
98
Table 2.23.1: Non-Hodgkin Lymphoma. Cancer Incidence Rates by U.S. Census Region and Division, State andMetropolitan Area, and Race (All Races, White, Black), United States: SEER and NPCR Registries that Meet QualityCriteria∗†
Males, 1999
All Races White BlackAge-Adjusted Crude Age-Adjusted Crude Age-Adjusted Crude
Area Rate‡§ (CI) Rate‡ (CI) Rate‡§ (CI) Rate‡ (CI) Rate‡§ (CI) Rate‡ (CI)
United States 22.0 ( 21.7- 22.3) 20.0 ( 19.7- 20.3) 22.1 ( 21.8- 22.5) 21.3 ( 21.0- 21.6) 16.7 ( 15.8- 17.6) 12.4 ( 11.7- 13.0)
Northeast 23.2 ( 22.5- 23.8) 22.2 ( 21.6- 22.8) 23.0 ( 22.3- 23.6) 23.3 ( 22.6- 24.0) 19.0 ( 17.2- 21.0) 14.7 ( 13.4- 16.2)
New England 23.3 ( 22.0- 24.6) 22.1 ( 20.9- 23.4) 23.1 ( 21.8- 24.5) 22.9 ( 21.6- 24.3) 18.2 ( 12.7- 26.1) 12.1 ( 8.8- 16.1)
Connecticut 26.2 ( 23.7- 28.9) 25.5 ( 23.1- 28.1) 26.4 ( 23.8- 29.2) 27.0 ( 24.3- 29.8) 23.8 ( 14.2- 39.1) 15.7 ( 10.0- 23.6)
Maine
Massachusetts 22.4 ( 20.6- 24.2) 21.1 ( 19.5- 22.9) 21.9 ( 20.2- 23.8) 21.8 ( 20.1- 23.6) 13.0 ( 7.6- 24.2) 9.7 ( 5.8- 15.1)
New Hampshire 19.3 ( 15.6- 23.6) 16.9 ( 13.8- 20.6) 19.4 ( 15.7- 23.8) 17.2 ( 13.9- 20.9) ∼ ∼Rhode Island 23.8 ( 19.6- 28.8) 23.1 ( 19.0- 27.8) 24.1 ( 19.7- 29.3) 24.3 ( 19.9- 29.3) ∼ ∼Vermont
Middle Atlantic 23.1 ( 22.4- 23.9) 22.2 ( 21.6- 22.9) 22.9 ( 22.2- 23.7) 23.4 ( 22.6- 24.2) 19.1 ( 17.2- 21.2) 15.1 ( 13.7- 16.7)
New Jersey 25.1 ( 23.5- 26.8) 23.7 ( 22.2- 25.2) 25.4 ( 23.7- 27.2) 25.6 ( 23.9- 27.5) 19.3 ( 15.3- 24.5) 15.5 ( 12.4- 19.1)
New York 21.8 ( 20.8- 22.9) 20.4 ( 19.4- 21.3) 21.6 ( 20.5- 22.8) 21.5 ( 20.4- 22.6) 18.6 ( 16.1- 21.4) 15.1 ( 13.2- 17.2)
Pennsylvania 23.6 ( 22.4- 24.9) 24.1 ( 22.9- 25.4) 23.1 ( 21.8- 24.4) 24.5 ( 23.2- 25.9) 19.5 ( 15.4- 24.6) 14.8 ( 11.7- 18.4)
Midwest
East North Central
Illinois 23.3 ( 22.0- 24.7) 20.3 ( 19.2- 21.5) 23.9 ( 22.5- 25.4) 22.0 ( 20.7- 23.3) 14.9 ( 11.8- 18.6) 10.8 ( 8.7- 13.2)
Indiana
Michigan 22.4 ( 21.0- 23.9) 20.1 ( 18.8- 21.4) 23.1 ( 21.6- 24.7) 21.6 ( 20.2- 23.1) 15.3 ( 12.0- 19.3) 11.9 ( 9.5- 14.9)
Detroit 22.3 ( 20.1- 24.6) 20.0 ( 18.1- 22.1) 23.8 ( 21.3- 26.7) 22.6 ( 20.2- 25.2) 15.4 ( 11.6- 20.2) 12.2 ( 9.2- 15.9)
Ohio 21.9 ( 20.6- 23.2) 20.3 ( 19.2- 21.6) 21.9 ( 20.6- 23.4) 21.1 ( 19.8- 22.4) 16.8 ( 13.1- 21.4) 12.6 ( 9.9- 15.7)
Wisconsin 23.0 ( 21.1- 25.0) 21.0 ( 19.3- 22.9) 22.6 ( 20.7- 24.7) 21.6 ( 19.8- 23.5) 22.9 ( 12.9- 43.9) 12.6 ( 7.5- 19.9)
West North Central 22.2 ( 21.2- 23.3) 20.6 ( 19.6- 21.5) 22.2 ( 21.2- 23.3) 21.3 ( 20.3- 22.3) 15.4 ( 11.4- 20.8) 10.6 ( 8.0- 13.9)
Iowa 21.8 ( 19.4- 24.5) 21.6 ( 19.2- 24.2) 21.7 ( 19.3- 24.4) 21.9 ( 19.5- 24.6) ∼ ∼Kansas 21.2 ( 18.6- 24.0) 19.4 ( 17.1- 22.0) 20.8 ( 18.2- 23.7) 19.7 ( 17.3- 22.4) ∼ ∼Minnesota 25.6 ( 23.4- 27.9) 22.5 ( 20.6- 24.5) 25.1 ( 22.9- 27.4) 23.0 ( 21.0- 25.1) ∼ ∼Missouri 20.9 ( 19.1- 22.9) 19.3 ( 17.7- 21.1) 21.3 ( 19.4- 23.3) 20.5 ( 18.7- 22.4) 14.1 ( 9.3- 21.1) 10.1 ( 6.7- 14.4)
Nebraska 19.2 ( 16.2- 22.6) 18.0 ( 15.2- 21.2) 19.2 ( 16.2- 22.7) 18.6 ( 15.7- 21.9) ∼ ∼North Dakota 24.0 ( 18.9- 30.2) 23.5 ( 18.4- 29.5) 24.4 ( 19.1- 30.8) 24.8 ( 19.4- 31.1) ∼ ∼South Dakota
South
South Atlantic
Delaware 16.5 ( 12.6- 21.7) 16.1 ( 12.3- 20.8) 18.3 ( 13.8- 24.3) 19.2 ( 14.4- 25.0) ∼ ∼District of Columbia 19.9 ( 14.6- 26.6) 19.7 ( 14.5- 26.1) 21.1 ( 12.1- 36.9) 19.0 ( 11.1- 30.5) 18.9 ( 12.6- 27.8) 19.1 ( 12.7- 27.7)
Florida 22.6 ( 21.5- 23.6) 25.3 ( 24.2- 26.5) 22.7 ( 21.6- 23.9) 27.9 ( 26.6- 29.3) 16.2 ( 13.4- 19.8) 12.2 ( 10.2- 14.4)
Georgia
Atlanta 21.7 ( 18.4- 25.6) 14.8 ( 12.8- 17.0) 21.7 ( 18.0- 26.1) 16.5 ( 13.9- 19.5) 20.2 ( 13.4- 30.4) 11.3 ( 8.3- 15.2)
Maryland 20.1 ( 18.2- 22.1) 17.7 ( 16.1- 19.4) 20.2 ( 18.1- 22.6) 19.4 ( 17.3- 21.5) 14.8 ( 11.6- 19.1) 11.8 ( 9.4- 14.7)
North Carolina 18.0 ( 16.5- 19.5) 16.1 ( 14.8- 17.4) 19.1 ( 17.5- 20.9) 18.3 ( 16.8- 20.0) 11.4 ( 8.8- 14.8) 8.7 ( 6.8- 11.1)
South Carolina 18.9 ( 16.8- 21.3) 16.5 ( 14.7- 18.4) 19.3 ( 16.9- 22.1) 18.3 ( 16.1- 20.8) 16.5 ( 12.5- 21.6) 11.9 ( 9.1- 15.2)
Virginia
West Virginia 22.2 ( 19.2- 25.6) 22.7 ( 19.7- 26.1) 22.4 ( 19.3- 25.9) 23.0 ( 19.9- 26.5) ∼ ∼East South Central
Alabama
Kentucky 21.0 ( 18.9- 23.4) 19.0 ( 17.1- 21.0) 20.5 ( 18.3- 22.9) 18.9 ( 17.0- 21.1) 20.3 ( 12.1- 32.9) 14.6 ( 8.9- 22.5)
Mississippi
Tennessee
continued

Cancer Incidence, by U
.S. Census R
egion and Division, State, and M
etropolitan Area
99
Table 2.23.1: Non-Hodgkin Lymphoma. Cancer Incidence Rates by U.S. Census Region and Division, State andMetropolitan Area, and Race (All Races, White, Black), United States: SEER and NPCR Registries that Meet QualityCriteria∗† (continued)
Males, 1999
All Races White BlackAge-Adjusted Crude Age-Adjusted Crude Age-Adjusted Crude
Area Rate‡§ (CI) Rate‡ (CI) Rate‡§ (CI) Rate‡ (CI) Rate‡§ (CI) Rate‡ (CI)
West South Central
Arkansas
Louisiana 20.8 ( 18.6- 23.1) 17.4 ( 15.7- 19.3) 21.5 ( 19.0- 24.3) 20.0 ( 17.7- 22.4) 18.6 ( 14.7- 23.4) 12.7 ( 10.2- 15.8)
Oklahoma
Texas
West 21.3 ( 20.8- 21.9) 17.9 ( 17.4- 18.4) 21.6 ( 21.0- 22.3) 18.8 ( 18.3- 19.4) 16.7 ( 14.2- 19.6) 11.5 ( 9.9- 13.3)
Mountain
Arizona 19.2 ( 17.4- 21.2) 17.7 ( 16.0- 19.5) 19.9 ( 18.0- 21.9) 19.3 ( 17.4- 21.2) ∼ ∼Colorado 20.6 ( 18.4- 23.1) 17.0 ( 15.3- 18.9) 20.9 ( 18.6- 23.4) 17.6 ( 15.8- 19.6) ∼ ∼Idaho 18.8 ( 15.2- 22.9) 16.2 ( 13.2- 19.6) 18.7 ( 15.2- 22.9) 16.3 ( 13.3- 19.9) ∼ ∼Montana 20.5 ( 16.4- 25.4) 20.3 ( 16.3- 24.9) 20.6 ( 16.4- 25.6) 21.1 ( 16.9- 26.1) ∼ ∼Nevada
New Mexico 15.9 ( 13.1- 19.2) 13.8 ( 11.4- 16.5) 16.5 ( 13.5- 20.0) 15.1 ( 12.5- 18.2) ∼ ∼Utah 23.5 ( 20.0- 27.4) 16.2 ( 13.9- 18.8) 23.8 ( 20.3- 27.9) 16.7 ( 14.3- 19.5) ∼ ∼Wyoming 15.0 ( 10.2- 21.8) 13.3 ( 9.1- 18.7) 14.5 ( 9.7- 21.2) 12.9 ( 8.7- 18.5) ∼ ∼
Pacific 22.0 ( 21.3- 22.7) 18.3 ( 17.7- 18.9) 22.3 ( 21.6- 23.1) 19.3 ( 18.6- 19.9) 16.8 ( 14.2- 19.9) 12.0 ( 10.2- 13.9)
Alaska 19.8 ( 13.4- 30.0) 13.8 ( 10.1- 18.5) 21.8 ( 14.2- 34.5) 15.3 ( 10.8- 21.0) ∼ ∼California 21.6 ( 20.8- 22.4) 17.6 ( 17.0- 18.3) 22.2 ( 21.3- 23.1) 18.7 ( 18.0- 19.5) 16.3 ( 13.6- 19.5) 11.9 ( 10.0- 14.0)
San Francisco-Oakland 25.8 ( 23.5- 28.3) 23.6 ( 21.5- 25.8) 27.4 ( 24.6- 30.5) 26.6 ( 23.9- 29.5) 19.4 ( 13.6- 27.7) 16.1 ( 11.4- 22.1)
San Jose-Monterey 20.2 ( 17.3- 23.5) 15.8 ( 13.6- 18.2) 19.8 ( 16.6- 23.4) 16.2 ( 13.7- 19.0) ∼ ∼Los Angeles 22.4 ( 20.8- 24.1) 17.3 ( 16.1- 18.6) 23.8 ( 22.0- 25.8) 18.7 ( 17.3- 20.2) 16.3 ( 12.4- 21.4) 12.8 ( 9.8- 16.3)
Hawaii 20.2 ( 16.7- 24.4) 19.3 ( 15.9- 23.2) 21.9 ( 14.7- 31.8) 17.7 ( 12.0- 25.3) ∼ ∼Oregon 22.6 ( 20.3- 25.2) 21.5 ( 19.3- 23.9) 22.1 ( 19.8- 24.7) 21.6 ( 19.3- 24.0) ∼ ∼Washington 23.7 ( 21.8- 25.7) 20.8 ( 19.1- 22.5) 23.2 ( 21.3- 25.3) 21.2 ( 19.4- 23.0) ∼ ∼
Seattle-Puget Sound 25.3 ( 23.0- 27.9) 22.0 ( 20.0- 24.2) 25.0 ( 22.6- 27.7) 22.8 ( 20.5- 25.1) ∼ ∼∗ Data are from selected statewide and metropolitan area cancer registries that meet the following data quality criteria for all invasive cancer sites combined: case
ascertainment is at least 90% complete; ≥ 97% of cases pass a standard set of computerized edits; ≤ 5% of cases were ascertained by death certificate only; ≤ 3% of
cases are missing information on sex; ≤ 5% of cases are missing information on race; ≤ 3% of cases are missing information on age. See Appendix H for registry-specific
data quality information. U.S. rates cover approximately 78% of the U.S. population.
† Invasive cancers only
‡ Rates are per 100,000 persons. Population denominators for 1999 are projected from the 1990 census and may not accurately reflect the 1999 population size. Caution
should be used in interpreting rates based on these projected populations.
§ Rates are age-adjusted to the 2000 U.S. standard population.
∼ Rates are suppressed if fewer than 16 cases were reported in the specific area-race category.
Notes: Cases from suppressed rates are included in the U.S. and region/division rates. Observed region/division age-adjusted incidence rates are presented for
regions/divisions with ≥ 78% of the population covered by registries that meet the data quality criteria specified above, and if the 95% confidence intervals
around the observed region/division rates for each of four major cancers include "bias-corrected" estimated region/division rates (see technical notes) for
each of those cancers. U.S rates are as presented in Table 1.1. California, Washington, and Michigan state rates each include cases from the SEER metropolitan
areas.
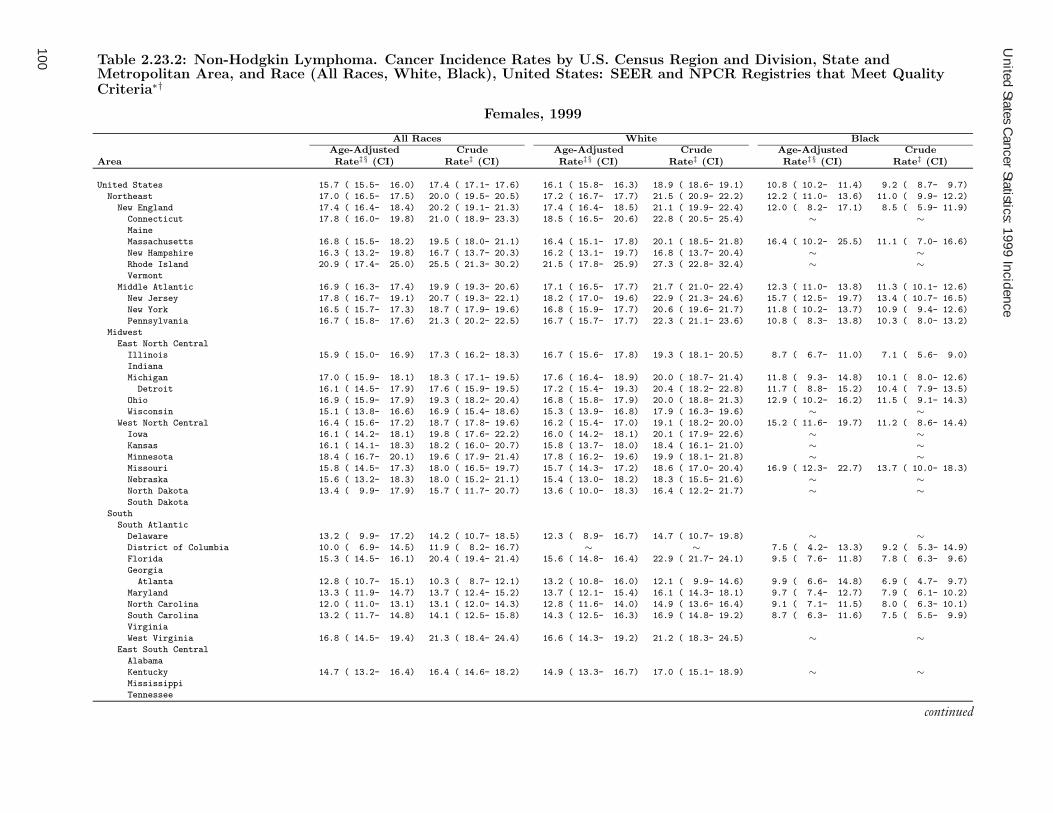
United States C
ancer Statistics: 1999 Incidence
100 Table 2.23.2: Non-Hodgkin Lymphoma. Cancer Incidence Rates by U.S. Census Region and Division, State andMetropolitan Area, and Race (All Races, White, Black), United States: SEER and NPCR Registries that Meet QualityCriteria∗†
Females, 1999
All Races White BlackAge-Adjusted Crude Age-Adjusted Crude Age-Adjusted Crude
Area Rate‡§ (CI) Rate‡ (CI) Rate‡§ (CI) Rate‡ (CI) Rate‡§ (CI) Rate‡ (CI)
United States 15.7 ( 15.5- 16.0) 17.4 ( 17.1- 17.6) 16.1 ( 15.8- 16.3) 18.9 ( 18.6- 19.1) 10.8 ( 10.2- 11.4) 9.2 ( 8.7- 9.7)
Northeast 17.0 ( 16.5- 17.5) 20.0 ( 19.5- 20.5) 17.2 ( 16.7- 17.7) 21.5 ( 20.9- 22.2) 12.2 ( 11.0- 13.6) 11.0 ( 9.9- 12.2)
New England 17.4 ( 16.4- 18.4) 20.2 ( 19.1- 21.3) 17.4 ( 16.4- 18.5) 21.1 ( 19.9- 22.4) 12.0 ( 8.2- 17.1) 8.5 ( 5.9- 11.9)
Connecticut 17.8 ( 16.0- 19.8) 21.0 ( 18.9- 23.3) 18.5 ( 16.5- 20.6) 22.8 ( 20.5- 25.4) ∼ ∼Maine
Massachusetts 16.8 ( 15.5- 18.2) 19.5 ( 18.0- 21.1) 16.4 ( 15.1- 17.8) 20.1 ( 18.5- 21.8) 16.4 ( 10.2- 25.5) 11.1 ( 7.0- 16.6)
New Hampshire 16.3 ( 13.2- 19.8) 16.7 ( 13.7- 20.3) 16.2 ( 13.1- 19.7) 16.8 ( 13.7- 20.4) ∼ ∼Rhode Island 20.9 ( 17.4- 25.0) 25.5 ( 21.3- 30.2) 21.5 ( 17.8- 25.9) 27.3 ( 22.8- 32.4) ∼ ∼Vermont
Middle Atlantic 16.9 ( 16.3- 17.4) 19.9 ( 19.3- 20.6) 17.1 ( 16.5- 17.7) 21.7 ( 21.0- 22.4) 12.3 ( 11.0- 13.8) 11.3 ( 10.1- 12.6)
New Jersey 17.8 ( 16.7- 19.1) 20.7 ( 19.3- 22.1) 18.2 ( 17.0- 19.6) 22.9 ( 21.3- 24.6) 15.7 ( 12.5- 19.7) 13.4 ( 10.7- 16.5)
New York 16.5 ( 15.7- 17.3) 18.7 ( 17.9- 19.6) 16.8 ( 15.9- 17.7) 20.6 ( 19.6- 21.7) 11.8 ( 10.2- 13.7) 10.9 ( 9.4- 12.6)
Pennsylvania 16.7 ( 15.8- 17.6) 21.3 ( 20.2- 22.5) 16.7 ( 15.7- 17.7) 22.3 ( 21.1- 23.6) 10.8 ( 8.3- 13.8) 10.3 ( 8.0- 13.2)
Midwest
East North Central
Illinois 15.9 ( 15.0- 16.9) 17.3 ( 16.2- 18.3) 16.7 ( 15.6- 17.8) 19.3 ( 18.1- 20.5) 8.7 ( 6.7- 11.0) 7.1 ( 5.6- 9.0)
Indiana
Michigan 17.0 ( 15.9- 18.1) 18.3 ( 17.1- 19.5) 17.6 ( 16.4- 18.9) 20.0 ( 18.7- 21.4) 11.8 ( 9.3- 14.8) 10.1 ( 8.0- 12.6)
Detroit 16.1 ( 14.5- 17.9) 17.6 ( 15.9- 19.5) 17.2 ( 15.4- 19.3) 20.4 ( 18.2- 22.8) 11.7 ( 8.8- 15.2) 10.4 ( 7.9- 13.5)
Ohio 16.9 ( 15.9- 17.9) 19.3 ( 18.2- 20.4) 16.8 ( 15.8- 17.9) 20.0 ( 18.8- 21.3) 12.9 ( 10.2- 16.2) 11.5 ( 9.1- 14.3)
Wisconsin 15.1 ( 13.8- 16.6) 16.9 ( 15.4- 18.6) 15.3 ( 13.9- 16.8) 17.9 ( 16.3- 19.6) ∼ ∼West North Central 16.4 ( 15.6- 17.2) 18.7 ( 17.8- 19.6) 16.2 ( 15.4- 17.0) 19.1 ( 18.2- 20.0) 15.2 ( 11.6- 19.7) 11.2 ( 8.6- 14.4)
Iowa 16.1 ( 14.2- 18.1) 19.8 ( 17.6- 22.2) 16.0 ( 14.2- 18.1) 20.1 ( 17.9- 22.6) ∼ ∼Kansas 16.1 ( 14.1- 18.3) 18.2 ( 16.0- 20.7) 15.8 ( 13.7- 18.0) 18.4 ( 16.1- 21.0) ∼ ∼Minnesota 18.4 ( 16.7- 20.1) 19.6 ( 17.9- 21.4) 17.8 ( 16.2- 19.6) 19.9 ( 18.1- 21.8) ∼ ∼Missouri 15.8 ( 14.5- 17.3) 18.0 ( 16.5- 19.7) 15.7 ( 14.3- 17.2) 18.6 ( 17.0- 20.4) 16.9 ( 12.3- 22.7) 13.7 ( 10.0- 18.3)
Nebraska 15.6 ( 13.2- 18.3) 18.0 ( 15.2- 21.1) 15.4 ( 13.0- 18.2) 18.3 ( 15.5- 21.6) ∼ ∼North Dakota 13.4 ( 9.9- 17.9) 15.7 ( 11.7- 20.7) 13.6 ( 10.0- 18.3) 16.4 ( 12.2- 21.7) ∼ ∼South Dakota
South
South Atlantic
Delaware 13.2 ( 9.9- 17.2) 14.2 ( 10.7- 18.5) 12.3 ( 8.9- 16.7) 14.7 ( 10.7- 19.8) ∼ ∼District of Columbia 10.0 ( 6.9- 14.5) 11.9 ( 8.2- 16.7) ∼ ∼ 7.5 ( 4.2- 13.3) 9.2 ( 5.3- 14.9)
Florida 15.3 ( 14.5- 16.1) 20.4 ( 19.4- 21.4) 15.6 ( 14.8- 16.4) 22.9 ( 21.7- 24.1) 9.5 ( 7.6- 11.8) 7.8 ( 6.3- 9.6)
Georgia
Atlanta 12.8 ( 10.7- 15.1) 10.3 ( 8.7- 12.1) 13.2 ( 10.8- 16.0) 12.1 ( 9.9- 14.6) 9.9 ( 6.6- 14.8) 6.9 ( 4.7- 9.7)
Maryland 13.3 ( 11.9- 14.7) 13.7 ( 12.4- 15.2) 13.7 ( 12.1- 15.4) 16.1 ( 14.3- 18.1) 9.7 ( 7.4- 12.7) 7.9 ( 6.1- 10.2)
North Carolina 12.0 ( 11.0- 13.1) 13.1 ( 12.0- 14.3) 12.8 ( 11.6- 14.0) 14.9 ( 13.6- 16.4) 9.1 ( 7.1- 11.5) 8.0 ( 6.3- 10.1)
South Carolina 13.2 ( 11.7- 14.8) 14.1 ( 12.5- 15.8) 14.3 ( 12.5- 16.3) 16.9 ( 14.8- 19.2) 8.7 ( 6.3- 11.6) 7.5 ( 5.5- 9.9)
Virginia
West Virginia 16.8 ( 14.5- 19.4) 21.3 ( 18.4- 24.4) 16.6 ( 14.3- 19.2) 21.2 ( 18.3- 24.5) ∼ ∼East South Central
Alabama
Kentucky 14.7 ( 13.2- 16.4) 16.4 ( 14.6- 18.2) 14.9 ( 13.3- 16.7) 17.0 ( 15.1- 18.9) ∼ ∼Mississippi
Tennessee
continued

Cancer Incidence, by U
.S. Census R
egion and Division, State, and M
etropolitan Area
101
Table 2.23.2: Non-Hodgkin Lymphoma. Cancer Incidence Rates by U.S. Census Region and Division, State andMetropolitan Area, and Race (All Races, White, Black), United States: SEER and NPCR Registries that Meet QualityCriteria∗† (continued)
Females, 1999
All Races White BlackAge-Adjusted Crude Age-Adjusted Crude Age-Adjusted Crude
Area Rate‡§ (CI) Rate‡ (CI) Rate‡§ (CI) Rate‡ (CI) Rate‡§ (CI) Rate‡ (CI)
West South Central
Arkansas
Louisiana 15.6 ( 14.1- 17.3) 16.0 ( 14.4- 17.7) 17.8 ( 15.9- 20.0) 20.5 ( 18.3- 23.0) 9.5 ( 7.2- 12.3) 8.0 ( 6.1- 10.2)
Oklahoma
Texas
West 15.2 ( 14.7- 15.6) 15.1 ( 14.6- 15.5) 15.6 ( 15.1- 16.1) 16.1 ( 15.6- 16.6) 10.5 ( 8.8- 12.5) 8.4 ( 7.1- 10.0)
Mountain
Arizona 13.1 ( 11.7- 14.6) 14.0 ( 12.6- 15.6) 13.6 ( 12.1- 15.1) 15.2 ( 13.6- 17.0) ∼ ∼Colorado 17.6 ( 15.8- 19.5) 17.0 ( 15.2- 18.8) 17.8 ( 15.9- 19.8) 17.6 ( 15.8- 19.6) ∼ ∼Idaho 17.8 ( 14.6- 21.5) 17.4 ( 14.3- 21.0) 17.2 ( 14.1- 21.0) 17.1 ( 14.0- 20.8) ∼ ∼Montana 12.4 ( 9.5- 15.9) 14.4 ( 11.1- 18.4) 12.8 ( 9.9- 16.6) 15.6 ( 12.0- 19.9) ∼ ∼Nevada
New Mexico 13.2 ( 10.9- 15.9) 13.1 ( 10.8- 15.7) 13.5 ( 11.1- 16.3) 14.3 ( 11.8- 17.3) ∼ ∼Utah 14.6 ( 12.1- 17.4) 11.4 ( 9.4- 13.6) 14.9 ( 12.4- 17.9) 11.9 ( 9.8- 14.2) ∼ ∼Wyoming 13.4 ( 9.2- 19.0) 13.8 ( 9.5- 19.4) 13.3 ( 9.1- 19.0) 14.0 ( 9.6- 19.8) ∼ ∼
Pacific 15.3 ( 14.8- 15.9) 15.2 ( 14.7- 15.7) 15.8 ( 15.2- 16.4) 16.3 ( 15.7- 16.9) 11.0 ( 9.1- 13.2) 9.0 ( 7.5- 10.7)
Alaska 18.2 ( 12.8- 26.0) 14.3 ( 10.3- 19.3) 20.4 ( 14.0- 29.8) 16.9 ( 11.9- 23.3) ∼ ∼California 14.9 ( 14.3- 15.5) 14.6 ( 14.0- 15.2) 15.4 ( 14.8- 16.1) 15.7 ( 15.0- 16.4) 10.9 ( 8.9- 13.2) 9.0 ( 7.4- 10.8)
San Francisco-Oakland 15.0 ( 13.4- 16.7) 16.4 ( 14.7- 18.2) 16.0 ( 14.0- 18.1) 18.8 ( 16.6- 21.3) 11.1 ( 7.1- 16.6) 10.0 ( 6.5- 14.7)
San Jose-Monterey 16.4 ( 14.1- 19.0) 15.7 ( 13.5- 18.2) 15.8 ( 13.2- 18.6) 15.8 ( 13.3- 18.6) ∼ ∼Los Angeles 14.4 ( 13.3- 15.5) 13.7 ( 12.7- 14.8) 15.6 ( 14.3- 17.0) 15.2 ( 13.9- 16.6) 10.0 ( 7.4- 13.2) 9.1 ( 6.7- 12.0)
Hawaii 12.2 ( 9.6- 15.2) 13.6 ( 10.7- 16.9) 12.9 ( 7.9- 20.4) 13.2 ( 8.0- 20.3) ∼ ∼Oregon 16.0 ( 14.2- 17.9) 18.0 ( 16.0- 20.2) 15.9 ( 14.1- 17.8) 18.3 ( 16.3- 20.6) ∼ ∼Washington 17.3 ( 15.8- 18.9) 17.6 ( 16.1- 19.2) 17.1 ( 15.6- 18.8) 18.3 ( 16.6- 20.0) ∼ ∼
Seattle-Puget Sound 17.5 ( 15.7- 19.5) 17.6 ( 15.8- 19.6) 17.8 ( 15.9- 19.9) 18.9 ( 16.9- 21.0) ∼ ∼∗ Data are from selected statewide and metropolitan area cancer registries that meet the following data quality criteria for all invasive cancer sites combined: case
ascertainment is at least 90% complete; ≥ 97% of cases pass a standard set of computerized edits; ≤ 5% of cases were ascertained by death certificate only; ≤ 3% of
cases are missing information on sex; ≤ 5% of cases are missing information on race; ≤ 3% of cases are missing information on age. See Appendix H for registry-specific
data quality information. U.S. rates cover approximately 78% of the U.S. population.
† Invasive cancers only
‡ Rates are per 100,000 persons. Population denominators for 1999 are projected from the 1990 census and may not accurately reflect the 1999 population size. Caution
should be used in interpreting rates based on these projected populations.
§ Rates are age-adjusted to the 2000 U.S. standard population.
∼ Rates are suppressed if fewer than 16 cases were reported in the specific area-race category.
Notes: Cases from suppressed rates are included in the U.S. and region/division rates. Observed region/division age-adjusted incidence rates are presented for
regions/divisions with ≥ 78% of the population covered by registries that meet the data quality criteria specified above, and if the 95% confidence intervals
around the observed region/division rates for each of four major cancers include "bias-corrected" estimated region/division rates (see technical notes) for
each of those cancers. U.S rates are as presented in Table 1.2. California, Washington, and Michigan state rates each include cases from the SEER metropolitan
areas.

United States C
ancer Statistics: 1999 Incidence
102
Table 2.24.1: Multiple Myeloma. Cancer Incidence Rates by U.S. Census Region and Division, State and MetropolitanArea, and Race (All Races, White, Black), United States: SEER and NPCR Registries that Meet Quality Criteria∗†
Males, 1999
All Races White BlackAge-Adjusted Crude Age-Adjusted Crude Age-Adjusted Crude
Area Rate‡§ (CI) Rate‡ (CI) Rate‡§ (CI) Rate‡ (CI) Rate‡§ (CI) Rate‡ (CI)
United States 6.0 ( 5.8- 6.2) 5.3 ( 5.2- 5.5) 5.6 ( 5.4- 5.7) 5.3 ( 5.1- 5.4) 10.8 ( 10.0- 11.6) 6.6 ( 6.2- 7.1)
Northeast 6.1 ( 5.7- 6.4) 5.7 ( 5.4- 6.0) 5.6 ( 5.3- 6.0) 5.7 ( 5.3- 6.0) 10.2 ( 8.8- 11.9) 6.5 ( 5.7- 7.5)
New England 5.8 ( 5.2- 6.5) 5.4 ( 4.8- 6.0) 5.7 ( 5.1- 6.4) 5.6 ( 4.9- 6.2) 9.3 ( 5.2- 16.2) 4.6 ( 2.7- 7.3)
Connecticut 6.4 ( 5.2- 7.9) 6.1 ( 5.0- 7.5) 6.3 ( 5.0- 7.7) 6.3 ( 5.1- 7.8) ∼ ∼Maine
Massachusetts 5.4 ( 4.5- 6.3) 5.0 ( 4.2- 5.8) 5.2 ( 4.4- 6.2) 5.1 ( 4.3- 6.0) ∼ ∼New Hampshire 6.8 ( 4.6- 9.7) 5.6 ( 3.8- 7.8) 6.8 ( 4.7- 9.8) 5.7 ( 3.9- 8.0) ∼ ∼Rhode Island 5.4 ( 3.5- 8.1) 5.2 ( 3.4- 7.7) 5.4 ( 3.4- 8.2) 5.5 ( 3.5- 8.2) ∼ ∼Vermont
Middle Atlantic 6.1 ( 5.8- 6.5) 5.8 ( 5.5- 6.2) 5.6 ( 5.2- 6.0) 5.7 ( 5.3- 6.1) 10.4 ( 8.8- 12.1) 6.8 ( 5.9- 7.9)
New Jersey 6.4 ( 5.6- 7.4) 6.0 ( 5.2- 6.8) 5.9 ( 5.1- 6.9) 6.0 ( 5.1- 6.9) 12.1 ( 8.6- 17.0) 7.7 ( 5.6- 10.4)
New York 6.3 ( 5.7- 6.9) 5.7 ( 5.2- 6.2) 5.9 ( 5.3- 6.5) 5.8 ( 5.2- 6.4) 8.4 ( 6.6- 10.5) 5.7 ( 4.6- 7.1)
Pennsylvania 5.7 ( 5.1- 6.3) 5.9 ( 5.3- 6.5) 5.1 ( 4.5- 5.8) 5.5 ( 4.9- 6.2) 13.1 ( 9.7- 17.6) 8.9 ( 6.6- 11.8)
Midwest
East North Central
Illinois 6.2 ( 5.5- 6.9) 5.3 ( 4.7- 5.9) 5.5 ( 4.8- 6.2) 5.0 ( 4.3- 5.6) 10.5 ( 7.9- 13.9) 6.8 ( 5.1- 8.7)
Indiana
Michigan 6.9 ( 6.1- 7.8) 5.9 ( 5.2- 6.6) 6.2 ( 5.4- 7.1) 5.6 ( 4.9- 6.3) 13.1 ( 9.8- 17.1) 8.6 ( 6.5- 11.2)
Detroit 7.7 ( 6.4- 9.2) 6.6 ( 5.5- 7.8) 6.1 ( 4.9- 7.7) 5.7 ( 4.5- 7.0) 14.5 ( 10.6- 19.5) 10.3 ( 7.5- 13.6)
Ohio 6.2 ( 5.5- 7.0) 5.7 ( 5.1- 6.4) 5.5 ( 4.9- 6.3) 5.3 ( 4.6- 6.0) 12.6 ( 9.3- 16.8) 8.5 ( 6.3- 11.1)
Wisconsin 5.6 ( 4.7- 6.7) 5.0 ( 4.2- 6.0) 5.6 ( 4.6- 6.6) 5.3 ( 4.4- 6.3) ∼ ∼West North Central 5.7 ( 5.2- 6.3) 5.3 ( 4.8- 5.8) 5.5 ( 5.0- 6.1) 5.3 ( 4.8- 5.8) 11.1 ( 7.5- 16.2) 6.5 ( 4.5- 9.1)
Iowa 5.8 ( 4.6- 7.2) 5.8 ( 4.6- 7.2) 5.7 ( 4.5- 7.1) 5.8 ( 4.6- 7.2) ∼ ∼Kansas 6.1 ( 4.8- 7.7) 5.5 ( 4.3- 6.9) 6.0 ( 4.7- 7.7) 5.6 ( 4.4- 7.1) ∼ ∼Minnesota 6.4 ( 5.3- 7.6) 5.5 ( 4.6- 6.5) 6.2 ( 5.2- 7.5) 5.6 ( 4.7- 6.7) ∼ ∼Missouri 5.0 ( 4.2- 6.0) 4.6 ( 3.9- 5.5) 4.4 ( 3.6- 5.4) 4.3 ( 3.5- 5.2) 11.5 ( 7.0- 18.3) 7.3 ( 4.5- 11.1)
Nebraska 6.2 ( 4.6- 8.3) 5.8 ( 4.2- 7.7) 6.2 ( 4.5- 8.3) 5.9 ( 4.3- 7.9) ∼ ∼North Dakota ∼ ∼ ∼ ∼ ∼ ∼South Dakota
South
South Atlantic
Delaware 6.5 ( 4.0- 10.2) 6.0 ( 3.8- 9.1) ∼ ∼ ∼ ∼District of Columbia 8.6 ( 5.2- 13.7) 7.8 ( 4.7- 12.2) ∼ ∼ ∼ ∼Florida 6.0 ( 5.5- 6.5) 7.0 ( 6.4- 7.6) 5.5 ( 5.0- 6.1) 7.2 ( 6.5- 7.9) 11.8 ( 9.1- 15.3) 6.6 ( 5.2- 8.3)
Georgia
Atlanta 5.9 ( 4.2- 8.1) 3.7 ( 2.8- 5.0) 4.5 ( 2.9- 6.9) 3.3 ( 2.2- 4.7) 12.1 ( 6.8- 21.1) 5.0 ( 3.1- 7.8)
Maryland 6.3 ( 5.2- 7.6) 5.1 ( 4.2- 6.0) 5.3 ( 4.2- 6.7) 4.8 ( 3.8- 6.0) 9.9 ( 6.8- 14.2) 5.8 ( 4.2- 8.0)
North Carolina 5.2 ( 4.4- 6.0) 4.5 ( 3.9- 5.3) 4.7 ( 3.9- 5.7) 4.5 ( 3.8- 5.4) 7.7 ( 5.4- 10.8) 4.8 ( 3.4- 6.6)
South Carolina 5.5 ( 4.4- 6.9) 4.9 ( 3.9- 6.0) 4.6 ( 3.5- 6.1) 4.6 ( 3.5- 5.9) 8.3 ( 5.5- 12.4) 5.4 ( 3.6- 7.7)
Virginia
West Virginia 5.3 ( 3.9- 7.2) 5.4 ( 4.0- 7.2) 5.4 ( 3.9- 7.3) 5.5 ( 4.0- 7.3) ∼ ∼East South Central
Alabama
Kentucky 7.3 ( 6.1- 8.8) 6.4 ( 5.4- 7.7) 7.0 ( 5.7- 8.5) 6.3 ( 5.2- 7.6) ∼ ∼Mississippi
Tennessee
continued

Cancer Incidence, by U
.S. Census R
egion and Division, State, and M
etropolitan Area
103
Table 2.24.1: Multiple Myeloma. Cancer Incidence Rates by U.S. Census Region and Division, State and MetropolitanArea, and Race (All Races, White, Black), United States: SEER and NPCR Registries that Meet Quality Criteria∗†(continued)
Males, 1999
All Races White BlackAge-Adjusted Crude Age-Adjusted Crude Age-Adjusted Crude
Area Rate‡§ (CI) Rate‡ (CI) Rate‡§ (CI) Rate‡ (CI) Rate‡§ (CI) Rate‡ (CI)
West South Central
Arkansas
Louisiana 7.0 ( 5.8- 8.4) 5.8 ( 4.9- 7.0) 5.3 ( 4.1- 6.7) 5.2 ( 4.1- 6.5) 13.1 ( 9.7- 17.6) 7.6 ( 5.6- 10.0)
Oklahoma
Texas
West 5.8 ( 5.5- 6.1) 4.6 ( 4.4- 4.9) 5.6 ( 5.3- 6.0) 4.7 ( 4.4- 5.0) 10.9 ( 8.9- 13.4) 6.5 ( 5.3- 7.9)
Mountain
Arizona 4.5 ( 3.6- 5.5) 3.9 ( 3.2- 4.8) 4.3 ( 3.4- 5.3) 4.0 ( 3.2- 5.0) ∼ ∼Colorado 6.4 ( 5.1- 7.9) 4.7 ( 3.8- 5.8) 6.3 ( 5.0- 7.8) 4.8 ( 3.9- 5.9) ∼ ∼Idaho 7.4 ( 5.2- 10.3) 6.1 ( 4.3- 8.3) 7.3 ( 5.1- 10.2) 6.1 ( 4.3- 8.4) ∼ ∼Montana 5.7 ( 3.6- 8.6) 5.5 ( 3.5- 8.1) 5.2 ( 3.2- 8.2) 5.2 ( 3.2- 7.9) ∼ ∼Nevada
New Mexico 5.0 ( 3.5- 6.9) 4.6 ( 3.2- 6.2) 4.9 ( 3.4- 6.9) 4.7 ( 3.3- 6.6) ∼ ∼Utah 6.9 ( 5.0- 9.3) 4.2 ( 3.1- 5.7) 6.8 ( 4.9- 9.2) 4.3 ( 3.1- 5.7) ∼ ∼Wyoming ∼ ∼ ∼ ∼ ∼ ∼
Pacific 5.9 ( 5.5- 6.3) 4.7 ( 4.4- 5.0) 5.7 ( 5.3- 6.1) 4.8 ( 4.4- 5.1) 11.1 ( 8.9- 13.8) 6.8 ( 5.5- 8.3)
Alaska ∼ ∼ ∼ ∼ ∼ ∼California 5.7 ( 5.3- 6.2) 4.5 ( 4.2- 4.8) 5.4 ( 5.0- 5.9) 4.5 ( 4.1- 4.8) 11.2 ( 8.9- 14.0) 7.0 ( 5.6- 8.6)
San Francisco-Oakland 5.9 ( 4.8- 7.2) 5.1 ( 4.2- 6.2) 4.6 ( 3.5- 6.1) 4.3 ( 3.3- 5.6) 11.3 ( 6.8- 18.3) 8.5 ( 5.2- 13.1)
San Jose-Monterey 3.6 ( 2.4- 5.2) 2.7 ( 1.9- 3.8) 3.6 ( 2.3- 5.4) 2.9 ( 1.9- 4.2) ∼ ∼Los Angeles 7.0 ( 6.1- 7.9) 5.1 ( 4.4- 5.8) 6.4 ( 5.4- 7.5) 4.7 ( 4.0- 5.5) 13.9 ( 10.2- 18.7) 10.1 ( 7.5- 13.4)
Hawaii 3.9 ( 2.4- 6.0) 3.7 ( 2.3- 5.6) ∼ ∼ ∼ ∼Oregon 6.1 ( 4.9- 7.6) 5.7 ( 4.6- 7.0) 6.1 ( 4.9- 7.5) 5.8 ( 4.7- 7.2) ∼ ∼Washington 6.9 ( 5.9- 8.1) 5.7 ( 4.9- 6.6) 6.9 ( 5.8- 8.1) 5.9 ( 5.0- 6.9) ∼ ∼
Seattle-Puget Sound 7.4 ( 6.1- 8.9) 5.8 ( 4.8- 7.0) 7.4 ( 6.0- 9.0) 6.1 ( 5.0- 7.4) ∼ ∼∗ Data are from selected statewide and metropolitan area cancer registries that meet the following data quality criteria for all invasive cancer sites combined: case
ascertainment is at least 90% complete; ≥ 97% of cases pass a standard set of computerized edits; ≤ 5% of cases were ascertained by death certificate only; ≤ 3% of
cases are missing information on sex; ≤ 5% of cases are missing information on race; ≤ 3% of cases are missing information on age. See Appendix H for registry-specific
data quality information. U.S. rates cover approximately 78% of the U.S. population.
† Invasive cancers only
‡ Rates are per 100,000 persons. Population denominators for 1999 are projected from the 1990 census and may not accurately reflect the 1999 population size. Caution
should be used in interpreting rates based on these projected populations.
§ Rates are age-adjusted to the 2000 U.S. standard population.
∼ Rates are suppressed if fewer than 16 cases were reported in the specific area-race category.
Notes: Cases from suppressed rates are included in the U.S. and region/division rates. Observed region/division age-adjusted incidence rates are presented for
regions/divisions with ≥ 78% of the population covered by registries that meet the data quality criteria specified above, and if the 95% confidence intervals
around the observed region/division rates for each of four major cancers include "bias-corrected" estimated region/division rates (see technical notes) for
each of those cancers. U.S rates are as presented in Table 1.1. California, Washington, and Michigan state rates each include cases from the SEER metropolitan
areas.

United States C
ancer Statistics: 1999 Incidence
104
Table 2.24.2: Multiple Myeloma. Cancer Incidence Rates by U.S. Census Region and Division, State and MetropolitanArea, and Race (All Races, White, Black), United States: SEER and NPCR Registries that Meet Quality Criteria∗†
Females, 1999
All Races White BlackAge-Adjusted Crude Age-Adjusted Crude Age-Adjusted Crude
Area Rate‡§ (CI) Rate‡ (CI) Rate‡§ (CI) Rate‡ (CI) Rate‡§ (CI) Rate‡ (CI)
United States 4.1 ( 4.0- 4.3) 4.6 ( 4.5- 4.8) 3.7 ( 3.6- 3.8) 4.5 ( 4.3- 4.6) 8.2 ( 7.7- 8.8) 6.4 ( 6.0- 6.9)
Northeast 4.3 ( 4.1- 4.5) 5.2 ( 4.9- 5.5) 3.8 ( 3.5- 4.0) 4.9 ( 4.6- 5.2) 8.6 ( 7.6- 9.8) 7.2 ( 6.3- 8.1)
New England 3.6 ( 3.1- 4.0) 4.2 ( 3.7- 4.8) 3.3 ( 2.9- 3.8) 4.2 ( 3.7- 4.8) 6.6 ( 3.9- 10.8) 4.5 ( 2.7- 7.1)
Connecticut 3.6 ( 2.8- 4.6) 4.3 ( 3.4- 5.4) 3.2 ( 2.5- 4.2) 4.2 ( 3.2- 5.4) ∼ ∼Maine
Massachusetts 3.4 ( 2.8- 4.0) 4.0 ( 3.4- 4.8) 3.1 ( 2.5- 3.7) 4.0 ( 3.3- 4.8) ∼ ∼New Hampshire 3.2 ( 2.0- 5.1) 3.3 ( 2.0- 5.1) 3.3 ( 2.0- 5.1) 3.4 ( 2.1- 5.2) ∼ ∼Rhode Island 5.1 ( 3.5- 7.3) 6.4 ( 4.4- 9.0) 5.2 ( 3.5- 7.6) 6.8 ( 4.6- 9.5) ∼ ∼Vermont
Middle Atlantic 4.5 ( 4.2- 4.8) 5.5 ( 5.2- 5.9) 3.9 ( 3.6- 4.2) 5.2 ( 4.8- 5.5) 8.8 ( 7.7- 10.1) 7.5 ( 6.6- 8.6)
New Jersey 4.4 ( 3.8- 5.0) 5.2 ( 4.5- 5.9) 3.7 ( 3.2- 4.4) 4.9 ( 4.2- 5.7) 9.3 ( 6.7- 12.5) 7.2 ( 5.2- 9.6)
New York 4.6 ( 4.2- 5.0) 5.4 ( 5.0- 5.9) 4.0 ( 3.6- 4.4) 5.2 ( 4.7- 5.7) 7.8 ( 6.5- 9.4) 6.7 ( 5.5- 8.0)
Pennsylvania 4.4 ( 4.0- 4.9) 5.9 ( 5.3- 6.5) 3.9 ( 3.4- 4.3) 5.3 ( 4.7- 6.0) 10.9 ( 8.3- 13.9) 10.2 ( 7.8- 13.0)
Midwest
East North Central
Illinois 4.8 ( 4.3- 5.3) 5.2 ( 4.7- 5.8) 3.7 ( 3.2- 4.2) 4.4 ( 3.9- 5.1) 11.7 ( 9.4- 14.4) 9.4 ( 7.6- 11.5)
Indiana
Michigan 4.1 ( 3.6- 4.7) 4.5 ( 4.0- 5.1) 3.5 ( 3.0- 4.1) 4.1 ( 3.5- 4.8) 8.6 ( 6.4- 11.3) 6.9 ( 5.2- 9.1)
Detroit 4.9 ( 4.0- 5.9) 5.4 ( 4.5- 6.5) 3.8 ( 3.0- 4.9) 4.7 ( 3.7- 6.0) 8.8 ( 6.3- 11.9) 7.5 ( 5.4- 10.2)
Ohio 4.0 ( 3.5- 4.5) 4.5 ( 4.0- 5.1) 3.6 ( 3.2- 4.2) 4.3 ( 3.8- 5.0) 7.2 ( 5.2- 9.8) 6.1 ( 4.4- 8.2)
Wisconsin 4.1 ( 3.4- 4.9) 4.6 ( 3.8- 5.5) 4.0 ( 3.3- 4.9) 4.8 ( 4.0- 5.7) ∼ ∼West North Central 4.1 ( 3.7- 4.5) 4.8 ( 4.3- 5.2) 3.7 ( 3.3- 4.1) 4.5 ( 4.1- 5.0) 10.8 ( 7.8- 14.7) 7.7 ( 5.6- 10.4)
Iowa 3.7 ( 2.9- 4.8) 4.9 ( 3.8- 6.2) 3.8 ( 2.9- 4.8) 5.0 ( 3.9- 6.3) ∼ ∼Kansas 4.3 ( 3.3- 5.5) 5.0 ( 3.9- 6.3) 3.7 ( 2.8- 4.9) 4.5 ( 3.4- 5.8) ∼ ∼Minnesota 3.9 ( 3.1- 4.7) 4.2 ( 3.4- 5.1) 3.6 ( 2.9- 4.4) 4.1 ( 3.3- 5.0) ∼ ∼Missouri 4.1 ( 3.4- 4.9) 4.8 ( 4.1- 5.7) 3.4 ( 2.8- 4.1) 4.2 ( 3.4- 5.1) 11.5 ( 7.8- 16.5) 9.1 ( 6.2- 13.0)
Nebraska 4.0 ( 2.8- 5.5) 4.8 ( 3.5- 6.5) 4.0 ( 2.8- 5.6) 5.0 ( 3.6- 6.8) ∼ ∼North Dakota 5.6 ( 3.5- 8.8) 6.9 ( 4.3- 10.5) 5.4 ( 3.3- 8.7) 7.0 ( 4.4- 10.8) ∼ ∼South Dakota
South
South Atlantic
Delaware 4.2 ( 2.5- 6.7) 4.7 ( 2.8- 7.4) 4.3 ( 2.5- 7.3) 5.4 ( 3.1- 8.7) ∼ ∼District of Columbia 6.4 ( 3.9- 10.2) 7.6 ( 4.7- 11.6) ∼ ∼ 7.4 ( 4.3- 12.8) 9.8 ( 5.7- 15.6)
Florida 4.1 ( 3.8- 4.6) 5.8 ( 5.3- 6.4) 4.0 ( 3.6- 4.4) 6.2 ( 5.6- 6.8) 6.5 ( 4.8- 8.6) 4.1 ( 3.1- 5.4)
Georgia
Atlanta 4.4 ( 3.2- 5.9) 3.4 ( 2.5- 4.5) 3.4 ( 2.2- 5.0) 3.1 ( 2.0- 4.5) 7.9 ( 4.7- 12.9) 4.2 ( 2.5- 6.6)
Maryland 4.2 ( 3.5- 5.0) 4.3 ( 3.5- 5.2) 3.3 ( 2.6- 4.2) 4.0 ( 3.1- 5.0) 7.2 ( 5.1- 9.9) 5.3 ( 3.8- 7.2)
North Carolina 3.7 ( 3.2- 4.4) 4.1 ( 3.5- 4.8) 3.2 ( 2.6- 3.9) 3.8 ( 3.2- 4.6) 6.0 ( 4.4- 8.0) 5.1 ( 3.8- 6.9)
South Carolina 4.2 ( 3.4- 5.2) 4.5 ( 3.6- 5.6) 3.3 ( 2.5- 4.4) 3.9 ( 3.0- 5.1) 7.1 ( 4.9- 9.9) 5.7 ( 3.9- 7.9)
Virginia
West Virginia 3.6 ( 2.6- 4.9) 4.8 ( 3.5- 6.4) 3.4 ( 2.4- 4.7) 4.4 ( 3.2- 6.1) ∼ ∼East South Central
Alabama
Kentucky 4.6 ( 3.7- 5.5) 5.1 ( 4.1- 6.1) 4.3 ( 3.5- 5.3) 4.9 ( 4.0- 6.0) ∼ ∼Mississippi
Tennessee
continued
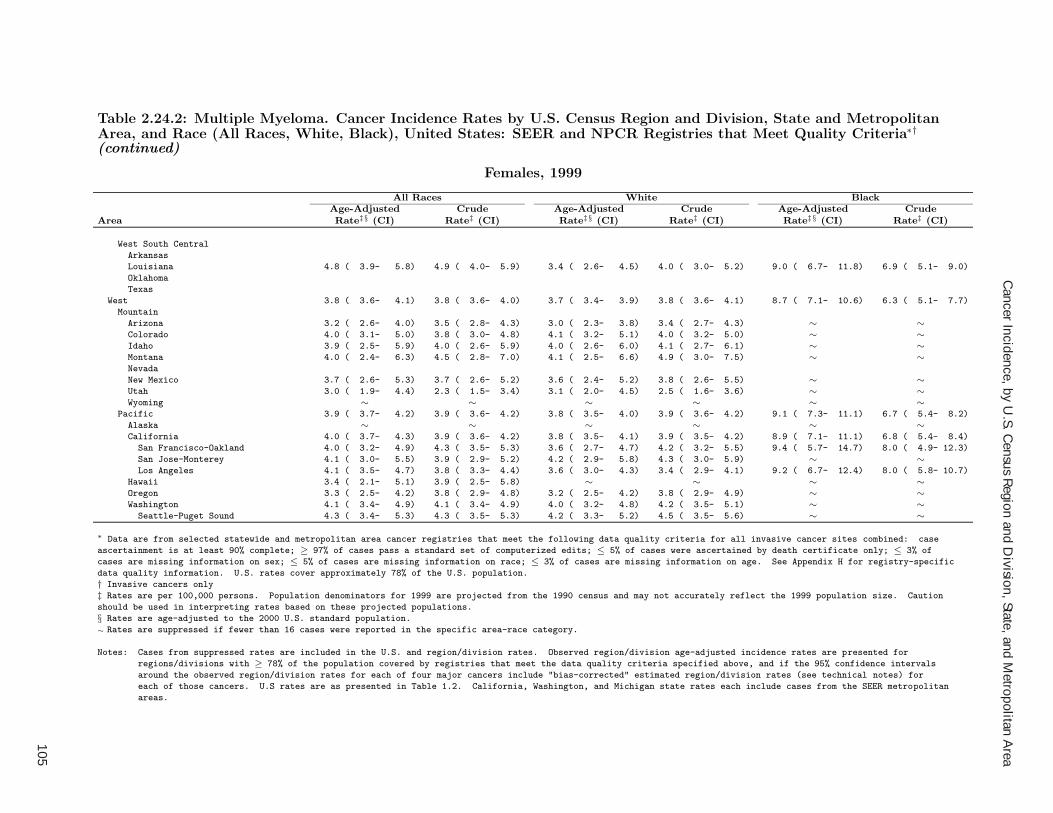
Cancer Incidence, by U
.S. Census R
egion and Division, State, and M
etropolitan Area
105
Table 2.24.2: Multiple Myeloma. Cancer Incidence Rates by U.S. Census Region and Division, State and MetropolitanArea, and Race (All Races, White, Black), United States: SEER and NPCR Registries that Meet Quality Criteria∗†(continued)
Females, 1999
All Races White BlackAge-Adjusted Crude Age-Adjusted Crude Age-Adjusted Crude
Area Rate‡§ (CI) Rate‡ (CI) Rate‡§ (CI) Rate‡ (CI) Rate‡§ (CI) Rate‡ (CI)
West South Central
Arkansas
Louisiana 4.8 ( 3.9- 5.8) 4.9 ( 4.0- 5.9) 3.4 ( 2.6- 4.5) 4.0 ( 3.0- 5.2) 9.0 ( 6.7- 11.8) 6.9 ( 5.1- 9.0)
Oklahoma
Texas
West 3.8 ( 3.6- 4.1) 3.8 ( 3.6- 4.0) 3.7 ( 3.4- 3.9) 3.8 ( 3.6- 4.1) 8.7 ( 7.1- 10.6) 6.3 ( 5.1- 7.7)
Mountain
Arizona 3.2 ( 2.6- 4.0) 3.5 ( 2.8- 4.3) 3.0 ( 2.3- 3.8) 3.4 ( 2.7- 4.3) ∼ ∼Colorado 4.0 ( 3.1- 5.0) 3.8 ( 3.0- 4.8) 4.1 ( 3.2- 5.1) 4.0 ( 3.2- 5.0) ∼ ∼Idaho 3.9 ( 2.5- 5.9) 4.0 ( 2.6- 5.9) 4.0 ( 2.6- 6.0) 4.1 ( 2.7- 6.1) ∼ ∼Montana 4.0 ( 2.4- 6.3) 4.5 ( 2.8- 7.0) 4.1 ( 2.5- 6.6) 4.9 ( 3.0- 7.5) ∼ ∼Nevada
New Mexico 3.7 ( 2.6- 5.3) 3.7 ( 2.6- 5.2) 3.6 ( 2.4- 5.2) 3.8 ( 2.6- 5.5) ∼ ∼Utah 3.0 ( 1.9- 4.4) 2.3 ( 1.5- 3.4) 3.1 ( 2.0- 4.5) 2.5 ( 1.6- 3.6) ∼ ∼Wyoming ∼ ∼ ∼ ∼ ∼ ∼
Pacific 3.9 ( 3.7- 4.2) 3.9 ( 3.6- 4.2) 3.8 ( 3.5- 4.0) 3.9 ( 3.6- 4.2) 9.1 ( 7.3- 11.1) 6.7 ( 5.4- 8.2)
Alaska ∼ ∼ ∼ ∼ ∼ ∼California 4.0 ( 3.7- 4.3) 3.9 ( 3.6- 4.2) 3.8 ( 3.5- 4.1) 3.9 ( 3.5- 4.2) 8.9 ( 7.1- 11.1) 6.8 ( 5.4- 8.4)
San Francisco-Oakland 4.0 ( 3.2- 4.9) 4.3 ( 3.5- 5.3) 3.6 ( 2.7- 4.7) 4.2 ( 3.2- 5.5) 9.4 ( 5.7- 14.7) 8.0 ( 4.9- 12.3)
San Jose-Monterey 4.1 ( 3.0- 5.5) 3.9 ( 2.9- 5.2) 4.2 ( 2.9- 5.8) 4.3 ( 3.0- 5.9) ∼ ∼Los Angeles 4.1 ( 3.5- 4.7) 3.8 ( 3.3- 4.4) 3.6 ( 3.0- 4.3) 3.4 ( 2.9- 4.1) 9.2 ( 6.7- 12.4) 8.0 ( 5.8- 10.7)
Hawaii 3.4 ( 2.1- 5.1) 3.9 ( 2.5- 5.8) ∼ ∼ ∼ ∼Oregon 3.3 ( 2.5- 4.2) 3.8 ( 2.9- 4.8) 3.2 ( 2.5- 4.2) 3.8 ( 2.9- 4.9) ∼ ∼Washington 4.1 ( 3.4- 4.9) 4.1 ( 3.4- 4.9) 4.0 ( 3.2- 4.8) 4.2 ( 3.5- 5.1) ∼ ∼
Seattle-Puget Sound 4.3 ( 3.4- 5.3) 4.3 ( 3.5- 5.3) 4.2 ( 3.3- 5.2) 4.5 ( 3.5- 5.6) ∼ ∼∗ Data are from selected statewide and metropolitan area cancer registries that meet the following data quality criteria for all invasive cancer sites combined: case
ascertainment is at least 90% complete; ≥ 97% of cases pass a standard set of computerized edits; ≤ 5% of cases were ascertained by death certificate only; ≤ 3% of
cases are missing information on sex; ≤ 5% of cases are missing information on race; ≤ 3% of cases are missing information on age. See Appendix H for registry-specific
data quality information. U.S. rates cover approximately 78% of the U.S. population.
† Invasive cancers only
‡ Rates are per 100,000 persons. Population denominators for 1999 are projected from the 1990 census and may not accurately reflect the 1999 population size. Caution
should be used in interpreting rates based on these projected populations.
§ Rates are age-adjusted to the 2000 U.S. standard population.
∼ Rates are suppressed if fewer than 16 cases were reported in the specific area-race category.
Notes: Cases from suppressed rates are included in the U.S. and region/division rates. Observed region/division age-adjusted incidence rates are presented for
regions/divisions with ≥ 78% of the population covered by registries that meet the data quality criteria specified above, and if the 95% confidence intervals
around the observed region/division rates for each of four major cancers include "bias-corrected" estimated region/division rates (see technical notes) for
each of those cancers. U.S rates are as presented in Table 1.2. California, Washington, and Michigan state rates each include cases from the SEER metropolitan
areas.
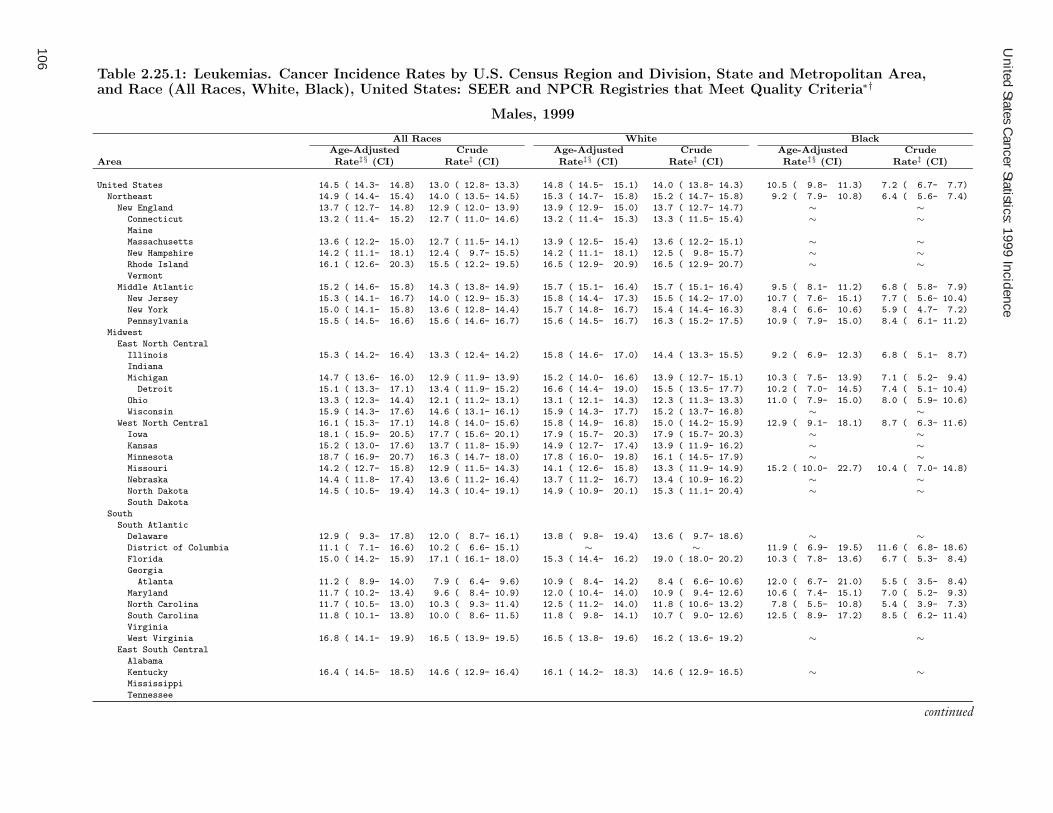
United States C
ancer Statistics: 1999 Incidence
106
Table 2.25.1: Leukemias. Cancer Incidence Rates by U.S. Census Region and Division, State and Metropolitan Area,and Race (All Races, White, Black), United States: SEER and NPCR Registries that Meet Quality Criteria∗†
Males, 1999
All Races White BlackAge-Adjusted Crude Age-Adjusted Crude Age-Adjusted Crude
Area Rate‡§ (CI) Rate‡ (CI) Rate‡§ (CI) Rate‡ (CI) Rate‡§ (CI) Rate‡ (CI)
United States 14.5 ( 14.3- 14.8) 13.0 ( 12.8- 13.3) 14.8 ( 14.5- 15.1) 14.0 ( 13.8- 14.3) 10.5 ( 9.8- 11.3) 7.2 ( 6.7- 7.7)
Northeast 14.9 ( 14.4- 15.4) 14.0 ( 13.5- 14.5) 15.3 ( 14.7- 15.8) 15.2 ( 14.7- 15.8) 9.2 ( 7.9- 10.8) 6.4 ( 5.6- 7.4)
New England 13.7 ( 12.7- 14.8) 12.9 ( 12.0- 13.9) 13.9 ( 12.9- 15.0) 13.7 ( 12.7- 14.7) ∼ ∼Connecticut 13.2 ( 11.4- 15.2) 12.7 ( 11.0- 14.6) 13.2 ( 11.4- 15.3) 13.3 ( 11.5- 15.4) ∼ ∼Maine
Massachusetts 13.6 ( 12.2- 15.0) 12.7 ( 11.5- 14.1) 13.9 ( 12.5- 15.4) 13.6 ( 12.2- 15.1) ∼ ∼New Hampshire 14.2 ( 11.1- 18.1) 12.4 ( 9.7- 15.5) 14.2 ( 11.1- 18.1) 12.5 ( 9.8- 15.7) ∼ ∼Rhode Island 16.1 ( 12.6- 20.3) 15.5 ( 12.2- 19.5) 16.5 ( 12.9- 20.9) 16.5 ( 12.9- 20.7) ∼ ∼Vermont
Middle Atlantic 15.2 ( 14.6- 15.8) 14.3 ( 13.8- 14.9) 15.7 ( 15.1- 16.4) 15.7 ( 15.1- 16.4) 9.5 ( 8.1- 11.2) 6.8 ( 5.8- 7.9)
New Jersey 15.3 ( 14.1- 16.7) 14.0 ( 12.9- 15.3) 15.8 ( 14.4- 17.3) 15.5 ( 14.2- 17.0) 10.7 ( 7.6- 15.1) 7.7 ( 5.6- 10.4)
New York 15.0 ( 14.1- 15.8) 13.6 ( 12.8- 14.4) 15.7 ( 14.8- 16.7) 15.4 ( 14.4- 16.3) 8.4 ( 6.6- 10.6) 5.9 ( 4.7- 7.2)
Pennsylvania 15.5 ( 14.5- 16.6) 15.6 ( 14.6- 16.7) 15.6 ( 14.5- 16.7) 16.3 ( 15.2- 17.5) 10.9 ( 7.9- 15.0) 8.4 ( 6.1- 11.2)
Midwest
East North Central
Illinois 15.3 ( 14.2- 16.4) 13.3 ( 12.4- 14.2) 15.8 ( 14.6- 17.0) 14.4 ( 13.3- 15.5) 9.2 ( 6.9- 12.3) 6.8 ( 5.1- 8.7)
Indiana
Michigan 14.7 ( 13.6- 16.0) 12.9 ( 11.9- 13.9) 15.2 ( 14.0- 16.6) 13.9 ( 12.7- 15.1) 10.3 ( 7.5- 13.9) 7.1 ( 5.2- 9.4)
Detroit 15.1 ( 13.3- 17.1) 13.4 ( 11.9- 15.2) 16.6 ( 14.4- 19.0) 15.5 ( 13.5- 17.7) 10.2 ( 7.0- 14.5) 7.4 ( 5.1- 10.4)
Ohio 13.3 ( 12.3- 14.4) 12.1 ( 11.2- 13.1) 13.1 ( 12.1- 14.3) 12.3 ( 11.3- 13.3) 11.0 ( 7.9- 15.0) 8.0 ( 5.9- 10.6)
Wisconsin 15.9 ( 14.3- 17.6) 14.6 ( 13.1- 16.1) 15.9 ( 14.3- 17.7) 15.2 ( 13.7- 16.8) ∼ ∼West North Central 16.1 ( 15.3- 17.1) 14.8 ( 14.0- 15.6) 15.8 ( 14.9- 16.8) 15.0 ( 14.2- 15.9) 12.9 ( 9.1- 18.1) 8.7 ( 6.3- 11.6)
Iowa 18.1 ( 15.9- 20.5) 17.7 ( 15.6- 20.1) 17.9 ( 15.7- 20.3) 17.9 ( 15.7- 20.3) ∼ ∼Kansas 15.2 ( 13.0- 17.6) 13.7 ( 11.8- 15.9) 14.9 ( 12.7- 17.4) 13.9 ( 11.9- 16.2) ∼ ∼Minnesota 18.7 ( 16.9- 20.7) 16.3 ( 14.7- 18.0) 17.8 ( 16.0- 19.8) 16.1 ( 14.5- 17.9) ∼ ∼Missouri 14.2 ( 12.7- 15.8) 12.9 ( 11.5- 14.3) 14.1 ( 12.6- 15.8) 13.3 ( 11.9- 14.9) 15.2 ( 10.0- 22.7) 10.4 ( 7.0- 14.8)
Nebraska 14.4 ( 11.8- 17.4) 13.6 ( 11.2- 16.4) 13.7 ( 11.2- 16.7) 13.4 ( 10.9- 16.2) ∼ ∼North Dakota 14.5 ( 10.5- 19.4) 14.3 ( 10.4- 19.1) 14.9 ( 10.9- 20.1) 15.3 ( 11.1- 20.4) ∼ ∼South Dakota
South
South Atlantic
Delaware 12.9 ( 9.3- 17.8) 12.0 ( 8.7- 16.1) 13.8 ( 9.8- 19.4) 13.6 ( 9.7- 18.6) ∼ ∼District of Columbia 11.1 ( 7.1- 16.6) 10.2 ( 6.6- 15.1) ∼ ∼ 11.9 ( 6.9- 19.5) 11.6 ( 6.8- 18.6)
Florida 15.0 ( 14.2- 15.9) 17.1 ( 16.1- 18.0) 15.3 ( 14.4- 16.2) 19.0 ( 18.0- 20.2) 10.3 ( 7.8- 13.6) 6.7 ( 5.3- 8.4)
Georgia
Atlanta 11.2 ( 8.9- 14.0) 7.9 ( 6.4- 9.6) 10.9 ( 8.4- 14.2) 8.4 ( 6.6- 10.6) 12.0 ( 6.7- 21.0) 5.5 ( 3.5- 8.4)
Maryland 11.7 ( 10.2- 13.4) 9.6 ( 8.4- 10.9) 12.0 ( 10.4- 14.0) 10.9 ( 9.4- 12.6) 10.6 ( 7.4- 15.1) 7.0 ( 5.2- 9.3)
North Carolina 11.7 ( 10.5- 13.0) 10.3 ( 9.3- 11.4) 12.5 ( 11.2- 14.0) 11.8 ( 10.6- 13.2) 7.8 ( 5.5- 10.8) 5.4 ( 3.9- 7.3)
South Carolina 11.8 ( 10.1- 13.8) 10.0 ( 8.6- 11.5) 11.8 ( 9.8- 14.1) 10.7 ( 9.0- 12.6) 12.5 ( 8.9- 17.2) 8.5 ( 6.2- 11.4)
Virginia
West Virginia 16.8 ( 14.1- 19.9) 16.5 ( 13.9- 19.5) 16.5 ( 13.8- 19.6) 16.2 ( 13.6- 19.2) ∼ ∼East South Central
Alabama
Kentucky 16.4 ( 14.5- 18.5) 14.6 ( 12.9- 16.4) 16.1 ( 14.2- 18.3) 14.6 ( 12.9- 16.5) ∼ ∼Mississippi
Tennessee
continued

Cancer Incidence, by U
.S. Census R
egion and Division, State, and M
etropolitan Area
107
Table 2.25.1: Leukemias. Cancer Incidence Rates by U.S. Census Region and Division, State and Metropolitan Area,and Race (All Races, White, Black), United States: SEER and NPCR Registries that Meet Quality Criteria∗†(continued)
Males, 1999
All Races White BlackAge-Adjusted Crude Age-Adjusted Crude Age-Adjusted Crude
Area Rate‡§ (CI) Rate‡ (CI) Rate‡§ (CI) Rate‡ (CI) Rate‡§ (CI) Rate‡ (CI)
West South Central
Arkansas
Louisiana 14.4 ( 12.7- 16.4) 12.1 ( 10.7- 13.7) 15.4 ( 13.3- 17.8) 14.2 ( 12.3- 16.3) 11.9 ( 8.8- 16.0) 8.2 ( 6.2- 10.7)
Oklahoma
Texas
West 14.0 ( 13.6- 14.5) 11.8 ( 11.4- 12.2) 14.3 ( 13.8- 14.8) 12.4 ( 12.0- 12.9) 12.6 ( 10.4- 15.2) 8.2 ( 6.9- 9.8)
Mountain
Arizona 11.3 ( 9.9- 12.9) 10.5 ( 9.2- 11.8) 11.6 ( 10.2- 13.3) 11.3 ( 9.9- 12.8) ∼ ∼Colorado 16.4 ( 14.4- 18.8) 12.4 ( 10.9- 14.0) 16.8 ( 14.6- 19.2) 12.9 ( 11.3- 14.6) ∼ ∼Idaho 16.7 ( 13.3- 20.7) 14.1 ( 11.3- 17.3) 17.0 ( 13.6- 21.1) 14.5 ( 11.6- 17.9) ∼ ∼Montana 16.2 ( 12.5- 20.7) 15.2 ( 11.8- 19.4) 15.3 ( 11.7- 19.8) 15.0 ( 11.5- 19.2) ∼ ∼Nevada
New Mexico 12.8 ( 10.3- 15.8) 11.1 ( 9.0- 13.6) 12.9 ( 10.3- 16.0) 11.8 ( 9.4- 14.5) ∼ ∼Utah 13.2 ( 10.7- 16.2) 10.0 ( 8.2- 12.1) 13.6 ( 11.0- 16.7) 10.5 ( 8.6- 12.7) ∼ ∼Wyoming 16.3 ( 11.2- 23.4) 14.1 ( 9.8- 19.7) 16.7 ( 11.5- 23.9) 14.7 ( 10.2- 20.5) ∼ ∼
Pacific 14.1 ( 13.6- 14.7) 11.8 ( 11.4- 12.3) 14.4 ( 13.8- 15.0) 12.5 ( 12.0- 13.0) 12.5 ( 10.2- 15.3) 8.3 ( 6.8- 9.9)
Alaska 11.2 ( 6.6- 19.9) 7.4 ( 4.7- 11.0) 10.8 ( 5.8- 21.1) 7.7 ( 4.6- 12.0) ∼ ∼California 13.6 ( 12.9- 14.2) 11.2 ( 10.7- 11.7) 13.9 ( 13.2- 14.6) 11.9 ( 11.4- 12.5) 11.6 ( 9.2- 14.5) 7.6 ( 6.1- 9.3)
San Francisco-Oakland 12.9 ( 11.2- 14.7) 11.5 ( 10.0- 13.0) 12.5 ( 10.6- 14.7) 11.7 ( 10.0- 13.7) 12.8 ( 8.0- 20.0) 10.2 ( 6.5- 15.1)
San Jose-Monterey 11.0 ( 8.9- 13.5) 8.7 ( 7.1- 10.5) 11.8 ( 9.4- 14.7) 9.7 ( 7.8- 11.9) ∼ ∼Los Angeles 14.5 ( 13.2- 15.8) 11.3 ( 10.3- 12.3) 15.4 ( 13.9- 16.9) 12.3 ( 11.1- 13.5) 11.3 ( 7.9- 15.9) 8.1 ( 5.8- 11.0)
Hawaii 13.4 ( 10.6- 16.8) 13.0 ( 10.3- 16.3) 19.2 ( 12.5- 28.5) 15.9 ( 10.5- 23.2) ∼ ∼Oregon 13.8 ( 12.0- 15.8) 13.1 ( 11.4- 15.0) 14.0 ( 12.1- 16.0) 13.6 ( 11.8- 15.6) ∼ ∼Washington 17.4 ( 15.7- 19.2) 14.7 ( 13.3- 16.2) 17.0 ( 15.3- 18.8) 14.9 ( 13.4- 16.4) ∼ ∼
Seattle-Puget Sound 18.4 ( 16.3- 20.7) 15.1 ( 13.4- 16.9) 18.1 ( 15.9- 20.4) 15.4 ( 13.6- 17.4) ∼ ∼∗ Data are from selected statewide and metropolitan area cancer registries that meet the following data quality criteria for all invasive cancer sites combined: case
ascertainment is at least 90% complete; ≥ 97% of cases pass a standard set of computerized edits; ≤ 5% of cases were ascertained by death certificate only; ≤ 3% of
cases are missing information on sex; ≤ 5% of cases are missing information on race; ≤ 3% of cases are missing information on age. See Appendix H for registry-specific
data quality information. U.S. rates cover approximately 78% of the U.S. population.
† Invasive cancers only
‡ Rates are per 100,000 persons. Population denominators for 1999 are projected from the 1990 census and may not accurately reflect the 1999 population size. Caution
should be used in interpreting rates based on these projected populations.
§ Rates are age-adjusted to the 2000 U.S. standard population.
∼ Rates are suppressed if fewer than 16 cases were reported in the specific area-race category.
Notes: Cases from suppressed rates are included in the U.S. and region/division rates. Observed region/division age-adjusted incidence rates are presented for
regions/divisions with ≥ 78% of the population covered by registries that meet the data quality criteria specified above, and if the 95% confidence intervals
around the observed region/division rates for each of four major cancers include "bias-corrected" estimated region/division rates (see technical notes) for
each of those cancers. U.S rates are as presented in Table 1.1. California, Washington, and Michigan state rates each include cases from the SEER metropolitan
areas.

United States C
ancer Statistics: 1999 Incidence
108
Table 2.25.2: Leukemias. Cancer Incidence Rates by U.S. Census Region and Division, State and Metropolitan Area,and Race (All Races, White, Black), United States: SEER and NPCR Registries that Meet Quality Criteria∗†
Females, 1999
All Races White BlackAge-Adjusted Crude Age-Adjusted Crude Age-Adjusted Crude
Area Rate‡§ (CI) Rate‡ (CI) Rate‡§ (CI) Rate‡ (CI) Rate‡§ (CI) Rate‡ (CI)
United States 8.8 ( 8.6- 8.9) 9.6 ( 9.5- 9.8) 8.9 ( 8.7- 9.1) 10.3 ( 10.1- 10.5) 7.0 ( 6.5- 7.5) 5.9 ( 5.5- 6.3)
Northeast 9.1 ( 8.8- 9.5) 10.6 ( 10.2- 11.0) 9.3 ( 9.0- 9.7) 11.5 ( 11.0- 11.9) 6.4 ( 5.6- 7.4) 5.7 ( 5.0- 6.6)
New England 9.1 ( 8.4- 9.8) 10.3 ( 9.5- 11.1) 9.1 ( 8.3- 9.9) 10.7 ( 9.8- 11.6) 7.7 ( 4.8- 12.0) 6.0 ( 3.9- 8.9)
Connecticut 8.5 ( 7.2- 9.9) 9.7 ( 8.3- 11.3) 8.3 ( 7.0- 9.8) 9.9 ( 8.3- 11.6) ∼ ∼Maine
Massachusetts 9.4 ( 8.4- 10.4) 10.6 ( 9.5- 11.8) 9.4 ( 8.3- 10.5) 11.1 ( 9.9- 12.4) ∼ ∼New Hampshire 10.1 ( 7.8- 13.0) 10.3 ( 7.9- 13.2) 10.3 ( 7.9- 13.2) 10.6 ( 8.1- 13.5) ∼ ∼Rhode Island 8.5 ( 6.3- 11.4) 9.9 ( 7.4- 13.0) 8.9 ( 6.5- 12.0) 10.6 ( 7.8- 13.9) ∼ ∼Vermont
Middle Atlantic 9.2 ( 8.8- 9.6) 10.7 ( 10.3- 11.2) 9.4 ( 9.0- 9.9) 11.8 ( 11.2- 12.3) 6.3 ( 5.4- 7.3) 5.7 ( 4.9- 6.6)
New Jersey 8.9 ( 8.1- 9.8) 10.1 ( 9.2- 11.2) 9.4 ( 8.4- 10.4) 11.4 ( 10.3- 12.6) 6.5 ( 4.5- 9.3) 5.4 ( 3.7- 7.6)
New York 9.1 ( 8.5- 9.7) 10.4 ( 9.7- 11.1) 9.6 ( 8.9- 10.3) 11.8 ( 11.1- 12.7) 4.9 ( 3.9- 6.2) 4.6 ( 3.6- 5.7)
Pennsylvania 9.4 ( 8.7- 10.1) 11.7 ( 10.8- 12.6) 9.3 ( 8.6- 10.1) 11.9 ( 11.0- 12.8) 9.5 ( 7.2- 12.3) 9.0 ( 6.8- 11.7)
Midwest
East North Central
Illinois 9.2 ( 8.5- 10.0) 10.0 ( 9.2- 10.8) 9.4 ( 8.6- 10.2) 10.7 ( 9.8- 11.7) 8.1 ( 6.3- 10.4) 6.9 ( 5.4- 8.8)
Indiana
Michigan 9.4 ( 8.6- 10.2) 10.0 ( 9.2- 10.9) 9.4 ( 8.6- 10.4) 10.5 ( 9.6- 11.5) 8.8 ( 6.7- 11.5) 7.4 ( 5.6- 9.7)
Detroit 10.2 ( 8.9- 11.6) 11.0 ( 9.6- 12.5) 10.7 ( 9.2- 12.3) 12.3 ( 10.6- 14.2) 8.6 ( 6.2- 11.7) 7.7 ( 5.5- 10.4)
Ohio 8.4 ( 7.7- 9.2) 9.5 ( 8.7- 10.3) 8.7 ( 7.9- 9.5) 10.1 ( 9.2- 11.0) 5.8 ( 4.1- 8.1) 5.2 ( 3.7- 7.2)
Wisconsin 10.3 ( 9.2- 11.6) 11.7 ( 10.4- 13.0) 10.4 ( 9.2- 11.7) 12.2 ( 10.8- 13.6) ∼ ∼West North Central 9.4 ( 8.8- 10.0) 10.7 ( 10.0- 11.4) 9.1 ( 8.5- 9.7) 10.8 ( 10.1- 11.5) 6.1 ( 4.0- 8.9) 5.1 ( 3.4- 7.4)
Iowa 9.0 ( 7.6- 10.5) 11.3 ( 9.6- 13.1) 8.8 ( 7.5- 10.4) 11.3 ( 9.6- 13.2) ∼ ∼Kansas 8.3 ( 6.9- 9.9) 9.3 ( 7.8- 11.1) 8.1 ( 6.7- 9.8) 9.4 ( 7.8- 11.3) ∼ ∼Minnesota 11.2 ( 9.9- 12.5) 12.1 ( 10.7- 13.5) 10.4 ( 9.1- 11.7) 11.7 ( 10.3- 13.2) ∼ ∼Missouri 8.4 ( 7.4- 9.5) 9.6 ( 8.5- 10.8) 8.4 ( 7.4- 9.5) 10.1 ( 8.8- 11.4) 7.0 ( 4.3- 10.9) 6.4 ( 4.0- 9.8)
Nebraska 10.4 ( 8.5- 12.7) 12.0 ( 9.8- 14.6) 10.2 ( 8.2- 12.6) 12.1 ( 9.8- 14.7) ∼ ∼North Dakota 8.4 ( 5.7- 12.1) 9.7 ( 6.6- 13.8) 8.7 ( 5.8- 12.6) 10.4 ( 7.1- 14.8) ∼ ∼South Dakota
South
South Atlantic
Delaware 8.0 ( 5.5- 11.3) 8.5 ( 5.9- 12.0) 7.8 ( 5.1- 11.5) 9.0 ( 6.0- 13.1) ∼ ∼District of Columbia 5.3 ( 3.0- 9.0) 6.1 ( 3.6- 9.8) ∼ ∼ ∼ ∼Florida 9.4 ( 8.8- 10.0) 12.3 ( 11.5- 13.1) 9.4 ( 8.7- 10.1) 13.3 ( 12.4- 14.2) 10.1 ( 8.1- 12.6) 7.3 ( 5.8- 8.9)
Georgia
Atlanta 5.3 ( 4.0- 6.9) 4.4 ( 3.4- 5.7) 5.5 ( 4.0- 7.4) 5.0 ( 3.7- 6.7) ∼ ∼Maryland 6.7 ( 5.8- 7.8) 6.9 ( 5.9- 8.0) 6.4 ( 5.3- 7.6) 7.3 ( 6.1- 8.7) 6.9 ( 5.0- 9.5) 5.6 ( 4.0- 7.5)
North Carolina 7.4 ( 6.6- 8.3) 8.0 ( 7.1- 8.9) 7.6 ( 6.7- 8.7) 8.7 ( 7.7- 9.9) 6.3 ( 4.7- 8.3) 5.8 ( 4.3- 7.6)
South Carolina 6.5 ( 5.4- 7.7) 6.9 ( 5.8- 8.1) 7.0 ( 5.7- 8.5) 8.1 ( 6.7- 9.8) 4.1 ( 2.6- 6.3) 3.6 ( 2.2- 5.4)
Virginia
West Virginia 9.9 ( 8.1- 12.0) 12.2 ( 10.0- 14.6) 10.0 ( 8.1- 12.1) 12.2 ( 10.0- 14.7) ∼ ∼East South Central
Alabama
Kentucky 9.0 ( 7.8- 10.3) 9.9 ( 8.6- 11.4) 9.0 ( 7.7- 10.4) 10.1 ( 8.7- 11.6) ∼ ∼Mississippi
Tennessee
continued

Cancer Incidence, by U
.S. Census R
egion and Division, State, and M
etropolitan Area
109
Table 2.25.2: Leukemias. Cancer Incidence Rates by U.S. Census Region and Division, State and Metropolitan Area,and Race (All Races, White, Black), United States: SEER and NPCR Registries that Meet Quality Criteria∗†(continued)
Females, 1999
All Races White BlackAge-Adjusted Crude Age-Adjusted Crude Age-Adjusted Crude
Area Rate‡§ (CI) Rate‡ (CI) Rate‡§ (CI) Rate‡ (CI) Rate‡§ (CI) Rate‡ (CI)
West South Central
Arkansas
Louisiana 8.0 ( 6.9- 9.2) 8.2 ( 7.1- 9.5) 7.9 ( 6.6- 9.4) 9.1 ( 7.6- 10.7) 8.0 ( 5.9- 10.6) 6.8 ( 5.0- 8.9)
Oklahoma
Texas
West 8.4 ( 8.0- 8.7) 8.4 ( 8.1- 8.8) 8.5 ( 8.2- 8.9) 8.9 ( 8.5- 9.3) 6.8 ( 5.4- 8.4) 5.4 ( 4.4- 6.7)
Mountain
Arizona 8.4 ( 7.3- 9.6) 8.9 ( 7.7- 10.1) 8.5 ( 7.4- 9.8) 9.4 ( 8.1- 10.8) ∼ ∼Colorado 9.6 ( 8.3- 11.1) 9.3 ( 8.0- 10.7) 9.8 ( 8.4- 11.3) 9.6 ( 8.3- 11.2) ∼ ∼Idaho 8.9 ( 6.8- 11.6) 9.1 ( 6.9- 11.8) 9.0 ( 6.8- 11.7) 9.2 ( 7.0- 12.0) ∼ ∼Montana 8.2 ( 5.8- 11.2) 9.2 ( 6.6- 12.5) 8.3 ( 5.9- 11.5) 9.7 ( 7.0- 13.3) ∼ ∼Nevada
New Mexico 8.4 ( 6.6- 10.6) 8.5 ( 6.7- 10.6) 9.3 ( 7.3- 11.7) 9.7 ( 7.6- 12.2) ∼ ∼Utah 8.1 ( 6.3- 10.2) 7.1 ( 5.6- 8.9) 7.5 ( 5.8- 9.6) 6.8 ( 5.3- 8.6) ∼ ∼Wyoming 10.8 ( 7.0- 16.0) 10.9 ( 7.1- 16.0) 11.1 ( 7.2- 16.5) 11.4 ( 7.4- 16.7) ∼ ∼
Pacific 8.2 ( 7.9- 8.6) 8.3 ( 7.9- 8.7) 8.4 ( 8.0- 8.8) 8.8 ( 8.4- 9.2) 6.9 ( 5.5- 8.7) 5.5 ( 4.4- 6.9)
Alaska 13.1 ( 7.9- 20.9) 8.5 ( 5.5- 12.5) 13.4 ( 7.4- 23.0) 8.2 ( 4.9- 13.0) ∼ ∼California 8.0 ( 7.6- 8.4) 8.0 ( 7.5- 8.4) 8.2 ( 7.8- 8.7) 8.5 ( 8.0- 9.0) 6.7 ( 5.2- 8.5) 5.4 ( 4.2- 6.9)
San Francisco-Oakland 7.5 ( 6.4- 8.7) 8.1 ( 6.9- 9.4) 7.7 ( 6.4- 9.3) 9.0 ( 7.5- 10.7) ∼ ∼San Jose-Monterey 9.1 ( 7.4- 11.1) 8.9 ( 7.2- 10.8) 9.9 ( 8.0- 12.2) 10.1 ( 8.1- 12.4) ∼ ∼Los Angeles 7.4 ( 6.6- 8.2) 7.1 ( 6.4- 7.9) 7.7 ( 6.8- 8.6) 7.7 ( 6.8- 8.7) 6.4 ( 4.3- 9.1) 5.6 ( 3.8- 8.0)
Hawaii 8.2 ( 6.1- 10.8) 8.6 ( 6.4- 11.4) ∼ ∼ ∼ ∼Oregon 8.7 ( 7.4- 10.2) 9.7 ( 8.3- 11.3) 8.7 ( 7.4- 10.3) 10.0 ( 8.5- 11.7) ∼ ∼Washington 9.1 ( 8.0- 10.3) 9.3 ( 8.2- 10.5) 9.1 ( 8.0- 10.3) 9.7 ( 8.5- 11.0) ∼ ∼
Seattle-Puget Sound 9.3 ( 8.0- 10.7) 9.4 ( 8.1- 10.9) 9.4 ( 8.0- 10.9) 10.0 ( 8.6- 11.6) ∼ ∼∗ Data are from selected statewide and metropolitan area cancer registries that meet the following data quality criteria for all invasive cancer sites combined: case
ascertainment is at least 90% complete; ≥ 97% of cases pass a standard set of computerized edits; ≤ 5% of cases were ascertained by death certificate only; ≤ 3% of
cases are missing information on sex; ≤ 5% of cases are missing information on race; ≤ 3% of cases are missing information on age. See Appendix H for registry-specific
data quality information. U.S. rates cover approximately 78% of the U.S. population.
† Invasive cancers only
‡ Rates are per 100,000 persons. Population denominators for 1999 are projected from the 1990 census and may not accurately reflect the 1999 population size. Caution
should be used in interpreting rates based on these projected populations.
§ Rates are age-adjusted to the 2000 U.S. standard population.
∼ Rates are suppressed if fewer than 16 cases were reported in the specific area-race category.
Notes: Cases from suppressed rates are included in the U.S. and region/division rates. Observed region/division age-adjusted incidence rates are presented for
regions/divisions with ≥ 78% of the population covered by registries that meet the data quality criteria specified above, and if the 95% confidence intervals
around the observed region/division rates for each of four major cancers include "bias-corrected" estimated region/division rates (see technical notes) for
each of those cancers. U.S rates are as presented in Table 1.2. California, Washington, and Michigan state rates each include cases from the SEER metropolitan
areas.


State and Metropolitan Area IncidenceRates for Most Common Cancers


Figure 3.1: Invasive Cancer Incidence Rates for the 15 Primary Sites with the HighestAge-Adjusted Incidence Rates within Race- and Sex-Specific Categories
Alaska,*† 1999
ThyroidBrain & ONS
TestisLiver & IBD
PancreasLeukemias
StomachMelanomas of the SkinOral Cavity & Pharynx
Non-Hodgkin LymphomaKidney & Renal Pelvis
Urinary BladderColon & Rectum
Lung & BronchusProstate
0 50 100 150 200 250 300
6.47.28.49.310.611.213.414.417.419.821.6
33.867.3
77.3155.8
Melanomas of the SkinCervix Uteri
Brain & ONSStomach
Kidney & Renal PelvisThyroid
Urinary BladderPancreas
LeukemiasCorpus & Uterus, NOS
OvaryNon-Hodgkin Lymphoma
Colon & RectumLung & Bronchus
Breast
0 50 100 150 200 250 300
7.27.37.47.48.210.710.813.013.117.818.018.2
49.669.3
127.8
TestisLeukemias
Oral Cavity & PharynxMelanomas of the SkinKidney & Renal Pelvis
Non-Hodgkin LymphomaUrinary Bladder
Colon & RectumLung & Bronchus
Prostate
0 50 100 150 200 250 300
10.410.812.515.217.821.8
36.453.5
74.5160.6
Melanomas of the SkinThyroid
PancreasLeukemias
OvaryCorpus & Uterus, NOS
Non-Hodgkin LymphomaColon & Rectum
Lung & BronchusBreast
0 50 100 150 200 250 300
9.19.113.213.419.420.320.4
38.673.0
136.2
0 50 100 150 200 250 300
Incidence rates were notranked when the populationsize was less than 50,000.
0 50 100 150 200 250 300
Incidence rates were notranked when the populationsize was less than 50,000.
Rate‡ per 100,000Rate‡ per 100,000
Rate‡ per 100,000Rate‡ per 100,000
Rate‡ per 100,000Rate‡ per 100,000
Males FemalesAll Races
White
Black
∗ Data meet the following data quality criteria for all invasive cancer sites combined: case ascertainment is at least
90% complete; ≥ 97% of cases pass a standard set of computerized edits; ≤ 5% of cases were ascertained by death certificate
only; ≤ 3% of cases are missing information on sex; ≤ 5% of cases are missing information on race; ≤ 3% of cases are
missing information on age. See Appendix H for registry-specific data quality information.† Excludes basal and squamous cell carcinomas of the skin except when these occur on the skin of the genital organs, and in
situ cancers except urinary bladder.‡ Rates are age-adjusted to the 2000 U.S. standard population. See Table 2.1.1-2.25.2 for 95% confidence intervals for rates
and footnote regarding 1999 population denominators. Rates are suppressed and not ranked if case counts are fewer than 16 or
if the population of the specific race-sex category is less than 50,000.
Note: ONS - Other Nervous System; NOS - Not Otherwise Specified; IBD - Intrahepatic Bile Duct.
Urinary bladder cases include invasive and in situ.
State and Metropolitan Area Incidence Rates for Most Common Cancers
111

United States Cancer Statistics: 1999 Incidence
112
Figure 3.2: Invasive Cancer Incidence Rates for the 15 Primary Sites with the HighestAge-Adjusted Incidence Rates within Race- and Sex-Specific Categories
Arizona,*† 1999
LarynxLiver & IBDEsophagus
Brain & ONSStomach
PancreasLeukemias
Oral Cavity & PharynxKidney & Renal Pelvis
Non-Hodgkin LymphomaMelanomas of the Skin
Urinary BladderColon & Rectum
Lung & BronchusProstate
0 50 100 150 200 250 300
5.75.96.97.68.59.811.312.115.019.220.1
39.354.7
75.8114.4
Oral Cavity & PharynxBrain & ONS
Kidney & Renal PelvisCervix Uteri
PancreasLeukemias
Urinary BladderThyroid
Melanomas of the SkinNon-Hodgkin Lymphoma
OvaryCorpus & Uterus, NOS
Colon & RectumLung & Bronchus
Breast
0 50 100 150 200 250 300
5.76.27.77.78.38.49.39.612.413.113.918.2
40.047.7
123.6
TestisLiver & IBDEsophagus
Brain & ONSStomach
PancreasLeukemias
Oral Cavity & PharynxKidney & Renal Pelvis
Non-Hodgkin LymphomaMelanomas of the Skin
Urinary BladderColon & Rectum
Lung & BronchusProstate
0 50 100 150 200 250 300
5.96.07.07.88.410.011.612.314.919.920.9
40.255.6
76.8114.5
Oral Cavity & PharynxBrain & ONS
Kidney & Renal PelvisCervix Uteri
PancreasLeukemias
Urinary BladderThyroid
Melanomas of the SkinNon-Hodgkin Lymphoma
OvaryCorpus & Uterus, NOS
Colon & RectumLung & Bronchus
Breast
0 50 100 150 200 250 300
5.96.77.88.08.38.59.710.013.613.614.718.9
41.049.1
126.9
Colon & RectumLung & Bronchus
Prostate
0 50 100 150 200 250 300
56.688.6
140.9
Lung & BronchusColon & Rectum
Breast
0 50 100 150 200 250 300
29.733.6
84.2
Rate‡ per 100,000Rate‡ per 100,000
Rate‡ per 100,000Rate‡ per 100,000
Rate‡ per 100,000Rate‡ per 100,000
Males FemalesAll Races
White
Black
∗ Data meet the following data quality criteria for all invasive cancer sites combined: case ascertainment is at least
90% complete; ≥ 97% of cases pass a standard set of computerized edits; ≤ 5% of cases were ascertained by death certificate
only; ≤ 3% of cases are missing information on sex; ≤ 5% of cases are missing information on race; ≤ 3% of cases are
missing information on age. See Appendix H for registry-specific data quality information.† Excludes basal and squamous cell carcinomas of the skin except when these occur on the skin of the genital organs, and in
situ cancers except urinary bladder.‡ Rates are age-adjusted to the 2000 U.S. standard population. See Table 2.1.1-2.25.2 for 95% confidence intervals for rates
and footnote regarding 1999 population denominators. Rates are suppressed and not ranked if case counts are fewer than 16 or
if the population of the specific race-sex category is less than 50,000.
Note: ONS - Other Nervous System; NOS - Not Otherwise Specified; IBD - Intrahepatic Bile Duct.
Urinary bladder cases include invasive and in situ.

State and Metropolitan Area Incidence Rates for Most Common Cancers
113
Figure 3.3: Invasive Cancer Incidence Rates for the 15 Primary Sites with the HighestAge-Adjusted Incidence Rates within Race- and Sex-Specific Categories
California,*† 1999
LarynxEsophagus
Brain & ONSLiver & IBD
PancreasStomach
LeukemiasKidney & Renal PelvisOral Cavity & Pharynx
Non-Hodgkin LymphomaMelanomas of the Skin
Urinary BladderColon & Rectum
Lung & BronchusProstate
0 50 100 150 200 250 300
5.97.07.69.311.011.613.613.715.321.622.1
33.257.1
70.5154.7
StomachOral Cavity & PharynxKidney & Renal Pelvis
LeukemiasUrinary Bladder
PancreasThyroid
Cervix UteriMelanomas of the Skin
Non-Hodgkin LymphomaOvary
Corpus & Uterus, NOSColon & Rectum
Lung & BronchusBreast
0 50 100 150 200 250 300
6.16.37.08.08.28.69.610.113.914.916.222.4
42.948.8
135.1
TestisLiver & IBDEsophagus
Brain & ONSStomach
PancreasLeukemias
Kidney & Renal PelvisOral Cavity & Pharynx
Non-Hodgkin LymphomaMelanomas of the Skin
Urinary BladderColon & Rectum
Lung & BronchusProstate
0 50 100 150 200 250 300
6.17.27.28.310.411.113.914.415.622.224.4
35.756.8
70.3144.3
Brain & ONSOral Cavity & PharynxKidney & Renal Pelvis
LeukemiasPancreas
Urinary BladderThyroid
Cervix UteriMelanomas of the Skin
Non-Hodgkin LymphomaOvary
Corpus & Uterus, NOSColon & Rectum
Lung & BronchusBreast
0 50 100 150 200 250 300
5.76.27.48.28.68.99.810.315.215.417.123.5
42.351.4
141.5
Brain & ONSEsophagusLiver & IBD
LarynxMultiple Myeloma
LeukemiasPancreasStomach
Kidney & Renal PelvisOral Cavity & Pharynx
Non-Hodgkin LymphomaUrinary Bladder
Colon & RectumLung & Bronchus
Prostate
0 50 100 150 200 250 300
4.87.810.411.111.211.612.314.614.615.416.317.4
64.094.3
222.6
ThyroidOral Cavity & Pharynx
Urinary BladderLeukemias
Kidney & Renal PelvisMultiple Myeloma
Cervix UteriPancreasStomach
Non-Hodgkin LymphomaOvary
Corpus & Uterus, NOSLung & BronchusColon & Rectum
Breast
0 50 100 150 200 250 300
4.56.26.36.78.88.99.810.510.510.911.717.6
54.655.2
118.0
Rate‡ per 100,000Rate‡ per 100,000
Rate‡ per 100,000Rate‡ per 100,000
Rate‡ per 100,000Rate‡ per 100,000
Males FemalesAll Races
White
Black
∗ Data meet the following data quality criteria for all invasive cancer sites combined: case ascertainment is at least
90% complete; ≥ 97% of cases pass a standard set of computerized edits; ≤ 5% of cases were ascertained by death certificate
only; ≤ 3% of cases are missing information on sex; ≤ 5% of cases are missing information on race; ≤ 3% of cases are
missing information on age. See Appendix H for registry-specific data quality information.† Excludes basal and squamous cell carcinomas of the skin except when these occur on the skin of the genital organs, and in
situ cancers except urinary bladder.‡ Rates are age-adjusted to the 2000 U.S. standard population. See Table 2.1.1-2.25.2 for 95% confidence intervals for rates
and footnote regarding 1999 population denominators. Rates are suppressed and not ranked if case counts are fewer than 16 or
if the population of the specific race-sex category is less than 50,000.
Note: ONS - Other Nervous System; NOS - Not Otherwise Specified; IBD - Intrahepatic Bile Duct.
Urinary bladder cases include invasive and in situ.

United States Cancer Statistics: 1999 Incidence
114
Figure 3.4: Invasive Cancer Incidence Rates for the 15 Primary Sites with the HighestAge-Adjusted Incidence Rates within Race- and Sex-Specific Categories
Los Angeles,*† 1999
LarynxBrain & ONS
Multiple MyelomaLiver & IBD
PancreasKidney & Renal PelvisOral Cavity & Pharynx
LeukemiasStomach
Melanomas of the SkinNon-Hodgkin Lymphoma
Urinary BladderColon & Rectum
Lung & BronchusProstate
0 50 100 150 200 250 300
6.56.87.010.210.813.813.914.514.817.422.4
30.356.864.1
156.6
Oral Cavity & PharynxUrinary Bladder
LeukemiasStomach
Kidney & Renal PelvisPancreas
ThyroidMelanomas of the Skin
Cervix UteriNon-Hodgkin Lymphoma
OvaryCorpus & Uterus, NOS
Lung & BronchusColon & Rectum
Breast
0 50 100 150 200 250 300
5.97.37.47.47.88.110.411.012.714.415.622.0
41.542.2
125.5
LarynxMultiple Myeloma
Brain & ONSLiver & IBD
PancreasStomach
Oral Cavity & PharynxKidney & Renal Pelvis
LeukemiasMelanomas of the Skin
Non-Hodgkin LymphomaUrinary Bladder
Colon & RectumLung & Bronchus
Prostate
0 50 100 150 200 250 300
6.26.47.68.211.513.414.114.815.421.423.8
33.355.660.4
144.8
Oral Cavity & PharynxStomach
LeukemiasUrinary Bladder
Kidney & Renal PelvisPancreas
ThyroidMelanomas of the Skin
Cervix UteriNon-Hodgkin Lymphoma
OvaryCorpus & Uterus, NOS
Colon & RectumLung & Bronchus
Breast
0 50 100 150 200 250 300
5.76.27.78.08.38.311.213.813.915.616.723.7
40.942.8
132.0
Brain & ONSEsophagusLiver & IBD
LarynxPancreas
LeukemiasStomach
Kidney & Renal PelvisMultiple Myeloma
Non-Hodgkin LymphomaOral Cavity & Pharynx
Urinary BladderColon & Rectum
Lung & BronchusProstate
0 50 100 150 200 250 300
4.26.58.810.511.011.312.613.713.916.316.417.6
68.598.0
236.9
Brain & ONSLeukemias
Oral Cavity & PharynxUrinary Bladder
PancreasMultiple Myeloma
Non-Hodgkin LymphomaCervix Uteri
Kidney & Renal PelvisStomach
OvaryCorpus & Uterus, NOS
Lung & BronchusColon & Rectum
Breast
0 50 100 150 200 250 300
4.56.46.47.18.49.210.010.210.610.810.8
19.251.952.5
115.6
Rate‡ per 100,000Rate‡ per 100,000
Rate‡ per 100,000Rate‡ per 100,000
Rate‡ per 100,000Rate‡ per 100,000
Males FemalesAll Races
White
Black
∗ Data meet the following data quality criteria for all invasive cancer sites combined: case ascertainment is at least
90% complete; ≥ 97% of cases pass a standard set of computerized edits; ≤ 5% of cases were ascertained by death certificate
only; ≤ 3% of cases are missing information on sex; ≤ 5% of cases are missing information on race; ≤ 3% of cases are
missing information on age. See Appendix H for registry-specific data quality information.† Excludes basal and squamous cell carcinomas of the skin except when these occur on the skin of the genital organs, and in
situ cancers except urinary bladder.‡ Rates are age-adjusted to the 2000 U.S. standard population. See Table 2.1.1-2.25.2 for 95% confidence intervals for rates
and footnote regarding 1999 population denominators. Rates are suppressed and not ranked if case counts are fewer than 16 or
if the population of the specific race-sex category is less than 50,000.
Note: ONS - Other Nervous System; NOS - Not Otherwise Specified; IBD - Intrahepatic Bile Duct.
Urinary bladder cases include invasive and in situ.

State and Metropolitan Area Incidence Rates for Most Common Cancers
115
Figure 3.5: Invasive Cancer Incidence Rates for the 15 Primary Sites with the HighestAge-Adjusted Incidence Rates within Race- and Sex-Specific Categories
San Francisco-Oakland,*† 1999
LarynxEsophagus
Brain & ONSPancreas
Liver & IBDStomach
LeukemiasKidney & Renal PelvisOral Cavity & Pharynx
Melanomas of the SkinNon-Hodgkin Lymphoma
Urinary BladderColon & Rectum
Lung & BronchusProstate
0 50 100 150 200 250 300
7.27.88.210.712.312.312.913.516.319.025.830.2
60.068.9
162.1
Kidney & Renal PelvisCervix Uteri
Oral Cavity & PharynxLeukemias
StomachThyroid
PancreasUrinary Bladder
Melanomas of the SkinNon-Hodgkin Lymphoma
OvaryCorpus & Uterus, NOS
Colon & RectumLung & Bronchus
Breast
0 50 100 150 200 250 300
6.46.77.07.57.68.18.39.013.315.017.023.2
45.949.6
143.8
TestisEsophagusLiver & IBD
Brain & ONSStomach
PancreasLeukemias
Kidney & Renal PelvisOral Cavity & Pharynx
Melanomas of the SkinNon-Hodgkin Lymphoma
Urinary BladderColon & Rectum
Lung & BronchusProstate
0 50 100 150 200 250 300
7.98.18.79.310.010.112.515.116.4
24.927.434.4
60.263.8
154.6
Oral Cavity & PharynxBrain & ONS
Kidney & Renal PelvisCervix UteriLeukemias
PancreasThyroid
Urinary BladderNon-Hodgkin Lymphoma
Melanomas of the SkinOvary
Corpus & Uterus, NOSColon & Rectum
Lung & BronchusBreast
0 50 100 150 200 250 300
6.56.76.76.87.78.38.69.916.018.419.025.6
44.854.4
159.5
Multiple MyelomaKidney & Renal Pelvis
Liver & IBDLeukemias
LarynxOral Cavity & Pharynx
PancreasUrinary Bladder
Non-Hodgkin LymphomaStomach
Colon & RectumLung & Bronchus
Prostate
0 50 100 150 200 250 300
11.312.012.712.813.214.214.815.619.420.4
52.688.3
204.5
Kidney & Renal PelvisCervix Uteri
PancreasMultiple Myeloma
Non-Hodgkin LymphomaStomach
OvaryCorpus & Uterus, NOS
Colon & RectumLung & Bronchus
Breast
0 50 100 150 200 250 300
7.27.78.59.411.111.712.116.9
55.455.7
110.9
Rate‡ per 100,000Rate‡ per 100,000
Rate‡ per 100,000Rate‡ per 100,000
Rate‡ per 100,000Rate‡ per 100,000
Males FemalesAll Races
White
Black
∗ Data meet the following data quality criteria for all invasive cancer sites combined: case ascertainment is at least
90% complete; ≥ 97% of cases pass a standard set of computerized edits; ≤ 5% of cases were ascertained by death certificate
only; ≤ 3% of cases are missing information on sex; ≤ 5% of cases are missing information on race; ≤ 3% of cases are
missing information on age. See Appendix H for registry-specific data quality information.† Excludes basal and squamous cell carcinomas of the skin except when these occur on the skin of the genital organs, and in
situ cancers except urinary bladder.‡ Rates are age-adjusted to the 2000 U.S. standard population. See Table 2.1.1-2.25.2 for 95% confidence intervals for rates
and footnote regarding 1999 population denominators. Rates are suppressed and not ranked if case counts are fewer than 16 or
if the population of the specific race-sex category is less than 50,000.
Note: ONS - Other Nervous System; NOS - Not Otherwise Specified; IBD - Intrahepatic Bile Duct.
Urinary bladder cases include invasive and in situ.

United States Cancer Statistics: 1999 Incidence
116
Figure 3.6: Invasive Cancer Incidence Rates for the 15 Primary Sites with the HighestAge-Adjusted Incidence Rates within Race- and Sex-Specific Categories
San Jose-Monterey,*† 1999
TestisEsophagus
Brain & ONSKidney & Renal Pelvis
LeukemiasLiver & IBD
StomachPancreas
Oral Cavity & PharynxNon-Hodgkin Lymphoma
Melanomas of the SkinUrinary Bladder
Colon & RectumLung & Bronchus
Prostate
0 50 100 150 200 250 300
5.57.48.110.311.011.111.612.614.020.220.3
28.954.1
62.5166.1
Brain & ONSStomach
Urinary BladderKidney & Renal Pelvis
Cervix UteriPancreas
LeukemiasThyroid
Melanomas of the SkinNon-Hodgkin Lymphoma
OvaryCorpus & Uterus, NOS
Colon & RectumLung & Bronchus
Breast
0 50 100 150 200 250 300
5.96.97.47.47.68.69.110.114.516.417.322.6
38.444.5
137.1
TestisLiver & IBD
StomachEsophagus
Brain & ONSKidney & Renal Pelvis
PancreasLeukemias
Oral Cavity & PharynxNon-Hodgkin Lymphoma
Melanomas of the SkinUrinary Bladder
Colon & RectumLung & Bronchus
Prostate
0 50 100 150 200 250 300
6.67.28.48.78.711.111.711.813.619.820.5
31.354.4
62.2156.8
StomachBrain & ONSCervix Uteri
Kidney & Renal PelvisUrinary Bladder
PancreasThyroid
LeukemiasMelanomas of the Skin
Non-Hodgkin LymphomaOvary
Corpus & Uterus, NOSColon & Rectum
Lung & BronchusBreast
0 50 100 150 200 250 300
6.06.36.97.77.98.59.89.913.615.818.223.8
38.845.8
146.4
0 50 100 150 200 250 300
Incidence rates were notranked when the populationsize was less than 50,000.
0 50 100 150 200 250 300
Incidence rates were notranked when the populationsize was less than 50,000.
Rate‡ per 100,000Rate‡ per 100,000
Rate‡ per 100,000Rate‡ per 100,000
Rate‡ per 100,000Rate‡ per 100,000
Males FemalesAll Races
White
Black
∗ Data meet the following data quality criteria for all invasive cancer sites combined: case ascertainment is at least
90% complete; ≥ 97% of cases pass a standard set of computerized edits; ≤ 5% of cases were ascertained by death certificate
only; ≤ 3% of cases are missing information on sex; ≤ 5% of cases are missing information on race; ≤ 3% of cases are
missing information on age. See Appendix H for registry-specific data quality information.† Excludes basal and squamous cell carcinomas of the skin except when these occur on the skin of the genital organs, and in
situ cancers except urinary bladder.‡ Rates are age-adjusted to the 2000 U.S. standard population. See Table 2.1.1-2.25.2 for 95% confidence intervals for rates
and footnote regarding 1999 population denominators. Rates are suppressed and not ranked if case counts are fewer than 16 or
if the population of the specific race-sex category is less than 50,000.
Note: ONS - Other Nervous System; NOS - Not Otherwise Specified; IBD - Intrahepatic Bile Duct.
Urinary bladder cases include invasive and in situ.

State and Metropolitan Area Incidence Rates for Most Common Cancers
117
Figure 3.7: Invasive Cancer Incidence Rates for the 15 Primary Sites with the HighestAge-Adjusted Incidence Rates within Race- and Sex-Specific Categories
Colorado,*† 1999
Multiple MyelomaEsophagus
TestisStomach
Brain & ONSOral Cavity & Pharynx
PancreasKidney & Renal Pelvis
LeukemiasNon-Hodgkin Lymphoma
Melanomas of the SkinUrinary Bladder
Colon & RectumLung & Bronchus
Prostate
0 50 100 150 200 250 300
6.46.97.57.98.111.211.314.216.420.624.4
32.054.8
63.2166.7
Oral Cavity & PharynxBrain & ONSCervix Uteri
Kidney & Renal PelvisPancreas
Urinary BladderLeukemias
ThyroidOvary
Melanomas of the SkinNon-Hodgkin Lymphoma
Corpus & Uterus, NOSColon & Rectum
Lung & BronchusBreast
0 50 100 150 200 250 300
4.55.46.67.28.39.19.610.716.816.917.619.4
39.440.7
139.4
Multiple MyelomaEsophagus
StomachTestis
Brain & ONSPancreas
Oral Cavity & PharynxKidney & Renal Pelvis
LeukemiasNon-Hodgkin Lymphoma
Melanomas of the SkinUrinary Bladder
Colon & RectumLung & Bronchus
Prostate
0 50 100 150 200 250 300
6.36.97.67.68.211.211.414.116.820.925.731.7
54.863.5
167.4
Oral Cavity & PharynxBrain & ONSCervix Uteri
Kidney & Renal PelvisPancreas
Urinary BladderLeukemias
ThyroidOvary
Non-Hodgkin LymphomaMelanomas of the SkinCorpus & Uterus, NOS
Colon & RectumLung & Bronchus
Breast
0 50 100 150 200 250 300
4.35.46.57.28.39.49.810.617.217.818.019.7
39.040.9
140.9
Colon & RectumLung & Bronchus
Prostate
0 50 100 150 200 250 300
39.353.8
148.4
Colon & RectumLung & Bronchus
Breast
0 50 100 150 200 250 300
45.348.0
91.5
Rate‡ per 100,000Rate‡ per 100,000
Rate‡ per 100,000Rate‡ per 100,000
Rate‡ per 100,000Rate‡ per 100,000
Males FemalesAll Races
White
Black
∗ Data meet the following data quality criteria for all invasive cancer sites combined: case ascertainment is at least
90% complete; ≥ 97% of cases pass a standard set of computerized edits; ≤ 5% of cases were ascertained by death certificate
only; ≤ 3% of cases are missing information on sex; ≤ 5% of cases are missing information on race; ≤ 3% of cases are
missing information on age. See Appendix H for registry-specific data quality information.† Excludes basal and squamous cell carcinomas of the skin except when these occur on the skin of the genital organs, and in
situ cancers except urinary bladder.‡ Rates are age-adjusted to the 2000 U.S. standard population. See Table 2.1.1-2.25.2 for 95% confidence intervals for rates
and footnote regarding 1999 population denominators. Rates are suppressed and not ranked if case counts are fewer than 16 or
if the population of the specific race-sex category is less than 50,000.
Note: ONS - Other Nervous System; NOS - Not Otherwise Specified; IBD - Intrahepatic Bile Duct.
Urinary bladder cases include invasive and in situ.
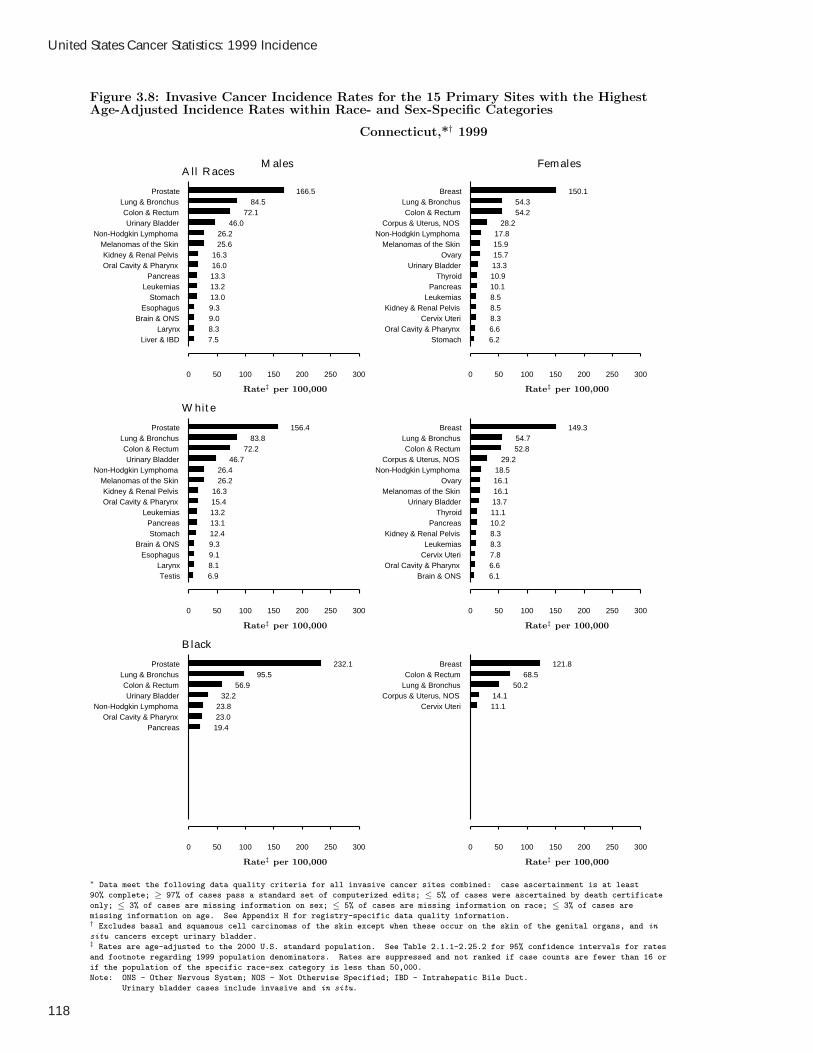
United States Cancer Statistics: 1999 Incidence
118
Figure 3.8: Invasive Cancer Incidence Rates for the 15 Primary Sites with the HighestAge-Adjusted Incidence Rates within Race- and Sex-Specific Categories
Connecticut,*† 1999
Liver & IBDLarynx
Brain & ONSEsophagus
StomachLeukemias
PancreasOral Cavity & PharynxKidney & Renal Pelvis
Melanomas of the SkinNon-Hodgkin Lymphoma
Urinary BladderColon & Rectum
Lung & BronchusProstate
0 50 100 150 200 250 300
7.58.39.09.313.013.213.316.016.3
25.626.2
46.072.1
84.5166.5
StomachOral Cavity & Pharynx
Cervix UteriKidney & Renal Pelvis
LeukemiasPancreas
ThyroidUrinary Bladder
OvaryMelanomas of the Skin
Non-Hodgkin LymphomaCorpus & Uterus, NOS
Colon & RectumLung & Bronchus
Breast
0 50 100 150 200 250 300
6.26.68.38.58.510.110.913.315.715.917.8
28.254.254.3
150.1
TestisLarynx
EsophagusBrain & ONS
StomachPancreas
LeukemiasOral Cavity & PharynxKidney & Renal Pelvis
Melanomas of the SkinNon-Hodgkin Lymphoma
Urinary BladderColon & Rectum
Lung & BronchusProstate
0 50 100 150 200 250 300
6.98.19.19.312.413.113.215.416.3
26.226.4
46.772.2
83.8156.4
Brain & ONSOral Cavity & Pharynx
Cervix UteriLeukemias
Kidney & Renal PelvisPancreas
ThyroidUrinary Bladder
Melanomas of the SkinOvary
Non-Hodgkin LymphomaCorpus & Uterus, NOS
Colon & RectumLung & Bronchus
Breast
0 50 100 150 200 250 300
6.16.67.88.38.310.211.113.716.116.118.5
29.252.854.7
149.3
PancreasOral Cavity & Pharynx
Non-Hodgkin LymphomaUrinary Bladder
Colon & RectumLung & Bronchus
Prostate
0 50 100 150 200 250 300
19.423.023.8
32.256.9
95.5232.1
Cervix UteriCorpus & Uterus, NOS
Lung & BronchusColon & Rectum
Breast
0 50 100 150 200 250 300
11.114.1
50.268.5
121.8
Rate‡ per 100,000Rate‡ per 100,000
Rate‡ per 100,000Rate‡ per 100,000
Rate‡ per 100,000Rate‡ per 100,000
Males FemalesAll Races
White
Black
∗ Data meet the following data quality criteria for all invasive cancer sites combined: case ascertainment is at least
90% complete; ≥ 97% of cases pass a standard set of computerized edits; ≤ 5% of cases were ascertained by death certificate
only; ≤ 3% of cases are missing information on sex; ≤ 5% of cases are missing information on race; ≤ 3% of cases are
missing information on age. See Appendix H for registry-specific data quality information.† Excludes basal and squamous cell carcinomas of the skin except when these occur on the skin of the genital organs, and in
situ cancers except urinary bladder.‡ Rates are age-adjusted to the 2000 U.S. standard population. See Table 2.1.1-2.25.2 for 95% confidence intervals for rates
and footnote regarding 1999 population denominators. Rates are suppressed and not ranked if case counts are fewer than 16 or
if the population of the specific race-sex category is less than 50,000.
Note: ONS - Other Nervous System; NOS - Not Otherwise Specified; IBD - Intrahepatic Bile Duct.
Urinary bladder cases include invasive and in situ.

State and Metropolitan Area Incidence Rates for Most Common Cancers
119
Figure 3.9: Invasive Cancer Incidence Rates for the 15 Primary Sites with the HighestAge-Adjusted Incidence Rates within Race- and Sex-Specific Categories
Delaware,*† 1999
Multiple MyelomaBrain & ONS
EsophagusStomach
LarynxPancreas
LeukemiasKidney & Renal Pelvis
Melanomas of the SkinNon-Hodgkin Lymphoma
Oral Cavity & PharynxUrinary Bladder
Colon & RectumLung & Bronchus
Prostate
0 50 100 150 200 250 300
6.57.07.910.010.512.612.915.316.016.517.5
33.966.4
109.9163.3
StomachBrain & ONSCervix UteriLeukemias
Melanomas of the SkinKidney & Renal Pelvis
PancreasThyroid
Non-Hodgkin LymphomaUrinary Bladder
OvaryCorpus & Uterus, NOS
Colon & RectumLung & Bronchus
Breast
0 50 100 150 200 250 300
6.56.77.98.010.711.312.113.213.213.215.5
27.154.4
65.8138.0
TestisBrain & ONS
EsophagusStomach
LarynxPancreas
LeukemiasKidney & Renal PelvisOral Cavity & Pharynx
Melanomas of the SkinNon-Hodgkin Lymphoma
Urinary BladderColon & Rectum
Lung & BronchusProstate
0 50 100 150 200 250 300
5.37.67.98.610.112.413.815.416.118.118.3
34.662.5
107.8149.7
Oral Cavity & PharynxBrain & ONS
LeukemiasCervix Uteri
Kidney & Renal PelvisMelanomas of the Skin
Non-Hodgkin LymphomaPancreas
Urinary BladderThyroid
OvaryCorpus & Uterus, NOS
Colon & RectumLung & Bronchus
Breast
0 50 100 150 200 250 300
6.57.07.87.911.412.212.312.413.213.517.0
29.451.6
66.0137.9
Colon & RectumLung & Bronchus
Prostate
0 50 100 150 200 250 300
96.4130.9
243.4
Lung & BronchusColon & Rectum
Breast
0 50 100 150 200 250 300
65.479.9
127.8
Rate‡ per 100,000Rate‡ per 100,000
Rate‡ per 100,000Rate‡ per 100,000
Rate‡ per 100,000Rate‡ per 100,000
Males FemalesAll Races
White
Black
∗ Data meet the following data quality criteria for all invasive cancer sites combined: case ascertainment is at least
90% complete; ≥ 97% of cases pass a standard set of computerized edits; ≤ 5% of cases were ascertained by death certificate
only; ≤ 3% of cases are missing information on sex; ≤ 5% of cases are missing information on race; ≤ 3% of cases are
missing information on age. See Appendix H for registry-specific data quality information.† Excludes basal and squamous cell carcinomas of the skin except when these occur on the skin of the genital organs, and in
situ cancers except urinary bladder.‡ Rates are age-adjusted to the 2000 U.S. standard population. See Table 2.1.1-2.25.2 for 95% confidence intervals for rates
and footnote regarding 1999 population denominators. Rates are suppressed and not ranked if case counts are fewer than 16 or
if the population of the specific race-sex category is less than 50,000.
Note: ONS - Other Nervous System; NOS - Not Otherwise Specified; IBD - Intrahepatic Bile Duct.
Urinary bladder cases include invasive and in situ.

United States Cancer Statistics: 1999 Incidence
120
Figure 3.10: Invasive Cancer Incidence Rates for the 15 Primary Sites with the HighestAge-Adjusted Incidence Rates within Race- and Sex-Specific Categories
District of Columbia,*† 1999
Brain & ONSMelanomas of the Skin
LeukemiasLiver & IBDEsophagus
LarynxKidney & Renal Pelvis
StomachPancreas
Non-Hodgkin LymphomaUrinary Bladder
Oral Cavity & PharynxColon & Rectum
Lung & BronchusProstate
0 50 100 150 200 250 300
10.610.811.111.913.814.214.815.717.219.919.924.5
66.1111.4
234.7
Melanomas of the SkinLiver & IBD
Multiple MyelomaOral Cavity & Pharynx
OvaryNon-Hodgkin Lymphoma
PancreasStomach
Urinary BladderCervix Uteri
ThyroidCorpus & Uterus, NOS
Lung & BronchusColon & Rectum
Breast
0 50 100 150 200 250 300
5.96.06.46.410.010.010.710.711.713.514.817.2
50.855.3
138.0
Melanomas of the SkinNon-Hodgkin Lymphoma
Colon & RectumLung & Bronchus
Prostate
0 50 100 150 200 250 300
19.821.1
50.763.7
144.0
Corpus & Uterus, NOSColon & Rectum
Lung & BronchusBreast
0 50 100 150 200 250 300
24.834.339.6
162.8
LeukemiasLiver & IBD
Kidney & Renal PelvisStomach
LarynxUrinary Bladder
Non-Hodgkin LymphomaPancreas
EsophagusOral Cavity & Pharynx
Colon & RectumLung & Bronchus
Prostate
0 50 100 150 200 250 300
11.914.717.317.317.518.718.919.320.7
29.175.6
134.6275.0
Multiple MyelomaOvary
Non-Hodgkin LymphomaLiver & IBD
Urinary BladderStomach
PancreasCorpus & Uterus, NOS
ThyroidCervix Uteri
Lung & BronchusColon & Rectum
Breast
0 50 100 150 200 250 300
7.47.57.58.510.610.912.213.214.715.3
55.466.1
126.3
Rate‡ per 100,000Rate‡ per 100,000
Rate‡ per 100,000Rate‡ per 100,000
Rate‡ per 100,000Rate‡ per 100,000
Males FemalesAll Races
White
Black
∗ Data meet the following data quality criteria for all invasive cancer sites combined: case ascertainment is at least
90% complete; ≥ 97% of cases pass a standard set of computerized edits; ≤ 5% of cases were ascertained by death certificate
only; ≤ 3% of cases are missing information on sex; ≤ 5% of cases are missing information on race; ≤ 3% of cases are
missing information on age. See Appendix H for registry-specific data quality information.† Excludes basal and squamous cell carcinomas of the skin except when these occur on the skin of the genital organs, and in
situ cancers except urinary bladder.‡ Rates are age-adjusted to the 2000 U.S. standard population. See Table 2.1.1-2.25.2 for 95% confidence intervals for rates
and footnote regarding 1999 population denominators. Rates are suppressed and not ranked if case counts are fewer than 16 or
if the population of the specific race-sex category is less than 50,000.
Note: ONS - Other Nervous System; NOS - Not Otherwise Specified; IBD - Intrahepatic Bile Duct.
Urinary bladder cases include invasive and in situ.

State and Metropolitan Area Incidence Rates for Most Common Cancers
121
Figure 3.11: Invasive Cancer Incidence Rates for the 15 Primary Sites with the HighestAge-Adjusted Incidence Rates within Race- and Sex-Specific Categories
Florida,*† 1999
Liver & IBDBrain & ONS
EsophagusLarynx
StomachPancreas
LeukemiasKidney & Renal PelvisOral Cavity & Pharynx
Melanomas of the SkinNon-Hodgkin Lymphoma
Urinary BladderColon & Rectum
Lung & BronchusProstate
0 50 100 150 200 250 300
7.17.99.910.010.813.115.016.420.021.922.6
41.472.9
101.8155.5
Brain & ONSOral Cavity & PharynxKidney & Renal Pelvis
ThyroidLeukemias
PancreasUrinary Bladder
Cervix UteriMelanomas of the Skin
Non-Hodgkin LymphomaOvary
Corpus & Uterus, NOSColon & Rectum
Lung & BronchusBreast
0 50 100 150 200 250 300
5.87.98.18.89.410.211.111.512.315.317.723.1
53.062.9
132.9
Liver & IBDBrain & ONS
EsophagusLarynx
StomachPancreas
LeukemiasKidney & Renal PelvisOral Cavity & Pharynx
Non-Hodgkin LymphomaMelanomas of the Skin
Urinary BladderColon & Rectum
Lung & BronchusProstate
0 50 100 150 200 250 300
6.68.39.59.810.012.915.316.619.722.723.2
43.472.1
101.3148.9
Brain & ONSOral Cavity & PharynxKidney & Renal Pelvis
ThyroidLeukemias
PancreasCervix Uteri
Urinary BladderMelanomas of the Skin
Non-Hodgkin LymphomaOvary
Corpus & Uterus, NOSColon & Rectum
Lung & BronchusBreast
0 50 100 150 200 250 300
6.08.08.29.49.410.010.911.513.515.618.623.4
52.165.5
136.5
Brain & ONSLiver & IBDLeukemias
Multiple MyelomaLarynx
Urinary BladderKidney & Renal Pelvis
EsophagusNon-Hodgkin Lymphoma
PancreasStomach
Oral Cavity & PharynxColon & Rectum
Lung & BronchusProstate
0 50 100 150 200 250 300
4.69.710.311.811.912.613.213.316.216.419.320.3
77.8110.4
228.5
Oral Cavity & PharynxThyroid
Multiple MyelomaKidney & Renal Pelvis
Urinary BladderNon-Hodgkin Lymphoma
LeukemiasStomach
OvaryPancreas
Cervix UteriCorpus & Uterus, NOS
Lung & BronchusColon & Rectum
Breast
0 50 100 150 200 250 300
6.06.16.56.77.99.510.110.711.912.517.823.6
39.158.1
100.3
Rate‡ per 100,000Rate‡ per 100,000
Rate‡ per 100,000Rate‡ per 100,000
Rate‡ per 100,000Rate‡ per 100,000
Males FemalesAll Races
White
Black
∗ Data meet the following data quality criteria for all invasive cancer sites combined: case ascertainment is at least
90% complete; ≥ 97% of cases pass a standard set of computerized edits; ≤ 5% of cases were ascertained by death certificate
only; ≤ 3% of cases are missing information on sex; ≤ 5% of cases are missing information on race; ≤ 3% of cases are
missing information on age. See Appendix H for registry-specific data quality information.† Excludes basal and squamous cell carcinomas of the skin except when these occur on the skin of the genital organs, and in
situ cancers except urinary bladder.‡ Rates are age-adjusted to the 2000 U.S. standard population. See Table 2.1.1-2.25.2 for 95% confidence intervals for rates
and footnote regarding 1999 population denominators. Rates are suppressed and not ranked if case counts are fewer than 16 or
if the population of the specific race-sex category is less than 50,000.
Note: ONS - Other Nervous System; NOS - Not Otherwise Specified; IBD - Intrahepatic Bile Duct.
Urinary bladder cases include invasive and in situ.
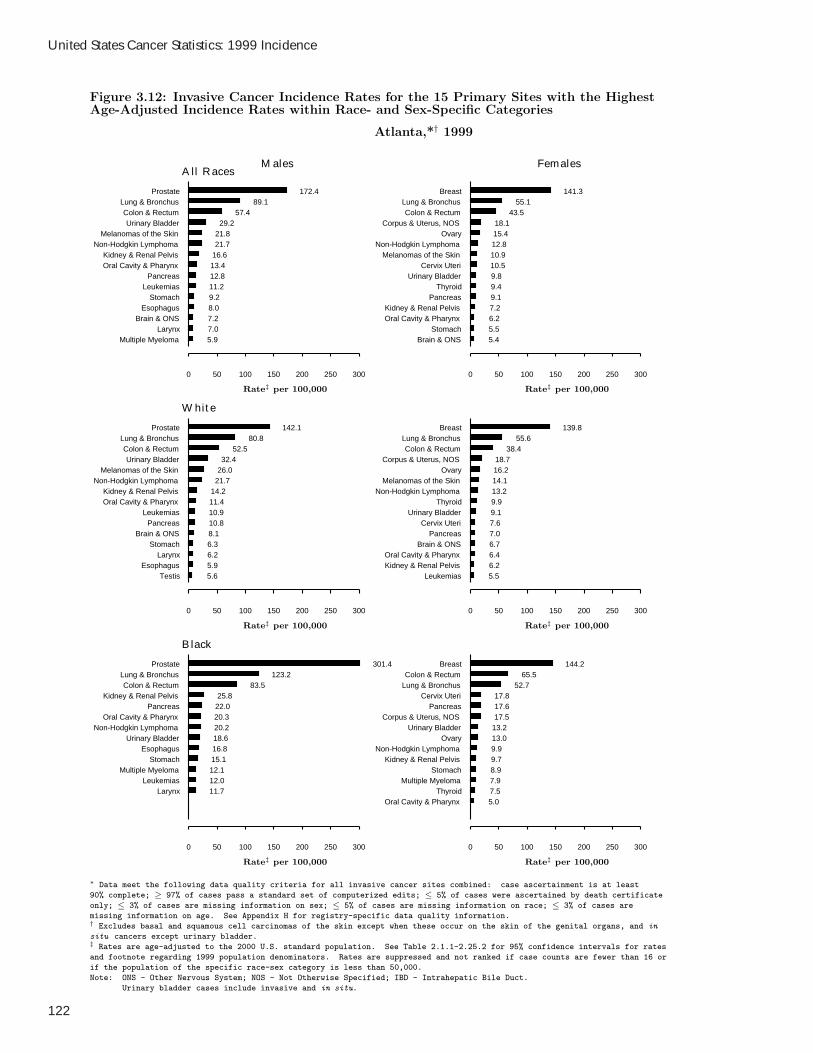
United States Cancer Statistics: 1999 Incidence
122
Figure 3.12: Invasive Cancer Incidence Rates for the 15 Primary Sites with the HighestAge-Adjusted Incidence Rates within Race- and Sex-Specific Categories
Atlanta,*† 1999
Multiple MyelomaLarynx
Brain & ONSEsophagus
StomachLeukemias
PancreasOral Cavity & PharynxKidney & Renal Pelvis
Non-Hodgkin LymphomaMelanomas of the Skin
Urinary BladderColon & Rectum
Lung & BronchusProstate
0 50 100 150 200 250 300
5.97.07.28.09.211.212.813.416.621.721.829.2
57.489.1
172.4
Brain & ONSStomach
Oral Cavity & PharynxKidney & Renal Pelvis
PancreasThyroid
Urinary BladderCervix Uteri
Melanomas of the SkinNon-Hodgkin Lymphoma
OvaryCorpus & Uterus, NOS
Colon & RectumLung & Bronchus
Breast
0 50 100 150 200 250 300
5.45.56.27.29.19.49.810.510.912.815.418.1
43.555.1
141.3
TestisEsophagus
LarynxStomach
Brain & ONSPancreas
LeukemiasOral Cavity & PharynxKidney & Renal Pelvis
Non-Hodgkin LymphomaMelanomas of the Skin
Urinary BladderColon & Rectum
Lung & BronchusProstate
0 50 100 150 200 250 300
5.65.96.26.38.110.810.911.414.221.726.032.4
52.580.8
142.1
LeukemiasKidney & Renal PelvisOral Cavity & Pharynx
Brain & ONSPancreas
Cervix UteriUrinary Bladder
ThyroidNon-Hodgkin Lymphoma
Melanomas of the SkinOvary
Corpus & Uterus, NOSColon & Rectum
Lung & BronchusBreast
0 50 100 150 200 250 300
5.56.26.46.77.07.69.19.913.214.116.218.7
38.455.6
139.8
LarynxLeukemias
Multiple MyelomaStomach
EsophagusUrinary Bladder
Non-Hodgkin LymphomaOral Cavity & Pharynx
PancreasKidney & Renal Pelvis
Colon & RectumLung & Bronchus
Prostate
0 50 100 150 200 250 300
11.712.012.115.116.818.620.220.322.025.8
83.5123.2
301.4
Oral Cavity & PharynxThyroid
Multiple MyelomaStomach
Kidney & Renal PelvisNon-Hodgkin Lymphoma
OvaryUrinary Bladder
Corpus & Uterus, NOSPancreas
Cervix UteriLung & BronchusColon & Rectum
Breast
0 50 100 150 200 250 300
5.07.57.98.99.79.913.013.217.517.617.8
52.765.5
144.2
Rate‡ per 100,000Rate‡ per 100,000
Rate‡ per 100,000Rate‡ per 100,000
Rate‡ per 100,000Rate‡ per 100,000
Males FemalesAll Races
White
Black
∗ Data meet the following data quality criteria for all invasive cancer sites combined: case ascertainment is at least
90% complete; ≥ 97% of cases pass a standard set of computerized edits; ≤ 5% of cases were ascertained by death certificate
only; ≤ 3% of cases are missing information on sex; ≤ 5% of cases are missing information on race; ≤ 3% of cases are
missing information on age. See Appendix H for registry-specific data quality information.† Excludes basal and squamous cell carcinomas of the skin except when these occur on the skin of the genital organs, and in
situ cancers except urinary bladder.‡ Rates are age-adjusted to the 2000 U.S. standard population. See Table 2.1.1-2.25.2 for 95% confidence intervals for rates
and footnote regarding 1999 population denominators. Rates are suppressed and not ranked if case counts are fewer than 16 or
if the population of the specific race-sex category is less than 50,000.
Note: ONS - Other Nervous System; NOS - Not Otherwise Specified; IBD - Intrahepatic Bile Duct.
Urinary bladder cases include invasive and in situ.

State and Metropolitan Area Incidence Rates for Most Common Cancers
123
Figure 3.13: Invasive Cancer Incidence Rates for the 15 Primary Sites with the HighestAge-Adjusted Incidence Rates within Race- and Sex-Specific Categories
Hawaii,*† 1999
LarynxThyroid
EsophagusPancreas
Liver & IBDLeukemias
Kidney & Renal PelvisOral Cavity & Pharynx
Melanomas of the SkinNon-Hodgkin Lymphoma
Urinary BladderStomach
Colon & RectumLung & Bronchus
Prostate
0 50 100 150 200 250 300
5.96.37.310.812.013.413.513.719.620.220.921.0
61.869.1
135.5
Kidney & Renal PelvisUrinary Bladder
LeukemiasOral Cavity & Pharynx
Cervix UteriMelanomas of the Skin
StomachPancreas
ThyroidNon-Hodgkin Lymphoma
OvaryCorpus & Uterus, NOS
Lung & BronchusColon & Rectum
Breast
0 50 100 150 200 250 300
5.35.48.28.89.69.711.311.612.012.214.4
27.039.5
48.0134.0
PancreasStomach
LarynxOral Cavity & Pharynx
LeukemiasKidney & Renal Pelvis
Non-Hodgkin LymphomaUrinary Bladder
Melanomas of the SkinColon & Rectum
Lung & BronchusProstate
0 50 100 150 200 250 300
13.513.914.316.819.219.421.9
40.255.259.3
90.5183.8
Cervix UteriOral Cavity & Pharynx
Non-Hodgkin LymphomaOvary
Melanomas of the SkinCorpus & Uterus, NOS
Colon & RectumLung & Bronchus
Breast
0 50 100 150 200 250 300
11.412.712.916.4
26.929.6
43.556.6
155.5
0 50 100 150 200 250 300
Incidence rates were notranked when the populationsize was less than 50,000.
0 50 100 150 200 250 300
Incidence rates were notranked when the populationsize was less than 50,000.
Rate‡ per 100,000Rate‡ per 100,000
Rate‡ per 100,000Rate‡ per 100,000
Rate‡ per 100,000Rate‡ per 100,000
Males FemalesAll Races
White
Black
∗ Data meet the following data quality criteria for all invasive cancer sites combined: case ascertainment is at least
90% complete; ≥ 97% of cases pass a standard set of computerized edits; ≤ 5% of cases were ascertained by death certificate
only; ≤ 3% of cases are missing information on sex; ≤ 5% of cases are missing information on race; ≤ 3% of cases are
missing information on age. See Appendix H for registry-specific data quality information.† Excludes basal and squamous cell carcinomas of the skin except when these occur on the skin of the genital organs, and in
situ cancers except urinary bladder.‡ Rates are age-adjusted to the 2000 U.S. standard population. See Table 2.1.1-2.25.2 for 95% confidence intervals for rates
and footnote regarding 1999 population denominators. Rates are suppressed and not ranked if case counts are fewer than 16 or
if the population of the specific race-sex category is less than 50,000.
Note: ONS - Other Nervous System; NOS - Not Otherwise Specified; IBD - Intrahepatic Bile Duct.
Urinary bladder cases include invasive and in situ.

United States Cancer Statistics: 1999 Incidence
124
Figure 3.14: Invasive Cancer Incidence Rates for the 15 Primary Sites with the HighestAge-Adjusted Incidence Rates within Race- and Sex-Specific Categories
Idaho,*† 1999
TestisMultiple Myeloma
StomachLarynx
PancreasBrain & ONS
Kidney & Renal PelvisOral Cavity & Pharynx
LeukemiasNon-Hodgkin Lymphoma
Melanomas of the SkinUrinary Bladder
Colon & RectumLung & Bronchus
Prostate
0 50 100 150 200 250 300
6.37.47.67.69.411.211.814.516.718.824.0
35.552.2
69.0157.4
Oral Cavity & PharynxBrain & ONSCervix Uteri
Urinary BladderThyroid
LeukemiasKidney & Renal Pelvis
PancreasMelanomas of the Skin
OvaryNon-Hodgkin Lymphoma
Corpus & Uterus, NOSColon & Rectum
Lung & BronchusBreast
0 50 100 150 200 250 300
5.26.06.27.28.58.911.312.715.816.017.825.1
38.742.0
131.4
TestisStomach
Multiple MyelomaLarynx
PancreasBrain & ONS
Kidney & Renal PelvisOral Cavity & Pharynx
LeukemiasNon-Hodgkin Lymphoma
Melanomas of the SkinUrinary Bladder
Colon & RectumLung & Bronchus
Prostate
0 50 100 150 200 250 300
6.47.37.37.79.611.511.814.517.018.724.5
35.352.3
69.5158.6
Oral Cavity & PharynxBrain & ONSCervix Uteri
Urinary BladderThyroid
LeukemiasKidney & Renal Pelvis
PancreasMelanomas of the Skin
OvaryNon-Hodgkin Lymphoma
Corpus & Uterus, NOSColon & Rectum
Lung & BronchusBreast
0 50 100 150 200 250 300
5.36.26.47.38.49.011.412.916.316.317.2
25.638.742.2
132.3
0 50 100 150 200 250 300
Incidence rates were notranked when the populationsize was less than 50,000.
0 50 100 150 200 250 300
Incidence rates were notranked when the populationsize was less than 50,000.
Rate‡ per 100,000Rate‡ per 100,000
Rate‡ per 100,000Rate‡ per 100,000
Rate‡ per 100,000Rate‡ per 100,000
Males FemalesAll Races
White
Black
∗ Data meet the following data quality criteria for all invasive cancer sites combined: case ascertainment is at least
90% complete; ≥ 97% of cases pass a standard set of computerized edits; ≤ 5% of cases were ascertained by death certificate
only; ≤ 3% of cases are missing information on sex; ≤ 5% of cases are missing information on race; ≤ 3% of cases are
missing information on age. See Appendix H for registry-specific data quality information.† Excludes basal and squamous cell carcinomas of the skin except when these occur on the skin of the genital organs, and in
situ cancers except urinary bladder.‡ Rates are age-adjusted to the 2000 U.S. standard population. See Table 2.1.1-2.25.2 for 95% confidence intervals for rates
and footnote regarding 1999 population denominators. Rates are suppressed and not ranked if case counts are fewer than 16 or
if the population of the specific race-sex category is less than 50,000.
Note: ONS - Other Nervous System; NOS - Not Otherwise Specified; IBD - Intrahepatic Bile Duct.
Urinary bladder cases include invasive and in situ.

State and Metropolitan Area Incidence Rates for Most Common Cancers
125
Figure 3.15: Invasive Cancer Incidence Rates for the 15 Primary Sites with the HighestAge-Adjusted Incidence Rates within Race- and Sex-Specific Categories
Illinois,*† 1999
Liver & IBDBrain & ONS
LarynxEsophagus
StomachPancreas
Melanomas of the SkinLeukemias
Oral Cavity & PharynxKidney & Renal Pelvis
Non-Hodgkin LymphomaUrinary Bladder
Colon & RectumLung & Bronchus
Prostate
0 50 100 150 200 250 300
7.47.69.110.111.113.214.915.316.016.423.3
37.871.3
95.8155.2
Brain & ONSOral Cavity & Pharynx
Melanomas of the SkinKidney & Renal Pelvis
LeukemiasPancreas
ThyroidUrinary Bladder
Cervix UteriNon-Hodgkin Lymphoma
OvaryCorpus & Uterus, NOS
Colon & RectumLung & Bronchus
Breast
0 50 100 150 200 250 300
5.46.58.79.19.210.110.110.210.715.916.3
24.250.454.8
136.6
Liver & IBDBrain & ONS
LarynxEsophagus
StomachPancreas
Oral Cavity & PharynxLeukemias
Kidney & Renal PelvisMelanomas of the Skin
Non-Hodgkin LymphomaUrinary Bladder
Colon & RectumLung & Bronchus
Prostate
0 50 100 150 200 250 300
6.37.98.39.410.112.715.215.816.216.323.9
39.170.6
92.4143.7
Brain & ONSOral Cavity & Pharynx
Cervix UteriLeukemias
Kidney & Renal PelvisPancreas
Melanomas of the SkinUrinary Bladder
ThyroidNon-Hodgkin Lymphoma
OvaryCorpus & Uterus, NOS
Colon & RectumLung & Bronchus
Breast
0 50 100 150 200 250 300
5.76.39.49.49.49.69.910.410.916.717.2
25.148.954.0
137.0
Brain & ONSLeukemias
Multiple MyelomaLiver & IBD
LarynxNon-Hodgkin Lymphoma
StomachEsophagus
PancreasKidney & Renal Pelvis
Urinary BladderOral Cavity & Pharynx
Colon & RectumLung & Bronchus
Prostate
0 50 100 150 200 250 300
4.99.210.512.514.714.916.116.216.616.918.821.5
72.7126.3
206.1
Liver & IBDOral Cavity & Pharynx
LeukemiasStomach
Non-Hodgkin LymphomaKidney & Renal Pelvis
Urinary BladderOvary
Multiple MyelomaPancreas
Corpus & Uterus, NOSCervix Uteri
Colon & RectumLung & Bronchus
Breast
0 50 100 150 200 250 300
4.66.88.18.48.78.79.310.911.713.517.118.4
57.262.0
122.2
Rate‡ per 100,000Rate‡ per 100,000
Rate‡ per 100,000Rate‡ per 100,000
Rate‡ per 100,000Rate‡ per 100,000
Males FemalesAll Races
White
Black
∗ Data meet the following data quality criteria for all invasive cancer sites combined: case ascertainment is at least
90% complete; ≥ 97% of cases pass a standard set of computerized edits; ≤ 5% of cases were ascertained by death certificate
only; ≤ 3% of cases are missing information on sex; ≤ 5% of cases are missing information on race; ≤ 3% of cases are
missing information on age. See Appendix H for registry-specific data quality information.† Excludes basal and squamous cell carcinomas of the skin except when these occur on the skin of the genital organs, and in
situ cancers except urinary bladder.‡ Rates are age-adjusted to the 2000 U.S. standard population. See Table 2.1.1-2.25.2 for 95% confidence intervals for rates
and footnote regarding 1999 population denominators. Rates are suppressed and not ranked if case counts are fewer than 16 or
if the population of the specific race-sex category is less than 50,000.
Note: ONS - Other Nervous System; NOS - Not Otherwise Specified; IBD - Intrahepatic Bile Duct.
Urinary bladder cases include invasive and in situ.

United States Cancer Statistics: 1999 Incidence
126
Figure 3.16: Invasive Cancer Incidence Rates for the 15 Primary Sites with the HighestAge-Adjusted Incidence Rates within Race- and Sex-Specific Categories
Iowa,*† 1999
TestisBrain & ONS
LarynxEsophagus
StomachPancreas
Oral Cavity & PharynxKidney & Renal Pelvis
LeukemiasMelanomas of the Skin
Non-Hodgkin LymphomaUrinary Bladder
Colon & RectumLung & Bronchus
Prostate
0 50 100 150 200 250 300
6.07.98.08.69.210.716.717.418.120.121.8
38.676.6
88.0154.4
Oral Cavity & PharynxBrain & ONS
PancreasUrinary Bladder
Kidney & Renal PelvisLeukemias
ThyroidCervix Uteri
Melanomas of the SkinNon-Hodgkin Lymphoma
OvaryCorpus & Uterus, NOS
Lung & BronchusColon & Rectum
Breast
0 50 100 150 200 250 300
5.05.07.78.48.89.09.710.214.216.117.4
28.646.2
55.0132.3
TestisLarynx
Brain & ONSEsophagus
StomachPancreas
Oral Cavity & PharynxKidney & Renal Pelvis
LeukemiasMelanomas of the Skin
Non-Hodgkin LymphomaUrinary Bladder
Colon & RectumLung & Bronchus
Prostate
0 50 100 150 200 250 300
5.88.08.08.39.210.416.617.317.918.921.7
38.276.8
87.6148.2
Oral Cavity & PharynxBrain & ONS
PancreasUrinary Bladder
Kidney & Renal PelvisLeukemias
Cervix UteriThyroid
Melanomas of the SkinNon-Hodgkin Lymphoma
OvaryCorpus & Uterus, NOS
Lung & BronchusColon & Rectum
Breast
0 50 100 150 200 250 300
5.05.17.48.28.78.89.59.613.416.017.0
28.646.1
55.1132.8
0 50 100 150 200 250 300
Incidence rates were notranked when the populationsize was less than 50,000.
0 50 100 150 200 250 300
Incidence rates were notranked when the populationsize was less than 50,000.
Rate‡ per 100,000Rate‡ per 100,000
Rate‡ per 100,000Rate‡ per 100,000
Rate‡ per 100,000Rate‡ per 100,000
Males FemalesAll Races
White
Black
∗ Data meet the following data quality criteria for all invasive cancer sites combined: case ascertainment is at least
90% complete; ≥ 97% of cases pass a standard set of computerized edits; ≤ 5% of cases were ascertained by death certificate
only; ≤ 3% of cases are missing information on sex; ≤ 5% of cases are missing information on race; ≤ 3% of cases are
missing information on age. See Appendix H for registry-specific data quality information.† Excludes basal and squamous cell carcinomas of the skin except when these occur on the skin of the genital organs, and in
situ cancers except urinary bladder.‡ Rates are age-adjusted to the 2000 U.S. standard population. See Table 2.1.1-2.25.2 for 95% confidence intervals for rates
and footnote regarding 1999 population denominators. Rates are suppressed and not ranked if case counts are fewer than 16 or
if the population of the specific race-sex category is less than 50,000.
Note: ONS - Other Nervous System; NOS - Not Otherwise Specified; IBD - Intrahepatic Bile Duct.
Urinary bladder cases include invasive and in situ.

State and Metropolitan Area Incidence Rates for Most Common Cancers
127
Figure 3.17: Invasive Cancer Incidence Rates for the 15 Primary Sites with the HighestAge-Adjusted Incidence Rates within Race- and Sex-Specific Categories
Kansas,*† 1999
TestisBrain & ONS
EsophagusLarynx
StomachPancreas
LeukemiasKidney & Renal PelvisOral Cavity & Pharynx
Non-Hodgkin LymphomaMelanomas of the Skin
Urinary BladderColon & Rectum
Lung & BronchusProstate
0 50 100 150 200 250 300
6.36.86.97.29.613.415.215.516.421.221.8
34.767.2
91.9169.4
Brain & ONSOral Cavity & Pharynx
LeukemiasPancreas
Kidney & Renal PelvisCervix Uteri
Urinary BladderThyroid
Melanomas of the SkinOvary
Non-Hodgkin LymphomaCorpus & Uterus, NOS
Colon & RectumLung & Bronchus
Breast
0 50 100 150 200 250 300
5.35.48.38.88.99.310.210.512.415.216.1
26.248.052.8
135.8
EsophagusTestis
LarynxBrain & ONS
StomachPancreas
LeukemiasKidney & Renal PelvisOral Cavity & Pharynx
Melanomas of the SkinNon-Hodgkin Lymphoma
Urinary BladderColon & Rectum
Lung & BronchusProstate
0 50 100 150 200 250 300
6.46.86.86.99.012.914.915.515.520.320.8
34.365.9
90.4159.5
Oral Cavity & PharynxBrain & ONS
LeukemiasKidney & Renal Pelvis
PancreasCervix Uteri
Urinary BladderThyroid
Melanomas of the SkinOvary
Non-Hodgkin LymphomaCorpus & Uterus, NOS
Colon & RectumLung & Bronchus
Breast
0 50 100 150 200 250 300
5.35.68.18.68.78.89.810.511.215.415.8
26.346.953.3
134.6
Colon & RectumLung & Bronchus
Prostate
0 50 100 150 200 250 300
85.3131.4
264.7
Lung & BronchusColon & Rectum
Breast
0 50 100 150 200 250 300
48.158.6
110.9
Rate‡ per 100,000Rate‡ per 100,000
Rate‡ per 100,000Rate‡ per 100,000
Rate‡ per 100,000Rate‡ per 100,000
Males FemalesAll Races
White
Black
∗ Data meet the following data quality criteria for all invasive cancer sites combined: case ascertainment is at least
90% complete; ≥ 97% of cases pass a standard set of computerized edits; ≤ 5% of cases were ascertained by death certificate
only; ≤ 3% of cases are missing information on sex; ≤ 5% of cases are missing information on race; ≤ 3% of cases are
missing information on age. See Appendix H for registry-specific data quality information.† Excludes basal and squamous cell carcinomas of the skin except when these occur on the skin of the genital organs, and in
situ cancers except urinary bladder.‡ Rates are age-adjusted to the 2000 U.S. standard population. See Table 2.1.1-2.25.2 for 95% confidence intervals for rates
and footnote regarding 1999 population denominators. Rates are suppressed and not ranked if case counts are fewer than 16 or
if the population of the specific race-sex category is less than 50,000.
Note: ONS - Other Nervous System; NOS - Not Otherwise Specified; IBD - Intrahepatic Bile Duct.
Urinary bladder cases include invasive and in situ.

United States Cancer Statistics: 1999 Incidence
128
Figure 3.18: Invasive Cancer Incidence Rates for the 15 Primary Sites with the HighestAge-Adjusted Incidence Rates within Race- and Sex-Specific Categories
Kentucky,*† 1999
Multiple MyelomaBrain & ONS
EsophagusStomach
LarynxPancreas
Oral Cavity & PharynxLeukemias
Kidney & Renal PelvisNon-Hodgkin Lymphoma
Melanomas of the SkinUrinary Bladder
Colon & RectumLung & Bronchus
Prostate
0 50 100 150 200 250 300
7.37.47.89.29.512.015.416.416.821.022.4
37.071.4
135.6155.5
Brain & ONSOral Cavity & Pharynx
Urinary BladderThyroid
Kidney & Renal PelvisLeukemias
PancreasCervix Uteri
OvaryNon-Hodgkin Lymphoma
Melanomas of the SkinCorpus & Uterus, NOS
Colon & RectumLung & Bronchus
Breast
0 50 100 150 200 250 300
5.16.18.99.09.09.09.310.814.214.716.418.9
52.270.4
126.8
Multiple MyelomaEsophagus
Brain & ONSStomach
LarynxPancreas
Oral Cavity & PharynxLeukemias
Kidney & Renal PelvisNon-Hodgkin Lymphoma
Melanomas of the SkinUrinary Bladder
Colon & RectumProstate
Lung & Bronchus
0 50 100 150 200 250 300
7.07.57.68.99.411.714.516.116.520.522.2
37.271.0
132.8136.6
Brain & ONSOral Cavity & Pharynx
Urinary BladderLeukemias
Kidney & Renal PelvisPancreas
ThyroidCervix Uteri
OvaryNon-Hodgkin Lymphoma
Melanomas of the SkinCorpus & Uterus, NOS
Colon & RectumLung & Bronchus
Breast
0 50 100 150 200 250 300
5.16.18.99.09.09.09.110.514.414.916.518.7
51.369.8
125.7
Oral Cavity & PharynxNon-Hodgkin Lymphoma
Kidney & Renal PelvisUrinary Bladder
Colon & RectumLung & Bronchus
Prostate
0 50 100 150 200 250 300
19.720.322.623.5
69.7115.9
199.9
Corpus & Uterus, NOSPancreas
Cervix UteriColon & Rectum
Lung & BronchusBreast
0 50 100 150 200 250 300
12.713.314.1
62.682.2
126.8
Rate‡ per 100,000Rate‡ per 100,000
Rate‡ per 100,000Rate‡ per 100,000
Rate‡ per 100,000Rate‡ per 100,000
Males FemalesAll Races
White
Black
∗ Data meet the following data quality criteria for all invasive cancer sites combined: case ascertainment is at least
90% complete; ≥ 97% of cases pass a standard set of computerized edits; ≤ 5% of cases were ascertained by death certificate
only; ≤ 3% of cases are missing information on sex; ≤ 5% of cases are missing information on race; ≤ 3% of cases are
missing information on age. See Appendix H for registry-specific data quality information.† Excludes basal and squamous cell carcinomas of the skin except when these occur on the skin of the genital organs, and in
situ cancers except urinary bladder.‡ Rates are age-adjusted to the 2000 U.S. standard population. See Table 2.1.1-2.25.2 for 95% confidence intervals for rates
and footnote regarding 1999 population denominators. Rates are suppressed and not ranked if case counts are fewer than 16 or
if the population of the specific race-sex category is less than 50,000.
Note: ONS - Other Nervous System; NOS - Not Otherwise Specified; IBD - Intrahepatic Bile Duct.
Urinary bladder cases include invasive and in situ.

State and Metropolitan Area Incidence Rates for Most Common Cancers
129
Figure 3.19: Invasive Cancer Incidence Rates for the 15 Primary Sites with the HighestAge-Adjusted Incidence Rates within Race- and Sex-Specific Categories
Louisiana,*† 1999
Multiple MyelomaLiver & IBDEsophagus
LarynxStomach
Melanomas of the SkinPancreas
LeukemiasKidney & Renal PelvisOral Cavity & Pharynx
Non-Hodgkin LymphomaUrinary Bladder
Colon & RectumLung & Bronchus
Prostate
0 50 100 150 200 250 300
7.07.69.710.310.612.113.114.419.020.220.8
32.970.5
114.9163.1
StomachMelanomas of the SkinOral Cavity & Pharynx
Urinary BladderThyroid
LeukemiasKidney & Renal Pelvis
PancreasCervix Uteri
OvaryNon-Hodgkin Lymphoma
Corpus & Uterus, NOSColon & Rectum
Lung & BronchusBreast
0 50 100 150 200 250 300
5.76.57.27.47.68.09.910.012.312.915.616.1
47.552.4
123.1
Brain & ONSLiver & IBDEsophagus
StomachLarynx
PancreasMelanomas of the Skin
LeukemiasKidney & Renal PelvisOral Cavity & Pharynx
Non-Hodgkin LymphomaUrinary Bladder
Colon & RectumLung & Bronchus
Prostate
0 50 100 150 200 250 300
7.67.78.38.59.111.615.215.418.019.121.5
37.569.1
107.5147.5
Brain & ONSOral Cavity & Pharynx
Urinary BladderLeukemias
ThyroidMelanomas of the Skin
PancreasKidney & Renal Pelvis
Cervix UteriOvary
Corpus & Uterus, NOSNon-Hodgkin Lymphoma
Colon & RectumLung & Bronchus
Breast
0 50 100 150 200 250 300
5.07.17.77.98.59.19.210.110.713.815.517.8
46.554.3
127.6
Hodgkin LymphomaLiver & IBDLeukemias
Multiple MyelomaEsophagus
LarynxStomach
Non-Hodgkin LymphomaUrinary Bladder
PancreasKidney & Renal PelvisOral Cavity & Pharynx
Colon & RectumLung & Bronchus
Prostate
0 50 100 150 200 250 300
3.47.011.913.114.314.617.218.618.718.922.824.3
77.3142.1
218.2
ThyroidUrinary Bladder
Oral Cavity & PharynxLeukemias
Multiple MyelomaKidney & Renal Pelvis
Non-Hodgkin LymphomaOvary
StomachPancreas
Cervix UteriCorpus & Uterus, NOS
Lung & BronchusColon & Rectum
Breast
0 50 100 150 200 250 300
6.16.67.68.09.09.59.511.211.512.516.518.5
47.450.6
111.8
Rate‡ per 100,000Rate‡ per 100,000
Rate‡ per 100,000Rate‡ per 100,000
Rate‡ per 100,000Rate‡ per 100,000
Males FemalesAll Races
White
Black
∗ Data meet the following data quality criteria for all invasive cancer sites combined: case ascertainment is at least
90% complete; ≥ 97% of cases pass a standard set of computerized edits; ≤ 5% of cases were ascertained by death certificate
only; ≤ 3% of cases are missing information on sex; ≤ 5% of cases are missing information on race; ≤ 3% of cases are
missing information on age. See Appendix H for registry-specific data quality information.† Excludes basal and squamous cell carcinomas of the skin except when these occur on the skin of the genital organs, and in
situ cancers except urinary bladder.‡ Rates are age-adjusted to the 2000 U.S. standard population. See Table 2.1.1-2.25.2 for 95% confidence intervals for rates
and footnote regarding 1999 population denominators. Rates are suppressed and not ranked if case counts are fewer than 16 or
if the population of the specific race-sex category is less than 50,000.
Note: ONS - Other Nervous System; NOS - Not Otherwise Specified; IBD - Intrahepatic Bile Duct.
Urinary bladder cases include invasive and in situ.

United States Cancer Statistics: 1999 Incidence
130
Figure 3.20: Invasive Cancer Incidence Rates for the 15 Primary Sites with the HighestAge-Adjusted Incidence Rates within Race- and Sex-Specific Categories
Maryland,*† 1999
Multiple MyelomaBrain & ONS
LarynxEsophagus
StomachPancreas
LeukemiasKidney & Renal PelvisOral Cavity & Pharynx
Non-Hodgkin LymphomaMelanomas of the Skin
Urinary BladderColon & Rectum
Lung & BronchusProstate
0 50 100 150 200 250 300
6.37.28.810.310.511.311.715.116.420.122.1
30.463.2
92.1184.7
Brain & ONSOral Cavity & Pharynx
LeukemiasCervix Uteri
Kidney & Renal PelvisPancreas
Urinary BladderThyroid
OvaryNon-Hodgkin Lymphoma
Melanomas of the SkinCorpus & Uterus, NOS
Colon & RectumLung & Bronchus
Breast
0 50 100 150 200 250 300
5.36.26.78.28.39.19.810.613.213.314.4
23.545.6
57.0137.0
TestisLarynx
Brain & ONSStomach
EsophagusPancreas
LeukemiasKidney & Renal PelvisOral Cavity & Pharynx
Non-Hodgkin LymphomaMelanomas of the Skin
Urinary BladderColon & Rectum
Lung & BronchusProstate
0 50 100 150 200 250 300
6.47.97.98.49.610.912.015.415.720.2
28.434.7
61.390.0
157.0
Brain & ONSOral Cavity & Pharynx
LeukemiasCervix Uteri
Kidney & Renal PelvisPancreas
Urinary BladderThyroid
Non-Hodgkin LymphomaOvary
Melanomas of the SkinCorpus & Uterus, NOS
Colon & RectumLung & Bronchus
Breast
0 50 100 150 200 250 300
5.55.76.46.78.58.610.711.913.714.920.025.9
42.658.7
139.6
Brain & ONSLiver & IBD
Multiple MyelomaLeukemias
Urinary BladderPancreas
LarynxEsophagus
Kidney & Renal PelvisNon-Hodgkin Lymphoma
Oral Cavity & PharynxStomach
Colon & RectumLung & Bronchus
Prostate
0 50 100 150 200 250 300
5.97.49.910.612.112.813.113.214.614.818.018.3
65.4104.5
225.6
Urinary BladderOral Cavity & Pharynx
LeukemiasStomach
ThyroidMultiple Myeloma
Kidney & Renal PelvisOvary
Non-Hodgkin LymphomaCervix Uteri
PancreasCorpus & Uterus, NOS
Colon & RectumLung & Bronchus
Breast
0 50 100 150 200 250 300
5.26.86.96.97.07.27.78.69.710.811.715.6
50.155.2
127.7
Rate‡ per 100,000Rate‡ per 100,000
Rate‡ per 100,000Rate‡ per 100,000
Rate‡ per 100,000Rate‡ per 100,000
Males FemalesAll Races
White
Black
∗ Data meet the following data quality criteria for all invasive cancer sites combined: case ascertainment is at least
90% complete; ≥ 97% of cases pass a standard set of computerized edits; ≤ 5% of cases were ascertained by death certificate
only; ≤ 3% of cases are missing information on sex; ≤ 5% of cases are missing information on race; ≤ 3% of cases are
missing information on age. See Appendix H for registry-specific data quality information.† Excludes basal and squamous cell carcinomas of the skin except when these occur on the skin of the genital organs, and in
situ cancers except urinary bladder.‡ Rates are age-adjusted to the 2000 U.S. standard population. See Table 2.1.1-2.25.2 for 95% confidence intervals for rates
and footnote regarding 1999 population denominators. Rates are suppressed and not ranked if case counts are fewer than 16 or
if the population of the specific race-sex category is less than 50,000.
Note: ONS - Other Nervous System; NOS - Not Otherwise Specified; IBD - Intrahepatic Bile Duct.
Urinary bladder cases include invasive and in situ.

State and Metropolitan Area Incidence Rates for Most Common Cancers
131
Figure 3.21: Invasive Cancer Incidence Rates for the 15 Primary Sites with the HighestAge-Adjusted Incidence Rates within Race- and Sex-Specific Categories
Massachusetts,*† 1999
Liver & IBDBrain & ONS
LarynxEsophagus
StomachPancreas
LeukemiasOral Cavity & PharynxKidney & Renal Pelvis
Melanomas of the SkinNon-Hodgkin Lymphoma
Urinary BladderColon & Rectum
Lung & BronchusProstate
0 50 100 150 200 250 300
6.88.18.510.812.113.313.616.217.419.722.4
43.570.0
88.1180.1
Brain & ONSCervix Uteri
Oral Cavity & PharynxLeukemias
Kidney & Renal PelvisPancreas
ThyroidUrinary Bladder
Melanomas of the SkinOvary
Non-Hodgkin LymphomaCorpus & Uterus, NOS
Colon & RectumLung & Bronchus
Breast
0 50 100 150 200 250 300
6.76.87.49.49.59.810.612.313.916.016.8
28.851.2
59.0144.7
TestisBrain & ONS
LarynxEsophagus
StomachPancreas
LeukemiasOral Cavity & PharynxKidney & Renal Pelvis
Melanomas of the SkinNon-Hodgkin Lymphoma
Urinary BladderColon & Rectum
Lung & BronchusProstate
0 50 100 150 200 250 300
6.98.28.310.711.213.213.915.817.120.221.9
44.069.7
87.7173.7
Cervix UteriBrain & ONS
Oral Cavity & PharynxLeukemias
Kidney & Renal PelvisPancreas
ThyroidUrinary Bladder
Melanomas of the SkinOvary
Non-Hodgkin LymphomaCorpus & Uterus, NOS
Colon & RectumLung & Bronchus
Breast
0 50 100 150 200 250 300
6.07.07.39.49.69.910.512.314.316.016.4
28.750.8
59.0145.1
Non-Hodgkin LymphomaLarynx
Oral Cavity & PharynxKidney & Renal Pelvis
Urinary BladderStomach
Colon & RectumLung & Bronchus
Prostate
0 50 100 150 200 250 300
13.016.219.820.321.325.7
56.985.7
259.8
Cervix UteriCorpus & Uterus, NOS
Non-Hodgkin LymphomaColon & Rectum
Lung & BronchusBreast
0 50 100 150 200 250 300
14.714.916.4
47.351.3
94.4
Rate‡ per 100,000Rate‡ per 100,000
Rate‡ per 100,000Rate‡ per 100,000
Rate‡ per 100,000Rate‡ per 100,000
Males FemalesAll Races
White
Black
∗ Data meet the following data quality criteria for all invasive cancer sites combined: case ascertainment is at least
90% complete; ≥ 97% of cases pass a standard set of computerized edits; ≤ 5% of cases were ascertained by death certificate
only; ≤ 3% of cases are missing information on sex; ≤ 5% of cases are missing information on race; ≤ 3% of cases are
missing information on age. See Appendix H for registry-specific data quality information.† Excludes basal and squamous cell carcinomas of the skin except when these occur on the skin of the genital organs, and in
situ cancers except urinary bladder.‡ Rates are age-adjusted to the 2000 U.S. standard population. See Table 2.1.1-2.25.2 for 95% confidence intervals for rates
and footnote regarding 1999 population denominators. Rates are suppressed and not ranked if case counts are fewer than 16 or
if the population of the specific race-sex category is less than 50,000.
Note: ONS - Other Nervous System; NOS - Not Otherwise Specified; IBD - Intrahepatic Bile Duct.
Urinary bladder cases include invasive and in situ.

United States Cancer Statistics: 1999 Incidence
132
Figure 3.22: Invasive Cancer Incidence Rates for the 15 Primary Sites with the HighestAge-Adjusted Incidence Rates within Race- and Sex-Specific Categories
Michigan,*† 1999
LarynxLiver & IBD
Brain & ONSEsophagus
StomachPancreas
LeukemiasOral Cavity & PharynxKidney & Renal Pelvis
Melanomas of the SkinNon-Hodgkin Lymphoma
Urinary BladderColon & Rectum
Lung & BronchusProstate
0 50 100 150 200 250 300
8.08.18.810.310.912.114.715.416.622.322.4
41.962.5
94.6202.2
Brain & ONSOral Cavity & Pharynx
Cervix UteriKidney & Renal Pelvis
LeukemiasThyroid
PancreasUrinary Bladder
Melanomas of the SkinOvary
Non-Hodgkin LymphomaCorpus & Uterus, NOS
Colon & RectumLung & Bronchus
Breast
0 50 100 150 200 250 300
6.06.68.38.89.410.210.810.915.316.617.0
26.847.2
57.4131.6
LarynxLiver & IBD
Brain & ONSStomach
EsophagusPancreas
Oral Cavity & PharynxLeukemias
Kidney & Renal PelvisNon-Hodgkin Lymphoma
Melanomas of the SkinUrinary Bladder
Colon & RectumLung & Bronchus
Prostate
0 50 100 150 200 250 300
7.47.69.410.110.211.414.715.216.223.123.5
44.161.5
90.9185.8
Brain & ONSOral Cavity & Pharynx
Cervix UteriKidney & Renal Pelvis
LeukemiasPancreas
ThyroidUrinary Bladder
Melanomas of the SkinOvary
Non-Hodgkin LymphomaCorpus & Uterus, NOS
Colon & RectumLung & Bronchus
Breast
0 50 100 150 200 250 300
6.36.57.58.39.49.910.311.116.716.917.6
28.245.8
56.5132.8
Brain & ONSLeukemiasLiver & IBDEsophagus
Multiple MyelomaLarynx
Non-Hodgkin LymphomaStomach
PancreasKidney & Renal PelvisOral Cavity & Pharynx
Urinary BladderColon & Rectum
Lung & BronchusProstate
0 50 100 150 200 250 300
4.910.310.411.813.113.815.315.618.420.221.022.6
71.1127.6
290.3
Oral Cavity & PharynxThyroid
Multiple MyelomaUrinary Bladder
LeukemiasStomach
Non-Hodgkin LymphomaKidney & Renal Pelvis
Cervix UteriOvary
Corpus & Uterus, NOSPancreas
Colon & RectumLung & Bronchus
Breast
0 50 100 150 200 250 300
6.28.18.68.88.811.011.811.913.513.616.917.4
54.166.8
121.7
Rate‡ per 100,000Rate‡ per 100,000
Rate‡ per 100,000Rate‡ per 100,000
Rate‡ per 100,000Rate‡ per 100,000
Males FemalesAll Races
White
Black
∗ Data meet the following data quality criteria for all invasive cancer sites combined: case ascertainment is at least
90% complete; ≥ 97% of cases pass a standard set of computerized edits; ≤ 5% of cases were ascertained by death certificate
only; ≤ 3% of cases are missing information on sex; ≤ 5% of cases are missing information on race; ≤ 3% of cases are
missing information on age. See Appendix H for registry-specific data quality information.† Excludes basal and squamous cell carcinomas of the skin except when these occur on the skin of the genital organs, and in
situ cancers except urinary bladder.‡ Rates are age-adjusted to the 2000 U.S. standard population. See Table 2.1.1-2.25.2 for 95% confidence intervals for rates
and footnote regarding 1999 population denominators. Rates are suppressed and not ranked if case counts are fewer than 16 or
if the population of the specific race-sex category is less than 50,000.
Note: ONS - Other Nervous System; NOS - Not Otherwise Specified; IBD - Intrahepatic Bile Duct.
Urinary bladder cases include invasive and in situ.

State and Metropolitan Area Incidence Rates for Most Common Cancers
133
Figure 3.23: Invasive Cancer Incidence Rates for the 15 Primary Sites with the HighestAge-Adjusted Incidence Rates within Race- and Sex-Specific Categories
Detroit,*† 1999
Multiple MyelomaBrain & ONS
EsophagusLiver & IBD
PancreasStomach
LeukemiasOral Cavity & PharynxKidney & Renal Pelvis
Melanomas of the SkinNon-Hodgkin Lymphoma
Urinary BladderColon & Rectum
Lung & BronchusProstate
0 50 100 150 200 250 300
7.78.78.78.912.213.715.116.316.720.622.3
41.564.3
100.5219.0
StomachOral Cavity & Pharynx
Cervix UteriKidney & Renal Pelvis
LeukemiasThyroid
Urinary BladderPancreas
Melanomas of the SkinNon-Hodgkin Lymphoma
OvaryCorpus & Uterus, NOS
Colon & RectumLung & Bronchus
Breast
0 50 100 150 200 250 300
6.76.89.09.010.210.311.111.713.316.116.6
25.747.9
59.6129.9
Multiple MyelomaLiver & IBDEsophagus
Brain & ONSPancreasStomach
Oral Cavity & PharynxKidney & Renal Pelvis
LeukemiasNon-Hodgkin Lymphoma
Melanomas of the SkinUrinary Bladder
Colon & RectumLung & Bronchus
Prostate
0 50 100 150 200 250 300
6.18.38.59.610.913.014.316.216.623.825.2
46.562.2
93.5196.3
StomachOral Cavity & Pharynx
Cervix UteriKidney & Renal Pelvis
PancreasLeukemias
ThyroidUrinary Bladder
Melanomas of the SkinNon-Hodgkin Lymphoma
OvaryCorpus & Uterus, NOS
Colon & RectumLung & Bronchus
Breast
0 50 100 150 200 250 300
5.76.77.08.610.310.711.011.517.117.217.3
27.645.4
59.0131.8
Brain & ONSLeukemiasEsophagusLiver & IBD
LarynxMultiple Myeloma
Non-Hodgkin LymphomaStomach
PancreasKidney & Renal Pelvis
Urinary BladderOral Cavity & Pharynx
Colon & RectumLung & Bronchus
Prostate
0 50 100 150 200 250 300
5.210.210.310.713.414.515.415.718.218.923.825.1
74.2133.4
299.4
Oral Cavity & PharynxThyroid
LeukemiasMultiple Myeloma
Urinary BladderStomach
Kidney & Renal PelvisNon-Hodgkin Lymphoma
OvaryCervix Uteri
PancreasCorpus & Uterus, NOS
Colon & RectumLung & Bronchus
Breast
0 50 100 150 200 250 300
6.17.48.68.89.810.011.211.715.015.517.619.1
56.663.8
125.0
Rate‡ per 100,000Rate‡ per 100,000
Rate‡ per 100,000Rate‡ per 100,000
Rate‡ per 100,000Rate‡ per 100,000
Males FemalesAll Races
White
Black
∗ Data meet the following data quality criteria for all invasive cancer sites combined: case ascertainment is at least
90% complete; ≥ 97% of cases pass a standard set of computerized edits; ≤ 5% of cases were ascertained by death certificate
only; ≤ 3% of cases are missing information on sex; ≤ 5% of cases are missing information on race; ≤ 3% of cases are
missing information on age. See Appendix H for registry-specific data quality information.† Excludes basal and squamous cell carcinomas of the skin except when these occur on the skin of the genital organs, and in
situ cancers except urinary bladder.‡ Rates are age-adjusted to the 2000 U.S. standard population. See Table 2.1.1-2.25.2 for 95% confidence intervals for rates
and footnote regarding 1999 population denominators. Rates are suppressed and not ranked if case counts are fewer than 16 or
if the population of the specific race-sex category is less than 50,000.
Note: ONS - Other Nervous System; NOS - Not Otherwise Specified; IBD - Intrahepatic Bile Duct.
Urinary bladder cases include invasive and in situ.
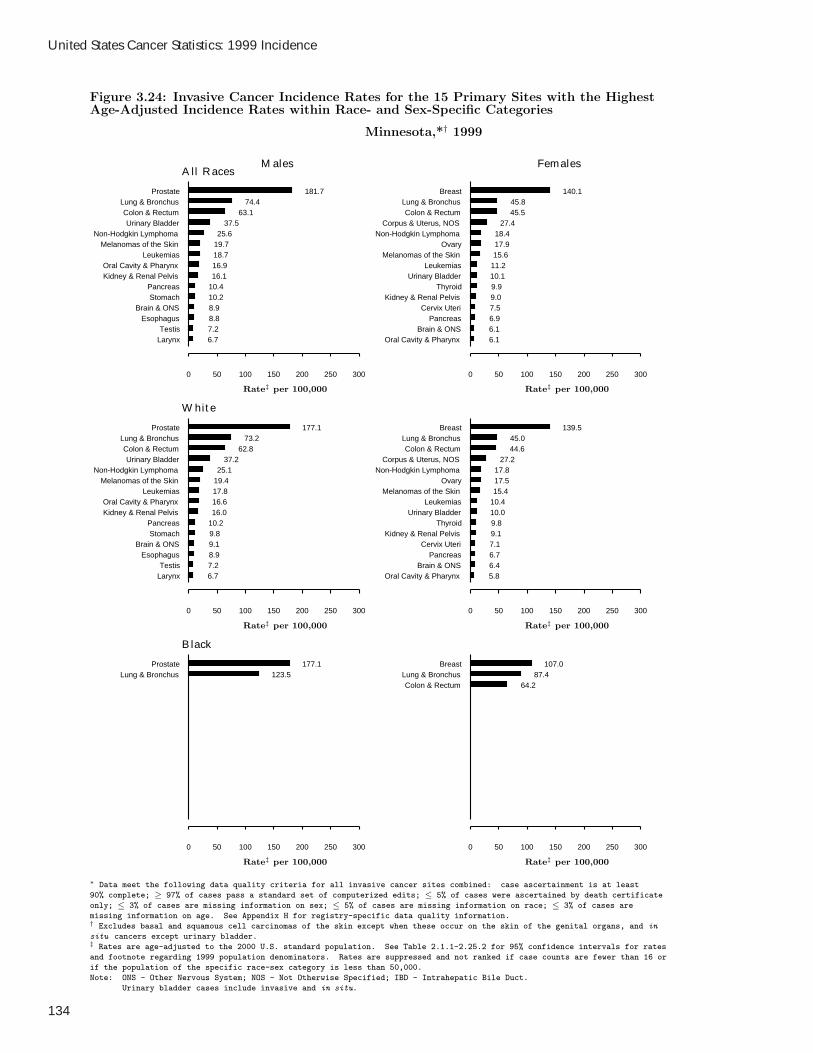
United States Cancer Statistics: 1999 Incidence
134
Figure 3.24: Invasive Cancer Incidence Rates for the 15 Primary Sites with the HighestAge-Adjusted Incidence Rates within Race- and Sex-Specific Categories
Minnesota,*† 1999
LarynxTestis
EsophagusBrain & ONS
StomachPancreas
Kidney & Renal PelvisOral Cavity & Pharynx
LeukemiasMelanomas of the Skin
Non-Hodgkin LymphomaUrinary Bladder
Colon & RectumLung & Bronchus
Prostate
0 50 100 150 200 250 300
6.77.28.88.910.210.416.116.918.719.725.6
37.563.1
74.4181.7
Oral Cavity & PharynxBrain & ONS
PancreasCervix Uteri
Kidney & Renal PelvisThyroid
Urinary BladderLeukemias
Melanomas of the SkinOvary
Non-Hodgkin LymphomaCorpus & Uterus, NOS
Colon & RectumLung & Bronchus
Breast
0 50 100 150 200 250 300
6.16.16.97.59.09.910.111.215.617.918.4
27.445.545.8
140.1
LarynxTestis
EsophagusBrain & ONS
StomachPancreas
Kidney & Renal PelvisOral Cavity & Pharynx
LeukemiasMelanomas of the Skin
Non-Hodgkin LymphomaUrinary Bladder
Colon & RectumLung & Bronchus
Prostate
0 50 100 150 200 250 300
6.77.28.99.19.810.216.016.617.819.425.1
37.262.8
73.2177.1
Oral Cavity & PharynxBrain & ONS
PancreasCervix Uteri
Kidney & Renal PelvisThyroid
Urinary BladderLeukemias
Melanomas of the SkinOvary
Non-Hodgkin LymphomaCorpus & Uterus, NOS
Colon & RectumLung & Bronchus
Breast
0 50 100 150 200 250 300
5.86.46.77.19.19.810.010.415.417.517.8
27.244.645.0
139.5
Lung & BronchusProstate
0 50 100 150 200 250 300
123.5177.1
Colon & RectumLung & Bronchus
Breast
0 50 100 150 200 250 300
64.287.4
107.0
Rate‡ per 100,000Rate‡ per 100,000
Rate‡ per 100,000Rate‡ per 100,000
Rate‡ per 100,000Rate‡ per 100,000
Males FemalesAll Races
White
Black
∗ Data meet the following data quality criteria for all invasive cancer sites combined: case ascertainment is at least
90% complete; ≥ 97% of cases pass a standard set of computerized edits; ≤ 5% of cases were ascertained by death certificate
only; ≤ 3% of cases are missing information on sex; ≤ 5% of cases are missing information on race; ≤ 3% of cases are
missing information on age. See Appendix H for registry-specific data quality information.† Excludes basal and squamous cell carcinomas of the skin except when these occur on the skin of the genital organs, and in
situ cancers except urinary bladder.‡ Rates are age-adjusted to the 2000 U.S. standard population. See Table 2.1.1-2.25.2 for 95% confidence intervals for rates
and footnote regarding 1999 population denominators. Rates are suppressed and not ranked if case counts are fewer than 16 or
if the population of the specific race-sex category is less than 50,000.
Note: ONS - Other Nervous System; NOS - Not Otherwise Specified; IBD - Intrahepatic Bile Duct.
Urinary bladder cases include invasive and in situ.

State and Metropolitan Area Incidence Rates for Most Common Cancers
135
Figure 3.25: Invasive Cancer Incidence Rates for the 15 Primary Sites with the HighestAge-Adjusted Incidence Rates within Race- and Sex-Specific Categories
Missouri,*† 1999
Liver & IBDEsophagus
Brain & ONSStomach
LarynxMelanomas of the Skin
PancreasLeukemias
Oral Cavity & PharynxKidney & Renal Pelvis
Non-Hodgkin LymphomaUrinary Bladder
Colon & RectumLung & Bronchus
Prostate
0 50 100 150 200 250 300
5.37.98.08.58.912.412.714.215.417.520.9
34.769.2
105.2139.9
Oral Cavity & PharynxBrain & ONS
Melanomas of the SkinUrinary Bladder
LeukemiasKidney & Renal Pelvis
Cervix UteriThyroid
PancreasOvary
Non-Hodgkin LymphomaCorpus & Uterus, NOS
Colon & RectumLung & Bronchus
Breast
0 50 100 150 200 250 300
5.55.97.47.78.48.68.810.010.215.515.8
25.948.9
59.2127.7
TestisStomach
EsophagusBrain & ONS
LarynxPancreas
Melanomas of the SkinLeukemias
Oral Cavity & PharynxKidney & Renal Pelvis
Non-Hodgkin LymphomaUrinary Bladder
Colon & RectumLung & Bronchus
Prostate
0 50 100 150 200 250 300
4.97.77.88.48.512.513.314.114.917.321.3
36.168.1
102.4133.5
Oral Cavity & PharynxBrain & ONS
Urinary BladderMelanomas of the SkinKidney & Renal Pelvis
Cervix UteriLeukemias
PancreasThyroid
Non-Hodgkin LymphomaOvary
Corpus & Uterus, NOSColon & Rectum
Lung & BronchusBreast
0 50 100 150 200 250 300
5.46.37.77.98.28.38.49.610.315.716.1
26.548.3
58.9127.5
EsophagusMultiple Myeloma
Liver & IBDLarynx
Non-Hodgkin LymphomaPancreas
LeukemiasUrinary Bladder
StomachOral Cavity & PharynxKidney & Renal Pelvis
Colon & RectumLung & Bronchus
Prostate
0 50 100 150 200 250 300
8.911.512.414.014.114.615.215.617.518.322.9
79.6136.0
214.4
ThyroidLeukemias
Urinary BladderOvary
Multiple MyelomaKidney & Renal Pelvis
Cervix UteriNon-Hodgkin Lymphoma
PancreasCorpus & Uterus, NOS
Colon & RectumLung & Bronchus
Breast
0 50 100 150 200 250 300
7.07.07.710.511.512.412.516.917.220.4
54.661.9
125.1
Rate‡ per 100,000Rate‡ per 100,000
Rate‡ per 100,000Rate‡ per 100,000
Rate‡ per 100,000Rate‡ per 100,000
Males FemalesAll Races
White
Black
∗ Data meet the following data quality criteria for all invasive cancer sites combined: case ascertainment is at least
90% complete; ≥ 97% of cases pass a standard set of computerized edits; ≤ 5% of cases were ascertained by death certificate
only; ≤ 3% of cases are missing information on sex; ≤ 5% of cases are missing information on race; ≤ 3% of cases are
missing information on age. See Appendix H for registry-specific data quality information.† Excludes basal and squamous cell carcinomas of the skin except when these occur on the skin of the genital organs, and in
situ cancers except urinary bladder.‡ Rates are age-adjusted to the 2000 U.S. standard population. See Table 2.1.1-2.25.2 for 95% confidence intervals for rates
and footnote regarding 1999 population denominators. Rates are suppressed and not ranked if case counts are fewer than 16 or
if the population of the specific race-sex category is less than 50,000.
Note: ONS - Other Nervous System; NOS - Not Otherwise Specified; IBD - Intrahepatic Bile Duct.
Urinary bladder cases include invasive and in situ.

United States Cancer Statistics: 1999 Incidence
136
Figure 3.26: Invasive Cancer Incidence Rates for the 15 Primary Sites with the HighestAge-Adjusted Incidence Rates within Race- and Sex-Specific Categories
Montana,*† 1999
Multiple MyelomaLarynxTestis
StomachEsophagus
Oral Cavity & PharynxPancreas
Melanomas of the SkinKidney & Renal Pelvis
LeukemiasNon-Hodgkin Lymphoma
Urinary BladderColon & Rectum
Lung & BronchusProstate
0 50 100 150 200 250 300
5.76.36.38.412.412.412.813.314.516.220.5
34.263.3
76.6157.1
Oral Cavity & PharynxBrain & ONS
PancreasLeukemias
Cervix UteriMelanomas of the SkinKidney & Renal Pelvis
Urinary BladderNon-Hodgkin Lymphoma
ThyroidOvary
Corpus & Uterus, NOSColon & Rectum
Lung & BronchusBreast
0 50 100 150 200 250 300
6.17.07.48.28.69.59.810.412.415.316.717.1
41.948.5
122.2
ThyroidLarynxTestis
StomachMelanomas of the Skin
EsophagusOral Cavity & Pharynx
PancreasKidney & Renal Pelvis
LeukemiasNon-Hodgkin Lymphoma
Urinary BladderColon & Rectum
Lung & BronchusProstate
0 50 100 150 200 250 300
5.45.86.28.211.812.012.412.913.915.320.6
33.259.7
74.0149.8
Oral Cavity & PharynxBrain & ONS
PancreasLeukemias
Cervix UteriMelanomas of the SkinKidney & Renal Pelvis
Urinary BladderNon-Hodgkin Lymphoma
ThyroidCorpus & Uterus, NOS
OvaryColon & Rectum
Lung & BronchusBreast
0 50 100 150 200 250 300
6.06.97.48.38.48.99.810.512.815.316.517.1
40.047.0
120.7
0 50 100 150 200 250 300
Incidence rates were notranked when the populationsize was less than 50,000.
0 50 100 150 200 250 300
Incidence rates were notranked when the populationsize was less than 50,000.
Rate‡ per 100,000Rate‡ per 100,000
Rate‡ per 100,000Rate‡ per 100,000
Rate‡ per 100,000Rate‡ per 100,000
Males FemalesAll Races
White
Black
∗ Data meet the following data quality criteria for all invasive cancer sites combined: case ascertainment is at least
90% complete; ≥ 97% of cases pass a standard set of computerized edits; ≤ 5% of cases were ascertained by death certificate
only; ≤ 3% of cases are missing information on sex; ≤ 5% of cases are missing information on race; ≤ 3% of cases are
missing information on age. See Appendix H for registry-specific data quality information.† Excludes basal and squamous cell carcinomas of the skin except when these occur on the skin of the genital organs, and in
situ cancers except urinary bladder.‡ Rates are age-adjusted to the 2000 U.S. standard population. See Table 2.1.1-2.25.2 for 95% confidence intervals for rates
and footnote regarding 1999 population denominators. Rates are suppressed and not ranked if case counts are fewer than 16 or
if the population of the specific race-sex category is less than 50,000.
Note: ONS - Other Nervous System; NOS - Not Otherwise Specified; IBD - Intrahepatic Bile Duct.
Urinary bladder cases include invasive and in situ.
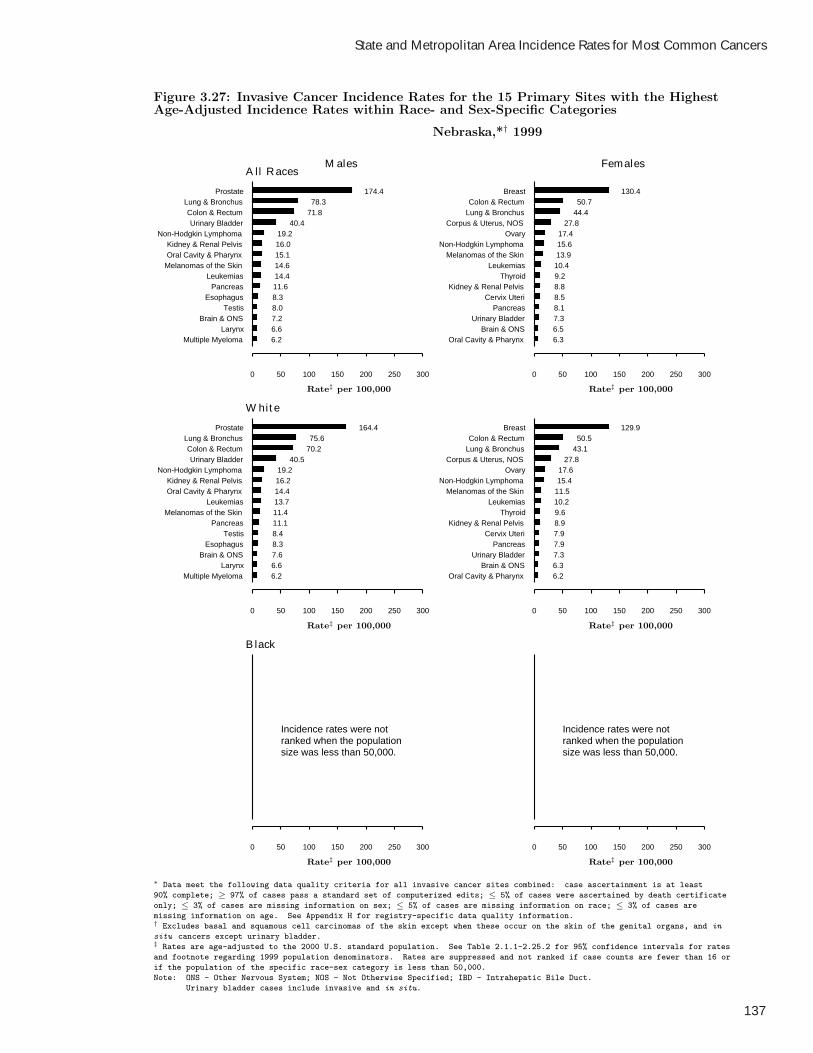
State and Metropolitan Area Incidence Rates for Most Common Cancers
137
Figure 3.27: Invasive Cancer Incidence Rates for the 15 Primary Sites with the HighestAge-Adjusted Incidence Rates within Race- and Sex-Specific Categories
Nebraska,*† 1999
Multiple MyelomaLarynx
Brain & ONSTestis
EsophagusPancreas
LeukemiasMelanomas of the SkinOral Cavity & PharynxKidney & Renal Pelvis
Non-Hodgkin LymphomaUrinary Bladder
Colon & RectumLung & Bronchus
Prostate
0 50 100 150 200 250 300
6.26.67.28.08.311.614.414.615.116.019.2
40.471.878.3
174.4
Oral Cavity & PharynxBrain & ONS
Urinary BladderPancreas
Cervix UteriKidney & Renal Pelvis
ThyroidLeukemias
Melanomas of the SkinNon-Hodgkin Lymphoma
OvaryCorpus & Uterus, NOS
Lung & BronchusColon & Rectum
Breast
0 50 100 150 200 250 300
6.36.57.38.18.58.89.210.413.915.617.4
27.844.450.7
130.4
Multiple MyelomaLarynx
Brain & ONSEsophagus
TestisPancreas
Melanomas of the SkinLeukemias
Oral Cavity & PharynxKidney & Renal Pelvis
Non-Hodgkin LymphomaUrinary Bladder
Colon & RectumLung & Bronchus
Prostate
0 50 100 150 200 250 300
6.26.67.68.38.411.111.413.714.416.219.2
40.570.275.6
164.4
Oral Cavity & PharynxBrain & ONS
Urinary BladderPancreas
Cervix UteriKidney & Renal Pelvis
ThyroidLeukemias
Melanomas of the SkinNon-Hodgkin Lymphoma
OvaryCorpus & Uterus, NOS
Lung & BronchusColon & Rectum
Breast
0 50 100 150 200 250 300
6.26.37.37.97.98.99.610.211.515.417.6
27.843.150.5
129.9
0 50 100 150 200 250 300
Incidence rates were notranked when the populationsize was less than 50,000.
0 50 100 150 200 250 300
Incidence rates were notranked when the populationsize was less than 50,000.
Rate‡ per 100,000Rate‡ per 100,000
Rate‡ per 100,000Rate‡ per 100,000
Rate‡ per 100,000Rate‡ per 100,000
Males FemalesAll Races
White
Black
∗ Data meet the following data quality criteria for all invasive cancer sites combined: case ascertainment is at least
90% complete; ≥ 97% of cases pass a standard set of computerized edits; ≤ 5% of cases were ascertained by death certificate
only; ≤ 3% of cases are missing information on sex; ≤ 5% of cases are missing information on race; ≤ 3% of cases are
missing information on age. See Appendix H for registry-specific data quality information.† Excludes basal and squamous cell carcinomas of the skin except when these occur on the skin of the genital organs, and in
situ cancers except urinary bladder.‡ Rates are age-adjusted to the 2000 U.S. standard population. See Table 2.1.1-2.25.2 for 95% confidence intervals for rates
and footnote regarding 1999 population denominators. Rates are suppressed and not ranked if case counts are fewer than 16 or
if the population of the specific race-sex category is less than 50,000.
Note: ONS - Other Nervous System; NOS - Not Otherwise Specified; IBD - Intrahepatic Bile Duct.
Urinary bladder cases include invasive and in situ.

United States Cancer Statistics: 1999 Incidence
138
Figure 3.28: Invasive Cancer Incidence Rates for the 15 Primary Sites with the HighestAge-Adjusted Incidence Rates within Race- and Sex-Specific Categories
New Hampshire,*† 1999
Multiple MyelomaLarynx
Brain & ONSStomach
EsophagusPancreas
Kidney & Renal PelvisLeukemias
Oral Cavity & PharynxNon-Hodgkin Lymphoma
Melanomas of the SkinUrinary Bladder
Colon & RectumLung & Bronchus
Prostate
0 50 100 150 200 250 300
6.88.58.99.09.412.913.214.215.219.323.2
43.158.3
83.5151.7
Brain & ONSCervix Uteri
Oral Cavity & PharynxKidney & Renal Pelvis
ThyroidPancreas
LeukemiasUrinary Bladder
OvaryNon-Hodgkin Lymphoma
Melanomas of the SkinCorpus & Uterus, NOS
Colon & RectumLung & Bronchus
Breast
0 50 100 150 200 250 300
5.46.56.86.87.09.410.112.514.116.319.026.4
47.461.0
137.9
Multiple MyelomaLarynx
Brain & ONSStomach
EsophagusPancreas
Kidney & Renal PelvisLeukemias
Oral Cavity & PharynxNon-Hodgkin Lymphoma
Melanomas of the SkinUrinary Bladder
Colon & RectumLung & Bronchus
Prostate
0 50 100 150 200 250 300
6.88.68.89.29.412.913.414.215.119.423.6
43.658.2
83.7149.8
Brain & ONSCervix Uteri
Oral Cavity & PharynxKidney & Renal Pelvis
ThyroidPancreas
LeukemiasUrinary Bladder
OvaryNon-Hodgkin Lymphoma
Melanomas of the SkinCorpus & Uterus, NOS
Colon & RectumLung & Bronchus
Breast
0 50 100 150 200 250 300
5.36.26.96.97.19.410.312.314.316.219.126.2
46.761.0
136.3
0 50 100 150 200 250 300
Incidence rates were notranked when the populationsize was less than 50,000.
0 50 100 150 200 250 300
Incidence rates were notranked when the populationsize was less than 50,000.
Rate‡ per 100,000Rate‡ per 100,000
Rate‡ per 100,000Rate‡ per 100,000
Rate‡ per 100,000Rate‡ per 100,000
Males FemalesAll Races
White
Black
∗ Data meet the following data quality criteria for all invasive cancer sites combined: case ascertainment is at least
90% complete; ≥ 97% of cases pass a standard set of computerized edits; ≤ 5% of cases were ascertained by death certificate
only; ≤ 3% of cases are missing information on sex; ≤ 5% of cases are missing information on race; ≤ 3% of cases are
missing information on age. See Appendix H for registry-specific data quality information.† Excludes basal and squamous cell carcinomas of the skin except when these occur on the skin of the genital organs, and in
situ cancers except urinary bladder.‡ Rates are age-adjusted to the 2000 U.S. standard population. See Table 2.1.1-2.25.2 for 95% confidence intervals for rates
and footnote regarding 1999 population denominators. Rates are suppressed and not ranked if case counts are fewer than 16 or
if the population of the specific race-sex category is less than 50,000.
Note: ONS - Other Nervous System; NOS - Not Otherwise Specified; IBD - Intrahepatic Bile Duct.
Urinary bladder cases include invasive and in situ.
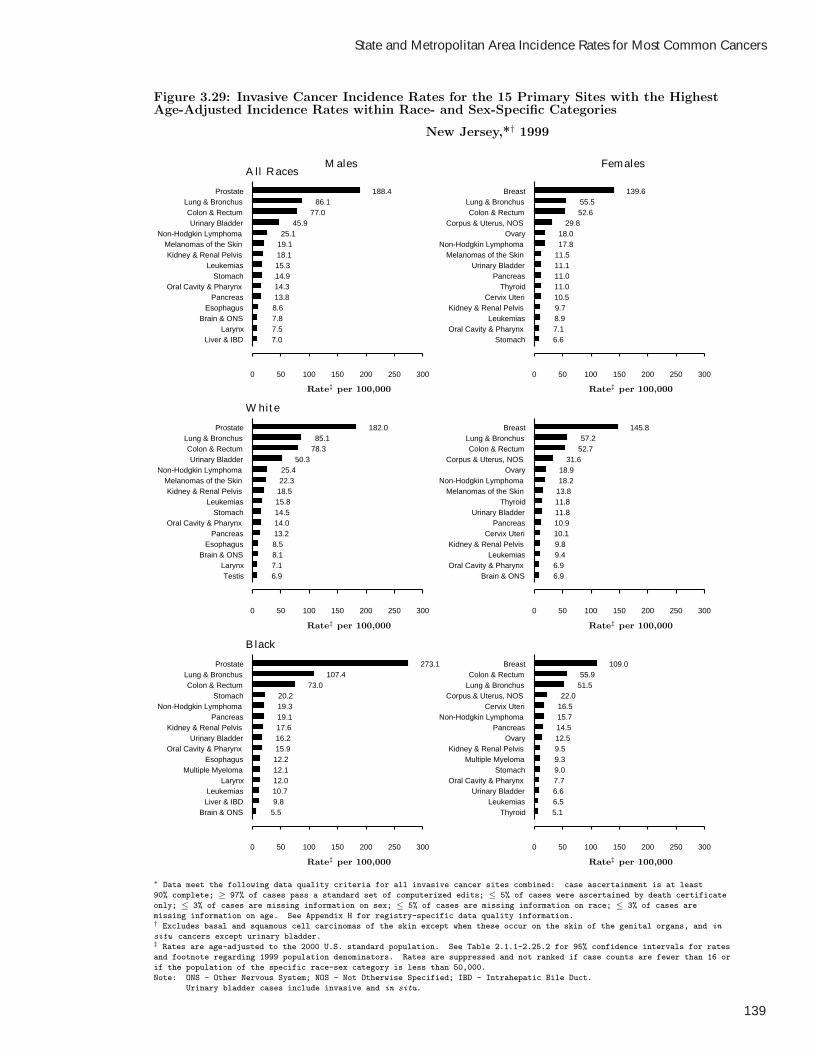
State and Metropolitan Area Incidence Rates for Most Common Cancers
139
Figure 3.29: Invasive Cancer Incidence Rates for the 15 Primary Sites with the HighestAge-Adjusted Incidence Rates within Race- and Sex-Specific Categories
New Jersey,*† 1999
Liver & IBDLarynx
Brain & ONSEsophagus
PancreasOral Cavity & Pharynx
StomachLeukemias
Kidney & Renal PelvisMelanomas of the Skin
Non-Hodgkin LymphomaUrinary Bladder
Colon & RectumLung & Bronchus
Prostate
0 50 100 150 200 250 300
7.07.57.88.613.814.314.915.318.119.125.1
45.977.0
86.1188.4
StomachOral Cavity & Pharynx
LeukemiasKidney & Renal Pelvis
Cervix UteriThyroid
PancreasUrinary Bladder
Melanomas of the SkinNon-Hodgkin Lymphoma
OvaryCorpus & Uterus, NOS
Colon & RectumLung & Bronchus
Breast
0 50 100 150 200 250 300
6.67.18.99.710.511.011.011.111.517.818.0
29.852.655.5
139.6
TestisLarynx
Brain & ONSEsophagus
PancreasOral Cavity & Pharynx
StomachLeukemias
Kidney & Renal PelvisMelanomas of the Skin
Non-Hodgkin LymphomaUrinary Bladder
Colon & RectumLung & Bronchus
Prostate
0 50 100 150 200 250 300
6.97.18.18.513.214.014.515.818.522.325.4
50.378.385.1
182.0
Brain & ONSOral Cavity & Pharynx
LeukemiasKidney & Renal Pelvis
Cervix UteriPancreas
Urinary BladderThyroid
Melanomas of the SkinNon-Hodgkin Lymphoma
OvaryCorpus & Uterus, NOS
Colon & RectumLung & Bronchus
Breast
0 50 100 150 200 250 300
6.96.99.49.810.110.911.811.813.818.218.9
31.652.757.2
145.8
Brain & ONSLiver & IBDLeukemias
LarynxMultiple Myeloma
EsophagusOral Cavity & Pharynx
Urinary BladderKidney & Renal Pelvis
PancreasNon-Hodgkin Lymphoma
StomachColon & Rectum
Lung & BronchusProstate
0 50 100 150 200 250 300
5.59.810.712.012.112.215.916.217.619.119.320.2
73.0107.4
273.1
ThyroidLeukemias
Urinary BladderOral Cavity & Pharynx
StomachMultiple Myeloma
Kidney & Renal PelvisOvary
PancreasNon-Hodgkin Lymphoma
Cervix UteriCorpus & Uterus, NOS
Lung & BronchusColon & Rectum
Breast
0 50 100 150 200 250 300
5.16.56.67.79.09.39.512.514.515.716.522.0
51.555.9
109.0
Rate‡ per 100,000Rate‡ per 100,000
Rate‡ per 100,000Rate‡ per 100,000
Rate‡ per 100,000Rate‡ per 100,000
Males FemalesAll Races
White
Black
∗ Data meet the following data quality criteria for all invasive cancer sites combined: case ascertainment is at least
90% complete; ≥ 97% of cases pass a standard set of computerized edits; ≤ 5% of cases were ascertained by death certificate
only; ≤ 3% of cases are missing information on sex; ≤ 5% of cases are missing information on race; ≤ 3% of cases are
missing information on age. See Appendix H for registry-specific data quality information.† Excludes basal and squamous cell carcinomas of the skin except when these occur on the skin of the genital organs, and in
situ cancers except urinary bladder.‡ Rates are age-adjusted to the 2000 U.S. standard population. See Table 2.1.1-2.25.2 for 95% confidence intervals for rates
and footnote regarding 1999 population denominators. Rates are suppressed and not ranked if case counts are fewer than 16 or
if the population of the specific race-sex category is less than 50,000.
Note: ONS - Other Nervous System; NOS - Not Otherwise Specified; IBD - Intrahepatic Bile Duct.
Urinary bladder cases include invasive and in situ.
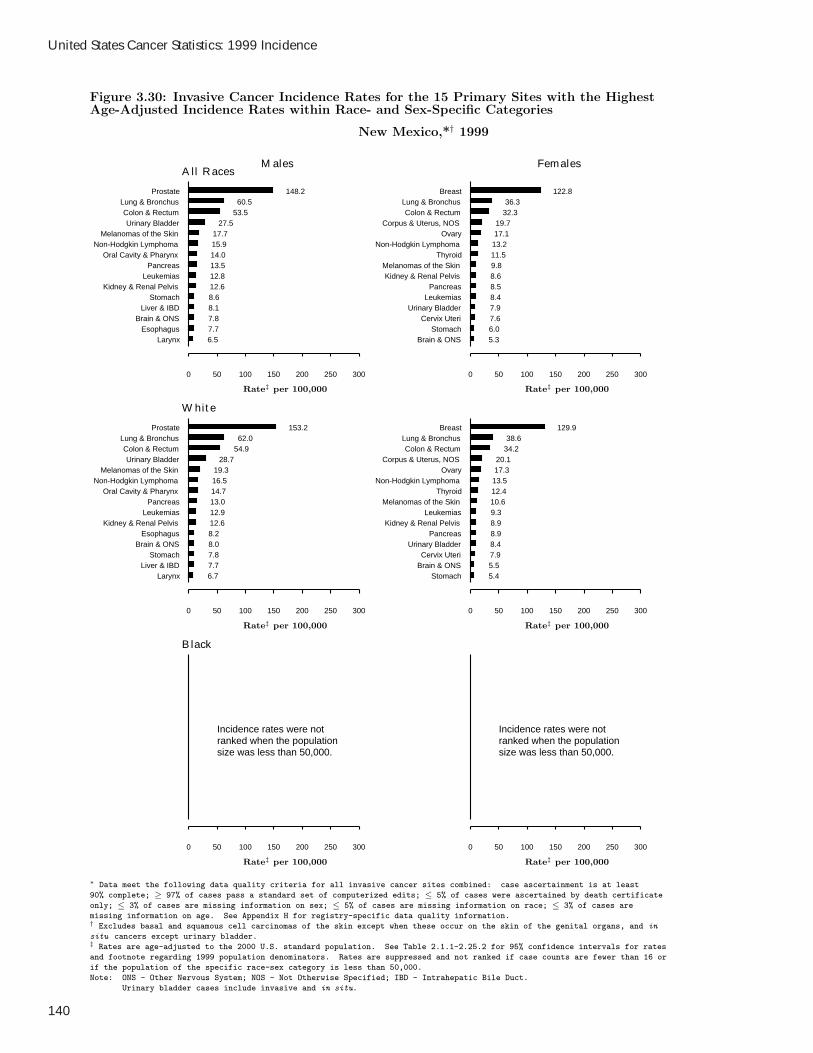
United States Cancer Statistics: 1999 Incidence
140
Figure 3.30: Invasive Cancer Incidence Rates for the 15 Primary Sites with the HighestAge-Adjusted Incidence Rates within Race- and Sex-Specific Categories
New Mexico,*† 1999
LarynxEsophagus
Brain & ONSLiver & IBD
StomachKidney & Renal Pelvis
LeukemiasPancreas
Oral Cavity & PharynxNon-Hodgkin Lymphoma
Melanomas of the SkinUrinary Bladder
Colon & RectumLung & Bronchus
Prostate
0 50 100 150 200 250 300
6.57.77.88.18.612.612.813.514.015.917.7
27.553.560.5
148.2
Brain & ONSStomach
Cervix UteriUrinary Bladder
LeukemiasPancreas
Kidney & Renal PelvisMelanomas of the Skin
ThyroidNon-Hodgkin Lymphoma
OvaryCorpus & Uterus, NOS
Colon & RectumLung & Bronchus
Breast
0 50 100 150 200 250 300
5.36.07.67.98.48.58.69.811.513.217.119.7
32.336.3
122.8
LarynxLiver & IBD
StomachBrain & ONS
EsophagusKidney & Renal Pelvis
LeukemiasPancreas
Oral Cavity & PharynxNon-Hodgkin Lymphoma
Melanomas of the SkinUrinary Bladder
Colon & RectumLung & Bronchus
Prostate
0 50 100 150 200 250 300
6.77.77.88.08.212.612.913.014.716.519.3
28.754.962.0
153.2
StomachBrain & ONSCervix Uteri
Urinary BladderPancreas
Kidney & Renal PelvisLeukemias
Melanomas of the SkinThyroid
Non-Hodgkin LymphomaOvary
Corpus & Uterus, NOSColon & Rectum
Lung & BronchusBreast
0 50 100 150 200 250 300
5.45.57.98.48.98.99.310.612.413.517.320.1
34.238.6
129.9
0 50 100 150 200 250 300
Incidence rates were notranked when the populationsize was less than 50,000.
0 50 100 150 200 250 300
Incidence rates were notranked when the populationsize was less than 50,000.
Rate‡ per 100,000Rate‡ per 100,000
Rate‡ per 100,000Rate‡ per 100,000
Rate‡ per 100,000Rate‡ per 100,000
Males FemalesAll Races
White
Black
∗ Data meet the following data quality criteria for all invasive cancer sites combined: case ascertainment is at least
90% complete; ≥ 97% of cases pass a standard set of computerized edits; ≤ 5% of cases were ascertained by death certificate
only; ≤ 3% of cases are missing information on sex; ≤ 5% of cases are missing information on race; ≤ 3% of cases are
missing information on age. See Appendix H for registry-specific data quality information.† Excludes basal and squamous cell carcinomas of the skin except when these occur on the skin of the genital organs, and in
situ cancers except urinary bladder.‡ Rates are age-adjusted to the 2000 U.S. standard population. See Table 2.1.1-2.25.2 for 95% confidence intervals for rates
and footnote regarding 1999 population denominators. Rates are suppressed and not ranked if case counts are fewer than 16 or
if the population of the specific race-sex category is less than 50,000.
Note: ONS - Other Nervous System; NOS - Not Otherwise Specified; IBD - Intrahepatic Bile Duct.
Urinary bladder cases include invasive and in situ.
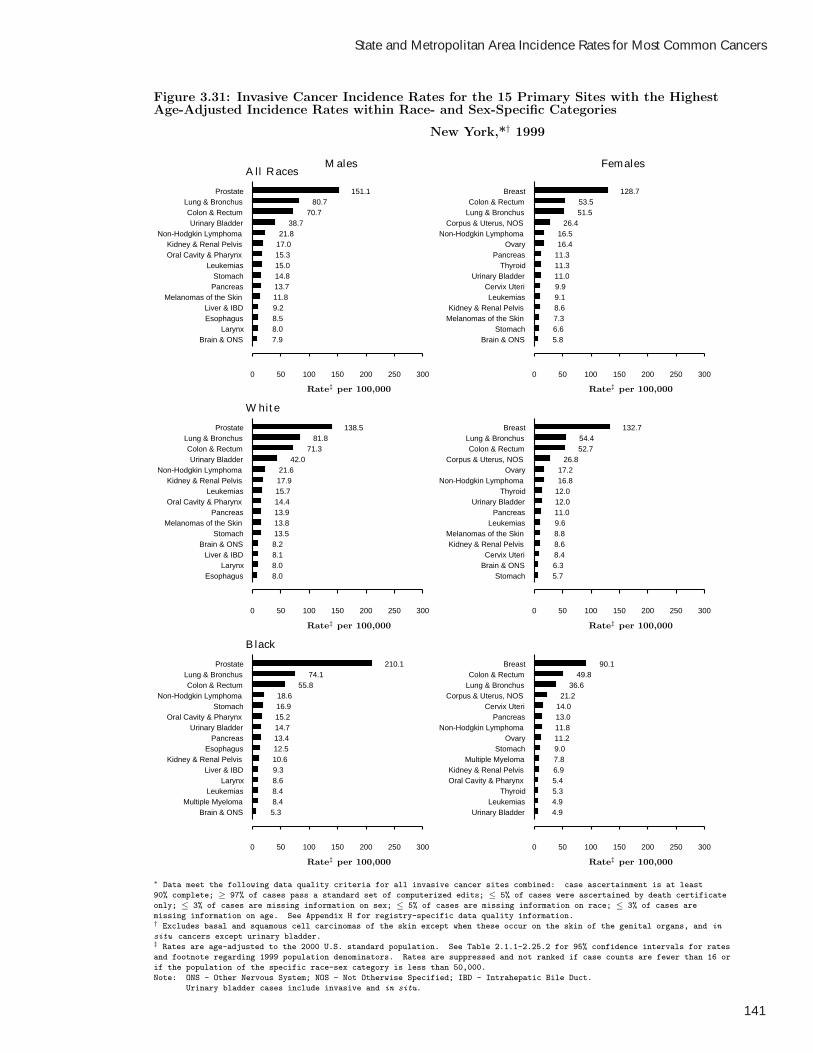
State and Metropolitan Area Incidence Rates for Most Common Cancers
141
Figure 3.31: Invasive Cancer Incidence Rates for the 15 Primary Sites with the HighestAge-Adjusted Incidence Rates within Race- and Sex-Specific Categories
New York,*† 1999
Brain & ONSLarynx
EsophagusLiver & IBD
Melanomas of the SkinPancreasStomach
LeukemiasOral Cavity & PharynxKidney & Renal Pelvis
Non-Hodgkin LymphomaUrinary Bladder
Colon & RectumLung & Bronchus
Prostate
0 50 100 150 200 250 300
7.98.08.59.211.813.714.815.015.317.021.8
38.770.7
80.7151.1
Brain & ONSStomach
Melanomas of the SkinKidney & Renal Pelvis
LeukemiasCervix Uteri
Urinary BladderThyroid
PancreasOvary
Non-Hodgkin LymphomaCorpus & Uterus, NOS
Lung & BronchusColon & Rectum
Breast
0 50 100 150 200 250 300
5.86.67.38.69.19.911.011.311.316.416.5
26.451.553.5
128.7
EsophagusLarynx
Liver & IBDBrain & ONS
StomachMelanomas of the Skin
PancreasOral Cavity & Pharynx
LeukemiasKidney & Renal Pelvis
Non-Hodgkin LymphomaUrinary Bladder
Colon & RectumLung & Bronchus
Prostate
0 50 100 150 200 250 300
8.08.08.18.213.513.813.914.415.717.921.6
42.071.3
81.8138.5
StomachBrain & ONSCervix Uteri
Kidney & Renal PelvisMelanomas of the Skin
LeukemiasPancreas
Urinary BladderThyroid
Non-Hodgkin LymphomaOvary
Corpus & Uterus, NOSColon & Rectum
Lung & BronchusBreast
0 50 100 150 200 250 300
5.76.38.48.68.89.611.012.012.016.817.2
26.852.754.4
132.7
Brain & ONSMultiple Myeloma
LeukemiasLarynx
Liver & IBDKidney & Renal Pelvis
EsophagusPancreas
Urinary BladderOral Cavity & Pharynx
StomachNon-Hodgkin Lymphoma
Colon & RectumLung & Bronchus
Prostate
0 50 100 150 200 250 300
5.38.48.48.69.310.612.513.414.715.216.918.6
55.874.1
210.1
Urinary BladderLeukemias
ThyroidOral Cavity & PharynxKidney & Renal Pelvis
Multiple MyelomaStomach
OvaryNon-Hodgkin Lymphoma
PancreasCervix Uteri
Corpus & Uterus, NOSLung & BronchusColon & Rectum
Breast
0 50 100 150 200 250 300
4.94.95.35.46.97.89.011.211.813.014.021.2
36.649.8
90.1
Rate‡ per 100,000Rate‡ per 100,000
Rate‡ per 100,000Rate‡ per 100,000
Rate‡ per 100,000Rate‡ per 100,000
Males FemalesAll Races
White
Black
∗ Data meet the following data quality criteria for all invasive cancer sites combined: case ascertainment is at least
90% complete; ≥ 97% of cases pass a standard set of computerized edits; ≤ 5% of cases were ascertained by death certificate
only; ≤ 3% of cases are missing information on sex; ≤ 5% of cases are missing information on race; ≤ 3% of cases are
missing information on age. See Appendix H for registry-specific data quality information.† Excludes basal and squamous cell carcinomas of the skin except when these occur on the skin of the genital organs, and in
situ cancers except urinary bladder.‡ Rates are age-adjusted to the 2000 U.S. standard population. See Table 2.1.1-2.25.2 for 95% confidence intervals for rates
and footnote regarding 1999 population denominators. Rates are suppressed and not ranked if case counts are fewer than 16 or
if the population of the specific race-sex category is less than 50,000.
Note: ONS - Other Nervous System; NOS - Not Otherwise Specified; IBD - Intrahepatic Bile Duct.
Urinary bladder cases include invasive and in situ.

United States Cancer Statistics: 1999 Incidence
142
Figure 3.32: Invasive Cancer Incidence Rates for the 15 Primary Sites with the HighestAge-Adjusted Incidence Rates within Race- and Sex-Specific Categories
North Carolina,*† 1999
Multiple MyelomaEsophagus
Brain & ONSStomach
LarynxLeukemias
PancreasKidney & Renal PelvisOral Cavity & Pharynx
Melanomas of the SkinNon-Hodgkin Lymphoma
Urinary BladderColon & Rectum
Lung & BronchusProstate
0 50 100 150 200 250 300
5.27.38.49.09.111.712.214.216.017.118.0
31.753.4
103.2140.8
Brain & ONSOral Cavity & Pharynx
ThyroidLeukemias
Kidney & Renal PelvisUrinary Bladder
PancreasCervix Uteri
Melanomas of the SkinNon-Hodgkin Lymphoma
OvaryCorpus & Uterus, NOS
Colon & RectumLung & Bronchus
Breast
0 50 100 150 200 250 300
4.85.96.57.48.18.49.29.511.312.015.120.0
42.151.0
123.2
TestisEsophagus
StomachLarynx
Brain & ONSPancreas
LeukemiasKidney & Renal PelvisOral Cavity & Pharynx
Non-Hodgkin LymphomaMelanomas of the Skin
Urinary BladderColon & Rectum
Lung & BronchusProstate
0 50 100 150 200 250 300
5.16.56.68.39.612.212.513.914.519.120.7
34.252.7
101.9129.8
Brain & ONSOral Cavity & Pharynx
ThyroidLeukemias
Kidney & Renal PelvisPancreas
Cervix UteriUrinary Bladder
Non-Hodgkin LymphomaMelanomas of the Skin
OvaryCorpus & Uterus, NOS
Colon & RectumLung & Bronchus
Breast
0 50 100 150 200 250 300
5.55.87.37.68.18.58.79.212.814.016.720.2
41.053.8
125.8
Hodgkin LymphomaLiver & IBD
Multiple MyelomaLeukemias
Non-Hodgkin LymphomaEsophagus
PancreasLarynx
Kidney & Renal PelvisUrinary Bladder
StomachOral Cavity & Pharynx
Colon & RectumLung & Bronchus
Prostate
0 50 100 150 200 250 300
2.94.57.77.811.411.612.513.515.118.421.022.7
57.6111.8
195.9
ThyroidUrinary Bladder
Multiple MyelomaOral Cavity & Pharynx
LeukemiasKidney & Renal Pelvis
StomachOvary
Non-Hodgkin LymphomaPancreas
Cervix UteriCorpus & Uterus, NOS
Lung & BronchusColon & Rectum
Breast
0 50 100 150 200 250 300
3.74.56.06.36.37.88.08.99.112.612.820.2
38.347.5
110.9
Rate‡ per 100,000Rate‡ per 100,000
Rate‡ per 100,000Rate‡ per 100,000
Rate‡ per 100,000Rate‡ per 100,000
Males FemalesAll Races
White
Black
∗ Data meet the following data quality criteria for all invasive cancer sites combined: case ascertainment is at least
90% complete; ≥ 97% of cases pass a standard set of computerized edits; ≤ 5% of cases were ascertained by death certificate
only; ≤ 3% of cases are missing information on sex; ≤ 5% of cases are missing information on race; ≤ 3% of cases are
missing information on age. See Appendix H for registry-specific data quality information.† Excludes basal and squamous cell carcinomas of the skin except when these occur on the skin of the genital organs, and in
situ cancers except urinary bladder.‡ Rates are age-adjusted to the 2000 U.S. standard population. See Table 2.1.1-2.25.2 for 95% confidence intervals for rates
and footnote regarding 1999 population denominators. Rates are suppressed and not ranked if case counts are fewer than 16 or
if the population of the specific race-sex category is less than 50,000.
Note: ONS - Other Nervous System; NOS - Not Otherwise Specified; IBD - Intrahepatic Bile Duct.
Urinary bladder cases include invasive and in situ.

State and Metropolitan Area Incidence Rates for Most Common Cancers
143
Figure 3.33: Invasive Cancer Incidence Rates for the 15 Primary Sites with the HighestAge-Adjusted Incidence Rates within Race- and Sex-Specific Categories
North Dakota,*† 1999
Brain & ONSTestis
EsophagusPancreas
Melanomas of the SkinStomach
LeukemiasOral Cavity & PharynxKidney & Renal Pelvis
Non-Hodgkin LymphomaUrinary Bladder
Colon & RectumLung & Bronchus
Prostate
0 50 100 150 200 250 300
5.35.96.27.210.510.714.516.416.624.0
40.569.169.3
192.9
Oral Cavity & PharynxKidney & Renal Pelvis
Multiple MyelomaCervix Uteri
Melanomas of the SkinPancreas
LeukemiasUrinary Bladder
ThyroidNon-Hodgkin Lymphoma
OvaryCorpus & Uterus, NOS
Lung & BronchusColon & Rectum
Breast
0 50 100 150 200 250 300
4.95.45.65.86.58.18.48.99.513.415.823.0
37.242.0
130.3
Brain & ONSTestis
EsophagusPancreas
Melanomas of the SkinStomach
LeukemiasOral Cavity & PharynxKidney & Renal Pelvis
Non-Hodgkin LymphomaUrinary Bladder
Lung & BronchusColon & Rectum
Prostate
0 50 100 150 200 250 300
5.46.26.37.310.810.914.916.216.6
24.440.8
68.669.1
193.4
Oral Cavity & PharynxMultiple Myeloma
Kidney & Renal PelvisCervix Uteri
Melanomas of the SkinPancreas
LeukemiasUrinary Bladder
ThyroidNon-Hodgkin Lymphoma
OvaryCorpus & Uterus, NOS
Lung & BronchusColon & Rectum
Breast
0 50 100 150 200 250 300
4.85.45.66.06.58.38.78.89.613.616.1
23.736.841.6
130.8
0 50 100 150 200 250 300
Incidence rates were notranked when the populationsize was less than 50,000.
0 50 100 150 200 250 300
Incidence rates were notranked when the populationsize was less than 50,000.
Rate‡ per 100,000Rate‡ per 100,000
Rate‡ per 100,000Rate‡ per 100,000
Rate‡ per 100,000Rate‡ per 100,000
Males FemalesAll Races
White
Black
∗ Data meet the following data quality criteria for all invasive cancer sites combined: case ascertainment is at least
90% complete; ≥ 97% of cases pass a standard set of computerized edits; ≤ 5% of cases were ascertained by death certificate
only; ≤ 3% of cases are missing information on sex; ≤ 5% of cases are missing information on race; ≤ 3% of cases are
missing information on age. See Appendix H for registry-specific data quality information.† Excludes basal and squamous cell carcinomas of the skin except when these occur on the skin of the genital organs, and in
situ cancers except urinary bladder.‡ Rates are age-adjusted to the 2000 U.S. standard population. See Table 2.1.1-2.25.2 for 95% confidence intervals for rates
and footnote regarding 1999 population denominators. Rates are suppressed and not ranked if case counts are fewer than 16 or
if the population of the specific race-sex category is less than 50,000.
Note: ONS - Other Nervous System; NOS - Not Otherwise Specified; IBD - Intrahepatic Bile Duct.
Urinary bladder cases include invasive and in situ.
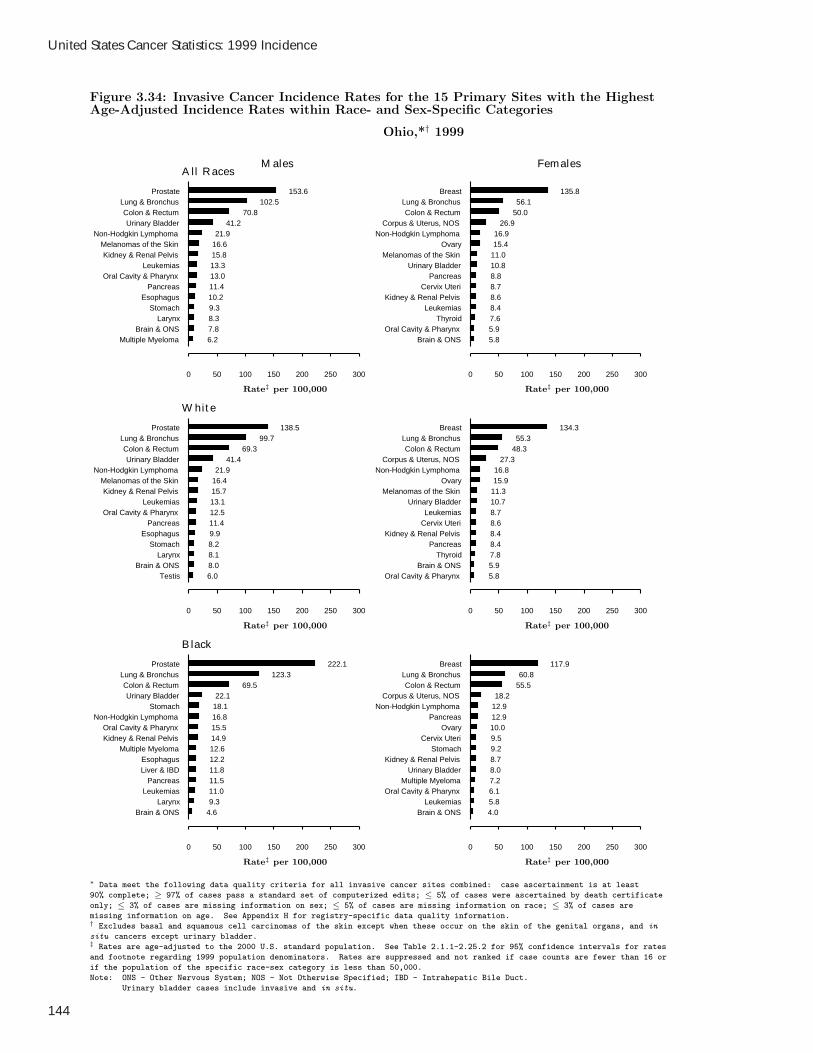
United States Cancer Statistics: 1999 Incidence
144
Figure 3.34: Invasive Cancer Incidence Rates for the 15 Primary Sites with the HighestAge-Adjusted Incidence Rates within Race- and Sex-Specific Categories
Ohio,*† 1999
Multiple MyelomaBrain & ONS
LarynxStomach
EsophagusPancreas
Oral Cavity & PharynxLeukemias
Kidney & Renal PelvisMelanomas of the Skin
Non-Hodgkin LymphomaUrinary Bladder
Colon & RectumLung & Bronchus
Prostate
0 50 100 150 200 250 300
6.27.88.39.310.211.413.013.315.816.621.9
41.270.8
102.5153.6
Brain & ONSOral Cavity & Pharynx
ThyroidLeukemias
Kidney & Renal PelvisCervix Uteri
PancreasUrinary Bladder
Melanomas of the SkinOvary
Non-Hodgkin LymphomaCorpus & Uterus, NOS
Colon & RectumLung & Bronchus
Breast
0 50 100 150 200 250 300
5.85.97.68.48.68.78.810.811.015.416.9
26.950.056.1
135.8
TestisBrain & ONS
LarynxStomach
EsophagusPancreas
Oral Cavity & PharynxLeukemias
Kidney & Renal PelvisMelanomas of the Skin
Non-Hodgkin LymphomaUrinary Bladder
Colon & RectumLung & Bronchus
Prostate
0 50 100 150 200 250 300
6.08.08.18.29.911.412.513.115.716.421.9
41.469.3
99.7138.5
Oral Cavity & PharynxBrain & ONS
ThyroidPancreas
Kidney & Renal PelvisCervix UteriLeukemias
Urinary BladderMelanomas of the Skin
OvaryNon-Hodgkin Lymphoma
Corpus & Uterus, NOSColon & Rectum
Lung & BronchusBreast
0 50 100 150 200 250 300
5.85.97.88.48.48.68.710.711.315.916.8
27.348.355.3
134.3
Brain & ONSLarynx
LeukemiasPancreas
Liver & IBDEsophagus
Multiple MyelomaKidney & Renal PelvisOral Cavity & Pharynx
Non-Hodgkin LymphomaStomach
Urinary BladderColon & Rectum
Lung & BronchusProstate
0 50 100 150 200 250 300
4.69.311.011.511.812.212.614.915.516.818.122.1
69.5123.3
222.1
Brain & ONSLeukemias
Oral Cavity & PharynxMultiple Myeloma
Urinary BladderKidney & Renal Pelvis
StomachCervix Uteri
OvaryPancreas
Non-Hodgkin LymphomaCorpus & Uterus, NOS
Colon & RectumLung & Bronchus
Breast
0 50 100 150 200 250 300
4.05.86.17.28.08.79.29.510.012.912.918.2
55.560.8
117.9
Rate‡ per 100,000Rate‡ per 100,000
Rate‡ per 100,000Rate‡ per 100,000
Rate‡ per 100,000Rate‡ per 100,000
Males FemalesAll Races
White
Black
∗ Data meet the following data quality criteria for all invasive cancer sites combined: case ascertainment is at least
90% complete; ≥ 97% of cases pass a standard set of computerized edits; ≤ 5% of cases were ascertained by death certificate
only; ≤ 3% of cases are missing information on sex; ≤ 5% of cases are missing information on race; ≤ 3% of cases are
missing information on age. See Appendix H for registry-specific data quality information.† Excludes basal and squamous cell carcinomas of the skin except when these occur on the skin of the genital organs, and in
situ cancers except urinary bladder.‡ Rates are age-adjusted to the 2000 U.S. standard population. See Table 2.1.1-2.25.2 for 95% confidence intervals for rates
and footnote regarding 1999 population denominators. Rates are suppressed and not ranked if case counts are fewer than 16 or
if the population of the specific race-sex category is less than 50,000.
Note: ONS - Other Nervous System; NOS - Not Otherwise Specified; IBD - Intrahepatic Bile Duct.
Urinary bladder cases include invasive and in situ.

State and Metropolitan Area Incidence Rates for Most Common Cancers
145
Figure 3.35: Invasive Cancer Incidence Rates for the 15 Primary Sites with the HighestAge-Adjusted Incidence Rates within Race- and Sex-Specific Categories
Oregon,*† 1999
Multiple MyelomaTestis
EsophagusBrain & ONS
StomachPancreas
LeukemiasKidney & Renal PelvisOral Cavity & Pharynx
Non-Hodgkin LymphomaMelanomas of the Skin
Urinary BladderColon & Rectum
Lung & BronchusProstate
0 50 100 150 200 250 300
6.17.27.98.18.612.313.815.216.422.623.7
42.856.7
86.1176.2
Brain & ONSOral Cavity & PharynxKidney & Renal Pelvis
Cervix UteriThyroid
LeukemiasUrinary Bladder
PancreasNon-Hodgkin Lymphoma
OvaryMelanomas of the SkinCorpus & Uterus, NOS
Colon & RectumLung & Bronchus
Breast
0 50 100 150 200 250 300
5.16.57.88.58.68.79.810.416.016.316.5
24.248.4
60.8151.5
Multiple MyelomaTestis
EsophagusStomach
Brain & ONSPancreas
LeukemiasKidney & Renal PelvisOral Cavity & Pharynx
Non-Hodgkin LymphomaMelanomas of the Skin
Urinary BladderColon & Rectum
Lung & BronchusProstate
0 50 100 150 200 250 300
6.17.47.98.18.312.114.014.816.722.124.4
42.656.3
85.5173.1
Brain & ONSOral Cavity & PharynxKidney & Renal Pelvis
Cervix UteriLeukemias
ThyroidUrinary Bladder
PancreasNon-Hodgkin Lymphoma
Melanomas of the SkinOvary
Corpus & Uterus, NOSColon & Rectum
Lung & BronchusBreast
0 50 100 150 200 250 300
5.26.48.08.58.78.89.910.315.916.616.7
24.348.1
61.6153.0
0 50 100 150 200 250 300
Incidence rates were notranked when the populationsize was less than 50,000.
0 50 100 150 200 250 300
Incidence rates were notranked when the populationsize was less than 50,000.
Rate‡ per 100,000Rate‡ per 100,000
Rate‡ per 100,000Rate‡ per 100,000
Rate‡ per 100,000Rate‡ per 100,000
Males FemalesAll Races
White
Black
∗ Data meet the following data quality criteria for all invasive cancer sites combined: case ascertainment is at least
90% complete; ≥ 97% of cases pass a standard set of computerized edits; ≤ 5% of cases were ascertained by death certificate
only; ≤ 3% of cases are missing information on sex; ≤ 5% of cases are missing information on race; ≤ 3% of cases are
missing information on age. See Appendix H for registry-specific data quality information.† Excludes basal and squamous cell carcinomas of the skin except when these occur on the skin of the genital organs, and in
situ cancers except urinary bladder.‡ Rates are age-adjusted to the 2000 U.S. standard population. See Table 2.1.1-2.25.2 for 95% confidence intervals for rates
and footnote regarding 1999 population denominators. Rates are suppressed and not ranked if case counts are fewer than 16 or
if the population of the specific race-sex category is less than 50,000.
Note: ONS - Other Nervous System; NOS - Not Otherwise Specified; IBD - Intrahepatic Bile Duct.
Urinary bladder cases include invasive and in situ.

United States Cancer Statistics: 1999 Incidence
146
Figure 3.36: Invasive Cancer Incidence Rates for the 15 Primary Sites with the HighestAge-Adjusted Incidence Rates within Race- and Sex-Specific Categories
Pennsylvania,*† 1999
Liver & IBDBrain & ONS
LarynxEsophagus
StomachPancreas
LeukemiasOral Cavity & Pharynx
Melanomas of the SkinKidney & Renal Pelvis
Non-Hodgkin LymphomaUrinary Bladder
Colon & RectumLung & Bronchus
Prostate
0 50 100 150 200 250 300
7.38.18.79.612.213.315.515.517.017.823.6
45.074.6
94.2169.0
Brain & ONSOral Cavity & PharynxKidney & Renal Pelvis
Cervix UteriLeukemias
PancreasMelanomas of the Skin
Urinary BladderThyroid
Non-Hodgkin LymphomaOvary
Corpus & Uterus, NOSLung & BronchusColon & Rectum
Breast
0 50 100 150 200 250 300
5.65.98.89.39.49.59.911.612.516.718.0
30.151.953.5
136.2
TestisLarynx
Brain & ONSEsophagus
StomachPancreas
Oral Cavity & PharynxLeukemias
Melanomas of the SkinKidney & Renal Pelvis
Non-Hodgkin LymphomaUrinary Bladder
Colon & RectumLung & Bronchus
Prostate
0 50 100 150 200 250 300
6.18.28.39.011.312.614.515.617.317.423.1
46.273.8
89.9159.4
Oral Cavity & PharynxBrain & ONS
Kidney & Renal PelvisCervix Uteri
PancreasLeukemias
Melanomas of the SkinUrinary Bladder
ThyroidNon-Hodgkin Lymphoma
OvaryCorpus & Uterus, NOS
Lung & BronchusColon & Rectum
Breast
0 50 100 150 200 250 300
5.55.78.58.59.19.310.311.812.316.718.3
31.050.652.7
135.1
ThyroidLeukemias
Multiple MyelomaLarynx
EsophagusLiver & IBD
Non-Hodgkin LymphomaPancreas
Kidney & Renal PelvisUrinary Bladder
StomachOral Cavity & Pharynx
Colon & RectumLung & Bronchus
Prostate
0 50 100 150 200 250 300
4.110.913.113.514.916.619.519.721.422.122.423.9
76.7147.2
241.7
Oral Cavity & PharynxLeukemias
StomachUrinary Bladder
Non-Hodgkin LymphomaMultiple Myeloma
ThyroidKidney & Renal Pelvis
OvaryPancreas
Cervix UteriCorpus & Uterus, NOS
Colon & RectumLung & Bronchus
Breast
0 50 100 150 200 250 300
7.49.59.59.710.810.911.311.712.513.015.517.0
58.063.7
125.1
Rate‡ per 100,000Rate‡ per 100,000
Rate‡ per 100,000Rate‡ per 100,000
Rate‡ per 100,000Rate‡ per 100,000
Males FemalesAll Races
White
Black
∗ Data meet the following data quality criteria for all invasive cancer sites combined: case ascertainment is at least
90% complete; ≥ 97% of cases pass a standard set of computerized edits; ≤ 5% of cases were ascertained by death certificate
only; ≤ 3% of cases are missing information on sex; ≤ 5% of cases are missing information on race; ≤ 3% of cases are
missing information on age. See Appendix H for registry-specific data quality information.† Excludes basal and squamous cell carcinomas of the skin except when these occur on the skin of the genital organs, and in
situ cancers except urinary bladder.‡ Rates are age-adjusted to the 2000 U.S. standard population. See Table 2.1.1-2.25.2 for 95% confidence intervals for rates
and footnote regarding 1999 population denominators. Rates are suppressed and not ranked if case counts are fewer than 16 or
if the population of the specific race-sex category is less than 50,000.
Note: ONS - Other Nervous System; NOS - Not Otherwise Specified; IBD - Intrahepatic Bile Duct.
Urinary bladder cases include invasive and in situ.
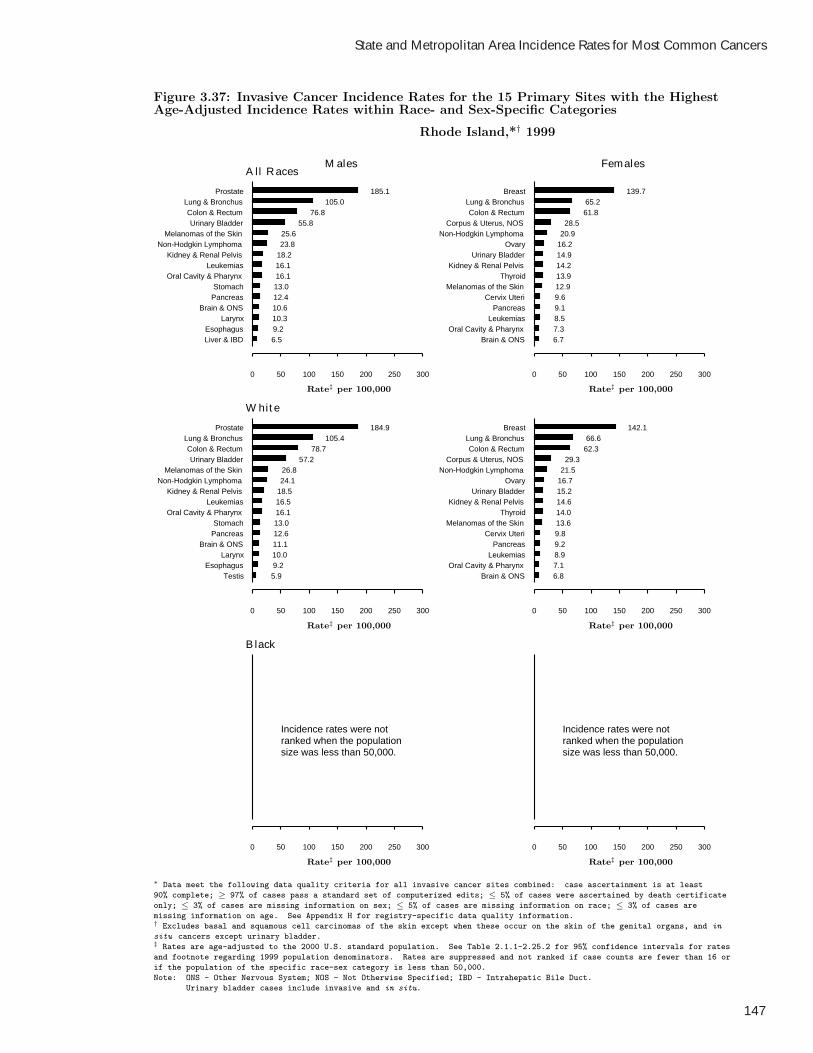
State and Metropolitan Area Incidence Rates for Most Common Cancers
147
Figure 3.37: Invasive Cancer Incidence Rates for the 15 Primary Sites with the HighestAge-Adjusted Incidence Rates within Race- and Sex-Specific Categories
Rhode Island,*† 1999
Liver & IBDEsophagus
LarynxBrain & ONS
PancreasStomach
Oral Cavity & PharynxLeukemias
Kidney & Renal PelvisNon-Hodgkin Lymphoma
Melanomas of the SkinUrinary Bladder
Colon & RectumLung & Bronchus
Prostate
0 50 100 150 200 250 300
6.59.210.310.612.413.016.116.118.223.825.6
55.876.8
105.0185.1
Brain & ONSOral Cavity & Pharynx
LeukemiasPancreas
Cervix UteriMelanomas of the Skin
ThyroidKidney & Renal Pelvis
Urinary BladderOvary
Non-Hodgkin LymphomaCorpus & Uterus, NOS
Colon & RectumLung & Bronchus
Breast
0 50 100 150 200 250 300
6.77.38.59.19.612.913.914.214.916.220.928.5
61.865.2
139.7
TestisEsophagus
LarynxBrain & ONS
PancreasStomach
Oral Cavity & PharynxLeukemias
Kidney & Renal PelvisNon-Hodgkin Lymphoma
Melanomas of the SkinUrinary Bladder
Colon & RectumLung & Bronchus
Prostate
0 50 100 150 200 250 300
5.99.210.011.112.613.016.116.518.524.126.8
57.278.7
105.4184.9
Brain & ONSOral Cavity & Pharynx
LeukemiasPancreas
Cervix UteriMelanomas of the Skin
ThyroidKidney & Renal Pelvis
Urinary BladderOvary
Non-Hodgkin LymphomaCorpus & Uterus, NOS
Colon & RectumLung & Bronchus
Breast
0 50 100 150 200 250 300
6.87.18.99.29.813.614.014.615.216.721.5
29.362.366.6
142.1
0 50 100 150 200 250 300
Incidence rates were notranked when the populationsize was less than 50,000.
0 50 100 150 200 250 300
Incidence rates were notranked when the populationsize was less than 50,000.
Rate‡ per 100,000Rate‡ per 100,000
Rate‡ per 100,000Rate‡ per 100,000
Rate‡ per 100,000Rate‡ per 100,000
Males FemalesAll Races
White
Black
∗ Data meet the following data quality criteria for all invasive cancer sites combined: case ascertainment is at least
90% complete; ≥ 97% of cases pass a standard set of computerized edits; ≤ 5% of cases were ascertained by death certificate
only; ≤ 3% of cases are missing information on sex; ≤ 5% of cases are missing information on race; ≤ 3% of cases are
missing information on age. See Appendix H for registry-specific data quality information.† Excludes basal and squamous cell carcinomas of the skin except when these occur on the skin of the genital organs, and in
situ cancers except urinary bladder.‡ Rates are age-adjusted to the 2000 U.S. standard population. See Table 2.1.1-2.25.2 for 95% confidence intervals for rates
and footnote regarding 1999 population denominators. Rates are suppressed and not ranked if case counts are fewer than 16 or
if the population of the specific race-sex category is less than 50,000.
Note: ONS - Other Nervous System; NOS - Not Otherwise Specified; IBD - Intrahepatic Bile Duct.
Urinary bladder cases include invasive and in situ.
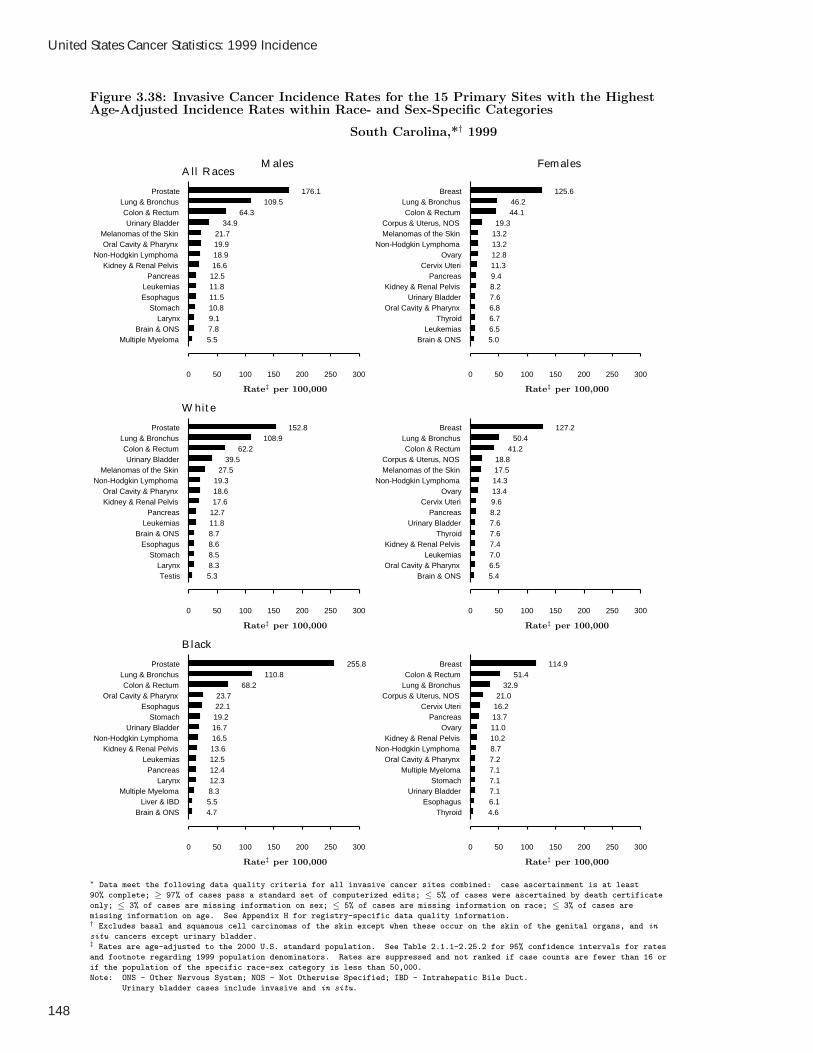
United States Cancer Statistics: 1999 Incidence
148
Figure 3.38: Invasive Cancer Incidence Rates for the 15 Primary Sites with the HighestAge-Adjusted Incidence Rates within Race- and Sex-Specific Categories
South Carolina,*† 1999
Multiple MyelomaBrain & ONS
LarynxStomach
EsophagusLeukemias
PancreasKidney & Renal Pelvis
Non-Hodgkin LymphomaOral Cavity & Pharynx
Melanomas of the SkinUrinary Bladder
Colon & RectumLung & Bronchus
Prostate
0 50 100 150 200 250 300
5.57.89.110.811.511.812.516.618.919.921.7
34.964.3
109.5176.1
Brain & ONSLeukemias
ThyroidOral Cavity & Pharynx
Urinary BladderKidney & Renal Pelvis
PancreasCervix Uteri
OvaryNon-Hodgkin Lymphoma
Melanomas of the SkinCorpus & Uterus, NOS
Colon & RectumLung & Bronchus
Breast
0 50 100 150 200 250 300
5.06.56.76.87.68.29.411.312.813.213.219.3
44.146.2
125.6
TestisLarynx
StomachEsophagus
Brain & ONSLeukemias
PancreasKidney & Renal PelvisOral Cavity & Pharynx
Non-Hodgkin LymphomaMelanomas of the Skin
Urinary BladderColon & Rectum
Lung & BronchusProstate
0 50 100 150 200 250 300
5.38.38.58.68.711.812.717.618.619.3
27.539.5
62.2108.9
152.8
Brain & ONSOral Cavity & Pharynx
LeukemiasKidney & Renal Pelvis
ThyroidUrinary Bladder
PancreasCervix Uteri
OvaryNon-Hodgkin Lymphoma
Melanomas of the SkinCorpus & Uterus, NOS
Colon & RectumLung & Bronchus
Breast
0 50 100 150 200 250 300
5.46.57.07.47.67.68.29.613.414.317.518.8
41.250.4
127.2
Brain & ONSLiver & IBD
Multiple MyelomaLarynx
PancreasLeukemias
Kidney & Renal PelvisNon-Hodgkin Lymphoma
Urinary BladderStomach
EsophagusOral Cavity & Pharynx
Colon & RectumLung & Bronchus
Prostate
0 50 100 150 200 250 300
4.75.58.312.312.412.513.616.516.719.222.123.7
68.2110.8
255.8
ThyroidEsophagus
Urinary BladderStomach
Multiple MyelomaOral Cavity & Pharynx
Non-Hodgkin LymphomaKidney & Renal Pelvis
OvaryPancreas
Cervix UteriCorpus & Uterus, NOS
Lung & BronchusColon & Rectum
Breast
0 50 100 150 200 250 300
4.66.17.17.17.17.28.710.211.013.716.221.0
32.951.4
114.9
Rate‡ per 100,000Rate‡ per 100,000
Rate‡ per 100,000Rate‡ per 100,000
Rate‡ per 100,000Rate‡ per 100,000
Males FemalesAll Races
White
Black
∗ Data meet the following data quality criteria for all invasive cancer sites combined: case ascertainment is at least
90% complete; ≥ 97% of cases pass a standard set of computerized edits; ≤ 5% of cases were ascertained by death certificate
only; ≤ 3% of cases are missing information on sex; ≤ 5% of cases are missing information on race; ≤ 3% of cases are
missing information on age. See Appendix H for registry-specific data quality information.† Excludes basal and squamous cell carcinomas of the skin except when these occur on the skin of the genital organs, and in
situ cancers except urinary bladder.‡ Rates are age-adjusted to the 2000 U.S. standard population. See Table 2.1.1-2.25.2 for 95% confidence intervals for rates
and footnote regarding 1999 population denominators. Rates are suppressed and not ranked if case counts are fewer than 16 or
if the population of the specific race-sex category is less than 50,000.
Note: ONS - Other Nervous System; NOS - Not Otherwise Specified; IBD - Intrahepatic Bile Duct.
Urinary bladder cases include invasive and in situ.
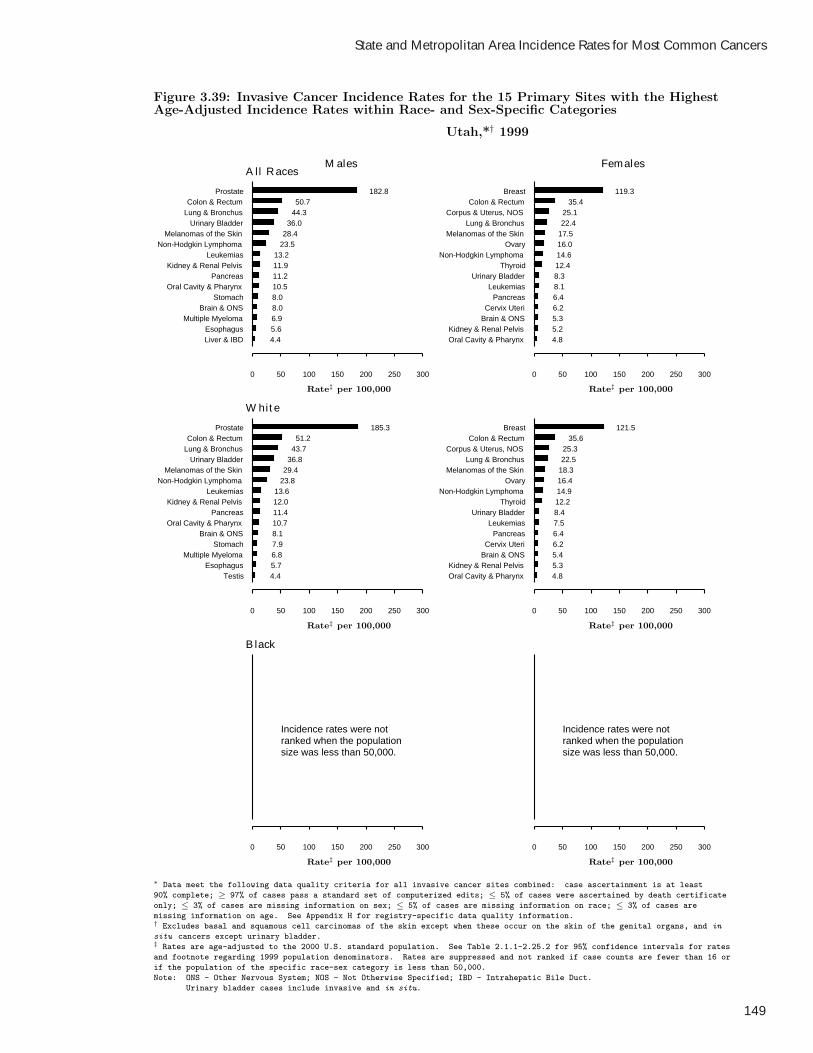
State and Metropolitan Area Incidence Rates for Most Common Cancers
149
Figure 3.39: Invasive Cancer Incidence Rates for the 15 Primary Sites with the HighestAge-Adjusted Incidence Rates within Race- and Sex-Specific Categories
Utah,*† 1999
Liver & IBDEsophagus
Multiple MyelomaBrain & ONS
StomachOral Cavity & Pharynx
PancreasKidney & Renal Pelvis
LeukemiasNon-Hodgkin Lymphoma
Melanomas of the SkinUrinary Bladder
Lung & BronchusColon & Rectum
Prostate
0 50 100 150 200 250 300
4.45.66.98.08.010.511.211.913.2
23.528.436.0
44.350.7
182.8
Oral Cavity & PharynxKidney & Renal Pelvis
Brain & ONSCervix Uteri
PancreasLeukemias
Urinary BladderThyroid
Non-Hodgkin LymphomaOvary
Melanomas of the SkinLung & Bronchus
Corpus & Uterus, NOSColon & Rectum
Breast
0 50 100 150 200 250 300
4.85.25.36.26.48.18.312.414.616.017.522.425.1
35.4119.3
TestisEsophagus
Multiple MyelomaStomach
Brain & ONSOral Cavity & Pharynx
PancreasKidney & Renal Pelvis
LeukemiasNon-Hodgkin Lymphoma
Melanomas of the SkinUrinary Bladder
Lung & BronchusColon & Rectum
Prostate
0 50 100 150 200 250 300
4.45.76.87.98.110.711.412.013.6
23.829.436.843.751.2
185.3
Oral Cavity & PharynxKidney & Renal Pelvis
Brain & ONSCervix Uteri
PancreasLeukemias
Urinary BladderThyroid
Non-Hodgkin LymphomaOvary
Melanomas of the SkinLung & Bronchus
Corpus & Uterus, NOSColon & Rectum
Breast
0 50 100 150 200 250 300
4.85.35.46.26.47.58.412.214.916.418.322.525.3
35.6121.5
0 50 100 150 200 250 300
Incidence rates were notranked when the populationsize was less than 50,000.
0 50 100 150 200 250 300
Incidence rates were notranked when the populationsize was less than 50,000.
Rate‡ per 100,000Rate‡ per 100,000
Rate‡ per 100,000Rate‡ per 100,000
Rate‡ per 100,000Rate‡ per 100,000
Males FemalesAll Races
White
Black
∗ Data meet the following data quality criteria for all invasive cancer sites combined: case ascertainment is at least
90% complete; ≥ 97% of cases pass a standard set of computerized edits; ≤ 5% of cases were ascertained by death certificate
only; ≤ 3% of cases are missing information on sex; ≤ 5% of cases are missing information on race; ≤ 3% of cases are
missing information on age. See Appendix H for registry-specific data quality information.† Excludes basal and squamous cell carcinomas of the skin except when these occur on the skin of the genital organs, and in
situ cancers except urinary bladder.‡ Rates are age-adjusted to the 2000 U.S. standard population. See Table 2.1.1-2.25.2 for 95% confidence intervals for rates
and footnote regarding 1999 population denominators. Rates are suppressed and not ranked if case counts are fewer than 16 or
if the population of the specific race-sex category is less than 50,000.
Note: ONS - Other Nervous System; NOS - Not Otherwise Specified; IBD - Intrahepatic Bile Duct.
Urinary bladder cases include invasive and in situ.
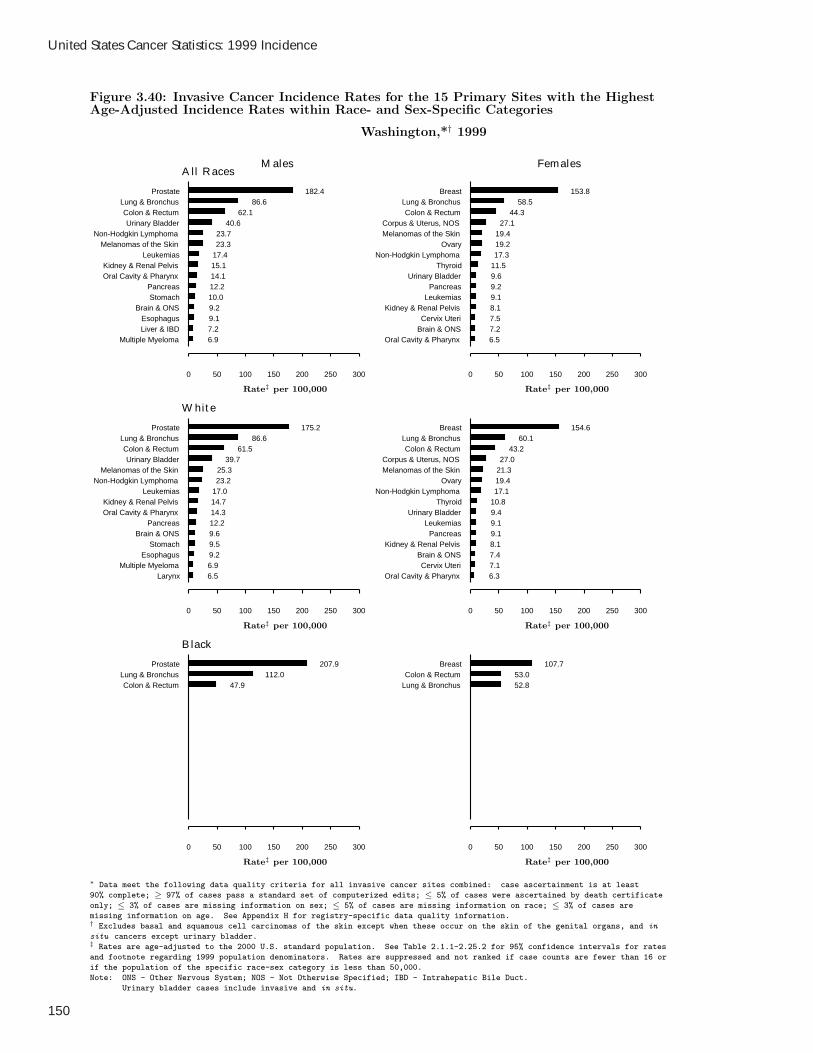
United States Cancer Statistics: 1999 Incidence
150
Figure 3.40: Invasive Cancer Incidence Rates for the 15 Primary Sites with the HighestAge-Adjusted Incidence Rates within Race- and Sex-Specific Categories
Washington,*† 1999
Multiple MyelomaLiver & IBDEsophagus
Brain & ONSStomach
PancreasOral Cavity & PharynxKidney & Renal Pelvis
LeukemiasMelanomas of the Skin
Non-Hodgkin LymphomaUrinary Bladder
Colon & RectumLung & Bronchus
Prostate
0 50 100 150 200 250 300
6.97.29.19.210.012.214.115.117.423.323.7
40.662.1
86.6182.4
Oral Cavity & PharynxBrain & ONSCervix Uteri
Kidney & Renal PelvisLeukemias
PancreasUrinary Bladder
ThyroidNon-Hodgkin Lymphoma
OvaryMelanomas of the SkinCorpus & Uterus, NOS
Colon & RectumLung & Bronchus
Breast
0 50 100 150 200 250 300
6.57.27.58.19.19.29.611.517.319.219.4
27.144.3
58.5153.8
LarynxMultiple Myeloma
EsophagusStomach
Brain & ONSPancreas
Oral Cavity & PharynxKidney & Renal Pelvis
LeukemiasNon-Hodgkin Lymphoma
Melanomas of the SkinUrinary Bladder
Colon & RectumLung & Bronchus
Prostate
0 50 100 150 200 250 300
6.56.99.29.59.612.214.314.717.023.225.3
39.761.5
86.6175.2
Oral Cavity & PharynxCervix Uteri
Brain & ONSKidney & Renal Pelvis
PancreasLeukemias
Urinary BladderThyroid
Non-Hodgkin LymphomaOvary
Melanomas of the SkinCorpus & Uterus, NOS
Colon & RectumLung & Bronchus
Breast
0 50 100 150 200 250 300
6.37.17.48.19.19.19.410.817.119.421.327.0
43.260.1
154.6
Colon & RectumLung & Bronchus
Prostate
0 50 100 150 200 250 300
47.9112.0
207.9
Lung & BronchusColon & Rectum
Breast
0 50 100 150 200 250 300
52.853.0
107.7
Rate‡ per 100,000Rate‡ per 100,000
Rate‡ per 100,000Rate‡ per 100,000
Rate‡ per 100,000Rate‡ per 100,000
Males FemalesAll Races
White
Black
∗ Data meet the following data quality criteria for all invasive cancer sites combined: case ascertainment is at least
90% complete; ≥ 97% of cases pass a standard set of computerized edits; ≤ 5% of cases were ascertained by death certificate
only; ≤ 3% of cases are missing information on sex; ≤ 5% of cases are missing information on race; ≤ 3% of cases are
missing information on age. See Appendix H for registry-specific data quality information.† Excludes basal and squamous cell carcinomas of the skin except when these occur on the skin of the genital organs, and in
situ cancers except urinary bladder.‡ Rates are age-adjusted to the 2000 U.S. standard population. See Table 2.1.1-2.25.2 for 95% confidence intervals for rates
and footnote regarding 1999 population denominators. Rates are suppressed and not ranked if case counts are fewer than 16 or
if the population of the specific race-sex category is less than 50,000.
Note: ONS - Other Nervous System; NOS - Not Otherwise Specified; IBD - Intrahepatic Bile Duct.
Urinary bladder cases include invasive and in situ.

State and Metropolitan Area Incidence Rates for Most Common Cancers
151
Figure 3.41: Invasive Cancer Incidence Rates for the 15 Primary Sites with the HighestAge-Adjusted Incidence Rates within Race- and Sex-Specific Categories
Seattle-Puget Sound,*† 1999
Multiple MyelomaLiver & IBD
Brain & ONSEsophagus
StomachPancreas
Oral Cavity & PharynxKidney & Renal Pelvis
LeukemiasMelanomas of the Skin
Non-Hodgkin LymphomaUrinary Bladder
Colon & RectumLung & Bronchus
Prostate
0 50 100 150 200 250 300
7.48.29.39.411.213.014.515.018.423.425.3
43.161.0
90.3187.5
Cervix UteriOral Cavity & Pharynx
Brain & ONSKidney & Renal Pelvis
LeukemiasUrinary Bladder
PancreasThyroid
Non-Hodgkin LymphomaMelanomas of the Skin
OvaryCorpus & Uterus, NOS
Colon & RectumLung & Bronchus
Breast
0 50 100 150 200 250 300
6.16.57.07.79.310.010.712.217.518.920.627.0
45.763.3
156.1
Liver & IBDMultiple Myeloma
EsophagusBrain & ONS
StomachPancreas
Kidney & Renal PelvisOral Cavity & Pharynx
LeukemiasNon-Hodgkin Lymphoma
Melanomas of the SkinUrinary Bladder
Colon & RectumLung & Bronchus
Prostate
0 50 100 150 200 250 300
6.77.49.810.010.313.114.915.218.125.025.7
44.061.4
90.9189.4
Cervix UteriOral Cavity & Pharynx
Brain & ONSKidney & Renal Pelvis
LeukemiasUrinary Bladder
PancreasThyroid
Non-Hodgkin LymphomaMelanomas of the Skin
OvaryCorpus & Uterus, NOS
Colon & RectumLung & Bronchus
Breast
0 50 100 150 200 250 300
6.16.47.37.79.410.410.611.917.820.921.627.6
45.466.3
160.8
Colon & RectumLung & Bronchus
Prostate
0 50 100 150 200 250 300
52.7118.7
217.2
Lung & BronchusColon & Rectum
Breast
0 50 100 150 200 250 300
54.259.8
106.7
Rate‡ per 100,000Rate‡ per 100,000
Rate‡ per 100,000Rate‡ per 100,000
Rate‡ per 100,000Rate‡ per 100,000
Males FemalesAll Races
White
Black
∗ Data meet the following data quality criteria for all invasive cancer sites combined: case ascertainment is at least
90% complete; ≥ 97% of cases pass a standard set of computerized edits; ≤ 5% of cases were ascertained by death certificate
only; ≤ 3% of cases are missing information on sex; ≤ 5% of cases are missing information on race; ≤ 3% of cases are
missing information on age. See Appendix H for registry-specific data quality information.† Excludes basal and squamous cell carcinomas of the skin except when these occur on the skin of the genital organs, and in
situ cancers except urinary bladder.‡ Rates are age-adjusted to the 2000 U.S. standard population. See Table 2.1.1-2.25.2 for 95% confidence intervals for rates
and footnote regarding 1999 population denominators. Rates are suppressed and not ranked if case counts are fewer than 16 or
if the population of the specific race-sex category is less than 50,000.
Note: ONS - Other Nervous System; NOS - Not Otherwise Specified; IBD - Intrahepatic Bile Duct.
Urinary bladder cases include invasive and in situ.

United States Cancer Statistics: 1999 Incidence
152
Figure 3.42: Invasive Cancer Incidence Rates for the 15 Primary Sites with the HighestAge-Adjusted Incidence Rates within Race- and Sex-Specific Categories
West Virginia,*† 1999
Liver & IBDBrain & ONS
EsophagusStomach
LarynxPancreas
Oral Cavity & PharynxKidney & Renal Pelvis
LeukemiasMelanomas of the Skin
Non-Hodgkin LymphomaUrinary Bladder
Colon & RectumLung & Bronchus
Prostate
0 50 100 150 200 250 300
5.57.57.88.110.410.616.316.616.819.222.2
39.873.3
126.3144.8
Oral Cavity & PharynxBrain & ONS
PancreasKidney & Renal Pelvis
LeukemiasThyroid
Melanomas of the SkinCervix Uteri
Urinary BladderOvary
Non-Hodgkin LymphomaCorpus & Uterus, NOS
Colon & RectumLung & Bronchus
Breast
0 50 100 150 200 250 300
5.86.06.58.69.910.911.513.413.814.616.8
26.252.2
67.5123.5
Multiple MyelomaEsophagus
Brain & ONSStomach
LarynxPancreas
Oral Cavity & PharynxKidney & Renal Pelvis
LeukemiasMelanomas of the Skin
Non-Hodgkin LymphomaUrinary Bladder
Colon & RectumLung & Bronchus
Prostate
0 50 100 150 200 250 300
5.47.67.78.110.110.415.516.216.517.522.4
40.172.3
126.4141.0
Oral Cavity & PharynxBrain & ONS
PancreasKidney & Renal Pelvis
LeukemiasMelanomas of the Skin
ThyroidCervix Uteri
Urinary BladderOvary
Non-Hodgkin LymphomaCorpus & Uterus, NOS
Colon & RectumLung & Bronchus
Breast
0 50 100 150 200 250 300
5.96.06.68.410.010.411.113.513.715.016.6
26.352.0
67.0122.7
0 50 100 150 200 250 300
Incidence rates were notranked when the populationsize was less than 50,000.
0 50 100 150 200 250 300
Incidence rates were notranked when the populationsize was less than 50,000.
Rate‡ per 100,000Rate‡ per 100,000
Rate‡ per 100,000Rate‡ per 100,000
Rate‡ per 100,000Rate‡ per 100,000
Males FemalesAll Races
White
Black
∗ Data meet the following data quality criteria for all invasive cancer sites combined: case ascertainment is at least
90% complete; ≥ 97% of cases pass a standard set of computerized edits; ≤ 5% of cases were ascertained by death certificate
only; ≤ 3% of cases are missing information on sex; ≤ 5% of cases are missing information on race; ≤ 3% of cases are
missing information on age. See Appendix H for registry-specific data quality information.† Excludes basal and squamous cell carcinomas of the skin except when these occur on the skin of the genital organs, and in
situ cancers except urinary bladder.‡ Rates are age-adjusted to the 2000 U.S. standard population. See Table 2.1.1-2.25.2 for 95% confidence intervals for rates
and footnote regarding 1999 population denominators. Rates are suppressed and not ranked if case counts are fewer than 16 or
if the population of the specific race-sex category is less than 50,000.
Note: ONS - Other Nervous System; NOS - Not Otherwise Specified; IBD - Intrahepatic Bile Duct.
Urinary bladder cases include invasive and in situ.

State and Metropolitan Area Incidence Rates for Most Common Cancers
153
Figure 3.43: Invasive Cancer Incidence Rates for the 15 Primary Sites with the HighestAge-Adjusted Incidence Rates within Race- and Sex-Specific Categories
Wisconsin,*† 1999
LarynxTestis
Brain & ONSEsophagus
StomachPancreas
Melanomas of the SkinLeukemias
Oral Cavity & PharynxKidney & Renal Pelvis
Non-Hodgkin LymphomaUrinary Bladder
Colon & RectumLung & Bronchus
Prostate
0 50 100 150 200 250 300
6.77.57.69.59.911.913.015.917.218.523.0
37.670.6
83.0161.2
Brain & ONSOral Cavity & Pharynx
ThyroidKidney & Renal Pelvis
Melanomas of the SkinCervix Uteri
PancreasLeukemias
Urinary BladderOvary
Non-Hodgkin LymphomaCorpus & Uterus, NOS
Lung & BronchusColon & Rectum
Breast
0 50 100 150 200 250 300
6.26.28.58.99.19.810.010.310.413.915.1
25.946.947.3
132.8
LarynxBrain & ONS
TestisEsophagus
StomachPancreas
Melanomas of the SkinLeukemias
Oral Cavity & PharynxKidney & Renal Pelvis
Non-Hodgkin LymphomaUrinary Bladder
Colon & RectumLung & Bronchus
Prostate
0 50 100 150 200 250 300
6.47.77.89.29.611.713.415.916.518.222.6
38.369.9
81.5156.8
Brain & ONSOral Cavity & Pharynx
Cervix UteriThyroid
Kidney & Renal PelvisMelanomas of the Skin
PancreasLeukemias
Urinary BladderOvary
Non-Hodgkin LymphomaCorpus & Uterus, NOS
Colon & RectumLung & Bronchus
Breast
0 50 100 150 200 250 300
6.26.28.99.09.09.49.410.410.714.215.3
26.446.346.3
132.2
Non-Hodgkin LymphomaKidney & Renal PelvisOral Cavity & Pharynx
Colon & RectumLung & Bronchus
Prostate
0 50 100 150 200 250 300
22.926.2
43.469.1
135.0278.5
Cervix UteriPancreas
Lung & BronchusColon & Rectum
Breast
0 50 100 150 200 250 300
20.228.6
65.067.7
140.8
Rate‡ per 100,000Rate‡ per 100,000
Rate‡ per 100,000Rate‡ per 100,000
Rate‡ per 100,000Rate‡ per 100,000
Males FemalesAll Races
White
Black
∗ Data meet the following data quality criteria for all invasive cancer sites combined: case ascertainment is at least
90% complete; ≥ 97% of cases pass a standard set of computerized edits; ≤ 5% of cases were ascertained by death certificate
only; ≤ 3% of cases are missing information on sex; ≤ 5% of cases are missing information on race; ≤ 3% of cases are
missing information on age. See Appendix H for registry-specific data quality information.† Excludes basal and squamous cell carcinomas of the skin except when these occur on the skin of the genital organs, and in
situ cancers except urinary bladder.‡ Rates are age-adjusted to the 2000 U.S. standard population. See Table 2.1.1-2.25.2 for 95% confidence intervals for rates
and footnote regarding 1999 population denominators. Rates are suppressed and not ranked if case counts are fewer than 16 or
if the population of the specific race-sex category is less than 50,000.
Note: ONS - Other Nervous System; NOS - Not Otherwise Specified; IBD - Intrahepatic Bile Duct.
Urinary bladder cases include invasive and in situ.

United States Cancer Statistics: 1999 Incidence
154
Figure 3.44: Invasive Cancer Incidence Rates for the 15 Primary Sites with the HighestAge-Adjusted Incidence Rates within Race- and Sex-Specific Categories
Wyoming,*† 1999
Brain & ONSOral Cavity & PharynxKidney & Renal Pelvis
Non-Hodgkin LymphomaLeukemias
PancreasMelanomas of the Skin
Urinary BladderColon & Rectum
Lung & BronchusProstate
0 50 100 150 200 250 300
10.113.914.115.016.316.4
28.142.5
65.968.9
172.0
PancreasOral Cavity & PharynxKidney & Renal Pelvis
ThyroidUrinary Bladder
Cervix UteriLeukemias
Melanomas of the SkinOvary
Non-Hodgkin LymphomaCorpus & Uterus, NOS
Lung & BronchusColon & Rectum
Breast
0 50 100 150 200 250 300
6.36.46.68.39.210.010.812.512.913.416.4
46.548.4
131.2
Brain & ONSOral Cavity & PharynxKidney & Renal Pelvis
Non-Hodgkin LymphomaPancreas
LeukemiasMelanomas of the Skin
Urinary BladderColon & Rectum
Lung & BronchusProstate
0 50 100 150 200 250 300
10.413.314.014.516.016.7
28.743.3
67.169.4
172.4
Kidney & Renal PelvisThyroid
Urinary BladderCervix UteriLeukemias
OvaryMelanomas of the Skin
Non-Hodgkin LymphomaCorpus & Uterus, NOS
Lung & BronchusColon & Rectum
Breast
0 50 100 150 200 250 300
6.78.39.410.311.112.012.913.316.0
45.948.1
133.0
0 50 100 150 200 250 300
Incidence rates were notranked when the populationsize was less than 50,000.
0 50 100 150 200 250 300
Incidence rates were notranked when the populationsize was less than 50,000.
Rate‡ per 100,000Rate‡ per 100,000
Rate‡ per 100,000Rate‡ per 100,000
Rate‡ per 100,000Rate‡ per 100,000
Males FemalesAll Races
White
Black
∗ Data meet the following data quality criteria for all invasive cancer sites combined: case ascertainment is at least
90% complete; ≥ 97% of cases pass a standard set of computerized edits; ≤ 5% of cases were ascertained by death certificate
only; ≤ 3% of cases are missing information on sex; ≤ 5% of cases are missing information on race; ≤ 3% of cases are
missing information on age. See Appendix H for registry-specific data quality information.† Excludes basal and squamous cell carcinomas of the skin except when these occur on the skin of the genital organs, and in
situ cancers except urinary bladder.‡ Rates are age-adjusted to the 2000 U.S. standard population. See Table 2.1.1-2.25.2 for 95% confidence intervals for rates
and footnote regarding 1999 population denominators. Rates are suppressed and not ranked if case counts are fewer than 16 or
if the population of the specific race-sex category is less than 50,000.
Note: ONS - Other Nervous System; NOS - Not Otherwise Specified; IBD - Intrahepatic Bile Duct.
Urinary bladder cases include invasive and in situ.

Appendices


Appendix A


Appendix A
A–1
Registries in bold contributed data to this report.
AlabamaAlabama Statewide Cancer RegistryAlabama Department of Public HealthP.O. Box 303017Montgomery, AL 36130-3017Phone: (334) 206-5552Fax: (334) 206-5324http://www.adph.org/cancer_registry/
AlaskaAlaska Cancer Registry3601 C Street, Suite 540P.O. Box 240249Anchorage, AK 99524-0249Phone: (907) 269-8000Fax: (907) 561-1896http://www.epi.hss.state.ak.us/programs/chronic/
ArizonaArizona Department of Health ServicesArizona Cancer Registry2700 North 3rd Street, Suite 4000Phoenix, AZ 85004Phone: (602) 542-7308Fax: (602) 364-0296http://www.hs.state.az.us/phs/phstats/
acr/index.htm
ArkansasArkansas Central Cancer RegistryArkansas Department of HealthDivision of Chronic Disease/Disability Prevention4815 West Markham Street, Slot 7Little Rock, AR 72205Phone: (501) 661-2392Fax: (501) 661-2891http://www.healthyarkansas.com/arkcancer/
arkcancer.html
CaliforniaCalifornia Department of Health ServicesCancer Surveillance Section1700 Tribute Road, Suite 100Sacramento, CA 95815-4402Phone: (916) 779-0303Fax: (916) 779-0264http://www.ccrcal.org/index.htm
Greater Bay Area CancerRegistry (San Francisco-Oakland and San Jose-Monterey)Greater Bay Area Cancer Registry32960 Alvarado-Niles Road, Suite 600Union City, CA 94578Phone: (510) 429-2500Fax: (510) 429-2550http://www.nccc.org/ResearchandTraining/
research_gbareg.html
Los AngelesLos Angeles Cancer Surveillance Program1540 Alcazar, CHP-204Los Angeles, CA 90033Phone: (323) 442-1574Fax: (323) 442-2301http://www.usc.edu/schools/medicine/
academic_departments/preventive_med/csp/index.html
ColoradoColorado Department of Public Health
and EnvironmentColorado Central Cancer RegistryPPD-CR-A54300 Cherry Creek Drive SouthDenver, CO 80246Phone: (303) 692-2542Fax: (303) 691-7721http://www.cdphe.state.co.us/pp/cccr/
cccrhom.asp
State and Metropolitan Area Cancer Registries
National Program of Cancer Registries (NPCR) and Surveillance, Epidemiology, and End Results (SEER) Program
ConnecticutConnecticut Tumor Registry410 Capitol AvenueP.O. Box 340308 MS # 13-TMRHartford, CT 06134Phone: (860) 509-7124Fax: (860) 509-7161http://www.dph.state.ct.us/OPPE/hptumor.htm
DelawareDelaware Department of Health
and Social ServicesDivision of Public HealthP.O. Box 637Dover, DE 19903Phone: (302) 739-5617Fax: (302) 739-6617
District of ColumbiaDistrict of Columbia Cancer RegistryDistrict of Columbia Department of Health825 North Capitol Street, N.E., Room 3145Washington, DC 20002Phone: (202) 442-5910Fax: (202) 442-9432http://www.dchealth.com/dccc/introduction.htm
FloridaFlorida Cancer Data SystemP.O. Box 016969 (D4-11)Miami, FL 33101Phone: (305) 243-3426Fax: (305) 243-4871http://fcds.med.miami.edu/
GeorgiaGeorgia Department of Human ResourcesDivision of Public Health2 Peachtree Street, N.W.14th floor, 14.283Atlanta, GA 30303Phone: (404) 657-1943Fax: (404) 463-0780http://www.ph.dhr.state.ga.us/programs/cancer/
AtlantaGeorgia Center for Cancer Statistics1518 Clifton Road, N.E.Atlanta, GA 30322Phone: (404) 727-4151Fax: (404) 727-7261http://www.sph.emory.edu/GCCS
HawaiiHawaii Tumor Registry1236 Lauhala StreetHonolulu, HI 96813Phone: (808) 586-9750Fax: (808) 587-0024http://planet-hawaii.com/htr/
IdahoIdaho Hospital AssociationCancer Data Registry of Idaho615 North 7th StreetBoise, ID 83702
orP.O. Box 1278Boise, ID 83701-1278Phone: (208) 338-5100Fax: (208) 338-7800http://www.idcancer.org/
United States Cancer Statistics: 1999 Incidence
A–2Registries in bold contributed data to this report.
llinoisIllinois State Cancer RegistryIllinois Department of Public Health605 West Jefferson StreetSpringfield, IL 62761Phone: (217) 785-1873Fax: (217) 524-1770http://www.idph.state.il.us/about/epi/cancer.htm
IndianaIndiana State Department of HealthState Cancer Registry2 North Meridian Street, Section 7-DIndianapolis, IN 46204Phone: (317) 233-7424Fax: (317) 233-7722http://www.state.in.us/isdh/dataandstats/data_and_statistics.htm
IowaState Health Registry of Iowa250 FB BuildingIowa City, IA 52242Phone: (319) 335-8508Fax: (319) 335-8610http://www.shri.us/
KansasKansas Cancer RegistryUniversity of Kansas Medical Center3901 Rainbow BoulevardKansas City, KS 66160-7313Phone: (913) 588-2744Fax: (913) 588-2780http://www.kumc.edu/som/kcr/
KentuckyKentucky Cancer Registry2365 Harrodsburg RoadLexington, KY 40504Phone: (859) 219-0773, ext. 225Fax: (859) 219-0557http://web.kcr.uky.edu/index.html
LouisianaLouisiana Tumor RegistryLouisiana State University Health Sciences
Center—New Orleans1600 Canal Street, Suite 900ANew Orleans, LA 70112Phone: (504) 568-4716Fax: (504) 568-2493http://www.lcltfb.org/registry.html
MaineMaine Cancer RegistryDivision of Family and Community HealthBureau of Health11 State House StationKey Bank Plaza 4th FloorAugusta, ME 04333-0011For items sent by FedEx, please use the zip code 04330.Phone: (207) 287-5196Fax: (207) 287-4631http://www.state.me.us/dhs/bohdcfh/mcr/index2.html
MarylandMaryland Cancer RegistryMaryland Department of Health
and Mental Hygiene201 West Preston Street, Suite 400Baltimore, MD 21201Phone: (410) 767-4055 or -5521Fax: (410) 333-5218
MassachusettsMassachusetts Department of Public HealthMassachusetts Cancer Registry250 Washington Street, 6th FloorBoston, MA 02108-4619Phone: (617) 624-5645Fax: (617) 624-5697http://www.state.ma.us/dph/bhsre/
mcr/canreg.htm
Appendix A
A–3Registries in bold contributed data to this report.

MichiganMichigan Cancer Surveillance ProgramVital Records and Health Data
Development SectionEpidemiological Services DivisionBureau of Epidemiology3423 North Martin Luther King BoulevardP.O. Box 30691Lansing, MI 48909Phone: (517) 335-8702Fax: (517) 335-8711www.michigan.gov/mdch/
DetroitKarmanos Cancer Institute110 East Warren AvenueDetroit, MI 48201Phone: (313) 833-0715, ext. 2329Fax: (313) 831-7806http://www.karmanos.org/epid/
MinnesotaMinnesota Cancer Surveillance SystemMinnesota Department of HealthChronic Disease and EnvironmentalEpidemiologyP.O. Box 9441Minneapolis, MN 55440-9441Phone: (612) 676-5374Fax: (612) 676-5099http://www.health.state.mn.us/divs/dpc/
cdee/mcss.htm/
MississippiMississippi Department of HealthP.O. Box 1700Jackson, MS 39215-1700Phone: (601) 576-7411Fax: (601) 576-7407http://www.cancer.msdh.state.ms.us/
MissouriMissouri Department of HealthOffice of Surveillance, Research and EvaluationDivision of Chronic Disease Prevention
and Health PromotionP.O. Box 570Jefferson City, MO 65102-0570Phone: (573) 522-2880Fax: (573) 522-2882
MontanaMontana Central Tumor RegistryMontana Department of Public Health
and Human ServicesHealth Policy and Services DivisionCogswell Building, P.O. Box 202952Helena, MT 59620-2952Phone: (406) 444-6786Fax: (406) 444-6557http://www.dphhs.state.mt.us/
NebraskaNebraska Department of Health
and Human ServicesPublic Health Assurance DivisionRegulation and LicensureP.O. Box 95007Lincoln, NE 68509-5007Phone: (402) 471-0147Fax: (402) 471-9728
NevadaNevada State Cancer Registry3811 West Charleston Boulevard, Suite 208Las Vegas, NV 89102Phone: (702) 486-6260, ext. 224Fax: (702) 486-7602
United States Cancer Statistics: 1999 Incidence
A–4
Registries in bold contributed data to this report.

New HampshireBureau of Health Statistics and DataManagementNew Hampshire Department of Health
and Human ServicesOffice of Community and Public HealthDivision of Epidemiology and Vital Statistics6 Hazen DriveConcord, NH 03301-6527Phone: (603) 271-5926Fax: (603) 271-8710
New JerseyNew Jersey State Cancer RegistryNew Jersey Department of Health
and Senior ServicesP.O. Box 369Trenton, NJ 08625-0369Phone: (609) 588-3500Fax: (609) 588-3638http://www.state.nj.us/health/cancer/
statistics.htm
New MexicoNew Mexico Tumor Registry2325 Camino de Salud, N.E.Albuquerque, NM 87131-5306Phone: (505) 272-5541Fax: (505) 272-8572http://hsc.unm.edu/epiccpro/
New YorkNew York State Cancer RegistryNew York State Department of HealthCorning Tower, Room 536Empire State PlazaAlbany, NY 12237-0679Phone: (518) 474-2255Fax: (518) 473-6789http://www.health.state.ny.us/nysdoh/
cancer/cancer.htm
North CarolinaNorth Carolina Central Cancer Registry1908 Mail Service CenterRaleigh, NC 27699-1908Phone: (919) 715-4558Fax: (919) 733-8485http://www.schs.state.nc.us/dphmoved.html
North DakotaNorth Dakota Department of HealthDivision of Health Promotion600 East Boulevard Avenue, Department 301Bismarck, ND 58505-0200Phone: (701) 328-2419Fax: (701) 328-2036http://www.health.state.nd.us/cancerregistry
OhioOhio Department of HealthBureau of Health Surveillance, Information,
and Operational SupportP.O. Box 118Columbus, OH 43266-0118Phone: (614) 466-5350Fax: (614) 644-1909http://www.odh.state.oh.us/ODHPrograms/
CI_SURV/ci_surv1.htm
OklahomaOklahoma Central Cancer RegistryChronic Disease ServiceOklahoma Department of Health1000 Northeast 10th StreetOklahoma City, OK 73117-1299Phone: (405) 271-4072, ext. 57123Fax: (405) 271-5181http://www.health.state.ok.us/program/cds/registry.html
Appendix A
A–5
Registries in bold contributed data to this report.
OregonOregon State Cancer RegistryOregon Health Division800 Northeast Oregon Street, Suite 730Portland, OR 97232Phone: (503) 731-4858Fax: (503) 731-4848http://www.ohd.hr.state.or.us/oscar/
welcome.htm
PennsylvaniaPennsylvania Cancer RegistryDivision of Statistical RegistriesPennsylvania Department of Health555 Walnut Street, 6th FloorHarrisburg, PA 17101-1914Phone: (717) 783-2548Fax: (717) 772-3258http://www.health.state.pa.us/stats/
Puerto RicoDepartamento de Salud de Puerto RicoRegistro Central de Puerto RicoP.O. Box 70184San Juan, PR 00927Phone: (787) 274-7866Fax: (787) 274-3347
Republic of PalauMinistry of Health, Republic of PalauP.O. Box 6027Koror, PW 96940Phone: 011-(680) 488-4612Fax: 011-(680) 488-1211
Rhode IslandRhode Island Department of Health3 Capitol HillProvidence, RI 02908-5097Phone: (401) 222-1172Fax: (401) 222-3551
South CarolinaSouth Carolina Department of Health
and Environmental ControlPHSIS/SCCCR2600 Bull StreetColumbia, SC 29201Phone: (803) 898-3626Fax: (803) 898-3599
South DakotaSouth Dakota Cancer RegistryOffice of Health Promotion, Health
and Medical ServicesDepartment of Health615 East 4th StreetPierre, SD 57501Phone: (605) 773-5740Fax: (605) 773-5509
TennesseeTennessee Cancer RegistryCordell Hull Building, 6th Floor North425 5th Avenue, NorthNashville, TN 37247Phone: (615) 532-7903Fax: (615) 532-7904
TexasTexas Department of HealthCancer Registry DivisionBureau of Epidemiology1100 West 49th StreetAustin, TX 78756-3199Phone: (512) 458-7523Fax: (512) 458-7681http://www.tdh.state.tx.us/tcr/
UtahUtah Cancer Registry546 Chipeta Way, Suite 410Salt Lake City, UT 84108Phone: (801) 581-8407Fax: (801) 581-4560http://www.uuhsc.utah.edu/ucr
United States Cancer Statistics: 1999 Incidence
A–6Registries in bold contributed data to this report.

VermontVermont Cancer RegistryVermont Department of HealthP.O. Box 70Burlington, VT 05402-0070Phone: (802) 863-7644Fax: (802) 651-1787http://www.healthyvermonters.info/
Virgin IslandsVirgin Islands Department of Health3500 Estate RichmondCharles Harwood Complex Christiansted, St. Croix, VI 00820-4370Phone: (340) 773-1311, ext. 3082Fax: (340) 773-0850
VirginiaVirginia Department of HealthP.O. Box 2448Room 114Richmond, VA 23218Phone: (804) 786-1668Fax: (804) 371-4061http://www.vdh.state.va.us/epi/cancer/index.htm
WashingtonWashington State Cancer RegistryDepartment of Health7211 Cleanwater Lane, Building 10Olympia, WA 98504-47835Phone: (360) 236-3676Fax: (360) 586-2714http://www.doh.wa.gov
Seattle-Puget SoundSeattle-Puget Sound Cancer
Surveillance System1100 Fairview Avenue North, MP-826MP-1146Seattle, WA 98109-1024Phone: (206) 667-4707Fax: (206) 667-4870http://css.fhcrc.org
West VirginiaWest Virginia Department of Health
and Human ResourcesBureau for Public HealthWest Virginia Cancer Registry350 Capitol Street, Room 126Charleston, WV 25301Phone: (304) 558-6421Fax: (304) 558-4463http://www.wvdhhr.org/bph/oehp/sdc/
cancerrep.htm
WisconsinWisconsin Department of Health
and Family ServicesBureau of Health InformationDivision of Health Care FinancingP.O. Box 309Madison, WI 53701-0309Phone: (608) 266-8926Fax: (608) 261-6380http://www.dhfs.state.wi.us/wcrs/index.htm
WyomingWyoming Cancer Surveillance ProgramWyoming Department of Health6101 Yellowstone Road, Room 259ACheyenne, WY 82002Phone: (307) 777-3477Fax: (307) 777-8604http://wdhfs.state.wy.us/cancer
Appendix A
A–7
Registries in bold contributed data to this report.


Appendix B


Appendix B
B–1
National Program of Cancer Registries
Scientific Workgroup MembersToni H. Bounds, PhD, MPH, Tennessee Cancer RegistryJudy Brockhouse, Wyoming Cancer Surveillance ProgramVivien W. Chen, PhD, Louisiana Tumor RegistryCatherine N. Correa, PhD, MPH, Louisiana Tumor RegistrySusan T. Gershman, PhD, MS, MPH, CTR, Massachusetts Cancer RegistryGeorgette G. Haydu, MS, Ohio Cancer Incidence Surveillance SystemDale Herman, MSPH, North Carolina Central Cancer RegistryHolly L. Howe, PhD, North American Association of Central Cancer RegistriesJeannette Jackson-Thompson, PhD, MSPH, Missouri Cancer RegistryAmy Kahn, MS, CTR, New York State Cancer RegistryBetsy Kohler, MPH, CTR, New Jersey State Cancer RegistrySue Min Lai, PhD, MS, MBA, Kansas Cancer RegistryJill A. MacKinnon, CTR, Florida Cancer Data SystemStacey Neloms, MPH, Maryland Cancer RegistryMargaret Parsons, MD, MPH, Maine Cancer RegistryMaria J. Schymura, PhD, New York State Cancer RegistryTiefu Shen, MD, PhD, Illinois State Cancer RegistryLaura Stephenson, Wisconsin Cancer Reporting SystemThomas C. Tucker, PhD, MPH, Kentucky Cancer RegistryNancy S. Weiss, PhD, Texas Cancer RegistryBrian D. Wright, BS, Pennsylvania Cancer RegistryWilliam E. Wright, PhD, California Cancer RegistryXiao Cheng Wu, MD, MPH, CTR, Louisiana Tumor Registry
Logistics Workgroup MembersToshi Abe, MSW, CTR, New Jersey State Cancer RegistryGlenn Copeland, MBA, Michigan Cancer Surveillance ProgramColleen C. McLaughlin, MPH, CTR, New York State Cancer RegistryFrances Michaud, CTR, Metropolitan Atlanta & Rural Georgia SEER RegistryLynn A.G. Ries, MS, National Cancer InstituteFrances E. Ross, CTR, Kentucky Cancer RegistryJennifer E. Seiffert, MLIS, CTR, TRW under contract to CDCDonald K. Shipley, MS, Oregon State Cancer RegistryJan Snodgrass, CTR, Illinois State Cancer RegistryLaura Stephenson, Wisconsin Cancer Reporting SystemReda Wilson, MPH, RHIT, CTR, Alabama Statewide Cancer Registry


Appendix C


Appendix C
C–1
National Partner OrganizationsNational partner organizations are crucial to the success of cancer registration and cancer surveillance inthe United States. This document, and many advances in cancer surveillance in the United States, wouldnot have been possible without the tireless efforts and many achievements of the following organizations:
American Cancer Society (ACS)1599 Clifton Road NEAtlanta, GA 30329-4251Phone: (404) 329-5738Fax: (404) 327-6450http://www.cancer.org
American College of Surgeons (ACoS) Commission on Cancer (COC)633 North Saint Clair StreetChicago, IL 60611-3211Phone: (312) 202-5085Fax: (312) 202-5009 http://www.facs.org/dept/cancer/index.html
American Joint Committee on Cancer (AJCC)633 North Saint Clair StreetChicago, IL 60611-3211Phone: (312) 202-5000Fax: (312) 202-5009http://www.cancerstaging.org
National Cancer Registrars Association (NCRA)1310 Braddock Place, Suite 102Alexandria, VA 22314Phone: (703) 299-6640Fax: (703) 299-6620http://www.ncra-usa.org
North American Association of Central Cancer Registries (NAACCR)2121 West White Oaks Drive, Suite CSpringfield, IL 62704-6495Phone: (217) 698-0800Fax: (217) 698-0188http://www.naaccr.org


Appendix D


Appendix D
D–1
Case CountsMales Females
All Races White Black All Races White BlackAll Sites 515,975 446,622 46,680 495,954 434,366 41,465
Oral Cavity and Pharynx 15,125 12,770 1,625 7,461 6,365 698Lip 1,446 1,366 ~ 397 371 ~Tongue 3,664 3,194 345 1,831 1,587 136Salivary Gland 1,408 1,254 95 1,015 877 86Floor of Mouth 1,139 966 142 572 497 58Gum and Other Mouth 1,972 1,647 245 1,668 1,450 140Nasopharynx 834 530 99 412 265 59Tonsil 2,089 1,766 250 686 581 89Oropharynx 613 470 121 229 185 38Hypopharynx 1,418 1,135 231 414 349 56Other Oral Cavity and Pharynx 542 442 87 237 203 29
Digestive System 102,879 88,471 9,625 92,522 79,288 9,382Esophagus 8,207 6,987 994 2,654 2,203 379Stomach 10,082 8,077 1,231 6,345 4,896 932Small Intestine 1,858 1,568 222 1,676 1,390 231Colon and Rectum 60,642 53,370 4,936 59,892 52,062 5,622
Colon excluding Rectum 42,428 37,201 3,715 45,394 39,321 4,483Rectum and Rectosigmoid Junction 18,214 16,169 1,221 14,498 12,741 1,139
Anus, Anal Canal and Anorectum 1,114 958 119 1,722 1,523 143Liver and Intrahepatic Bile Duct 6,664 5,055 782 3,428 2,722 368Gallbladder 715 609 60 1,863 1,607 163Other Biliary 1,403 1,244 91 1,392 1,227 99Pancreas 11,303 9,821 1,124 11,876 10,151 1,332Retroperitoneum 409 355 35 417 354 50Peritoneum, Omentum and Mesentery 191 176 ~ 919 853 37Other Digestive Organs 291 251 23 338 300 26
Respiratory System 93,162 81,230 9,354 67,128 59,864 5,650Nose, Nasal Cavity and Middle Ear 804 683 80 625 545 50Larynx 7,513 6,355 950 2,018 1,708 268Lung and Bronchus 82,869 72,372 8,233 63,929 57,099 5,305Pleura 1,651 1,546 60 416 392 16Trachea and Other Respiratory Organs 325 274 31 140 120 ~
Bones and Joints 1,066 924 93 883 758 82
Soft Tissue including Heart 3,215 2,722 332 2,777 2,367 275
Skin excluding Basal and Squamous 20,522 19,027 396 15,084 13,942 237Melanomas of the Skin 18,178 17,142 94 13,739 12,839 96Other Non-Epithelial Skin 2,344 1,885 302 1,345 1,103 141
Breast 1,399 1,197 155 155,069 136,064 12,564continued
Table D.1: Invasive Cancer Incidence, Case Counts by Primary Site, Sex,and Race (All Races, White, Black), United States: NPCR and SEER ProgramRegistries That Meet Quality Criteria, 1999*

United States Cancer Statistics: 1999 Incidence
D–2
Case CountsMales Females
All Races White Black All Races White BlackFemale Genital System 62,166 54,131 5,179
Cervix 10,525 8,186 1,634Corpus 27,748 24,720 1,853Uterus, NOS 865 686 145Ovary 18,673 16,730 1,176Vagina 817 645 127Vulva 2,802 2,542 173Other Female Genital Organs 736 622 71
Male Genital System 158,531 132,773 17,087Prostate 151,711 126,500 16,855Testis 5,815 5,415 159Penis 793 687 53Other Male Genital Organs 212 171 20
Urinary System 51,123 46,989 2,559 23,023 20,645 1,722Urinary Bladder 34,696 32,438 1,202 12,345 11,280 719Kidney and Renal Pelvis 15,222 13,438 1,304 9,907 8,673 953Ureter 777 741 19 564 531 18Other Urinary Organs 428 372 34 207 161 32
Eye and Orbit 828 740 31 738 668 31
Brain and Other Nervous System 7,757 7,022 452 6,466 5,812 427Brain 7,344 6,666 416 6,033 5,447 384Cranial Nerves and Other Nervous System 413 356 36 433 365 43
Endocrine System 4,324 3,818 239 11,453 9,790 789Thyroid 3,622 3,232 159 10,862 9,307 718Other Endocrine including Thymus 702 586 80 591 483 71
Lymphomas 23,981 21,072 1,804 21,600 19,224 1,468Hodgkin’s Disease 3,248 2,790 321 2,777 2,415 255Non-Hodgkin’s Lymphoma 20,733 18,282 1,483 18,823 16,809 1,213
Multiple Myeloma 5,535 4,546 793 5,028 3,975 851
Leukemias 13,515 12,052 859 10,438 9,197 777Acute Lymphocytic 1,593 1,382 111 1,254 1,073 96Chronic Lymphocytic 3,785 3,433 213 2,592 2,336 148Acute Myeloid 4,133 3,684 277 3,637 3,191 297Chronic Myeloid 1,691 1,468 123 1,288 1,105 108Other Leukemias 2,313 2,085 135 1,667 1,492 128
Miscellaneous 13,013 11,269 1,276 14,118 12,276 1,333
Breast, in situ 32,579 28,290 2,495
* Data are from selected statewide and metropolitan area cancer registries that meet the following data quality criteria for all invasivecancer sites combined: case ascertainment is at least 90% complete; ≥ 97% of cases pass a standard set of computerized edits; ≤ 5% ofcases were ascertained by death certificate only; ≤ 3% of cases are missing information on sex; ≤ 5% of cases are missing information onrace; and ≤ 3% of cases are missing information on age.
~ Case counts are suppressed for site-sex-race categories with fewer than 16 cases.
NPCR = National Program of Cancer Registries; SEER = Surveillance, Epidemiology, and End Results.
Table D.1: Invasive Cancer Incidence, Case Counts by Primary Site, Sex,and Race (All Races, White, Black), United States: NPCR and SEERProgram Registries That Meet Quality Criteria, 1999* (continued)

Appendix E


Tables E.1–E.25

United States C
ancer Statistics: 1999 Incidence
E–2
Table E.1: All Cancer Sites Combined. Invasive Cancer Incidence Counts by U.S. Census Region and Division,State and Metropolitan Area, Sex, and Race (All Races, White, Black), United States: SEER and NPCR Registriesthat Meet Quality Criteria,*† 1999
Male FemaleArea All Races White Black All Races White Black
Northeast
New England
Connecticut 8,907 8,131 530 8,990 8,264 496
Maine
Massachusetts 16,331 15,179 614 16,488 15,422 479
New Hampshire 2,702 2,663 ∼ 2,662 2,607 ∼Rhode Island 2,998 2,901 77 3,005 2,921 59
Vermont
Middle Atlantic 100,790 86,303 10,596 100,703 86,969 9,769
New Jersey 22,354 19,341 2,480 21,565 18,849 2,106
New York 43,416 35,668 5,296 45,288 37,535 5,125
Pennsylvania 35,020 31,294 2,820 33,850 30,585 2,538
Midwest
East North Central
Illinois 28,386 23,756 3,454 28,302 24,029 3,336
Indiana
Michigan 25,667 21,856 3,202 23,263 20,131 2,720
Detroit 10,973 8,283 2,481 10,037 7,758 2,122
Ohio 27,746 24,051 2,652 27,444 24,363 2,324
Wisconsin 12,744 12,092 452 11,839 11,264 404
West North Central
Iowa 7,723 7,470 106 7,351 7,187 82
Kansas 6,529 5,978 318 6,214 5,795 230
Minnesota 11,491 10,926 190 10,726 10,223 147
Missouri 13,196 11,847 1,191 12,995 11,683 1,140
Nebraska 4,149 3,868 101 3,886 3,666 78
North Dakota 1,653 1,620 ∼ 1,333 1,298 ∼South Dakota
South
South Atlantic
Delaware 1,918 1,589 298 1,893 1,597 258
District of Columbia 1,554 365 1,111 1,373 388 916
Florida 50,472 45,601 4,011 44,912 40,856 3,359
Georgia
Atlanta 4,375 2,967 1,259 4,576 3,230 1,204
Maryland 11,956 8,764 2,497 11,295 8,544 2,309
North Carolina 16,302 13,233 2,825 15,884 13,006 2,636
South Carolina 9,528 7,179 2,235 8,078 6,084 1,881
Virginia
West Virginia 5,228 4,999 138 5,017 4,810 141
East South Central
Alabama
Kentucky 10,213 9,227 540 9,579 8,897 553
Mississippi
Tennessee
continued

Appendix E
E–3
Table E.1: All Cancer Sites Combined. Invasive Cancer Incidence Counts by U.S. Census Region and Division,State and Metropolitan Area, Sex, and Race (All Races, White, Black), United States: SEER and NPCR Registriesthat Meet Quality Criteria,*† 1999 (continued)
Male FemaleArea All Races White Black All Races White Black
West South Central
Arkansas
Louisiana 10,111 7,322 2,729 9,043 6,658 2,337
Oklahoma
Texas
West
Mountain
Arizona 9,960 9,500 213 9,551 9,141 149
Colorado 7,975 7,557 231 7,818 7,425 200
Idaho 2,678 2,647 ∼ 2,468 2,440 ∼Montana 2,177 2,028 ∼ 1,927 1,822 ∼Nevada
New Mexico 3,445 3,270 57 3,174 3,015 27
Utah 3,511 3,448 ∼ 2,984 2,920 ∼Wyoming 1,147 1,127 ∼ 958 934 ∼
Pacific 92,413 77,158 5,014 90,223 76,777 4,213
Alaska 996 791 33 907 691 17
California 66,149 54,574 4,518 65,183 55,197 3,856
San Francisco-Oakland 9,096 6,496 966 9,166 6,908 808
San Jose-Monterey 4,302 3,448 112 4,348 3,626 70
Los Angeles 16,991 12,890 2,142 17,070 13,397 1,853
Hawaii 2,736 857 22 2,544 673 22
Oregon 8,601 8,201 109 8,273 7,972 80
Washington 13,931 12,735 332 13,316 12,244 238
Seattle-Puget Sound 9,632 8,883 307 9,319 8,580 211
∗ Data are from selected statewide and metropolitan area cancer registries that meet the following data quality criteria for all invasive cancer sites
combined: case ascertainment is at least 90% complete; ≥ 97% of cases pass a standard set of computerized edits; ≤ 5% of cases were ascertained by death
certificate only; ≤ 3% of cases are missing information on sex; ≤ 5% of cases are missing information on race; ≤ 3% of cases are missing information
on age. See Appendix H for registry-specific data quality information.
† Excludes basal and squamous cell carcinomas of the skin except when these occur on the skin of the genital organs, and in situ cancers except
urinary bladder.
∼ Counts are suppressed if fewer than 16 cases were reported in the specific area-sex-race category.
Notes: Cases from suppressed counts are included in region/division counts. Region/division counts are presented for regions/divisions with 100% of the
population covered by registries that meet the data quality criteria specified above unless the count for exactly one state in the region or
division is suppressed due to a count of less than 16. California, Washington, and Michigan state counts each include cases from the SEER
metropolitan areas.

United States C
ancer Statistics: 1999 Incidence
E–4
Table E.2: Cancer of the Oral Cavity and Pharynx. Invasive Cancer Incidence Counts by U.S. Census Region andDivision, State and Metropolitan Area, Sex, and Race (All Races, White, Black), United States: SEER and NPCRRegistries that Meet Quality Criteria,*† 1999
Male FemaleArea All Races White Black All Races White Black
Northeast
New England
Connecticut 247 220 23 133 121 ∼Maine
Massachusetts 456 418 20 269 248 ∼New Hampshire 80 78 ∼ 41 41 ∼Rhode Island 74 71 ∼ 45 41 ∼Vermont
Middle Atlantic 2,736 2,217 338 1,411 1,166 169
New Jersey 543 450 69 339 284 43
New York 1,273 978 174 608 479 83
Pennsylvania 920 789 95 464 403 43
Midwest
East North Central
Illinois 852 691 136 423 351 57
Indiana
Michigan 677 564 104 354 304 39
Detroit 295 200 90 155 120 30
Ohio 666 576 69 385 336 37
Wisconsin 420 385 26 180 171 ∼West North Central
Iowa 233 227 ∼ 90 88 ∼Kansas 196 175 ∼ 85 80 ∼Minnesota 355 338 ∼ 154 142 ∼Missouri 392 344 38 172 155 ∼Nebraska 116 107 ∼ 62 58 ∼North Dakota 50 48 ∼ 19 18 ∼South Dakota
South
South Atlantic
Delaware 61 47 ∼ 23 21 ∼District of Columbia 60 ∼ 43 21 ∼ ∼Florida 1,635 1,447 142 798 723 58
Georgia
Atlanta 133 83 47 67 50 16
Maryland 372 265 91 167 116 41
North Carolina 537 397 133 251 200 49
South Carolina 348 252 92 145 105 39
Virginia
West Virginia 155 144 ∼ 69 68 ∼East South Central
Alabama
Kentucky 278 246 20 135 126 ∼Mississippi
Tennessee
continued

Appendix E
E–5
Table E.2: Cancer of the Oral Cavity and Pharynx. Invasive Cancer Incidence Counts by U.S. Census Region andDivision, State and Metropolitan Area, Sex, and Race (All Races, White, Black), United States: SEER and NPCRRegistries that Meet Quality Criteria,*† 1999 (continued)
Male FemaleArea All Races White Black All Races White Black
West South Central
Arkansas
Louisiana 375 262 112 168 120 48
Oklahoma
Texas
West
Mountain
Arizona 265 252 ∼ 146 140 ∼Colorado 189 181 ∼ 89 81 ∼Idaho 81 80 ∼ 33 33 ∼Montana 57 55 ∼ 32 30 ∼Nevada
New Mexico 107 103 ∼ 39 38 ∼Utah 78 77 ∼ 41 40 ∼Wyoming 30 28 ∼ 16 ∼ ∼
Pacific 2,814 2,379 136 ∼ ∼ 70
Alaska 41 26 ∼ ∼ ∼ ∼California 2,073 1,735 130 1,013 819 66
San Francisco-Oakland 296 212 25 155 101 ∼San Jose-Monterey 131 101 ∼ 55 42 ∼Los Angeles 495 377 65 260 192 33
Hawaii 80 25 ∼ 57 19 ∼Oregon 262 256 ∼ 124 117 ∼Washington 358 337 ∼ 191 169 ∼
Seattle-Puget Sound 251 240 ∼ 131 116 ∼∗ Data are from selected statewide and metropolitan area cancer registries that meet the following data quality criteria for all invasive cancer sites
combined: case ascertainment is at least 90% complete; ≥ 97% of cases pass a standard set of computerized edits; ≤ 5% of cases were ascertained by death
certificate only; ≤ 3% of cases are missing information on sex; ≤ 5% of cases are missing information on race; ≤ 3% of cases are missing information
on age. See Appendix H for registry-specific data quality information.
† Invasive cancers only
∼ Counts are suppressed if fewer than 16 cases were reported in the specific area-sex-race category.
Notes: Cases from suppressed counts are included in region/division counts. Region/division counts are presented for regions/divisions with 100% of the
population covered by registries that meet the data quality criteria specified above unless the count for exactly one state in the region or
division is suppressed due to a count of less than 16. California, Washington, and Michigan state counts each include cases from the SEER
metropolitan areas.

United States C
ancer Statistics: 1999 Incidence
E–6
Table E.3: Cancer of the Esophagus. Invasive Cancer Incidence Counts by U.S. Census Region and Division, Stateand Metropolitan Area, Sex, and Race (All Races, White, Black), United States: SEER and NPCR Registriesthat Meet Quality Criteria,*† 1999
Male FemaleArea All Races White Black All Races White Black
Northeast
New England
Connecticut 144 131 ∼ 61 48 ∼Maine
Massachusetts 300 280 ∼ 84 73 ∼New Hampshire 48 47 ∼ 16 16 ∼Rhode Island 44 42 ∼ 21 20 ∼Vermont
Middle Atlantic 1,577 1,304 230 550 443 95
New Jersey 317 270 44 127 106 19
New York 694 538 129 263 198 57
Pennsylvania 566 496 57 160 139 19
Midwest
East North Central
Illinois 514 415 89 139 107 28
Indiana
Michigan 439 384 54 116 94 21
Detroit 153 117 36 50 33 17
Ohio 514 458 48 159 128 22
Wisconsin 224 208 ∼ 71 65 ∼West North Central
Iowa 120 114 ∼ 32 32 ∼Kansas 83 72 ∼ 24 24 ∼Minnesota 181 178 ∼ 55 53 ∼Missouri 195 177 17 61 49 ∼Nebraska 64 62 ∼ 16 16 ∼North Dakota 19 19 ∼ ∼ ∼ ∼South Dakota
South
South Atlantic
Delaware 28 24 ∼ ∼ ∼ ∼District of Columbia 33 ∼ 31 ∼ ∼ ∼Florida 837 737 87 279 242 32
Georgia
Atlanta 66 36 27 26 ∼ ∼Maryland 219 156 58 67 47 18
North Carolina 238 175 60 79 54 24
South Carolina 196 111 85 58 26 31
Virginia
West Virginia 70 66 ∼ 24 23 ∼East South Central
Alabama
Kentucky 135 122 ∼ 41 40 ∼Mississippi
Tennessee
continued

Appendix E
E–7
Table E.3: Cancer of the Esophagus. Invasive Cancer Incidence Counts by U.S. Census Region and Division, Stateand Metropolitan Area, Sex, and Race (All Races, White, Black), United States: SEER and NPCR Registriesthat Meet Quality Criteria,*† 1999 (continued)
Male FemaleArea All Races White Black All Races White Black
West South Central
Arkansas
Louisiana 169 110 59 51 40 ∼Oklahoma
Texas
West
Mountain
Arizona 149 143 ∼ 43 42 ∼Colorado 100 95 ∼ 35 32 ∼Idaho 33 33 ∼ ∼ ∼ ∼Montana 54 51 ∼ ∼ ∼ ∼Nevada
New Mexico 57 56 ∼ ∼ ∼ ∼Utah 41 40 ∼ ∼ ∼ ∼Wyoming ∼ ∼ ∼ ∼ ∼ ∼
Pacific ∼ 1,127 63 474 416 35
Alaska ∼ ∼ ∼ ∼ ∼ ∼California 904 777 57 356 303 35
San Francisco-Oakland 134 99 ∼ 54 40 ∼San Jose-Monterey 63 61 ∼ 26 23 ∼Los Angeles 212 162 22 83 66 16
Hawaii 42 ∼ ∼ ∼ ∼ ∼Oregon 120 116 ∼ 46 45 ∼Washington 223 210 ∼ 64 64 ∼
Seattle-Puget Sound 157 149 ∼ 47 47 ∼∗ Data are from selected statewide and metropolitan area cancer registries that meet the following data quality criteria for all invasive cancer sites
combined: case ascertainment is at least 90% complete; ≥ 97% of cases pass a standard set of computerized edits; ≤ 5% of cases were ascertained by death
certificate only; ≤ 3% of cases are missing information on sex; ≤ 5% of cases are missing information on race; ≤ 3% of cases are missing information
on age. See Appendix H for registry-specific data quality information.
† Invasive cancers only
∼ Counts are suppressed if fewer than 16 cases were reported in the specific area-sex-race category.
Notes: Cases from suppressed counts are included in region/division counts. Region/division counts are presented for regions/divisions with 100% of the
population covered by registries that meet the data quality criteria specified above unless the count for exactly one state in the region or
division is suppressed due to a count of less than 16. California, Washington, and Michigan state counts each include cases from the SEER
metropolitan areas.

United States C
ancer Statistics: 1999 Incidence
E–8
Table E.4: Cancer of the Stomach. Invasive Cancer Incidence Counts by U.S. Census Region and Division, Stateand Metropolitan Area, Sex, and Race (All Races, White, Black), United States: SEER and NPCR Registriesthat Meet Quality Criteria,*† 1999
Male FemaleArea All Races White Black All Races White Black
Northeast
New England
Connecticut 197 176 ∼ 134 122 ∼Maine
Massachusetts 323 282 24 191 175 ∼New Hampshire 46 46 ∼ 27 26 ∼Rhode Island 60 58 ∼ 46 43 ∼Vermont
Middle Atlantic 2,409 1,948 306 1,518 1,185 232
New Jersey 536 452 66 335 267 45
New York 1,158 882 156 741 543 131
Pennsylvania 715 614 84 442 375 56
Midwest
East North Central
Illinois 554 436 87 358 277 63
Indiana
Michigan 440 364 65 296 223 66
Detroit 224 169 50 160 109 47
Ohio 456 365 74 315 255 52
Wisconsin 231 216 ∼ 111 103 ∼West North Central
Iowa 127 125 ∼ 61 59 ∼Kansas 112 100 ∼ 54 49 ∼Minnesota 205 190 ∼ 116 112 ∼Missouri 206 171 31 106 87 ∼Nebraska 47 42 ∼ 40 34 ∼North Dakota 33 33 ∼ 17 17 ∼South Dakota
South
South Atlantic
Delaware 34 25 ∼ 28 20 ∼District of Columbia 35 ∼ 25 37 ∼ 26
Florida 921 779 114 539 438 85
Georgia
Atlanta 76 38 24 57 34 21
Maryland 210 134 63 118 70 39
North Carolina 282 175 100 187 124 61
South Carolina 172 104 67 98 62 36
Virginia
West Virginia 69 67 ∼ 43 41 ∼East South Central
Alabama
Kentucky 152 138 ∼ 106 93 ∼Mississippi
Tennessee
continued

Appendix E
E–9
Table E.4: Cancer of the Stomach. Invasive Cancer Incidence Counts by U.S. Census Region and Division, Stateand Metropolitan Area, Sex, and Race (All Races, White, Black), United States: SEER and NPCR Registriesthat Meet Quality Criteria,*† 1999 (continued)
Male FemaleArea All Races White Black All Races White Black
West South Central
Arkansas
Louisiana 180 111 66 135 66 67
Oklahoma
Texas
West
Mountain
Arizona 185 172 ∼ 100 87 ∼Colorado 120 108 ∼ 87 77 ∼Idaho 38 36 ∼ 24 24 ∼Montana 36 34 ∼ ∼ ∼ ∼Nevada
New Mexico 62 52 ∼ 52 43 ∼Utah 54 52 ∼ 39 39 ∼Wyoming ∼ ∼ ∼ ∼ ∼ ∼
Pacific 1,999 ∼ 111 1,284 882 106
Alaska 22 ∼ ∼ 16 ∼ ∼California 1,488 1,118 106 1,001 711 99
San Francisco-Oakland 210 124 32 173 100 25
San Jose-Monterey 98 59 ∼ 76 55 ∼Los Angeles 494 345 46 333 213 50
Hawaii 119 18 ∼ 75 ∼ ∼Oregon 131 119 ∼ 56 51 ∼Washington 239 213 ∼ 136 106 ∼
Seattle-Puget Sound 178 151 ∼ 92 68 ∼∗ Data are from selected statewide and metropolitan area cancer registries that meet the following data quality criteria for all invasive cancer sites
combined: case ascertainment is at least 90% complete; ≥ 97% of cases pass a standard set of computerized edits; ≤ 5% of cases were ascertained by death
certificate only; ≤ 3% of cases are missing information on sex; ≤ 5% of cases are missing information on race; ≤ 3% of cases are missing information
on age. See Appendix H for registry-specific data quality information.
† Invasive cancers only
∼ Counts are suppressed if fewer than 16 cases were reported in the specific area-sex-race category.
Notes: Cases from suppressed counts are included in region/division counts. Region/division counts are presented for regions/divisions with 100% of the
population covered by registries that meet the data quality criteria specified above unless the count for exactly one state in the region or
division is suppressed due to a count of less than 16. California, Washington, and Michigan state counts each include cases from the SEER
metropolitan areas.
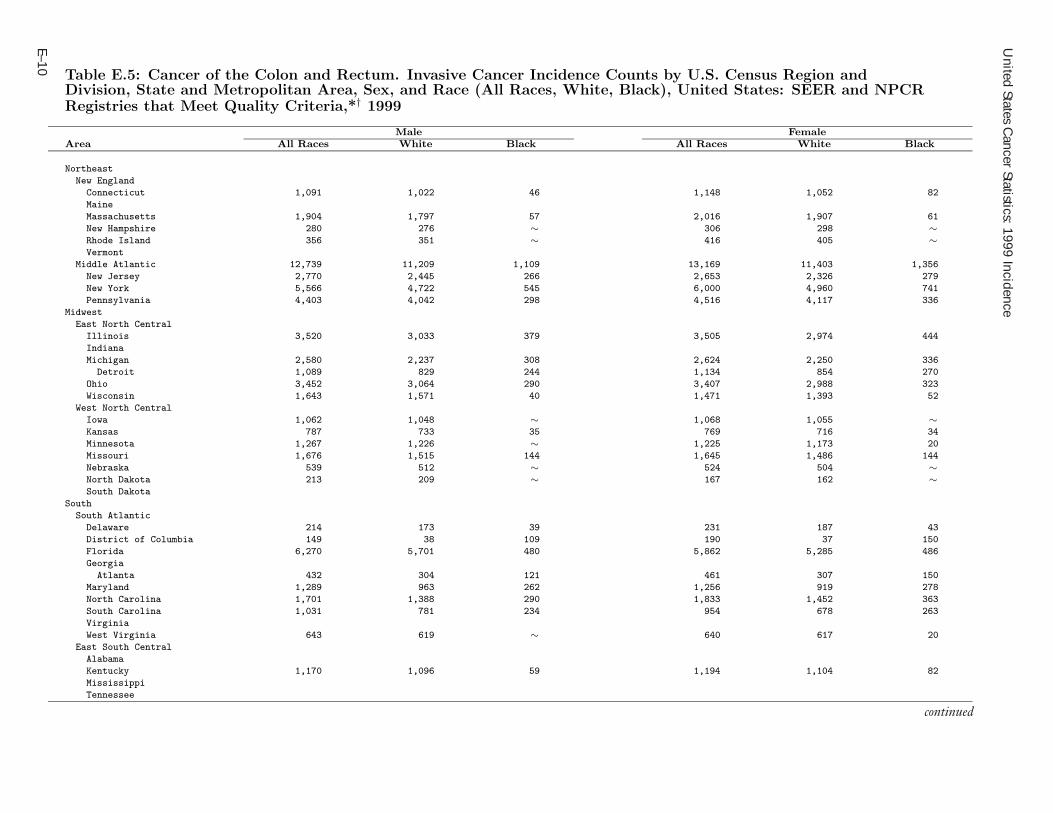
United States C
ancer Statistics: 1999 Incidence
E–10
Table E.5: Cancer of the Colon and Rectum. Invasive Cancer Incidence Counts by U.S. Census Region andDivision, State and Metropolitan Area, Sex, and Race (All Races, White, Black), United States: SEER and NPCRRegistries that Meet Quality Criteria,*† 1999
Male FemaleArea All Races White Black All Races White Black
Northeast
New England
Connecticut 1,091 1,022 46 1,148 1,052 82
Maine
Massachusetts 1,904 1,797 57 2,016 1,907 61
New Hampshire 280 276 ∼ 306 298 ∼Rhode Island 356 351 ∼ 416 405 ∼Vermont
Middle Atlantic 12,739 11,209 1,109 13,169 11,403 1,356
New Jersey 2,770 2,445 266 2,653 2,326 279
New York 5,566 4,722 545 6,000 4,960 741
Pennsylvania 4,403 4,042 298 4,516 4,117 336
Midwest
East North Central
Illinois 3,520 3,033 379 3,505 2,974 444
Indiana
Michigan 2,580 2,237 308 2,624 2,250 336
Detroit 1,089 829 244 1,134 854 270
Ohio 3,452 3,064 290 3,407 2,988 323
Wisconsin 1,643 1,571 40 1,471 1,393 52
West North Central
Iowa 1,062 1,048 ∼ 1,068 1,055 ∼Kansas 787 733 35 769 716 34
Minnesota 1,267 1,226 ∼ 1,225 1,173 20
Missouri 1,676 1,515 144 1,645 1,486 144
Nebraska 539 512 ∼ 524 504 ∼North Dakota 213 209 ∼ 167 162 ∼South Dakota
South
South Atlantic
Delaware 214 173 39 231 187 43
District of Columbia 149 38 109 190 37 150
Florida 6,270 5,701 480 5,862 5,285 486
Georgia
Atlanta 432 304 121 461 307 150
Maryland 1,289 963 262 1,256 919 278
North Carolina 1,701 1,388 290 1,833 1,452 363
South Carolina 1,031 781 234 954 678 263
Virginia
West Virginia 643 619 ∼ 640 617 20
East South Central
Alabama
Kentucky 1,170 1,096 59 1,194 1,104 82
Mississippi
Tennessee
continued

Appendix E
E–11
Table E.5: Cancer of the Colon and Rectum. Invasive Cancer Incidence Counts by U.S. Census Region andDivision, State and Metropolitan Area, Sex, and Race (All Races, White, Black), United States: SEER and NPCRRegistries that Meet Quality Criteria,*† 1999 (continued)
Male FemaleArea All Races White Black All Races White Black
West South Central
Arkansas
Louisiana 1,201 892 301 1,113 807 300
Oklahoma
Texas
West
Mountain
Arizona 1,166 1,120 24 1,053 1,018 17
Colorado 829 782 24 768 722 27
Idaho 271 267 ∼ 250 246 ∼Montana 266 242 ∼ 218 202 ∼Nevada
New Mexico 389 371 ∼ 284 276 ∼Utah 349 342 ∼ 297 290 ∼Wyoming 136 136 ∼ 121 118 ∼
Pacific 10,027 8,352 519 9,707 8,031 562
Alaska 117 77 ∼ 87 49 ∼California 7,232 6,020 475 7,028 5,800 522
San Francisco-Oakland 1,014 742 84 1,051 747 117
San Jose-Monterey 459 374 18 420 352 ∼Los Angeles 1,872 1,412 234 1,890 1,414 250
Hawaii 351 79 ∼ 319 67 ∼Oregon 864 826 ∼ 947 910 ∼Washington 1,463 1,350 29 1,326 1,205 27
Seattle-Puget Sound 965 888 28 927 844 27
∗ Data are from selected statewide and metropolitan area cancer registries that meet the following data quality criteria for all invasive cancer sites
combined: case ascertainment is at least 90% complete; ≥ 97% of cases pass a standard set of computerized edits; ≤ 5% of cases were ascertained by death
certificate only; ≤ 3% of cases are missing information on sex; ≤ 5% of cases are missing information on race; ≤ 3% of cases are missing information
on age. See Appendix H for registry-specific data quality information.
† Invasive cancers only
∼ Counts are suppressed if fewer than 16 cases were reported in the specific area-sex-race category.
Notes: Cases from suppressed counts are included in region/division counts. Region/division counts are presented for regions/divisions with 100% of the
population covered by registries that meet the data quality criteria specified above unless the count for exactly one state in the region or
division is suppressed due to a count of less than 16. California, Washington, and Michigan state counts each include cases from the SEER
metropolitan areas.

United States C
ancer Statistics: 1999 Incidence
E–12
Table E.6: Cancer of the Liver and Intrahepatic Bile Duct. Invasive Cancer Incidence Counts by U.S. CensusRegion and Division, State and Metropolitan Area, Sex, and Race (All Races, White, Black), United States:SEER and NPCR Registries that Meet Quality Criteria,*† 1999
Male FemaleArea All Races White Black All Races White Black
Northeast
New England
Connecticut 116 97 ∼ 54 53 ∼Maine
Massachusetts 190 164 ∼ 98 82 ∼New Hampshire 32 31 ∼ ∼ ∼ ∼Rhode Island 30 25 ∼ ∼ ∼ ∼Vermont
Middle Atlantic 1,443 1,073 209 732 566 ∼New Jersey 256 200 39 137 115 ∼New York 750 546 101 403 291 69
Pennsylvania 437 327 69 192 160 26
Midwest
East North Central
Illinois 383 282 68 235 187 36
Indiana
Michigan 344 282 48 149 122 24
Detroit 156 113 37 77 53 22
Ohio 276 210 52 163 139 23
Wisconsin 141 134 ∼ 71 67 ∼West North Central
Iowa 73 67 ∼ 42 40 ∼Kansas 56 50 ∼ 45 42 ∼Minnesota 109 87 ∼ 54 49 ∼Missouri 132 103 24 71 54 ∼Nebraska 37 34 ∼ ∼ ∼ ∼North Dakota ∼ ∼ ∼ ∼ ∼ ∼South Dakota
South
South Atlantic
Delaware 16 ∼ ∼ ∼ ∼ ∼District of Columbia 29 ∼ 22 20 ∼ 19
Florida 594 507 68 317 283 28
Georgia
Atlanta 49 23 ∼ 30 ∼ ∼Maryland 124 77 34 67 48 ∼North Carolina 141 111 26 75 58 ∼South Carolina 89 66 21 40 29 ∼Virginia
West Virginia 48 43 ∼ 28 27 ∼East South Central
Alabama
Kentucky 93 84 ∼ 53 47 ∼Mississippi
Tennessee
continued

Appendix E
E–13
Table E.6: Cancer of the Liver and Intrahepatic Bile Duct. Invasive Cancer Incidence Counts by U.S. CensusRegion and Division, State and Metropolitan Area, Sex, and Race (All Races, White, Black), United States:SEER and NPCR Registries that Meet Quality Criteria,*† 1999 (continued)
Male FemaleArea All Races White Black All Races White Black
West South Central
Arkansas
Louisiana 132 96 32 63 50 ∼Oklahoma
Texas
West
Mountain
Arizona 128 121 ∼ 58 52 ∼Colorado 100 91 ∼ 47 43 ∼Idaho 20 20 ∼ 17 17 ∼Montana 21 19 ∼ ∼ ∼ ∼Nevada
New Mexico 60 52 ∼ 29 26 ∼Utah 31 29 ∼ 23 22 ∼Wyoming ∼ ∼ ∼ ∼ ∼ ∼
Pacific 1,607 1,037 99 ∼ 533 37
Alaska 19 ∼ ∼ ∼ ∼ ∼California 1,245 791 89 586 405 33
San Francisco-Oakland 225 112 25 82 38 ∼San Jose-Monterey 102 53 ∼ 36 18 ∼Los Angeles 353 216 33 198 138 17
Hawaii 70 ∼ ∼ 29 ∼ ∼Oregon 90 80 ∼ 52 45 ∼Washington 183 143 ∼ 97 73 ∼
Seattle-Puget Sound 139 103 ∼ 75 55 ∼∗ Data are from selected statewide and metropolitan area cancer registries that meet the following data quality criteria for all invasive cancer sites
combined: case ascertainment is at least 90% complete; ≥ 97% of cases pass a standard set of computerized edits; ≤ 5% of cases were ascertained by death
certificate only; ≤ 3% of cases are missing information on sex; ≤ 5% of cases are missing information on race; ≤ 3% of cases are missing information
on age. See Appendix H for registry-specific data quality information.
† Invasive cancers only
∼ Counts are suppressed if fewer than 16 cases were reported in the specific area-sex-race category.
Notes: Cases from suppressed counts are included in region/division counts. Region/division counts are presented for regions/divisions with 100% of the
population covered by registries that meet the data quality criteria specified above unless the count for exactly one state in the region or
division is suppressed due to a count of less than 16. California, Washington, and Michigan state counts each include cases from the SEER
metropolitan areas.

United States C
ancer Statistics: 1999 Incidence
E–14
Table E.7: Cancer of the Pancreas. Invasive Cancer Incidence Counts by U.S. Census Region and Division, Stateand Metropolitan Area, Sex, and Race (All Races, White, Black), United States: SEER and NPCR Registriesthat Meet Quality Criteria,*† 1999
Male FemaleArea All Races White Black All Races White Black
Northeast
New England
Connecticut 201 185 16 217 205 ∼Maine
Massachusetts 363 341 ∼ 386 368 ∼New Hampshire 64 63 ∼ 60 59 ∼Rhode Island 56 55 ∼ 64 62 ∼Vermont
Middle Atlantic 2,371 2,030 272 2,639 2,237 329
New Jersey 497 411 66 561 483 65
New York 1,086 924 127 1,282 1,045 189
Pennsylvania 788 695 79 796 709 75
Midwest
East North Central
Illinois 664 555 88 706 586 101
Indiana
Michigan 509 423 84 601 489 105
Detroit 212 149 62 277 195 82
Ohio 567 514 48 605 526 75
Wisconsin 280 266 ∼ 314 288 21
West North Central
Iowa 148 142 ∼ 151 145 ∼Kansas 155 141 ∼ 142 133 ∼Minnesota 213 203 ∼ 181 172 ∼Missouri 312 282 27 347 298 46
Nebraska 88 82 ∼ 83 79 ∼North Dakota 22 22 ∼ 32 32 ∼South Dakota
South
South Atlantic
Delaware 41 35 ∼ 51 45 ∼District of Columbia 40 ∼ 28 37 ∼ 28
Florida 1,122 1,010 101 1,131 1,016 103
Georgia
Atlanta 100 64 34 93 55 36
Maryland 238 176 56 250 184 61
North Carolina 386 319 64 408 309 95
South Carolina 194 152 42 203 134 69
Virginia
West Virginia 96 91 ∼ 80 78 ∼East South Central
Alabama
Kentucky 198 182 ∼ 215 196 17
Mississippi
Tennessee
continued

Appendix E
E–15
Table E.7: Cancer of the Pancreas. Invasive Cancer Incidence Counts by U.S. Census Region and Division, Stateand Metropolitan Area, Sex, and Race (All Races, White, Black), United States: SEER and NPCR Registriesthat Meet Quality Criteria,*† 1999 (continued)
Male FemaleArea All Races White Black All Races White Black
West South Central
Arkansas
Louisiana 219 147 72 236 163 73
Oklahoma
Texas
West
Mountain
Arizona 211 203 ∼ 221 208 ∼Colorado 167 156 ∼ 161 153 ∼Idaho 51 51 ∼ 82 82 ∼Montana 53 52 ∼ 40 39 ∼Nevada
New Mexico 101 90 ∼ 75 72 ∼Utah 76 75 ∼ 54 52 ∼Wyoming 35 33 ∼ 16 ∼ ∼
Pacific 1,962 ∼ 105 1,995 ∼ 110
Alaska 19 ∼ ∼ 21 17 ∼California 1,399 1,188 97 1,417 1,188 100
San Francisco-Oakland 187 128 26 191 143 18
San Jose-Monterey 105 81 ∼ 93 76 ∼Los Angeles 358 291 41 365 287 40
Hawaii 61 17 ∼ 77 ∼ ∼Oregon 191 181 ∼ 205 197 ∼Washington 292 273 ∼ 275 252 ∼
Seattle-Puget Sound 207 193 ∼ 216 197 ∼∗ Data are from selected statewide and metropolitan area cancer registries that meet the following data quality criteria for all invasive cancer sites
combined: case ascertainment is at least 90% complete; ≥ 97% of cases pass a standard set of computerized edits; ≤ 5% of cases were ascertained by death
certificate only; ≤ 3% of cases are missing information on sex; ≤ 5% of cases are missing information on race; ≤ 3% of cases are missing information
on age. See Appendix H for registry-specific data quality information.
† Invasive cancers only
∼ Counts are suppressed if fewer than 16 cases were reported in the specific area-sex-race category.
Notes: Cases from suppressed counts are included in region/division counts. Region/division counts are presented for regions/divisions with 100% of the
population covered by registries that meet the data quality criteria specified above unless the count for exactly one state in the region or
division is suppressed due to a count of less than 16. California, Washington, and Michigan state counts each include cases from the SEER
metropolitan areas.

United States C
ancer Statistics: 1999 Incidence
E–16
Table E.8: Cancer of the Larynx. Invasive Cancer Incidence Counts by U.S. Census Region and Division, Stateand Metropolitan Area, Sex, and Race (All Races, White, Black), United States: SEER and NPCR Registriesthat Meet Quality Criteria,*† 1999
Male FemaleArea All Races White Black All Races White Black
Northeast
New England
Connecticut 130 118 ∼ 49 46 ∼Maine
Massachusetts 240 220 16 63 56 ∼New Hampshire 44 44 ∼ ∼ ∼ ∼Rhode Island 47 44 ∼ ∼ ∼ ∼Vermont
Middle Atlantic 1,467 1,229 192 385 311 ∼New Jersey 282 229 48 74 61 ∼New York 666 547 90 186 149 32
Pennsylvania 519 453 54 125 101 22
Midwest
East North Central
Illinois 475 372 89 98 77 20
Indiana
Michigan 348 283 62 142 102 38
Detroit 132 86 46 74 45 29
Ohio 426 374 42 97 77 16
Wisconsin 162 148 ∼ 56 52 ∼West North Central
Iowa 113 110 ∼ 29 28 ∼Kansas 86 77 ∼ 18 17 ∼Minnesota 139 135 ∼ 30 30 ∼Missouri 224 195 27 57 50 ∼Nebraska 52 50 ∼ ∼ ∼ ∼North Dakota ∼ ∼ ∼ ∼ ∼ ∼South Dakota
South
South Atlantic
Delaware 37 30 ∼ ∼ ∼ ∼District of Columbia 34 ∼ 26 ∼ ∼ ∼Florida 844 751 75 228 206 17
Georgia
Atlanta 59 41 18 20 ∼ ∼Maryland 195 132 57 48 37 ∼North Carolina 308 233 71 67 56 ∼South Carolina 156 110 46 47 36 ∼Virginia
West Virginia 99 93 ∼ 27 27 ∼East South Central
Alabama
Kentucky 173 161 ∼ 58 51 ∼Mississippi
Tennessee
continued
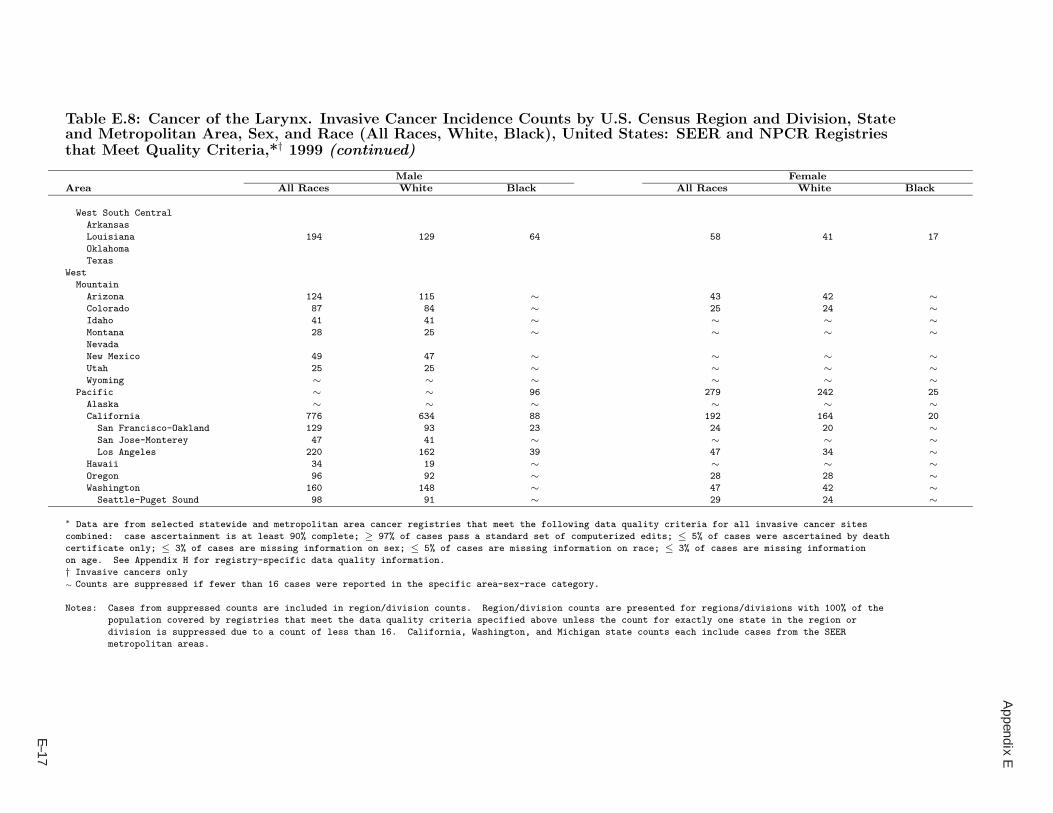
Appendix E
E–17
Table E.8: Cancer of the Larynx. Invasive Cancer Incidence Counts by U.S. Census Region and Division, Stateand Metropolitan Area, Sex, and Race (All Races, White, Black), United States: SEER and NPCR Registriesthat Meet Quality Criteria,*† 1999 (continued)
Male FemaleArea All Races White Black All Races White Black
West South Central
Arkansas
Louisiana 194 129 64 58 41 17
Oklahoma
Texas
West
Mountain
Arizona 124 115 ∼ 43 42 ∼Colorado 87 84 ∼ 25 24 ∼Idaho 41 41 ∼ ∼ ∼ ∼Montana 28 25 ∼ ∼ ∼ ∼Nevada
New Mexico 49 47 ∼ ∼ ∼ ∼Utah 25 25 ∼ ∼ ∼ ∼Wyoming ∼ ∼ ∼ ∼ ∼ ∼
Pacific ∼ ∼ 96 279 242 25
Alaska ∼ ∼ ∼ ∼ ∼ ∼California 776 634 88 192 164 20
San Francisco-Oakland 129 93 23 24 20 ∼San Jose-Monterey 47 41 ∼ ∼ ∼ ∼Los Angeles 220 162 39 47 34 ∼
Hawaii 34 19 ∼ ∼ ∼ ∼Oregon 96 92 ∼ 28 28 ∼Washington 160 148 ∼ 47 42 ∼
Seattle-Puget Sound 98 91 ∼ 29 24 ∼∗ Data are from selected statewide and metropolitan area cancer registries that meet the following data quality criteria for all invasive cancer sites
combined: case ascertainment is at least 90% complete; ≥ 97% of cases pass a standard set of computerized edits; ≤ 5% of cases were ascertained by death
certificate only; ≤ 3% of cases are missing information on sex; ≤ 5% of cases are missing information on race; ≤ 3% of cases are missing information
on age. See Appendix H for registry-specific data quality information.
† Invasive cancers only
∼ Counts are suppressed if fewer than 16 cases were reported in the specific area-sex-race category.
Notes: Cases from suppressed counts are included in region/division counts. Region/division counts are presented for regions/divisions with 100% of the
population covered by registries that meet the data quality criteria specified above unless the count for exactly one state in the region or
division is suppressed due to a count of less than 16. California, Washington, and Michigan state counts each include cases from the SEER
metropolitan areas.

United States C
ancer Statistics: 1999 Incidence
E–18
Table E.9: Cancer of the Lung and Bronchus. Invasive Cancer Incidence Counts by U.S. Census Region andDivision, State and Metropolitan Area, Sex, and Race (All Races, White, Black), United States: SEER and NPCRRegistries that Meet Quality Criteria,*† 1999
Male FemaleArea All Races White Black All Races White Black
Northeast
New England
Connecticut 1,293 1,198 81 1,079 1,009 62
Maine
Massachusetts 2,440 2,302 83 2,185 2,063 66
New Hampshire 419 415 ∼ 375 370 ∼Rhode Island 493 476 ∼ 406 398 ∼Vermont
Middle Atlantic 15,312 13,238 1,707 12,453 10,989 1,190
New Jersey 3,164 2,712 393 2,710 2,407 264
New York 6,480 5,508 748 5,595 4,861 556
Pennsylvania 5,668 5,018 566 4,148 3,721 370
Midwest
East North Central
Illinois 4,831 4,050 684 3,654 3,099 489
Indiana
Michigan 3,973 3,362 571 3,098 2,663 410
Detroit 1,734 1,272 449 1,387 1,074 301
Ohio 5,132 4,529 516 3,712 3,301 360
Wisconsin 1,950 1,850 82 1,366 1,298 55
West North Central
Iowa 1,232 1,209 20 826 810 ∼Kansas 1,079 1,011 57 787 753 28
Minnesota 1,514 1,448 38 1,148 1,096 29
Missouri 2,610 2,332 253 1,894 1,709 164
Nebraska 596 558 24 436 410 ∼North Dakota 216 210 ∼ 137 132 ∼South Dakota
South
South Atlantic
Delaware 368 311 53 274 234 36
District of Columbia 258 48 197 168 39 125
Florida 8,851 8,081 688 6,767 6,372 340
Georgia
Atlanta 674 462 199 571 434 126
Maryland 1,904 1,440 428 1,542 1,209 308
North Carolina 3,336 2,742 557 2,208 1,891 289
South Carolina 1,820 1,419 392 1,003 831 167
Virginia
West Virginia 1,164 1,131 21 817 783 28
East South Central
Alabama
Kentucky 2,321 2,205 104 1,580 1,470 106
Mississippi
Tennessee
continued

Appendix E
E–19
Table E.9: Cancer of the Lung and Bronchus. Invasive Cancer Incidence Counts by U.S. Census Region andDivision, State and Metropolitan Area, Sex, and Race (All Races, White, Black), United States: SEER and NPCRRegistries that Meet Quality Criteria,*† 1999 (continued)
Male FemaleArea All Races White Black All Races White Black
West South Central
Arkansas
Louisiana 2,005 1,417 578 1,223 935 282
Oklahoma
Texas
West
Mountain
Arizona 1,643 1,573 42 1,254 1,215 16
Colorado 952 906 27 785 748 25
Idaho 361 358 ∼ 260 257 ∼Montana 327 307 ∼ 247 231 ∼Nevada
New Mexico 435 415 ∼ 320 313 ∼Utah 306 294 ∼ 185 181 ∼Wyoming 144 142 ∼ 116 112 ∼
Pacific 12,910 10,933 801 11,053 9,744 571
Alaska 140 113 ∼ 125 102 ∼California 8,995 7,519 714 7,828 6,834 530
San Francisco-Oakland 1,172 786 151 1,104 863 120
San Jose-Monterey 521 426 19 481 410 ∼Los Angeles 2,131 1,546 337 1,826 1,433 250
Hawaii 397 118 ∼ 265 82 ∼Oregon 1,319 1,264 22 1,144 1,116 ∼Washington 2,059 1,919 62 1,691 1,610 28
Seattle-Puget Sound 1,436 1,324 56 1,248 1,186 25
∗ Data are from selected statewide and metropolitan area cancer registries that meet the following data quality criteria for all invasive cancer sites
combined: case ascertainment is at least 90% complete; ≥ 97% of cases pass a standard set of computerized edits; ≤ 5% of cases were ascertained by death
certificate only; ≤ 3% of cases are missing information on sex; ≤ 5% of cases are missing information on race; ≤ 3% of cases are missing information
on age. See Appendix H for registry-specific data quality information.
† Invasive cancers only
∼ Counts are suppressed if fewer than 16 cases were reported in the specific area-sex-race category.
Notes: Cases from suppressed counts are included in region/division counts. Region/division counts are presented for regions/divisions with 100% of the
population covered by registries that meet the data quality criteria specified above unless the count for exactly one state in the region or
division is suppressed due to a count of less than 16. California, Washington, and Michigan state counts each include cases from the SEER
metropolitan areas.

United States C
ancer Statistics: 1999 Incidence
E–20
Table E.10: Melanomas of the Skin. Invasive Cancer Incidence Counts by U.S. Census Region and Division, Stateand Metropolitan Area, Sex, and Race (All Races, White, Black), United States: SEER and NPCR Registriesthat Meet Quality Criteria,*† 1999
Male FemaleArea All Races White Black All Races White Black
Northeast
New England
Connecticut 400 376 ∼ 292 266 ∼Maine
Massachusetts 564 542 ∼ 482 460 ∼New Hampshire 123 123 ∼ 120 119 ∼Rhode Island 118 118 ∼ 77 77 ∼Vermont
Middle Atlantic 2,691 2,584 ∼ 1,995 1,907 ∼New Jersey 721 716 ∼ 536 528 ∼New York 972 933 ∼ 755 719 ∼Pennsylvania 998 935 ∼ 704 660 ∼
Midwest
East North Central
Illinois 791 743 ∼ 558 531 ∼Indiana
Michigan 970 898 ∼ 795 737 ∼Detroit 364 351 ∼ 296 283 ∼
Ohio 845 757 ∼ 677 612 ∼Wisconsin 317 313 ∼ 251 243 ∼
West North Central
Iowa 278 257 ∼ 228 212 ∼Kansas 261 229 ∼ 177 150 ∼Minnesota 425 403 ∼ 385 361 ∼Missouri 309 302 ∼ 226 215 ∼Nebraska 113 84 ∼ 119 93 ∼North Dakota 33 33 ∼ 22 21 ∼South Dakota
South
South Atlantic
Delaware 55 53 ∼ 43 40 ∼District of Columbia 27 17 ∼ 20 ∼ ∼Florida 1,806 1,713 ∼ 1,134 1,068 ∼Georgia
Atlanta 204 184 ∼ 141 126 ∼Maryland 486 472 ∼ 397 385 ∼North Carolina 575 567 ∼ 461 445 ∼South Carolina 368 359 ∼ 275 260 ∼Virginia
West Virginia 174 156 ∼ 120 105 ∼East South Central
Alabama
Kentucky 403 372 ∼ 350 326 ∼Mississippi
Tennessee
continued

Appendix E
E–21
Table E.10: Melanomas of the Skin. Invasive Cancer Incidence Counts by U.S. Census Region and Division, Stateand Metropolitan Area, Sex, and Race (All Races, White, Black), United States: SEER and NPCR Registriesthat Meet Quality Criteria,*† 1999 (continued)
Male FemaleArea All Races White Black All Races White Black
West South Central
Arkansas
Louisiana 214 202 ∼ 149 145 ∼Oklahoma
Texas
West
Mountain
Arizona 434 421 ∼ 301 300 ∼Colorado 424 421 ∼ 348 345 ∼Idaho 134 134 ∼ 96 96 ∼Montana 56 48 ∼ 43 38 ∼Nevada
New Mexico 135 135 ∼ 85 82 ∼Utah 216 216 ∼ 157 157 ∼Wyoming 62 62 ∼ 31 31 ∼
Pacific 4,167 3,848 ∼ 3,184 2,872 16
Alaska 27 25 ∼ 19 19 ∼California 3,040 2,765 ∼ 2,245 1,973 ∼
San Francisco-Oakland 348 326 ∼ 291 272 ∼San Jose-Monterey 196 158 ∼ 163 121 ∼Los Angeles 624 586 ∼ 494 457 ∼
Hawaii 113 80 ∼ 61 42 ∼Oregon 380 373 ∼ 292 277 ∼Washington 607 605 ∼ 567 561 ∼
Seattle-Puget Sound 417 414 ∼ 382 373 ∼∗ Data are from selected statewide and metropolitan area cancer registries that meet the following data quality criteria for all invasive cancer sites
combined: case ascertainment is at least 90% complete; ≥ 97% of cases pass a standard set of computerized edits; ≤ 5% of cases were ascertained by death
certificate only; ≤ 3% of cases are missing information on sex; ≤ 5% of cases are missing information on race; ≤ 3% of cases are missing information
on age. See Appendix H for registry-specific data quality information.
† Invasive cancers only
∼ Counts are suppressed if fewer than 16 cases were reported in the specific area-sex-race category.
Notes: Cases from suppressed counts are included in region/division counts. Region/division counts are presented for regions/divisions with 100% of the
population covered by registries that meet the data quality criteria specified above unless the count for exactly one state in the region or
division is suppressed due to a count of less than 16. California, Washington, and Michigan state counts each include cases from the SEER
metropolitan areas.
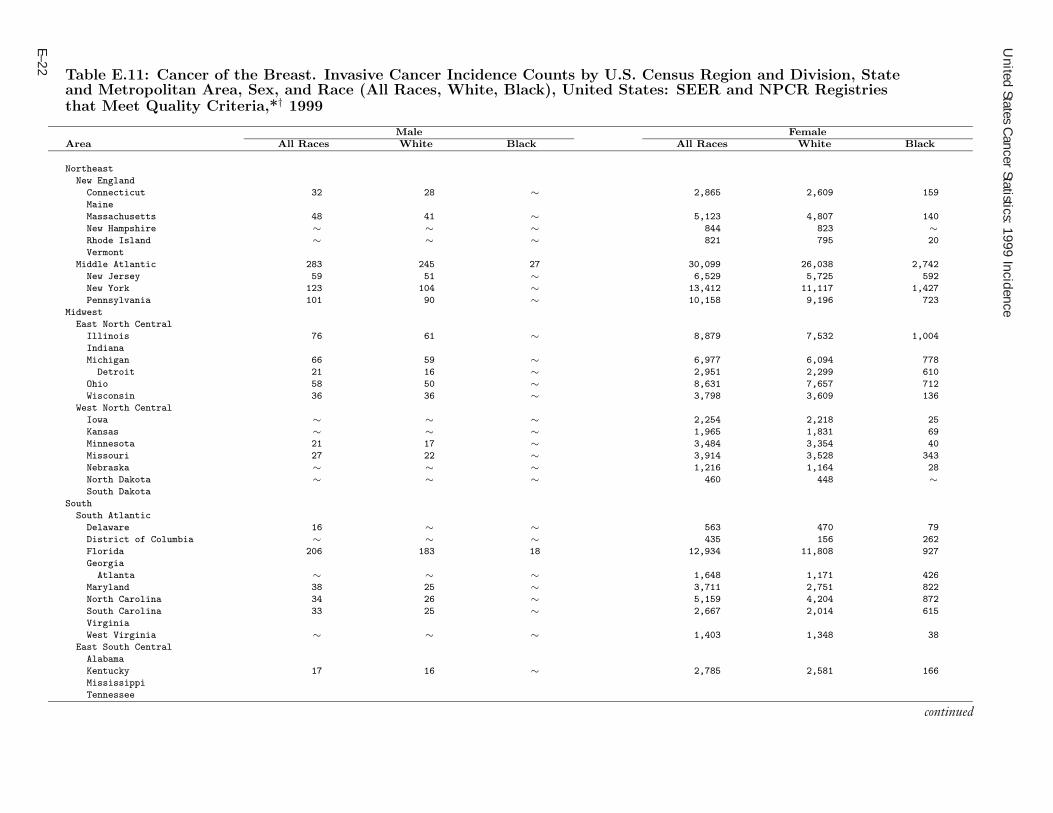
United States C
ancer Statistics: 1999 Incidence
E–22
Table E.11: Cancer of the Breast. Invasive Cancer Incidence Counts by U.S. Census Region and Division, Stateand Metropolitan Area, Sex, and Race (All Races, White, Black), United States: SEER and NPCR Registriesthat Meet Quality Criteria,*† 1999
Male FemaleArea All Races White Black All Races White Black
Northeast
New England
Connecticut 32 28 ∼ 2,865 2,609 159
Maine
Massachusetts 48 41 ∼ 5,123 4,807 140
New Hampshire ∼ ∼ ∼ 844 823 ∼Rhode Island ∼ ∼ ∼ 821 795 20
Vermont
Middle Atlantic 283 245 27 30,099 26,038 2,742
New Jersey 59 51 ∼ 6,529 5,725 592
New York 123 104 ∼ 13,412 11,117 1,427
Pennsylvania 101 90 ∼ 10,158 9,196 723
Midwest
East North Central
Illinois 76 61 ∼ 8,879 7,532 1,004
Indiana
Michigan 66 59 ∼ 6,977 6,094 778
Detroit 21 16 ∼ 2,951 2,299 610
Ohio 58 50 ∼ 8,631 7,657 712
Wisconsin 36 36 ∼ 3,798 3,609 136
West North Central
Iowa ∼ ∼ ∼ 2,254 2,218 25
Kansas ∼ ∼ ∼ 1,965 1,831 69
Minnesota 21 17 ∼ 3,484 3,354 40
Missouri 27 22 ∼ 3,914 3,528 343
Nebraska ∼ ∼ ∼ 1,216 1,164 28
North Dakota ∼ ∼ ∼ 460 448 ∼South Dakota
South
South Atlantic
Delaware 16 ∼ ∼ 563 470 79
District of Columbia ∼ ∼ ∼ 435 156 262
Florida 206 183 18 12,934 11,808 927
Georgia
Atlanta ∼ ∼ ∼ 1,648 1,171 426
Maryland 38 25 ∼ 3,711 2,751 822
North Carolina 34 26 ∼ 5,159 4,204 872
South Carolina 33 25 ∼ 2,667 2,014 615
Virginia
West Virginia ∼ ∼ ∼ 1,403 1,348 38
East South Central
Alabama
Kentucky 17 16 ∼ 2,785 2,581 166
Mississippi
Tennessee
continued
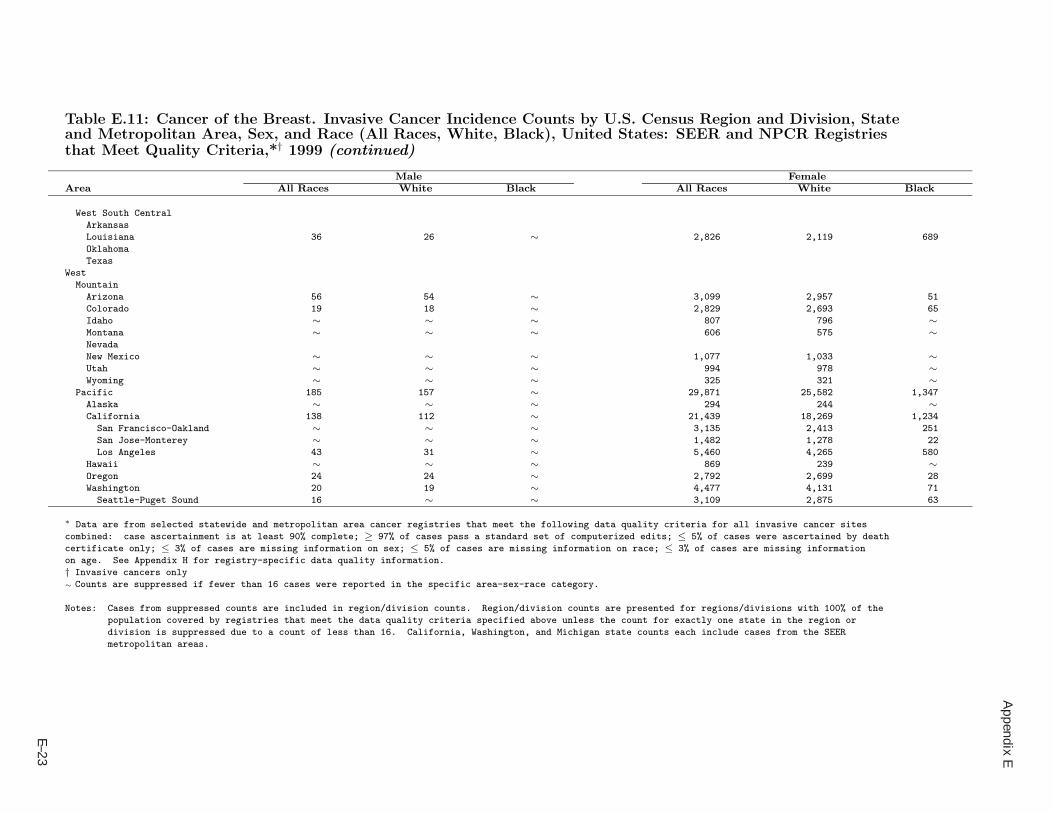
Appendix E
E–23
Table E.11: Cancer of the Breast. Invasive Cancer Incidence Counts by U.S. Census Region and Division, Stateand Metropolitan Area, Sex, and Race (All Races, White, Black), United States: SEER and NPCR Registriesthat Meet Quality Criteria,*† 1999 (continued)
Male FemaleArea All Races White Black All Races White Black
West South Central
Arkansas
Louisiana 36 26 ∼ 2,826 2,119 689
Oklahoma
Texas
West
Mountain
Arizona 56 54 ∼ 3,099 2,957 51
Colorado 19 18 ∼ 2,829 2,693 65
Idaho ∼ ∼ ∼ 807 796 ∼Montana ∼ ∼ ∼ 606 575 ∼Nevada
New Mexico ∼ ∼ ∼ 1,077 1,033 ∼Utah ∼ ∼ ∼ 994 978 ∼Wyoming ∼ ∼ ∼ 325 321 ∼
Pacific 185 157 ∼ 29,871 25,582 1,347
Alaska ∼ ∼ ∼ 294 244 ∼California 138 112 ∼ 21,439 18,269 1,234
San Francisco-Oakland ∼ ∼ ∼ 3,135 2,413 251
San Jose-Monterey ∼ ∼ ∼ 1,482 1,278 22
Los Angeles 43 31 ∼ 5,460 4,265 580
Hawaii ∼ ∼ ∼ 869 239 ∼Oregon 24 24 ∼ 2,792 2,699 28
Washington 20 19 ∼ 4,477 4,131 71
Seattle-Puget Sound 16 ∼ ∼ 3,109 2,875 63
∗ Data are from selected statewide and metropolitan area cancer registries that meet the following data quality criteria for all invasive cancer sites
combined: case ascertainment is at least 90% complete; ≥ 97% of cases pass a standard set of computerized edits; ≤ 5% of cases were ascertained by death
certificate only; ≤ 3% of cases are missing information on sex; ≤ 5% of cases are missing information on race; ≤ 3% of cases are missing information
on age. See Appendix H for registry-specific data quality information.
† Invasive cancers only
∼ Counts are suppressed if fewer than 16 cases were reported in the specific area-sex-race category.
Notes: Cases from suppressed counts are included in region/division counts. Region/division counts are presented for regions/divisions with 100% of the
population covered by registries that meet the data quality criteria specified above unless the count for exactly one state in the region or
division is suppressed due to a count of less than 16. California, Washington, and Michigan state counts each include cases from the SEER
metropolitan areas.
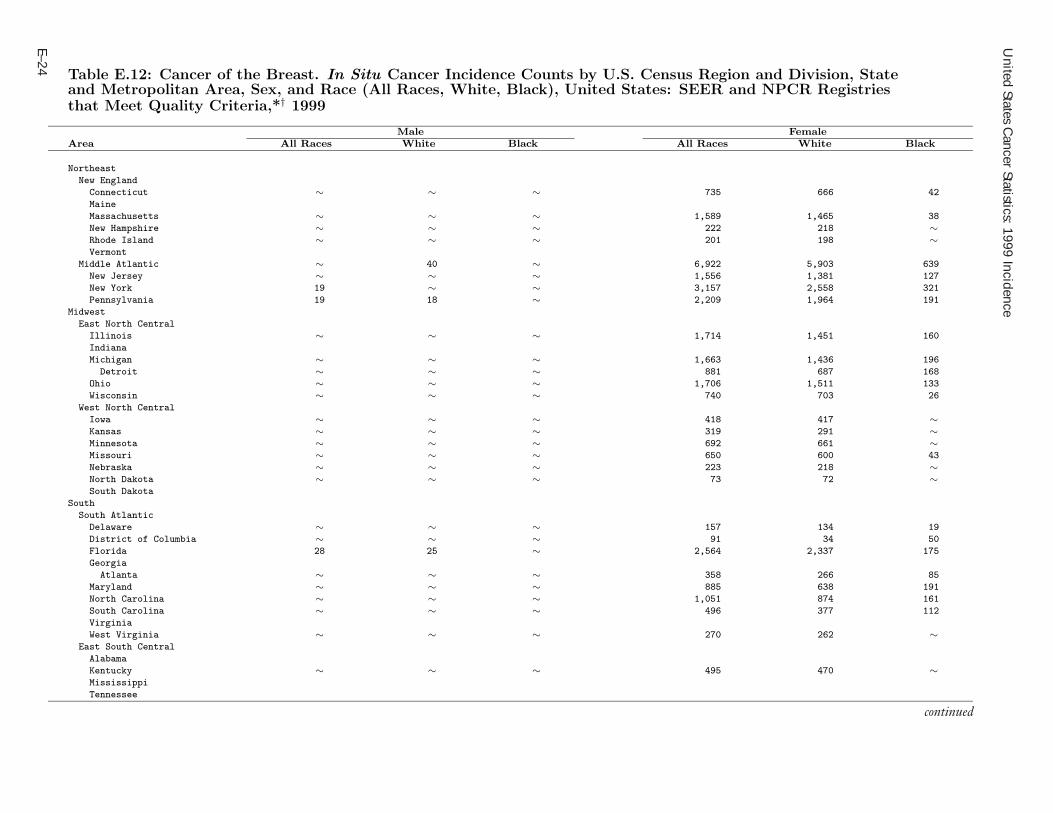
United States C
ancer Statistics: 1999 Incidence
E–24
Table E.12: Cancer of the Breast. In Situ Cancer Incidence Counts by U.S. Census Region and Division, Stateand Metropolitan Area, Sex, and Race (All Races, White, Black), United States: SEER and NPCR Registriesthat Meet Quality Criteria,*† 1999
Male FemaleArea All Races White Black All Races White Black
Northeast
New England
Connecticut ∼ ∼ ∼ 735 666 42
Maine
Massachusetts ∼ ∼ ∼ 1,589 1,465 38
New Hampshire ∼ ∼ ∼ 222 218 ∼Rhode Island ∼ ∼ ∼ 201 198 ∼Vermont
Middle Atlantic ∼ 40 ∼ 6,922 5,903 639
New Jersey ∼ ∼ ∼ 1,556 1,381 127
New York 19 ∼ ∼ 3,157 2,558 321
Pennsylvania 19 18 ∼ 2,209 1,964 191
Midwest
East North Central
Illinois ∼ ∼ ∼ 1,714 1,451 160
Indiana
Michigan ∼ ∼ ∼ 1,663 1,436 196
Detroit ∼ ∼ ∼ 881 687 168
Ohio ∼ ∼ ∼ 1,706 1,511 133
Wisconsin ∼ ∼ ∼ 740 703 26
West North Central
Iowa ∼ ∼ ∼ 418 417 ∼Kansas ∼ ∼ ∼ 319 291 ∼Minnesota ∼ ∼ ∼ 692 661 ∼Missouri ∼ ∼ ∼ 650 600 43
Nebraska ∼ ∼ ∼ 223 218 ∼North Dakota ∼ ∼ ∼ 73 72 ∼South Dakota
South
South Atlantic
Delaware ∼ ∼ ∼ 157 134 19
District of Columbia ∼ ∼ ∼ 91 34 50
Florida 28 25 ∼ 2,564 2,337 175
Georgia
Atlanta ∼ ∼ ∼ 358 266 85
Maryland ∼ ∼ ∼ 885 638 191
North Carolina ∼ ∼ ∼ 1,051 874 161
South Carolina ∼ ∼ ∼ 496 377 112
Virginia
West Virginia ∼ ∼ ∼ 270 262 ∼East South Central
Alabama
Kentucky ∼ ∼ ∼ 495 470 ∼Mississippi
Tennessee
continued

Appendix E
E–25
Table E.12: Cancer of the Breast. In Situ Cancer Incidence Counts by U.S. Census Region and Division, Stateand Metropolitan Area, Sex, and Race (All Races, White, Black), United States: SEER and NPCR Registriesthat Meet Quality Criteria,*† 1999 (continued)
Male FemaleArea All Races White Black All Races White Black
West South Central
Arkansas
Louisiana ∼ ∼ ∼ 479 350 121
Oklahoma
Texas
West
Mountain
Arizona ∼ ∼ ∼ 613 582 ∼Colorado ∼ ∼ ∼ 568 540 ∼Idaho ∼ ∼ ∼ 163 159 ∼Montana ∼ ∼ ∼ 129 124 ∼Nevada
New Mexico ∼ ∼ ∼ 188 183 ∼Utah ∼ ∼ ∼ 186 183 ∼Wyoming ∼ ∼ ∼ 59 58 ∼
Pacific 30 25 ∼ 5,960 4,909 245
Alaska ∼ ∼ ∼ 74 56 ∼California 26 22 ∼ 4,172 3,458 220
San Francisco-Oakland ∼ ∼ ∼ 680 456 56
San Jose-Monterey ∼ ∼ ∼ 356 298 ∼Los Angeles ∼ ∼ ∼ 1,056 832 100
Hawaii ∼ ∼ ∼ 228 45 ∼Oregon ∼ ∼ ∼ 553 523 ∼Washington ∼ ∼ ∼ 933 827 16
Seattle-Puget Sound ∼ ∼ ∼ 675 604 ∼∗ Data are from selected statewide and metropolitan area cancer registries that meet the following data quality criteria for all invasive cancer sites
combined: case ascertainment is at least 90% complete; ≥ 97% of cases pass a standard set of computerized edits; ≤ 5% of cases were ascertained by death
certificate only; ≤ 3% of cases are missing information on sex; ≤ 5% of cases are missing information on race; ≤ 3% of cases are missing information
on age. See Appendix H for registry-specific data quality information.
† In situ cancers only
∼ Counts are suppressed if fewer than 16 cases were reported in the specific area-sex-race category.
Notes: Cases from suppressed counts are included in region/division counts. Region/division counts are presented for regions/divisions with 100% of the
population covered by registries that meet the data quality criteria specified above unless the count for exactly one state in the region or
division is suppressed due to a count of less than 16. California, Washington, and Michigan state counts each include cases from the SEER
metropolitan areas.
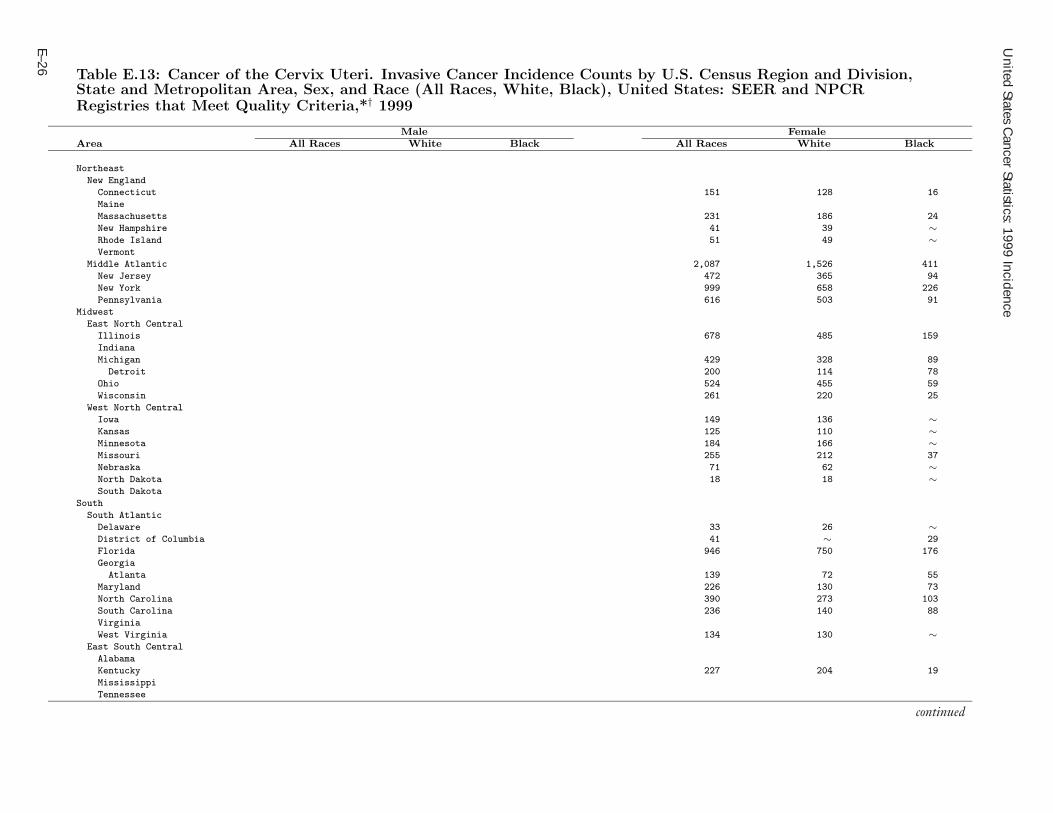
United States C
ancer Statistics: 1999 Incidence
E–26
Table E.13: Cancer of the Cervix Uteri. Invasive Cancer Incidence Counts by U.S. Census Region and Division,State and Metropolitan Area, Sex, and Race (All Races, White, Black), United States: SEER and NPCRRegistries that Meet Quality Criteria,*† 1999
Male FemaleArea All Races White Black All Races White Black
Northeast
New England
Connecticut 151 128 16
Maine
Massachusetts 231 186 24
New Hampshire 41 39 ∼Rhode Island 51 49 ∼Vermont
Middle Atlantic 2,087 1,526 411
New Jersey 472 365 94
New York 999 658 226
Pennsylvania 616 503 91
Midwest
East North Central
Illinois 678 485 159
Indiana
Michigan 429 328 89
Detroit 200 114 78
Ohio 524 455 59
Wisconsin 261 220 25
West North Central
Iowa 149 136 ∼Kansas 125 110 ∼Minnesota 184 166 ∼Missouri 255 212 37
Nebraska 71 62 ∼North Dakota 18 18 ∼South Dakota
South
South Atlantic
Delaware 33 26 ∼District of Columbia 41 ∼ 29
Florida 946 750 176
Georgia
Atlanta 139 72 55
Maryland 226 130 73
North Carolina 390 273 103
South Carolina 236 140 88
Virginia
West Virginia 134 130 ∼East South Central
Alabama
Kentucky 227 204 19
Mississippi
Tennessee
continued

Appendix E
E–27
Table E.13: Cancer of the Cervix Uteri. Invasive Cancer Incidence Counts by U.S. Census Region and Division,State and Metropolitan Area, Sex, and Race (All Races, White, Black), United States: SEER and NPCRRegistries that Meet Quality Criteria,*† 1999 (continued)
Male FemaleArea All Races White Black All Races White Black
West South Central
Arkansas
Louisiana 275 163 107
Oklahoma
Texas
West
Mountain
Arizona 183 170 ∼Colorado 135 124 ∼Idaho 37 37 ∼Montana 38 35 ∼Nevada
New Mexico 65 60 ∼Utah 55 53 ∼Wyoming 23 23 ∼
Pacific 2,087 ∼ 122
Alaska 18 ∼ ∼California 1,643 1,323 111
San Francisco-Oakland 149 101 18
San Jose-Monterey 85 61 ∼Los Angeles 574 458 55
Hawaii 58 18 ∼Oregon 146 136 ∼Washington 222 188 ∼
Seattle-Puget Sound 126 110 ∼∗ Data are from selected statewide and metropolitan area cancer registries that meet the following data quality criteria for all invasive cancer sites
combined: case ascertainment is at least 90% complete; ≥ 97% of cases pass a standard set of computerized edits; ≤ 5% of cases were ascertained by death
certificate only; ≤ 3% of cases are missing information on sex; ≤ 5% of cases are missing information on race; ≤ 3% of cases are missing information
on age. See Appendix H for registry-specific data quality information.
† Invasive cancers only
∼ Counts are suppressed if fewer than 16 cases were reported in the specific area-sex-race category.
Notes: Cases from suppressed counts are included in region/division counts. Region/division counts are presented for regions/divisions with 100% of the
population covered by registries that meet the data quality criteria specified above unless the count for exactly one state in the region or
division is suppressed due to a count of less than 16. California, Washington, and Michigan state counts each include cases from the SEER
metropolitan areas.

United States C
ancer Statistics: 1999 Incidence
E–28
Table E.14: Cancer of the Corpus Uteri. Invasive Cancer Incidence Counts by U.S. Census Region and Division,State and Metropolitan Area, Sex, and Race (All Races, White, Black), United States: SEER and NPCRRegistries that Meet Quality Criteria,*† 1999
Male FemaleArea All Races White Black All Races White Black
Northeast
New England
Connecticut 536 506 18
Maine
Massachusetts 1,006 937 21
New Hampshire 158 155 ∼Rhode Island 168 165 ∼Vermont
Middle Atlantic 6,414 5,611 544
New Jersey 1,395 1,244 117
New York 2,780 2,270 328
Pennsylvania 2,239 2,097 99
Midwest
East North Central
Illinois 1,574 1,376 137
Indiana
Michigan 1,418 1,294 106
Detroit 586 485 92
Ohio 1,717 1,555 107
Wisconsin 735 713 ∼West North Central
Iowa 483 476 ∼Kansas 388 368 ∼Minnesota 681 655 ∼Missouri 812 746 55
Nebraska 262 252 ∼North Dakota 82 82 ∼South Dakota
South
South Atlantic
Delaware 111 101 ∼District of Columbia 56 23 30
Florida 2,324 2,087 202
Georgia
Atlanta 204 156 41
Maryland 631 510 89
North Carolina 851 684 153
South Carolina 415 301 108
Virginia
West Virginia 300 291 ∼East South Central
Alabama
Kentucky 420 389 17
Mississippi
Tennessee
continued

Appendix E
E–29
Table E.14: Cancer of the Corpus Uteri. Invasive Cancer Incidence Counts by U.S. Census Region and Division,State and Metropolitan Area, Sex, and Race (All Races, White, Black), United States: SEER and NPCRRegistries that Meet Quality Criteria,*† 1999 (continued)
Male FemaleArea All Races White Black All Races White Black
West South Central
Arkansas
Louisiana 372 259 111
Oklahoma
Texas
West
Mountain
Arizona 459 444 ∼Colorado 385 369 ∼Idaho 155 155 ∼Montana 84 78 ∼Nevada
New Mexico 173 161 ∼Utah 209 204 ∼Wyoming 41 39 ∼
Pacific 4,989 4,264 189
Alaska 43 37 ∼California 3,537 3,029 177
San Francisco-Oakland 502 381 38
San Jose-Monterey 242 205 ∼Los Angeles 953 765 95
Hawaii 172 44 ∼Oregon 452 436 ∼Washington 785 718 ∼
Seattle-Puget Sound 533 491 ∼∗ Data are from selected statewide and metropolitan area cancer registries that meet the following data quality criteria for all invasive cancer sites
combined: case ascertainment is at least 90% complete; ≥ 97% of cases pass a standard set of computerized edits; ≤ 5% of cases were ascertained by death
certificate only; ≤ 3% of cases are missing information on sex; ≤ 5% of cases are missing information on race; ≤ 3% of cases are missing information
on age. See Appendix H for registry-specific data quality information.
† Invasive cancers only
∼ Counts are suppressed if fewer than 16 cases were reported in the specific area-sex-race category.
Notes: Cases from suppressed counts are included in region/division counts. Region/division counts are presented for regions/divisions with 100% of the
population covered by registries that meet the data quality criteria specified above unless the count for exactly one state in the region or
division is suppressed due to a count of less than 16. California, Washington, and Michigan state counts each include cases from the SEER
metropolitan areas.
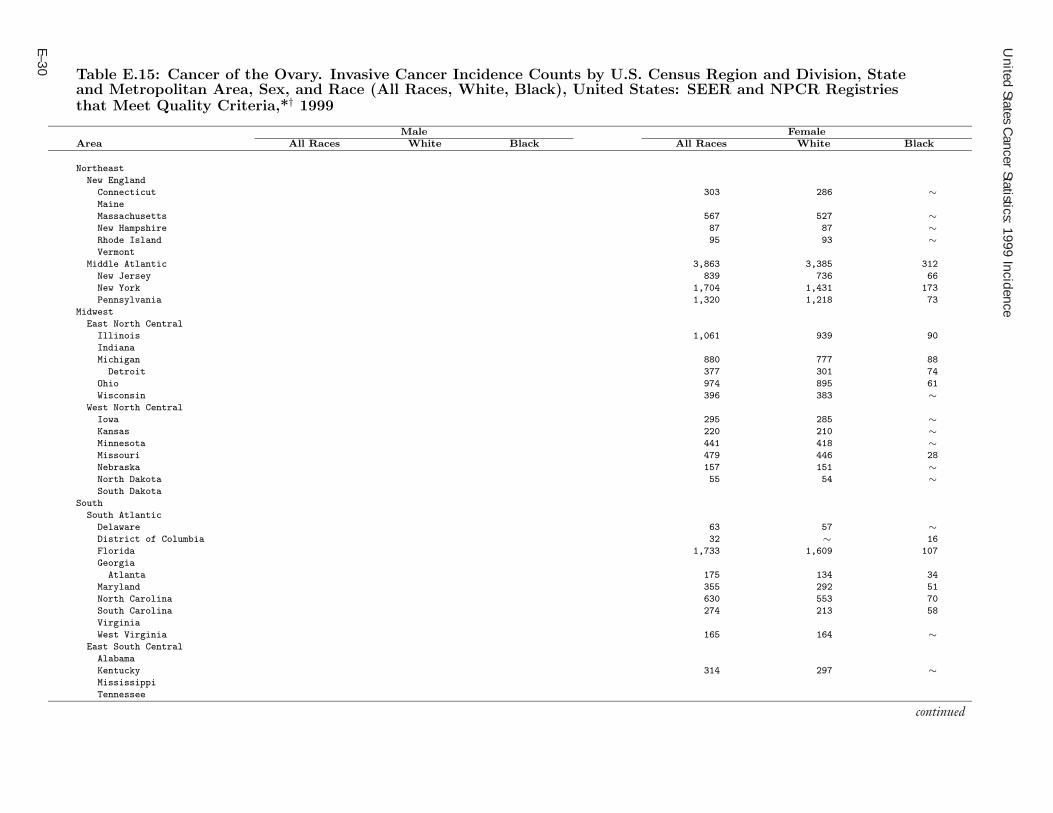
United States C
ancer Statistics: 1999 Incidence
E–30
Table E.15: Cancer of the Ovary. Invasive Cancer Incidence Counts by U.S. Census Region and Division, Stateand Metropolitan Area, Sex, and Race (All Races, White, Black), United States: SEER and NPCR Registriesthat Meet Quality Criteria,*† 1999
Male FemaleArea All Races White Black All Races White Black
Northeast
New England
Connecticut 303 286 ∼Maine
Massachusetts 567 527 ∼New Hampshire 87 87 ∼Rhode Island 95 93 ∼Vermont
Middle Atlantic 3,863 3,385 312
New Jersey 839 736 66
New York 1,704 1,431 173
Pennsylvania 1,320 1,218 73
Midwest
East North Central
Illinois 1,061 939 90
Indiana
Michigan 880 777 88
Detroit 377 301 74
Ohio 974 895 61
Wisconsin 396 383 ∼West North Central
Iowa 295 285 ∼Kansas 220 210 ∼Minnesota 441 418 ∼Missouri 479 446 28
Nebraska 157 151 ∼North Dakota 55 54 ∼South Dakota
South
South Atlantic
Delaware 63 57 ∼District of Columbia 32 ∼ 16
Florida 1,733 1,609 107
Georgia
Atlanta 175 134 34
Maryland 355 292 51
North Carolina 630 553 70
South Carolina 274 213 58
Virginia
West Virginia 165 164 ∼East South Central
Alabama
Kentucky 314 297 ∼Mississippi
Tennessee
continued

Appendix E
E–31
Table E.15: Cancer of the Ovary. Invasive Cancer Incidence Counts by U.S. Census Region and Division, Stateand Metropolitan Area, Sex, and Race (All Races, White, Black), United States: SEER and NPCR Registriesthat Meet Quality Criteria,*† 1999 (continued)
Male FemaleArea All Races White Black All Races White Black
West South Central
Arkansas
Louisiana 297 227 70
Oklahoma
Texas
West
Mountain
Arizona 346 336 ∼Colorado 340 327 ∼Idaho 99 99 ∼Montana 83 81 ∼Nevada
New Mexico 150 137 ∼Utah 141 139 ∼Wyoming 32 29 ∼
Pacific 3,571 3,088 130
Alaska 38 33 ∼California 2,587 2,222 122
San Francisco-Oakland 370 287 27
San Jose-Monterey 192 161 ∼Los Angeles 688 541 54
Hawaii 91 25 ∼Oregon 300 293 ∼Washington 555 515 ∼
Seattle-Puget Sound 411 385 ∼∗ Data are from selected statewide and metropolitan area cancer registries that meet the following data quality criteria for all invasive cancer sites
combined: case ascertainment is at least 90% complete; ≥ 97% of cases pass a standard set of computerized edits; ≤ 5% of cases were ascertained by death
certificate only; ≤ 3% of cases are missing information on sex; ≤ 5% of cases are missing information on race; ≤ 3% of cases are missing information
on age. See Appendix H for registry-specific data quality information.
† Invasive cancers only
∼ Counts are suppressed if fewer than 16 cases were reported in the specific area-sex-race category.
Notes: Cases from suppressed counts are included in region/division counts. Region/division counts are presented for regions/divisions with 100% of the
population covered by registries that meet the data quality criteria specified above unless the count for exactly one state in the region or
division is suppressed due to a count of less than 16. California, Washington, and Michigan state counts each include cases from the SEER
metropolitan areas.

United States C
ancer Statistics: 1999 Incidence
E–32
Table E.16: Cancer of the Prostate. Invasive Cancer Incidence Counts by U.S. Census Region and Division, Stateand Metropolitan Area, Sex, and Race (All Races, White, Black), United States: SEER and NPCR Registriesthat Meet Quality Criteria,*† 1999
Male FemaleArea All Races White Black All Races White Black
Northeast
New England
Connecticut 2,559 2,242 195
Maine
Massachusetts 5,002 4,565 246
New Hampshire 764 746 ∼Rhode Island 861 828 28
Vermont
Middle Atlantic 29,505 24,230 4,024
New Jersey 6,989 5,859 978
New York 12,280 9,418 2,100
Pennsylvania 10,236 8,953 946
Midwest
East North Central
Illinois 7,861 6,334 1,085
Indiana
Michigan 8,534 6,933 1,277
Detroit 3,805 2,700 996
Ohio 7,709 6,304 945
Wisconsin 3,787 3,562 162
West North Central
Iowa 2,164 2,048 42
Kansas 1,990 1,785 110
Minnesota 3,668 3,486 43
Missouri 3,515 3,087 381
Nebraska 1,329 1,218 29
North Dakota 599 590 ∼South Dakota
South
South Atlantic
Delaware 559 440 105
District of Columbia 542 115 405
Florida 13,820 12,171 1,417
Georgia
Atlanta 1,383 877 470
Maryland 3,866 2,555 904
North Carolina 4,630 3,563 982
South Carolina 2,888 1,994 842
Virginia
West Virginia 1,322 1,251 47
East South Central
Alabama
Kentucky 2,613 2,113 175
Mississippi
Tennessee
continued

Appendix E
E–33
Table E.16: Cancer of the Prostate. Invasive Cancer Incidence Counts by U.S. Census Region and Division, Stateand Metropolitan Area, Sex, and Race (All Races, White, Black), United States: SEER and NPCR Registriesthat Meet Quality Criteria,*† 1999 (continued)
Male FemaleArea All Races White Black All Races White Black
West South Central
Arkansas
Louisiana 2,817 1,944 857
Oklahoma
Texas
West
Mountain
Arizona 2,525 2,389 62
Colorado 2,621 2,486 85
Idaho 828 821 ∼Montana 684 635 ∼Nevada
New Mexico 1,096 1,056 20
Utah 1,269 1,252 ∼Wyoming 367 361 ∼
Pacific 28,034 22,519 ∼Alaska 280 235 17
California 19,886 15,547 1,720
San Francisco-Oakland 2,785 1,917 353
San Jose-Monterey 1,413 1,103 35
Los Angeles 5,261 3,737 851
Hawaii 774 236 ∼Oregon 2,715 2,572 39
Washington 4,379 3,929 114
Seattle-Puget Sound 3,026 2,803 104
∗ Data are from selected statewide and metropolitan area cancer registries that meet the following data quality criteria for all invasive cancer sites
combined: case ascertainment is at least 90% complete; ≥ 97% of cases pass a standard set of computerized edits; ≤ 5% of cases were ascertained by death
certificate only; ≤ 3% of cases are missing information on sex; ≤ 5% of cases are missing information on race; ≤ 3% of cases are missing information
on age. See Appendix H for registry-specific data quality information.
† Invasive cancers only
∼ Counts are suppressed if fewer than 16 cases were reported in the specific area-sex-race category.
Notes: Cases from suppressed counts are included in region/division counts. Region/division counts are presented for regions/divisions with 100% of the
population covered by registries that meet the data quality criteria specified above unless the count for exactly one state in the region or
division is suppressed due to a count of less than 16. California, Washington, and Michigan state counts each include cases from the SEER
metropolitan areas.

United States C
ancer Statistics: 1999 Incidence
E–34
Table E.17: Cancer of the Testis. Invasive Cancer Incidence Counts by U.S. Census Region and Division, Stateand Metropolitan Area, Sex, and Race (All Races, White, Black), United States: SEER and NPCR Registriesthat Meet Quality Criteria,*† 1999
Male FemaleArea All Races White Black All Races White Black
Northeast
New England
Connecticut 99 96 ∼Maine
Massachusetts 205 197 ∼New Hampshire 39 38 ∼Rhode Island 26 26 ∼Vermont
Middle Atlantic 1,059 981 35
New Jersey 235 220 ∼New York 497 447 18
Pennsylvania 327 314 ∼Midwest
East North Central
Illinois 318 283 ∼Indiana
Michigan 245 238 ∼Detroit 97 90 ∼
Ohio 302 288 ∼Wisconsin 194 186 ∼
West North Central
Iowa 82 77 ∼Kansas 83 81 ∼Minnesota 172 159 ∼Missouri 117 113 ∼Nebraska 63 62 ∼North Dakota 18 18 ∼South Dakota
South
South Atlantic
Delaware 19 16 ∼District of Columbia ∼ ∼ ∼Florida 361 334 17
Georgia
Atlanta 68 57 ∼Maryland 125 115 ∼North Carolina 162 149 ∼South Carolina 81 74 ∼Virginia
West Virginia 42 42 ∼East South Central
Alabama
Kentucky 105 99 ∼Mississippi
Tennessee
continued

Appendix E
E–35
Table E.17: Cancer of the Testis. Invasive Cancer Incidence Counts by U.S. Census Region and Division, Stateand Metropolitan Area, Sex, and Race (All Races, White, Black), United States: SEER and NPCR Registriesthat Meet Quality Criteria,*† 1999 (continued)
Male FemaleArea All Races White Black All Races White Black
West South Central
Arkansas
Louisiana 76 69 ∼Oklahoma
Texas
West
Mountain
Arizona 128 121 ∼Colorado 154 143 ∼Idaho 37 36 ∼Montana 26 24 ∼Nevada
New Mexico 47 41 ∼Utah 47 46 ∼Wyoming ∼ ∼ ∼
Pacific 1,286 ∼ 18
Alaska 27 26 ∼California 928 860 16
San Francisco-Oakland 137 118 ∼San Jose-Monterey 73 66 ∼Los Angeles 197 186 ∼
Hawaii 31 ∼ ∼Oregon 118 113 ∼Washington 182 168 ∼
Seattle-Puget Sound 124 118 ∼∗ Data are from selected statewide and metropolitan area cancer registries that meet the following data quality criteria for all invasive cancer sites
combined: case ascertainment is at least 90% complete; ≥ 97% of cases pass a standard set of computerized edits; ≤ 5% of cases were ascertained by death
certificate only; ≤ 3% of cases are missing information on sex; ≤ 5% of cases are missing information on race; ≤ 3% of cases are missing information
on age. See Appendix H for registry-specific data quality information.
† Invasive cancers only
∼ Counts are suppressed if fewer than 16 cases were reported in the specific area-sex-race category.
Notes: Cases from suppressed counts are included in region/division counts. Region/division counts are presented for regions/divisions with 100% of the
population covered by registries that meet the data quality criteria specified above unless the count for exactly one state in the region or
division is suppressed due to a count of less than 16. California, Washington, and Michigan state counts each include cases from the SEER
metropolitan areas.

United States C
ancer Statistics: 1999 Incidence
E–36
Table E.18: Cancer of the Urinary Bladder. Invasive Cancer Incidence Counts by U.S. Census Region andDivision, State and Metropolitan Area, Sex, and Race (All Races, White, Black), United States: SEER and NPCRRegistries that Meet Quality Criteria,*† 1999
Male FemaleArea All Races White Black All Races White Black
Northeast
New England
Connecticut 694 661 22 274 261 ∼Maine
Massachusetts 1,177 1,133 17 474 448 ∼New Hampshire 210 210 ∼ 81 79 ∼Rhode Island 259 256 ∼ 104 102 ∼Vermont
Middle Atlantic 7,323 6,876 271 2,753 2,523 160
New Jersey 1,650 1,578 56 562 518 32
New York 3,027 2,775 133 1,228 1,108 72
Pennsylvania 2,646 2,523 82 963 897 56
Midwest
East North Central
Illinois 1,850 1,674 89 711 625 67
Indiana
Michigan 1,702 1,584 95 603 542 53
Detroit 684 605 76 264 213 46
Ohio 1,977 1,807 84 729 658 45
Wisconsin 866 854 ∼ 317 312 ∼West North Central
Iowa 535 522 ∼ 159 154 ∼Kansas 401 378 ∼ 164 152 ∼Minnesota 743 719 ∼ 267 258 ∼Missouri 837 802 28 256 232 20
Nebraska 299 292 ∼ 75 72 ∼North Dakota 124 123 ∼ 36 35 ∼South Dakota
South
South Atlantic
Delaware 111 99 ∼ 56 48 ∼District of Columbia 44 ∼ 26 41 ∼ 26
Florida 3,631 3,504 71 1,239 1,166 63
Georgia
Atlanta 199 175 23 100 71 28
Maryland 610 544 50 272 230 27
North Carolina 976 887 78 366 329 34
South Carolina 542 486 51 165 128 36
Virginia
West Virginia 354 346 ∼ 168 161 ∼East South Central
Alabama
Kentucky 610 580 18 205 192 ∼Mississippi
Tennessee
continued
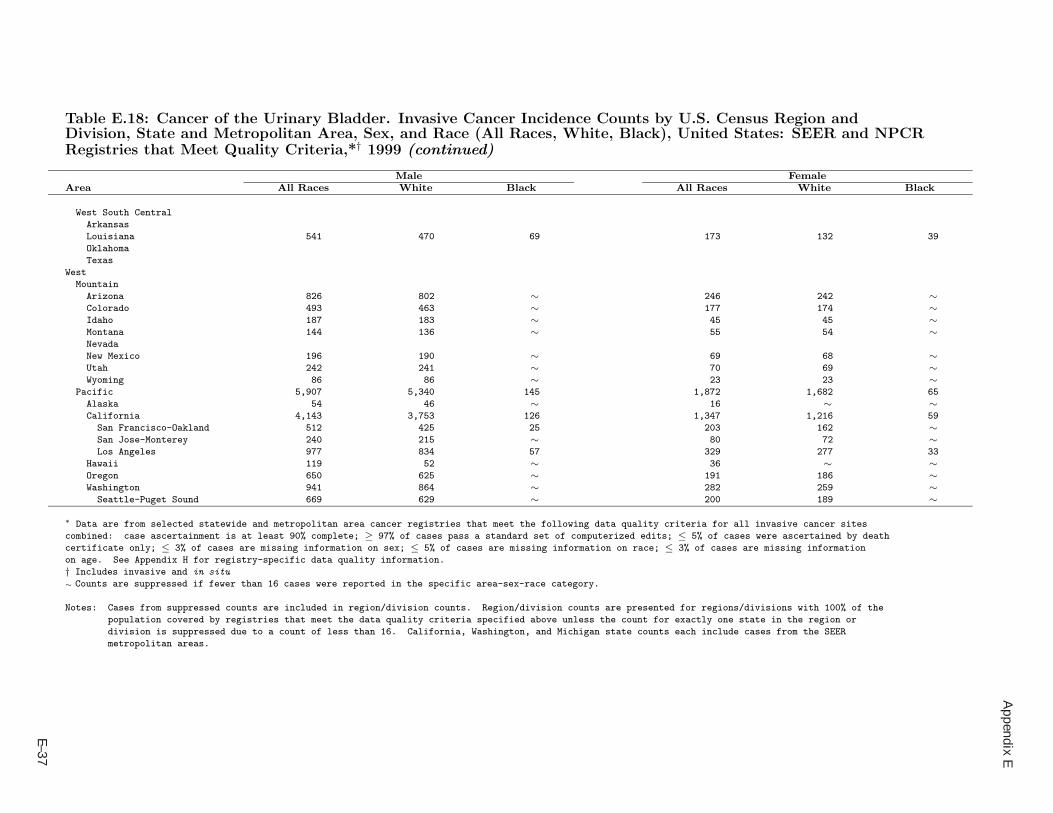
Appendix E
E–37
Table E.18: Cancer of the Urinary Bladder. Invasive Cancer Incidence Counts by U.S. Census Region andDivision, State and Metropolitan Area, Sex, and Race (All Races, White, Black), United States: SEER and NPCRRegistries that Meet Quality Criteria,*† 1999 (continued)
Male FemaleArea All Races White Black All Races White Black
West South Central
Arkansas
Louisiana 541 470 69 173 132 39
Oklahoma
Texas
West
Mountain
Arizona 826 802 ∼ 246 242 ∼Colorado 493 463 ∼ 177 174 ∼Idaho 187 183 ∼ 45 45 ∼Montana 144 136 ∼ 55 54 ∼Nevada
New Mexico 196 190 ∼ 69 68 ∼Utah 242 241 ∼ 70 69 ∼Wyoming 86 86 ∼ 23 23 ∼
Pacific 5,907 5,340 145 1,872 1,682 65
Alaska 54 46 ∼ 16 ∼ ∼California 4,143 3,753 126 1,347 1,216 59
San Francisco-Oakland 512 425 25 203 162 ∼San Jose-Monterey 240 215 ∼ 80 72 ∼Los Angeles 977 834 57 329 277 33
Hawaii 119 52 ∼ 36 ∼ ∼Oregon 650 625 ∼ 191 186 ∼Washington 941 864 ∼ 282 259 ∼
Seattle-Puget Sound 669 629 ∼ 200 189 ∼∗ Data are from selected statewide and metropolitan area cancer registries that meet the following data quality criteria for all invasive cancer sites
combined: case ascertainment is at least 90% complete; ≥ 97% of cases pass a standard set of computerized edits; ≤ 5% of cases were ascertained by death
certificate only; ≤ 3% of cases are missing information on sex; ≤ 5% of cases are missing information on race; ≤ 3% of cases are missing information
on age. See Appendix H for registry-specific data quality information.
† Includes invasive and in situ
∼ Counts are suppressed if fewer than 16 cases were reported in the specific area-sex-race category.
Notes: Cases from suppressed counts are included in region/division counts. Region/division counts are presented for regions/divisions with 100% of the
population covered by registries that meet the data quality criteria specified above unless the count for exactly one state in the region or
division is suppressed due to a count of less than 16. California, Washington, and Michigan state counts each include cases from the SEER
metropolitan areas.
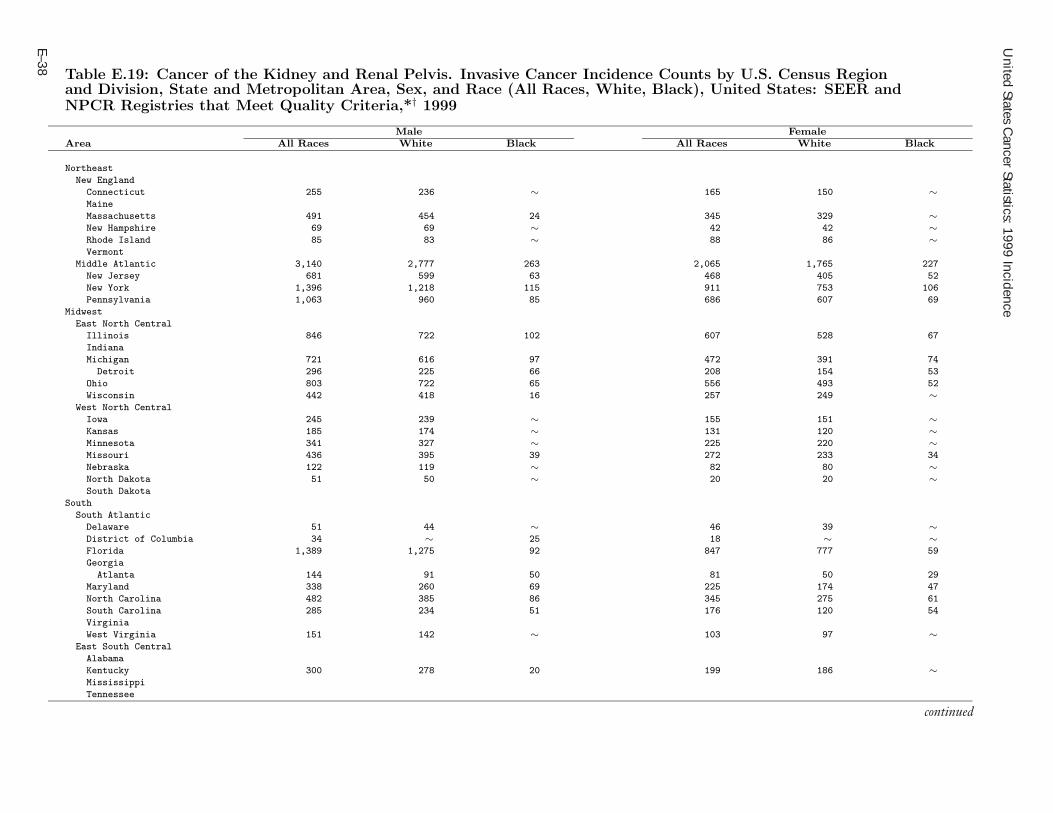
United States C
ancer Statistics: 1999 Incidence
E–38
Table E.19: Cancer of the Kidney and Renal Pelvis. Invasive Cancer Incidence Counts by U.S. Census Regionand Division, State and Metropolitan Area, Sex, and Race (All Races, White, Black), United States: SEER andNPCR Registries that Meet Quality Criteria,*† 1999
Male FemaleArea All Races White Black All Races White Black
Northeast
New England
Connecticut 255 236 ∼ 165 150 ∼Maine
Massachusetts 491 454 24 345 329 ∼New Hampshire 69 69 ∼ 42 42 ∼Rhode Island 85 83 ∼ 88 86 ∼Vermont
Middle Atlantic 3,140 2,777 263 2,065 1,765 227
New Jersey 681 599 63 468 405 52
New York 1,396 1,218 115 911 753 106
Pennsylvania 1,063 960 85 686 607 69
Midwest
East North Central
Illinois 846 722 102 607 528 67
Indiana
Michigan 721 616 97 472 391 74
Detroit 296 225 66 208 154 53
Ohio 803 722 65 556 493 52
Wisconsin 442 418 16 257 249 ∼West North Central
Iowa 245 239 ∼ 155 151 ∼Kansas 185 174 ∼ 131 120 ∼Minnesota 341 327 ∼ 225 220 ∼Missouri 436 395 39 272 233 34
Nebraska 122 119 ∼ 82 80 ∼North Dakota 51 50 ∼ 20 20 ∼South Dakota
South
South Atlantic
Delaware 51 44 ∼ 46 39 ∼District of Columbia 34 ∼ 25 18 ∼ ∼Florida 1,389 1,275 92 847 777 59
Georgia
Atlanta 144 91 50 81 50 29
Maryland 338 260 69 225 174 47
North Carolina 482 385 86 345 275 61
South Carolina 285 234 51 176 120 54
Virginia
West Virginia 151 142 ∼ 103 97 ∼East South Central
Alabama
Kentucky 300 278 20 199 186 ∼Mississippi
Tennessee
continued

Appendix E
E–39
Table E.19: Cancer of the Kidney and Renal Pelvis. Invasive Cancer Incidence Counts by U.S. Census Regionand Division, State and Metropolitan Area, Sex, and Race (All Races, White, Black), United States: SEER andNPCR Registries that Meet Quality Criteria,*† 1999 (continued)
Male FemaleArea All Races White Black All Races White Black
West South Central
Arkansas
Louisiana 342 244 96 231 172 59
Oklahoma
Texas
West
Mountain
Arizona 326 305 ∼ 195 185 ∼Colorado 237 223 ∼ 143 135 ∼Idaho 65 64 ∼ 69 68 ∼Montana 64 59 ∼ 49 47 ∼Nevada
New Mexico 95 87 ∼ 76 72 ∼Utah 89 87 ∼ 43 42 ∼Wyoming 29 28 ∼ 16 16 ∼
Pacific 2,569 2,226 139 1,563 1,357 102
Alaska 44 33 ∼ 19 ∼ ∼California 1,828 1,600 120 1,127 973 90
San Francisco-Oakland 240 195 20 140 104 17
San Jose-Monterey 97 85 ∼ 80 69 ∼Los Angeles 487 397 53 344 273 52
Hawaii 79 29 ∼ 35 ∼ ∼Oregon 241 225 ∼ 144 142 ∼Washington 377 339 ∼ 238 219 ∼
Seattle-Puget Sound 251 227 ∼ 155 139 ∼∗ Data are from selected statewide and metropolitan area cancer registries that meet the following data quality criteria for all invasive cancer sites
combined: case ascertainment is at least 90% complete; ≥ 97% of cases pass a standard set of computerized edits; ≤ 5% of cases were ascertained by death
certificate only; ≤ 3% of cases are missing information on sex; ≤ 5% of cases are missing information on race; ≤ 3% of cases are missing information
on age. See Appendix H for registry-specific data quality information.
† Invasive cancers only
∼ Counts are suppressed if fewer than 16 cases were reported in the specific area-sex-race category.
Notes: Cases from suppressed counts are included in region/division counts. Region/division counts are presented for regions/divisions with 100% of the
population covered by registries that meet the data quality criteria specified above unless the count for exactly one state in the region or
division is suppressed due to a count of less than 16. California, Washington, and Michigan state counts each include cases from the SEER
metropolitan areas.

United States C
ancer Statistics: 1999 Incidence
E–40
Table E.20: Cancer of the Brain and Other Nervous System. Invasive Cancer Incidence Counts by U.S. CensusRegion and Division, State and Metropolitan Area, Sex, and Race (All Races, White, Black), United States: SEERand NPCR Registries that Meet Quality Criteria,*† 1999
Male FemaleArea All Races White Black All Races White Black
Northeast
New England
Connecticut 141 133 ∼ 109 101 ∼Maine
Massachusetts 232 215 ∼ 233 222 ∼New Hampshire 47 46 ∼ 32 31 ∼Rhode Island 51 50 ∼ 41 39 ∼Vermont
Middle Atlantic 1,445 1,259 105 1,283 1,142 99
New Jersey 300 260 25 296 267 20
New York 667 555 64 591 509 55
Pennsylvania 478 444 16 396 366 24
Midwest
East North Central
Illinois 413 364 34 348 308 31
Indiana
Michigan 391 361 27 318 289 22
Detroit 159 136 21 114 94 16
Ohio 407 368 26 360 326 24
Wisconsin 187 181 ∼ 174 164 ∼West North Central
Iowa 110 110 ∼ 84 83 ∼Kansas 83 79 ∼ 77 75 ∼Minnesota 199 193 ∼ 149 148 ∼Missouri 202 192 ∼ 182 172 ∼Nebraska 57 57 ∼ 61 56 ∼North Dakota 16 16 ∼ 17 17 ∼South Dakota
South
South Atlantic
Delaware 25 23 ∼ 27 23 ∼District of Columbia 26 ∼ ∼ ∼ ∼ ∼Florida 633 580 41 537 484 40
Georgia
Atlanta 81 63 ∼ 64 56 ∼Maryland 168 134 31 144 106 29
North Carolina 289 265 21 198 173 22
South Carolina 141 119 21 104 81 22
Virginia
West Virginia 67 66 ∼ 63 61 ∼East South Central
Alabama
Kentucky 135 128 ∼ 110 102 ∼Mississippi
Tennessee
continued

Appendix E
E–41
Table E.20: Cancer of the Brain and Other Nervous System. Invasive Cancer Incidence Counts by U.S. CensusRegion and Division, State and Metropolitan Area, Sex, and Race (All Races, White, Black), United States: SEERand NPCR Registries that Meet Quality Criteria,*† 1999 (continued)
Male FemaleArea All Races White Black All Races White Black
West South Central
Arkansas
Louisiana 122 103 19 112 80 31
Oklahoma
Texas
West
Mountain
Arizona 171 163 ∼ 156 152 ∼Colorado 151 143 ∼ 108 100 ∼Idaho 65 65 ∼ 37 37 ∼Montana 23 22 ∼ 33 31 ∼Nevada
New Mexico 62 57 ∼ 46 43 ∼Utah 69 67 ∼ 50 49 ∼Wyoming 23 23 ∼ ∼ ∼ ∼
Pacific 1,525 1,370 50 1,182 1,044 43
Alaska 17 ∼ ∼ 17 ∼ ∼California 1,105 984 48 843 744 40
San Francisco-Oakland 154 124 ∼ 118 98 ∼San Jose-Monterey 82 70 ∼ 67 56 ∼Los Angeles 267 227 18 217 186 23
Hawaii 28 ∼ ∼ 23 ∼ ∼Oregon 131 128 ∼ 90 86 ∼Washington 244 230 ∼ 209 192 ∼
Seattle-Puget Sound 168 161 ∼ 138 127 ∼∗ Data are from selected statewide and metropolitan area cancer registries that meet the following data quality criteria for all invasive cancer sites
combined: case ascertainment is at least 90% complete; ≥ 97% of cases pass a standard set of computerized edits; ≤ 5% of cases were ascertained by death
certificate only; ≤ 3% of cases are missing information on sex; ≤ 5% of cases are missing information on race; ≤ 3% of cases are missing information
on age. See Appendix H for registry-specific data quality information.
† Invasive cancers only
∼ Counts are suppressed if fewer than 16 cases were reported in the specific area-sex-race category.
Notes: Cases from suppressed counts are included in region/division counts. Region/division counts are presented for regions/divisions with 100% of the
population covered by registries that meet the data quality criteria specified above unless the count for exactly one state in the region or
division is suppressed due to a count of less than 16. California, Washington, and Michigan state counts each include cases from the SEER
metropolitan areas.
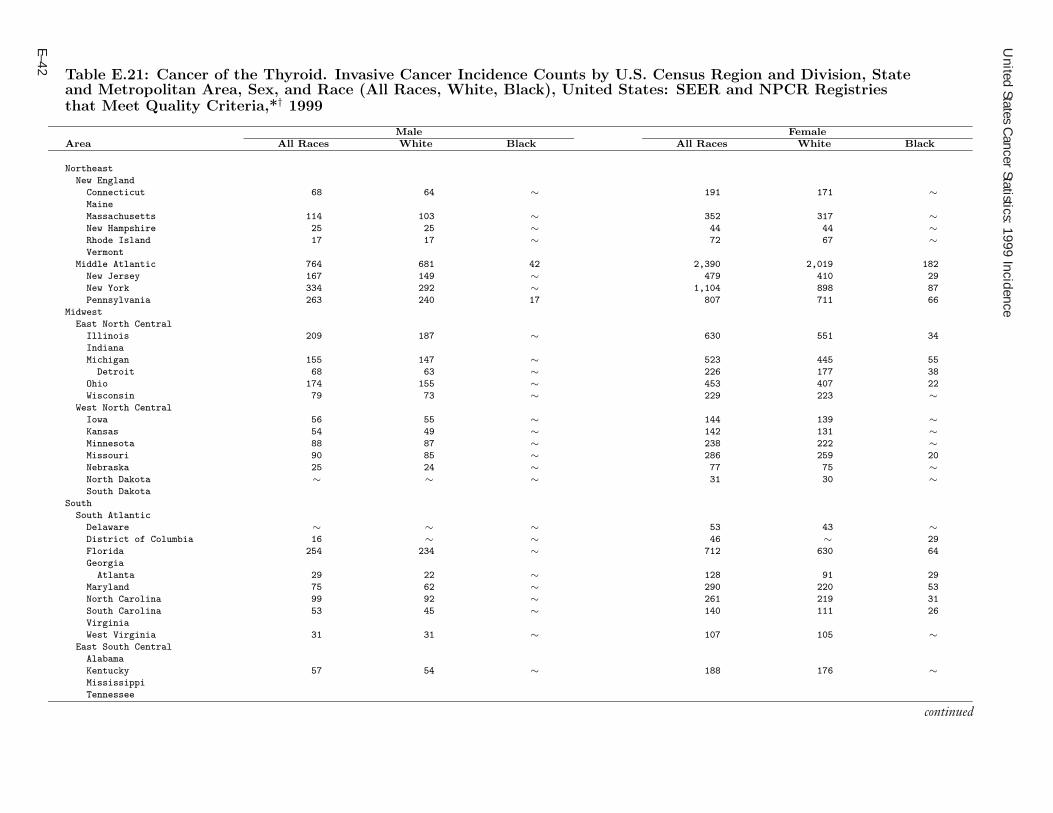
United States C
ancer Statistics: 1999 Incidence
E–42
Table E.21: Cancer of the Thyroid. Invasive Cancer Incidence Counts by U.S. Census Region and Division, Stateand Metropolitan Area, Sex, and Race (All Races, White, Black), United States: SEER and NPCR Registriesthat Meet Quality Criteria,*† 1999
Male FemaleArea All Races White Black All Races White Black
Northeast
New England
Connecticut 68 64 ∼ 191 171 ∼Maine
Massachusetts 114 103 ∼ 352 317 ∼New Hampshire 25 25 ∼ 44 44 ∼Rhode Island 17 17 ∼ 72 67 ∼Vermont
Middle Atlantic 764 681 42 2,390 2,019 182
New Jersey 167 149 ∼ 479 410 29
New York 334 292 ∼ 1,104 898 87
Pennsylvania 263 240 17 807 711 66
Midwest
East North Central
Illinois 209 187 ∼ 630 551 34
Indiana
Michigan 155 147 ∼ 523 445 55
Detroit 68 63 ∼ 226 177 38
Ohio 174 155 ∼ 453 407 22
Wisconsin 79 73 ∼ 229 223 ∼West North Central
Iowa 56 55 ∼ 144 139 ∼Kansas 54 49 ∼ 142 131 ∼Minnesota 88 87 ∼ 238 222 ∼Missouri 90 85 ∼ 286 259 20
Nebraska 25 24 ∼ 77 75 ∼North Dakota ∼ ∼ ∼ 31 30 ∼South Dakota
South
South Atlantic
Delaware ∼ ∼ ∼ 53 43 ∼District of Columbia 16 ∼ ∼ 46 ∼ 29
Florida 254 234 ∼ 712 630 64
Georgia
Atlanta 29 22 ∼ 128 91 29
Maryland 75 62 ∼ 290 220 53
North Carolina 99 92 ∼ 261 219 31
South Carolina 53 45 ∼ 140 111 26
Virginia
West Virginia 31 31 ∼ 107 105 ∼East South Central
Alabama
Kentucky 57 54 ∼ 188 176 ∼Mississippi
Tennessee
continued

Appendix E
E–43
Table E.21: Cancer of the Thyroid. Invasive Cancer Incidence Counts by U.S. Census Region and Division, Stateand Metropolitan Area, Sex, and Race (All Races, White, Black), United States: SEER and NPCR Registriesthat Meet Quality Criteria,*† 1999 (continued)
Male FemaleArea All Races White Black All Races White Black
West South Central
Arkansas
Louisiana 59 49 ∼ 171 130 39
Oklahoma
Texas
West
Mountain
Arizona 82 78 ∼ 225 211 ∼Colorado 65 59 ∼ 222 205 ∼Idaho 23 23 ∼ 51 49 ∼Montana 24 22 ∼ 68 63 ∼Nevada
New Mexico 32 32 ∼ 100 95 ∼Utah 33 31 ∼ 115 107 ∼Wyoming ∼ ∼ ∼ 19 18 ∼
Pacific 740 608 20 2,164 ∼ 69
Alaska 18 ∼ ∼ 30 20 ∼California 505 422 18 1,577 1,271 55
San Francisco-Oakland 61 42 ∼ 177 124 ∼San Jose-Monterey 51 44 ∼ 117 88 ∼Los Angeles 138 109 ∼ 474 375 23
Hawaii 37 ∼ ∼ 73 ∼ ∼Oregon 64 59 ∼ 148 142 ∼Washington 116 101 ∼ 336 282 ∼
Seattle-Puget Sound 84 77 ∼ 247 211 ∼∗ Data are from selected statewide and metropolitan area cancer registries that meet the following data quality criteria for all invasive cancer sites
combined: case ascertainment is at least 90% complete; ≥ 97% of cases pass a standard set of computerized edits; ≤ 5% of cases were ascertained by death
certificate only; ≤ 3% of cases are missing information on sex; ≤ 5% of cases are missing information on race; ≤ 3% of cases are missing information
on age. See Appendix H for registry-specific data quality information.
† Invasive cancers only
∼ Counts are suppressed if fewer than 16 cases were reported in the specific area-sex-race category.
Notes: Cases from suppressed counts are included in region/division counts. Region/division counts are presented for regions/divisions with 100% of the
population covered by registries that meet the data quality criteria specified above unless the count for exactly one state in the region or
division is suppressed due to a count of less than 16. California, Washington, and Michigan state counts each include cases from the SEER
metropolitan areas.

United States C
ancer Statistics: 1999 Incidence
E–44
Table E.22: Hodgkin Lymphoma. Cancer Incidence Counts by U.S. Census Region and Division, State andMetropolitan Area, Sex, and Race (All Races, White, Black), United States: SEER and NPCR Registries thatMeet Quality Criteria,*† 1999
Male FemaleArea All Races White Black All Races White Black
Northeast
New England
Connecticut 51 48 ∼ 53 47 ∼Maine
Massachusetts 116 109 ∼ 104 99 ∼New Hampshire 22 22 ∼ 19 19 ∼Rhode Island 20 19 ∼ 16 16 ∼Vermont
Middle Atlantic 664 556 79 564 486 ∼New Jersey 145 119 23 128 108 17
New York 302 242 40 264 219 29
Pennsylvania 217 195 16 172 159 ∼Midwest
East North Central
Illinois 180 144 18 149 132 ∼Indiana
Michigan 184 159 23 138 120 18
Detroit 73 55 17 66 53 ∼Ohio 174 150 17 131 117 ∼Wisconsin 87 78 ∼ 73 71 ∼
West North Central
Iowa 40 39 ∼ 42 41 ∼Kansas 49 45 ∼ 31 30 ∼Minnesota 87 78 ∼ 77 69 ∼Missouri 89 80 ∼ 81 71 ∼Nebraska 30 30 ∼ 23 19 ∼North Dakota ∼ ∼ ∼ ∼ ∼ ∼South Dakota
South
South Atlantic
Delaware 19 ∼ ∼ ∼ ∼ ∼District of Columbia ∼ ∼ ∼ ∼ ∼ ∼Florida 225 195 26 204 178 21
Georgia
Atlanta 36 20 ∼ 33 24 ∼Maryland 77 56 18 64 47 ∼North Carolina 103 77 21 95 71 22
South Carolina 44 32 ∼ 41 29 ∼Virginia
West Virginia 30 29 ∼ 30 29 ∼East South Central
Alabama
Kentucky 58 55 ∼ 43 39 ∼Mississippi
Tennessee
continued

Appendix E
E–45
Table E.22: Hodgkin Lymphoma. Cancer Incidence Counts by U.S. Census Region and Division, State andMetropolitan Area, Sex, and Race (All Races, White, Black), United States: SEER and NPCR Registries thatMeet Quality Criteria,*† 1999 (continued)
Male FemaleArea All Races White Black All Races White Black
West South Central
Arkansas
Louisiana 54 32 21 63 45 18
Oklahoma
Texas
West
Mountain
Arizona 50 46 ∼ 50 45 ∼Colorado 64 61 ∼ 44 40 ∼Idaho ∼ ∼ ∼ 18 18 ∼Montana ∼ ∼ ∼ ∼ ∼ ∼Nevada
New Mexico 28 27 ∼ ∼ ∼ ∼Utah 27 26 ∼ 26 26 ∼Wyoming ∼ ∼ ∼ ∼ ∼ ∼
Pacific 586 518 29 514 443 23
Alaska ∼ ∼ ∼ ∼ ∼ ∼California 429 381 27 379 326 19
San Francisco-Oakland 53 37 ∼ 47 34 ∼San Jose-Monterey 34 32 ∼ 23 21 ∼Los Angeles 120 105 ∼ 125 105 ∼
Hawaii ∼ ∼ ∼ ∼ ∼ ∼Oregon 50 47 ∼ 44 41 ∼Washington 88 81 ∼ 76 67 ∼
Seattle-Puget Sound 59 56 ∼ 58 55 ∼∗ Data are from selected statewide and metropolitan area cancer registries that meet the following data quality criteria for all invasive cancer sites
combined: case ascertainment is at least 90% complete; ≥ 97% of cases pass a standard set of computerized edits; ≤ 5% of cases were ascertained by death
certificate only; ≤ 3% of cases are missing information on sex; ≤ 5% of cases are missing information on race; ≤ 3% of cases are missing information
on age. See Appendix H for registry-specific data quality information.
† Invasive cancers only
∼ Counts are suppressed if fewer than 16 cases were reported in the specific area-sex-race category.
Notes: Cases from suppressed counts are included in region/division counts. Region/division counts are presented for regions/divisions with 100% of the
population covered by registries that meet the data quality criteria specified above unless the count for exactly one state in the region or
division is suppressed due to a count of less than 16. California, Washington, and Michigan state counts each include cases from the SEER
metropolitan areas.

United States C
ancer Statistics: 1999 Incidence
E–46
Table E.23: Non-Hodgkin Lymphoma. Cancer Incidence Counts by U.S. Census Region and Division, Stateand Metropolitan Area, Sex, and Race (All Races, White, Black), United States: SEER and NPCR Registriesthat Meet Quality Criteria,*† 1999
Male FemaleArea All Races White Black All Races White Black
Northeast
New England
Connecticut 407 378 23 355 338 ∼Maine
Massachusetts 630 580 19 624 574 23
New Hampshire 100 99 ∼ 102 100 ∼Rhode Island 110 106 ∼ 131 129 ∼Vermont
Middle Atlantic 4,114 3,506 396 3,963 3,460 336
New Jersey 936 805 88 868 761 84
New York 1,786 1,446 227 1,770 1,476 188
Pennsylvania 1,392 1,255 81 1,325 1,223 64
Midwest
East North Central
Illinois 1,203 1,060 94 1,072 963 70
Indiana
Michigan 964 870 79 925 838 76
Detroit 392 327 56 374 311 57
Ohio 1,107 1,002 77 1,120 1,009 79
Wisconsin 543 513 18 452 438 ∼West North Central
Iowa 302 295 ∼ 291 286 ∼Kansas 254 235 ∼ 246 227 ∼Minnesota 530 502 ∼ 474 447 ∼Missouri 512 476 29 508 456 45
Nebraska 147 142 ∼ 153 146 ∼North Dakota 74 73 ∼ 50 49 ∼South Dakota
South
South Atlantic
Delaware 59 55 ∼ 55 44 ∼District of Columbia 48 17 28 33 ∼ 16
Florida 1,858 1,690 136 1,585 1,463 95
Georgia
Atlanta 193 141 45 142 106 31
Maryland 445 333 81 365 286 61
North Carolina 598 518 69 515 438 72
South Carolina 309 241 64 283 231 46
Virginia
West Virginia 198 193 ∼ 199 191 ∼East South Central
Alabama
Kentucky 365 335 20 333 317 ∼Mississippi
Tennessee
continued

Appendix E
E–47
Table E.23: Non-Hodgkin Lymphoma. Cancer Incidence Counts by U.S. Census Region and Division, Stateand Metropolitan Area, Sex, and Race (All Races, White, Black), United States: SEER and NPCR Registriesthat Meet Quality Criteria,*† 1999 (continued)
Male FemaleArea All Races White Black All Races White Black
West South Central
Arkansas
Louisiana 367 281 84 363 303 60
Oklahoma
Texas
West
Mountain
Arizona 418 404 ∼ 338 326 ∼Colorado 343 327 ∼ 347 332 ∼Idaho 101 99 ∼ 109 104 ∼Montana 89 86 ∼ 64 64 ∼Nevada
New Mexico 118 112 ∼ 116 109 ∼Utah 172 169 ∼ 122 121 ∼Wyoming 32 30 ∼ 33 32 ∼
Pacific 4,023 3,414 168 3,355 2,867 126
Alaska 45 38 ∼ 42 37 ∼California 2,918 2,478 147 2,422 2,056 113
San Francisco-Oakland 469 356 38 336 253 25
San Jose-Monterey 185 147 ∼ 181 140 ∼Los Angeles 800 652 63 647 530 50
Hawaii 114 30 ∼ 80 20 ∼Oregon 352 330 ∼ 302 287 ∼Washington 594 538 ∼ 509 467 ∼
Seattle-Puget Sound 432 386 ∼ 350 322 ∼∗ Data are from selected statewide and metropolitan area cancer registries that meet the following data quality criteria for all invasive cancer sites
combined: case ascertainment is at least 90% complete; ≥ 97% of cases pass a standard set of computerized edits; ≤ 5% of cases were ascertained by death
certificate only; ≤ 3% of cases are missing information on sex; ≤ 5% of cases are missing information on race; ≤ 3% of cases are missing information
on age. See Appendix H for registry-specific data quality information.
† Invasive cancers only
∼ Counts are suppressed if fewer than 16 cases were reported in the specific area-sex-race category.
Notes: Cases from suppressed counts are included in region/division counts. Region/division counts are presented for regions/divisions with 100% of the
population covered by registries that meet the data quality criteria specified above unless the count for exactly one state in the region or
division is suppressed due to a count of less than 16. California, Washington, and Michigan state counts each include cases from the SEER
metropolitan areas.

United States C
ancer Statistics: 1999 Incidence
E–48
Table E.24: Multiple Myeloma. Cancer Incidence Counts by U.S. Census Region and Division, State andMetropolitan Area, Sex, and Race (All Races, White, Black), United States: SEER and NPCR Registries thatMeet Quality Criteria,*† 1999
Male FemaleArea All Races White Black All Races White Black
Northeast
New England
Connecticut 98 89 ∼ 73 62 ∼Maine
Massachusetts 148 136 ∼ 129 113 ∼New Hampshire 33 33 ∼ 20 20 ∼Rhode Island 25 24 ∼ 33 32 ∼Vermont
Middle Atlantic 1,072 856 179 1,097 825 223
New Jersey 236 187 44 218 162 45
New York 498 388 86 514 371 115
Pennsylvania 338 281 49 365 292 63
Midwest
East North Central
Illinois 311 239 59 325 222 92
Indiana
Michigan 284 224 57 229 173 52
Detroit 129 82 47 115 72 41
Ohio 310 251 52 264 219 42
Wisconsin 130 125 ∼ 123 117 ∼West North Central
Iowa 81 78 ∼ 72 71 ∼Kansas 72 67 ∼ 67 55 ∼Minnesota 129 123 ∼ 102 92 ∼Missouri 123 99 21 136 103 30
Nebraska 47 45 ∼ 41 40 ∼North Dakota ∼ ∼ ∼ 22 21 ∼South Dakota
South
South Atlantic
Delaware 22 ∼ ∼ 18 16 ∼District of Columbia 19 ∼ ∼ 21 ∼ 17
Florida 513 436 74 453 396 50
Georgia
Atlanta 49 28 20 47 27 19
Maryland 128 83 40 114 70 41
North Carolina 168 128 38 162 113 46
South Carolina 91 60 29 91 54 35
Virginia
West Virginia 47 46 ∼ 45 40 ∼East South Central
Alabama
Kentucky 124 112 ∼ 103 92 ∼Mississippi
Tennessee
continued

Appendix E
E–49
Table E.24: Multiple Myeloma. Cancer Incidence Counts by U.S. Census Region and Division, State andMetropolitan Area, Sex, and Race (All Races, White, Black), United States: SEER and NPCR Registries thatMeet Quality Criteria,*† 1999 (continued)
Male FemaleArea All Races White Black All Races White Black
West South Central
Arkansas
Louisiana 123 73 50 111 59 52
Oklahoma
Texas
West
Mountain
Arizona 93 84 ∼ 84 73 ∼Colorado 95 89 ∼ 78 76 ∼Idaho 38 37 ∼ 25 25 ∼Montana 24 21 ∼ 20 20 ∼Nevada
New Mexico 39 35 ∼ 33 29 ∼Utah 45 43 ∼ 25 25 ∼Wyoming ∼ ∼ ∼ ∼ ∼ ∼
Pacific ∼ 844 95 ∼ 685 94
Alaska ∼ ∼ ∼ ∼ ∼ ∼California 744 589 86 647 507 85
San Francisco-Oakland 102 58 20 89 57 20
San Jose-Monterey 32 26 ∼ 45 38 ∼Los Angeles 234 165 50 179 120 44
Hawaii 22 ∼ ∼ 23 ∼ ∼Oregon 93 89 ∼ 63 60 ∼Washington 163 150 ∼ 119 108 ∼
Seattle-Puget Sound 114 104 ∼ 86 76 ∼∗ Data are from selected statewide and metropolitan area cancer registries that meet the following data quality criteria for all invasive cancer sites
combined: case ascertainment is at least 90% complete; ≥ 97% of cases pass a standard set of computerized edits; ≤ 5% of cases were ascertained by death
certificate only; ≤ 3% of cases are missing information on sex; ≤ 5% of cases are missing information on race; ≤ 3% of cases are missing information
on age. See Appendix H for registry-specific data quality information.
† Invasive cancers only
∼ Counts are suppressed if fewer than 16 cases were reported in the specific area-sex-race category.
Notes: Cases from suppressed counts are included in region/division counts. Region/division counts are presented for regions/divisions with 100% of the
population covered by registries that meet the data quality criteria specified above unless the count for exactly one state in the region or
division is suppressed due to a count of less than 16. California, Washington, and Michigan state counts each include cases from the SEER
metropolitan areas.
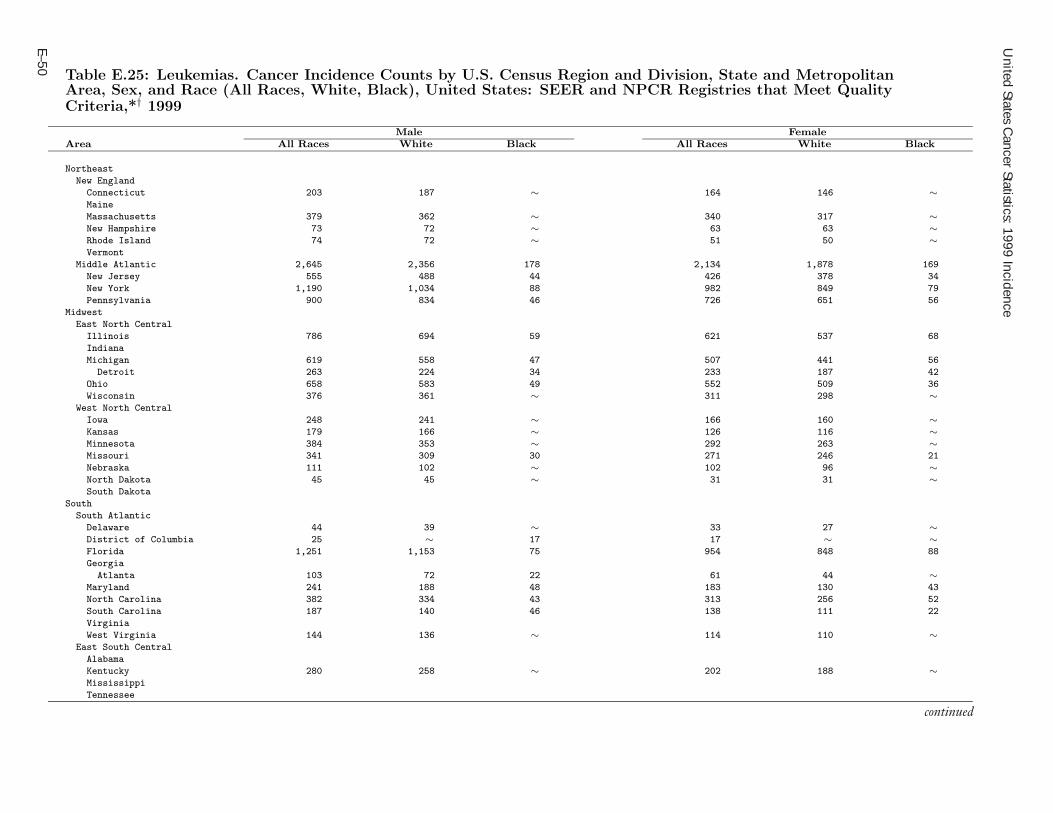
United States C
ancer Statistics: 1999 Incidence
E–50
Table E.25: Leukemias. Cancer Incidence Counts by U.S. Census Region and Division, State and MetropolitanArea, Sex, and Race (All Races, White, Black), United States: SEER and NPCR Registries that Meet QualityCriteria,*† 1999
Male FemaleArea All Races White Black All Races White Black
Northeast
New England
Connecticut 203 187 ∼ 164 146 ∼Maine
Massachusetts 379 362 ∼ 340 317 ∼New Hampshire 73 72 ∼ 63 63 ∼Rhode Island 74 72 ∼ 51 50 ∼Vermont
Middle Atlantic 2,645 2,356 178 2,134 1,878 169
New Jersey 555 488 44 426 378 34
New York 1,190 1,034 88 982 849 79
Pennsylvania 900 834 46 726 651 56
Midwest
East North Central
Illinois 786 694 59 621 537 68
Indiana
Michigan 619 558 47 507 441 56
Detroit 263 224 34 233 187 42
Ohio 658 583 49 552 509 36
Wisconsin 376 361 ∼ 311 298 ∼West North Central
Iowa 248 241 ∼ 166 160 ∼Kansas 179 166 ∼ 126 116 ∼Minnesota 384 353 ∼ 292 263 ∼Missouri 341 309 30 271 246 21
Nebraska 111 102 ∼ 102 96 ∼North Dakota 45 45 ∼ 31 31 ∼South Dakota
South
South Atlantic
Delaware 44 39 ∼ 33 27 ∼District of Columbia 25 ∼ 17 17 ∼ ∼Florida 1,251 1,153 75 954 848 88
Georgia
Atlanta 103 72 22 61 44 ∼Maryland 241 188 48 183 130 43
North Carolina 382 334 43 313 256 52
South Carolina 187 140 46 138 111 22
Virginia
West Virginia 144 136 ∼ 114 110 ∼East South Central
Alabama
Kentucky 280 258 ∼ 202 188 ∼Mississippi
Tennessee
continued
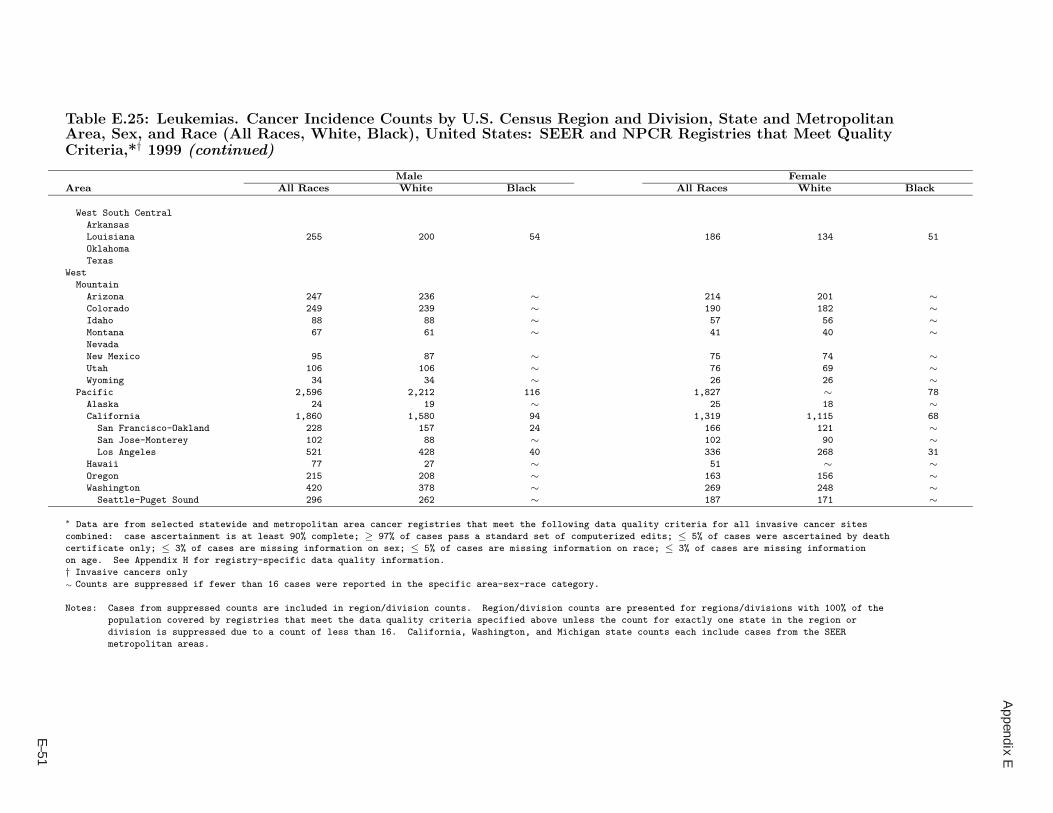
Appendix E
E–51
Table E.25: Leukemias. Cancer Incidence Counts by U.S. Census Region and Division, State and MetropolitanArea, Sex, and Race (All Races, White, Black), United States: SEER and NPCR Registries that Meet QualityCriteria,*† 1999 (continued)
Male FemaleArea All Races White Black All Races White Black
West South Central
Arkansas
Louisiana 255 200 54 186 134 51
Oklahoma
Texas
West
Mountain
Arizona 247 236 ∼ 214 201 ∼Colorado 249 239 ∼ 190 182 ∼Idaho 88 88 ∼ 57 56 ∼Montana 67 61 ∼ 41 40 ∼Nevada
New Mexico 95 87 ∼ 75 74 ∼Utah 106 106 ∼ 76 69 ∼Wyoming 34 34 ∼ 26 26 ∼
Pacific 2,596 2,212 116 1,827 ∼ 78
Alaska 24 19 ∼ 25 18 ∼California 1,860 1,580 94 1,319 1,115 68
San Francisco-Oakland 228 157 24 166 121 ∼San Jose-Monterey 102 88 ∼ 102 90 ∼Los Angeles 521 428 40 336 268 31
Hawaii 77 27 ∼ 51 ∼ ∼Oregon 215 208 ∼ 163 156 ∼Washington 420 378 ∼ 269 248 ∼
Seattle-Puget Sound 296 262 ∼ 187 171 ∼∗ Data are from selected statewide and metropolitan area cancer registries that meet the following data quality criteria for all invasive cancer sites
combined: case ascertainment is at least 90% complete; ≥ 97% of cases pass a standard set of computerized edits; ≤ 5% of cases were ascertained by death
certificate only; ≤ 3% of cases are missing information on sex; ≤ 5% of cases are missing information on race; ≤ 3% of cases are missing information
on age. See Appendix H for registry-specific data quality information.
† Invasive cancers only
∼ Counts are suppressed if fewer than 16 cases were reported in the specific area-sex-race category.
Notes: Cases from suppressed counts are included in region/division counts. Region/division counts are presented for regions/divisions with 100% of the
population covered by registries that meet the data quality criteria specified above unless the count for exactly one state in the region or
division is suppressed due to a count of less than 16. California, Washington, and Michigan state counts each include cases from the SEER
metropolitan areas.


Appendix F

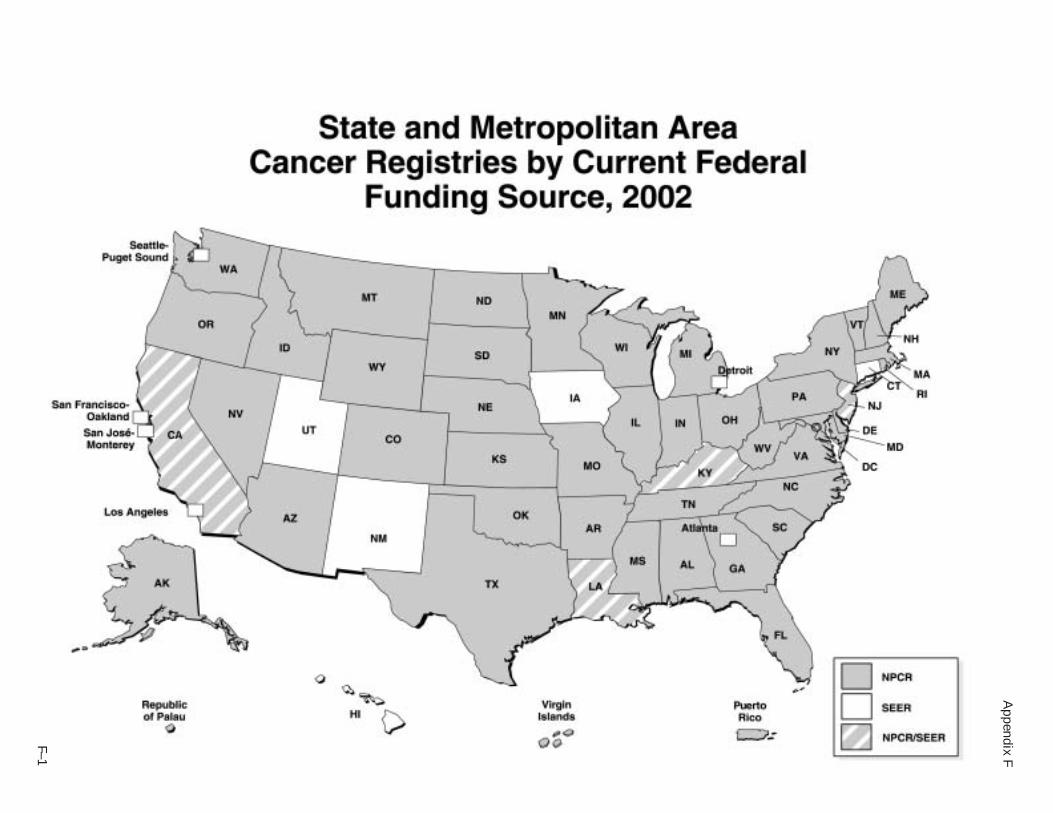
Appendix F
F–1


Appendix G


Appendix G
G–1
Table G.1: State and Metropolitan Area Cancer Registries by Federal FundingSource and First Diagnosis Year* for Which Cancer Cases Were Reportable toCDC’s NPCR or NCI’s SEER Program
Alabama 1996 NPCR NPCR
Alaska 1996 NPCR NPCR
Arizona 1995 NPCR NPCR
Arkansas 1996 NPCR NPCR
California 1995/2000 NPCR NPCR/SEERLos Angeles 1992 SEER SEERSan Francisco-Oakland 1973 SEER SEERSan Jose-Monterey 1992 SEER SEER
Colorado 1995 NPCR NPCR
Connecticut 1973 SEER SEER
Delaware 1997 NPCR NPCR
District of Columbia 1996 NPCR NPCR
Florida 1995 NPCR NPCR
Georgia 1995 NPCR NPCRAtlanta 1975 SEER SEER
Hawaii 1973 SEER SEER
Idaho 1995 NPCR NPCR
Illinois 1995 NPCR NPCR
Indiana 1995 NPCR NPCR
Iowa 1973 SEER SEER
Kansas 1995 NPCR NPCR
Kentucky 1995/2000 NPCR NPCR/SEER
Louisiana 1995/2000 NPCR NPCR/SEER
Maine 1995 NPCR NPCR
Maryland 1996 NPCR NPCR
Massachusetts 1995 NPCR NPCR
Michigan 1995 NPCR NPCRDetroit 1973 SEER SEER
Minnesota 1995 NPCR NPCR
Mississippi 1996 NPCR NPCR
Missouri 1996 NPCR NPCR
Montana 1995 NPCR NPCR
Nebraska 1995 NPCR NPCR
Nevada 1995 NPCR NPCR
First Diagnosis Year forWhich Cases Were
Reportable to Federal Funding SourceState or Territory NPCR or SEER* 1999 2002
continued
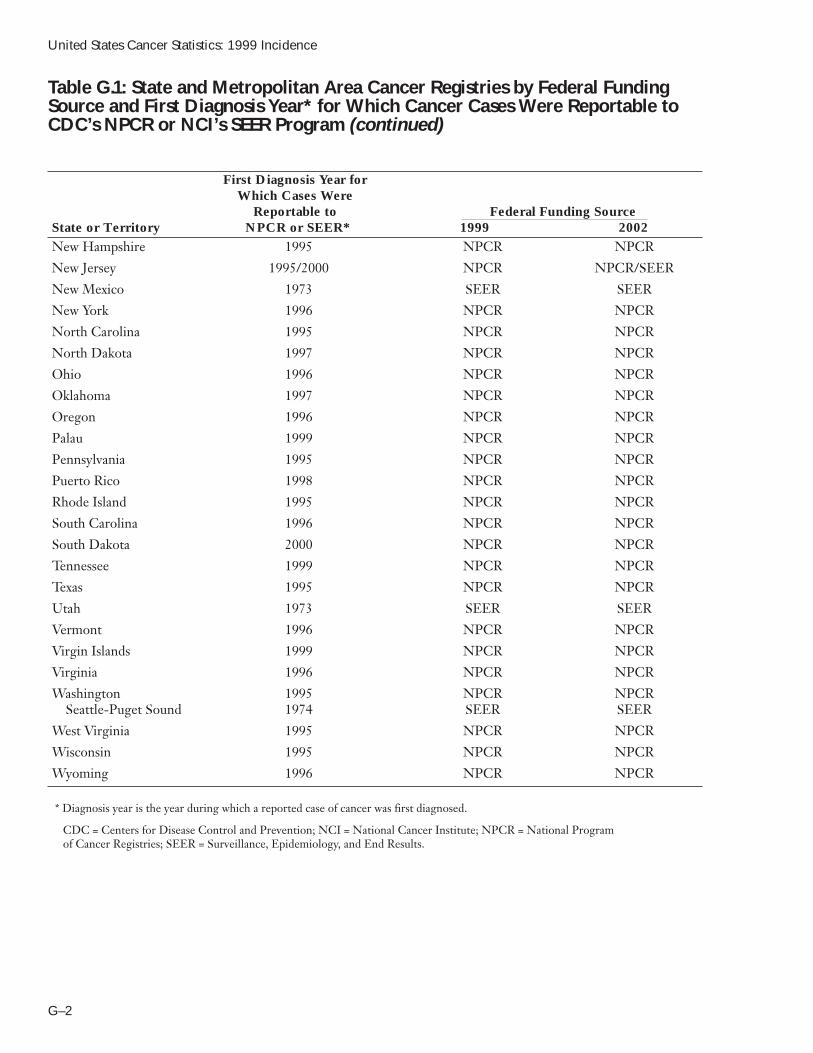
United States Cancer Statistics: 1999 Incidence
G–2
New Hampshire 1995 NPCR NPCR
New Jersey 1995/2000 NPCR NPCR/SEER
New Mexico 1973 SEER SEER
New York 1996 NPCR NPCR
North Carolina 1995 NPCR NPCR
North Dakota 1997 NPCR NPCR
Ohio 1996 NPCR NPCR
Oklahoma 1997 NPCR NPCR
Oregon 1996 NPCR NPCR
Palau 1999 NPCR NPCR
Pennsylvania 1995 NPCR NPCR
Puerto Rico 1998 NPCR NPCR
Rhode Island 1995 NPCR NPCR
South Carolina 1996 NPCR NPCR
South Dakota 2000 NPCR NPCR
Tennessee 1999 NPCR NPCR
Texas 1995 NPCR NPCR
Utah 1973 SEER SEER
Vermont 1996 NPCR NPCR
Virgin Islands 1999 NPCR NPCR
Virginia 1996 NPCR NPCR
Washington 1995 NPCR NPCRSeattle-Puget Sound 1974 SEER SEER
West Virginia 1995 NPCR NPCR
Wisconsin 1995 NPCR NPCR
Wyoming 1996 NPCR NPCR
Table G.1: State and Metropolitan Area Cancer Registries by Federal FundingSource and First Diagnosis Year* for Which Cancer Cases Were Reportable toCDC’s NPCR or NCI’s SEER Program (continued)
First Diagnosis Year forWhich Cases Were
Reportable to Federal Funding SourceState or Territory NPCR or SEER* 1999 2002
* Diagnosis year is the year during which a reported case of cancer was first diagnosed.
CDC = Centers for Disease Control and Prevention; NCI = National Cancer Institute; NPCR = National Programof Cancer Registries; SEER = Surveillance, Epidemiology, and End Results.

Appendix H


Alabama <90 100.0 3.4 0.04 4.55 0.06Alaska >95 100.0 0.3 0.00 0.95 0.05Arizona >95 100.0 2.1 0.00 0.98 0.01Arkansas <90 100.0 0.0 0.00 0.43 0.00California >95 100.0 1.0 0.00 2.61 0.00
Greater Bay¶ 90-94 100.0 2.0 0.00 3.96 0.00Los Angeles >95 100.0 0.8 0.00 1.43 0.00
Colorado >95 100.0 1.0 0.01 1.13 0.11Connecticut >95 100.0 1.0 0.00 1.06 0.00Delaware >95 100.0 1.4 0.05 0.58 0.00District of Columbia >95 100.0 2.9 0.00 2.83 0.07Florida >95 100.0 3.8 0.02 0.91 0.01Georgia <90 100.0 0.8 0.00 1.11 0.01
Atlanta >95 100.0 1.7 0.00 0.72 0.00Hawaii 90-94 100.0 0.5 0.00 3.90 0.00Idaho >95 100.0 2.8 0.00 0.02 0.00Illinois >95 100.0 2.0 0.00 2.10 0.00Indiana 90-94 100.0 NA 0.00 0.54 0.00Iowa >95 100.0 1.6 0.00 1.07 0.00Kansas >95 100.0 3.7 0.00 2.39 0.00Kentucky >95 100.0 1.8 0.01 2.61 0.00Louisiana >95 100.0 0.8 0.00 0.05 0.00MaineMaryland >95 100.0 3.1 0.00 2.39 0.06Massachusetts >95 100.0 2.5 0.00 2.04 0.00Michigan >95 100.0 1.0 0.01 1.24 0.02
Detroit >95 100.0 1.0 0.00 0.84 0.00Minnesota >95 99.9 2.2 0.00 1.97 0.01MississippiMissouri >95 100.0 3.3 0.00 0.62 0.00Montana 90-94 100.0 5.0 0.00 2.73 0.05Nebraska >95 100.0 1.5 0.00 3.31 0.00Nevada <90 99.9 9.5 0.03 0.40 0.00New Hampshire 90-94 100.0 2.6 0.00 1.03 0.02New Jersey >95 100.0 1.1 0.00 0.23 0.01New Mexico 90-94 100.0 4.1 0.00 0.00 0.00New York >95 100.0 2.5 0.00 2.10 0.00North Carolina 90-94 100.0 2.0 0.00 0.36 0.01North Dakota >95 100.0 0.0 0.00 0.10 0.00Ohio >95 100.0 3.3 0.00 2.54 0.00Oklahoma <90 100.0 NA 0.00 3.53 0.01Oregon >95 100.0 4.1 0.00 1.58 0.00Pennsylvania >95 100.0 0.4 0.00 1.70 0.00Rhode Island >95 100.0 2.6 0.00 0.02 0.00South Carolina >95 100.0 2.2 0.00 0.70 0.00
Appendix H
H–1
Table H.1: Achievement of Selected Data Quality Criteria by State and SEERMetropolitan Area Cancer Registries, 1999
Only data from the shaded states and metropolitan areas are included in United StatesCancer Statistics: 1999 Incidence.*
% Case % Passing % % Missing % Missing % MissingCancer Registry Ascertainment† Edits‡ DCOs§ Sex Race Age
continued

United States Cancer Statistics: 1999 Incidence
H–2
Table H.1: Achievement of Selected Data Quality Criteria by State and SEERMetropolitan Area Cancer Registries, 1999 (continued)
Only data from the shaded states and metropolitan areas are included in United StatesCancer Statistics: 1999 Incidence.*
% Case % Passing % % Missing % Missing % MissingCancer Registry Ascertainment† Edits‡ DCOs§ Sex Race AgeSouth Dakota||TennesseeTexasUtah >95 100.0 0.3 0.00 0.00 0.00Vermont <90 100.0 NA 0.04 2.05 0.15Virginia 90-94 100.0 NA 0.00 0.93 0.02Washington >95 100.0 0.6 0.00 2.69 0.00
Seattle-Puget Sound >95 100.0 0.8 0.00 0.73 0.00West Virginia >95 100.0 1.7 0.01 1.32 0.00Wisconsin >95 100.0 2.7 0.00 0.73 0.00Wyoming >95 100.0 1.2 0.00 0.00 0.00
* Registry members of the National Program of Cancer Registries whose data are not included in this report chose whether to have theirdata quality information listed.
† Completeness of case ascertainment was estimated by methods developed by the North American Association of Central CancerRegistries (Howe 2001; Tucker 1999; Wu 2002).
‡ Computerized edits test the validity and logic of data components reported for selected items.
§ DCOs, or death-certificate only cases, are cancer cases ascertained solely on the basis of a death certificate after the registry hascompleted a routine procedure known as death clearance and followback. 24–26
¶ Greater Bay includes San Francisco-Oakland and San Jose-Monterey Registries.
||Registry reference year is after 1999.
NA = Registry did not conduct death clearance and followback for 1999 cases; SEER = Surveillance, Epidemiology, and End Results.

Appendix I


Appendix I
I–1
Table I.1: SEER Site Groups for Primary Cancer Sites Based on ICD–O–2
Buccal cavity and pharynxLip C000:C009 M-9590:9989Tongue C019:C029 M-9590:9989Salivary gland C079:C089 M-9590:9989Floor of mouth C040:C049 M-9590:9989Gum & other mouth C030:C039,C050:C059,C060:C069 M-9590:9989Nasopharynx C110:C119 M-9590:9989Tonsil C090:C099 M-9590:9989Oropharynx C100:C109 M-9590:9989Hypopharynx C129,C130:C139 M-9590:9989Other buccal cavity C140,C142:C148 M-9590:9989and pharynx
Digestive systemEsophagus C150:C159 M-9590:9989Stomach C160:C169 M-9590:9989Small intestine C170:C179 M-9590:9989Colon excluding rectum
Cecum C180 M-9590:9989Appendix C181 M-9590:9989Ascending colon C182 M-9590:9989Hepatic flexure C183 M-9590:9989Transverse colon C184 M-9590:9989Splenic flexure C185 M-9590:9989Descending colon C186 M-9590:9989Sigmoid colon C187 M-9590:9989Large intestine, NOS C188:C189,C260 M-9590:9989
Rectum & rectosigmoidRectosigmoid junction C199 M-9590:9989Rectum C209 M-9590:9989
Anus, anal canal & anorectum C210:C212,C218 M-9590:9989Liver & intrahepatic bile duct
Liver C220 M-9590:9989Intrahepatic bile duct C221 M-9590:9989
Gallbladder C239 M-9590:9989Other biliary C240:C249 M-9590:9989Pancreas C250:C259 M-9590:9989Retroperitoneum C480 M-9590:9989Peritoneum, omentum & C481:C482 M-9590:9989mesentery
Other digestive organs C268:C269,C488 M-9590:9989
Respiratory system Nasal cavity, middle ear & C300:C301,C310:C319 M-9590:9989accessory sinuses
Larynx C320:C329 M-9590:9989Lung and bronchus C340:C349 M-9590:9989Pleura C384 M-9590:9989Trachea, mediastinum & other C339,C381:C383,C388,C390 M-9590:9989respiratory organs C398,C399
Primary Site/ ExcludingPrimary Site Group Histologic Type Histologic Type
continued

United States Cancer Statistics: 1999 Incidence
I–2
Bones and joints C400:C419 M-9590:9989Soft tissue (including heart) C380,C470:C479,C490:C499 M-9590:9989
Skin (excluding basal and squamous)Melanomas—skin C440:C449 (types 8720:8790)Other non-epithelial skin C440:C449 M-8000:8004,
8010:8045,8050:8082,8090:8110,8720:8790,9590:9989
Breast C500:C509 M-9590:9989
Female genital systemCervix C530:C539 M-9590:9989Corpus C540:C549 M-9590:9989Uterus, NOS C559 M-9590:9989Ovary C569 M-9590:9989Vagina C529 M-9590:9989Vulva C510:C519 M-9590:9989Other female genital organs C570:C589 M-9590:9989
Male genital systemProstate C619 M-9590:9989Testis C620:C629 M-9590:9989Penis C600:C609 M-9590:9989Other male genital organs C630:C639 M-9590:9989
Urinary systemBladder C670:C679 M-9590:9989Kidney and renal pelvis C649,C659 M-9590:9989Ureter C669 M-9590:9989Other urinary organs C680:C689 M-9590:9989
Eye & orbit C690:C699 M-9590:9989
Brain and other nervous system Brain C710:C719 M-9530:9539,
9590:9989Other nervous system C710:C719 (type 9530:9539)
C700:C709,C720:C729 M-9590:9989
Endocrine systemThyroid C739 M-9590:9989Other endocrine C379,C740:C749,C750:C759 M-9590:9989(including thymus)
Table I.1: SEER Site Groups for Primary Cancer Sites Based on ICD–O–2(continued)
continued
Primary Site/ ExcludingPrimary Site Group Histologic Type Histologic Type
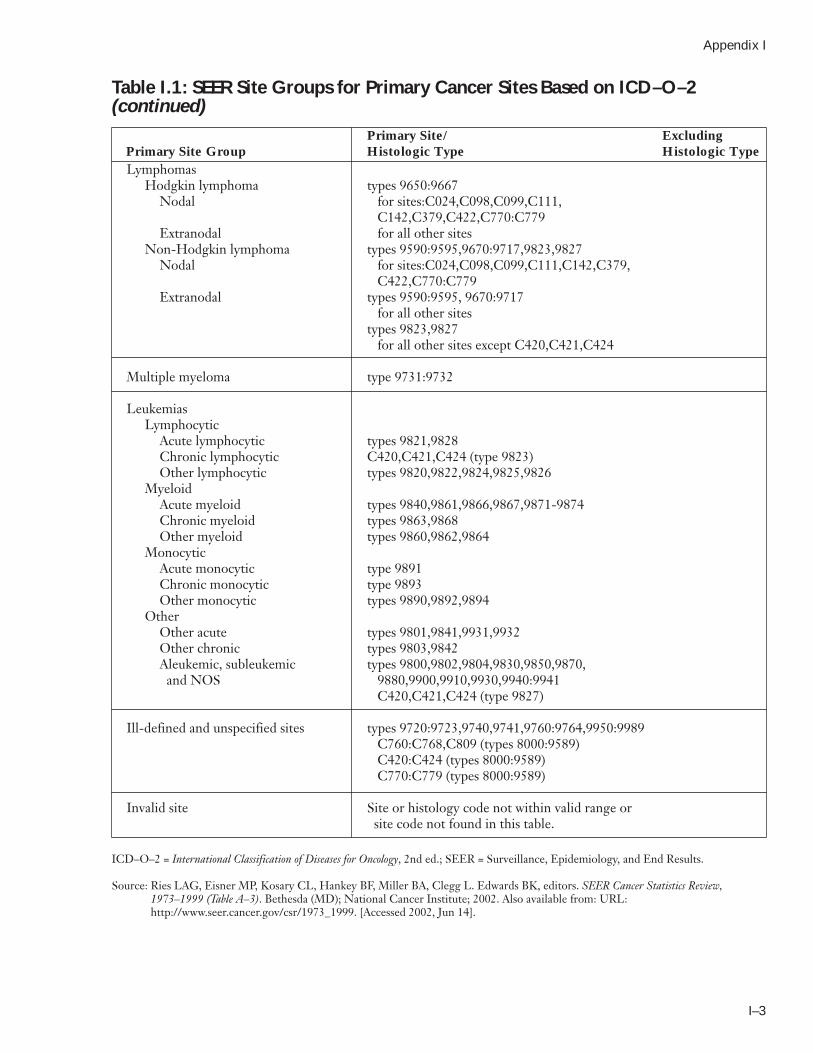
LymphomasHodgkin lymphoma types 9650:9667
Nodal for sites:C024,C098,C099,C111,C142,C379,C422,C770:C779
Extranodal for all other sitesNon-Hodgkin lymphoma types 9590:9595,9670:9717,9823,9827
Nodal for sites:C024,C098,C099,C111,C142,C379,C422,C770:C779
Extranodal types 9590:9595, 9670:9717 for all other sites
types 9823,9827for all other sites except C420,C421,C424
Multiple myeloma type 9731:9732
LeukemiasLymphocytic
Acute lymphocytic types 9821,9828Chronic lymphocytic C420,C421,C424 (type 9823)Other lymphocytic types 9820,9822,9824,9825,9826
MyeloidAcute myeloid types 9840,9861,9866,9867,9871-9874Chronic myeloid types 9863,9868Other myeloid types 9860,9862,9864
MonocyticAcute monocytic type 9891Chronic monocytic type 9893Other monocytic types 9890,9892,9894
OtherOther acute types 9801,9841,9931,9932Other chronic types 9803,9842Aleukemic, subleukemic types 9800,9802,9804,9830,9850,9870,and NOS 9880,9900,9910,9930,9940:9941
C420,C421,C424 (type 9827)
Ill-defined and unspecified sites types 9720:9723,9740,9741,9760:9764,9950:9989C760:C768,C809 (types 8000:9589)C420:C424 (types 8000:9589)C770:C779 (types 8000:9589)
Invalid site Site or histology code not within valid range or site code not found in this table.
Appendix I
I–3
Table I.1: SEER Site Groups for Primary Cancer Sites Based on ICD–O–2(continued)
Primary Site/ ExcludingPrimary Site Group Histologic Type Histologic Type
ICD–O–2 = International Classification of Diseases for Oncology, 2nd ed.; SEER = Surveillance, Epidemiology, and End Results.
Source: Ries LAG, Eisner MP, Kosary CL, Hankey BF, Miller BA, Clegg L. Edwards BK, editors. SEER Cancer Statistics Review,1973–1999 (Table A–3). Bethesda (MD); National Cancer Institute; 2002. Also available from: URL:http://www.seer.cancer.gov/csr/1973_1999. [Accessed 2002, Jun 14].


Appendix J


Appendix J
J–1
Table J.1: Projected Population Counts by U.S. Census Region and Division, Stateand SEER Metropolitan Area, Sex, and Race (All Races, White, Black), 1999*
United States 133,349,782 110,321,683 16,555,757 139,437,703 114,250,059 18,301,941
Northeast Census Region 25,035,338 20,943,696 2,998,634 26,826,675 22,300,890 3,372,345
New England Division 6,544,836 5,963,667 378,342 6,948,797 6,333,408 403,385Connecticut 1,594,082 1,402,101 146,123 1,688,963 1,479,609 161,621Maine 610,143 599,396 3,541 639,568 628,771 2,784Massachusetts 2,980,618 2,660,527 196,783 3,195,630 2,859,461 207,630New Hampshire 591,015 577,105 4,983 609,027 595,817 4,104Rhode Island 476,746 437,037 25,181 514,297 473,324 25,769Vermont 292,232 287,501 1,731 301,312 296,426 1,477
Middle Atlantic Division 18,490,502 14,980,029 2,620,292 19,877,878 15,967,482 2,968,960New Jersey 3,952,320 3,140,307 568,465 4,201,145 3,317,317 628,607New York 8,770,904 6,727,305 1,503,596 9,455,387 7,165,718 1,720,784Pennsylvania 5,767,278 5,112,417 548,231 6,221,346 5,484,447 619,569
Midwest Census Region 30,840,459 27,033,602 3,039,023 32,402,640 28,213,808 3,382,736
East North Central Division 21,638,223 18,601,007 2,527,657 22,802,600 19,432,832 2,836,020Illinois 5,916,262 4,824,734 874,010 6,212,197 5,001,499 980,787Indiana 2,892,566 2,619,519 236,287 3,047,309 2,747,647 261,430Michigan 4,803,696 4,027,357 661,446 5,062,808 4,194,065 752,675
Detroit† 1,957,737 1,446,258 458,143 2,123,229 1,523,270 546,664Ohio 5,442,355 4,752,381 613,184 5,811,240 5,041,360 688,298Wisconsin 2,583,344 2,377,016 142,730 2,669,046 2,448,261 152,830
West North Central Division 9,202,236 8,432,595 511,366 9,600,040 8,780,976 546,716Iowa 1,399,035 1,346,463 29,753 1,471,690 1,420,081 28,150Kansas 1,306,160 1,193,279 78,189 1,348,474 1,232,470 78,721Minnesota 2,355,710 2,186,797 76,451 2,421,214 2,251,774 72,103Missouri 2,650,374 2,321,542 288,459 2,817,380 2,445,815 328,816Nebraska 815,142 763,344 33,183 850,699 796,291 34,997North Dakota 314,940 294,944 2,319 318,184 298,039 1,840South Dakota 360,875 326,226 3,012 372,399 336,506 2,089
South Census Region 46,959,277 36,882,052 8,818,684 49,554,322 38,344,020 9,860,562
South Atlantic Division 24,072,748 18,352,260 5,080,545 25,495,852 19,114,881 5,686,314Delaware 366,530 286,792 70,805 386,862 298,836 78,261District of Columbia 244,005 89,325 146,282 277,059 93,110 174,187Florida 7,333,414 6,053,646 1,116,074 7,779,773 6,386,787 1,212,852Georgia 3,791,682 2,660,087 1,043,508 3,994,493 2,714,653 1,187,978
Atlanta† 1,307,258 854,668 397,282 1,380,609 875,331 451,796Maryland 2,515,847 1,720,562 684,647 2,657,985 1,771,058 769,302
continued
Males Females
All Races White Black All Races White Black

United States Cancer Statistics: 1999 Incidence
J–2
North Carolina 3,713,183 2,822,968 789,314 3,936,974 2,935,607 895,093South Carolina 1,874,780 1,314,354 538,921 2,009,987 1,368,307 617,229Virginia 3,361,948 2,565,538 663,972 3,516,603 2,646,613 721,415West Virginia 871,359 838,988 27,022 936,116 899,910 29,997
East South Central Division 7,998,890 6,354,102 1,560,526 8,586,683 6,705,611 1,790,770Alabama 2,098,014 1,551,736 526,174 2,273,152 1,637,849 612,716Kentucky 1,923,406 1,768,730 137,339 2,036,644 1,868,539 150,976Mississippi 1,328,964 842,050 472,020 1,442,275 887,033 539,741Tennessee 2,648,506 2,191,586 424,993 2,834,612 2,312,190 487,337
West South Central Division 14,887,639 12,175,690 2,177,613 15,471,787 12,523,528 2,383,478Arkansas 1,236,966 1,029,547 191,724 1,321,616 1,084,472 220,070Louisiana 2,103,538 1,406,913 659,208 2,269,021 1,477,392 754,112Oklahoma 1,646,239 1,366,806 129,815 1,722,683 1,428,407 135,175Texas 9,900,896 8,372,424 1,196,866 10,158,467 8,533,257 1,274,121
West Census Region 30,514,708 25,462,333 1,699,416 30,654,066 25,391,341 1,686,298
Mountain Division 8,520,945 7,741,954 293,680 8,612,615 7,807,439 280,644Arizona 2,362,679 2,097,320 89,238 2,411,702 2,138,420 86,006Colorado 2,012,093 1,856,301 89,868 2,045,614 1,886,188 86,817Idaho 625,182 606,066 3,959 626,646 606,958 3,588Montana 439,393 407,282 1,793 443,762 410,303 1,431Nevada 924,000 794,334 72,141 890,035 756,182 69,684New Mexico 855,563 739,568 23,607 883,706 761,484 22,353Utah 1,060,918 1,009,293 10,871 1,072,684 1,019,382 8,777Wyoming 241,117 231,790 2,203 238,466 228,522 1,988
Pacific Division 21,993,763 17,720,379 1,405,736 22,041,451 17,583,902 1,405,654Alaska 325,227 248,093 12,647 294,385 218,474 11,372California 16,579,347 13,228,889 1,235,844 16,589,374 13,089,930 1,252,823
San Francisco-Oakland† 1,989,602 1,339,764 235,788 2,049,064 1,345,945 250,283San Jose-Monterey† 1,174,520 907,604 48,789 1,149,775 888,746 40,853Los Angeles† 4,620,176 3,492,101 493,637 4,714,892 3,486,712 550,524
Hawaii 590,114 169,355 19,035 590,366 151,881 14,840Oregon 1,637,560 1,530,542 32,200 1,676,382 1,565,372 29,816Washington 2,861,515 2,543,500 106,010 2,890,944 2,558,245 96,803
Seattle-Puget Sound† 1,961,054 1,696,116 92,924 1,985,892 1,706,701 86,208
Males Females
All Races White Black All Races White Black
Table J.1: Projected Population Counts by U.S. Census Region and Division, Stateand SEER Metropolitan Area, Sex, and Race (All Races, White, Black), 1999*(continued)
* The 1999 race- and sex-specific population estimates from the U.S. Bureau of the Census, as available from SEER*Stat (www.SEER.cancer.gov/population), are projected from estimates and do not take into consideration results from the enumerated 2000 census.
† The populations of the metropolitan areas of Detroit, Atlanta, San Francisco-Oakland, San Jose-Monterey, Los Angeles, and Seattle-Puget Sound are shown separately because these populations have separate metropolitan area Surveillance, Epidemiology, and EndResults (SEER) cancer registries. State population totals include the populations of the SEER metropolitan areas.
Source: Census Bureau population figures, as modified by the SEER Program. Available from: http://www.seer.cancer.gov/popdata[accessed August 8, 2002].

Appendix K


Appendix K
K–1
Table K.1: 1970 and 2000 U.S. Standard Population Weights
All ages 1.000000 1.0000000-4 0.084416 NA<1 NA 0.0138181-4 NA 0.0553175-9 0.098204 0.07253310-14 0.102304 0.07303215-19 0.093845 0.07216920-24 0.080561 0.06647825-29 0.066320 0.06452930-34 0.056249 0.07104435-39 0.054656 0.08076240-44 0.058958 0.08185145-49 0.059622 0.07211850-54 0.054643 0.06271655-59 0.049077 0.04845460-64 0.042403 0.03879365-69 0.034406 0.03426470-74 0.026789 0.03177375-79 0.018871 0.02699980-84 0.011241 0.01784285+ 0.007435 0.015508
* Department of Health and Human Services policy mandates that, beginning with the 1999 data year, the 2000 U.S. standardpopulation will be used for reporting age-adjusted disease rates.
Sources: Klein, RJ, and Schoenborn, CA. Age adjustment using the 2000 projected U.S. population. Healthy People Statistical Notes, No. 20. Hyattsville, MD: National Center for Health Statistics, 2001.Surveillance, Epidemiology, and End Results (SEER) Program public-use data (1973-1999). Available from:http://www.SEER.cancer.gov.publicdata/ [accessed Aug 8, 2002].
Year 1970 Year 2000 Age Category ( j ) Standard Weight (wj) Standard Weight (wj)*


Appendix L


Appendix L
L–1
The bias-corrected incidence rate for a cancer site wascomputed on the basis of the relationship betweenmortality from that cancer site in an entire U.S. censusregion or division and mortality from that cancer site inthe states in the region or division for which incidencedata were eligible for inclusion in United States CancerStatistics: 1999 Incidence.
To estimate the bias-corrected incidence rate for a cancersite for a U.S. census region or division, we firstcalculated the observed age-adjusted incidence rate usingdata from cancer registries in the region or divisionwhose data are included in this report. In addition, theage-adjusted mortality rate for the same included portionof the region or division was calculated, as well as theage-adjusted mortality rate for the areas in the region ordivision whose incidence data are not included in theobserved incidence rate. The true mortality rate for theregion or division was then calculated as the weightedsum of the two age-adjusted mortality rates, where theweights are based on the population in the two areas (i.e.,included and excluded) of the region or division. Anestimate of the bias in the observed mortality rate wastherefore the difference between the true and observedmortality rates expressed as a proportion of the observedmortality rate. This estimate of bias was then used tocalculate a bias-corrected estimate of the incidence ratefor the region or division.
As an example, consider female invasive breast cancer inthe New England census region. Incidence data forConnecticut, Massachusetts, New Hampshire, andRhode Island (states that have 86.3% of the region’s totalpopulation) were eligible for inclusion in the calculationof the regional incidence rate; data for Maine and
Vermont were not eligible. The invasive female breastcancer mortality rate for the eligible areas is 27.3 per100,000, and the rate for Maine and Vermont combinedis 27.7. The true mortality rate is the weighted sum ofthe two rates and is computed as follows:
27.4 = [0.863 * 27.3 + (1- 0.863) * 27.7].
The observed incidence rate for the region therefore hasan estimated bias (expressed as a proportion of theobserved rate) of
-0.0037 = (27.3–27.4)/27.3.
The observed age-adjusted incidence rate for NewEngland is 145.1 per 100,000. Because the sign for theestimated bias is negative, this proportion of the ratemust be added to the observed rate to compensate forbias. The bias-corrected rate, then, is
145.64 = 145.1 + (0.0037 * 145.1).
In this example, the confidence interval for the observedincidence rate (142.2–148.1) includes the bias-correctedrate.
For this report, the bias-corrected, age-adjustedincidence rate was calculated for four major cancer sites(female breast, male prostate, male and femalecolorectal, male and female lung and bronchus) for eachU.S. census region or division. Then, if the bias-corrected, age-adjusted incidence rates for all four sitesfell within the confidence interval of the observed age-adjusted incidence rates for all four sites, the rates for allcancer sites in the region or division were published.
Estimating Bias-Corrected Incidence Rates for U.S. Census Regions and Divisions


Appendix M


Appendix M
M–1
Table M.1: U.S. Population Median Age in Years by State, Sex, and Race (All Races, White, Black), 2000
United States 34.0 36.5 28.5 36.5 38.9 31.7Alabama 34.4 36.8 27.8 37.2 39.5 31.8Alaska 32.4 35.4 27.8 32.5 35.2 26.7Arizona 32.9 36.6 29.0 35.5 39.2 29.0Arkansas 34.6 36.7 25.9 37.4 39.5 29.7California 32.2 36.2 30.5 34.4 38.5 32.6Colorado 33.2 35.2 30.3 35.4 37.3 30.3Connecticut 36.1 38.4 27.9 38.6 40.7 31.5Delaware 34.9 37.3 28.8 37.1 39.5 31.9District of Columbia 33.7 34.8 34.3 35.6 34.2 37.6Florida 37.3 40.1 27.3 40.1 43.1 30.0Georgia 32.1 35.0 27.7 34.6 37.4 30.7Hawaii 35.1 38.8 28.2 37.4 41.0 25.6Idaho 32.2 33.5 25.7 34.2 35.5 21.6Illinois 33.3 35.9 27.7 36.0 38.5 31.6Indiana 33.9 35.1 27.8 36.5 37.6 30.7Iowa 35.2 36.2 25.1 38.0 38.9 25.5Kansas 33.7 35.5 27.5 36.5 38.2 29.8Kentucky 34.6 35.4 28.5 37.1 37.9 31.8Louisiana 32.6 35.9 26.1 35.3 38.2 30.1Maine 37.6 38.0 24.7 39.6 40.0 20.7Maryland 34.9 37.5 30.5 37.0 39.5 33.7Massachusetts 35.4 37.0 28.4 37.7 39.6 30.8Michigan 34.3 36.2 28.3 36.6 38.4 31.3Minnesota 34.4 36.0 25.5 36.3 37.9 24.8Mississippi 32.2 36.2 25.3 35.3 39.1 29.3Missouri 34.8 36.2 27.7 37.4 38.6 31.2Montana 36.6 37.9 24.8 38.5 39.6 21.0Nebraska 34.0 35.6 25.9 36.6 38.1 28.0Nevada 34.5 37.1 30.4 35.6 38.1 30.9New Hampshire 36.4 36.8 29.7 37.8 38.2 26.5New Jersey 35.5 37.9 29.8 38.0 40.6 33.2New Mexico 33.4 37.6 30.0 35.6 39.8 29.6New York 34.5 37.2 29.3 37.2 40.0 33.6North Carolina 33.8 36.2 29.3 36.7 39.0 32.7North Dakota 34.8 36.1 23.6 37.5 38.7 20.5Ohio 34.9 36.1 28.7 37.5 38.7 32.1Oklahoma 33.9 36.9 26.9 36.9 39.6 29.4Oregon 35.1 37.2 30.0 37.5 39.4 28.8
Males FemalesState All Races White Black All Races White Black
continued

Pennsylvania 36.5 38.1 29.1 39.4 40.8 33.2Rhode Island 35.4 37.4 26.0 38.0 40.1 27.6South Carolina 34.0 36.7 28.4 36.7 39.2 32.3South Dakota 34.4 36.3 26.9 36.7 38.5 20.4Tennessee 34.5 36.3 27.6 37.2 38.9 31.1Texas 31.3 33.9 28.5 33.4 36.2 31.0Utah 26.7 27.3 26.8 27.7 28.4 21.8Vermont 36.6 37.0 24.4 38.7 39.0 21.7Virginia 34.5 36.6 30.4 36.8 38.7 33.4Washington 34.4 36.4 30.0 36.3 38.3 29.3West Virginia 37.5 37.9 30.7 40.2 40.5 36.5Wisconsin 35.0 36.6 23.8 37.1 38.6 26.9Wyoming 35.3 36.3 26.6 37.1 38.0 26.3
Source: United States Census 2000 (http://www.census.gov).
U.S. Cancer Statistics: 1999 Incidence
M–2
Table M.1: U.S. Population Median Age in Years by State, Sex, and Race (All Races, White, Black), 2000 (continued)
Males FemalesState All Races White Black All Races White Black
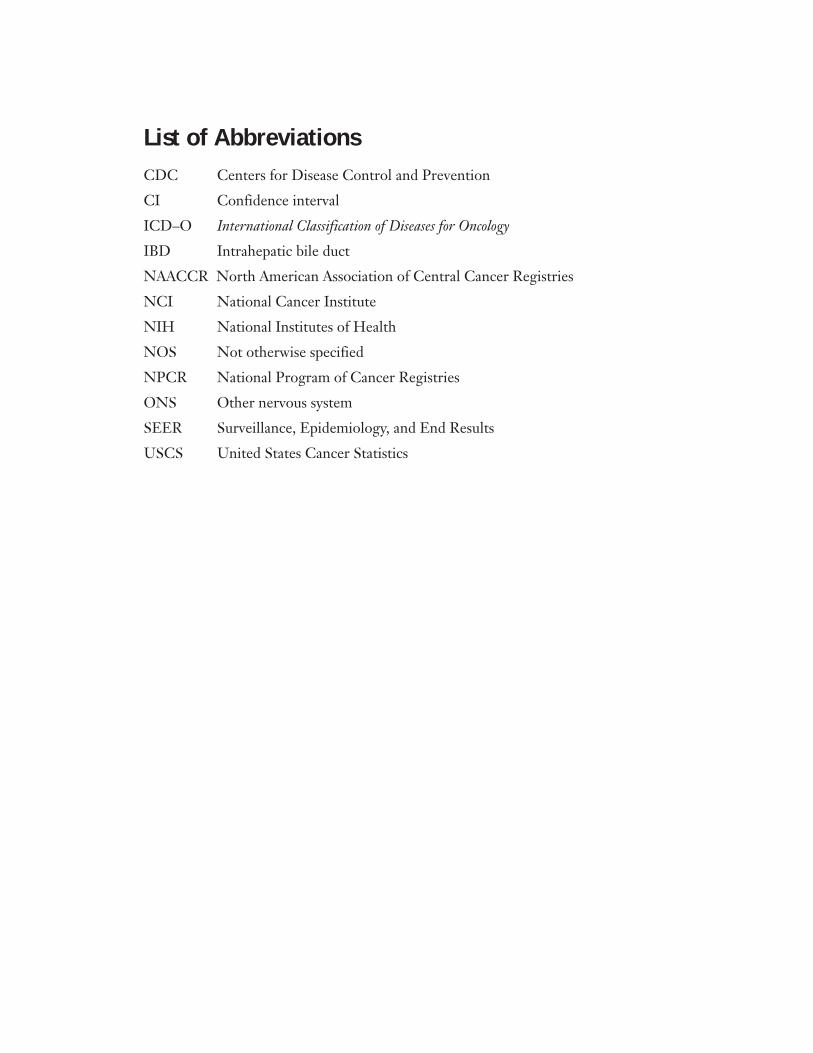
List of AbbreviationsCDC Centers for Disease Control and Prevention
CI Confidence interval
ICD–O International Classification of Diseases for Oncology
IBD Intrahepatic bile duct
NAACCR North American Association of Central Cancer Registries
NCI National Cancer Institute
NIH National Institutes of Health
NOS Not otherwise specified
NPCR National Program of Cancer Registries
ONS Other nervous system
SEER Surveillance, Epidemiology, and End Results
USCS United States Cancer Statistics
