united states department of commerce … states department of commerce national oceanic and...
TRANSCRIPT

UNITED STATES DEPARTMENT OF COMMERCE National Oceanic and Atmospheric Administration NATIONAL MARINE FISHERIES SERVICE Alaska Fisheries Science Center Resource Assessment and Conservation Engineering Division 7 6 0 0 Sand Point \Nay Nor theast BIN C1.5700, Building 4 Seattle, Washington 9 8 1 1 5 - 0 0 7 0
January 8, 2001 F/AKC2:MEW
CRUISE RESULTS
CHARTERED VESSEL R/v MORNING STAR (CRUISE 2000-01)
BOTTOM TRAWL SURVEY OF EASTERN BERING SEA CONTINENTAL SLOPE GROUNDFISH AND SHELLFISH RESOURCES
JUNE 16 - JULY 20, 2000
The Resource and Assessment Conservation Engineering (RACE) Division of the Alaska Fisheries Science Center (AFSC) recently completed a bottom trawl survey of the groundfish and shellfish resources of the eastern Bering Sea continental slope (BSCS). This report summarizes the preliminary results of the survey.
ITINERARY
The survey was conducted aboard the chartered commercial trawler M o r n i n g S t a r from June 1 6 through July 20 (Table 1). A mid-cruise break was taken in Dutch Harbor on July 3 to exchange some scientific personnel and reprovision the vessel. The vessel worked along the continental slope of the eastern Bering Sea from Akutan Island toward the northwest, sampling predetermined stations at depths between 200 and 1,100 meters (Figure 1).
OBJECTIVES
The objectives of the 2000 BSCS investigation were somewhat exploratory in nature, to gain a familiarity with the area, habitats, and biota that we will be sampling in a biennial bottom trawl survey series that is proposed to begin in 2002. In order to help us design the best survey for the habitat and biota, we undertook a study of the fishing performance of two different configurations of the Poly NorfEastern sampling trawl. The objective of this study was to discern which rigging will allow us to sample the widest range of habitats and what possible
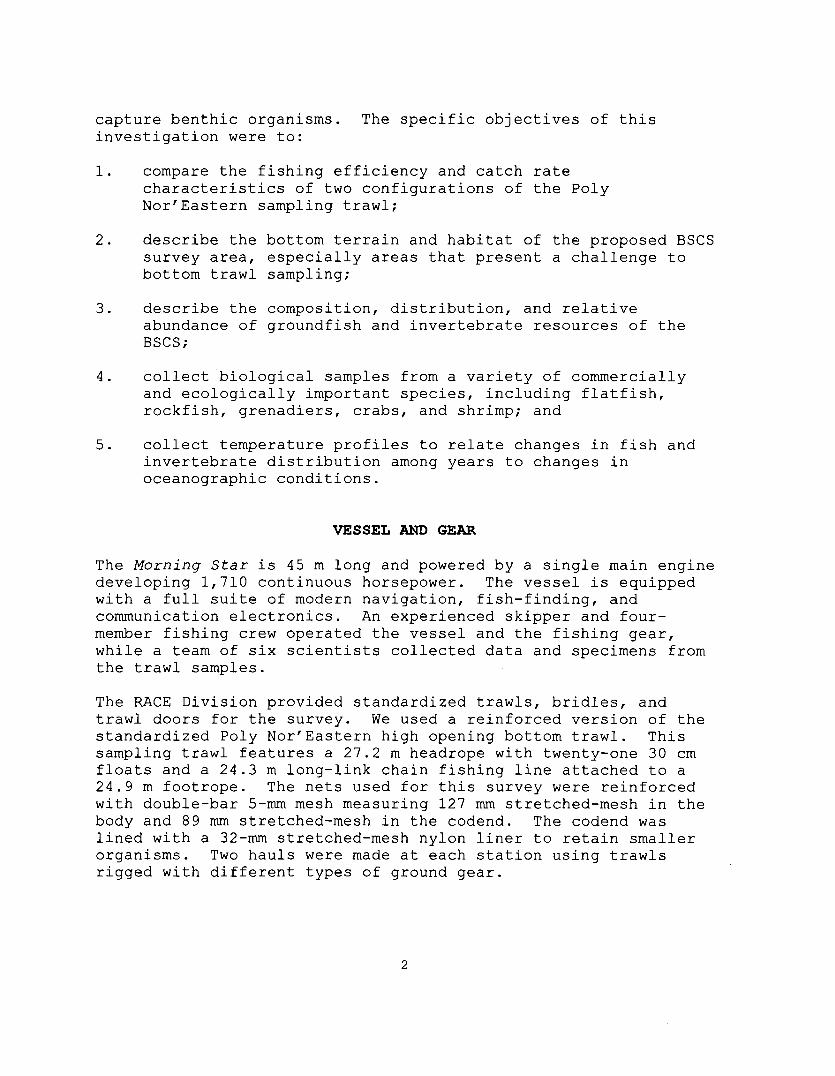
capture benthic organisms. The specific objectives of this investigation were to:
1. compare the fishing efficiency and catch rate characteristics of two configurations of the Poly NorfEastern sampling trawl;
2. describe the bottom terrain and habitat of the proposed BSCS survey area, especially areas that present a challenge to bottom trawl sampling;
3. describe the composition, distribution, and relative abundance of groundfish and invertebrate resources of the BSCS;
4. collect biological samples from a variety of commercially and ecologically important species, including flatfish, rockfish, grenadiers, crabs, and shrimp; and
5. collect temperature profiles to relate changes in fish and invertebrate distribution among years to changes in oceanographic conditions.
VESSEL AND GEAR
The Morning Star is 45 m long and powered by a single main engine developing 1,710 continuous horsepower. The vessel is equipped with a full suite of modern navigation, fish-finding, and communication electronics. An experienced skipper and four- member fishing crew operated the vessel and the fishing gear, while a team of six scientists collected data and specimens from the trawl samples.
The RACE Division provided standardized trawls, bridles, and trawl doors for the survey. We used a reinforced version of the standardized Poly NorfEastern high opening bottom trawl. This sampling trawl features a 27.2 m headrope with twenty-one 30 cm floats and a 24.3 m long-link chain fishing line attached to a 24.9 m footrope. The nets used for this survey were reinforced with double-bar 5-mm mesh measuring 127 mm stretched-mesh in the body and 89 mm stretched-mesh in the codend. The codend was lined with a 32-mrn stretched-mesh nylon liner to retain smaller organisms. Two hauls were made at each station using trawls rigged with different types of ground gear.

• The "mudsweep" ground gear was constructed of 20-cm diameter solid rubber disks strung on 16-mm high tensile chain.
The "rockhopper" ground gear consisted of 46-cm diameter rockhopper disks separated by solid sections (approximately 35 cm long) of 25-cm diameter rubber disks.
Both trawl systems were fished with 1.83~2.75m (6x9 ft) steel V-doors rigged with four-point bridles to enhance their stability at slow towing speeds and 55-m bridles between the doors and wingtips. The fishing dimensions of the trawl were measured using a scanmar' net measurement system.
Data collected with each gear configuration will be compared to ascertain the relative ability of each to sample the rugged habitat of this region. We will also be analyzing catch rates and size compositions of key fish and invertebrate species to detect whether the different ground gears significantly affected our ability to sample the biota representatively.
We collected sea surface temperatures with conventional bucket thermometers and used a net-mounted Brancker Model ~ ~ 2 0 0 ~ microbathythermograph (MBT) to collect surface-to-bottom temperature-depth profiles. A continuous track of the vessel's GPS position during searching and running operations (observations every 30-40 seconds) was captured with our navigation software. More detailed position tracks (observations every 6 seconds) were collected during all fishing operations.
SURVEY DESIGN AND METHODS
The survey employed a stratified sampling design which placed 32 tracklines, drawn approximately perpendicular to the 200 m isobath, about 50 nmi apart between Akutan Island and 1 8 0 " ~ longitude (Fig. 1). Each trackline extended from 183 to 1,100 m and was separated into five 183-m (100-fm) depth strata. Two depth strata on each trackline were selected for sampling stations. Station locations within each depth stratum segment were specified by choosing a target depth. Each station was sampled once with each trawl system, ensuring that adequate distance was left between the tows to prevent any possibility that the trawl tracks would overlap. The 64 trawl stations were
'Reference to trade names or commercial firms does not constitute U.S. government endorsement.

laid out so as to spread the sampling evenly across the depth range of each stratum.
The fishing operations to collect samples during all AFSC bottom trawl surveys have been standardized. Captains are instructed to try to maintain a constant fishing depth and fishing speed (in the case of this survey, 2.5 knots) and to set the gear so that, upon initial bottom contact, the trawl is as close to its equilibrium fishing speed and configuration as possible. Tows were designed to last 30 minutes between the time the net achieved a stable fishing configuration on bottom and the beginning of retrieval. Electronic bottom contact sensors (BCS) were hung from the footrope of the trawl to detect when the trawl was on bottom and monitor the actual duration that the trawl remained in contact with the seabed. Synchronized data streams from the GPS, BCS, Scanmar net mensuration system, and MBT were synthesized into a data set that describes and quantifies the sampling effort for each haul. This data set includes precise measurements of distance fished, fishing dimensions (width and height) of the net, bottom depth, water temperature, and bottom contact.
After retrieving the net, catches were sorted, each species was weighed and counted, and a variety of biological data and specimens (length, weight, age structures, and maturity of individual specimens) were collected. Samples were also collected from several species for more detailed studies of their biology (tissue samples, stomach contents, ovaries, etc) .
RESULTS
One-hundred-seventeen tows were made during the survey. We successfully completed paired trawl hauls at 56 of the 64 planned stations (Table 2). Two stations in the deepest stratum were abandoned due to untrawlable bottom and we were unable to sample the six stations on the westernmost three tracklines because they had been placed in Russian waters. Four tows resulted in unsatisfactory performance (three due to gear damage and one due to the net "mudding down") and one extra tow was done at the deepest possible depth (1,400 m) to collect specimens of unusual species. Figure 2 presents sea surface and bottom temperatures by depth. Mean path widths of the mudsweep and rockhopper trawls were 14.94 and 14.02 m, respectively, with corresponding mean net heights of 7.24 and 8.35 m.
We identified 89 fish species, representing 32 families, and numerous orders of invertebrates in catches throughout the

survey. Specimens of many unidentifiable fish and invertebrates were collected for later identification by experts. Scientists used a digital camera and an on-board digital photo data base to improve the consistency of species identification.
The types and counts of biological data collected from fish species as part of the RACE mission are summarized in Table 3. We measured 32,792 fish from 38 species. Length-type conversion data was collected from eight species of skates (to determine the relationship between total length and disk width), two species of grenadiers (to determine the relationship between pre-anal fin length and total length), and shortraker rockfish (to determine the relationship between fork, standard, and total length measurements). Otoliths were collected from 11 groundfish species. These will be examined and ages will be assigned to each specimen. Length-weight data was collected from 3,465 specimens of 20 different species. Seven species of crabs were also measured during the survey including Chionoecetes angulatus (2,100), C . b a i r d i (158), C . o p i l i o (43), C . tanneri (1,573), Lithodes aequispina (298), L . couesi (loo), and Paralomis mult ispina (18).
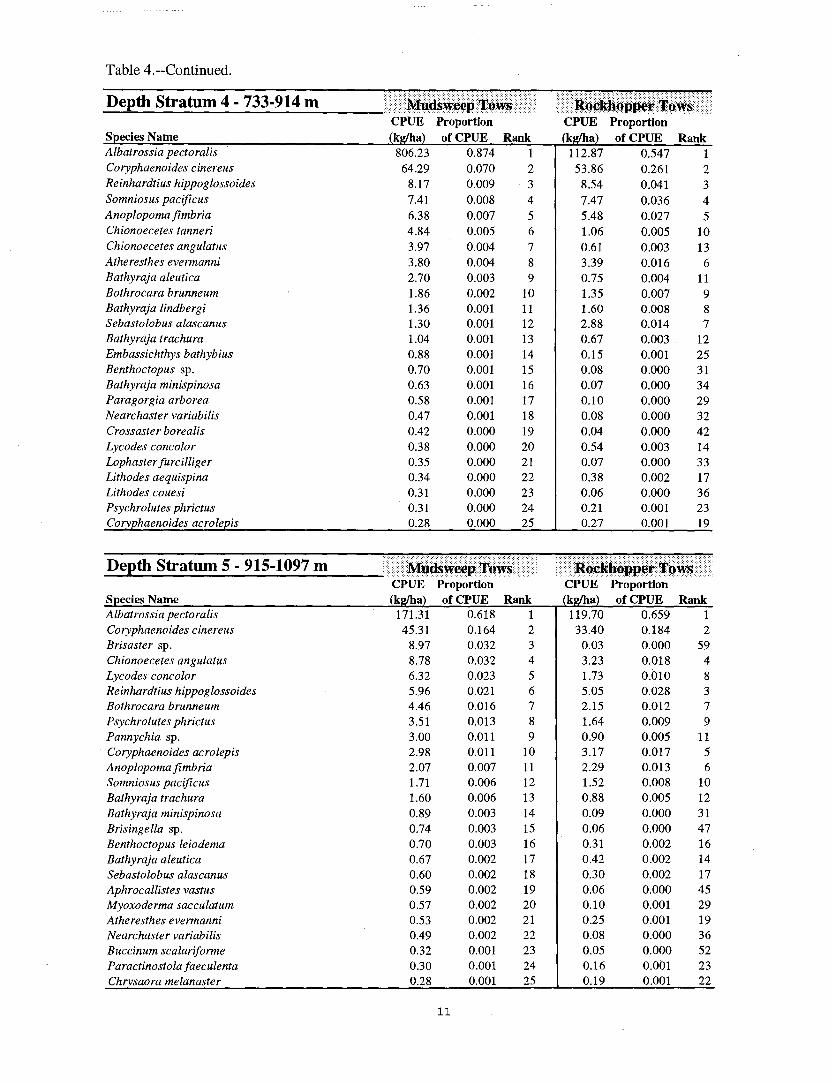
Table 4 lists the dominant fish species caught by gear type and depth stratum, ranked in order of catch per unit of effort (CPUE, kg/ha). Pacific ocean perch dominated the catches in the shallowest stratum (183-366 m) . Giant grenadier was the most abundant species in all other depth strata, accounting for over half of the catch weight in each of the four deeper strata. Relatively high catch rates of large flatfish (arrowtooth flounder and Greenland turbot) were seen in the two shallowest strata, but decreased at deeper depths. Popeye grenadier was quite important in the three deepest strata (550-1,100 m) . Pacific sleeper shark was a major component of the catch in several strata, particularly in the middle stratum where two large catches were made.
Average catch rates of the mudsweep gear were higher than those of the rockhopper gear in all depth strata except the shallowest (Fig. 3). Average catch rates in the shallowest stratum were strongly influenced by large catches of Pacific ocean perch, and the largest of those catches (16+ t) was made with the rockhopper net. With Pacific ocean perch excluded, the average catch rate of the mudsweep gear in the shallowest stratum exceeded that of the rockhopper gear by 46%.
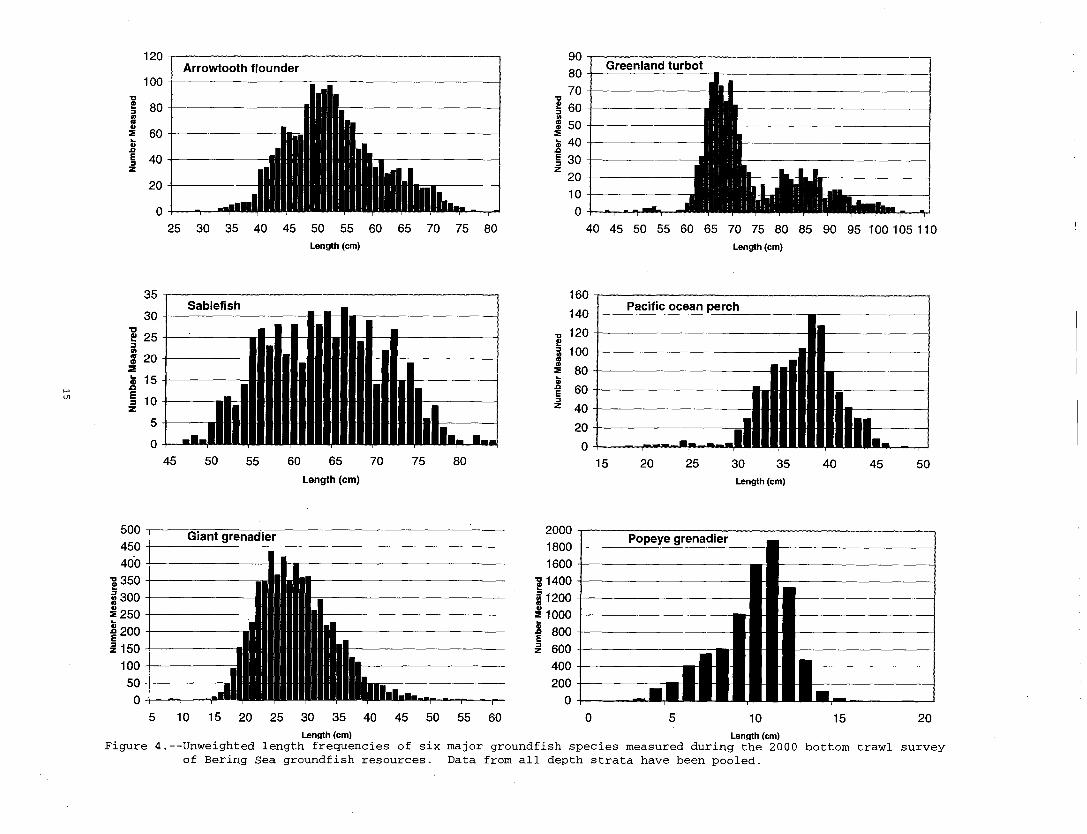
Figure 4 shows the unweighted size compositions (all depth strata combined) for six of the most commonly caught groundfish species, including arrowtooth flounder, Greenland turbot, giant and popeye
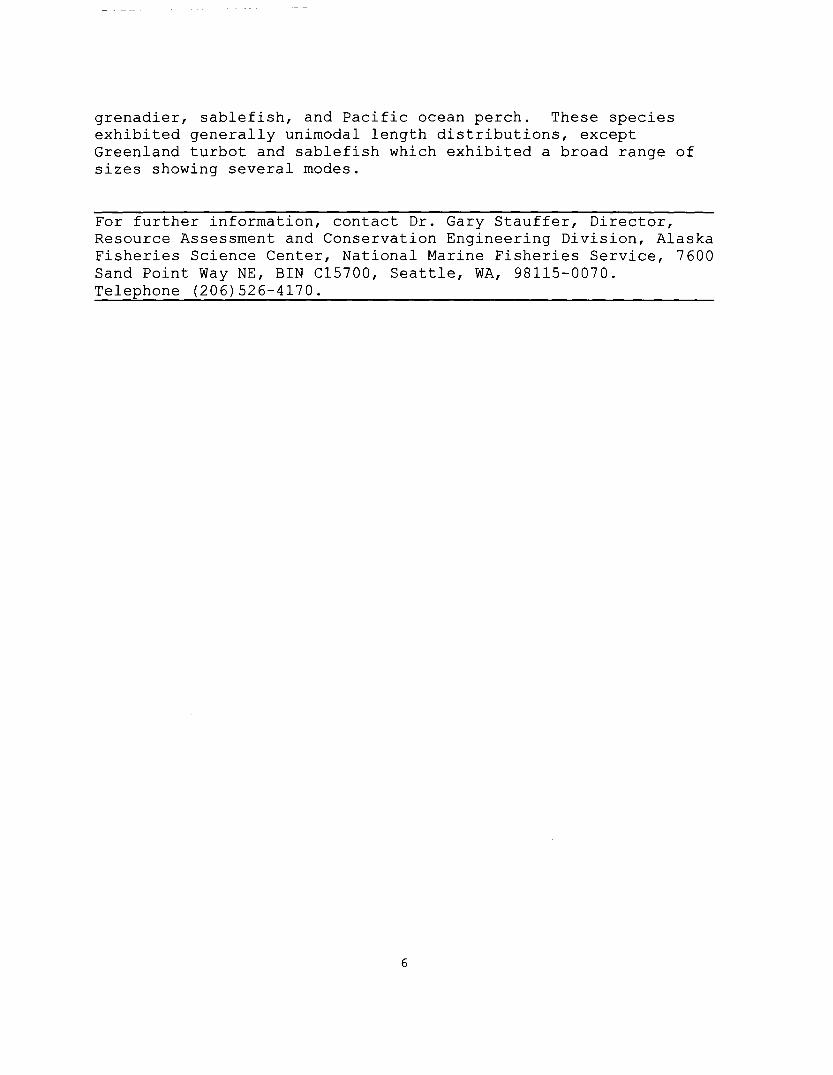
grenadier, sablefish, and Pacific ocean perch. These species exhibited generally unimodal length distributions, except Greenland turbot and sablefish which exhibited a broad range of sizes showing several modes.
For further information, contact Dr. Gary Stauffer, Director, Resource Assessment and Conservation Engineering Division, Alaska Fisheries Science Center, National Marine Fisheries Service, 7600 Sand Point Way NE, BIN C15700, Seattle, WA, 98115-0070. Telephone (206) 526-4170.
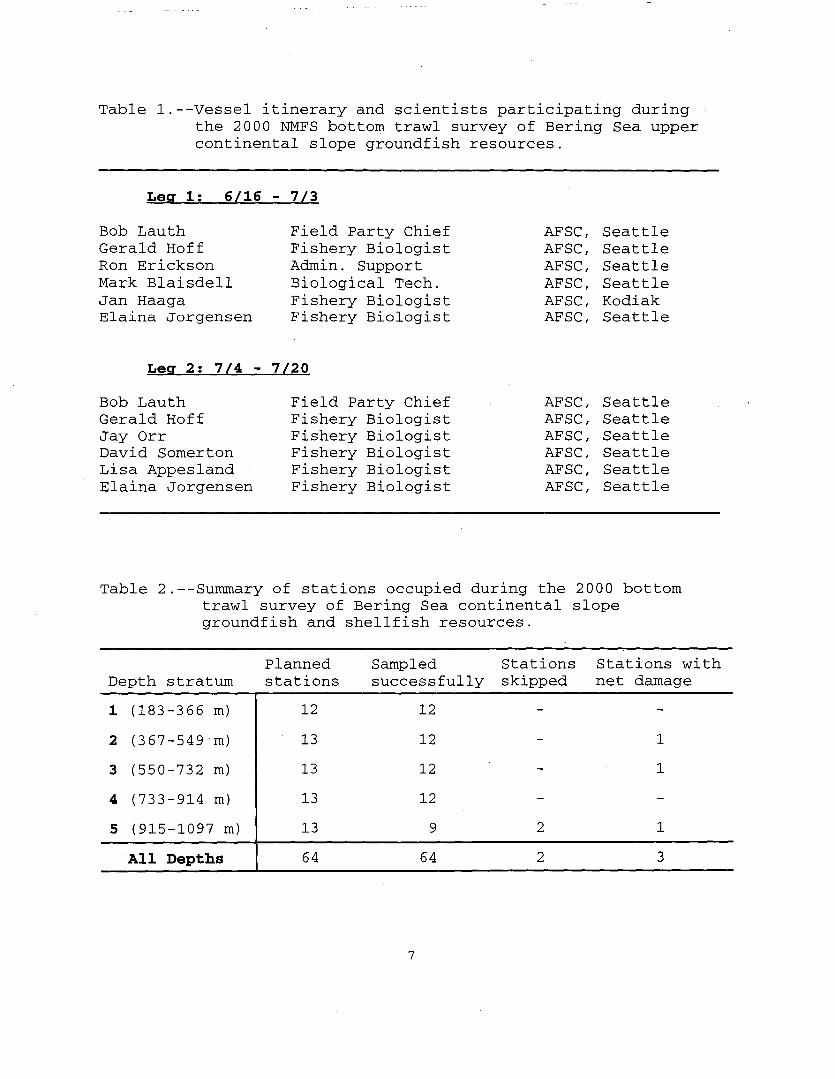
Table 1.--Vessel itinerary and scientists participating during the 2000 NMFS bottom trawl survey of Bering Sea upper continental slope groundfish resources.
L e g 1: 6/16 - 7/3
Bob Lauth Field Party Chief AFSC, Seattle Gerald Hoff Fishery Biologist AFSC, Seattle Ron Erickson Admin. Support AFSC, Seattle Mark Blaisdell Biological Tech. AFSC, Seattle Jan -Haaga Fishery Biologist AFSC, Kodiak Elaina Jorgensen Fishery Biologist AFSC, Seattle
L e g 2: 7/4 - 7/20
Bob Lauth Field Party Chief AFSC, Seattle Gerald Hoff Fishery Biologist AFSC, Seattle Jay Orr Fishery Biologist AFSC, Seattle David Somerton Fishery Biologist AFSC, Seattle Lisa Appesland Fishery Biologist AFSC, Seattle Elaina Jorgensen Fishery Biologist AFSC, Seattle
Table 2.--Summary of stations occupied during the 2000 bottom trawl survey of Bering Sea continental slope groundfish and shellfish resources.
Planned Sampled Stations Stations with Depth stratum stations successfully skipped net damage
All Depths I 64 6 4 2 3
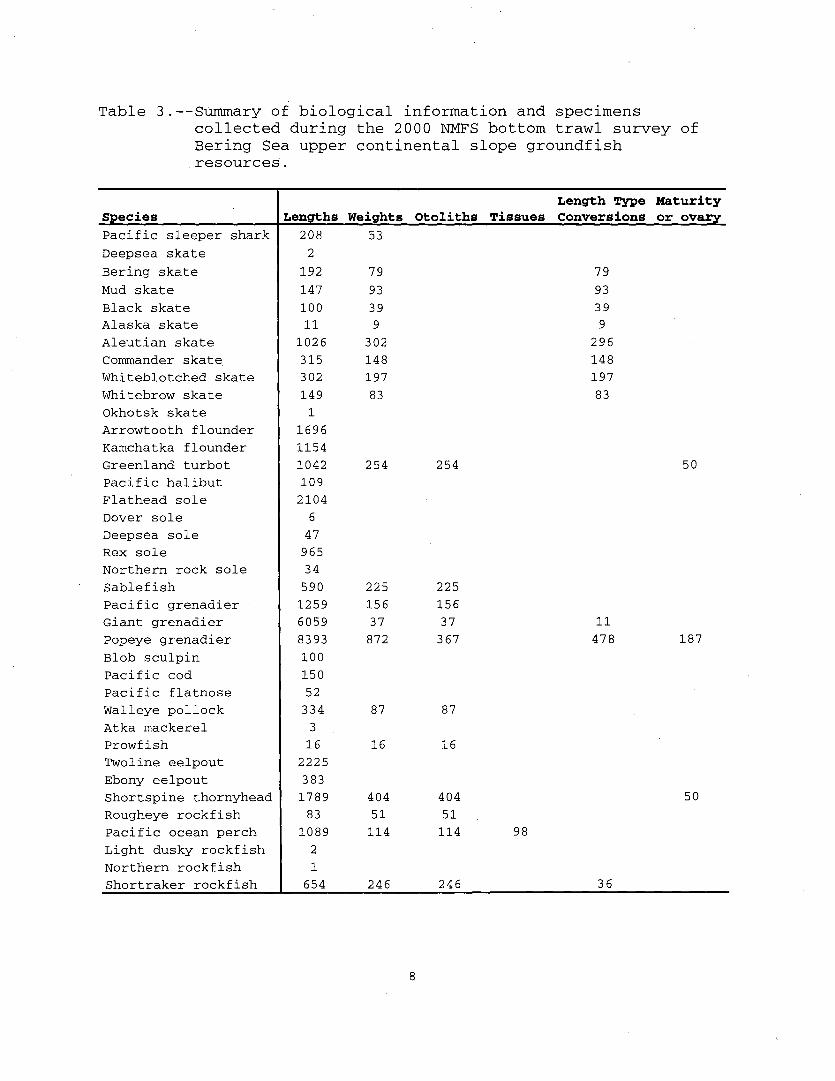
Table 3.--Summary of biological information and specimens collected during the 2000 NMFS bottom trawl survey of Bering Sea upper continental slope groundfish resources.
Length Type Maturity Species Lengths Weights Otoliths Tissues Conversions or ovary
Pacific sleeper shark Deepsea skate Bering skate Mud skate Black skate Alaska skate Aleutian skate Commander skate Whiteblotched skate Whitebrow skate Okhotsk skate Arrowtooth flounder Kamchatka flounder Greenland turbot Pacific halibut Flathead sole Dover sole Deepsea sole Rex sole Northern rock sole Sablef ish Pacific grenadier Giant grenadier Popeye grenadier Blob sculpin Pacific cod Pacific flatnose Walleye pollock Atka mackerel Prowf ish Twoline eelpout Ebony eelpout Shortspine thornyhead Rougheye rockfish Pacific ocean perch Light dusky rockfish Northern rockfish Shortraker rockfish
208 53

Table 4.--The most abundant species in catches within each depth stratum. For each depth stratum, the 25 most abundant species are listed in order of relative abundance (ranked by catch weight) in hauls made with the mudsweep gear. Their CPUE and rank in hauls made with the rockhopper gear are shown alongside for comparison.
Depth Stratum 1 - 183-366 m Mudsweep Tows RockhopperTows CPUE Proportion CPUE Proportion
Species Name (kg/ha) of CPUE Rank (kgha) of CPUE Rank Sebastes alutus 187.46 0.497 1 1 904.07 0.874 1 Atheresthes stomias 49.46 0.131 2 Somniosus pacifcus 39.07 0.104 3 Sebastes borealis 20.55 0.055 4 Hippoglossoides elassodon 14.84 0.039 5 Theragra chalcogramma 10.43 0.028 6 Hippoglossus stenolepis 7.64 0.020 7 Gadus macrocephalus 7.09 0.019 8 Reinhardtius hippoglossoides 6.81 0.018 9 Bathyraja aleutica 5.08 0.013 10 Glyptocephalus zachirus 4.60 0.012 11 Atheresthes evermanni 4.28 0.011 12 Porifera 2.60 0.007 13 Bathyraja maculata 1.81 0.005 14 Zaprora silenus 1.72 0.005 15 Bathyraja interrupta 1.55 0.004 16 Sebastes aleutianus 1.27 0.003 17 Bathyraja parmifera 1.13 0.003 18 Lithodes aequispina 0.83 0.002 19 Malacocottus zonurus 0.83 0.002 20 Hemitripterus bolini 0.83 0.002 21 Bathyraja taranetzi 0.67 0.002 22 Liponema brevicome 0.65 0.002 23 Pandalus borealis 0.52 0.001 24 Asteronyx loveni 0.45 0.001 25

1 2 3 4 5 6 7 8 9
10 11 12 13 14 15 16 17 18 19 20 21 22 23 24 25
1 2 3 4 5 6 7 8
Table 4.--Continued.
Depth Stratum 2 - 367-549 m Mudsweep Tows Rockhopper Tows CPUE Proportion CPUE Proportion
Species Name ( k e a ) of CPUE Rank (kg/ha) of CPUE Rank Albatrossia pectoralis 281.86 0.641 1 143.94 0.546 1 Atheresthes stomias 27.09 0.062 2 15.09 0.057 4 Reinhardtius hippoglossoides 23.80 0.054 3 16.45 0.062 2 Bathyraja aleutica 23.54 0.054 4 15.21 0.058 3 Hippoglossoides elassodon 12.42 0.028 5 7.99 0.030 9 Sebastes borealis 10.29 0.023 6 10.35 0.039 5 Sebastolobus alascanus 8.67 0.020 7 8.13 0.031 8 Atheresthes evermanni 7.91 0.01 8 8 9.12 0.035 6 Hippoglossus stenolepis 6.21 0.014 9 8.45 0.032 7 Glyptocephalus zachirus 6.05 0.014 10 3.42 0.013 11 Hemitripterus bolini 5.34 0.012 11 5.89 0.022 10 Bothrocara brunneum 4.21 0.010 12 2.38 0.009 14 Anoplopoma fimbria 4.15 0.009 13 3.16 0.012 12 Bathyraja lindbergi 2.08 0.005 14 0.64 0.002 21 Bathyraja minispinosa 2.08 0.005 15 1.19 0.005 16 Bathyraja maculata 2.03 0.005 16 1.39 0.005 15 Lycodes concolor 0.91 0.002 17 0.48 0.002 23 Bathyraja interrupta 0.90 0.002 18 0.50 0.002 22 Somniosus pacificus 0.87 0.002 19 2.58 0.010 13 Liponema brevicome 0.80 0.002 20 0.39 0.001 25 Chionoecetes tanneri 0.76 0.002 21 0.04 0.000 49 Ceramaster patagonicus 0.61 0.001 22 0.18 0.001 31 Careproctus melanurus 0.59 0.001 23 0.36 0.001 26 Lithodes aequispina 0.56 0.001 24 0.85 0.003 17 Theragra chalcogramma 0.47 0.001 25 0.20 0.001 30
Depth Stratum 3 - 550-732 m Mudsweep Tows Rockhopper TOWS CPUE Proportion CPUE Proportion
Species Name ( k e a ) of CPUE Rank (kgha) of CPUE Rank Albatrossia pectoralis 239.99 0.556 93.28 0.419 Somniosus pacificus 95.40 0.221 62.52 0.281 Coryphaenoides cinereus 30.45 0.071 23.01 0.103 Reinhardtius hippoglossoides 12.86 0.030 7.08 0.032 Anoplopoma fimbria 10.46 0.024 6.08 0.027 Atheresthes evermanni 6.27 0.015 5.97 0.027 Bothrocara brunneum 5.24 0.012 5.47 0.025 Sebastolobus alascanus 4.62 0.01 1 5.28 0.024 Chionoecetes tanneri 3.94 0.009 0.91 0.004 13 Bathyraja lindbergi 3.34 0.008 2.58 0.012 9 Bathyraja aleutica 2.66 0.006 1.58 0.007 11 Ophiura sp. 2.06 0.005 0.00 0.000 82 Bathyraja maculata 1.82 0.004 1.66 0.007 10 Hippoglossus stenolepis 1.71 0.004 1.53 0.007 12 Parastichopus sp. 1.47 0.003 0.62 0.003 15 Atheresthes stomias 1.47 0.003 0.34 0.002 16 Lycodes concolor 0.98 0.002 0.68 0.003 14 Bathyraja minispinosa 0.69 0.002 0.34 0.002 17 Lithodes aequispina 0.69 0.002 0.26 0.001 21 Crossaster borealis 0.67 0.002 0.31 0.001 19 Lithodes couesi 0.52 0:OOl 0.28 0.001 20 Chionoecetes angulatus 0.38 0.001 0.03 0.000 43 Bathyraja trachura 0.33 0.001 0.03 0.000 46 Aphrocallistes vastus 0.26 0.001 Careproctus melanurus 0.26 0.001
1 2 3 4 5 6 7 8 9
10 11 12 13 14 15 16 17 18 19 20 21 22 23 24 25
1
Table 4.--Continued.
Rockhopper Tows CPUE Proportion
Species Name (kgha) of CPUE Rank Albatrossia pectoralis 806.23 0.874 1 Coryphaenoides cinereus 64.29 0.070 2 Reinhardtius hippoglossoides 8.17 0.009 3 Somniosus pacificus 7.41 0.008 4 Anoplopoma fimbria 6.38 0.007 5 Chionoecetes tanneri 4.84 0.005 6 Chionoecetes angulatus 3.97 0.004 7 Atheresthes evermanni 3.80 0.004 8 Bathyraja aleutica 2.70 0.003 9 Bothrocara brunneum 1.86 0.002 10 Bathyraja lindbergi 1.36 0.001 11 Sebastolobus alascanus 1.30 0.001 12 Bathyraja trachura 1.04 0.001 13 Embassichthys bathybius 0.88 0.001 14 Benthoctopus sp. 0.70 0.001 15 Bathyraja minispinosa 0.63 0.001 16 Paragorgia arborea 0.58 0.001 17 Nearchaster variabilis 0.47 0.001 18 Crossaster borealis 0.42 0.000 19 Lycodes concolor 0.38 0.000 20 Lophaster furcilliger 0.35 0.000 21 Lithodes aequispina 0.34 0.000 22 Lithodes couesi 0.31 0.000 23 Psychrolutes phrictus 0.31 0.000 24 Coryphaenoides acrolepis 0.28 0.000 25
Depth M"&jwmqTows CPUE Proportion
Species Name (kgha) of CPUE Rank Albatrossia pectoralis 171.31 0.618 Coryphaenoides cinereus 45.31 0.164 Brisaster sp. 8.97 0.032 Chionoecetes angulatus 8.78 0.032 Lycodes concolor 6.32 0.023 Reinhardtius hippoglossoides 5.96 0.021 Bothrocara brunneum 4.46 0.01 6 Psychrolutes phrictus 3.51 0.01 3 Pannychia sp. 3.OO 0.011 Coryphaenoides acrolepis 2.98 0.011 Anoplopoma fimbria 2.07 0.007 Somniosus pacificus 1.71 0.006 Bathyraja trachura 1.60 0.006 Bathyraja minispinosa 0.89 0.003 Brisingella sp. 0.74 0.003 Benthoctopus leiodema 0.70 0.003 Bathyraja aleutica 0.67 0.002 Sebastolobus alascanus 0.60 0.002 Aphrocallistes vastus 0.59 0.002 Myoxoderma sacculatum 0.57 0.002 Atheresthes evermanni 0.53 0.002 Nearchaster variabilis 0.49 0.002 Buccinum scalariforme 0.32 0.001 Paractinostola faeculenta 0.30 0.001 Chrysaora melanaster 0.28 0.001
CPUE Proportion (kgha) of CPUE Rank
112.87 0.547
Rockhopper Tows CPUE Proportion (kgha) of CPUE Rank 119.70 0.659 1 33.40 0.184 2 0.03 0.000 59 3.23 0.018 4 1.73 0.010 8 5.05 0.028 3 2.15 0.012 7 1.64 0.009 9 0.90 0.005 11 3.17 0.017 5 2.29 0.013 6 1.52 0.008 10 0.88 0.005 12 0.09 0.000 31 0.06 0.000 47 0.31 0.002 16 0.42 0.002 14 0.30 0.002 17 0.06 0.000 45 0.10 0.001 29 0.25 0.001 19 0.08 0.000 36 0.05 0.000 52 0.16 0.001 23 0.19 0.001 22

Figure 1.--Survey area and sampling tracklines for the 2000 Bering Sea bottom trawl survey of continental slope groundfish and shellfish resources. Depth contours (100 m) from 200 to 1,100 m are shown.

500 600 700
Bottom Depth (m)
Figure 2.--Surface and bottom temperatures measured at each station plotted against the bottom depth.

1 2 3 4 5 All
Depth Stratum
Figure 3.--Comparison of average total catch rates (all species combined) from the two gear types used during the 2000 bottom trawl survey of Bering Sea continental slope groundfish and shellfish resources. Average total catch rates are shown for each depth stratum and for all strata combined.
90 80 1 Greenland turbot
I I
0 -
25 30 35 40 45 50 55 60 65 70 75 80 40 45 50 55 60 65 70 75 80 85 90 95 100 105 110 Length (cm) Length (cm)
35 I Sablefish 1 160 Pacific ocean perch
140 1
45 50 55 60 65 70 75 80 15 20 25 30 35 40 45 50 Length (cm) Length (cm)
500 2000 450 1800 400 1600
g 350 3 1400 300
2 2501200 7 1200!10005 800
I150 I 600 100 400 50 200 0 0 5 10 15 20 25 30 35 40 45 50 55 60 0 5 10 15 20
Length (cm) Lenath (em) Figure 4.--Unweighted length frequencies of six major groundfish species measured during the 2000 bottom trawl survey
of Bering Sea groundfish resources. Data from all depth strata have been pooled.