united states economies in transition: agriculture an
TRANSCRIPT

United StatesDepartment ofAgriculture
Forest Service
Pacific NorthwestResearch Station
General TechnicalReportPNW-GTR-417April 1998
Economies in Transition:An Assessment of TrendsRelevant to Management ofthe Tongass National Forest
Stewart D. Allen, Guy Robertson, Julie Schaefers

Authors STEWART D. ALLEN is a research social scientist, Pacific Northwest ResearchStation, Forestry Sciences Laboratory, 2770 Sherwood Lane, Juneau, AK 99801;GUY ROBERTSON is an economist, Pacific Northwest Research Station, ForestrySciences Laboratory, 3200 SW Jefferson Way, Corvallis, OR 97331; and JULIESCHAEFERS is an economist, Alaska Region, P.O. Box 21628, Juneau, AK 99802.

Conservation and ResourceAssessments for the TongassLand Management Plan Manage-ment Plan Revision
Charles G. Shaw III, Technical Coordinator
Economies in Transition: An Assessment of TrendsRelevant to Management of the Tongass National Forest.
Stewart D. Allen, Guy Robertson, and Julie Schaefers
Published by:U.S. Department of AgricultureForest ServicePacific Northwest Research StationPortland, OregonGeneral Technical Report PNW-GTR-417April 1998
Abstract Allen, Stewart D.; Robertson, Guy; Schaefers, Julie. 1998. Economies in transi-tion: an assessment of trends relevant to management of the Tongass NationalForest. Gen. Tech. Rep. PNW-GTR-417. Portland, OR: U.S. Department ofAgriculture, Forest Service, Pacific Northwest Research Station. 101 p. (Shaw,Charles G., III, tech. coord.; Conservation and resource assessments for theTongass land management plan revision).
This assessment focuses on the regional and community economies of southeastAlaska. A mixed economy composed of subsistence harvest and cash income char-acterizes the economies of most of the region’s rural communities. Although the shareof natural resource-based sectors relative to total employment has remained fairlyconsistent over the past 10 years, the mix of industries within that share is shifting,with substantial declines in the wood products sector and substantial increases inthe recreation-tourism sector. Regional trends are reflected very differently acrossboroughs, and even more so across the many small communities of southeastAlaska; analysis at diverse scales was needed to accurately portray economic andsocial conditions and trends.
Keywords: Tongass National Forest, southeast Alaska, economic trends,employment, subsistence, communities.
Contents 1 Introduction
1 Methodology
4 Overview of Historical Development and Current Population
11 Regional Conditions and Trends
16 Tongass National Forest-Related Regional Economy
38 Subsistence
40 Subregional Conditions and Trends
42 Tongass-Related Industries
44 Community Conditions and Trends
49 Tongass-Related Industries
54 Forest Receipts and Payments to State
56 Community Resiliency
60 Conclusions
67 Acknowledgments
67 References
72 Appendix 1: Employment by Sector and Community Group
95 Appendix 2: Per Capita Revenues and Expenditures by Community
Introduction The USDA Forest Service has adopted ecosystem management as the strategyby which to manage the National Forests, including the Tongass National Forest insoutheast Alaska. Humans are an integral part of ecosystems, so our social and eco-nomic systems are components of overall ecosystem functioning and integrity. Condi-tions of sociocultural and economic systems must be evaluated side by side with bio-logical and physical systems. This will lead to a better understanding of how humanand nonhuman ecosystem components interact and affect each other. This is espe-cially needed for southeast Alaska, because of the many ways people depend onnatural resources for food, employment, recreation, health, and cultural survival, andthe effects of these uses on ecosystems.
This assessment describes one portion of the complex human-environment story: theeconomies of southeast Alaska. It focuses on conditions and trends relevant to under-standing management of the Tongass National Forest and the Forest’s relation toboth regional and local economies. The social and economic systems of southeastAlaska are subject to many of the same forces affecting rural areas nationwide, butthe Tongass plays a central role as manager of the vast majority (over 80 percent)of the land in southeast Alaska.
Because the focus of this report is on regional and local economies, it should not beconsidered a complete assessment of social and economic conditions and trends insoutheast Alaska, or as an indication that characteristics not discussed are less im-portant to southeast Alaska residents or to management of the Tongass. Reports onother aspects of the human ecosystem will be published under the long-term socialresearch program currently being developed by the Pacific Northwest Research Sta-tion. It also should be understood that the purpose here is to describe existing econo-mic conditions and recent trends, and not to forecast the future. Additional social andeconomic information and impact assessment is provided in the final environmentalimpact statement for the Tongass Land Management Plan (USDA Forest Service1997). This report documents economic conditions and trends present during thewriting of the final environmental impact statement (EIS) on the Tongass NationalForest Land Management Plan (USDA Forest Service 1997). Future reports willprovide updates on those trends.
The following section describes some methodological considerations, including theimportant issue of scale of analysis. The third section is a brief summary of historicsettlement and the current population of southeast Alaska. The fourth section providesan overview of trends at the regional level, which includes all of southeast Alaska.The fifth section describes information available at the subregional level—in this case,boroughs and census areas in southeast Alaska (the functional equivalent of countieselsewhere in the United States). The sixth section describes economic conditions andtrends for communities and groups of communities. The final section contains conclu-sions about the economic status of southeast Alaskans and implications for manage-ment of the Tongass.
Methodology The issue of scale or level of analysis is as important for socioeconomic analyses asit is for biological or physical analyses. It is important, for example, to begin with anoverview of conditions at the regional scale. The entire region has a number of char-acteristics that distinguish it markedly from other portions of the United States, suchas its climate and topography, sparse population, lack of road access, strong depend-ence on natural resources for cultural, social, psychological, and economic benefits,
1

and the lack of political units common in other parts of the country (i.e., counties).Similarly, some economic trends are best understood at the regional level becausethey have effects throughout southeast Alaska. Regional-level analyses also allowcomparison between conditions and trends in southeast Alaska and those presentnationwide or Alaska-wide.
Assessing conditions at only the regional level misses the many distinctions presentat the next main political unit of analysis: borough or census area level (because largeportions of southeast Alaska have not incorporated into boroughs). These units arewidely recognized by all Federal agencies and most state agencies as county equiva-lents for Alaska. Southeast Alaska’s boroughs and census areas, as shown below,differ in their social and economic structure and diversity and in the emphasis on nat-ural resources used. Southeast Alaska contains five boroughs: the city-boroughs ofJuneau, Sitka, and Yakutat; and Ketchikan Gateway and Haines, which have indepen-dent, incorporated communities within their boundaries. The remaining unorganizedarea is divided into three census areas for enumeration by the U.S. Bureau of theCensus: Skagway-Hoonah-Angoon; Wrangell-Petersburg; and Prince of Wales-OuterKetchikan.
The next primary unit of analysis and understanding is communities within boroughsor census areas. Each of southeast Alaska’s communities, whether the few classifiedas urban (population of 2,500 or greater) or the majority, which are rural and in somecases very small, has a unique set of social and economic characteristics and quali-ties that contribute to quality of life for the residents. Very different communities mayoccur within the same borough.
Some of the data desirable for describing community economies are either unavail-able (the state does not collect employment and income data at very small scales,and some information is viewed as proprietary and not released) or available infre-quently (only collected every 10 years during the U.S. census). A recent change instate policy, however, has made available data for groups of communities (discussedin greater detail in “Community Conditions and Trends”). These data, available onlysince July 1, 1996, provide a much better understanding of local distinctions. Table 1shows how these various levels of analysis fit together.
It is also possible, and for many purposes desirable, to discuss other units of measurein social and economic assessments. “Communities of interest,” for example, is aterm used to describe like-minded groups of people who form a social unit regardlessof their place of residence, such as the timber community or the environmental com-munity. These subgroups can be differentially affected by public policy changes, evenif a community as a whole is doing well. Other social units include clans, families, andindividuals. Another subgroup, but a spatially defined one, is logging camps—mobileyet independent settlements that sometimes become formal communities. Communi-ties of interest and other possible subgroupings are not the focus of this report but areoccasionally mentioned where appropriate.
The data referenced come from many sources. Employment, income, and revenuestatistics were drawn primarily from the Alaska Department of Labor and Departmentof Community and Regional Affairs, with additional analysis by the Forest Service,and from the U.S. Bureau of the Census and Bureau of Economic Analysis. For eachindustry, numerous estimation techniques were used, each containing underlying as-sumptions and subject to various degrees of error. Where appropriate, these assump-tions are stated and the nature of associated interpretation discussed.
2

Table 1—Boroughs and census areas, community groups, and communities of southeast Alaska
Boroughs and census areas Community groups Communities
City and Borough of Juneau Juneau Auke Bay, Berners Bay, Douglas, Dupont, Fritz Cove, Hawk Inlet,Juneau, Lemon Creek, Lena Cove, Lynn Canal, Mendenhall Valley,North Douglas, Salmon Creek, Snettisham, Switzer Creek, Taku Harbor,Taku Lodge, Tee Harbor, Thane, and West Juneau.
Ketchikan Gateway Borough Ketchikan City Carlanna, Charcoal Point, Clover Pass, Herring Cove, Ketchikan,Mountain Point, Mud Bay, North Tongass Highway, Peninsula Point,Pennock Island, Point Higgins, Refuge Cove, Saxman, Shoreline Drive,Thomas Basin, Totem Bight, Upper Nickeyville, Wacker, and Ward Cove.
Revillaggigedo Fire Cove, Gedney Pass, George Inlet, Gravina Island, Guard Island,Hassler Pass, Loring, Neets Bay, Princess Bay, Shoal Cove, andTwin Peaks.
Haines Borough Haines Eldred Rock, Excursion Inlet, Haines, Letnikof Cove, Moose Valley,Mosquito Lake, Pleasant Camp, Porcupine, Port Chilkoot, andSaint James Bay.
Sitka Borough Baranof Baranof, Big Port Walter, Chatham, Corner Bay, False Island, Lake Eva,Little Port Walter, Port Armstrong, Port Conclusion, Rodman Bay,Saook Bay, Todd, and Warm Spring Bay.
Sitka Biorka Island, Chichagof, Cobol, Deep Bay, Goddard, Halibut Point,Jamestown Bay, Japonski Island (Mt. Edgecumbe), Katlian Bay,Klag Bay, Nakwasina Cove, Redfish Cape, Saint John Baptist Bay,Schulze Cove, Sitka, and Sitka Logging Camp.
Yakutat Borough Yakutat Situk and Yakutat.
Skagway-Hoonah-Angoon Chatham Strait Angoon, Catherine Island, Cube Cove, Hanus Bay, Tenakee Springs,Tyee, and Whitewater Bay.
Gustavus Bartlett Cove, Cape Spencer, and Gustavus (Strawberry Point).
North Chichagof Elfin Cove, Gull Cove, Hoonah, Idaho Inlet, Lisianski, Pelican,Port Althorp, Port Frederick, and Yakobi Island.
Stephens Passage Cape Fanshaw, Five Fingers, Freshwater Bay, Funter Bay,Hobart Bay, Point Retreat, Port Houghton, Sawyers Landing, Sumdum,and Windham Bay.
Skagway Clifton and Skagway.
Prince of Wales-Outer Ketchikan Central POWa Craig, Hollis, and Klawock.
Southeast POW Bokan Mountain, Campbell, Dall Island, Dora Bay, Kendrick Bay,Klakas Inlet, Rose Inlet, Twelvemile Arm, View Cove, and Waterfall.
Hydaburg Hydaburg.
3
Overview ofHistorical Develop-ment and CurrentPopulation
This section begins with a brief summary of the history of southeast Alaska’s primaryresource-dependent industries. The purpose is to provide a context for understandingand interpreting changes occurring in southeast Alaska economies today, at both re-gional and community scales. State and Federal policies, critical to population anddevelopment of southeast Alaska, continue to shape the behavior of natural resource-based industries.
Southeast Alaska’s contemporary society is influenced by many cultures. The abun-dant resources of the forest and water have provided for the physical and culturallivelihood of local peoples for thousands of years. The earliest known people toinhabit the area, the Tlingit, adapted well to the coastal environment, developinga rich culture that still thrives through the changes brought by European peoples.Native corporations operating today are a major economic force in southeast Alaska(McDowell Group 1997).
Table 1—Boroughs and census areas, community groups, and communities of southeast Alaska(continued)
Boroughs and census areas Community groups Communities
North POW Cape Pole, Coal Bay, Coffman Cove, Edna Bay, El Capitan, Kasaan,Labouchere Bay, Little Naukati Bay, Naukati Bay, Noyes Island,Point Baker, Port Alice, Port Protection, Ratz Harbor, Red Bay,Salt Chuck, Shakan, Steamboat Bay, Thorne Bay, Thorne Island,Tokeen, Tuxekan, Warren Cove, and Whale Pass.
Metlakatla Annette, Mary Island, and Metlakatla.
Hyder Hidden Inlet, Hyder, Smeaton Bay, Tongass, and Tree Point.
Cleveland Peninsula Bell Island, Meyers Chuck, Union Bay, and Yes Bay.
Wrangell-Petersburg Kake Kake.
Kuiu Island Alvin Bay, Cape Decision, Coronation Island, Duncan Canal, FairwayIsland, Hamilton Bay, Kah Sheets Bay, Port Alexander, Rowan Bay,Saginaw Bay, Security Bay, Tebenkof Bay, and Washington Bay.
Petersburg Kupreanof, Mitkof Island, Petersburg, Scow Bay, and Vank Island.
Thomas Bay Thomas Bay.
Wrangell City Wrangell.
Wrangell Island Bradfield River, Burnette Inlet, Deer Island, Ernest Sound, Etolin Island,Kakwan Point, Roosevelt Harbor, Saint John Harbor, Tyler LoggingCamp, and Zarembo Island.
a POW = Prince of Wales Island.Source: Alaska Department of Labor 1995.
4
In the 1700s, the Russians began exploration in Alaska.1 The fur trade, primarily insea otter (Enhydra lutris) pelts, was the main force driving colonization. Sitka, estab-lished as Russian headquarters, was a city by the early 1860s, complete with saw-mills, a shipyard, a foundry, numerous support industries, and a thriving harbor. Whenmost of the sea otter population was depleted, the fur industry declined and Russialost interest in her North American colony; Alaska was sold to the United States in1867 (Seward’s Folly).
As American colonization continued, new industries developed. In the late 1800s,commercial fishing, including salting and canning, became an important part of theeconomy of southeast Alaska. The first American shore-based salmon saltery oper-ated in 1868 on Klawock Island, where a salmon cannery opened 10 years later.By the start of the 20th century, one-third of the million cases of salmon processedin Alaska came from the southeast. Concerns about the sustainability of harvestrates led to policy mandating artificial propagation; the largest hatchery in the worldbegan operation in 1901 at Heckman Lake. Mild-curing started soon thereafter, withGermany as the principal market. Many communities sprang up around the fishingindustry. In the early 1900s, Port Alexander’s harbor was filled with up to 1,000 fishingboats, and the community swelled with many businesses. Later, floating fish trapsgreatly increased catch rates, until they were outlawed at the time of statehood(1959). Many canneries closed, but the fishing boat industry flourished. Commercialsalmon fisheries in southeast Alaska became limited entry in the mid 1970s and early1980s; this system limited the number of commercial permits available and estab-lished rules for allocating them.
The discovery of gold brought thousands of miners to the area, many of whom werethen followed by their families. Kowee, a chief of the Auk Tlingits, is credited withshowing Joe Juneau and Richard Harris to their finding at Juneau in 1880. TheTreadwell Mine across the channel in Douglas, one of the largest mining complexesin the world, began operation in 1885 and continued until 1917, employing an averageof 700 to 750 workers annually and up to 2,000 in peak years. Discovery of gold inthe Klondike led to establishment of Skagway as a gateway to the gold fields. By1920, the Alaska-Juneau mine was the largest bar-grade gold mine in the world,processing a peak of 12,000 tons of ore per day and employing 1,000. In the 1920sand 1930s, the Great Depression brought a decline in mining employment. The goldmines, not considered critical to the war effort, were closed by Federal order duringWorld War II. Afterwards, rising labor costs and fixed gold prices prevented mostAlaska mines from reopening for some time.
The region’s timber resources were used by the earliest inhabitants for shelter, heat,utility, and cultural purposes. The Russians also harvested timber for building shipsand structures, but commercial timber harvest did not develop until the 1900s. In theearly part of the 20th century, small sawmills were operating in a few communitiesand served local markets. Alaska’s first pulp mill opened in 1921 south of Juneau, butclosed after 3 years as a result of poor market conditions. The Alaska Spruce Logprogram was headquartered at Edna Bay, where 250 newcomers were housed. Theprogram operated from 1942 to 1944 to produce lumber for airplanes needed for the
1 Much of the following history is adapted from Roppel (1983).
5
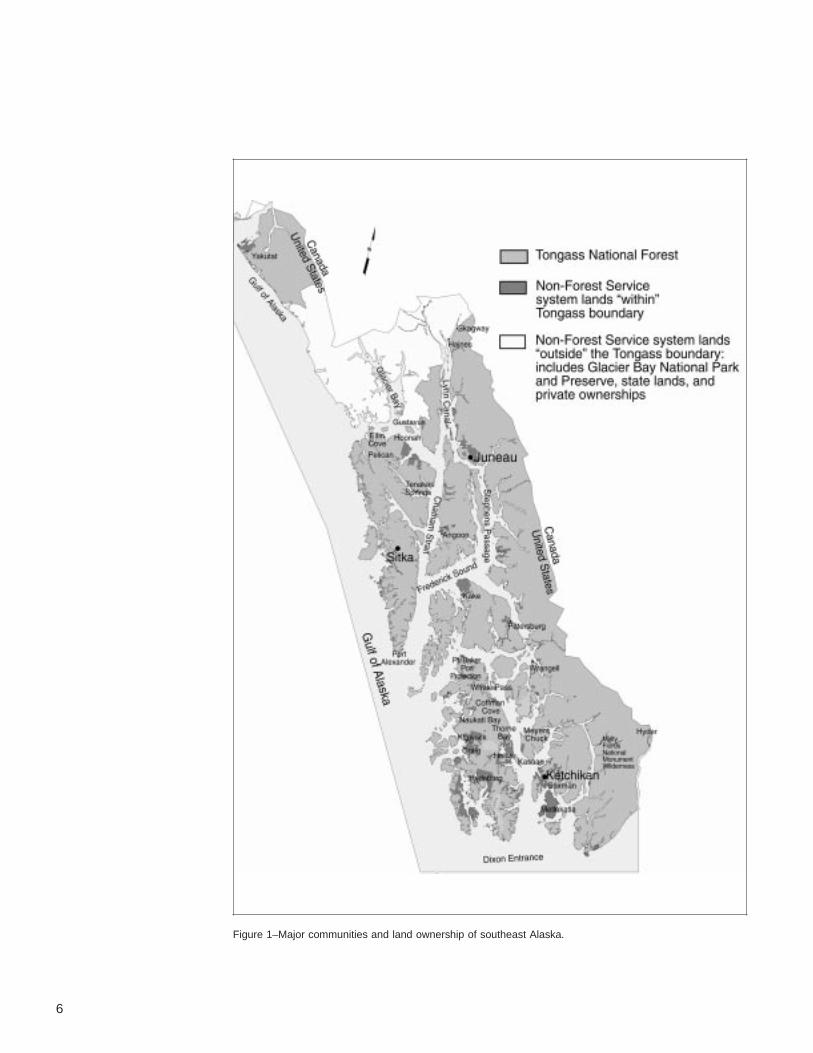
Figure 1–Major communities and land ownership of southeast Alaska.
6

war. It was not until the mid-20th century, though, when two large pulp mills openedin Ketchikan and Sitka, that the timber industry became a major social and economicfactor in southeast Alaska. The Ketchikan Pulp Company mill was completed in 1954,and the Alaska Lumber and Pulp Company mill near Sitka opened in 1959. Long-termcontracts guaranteed a supply of timber from Federal lands to these large southeastAlaska mills. Closure of the mills in 1994 (Sitka) and 1997 (Ketchikan) led to social,economic, and political effects that continue to reverberate throughout southeastAlaska.
The tourism industry in southeast Alaska began in the 1870s with visits by John Muirand others who wrote of the land’s magnificence. Transportation developed to bringfreight and workers was used by travelers to see the region’s sights. Steamshipsbrought 5,000 travelers to the region in 1890, and completion of the White Passand Yukon Railroad in 1900 attracted tourists as well as gold miners. Air passengerservice between Juneau, Ketchikan, and Seattle began in 1940 with Pan AmericanAirways’ Sikorsky flying boat, which could carry 32 passengers. By 1951, just after theAlaska Highway opened to the public, southeast Alaska visitation increased to about50,000. Recent years have seen southeast Alaska attract industrial-scale tourism, andthe Inside Passage is Alaska’s most frequently visited attraction.
Today, land ownership in southeast Alaska is dominated by the Tongass NationalForest, which comprises over 80 percent of the land base (17 of 21 million acres). Anadditional 15 percent, is Federal land managed by the National Park Service, most ofwhich is in Glacier Bay National Park and Preserve. The next largest ownership is byNative corporations, which own just over 500,000 acres, followed by the state with180,000 acres, boroughs and communities with 53,000 acres, and other private landswith 11,000 acres. Given this distribution, it is not difficult to imagine the pervasiveeffects that Tongass management has on the people of southeast Alaska.
Southeast Alaska (fig. 1) contains about 12 percent of Alaska’s population and6 percent of its land base. Presently, about 74,000 people live in the towns, com-munities, and villages of Alaska’s southeastern panhandle, mostly on islands oralong the narrow strip of coastline (Alaska Department of Labor 1995). As of 1995,only 5 of southeast Alaska’s 32 primary communities were considered urban bythe U.S. Bureau of the Census definition as having a population of 2,500 or greater.Together, these cities account for 71 percent of the total regional population. Three—Juneau, Ketchikan and Sitka—rank within the top five urban areas in the state; onlyAnchorage and Fairbanks are larger in population. At 29,500, Juneau alone accountsfor almost 40 percent of southeast Alaska’s population.
The region’s remoteness is reflected in a population density of around 2 personsper square mile, compared to the U.S. average of over 70 persons per square mile.Southeast Alaska consists of a narrow strip of mainland and a chain of hundreds ofislands known as the Alexander Archipelago. Most locations are accessible only byboat or plane, and landing strips or seaplane facilities are available in virtually allcommunities. Ferries owned and operated by the state’s Alaska Marine HighwaySystem transport people and vehicles between several ports in southeast Alaska,Prince Rupert, BC, and Bellingham, WA. Haines and Skagway, at the northernend of the interisland waterway, and Hyder at the southern end, offer the only roadaccess to the interior and south-central Alaska via the Alaska Highway, and Canadavia the Cassiar Highway.
7

Table 2—Population characteristics compared for the United States and Alaska, 1990 and 1995
Education attainment(25 years and older)
PopulationHigh Bachelor
Census area Asian and Median Persons per school degree orand year Total Caucasian Native Black Pacific Islander age Males household or higher higher
– – – – – – – – – Percent – – – – – – – – – Years Percent No. – – – Percent – – –
United States,1990 248,709,873 83.9 0.8 12.3 3.0 32.8 48.7 2.6 75.2 20.3
Alaska:1990 550,043 76.5 15.7 4.2 3.7 29.2 52.7 2.8 86.6 23.01995 603,453 75.7 15.7 4.4 4.2 30.0 52.0 NA NA NA
Southeast region:1990 68,989 77.5 18.7 0.6 3.2 31.1 52.4 NA NA NA1995 74,668 77.8 18.0 .8 3.4 33.1 51.8 NA NA NA
Haines Borough:1990 2,117 85.8 13.3 0 0.8 34.2 53.2 2.6 78.5 17.61995 2,295 86.5 12.9 .1 .5 36.5 50.9 NA NA NA
City & Boroughof Juneau:1990 26,751 81.4 13.1 1.1 4.4 31.7 50.8 2.6 89.9 30.71995 28,757 82.2 11.9 1.2 4.7 32.6 50.6 NA NA NA
Ketchikan GatewayBorough:1990 13,828 82.2 13.8 .4 3.6 31.5 52.3 2.7 85.4 20.21995 14,773 83.4 11.9 .5 4.3 33.6 52.0 NA NA NA
Prince of Wales-Outer Ketchikan:1990 6,278 61.7 37.7 .1 .5 30.2 56.5 2.9 77.5 11.41995 6,755 59.7 39.9 0 .3 31.8 54.8 NA NA NA
Sitka Borough:1990 8,588 74.6 21.0 .5 3.9 30.4 52.5 2.8 87.0 21.41995 8,891 74.6 20.1 1.1 4.2 32.9 51.2 NA NA NA
Skagway-Hoonah-Angoon:1990 3,680 62.0 37.2 .2 .7 31.2 55.1 3.0 79.3 15.81995 3,733 62.2 37.5 0 .3 34.4 53.0 NA NA NA
Wrangell-Petersburg:1990 7,042 79.0 19.5 .2 1.3 31.6 53.5 2.8 81.0 19.81995 7,198 79.9 18.6 .3 1.3 34.2 53.0 NA NA NA
Yakutat Borough:1990 705 54.2 44.3 .1 1.4 30.3 54.6 a a a
1995 767 40.8 55.8 .1 3.2 31.6 54.3 NA NA NA
NA = not available.a Yakutat Borough was delineated in 1992, for these 1990 census figures, it is included in the Skagway-Hoonah-Angoon Census Area.Sources: Alaska Department of Labor 1995; U.S. Department of Commerce, Bureau of the Census 1990, 1996.
8
Between 1980 and 1990, southeast Alaska’s population increased at about 2.5 per-cent annually, from just under 54,000 to nearly 69,000 (Alaska Department of Labor1991); this was a slightly lower rate of increase than that of Alaska as a whole (3 per-cent annually). The largest rate of change within the southeast was in the Prince ofWales-Outer Ketchikan Census Area (5 percent increase annually) and the smallestwas in the Sitka Borough (1 percent annually).
Population change is comprised of two components: natural increase (births minusdeaths), which tends to be a fairly stable component; and net migration (inmigration,which is the number of people moving into an area, minus outmigration, the numberof people leaving), which can fluctuate more rapidly. Between 1980 and 1990, about38 percent of southeast Alaska’s population increase was due to net migration, com-pared to about 35 percent of the statewide increase. The pattern differed acrosssoutheast Alaska; in Sitka Borough and the Wrangell-Petersburg Census Area, netmigration was negative (more people moved away than moved in), while populationgrowth due to net migration far outpaced natural increases in the Skagway-Yakutat-Angoon Census Area and Prince of Wales-Outer Ketchikan Census Area.
Between 1990 and 1996, southeast Alaska’s population continued to grow, but at aslower rate (about 1.4 percent annually, compared to the statewide average of 1.9)than in the 1980s (table 2). Growth rates were more uniform at the subregional level.For example, Prince of Wales-Outer Ketchikan increases slowed to just under 2 per-cent annually, although this remained the highest rate except for Yakutat Borough(incorporated in September 1992), which grew at nearly 2.5 percent annually. Dataon migration trends for 1990-96 are not yet available.
The racial mixture of Alaska’s population remained fairly constant between 1990 and1995, with a small decrease in the Caucasian share and small increases in the Black,and Asian and Pacific Islander populations (table 2). The greatest difference betweensoutheast Alaska and the Nation is the proportion of Natives. At the start of the 20thcentury, Native and non-Native populations were about equal in southeast Alaska,and by the 1950s non-Native outnumbered Natives by about a 2:1 ratio. Today,Alaska’s Natives comprise nearly 16 percent of the population statewide and 18 per-cent of southeast Alaska, much larger than the approximately 1 percent proportionnationwide.
Alaska has the second youngest population in the United States and the lowest over-all percentage of females of any state. In line with national trends, Alaska’s medianage increased from 29.2 in 1990 to 30 in 1995. Southeast Alaska also reflects thistrend, with the median age increasing from 31.1 in 1990 to 33.1 in 1995. The medianage in Haines Borough of 36.5 was the highest in Alaska in 1995. The region’s male-to-female ratio also moved closer toward an even split between 1990 and 1995.Areas such as Prince of Wales-Outer Ketchikan Census Area and Yakutat Borough,which have concentrations of jobs traditionally held by males (in logging and fishingcamps), have populations of more than 50 percent male. Table 2 also shows thata higher proportion of the Alaskan population 25 years and older completed highschool or higher education compared to the proportion in the entire United States.The boroughs of southeast Alaska follow this trend, with the largest population ofpeople having higher educations living in the City and Borough of Juneau.
9

Demographic information can describe some aspects of a region’s population butnot its values and lifestyles. Southeast Alaska is a unique and special place to thepeople who live there. Insight into the values and challenges shared by residents wasgained in a recent series of informal meetings held by representatives of the Henry P.Kendall Foundation in five communities. Findings from those meetings, published in areport called “Listening to Communities in Southeast Alaska” (Smith 1996), were lacedwith references to “human dignity, fairness, community/place/home, the economy,inclusiveness/participation, long-term vision, and land and water.” Excerptsdemonstrate the range of values held by southeast Alaska residents:
Southeast Alaskans cherish their place, their closeness to the land, water,mountains, and wildlife—their lifestyles. Personal use of forest and marineresources is considered by many to be a vital component of local culture,lifestyle, and family provisioning [p. 1].
Southeast Alaskan communities seem to prefer a diverse local economy,one that is not dominated by a single corporate employer, native or non-native. Nearly every community is experiencing changes in its leadingeconomic sectors [p. 2].
Many residents want to protect the forest lands, wildlife, and fisheries inthe areas surrounding their own city or village. This (apparently growing)sense of economic and life-style territoriality is expressed in commentsabout logging, hunting, fishing, and tourism [p. 3].
Commercial fishermen express concern over habitat destruction in theTongass, but they seem more interested in issues like access, marketprices, and restrictions imposed to protect Columbia River salmon runs[p. 4].
Several communities are facing the same issues on their own. Examplesinclude tourism planning and passenger (user) levies, solid waste disposal,municipal water, and all of the challenges and problems associated withinvestments in new woods products facilities [p. 5].
There is growing frustration in rural communities/villages among residentswho believe they cannot influence decisions in corporations and govern-mental agencies which control the use of surrounding forests. Some peoplethink that communities need to find a way to develop a vision of their futureand then deliver that message to institutions that dominate their local eco-nomies. There is presently said to be no institution capable of bringingpeople together to search for an acceptable medium to long-term strategyfor Tongass management [p. 3].
10
Regional Conditionsand Trends
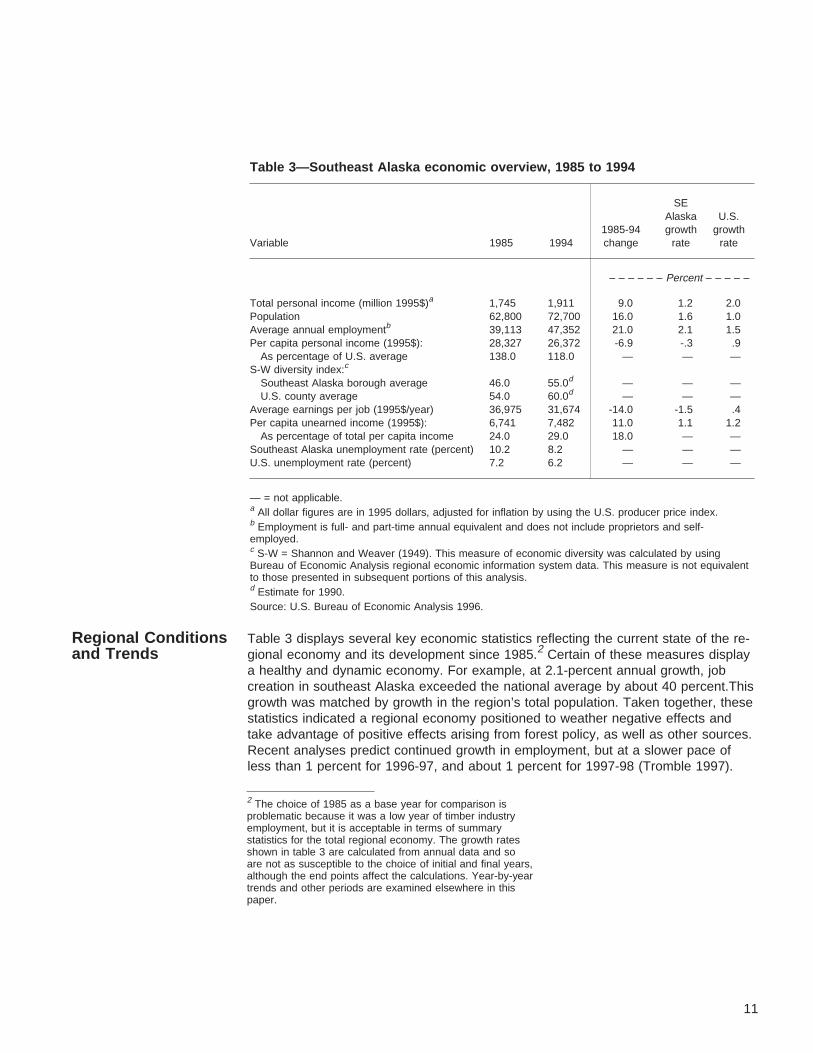
Table 3 displays several key economic statistics reflecting the current state of the re-gional economy and its development since 1985.2 Certain of these measures displaya healthy and dynamic economy. For example, at 2.1-percent annual growth, jobcreation in southeast Alaska exceeded the national average by about 40 percent.Thisgrowth was matched by growth in the region’s total population. Taken together, thesestatistics indicated a regional economy positioned to weather negative effects andtake advantage of positive effects arising from forest policy, as well as other sources.Recent analyses predict continued growth in employment, but at a slower pace ofless than 1 percent for 1996-97, and about 1 percent for 1997-98 (Tromble 1997).
Table 3—Southeast Alaska economic overview, 1985 to 1994
SEAlaska U.S.
1985-94 growth growthVariable 1985 1994 change rate rate
– – – – – – Percent – – – – –
Total personal income (million 1995$)a 1,745 1,911 9.0 1.2 2.0Population 62,800 72,700 16.0 1.6 1.0Average annual employmentb 39,113 47,352 21.0 2.1 1.5Per capita personal income (1995$): 28,327 26,372 -6.9 -.3 .9
As percentage of U.S. average 138.0 118.0 — — —S-W diversity index:c
Southeast Alaska borough average 46.0 55.0d — — —U.S. county average 54.0 60.0d — — —
Average earnings per job (1995$/year) 36,975 31,674 -14.0 -1.5 .4Per capita unearned income (1995$): 6,741 7,482 11.0 1.1 1.2
As percentage of total per capita income 24.0 29.0 18.0 — —Southeast Alaska unemployment rate (percent) 10.2 8.2 — — —U.S. unemployment rate (percent) 7.2 6.2 — — —
— = not applicable.a All dollar figures are in 1995 dollars, adjusted for inflation by using the U.S. producer price index.b Employment is full- and part-time annual equivalent and does not include proprietors and self-employed.c S-W = Shannon and Weaver (1949). This measure of economic diversity was calculated by usingBureau of Economic Analysis regional economic information system data. This measure is not equivalentto those presented in subsequent portions of this analysis.d Estimate for 1990.Source: U.S. Bureau of Economic Analysis 1996.
2 The choice of 1985 as a base year for comparison isproblematic because it was a low year of timber industryemployment, but it is acceptable in terms of summarystatistics for the total regional economy. The growth ratesshown in table 3 are calculated from annual data and soare not as susceptible to the choice of initial and final years,although the end points affect the calculations. Year-by-yeartrends and other periods are examined elsewhere in thispaper.
11

Other statistics shown in table 3, however, indicate a more complex situation. Theregional unemployment rate, for example, is well above the national average andhas remained so since at least 1975. This indicates that higher unemployment is astructural feature of the region’s economy; the “natural” rate of unemployment forsoutheast Alaska is higher than the national average.3 The unemployment rate seemsto be tracking the national average more closely in recent years, perhaps the resultof increased economic diversification and opportunity in the region.
Given the relative youth of the region’s population, the seasonal nature of muchresource-related employment, and the mixed cash-subsistence economy, it is notsurprising that southeast Alaska residents find themselves between jobs more fre-quently or for longer periods do than other U.S. citizens. Many southeast Alaska resi-dents may be willing to accept economic hardship or uncertainty to remain becauseof the unique lifestyles still possible. The Alaska Public Survey (Alves 1979) foundthat southeast Alaska residents (and other Alaskans) rated “being close to a wilder-ness environment” and “living near the water and recreation opportunities” as moreimportant than “long term economic opportunities” as reasons for moving to or re-maining in the region (although recent migrants cited “a challenging job” more fre-quently than did long-time residents).
A measure of economic diversity, the Shannon-Weaver (S-W) diversity index (Attaran1986, Shannon and Weaver 1949) is provided in table 3.4 Economic diversity, a goalof many communities historically dependent on a single industry (or even a singlecompany) for a large proportion of employment, correlates with other positive econo-mic indicators (Ashton and Pickens 1995, Forest Ecosystem Management Assess-ment Team [FEMAT] 1993). The index is best viewed as a relative measure used tocompare communities within a region or one region to another. It does not measurethe strength or size of an economy and thus should be used in conjunction with othereconomic indicators.
The S-W index for southeast Alaska boroughs and census areas indicated that theseareas tend to fall well below national averages in terms of economic diversification.Over 90 percent of all U.S. counties reported a higher diversity index than the south-east Alaska average in 1985 (calculated by using a standard deviation of 0.06 for allU.S. counties). In 1990, 83 percent of U. S. counties scored higher than the southeastAlaska average (standard deviation of 0.05), indicating that the region’s economy
3 The official unemployment rate does not include peoplenot covered by unemployment insurance, such as self-employed individuals or fishers. This definition also excludespeople who have made no attempt to find work recently, suchas discouraged workers or people who do not want to work.In other words, the official unemployment rate does notrepresent the actual number of people currently notemployed, especially in rural areas (Boucher 1996).
4 This analysis measures the percentage of employmentwithin an industry sector relative to the total. If employmentis evenly distributed across all industry sectors, the S-Windex will yield a maximum score (100 percent). In econo-mies with substantial concentration in a single sector, theS-W score will be relatively low.
12

has diversified but is still significantly less so than the national average. Economicdiversity is highly correlated with population density. Most of the communities ofsoutheast Alaska are characterized by low populations (relative to towns and cities inthe lower 48 States) and a high degree of isolation, and thus are unable to supportthe specialized industries found in a more diversified economy.
Total personal income in southeast Alaska presents an ambiguous picture. It in-creased at an annual rate of 1.2 percent from 1985 to 1994, but this rate is 38 per-cent below the national average. When combined with a growing population, the netresult is an actual decline in per capita personal income for the region. Residents ofsoutheast Alaska still earn more, on average, than the general U.S. population, butthe difference has fallen from 138 percent of the national average in 1985 to just 118percent in 1994. A decline in average real wages is the primary cause of decreasingper capita income. Real average earnings per job have declined at an annual rate of1.5 percent, falling from $36,975 in 1985 to $31,674 in 1994. When the higher costof living faced by consumers in southeast Alaska is taken into account, it is hard toargue that residents of the region are economically better off than other U.S.residents.
Table 3 also reports changes in unearned income, such as transfer payments andreturns on investments, an increasingly important component of personal income inlocal economies throughout the United States. Unearned income can be viewed asequivalent to basic industries; because the source of these payments lies outside theregion, they represent new money coming into the region and therefore have an as-sociated multiplier effect. Between 1985 and 1994, real per capita unearned incomeincreased at an average of 1.1 percent annually, a rate roughly equivalent to the na-tional average of 1.2 percent (U.S. Bureau of Economic Analysis 1996). In 1994, un-earned income comprised 29 percent of total income in southeast Alaska, comparedto 33 percent of income nationwide. Sources of transfer payments for southeastAlaska residents include income maintenance (4 percent of unearned income; thisincludes food stamps, aid to families with dependent children, and other assistanceprograms); unemployment insurance (3 percent); dividends, interest, and rent (47 per-cent of unearned income); and retirement and other (46 percent): these proportionswere comparable to national proportions.
Residents of Alaska also receive transfer payments from the state that are notcommon in the lower 48. The State of Alaska, which no longer has a state incometax, pays each resident an annual sum under the Permanent Fund Dividend Programbased on investments made from state oil revenues. The average payment over the15 years of the program has been $796, ranging from a low in 1984 of $331 perperson, to a high in 1996 of $1,131 per person. Alaska residents who were 65 yearsor older before 1996 are eligible for further state assistance in the form of longevitybonus payments. The latter program pays a monthly amount to residents 65 or olderto encourage them to remain in Alaska during retirement. The program no longeraccepts new applicants as of December 1996, but all who qualify will continue toreceive payments for the rest of their lives or until they move out of Alaska. For thosewho qualified in 1990 or earlier, the bonus is $250 per month, dropping to $100 permonth for those qualifying in 1996. This same population also qualifies to live in a“pioneer home,” a state-operated, full care facility, with payment based on individualincome.
13

Table 4—Southeast Alaska employment by sector, 1985 to 1995
Employment Share of total1985-95 1995 share
Sectora 1985 1995 1985 1995 change relative to U.S.
Annual equivalent – – – – – – – – Percent – – – – – – – –
Agricultural production 0 0 0 0 — —Mining 44 189 1 1 333 -16Construction 1,665 1,620 6 5 -3 -10Total manufacturing 3,234 4,027 11 11 25 -14Retail trade 4,182 6,098 14 17 46 2Wholesale trade 370 507 1 1 37 -70Financial, insurance, real estate 1,112 1,311 4 4 18 -50Services 4,389 6,496 15 18 48 -38Transportation and public utilities 2,032 2,771 7 8 36 64Agriculture, forestry, fishing services 162 282 1 1 75 -35Federal Government 2,075 1,939 7 6 -7 46Other government 9,898 10,182 34 29 3 157
Totalb 29,162 35,422 — — 21 —
— = not applicable.a Sectors defined according to Standard Industry Classification Manual, 1987:Agricultural production includes farms, orchards, greenhouses, and nurseries primarily engaged in the production of crops, plants, vines, andtrees (excluding forestry operations).Mining includes the extraction of minerals occurring naturally, quarrying, well operations, milling, preparation at the mine site, and explorationand development of mineral properties.Construction includes new work, additions, alterations, reconstruction, installations, and repairs of structures.Total manufacturing includes the processing of materials (products of agriculture, forestry fishing, mining, and quarrying) into new products.Examples include food, textiles, lumber, wood products, furniture, paper, machinery, and appliances.Retail trade includes selling goods for personal or household consumption and rendering services incidental to the sale of the goods. Examplesinclude groceries, hardware, drug store, and other specialty stores.Wholesale trade includes selling goods to retailers or other wholesalers. Wholesalers maintain inventories of goods, extend credit; physicallyassemble, sort, and grade goods in large lots, break bulk goods into smaller lots and advertise.Finance, insurance, and real estate includes business that operate in the fields of finance, insurance, and real estate, such as banks,investment companies, insurance agents and brokers; real estate buyers, sellers, and developers.Services includes businesses engaged in providing a wide variety of services for individuals, business, government, and other organizations.Examples include hotels; health, legal, engineering, and professional services; and educational institutions.Transportation and public utilities includes passenger and freight transportation, communications services, electricity, gas, steam, water andsanitary services and all establishments of the United States Postal Service.Agricultural, forestry, and fishing services includes businesses engaged in agricultural production, forestry, commercial fishing, hunting andtrapping, and related services.Federal and other government includes all Federal, state, and local government employees involved in executive, legislative, judicial,administrative and regulatory activities.b Employment is full- and part-time annual equivalent and excludes proprietors and self-employed. Source: Alaska Department of Labor 1996.U.S. Bureau of Economic Analysis 1996.
14
Another type of income unique to Alaska, but not supplied by the state, comes fromNative corporation activities. The Alaska Native Claims Settlement Act of 1971(ANCSA; U.S. Laws, Statutes 1971) extinguished aboriginal claims to Alaska in returnfor about $1 billion and 44 million acres of land. Under ANCSA, the land and moneywere distributed to 13 regional Native corporations, which distributed about half themoney to village corporations and shareholders. Sealaska was established as theregional corporation in southeast Alaska, along with two urban corporations and 10village corporations. A recent report (McDowell Group 1997) estimated that southeastAlaska’s ANCSA corporations accounted for more than 1 out of 10 private sectorjobs in southeast Alaska (through direct and indirect employment combined). Thecorporations distributed about $47 million in dividends in 1996, $27 million to south-east Alaska residents; during the past 5 years, dividends averaged $22,000 pershareholder. The report also documented the corporations’ support of scholarships,social service organizations, cultural heritage groups, and nonprofit agencies.
Southeast Alaska employment by sector is shown in table 4. Services and retailtrade have contributed a growing share of the region’s total employment, increasingfrom 29 percent of total employment in 1985 to 36 percent in 1995. Nonetheless, theshare of retail employment is currently quite close to the national average and ser-vices are still largely underrepresented. Jobs in these sectors have by no meansbeen replacing jobs in the manufacturing sector, where a 2.2-percent annual growthrate is evident and the share of southeast Alaska total employment has remainedstable at about 11 percent. Declines in share are concentrated in the governmentsector where growth in employment has been limited. Recent forecasts suggest thatgrowth through 1998 could be strongest in mining and construction sectors, whiledeclines are expected to continue in the manufacturing, forest products, and stategovernment sectors (Tromble 1997). Other sectors are expected to remain stableor show slight increases.
Table 4 displays industrial sector employment shares relative to the U.S. average.Wholesale trade, F.I.R.E. (finance, insurance, and real estate), and services arelargely underrepresented in southeast Alaska, reflecting the lack of economies ofscale in the region and the propensity to import these goods and services from thelower 48 States. Manufacturing is also underrepresented, but to a lesser extent.This is the result of certain basic industries (primarily wood products and commer-cial fishing) partially offsetting a less developed manufacturing base. Government andtransportation, on the other hand, far exceed their representation in the U.S. economyat large. In the first instance, the location of the state capital in Juneau is a primarydeterminant, but relatively higher proportions of government employment also arepresent in the other communities of southeast Alaska. The high share of transporta-tion arises, for the most part, from the importance of air and water traffic in a regionlacking an interconnected road system.
15

Table 4, and much other employment data reported by the Alaska Department ofLabor (ADOL) and other relevant agencies, includes only nonagricultural wage andsalary (NAWS) employment, which excludes self-employed individuals and thus omitsa substantial proportion of regional total employment; sufficiently detailed statistics ontotal employment are generally unavailable. In 1994, the difference between total andNAWS employment (with salmon harvesting included) was estimated at 10,289 jobs,with NAWS jobs accounting for 78 percent of total regional employment. This percent-age is substantially lower than the U.S. average of 85 percent, indicating that south-east Alaska residents are more apt to be self-employed. Several reasons may under-lie this tendency. First, much of the tourism industry is comprised of small businessesin which self-employed proprietors account for a large share of total employment.Second, because halibut, crab, and other nonsalmon fishing are not included in ourestimates, they are counted in the self-employed category. Third, logging often em-ploys a large number of independent contractors, although this practice is not asprevalent in southeast Alaska as in the lower 48 States.
This snapshot of the regional economy describes both strengths and weaknesses re-lative to the whole of the United States. Growth in employment opportunities is higherthan in much of the rest of the country, but so is growth in the local population. Whencombined with the fact that much of the new job creation has occurred in lower paidretail and service sectors, the result is a steady erosion in average wages and percapita income. Nonetheless, current per capita income is still significantly higher thanthe national average, and much of the new job creation in the region is occurring inlocally underrepresented industries. Were the regional economy to grow at its recentpace, it might eventually more closely resemble that of the United States at large.This could mean a further diminution of per capita income, but also increased eco-nomic diversification and resiliency and a decline in unemployment rates to levelsmore closely matching the rest of the country. Projections of lower growth rates forthe upcoming year (1998) suggest uncertainty regarding these results.
Tongass NationalForest-Related RegionalEconomy
The Tongass National Forest supplies southeast Alaska (and the Nation) with re-sources ranging from traditional commodities, such as salmon and timber, to moreintangible goods and services such as recreational opportunities and scenery. Indus-tries based on natural resources comprise a comparatively large proportion of theregional economy. Consequently, policy decisions affecting the potential supply ofcertain outputs (such as timber or recreational opportunities) have relatively largeimpacts. At the same time, forces outside the control of the Forest Service alsoinfluence the system, such as world market prices, national and international competi-tion for providing products and services, demographic trends and consumer prefer-ences, and trends in climate that affect natural resource conditions.
One example of this influence is evident in timber policies. In recent years, theTongass has accounted for slightly less than half of the total regional timber harvest,with harvests from private lands accounting for nearly all the rest. Private land har-vests are an important determinant of logging employment. Local mills have beenunsuccessful, however, in bidding for logs that have instead gone to the exportmarket, so an overwhelming majority of saw-log quality timber from private lands isexported in raw-log form. This leaves the Forest Service as the sole supplier of logsto local mills and creates an ambiguous policy picture; mill owners have identifiedcertain aspects of Forest policy as a barrier to their further development (and sur-vival), yet have relied on other aspects of Federal policy for their existence.
16

There also is a complex relation between the Tongass and the tourism industry. TheNational Forest provides most, but by no means all, of the recreational and tourismopportunities and amenities on which the industry relies; however, the majority ofsoutheast Alaska tourists arrive on cruise ships and have the Inside Passage as theirdestination. Forest Service policies provide much of the scenery and habitat for wild-life that are viewed or hunted and contribute to the fish that are caught by tourists,but it is difficult to determine at what point a change in policy would cause a changein tourist behavior. Similarly, salmon populations and thereby the salmon fishing andprocessing industries depend on numerous factors. The importance of Tongass man-agement is recognized, but the specific percentage of contribution can only be esti-mated. The Tongass obviously plays a central role in the fortunes of southeastAlaska’s resource-dependent industries but, as these examples illustrate, it is nottheir sole determinant.
Management of the Tongass also contributes greatly to the subsistence lifestylesand mixed economy of rural southeast Alaska. It is beyond the scope of this paperto thoroughly describe subsistence and its economic, psychological, social, andcultural benefits, but the economy of southeast Alaska cannot be described withoutunderstanding subsistence. Rural Alaska communities generally have integratedthree-sector economies composed of public, private, and subsistence sectors (Glassand others 1995). The public sector provides substantial employment opportunitiesin local, state, and Federal government and many types of services. It also spurslocal employment through capital investment, and provides transfer payments, someof which are unique to Alaska. The private sector provides jobs, investment oppor-tunities, and marketed goods and services. The subsistence sector provides naturalresources that supplement income, often substantially. The three sectors interact inmany ways, so it is difficult to separate the contributions of each sector to social andeconomic well-being and the quality of life in rural Alaska (Glass and others 1995).5
This section describes employment and income for the region’s natural resource-related industries because they are most likely to be directly affected by policydecisions on management of the Tongass National Forest. These include woodproducts, seafood harvesting and processing, recreation and tourism, and mining.6
An overview of subsistence and its role in the mixed economy of rural southeastAlaska is included.
The primary statistical source for natural resource employment data is ADOL, whichpublishes employment figures based on unemployment insurance contribution reportsfiled by state employers, as well as other sources. In these data, recreation and tour-ism is not reported as a separate industry. Employment within this sector is distri-buted across various industry categories, particularly the service sector. For this pa-per, recreation and tourism jobs were derived by using the impact analysis for plan-ning (IMPLAN) regional-level input-output model developed by the Forest Service(Taylor and others 1993). For the recreation and tourism industry, as well as for com-mercial fishing, the methodologies used are further described in the industry-specificsubsections below.
5 Subsistence will be the subject of future publicationsfollowing collection of more up-to-date information onpatterns of subsistence harvest in southeast Alaska (begunearly in 1997 by the Alaska Department of Fish and Game).
6 Mining is not addressed in equivalent detail because newdevelopment is less directly linked to Forest Service policy.
17
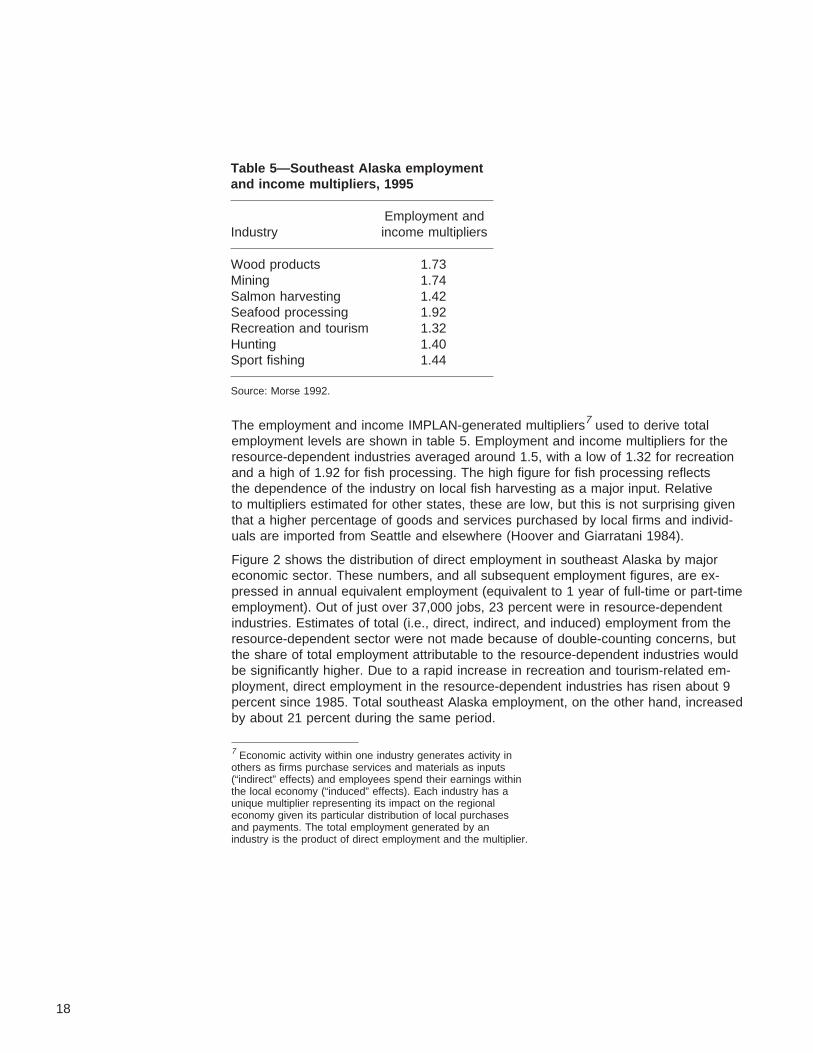
The employment and income IMPLAN-generated multipliers7 used to derive totalemployment levels are shown in table 5. Employment and income multipliers for theresource-dependent industries averaged around 1.5, with a low of 1.32 for recreationand a high of 1.92 for fish processing. The high figure for fish processing reflectsthe dependence of the industry on local fish harvesting as a major input. Relativeto multipliers estimated for other states, these are low, but this is not surprising giventhat a higher percentage of goods and services purchased by local firms and individ-uals are imported from Seattle and elsewhere (Hoover and Giarratani 1984).
Figure 2 shows the distribution of direct employment in southeast Alaska by majoreconomic sector. These numbers, and all subsequent employment figures, are ex-pressed in annual equivalent employment (equivalent to 1 year of full-time or part-timeemployment). Out of just over 37,000 jobs, 23 percent were in resource-dependentindustries. Estimates of total (i.e., direct, indirect, and induced) employment from theresource-dependent sector were not made because of double-counting concerns, butthe share of total employment attributable to the resource-dependent industries wouldbe significantly higher. Due to a rapid increase in recreation and tourism-related em-ployment, direct employment in the resource-dependent industries has risen about 9percent since 1985. Total southeast Alaska employment, on the other hand, increasedby about 21 percent during the same period.
Table 5—Southeast Alaska employmentand income multipliers, 1995
Employment andIndustry income multipliers
Wood products 1.73Mining 1.74Salmon harvesting 1.42Seafood processing 1.92Recreation and tourism 1.32Hunting 1.40Sport fishing 1.44
Source: Morse 1992.
7 Economic activity within one industry generates activity inothers as firms purchase services and materials as inputs(“indirect” effects) and employees spend their earnings withinthe local economy (“induced” effects). Each industry has aunique multiplier representing its impact on the regionaleconomy given its particular distribution of local purchasesand payments. The total employment generated by anindustry is the product of direct employment and the multiplier.
18

The differential rates of growth in resource-dependent jobs and total employment hasbeen reflected in a recent gradual decline in the share of resource-dependent indus-tries in southeast Alaska’s total employment mix (fig. 3). The 23-percent share of re-source-dependent employment in 1995, however, is still higher than the 22 percentrecorded in 1984, a low year for timber employment. Direct employment shares of thevarious resource-dependent industries within the resource sector total are displayedin figure 4. Salmon harvesting and fish processing together account for 40 percent ofthe total, followed by recreation and tourism (including hunting and sportfishing; 34percent), wood products (24 percent), and mining (2 percent). The distribution of totalemployment (using the multipliers mentioned above) differs due to the multipliers at-tached to each industry. While the share of total employment related to recreation andtourism declines due to its relatively small multiplier, the total share of wood productsemployment increases. Relative changes in share for the salmon harvesting andprocessing sector total employment are ambiguous; the complementary nature of thesector’s two industries means that indirect effects from each cannot be summed toestimate a total. Income shares also differ among the industries because jobs in woodproducts and mining pay more.
The average annual earnings shown in table 6 roughly correspond to the wage ratefor each industry (expressed in annual equivalents). Mining, followed by wood pro-ducts, occupies the high end; these two industries are, respectively, 100 percent and48 percent higher than the average for the region. Estimates for tourism and recrea-tion also are slightly higher than the regional average. At $26,074, seafood processingprovides the lowest annual wage of the five industries (profits to fishing permit holdersare not included in the fish harvesting earnings, and the earning figures do not reflecttotal income of fishing industry participants).
Figure 2–Distribution of 1995 southeast Alaska direct employment by major sector. Resource-dependent industries include paper and wood products, mining, salmon harvesting and seafoodprocessing, and recreation and tourism. All employment figures are standardized to annualequivalent and include an estimate of those self-employed in salmon harvesting. Sources:Alaska Commercial Fisheries Entry Commission 1996, Alaska Department of Labor 1996a,USDA Forest Service 1996b.
19

Figure 3–Total and resource-dependent employment in southeast Alaska, 1980-94. Resource-dependentindustries include paper and wood products, mining, salmon harvesting and seafood processing, andrecreation and tourism. All employment figures are standardized to annual equivalent and include anestimate of those self-employed in salmon harvesting. Sources: Alaska Commercial Fisheries EntryCommission 1996, Alaska Department of Labor 1996s USDA Forest Service 1996b.
Figure 4–Distribution of 1995 southeast Alaska direct employmentwithin resource-dependent industries. Resource-dependent industriesinclude paper and wood products, mining, salmon harvesting andseafood processing, and recreation and tourism. All employmentfigures are standardized to annual equivalent and include anestimate of those self-employed in salmon harvesting. Sources:Alaska Commercial Fisheries Entry Commission 1996, AlaskaDepartment of Labor 1996a, Morse 1992, USDA Forest Service1996b.
20

Although not included in table 6, the proportion of Federal Government employmentcomprised by the Forest Service (and other resource management agencies) alsocould be considered resource dependent. Forest Service employment within a com-munity might be considered a basic industry, because the salaries come from outsidethe region. In 1995, Forest Service employment accounted for at least 45 percent ofthe Federal Government employment in southeast Alaska, although the level of em-ployment has been declining. Government wages are a steady source of income, tendto be above average, and in Alaska, include a 25-percent, tax-free cost-of-living ad-justment. Employees are concentrated in communities with Regional, Forest, andDistrict offices. The Ketchikan Administrative Area has the most employees (full-timeequivalents [FTEs]) with offices in Ketchikan, Thorne Bay, and Craig. The ChathamAdministrative Area has offices in Juneau, Sitka, Hoonah, and Yakutat. The StikineAdministrative Area, with the smallest workforce, has offices in Petersburg andWrangell. The Regional Office, which currently employs about 200 FTEs, is in Juneau.
Table 6—Southeast Alaska 1995 employment and earnings for resource-dependent industries
Individuals employed Employee earningsa
1995 direct Change SE AK 1995 total 1995 direct SE AK 1995 average 1995 totalIndustry employment 1985-95 total employment earnings total annual earnings earnings
Annual Annual Million Millionequivalent – – Percent – – equivalent 1995$ Percent 1995$ 1995$
Wood products 2,070 2 6 3,584 92 8 44,542 160Mining 189 -10 1 329 12 1 60,971 20Recreation and tourismb 2,941 22 8 3,888 93 8 31,773 124Salmon harvesting 1,855 -4 5 2,634 49 4 26,418 70Seafood processing 1,648 14 4 3,164 43 4 26,074 83
Total, resource-dependent 8,703 9 23 c 289 25 33,224 c
Southeast Alaska total 37,307 21 100 37,307 1,153 100 30,914 1,153
a All dollar figures are in 1995 dollars, adjusted for inflation by using the U.S. producer price index.b Recreation and tourism employment and earnings estimated from 1990 levels (derived from USDA Forest Service, Alaska Region, IMPLANmodel [Morse 1992]) by using historical recreation use on the Tongass as an index.c Total resource-dependent employment and income is omitted because of inability to sum resident and nonresident recreation and tourismmeasures.Sources: Alaska Commercial Fisheries Entry Commission 1995, Alaska Department of Labor 1996a, Morse 1992.
21

Two other characteristics of employment are relevant to southeast Alaska: non-resident share and seasonal variation. Nonresident shares for southeast Alaska totalemployment and direct employment in the resource-dependent industries are shownin figure 5. Nonresident shares help to indicate how much of the benefits generatedby an industry are likely to leave the region. At 44 percent, the share of nonresidentsin the resource sector is about twice that for all industries within the region. This re-sults mostly from the high proportion of nonresidents working in the seafood proc-essing sector and the recreation and tourism sector. Other sectors, particularly mining,are substantially lower but, with the exception of hunting-related employment, all arehigher than the regional average.
Subsectors within these broad categories may differ. Within the wood products sectorstatewide, employment in lumber and wood manufacturing has had a much higherproportion of nonresident employment than has the pulp industry (Hadland 1996).Alaska Pulp Corporation, for example, employed just 18 percent nonresidents in 1994(Alaska Department of Labor 1996b).
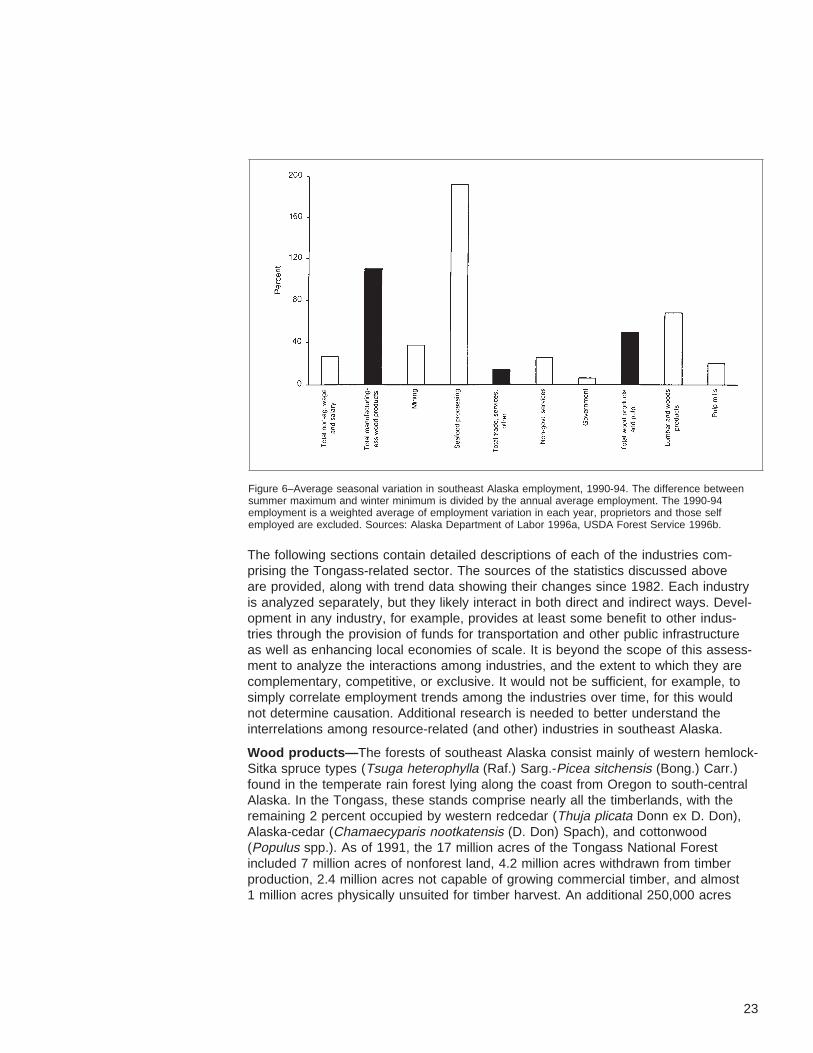
The seasonality of employment is another factor in southeast Alaska, where the dif-ference between levels of employment in summer and winter is quite pronounced.Figure 6 shows one measure designed to capture seasonal variation (monthly statis-tics were not available for many of the resource-dependent industries discussed). Apattern similar to that of nonresident employment is apparent, with seafood processingshowing an extremely high degree of seasonal variation (salmon harvesting can beassumed to display comparable but somewhat smaller figures due to increased pre-paration time). Although not reported here, it is safe to assume that tourism and rec-reation shows a high degree of seasonal variability; cruise ships, the travel methodfor a majority of southeast Alaska tourists, operate only from May through September.With the exception of pulp mills, the mining and wood products industries also showa higher variation in seasonality than the regional average.
Figure 5–Nonresident share of direct employment in southeast Alaska, 1994. All employment figures arestandardized to annual equivalent and include an estimate of those self-employed in salmon harvesting.Sources: Alaska Commercial Fisheries Entry Commission 1996, Alaska Department of Labor 1996b, USDAForest Service 1996b.
22
The following sections contain detailed descriptions of each of the industries com-prising the Tongass-related sector. The sources of the statistics discussed aboveare provided, along with trend data showing their changes since 1982. Each industryis analyzed separately, but they likely interact in both direct and indirect ways. Devel-opment in any industry, for example, provides at least some benefit to other indus-tries through the provision of funds for transportation and other public infrastructureas well as enhancing local economies of scale. It is beyond the scope of this assess-ment to analyze the interactions among industries, and the extent to which they arecomplementary, competitive, or exclusive. It would not be sufficient, for example, tosimply correlate employment trends among the industries over time, for this wouldnot determine causation. Additional research is needed to better understand theinterrelations among resource-related (and other) industries in southeast Alaska.
Wood products— The forests of southeast Alaska consist mainly of western hemlock-Sitka spruce types (Tsuga heterophylla (Raf.) Sarg.-Picea sitchensis (Bong.) Carr.)found in the temperate rain forest lying along the coast from Oregon to south-centralAlaska. In the Tongass, these stands comprise nearly all the timberlands, with theremaining 2 percent occupied by western redcedar (Thuja plicata Donn ex D. Don),Alaska-cedar (Chamaecyparis nootkatensis (D. Don) Spach), and cottonwood(Populus spp.). As of 1991, the 17 million acres of the Tongass National Forestincluded 7 million acres of nonforest land, 4.2 million acres withdrawn from timberproduction, 2.4 million acres not capable of growing commercial timber, and almost1 million acres physically unsuited for timber harvest. An additional 250,000 acres
Figure 6–Average seasonal variation in southeast Alaska employment, 1990-94. The difference betweensummer maximum and winter minimum is divided by the annual average employment. The 1990-94employment is a weighted average of employment variation in each year, proprietors and those selfemployed are excluded. Sources: Alaska Department of Labor 1996a, USDA Forest Service 1996b.
23

were made unavailable to harvest between 1991 and 1996 because of policychanges, new information, and ownership adjustments, leaving about 2.3 millionacres tentatively suitable for timber production (USDA Forest Service 1996b). Thisdoes not mean that all these lands will be harvested; that will be decided throughongoing management processes.
Southeast Alaska’s wood products mix has included dissolving pulp, logs, cants,dimension lumber, wood chips, and a small but growing volume of specialty products.Overall, most of southeast Alaska’s pulp production and a substantial majority of itslumber has been shipped overseas, with some 30 nations represented among thepurchasers. Until the 1997 closure of the Ketchikan Pulp Company mill at Ward’sCove near Ketchikan, dissolving wood pulp constituted a major (if not the major) woodproduct export for the region. Exclusive of Canada-U.S. trade, Alaska accounts forabout 8 percent of the softwood logs moving into Pacific Rim markets and about 4percent of the softwood lumber.
The vast majority of the region’s harvests come from two ownerships: the TongassNational Forest and Native corporations. On average, over the 1983-to-1995 period,these two ownerships accounted for 45 and 52 percent, respectively, of total harvests,with private harvests exceeding those from the Tongass National Forest by an aver-age of 14 percent. Consequently, the Tongass cannot be seen as the sole drivingforce in the region’s timber economy. Future levels in Native corporation harvestsshould be incorporated into predictions regarding evolution of the wood productsindustry, or at least that of the logging sector.
Timber from the Tongass National Forest and from Native corporation lands flows intoessentially different markets. While Sitka spruce and western hemlock saw logs (theregion’s mainstay species) from the Tongass must be processed locally (in responseto law reflecting concern for keeping timber jobs in Alaska), Native corporations faceno such constraint, and sell a majority of their timber as raw-log exports because ofthe higher prices paid by that market. Consequently, changes in Native corporationharvests are reflected primarily in changes in log exports.
Figure 7 shows southeast Alaska harvests by owner since 1983. Harvest levels rangefrom about 600 million board feet (MMBF) in 1983, to peak levels of just under 1,000MMBF in 1989 and 1990, and then to a period low of 497 MMBF in 1995. This patternis similar to that in the Pacific Northwest, where a global recession in the wood prod-ucts industry depressed output in the early to mid 1980s. This was followed by aboom and then subsequent declines in harvests, in spite of rising prices, due tosupply constraints. The variability is striking but not that unusual in industries proneto cycles.
As is clear from trends in recent harvest levels, timber supply on Native corporationlands is declining. It is widely assumed that Native corporation harvests will continueto decline, stabilizing at a level of around 100 MMBF at the start of the 21st century(Brooks and Haynes 1994). Under this assumption, continued declines in forest sectoremployment and revenue, particularly in logging and log export-related services, areinevitable unless harvests from the Tongass make up the approximate 100 MMBFdifference between 1994 Native corporation harvests and the predicted equilibriumlevel. Future reductions in the availability of timber from private suppliers in southeastAlaska may increase pressure to harvest timber from the Tongass National Forest.
24

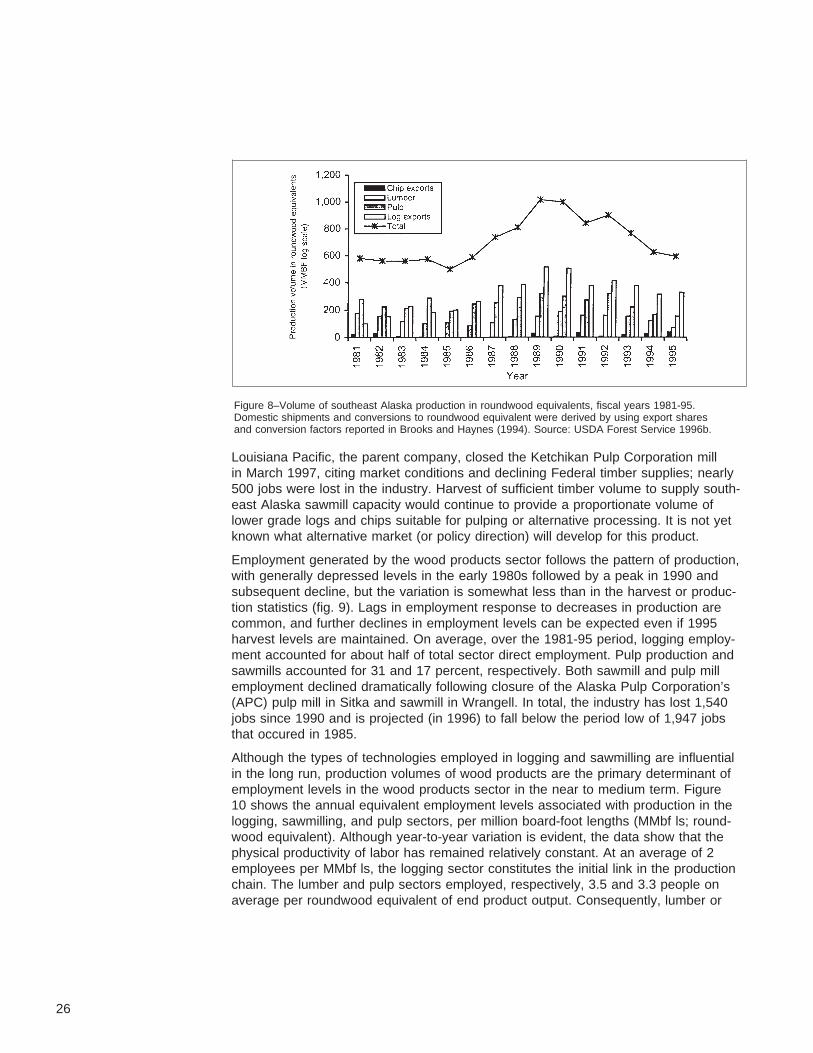
Total volumes of wood products produced in southeast Alaska are shown in figure 8.8
For comparability, all production units have been converted to round-wood equiva-lents (MMBF log scale); roundwood is defined as the amount of raw material inputneeded to produce the reported volume of output. Comprising 43 percent of total pro-duction in the 1981-95 period, log exports were, on average, the largest componentof southeast Alaska’s production by volume. At 36 percent, pulp production was thesecond largest component of production and has been far more stable than log ex-ports. On average, 19 percent of Native corporation harvests have been used in pulpproduction. Similarly, an average of 17 percent of Tongass National Forest logs wereclassified as utility grade and more likely to be used for pulp. This does not neces-sarily indicate the amount of timber dedicated to pulp production, because lowergrade saw logs also were chipped for pulp and some utility grade logs were sawn,depending on market conditions.
Lumber is the smallest component of total production (19 percent), although saw-mill residuals from lumber also have constituted a major source of chips for pulp. In1994, for example, mill residues supplied an estimated 102,000 tons of chips to theregional market, or about one quarter of southeast Alaska’s 429,000 tons of total chipsupply. Logs chipped by sawmills provided another 67,000 tons. These data highlightthe complementary relation between lumber production and local chip markets.
Figure 7–Southeast Alaska total timber harvest by ownership, fiscal years 1983-95. Source: USDA ForestService 1996b.
8 The primary source for this figure was fiscal year exportvolumes for the State of Alaska as reported by the USDAForest Service (1996a). Calendar year data on exports byport were used to estimate southeast Alaska’s share in totalstate exports, and these shares were used to scale the fiscalyear data. The resulting figures represent an estimate ofsoutheast Alaska’s exports based on state totals. Totalvolumes were obtained by adding estimates for domesticshipments derived from export shares (Brooks and Haynes1994). In the final step, roundwood equivalents wereproduced by using conversion factors, also given in Brooksand Haynes (1994).
25
Louisiana Pacific, the parent company, closed the Ketchikan Pulp Corporation millin March 1997, citing market conditions and declining Federal timber supplies; nearly500 jobs were lost in the industry. Harvest of sufficient timber volume to supply south-east Alaska sawmill capacity would continue to provide a proportionate volume oflower grade logs and chips suitable for pulping or alternative processing. It is not yetknown what alternative market (or policy direction) will develop for this product.
Employment generated by the wood products sector follows the pattern of production,with generally depressed levels in the early 1980s followed by a peak in 1990 andsubsequent decline, but the variation is somewhat less than in the harvest or produc-tion statistics (fig. 9). Lags in employment response to decreases in production arecommon, and further declines in employment levels can be expected even if 1995harvest levels are maintained. On average, over the 1981-95 period, logging employ-ment accounted for about half of total sector direct employment. Pulp production andsawmills accounted for 31 and 17 percent, respectively. Both sawmill and pulp millemployment declined dramatically following closure of the Alaska Pulp Corporation’s(APC) pulp mill in Sitka and sawmill in Wrangell. In total, the industry has lost 1,540jobs since 1990 and is projected (in 1996) to fall below the period low of 1,947 jobsthat occured in 1985.
Although the types of technologies employed in logging and sawmilling are influentialin the long run, production volumes of wood products are the primary determinant ofemployment levels in the wood products sector in the near to medium term. Figure10 shows the annual equivalent employment levels associated with production in thelogging, sawmilling, and pulp sectors, per million board-foot lengths (MMbf ls; round-wood equivalent). Although year-to-year variation is evident, the data show that thephysical productivity of labor has remained relatively constant. At an average of 2employees per MMbf ls, the logging sector constitutes the initial link in the productionchain. The lumber and pulp sectors employed, respectively, 3.5 and 3.3 people onaverage per roundwood equivalent of end product output. Consequently, lumber or
Figure 8–Volume of southeast Alaska production in roundwood equivalents, fiscal years 1981-95.Domestic shipments and conversions to roundwood equivalent were derived by using export sharesand conversion factors reported in Brooks and Haynes (1994). Source: USDA Forest Service 1996b.
26

pulp exporting employed about 5.5 persons in the logging and processing sectors.Additional employment is generated in a number of other related sectors (such asshipping and handling). Reliable estimates of these numbers were not made forthis assessment but they would be included in the 1.72 multiplier for the woodproducts sector.
Figure 9–Southeast Alaska wood products sector direct employment by type, fiscal years 1991-95.Source: USDA Forest Service 1996b.
Figure 10–Average annual employment per wood product output in southeast Alaska, 1981-95.Sources: Alaska Department of Labor 1996a, USDA Forest Service 1996b.
27
Both the direct link between employment and output shown in figure 10 and theindirect links assumed in the multiplier are more robust at the regional level wherethe law of averages more generally applies. At local levels, on the other hand, largedeviations from average levels can be expected. This deviation is especially apparentwith sawmills; mill openings and closures result in abrupt changes in employmentrather than the smooth fluctuations implied in the regional average-jobs-per-volumeestimates.
Commercial fishing and seafood processing —Fish and aquatic resources of theTongass National Forest provide major subsistence, commercial and sport fisheries,as well as traditional and cultural values. The Forest includes about 45,000 milesof known streams, and 20,900 lakes and ponds. Anadromous fish habitat includes10,800 stream miles and 4,100 lakes and ponds. Most of the Forest’s streams andrivers empty into bays or estuaries, which are important during some life stages ofanadromous species as well as for many saltwater species. These aquatic systemsof the Tongass provide spawning and rearing habitats for the majority of fish producedin southeast Alaska.
Commercial fish harvest has fluctuated over the years, averaging 50 million fishannually in the late 1930s, but declining to 20 million in 1950 and then to 6 millionin 1975. Since 1975, however, the trend is upwards, with 60 million fish caught insoutheast Alaska in 1985, a record 76 million in 1994, and new records since. Fluc-tuations in commercial harvest trends are partly attributable to changes in oceanproductivity. The productivity of marine waters in the Gulf of Alaska, and the survivalof salmon are both highly variable and cyclic. Since the mid-1970s, favorable oceancurrents have resulted in high productivity and, consequently, high marine survival ofsalmon (Anadromous Fish Habitat Assessment Team 1995). Releases of hatcheryjuvenile salmon also have increased substantially, from 20 million in 1980 to 500million in 1991.
Although the profitability of the seafood industry in southeast Alaska continuouslychanges, it remains a major component of the regional economy. Employment inseafood processing is reported in ADOL employment statistics, but commercialfishing is not. We relied on a methodology developed by McDowell Group (1989) toestimate employment in salmon fishing.9 This technique has been applied only to thesalmon fishery, and the employment numbers reported here are for salmon only. Thesalmon fishery constitutes about 75 percent of the region’s total catch (halibut, craband herring constitute about 25 percent by value). Statistics available for the seafoodprocessing industry, however, do not allow for an easy distinction between salmonprocessors and other firms, so the entire industry is represented in our tables andfigures.
9 This technique uses the yearly number of fishing permitsissued and the average amount of time spent in fishing andpreparation per fishing entry. Earnings figures are estimatedby dividing up net revenues among captains and employeesin the fishery. Because profits to captains are not included,this allows for comparability with ADOL figures and helps toexplain extremely low yearly earnings estimates. This methodyields a best approximation of the economic activityattributed directly to commercial salmon fishing but may besubject to a substantial degree of error. Despite this,employment trends are accurately reflected.
28

Taken together, commercial salmon fishing and seafood processing formed theregion’s largest private industry in 1994. At an estimated 3,500 average annual em-ployees in 1994, combined direct employment in the salmon fishing and seafood proc-essing industries exceeded that in wood products by 61 percent and that in recreationand tourism by 28 percent. Components of the seafood industry are spread through-out the region with a significant presence in virtually every community. Sitka leadssoutheast ports in the number of permits, and Petersburg residents lead the region incatch and gross earnings. Sport fishing also has made substantial progress as aneconomic force, with saltwater charter fishing service providers increasing substan-tially in recent years to over 700 in 1994. Ketchikan, Sitka, and Juneau are the threelargest centers of activity, but Prince of Wales Island, Petersburg, Wrangell, andother, smaller communities show increases as well.
Most fresh and frozen Alaska salmon is sold in the United States and Japan withlesser amounts sold in Europe, primarily France and the United Kingdom. Cannedsalmon is sold primarily in the United States; other markets include the United King-dom, other European nations, Australia, and Canada. World fish consumption far ex-ceeds the productive capability of the Tongass National Forest, and any changes incommercial fish production attributable to forest management will not have a signifi-cant effect on market prices except possibly for specific species such as king salmon.Alaska’s seafood industry is subject to wide price fluctuations as a consequence ofchanges in the international market for seafood products of all types.
Despite overall growth in Alaska’s salmon production and worldwide increases in con-sumption, Alaska’s market share of global salmon supply (estimated at 31 percent in1990) has been falling. The loss of market share is not a function of poor stocks orlow supply, but a consequence of the growing acceptability of farmed fish as a sourceof fresh salmon. Seafood processing, another vital component of southeast Alaska’seconomy, also has undergone fundamental changes, including the increased use offloating fish processing facilities and a trend toward freezing rather than canningsalmon.
Value and volume measures of salmon harvest for southeast Alaska are shownin figure 11. In spite of extreme variation from year to year, harvest levels show adefinite upward trend since 1980. Gross revenues (in 1994 constant dollars), on theother hand, display no consistent trend. Divergence of volume and value, most pro-nounced in the 1990s, is likely the result of falling prices for Alaska wild salmon as theindustry faces changing preferences in some markets, recession in major markets,and increasing competition with farmed salmon.
In contrast to revenue and catch levels, employment in both salmon fishing and, to alesser extent, seafood processing is remarkably stable (fig. 12). A generally increasingcatch using the same work force has, on average, allowed fisherman to maintain realincomes in spite of falling prices. Alongside the high degree of seasonality and non-resident participation in salmon fishing and processing, the extreme variation in yearlyincome stands out. Nonetheless, the relative size and stability of employment in theindustry identifies fishing and processing as an extremely important element in south-east Alaska’s regional economy. The success of the industry in increasing markets,developing new products, and increasing the overall consumption of Alaska salmonwill determine the size of the industry in the future.
29

Figure 11–Salmon harvest gross earnings and catch in southeast Alaska, 1980-94. Gross earnings tocommercial fishers are ex-vessel values in 1994 dollars, adjusted for inflation by using the U.S. producerprice index. Source: Alaska Commercial Fisheries Entry Commission 1996.
Figure 12–Southeast Alaska direct salmon harvesting and seafood processing employment, 1980-94.Salmon harvesting employment was derived by using average crew size and number of permits fished(McDowell Group, 1989). Source: Alaska Commercial Fisheries Entry Commission 1996, AlaskaDepartment of Labor 1996a.
30
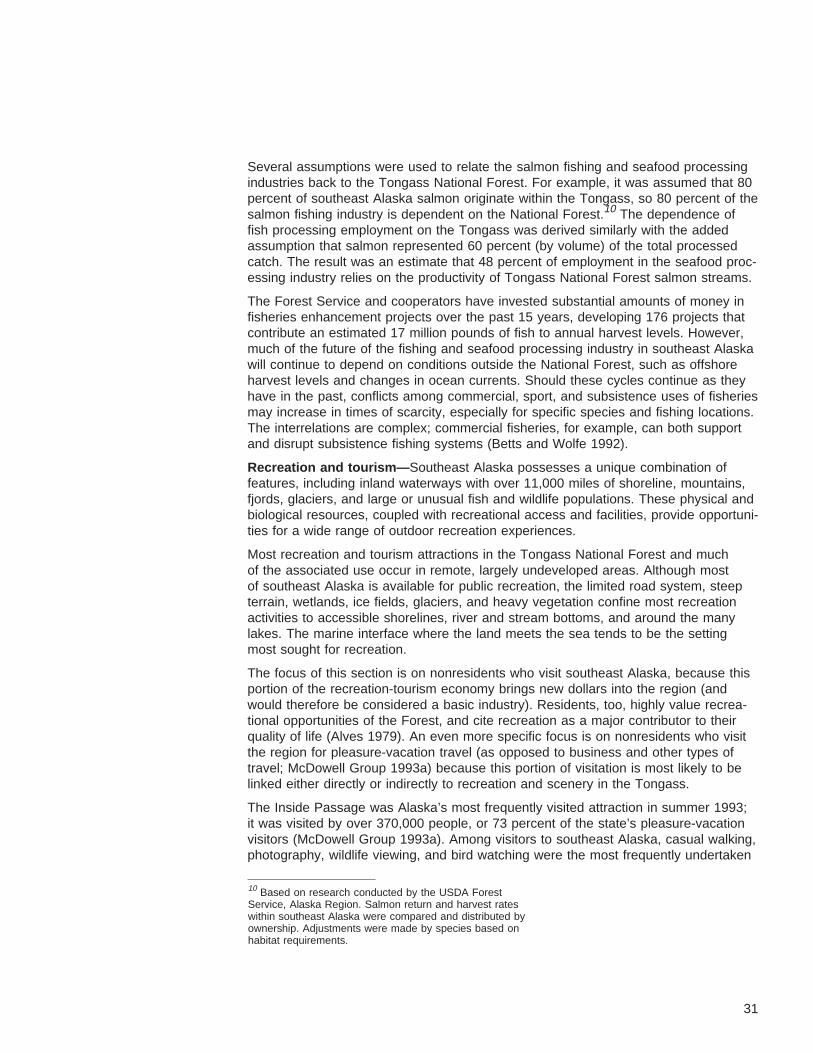
Several assumptions were used to relate the salmon fishing and seafood processingindustries back to the Tongass National Forest. For example, it was assumed that 80percent of southeast Alaska salmon originate within the Tongass, so 80 percent of thesalmon fishing industry is dependent on the National Forest.10 The dependence offish processing employment on the Tongass was derived similarly with the addedassumption that salmon represented 60 percent (by volume) of the total processedcatch. The result was an estimate that 48 percent of employment in the seafood proc-essing industry relies on the productivity of Tongass National Forest salmon streams.
The Forest Service and cooperators have invested substantial amounts of money infisheries enhancement projects over the past 15 years, developing 176 projects thatcontribute an estimated 17 million pounds of fish to annual harvest levels. However,much of the future of the fishing and seafood processing industry in southeast Alaskawill continue to depend on conditions outside the National Forest, such as offshoreharvest levels and changes in ocean currents. Should these cycles continue as theyhave in the past, conflicts among commercial, sport, and subsistence uses of fisheriesmay increase in times of scarcity, especially for specific species and fishing locations.The interrelations are complex; commercial fisheries, for example, can both supportand disrupt subsistence fishing systems (Betts and Wolfe 1992).
Recreation and tourism— Southeast Alaska possesses a unique combination offeatures, including inland waterways with over 11,000 miles of shoreline, mountains,fjords, glaciers, and large or unusual fish and wildlife populations. These physical andbiological resources, coupled with recreational access and facilities, provide opportuni-ties for a wide range of outdoor recreation experiences.
Most recreation and tourism attractions in the Tongass National Forest and muchof the associated use occur in remote, largely undeveloped areas. Although mostof southeast Alaska is available for public recreation, the limited road system, steepterrain, wetlands, ice fields, glaciers, and heavy vegetation confine most recreationactivities to accessible shorelines, river and stream bottoms, and around the manylakes. The marine interface where the land meets the sea tends to be the settingmost sought for recreation.
The focus of this section is on nonresidents who visit southeast Alaska, because thisportion of the recreation-tourism economy brings new dollars into the region (andwould therefore be considered a basic industry). Residents, too, highly value recrea-tional opportunities of the Forest, and cite recreation as a major contributor to theirquality of life (Alves 1979). An even more specific focus is on nonresidents who visitthe region for pleasure-vacation travel (as opposed to business and other types oftravel; McDowell Group 1993a) because this portion of visitation is most likely to belinked either directly or indirectly to recreation and scenery in the Tongass.
The Inside Passage was Alaska’s most frequently visited attraction in summer 1993;it was visited by over 370,000 people, or 73 percent of the state’s pleasure-vacationvisitors (McDowell Group 1993a). Among visitors to southeast Alaska, casual walking,photography, wildlife viewing, and bird watching were the most frequently undertaken
10 Based on research conducted by the USDA ForestService, Alaska Region. Salmon return and harvest rateswithin southeast Alaska were compared and distributed byownership. Adjustments were made by species based onhabitat requirements.
31
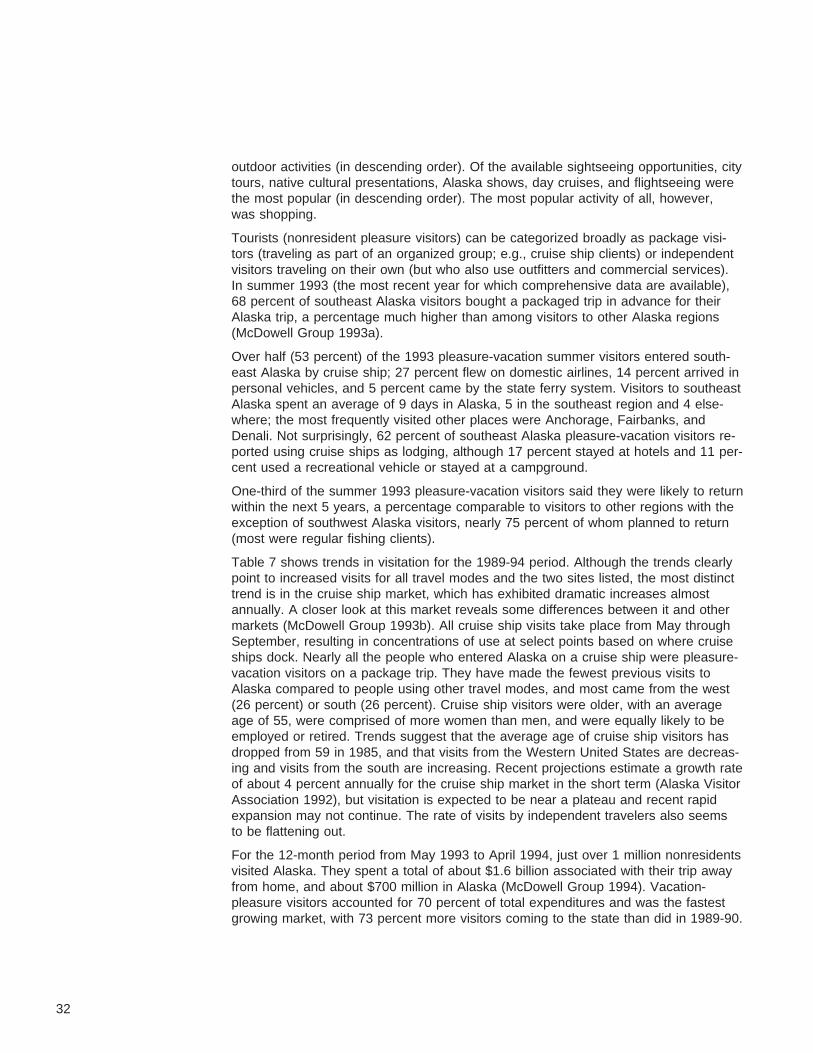
outdoor activities (in descending order). Of the available sightseeing opportunities, citytours, native cultural presentations, Alaska shows, day cruises, and flightseeing werethe most popular (in descending order). The most popular activity of all, however,was shopping.
Tourists (nonresident pleasure visitors) can be categorized broadly as package visi-tors (traveling as part of an organized group; e.g., cruise ship clients) or independentvisitors traveling on their own (but who also use outfitters and commercial services).In summer 1993 (the most recent year for which comprehensive data are available),68 percent of southeast Alaska visitors bought a packaged trip in advance for theirAlaska trip, a percentage much higher than among visitors to other Alaska regions(McDowell Group 1993a).
Over half (53 percent) of the 1993 pleasure-vacation summer visitors entered south-east Alaska by cruise ship; 27 percent flew on domestic airlines, 14 percent arrived inpersonal vehicles, and 5 percent came by the state ferry system. Visitors to southeastAlaska spent an average of 9 days in Alaska, 5 in the southeast region and 4 else-where; the most frequently visited other places were Anchorage, Fairbanks, andDenali. Not surprisingly, 62 percent of southeast Alaska pleasure-vacation visitors re-ported using cruise ships as lodging, although 17 percent stayed at hotels and 11 per-cent used a recreational vehicle or stayed at a campground.
One-third of the summer 1993 pleasure-vacation visitors said they were likely to returnwithin the next 5 years, a percentage comparable to visitors to other regions with theexception of southwest Alaska visitors, nearly 75 percent of whom planned to return(most were regular fishing clients).
Table 7 shows trends in visitation for the 1989-94 period. Although the trends clearlypoint to increased visits for all travel modes and the two sites listed, the most distincttrend is in the cruise ship market, which has exhibited dramatic increases almostannually. A closer look at this market reveals some differences between it and othermarkets (McDowell Group 1993b). All cruise ship visits take place from May throughSeptember, resulting in concentrations of use at select points based on where cruiseships dock. Nearly all the people who entered Alaska on a cruise ship were pleasure-vacation visitors on a package trip. They have made the fewest previous visits toAlaska compared to people using other travel modes, and most came from the west(26 percent) or south (26 percent). Cruise ship visitors were older, with an averageage of 55, were comprised of more women than men, and were equally likely to beemployed or retired. Trends suggest that the average age of cruise ship visitors hasdropped from 59 in 1985, and that visits from the Western United States are decreas-ing and visits from the south are increasing. Recent projections estimate a growth rateof about 4 percent annually for the cruise ship market in the short term (Alaska VisitorAssociation 1992), but visitation is expected to be near a plateau and recent rapidexpansion may not continue. The rate of visits by independent travelers also seemsto be flattening out.
For the 12-month period from May 1993 to April 1994, just over 1 million nonresidentsvisited Alaska. They spent a total of about $1.6 billion associated with their trip awayfrom home, and about $700 million in Alaska (McDowell Group 1994). Vacation-pleasure visitors accounted for 70 percent of total expenditures and was the fastestgrowing market, with 73 percent more visitors coming to the state than did in 1989-90.
32

About $160 million, almost one-fourth of the instate total, was spent in southeastAlaska, nearly all during the summer months. Statewide, instate expenditures includedtours and recreation (26 percent of the total), lodging (22 percent), transportation (18percent), food and beverage (14 percent), and gifts and souvenirs (12 percent).
Economic activity in the tourism industry (including sport fishing and hunting) nowaccounts for an estimated 2,941 jobs in the region (direct employment only).11 Thisconstitutes about 7 percent of southeast Alaska total 1995 employment and is thesecond largest level among the region’s resource-dependent industries. Much of theemployment resulting from tourism is in relatively low-paying jobs such as hotels and
Table 7—Southeast Alaska visitation trends, 1980-94
Year Juneau cruise SE Alaska state Juneau airline Juneau ice field Mendenhallship passenger ferry passenger departures tour passenger Glacier visitor
1980 86,815 276,000 155,699 NA NA
1981 83,566 282,000 156,257 NA NA
1982 87,358 300,000 150,871 NA NA
1983 99,706 307,782 167,302 NA NA
1984 118,781 311,459 168,685 NA NA
1985 137,000 313,147 163,837 12,925 94,072
1986 164,400 296,070a 156,667 17,553 110,229
1987 202,000 326,644 157,952 22,152 119,577
1988 198,870b 344,209 167,314 25,018 110,000
1989 193,983b 343,100c 176,429 27,326 184,452
1990 237,070 363,122 183,677 34,765 188,000
1991 248,428 368,780 190,244 41,887 145,482
1992 269,000 372,680 236,824 45,638 160,000
1993 306,600 342,613d 200,066 53,600 210,000
1994 372,923 347,998 229,820 62,449 265,000
NA = not availablea 2 vessels (1 trip per week) on the route to Seattle reduced total traffic.b Bankruptcy of a large company reduced total passengers these years.c Threat of strike reduced passengers late in season.d Ferry Taku out of service in May and June reduced total passengers.Sources: Alaska Marine Highway System 1995, Juneau Airport Manager’s Office 1995, Juneau Conventionand Visitors Bureau 1995, USDA Forest Service 1995.
11 Estimating recreation-tourism related employment iscomplicated by the fact that expenditures are widelydistributed across various industries. For example, in additionto making purchases from souvenir shops, outfitters, andguides, tourists may spend a large portion of their money inlocal restaurants, grocery stores, and other establishmentswhere local residents also spend their money. As a result,there is no easy way to determine a precise level ofemployment for the industry.
33

other lodging places or eating and drinking places, but other components include therelatively high-paying transportation industry, which in 1991 provided 27 percent ofthe total visitor industry employment and 42 percent of the total annual payroll of$141 million (McDowell Group 1991).
Economic benefits from the tourism industry also accrue directly to state government.For the state as a whole, the tourism industry generated about $52 million in directrevenues through nonresident visitor spending (the bulk attributable to the AlaskaMarine Highway System and nonresident fishing and hunting permits and tags), taxesand fees from the visitor industry business (primarily through corporate income taxand aviation fuel taxes), Alaska Division of Tourism receipts, the Alaska Railroad, andinternational airport system (McDowell Group 1992).
A substantial proportion of recreation and tourism activity, however, does not occurdirectly in the Tongass National Forest. The Tongass National Forest and associatedpublic perceptions of its undisturbed character play an important role in attracting out-of-state visitors to southeast Alaska, who, in turn, generate jobs and income throughactivities not directly related to the Tongass. The Tongass provides the scenic back-drop for recreational activities such as float plane and helicopter tours, as well ascommercial and noncommercial boating. Although these activities may not requirestepping onto Forest lands, they clearly involve resources located within the Tongass.Possible impacts to tourism and recreational uses are acknowledged in Forest Servicemanagement of visual resources along major waterways, and on visual quality objec-tives designed to maintain the overall attractiveness of the Forest.
The following discussion and employment analyses focus on activities occurringdirectly in the Tongass. This likely understates the Forest’s contribution to overalltourism and recreation employment, but the scientific basis for allocating proportionsof the total industry to the Tongass has not yet been developed.
A recent inventory identified 1,436 recreation places—specific geographic areas withrecreational values—located in the Tongass (USDA Forest Service 1997). Of these,about 80 percent were outside designated wilderness areas. Just under half werewithin 15 to 30 miles of a community (this distance was defined as a home range,accessible by a community road system or for day trips via a small boat). Just over40 percent of the places were defined as marine recreation opportunities consistingof water areas and adjacent lands accessible by boat or plane. Sixty-one percent ofthe recreation places in the Tongass were deemed important for tourism, either as adestination or as a scenic backdrop for popular activities such as photography, wildlifeviewing, flightseeing, and hiking.
General recreation use and tourism related to the Tongass has more than doubled inthe last 10 years. The Forest Service’s Recreation Information System (RIM) data-base is a yearly estimate of the number of recreation visitor days (RVDs) occurring inthe Forest. Use estimates from RIM were the basis for future use projections, withoutconsideration of constraints related to capacity. Figure 13 displays the RIM use datafrom 1984 through 1995, future trends as predicted directly from past use, and theamount of use likely to occur given the constraint of existing capacity. Given thesetrends and estimates, the Forest is expected to be able to provide sufficient opportuni-ties for all types of recreation except for semiprimitive motorized opportunities (USDAForest Service 1997). These opportunities, characterized by motorized access (usuallyfloat plane or motorboat) into relatively remote, undeveloped areas, are becoming
34
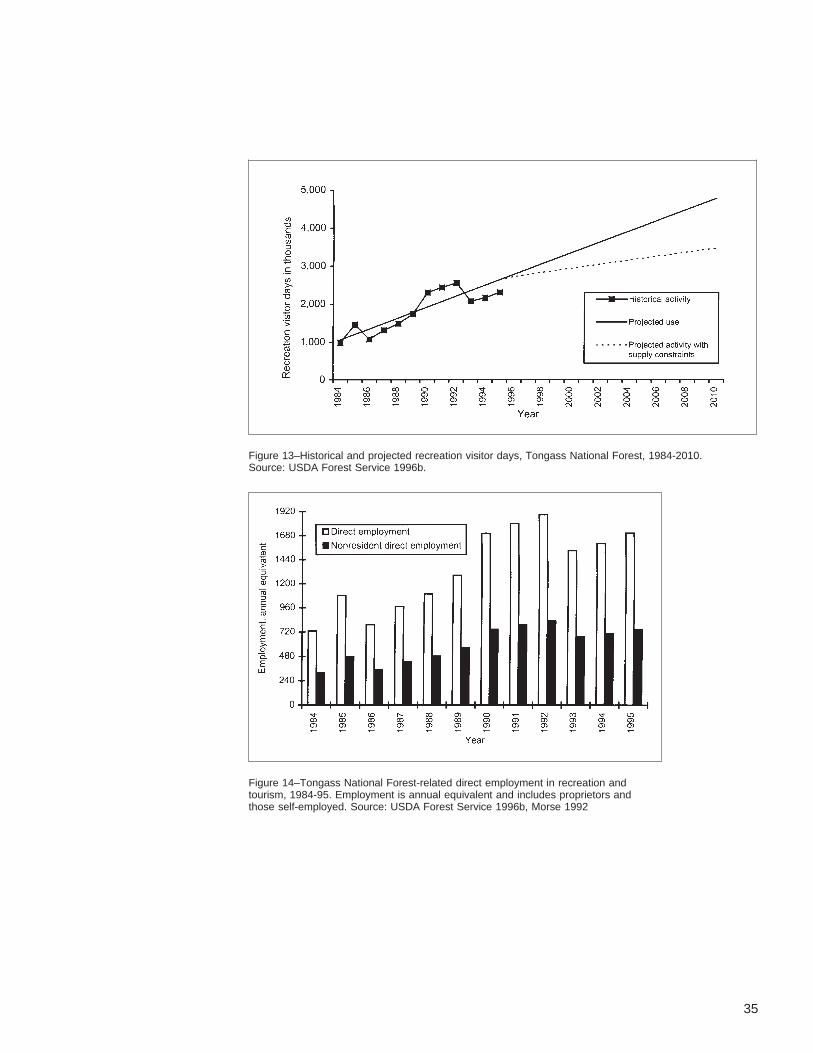
Figure 13–Historical and projected recreation visitor days, Tongass National Forest, 1984-2010.Source: USDA Forest Service 1996b.
Figure 14–Tongass National Forest-related direct employment in recreation andtourism, 1984-95. Employment is annual equivalent and includes proprietors andthose self-employed. Source: USDA Forest Service 1996b, Morse 1992
35

more popular. Other types of settings in the Tongass, including primitive and semi-primitive areas without motorized access, and the more developed roaded and ruralsettings, are not likely to be limiting factors on recreation in the Tongass for the nearfuture.
Tongass-related direct employment estimates were derived by multiplying jobs perRVD12 (estimated to be 0.00074) by historical use levels (fig. 14). We used a re-gional input-output economic model to derive an estimate of the average levels ofemployment generated by a unit of recreation-tourism activity in the Tongass. Thereis considerable room for error in this process, and the estimates should be taken asan approximation of the true value. Unlike a traded commodity, such as timber, thereis no direct way to integrate supply and demand to yield a level of consumption ormarket value for recreational experiences on public lands. Trends illustrated by thismeasure should be relatively accurate nonetheless, assuming that the rate of jobsper RVD is relatively stable in the short run.
In addition to the “Direct Employment” category, figure 14 shows a “From Non-resident” employment category that refers to jobs generated by expenditures fromout-of-region visitors and is comparable to an export industry bringing new moneyinto the region. Nonresident visitors to the Tongass National Forest account for anestimated 44 percent of total use (based on Forest Service RIM database), sononresident-generated employment estimates are considerably less than those fordirect employment.
Mining and mineral development —Mineral exploration and mining have been a partof life in southeast Alaska for over 120 years, with various mineral deposit types andmineral resources occurring within the boundaries of the Tongass National Forest.Locatable minerals13 of the Tongass include gold, silver, copper, molybdenum, iron,nickel, lead, zinc, limestone, and marble. Today, due to the most favorable metalprices since the mid-1980s, the mining industry is exploring new areas for potentialmineral deposits and is revisiting historic mining areas with modern exploration tech-niques. Thirteen identified mineral deposits in the Tongass seem economically viableunder today’s market conditions. In 1990, the U.S. Bureau of Mines estimated thegross value of identified mineral resources within the boundaries of the TongassNational Forest as $47.4 billion (1995 dollars). Highest among the individual mineralswere molybdenum ($18.4 billion) and iron ($16.2 billion), with gold third ($2.89 billion).
In 1995, 196 workers were directly employed by the mining industry, down from arecent peak of 342 employees in 1991 (fig. 15), and a scant fraction of levels earlierin the 20th century when mining was the dominant source of employment in southeastAlaska. Mining-related indirect employment in 1995 was estimated at 145 workers,yielding a total of 341 jobs generated in southeast Alaska by the mining industry. Atover $60,000 per year, employee earnings are twice the regional average. In 1995,direct employee earnings for the industry were $11.7 million (in 1995 dollars) and totalearnings $20.4 million.
12 The USDA Forest Service Alaska Region developedestimates of employment generated per RVD by using theIMPLAN model. The actual estimate was 1,352 RVDs perjob. Miernyk (1965) provides a good introduction for thoseinterested in a general description of input-output modeling.13 A locatable mineral is any mineral that is valuable in theusual economic sense or has a property giving it distinct andspecial value.
36
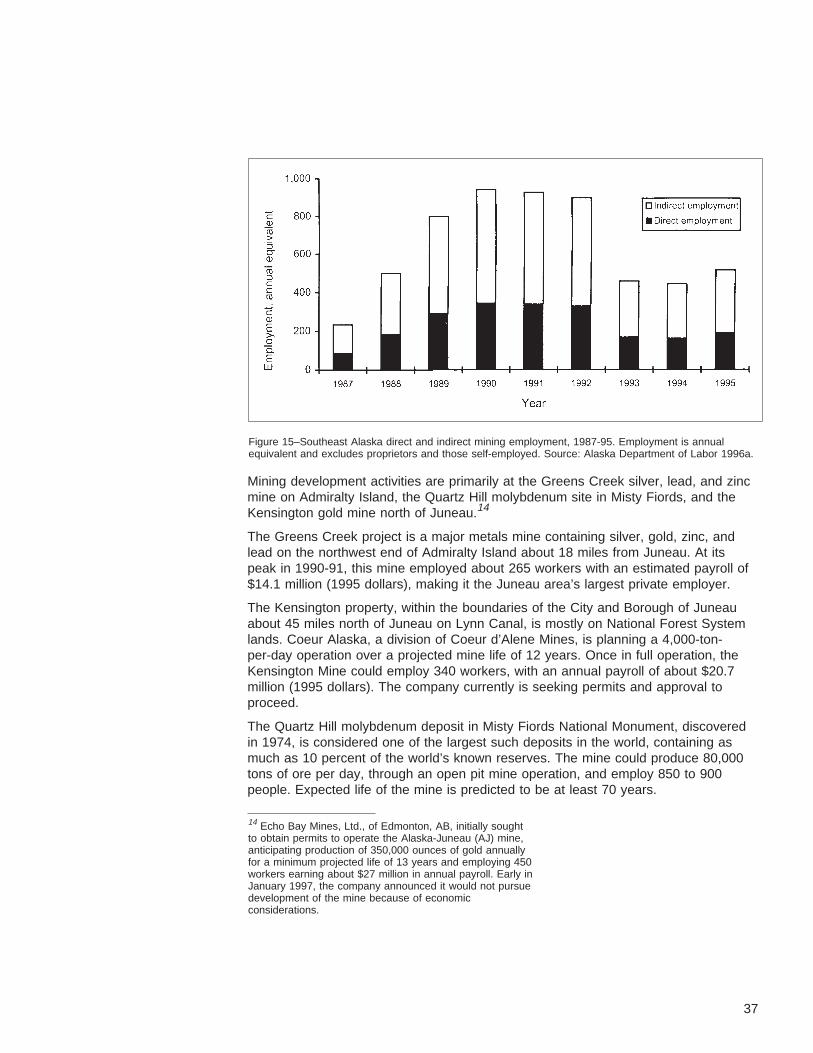
Mining development activities are primarily at the Greens Creek silver, lead, and zincmine on Admiralty Island, the Quartz Hill molybdenum site in Misty Fiords, and theKensington gold mine north of Juneau.14
The Greens Creek project is a major metals mine containing silver, gold, zinc, andlead on the northwest end of Admiralty Island about 18 miles from Juneau. At itspeak in 1990-91, this mine employed about 265 workers with an estimated payroll of$14.1 million (1995 dollars), making it the Juneau area’s largest private employer.
The Kensington property, within the boundaries of the City and Borough of Juneauabout 45 miles north of Juneau on Lynn Canal, is mostly on National Forest Systemlands. Coeur Alaska, a division of Coeur d’Alene Mines, is planning a 4,000-ton-per-day operation over a projected mine life of 12 years. Once in full operation, theKensington Mine could employ 340 workers, with an annual payroll of about $20.7million (1995 dollars). The company currently is seeking permits and approval toproceed.
The Quartz Hill molybdenum deposit in Misty Fiords National Monument, discoveredin 1974, is considered one of the largest such deposits in the world, containing asmuch as 10 percent of the world’s known reserves. The mine could produce 80,000tons of ore per day, through an open pit mine operation, and employ 850 to 900people. Expected life of the mine is predicted to be at least 70 years.
Figure 15–Southeast Alaska direct and indirect mining employment, 1987-95. Employment is annualequivalent and excludes proprietors and those self-employed. Source: Alaska Department of Labor 1996a.
14 Echo Bay Mines, Ltd., of Edmonton, AB, initially soughtto obtain permits to operate the Alaska-Juneau (AJ) mine,anticipating production of 350,000 ounces of gold annuallyfor a minimum projected life of 13 years and employing 450workers earning about $27 million in annual payroll. Early inJanuary 1997, the company announced it would not pursuedevelopment of the mine because of economicconsiderations.
37

Exploration investments in southeast Alaska in 1995 totaled about $12 million, themost spent in any of the state’s seven regions of mineral activity (Bundtzen andothers, no date). This amount dropped to about $7 million in 1996 (Swainbank andothers 1997). These amounts are lower than those spent between 1988 and 1991,which averaged over $20 million per year, but higher than the early 1980s of about$3 million per year. In general, the short- to medium-term prospects for southeastAlaska’s mining industry seem good, but much will depend on environmental concernsand whether prices for precious metals and other minerals can support Alaska’s highcosts of exploration, development, and production.
Subsistence As mentioned in the “Introduction,” this report does not attempt to define or cover thefull range of social, cultural, economic, and other meanings and benefits of subsist-ence, or to detail the harvest levels or species in southeast Alaska. This section willprovide a brief overview of subsistence activities within the context of economicconditions.
A variety of cultural, popular, and sociological definitions and interpretations of sub-sistence are possible, but Section 803 of the Alaska National Interest Lands Con-servation Act (ANILCA; U.S. Public Laws, Statutes 1980) defines subsistence use:
The customary and traditional uses by rural Alaska residents of wild re-newable resources for direct, personal or family consumption as food,shelter, fuel, clothing, tools, or transportation; for the making and selling ofhandicraft articles out of non-edible byproducts of fish and wildlife resourcestaken for personal or family consumption; for barter, or sharing for personalor family consumption; and for customary trade.
ANILCA provided for “the continuation of the opportunity for subsistence uses by ruralresidents of Alaska, including both Natives and non-Natives, on the public lands.” Italso stated that “customary and traditional” subsistence uses of the renewable re-sources “shall be the priority consumptive uses of all such resources on the publiclands of Alaska.”
The opportunity to participate in subsistence activities reinforces a variety of culturaland related values in both Native and non-Native communities. Distribution of fish andwildlife, for example, contributes to the cohesion of kinship groups and to communitycohesion through sharing of resources derived through harvest activities. Subsistenceresources provide the foundation for Native culture, from the totemic basis of clandivisions, to norms governing the distribution of wealth in potlatch ceremonies, andreinforcement of basic values of respect for the earth and its resources. Participatingin subsistence activities contributes to the self-reliance, independence, and ability toprovide for oneself, values that are important reasons why many people move to orremain in southeast Alaska (Alves 1979).
Noncommercial harvest of fish, animals, and plants is especially important in the con-text of southeast Alaska’s highly seasonal and cyclical resource-based employmentand the high prices of commercial products in the retail sector. Commercial enterprise,trade, and money have been part of subsistence economies ever since the com-mercial fur trade with European markets began about 300 years ago (Wolfe 1989).
38
A mixed subsistence-market economy, in which subsistence harvests and cash in-come are complementary, characterizes the economies of most of the region’s ruralcommunities. Families live by combining harvest of wild resources with income fromemployment. For example, cash income frequently supports purchase of fuel andequipment that are part of subsistence harvest technology; the same equipment maybe used for commercial activities such as fishing. In fact, the same activity can pro-duce resources for both commercial and subsistence use: Glass and others (1995)report that, in rural Alaska in 1987, between 12 and 28 percent of salmon used forpersonal consumption was removed from commercial catches.
Although subsistence plays a prominent role in the economy and social well-being ofrural communities, it is a hidden portion of the economy, not revealed by measures ofeconomic growth, employment, or income (Wolfe and Walker 1987). Before the early1980s, the amounts of wild fish and game used by communities had not been sys-tematically measured despite the acknowledged social, cultural, and economic impor-tance. Initial studies suggested that subsistence harvest was especially critical to ruralcommunities, with harvest levels increasing with distance from urban centers:
The combination of subsistence and commercial wage activities providesthe economic basis for the way of life so highly valued in rural communi-ties....In rural communities there is a great desire to maintain this part of aregion’s economy in the face of new economic changes primarily developingfrom the urban population centers [Wolfe and Walker 1987: 68 ].
Subsistence activity is substantial; 30 percent of rural southeast Alaska householdsobtain 50 percent or more of their meat from subsistence activity. About 40 percentof all households get at least a quarter of their food from subsistence harvest activi-ties, and 85 percent of rural southeast households harvest subsistence food (Kruseand Frazier 1988, Kruse and Muth 1990). In 1987, 51 percent of all households re-ported harvesting more than 80 pounds of edible subsistence product per capita, anda quarter of all households harvested more than 250 pounds per capita. A diversity offood sources is commonly used; more than half of all households (61 percent) har-vested at least four different types of fish, wildlife, and plant resources in 1987. Onein ten households harvested more than 10 different types of resources.
The use of subsistence resources in southeast Alaska cannot be explained simply interms of household harvest and consumption (Muth 1989). Most subsistence har-vesters give away at least part of their harvest. In 1987, one-third of all householdsin rural southeast Alaska gave away at least four different types of resources. Nativehouseholds and lower income, non-Native households are most likely to give away orreceive resources (Kruse and Muth 1990).
There is little question that subsistence has economic value. Researchers have takenvarious approaches to estimating these values, typically using replacement costs.For all of rural Alaska, the per capita cash value of subsistence foods equals almosthalf of the per capita income (Wolfe and Bosworth 1994). In Hoonah, for example,the annual replacement value of all harvested foods was between $3,141 and $5,497(1985 dollars), a sizable amount “for an isolated community with few employmentopportunities” (Tainter 1996). Assigning a dollar value to subsistence foods does notimply the existence of a subsistence economy separate from a cash economy(Nakazawa and Goldman 1991); as discussed, subsistence hunting, fishing, andgathering activities constitute part of a mixed subsistence-market economy.
39

One use of economic estimates has been to compare effects of alternative manage-ment strategies on subsistence activities. To compare the economic effects of alterna-tive methods of managing subsistence, Nakazawa and Goldman (1991) multipliedpounds per capita consumption of land animals by the cost per pound of red meat inthe region by the number of eligible subsistence users. Because the different manage-ment strategies led to different numbers of people who would be defined as subsis-tence users, this approach provided one way of differentiating effects of the alterna-tives. Glass and others (1995) point out that the presence of a mixed-sector economyhas the potential to greatly complicate socioeconomic impact assessments conductedby state and Federal resource management agencies. A similar statement could bemade about economic activity in general; the pervasive role of subsistence in thelifestyles of southeast Alaska rural residents complicates traditional discussions aboutregional and local economies.
SubregionalConditions andTrends
A common problem encountered in analysis of the southeast Alaska economy is thatJuneau dominates regional statistics. As a result, trends in employment or incomesometimes more closely represent developments in Juneau than changes elsewhere.Analyzing certain economic statistics at the borough level clarifies subregionaldifferences obscured at the regional level.
The boroughs and census areas of southeast Alaska (referred to collectively in thissection as “boroughs”) display large differences in their economic structure and de-velopment (U.S. Bureau of Economic Analysis 1996). Table 8 displays population,income, and employment measures for southeast Alaska boroughs since 1985. Ingeneral, trends are similar for each borough, but there are large differences in magni-tudes. For example, population growth in the Prince of Wales and Outer KetchikanBorough and in the “northern complex” (an aggregate of the Skagway-Hoonah-Angoon Census Area and Yakutat Borough) is considerably higher than the regionalaverage. Change in employment levels is positive for all boroughs, but ranges from50 percent for the northern complex to just 12 percent for Juneau.
Real per capita income is a measure that includes trends in population and employ-ment levels and in wages earned per job. Real per capita income has dropped thegreatest amount in Prince of Wales and Outer Ketchikan Borough as a result of asharp rise in population (which exceeds the increase in job growth), and a 23-percentdecline in average earnings per job. The absolute level of per capita income is alsoconsiderably lower, indicating that, on average, Prince of Wales and Outer KetchikanBorough residents receive 35 percent less income than the regional average. In con-trast, Ketchikan Gateway Borough and the northern complex both experienced gainsin real per capita income in this period due mostly to the rapid creation of new jobs inboth boroughs.
The Shannon-Weaver diversity index, derived for each borough by using ADOLemployment data, provides a measure of local economy diversity. To allow easycomparison, the index was constructed so that the borough displaying the greatestdiversity was recorded as 100 percent, with other boroughs reported as a percentageof this maximum. In addition to demonstrating positive growth in per capita income,Ketchikan Gateway (the principle trade center for the southern portions of southeastAlaska) and the northern complex also exhibit the highest relative diversity rating.Haines Borough shows the lowest rating, but this is expected because it has by far
40

the fewest jobs, and the index is sensitive to the size of the economy. Juneau, on theother hand, also exhibits a relatively low index rating in spite of its size and role as aregional trade center, the result of high employment concentrations in govern-ment and a lack of manufacturing jobs.
Taken together, these economic statistics show a mixed picture of economic develop-ments in the boroughs of southeast Alaska. With the highest per capita income, em-ployment growth and diversity score, Ketchikan Gateway Borough demonstrates thestrongest economic performance. The Northern Complex also exhibited dynamic per-formance over the last decade, but its per capita income is significantly lower than theregional average and, at 11 percent, its average unemployment rate is significantlyhigher (it also should be remembered that the northern complex does not comprise ageographically contiguous set). With by far the lowest per capita income and next tolowest diversity score, Prince of Wales and Outer Ketchikan Borough seems to berelatively weak from an economic standpoint, but this conclusion must be temperedby its higher population growth rate, gains in economic diversity, and higher rate ofnew job creation than other boroughs.
Table 8—Summary economic statistics for southeast Alaska boroughs, 1985-94
Real per capita S-W diversityPopulation incomea Total employmentb indexc
1985-94 1985-94 1985-94 1985-94
Area 1994 change 1994 change 1994 change 1995 change
Thousands Percent 1995 $ Percent Jobs − − − − Percent − − − −
Northern boroughs:
Haines Borough 2.2 10 26,755 -5.6 1,582 25.1 84 13
City and Borough ofJuneau 28.8 17 28,055 -13.5 19,456 11.6 92 11
Sitka Borough 8.8 10 24,285 -2.1 5,669 22.8 95 5
Northern complexd 4.5 25 23,370 4.9 2,846 50.2 100 10
Southern boroughs:
Ketchikan GatewayBorough 14.4 8 29,941 10.5 10,472 35.5 100 5
Prince of Wales-Outer
Ketchikan 6.9 35 17,113 -16.0 2,985 34.4 90 16
Wrangell-Petersburg 7.2 16 25,682 -12.0 4,342 13.0 98 0
Total 72.8 16 26,372 -6.9 47,352 21.1 94 8
a All dollar figures are in 1995 dollars, adjusted for inflation by using the U.S. producer price index.b Employment is full- and part-time annual equivalent and includes proprietors and self-employed.c S-W = Shannon-Weaver (1949) diversity index based on Alaska Department of Labor employment by industry.This index is normalized to the maximum index reported by any borough in a given reporting year.d Aggregate of Skagway-Hoonah-Angoon Census Area and Yakutat Borough.Sources: Alaska Department of Labor 1996a, U.S. Bureau of Economic Analysis 1996.
41


As noted in “Regional Conditions and Trends,” the choice of a base year for compar-ison is difficult; relatively low timber employment was recorded in 1985, and 1990 wasone of the highest years on record. In addition, using the 1985-94 period for analyzingdata can have the effect of obscuring changes or trends occurring within this decadespan. For these reasons, a longer period was selected for analysis; it was dividedinto two sections to allow comparison of recent trends with previous ones.
Figure 16 shows annual growth in NAWS employment for 1981-90 and for 1990-95.During the 1981-90 period, much of southeast Alaska saw strong employment growth,with many boroughs expanding at rates above the national average of 2 percent an-nually. Other boroughs, notably Wrangell-Petersburg, experienced much slowergrowth, although all growth estimates for this period were positive. The 1990-94 pe-riod reveals a markedly different situation. With the exception of Juneau, all borougsdemonstrated slower growth in this later period, and employment in four of the sevenboroughs actually declined. Due to the dominance of Juneau in the regional economy(and regional statistics), average growth for the entire region remained positive, butless than half of the 1981-90 average. In short, at least when viewed in terms of totalNAWS employment growth, southeast Alaska’s regional economy seems far lessrobust in the 1990s than in the previous decade, largely the result of decreases intimber employment.
Tongass-RelatedIndustries
The 41-percent decline in total regional wood products industry employment (includinglogging) is reflected in sharp declines in wood products industry employment at theborough level for all boroughs (table 9). In particular, mill closures in Sitka, Haines,and Wrangell have resulted in over an 80-percent decline in wood products industryemployment since 1990 in each of these boroughs. Logging employment declinedfrom 2,144 to 1,177 (-45 percent) between 1990 and 1994, and sawmill and pulp millemployment declined from 1,399 to 1,048 (-25 percent).15
In contrast to the wood products industry, employment in lodging, restaurants andrecreation-related services has demonstrated strong gains since 1990. The contrastbetween losses in wood products industry employment versus gains in recreation-related employment is consistent with overall trends discussed in the regional econo-mic section, but there is considerable variation across boroughs. Certain boroughs(and, by extension, the communities they encompass) have benefited much morefrom the expansion of the tourist-related economy than others. The northern complex,for example, saw a doubling of wage and salary employment in this category, withnearly 20 percent of employment there accounted for by lodging, restaurants, andrecreation-related services. The Wrangell-Petersburg Census Area, on the other hand,saw a substantial fall in employment in this category, and the share of total employ-ment is only 7 percent.
Subregional differences also are evident in the salmon fishing and seafood process-ing sector (table 9). The most jobs are in Wrangell-Petersburg, followed by KetchikanGateway Borough, but Sitka and the northern complex contribute substantial propor-tions of regional employment. The industry contributes more than 10 percent of localemployment to three of the boroughs, and is declining in none. Juneau has the fewestseafood processing jobs of any borough, despite having by far the greatestpopulation.
15 These declines become even more pronounced given therecent closure of the pulp mill in Ketchikan and the loss of anadditional 500 jobs in the industry.
43

Table 9 also indicates a distinction between northern and southern boroughs. As of1995, boroughs in the northern portion of southeast Alaska were far less dependenton the wood products industry for their employment base. The northern complex held464 wood products industry jobs, or 22 percent of the regional total, almost all in log-ging. The vast majority of timber employment and all the jobs in wood products proc-essing arising from harvests on the Tongass National Forest are concentrated in thesouthern boroughs, particularly Ketchikan Gateway Borough and Prince of Wales andOuter Ketchikan Borough. Recreation and tourism employment, by contrast, showshigher concentrations in the north, accounting for 70 percent of the regional total inthis category. Growth in employment in this area also has been more pronounced inthe north, with the northern complex showing relatively strong growth in this categorysince 1990. Seafood processing, a factor throughout southeast Alaska, is concen-trated in the southern boroughs, where the highest growth rates also are present.
At least at this level of aggregation, it is evident that the northern and southernboroughs likely have different interests in how the Tongass National Forest is man-aged. At lower levels of aggregation, the story becomes more complex, with certainboroughs or communities of the north demonstrating extremely high concentrations inlogging employment, and others in the south demonstrating no wood products indus-try employment at all.
Growth rates in NAWS employment similar to those shown in figure 16 are displayedfor southeast Alaska total employment (excluding wood products employment) infigure 17. In this analysis, regional employment growth appears stronger in the 1990sand generally matches 1981-90 patterns at the borough level with a few notable ex-ceptions. Average growth for the entire region is slightly higher for the latter periodowing to the influence of Juneau on aggregate statistics.
Timber employment has a strong influence on overall regional economic performance;changes in employment in this sector are clearly evident in the stagnant or even de-clining total employment levels for the entire region. Second, and in contrast to thefirst, the failure of trends in other employment to mirror those in the wood productssector suggests that local economic sectors have a degree of independence. In otherwords, substantial declines in one sector, even if considered a basic industry, do notnecessarily cause declines of similar magnitude in other sectors. Research, especiallyat subregional levels, is needed on the interrelations among the resource-related andother sectors of the southeast Alaska economy.
CommunityConditions andTrends
The previous sections of this report concentrated on economic conditions at the re-gional and subregional levels of analysis by showing some of the differences thatemerge as the area studied becomes smaller. At the community scale, the storybecomes even more diverse. People usually are most concerned about conditionsand trends at the community level, because that is where the effects of social andeconomic trends are felt daily. This is especially true in the remote, isolated communi-ties of southeast Alaska. As by far the dominant land management agency in south-east Alaska, responsible for managing over 80 percent of the land area, the ForestService has a pervasive influence on the quality of life in southeast Alaska rural com-munities (Alves 1979).
Community is a concept with multiple dimensions and definitions, from the commonnotion of a village or town, to a “community of interest”—people who may not live inthe same town but are linked by a common stake, profession, interest, activity, or set
44

of values. This section uses the geographic-political definition of community—townsand villages. The revised supplement to the Tongass land and resource managementplan (RSDEIS; USDA Forest Service 1996b) identifies 32 southeast Alaska communi-ties with a state land selection base.16 Table 10, a display of several statistics bycommunity, demonstrates the diversity in population, income, use of subsistence re-sources, and other socioeconomic characteristics.
As was the case at the regional and subregional levels of analysis, this assessmentfocuses on conditions most relevant to (and affected by) management of the Ton-gass. We begin by providing a context for trends affecting small, rural communitiesthroughout Alaska and the resulting fiscal conditions and challenges. An examinationof second-class cities17 in the late 1980s suggested that operating revenues declinedsignificantly; per capita revenues declined 20 percent and expenditures 28 percentfrom 1985 to 1989 (Alaska Department of Community and Regional Affairs 1992).Although actual funding levels tended to increase, they did not keep pace with infla-tion. Cities cut budgets in nearly every area of administration and service provision,and many communities found it difficult to operate and maintain public facilities andinfrastructure. State revenue sharing and municipal assistance programs decreasedby nearly one-third during the same period. An issue raised in the report was theability of these strapped communities to respond to new initiatives transferring addi-tional responsibilities to local government. Only two of the cities sampled for the study
Figure 17–Southeast Alaska annual growth in nonagricultural wage and salary employment (excluding thewood products sector) by borough (1981-90, and 1990-95). Employment is annual equivalent andexcludes proprietors and those self-employed. Source: Alaska Department of Labor 1996a.
16 Logging camps are communities, and contribute to thesocial fabric of southeast Alaska. By their nature, they tendto be mobile, to lack a dedicated land base, and to not bedefined as towns (although many communities, such asThorne Bay, Hollis, Naukati Bay, Coffman Cove, and WhalePass, began as logging camps). As a result, little quantitativestate or local data are available on logging camps except forspecific studies not repeated over time; however, loggingcamp employment is included in this report.17 The state has several classes of cities; second class is theminimum form of municipal government in Alaska. The 115(out of a total of 160) second-class cities are mostly verysmall towns or villages having several hundred or fewerresidents.
45

Table 10—Southeast Alaska community statistics, 1990 and 1995
Median Households Medianhousehold below subsistence Revenues/ Expeditures/
Population Natives, Income, poverty line, use, capita, capita,Community 1995 1990 1990 1990 1990 1987a 1995b 1995b
Percent Dollars Percent Pounds − − − − Dollars − − − −
Angoon 594 636 82 32,083 22 242 629 586Coffman Cove 249 186 7 44,063 5 186 977 594Craig 1,907 1,260 23 47,250 4 185 3,477 3,242Edna Bay 86 75 0 12,250 64 517 NA NAElfin Cove 43 57 2 43,125 7 264 NA NAGustavus 318 258 4 41,538 4 257 NA NAHaines Borough 2,295 2,117 13 36,048 9 104 1,998 1,941Hollis 112 111 3 31,250 15 164 NA NAHoonah 878 795 67 36,442 4 404 6,209 5,093Hydaburg 400 384 89 20,139 26 337 5,118 5,980Hyder 129 99 1 23,750 14 401 NA NAJuneau, City and Borough 28,757 26,751 13 47,924 6 NA 4,403 3,944Kake 700 700 73 35,875 7 159 7,229 5,605Kasaan 41 54 54 46,667 0 186 4,121 1,571Ketchikan City 8,635 8,263 14 45,172 4 NA 2,258 2,092Klawock 745 722 54 39,583 8 830c 5,905 5,871Metlakatla 1,523 1,407 84 37,143 10 71 NA NAMeyers Chuck 35 37 11 16,250 33 414 NA NANaukati Bay 148 96 1 43,333 5 NA NA NAPelican 201 222 29 27,083 14 355 6,454 6,636Petersburg 3,309 3,207 10 49,318 4 200 5,091 4,532Point Baker 58 39 0 12,083 NA 344 NA NAPort Alexander 96 119 3 20,625 18 306 384 325Port Protection 60 62 2 10,000 46 311 NA NASaxman 386 369 77 30,481 6 89 1,924 1,611Sitka 8,891 8,588 21 43,337 5 146 4,734 3,959Skagway 771 692 6 37,500 4 52 4,695 2,954Tenakee Springs 106 94 10 18,125 11 250 1,992 1,616Thorne Bay 631 581 1 39,688 5 97 2,143 1,649Whale Pass 87 75 3 49,583 14 186 NA NAWrangell 2,703 2,479 20 37,538 6 164 4,332 3,962Yakutat 767 705 55 36,875 11 398 6,843 6,666
NA = not available.a This is the 1987 per capita household subsistence harvest of edible pounds as reported by the Alaska Department of Fish and Game. Thespecies of fish, marine invertebrates, game, and plants harvested differ by community.b The revenues and expenditures are reported in 1995 dollars. Unincorporated communities are not required to provide revenue andexpenditure data to the State of Alaska. In many cases, these communities do not provide services or collect revenues.c This figure represents Klawock’s mean household subsistence harvest in edible pounds; per capita harvest information was unavailable.Sources: Alaska Department of Community and Regional Affairs 1996. Alaska Department of Labor 1996a; U.S. Department of Commerce,Bureau of the Census 1990; Wolfe and Bosworth 1994.
46
were in southeast Alaska, and the time period was the late 1980s, but the sametrends are of concern today, with funds provided through state revenue sharingprograms continuing to decline (Walters 1997).
Figure 18 displays per capita revenues and expenditures for southeast Alaska com-munities for which data existed in 1995. The magnitude of the differences amongcommunities is the most notable finding, but it is not correct to conclude that higherrevenues and expenditures lead to better social or economic well-being. Each com-munity has a unique set of services and administrative structure. Electricity, for ex-ample, may be provided by local governments in some communities but by a privatecompany in others; particularly wealthy communities may undertake more serviceprovision on their own than will most other communties. It is also likely that residentsin some communities may not desire some types of services, so the lack of city-provided services or infrastructure is not always a negative effect on the quality of lifeof residents.
Comparison of per capita revenues and expenditures over time within communitiesmay provide a better illustration (than the above) of community fiscal conditions.Appendix 2 contains trend information for 21 communities (or boroughs) for whichthis information is available, along with trends in population. Generally upward trendsin revenues are present in seven communities, generally downward trends in six, andfairly stable trends in eight. This pattern does not suggest a widespread, continuousdecline in revenues, but more indepth analysis is needed before firm conclusions canbe reached. Regardless, the fiscal conditions of communities is a continuing concernfor residents.
The communities of southeast Alaska are characterized by a relatively high degree ofgeographic isolation, but their economies are not autonomous. Local businesses andresidents often rely on external sources for large proportions of purchased goods andservices. Consequently, southeast Alaska communities have relatively strong linkswith larger regional trade centers (Juneau and, to a lesser extent, Ketchikan, Sitka, orlocations in Canada), and with suppliers of wholesale and retail goods in the lower 48States, particularly those shipping from Seattle. An important result of this is that themultiplier effects emanating from changes in local economic activity will often be feltelsewhere, further up the trade hierarchy in places such as Juneau.
Economic structure and diversity in this section are not described for each individualcommunity. The smallest unit of analysis used by ADOL is groups of communities,which are subareas of boroughs and census areas. Some of the community groupsrepresent individual communities, and some include several communities within theboundary (refer to table 1 for a complete description). Information at the communitygroup scale provides a more detailed picture of local employment patterns than pre-viously available data as a result of changes in policy effective July 1, 1996, regardingrelease of employment data. Before that date, public release of employment data wasmore restricted based on number of employees and percentage of employment pro-vided, and in most instances at smaller geographic levels, requirements were notmet.18 The concern was that releasing information at very small scales would identify
18 Similar concerns extend to other types of employment andincome information as well. For example, the state releasesinformation about proportions of resident and nonresidentemployees only for Alaska firms employing 20 or morepeople.
47
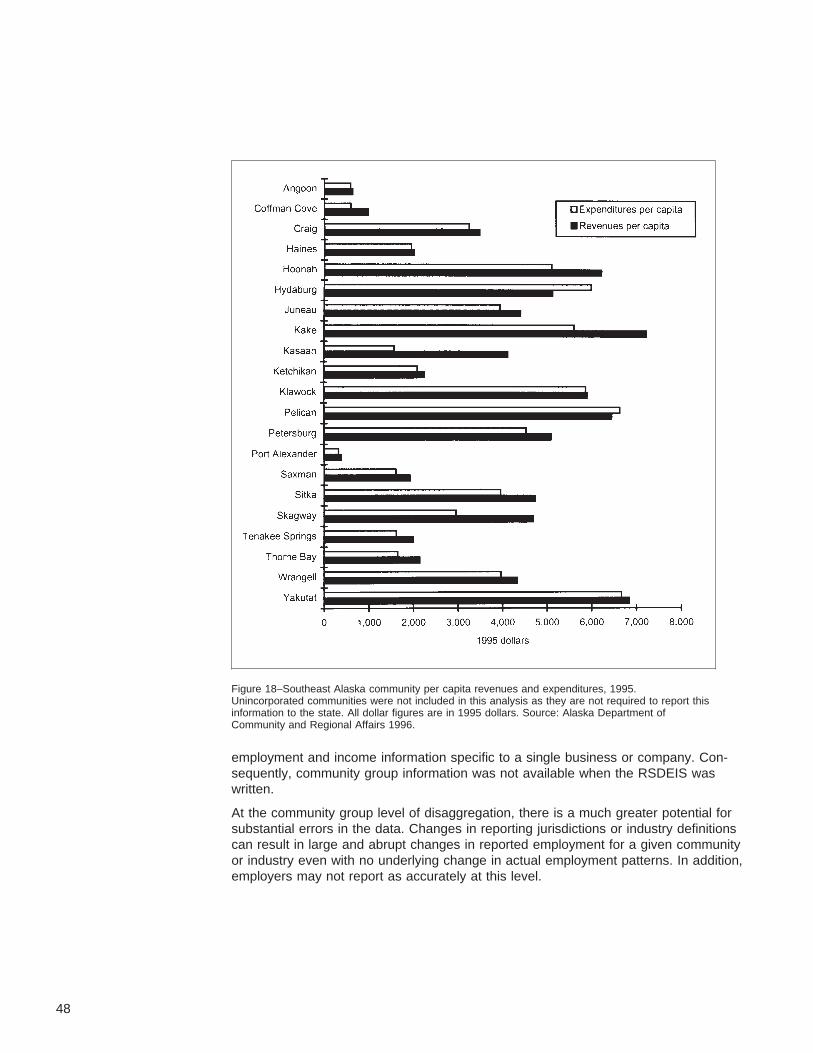
employment and income information specific to a single business or company. Con-sequently, community group information was not available when the RSDEIS waswritten.
At the community group level of disaggregation, there is a much greater potential forsubstantial errors in the data. Changes in reporting jurisdictions or industry definitionscan result in large and abrupt changes in reported employment for a given communityor industry even with no underlying change in actual employment patterns. In addition,employers may not report as accurately at this level.
Figure 18–Southeast Alaska community per capita revenues and expenditures, 1995.Unincorporated communities were not included in this analysis as they are not required to report thisinformation to the state. All dollar figures are in 1995 dollars. Source: Alaska Department ofCommunity and Regional Affairs 1996.
48
Summary statistics for the ADOL community groups (appendix 1) show the relativeproportion of employment in each major economic sector. These data demonstratethe widespread role of the government sector, as well as the difference in proportionsof employment that could be directly affected by Forest Service policies and actions.A reader interested in evaluating a specific community group may use appendix 1 tolearn more and make comparisons with other community groups.
Average annual growth in total employment for each of the ADOL community groupfor the 1981-90 and 1990-95 periods is further shown in figure 19 (the smallest com-munity groups were omitted from this analysis because the extremely large rates ofchange reflect problems of scale). One of the most striking characteristics is the ex-tremely high variation in the rate of job creation (or loss) experienced by the differentcommunity groups. The highest positive or negative changes are concentrated ingroups with the smallest total employment numbers. A rapid reversal in rates is evi-dent for some community groups. Employment in Yakutat, for example, increased atan annual rate of 14 percent in 1990-95 in contrast to a 2-percent annual rate ofdecline in the 1981-90 period. Many of the other community groups showed similarreversals, with the most pronounced occurring in the smaller community groups.
These data highlight an important aspect of community level impacts: the most severeimpacts (relative to total local employment) are often experienced in smaller communi-ties, where even a few job losses may be a large proportion of total employment.Conversely, the addition of a new firm or business can lead to sizable increases.Smaller communities often exhibit higher concentrations of employment in a singleindustry, such as logging camps or communities based on resorts or concentrationsof fishing lodges.
Larger communities, in which the absolute level of variation is considerably less, alsodemonstrated very different trends in overall employment growth or decline in recentyears. Population size is highly correlated with the number of businesses in a com-munity (r=0.77, p=0.005), with the current economic diversity (r=0.74, p=0.002), andwith the number of jobs (r=0.96, p=0.00) of the corresponding ADOL communitygroup. Median family income is more strongly associated with economic diversity(r=0.66, p=0.006) than with population size (r=0.38, p=0.03), highlighting the benefitsof economic diversity.
Tongass-RelatedIndustries
Employment at the community-group level in the three resource-dependent industriesmost likely to be affected by management of the Tongass National Forest is shown intable 11, again highlighting the great diversity present across southeast Alaska. In the23 community groups, 10 have 1 percent or less employment in the wood productsindustry, 12 have 1 percent or less employment in seafood processing, and six have1 percent or less employment in a combined category of lodging, restaurants, andrecreational and entertainment services. Very few community groups have significantproportions of employment in all three categories.
Wood products— The wood products-related employment as a share of total localemployment is shown in table 11 for all ADOL community groups. Extremely highconcentrations are found in groups containing logging camps, such as the Baranof,Kuiu Island, Revillagigedo, and North Prince of Wales community groups. A loss oftimber jobs could eliminate a substantial proportion of total employment within thesecommunity groups, and because of their impermanence, small size, and relative lackof social and institutional infrastructure, they would not be well positioned towithstand such impacts.
49

Figure 19–Annual growth in nonagricultural wage and salary employment for southeast Alaska’slarger community groups, 1981-90 and 1990-95. Communities are listed in descending order ofsize. Employment is annual equivalent and excludes proprietors and those self-employed.Source: Alaska Department of Labor 1996a.
50

Table 11—Summary of southeast Alaska employment statistics, by industry, for Alaska Department ofLabor community groups, 1990-95
Lodging, restaurant, and
Wage and salarya
Wood products Seafood processing recreationb
Borough or 1995 1990-95 1995 1990-95 Local 1995 1990-95 Local 1995 1990-95 LocalCommunity group census area jobs change jobs change total jobs change total jobs change total
Annual Annual Annual Annual
equivalent Percent equivalent − Percent − equivalent − Percent − equivalent − Percent −
Baranof Sitka Borough 51 -4 39 -17 75 0 — 0 0 — 0
Central POWc POW-OKd 1,059 9 137 -56 13 42 155 4 123 24 12
Chatham Strait Northern complex 324 -2 112 26 34 0 — 0 21 10 7
Cleveland Pen. POW-OK 14 -38 0 — 0 0 — 0 14 -38 100
Gustavus Northern complex 159 29 0 — 0 4 130 2 97 65 61
Haines Haines Borough 791 -11 10 -93 1 90 9 11 131 30 17
Hyder POW-OK 21 -33 0 — 0 0 — 0 8 -12 37
Hydaburg POW-OK 61 -20 0 — 0 0 — 0 0 — 0
Juneau Juneau Borough 15,775 12 80 — 1 59 139 0 1,505 29 10
Kake Wrang-Peterse 282 -1 47 -62 17 0 — 0 0 — 0
Ketchikan City Kt-Gt-Wyf 7,911 1 1,006 -30 13 405 -9 5 647 -4 8
Kuiu Island Wrang-Peters 9 -90 4 -95 45 0 — 0 0 — 0
Metlakatla POW-OK 550 -7 96 -17 17 31 — 6 20 136 4
North POW POW-OK 447 -12 257 -4 57 4 -63 1 19 220 4
North Chichagof Northern complex 565 -5 139 0 25 139 -40 25 33 10 6
Petersburg Wrang-Peters 1,555 12 12 -83 1 430 65 28 100 -23 6
Revillagigedo Kt-Gt-Wy 28 — 23 — 84 0 — 0 0 — 0
Sitka Sitka Borough 3,765 -7 14 -97 0 227 -18 6 390 8 10
Skagway Northern complex 602 10 0 — 0 0 — 0 211 190 35
Southeast POW POW-OK 39 369 0 — 0 0 — 0 38 — 97
Stephens Pass. Northern complex 48 -86 3 -95 6 2 200 5 0 — 0
Wrangell City Wrang-Peters 813 -8 21 -87 3 83 38 10 74 -4 9
Yakutat Northern complex 419 93 68 86 16 72 — 17 61 114 14
— = not applicable.a Employment is full- and part-time annual equivalent and excludes proprietors and self-employed.b This measure does not directly reflect recreation- and tourism-related employment, but is included as an indicator of trends and relativeconcentration of recreation- and tourism-dependent employment.c POW = Prince of Wales Island.d POW-OK = Prince of Wales-Outer Ketchikan Census Area.e Wrang-Peters = Wrangell-Petersburg Census Area.f Kt-Gt-Wy = Ketchikan Gateway Borough.Source: Alaska Department of Labor 1996a.
51

Lower yet still substantial concentrations of wood products industry-related employ-ment are found in and around more established communities, including the ChathamStrait and North Chichagof community groups, where timber employment shares ex-ceed 20 percent of total nonagricultural wage and salary employment. These areasalso are at risk of negative social and economic impacts if the trend in decreasing tim-ber industry employment continues.
Larger communities that contain wood processing facilities also can rely heavily onthe wood products industry for employment. Ketchikan is the principal example of thistype of community, but this characterization could have been equally applied to Sitka,Wrangell, or Haines before their mill closures. Due to their size and general level ofeconomic development, these communities are characterized by a much more devel-oped local economy, with wood products industry employment constituting a smallershare of total employment.
As noted above, changes in timber-related employment have not been evenly distrib-uted across the communities of southeast Alaska. In particular, the opening or closingof wood products processing facilities, such as pulp mills or sawmills, has large andabrupt impacts on local employment and earnings levels. The 1990s have witnessedclosures of large mills in Haines (1991), Sitka (1993), Wrangell (1994), and Ketchikan(1997).
Table 12 displays yearly levels in total employment, wood products employment(logging included), and other employment for Haines, Sitka, and Wrangell since 1990.The direct impact of mill closures is evident in the elimination of virtually all woodproducts-related employment in each community. These impacts also can be seen ina substantial reduction in total employment, ranging from 7 percent in Sitka to 11 per-cent in Haines over the 1990-95 period, compared to a 4-percent increase in totalNAWS salary employment in southeast Alaska for the same period. Earnings figureswere not available at this level of detail, but it is safe to assume that impacts toearnings are even greater because earnings in the wood products industries aresignificantly higher than the regional average.
Indirect impacts (i.e., declines in employment in other sectors generated by the reduc-tion in wood products employment) are far less evident than direct impacts, with eachcommunity showing a positive increase in other employment since 1990. Increases inSitka (3 percent) and Haines (4 percent), however, are substantially less than theregional average increase of 10 percent in nonwood-products related employment.Though the evidence is not conclusive, mill closures seem to have had a substantialdampening effect on growth in other employment categories.
At 10 percent, growth in other employment in Wrangell matches the regional aver-age, but much of the indirect impact of the mill closure may not yet be present or mayhave been partially mitigated through state and Federal programs. In 1995, other em-ployment saw a 3-percent decline, reversing a strong growth trend since 1991. InSitka, and especially Wrangell, the total impact from mill closures probably has nothad time to work its way through the entire economy, as unemployment benefits andoutmigration of unemployed workers may continue for several years after the initialjob loss.
52

Due to the relatively high wages, the taxes paid, and the charitable activities theyengage in, the contribution of larger mills (and other industries) to the local economymay be underestimated by employment statistics alone. At the community scale, largeemployers cease to become just statistics of employment and are seen as membersof the community that provide benefits for local residents related to the standard ofliving, transportation, and public services (McDowell Group 1995).
Commercial fishing and seafood processing— As shown by the regional- andborough-level analyses, commercial fishing is another extremely important componentof southeast Alaska’s economy, but there are no reliable statistics available onemployment numbers at the community level. The ADOL nonagricultural wage andsalary statistics used in this report do measure employees of seafood processingfirms; the numbers are reported in table 11.
Table 12—Wood products and total nonagricultural wage and salaryemployment in Haines, Sitka, and Wrangell, 1990-95 a
1990-95Employment 1990 1991 1992 1993 1994 1995 change
- - - - - - - Annual equivalent - - - - - - Percent
Haines:Wood products 141 60 9 34 28 10 -93Other employment 750 761 678 803 811 781 4
Total 891 821 688 836 839 791 -11
Sitka:Wood products 404 407 412 343 25 14 -97Other employment 3,653 3,477 3,482 3,667 3,709 3,751 3
Total 4,057 3,884 3,895 4,011 3,734 3,765 -7
Wrangell:Wood products 162 196 224 272 234 21 -87Other employment 721 716 744 771 819 792 10
Total 883 912 968 1,043 1,053 813 -8
Southeast Alaska:Wood products 3,543 3,069 2,863 2,650 2,225 2,002 -43Other employment 32,241 32,574 33,190 33,775 34,838 35,305 10
Total 35,784 35,643 36,053 36,425 37,063 37,307 4
a Nonagricultural wage and salary employment, annual equivalent excludes proprietors and self-employed.Source: Alaska Department of Labor 1996a.
53
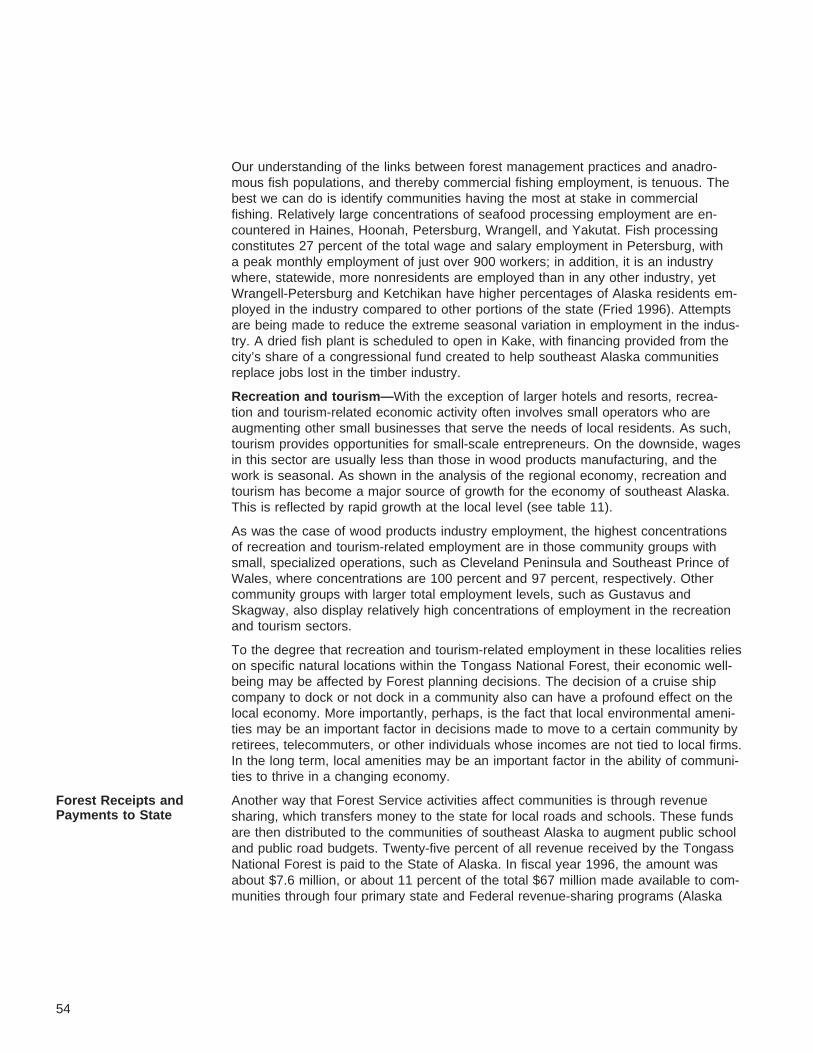
Our understanding of the links between forest management practices and anadro-mous fish populations, and thereby commercial fishing employment, is tenuous. Thebest we can do is identify communities having the most at stake in commercialfishing. Relatively large concentrations of seafood processing employment are en-countered in Haines, Hoonah, Petersburg, Wrangell, and Yakutat. Fish processingconstitutes 27 percent of the total wage and salary employment in Petersburg, witha peak monthly employment of just over 900 workers; in addition, it is an industrywhere, statewide, more nonresidents are employed than in any other industry, yetWrangell-Petersburg and Ketchikan have higher percentages of Alaska residents em-ployed in the industry compared to other portions of the state (Fried 1996). Attemptsare being made to reduce the extreme seasonal variation in employment in the indus-try. A dried fish plant is scheduled to open in Kake, with financing provided from thecity’s share of a congressional fund created to help southeast Alaska communitiesreplace jobs lost in the timber industry.
Recreation and tourism— With the exception of larger hotels and resorts, recrea-tion and tourism-related economic activity often involves small operators who areaugmenting other small businesses that serve the needs of local residents. As such,tourism provides opportunities for small-scale entrepreneurs. On the downside, wagesin this sector are usually less than those in wood products manufacturing, and thework is seasonal. As shown in the analysis of the regional economy, recreation andtourism has become a major source of growth for the economy of southeast Alaska.This is reflected by rapid growth at the local level (see table 11).
As was the case of wood products industry employment, the highest concentrationsof recreation and tourism-related employment are in those community groups withsmall, specialized operations, such as Cleveland Peninsula and Southeast Prince ofWales, where concentrations are 100 percent and 97 percent, respectively. Othercommunity groups with larger total employment levels, such as Gustavus andSkagway, also display relatively high concentrations of employment in the recreationand tourism sectors.
To the degree that recreation and tourism-related employment in these localities relieson specific natural locations within the Tongass National Forest, their economic well-being may be affected by Forest planning decisions. The decision of a cruise shipcompany to dock or not dock in a community also can have a profound effect on thelocal economy. More importantly, perhaps, is the fact that local environmental ameni-ties may be an important factor in decisions made to move to a certain community byretirees, telecommuters, or other individuals whose incomes are not tied to local firms.In the long term, local amenities may be an important factor in the ability of communi-ties to thrive in a changing economy.
Forest Receipts andPayments to State
Another way that Forest Service activities affect communities is through revenuesharing, which transfers money to the state for local roads and schools. These fundsare then distributed to the communities of southeast Alaska to augment public schooland public road budgets. Twenty-five percent of all revenue received by the TongassNational Forest is paid to the State of Alaska. In fiscal year 1996, the amount wasabout $7.6 million, or about 11 percent of the total $67 million made available to com-munities through four primary state and Federal revenue-sharing programs (Alaska
54

Department of Community and Regional Affairs, no date). Despite comprising just11 percent of this total, Federal payments have gained importance to communitiesin recent years because, as mentioned above, state revenue sharing has steadilydeclined since the early 1980s.
The Tongass contributes nearly all the Federal revenue sharing under the 25-percentfund because nearly all timber harvest (the principal source of revenue) occurs there;the Chugach National Forest contributes less than 1 percent of the total. Total re-ceipts for the Tongass National Forest are shown in figure 20. The most strikingaspect of the chart is the extreme variation in revenues received by the Forest. The1980-95 average income was over $20 million, but yearly income over that periodranged from about $46 million in 1980 to -$2.6 million in 1987.19 Later peaks occurredin the boom years of 1990 and 1991, but 1994 also posted one of the highest reve-nue years on record in spite of declining timber harvest volumes. Payments to Alaskaboroughs (25 percent of the total revenue) varied directly with revenues except for1987, when negative forest revenues resulted in zero payment to the boroughs. Aver-age payments to the State of Alaska were $5 million over the 1980-95 period.
Total forest revenues consist of forest receipts, actual cash payments received bythe National Forest, and capital improvements, capital goods received by the Forestusually in lieu of payment—the bulk of which are roads. Since 1980, forest receiptshave comprised, on average, about 15 percent of total Forest revenues; capital im-provements, on the other hand, constitute over 84 percent and thus are the drivingforce behind revenues and subsequent payments to the State of Alaska.
Figure 20–Total Tongass National Forest receipts in real 1995 dollars, fiscal years 1975-96. All dollarfigures are in 1995 dollars, adjusted for inflation by using the U.S. producer price index. Source: USDAForest Service 1996b.
19 Tongass receipts in FY 1987 were negative due toa comptroller decision to retroactively implement theemergency rate redeterminations for short-term sales.Without the reduction, Tongass receipts would have beenpositive by $2.1 million. As a result of the negative receipt,no payments to the State of Alaska were made in that year.
55

Almost 90 percent of forest receipts are comprised of revenues from timber sales, sodecreases in harvest levels can result in substantial drops in these Federal revenuesharing payments. Other revenue sources within this category are recreational userfees, payments for power line rights-of-way, fees paid by mineral developers, andother land use fees. At 80 percent of total capital improvements, purchaser roadcredits is the largest revenue source both within this category and within total For-est revenue. These credits are road construction expenditures undertaken primarilyby logging firms that are then reimbursed by the National Forest in reduced cashpayments for timber. The roads and related facilities remaining after harvest is com-pleted are the property of the Federal Government. Other capital improvements in-clude investments in forest stand regeneration and improvements or other silviculturalactivities, which are aimed at either augmenting the future sale value of forest standsor meeting other Tongass objectives.
Incorporated boroughs receive payments based on the acres of Federal land withinthe borough boundary. Historically, 100 percent of the payments to boroughs havebeen spent on public schools. Table 13 shows how payments for schools over thepast 5 years have been distributed across boroughs and the amounts per student.The 1995-96 range was quite broad, with per-student funding ranging from $117 perstudent in Ketchikan Borough to $3,219 per student in Yakutat Borough. Boroughswith large amounts of Federal land and small population, such as Yakutat, receivemore payment per student than those having larger populations, such as Juneau.
Unincorporated areas receive funds based on miles of public roads and public schoolenrollment, with 25 percent of their funding going to roads and the other 75 percentto schools. Several of the smaller communities are a part of a public school contractwith each community’s funding going to the organization as a whole. Table 13 dis-plays enrollment and the per-student payments made from 1991 through 1996.Basing the allocation in part on student enrollment has the obvious effect of equalizingthe payments per student.
Community Resiliency The preceding discussion described employment and economic diversity as keycomponents of communities, consistent with the purpose and narrow focus of thisassessment. Any discussion of communities would be incomplete, however, withoutmention of some other variables that affect the economic and social well-being ofresidents, and the community’s ability to adapt to changing conditions. Researchershave used the term “community resiliency” (Harris and others 1996) or “communitycapacity” (FEMAT 1993) to describe a community’s ability to weather significantchanges. These terms resemble the earlier concept of community stability that,although defined in many different ways, had some common elements: “Communitystability is best defined as a process of orderly change...the prosperity, adaptability,and cohesiveness of people living in a common functional geographic area and theirability to absorb and cope with change” (Society of American Foresters 1989).
Some of the factors judged important for small, rural communities in the Pacific North-west include community infrastructure, the presence of amenities, social cohesionand effective community leadership, and economic diversity (Harris and others 1996).Although information such as population size can be used as a rough proxy for resil-iency (generally, larger communities tend to be more resilient than smaller ones), thisis not always the case, and population size and economic diversity are not the onlyimportant determinants of community vitality and resiliency. The presence of adequateinfrastructure to accommodate existing residents and future growth also is a key con-sideration, as is the relative level of social cohesion and strength of local leadership.
56

Table 13—Southeast Alaska public school enrollment and Tongass NationalForest 25 percent fund payment per student, school years 1991-95
Enrollment and expenditure by School yearschool districta 91-92 92-93 93-94 94-95 95-96
Incorporated boroughs:b
Haines Borough—School enrollment 450 434 400 414 439Expenditure per student (1995$)c 1,254 446 535 1,188 949
City and Borough of Juneau—School enrollment 5,199 5,448 5,408 5,372 5,531Expenditure per student (1995$) 196 64 71 172 141
Ketchikan Gateway Borough—School enrollment 2,797 2,799 2,886 2,873 2,890Expenditure per student (1995$) 164 56 60 139 117
Sitka Borough—School enrollment 1,837 1,887 1,903 1,828 1,802Expenditure per student (1995$) 607 203 223 532 455
Yakutat Borough—School enrollment 130 133 149 163 173Expenditure per student (1995$) 1,405 1,945 1,921 4,034 3,219
Unincorporated areas:d
Chatham schools—e
School enrollment 378 357 336 335 342Expenditure per student (1995$) 1,388 431 474 1,062 900
Southeast Island schools—f
School enrollment 427 416 430 381 369Expenditure per student (1995$) 1,437 443 469 1,094 865
Annette Island School—School enrollment 416 411 388 406 420Expenditure per student (1995$) 1,421 433 512 1,129 965
Craig—School enrollment 305 355 367 385 427Expenditure per student (1995$) 1,437 443 488 1,123 906
Hoonah—School enrollment 239 268 259 262 273Expenditure per student (1995$) 1,371 443 503 1,081 915
Hydaburg—School enrollment 120 119 109 110 103Expenditure per student (1995$) 1,383 429 489 1,067 921
Kake—School enrollment 181 178 175 184 193Expenditure per student (1995$) 1,426 439 488 1,097 903
57
Table 13—Southeast Alaska public school enrollment and Tongass NationalForest 25 percent fund payment per student, school years 1991-95 (continued)
Enrollment and expenditure by School yearschool districta 91-92 92-93 93-94 94-95 95-96
Klawock—School enrollment 207 200 202 193 212Expenditure per student (1995$) 1,427 445 507 1,170 948
Pelican—School enrollment 46 44 45 47 35Expenditure per student (1995$) 1,392 466 487 1,042 997
Petersburg—School enrollment 702 703 698 757 754Expenditure per student (1995$) 1,395 443 497 1,094 912
Skagway—School enrollment 160 172 143 128 134Expenditure per student (1995$) 1,264 392 489 1,085 894
Wrangell—School enrollment 527 521 500 573 550Expenditure per student (1995$) 1,399 439 528 1,080 921
a Enrollment is taken each year on October 1.b Incorporated boroughs receive a share of National Forest income proportional to the area of the NationalForest located within its boundaries.c All dollar figures are in 1995 dollars, adjusted for inflation by using the U.S. producer price index.d Unincorporated boroughs receive a share of National Forest income proportional to the number ofchildren in average daily membership of the city school district or regional educational attendance area.e Chatham schools include Angoon, Cube Cove, Elfin Cove, Gustavus, Hobart Bay, Klukwan, andTenakee Springs.f Southeast Island schools include Coffman Cove, Edna Bay, Hollis, Kasaan, Meyers Chuck, Naukati Bay,Port Alexander, Port Protection, Thorne Bay, and Whale Pass.Sources: Alaska Department of Community and Regional Affairs 1996, Alaska Department of Education1996.
58

The importance of the human capital factor cannot be overstated. There are manyexamples of communities lacking economic diversity, population, and amenities thathave weathered storms because they have refused to give up. Humans are highlyadaptable and have a variety of mechanisms to cope with change. At the communitylevel, one indicator of this ability is the presence of planning and leadership functionsand abilities. Successful prior completion of action plans, community visioning proces-ses, economic development plans, and similar products can reflect a community’sresiliency.
Analyses have not been conducted regarding the resiliency of southeast Alaska com-munities, and we do not know how well information gained elsewhere applies tounderstanding southeast Alaska communities. The unique mixed economy of ruralAlaska communities, for example, is one central distinction. In this absence, we canexplore resiliency by taking a closer look at three communities that have experiencedrapid changes, all due to mill closures: Haines, Sitka, and Wrangell.
The sawmill in Haines, which employed 135 people, closed in May 1991. Followingmill closure, sales receipts dropped off, and population and school enrollment de-creased. Employment in other sectors, such as lodging, restaurants, and recreation,also showed abrupt declines. In subsequent years, school enrollment increased(although not quite to premill-closure levels), and population levels remained fairlysteady, as have housing prices.
Sitka lost its largest employer when the APC pulp mill closed in September 1993.Many individuals and families suffered greatly, and for some this continues today. Thiswas not just a major loss in employment, but in income; the mill jobs, on average,paid 84 percent more than other wage jobs in Sitka (Lane 1994). Employment in con-struction, wholesale trade, and transportation industries declined as well when the millclosed. School enrollment showed a decrease in the two subsequent years, as didpopulation, which remains below the 1993 level. Housing prices have continued to in-crease and rental prices, although fluctuating, have not dropped; vacancy rates re-main slightly higher than in 1993.
A State of Alaska report (Tromble 1996) notes that, “Only strong, fortuitously timedgrowth in other industries cushioned the community from the full blow of the millclosure. So far, Sitka has weathered its loss surprisingly well.” The Kendall Founda-tion report (Smith 1996; described in “ Regional Conditions and Trends”) also statesthat, “The city of Sitka has survived the closing of the Alaska Pulp Corporation milland community indicators, on balance, seem positive....Sitka benefits from havingseveral year-round institutional payrolls.” The city continues to work through this andother changes, from both social and economic perspectives, and the long-term effectsof mill closure are uncertain.
59

Another case study is provided by Wrangell, where the APC sawmill, which employed225 people and accounted for 23 percent of the wage and salary jobs and 30 percentof Wrangell’s payroll wages (Boucher 1994), closed at the end of 1994. The impactof losing its largest employer spiraled through Wrangell, with declines in wholesaletrade, transportation, service, and financial-insurance-real estate sectors. City salestax revenues fell 12 percent from the first quarter of 1994 to the first quarter of 1995,compared to previous annual increases of about 4 percent (Tromble and Boucher1995). School enrollment decreased and rental vacancy rates have increased sub-stantially. In addition, some types of impacts do not occur for 1 to 2 years due to tran-sition programs, payments, unemployment insurance, and other mechanisms, so addi-tional socioeconomic effects may well occur.
Lacking the population size and economic diversity of a community like Sitka,Wrangell faces a tougher struggle in reestablishing a local economy. The city’sOverall Economic Development Plan (City of Wrangell 1996) contains a number ofeconomic goals—many defined prior to mill closure—that could help rebuild the eco-nomy and lessen the likelihood of similar devastating events in the future. Theyinclude diversifying the economy so that it is not dependent on a single employer orindustry, encouraging year-round and long-term employment, enhancing the quality oflife for existing residents, encouraging new businesses, and strengthening the educa-tional system.
These goals and others identified by community leaders and residents are likely tobe achieved given Wrangell’s sizable share (about $32 million over 4 years) of the$110 million being distributed to southeast Alaska communities through the South-east Alaska Economic Fund (under the Balanced Budget Down Payment Act of 1996[U.S. Public Laws, Statutes, etc.; Public Law 104-134]). Congress designed this fundto provide immediate assistance to timber-dependent communities in southeastAlaska because of recent drops in timber harvest on the Tongass.
The evidence suggests that mill closures have had a strong and lasting impact onthese communities. At the same time, it is also evident that, at least in the case ofSitka and Haines, other sectors within these communities have continued to grow de-spite the loss in wood products employment. Short-term effects may not be the sameas long-term ones; a community’s resiliency and leadership can contribute to miti-gating the effects of economic blows, and it is clear that impacts must be viewed inthe context of a dynamic economy. Given a continued favorable economic climate inthe region, it is likely that non-wood products-related employment in these communi-ties will continue to expand, and growth rates may eventually match those of othercommunities in the region. Additional exploration of the resiliency of southeast Alaskacommunities could benefit community development efforts and management of theTongass.
Conclusions This section summarizes key findings and addresses some of the managementconsiderations flowing from the analyses in this report. Similar to the other TLMP-generated assessments, this is done through a series of questions. It also incor-porates suggestions for additional research to provide public land managers andstakeholders with a better understanding of social and economic trends and theirrelation to management of the Tongass National Forest.
60

The reader is reminded that this paper has taken a generally narrow view of thesocioeconomic dimensions of the Tongass, concentrating mostly on relatively directmeasures of economic activity and demographics. This does not mean that otheraspects, such as lifestyles, environmental amenities, and existence values are notimportant. On the contrary, they are extremely important and constitute a major re-source enjoyed primarily by the residents of southeast Alaska and other stakeholders.A major challenge in the future will be to develop measures for these aspects that,while unavoidably imprecise, will accurately measure general trends and can be easilycollected and updated.
1. What broad economic trends should public land managers be aware of asthey implement ecosystem management in the Tongass National Forest?
The various indicators of economic conditions discussed here do not present aunified, consistent picture of southeast Alaska’s economy. The region is experiencingannual growth in employment that exceeds the national level, but the rate is slowingrelative to past years. Total personal income, although rising, is not increasing asmuch as the national average, and per capita personal income is declining, due pri-marily to a steady annual drop in real average earnings per job. Although southeastAlaska residents earn more (on average) than the U.S. population, the difference hasdecreased over the last 10 years.
The seasonality of many jobs leads to unemployment rates that fluctuate widely bymonth, and the proportion of nonresidents working in many natural resource-basedoccupations means that much income does not stay in Alaska. Economic diversity—the balance of employment among various industries and one measure of economichealth—is generally lower in southeast Alaska than in other parts of the country. Theuniqueness of southeast Alaska in terms of population density, lack of a developedroad system, role of subsistence, reliance on natural resources, and other characteris-tics make direct comparisons with the U.S. economy difficult and, sometimes, notvery meaningful.
The analyses found major differences in economic structure and performance amongsoutheast Alaska’s boroughs and census areas, in such measures as growth in per-capita income, economic diversity, proportion of employment in resource-dependentindustries, and population growth. Northern boroughs, for example, are less reliant onthe wood products industry for their employment base and contain higher proportionsof employment in recreation and tourism. As would be expected, differences becomemore pronounced at the community level. It is difficult to generalize at this scale; thelimited number and unique characteristics of each community make aggregationproblematic.
Communities and community groups differ in many of the same ways that boroughsdo, only the differences tend to be more extreme. For example, community groupsas well as boroughs have tended to show slower rates of employment growth in the1990s than they did in the 1980s, but some groups of communities show the oppositetrend. Communities differ greatly in the proportion of employment derived from thewood products, tourism, and fishing industries. This was reflected in the message agroup of mayors brought to Washington, DC, in 1997: “the Southeast contingent didnot discuss timber harvest levels, because each community has different views”(Mills 1997).
61

As a result, social and economic conditions and trends need to be studied andunderstood at multiple scales. Similarly, analysis of effects of changes in public landmanagement and other policies need to be assessed at multiple scales to avoid a“one size fits all” discussion of impacts that will not measure effects on anyone.
2. What are trends in employment for the region’s primary natural resource-based industries (wood products, fish harvesting and seafood processing,recreation and tourism, and mining)?
The share of natural resource-based sectors relative to other employment sectors hasremained fairly constant recently, but the mix of industries within that share is shifting.Employment in the wood products industry has declined 41 percent since 1990, witha loss of nearly 1,500 jobs, the largest drop in any of the resource-dependent (orother) industries. The recent declines in timber harvest on both private and TongassNational Forest lands are expected to continue, posing further risk to the industry. Inturn, communities that rely on wood products, through logging, sawmill operations, orpulp mills, have lost a major employer, with social and economic effects that ripplethrough the community.
The long-term effects on southeast Alaska communities are unknown, but it should beclear that the industries and communities dependent on them are most at risk in theshort term from further reductions. Related effects could include decreasing revenuesto communities from taxes, decreasing real estate prices, increasing utility costs,increasing school costs per student, and decreasing school funding from state andFederal funds based on number of students. Impact estimates must take into accountthat economies are dynamic; one cannot talk about job loss without considering jobgrowth. The attraction of southeast Alaska’s amenities may become a draw not justfor tourists, but for residents not linked to specific locations by employment, as isalready happening in other parts of the United States. The $110 million being distrib-uted to southeast Alaska communities through the Southeast Alaska Economic Fundof 1996 is being used to mitigate the effects of reduced timber harvests, as are var-ious other programs, such as the Interagency Southeast Alaska Community EconomicRevitalization Team (SEACERT).
The level of employment in fishing and seafood processing exhibits more stability,although shifts among permit holders may have distributive effects. Links with man-agement of the Tongass are more difficult to determine, but communities with concen-trations of fishing activity, such as Petersburg or Pelican, are sensitive, especially overthe long term, to changes in management of the Tongass. The degree of protectionof habitat for species that use Tongass streams and rivers is probably the key var-iable within Forest Service control; as noted in the fisheries section of the revised sup-plement to the draft environmental impact statement on Tongass land managementplan revision (USDA Forest Service 1996b), many other factors significantly contributeto employment in the fishing industry.
62

The tourism industry is the fastest growing of the natural resource industries, and con-tinued growth is expected. On the whole, impacts to the recreation and tourism indus-try can be expected to be far more diffuse than those for wood products. The recrea-tion and tourism industry is characterized by smaller firms, so the closure of a singlefirm represents a much smaller proportion of the total local employment than would asawmill. Recreation and tourism-related employment is more evenly distributed amongthe communities of southeast Alaska, with all the larger community groups showingan employment concentration of more than 5 percent in the lodging, restaurant, andrecreation services sectors. Consequently, any policy decision decreasing the overallattractiveness of the region to outside visitors would most likely be felt (to variousdegrees) throughout the region. For employment in the recreation industry, the abilityof the Forest Service to meet projected use levels for semiprimitive motorized recrea-tion opportunities may be another key variable.
Communities that have specialized in recreation and tourism may be just as suscep-tible to developments beyond their control (such as changes in the docking locationsof cruise ships) as are communities that have specialized in timber; for example, Sitkaexpects a 29-percent drop in cruise passengers as one company shifts more of itsstops to Skagway (Tromble 1997). Different portions of the economy should not beviewed as substitutable; growth in one sector may not compensate for declines inanother.
Although not dealt with in detail in this paper, subsistence is another use that is bothdirectly and indirectly affected by management of the Tongass. Subsistence is a sub-stantial component of the rural economy of southeast Alaska, and may contribute sub-stantially to the resiliency of rural communities. Timber harvest and other land usesaffect the quality and quantity of habitat available for many species. Road construc-tion can increase access for subsistence, sport, and commercial users, as well asaffect habitat. Regulations proposed by state and Federal wildlife managers that de-termine subsistence users’ limits, harvest methods, and seasons take into accountconditions created through Tongass management. The continuous updating of sub-sistence harvest information at the community scale by the Alaska Department of Fishand Game may help to answer some of the questions relating subsistence use tomanagement of the Tongass, but additional ethnographic studies would complementthis harvest information.
Future long-term research to explore relations between ecosystem conditions and op-portunities in the Tongass and the health and resiliency of southeast Alaska com-munities is needed to provide a better baseline for assessing risk and possible socio-economic effects of forest management. Information on how management of the for-est affects tourism and fishing opportunities and employment would supplement thebetter knowledge available for the timber industry. Links among the industries and abetter understanding of how impacts in one resource-dependent sector affect thosein another would complement those studies. Additional study is needed on how wellthe “Lodging, Restaurant, and Recreation” sector actually represents the recreationand tourism industry.
63

3. How well equipped are the communities of southeast Alaska to successfullydeal with the social, economic, and environmental changes facing them? Docommunities differ in this capacity?
Analysis of key statistics at the borough and local levels indicates a high degree ofvariance in economic performance among different communities and different periods.This variance is not surprising given the small size and lack diversity of many south-east Alaska communities and is to be expected, especially in timber-dependent com-munities where global market swings and forest management decisions will largelydictate local developments in the timber economy. Few southeast Alaska communitiesdemonstrate a high level of economic diversity; even the largest city, Juneau, de-pends greatly on a single sector—government—for employment. The effects of amajor change (such as moving the capital) would likely have as abrupt an effect onJuneau as would closing the mill in a mill town.
In either case, reliance on a single industry may lead to greater instability and lowerresilience to change over the long term. For certain of the larger communities (notablyJuneau, Sitka, and Ketchikan), a reasonably diverse economy in conjunction with adeveloped physical and social infrastructure should allow for a reasonable degree ofeconomic stability. Most communities that have vision statements, overall economicdevelopment plans, and similar documents have formally recognized the merits ofeconomic diversity and are working toward this goal. In other, smaller, communitiesthe opportunity to grow and diversify may be more limited, although subsistenceactivities play a large role in maintaining quality of life.
Additional research on the characteristics of communities and their relation to com-munity resiliency should be undertaken. We do not know if models of resiliencydeveloped elsewhere are equally applicable to southeast Alaska, but similar method-ologies (Harris and others 1996, for example) could be applied to test such hypoth-eses. An important component of such techniques is combining information aboutcommunities, such as population, location, access, infrastructure, and economic diver-sity (Force and others 1995), with perceptions from local leaders and residents aboutthe adequacy of existing conditions and the quality of life in their community. Thecommunity self-assessment workshops used in the interior Columbia basin study(Harris and others 1996) worked well to obtain this type of information. In addition,surveys of southeast Alaska residents on their beliefs, attitudes, and opinions re-garding natural resources and public land management would provide Forest man-agers and stakeholders with baseline information that could then be used to track theacceptability and benefits associated with project activities and Forest plan revisions(Stankey and Clark 1992).
4. One of the criticisms received by the Tongass Land Management Planningteam was the lack of a community-by-community description of the number ofjobs lost or created (and related economic and social impacts) under eachalternative. What are the problems associated with this type of impact analysisand how can they be overcome?
There are several reasons why it is problematic to assess the effects of a program-matic plan on employment in individual communities. First, the analysis must bebased on available trend data, which is limited to community groups rather than com-munities. Another reason is that Forest Service activities provide economic opportuni-ties to the private sector; how that sector and various industries respond depends on
64

many variables in addition to Forest Service management. Complex social and econo-mic forces have great influence on community economics—many of which, such ascorporate decisions, may be outside the control of community residents.
Another problem in analyzing community-specific employment effects is that Forestplans are programmatic, meaning that they establish direction and allowable activitiesfor broad land areas, rather than schedule specific activities on specific units of land.The associated lack of specificity is a common source of frustration to local residents,who want to know exactly how they and the places they care about will be affected.Even though many outputs of forest management, such as scheduled timber harvest,generally translate into social and economic activity, such as employment in the tim-ber industry, it can be difficult to predict which communities will benefit the most fromthat activity. Communities may even compete with each other in some instances.Communities that rely on a given resource-related industry would be expected to bethe first to benefit or lose from significant changes in planned output levels affectingthat industry.
Another factor questioning the accuracy of predicting specific impacts at the com-munity scale is that people and businesses have proven themselves highly adaptable.Community resiliency can be both an intervening and a dependent variable; a resilientcommunity can weather effects better than a less resilient one, but resiliency itselfalso can be affected. A systematic study of the resiliency of southeast Alaska com-munities has not been conducted, but would be very helpful in assessing effects atboth the project and Forest levels.
Given these considerations, it is more accurate to identify areas of concern for whichthe risks of effects from a given alternative are higher or lower than it is to state cer-tainties; to do the latter would be presumptuous, as though people are incapable ofresponding to change. It is also critical to remember that impact assessment must beviewed in the context of dynamic economies, so it is inappropriate to assume a staticapproach that reduces employment in one sector while ignoring growth or interactionswith other sectors.
Sufficient information is available at the community or community group level fordecision makers to be able to describe the primary risks inherent under each man-agement alternative at the community scale. Such an effort ideally would include asystematic effort to identify the perceptions of community residents regarding likelyimpacts to their community. In the absence of this, public comments could be usedas a proxy for community concerns, although this should not be viewed as a sub-stitute for more valid, reliable methods of data collection. Over the next few years,Forest Service social scientists and economists (working with local, state, private,and other Federal scientists, stakeholders, and managers) will seek improved waysto translate forest policy and management changes into impacts on communities.
5. The wood products sector has experienced the greatest decline of all eco-nomic sectors in the 1990s. What are the implications of closure of the lastpulp mill in southeast Alaska for the wood products industry?
Mill closures, especially the recent closure of the KPC mill in Ketchikan, exert a strongand continuing influence on the economic viability of logging firms and the remainingmills in the region, as well as on the profitability of the timber sale program. In onesense, the mill closures mean less competition for raw materials among remaining
65

processors and thus could benefit their operations. Closure of the KPC mill eliminatedthe region’s major market outlet for mill residues, the sale of which constituted animportant part of sawmill revenues, especially in peak years for pulp and wood chipprices.
The KPC mill also consumed a large quantity of lower grade logs. Historically, slightlyover half of all timber harvested on the Tongass was used in the production of woodchips and pulp. In addition to utility grade logs, large proportions of number 3 and 4saw logs and even a small proportion of number 2 saw logs were chipped and pulpedrather than sawn. With the closure of the pulp mill, one of the major challenges forlocal sawmills is either to increase their efficiency in log use (and thereby minimizethe generation of residues) or find new markets for their residues and reject materials.For the forest sector in general, the major challenge will be to find suitable marketsfor the large volumes of lower grade material that are interspersed with the relativelysmaller volumes of higher valued saw logs. Private timber owners can either exportthese materials or leave them in the woods, while National Forest timber harvestedmust be removed and processed locally.
A number of different possibilities for processing lower grade material as well asvalue-added processing of higher grades have been examined by government andprivate industry, but all such proposals must overcome the high cost of labor andother inputs prevalent in southeast Alaska. Successful projects need to identify fea-sible products that rely on the specific characteristics of southeast Alaska timber,rather than attempt to compete directly with other, lower cost, regions and countriesin the production of commodity goods. The production of music board from Sitkaspruce is a good example of using high-value materials; market niches for lower valuematerials will continue to be explored. Ending of the long-term contracts also shouldopen the market for smaller companies and entrepreneurs who position themselvesto take advantage of industry changes.
From the standpoint of the timber industry, another need is to establish a stable tim-ber supply. Current uncertainty related to the Tongass planning process and the pos-sibility of litigation on current and future sales has purportedly dampened the enthu-siasm of local lenders to provide capital for wood products operations. Completion ofthe plan revision may eliminate much of this uncertainty regarding future supply.Nevertheless, it must be recognized that the plan does not constitute a guarantee,and that individual firms are expected, and even required, to compete in the purchaseof timber for harvest and processing. The Tongass is not the only source of timber inthe region. Private ownerships provide roughly half of the total harvest volumes,another consideration for southeast Alaska mills.
6. What strategies seem to have the greatest potential for addressing ongoingsocioeconomic concerns regarding management of the Tongass?
Past experience suggests that once a land management plan is signed, the issuesdebated during its development do not go away. Many of the debates over resourceallocation are grounded in differences in human values—values that tend to endureover time. Recognizing that controversy will continue during implementation and pro-viding a way for it to be dealt with constructively over time (instead of again andagain, project by project) through an existing or new institution is one effective way to
66
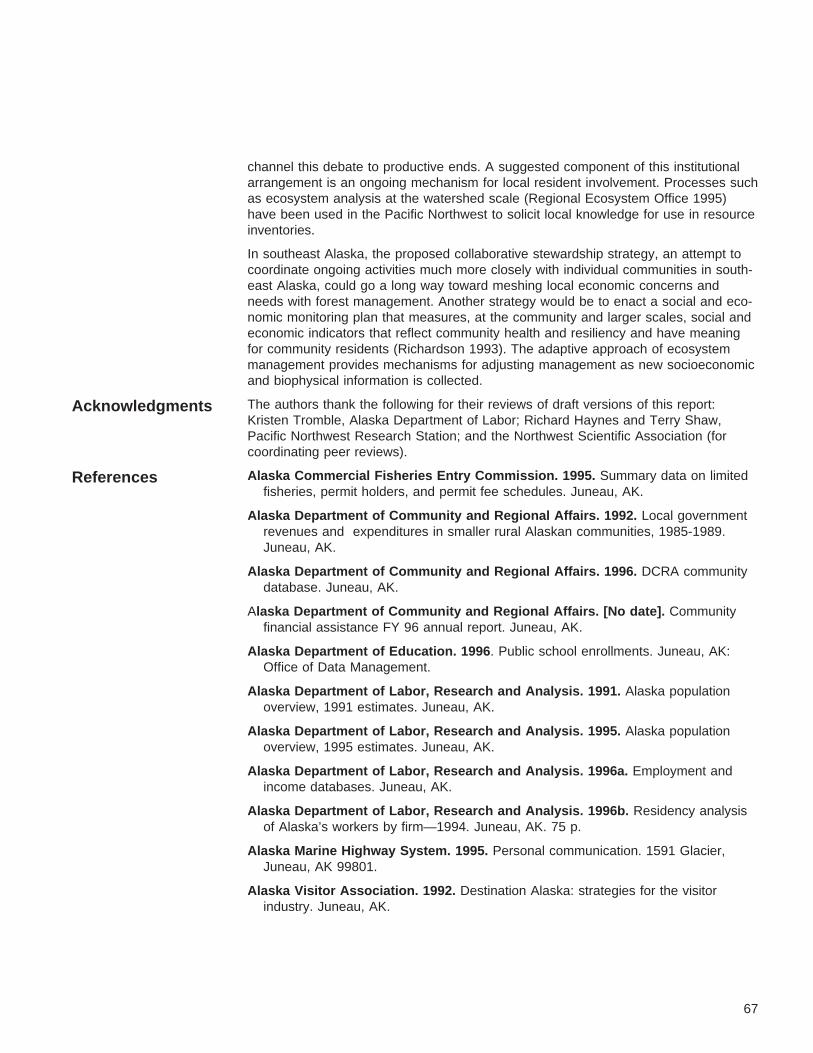
channel this debate to productive ends. A suggested component of this institutionalarrangement is an ongoing mechanism for local resident involvement. Processes suchas ecosystem analysis at the watershed scale (Regional Ecosystem Office 1995)have been used in the Pacific Northwest to solicit local knowledge for use in resourceinventories.
In southeast Alaska, the proposed collaborative stewardship strategy, an attempt tocoordinate ongoing activities much more closely with individual communities in south-east Alaska, could go a long way toward meshing local economic concerns andneeds with forest management. Another strategy would be to enact a social and eco-nomic monitoring plan that measures, at the community and larger scales, social andeconomic indicators that reflect community health and resiliency and have meaningfor community residents (Richardson 1993). The adaptive approach of ecosystemmanagement provides mechanisms for adjusting management as new socioeconomicand biophysical information is collected.
Acknowledgments The authors thank the following for their reviews of draft versions of this report:Kristen Tromble, Alaska Department of Labor; Richard Haynes and Terry Shaw,Pacific Northwest Research Station; and the Northwest Scientific Association (forcoordinating peer reviews).
References Alaska Commercial Fisheries Entry Commission. 1995. Summary data on limitedfisheries, permit holders, and permit fee schedules. Juneau, AK.
Alaska Department of Community and Regional Affairs. 1992. Local governmentrevenues and expenditures in smaller rural Alaskan communities, 1985-1989.Juneau, AK.
Alaska Department of Community and Regional Affairs. 1996. DCRA communitydatabase. Juneau, AK.
Alaska Department of Community and Regional Affairs. [No date]. Communityfinancial assistance FY 96 annual report. Juneau, AK.
Alaska Department of Education. 1996 . Public school enrollments. Juneau, AK:Office of Data Management.
Alaska Department of Labor, Research and Analysis. 1991. Alaska populationoverview, 1991 estimates. Juneau, AK.
Alaska Department of Labor, Research and Analysis. 1995. Alaska populationoverview, 1995 estimates. Juneau, AK.
Alaska Department of Labor, Research and Analysis. 1996a. Employment andincome databases. Juneau, AK.
Alaska Department of Labor, Research and Analysis. 1996b. Residency analysisof Alaska’s workers by firm—1994. Juneau, AK. 75 p.
Alaska Marine Highway System. 1995. Personal communication. 1591 Glacier,Juneau, AK 99801.
Alaska Visitor Association. 1992. Destination Alaska: strategies for the visitorindustry. Juneau, AK.
67

Alves, W. 1979. Residents and resources: findings of the Alaska public survey onthe importance of natural resources to the quality of life in southeast Alaska: areport for the USDA Forest Service, Region 10. Anchorage, AK: Institute of Socialand Economic Research, University of Alaska.
Anadromous Fish Habitat Assessment Team. 1995. Report to Congress:anadromous fish habitat assessment. R10-MB-279. Juneau, AK: U.S. Departmentof Agriculture, Forest Service, Pacific Northwest Research Station; Alaska Region.[Irregular pagination].
Ashton, P.G.; Pickens, J.B. 1995. Employment diversity and economic performancein small, resource-dependent communities near western National Forests. Societyand Natural Resources. 8: 231-241.
Attaran, M. 1986. Industrial diversity and economic performance in U.S. areas.Annals of Regional Science. 20(2): 44-55.
Betts, M.F.; Wolfe, R.J. 1992. Commercialization of fisheries and the subsistenceeconomies of the Alaska Tlingit. Society and Natural Resources. 5: 277-295.
Boucher, J. 1994. Low August jobless rate belies winter worries. Alaska EconomicTrends. 14(11): 9-12.
Boucher, J. 1996. April jobless rate drops to 7.5%. Alaska Economic Trends. 16(7):17-20.
Brooks, D.; Haynes, R. 1994. Timber products output and timber harvests in Alaska:projections for 1992-2010. Gen. Tech. Rep. PNW-GTR-334. Portland OR: U.S.Department of Agriculture, Forest Service, Pacific Northwest Research Station.
Bundtzen, T.K.; Swainbank, R.C.; Clough, A.H. [and others]. [No date]. Alaska’smineral industry 1995. Spec. Rep. 50. Juneau, AK: State of Alaska, Division ofGeological and Geophysical Surveys.
City of Wrangell. 1996. Overall economic development plan. Wrangell, AK.
Force, J. E.; Fosdeck, D.; Machlis, G.E. 1995. Monitoring social indicators forecosystem management. [Place of publication unknown]: [Publisher unknown];report submitted to Interior Columbia Basin Ecosystem Management Project,Order # 43-0E00-5-5269.
Forest Ecosystem Management Assessment Team [FEMAT]. 1993. Forestecosystem management: an ecological, economic, and social assessment.Portland, OR: U.S. Department of Agriculture; U.S. Department of the Interior [andothers]. [Irregular pagination].
Fried, N. 1996. Alaska seafood processing—a growing job source? Alaska EconomicTrends. 16(3): 1-8.
Glass, R.J.; Muth, R.M.; More, T.A.; Kruse, J. 1995. Assessing developmentalimpacts on subsistence fishing: complications attributable to a mixed economicsystem. Society and Natural Resources. 8: 431-442.
Hadland, J. 1996. Nonresidents working in Alaska—1994. Juneau, AK: [Publisherunknown]; report prepared by Alaska Department of Labor, Research and AnalysisSection. 22 p.
68

Harris, C.; Brown, G.; McLaughlin, B. 1996. Rural communities in the inlandNorthwest. Moscow, ID: University of Idaho, College of Forestry, Wildlife, andRange Sciences; final report parts 1 and 2; submitted to the Interior ColumbiaBasin Ecosystem Management Project, Walla Walla, WA. 340 p.
Hoover, E. M.; Giarratani, F. 1984. An introduction to regional economics. NewYork: Alfred A. Knopf. 444 p.
Juneau Airport Manager’s Office. 1995. Personal communication. City andBorough of Juneau, 155 S. Seward St., Juneau, AK.
Juneau Convention and Visitors Bureau. 1995. Personal communication.369 S. Franklin, Juneau, AK 99801.
Kruse, J.; Frazier, R. 1988. Reports to the communities of southeast Alaska:Tongass resource use cooperative survey. Anchorage, AK: Institute of Social andEconomic Research, University of Alaska–Anchorage. One report per community.
Kruse, J.A.; Muth, R.M. 1990. Subsistence use of renewable resources by ruralsoutheast Alaska residents. [Place of publication unknown]: U.S. Department ofAgriculture, Forest Service; University of Alaska–Anchorage; final report underU.S. Department of Agriculture, Forest Service–University of Alaska cooperativeagreement PNW 88-553. 160 p.
Lane, T. 1994. City and Borough of Sitka. Alaska Economic Trends. 14(3): 5-8.
McDowell Group. 1989. Alaska seafood industry study—a technical report: aneconomic profile of the seafood industry in Alaska. Juneau, AK.
McDowell Group. 1991. Alaska’s visitor industry: an economic profile. Juneau, AK;report prepared for Alaska Division of Tourism, Department of Commerce andEconomic Development.
McDowell Group. 1992. Direct revenues to the State of Alaska from the visitorindustry. Juneau, AK; report prepared for the Alaska Visitors Association.
McDowell Group. 1993a. Alaska’s visitor patterns, opinions, and planning. Juneau,AK; report prepared for Alaska Division of Tourism, Department of Commerce andEconomic Development.
McDowell Group. 1993b. Alaska visitor arrivals. Juneau, AK; report prepared forAlaska Division of Tourism, Department of Commerce and Economic Development.
McDowell Group. 1994. Alaska visitor expenditures fall/winter 1993-94. Juneau, AK;report prepared for Alaska Division of Tourism, Department of Commerce andEconomic Development.
McDowell Group. 1995. The timber industry’s role in the economy of southeastAlaska. Juneau, AK; report prepared for the Alaska Forest Association.
McDowell Group. 1997. 25 years of progress: the economic impact of ANCSAcorporations on southeast Alaska. Juneau, AK; report prepared for SealaskaCorporation, July 1997, 48 p.
Miernyk, W.H. 1965. The elements of input-output analysis. New York: RandomHouse. 156 p.
Mills, B. 1997. Mayors return from D.C. Juneau Empire. March 26: 1. Juneau, AK.
69

Morse, Kathleen. 1992. Personal communication. Results of 1992 IMPLAN analysis.Regional economist, U.S. Department of Agriculture, Forest Service, AlaskaRegion, Box 21628, Juneau, AK 99802-1628.
Muth, R.M. 1989. Community stability as a social structure: the role of subsistenceuses of natural resources in southeast Alaska. In: Lee, R.G.; Field, D.R.; Burch,W.R., Jr., eds. Community and forestry: continuities in the sociology of naturalresources. Boulder, CO: Westview Press. 400 p.
Nakazawa, Anthony; Goldman, George. 1991. Subsistence on Federal public landsin Alaska: some economic impacts of four management alternatives. Arctic IssuesDigest. Fairbanks: University of Alaska—Fairbanks; October: 2-7.
Regional Ecosystem Office. 1995. Ecosystem analysis at the watershed scale:Federal guide for watershed analysis. Version 2.2, rev. Aug. 1995. Portland, OR:[Publisher unknown]. Available from: Regional Ecosystem Office, P.O. Box 3623,Portland, OR 97208.
Richardson, C.W. 1993. An analysis of the socioeconomic effects of Bureau of LandManagement resource management plans in western Oregon. Seattle, WA:Institute for Resources in Society, University of Washington; report prepared forU.S. Department of the Interior, Bureau of Land Management, Oregon StateOffice, Portland, OR. 171 p.
Roppel, P. 1983. Southeast Alaska—a pictorial history. Norfolk/Virginia Beach, VA:The Donning Company.
Shannon, C.E; Weaver, W. 1949. The mathematical theory of communication.Urbana, IL: The University of Illinois Press.
Smith, T.M. 1996. Letter dated June 3 to Phil Janik, Regional Forester, USDA ForestService, Alaska Region. On file with: Regional Forester’s Office, U.S. Departmentof Agriculture, Forest Service, Alaska Region, P.O. Box 21628, Juneau, AK, 99802.
Society of American Foresters. 1989. Report of the Society of American Forestersnational task force on community stability. Resour. Pol. Ser. Bethesda, MD.
Stankey, G.H.; Clark, R.N. 1992. Social aspects of new perspectives in forestry: aproblem analysis. Pinchot Institute for Conservation Monograph Series. Milford,PA: Grey Towers Press.
Swainbank, R.C.; Bundtzen, T.K.; Clough, A.H.; Henning, M.W. 1997. Alaska’smineral industry 1996: a summary. Inf. Circ. 42. Juneau, AK: State of Alaska,Division of Geological and Geophysical Surveys.
Tainter, Joseph A. 1996. Cultural conflict and sustainable development: managingsubsistence hunting in Alaska. Paper presented at annual conference of theInternational Boreal Forest Research Association; 1996 Aug. 19-23; St.Petersburg, Russia. 11 p.
Taylor, C.; Winter, S; Alward, G; Siverts, E.. 1993. Micro IMPLAN user’s guide.Fort Collins, CO: U.S. Department of Agriculture, Forest Service, Rocky MountainForest and Range Experiment Station.
Tromble, K. 1996. Timber debate burns through southeast. Alaska Economic Trends16(9): 17, 20.
70

Tromble, K. 1997. Will mining rescue southeast’s economy? Alaska EconomicTrends. 17(5): 15-20.
Tromble, K.; Boucher, J. 1995. The city of Wrangell. Alaska Economic Trends.15(8): 5-8.
U.S. Bureau of Economic Analysis. 1996. Regional economic information system,1969-94. [Place of publication unknown].
U.S. Department of Commerce, Bureau of the Census. 1990. 1990 census ofpopulation, social, and economic characteristics of Alaska. Washington, DC.
U.S. Department of Commerce, Bureau of the Census. 1996. Statistical abstractof the United States: 1996. Washington, DC.
U.S. Department of Agriculture, Forest Service. 1995. Mendenhall Glacier visitorcenter counts. On file with: Juneau Ranger District, 8465 Old Dairy Rd., Juneau,AK, 99801.
U.S. Department of Agriculture, Forest Service. 1996a. Timber supply anddemand, 1995. Report to Congress, ANILCA Section 706(a). Juneau, AK: AlaskaRegion.
U.S. Department of Agriculture, Forest Service. 1996b. Tongass landmanagement plan revision revised supplement to the draft environmental impactstatement. R10-MB-314a. Juneau, AK: Alaska Region.
U.S. Department of Agriculture, Forest Service. 1997. Tongass land managementplan revision final environmental impact statement. R10-MB-338b. Juneau, AK:Alaska Region.
U.S. Laws, Statutes, etc.; Public Law 92-203. Alaska Native Claims SettlementAct [ANCSA] of 1971. Act of Dec. 18, 1971. 85 Stat. 688 (codified as amended at43 USC 1601-1628) .
U.S. Laws, Statutes, etc.; Public Law 96-487. Alaska National Interest LandsConservation Act [ANILCA] of 1980. Act of Dec. 2, 1980. 16 U.S.C. 3210.
U.S. Laws, Statutes, etc.; Public Law 104-134. Omnibus ConsolidatedRescissions and Appropriations Act of 1996. Act of April 26, 1996. 110 Stat.1321-182.
Walters, L. 1997. Personal communication. Research analyst, Alaska Department ofCommunity and Regional Affairs, 150 3d St., Juneau, AK 99801.
Wolfe, Robert. 1989. Myths: What have you heard? Alaska Fish and Game. 21(6):16-19.
Wolfe, Robert G.; Bosworth, Robert G. 1994. Subsistence in Alaska: 1994 update.Report on file: Alaska Department of Fish and Game, Division of Subsistence,1255 W. 8th St., Juneau, AK 99801.
Wolfe, Robert G.; Walker, Robert J. 1987. Subsistence economies in Alaska:productivity, geography, and development impacts. Arctic Anthropology. 24(2):56-81.
71

Appendix 1:Employment bySector andCommunity Group
Table 14—Baranof community group employment by sector, 1990-95
1990 1995 1990-95 Share of SESector employment employment change Alaska totala
No. of jobs Percent No. of jobs - - - - - - Percent − − − − −
Mining 0 0 0 0 — —
Construction 0 0 0 0 — —
Total manufacturing 46 87 39 75 -17 563
Retail trade 0 0 0 0 — —
Wholesale trade 0 0 0 0 — —
Financial, insurance, andreal estate 0 0 0 0 — —
Services 0 0 0 0 — —
Transportation andpublic utilities 0 0 0 0 — —
Agriculture, forestry, andfish services 7 13 13 25 82 3116
Federal Government 0 0 0 0 — —
Other government 0 0 0 0 — —
Totalb 53 100 51 100 -4 —
TLMP relevant sectors:
Logging 46 87 39 75 -17 1990
Sawmills 0 0 0 0 — —
Pulp mills 0 0 0 0 — —
Seafood processing 0 0 0 0 — —
Lodging, restaurant, andrecreationc 0 0 0 0 — —
— = not applicable.a Share relative to southeast Alaska total employment.b Full- and part-time employment. Excludes proprietors and self-employed.c This measure does not directly reflect recreation- and tourism-related employment, but is included as anindicator of trends and relative concentrations of recreation- and tourism-dependent employment.Sources: Alaska Department of Labor 1996a, U.S. Bureau of Economic Analysis 1996.
72

Table 15—Central Prince of Wales community group employment by sector,1990-95
1990 1995 1990-95 Share of SESector employment employment change Alaska totala
No. of jobs Percent No. of jobs - - - - - - Percent − − − − − −
Mining 0 0 0 0 — —
Construction 47 5 68 6 44 41
Total manufacturing 329 34 180 17 -45 50
Retail trade 151 16 205 19 36 13
Wholesale trade 8 1 12 1 43 -22
Financial, insurance, andreal estate 39 4 35 3 -9 -9
Services 104 11 114 11 10 -41
Transportation andpublic utilities 69 7 138 13 99 66
Agriculture, forestry, andfish services 5 0 0 0 — —
Federal Government 32 3 45 4 40 -22
Other government 186 19 261 25 40 -15
Totalb 970 100 1,059 100 9 —
TLMP relevant sectors:
Logging 312 32 117 11 -63 206
Sawmills 0 0 20 2 — 143
Pulp mills 0 0 0 0 — —
Seafood processing 17 2 42 4 155 -12
Lodging, restaurant, andrecreationc 99 10 123 12 24 17
— = not applicable.a Share relative to southeast Alaska total employment.b Full- and part-time employment. Excludes proprietors and self-employed.c This measure does not directly reflect recreation- and tourism-related employment, but is included as anindicator of trends and relative concentrations of recreation- and tourism-dependent employment.Sources: Alaska Department of Labor 1996a, U.S. Bureau of Economic Analysis 1996.
73
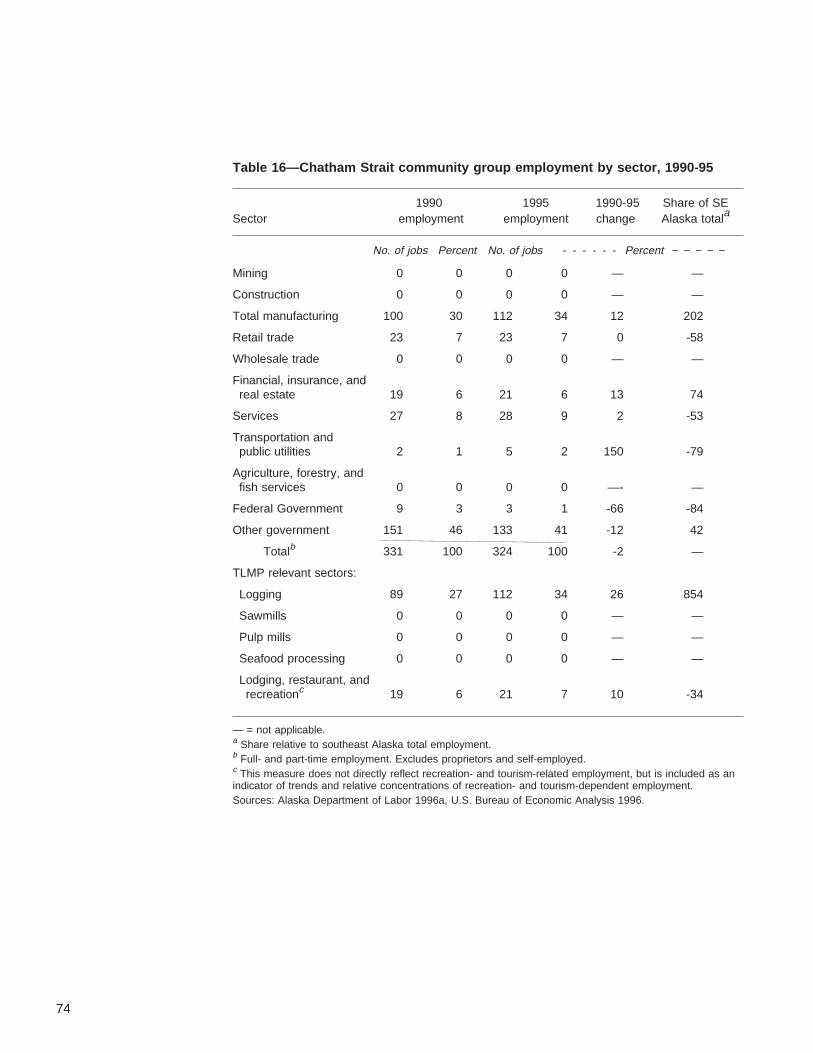
Table 16—Chatham Strait community group employment by sector, 1990-95
1990 1995 1990-95 Share of SESector employment employment change Alaska totala
No. of jobs Percent No. of jobs - - - - - - Percent − − − − −
Mining 0 0 0 0 — —
Construction 0 0 0 0 — —
Total manufacturing 100 30 112 34 12 202
Retail trade 23 7 23 7 0 -58
Wholesale trade 0 0 0 0 — —
Financial, insurance, andreal estate 19 6 21 6 13 74
Services 27 8 28 9 2 -53
Transportation andpublic utilities 2 1 5 2 150 -79
Agriculture, forestry, andfish services 0 0 0 0 —- —
Federal Government 9 3 3 1 -66 -84
Other government 151 46 133 41 -12 42
Totalb 331 100 324 100 -2 —
TLMP relevant sectors:
Logging 89 27 112 34 26 854
Sawmills 0 0 0 0 — —
Pulp mills 0 0 0 0 — —
Seafood processing 0 0 0 0 — —
Lodging, restaurant, andrecreationc 19 6 21 7 10 -34
— = not applicable.a Share relative to southeast Alaska total employment.b Full- and part-time employment. Excludes proprietors and self-employed.c This measure does not directly reflect recreation- and tourism-related employment, but is included as anindicator of trends and relative concentrations of recreation- and tourism-dependent employment.Sources: Alaska Department of Labor 1996a, U.S. Bureau of Economic Analysis 1996.
74
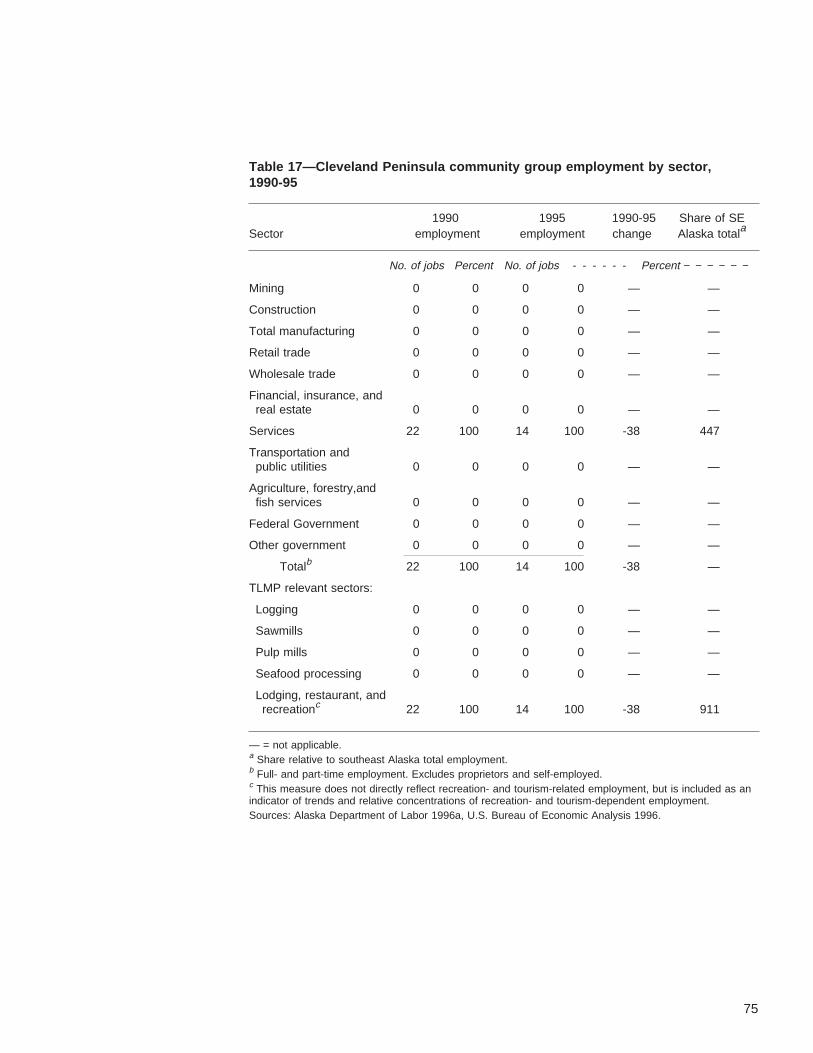
Table 17—Cleveland Peninsula community group employment by sector,1990-95
1990 1995 1990-95 Share of SESector employment employment change Alaska totala
No. of jobs Percent No. of jobs - - - - - - Percent − − − − − −
Mining 0 0 0 0 — —
Construction 0 0 0 0 — —
Total manufacturing 0 0 0 0 — —
Retail trade 0 0 0 0 — —
Wholesale trade 0 0 0 0 — —
Financial, insurance, andreal estate 0 0 0 0 — —
Services 22 100 14 100 -38 447
Transportation andpublic utilities 0 0 0 0 — —
Agriculture, forestry,andfish services 0 0 0 0 — —
Federal Government 0 0 0 0 — —
Other government 0 0 0 0 — —
Totalb 22 100 14 100 -38 —
TLMP relevant sectors:
Logging 0 0 0 0 — —
Sawmills 0 0 0 0 — —
Pulp mills 0 0 0 0 — —
Seafood processing 0 0 0 0 — —
Lodging, restaurant, andrecreationc 22 100 14 100 -38 911
— = not applicable.a Share relative to southeast Alaska total employment.b Full- and part-time employment. Excludes proprietors and self-employed.c This measure does not directly reflect recreation- and tourism-related employment, but is included as anindicator of trends and relative concentrations of recreation- and tourism-dependent employment.Sources: Alaska Department of Labor 1996a, U.S. Bureau of Economic Analysis 1996.
75

Table 18—Gustavus community group employment by sector, 1990-95
1990 1995 1990-95 Share of SESector employment employment change Alaska totala
No. of jobs Percent No. of jobs - - - - - - Percent − − − − −
Mining 0 0 0 0 — —
Construction 3 3 3 2 0 -56
Total manufacturing 2 1 4 2 130 -79
Retail trade 6 5 9 6 64 -66
Wholesale trade 9 7 0 0 — —
Financial, insurance, andreal estate 0 0 0 0 — —
Services 59 48 96 60 62 229
Transportation andpublic utilities 7 6 18 11 148 42
Agriculture, forestry, andfish services 0 0 0 0 — —
Federal Government 37 30 27 17 -27 210
Other government 0 0 2 1 — -96
Totalb 123 100 159 100 29 —
TLMP relevant sectors:
Logging 0 0 0 0 — —
Sawmills 0 0 0 0 — —
Pulp mills 0 0 0 0 — —
Seafood processing 2 1 4 2 130 -46
Lodging, restaurant, andrecreationc 59 48 97 61 65 519
— = not applicable.a Share relative to southeast Alaska total employment.b Full- and part-time employment. Excludes proprietors and self-employed.c This measure does not directly reflect recreation and tourism-related employment, but is included as anindicator of trends and relative concentrations of recreation and tourism-dependent employment.Sources: Alaska Department of Labor 1996a, U.S. Bureau of Economic Analysis 1996.
76

Table 19—Haines community group employment by sector, 1990-95
1990 1995 1990-95 Share of SESector employment employment change Alaska totala
No. of jobs Percent No. of jobs - - - - - - Percent − − − − − −
Mining 0 0 0 0 — —
Construction 39 4 57 7 47 59
Total manufacturing 225 25 105 13 -54 16
Retail trade 163 18 159 20 -2 17
Wholesale trade 5 1 1 0 -90 -95
Financial, insurance, andreal estate 17 2 17 2 -3 -42
Services 101 11 143 18 42 -1
Transportation andpublic utilities 169 19 149 19 -12 139
Agriculture, forestry, andfish services 0 0 0 0 — —
Federal Government 9 1 11 1 26 -74
Other government 163 18 150 19 -8 -34
Totalb 891 100 791 100 -11 —
TLMP relevant sectors:
Logging 0 0 10 1 100 -64
Sawmills 140 16 0 0 — —
Pulp mills 0 0 0 0 — —
Seafood processing 82 9 90 11 9 152
Lodging, restaurant, andrecreationc 101 11 131 17 30 67
— = not applicable.a Share relative to southeast Alaska total employment.b Full- and part-time employment. Excludes proprietors and self-employed.c This measure does not directly reflect recreation- and tourism-related employment, but is included as anindicator of trends and relative concentrations of recreation- and tourism-dependent employment.Sources: Alaska Department of Labor 1996a, U.S. Bureau of Economic Analysis 1996.
77

Table 20—Hydaburg community group employment by sector, 1990-95
1990 1995 1990-95 Share of SESector employment employment change Alaska totala
No. of jobs Percent No. of jobs - - - - - - Percent − − − − −
Mining 0 0 0 0 — —
Construction 0 0 0 0 — —
Total manufacturing 0 0 0 0 — —
Retail trade 7 9 9 14 30 -19
Wholesale trade 0 0 0 0 — —
Financial, insurance, andreal estate 14 19 9 14 -39 290
Services 4 5 4 6 0 -69
Transportation andpublic utilities 10 13 4 6 -61 -22
Agriculture, forestry, andfish services 0 0 0 0 — —
Federal Government 0 0 0 0 — —
Other government 42 55 37 60 -12 108
Totalb 76 100 61 100 -20 —
TLMP relevant sectors:
Logging 0 0 0 0 — —
Sawmills 0 0 0 0 — —
Pulp mills 0 0 0 0 — —
Seafood processing 0 0 0 0 — —
Lodging, restaurant, andrecreationc 0 0 0 0 — —
— = not applicable.a Share relative to southeast Alaska total employment.b Full- and part-time employment. Excludes proprietors and self-employed.c This measure does not directly reflect recreation- and tourism-related employment, but is included as anindicator of trends and relative concentrations of recreation- and tourism-dependent employment.Sources: Alaska Department of Labor 1996a, U.S. Bureau of Economic Analysis 1996.
78

Table 21—Hyder community group employment by sector, 1990-95
1990 1995 1990-95 Share of SESector employment employment change Alaska totala
No. of jobs Percent No. of jobs - - - - - - Percent − − − − − −
Mining 3 8 0 0 — —
Construction 0 0 0 0 — —
Total manufacturing 0 0 0 0 — —
Retail trade 4 11 7 33 95 93
Wholesale trade 0 0 0 0 — —
Financial, insurance, andreal estate 0 0 0 0 — —
Services 14 46 13 64 -8 250
Transportation andpublic utilities 8 27 0 0 — —
Agriculture, forestry, andfish services 0 0 0 0 — —
Federal Government 2 7 1 3 -72 -49
Other government 0 0 0 0 — —
Totalb 31 100 21 100 -33 —
TLMP relevant sectors:
Logging 0 0 0 0 — —
Sawmills 0 0 0 0 — —
Pulp mills 0 0 0 0 — —
Seafood processing 0 0 0 0 — —
Lodging, restaurant, andrecreationc 9 28 8 37 -12 275
— = not applicable.a Share relative to southeast Alaska total employment.b Full- and part-time employment. Excludes proprietors and self-employed.c This measure does not directly reflect recreation- and tourism-related employment, but is included as anindicator of trends and relative concentrations of recreation- and tourism-dependent employment.Sources: Alaska Department of Labor 1996a, U.S. Bureau of Economic Analysis 1996.
79

Table 22—Juneau community group employment by sector, 1990-95
1990 1995 1990-95 Share of SESector employment employment change Alaska totala
No. of jobs Percent No. of jobs - - - - - - Percent − − − − −
Mining 72 1 187 1 158 122
Construction 410 3 626 4 53 -13
Total manufacturing 145 1 325 2 124 -82
Retail trade 2,041 14 2,735 17 34 1
Wholesale trade 194 1 180 1 -7 -18
Financial, insurance, andreal estate 494 3 673 4 36 16
Services 2,323 16 3,010 19 30 4
Transportation andpublic utilities 910 6 1,072 7 18 -13
Agriculture, forestry, andfish services 59 0 74 0 27 -39
Federal Government 1,406 10 908 6 -35 5
Other government 6,081 43 5,985 38 -2 32
Totalb 14,133 100 15,775 100 12 —
TLMP relevant sectors:
Logging 0 0 80 1 — -86
Sawmills 0 0 0 0 — —
Pulp mills 0 0 0 0 — —
Seafood processing 25 0 59 0 139 -92
Lodging, restaurant, andrecreationc 1,170 8 1,505 10 29 -4
— = not applicable.a Share relative to southeast Alaska total employment.b Full- and part-time employment. Excludes proprietors and self-employed.c This measure does not directly reflect recreation- and tourism-related employment, but is included as anindicator of trends and relative concentrations of recreation- and tourism-dependent employment.Sources: Alaska Department of Labor 1996a, U.S. Bureau of Economic Analysis 1996.
80

Table 23—Kake community group employment by sector, 1990-95
1990 1995 1990-95 Share of SESector employment employment change Alaska totala
No. of jobs Percent No. of jobs - - - - - - Percent − − − − −
Mining 0 0 0 0 — —
Construction 3 1 0 0 — —
Total manufacturing 123 43 47 17 -62 46
Retail trade 25 9 17 6 -31 -65
Wholesale trade 2 1 0 0 — —
Financial, insurance, andreal estate 17 6 85 30 400 722
Services 16 5 18 6 17 -65
Transportation andpublic utilities 7 2 14 5 102 -37
Agriculture, forestry, andfish services 20 7 16 6 -19 654
Federal Government 2 1 2 1 -8 -87
Other government 69 24 82 29 18 1
Totalb 284 100 282 100 -1 —
TLMP relevant sectors:
Logging 123 43 47 17 -62 361
Sawmills 0 0 0 0 — —
Pulp mills 0 0 0 0 — —
Seafood processing 0 0 0 0 — —
Lodging, restaurant, andrecreationc 0 0 0 0 — —
— = not applicable.a Share relative to southeast Alaska total employment.b Full- and part-time employment. Excludes proprietors and self-employed.c This measure does not directly reflect recreation- and tourism-related employment, but is included as anindicator of trends and relative concentrations of recreation- and tourism-dependent employment.Sources: Alaska Department of Labor 1996a, U.S. Bureau of Economic Analysis 1996.
81
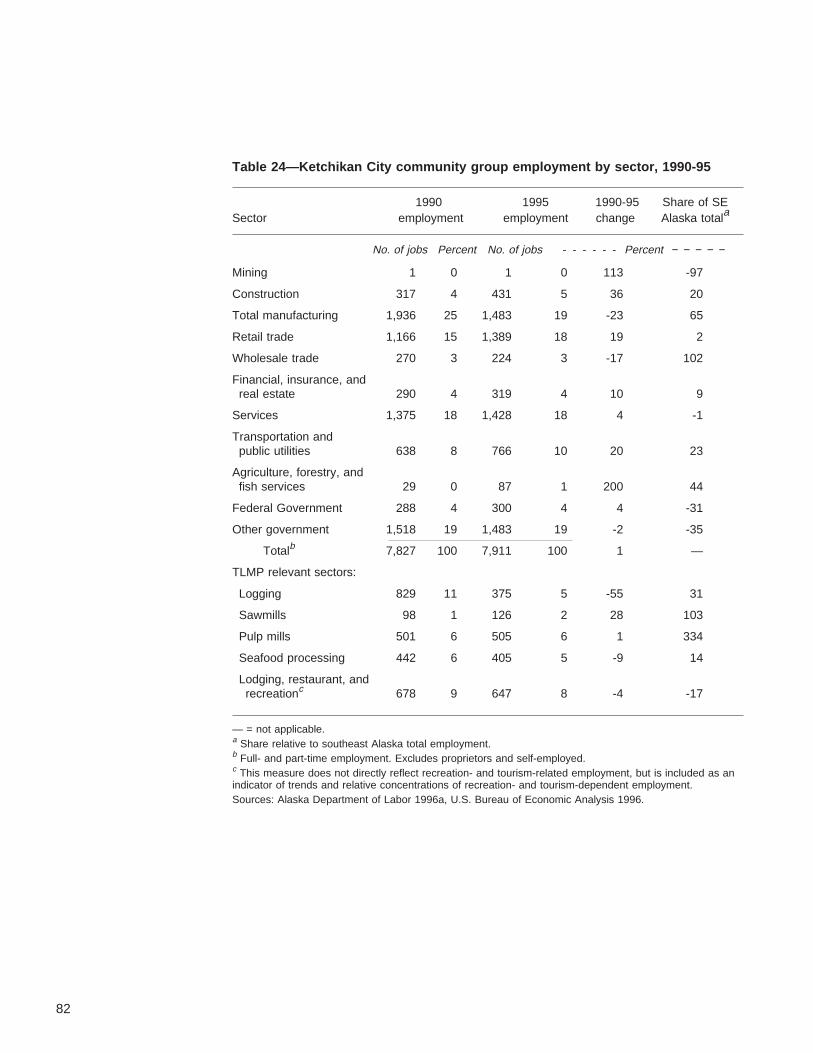
Table 24—Ketchikan City community group employment by sector, 1990-95
1990 1995 1990-95 Share of SESector employment employment change Alaska totala
No. of jobs Percent No. of jobs - - - - - - Percent − − − − −
Mining 1 0 1 0 113 -97
Construction 317 4 431 5 36 20
Total manufacturing 1,936 25 1,483 19 -23 65
Retail trade 1,166 15 1,389 18 19 2
Wholesale trade 270 3 224 3 -17 102
Financial, insurance, andreal estate 290 4 319 4 10 9
Services 1,375 18 1,428 18 4 -1
Transportation andpublic utilities 638 8 766 10 20 23
Agriculture, forestry, andfish services 29 0 87 1 200 44
Federal Government 288 4 300 4 4 -31
Other government 1,518 19 1,483 19 -2 -35
Totalb 7,827 100 7,911 100 1 —
TLMP relevant sectors:
Logging 829 11 375 5 -55 31
Sawmills 98 1 126 2 28 103
Pulp mills 501 6 505 6 1 334
Seafood processing 442 6 405 5 -9 14
Lodging, restaurant, andrecreationc 678 9 647 8 -4 -17
— = not applicable.a Share relative to southeast Alaska total employment.b Full- and part-time employment. Excludes proprietors and self-employed.c This measure does not directly reflect recreation- and tourism-related employment, but is included as anindicator of trends and relative concentrations of recreation- and tourism-dependent employment.Sources: Alaska Department of Labor 1996a, U.S. Bureau of Economic Analysis 1996.
82

Table 25—Kuiu Island community group employment by sector, 1990-95
1990 1995 1990-95 Share of SESector employment employment change Alaska totala
No. of jobs Percent No. of jobs - - - - - - Percent − − − − − −
Mining 0 0 0 0 — —
Construction 0 0 0 0 — —
Total manufacturing 77 91 4 45 -95 298
Retail trade 0 0 0 0 — —
Wholesale trade 0 0 1 10 — 644
Financial, insurance, andreal estate 0 0 0 0 — —
Services 0 0 0 0 — —
Transportation andpublic utilities 0 0 0 0 — —
Agriculture, forestry, andfish services 1 1 0 0 — —
Federal Government 0 0 0 0 — —
Other government 7 8 4 44 -43 54
Totalb 85 100 9 100 -90 —
TLMP relevant sectors:
Logging 77 91 4 45 -95 1,156
Sawmills 0 0 0 0 — —
Pulp mills 0 0 0 0 — —
Seafood processing 0 0 0 0 — —
Lodging, restaurant, andrecreationc 0 0 0 0 — —
— = not applicable.a Share relative to southeast Alaska total employment.b Full- and part-time employment. Excludes proprietors and self-employed.c This measure does not directly reflect recreation- and tourism-related employment, but is included as anindicator of trends and relative concentrations of recreation- and tourism-dependent employment.Sources: Alaska Department of Labor 1996a, U.S. Bureau of Economic Analysis 1996.
83

Table 26—Metlakatla community group employment by sector, 1990-95
1990 1995 1990-95 Share of SESector employment employment change Alaska totala
No. of jobs Percent No. of jobs - - - - - - Percent − − − − −
Mining 0 0 0 0 — —
Construction 8 1 0 0 — —
Total manufacturing 116 20 127 23 9 102
Retail trade 53 9 52 10 -2 -45
Wholesale trade 0 0 0 0 — —
Financial, insurance, andreal estate 4 1 5 1 18 -76
Services 6 1 7 1 15 -93
Transportation andpublic utilities 57 10 24 4 -59 -45
Agriculture, forestry, andfish services 0 0 0 0 — —
Federal Government 24 4 10 2 -60 -69
Other government 321 54 326 59 2 106
Totalb 590 100 550 100 -7 —
TLMP relevant sectors:
Logging 16 3 0 0 — —
Sawmills 100 17 96 17 -4 2,129
Pulp mills 0 0 0 0 — —
Seafood processing 0 0 31 6 100 25
Lodging, restaurant, andrecreationc 8 1 20 4 136 -64
— = not applicable.a Share relative to southeast Alaska total employment.b Full- and part-time employment. Excludes proprietors and self-employed.c This measure does not directly reflect recreation- and tourism-related employment, but is included as anindicator of trends and relative concentrations of recreation- and tourism-dependent employment.Sources: Alaska Department of Labor 1996a, U.S. Bureau of Economic Analysis 1996.
84
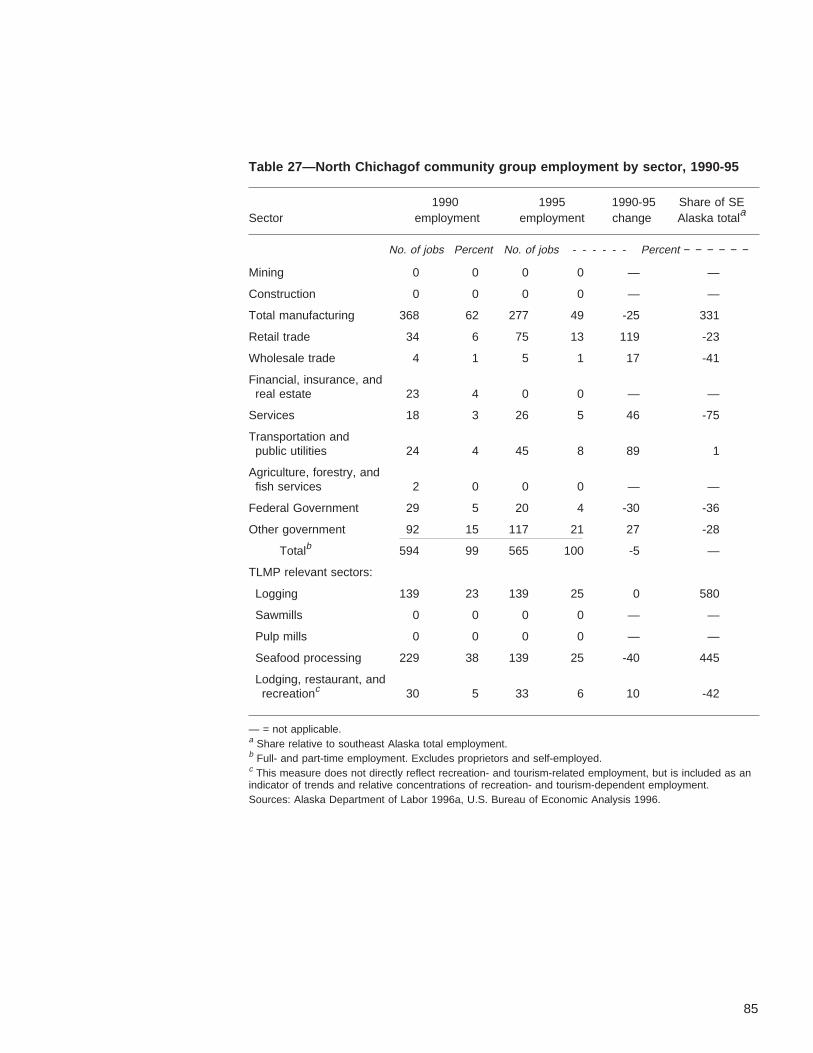
Table 27—North Chichagof community group employment by sector, 1990-95
1990 1995 1990-95 Share of SESector employment employment change Alaska totala
No. of jobs Percent No. of jobs - - - - - - Percent − − − − − −
Mining 0 0 0 0 — —
Construction 0 0 0 0 — —
Total manufacturing 368 62 277 49 -25 331
Retail trade 34 6 75 13 119 -23
Wholesale trade 4 1 5 1 17 -41
Financial, insurance, andreal estate 23 4 0 0 — —
Services 18 3 26 5 46 -75
Transportation andpublic utilities 24 4 45 8 89 1
Agriculture, forestry, andfish services 2 0 0 0 — —
Federal Government 29 5 20 4 -30 -36
Other government 92 15 117 21 27 -28
Totalb 594 99 565 100 -5 —
TLMP relevant sectors:
Logging 139 23 139 25 0 580
Sawmills 0 0 0 0 — —
Pulp mills 0 0 0 0 — —
Seafood processing 229 38 139 25 -40 445
Lodging, restaurant, andrecreationc 30 5 33 6 10 -42
— = not applicable.a Share relative to southeast Alaska total employment.b Full- and part-time employment. Excludes proprietors and self-employed.c This measure does not directly reflect recreation- and tourism-related employment, but is included as anindicator of trends and relative concentrations of recreation- and tourism-dependent employment.Sources: Alaska Department of Labor 1996a, U.S. Bureau of Economic Analysis 1996.
85

Table 28—North Prince of Wales community group employment by sector,1990-95
1990 1995 1990-95 Share of SESector employment employment change Alaska totala
No. of jobs Percent No. of jobs - - - - - - Percent − − − − −
Mining 0 0 0 0 — —
Construction 20 4 15 3 -21 -24
Total manufacturing 280 55 262 59 -6 416
Retail trade 22 4 22 5 -1 -72
Wholesale trade 5 1 0 0 — —
Financial, insurance, andreal estate 6 1 1 0 -83 -94
Services 32 6 23 5 -27 -72
Transportation andpublic utilities 44 9 5 1 -89 -86
Agriculture, forestry, andfish services 5 1 12 3 157 251
Federal Government 65 13 64 14 -1 162
Other government 33 6 42 9 27 -67
Totalb 510 100 447 100 -12 —
TLMP relevant sectors:
Logging 245 48 243 54 -1 1,409
Sawmills 24 5 14 3 -43 286
Pulp mills 0 0 0 0 — —
Seafood processing 9 2 4 1 -63 -83
Lodging, restaurant, andrecreationc 6 1 19 4 220 -58
— = not applicable.a Share relative to southeast Alaska total employment.b Full- and part-time employment. Excludes proprietors and self-employed.c This measure does not directly reflect recreation- and tourism-related employment, but is included as anindicator of trends and relative concentrations of recreation- and tourism-dependent employment.Sources: Alaska Department of Labor 1996a, U.S. Bureau of Economic Analysis 1996.
86

Table 29—Petersburg community group employment by sector, 1990-95
1990 1995 1990-95 Share of SESector employment employment change Alaska totala
No. of jobs Percent No. of jobs - - - - - - Percent − − − − −
Mining 0 0 0 0 — —
Construction 30 2 60 4 99 -16
Total manufacturing 351 25 467 30 33 163
Retail trade 231 17 263 17 14 -2
Wholesale trade 4 0 8 1 98 -64
Financial, insurance, andreal estate 29 2 25 2 -14 -57
Services 192 14 166 11 -14 -42
Transportation andpublic utilities 60 4 67 4 12 -45
Agriculture, forestry, andfish services 20 1 17 1 -12 45
Federal Government 147 11 144 9 -2 68
Other government 330 24 339 22 3 -25
Totalb 1,394 100 1,555 100 12 —
TLMP relevant sectors:
Logging 70 5 12 1 -83 -78
Sawmills 0 0 0 0 — —
Pulp mills 0 0 0 0 — —
Seafood processing 260 19 430 28 65 514
Lodging, restaurant, andrecreationc 130 9 100 6 -23 -35
— = not applicable.a Share relative to southeast Alaska total employment.b Full- and part-time employment. Excludes proprietors and self-employed.c This measure does not directly reflect recreation- and tourism-related employment, but is included as anindicator of trends and relative concentrations of recreation- and tourism-dependent employment.Sources: Alaska Department of Labor 1996a, U.S. Bureau of Economic Analysis 1996.
87

Table 30—Revillagigedo community group employment by sector, 1990-95
1990 1995 1990-95 Share of SESector employment employment change Alaska totala
No. of jobs Percent No. of jobs - - - - - - Percent − − − − −
Mining 0 0 0 0 — —
Construction 0 0 0 0 — —
Total manufacturing 0 0 23 84 — 635
Retail trade 0 0 0 0 — —
Wholesale trade 0 0 0 0 — —
Financial, insurance, andreal estate 0 0 0 0 — —
Services 0 0 0 0 — —
Transportation andpublic utilities 0 0 5 16 — 109
Agriculture, forestry, andfish services 0 0 0 0 — —
Federal Government 0 0 0 0 — —
Other government 0 0 0 0 — —
Totalb 0 100 28 100 — —
TLMP relevant sectors:
Logging 0 0 23 84 — 2,220
Sawmills 0 0 0 0 — —
Pulp mills 0 0 0 0 — —
Seafood processing 0 0 0 0 — —
Lodging, restaurant, andrecreationc 0 0 0 0 — —
— = not applicable.a Share relative to southeast Alaska total employment.b Full- and part-time employment. Excludes proprietors and self-employed.c This measure does not directly reflect recreation- and tourism-related employment, but is included as anindicator of trends and relative concentrations of recreation- and tourism-dependent employment.Sources: Alaska Department of Labor 1996a, U.S. Bureau of Economic Analysis 1996.
88

Table 31—Sitka community group employment by sector, 1990-95
1990 1995 1990-95 Share of SESector employment employment change Alaska totala
No. of jobs Percent No. of jobs - - - - - - Percent − − − − − −
Mining 0 0 0 0 — —
Construction 236 6 225 6 -5 31
Total manufacturing 702 17 286 8 -59 -33
Retail trade 612 15 721 19 18 12
Wholesale trade 76 2 57 2 -25 9
Financial, insurance, andreal estate 77 2 79 2 3 -43
Services 997 25 1,026 27 3 49
Transportation andpublic utilities 295 7 261 7 -12 -12
Agriculture, forestry, andfish services 39 1 32 1 -18 9
Federal Government 259 6 265 7 2 28
Other government 764 19 813 22 6 -25
Totalb 4,057 100 3,765 100 -7 —
TLMP relevant sectors:
Logging 2 0 0 0 — —
Sawmills 0 0 0 0 — —
Pulp mills 402 10 14 0 -97 -75
Seafood processing 278 7 227 6 -18 34
Lodging, restaurant, andrecreationc 360 9 390 10 8 5
— = not applicable.a Share relative to southeast Alaska total employment.b Full- and part-time employment. Excludes proprietors and self-employed.c This measure does not directly reflect recreation- and tourism-related employment, but is included as anindicator of trends and relative concentrations of recreation- and tourism-dependent employment.Sources: Alaska Department of Labor 1996a, U.S. Bureau of Economic Analysis 1996.
89

Table 32—Skagway community group employment by sector, 1990-95
1990 1995 1990-95 Share of SESector employment employment change Alaska totala
No. of jobs Percent No. of jobs - - - - - - Percent − − − − −
Mining 0 0 0 0 — —
Construction 0 0 29 5 — 6
Total manufacturing 4 1 14 2 280 -79
Retail trade 102 20 173 29 70 67
Wholesale trade 1 0 0 0 — —
Financial, insurance, andreal estate 7 1 8 1 5 -66
Services 76 15 168 28 122 53
Transportation andpublic utilities 175 34 62 10 -64 32
Agriculture, forestry, andfish services 1 0 0 0 — —
Federal Government 35 7 57 10 65 74
Other government 108 21 90 15 -17 -48
Totalb 509 100 602 100 18 —
TLMP relevant sectors:
Logging 0 0 0 0 — —
Sawmills 0 0 0 0 — —
Pulp mills 0 0 0 0 — —
Seafood processing 0 0 0 0 — —
Lodging, restaurant, andrecreationc 73 14 211 35 190 254
— = not applicable.a Share relative to southeast Alaska total employment.b Full- and part-time employment. Excludes proprietors and self-employed.c This measure does not directly reflect recreation- and tourism-related employment, but is included as anindicator of trends and relative concentrations of recreation- and tourism-dependent employment.Sources: Alaska Department of Labor 1996a, U.S. Bureau of Economic Analysis 1996.
90

Table 33—Southeast Prince of Wales community group employment by sector,1990-95
1990 1995 1990-95 Share of SESector employment employment change Alaska totala
No. of jobs Percent No. of jobs - - - - - - Percent − − − − −
Mining 0 0 0 0 — —
Construction 0 0 0 0 — —
Total manufacturing 0 0 0 0 — —
Retail trade 0 0 0 0 — —
Wholesale trade 1 12 1 3 0 84
Financial, insurance, andreal estate 0 0 0 0 — —
Services 0 0 38 97 — 433
Transportation andpublic utilities 7 88 0 0 — —
Agriculture, forestry, andfish services 0 0 0 0 — —
Federal Government 0 0 0 0 — —
Other government 0 0 0 0 — —
Totalb 8 100 39 100 369 —
TLMP relevant sectors:
Logging 0 0 0 0 — —
Sawmills 0 0 0 0 — —
Pulp mills 0 0 0 0 — —
Seafood processing 0 0 0 0 — —
Lodging, restaurant, andrecreationc 0 0 38 97 — 885
— = not applicable.a Share relative to southeast Alaska total employment.b Full- and part-time employment. Excludes proprietors and self-employed.c This measure does not directly reflect recreation- and tourism-related employment, but is included as anindicator of trends and relative concentrations of recreation- and tourism-dependent employment.Sources: Alaska Department of Labor 1996a, U.S. Bureau of Economic Analysis 1996.
91

Table 34—Stephens Passage community group employment by sector, 1990-95
1990 1995 1990-95 Share of SESector employment employment change Alaska totala
No. of jobs Percent No. of jobs - - - - - - Percent − − − − −
Mining 268 80 0 0 — —
Construction 0 0 26 54 — 1,094
Total manufacturing 62 18 5 11 -92 -5
Retail trade 0 0 0 0 — —
Wholesale trade 0 0 0 0 — —
Financial, insurance, andreal estate 0 0 0 0 — —
Services 0 0 0 0 — —
Transportation andpublic utilities 0 0 15 32 — 306
Agriculture, forestry, andfish services 4 1 0 0 — —
Federal Government 0 0 0 0 — —
Other government 0 0 1 3 — -90
Totalb 333 100 48 100 -86 —
TLMP relevant sectors:
Logging 61 18 3 6 -95 70
Sawmills 0 0 0 0 — —
Pulp mills 0 0 0 0 — —
Seafood processing 1 0 2 5 200 5
Lodging, restaurant, andrecreationc 0 0 0 0 — —
— = not applicable.a Share relative to southeast Alaska total employment.b Full- and part-time employment. Excludes proprietors and self-employed.c This measure does not directly reflect recreation- and tourism-related employment, but is included as anindicator of trends and relative concentrations of recreation- and tourism-dependent employment.Sources: Alaska Department of Labor 1996a, U.S. Bureau of Economic Analysis 1996.
92

Table 35—Wrangell City community group employment by sector, 1990-95
1990 1995 1990-95 Share of SESector employment employment change Alaska totala
No. of jobs Percent No. of jobs - - - - - - Percent − − − − − −
Mining 0 0 0 0 — —
Construction 17 2 53 7 206 43
Total manufacturing 239 27 117 14 -51 27
Retail trade 153 17 162 20 6 16
Wholesale trade 6 1 4 1 -29 -63
Financial, insurance, andreal estate 18 2 13 2 -26 -56
Services 73 8 66 8 -10 -56
Transportation andpublic utilities 118 13 83 10 -30 30
Agriculture, forestry, andfish services 13 1 19 2 53 209
Federal Government 49 6 57 7 16 27
Other government 197 22 239 29 21 2
Totalb 883 100 813 100 -8 —
TLMP relevant sectors:
Logging 0 0 1 0 — -98
Sawmills 162 18 21 3 -87 225
Pulp mills 0 0 0 0 — —
Seafood processing 60 7 83 10 38 127
Lodging, restaurant, andrecreationc 77 9 74 9 -4 -8
— = not applicable.a Share relative to southeast Alaska total employment.b Full- and part-time employment. Excludes proprietors and self-employed.c This measure does not directly reflect recreation- and tourism-related employment, but is included as anindicator of trends and relative concentrations of recreation- and tourism-dependent employment.Sources: Alaska Department of Labor 1996a, U.S. Bureau of Economic Analysis 1996.
93

Table 36—Yakutat community group employment by sector, 1990-95
1990 1995 1990-95 Share of SESector employment employment change Alaska totala
No. of jobs Percent No. of jobs - - - - - - Percent − − − − −
Mining 0 0 0 0 — —
Construction 5 2 14 3 202 -28
Total manufacturing 45 21 140 33 213 194
Retail trade 30 14 39 9 31 -46
Wholesale trade 0 0 1 0 — -90
Financial, insurance, andreal estate 8 4 14 3 67 -12
Services 6 12 73 17 179 -5
Transportation andpublic utilities 28 13 36 9 28 10
Agriculture, forestry, andfish services 1 0 0 0 — —
Federal Government 20 9 26 6 30 11
Other government 55 25 77 18 41 -36
Totalb 217 100 419 100 93 —
TLMP relevant sectors:
Logging 37 17 68 16 86 353
Sawmills 0 0 0 0 — —
Pulp mills 0 0 0 0 — —
Seafood processing 0 0 72 17 — 282
Lodging, restaurant, andrecreationc 28 13 61 14 114 46
— = not applicable.a Share relative to southeast Alaska total employment.b Full- and part-time employment. Excludes proprietors and self-employed.c This measure does not directly reflect recreation- and tourism-related employment, but is included as anindicator of trends and relative concentrations of recreation- and tourism-dependent employment.Sources: Alaska Department of Labor 1996a, U.S. Bureau of Economic Analysis 1996.
94

Appendix 2: PerCapita Revenuesand Expendituresby Community
95

96

97

98

99
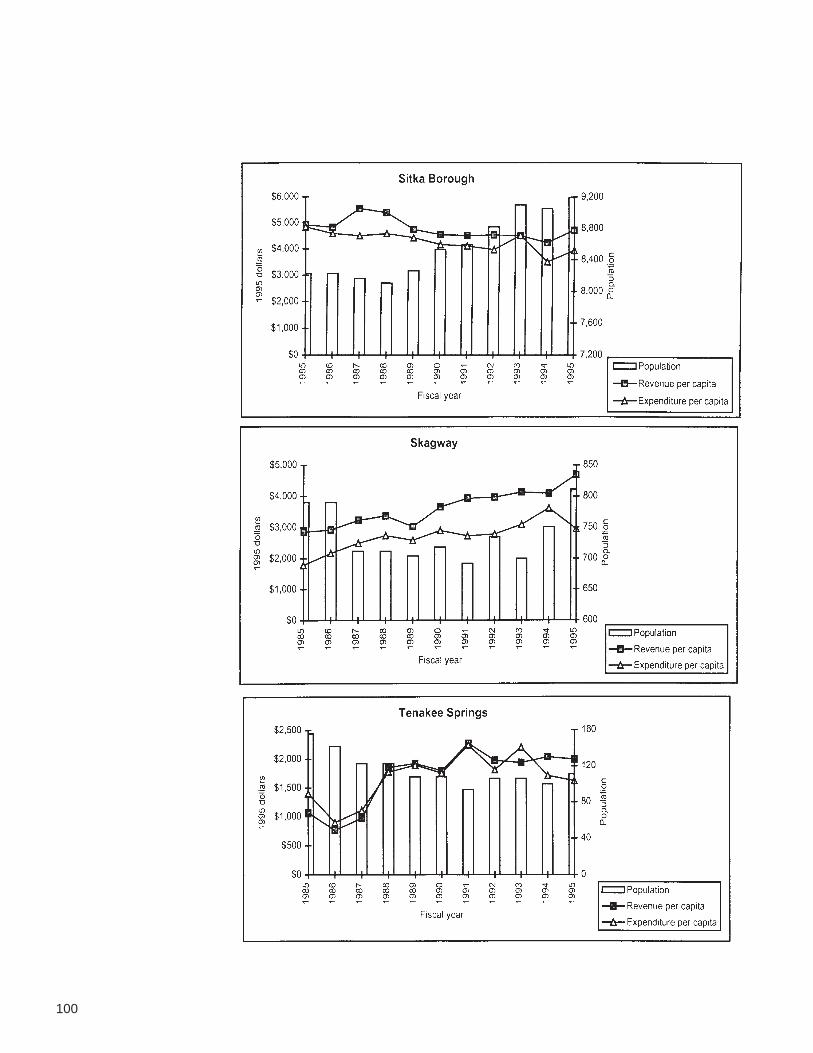
100

101

This page has been left blank intentionally.Document continues on next page.
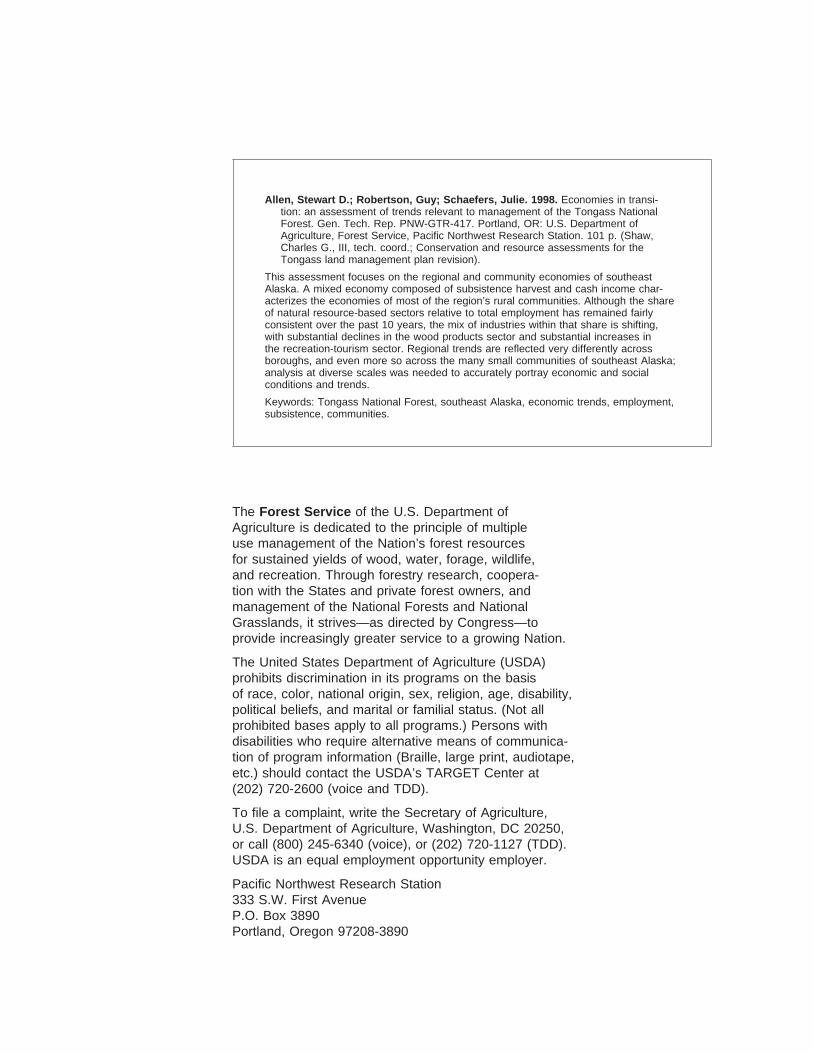
Allen, Stewart D.; Robertson, Guy; Schaefers, Julie. 1998. Economies in transi-tion: an assessment of trends relevant to management of the Tongass NationalForest. Gen. Tech. Rep. PNW-GTR-417. Portland, OR: U.S. Department ofAgriculture, Forest Service, Pacific Northwest Research Station. 101 p. (Shaw,Charles G., III, tech. coord.; Conservation and resource assessments for theTongass land management plan revision).
This assessment focuses on the regional and community economies of southeastAlaska. A mixed economy composed of subsistence harvest and cash income char-acterizes the economies of most of the region’s rural communities. Although the shareof natural resource-based sectors relative to total employment has remained fairlyconsistent over the past 10 years, the mix of industries within that share is shifting,with substantial declines in the wood products sector and substantial increases inthe recreation-tourism sector. Regional trends are reflected very differently acrossboroughs, and even more so across the many small communities of southeast Alaska;analysis at diverse scales was needed to accurately portray economic and socialconditions and trends.
Keywords: Tongass National Forest, southeast Alaska, economic trends, employment,subsistence, communities.
The Forest Service of the U.S. Department ofAgriculture is dedicated to the principle of multipleuse management of the Nation’s forest resourcesfor sustained yields of wood, water, forage, wildlife,and recreation. Through forestry research, coopera-tion with the States and private forest owners, andmanagement of the National Forests and NationalGrasslands, it strives—as directed by Congress—toprovide increasingly greater service to a growing Nation.
The United States Department of Agriculture (USDA)prohibits discrimination in its programs on the basisof race, color, national origin, sex, religion, age, disability,political beliefs, and marital or familial status. (Not allprohibited bases apply to all programs.) Persons withdisabilities who require alternative means of communica-tion of program information (Braille, large print, audiotape,etc.) should contact the USDA’s TARGET Center at(202) 720-2600 (voice and TDD).
To file a complaint, write the Secretary of Agriculture,U.S. Department of Agriculture, Washington, DC 20250,or call (800) 245-6340 (voice), or (202) 720-1127 (TDD).USDA is an equal employment opportunity employer.
Pacific Northwest Research Station333 S.W. First AvenueP.O. Box 3890Portland, Oregon 97208-3890

U.S. Department of AgriculturePacific Northwest Research Station333 S.W. First AvenueP.O. Box 3890Portland, OR 97208
Official BusinessPenalty for Private Use, $300
do NOT detach label