united states gaap first quarter report for the three
TRANSCRIPT

Q1 2010UNITED STATES GAAP
First Quarter ReportFor the three months ended March 31

1
Report to Shareholders
Solid revenue growth and operating expense reductions drove improving profitability on a
non-GAAP basis for the first quarter of 2010.
Revenue was $151.3 million in the first quarter of 2010, an increase of 36% compared to the first quarter of 2009.
Our GAAP loss from operations was $4.5 million and loss per share was $0.24 for the first quarter of 2010. On a
non-GAAP basis, our earnings from operations were $4.1 million and diluted earnings per share were $0.13. We
experienced good momentum across all of our business lines as evidenced by our revenue growth, new customer
design wins, new product launches and improving sell through. We also made significant progress during the
quarter building our leadership position in M2M, while revitalizing momentum in our Mobile Computing business.
M2M Business
Our M2M market represents an exciting growth opportunity for us and is receiving growing focus from operators
and OEMs globally. Our M2M business includes AirPrime™ Embedded Modules (excluding revenue from PC
OEM customers), AirLink™ Intelligent Gateways and Routers and our AirVantage™ Solutions and Service
Delivery Platforms.
In the first quarter of 2010, M2M revenue was $88.7 million, up over 187% compared to the first quarter of 2009.
The increase was broad-based, however we saw exceptionally strong growth in the consumer space where our
embedded modules are used in e-readers, personal navigation devices and other products.
AirLink Intelligent Gateways and Routers continued to be a solid contributor, delivering revenue of $10.5 million in
the first quarter of 2010, compared to $9.1 million in the first quarter of 2009. We have made good progress in our
international expansion efforts with AirLink products, including significant new wins in Europe, Latin America and
China.
We are gaining momentum with our AirVantage services delivery platform. We achieved new design wins in
industrial M2M and outdoor advertising and have now successfully launched our services platform with
ORBCOMM. We have made good progress in our deployment of our AirVantage services platform with our first
cellular operator customer and we expect to go live with them in the second half of 2010.
Mobile Computing Business
Our mobile computing business is focused on providing mobile broadband connectivity for notebooks and netbooks.
We are a technology leader in this space and are often first to market with USB modems, mobile hotspots or PC
cards that support the latest high speed services being deployed by wireless operators such as AT&T, Sprint and
Telstra. We also have strong relationships with leading PC OEMs such as HP, Lenovo, Panasonic, Fujitsu and
others to whom we provide embedded mobile broadband solutions. Our mobile computing business includes
AirCard® Mobile Broadband Devices, as well as revenue from our AirPrime Embedded Modules to PC OEM
customers.
In the first quarter of 2010, our mobile computing revenue was $62.6 million, down 22% compared to the first
quarter of 2009, driven primarily by a decline in our AirCard business. Despite the weakness in the first quarter, we
believe we have a strong AirCard product portfolio and pipeline, as well as leading channel positions with key
operators. During the quarter, we launched the Overdrive™
, the world’s first 3G/4G mobile hotspot, with Sprint and
the AirCard 890 with AT&T. We also demonstrated our first to market dual carrier HSPA+ USB device that
supports speeds of up to 42 Mbps and expect to launch this product with Telstra later this year.
We are also making good progress rebuilding our PC OEM business. Our revenue from PC OEM customers
increased sequentially for the first time in several quarters. During the quarter, we announced production design
wins with Fujitsu and Panasonic. We also have new opportunities with additional leading PC OEM manufacturers
and expect to secure design wins for notebook platform launches in 2011.

2
Outlook
Our organic and inorganic investments have resulted in a strong, growing and profitable M2M business that
represented 59% of our revenue for the first quarter of 2010. Our Mobile Computing business is also well
positioned with key operators and OEMs and is expected to return to growth in the second quarter. As a result, we
believe we have a well diversified company with two solid business lines that are contributing to our goal of
becoming the global leader in wireless solutions for M2M and Mobile Computing.
Jason W. Cohenour
President and Chief Executive Officer
Certain statements in this report that are not based on historical facts constitute forward-looking statements or
forward-looking information within the meaning of the U.S. Private Securities Litigation Reform Act of 1995 and
applicable Canadian securities laws (―forward-looking statements‖). These forward-looking statements are not
promises or guarantees of future performance but are only predictions that relate to future events, conditions or
circumstances or our future results, performance, achievements or developments and are subject to substantial
known and unknown risks, assumptions, uncertainties and other factors that could cause our actual results,
performance, achievements or developments in our business or in our industry to differ materially from those
expressed, anticipated or implied by such forward-looking statements. Forward-looking statements in this report
include all disclosure regarding possible events, conditions, circumstances or results of operations that are based on
assumptions about future economic conditions, courses of action and other future events. We caution you not to
place undue reliance upon any such forward-looking statements, which speak only as of the date they are made.
These forward-looking statements appear in a number of different places in this report and can be identified by
words such as ―may‖, ―estimates‖, ―projects‖, ―expects‖, ―intends‖, ―believes‖, ―plans‖, ―anticipates‖, ―continue‖,
―growing‖, ―expanding‖, or their negatives or other comparable words. Forward-looking statements include
statements regarding the outlook for our future operations, plans and timing for the introduction or enhancement of
our services and products, statements concerning strategies or developments, statements about future market
conditions, supply conditions, end customer demand conditions, channel inventory and sell through, revenue, gross
margin, operating expenses, profits, forecasts of future costs and expenditures, the outcome of legal proceedings,
and other expectations, intentions and plans that are not historical fact. The risk factors and uncertainties that may
affect our actual results, performance, achievements or developments are many and include, amongst others, our
ability to develop, manufacture, supply and market new products that we do not produce today that meet the needs
of customers and gain commercial acceptance, our reliance on the deployment of next generation networks by major
wireless operators, the continuous commitment of our customers, and increased competition. These risk factors and
others are discussed in our Annual Information Form and Management’s Discussion and Analysis of Financial
Condition and Results of Operations, which may be found on SEDAR at www.sedar.com and on EDGAR at
www.sec.gov and in our other regulatory filings with the Securities and Exchange Commission in the United States
and the Provincial Securities Commissions in Canada. Many of these factors and uncertainties are beyond our
control. Consequently, all forward-looking statements in this report are qualified by this cautionary statement and
we cannot assure you that actual results, performance, achievements or developments that we anticipate will be
realized. Forward-looking statements are based on management’s current plans, estimates, projections, beliefs and
opinions and we do not undertake any obligation to update forward-looking statements should the assumptions
related to these plans, estimates, projections, beliefs and opinions change, except as required by law.
3
Management’s Discussion and Analysis of
Financial Condition and Results of Operations
The following Management’s Discussion and Analysis of Financial Condition and Results of Operations
(“MD&A”) provides information for the three months ended March 31, 2010, and up to and including May 11,
2010. This MD&A should be read together with our audited consolidated financial statements and the
accompanying notes for the year ended December 31, 2009 (the “consolidated financial statements”). The
consolidated financial statements have been prepared in accordance with generally accepted accounting principles
in the United States (“U.S. GAAP”). Except where otherwise specifically indicated, all amounts in this MD&A are
expressed in United States dollars.
We have prepared this MD&A with reference to National Instrument 51-102 “Continuous Disclosure Obligations”
of the Canadian Securities Administrators. Under the U.S./Canada Multijurisdictional Disclosure System, we are
permitted to prepare this MD&A in accordance with the disclosure requirements of Canada, which requirements
are different than those of the United States.
Certain statements in this MD&A constitute forward-looking statements or forward-looking information within the
meaning of applicable securities laws. You should carefully read the cautionary note in this MD&A regarding
forward-looking statements and should not place undue reliance on any such forward-looking statements. See
“Cautionary Note Regarding Forward-Looking Statements”.
Additional information related to Sierra Wireless, Inc., including our consolidated financial statements and our
Annual Information Form, may be found on SEDAR at www.sedar.com and on EDGAR at www.sec.gov.
Overview
We provide leading edge wireless solutions for the machine-to-machine (―M2M‖) and mobile computing markets.
We develop and market a range of products that include wireless modems for mobile computers, embedded modules
and software for original equipment manufacturers (―OEMs‖), intelligent wireless gateway solutions for industrial,
commercial and public safety applications, and an innovative platform for delivering device management and end-
to-end application services. We also offer professional services to OEM customers during their product development
and launch process, leveraging our expertise in wireless design, software, integration and certification to provide
built-in wireless connectivity for mobile computing devices and M2M solutions. Our products, services and
solutions connect people, their mobile computers and machines to wireless voice and mobile broadband networks
around the world.
Our acquisition of Wavecom S.A. (―Wavecom‖), a global leader in wireless M2M solutions headquartered in Issy-
les-Moulineaux, France, on February 27, 2009 enhances our product and service offering in the global M2M market
by adding highly sophisticated wireless module platforms and solutions which integrate all of the necessary software
and hardware on embedded devices that can be used for a wide variety of applications. We expect the combination
of Sierra Wireless and Wavecom will create a global leader that will be uniquely positioned to benefit from the
anticipated growth in the wireless M2M and mobile computing markets. We expect the acquisition to significantly
expand and diversify our position in the global M2M market, broaden our product offerings and increase our scale
and capabilities in Europe and Asia.
We believe that the markets for mobile broadband connectivity and wireless M2M solutions have strong growth
prospects. We believe that the key growth enablers for these markets include the continued deployment of mobile
broadband networks around the world, aggressive promotion of mobile broadband services by wireless operators,
growing strategic focus on mobile broadband and M2M services by wireless operators and expanding end customer
awareness of the availability of such services and their benefits.
Our expanded line-up of M2M wireless solutions is used by a wide range of OEMs and enterprises to wirelessly
enable their products and solutions. Our M2M customers cover a broad range of industries including consumer
electronics, networking equipment, automotive, energy, security, transaction processing, industrial control and
monitoring, fleet management and public safety.
Our mobile computing products are used by businesses, consumers and government organizations to enable mobile
broadband access to a wide range of applications, including the Internet, e-mail, corporate intranet, remote databases
and corporate and consumer applications.
4
We sell our products primarily through indirect channels including wireless operators, OEMs, distributors and value
added resellers.
On December 2, 2008, we announced an all-cash offer to purchase all of the ordinary shares and OCEANE
convertible bonds (―OCEANEs‖) of Wavecom. The total value of the transaction was approximately €218.0
million. We made a cash offer of €8.50 per share of Wavecom and €31.93 per OCEANE. The transaction was
implemented by way of concurrent but separate public tender offers in both France and the United States for all
Wavecom shares, all American Depository Shares (―ADSs‖) representing Wavecom shares and all OCEANEs
issued by Wavecom. On February 27, 2009, we completed our acquisition of 84.32% of the outstanding shares and
99.97% of the outstanding OCEANEs of Wavecom, representing 90.57% of the voting rights of Wavecom.
Following a statutory re-opening of the tender offer and our purchase of Wavecom shares on the market, we
increased our ownership of the voting rights of Wavecom from 90.57% to 95.4% and, on April 29, 2009, completed
our acquisition of all of the remaining Wavecom shares, except for certain shares held by employees that are subject
to a hold period, and OCEANEs by way of a squeeze-out. The Wavecom shares and OCEANEs have been delisted
from the Euronext and the ADSs have been delisted from the NASDAQ Global Market (―Nasdaq‖).
Prior to our acquisition of Wavecom, Wavecom announced a cost savings program and a proposed reorganization.
The first portion of this plan, related to its operations in the United States, began in late 2008. In the second quarter
of 2009, the staff reduction program in France related to this reorganization was implemented. A total of 77
positions in France were impacted, with three of these positions remaining to be phased out by the third quarter of
2010.
On January 29, 2009, also prior to the acquisition of Wavecom, Sierra Wireless implemented an expense reduction
program that was completed during the first quarter of 2009 and included the elimination of approximately 56
positions, representing 10% of our workforce. In the first quarter of 2009, we incurred a pre-tax charge of
approximately $1.6 million related to the program, which includes $0.5 million of stock-based compensation
expense.
On May 15, 2009, we announced further cost reduction initiatives related to the integration of Wavecom and Sierra
Wireless that included combining the research and development (―R&D‖) and product operations of both
organizations. As a result, the Wavecom location in Research Triangle Park, North Carolina, was closed in the
fourth quarter of 2009. R&D activities from this location have been transitioned primarily to the Sierra Wireless
location in Carlsbad, California. The cost reduction initiatives in the U.S. and France were substantially completed
by the first quarter of 2010.
Key factors that we expect will affect our results in the near term are general economic conditions in the markets we
serve, our ability to successfully complete the integration of the Wavecom acquisition, the relative competitive
position our products have within the wireless operators’ sales channels in any given period, the availability of
components from key suppliers, timing of deployment of mobile broadband networks by wireless operators, wireless
technology transitions, the rate of adoption by end-users, the timely launch and ramp up of sales of our new products
currently under development, the level of success our OEM customers achieve with sales of embedded solutions to
end users and our ability to secure future design wins with both existing and new OEM customers. We expect that
product and price competition from other wireless communications device manufacturers will continue to be intense.
As a result of these factors, we may experience volatility in our results on a quarter to quarter basis.
With the acquisition of Wavecom, we have a significantly expanded product line and global roster of sales channels.
However, the state of the global economy causes us to continue to be cautious regarding revenue trends in the near
term. We expect that Q2 2010 revenue will increase relative to Q1 2010. Specific product and business
development initiatives include:

5
M2M Business
Our M2M business includes our AirPrime™ Intelligent Embedded Modules, excluding sales to PC OEMs,
AirLink™ Intelligent Gateways and Routers and AirVantage™ Services Platform and Solutions. Our M2M revenue
was $88.7 million in the first quarter of 2010, compared to $30.9 million in the same period of 2009.
AirPrime™ Intelligent M2M Embedded Modules (excludes PC OEM embedded modules)
Our expanded line-up of AirPrime Intelligent Embedded Modules is used by a wide range of OEMs to wirelessly
enable their products and solutions. Our M2M OEM customers cover a broad range of industries including
consumer electronics, networking equipment, automotive, security, transaction processing, fleet management,
energy and public safety.
In the first quarter of 2010, sales of our M2M embedded module products increased 268% to $75.7 million,
compared to $20.6 million in the same period of 2009, primarily as a result of our acquisition of Wavecom.
With the acquisition of Wavecom, we have significantly expanded our global position in wireless embedded
solutions for M2M. In the first quarter of 2010, we had particularly strong shipments of our module that is
embedded inside the Barnes & Noble ―nook‖ ebook reader. We also launched our new AirPrime™ SL Series
intelligent embedded modules. Designed to suit the needs of manufacturers of small host devices in high-volume
production, such as e-readers, personal navigation devices and gaming devices, the Sierra Wireless AirPrime SL
Series offers EDGE and HSDPA connectivity in a compact, lightweight form factor. Also during the first quarter of
2010, Funkwerk Enterprise Communications GmbH selected the Sierra Wireless AirPrime™ MC8790 HSPA
Embedded Module to provide high-speed mobile broadband connectivity to the Funkwerk bintec RS120wu router.
We believe the long-term growth and profitability prospects in the embedded M2M market are strong and we plan to
continue to invest to expand our leadership position.
AirLink™ Intelligent Gateways and Routers
Our AirLink Intelligent Gateways and Routers are sold to public safety, transportation, field service, energy,
industrial and financial organizations and are among our highest gross margin products. We believe that there are
strong profitable growth prospects for our AirLink intelligent gateway solutions and intend to capture these
opportunities through segment, product line and geographical expansion.
In the first quarter of 2010, revenue from AirLink intelligent gateway solutions increased 15% to $10.5 million from
$9.1 million in the same period of 2009 primarily as a result of our acquisition of Wavecom.
During the first quarter of 2010, EDMI selected our intelligent embedded modules to integrate into its advanced
electronic energy meter to service the growing global smart meter market. In addition, together with Prumaro d.o.o.
and local integrator Telos d.o.o., we announced the deployment of Prumaro’s GEM interactive digital signage
application, powered by Sierra Wireless’ AirLink™ Pinpoint X mobile communications gateway in 128 public
buses and 64 kiosks throughout Slovenia’s capital of Ljubljana.
AirVantage™ Services Platform and Solutions
Our AirVantage business unit provides solutions and services that allow system integrators, enterprises and telecom
operators to accelerate the deployment of complete M2M solutions for managing remote equipment and assets.
These solutions are based on tools that facilitate the development and delivery of applications that are hosted on our
AirVantage services platform. Our services platform is scalable, secure and compatible with a broad range of
available wireless equipment.
During the first quarter of 2010, we signed a services contract with IBM to host a new services platform dedicated to
our software as a service M2M offering. The new hosting facility is expected to support a growing number of North
American customers, including Orbcomm who went live on the platform in March 2010. We announced a new
Consumer Device Management application for the Sierra Wireless AirVantage™ Services Platform that offers
wireless network operators and M2M solution providers a simple, cost effective way to deploy and manage mass
market consumer devices. In addition, together with the French wireless network operator Bouygues Telecom, we
introduced a new bundled offer for wireless M2M communication that targets industrial, sales and payment, and
security solutions. The bundle gives access to Bouygues Telecom’s prepaid pan-European data airtime on the new
Sierra Wireless AirLink™ GL6100 GSM/GPRS modem with Embedded SIM and includes a one year subscription
to Sierra Wireless’ AirVantage™ Management Services for remote diagnosis and software upgrades.

6
Mobile Computing Business
Our mobile computing business includes our AirCard® Mobile Broadband Devices and embedded module sales to
PC OEM customers. Our mobile computing revenue was $62.6 million in the first quarter of 2010, compared to
$80.5 million in the same period of 2009.
AirCard® Mobile Broadband Devices
Our AirCard mobile broadband device family includes our AirCard branded PC cards, USB modems and mobile
Wi-Fi hotspots. Our AirCards, sold to wireless operators around the world, provide a simple way to connect
notebooks, netbooks and other electronic devices to the Internet, over 3G and 4G mobile broadband networks. In
the first quarter of 2010, sales of our AirCard products decreased 25% to $57.0 million, compared to $76.0 million
in the same period of 2009 due primarily to lower unit volume sales.
Notwithstanding our lower AirCard revenue in the first quarter of 2010 compared to the same period of 2009, we
believe that the market for our AirCard products continues to offer profitable opportunities. Competition in this
market continues to be intense and our future success will depend in part on our ability to continue to develop
differentiated products that meet our customers’ evolving technology, design, schedule and price requirements.
During the first quarter of 2010, we continued to have a strong position with AT&T and Telstra for shipments of our
HSPA AirCards and with Sprint for shipments of our 3G/4G Mobile Hotspot and EV-DO Rev A AirCards.
During the first quarter of 2010, we began shipping the Sierra Wireless AirCard W801 Mobile Hotspot, the world’s
first wireless mobile hotspot that combines 3G (EV-DO Rev A) with 4G (WiMax) and WiFi technologies. Also
known as the Overdrive™ 3G/4G Mobile Hotspot launched by Sprint, this product turns a single Internet connection
into a wireless LAN that can be shared by multiple users.
Also during the first quarter of 2010, together with Telefonica, we successfully demonstrated an innovative cloud
computing application at Mobile World Congress in Barcelona, Spain. Using the Sierra Wireless AirCard 310U
USB modem, the 3GBox demonstration showcased a unique product and service combination wherein a customer
would be provided with an online storage vault accessed directly via the USB modem.
DNA Ltd., a Finnish telecommunications company, began offering its customers even faster connections with
modem devices supplied by Sierra Wireless, the first time Sierra Wireless USB modems have been commercially
available in Finland.
During the first quarter of 2010, we introduced our upcoming product portfolio, enhancing our HSPA+ product line
with a selection of products to support customers migrating to dual-carrier HSPA+ technology, effectively doubling
the speeds of currently available HSPA+ devices. The Sierra Wireless AirCard 312U USB modem is scheduled for
commercial release later this year from Telstra in Australia. Dual-carrier HSPA+ doubles the downlink speeds of
current HSPA+ networks from a theoretical maximum of 21 megabits per second (―Mbps‖) to 42 Mbps, making
them more efficient and providing a better user experience for customers.
We also announced that the Sierra Wireless AirCard product line provides a Windows 7 Device Stage experience
across multiple devices. Sierra Wireless is the first mobile broadband modem supplier to deploy a Device Stage
experience, which provides customers with more convenient, intuitive access to their device and account
information.
AirPrime™ Intelligent Embedded Modules for PC OEMs
In the first quarter of 2010, revenue from sales of our AirPrime Intelligent Embedded Modules to PC OEM
customers increased 26% to $4.8 million from $3.8 million in the first quarter of 2009.
During the first quarter of 2010, Fujitsu selected Sierra Wireless to provide 3G mobile broadband for several new
models in Fujitsu’s LIFEBOOK series notebooks which will utilize Qualcomm’s Gobi™ Global Mobile Internet
technology, provided by Sierra Wireless. Panasonic Computer Solutions Company, manufacturer of durable,
reliable Panasonic Toughbook® mobile computers, announced that with our help, it would deploy Gobi2000™
technology across its Toughbook line of rugged mobile computers. We also have new opportunities with Tier 1 PC
OEM manufacturers and expect to secure design wins for platform launches in 2011.We believe that these new
design wins will enable us to continue to grow our revenue from PC OEM customers in subsequent quarters. Our
ability to secure additional design wins in the PC OEM market will depend on being successful in developing
products and offering services that meet our customers’ technology, design, schedule and price requirements.

7
Selected Annual Information
Years ended December 31, 2007 2008 2009
Revenue .................................................................................................................. $ 439,903 $567,308 $526,384
Net earnings (loss) .................................................................................................. 32,459 62,583 (39,899)
Basic earnings (loss) per share................................................................................ 1.17 2.00 (1.29)
Diluted earnings (loss) per share ............................................................................ 1.16 2.00 (1.29)
Total assets ............................................................................................................. 385,021 462,386 484,519
Total long term liabilities ....................................................................................... 6,919 15,105 36,105
See discussion under ―Results of Operations‖ for factors that have caused period to period variations.
Results of Operations
The following table sets forth our operating results for the three months ended March 31, 2010, expressed as a
percentage of revenue:
Three months ended March 31, 2010 2009
Revenue .............................................................................................................................. 100.0% 100.0% Cost of goods sold .............................................................................................................. 69.4 71.7 Gross margin ...................................................................................................................... 30.6 28.3 Expenses Sales and marketing ..........................................................................................................
9.4
8.4
Research and development ............................................................................................... 13.6 13.4
Administration .................................................................................................................. 6.3 5.9
Acquisition costs .............................................................................................................. — 5.9 Restructuring costs ........................................................................................................... 1.1 1.5 Integration costs ............................................................................................................... 1.2 0.2 Amortization ..................................................................................................................... 2.0 2.2 33.6 37.5 Loss from operations .......................................................................................................... (3.0) (9.2) Foreign exchange loss ........................................................................................................ (2.4) (8.9) Other expense ..................................................................................................................... (0.1) (3.6) Loss before income taxes ................................................................................................... (5.5) (21.7) Income tax recovery ........................................................................................................... (0.5) (0.2)
Loss before non-controlling interest ................................................................................... (5.0) (21.5)
Less: Non-controlling interest ........................................................................................... — (0.3)
Net loss ............................................................................................................................... (5.0)% (21.2)%

8
Our revenue by product, by distribution channel and by geographical region is as follows:
Three months ended March 31, 2010 2009
Revenue by business line
M2M ........................................................................................................................... 28% 59%
Mobile computing ....................................................................................................... 72 41
100% 100%
Revenue by product
AirPrime Intelligent Embedded Modules ................................................................... 53% 22%
AirCard Mobile Broadband Devices........................................................................... 38 68
AirLink Intelligent Gateways and Routers ................................................................. 7 8
AirVantage Solutions and Other ................................................................................. 2 2
100% 100%
Revenue by geographical region
Americas ..................................................................................................................... 42% 68%
Europe, Middle East and Africa (―EMEA‖) ............................................................... 13 14
Asia-Pacific ................................................................................................................. 45 18
100% 100%
Non-GAAP Financial Measures
Our consolidated financial statements are prepared in accordance with U.S. GAAP on a basis consistent for all
periods presented. In addition to results reported in accordance with U.S. GAAP, we use non-GAAP financial
measures as supplemental indicators of our operating performance. The term ―non-GAAP financial measure‖ is
used to refer to a numerical measure of a company’s historical or future financial performance, financial position or
cash flows that: (i) excludes amounts, or is subject to adjustments that have the effect of excluding amounts, that are
included in the most directly comparable measure calculated and presented in accordance with U.S. GAAP in a
company’s statement of income, balance sheet or statement of cash flows; or (ii) includes amounts, or is subject to
adjustments that have the effect of including amounts, that are excluded from the most directly comparable measure
so calculated and presented. We refer to gross margin, earnings (loss) from operations, net earnings (loss) and
diluted earnings (loss) per share adjusted for specific items that affect comparability as non-GAAP gross margin,
non-GAAP earnings (loss) from operations, non-GAAP net earnings (loss) and non-GAAP diluted earnings (loss)
per share, respectively. We disclose non-GAAP amounts as we believe that these measures provide better
information on actual operating results and assist in comparisons from one period to another.
Readers are cautioned that non-GAAP financial measures do not have any standardized meaning prescribed by U.S.
GAAP and therefore may not be comparable to similar measures presented by other companies.

9
The following table provides a reconciliation of the non-GAAP financial measures for the three months ended
March 31, 2010 and 2009 to our U.S. GAAP results:
Results of Operations – Three Months Ended March 31, 2010 Compared to Three Months Ended
March 31, 2009
Revenue
Revenue amounted to $151.3 million for the three months ended March 31, 2010, compared to $111.4 million in the
same period of 2009, an increase of 36%. The increase in revenue was primarily a result of an increase in sales of
our M2M products, partially offset by a decrease in sales of our mobile computing products. Our sales of M2M
products increased primarily due to strong sales of our embedded modules used in consumer electronics and the
inclusion of Wavecom products for a full quarter in the first quarter of 2010, compared to only one month in the
same period of 2009.
Our revenue from customers in the Americas, EMEA and the Asia-Pacific region comprised 42%, 13% and 45%,
respectively, of our total revenue in the first quarter of 2010, compared to 68%, 14% and 18%, respectively, of our
total revenue in the same period of 2009. Our business in North America decreased by 17% compared to the first
quarter of 2009 due primarily to a decrease in sales of our AirCards. Our business in EMEA increased by 28%
compared to the first quarter of 2009 due primarily to the increase in revenue from the Wavecom acquisition,
partially offset by a decrease in sales of our AirCards and sales of embedded modules to PC OEM customers. Our
business in the Asia-Pacific region increased 237% compared to the first quarter of 2009 due primarily to increased
sales of our embedded modules used in consumer electronics as well as the increased revenue from the Wavecom
acquisition.
In the first quarter of 2010, AT&T, Sprint and Barnes and Noble each accounted for more than 10% of our revenue
and, in the aggregate, these three customers represented approximately 46% of our revenue. In the first quarter of
2009, AT&T and Sprint each accounted for more than 10% of our revenue and, in the aggregate, these two
customers represented approximately 51% of our revenue.
With the acquisition of Wavecom, we have a significantly expanded product line and global roster of sales channels.
The state of the global economy causes us to continue to be cautious regarding revenue trends in the near term,
however we expect that Q2 2010 revenue will increase compared to Q1 2010.
Three months ended March 31, 2010 2009
(in millions of U.S. dollars)
Revenue – GAAP and Non-GAAP $ 151.3 $ 111.4
Gross margin – GAAP $ 46.3 $ 31.5
Stock-based compensation 0.1 0.1
Gross margin – Non-GAAP $ 46.4 $ 31.6
Loss from operations – GAAP $ (4.5) $ (10.3)
Stock-based compensation 1.7 2.1
Transaction costs — 6.5
Restructuring and other costs 1.6 1.2
Integration costs 1.8 0.3
Acquisition related amortization 3.5 2.4
Earnings from operations – Non-GAAP
$ 4.1 $ 2.2
Net loss – GAAP $ (7.5) $ (23.7)
Stock-based compensation, transaction, restructuring,
integration and acquisition amortization costs,
net of tax
8.1
12.3
Foreign exchange loss 3.6 9.9
Interest expense — 4.3
Non-controlling interest (0.1) (0.3)
Net earnings – Non-GAAP
$ 4.1 $ 2.5
Loss per share – GAAP $ (0.24) $ (0.76)
Diluted earnings per share – Non-GAAP
$ 0.13 $ 0.08

10
Gross margin
Gross margin amounted to $46.3 million for the three months ended March 31, 2010, or 30.6% of revenue,
compared to $31.5 million, or 28.3% of revenue, in the same period of 2009. The increase in gross margin
percentage resulted primarily from product cost reductions, as well as the addition of higher margin products from
the Wavecom acquisition. Gross margin included $0.1 million of stock-based compensation expense in each of the
first quarters of 2010 and 2009.
During the second quarter of 2010, we expect that our gross margin percentage will decline compared to Q1 2010
primarily as a result of gross margin declines in our mobile computing business partially offset by gross margin
improvements in our M2M business.
Sales and marketing
Sales and marketing expenses were $14.2 million for the three months ended March 31, 2010, compared to $9.4
million in the same period of 2009, an increase of 51%. The increase in sales and marketing costs is due primarily
to the addition of staff and costs from the Wavecom acquisition. Sales and marketing expenses included $0.4
million of stock-based compensation expense in each of the first quarters of 2010 and 2009. Sales and marketing
expenses as a percentage of revenue increased to 9.4% in the three months ended March 31, 2010, compared to
8.4% in the same period of 2009, primarily due to the addition of costs from the Wavecom acquisition.
Research and development
Research and development expenses amounted to $20.5 million for the first quarter of 2010, compared to $15.0
million in the same period of 2009, an increase of 37%. The increase is due primarily to the addition of staff and
costs from the Wavecom acquisition.
During 2009, we finalized our obligations with respect to our conditionally repayable research and development
funding agreement with the Government of Canada’s Technology Partnerships Canada (―TPC‖). Under the terms of
the original agreement, royalty repayments, based on a percentage of annual sales in excess of certain minimum
amounts, would be calculated over the period from April 2003 to December 2011. If royalty repayments were less
than Cdn $16.5 million by December 2011, repayments would have continued subsequent to December 2011 until
the earlier of when this amount was reached or December 2014. In March 2009, we signed an amended agreement
under which we will pay a total of Cdn $2.5 million in five equal annual installments commencing March 1, 2009, in
full and final satisfaction of all amounts owing, or to be owed, to TPC under this agreement. We had previously
accrued payments under the original agreement and as a result of the amended agreement we have reversed accruals
recorded in research and development expense totaling $0.8 million during the first quarter of 2009.
Included in research and development expenses was $0.3 million of stock-based compensation expense in each of
the first quarters of 2010 and 2009.
Research and development expenses, excluding government research and development funding repayments and
reversal of accruals, were $20.2 million, or 13.3% of revenue, for the three months ended March 31, 2010, compared
to $15.8 million, or 14.2% of revenue, in the same period of 2009.
Administration
Administration expenses amounted to $9.6 million, or 6.3% of revenue, for the three months ended March 31, 2010,
compared to $6.5 million, or 5.9% of revenue, in the same period of 2009. The increase in administration costs is
primarily due to the addition of staff and costs from the Wavecom acquisition as well as increased legal fees (see
―Legal proceedings‖). Included in administration expenses was $0.9 million of stock-based compensation expense
in the first quarter of 2010, compared to $0.8 million in the same period of 2009.
Acquisition costs
Acquisition costs were nil for the three months ended March 31, 2010, compared to $6.5 million for the same period
of 2009. The acquisition costs were related to the acquisition of Wavecom.

11
Restructuring costs
During the second quarter of 2009, as part of the Wavecom cost reduction initiatives announced prior to our
acquisition of Wavecom, the staff reduction program in France was implemented. A total of 77 positions were
impacted, with three of these positions remaining to be phased out in the second quarter of 2010. On May 15, 2009,
we announced further cost reduction initiatives related to the integration of Wavecom and Sierra Wireless that
included combining the R&D and product operations. As a result, the Wavecom location in Research Triangle Park,
North Carolina, was closed during the fourth quarter of 2009.
In the first quarter of 2010, restructuring costs were $1.6 million, compared to $1.7 million in the same period of
2009. The restructuring costs in the first quarter of 2010 were related to the termination of additional employees,
primarily in Europe. The liability related to this workforce reduction was substantially paid by March 31, 2010. In
the first quarter of 2009, we completed an expense reduction program that included the reduction of approximately
56 positions. As a result, restructuring costs, comprised primarily of severance costs and stock compensation
expense, amounted to $1.7 million in the first quarter of 2009.
Integration costs
In the first quarter of 2010, integration costs related to the acquisition of Wavecom were $1.8 million, compared to
$0.3 million in the same period of 2009. Integration costs included the cost of employees retained for integration
activities, related travel expenses and consulting fees.
Foreign exchange loss
Our foreign exchange loss was $3.7 million for the three months ended March 31, 2010, compared to a foreign
exchange loss of $9.9 million in the same period of 2009. Our foreign exchange loss for the first quarter of 2010
includes a net foreign exchange loss of $2.0 million on an intercompany balance that the parent company has with
its self-sustaining foreign operations that arose as a result of the Wavecom acquisition. Our foreign exchange loss
for the first quarter of 2009 includes an unrealized foreign exchange loss of $15.7 million on Euros held for the
Wavecom transaction, partially offset by an unrealized foreign exchange gain of $7.8 million on intercompany
balances that the parent company has with its self-sustaining foreign operations.
Other expense
Other expense, which includes interest expense and interest income, was $0.1 million for the three months ended
March 31, 2010, compared to other expense of $4.0 million in the same period of 2009. Other expense in 2009
includes $3.9 million of financing costs and $0.4 million of interest expense related to the credit facilities that were
set up in connection with the Wavecom acquisition. Interest income decreased to $0.1 million in the first quarter of
2010, from $0.4 million in the same period of 2009 due to a decrease in our cash and short-term investment balances
that were used to fund the Wavecom acquisition, as well as a decline in interest rates.
Income tax recovery
Income tax recovery was $0.7 million for the three months ended March 31, 2010, compared to $0.3 million in the
same period of 2009.
Non-controlling interest
The non-controlling interest for the three months ended March 31, 2010 was $0.1 million, compared to $0.3 million
in the same period of 2009. The non-controlling interest represents the non-controlling interest in Wavecom’s loss
that results from the shares held by Wavecom employees under their long-term incentive plan. The shares have
vested, but are subject to a hold period for tax purposes. We have entered into a put/call agreement with these
employees to purchase back the shares at €8.50 per share upon expiry of the tax hold period. Until that time, the
shares are considered the non-controlling interest.

12
Net loss
Our net loss amounted to $7.5 million, or loss per share of $0.24, for the three months ended March 31, 2010,
compared to a net loss of $23.7 million, or loss per share of $0.76, in the same period of 2009. Included in our net
loss was $1.7 million of stock-based compensation expense in the first quarter of 2010, compared to $2.1 million in
the same period of 2009.
The weighted average diluted number of shares outstanding was 31.0 million at March 31, 2010 and 2009. The
number of shares outstanding at March 31, 2010 was 31.1 million, compared to 31.0 million at March 31, 2009.
Acquisition of Wavecom S.A.
On December 2, 2008, we announced an all-cash offer to purchase all of the ordinary shares and OCEANEs of
Wavecom, a global leader in wireless M2M solutions headquartered in Issy-les-Moulineaux, France. The total value
of the transaction was approximately €218.0 million. We made a cash offer of €8.50 per share of Wavecom and
€31.93 per OCEANE. The transaction was implemented by way of concurrent but separate public tender offers in
both France and the United States for all Wavecom shares, all ADSs representing Wavecom’s shares and all
OCEANEs issued by Wavecom.
On February 27, 2009, we completed our acquisition of 84.32% of the outstanding shares and 99.97% of the
outstanding OCEANEs of Wavecom, representing 90.57% of the voting rights of Wavecom. Following a statutory
re-opening of the tender offer and our purchase of Wavecom shares on the market, we increased our ownership of
the voting rights of Wavecom from 90.57% to 95.4% and, on April 29, 2009, completed our acquisition of all of the
remaining Wavecom shares, except for certain shares held by employees that are subject to a hold period, and
OCEANEs by way of a squeeze-out. The Wavecom shares and OCEANEs have been delisted from the Euronext
and the ADSs have been delisted from the Nasdaq.
We expect the combination of Sierra Wireless and Wavecom will create a global leader that will be uniquely
positioned to benefit from the anticipated growth in the wireless mobile computing and M2M markets. We expect
the acquisition to significantly expand our position in the global M2M market, broaden our product offerings and
increase our scale and capabilities in Europe and Asia.
International Financial Reporting Standards (“IFRS”)
In November 2008, the Securities and Exchange Commission (―SEC‖) announced a proposed roadmap for comment
regarding the potential use by U.S. registrants of financial statements prepared in accordance with IFRS. IFRS is a
comprehensive series of accounting standards published by the International Accounting Standards Board. On
February 24, 2010, the SEC issued a statement describing its position regarding global accounting standards.
Among other things, the SEC stated that it has directed its staff to execute a work plan, which will include
consideration of IFRS as it exists today and after completion of various ―convergence‖ projects currently underway
between U.S. and international accounting standards setters. By 2011, assuming completion of certain projects and
the SEC staff’s work plan, the SEC will decide whether to incorporate IFRS into the U.S. financial reporting system.
We will continue to monitor the development of the potential implementation of IFRS.
Legal Proceedings
In July 2009, a patent holding company, SPH America, LLC, filed a patent litigation lawsuit in the United States
District Court for the Eastern District of Virginia asserting patent infringement by a number of device
manufacturers, including us, and computer manufacturers, including Hewlett-Packard Co. (―HP‖), Panasonic
Corporation (―Panasonic‖), General Dynamics Itronix Corporation (―GD‖) and Fujitsu America and Fujitsu Japan
(―Fujitsu‖). The litigation, which has been transferred to the United States District Court, Southern District of
California, makes certain allegations concerning the wireless modules sold to the computer manufacturers by us, our
competitors, and some of our customers with whom we have supply agreements. We are assessing our obligations
and our liability, if any, in respect of this litigation. Although there can be no assurance that an unfavourable
outcome would not have a material adverse effect on our operating results, liquidity or financial position, we believe
the claims are without merit and will vigorously defend the lawsuit.
In July 2009, a patent holding company, WIAV Networks, LLC, filed a patent litigation lawsuit in the United States
District Court for the Eastern District of Texas asserting patent infringement by a number of parties, including
wireless device manufacturers, including us. We are currently assessing our potential liability, if any, in respect of
this litigation. Although there can be no assurance that an unfavourable outcome would not have a material adverse

13
effect on our operating results, liquidity or financial position, we believe the claims are without merit and will
vigorously defend the lawsuit.
In July, 2009, a patent holding company, Celltrace, LLC, filed a patent litigation lawsuit in the United States District
Court for the Eastern District of Texas asserting patent infringement by a number of telecommunication carrier
companies including Sprint Spectrum, LP and AT&T Mobility LLC. The litigation makes certain allegations
concerning the wireless modems sold to the carriers by us and our competitors. We are currently assessing our
obligations and our liability, if any, in respect of this litigation. Although there can be no assurance that an
unfavourable outcome would not have a material adverse effect on our operating results, liquidity or financial
position, we believe the claims are without merit and will vigorously defend the lawsuit.
In June 2009, a patent holding company, Saxon Innovations, LLC (―Saxon‖), filed a patent litigation lawsuit in the
United States District Court for the Eastern District of Texas asserting patent infringement by a number of wireless
device manufacturers, including us. The litigation makes certain allegations concerning the products sold by those
manufacturers. We are currently assessing our liability, if any, in respect of this litigation. Although there can be no
assurance that an unfavourable outcome would not have a material adverse effect on our operating results, liquidity
or financial position, we believe the claims are without merit and will vigorously defend the lawsuit.
In January 2009, a patent holding company, DNT LLC, filed a patent litigation lawsuit in the United States District
Court for the Eastern District of Virginia asserting patent infringement by a number of telecommunication carrier
companies including Sprint Spectrum, LP and Nextel, Verizon Wireless and T-Mobile USA, Inc. The litigation
made certain allegations concerning the wireless modems sold to the carriers by us and our competitors. Following a
trial in December 2009, the Court received a jury verdict of patent non-infringement and invalidity. In February,
2010, DNT LLC filed a motion for a new trial or in the alternative for an amended judgment. While we believe that
this motion will be unsuccessful, we intend to vigorously defend the motion. DNT LLC has indicated its intention
to file an appeal from the Court’s verdict. While we believe that the appeal, if any, will be unsuccessful, we intend
to vigorously defend against the appeal.
On February 6, 2008, Wavecom filed a civil proceeding in the Supreme Court of the State of New York (USA)
against Siemens AG and two of its U.S. subsidiaries. Sierra Wireless S.A., Wavecom, Inc., Siemens AG, Siemens
Corporation, and Siemens Energy and Automation, Inc. have reached a mutually agreeable settlement of the lawsuit
filed in New York State Court. The details of the settlement agreement are confidential.
Since early December 2008, Wavecom and its subsidiary Wavecom, Inc. have been involved in litigation with a
contracting counterparty, Temic Automotive of North America (Continental Group). Temic Automotive of North
America, Inc., d/b/a/ Continental and Continental AG, Wavecom, Inc., Wavecom, S.A., Sierra Wireless, Inc., Sierra
Wireless Americas, Inc., and Sierra Wireless, S.A. have reached a mutually agreeable settlement of the lawsuits
filed early December 2008 in North Carolina Business Court and New York State Court. The details of the
settlement agreement are confidential.
We are engaged in certain other claims and legal actions in the ordinary course of business and believe that the
ultimate outcome of these actions will not have a material adverse effect on our operating results, liquidity or
financial position.
Critical Accounting Estimates
We prepare our consolidated financial statements in accordance with U.S. GAAP and we make estimates and
assumptions that affect the reported amounts of assets, liabilities, revenue, expenses and the related disclosure of
contingent liabilities. On an ongoing basis, we evaluate our estimates and judgments, including those related to
revenue recognition, adequacy of allowance for doubtful accounts, adequacy of inventory reserve, valuation of
goodwill and intangible assets, income taxes, adequacy of warranty reserve, royalty obligations, lease provision,
contingencies and stock-based compensation. We base our estimates on historical experience, anticipated results
and trends and on various other assumptions that we believe are reasonable under the circumstances. By their nature,
estimates are subject to an inherent degree of uncertainty. Actual results may differ from our estimates. Senior
management has discussed with our audit committee the development, selection and disclosure of accounting
estimates used in the preparation of our consolidated financial statements.
Effective January 1, 2009, we adopted a new policy to account for assets acquired and liabilities assumed in a
business combination. Under this policy, the acquisition method is used to record all identifiable assets, liabilities,
non-controlling interests and goodwill acquired at fair value. We have applied this policy to our acquisition of
Wavecom. We did not adopt any other new accounting policies or make changes to existing accounting policies that
had a material impact on our consolidated financial statements.

14
The following critical accounting policies affect our more significant estimates and assumptions used in preparing
our consolidated financial statements:
We recognize revenue from sales of products and services upon the later of transfer of title or upon
shipment of the product to the customer or rendering of the service, so long as collectibility is reasonably
assured. Customers include resellers, original equipment manufacturers, wireless operators and end-users.
We record deferred revenue when we receive cash in advance of the revenue recognition criteria being met.
A significant portion of our revenue is generated from sales to resellers. We recognize revenue on the
portion of sales to certain resellers that are subject to contract provisions allowing various rights of return
and stock rotation, upon the earlier of when the rights have expired or the products have been reported as
sold by the resellers.
Revenues from contracts with multiple-element arrangements, such as those including technical support
services, are recognized as each element is earned based on the relative fair value of each element and only
when there are no undelivered elements that are essential to the functionality of the delivered elements.
Revenue from licensed software is recognized at the inception of the license term. Revenue from software
maintenance, unspecified upgrades and technical support contracts is recognized over the period such items
are delivered or services are provided. Technical support contracts extending beyond the current period are
recorded as deferred revenue.
Funding from research and development agreements, other than government research and development
arrangements, is recognized as revenue when certain criteria stipulated under the terms of those funding
agreements have been met and when there is reasonable assurance the funding will be received. Certain
research and development funding will be repayable only on the occurrence of specified future events. If
such events do not occur, no repayment would be required. We recognize the liability to repay research
and development funding in the period in which conditions arise that would cause research and
development funding to be repayable. Government research and development arrangements are recognized
as a reduction of the related expense when the criteria stipulated under the terms of the agreements have
been met and when there is reasonable assurance the funding will be received.
We maintain an allowance for doubtful accounts for estimated losses that may arise if any of our customers
are unable to make required payments. We consider the following factors when determining whether
collection is reasonably assured: customer credit-worthiness, past transaction history with the customer,
insured amounts, if any, current economic industry trends and changes in customer payment terms. If we
have no previous experience with the customer, we typically obtain reports from credit organizations to
ensure that the customer has a history of paying its creditors. We may also request financial information,
including financial statements, to ensure that the customer has the means of making payment. If these
factors indicate collection is not reasonably assured, revenue is deferred until collection becomes
reasonably assured, which is generally upon receipt of cash. If the financial condition of any of our
customers deteriorates, we may increase our allowance.
We value our inventory at the lower of cost, determined on a first-in-first-out basis, and estimated net
realizable value. We assess the need for an inventory writedown and/or an accrual for estimated losses on
inventory purchase commitments based on our assessment of estimated market value using assumptions
about future demand and market conditions. Our reserve requirements generally increase as our projected
demand requirements decrease, due to market conditions, technological and product life cycle changes and
longer than previously expected usage periods. If market conditions are worse than our projections, we
may further writedown the value of our inventory or increase the accrual for estimated losses on inventory
purchase commitments.
We currently have intangible assets of $80.2 million and goodwill of $92.1 million generated primarily
from our acquisitions of Wavecom in February 2009, AirLink in May 2007 and AirPrime in August 2003.
Goodwill and intangible assets are assessed for impairment annually, or more often, if an event or
circumstance indicates that an impairment loss may have been incurred.
We determined that we had two reporting units as of December 31, 2009. We assessed the realizability of
goodwill related to each of the reporting units during the fourth quarter of 2009 and determined that the fair
value exceeded the carrying amount for each reporting unit by a substantial margin. Therefore, the second
step of the impairment test that measures the amount of an impairment loss by comparing the implied fair

15
market value for each reporting unit with the carrying amount of the goodwill for each reporting unit was
not required. There was no impairment of goodwill during the first quarter of 2010 or the year ended
December 31, 2009.
We recognize and measure each tax position related to income tax positions taken or expected to be taken
in a tax return. We have reviewed our tax positions to determine which should be recognized and measured
according to the more likely than not threshold requirement. The tax benefits recognized in the financial
statements are measured based on the largest benefit that has a greater than fifty percent likelihood of being
realized upon ultimate resolution.
If the realization of a tax position is not considered more likely than not, we provide for a valuation
allowance. The ultimate realization of our deferred tax assets is dependent upon the generation of future
taxable income during the periods in which temporary differences become deductible. We consider
projected future taxable income and tax planning strategies in making our assessment. If our assessment of
our ability to realize our deferred tax assets changes, we may make an adjustment to our deferred tax assets
that would be charged to income (loss).
We accrue product warranty costs in accrued liabilities to provide for the repair or replacement of defective
products. Our accrual is based on an assessment of historical experience and management’s estimates. If
there is a change in the quality of our products, we will adjust our accrual accordingly.
Under license agreements, we are committed to royalty payments based on the sales of products using
certain technologies. We recognize royalty obligations as determinable in accordance with agreement
terms. Where agreements are not finalized, we have recognized our current best estimate of the obligation
in accrued liabilities and other long-term liabilities. When the agreements are finalized, the estimate will
be revised accordingly.
If we are engaged in legal actions, we estimate the range of liability related to pending litigation where the
amount and range of loss can be reasonably estimated. We record our best estimate of a loss when the loss
is considered probable. As additional information becomes available, we assess the potential liability
relating to our pending litigation and revise our estimates.
We recognize stock-based compensation expense for all stock-based compensation awards based on the fair
value at grant date. We recognize stock-based compensation expense for those shares expected to vest on a
straight-line basis over the requisite service period of the award.
Determining the appropriate fair value model and calculating the fair value of share-based payment awards
requires the input of subjective assumptions. The assumptions used in calculating the fair value of share-
based payment awards represent management’s best estimates, but these estimates involve inherent
uncertainties and the application of management’s judgment. As a result, if factors change and we use
different assumptions, our stock-based compensation expense could be materially different in the future.
Liquidity and Capital Resources
Operating Activities
Cash used by operating activities was $7.9 million for the three months ended March 31, 2010, compared to cash
provided by operating activities of $10.5 million in the same period of 2009. The use of cash in operating activities
in first quarter of 2010 primarily resulted from our net loss of $7.0 million adjusted for net non-cash items of $10.1
million as well as changes in other operating assets and liabilities of $10.9 million.
Investing Activities
Cash provided by investing activities was $12.9 million in the three months ended March 31, 2010, compared to
$9.6 million in the same period of 2009. Cash provided by investing activities in the first quarter of 2010 was due
primarily to the net proceeds on maturity of short-term investments of $15.8 million, compared to the use of cash of
$21.5 million to fund purchases of short-term investments, net of proceeds on maturity of short-term investments in
the same period of 2009. Cash provided by investing activities in the first quarter of 2009 was due primarily to a
reduction in restricted cash of $146.3 million, offset by cash used for the acquisition of OCEANEs of $104.8
million. The restricted cash of $146.3 million was used to purchase Wavecom net assets of $146.7 million, which
included cash acquired of $139.8 million, resulting in net cash used for the acquisition of $6.9 million. We also
16
used cash for expenditures on fixed and intangible assets of $1.9 million and $1.0 million, respectively, for the three
months ended March 31, 2010, compared to $2.5 million and $1.0 million, respectively, in the same period of 2009.
Capital expenditures were primarily for production and tooling equipment, research and development equipment,
computer equipment and software, while intangible assets were primarily for patents and software licenses.
We do not have any trading activities that involve any type of commodity contracts that are accounted for at fair
value but for which a lack of market price quotations necessitate the use of fair value estimation techniques.
Financing Activities
Cash used by financing activities was $0.4 million in the three months ended March 31, 2010, compared to $4.0
million in the same period of 2009. The use of cash in the first quarter of 2010 was due primarily to the repayment
of long-term obligations. During the first quarter of 2009, we received proceeds from the term loan of $102.7
million which was used to purchase the Wavecom OCEANEs and subsequently repaid the term loan with cash
acquired from the acquisition of Wavecom. In the first quarter of 2009, we also received proceeds from the exercise
of Wavecom options of $4.1 million, partially offset by the use of cash of $3.9 million for financing costs related to
the credit facilities that were set up to finance the Wavecom acquisition.
As of March 31, 2010, we did not have any off-balance sheet finance or special purpose entities.
Cash Requirements
Our near-term cash requirements are primarily related to funding our operations, capital expenditures, completion of
the purchase of Wavecom and other obligations discussed below. We believe our cash, cash equivalents and short-
term investments of $122.4 million and cash generated from operations will be sufficient to fund our expected
working capital requirements for at least the next twelve months based on current business plans. Our capital
expenditures during the second quarter of 2010 are expected to be primarily for research and development
equipment, tooling, leasehold improvements, software licenses and patents. However, we cannot assure you that our
actual cash requirements will not be greater than we currently expect.
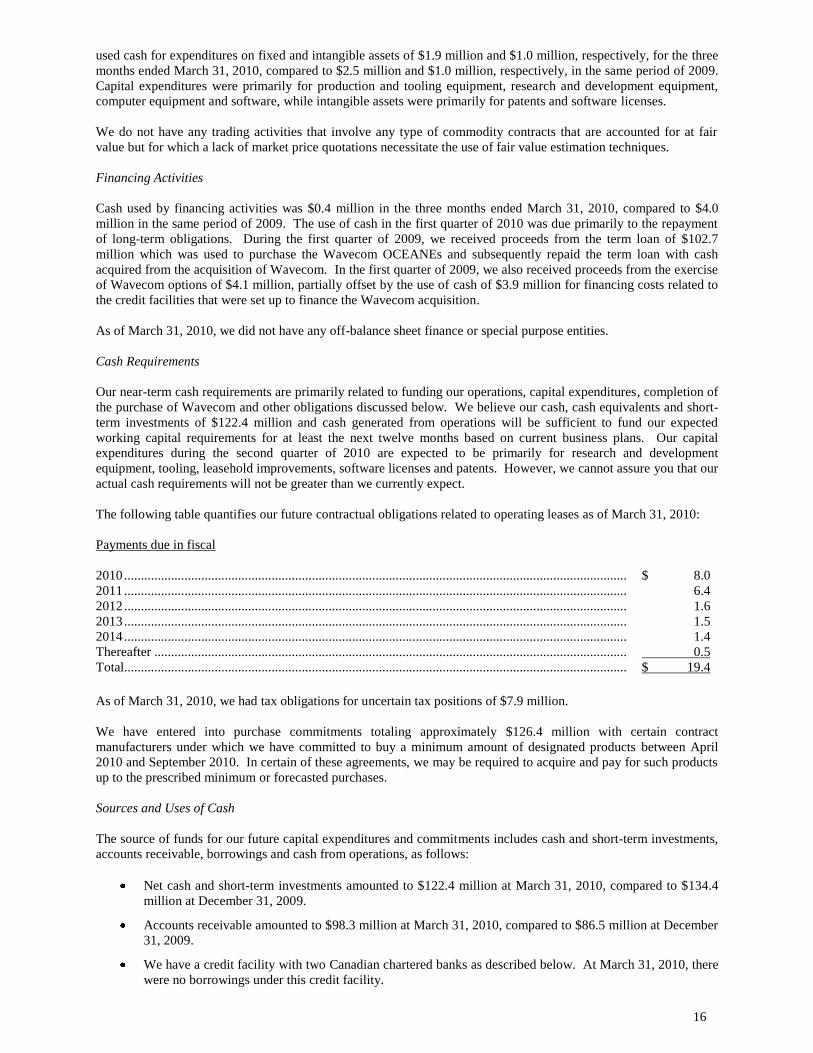
The following table quantifies our future contractual obligations related to operating leases as of March 31, 2010:
Payments due in fiscal
2010 ...................................................................................................................................................... $ 8.0
2011 ...................................................................................................................................................... 6.4
2012 ...................................................................................................................................................... 1.6
2013 ...................................................................................................................................................... 1.5
2014 ...................................................................................................................................................... 1.4
Thereafter ............................................................................................................................................. 0.5
Total ...................................................................................................................................................... $ 19.4
As of March 31, 2010, we had tax obligations for uncertain tax positions of $7.9 million.
We have entered into purchase commitments totaling approximately $126.4 million with certain contract
manufacturers under which we have committed to buy a minimum amount of designated products between April
2010 and September 2010. In certain of these agreements, we may be required to acquire and pay for such products
up to the prescribed minimum or forecasted purchases.
Sources and Uses of Cash
The source of funds for our future capital expenditures and commitments includes cash and short-term investments,
accounts receivable, borrowings and cash from operations, as follows:
Net cash and short-term investments amounted to $122.4 million at March 31, 2010, compared to $134.4
million at December 31, 2009.
Accounts receivable amounted to $98.3 million at March 31, 2010, compared to $86.5 million at December
31, 2009.
We have a credit facility with two Canadian chartered banks as described below. At March 31, 2010, there
were no borrowings under this credit facility.

17
Credit Facilities
Until December 2008, we had an unsecured revolving demand facility with a Canadian chartered bank for $10.0
million that bore interest at prime per annum. No amount was drawn down under that facility and it was terminated
on December 1, 2008.
In connection with our acquisition of Wavecom, we signed a credit agreement on December 1, 2008, with The
Toronto-Dominion Bank and Canadian Imperial Bank of Commerce, as lenders, that provided for a one-year
revolving term credit facility (―Revolving Facility‖) and a one-year non-revolving term credit facility (―Term
Facility‖).
The Term Facility, not to exceed €218.0 million, was used to complete the acquisition of Wavecom ordinary shares
and OCEANEs. The Term Facility was secured by cash of €136.8 million and a pledge against all of our assets. On
December 1, 2008, as required by French regulations, we drew a letter of credit in the amount of €218.0 million
issued under the Term Facility. On February 26, 2009, we borrowed €80.473 million under the Term Facility to
facilitate the purchase, on February 27, 2009, of 99.97% of the outstanding OCEANEs. On February 27, 2009, we
completed the purchase of 84.32% of the outstanding Wavecom shares with €115.3 million of our cash that secured
the Term Facility and the letter of credit was reduced from €218.0 million to €22.2 million. The OCEANEs were
subsequently redeemed by Wavecom and on March 13, 2009 the loan of €80.473 million under the Term Facility
was repaid with those proceeds. On completion of the squeeze-out on April 29, 2009, the letter of credit was
reduced to nil and the Term Facility was no longer available.
The Revolving Facility, not to exceed $55.0 million, is to be used for working capital requirements and is secured by
a pledge against all of our assets. On January 29, 2010, we signed an amended and restated credit agreement which
renewed our Revolving Facility to January 28, 2011, and amended the maximum amount from $55.0 million to
$10.0 million. Since December 1, 2008, we have not drawn any amount under the Revolving Facility.
During the first quarter of 2010, we obtained a letter of credit to ensure our performance to a third party customer in
accordance with specified terms and conditions. At March 31, 2010 we had $0.3 million (2009 – nil) outstanding
under the letter of credit, which approximates its fair value. The letter of credit expires in September 2011.
Market Risk Disclosure
We are exposed to currency fluctuations and exchange rate risk on all operations conducted in currencies other than
the United States dollar. We cannot accurately predict the future effects of foreign currency fluctuations on our
financial condition or results of operations.
Our risk from currency fluctuations between the Canadian and U.S. dollar is reduced by purchasing inventory, other
costs of sales and many of our services in U.S. dollars. We are exposed to foreign currency fluctuations because a
significant amount of our research and development, marketing, and administration costs are incurred in Canada.
We monitor our exposure to fluctuations between the Canadian and U.S. dollars.
With respect to operations in EMEA and the Asia-Pacific region, we transact business in additional foreign
currencies and the potential for currency fluctuations is increasing. Our risk associated with currency fluctuations
associated with the Euro has increased as a result of our acquisition of Wavecom and cash balances that we hold in
Euros. SierraWireless S.A., formerly Wavecom, whose functional currency is Euros, uses derivatives such as
foreign currency forward and options contracts to reduce our foreign exchange risk on cash flows from firm and
highly probable commitments denominated in U.S. dollars. All derivatives that were outstanding at March 31, 2010
had maturity dates of less than 12 months. We believe that the counterparty risk on the foreign currency financial
instruments being used is acceptable because we deal with major banks and financial institutions.
Related Party Transactions
During the three months ended March 31, 2010, there were no material related party transactions.

18
Changes in Internal Control over Financial Reporting
Prior to our acquisition of Wavecom, Wavecom maintained effective internal control over financial reporting based
on criteria established in the Internal Control Integrated Framework issued by the Committee of Sponsoring
Organizations of the Treadway Commission. We are evaluating Wavecom’s internal control over financial reporting
but are not aware of any changes since the date of acquisition that have materially affected, or are reasonably likely
to materially affect, Wavecom’s internal control over financial reporting.
There have been no changes in Sierra Wireless’ internal control over financial reporting during the three months
ended March 31, 2010 that have materially affected, or are reasonably likely to materially affect, our internal control
over financial reporting. The design of any system of controls and procedures is based in part upon certain
assumptions about the likelihood of certain events. There can be no assurance that any design will succeed in
achieving its stated goals under all potential future conditions, regardless of how remote.
Quarterly Results of Operations
The following tables set forth certain unaudited consolidated statements of operations data for each of the nine most
recent quarters that, in management’s opinion, have been prepared on a basis consistent with the audited
consolidated financial statements for the three months ended March 31, 2010. The unaudited consolidated
statements of operations data presented below reflects all adjustments, consisting primarily of normal recurring
adjustments, which are, in the opinion of management, necessary for a fair presentation of results for the interim
periods. These operating results are not necessarily indicative of results for any future period. You should not rely
on them to predict our future performance.
Amounts are expressed in thousands of United States dollars except per share amounts and number of shares.
Certain figures have been reclassified for comparative purposes to conform to the current year presentation.
Three months ended Mar 31,
2010
Revenue .................................................................................................................. $ 151,317
Cost of goods sold .................................................................................................. 104,983
Gross margin .......................................................................................................... 46,334
Expenses:
Sales and marketing .............................................................................................. 14,156
Research and development ................................................................................... 20,541
Administration ...................................................................................................... 9,584
Restructuring costs ............................................................................................... 1,611
Integration costs ................................................................................................... 1,846
Amortization ......................................................................................................... 3,106
50,844
Loss from operations .............................................................................................. (4,510)
Foreign exchange loss ............................................................................................ (3,658)
Other expense ......................................................................................................... (130)
Loss before income taxes ....................................................................................... (8,298)
Income tax recovery ............................................................................................... (689)
Net loss before non-controlling interest ................................................................. (7,609)
Net loss attributable to non-controlling interest ..................................................... (88)
Net loss ................................................................................................................... $ (7,521)
Loss per share:
Basic ..................................................................................................................... $ (0.24)
Diluted .................................................................................................................. $ (0.24)
Weighted average number of shares (in thousands):
Basic ..................................................................................................................... 31,050
Diluted .................................................................................................................. 31,050

19
2009 Quarter Ended Year Mar 31 Jun 30 Sep 30 Dec 31 2009
Revenue .................................................................................................................. $ 111,407 $ 135,348 $ 135,677 $ 143,952 $ 526,384
Cost of goods sold .................................................................................................. 79,886 86,895 87,088 95,223 349,092
Gross margin .......................................................................................................... 31,521 48,453 48,589 48,729 177,292
Expenses:
Sales and marketing .............................................................................................. 9,362 15,590 14,692 15,191 54,835
Research and development ................................................................................... 14,964 22,672 22,546 19,884 80,066
Administration ...................................................................................................... 6,547 10,792 9,589 9,625 36,553
Acquisition costs .................................................................................................. 6,522 804 364 95 7,785
Restructuring costs ............................................................................................... 1,726 8,869 5,332 4,678 20,605
Integration costs ................................................................................................... 254 936 1,332 1,337 3,859
Amortization ......................................................................................................... 2,420 5,001 4,889 (997) 11,313
41,795 64,664 58,744 49,813 215,016
Loss from operations .............................................................................................. (10,274) (16,211) (10,155) (1,084) (37,724)
Foreign exchange gain (loss) .................................................................................. (9,923) 10,957 1,981 (1,754) 1,261
Other expense ......................................................................................................... (4,022) (10) (88) (279) (4,399)
Loss before income taxes ....................................................................................... (24,219) (5,264) (8,262) (3,117) (40,862)
Income tax expense (recovery) ............................................................................... (267) 1,229 (634) 12 340
Net loss before non-controlling interest ................................................................. (23,952) (6,493) (7,628) (3,129) (41,202)
Net loss attributable to non-controlling interest ..................................................... (287) (622) — (394) (1,303) Net loss ................................................................................................................... $ (23,665) $ (5,871) $ (7,628) $ (2,735) $ (39,899)
Loss per share:
Basic ..................................................................................................................... $ (0.76) $ (0.19) $ (0.25) $ (0.09) $ (1.29)
Diluted .................................................................................................................. $ (0.76) $ (0.19) $ (0.25) $ (0.09) $ (1.29)
Weighted average number of shares (in thousands):
Basic ..................................................................................................................... 31,032 31,032 31,032 31,042 31,035
Diluted .................................................................................................................. 31,032 31,032 31,032 31,042 31,035

20
Quarter Ended Year 2008 Mar 31 Jun 30 Sep 30 Dec 31 2008
Revenue .................................................................................................................. $141,949
$155,698
$136,794
$132,867 $567,308
Cost of goods sold .................................................................................................. 101,909 111,858
98,388
95,484
407,639
Gross margin .......................................................................................................... 40,040 43,840 38,406 37,383 159,669
Expenses:
Sales and marketing .............................................................................................. 8,190 8,260 9,165 8,675 34,290
Research and development ................................................................................... 13,955 14,202 13,089 13,411 54,657
Administration ...................................................................................................... 5,248 5,762 5,173 5,153 21,336
Amortization ......................................................................................................... 1,281 1,212 1,135 1,186 4,814
28,674 29,436 28,562 28,425 115,097
Earnings from operations ....................................................................................... 11,366 14,404 9,844 8,958 44,572
Other income .......................................................................................................... 2,459 1,269 522 21,912 26,162
Earnings before income taxes ................................................................................. 13,825 15,673 10,366 30,870 70,734
Income tax expense (recovery) ............................................................................... 4,148 4,702 3,110 (3,809) 8,151
Net earnings ............................................................................................................ $ 9,677 $ 10,971 $ 7,256 $ 34,679 $ 62,583
Earnings per share:
Basic ..................................................................................................................... $ 0.31 $ 0.35 $ 0.23 $ 1.12 $ 2.00
Diluted .................................................................................................................. $ 0.31 $ 0.35 $ 0.23 $ 1.12 $ 2.00
Weighted average number of shares (in thousands):
Basic ..................................................................................................................... 31,341 31,371 31,273 31,032 31,254
Diluted .................................................................................................................. 31,427 31,512 31,324 31,032 31,323
Our quarterly results may fluctuate from quarter to quarter because our operating expenses are determined based on
anticipated sales, are generally fixed and are incurred throughout each fiscal quarter. The impact of significant items
incurred during the first three interim periods of each fiscal year are discussed in more detail and disclosed in our
quarterly reports and MD&A. Items affecting our results were as follows:
The decrease in revenue and net earnings in the third quarter of 2008 compared to the second quarter of
2008 was primarily a result of missing an expected product launch with a large wireless operator.
The increase in net earnings in the fourth quarter of 2008 compared to the third quarter of 2008 was
primarily a result of an unrealized foreign exchange gain of $18.4 million on Euros held in connection with
the Wavecom acquisition and a reduction in income tax expense of $6.5 million as a result of reducing our
valuation allowance on our current tax assets.
The decrease in net earnings in the first quarter of 2009 compared to the fourth quarter of 2008 was a result
of a decrease in revenue due to macro-economic headwinds in key markets and continued intense
competition. In addition, our net loss included Wavecom’s net loss of $3.0 million for the month of March,
an unrealized foreign exchange loss of $15.7 million on Euros held in connection with the Wavecom
acquisition, Wavecom transaction costs of $10.4 million, restructuring costs of $1.6 million, stock-based
compensation of $2.0 million, acquisition related amortization of $2.2 million and integration costs of $0.3
million.
The decrease in our net loss in the second quarter of 2009 compared to the first quarter of 2009 was a result
of an increase in gross margin that resulted from product cost reductions and the addition of higher margin
products from the acquisition of Wavecom, as well as a decrease in acquisition and financing costs and a
foreign exchange gain. These decreases to our net loss were partially offset by an increase in operating
expenses due to the acquisition of Wavecom, restructuring costs and income tax expense.
In the third quarter of 2009, our loss from operations decreased to $10.2 million from $16.2 million in the
second quarter of 2009, primarily as a result of a decrease in restructuring and acquisitions costs. Our
operating expenses also decreased due partly to the impact of the restructurings that occurred in May 2009.
Our net loss increased to $7.6 million in the third quarter of 2009, compared to a net loss of $5.9 million in
the second quarter of 2009 as a result of a decrease in foreign exchange gain, partially offset by a decrease
in income tax expense.

21
In the fourth quarter of 2009, our loss from operations and net loss decreased to $1.1 million and $2.7
million, respectively, compared to $10.2 million and $7.6 million, respectively, in the third quarter of 2009,
primarily as a result of the reversal of purchase price amortization. During the fourth quarter we received a
third party valuation report and revised our estimates of the fair value of the identifiable assets acquired and
liabilities assumed which resulted in the adjustment of our purchase price amortization of intangible assets.
In the first quarter of 2010, our loss from operations and net loss increased to $4.5 million and $7.5 million,
respectively, compared to $1.1 million and $2.7 million, respectively in the fourth quarter of 2009 primarily
as a result of the increased in amortization expense. In the fourth quarter of 2009, a reversal of purchase
price amortization was recorded to reflect the amounts in the third party valuation report and no such
reversal occurred in the first quarter of 2010.
Cautionary Note Regarding Forward-looking Statements
Certain statements in this report that are not based on historical facts constitute forward-looking statements or
forward-looking information within the meaning of the U.S. Private Securities Litigation Reform Act of 1995 and
applicable Canadian securities laws (―forward-looking statements‖). These forward-looking statements are not
promises or guarantees of future performance but are only predictions that relate to future events, conditions or
circumstances or our future results, performance, achievements or developments and are subject to substantial
known and unknown risks, assumptions, uncertainties and other factors that could cause our actual results,
performance, achievements or developments in our business or in our industry to differ materially from those
expressed, anticipated or implied by such forward-looking statements. Forward-looking statements include
disclosure regarding possible events, conditions circumstances or results of operations that are based on assumptions
about future economic conditions, courses of action and other future events. We caution you not to place undue
reliance upon any such forward-looking statements, which speak only as of the date they are made. These forward-
looking statements appear in a number of different places in this report and can be identified by words such as
―may‖, ―estimates‖, ―projects‖, ―expects‖, ―intends‖, ―believes‖, ―plans‖, ―anticipates‖, ―continue‖, ―growing‖
―expanding‖ or their negatives or other comparable words. Forward-looking statements include statements
regarding the outlook for our future operations, plans and timing for the introduction or enhancement of our services
and products, statements concerning strategies or developments, statements about future market conditions, supply
conditions, end customer demand conditions, channel inventory and sell through, revenue, gross margin, operating
expenses, profits, forecasts of future costs and expenditures, the outcome of legal proceedings, and other
expectations, intentions and plans that are not historical fact. The risk factors, uncertainties and assumptions that
may affect our actual results, performance, achievements or developments are many and include, amongst others,
our ability to develop, manufacture, supply and market new products that we do not produce today and that meet the
needs of customers and gain commercial acceptance, our reliance on the deployment of next generation networks by
major wireless operators, the continuous commitment of our customers and increased competition. These risk
factors and others are discussed below under ―Risk Factors‖ and in our other regulatory filings with the Securities
and Exchange Commission in the United States and the Provincial Securities Commissions in Canada. Many of
these factors are beyond our control. Consequently, all forward-looking statements in this report are qualified by
this cautionary statement and we cannot assure you that the actual results, performance, achievements or
developments that we anticipate will be realized. Forward-looking statements are based on management’s current
plans, estimates, projections, beliefs and opinions and we do not undertake any obligation to update forward-looking
statements should the assumptions related to these plans, estimates, projections, beliefs and opinions change, except
as required by law.
Risk Factors
Our business is subject to significant risks and uncertainties and past performance is no guarantee of future
performance. The risks and uncertainties described below are those which we currently believe to be material, and
do not represent all of the risks that we face. Other risks and uncertainties may become material in the future or
ones we currently believe to be immaterial may become material in the future. If any of the following risks actually
occurs, our business, financial condition and results of operation could be materially adversely affected as well as
the market price of our common shares.

22
Our quarterly financial results are subject to fluctuations that could affect the market price of our common
shares.
Our revenue, gross margin, operating earnings and net earnings may vary from quarter to quarter and could be
significantly impacted by a number of factors, including:
Possible delays or shortages in component supplies;
The ability to accurately forecast demand in order to properly align the purchase of components and the
appropriate level of manufacturing capability;
Price and product competition, which may result in lower selling prices for some of our products or lost
market share;
Price and demand pressure on our products from our customers as they experience pressure in their
businesses;
Potential commoditization and saturation in certain markets;
Transition periods associated with the migration of new technologies;
The development and timing of the introduction of our new products;
The securing of channel slots for new products and the timing of sales orders and OEM and carrier
customer sell through;
Design win cycles in our embedded module business;
Product mix of our sales. Our products have different gross margins – for example the embedded module
product line has lower gross margins than the higher margin rugged mobile product line;
The amount of inventory held by our channel partners;
Possible cyclical fluctuations related to the evolution of wireless technologies;
Possible delays in the manufacture or shipment of current or new products;
Possible product quality or factory yield issues that may increase our cost of goods sold;
Possible increased inventory levels;
Possible fluctuations in certain foreign currencies relative to the U.S. dollar;
Concentration in our customer base; and
The achievement of milestones related to our professional services contracts.
Because our operating expenses are determined based on anticipated sales, are generally fixed and are incurred
throughout each fiscal quarter, any of the factors listed above could cause significant variations in our
revenues, gross margin and earnings in any given quarter. Therefore, our quarterly results are not necessarily
indicative of our overall business, results of operations and financial condition.
Quarterly variations in operating results or any of the other factors listed above, changes in financial estimates
by securities analysts, or other events or factors may result in wide fluctuations in the market price of our stock
price. In addition, the financial markets have experienced significant price and volume fluctuations that have
particularly affected the market prices of equity securities of many technology companies and that often have
been unrelated to the operating performance of these companies or have resulted from the failure of the
operating results of such companies to meet market expectations in a particular quarter. Broad market
fluctuations or any failure of the Company’s operating results in a particular quarter to meet market
expectations may adversely affect the market price of our common shares.
Competition from new or established wireless communication companies or from those with greater
resources may prevent us from increasing or maintaining our market share and could result in price
reductions and/or loss of business with resulting reduced revenues and gross margins.
The wireless communications industry is highly competitive and we expect competition to increase and
intensify. More established and larger companies with different business models, strong brands and greater
financial, technical and marketing resources sell products that compete with ours and we expect this
competition to intensify. We also may introduce new products that will put us in direct competition with major
new competitors. Existing or future competitors may be able to respond more quickly to technological

23
developments and changes and introduce new products before we do, or may independently develop and patent
technologies and products that are superior to ours or achieve greater acceptance due to factors such as more
favorable pricing, more desired or better quality features or more efficient sales channels. If we are unable to
compete effectively with our competitors’ pricing strategies, technological advances and other initiatives, we
may lose customer orders and market share and we may need to reduce the price of our products, resulting in
reduced revenue and reduced gross margins.
The loss of any of our significant customers could adversely affect our revenue and profitability, and
therefore shareholder value.
We sell our products through network carriers, resellers and OEMs and we are dependent on a limited number
of customers for a significant portion of our revenues. Most of these network carriers, resellers and OEMs also
sell products of our competitors. Accordingly, our business and future success depends on our ability to
maintain and build on existing relationships and develop new relationships with network carriers, resellers and
OEMs. If any of these customers, for any reason, discontinues their relationship with us or reduces or
postpones current or expected purchase orders for products, or suffers from business failure, our revenues and
profitability could decline, perhaps materially. We expect that a limited number of customers will account for
a significant portion of our revenues for the foreseeable future.
In the three months ended March 31, 2010, three customers individually accounted for more than 10% of our
revenue, and in the aggregate, these three customers represented approximately 46% of our revenue. In the
year ended December 31, 2009, two customers individually accounted for more than 10% of our revenue, and
in the aggregate, these two customers represented approximately 40% of our revenue. In the last three fiscal
years, there have been two different customers that individually accounted for more than 10% of our revenues.
In addition, our current customers purchase our products under purchase orders. Our customers have no
contractual obligation to continue to purchase our products following our fulfillment of current purchase orders
and if they do not continue to make purchases, our revenue and our profitability could decline, perhaps
materially.
We may infringe on the intellectual property rights of others.
The industry in which we operate has many participants that own, or claim to own, proprietary intellectual
property. In the past we have received, and in the future may receive assertions or claims from third parties
alleging that our products violate or infringe their intellectual property rights. We may be subject to these
claims directly or through indemnities against these claims which we have provided to certain customers.
Activity in this area by third parties, particularly those with tenuous claims, is increasing, resulting in us taking
a more aggressive defensive approach, which may result in increased litigation. Rights to intellectual property
can be difficult to verify and litigation may be necessary to establish whether or not we have infringed the
intellectual property rights of others. In many cases, these third parties are companies with substantially greater
resources than us, and they may be able to, and may choose to, pursue complex litigation to a greater degree
than we could. Regardless of whether these infringement claims have merit or not, we may be subject to the
following:
We may be liable for potentially substantial damages, liabilities and litigation costs, including attorneys’
fees;
We may be prohibited from further use of the intellectual property and may be required to cease selling our
products that are subject to the claim;
We may have to license the third party intellectual property, incurring royalty fees that may or may not be
on commercially reasonable terms. In addition, there is no assurance that we will be able to successfully
negotiate and obtain such a license from the third party;
We may have to develop a non-infringing alternative, which could be costly and delay or result in the loss
of sales. In addition, there is no assurance that we will be able to develop such a non-infringing alternative;
The diversion of management’s attention and resources;
Our relationships with customers may be adversely affected; and
We may be required to indemnify our customers for certain costs and damages they incur in such a claim.

24
In the event of an unfavorable outcome in such a claim and our inability to either obtain a license from the
third party or develop a non-infringing alternative, then our business, operating results and financial condition
may be materially adversely affected and we may have to restructure our business.
We license technology, intellectual property and software from third parties for use in our products and from
time to time may be required to license additional intellectual property. In some cases, these licenses provide
us with certain pass-through rights for the use of other third party intellectual property. There is no assurance
that we will be able to maintain our third party licenses or obtain new licenses when required and this inability
could materially adversely affect our business and operating results and the quality and functionality of our
products. In addition, there is no assurance that third party licenses we execute will be on commercially
reasonable terms.
Under purchase orders and contracts for the sale of our products we may provide indemnification to our
customers for potential intellectual property infringement claims for which we may have no corresponding
recourse against our third party licensors. This potential liability, if realized, could materially adversely affect
our business, operating results and financial condition.
We depend on single source suppliers for some components used in our products and if these suppliers are
unable to meet our demand the availability of our products may be materially adversely affected.
Our products are comprised of components some of which are procured from single source suppliers, including
where we have licensed certain software embedded in a component. From time to time, certain components
used in our products have been, and may be, in short supply worldwide and shortages in allocation of
components may result in delay in filling orders from our customers, which may adversely affect our business.
In addition, our single source suppliers may experience damage or interruption in their operations, become
insolvent or bankrupt, or experience claims of infringement, all of which could delay or stop their shipment of
components to us, which may adversely affect our business. Alternate sources of components may not be
available. If there is a shortage of any such components and we cannot obtain an appropriate substitute, we
may not be able to deliver sufficient quantities of our products, we may lose business or customers and our
revenue may be materially adversely affected.
We depend on a limited number of third parties to purchase certain components and manufacture our
products. If they do not manufacture our products properly or cannot meet our needs in a timely manner, we
may be unable to fulfill our product delivery obligations and our costs may increase, and our revenue and
margins could decrease.
We outsource the purchase of certain components and the manufacturing of our products to a limited number
of third parties and depend heavily on the ability of these manufacturers to meet our needs in a timely and
satisfactory manner at a reasonable cost. We currently rely on two manufacturers, either of whom may
terminate the manufacturing contract with us at the end of any contract year. Our reliance on third party
manufacturers subjects us to a number of risks, including the following:
The absence of guaranteed or adequate manufacturing capacity;
Reduced control over delivery schedules, production levels, manufacturing yields, costs and quality;
Their inability to secure adequate volumes of components in a timely manner at a reasonable cost; and
Unexpected increases in manufacturing costs.
If we are unable to successfully manage any of these risks or to locate alternative or additional manufacturers
or suppliers in a timely and cost-effective manner, we may not be able to deliver products in a timely manner.
In addition, our results of operations could be harmed by increased costs, reduced revenues and reduced
margins.
Under our manufacturing agreements, in many cases we are required to place binding purchase orders with our
manufacturers well in advance of our receipt of binding purchase orders from our customers. In this situation,
we consider our customers’ good faith, non-binding forecasts of demand for our products. As a result, if the
number of actual products ordered by our customers is materially different from the number of products we
have instructed our manufacturer to build (and purchase components in respect of), then, if too many
components have been purchased by our manufacturer, we may be required to purchase such excess
component inventory, or, if an insufficient number of components have been purchased by our manufacturer,
we may not be in a position to meet all of our customers’ requirements. If we are unable to successfully
25
manage our inventory levels and respond to our customers’ purchase orders based on their forecasted
quantities, our business could be adversely affected.
We may have difficulty responding to changing technology, industry standards and customer requirements,
which could cause us to be unable to recover our research and development expenses and our revenue could
decline.
The wireless communications industry is subject to rapid technological change. Our business and future
success will depend, in part, on our ability to accurately predict and anticipate evolving wireless technology
standards and develop products that keep pace with the continuing changes in technology, evolving industry
standards and changing customer and end-user preferences and requirements. Our products embody complex
technology that may not meet those standards, preferences and requirements. Our ability to design, develop
and commercially launch new products depends on a number of factors, including, but not limited to the
following:
Our ability to attract and retain skilled technical employees;
The availability of critical components from third parties;
Our ability to successfully complete the development of products in a timely manner;
The ability of third parties to complete and deliver on outsourced product development engagements; and
Our ability to design and manufacture products at an acceptable cost and quality.
A failure by us, or our suppliers, in any of these areas, or a failure of new products to obtain commercial
acceptance, could mean we receive less revenue than we anticipate and we are unable to recover our research
and development expenses, and may result in a decrease in the market price for our shares.
We develop products to meet our customers’ requirements. Original equipment manufacturer customers award
design wins for the integration of wide area wireless embedded modules on a platform by platform basis.
Current design wins do not guarantee future design wins. If we are unable or choose not to meet our
customers’ future needs, we may not win their future business and our revenue and profitability may decrease.
In addition, wireless communications service providers require that wireless data systems deployed on their
networks comply with their own standards, which may differ from the standards of other providers. We may
be unable to successfully address these developments in a timely basis or at all. Our failure to respond quickly
and cost-effectively to new developments through the development of new products or enhancements to
existing products could cause us to be unable to recover significant research and development expenses and
reduce our revenues.
Fluctuations in exchange rates between the United States dollar and other currencies, including the Canadian
dollar, Euro and Australian dollar may affect our operating results.
We are exposed to fluctuations in the exchange rate between the United States dollar and the Canadian dollar
through our operations in Canada, the Euro primarily through our recent acquisition of Wavecom in Europe
and the Australian dollar through sales to certain customers. To reduce our risk because of currency
fluctuations, we purchase inventory, other cost of sales items and many of our services in United States dollars,
however, some of our operating costs are still incurred in Canadian dollars, primarily those relating to
marketing, administration and a portion of our research and development. Given the fluctuations in the
Canadian dollar relative to the United States dollar, our operating results may be negatively impacted.
Wavecom has significant revenue and costs denominated in Euro and certain of our product sales are
denominated in Australian dollars, resulting in increased exposure to currency fluctuations.
As our business expands internationally, we will be exposed to additional risks relating to international
operations.
Our expansion into international operations exposes us to additional risks unique to such international markets,
including the following:
Increased credit management risks and greater difficulties in collecting accounts receivable;
Unexpected changes in regulatory requirements, wireless communications standards, exchange rates,
trading policies, tariffs and other barriers;

26
Uncertainties of laws and enforcement relating to the protection of intellectual property;
Language barriers; and
Potential adverse tax consequences.
Furthermore, if we are unable to further develop distribution channels in Europe and the Asia-Pacific region,
we may not be able to grow our international operations and our ability to increase our revenue will be
negatively impacted.
We do not have fixed-term employment agreements with our key personnel and the loss of any key personnel
may harm our ability to compete effectively.
None of our executive officers or other key employees has entered into a fixed-term employment agreement.
Our success depends in large part on the abilities and experience of our executive officers and other key
employees. Competition for highly skilled management, technical, research and development and other key
employees is intense in the wireless communications industry. We may not be able to retain our current
executive officers or key employees and may not be able to hire and transition in a timely manner experienced
and highly qualified additional executive officers and key employees as needed to achieve our business
objectives. The loss of executive officers and key employees could disrupt our operations and our ability to
compete effectively could be adversely affected.
We rely on certain internal processes, networks and systems to efficiently operate and report on our business.
Failure of these internal processes, networks or systems could negatively impact our ability to operate or
accurately report on our business.
Acquisitions of companies or technologies, including our acquisition of Wavecom, may result in disruptions to
our business or may not achieve the anticipated benefits.
As part of our business strategy, we have acquired and may continue to acquire additional assets and
businesses principally relating to or complementary to our current operations. On February 27, 2009, we
completed our acquisition of Wavecom. Any acquisitions and/or mergers by us will be accompanied by the
risks commonly encountered in acquisitions of companies. These risks include, among other things:
Exposure to unknown liabilities of acquired companies, including unknown litigation related to acts or
omissions of our acquired company and/or its directors and officers prior to the acquisition;
Higher than anticipated acquisition and integration costs and expenses;
Effects of costs and expenses of acquiring and integrating new businesses on our operating results and
financial condition;
The difficulty and expense of integrating the operations and personnel of the companies;
Possible use of cash to support the operations of an acquired business;
Possible increase in foreign exchange translation risk depending on the denomination of the revenue and
expenses of the acquired business;
Disruption of our ongoing business;
Diversion of management's time and attention away from our remaining business during the integration
process;
Failure to maximize our financial and strategic position by the successful incorporation of acquired
technology;
The inability to implement uniform standards, controls, procedures and policies;
The loss of key employees and customers as a result of changes in management;
The incurrence of amortization expenses;
As a result of the growth of our company, we may seek to raise additional capital through an offering of
common shares, preference shares or debt, which may result in dilution and/or the issuance of securities.
As a result, our share price may decline; and

27
Possible dilution to our shareholders if the purchase price is paid in common shares or securities
convertible into common shares.
In addition, geographic distances may make integration of businesses more difficult. We may not be successful
in overcoming these risks or any other problems encountered in connection with any acquisitions. If realized,
these risks could reduce shareholder value.
Continued difficult market conditions could adversely affect our revenue and profitability.
A significant portion of our business is in the U.S. and we are particularly exposed to the downturns in the U.S.
economy. With our acquisition of Wavecom, we have a larger portion of our business based in Europe and
will have increased exposure to the market conditions in Europe. The market turmoil and tightening of credit
have led to an increased level of commercial and consumer delinquencies, lack of consumer confidence,
increased market volatility and widespread reduction of business activity generally. If the resulting economic
pressure on our customers causes them to end their relationship with us, reduce or postpone current or
expected purchase orders for our products, or suffer from business failure, our revenues and profitability could
decline, perhaps materially.
Misappropriation of our intellectual property could place us at a competitive disadvantage.
Our intellectual property is important to our success. We rely on a combination of patent protection,
copyrights, trademarks, trade secrets, licenses, non-disclosure agreements and other contractual agreements to
protect our intellectual property. Third parties may attempt to copy aspects of our products and technology or
obtain information we regard as proprietary without our authorization. If we are unable to protect our
intellectual property against unauthorized use by others it could have an adverse effect on our competitive
position.
Our strategies to deter misappropriation could be inadequate due to the following risks:
Non-recognition of the proprietary nature or inadequate protection of our methodologies in the United
States, Canada or foreign countries;
Undetected misappropriation of our intellectual property;
The substantial legal and other costs of protecting and enforcing our rights in our intellectual property; and
Development of similar technologies by our competitors.
In addition, we could be required to spend significant funds and our managerial resources could be diverted in
order to defend our rights, which could disrupt our operations.
We have been subject to, and may in the future be subject to, certain class action lawsuits, which if decided
against us, could require us to pay substantial judgments, settlements or other penalties.
In addition to being subject to litigation in the ordinary course of business, in the future, we may be subject to
class actions and other securities litigation and investigations. We expect that this type of litigation will be time
consuming, expensive and distracting from the conduct of our daily business. It is possible that we will be
required to pay substantial judgments, settlements or other penalties and incur expenses that could have a
material adverse effect on our operating results, liquidity or financial position. Expenses incurred in connection
with these lawsuits, which include substantial fees of lawyers and other professional advisors and our
obligations to indemnify officers and directors who may be parties to such actions, could materially adversely
affect our cash position. We do not know if any of this type of litigation and resulting expenses will be covered
by insurance. In addition, these lawsuits may cause our insurance premiums to increase in future periods.
We depend on wireless network carriers to offer acceptable wireless data and voice communications services
for our products to operate.
Our products can only be used over wireless data and voice networks operated by third parties. Our business
and future growth depends, in part, on the successful deployment by network carriers of next generation
wireless data and voice networks and the network carriers’ ability to grow their subscriber base. If these
network carriers delay the deployment or expansion of next generation networks or fail to offer effective and
reliable service, or fail to price and market their services effectively, sales of our products will decline and our
revenues will decrease.

28
Government regulation could result in increased costs and inability to sell our products.
Our products are subject to certain mandatory regulatory approvals in the United States, Canada, the European
Union and other regions in which we operate. In the United States, the Federal Communications Commission
regulates many aspects of communications devices. In Canada, similar regulations are administered by the
Ministry of Industry, through Industry Canada. European Union directives provide comparable regulatory
guidance in Europe. Although we have obtained all the necessary Federal Communications Commission,
Industry Canada and other required approvals for the products we currently sell, we may not obtain approvals
for future products on a timely basis, or at all. In addition, regulatory requirements may change or we may not
be able to obtain regulatory approvals from countries other than the United States and Canada in which we
may desire to sell products in the future.

29
SIERRA WIRELESS, INC.
Consolidated Statements of Operations and Retained Earnings (Deficit)
(Expressed in thousands of United States (―U.S.‖) dollars, except per share amounts)
(Prepared in accordance with United States generally accepted accounting principles (―U.S. GAAP‖))
(Unaudited)
Three months ended March 31, 2010 2009
Revenue .................................................................................................................................... $ 151,317 $ 111,407
Cost of goods sold .................................................................................................................... 104,983 79,886
Gross margin ............................................................................................................................ 46,334 31,521
Expenses:
Sales and marketing ............................................................................................................... 14,156 9,362
Research and development ..................................................................................................... 20,541 14,964
Administration ....................................................................................................................... 9,584 6,547
Acquisition costs (note 3) ....................................................................................................... — 6,522
Restructuring (note 6) ............................................................................................................. 1,611 1,726
Integration (note 7) ................................................................................................................. 1,846 254
Amortization ........................................................................................................................... 3,106 2,420
50,844 41,795
Loss from operations ................................................................................................................ (4,510) (10,274)
Foreign exchange loss ............................................................................................................. (3,658) (9,923)
Other expense ........................................................................................................................... (130) (4,022)
Loss before income taxes.......................................................................................................... (8,298) (24,219)
Income tax recovery ................................................................................................................. (689) (267)
Net loss ..................................................................................................................................... (7,609) (23,952)
Net loss attributable to the non-controlling interest (note 12) .................................................. (88) (287)
Net loss attributable to Sierra Wireless, Inc. ............................................................................ (7,521) (23,665)
Retained earnings (deficit), beginning of period ...................................................................... (18,626) 21,273
Deficit, end of period ................................................................................................................ $ (26,147) $ (2,392)
Loss per share attributable to Sierra Wireless, Inc.:
Basic ....................................................................................................................................... $ (0.24) $ (0.76)
Diluted .................................................................................................................................... $ (0.24) $ (0.76)
Weighted average number of shares (in thousands):
Basic ....................................................................................................................................... 31,050 31,032
Diluted .................................................................................................................................... 31,050 31,032
See accompanying notes to consolidated financial statements.

30
SIERRA WIRELESS, INC.
Consolidated Statements of Comprehensive Loss
(Expressed in thousands of U.S. dollars)
(Prepared in accordance with U.S. GAAP)
(Unaudited)
Three months ended March 31, 2010 2009
Net loss. .................................................................................................................................... $ (7,609) $ (23,952)
Other comprehensive income
Unrealized gain on marketable securities ............................................................................ — 18
Unrealized gain on financial instruments (note 13(c)) ......................................................... — 72
Foreign currency translation ................................................................................................ (5,523) 966
Comprehensive loss .................................................................................................................. (13,132) (22,896)
Comprehensive loss attributable to the non-controlling interest (note 12) ............................... (28) (168)
Comprehensive loss attributable to Sierra Wireless, Inc. ........................................................ $ (13,104) $ (22,728)
See accompanying notes to consolidated financial statements.

31
SIERRA WIRELESS, INC.
Consolidated Balance Sheets
(Expressed in thousands of U.S. dollars)
(Prepared in accordance with U.S. GAAP)
March 31,
2010 December 31,
2009 (Unaudited) Assets
Current assets:
Cash and cash equivalents ........................................................................................................ $ 111,257 $ 107,491
Short-term investments (note 4) ............................................................................................... 5 11,099 26,898
Accounts receivable, net of allowance for doubtful accounts of $4,311 (2009 – $6,504)......................................................................
98,287
86,466
Inventories (note 5) .................................................................................................................. 23,459 24,708
Deferred income taxes ............................................................................................................. 6,060 6,168
Prepaid expenses and other ...................................................................................................... 15,919 14,039
266,081 265,770
Fixed assets ................................................................................................................................ 24,411 27,956
Intangible assets ......................................................................................................................... 80,207 86,674
Goodwill .................................................................................................................................... 92,142 95,064
Deferred income taxes ................................................................................................................ 1,649 1,794
Other assets ................................................................................................................................ 4,814 7,261
$ 469,304 $ 484,519
Liabilities and Shareholders' Equity
Current liabilities:
Accounts payable ..................................................................................................................... $ 72,619 $ 71,035
Accrued liabilities .................................................................................................................... 52,925 54,419
Deferred revenue and credits .................................................................................................... 570 750
Current portion of long-term liabilities (note 8) ....................................................................... 3,429 3,371
Current portion of obligations under capital leases (note 9) .................................................... 230 293
129,773 129,868
Long-term liabilities (note 8) ..................................................................................................... 2,193 3,197
Obligations under capital leases (note 9) ................................................................................... 193 245
Other long-term liabilities (note 8) ............................................................................................. 30,218 32,663
Deferred income taxes ................................................................................................................ 1,749 1,950
Shareholders' equity:
Share capital (note 10) ............................................................................................................. 326,073 326,043
Shares held for RSU distribution, at cost (note 10) .................................................................. (4,648) (6,442)
Additional paid-in capital ......................................................................................................... 13,023 13,133
Deficit ...................................................................................................................................... (26,147) (18,626)
Accumulated other comprehensive loss ................................................................................... (5,620) (37)
302,681 314,071
Non-controlling interest in Wavecom S.A. (note 12) ................................................................ 2,497 2,525
Total shareholders’ equity .......................................................................................................... 305,178 316,596
$ 469,304 $ 484,519
Commitments and contingencies (note 15)
See accompanying notes to consolidated financial statements.

32
SIERRA WIRELESS, INC.
Consolidated Statements of Cash Flows
(Expressed in thousands of U.S. dollars)
(Prepared in accordance with U.S. GAAP)
(Unaudited)
Three months ended March 31, 2010 2009
Cash flows from operating activities:
Net loss ..................................................................................................................... $ (7,609) $ (23,952)
Adjustments to reconcile net loss to net cash provided by (used in) operating activities
Amortization .......................................................................................................... 8,721 6,746
Stock-based compensation (note 11) ..................................................................... 1,694 2,103
Non-cash restructuring and other ........................................................................... 4 —
Deferred income tax ............................................................................................... (8) (5)
Loss on disposal ..................................................................................................... — 1
Unrealized foreign exchange loss on restricted cash ............................................. — 15,719
Unrealized foreign exchange loss on term loan ..................................................... — 1,215
Changes in operating assets and liabilities
Accounts receivable ............................................................................................... (12,327) 18,858
Inventories ............................................................................................................. 595 517
Prepaid expenses and other assets .......................................................................... (49) 6,276
Accounts payable ................................................................................................... 3,463 (9,080)
Accrued liabilities .................................................................................................. (2,462) (8,239)
Deferred revenue and credits ................................................................................. 70 295
Net cash provided by (used in) operating activities ................................................... (7,908) 10,454
Cash flows from investing activities:
Business acquisition, net of cash acquired of $139,785 (note 3) .............................. — (6,918)
Acquisition of OCEANE convertible bonds (note 3)................................................ — (104,767)
Decrease in restricted cash ........................................................................................ — 146,277
Purchase of fixed assets ............................................................................................ (1,915) (2,476)
Increase in intangible assets ...................................................................................... (977) (1,027)
Purchase of short-term investments .......................................................................... (7,090) (21,950)
Proceeds on maturity of short-term investments ....................................................... 22,886 469
Net cash provided by investing activities................................................................... 12,904 9,608
Cash flows from financing activities:
Proceeds on issuance of term loan (note 13(a)) ........................................................ — 102,716
Repayment of term loan (note 13(a)) ........................................................................ — (103,931)
Financing costs ......................................................................................................... — (3,921)
Issuance of common shares, net of share issue costs ................................................ 21 —
Purchase of shares for RSU distribution ................................................................... — (2,518)
Proceeds on exercise of Wavecom options ............................................................... — 4,148
Decrease in long-term liabilities ............................................................................... (422) (532)
Net cash used in financing activities .......................................................................... (401) (4,038)
Effect of foreign exchange changes on cash and cash equivalents ............................. (829) (3,241)
Net increase in cash and cash equivalents .................................................................. 3,766 12,783
Cash and cash equivalents, beginning of period ......................................................... 107,491 63,258
Cash and cash equivalents, end of period ................................................................... $ 111,257 $ 76,041
Supplementary information (note 16)
See accompanying notes to consolidated financial statements.

33
SIERRA WIRELESS, INC.
Notes to Consolidated Financial Statements
For the three months ended March 31, 2010 and 2009
(Expressed in thousands of U.S. dollars, except per share amounts and number of shares)
(Prepared in accordance with U.S. GAAP)
1. Basis of Presentation
The accompanying interim financial information does not include all disclosures required under United States
generally accepted accounting principles (―U.S. GAAP‖) for annual financial statements. The accompanying
interim financial information is unaudited and reflects all adjustments, consisting of normal recurring adjustments,
which, in the opinion of management, are necessary for a fair presentation of results for the interim periods. These
interim consolidated financial statements should be read in conjunction with the consolidated financial statements
and notes thereto included in our fiscal 2009 Annual Report.
2. Significant Accounting Policies
These interim financial statements follow the same accounting policies and methods of application as our annual
financial statements.
(a) Principles of consolidation
Our consolidated financial statements include the accounts of Sierra Wireless, Inc. and its wholly-owned
subsidiaries from their respective dates of formation or acquisition. We have eliminated all significant intercompany
balances and transactions. The ownership of the other non-controlling interest holders of consolidated subsidiaries is
reflected as non-controlling interest and is not significant.
(b) Use of estimates
In preparing these consolidated financial statements in conformity with U.S. GAAP, management makes estimates
and assumptions that affect revenue recognition and the reported amounts of assets, particularly the recoverability of
accounts receivable, inventory, fixed assets, intangible assets, goodwill and deferred income taxes, as well as royalty
and warranty accruals, lease provisions, other liabilities, stock-based compensation, and disclosures of contingent
liabilities at the date of the financial statements and the reported amounts of revenues and expenses during the
reporting period. Actual results could differ from the estimates.
(c) Foreign currency translation
Our functional or primary operating currency is the U.S. dollar.
For financial statements of operations whose functional currency is the U.S. dollar but the transactions are in
currencies other than the U.S. dollar, the monetary assets and liabilities denominated in a currency other than the
U.S. dollar are translated at the exchange rate in effect at the balance sheet date, and the resulting exchange rate
gains and losses are recognized in net earnings (loss). Non-monetary assets denominated in a currency other than
the U.S. dollar are translated at the historical exchange rate in effect on the date of the transaction.
Financial statements for operations whose functional currency is not the U.S. dollar are translated into U.S. dollars at
the exchange rates in effect at the balance sheet dates for assets and liabilities, at historical rates for equity, and at
average rates for revenues and expenses. The accumulated unrealized translation gains and losses in these
operations are recorded as a component of other comprehensive income (loss).
(d) Comparative figures
We have reclassified certain of the figures presented for comparative purposes to conform to the financial statement
presentation we adopted for the current year.

34
3. Acquisition of Wavecom S.A.
On December 2, 2008, we announced an all-cash offer to purchase all of the ordinary shares and OCEANE
convertible bonds (―OCEANEs‖) of Wavecom, a global leader in wireless machine-to-machine (―M2M‖) solutions
headquartered in Issy-les-Moulineaux, France. The total value of the transaction was approximately €218,000. We
made a cash offer of €8.50 per share of Wavecom and €31.93 per OCEANE. The transaction was implemented by
way of concurrent but separate public tender offers in both France and the United States for all Wavecom shares, all
American Depository Shares (―ADSs‖) representing Wavecom shares and all OCEANEs issued by Wavecom.
On February 27, 2009, we completed our acquisition of 84.32% of the outstanding shares and 99.97% of the
outstanding OCEANEs of Wavecom, representing 90.57% of the voting rights of Wavecom, for cash consideration
of $144,859 (€113,508) and $104,767 (€82,093), respectively. During March 2009, we purchased 160,643 shares
on the open market for cash consideration of $1,850 (€1,365), resulting in the acquisition of 85.34% of the
outstanding shares. Following a statutory re-opening of the tender offer, we increased our ownership of the voting
rights of Wavecom from 90.57% to 95.4% for cash consideration of $11,817 (€8,908). On April 29, 2009, we
completed our acquisition of all of the remaining Wavecom shares, except for certain shares held by employees that
are subject to a hold period, and OCEANEs by way of a squeeze-out for cash consideration of $7,752 (€5,851). The
Wavecom shares and OCEANEs have been delisted from Euronext and the ADSs have been delisted from the
NASDAQ Global Market (―Nasdaq‖).
The goodwill of $56,692 (2009 – $56,911) arising from the acquisition results from the expectation that the
combination will create a global leader that will be uniquely positioned to benefit from the anticipated growth in
wireless for mobile computing and M2M markets. We expect the acquisition to significantly expand our position in
the global M2M market, broaden our product offerings and increase our scale and capabilities in Europe and Asia.
All of the goodwill was assigned to the Wavecom segment. Any goodwill allocated on the acquisition will not be
deductible for tax purposes.
The results of Wavecom have been included in our consolidated financial statements from February 27, 2009 and
the first quarter of 2009 included revenue of $11,019 and net loss attributable to Sierra Wireless, Inc. of $2,075.
Wavecom acquisition and financing costs recognized in the three months ended March 31, 2010 were nil. In the
three months ended March 31, 2009, Wavecom acquisition and financing costs of $10,443 were expensed as
follows: $6,522 in acquisition costs and $3,921 in other expense.
We have obtained a third party review of the valuation of the assets acquired and liabilities assumed. The following
table summarizes the fair value of the identifiable assets acquired and liabilities assumed:
Cash and marketable securities .................................................................................................................. $139,785
Other current assets .................................................................................................................................... 51,753
Property and equipment ............................................................................................................................. 9,916
Intangible assets ......................................................................................................................................... 71,354
Goodwill .................................................................................................................................................... 56,692
Other long-term assets ............................................................................................................................... 5,231
Deferred income tax................................................................................................................................... 1,110
Total assets acquired ................................................................................................................................ 335,841
Current liabilities ....................................................................................................................................... 52,065
OCEANE convertible bonds ...................................................................................................................... 104,870
Capital lease obligations ............................................................................................................................ 657
Long-term liabilities .................................................................................................................................. 462
Other long-term liabilities .......................................................................................................................... 17,645
Deferred income tax................................................................................................................................... 76
Non-controlling interest ............................................................................................................................. 13,357
Net assets acquired................................................................................................................................... $ 146,709
The fair value of the non-controlling interest at February 27, 2009 of $13,357 was based on the fair market price
determined in the tender offer of $10.85 (€8.50) per ordinary share (see also note 12).

35
The following table presents details of the estimated purchased intangible assets:
Estimated Useful Life (in years)
Amount
Intellectual property ....................................................................................................................... zx 3-6 $ 30,510
In-process research and development ............................................................................................ zx 3-9 18,425
Customer relationships .................................................................................................................. 5 16,387
Brand portfolio ............................................................................................................................... 5 3,295
Non-compete covenant .................................................................................................................. 2 2,737
Total purchased intangible assets ................................................................................................. $ 71,354
The following pro forma information presents our operating results by giving effect to the purchase price allocations
set out above, as if the acquisition had been completed as of January 1, 2009. The pro forma amounts are not
intended to be indicative of the results that would have actually been obtained if the acquisition occurred as of
January 1, 2009 or that may be obtained in the future. If the acquisition of Wavecom had occurred as of January 1,
2009, the pro forma operating results would have been as follows:
Three months ended March 31, 2009
Revenue ..................................................................................................................................................... $ 542,657
Net loss ...................................................................................................................................................... (56,372)
Loss per share. ........................................................................................................................................... $ (1.80)
4. Investments
Investments, all of which are classified as available-for-sale, were comprised of government treasury bills and
securities. Our outstanding short-term investments have contractual maturities ranging from four to six months from
the date of purchase.
5. Inventories
March 31, December 31,
2010 2009
Electronic components ....................................................................................................................... $ 13,293 $ 10,932
Finished goods .................................................................................................................................... 10,166 13,776
$ 23,459 $ 24,708

36
6. Restructuring Charges
(a) May 2009 Restructuring
On May 15, 2009, we announced further cost reduction initiatives related to the integration of Wavecom with Sierra
Wireless that included combining the research and development (―R&D‖) and product operations of both
organizations. As a result, the Wavecom location in Research Triangle Park, North Carolina was closed in the
fourth quarter of 2009. R&D activities from this location were transitioned primarily to the Sierra Wireless location
in Carlsbad, California. The cost reduction initiatives related to the workforce reduction were substantially
completed by the first quarter of 2010. The current and long-term portions of the facilities restructuring of $353 and
$672 (December 31, 2009 – $455 and $760), respectively, is expected to be substantially paid by 2014.
In the first quarter of 2010, the Wavecom location in Brazil was closed resulting in $217 of restructuring charges
related to employee terminations. The liability related to this workforce reduction was substantially paid by March
31, 2010.
(b) January 2009 Restructuring
In January 2009, we implemented an expense reduction program to reduce labor costs. We reduced our workforce
by 56 employees, all of whom were terminated in the first quarter of 2009. The total workforce reduction charges
recognized in the first quarter of 2009 of $1,622 included $501 for accelerated stock-based compensation and the
remainder represented severance and benefits associated with the terminated employees. The liability related to this
program was substantially paid by the end of the third quarter of 2009.
(c) Wavecom Restructuring
In October 2008, prior to our acquisition of Wavecom, Wavecom announced a cost savings program and a proposed
reorganization. The first portion of this plan, related to its operations in the United States, began in late 2008. In the
first quarter of 2009, $104 of restructuring charges was recognized. In the second quarter of 2009, the staff reduction
program in France related to this reorganization was implemented. A total of 77 positions in France were impacted,
with three of these positions remaining to be phased out by the third quarter of 2010. The remaining liability related
to the workforce reduction is expected to be substantially paid by the third quarter of 2010. The current and long-
term portions of the facilities restructuring of $2,315 and $912, respectively, are expected to be substantially paid by
July 2011.
In the first quarter of 2010, additional employees were terminated resulting in restructuring charges of $1,390. The
liability related to this workforce reduction was paid in the first quarter of 2010.
(d) Prior Period Restructuring
In the second quarter of 2005, we announced our decision to exit our Voq professional phone initiative. In addition
to the exit of the Voq initiative, we made certain non-Voq related reductions to our operating expenses and assets. Of the facilities restructuring liability outstanding at March 31, 2010, $120 (2009 – $130) is from the 2005 restructuring and $249 (2009 – $267) arises from prior restructurings. The current and long-term portions of the facilities restructuring are $213 and $156, respectively (2009 – $206 and $191).

37
The following tables summarize the changes to the restructuring provisions during the three months ended March
31, 2010:
May 2009 Restructuring Workforce Reduction Facilities Total
Restructuring Charge
Balance at December 31, 2009 ........................................................................................................... $ 1,211 $ 1,215 $ 2,426 $ —
Period charges ............................................................................................................................... 217 4 221 221
Cash payments ............................................................................................................................... (1,214) (194) (1,408) —
Foreign exchange .......................................................................................................................... (6) — (6) —
Balance at March 31, 2010 ................................................................................................................. $ 208 $ 1,025 $ 1,233 $ 221
January 2009 Restructuring Workforce Reduction Facilities Total
Restructuring Charge
Balance at December 31, 2009 ........................................................................................................... $ 32 $ — $ 32 $ —
Cash payments ............................................................................................................................... — — — —
Balance at March 31, 2010 ................................................................................................................. $ 32 $ — $ 32 $ —
Wavecom Restructuring Workforce Reduction Facilities Total
Restructuring Charge
Balance at December 31, 2009 ........................................................................................................... $ 3,918 $ 3,227 $ 7,145 $ —
Period charges ............................................................................................................................... 1,390 — 1,390 1,390
Cash payments .............................................................................................................................. (2,654) (136) (2,790) —
Foreign exchange .......................................................................................................................... (182) (176) (358) —
Balance at March 31, 2010 ................................................................................................................ $ 2,472 $ 2,915 $ 5, 387 $ 1,390
Prior Restructurings Workforce Reduction Facilities Total
Restructuring Charge
Balance at December 31, 2009 ........................................................................................................... $ — $ 397 $ 397 $ —
Cash payments .............................................................................................................................. — (79) (79) —
Revisions to prior accruals ........................................................................................................... — 51 51 —
Balance at March 31, 2010 ................................................................................................................. $ — $ 369 $ 369 $ —
Total provision balances, March 31, 2010 .......................................................................................... $ 2,712 $ 4,309 $ 7,021
Total provision balances, December 31, 2009 .................................................................................... $ 5,161 $ 4,839 $ 10,000
Total charges for the three months ended March 31, 2010 ................................................................. $ 1,611
Total charges for the three months ended March 31, 2009 ................................................................. $ 1,726
7. Integration Costs
During the three months ended March 31, 2010, we incurred integration costs related to the acquisition of Wavecom
of $1,846 (2009 – $254), which included the cost of employees retained for integration activities, related travel
expenses and consulting fees.
8. Long-term Liabilities
March 31, December 31,
2010 2009
Facilities (note 6) ................................................................................................................................ $ 4,309 $ 4,839
TPC liability (note 15(a)(iv)) .............................................................................................................. 1,313 1,729
Less: current portion long-term liabilities .......................................................................................... (3,429) (3,371)
2,193 3,197
Other long-term liabilities................................................................................................................... 30,218 32,663
$ 32,411 $ 35,860
Other long-term liabilities include the long-term portions of accrued royalties of $21,410 (2009 – $23,305) and marketing development funds of $8,808 (2009 – $9,358).
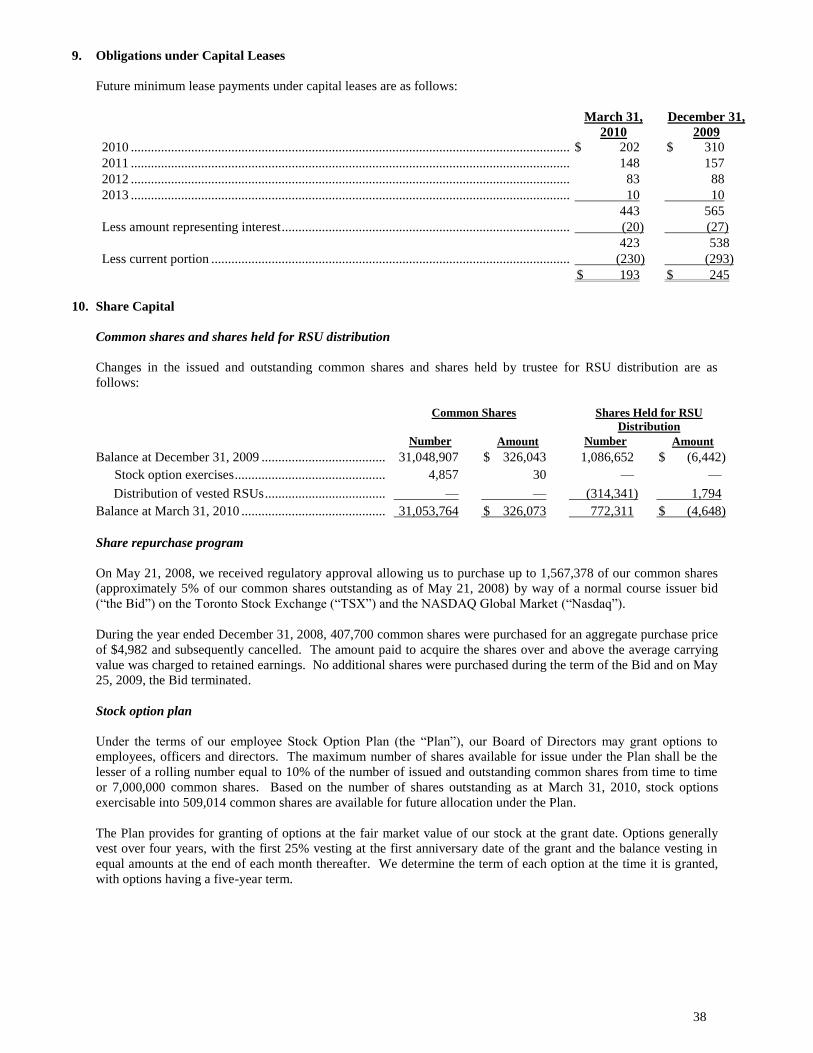
38
9. Obligations under Capital Leases
Future minimum lease payments under capital leases are as follows:
March 31,
2010
December 31,
2009
2010 ............................................................................................................................................................................... $ 202 $ 310
2011 ............................................................................................................................................................................... 148 157
2012 ............................................................................................................................................................................... 83 88
2013 ............................................................................................................................................................................... 10 10
443 565
Less amount representing interest .................................................................................................................................. (20) (27)
423 538
Less current portion ....................................................................................................................................................... (230) (293)
$ 193 $ 245
10. Share Capital
Common shares and shares held for RSU distribution
Changes in the issued and outstanding common shares and shares held by trustee for RSU distribution are as
follows:
Common Shares Shares Held for RSU
Distribution
Number Amount Number Amount
Balance at December 31, 2009 ........................................................................................................ 31,048,907 $ 326,043 1,086,652 $ (6,442)
Stock option exercises ................................................................................................................ 4,857 30 — —
Distribution of vested RSUs ....................................................................................................... — — (314,341) 1,794
Balance at March 31, 2010 .............................................................................................................. 31,053,764 $ 326,073 772,311 $ (4,648)
Share repurchase program
On May 21, 2008, we received regulatory approval allowing us to purchase up to 1,567,378 of our common shares
(approximately 5% of our common shares outstanding as of May 21, 2008) by way of a normal course issuer bid
(―the Bid‖) on the Toronto Stock Exchange (―TSX‖) and the NASDAQ Global Market (―Nasdaq‖).
During the year ended December 31, 2008, 407,700 common shares were purchased for an aggregate purchase price
of $4,982 and subsequently cancelled. The amount paid to acquire the shares over and above the average carrying
value was charged to retained earnings. No additional shares were purchased during the term of the Bid and on May
25, 2009, the Bid terminated.
Stock option plan
Under the terms of our employee Stock Option Plan (the ―Plan‖), our Board of Directors may grant options to
employees, officers and directors. The maximum number of shares available for issue under the Plan shall be the
lesser of a rolling number equal to 10% of the number of issued and outstanding common shares from time to time
or 7,000,000 common shares. Based on the number of shares outstanding as at March 31, 2010, stock options
exercisable into 509,014 common shares are available for future allocation under the Plan.
The Plan provides for granting of options at the fair market value of our stock at the grant date. Options generally
vest over four years, with the first 25% vesting at the first anniversary date of the grant and the balance vesting in
equal amounts at the end of each month thereafter. We determine the term of each option at the time it is granted,
with options having a five-year term.

39
Stock option activity since December 31, 2009 is presented below:
Number of Shares
Weighted Average Exercise Price
Weighted Average
Remaining Contractual Life
Aggregate Intrinsic Value
Cdn.$ U.S.$ In Years U.S.$
Outstanding, December 31, 2009 ................................................................................................... 2,158,088 $ 13.51 $ 12.83 2.5 $ 3,246
Granted ........................................................................................................................................ 656,854 9.02 8.66
Exercised ..................................................................................................................................... (4,857) 4.68 4.40 21
Forfeited ...................................................................................................................................... (213,723) 10.38 9.80
Outstanding, March 31, 2010 ........................................................................................................ 2,596,362 12.39 12.20 3.1 1,919
Exercisable, December 31, 2009 .................................................................................................. 1,188,034 15.47 14.68 204
Exercisable, March 31, 2010 ........................................................................................................ 1,194,286 14.99 14.77 503
The intrinsic value of a stock option is calculated as the quoted market price of the stock at the balance sheet date, or
date of exercise, less the amount an employee must pay to acquire the stock. The aggregate intrinsic value of stock
options exercised in the three months ended March 31, 2009 was nil as no options were exercised during this period.
Restricted stock plans
Our non-vested restricted stock plans for U.S. and non-U.S. employees (together, the ―RSPs‖) provide long-term
incentives to certain executives and other key employees and support the objective of employee share ownership
through the granting of restricted share units (―RSUs‖). There is no exercise price and no monetary payment is
required from the employees to the Company upon receipt of the RSUs or upon the subsequent issuance of shares to
settle the award. Under the RSPs, independent trustees purchase the common shares over the facilities of the TSX
and Nasdaq. The trust funds are variable interest entities and are included in these consolidated financial statements
as shares held for RSU distribution.
Generally, RSUs vest annually over three years, in equal amounts on the anniversary date of the date of the grant. In
February 2010, the non-U.S. employee restricted stock plan was amended for grants to employees in France. Under
the amendment, grants to employees in France will not vest before the second anniversary from the date of grant,
and any shares issued are subject to an additional two year tax hold period. All vested RSUs will be settled upon
vesting by delivery of a common share of Sierra Wireless, Inc. for each vested unit. The following table
summarizes the RSU activity since December 31, 2009:
Number of RSUs
Weighted Average Grant Date Fair Value
Weighted Average
Remaining Contractual
Life
Aggregate Intrinsic
Value
Cdn.$ U.S.$ In years U.S.$
Outstanding, December 31, 2009 ................................................................................................... 975,884 $ 6.88 $ 6.53 1.9 $ 10,349
Granted ........................................................................................................................................ 323,777 9.07 8.72
Vested .......................................................................................................................................... (314,341) 6.64 6.27 2,918
Outstanding, March 31, 2010......................................................................................................... 985,320 7.52 7.41 2.1 8,301
The aggregate intrinsic value of RSUs that vested in the three months ended March 31, 2009 was $401.

40
11. Stock-based Compensation
The following table summarizes the classification of the stock-based compensation expense recognized in the
Consolidated Statements of Operations and Retained Earnings (Deficit) for the non-vested share awards related to
the stock option and restricted stock plans described above in note 10:
Three months ended March 31, 2010 2009
Cost of goods sold ........................................................................................................................... $ 135 $ 110
Sales and marketing ......................................................................................................................... 381 349
Research and development ............................................................................................................................. 315 313
Administration ................................................................................................................................................ 841 735
Restructuring (note 6) ..................................................................................................................................... — 501
Integration (note 7) .......................................................................................................................... — 9
$ 1,672 $ 2,017
As of March 31, 2010, the unrecognized compensation costs related to non-vested stock options and RSUs were
$6,189 and $5,670 (2009 – $6,676 and $5,538), respectively, which are expected to be recognized over weighted
average periods of 2.5 and 2.2 years (2009 – 2.4 and 2.3), respectively.
RSUs are valued at the grant date market price of the underlying securities and the compensation expense based on
the estimated number of awards expected to vest is recognized on a straight-line basis over the three-year vesting
period, and grants to French employees are expensed over a two-year vesting period. Of the expense recognized in
our Consolidated Statements of Operations and Retained Earnings (Deficit) for the three months ended March 31,
2010, $880 related to the RSUs (2009 – $793).
We calculate the fair value of stock options granted using the Black-Scholes valuation model. Under this method,
the weighted average fair value of stock options granted during the three months ended March 31, 2010 was $4.15
(2009 – $1.80). The following assumptions were used:
Three months ended March 31, 2010 2009
Expected dividend yield ................................................................................................................................. — —
Expected stock price volatility ........................................................................................................................ 60% 57%
Risk-free interest rate ...................................................................................................................................... 1.92% 1.84 %
Expected life of options .................................................................................................................................. 4 years 4 years
Estimated forfeiture rate ................................................................................................................................. 3.50 % 3.50 %
There is no dividend yield because we do not pay, and do not plan to pay, cash dividends on our common shares.
The expected stock price volatility is based on the historical volatility of our average monthly stock closing prices
over a period equal to the expected life of each option grant. The risk-free interest rate is based on yields from risk-
free instruments with a term equal to the expected term of the options being valued. The expected life of options
represents the period of time that the options are expected to be outstanding based on historical data of option holder
exercise and termination behaviour. We estimate forfeitures at the time of grant and, if necessary, revise that
estimate if actual forfeitures differ and adjust stock-based compensation expense accordingly.
Wavecom stock option, warrant plans and free shares
Prior to our acquisition of Wavecom, Wavecom granted founders’ warrants and stock options to its employees,
stock options to employees of its subsidiaries, warrants to some members of its board of directors and free shares to
its employees of its subsidiaries. Under the terms of the plans, the options and warrants give the right to purchase
one share of Wavecom per option or warrant at an exercise price based either on the stock market price of Wavecom
shares on the grant date, or on the average stock market price of Wavecom shares over the twenty trading days prior
to the date of grant (in accordance with French Law). The stock-based compensation related to the pre-acquisition
Wavecom plans recognized in the Consolidated Statements of Operations is as follows:
Three months ended March 31, 2010 2009
Sales and marketing ........................................................................................................................................... $ 5 $ 15
Research and development ................................................................................................................................ 6 4
Administration ................................................................................................................................................... 11 69
$ 22 $ 88

41
The unrecognized stock-based compensation for the grants under the plans that existed prior to the acquisition of
Wavecom is $70 or €51 (2009 – $652 or €490), all of which is expected to be recognized by the end of 2012.
12. Non-controlling Interest
The following table summarizes the changes in the non-controlling interest that was acquired with the acquisition of
Wavecom (note 3).
Non-controlling interest of Wavecom at December 31, 2009 ........................................................................ $ 2,525
Comprehensive income (loss) attributable to non-controlling interest:
Net loss ..................................................................................................................................................................... (88)
Other comprehensive income:
Foreign currency translation .................................................................................................................. 60
Comprehensive loss attributable to non-controlling interest ....................................................................................... (28)
Non-controlling interest of Wavecom at March 31, 2010 ........................................................................................... $ 2,497
13. Financial Instruments
(a) Credit facilities
Until December 2008, we had an unsecured revolving demand facility with a Canadian chartered bank for $10,000
that bore interest at prime per annum. No amount was drawn under that facility and it was terminated on December
1, 2008.
In connection with our acquisition of Wavecom, we signed a credit agreement on December 1, 2008, with The
Toronto Dominion Bank and Canadian Imperial Bank of Commerce, as lenders, that provided a one-year revolving
term credit facility (―Revolving Facility‖) and a one-year non-revolving term credit facility (―Term Facility‖).
The Term Facility, not to exceed €218,000, was used to complete the acquisition of Wavecom ordinary shares and
OCEANEs. The Term Facility was secured by cash of €136,766 and a pledge against all of our assets. On
December 1, 2008, as required by French regulations, we drew a letter of credit in the amount of €218,000 issued
under the Term Facility. On February 26, 2009, we borrowed €80,473 under the Term Facility to facilitate the
purchase, on February 27, 2009, of 99.97% of the outstanding OCEANEs. On February 27, 2009, we completed the
purchase of 84.32% of the outstanding Wavecom shares with €115,365 of our cash that secured the Term Facility
and the letter of credit was reduced from €218,000 to €22,162. The OCEANEs were subsequently redeemed by
Wavecom and on March 13, 2009 the loan of €80,473 under the Term Facility was repaid with those proceeds. On
completion of the squeeze-out on April 29, 2009, the letter of credit was reduced to nil and the Term Facility was no
longer available.
The Revolving Facility, not to exceed $55,000, is to be used for working capital requirements and is secured by a
pledge against all of our assets. On January 29, 2010, we signed an amended and restated credit agreement which
renewed our Revolving Facility to January 28, 2011, and amended the maximum amount from $55,000 to $10,000.
Since December 1, 2008, we have not drawn on any amount under the Revolving Facility.
At March 31, 2010, there were no borrowings under the Revolving Facility and we were in compliance with the
covenants associated with the credit facility.
(b) Letter of credit
During the quarter, we obtained a letter of credit to ensure our performance to a third party customer in accordance
with specified terms and conditions. At March 31, 2010 we had $315 (2009 – nil) outstanding under the letter of
credit, which approximates its fair value. The letter of credit expires in September 2011.
On December 1, 2008, we drew a letter of credit in the amount of €218,000, which was issued under the €218,000
secured Term Facility to facilitate our acquisition of Wavecom. As of the completion of the squeeze-out of
Wavecom shares, the letter of credit was reduced to nil and the Term Facility was no longer available.

42
(c) Derivatives
Wavecom, whose functional currency is the Euro, uses derivatives such as foreign currency forward and options
contracts, to reduce the foreign exchange risk on cash flows from firm and highly probable commitments
denominated in U.S. dollars. The fair value of these financial instruments is determined using published exchange
rates to calculate the price that would be received to sell the asset or paid to transfer the liability related to the
contracts. Accordingly, these foreign exchange contracts are classified in Level 2 of the fair value hierarchy. These
instruments are recorded at fair value on the balance sheet in prepaid expenses and other. At March 31, 2010, there
were no cash flow hedges. All derivatives that were outstanding at March 31, 2010 had maturity dates of less than
12 months. We believe that the counterparty risk on the foreign currency financial instruments being used is
acceptable because we deal with major banks and financial institutions.
The following table presents the fair value of the derivative financial instruments at March 31, 2010:
Notional
Amount
Fair
Value Fair value of forward and option contracts selling U.S. dollars
against Euros ........................................................................................................................................... $ 8,850 € 212
The net foreign currency exposure related to Wavecom’s assets and liabilities as of March 31, 2010, which are
denominated in foreign currencies and then converted to Euros, are as follows:
U.S.
Dollars
Other
Currencies
Assets ........................................................................................................................................................ € 13,700 € 216
Hedging of assets in foreign currencies (balance sheet) ............................................................................ 6,556 — Net assets after hedging ....................................................................................................................... € 7,144 € 216
Liabilities................................................................................................................................................... € 6,430 € 95
Hedging of liabilities in foreign currencies (balance sheet) ...................................................................... — —
Net liabilities after hedging ................................................................................................................ € 6,430 € 95
14. Income Taxes
We evaluated all uncertain tax positions and determined that the unrecognized tax benefits at December 31, 2009
were $7,754 (2008 – $9,344). This was increased in the three months ended March 31, 2010 by $140 (2009 –$124),
respectively, resulting in unrecognized tax benefits of $7,894 as at March 31, 2010. If these tax benefits as at March
31, 2010 and December 31, 2009 were recognized, they would affect the effective tax rate.
We recognize potential interest and penalties related to income tax matters in income tax expense. During the
months ended March 31, 2010, we recorded an expense of $140 (2009 – $118), for interest and penalties. At March
31, 2010, we had accrued $1,275 (December 31, 2009 – $1,135) for potential interest and penalties.
15. Commitments and contingencies
(a) Contingent liability on sale of products
(i) Under license agreements, we are committed to make royalty payments based on the sales of products using
certain technologies. We recognize royalty obligations as determinable in accordance with agreement terms.
Where agreements are not finalized, we have recognized our current best estimate of the obligation. When the
agreements are finalized, the estimate will be revised accordingly.
(ii) We are a party to a variety of agreements in the ordinary course of business under which we may be obligated
to indemnify a third party with respect to certain matters. Typically, these obligations arise as a result of
contracts for sale of our products to customers where we provide indemnification against losses arising from
matters such as potential intellectual property infringements and product liabilities. The impact on our future
financial results is not subject to reasonable estimation because considerable uncertainty exists as to whether
claims will be made and the final outcome of potential claims. To date, we have not incurred material costs
related to these types of indemnifications.
(iii) Under certain research and development funding agreements, we are contingently liable to repay up to $3,167.
Repayment under these agreements is contingent upon reaching certain revenue levels for specified products.

43
(iv) Under an agreement with the Government of Canada’s Technology Partnerships Canada (―TPC‖) program, we
have received Cdn. $9,999 to support the development of a range of third generation wireless technologies.
Under the terms of the agreement, an amount up to a maximum of Cdn. $13,000 is to be repaid based on
annual sales, in excess of certain minimum amounts, of specified products commencing in 2004. As all funds
available under this program were earned prior to 2004, during the years ended December 31, 2009 and 2008
we claimed nil. As of June 30, 2008, the repayable funding had been fully expensed. During the three months
ended March 31, 2010 and 2009, we expensed nil in research and development expense. In addition, we issued
warrants to TPC to purchase 138,696 common shares on December 30, 2003, valued at Cdn. $2,000 based on
the Black-Scholes option pricing model. The warrants were exercisable at Cdn. $20.49 per share for a term of
five years from December 30, 2003. On December 30, 2008, the warrants expired unexercised.
In March 2004, we entered into a second agreement with TPC under which we were eligible to receive
conditionally repayable research and development funding up to Cdn. $9,540 to support the development of a
range of third generation wireless technologies. The agreement was effective April 2003. Given the
termination of the Voq professional phone initiative in the second quarter of 2005, no costs have been claimed
under this agreement since June 2005. A total of Cdn. $4,558 was funded by TPC for eligible development
activity prior to the termination of the Voq initiative. Under the terms of the original agreement, royalty
repayments, based on a percentage of annual sales in excess of certain minimum amounts, would be calculated
over the period from April 2003 to December 2011. If royalty repayments were less than Cdn. $16,455 by
December 2011, repayments would have continued subsequent to December 2011 until the earlier of when this
amount was reached or December 2014. In addition, all or part of the contribution was repayable upon the
occurrence of certain prescribed events of default, including material breach or insolvency. During the three
months ended March 31, 2010 and 2009, we have recorded nil, in research and development expense. In
March 2009, we signed an amended agreement under which we will pay a total of $2,155 (Cdn. $2,500) in five
equal annual installments commencing March 1, 2009, in full and final satisfaction of all amounts owing, or to
be owed, to TPC under this agreement. In the three months ended March 31, 2010, we repaid $476 (Cdn.
$500) (2009 – $394 or Cdn. $500). We had previously accrued the royalty repayments and as a result of the
amended agreement we reversed accruals in research and development expense totaling nil (2009 – $753 or
Cdn. $957).
(v) We accrue product warranty costs, when we sell the related products, to provide for the repair or replacement
of defective products. Our accrual is based on an assessment of historical experience and on management’s
estimates. An analysis of changes in the liability for product warranties follows:
Balance, December 31, 2009 .............................................................................................................. $ 4,630
Provisions ........................................................................................................................................ 1,427
Expenditures .................................................................................................................................... (1,787)
Balance, March 31, 2010 .................................................................................................................... $ 4,270
(b) Other commitments
We have entered into purchase commitments totaling approximately $126,378 (December 31, 2009 – $109,421)
with certain contract manufacturers under which we have committed to buy a minimum amount of designated
products between April 2010 and September 2010. In certain of these agreements, we may be required to acquire
and pay for such products up to the prescribed minimum or forecasted purchases.
(c) Legal proceedings
In July 2009, a patent holding company, SPH America, LLC, filed a patent litigation lawsuit in the United States
District Court for the Eastern District of Virginia asserting patent infringement by a number of device
manufacturers, including us, and computer manufacturers, including Hewlett-Packard Co. (―HP‖), Panasonic
Corporation (―Panasonic‖), General Dynamics Itronix Corporation (―GD‖) and Fujitsu America and Fujitsu Japan
(―Fujitsu‖). The litigation, which has been transferred to the United States District Court, Southern District of
California, makes certain allegations concerning the wireless modules sold to the computer manufacturers by us, our
competitors, and some of our customers with whom we have supply agreements. We are assessing our obligations
and our liability, if any, in respect of this litigation. Although there can be no assurance that an unfavourable
outcome would not have a material adverse effect on our operating results, liquidity or financial position, we believe
the claims are without merit and will vigorously defend the lawsuit.
In July 2009, a patent holding company, WIAV Networks, LLC, filed a patent litigation lawsuit in the United States
District Court for the Eastern District of Texas asserting patent infringement by a number of parties, including

44
wireless device manufacturers, including us. We are currently assessing our potential liability, if any, in respect of
this litigation. Although there can be no assurance that an unfavourable outcome would not have a material adverse
effect on our operating results, liquidity or financial position, we believe the claims are without merit and will
vigorously defend the lawsuit.
In July, 2009, a patent holding company, Celltrace, LLC, filed a patent litigation lawsuit in the United States District
Court for the Eastern District of Texas asserting patent infringement by a number of telecommunication carrier
companies including Sprint Spectrum, LP and AT&T Mobility LLC. The litigation makes certain allegations
concerning the wireless modems sold to the carriers by us and our competitors. We are currently assessing our
obligations and our liability, if any, in respect of this litigation. Although there can be no assurance that an
unfavourable outcome would not have a material adverse effect on our operating results, liquidity or financial
position, we believe the claims are without merit and will vigorously defend the lawsuit.
In June 2009, a patent holding company, Saxon Innovations, LLC (―Saxon‖), filed a patent litigation lawsuit in the
United States District Court for the Eastern District of Texas asserting patent infringement by a number of wireless
device manufacturers, including us. The litigation makes certain allegations concerning the products sold by those
manufacturers. We are currently assessing our liability, if any, in respect of this litigation. Although there can be no
assurance that an unfavourable outcome would not have a material adverse effect on our operating results, liquidity
or financial position, we believe the claims are without merit and will vigorously defend the lawsuit.
In January 2009, a patent holding company, DNT LLC, filed a patent litigation lawsuit in the United States District
Court for the Eastern District of Virginia asserting patent infringement by a number of telecommunication carrier
companies including Sprint Spectrum, LP and Nextel, Verizon Wireless and T-Mobile USA, Inc. The litigation
made certain allegations concerning the wireless modems sold to the carriers by us and our competitors. Following a
trial in December 2009, the Court received a jury verdict of patent non-infringement and invalidity. In February,
2010, DNT LLC filed a motion for a new trial or in the alternative for an amended judgment. While we believe that
this motion will be unsuccessful, we intend to vigorously defend the motion. DNT LLC has indicated its intention
to file an appeal from the Court’s verdict. While we believe that the appeal, if any, will be unsuccessful, we intend
to vigorously defend against the appeal.
On February 6, 2008, Wavecom filed a civil proceeding in the Supreme Court of the State of New York (USA)
against Siemens AG and two of its U.S. subsidiaries. Sierra Wireless S.A., Wavecom, Inc., Siemens AG, Siemens
Corporation, and Siemens Energy and Automation, Inc. have reached a mutually agreeable settlement of the lawsuit
filed in New York State Court. The details of the settlement agreement are confidential.
Since early December 2008, Wavecom and its subsidiary Wavecom, Inc. have been involved in litigation with a
contracting counterparty, Temic Automotive of North America (Continental Group). Temic Automotive of North
America, Inc., d/b/a/ Continental and Continental AG, Wavecom, Inc., Wavecom, S.A., Sierra Wireless, Inc., Sierra
Wireless Americas, Inc., and Sierra Wireless, S.A. have reached a mutually agreeable settlement of the lawsuits
filed early December 2008 in North Carolina Business Court and New York State Court. The details of the
settlement agreement are confidential.
We are engaged in certain other claims and legal actions in the ordinary course of business and believe that the
ultimate outcome of these actions will not have a material adverse effect on our operating results, liquidity or
financial position.
16. Supplementary Information
Three months ended March 31, 2010 2009
Cash received for
Interest ......................................................................................................................................................... $ 15 $ 230
Income taxes ................................................................................................................................................ 113 —
Cash paid for
Interest ......................................................................................................................................................... 262 468
Income taxes ................................................................................................................................................ 136 516

45
17. Segmented Information
Effective January 1, 2010, we integrated the legacy Sierra Wireless and Wavecom segments, and as a result our
reportable segments have changed from those reported at December 31, 2009. We operate in one segment, the
wireless solutions industry, and all of our products and services are made in this segment.
We sell certain products through resellers, original equipment manufacturers, and wireless service providers who
sell these products to end-users. The approximate sales to significant customers are as follows:
Three months ended March 31, 2010 2009
Customer A ...................................................................................................................................... $ 19,819 $ 27,349
Customer B ...................................................................................................................................... 22,426 29,291
Customer C ...................................................................................................................................... 26,671 —

Head Office
Sierra Wireless, Inc.
13811 Wireless Way
Richmond
British Columbia
Canada V6V 3A4
Telephone 604 231 1100
Facsimile 604 231 1109
Website www.sierrawireless.com

www.sierrawireless.com