united states immigration and immigration policies, colonial times to present
Post on 20-Dec-2015
217 views
TRANSCRIPT
United States Immigration and Immigration Policies,
Colonial Times to Present
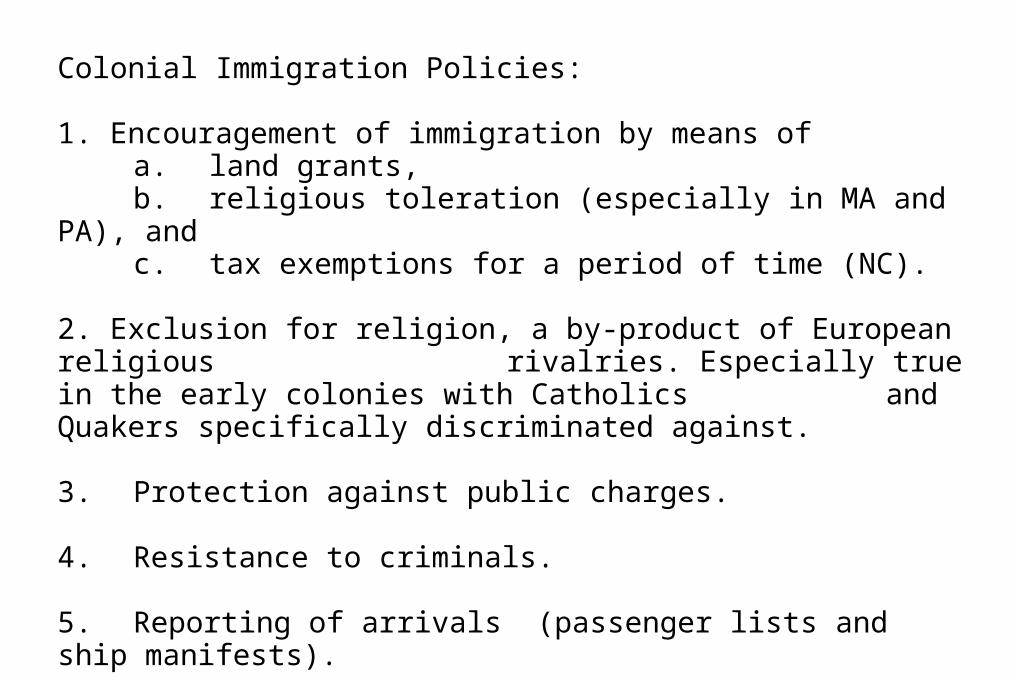
Colonial Immigration Policies:
1. Encouragement of immigration by means ofa. land grants,b. religious toleration (especially in MA and PA), andc. tax exemptions for a period of time (NC).
2. Exclusion for religion, a by-product of European religious rivalries. Especially true in the early colonies with Catholics and Quakers specifically discriminated against.
3. Protection against public charges.
4. Resistance to criminals.
5. Reporting of arrivals (passenger lists and ship manifests).
6. Taxes on immigrants.
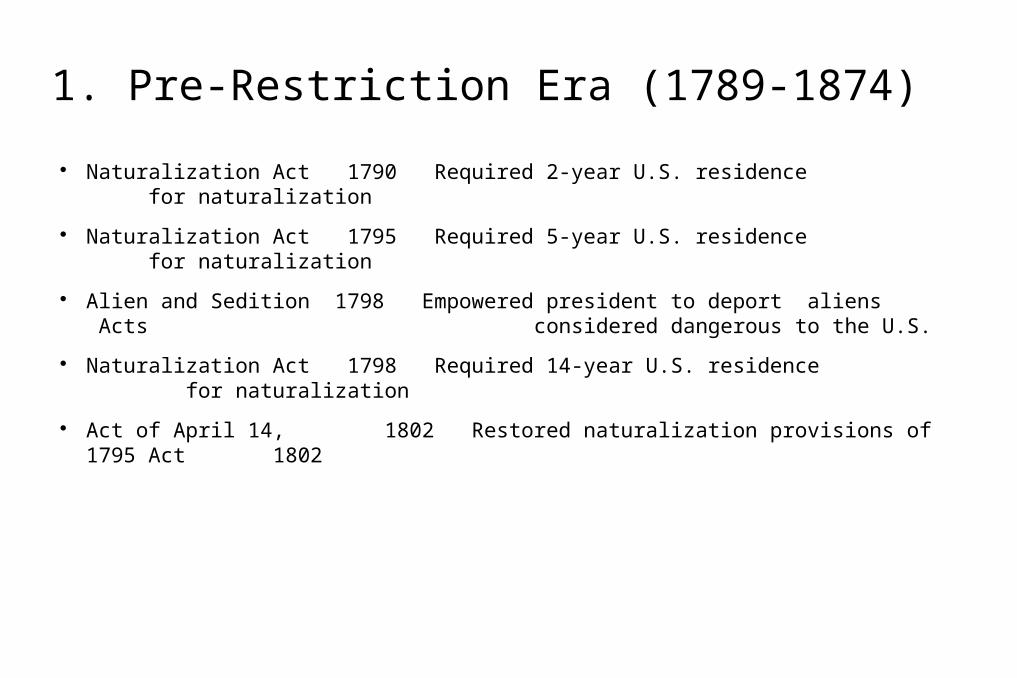
1. Pre-Restriction Era (1789-1874)
Naturalization Act 1790 Required 2-year U.S. residence for naturalization
Naturalization Act 1795 Required 5-year U.S. residence for naturalization
Alien and Sedition 1798 Empowered president to deport aliens Acts considered dangerous to the U.S.
Naturalization Act 1798 Required 14-year U.S. residence for naturalization
Act of April 14, 1802 Restored naturalization provisions of 1795 Act 1802
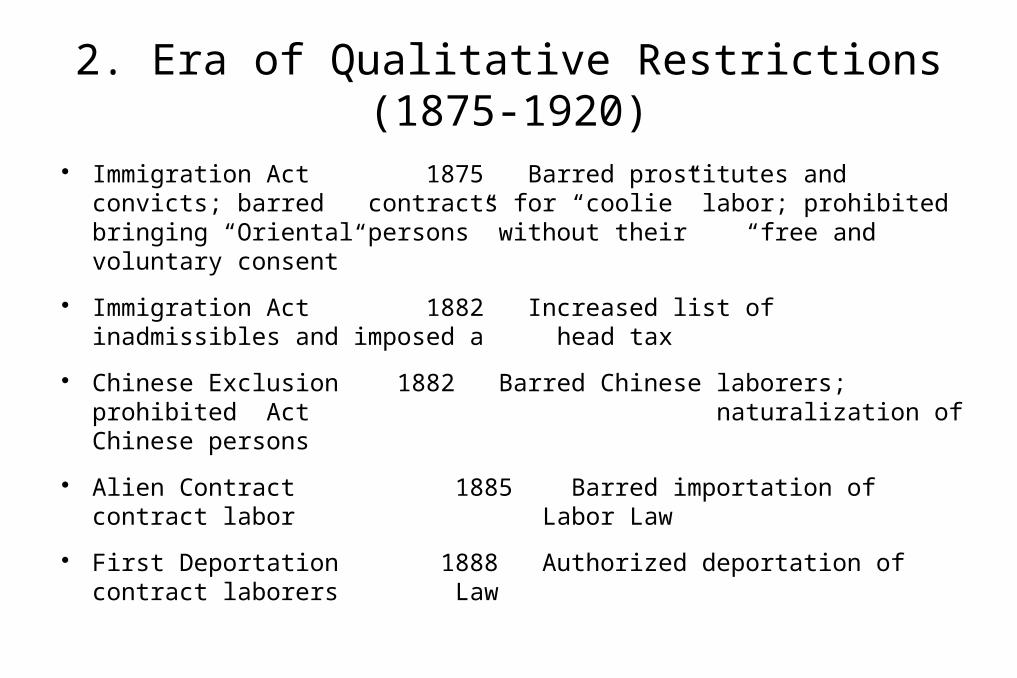
2. Era of Qualitative Restrictions (1875-1920)
Immigration Act 1875 Barred prostitutes and convicts; barred contracts for “coolie” labor; prohibited
bringing “Oriental persons” without their “free and voluntary consent”
Immigration Act 1882 Increased list of inadmissibles and imposed a head tax
Chinese Exclusion 1882 Barred Chinese laborers; prohibited Act naturalization of Chinese persons
Alien Contract 1885 Barred importation of contract labor Labor Law
First Deportation 1888 Authorized deportation of contract laborers Law
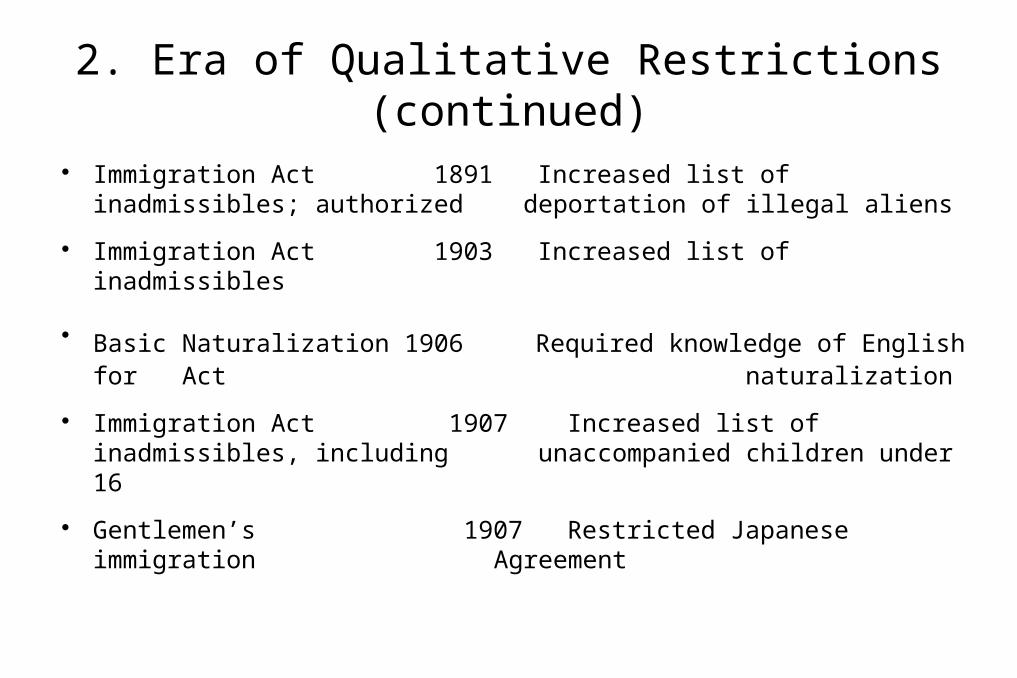
2. Era of Qualitative Restrictions (continued)
Immigration Act 1891 Increased list of inadmissibles; authorized deportation of illegal aliens
Immigration Act 1903 Increased list of inadmissibles
Basic Naturalization 1906 Required knowledge of English for Act naturalization
Immigration Act 1907 Increased list of inadmissibles, including unaccompanied children under 16
Gentlemen’s 1907 Restricted Japanese immigration Agreement
2. Era of Qualitative Restrictions (continued)
Immigration Act 1917 Increased and codified list of inadmissibles; required literacy for those over 16;
barred Asia-Pacific aliens
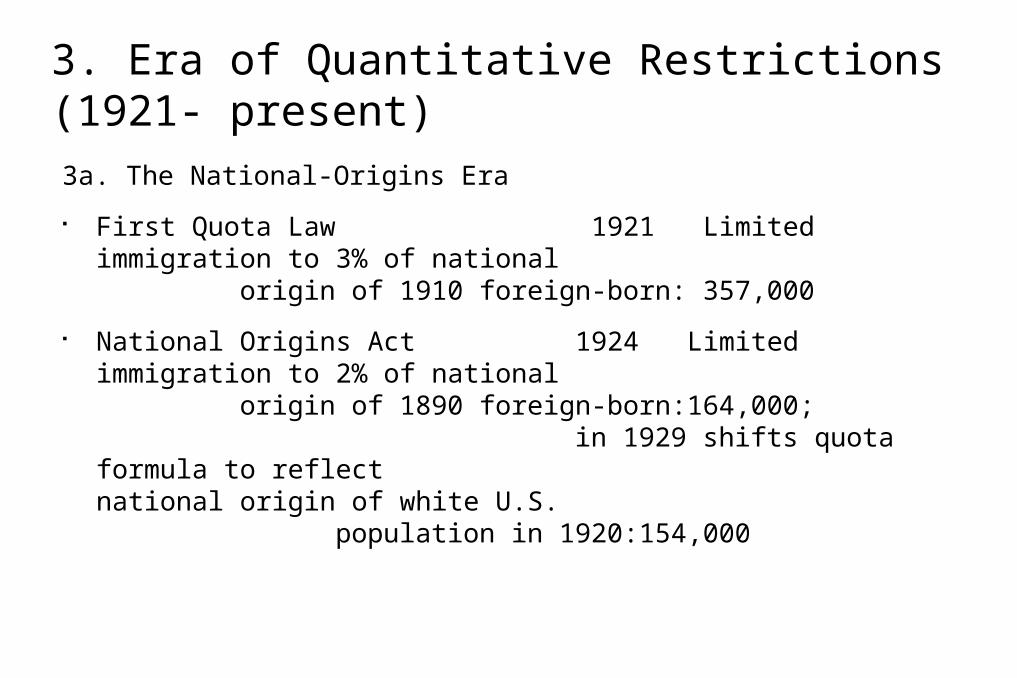
3. Era of Quantitative Restrictions (1921- present)
3a. The National-Origins Era
First Quota Law 1921 Limited immigration to 3% of national origin of 1910 foreign-born:
357,000
National Origins Act 1924 Limited immigration to 2% of national origin of 1890 foreign-
born:164,000; in 1929 shifts quota formula to reflect national origin of white U.S.
population in 1920:154,000
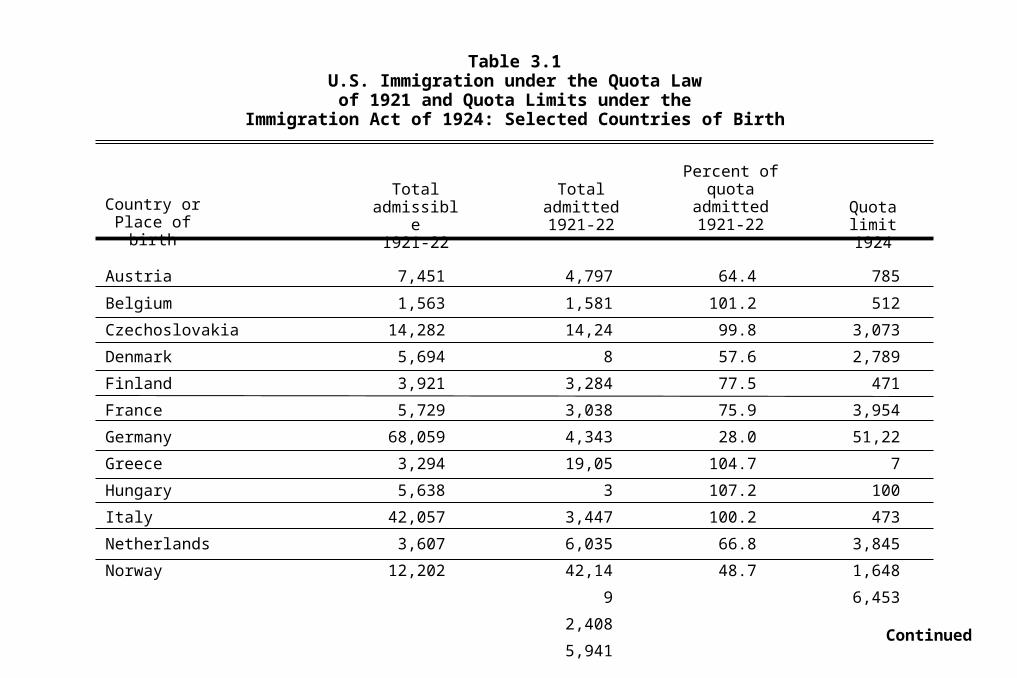
Table 3.1U.S. Immigration under the Quota Law
of 1921 and Quota Limits under theImmigration Act of 1924: Selected Countries of Birth
Country or Place of birth
Total admissible1921-22
Total admitted1921-22
Percent of quota
admitted1921-22
Quota limit1924
Austria
Belgium
Czechoslovakia
Denmark
Finland
France
Germany
Greece
Hungary
Italy
Netherlands
Norway
7,451
1,563
14,282
5,694
3,921
5,729
68,059
3,294
5,638
42,057
3,607
12,202
4,797
1,581
14,248
3,284
3,038
4,343
19,053
3,447
6,035
42,149
2,408
5,941
Continued
64.4
101.2
99.8
57.6
77.5
75.9
28.0
104.7
107.2
100.2
66.8
48.7
785
512
3,073
2,789
471
3,954
51,227
100
473
3,845
1,648
6,453
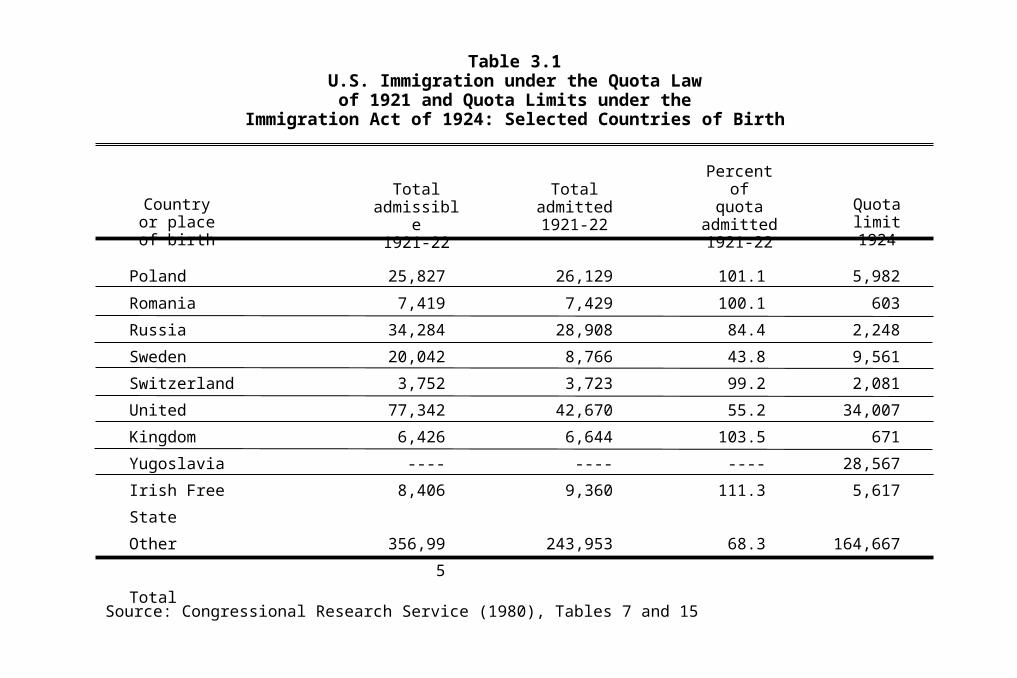
Table 3.1U.S. Immigration under the Quota Law
of 1921 and Quota Limits under theImmigration Act of 1924: Selected Countries of Birth
Country or place of birth
Total admissible1921-22
Percent ofquota
admitted1921-22
Quota limit1924
Total admitted1921-22
Poland
Romania
Russia
Sweden
Switzerland
United Kingdom
Yugoslavia
Irish Free State
Other
Total
25,827
7,419
34,284
20,042
3,752
77,342
6,426
----
8,406
356,995
26,129
7,429
28,908
8,766
3,723
42,670
6,644
----
9,360
243,953
101.1
100.1
84.4
43.8
99.2
55.2
103.5
----
111.3
68.3
5,982
603
2,248
9,561
2,081
34,007
671
28,567
5,617
164,667
Source: Congressional Research Service (1980), Tables 7 and 15
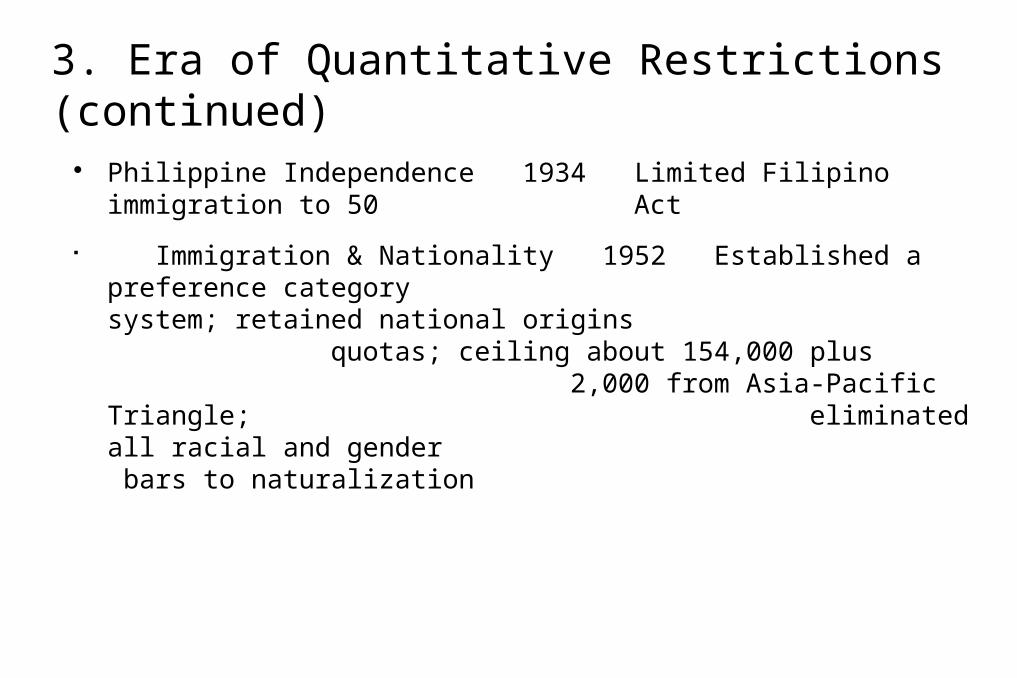
3. Era of Quantitative Restrictions (continued)
Philippine Independence 1934 Limited Filipino immigration to 50 Act
Immigration & Nationality 1952 Established a preference category system; retained national
origins quotas; ceiling about 154,000 plus 2,000 from Asia-Pacific Triangle; eliminated all racial and gender bars to naturalization
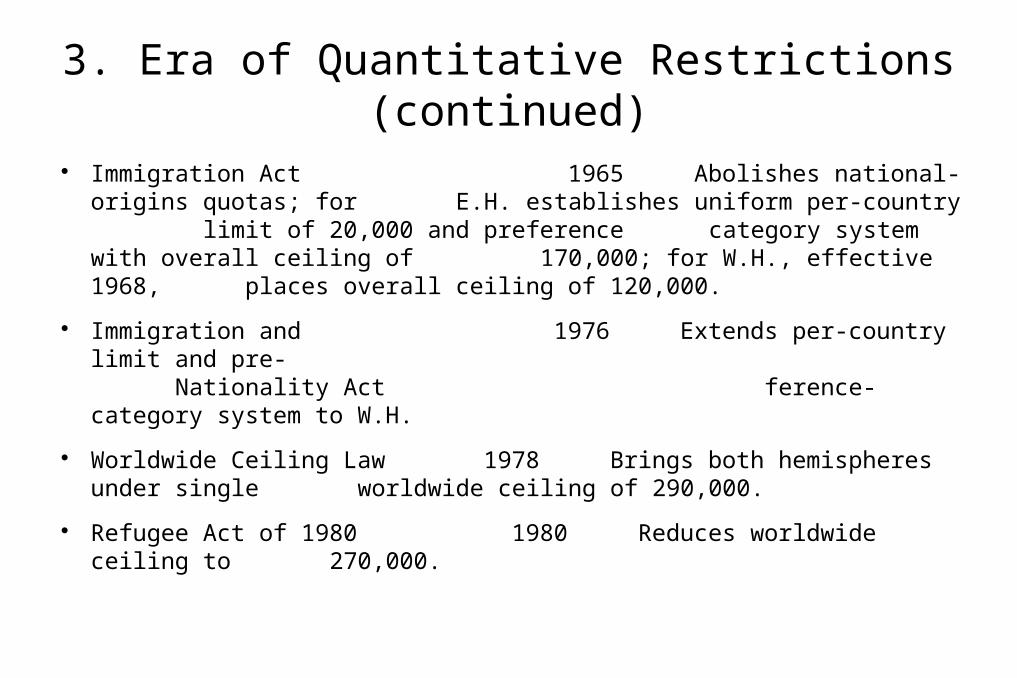
3. Era of Quantitative Restrictions (continued)
Immigration Act 1965 Abolishes national-origins quotas; for E.H. establishes uniform per-country limit of 20,000 and preference category system with overall ceiling of 170,000; for W.H., effective 1968, places overall ceiling of 120,000.
Immigration and 1976 Extends per-country limit and pre- Nationality Act ference-category system to W.H.
Worldwide Ceiling Law 1978 Brings both hemispheres under single worldwide ceiling of 290,000.
Refugee Act of 1980 1980 Reduces worldwide ceiling to 270,000.
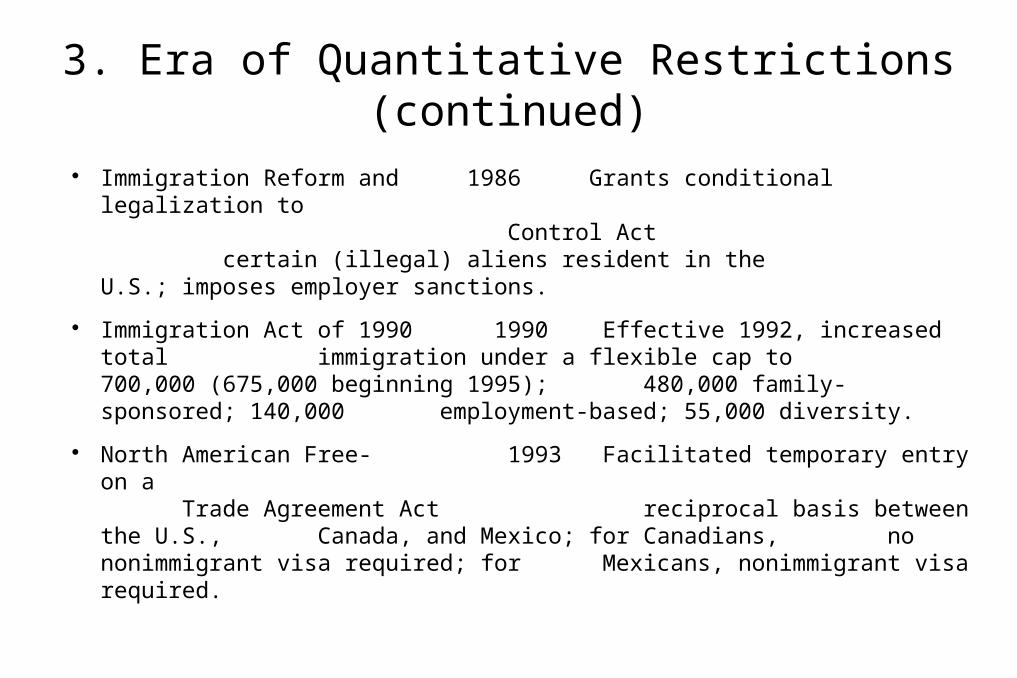
3. Era of Quantitative Restrictions (continued)
Immigration Reform and 1986 Grants conditional legalization to Control Act certain (illegal) aliens resident in the U.S.; imposes employer sanctions.
Immigration Act of 1990 1990 Effective 1992, increased total immigration under a flexible cap to 700,000 (675,000 beginning 1995); 480,000 family-sponsored; 140,000 employment-based; 55,000 diversity.
North American Free- 1993 Facilitated temporary entry on a Trade Agreement Act reciprocal basis between the U.S., Canada, and Mexico; for Canadians, no nonimmigrant visa required; for Mexicans, nonimmigrant visa required.
3. Era of Quantitative Restrictions (continued)
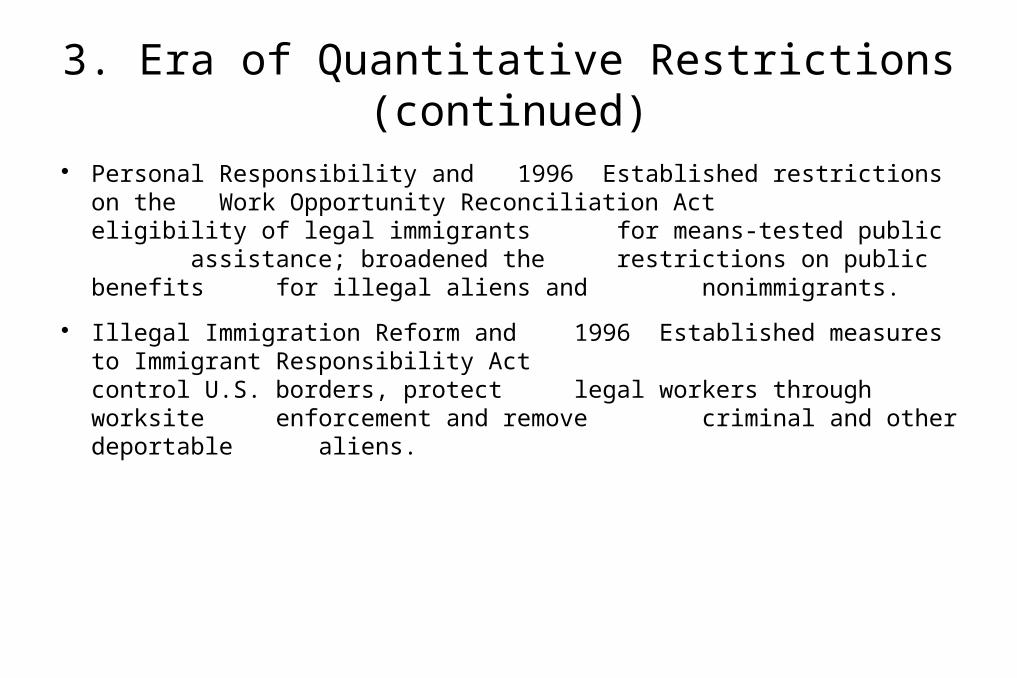
Personal Responsibility and 1996 Established restrictions on theWork Opportunity Reconciliation Act eligibility of legal immigrants
for means-tested public assistance; broadened the restrictions on public benefits for illegal aliens and nonimmigrants.
Illegal Immigration Reform and 1996 Established measures toImmigrant Responsibility Act control U.S. borders, protect
legal workers through worksite enforcement and remove criminal and other deportable aliens.

Preference Categories under the Immigration and Nationality Act of 1952
Class of admission Percent allotted
First preference - selected immigrants of special skill or ability
Second preference - parents of U.S. citizens
Third preference - spouses and children of resident aliens
Fourth preference - brothers or sisters of U.S. citizens; children over 21
years of age, or married to U.S. citizens
Nonpreference
50%
30%
20%
quotas not used by above categories (up to 25%)
quotas not used by any preference groups
Source: Congressional Research Service (1980), p. 63.
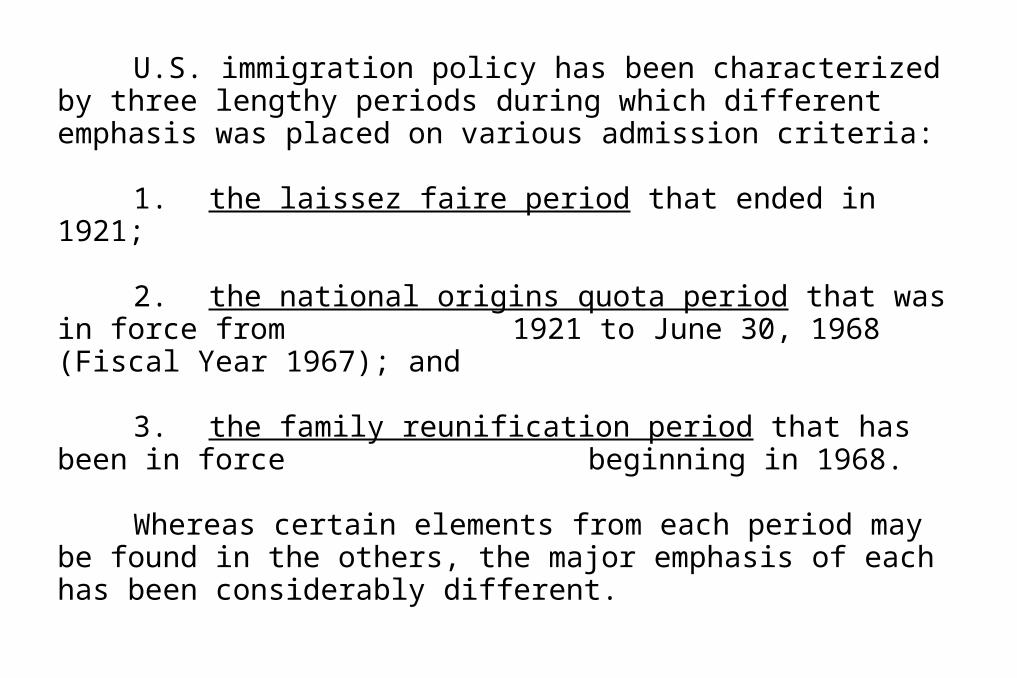
U.S. immigration policy has been characterized by three lengthy periods during which different emphasis was placed on various admission criteria:
1. the laissez faire period that ended in 1921;
2. the national origins quota period that was in force from 1921 to June 30, 1968 (Fiscal Year 1967); and
3. the family reunification period that has been in force beginning in 1968.
Whereas certain elements from each period may be found in the others, the major emphasis of each has been considerably different.
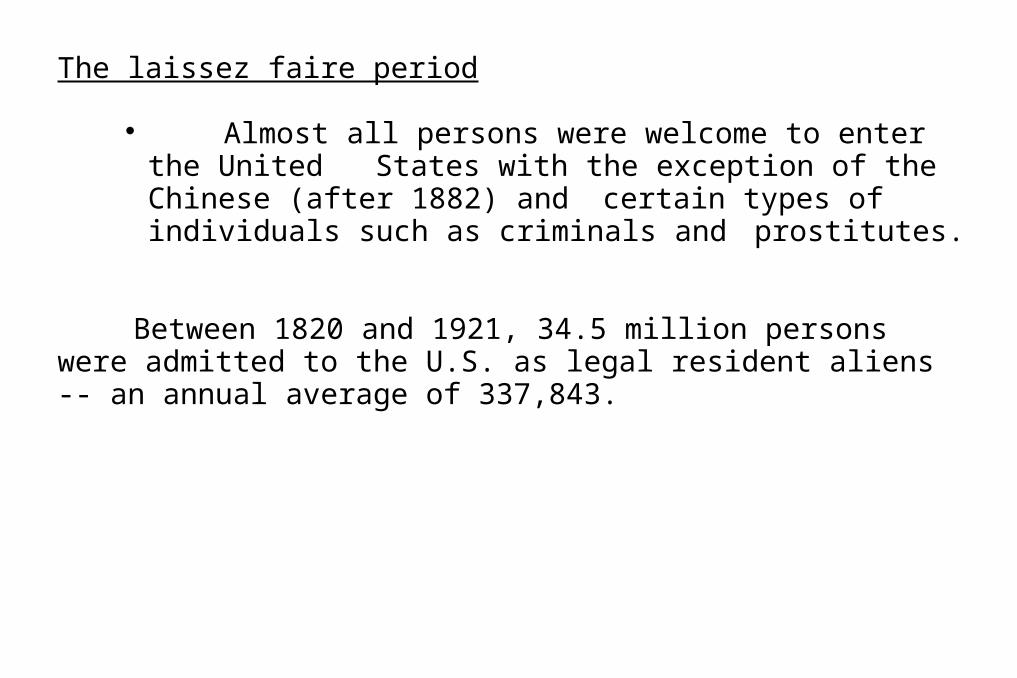
The laissez faire period
Almost all persons were welcome to enter the United States with the exception of the Chinese (after 1882) and certain types of individuals such as criminals and
prostitutes.
Between 1820 and 1921, 34.5 million persons were admitted to the U.S. as legal resident aliens -- an annual average of 337,843.

The national origins quota period
The emphasis in admissions during this period was on the country of birth of immigrants
Between 1922 and June 30, 1968, 9.5 million persons were admitted to the U.S. as legal resident aliens -- an annual average of 206,875.
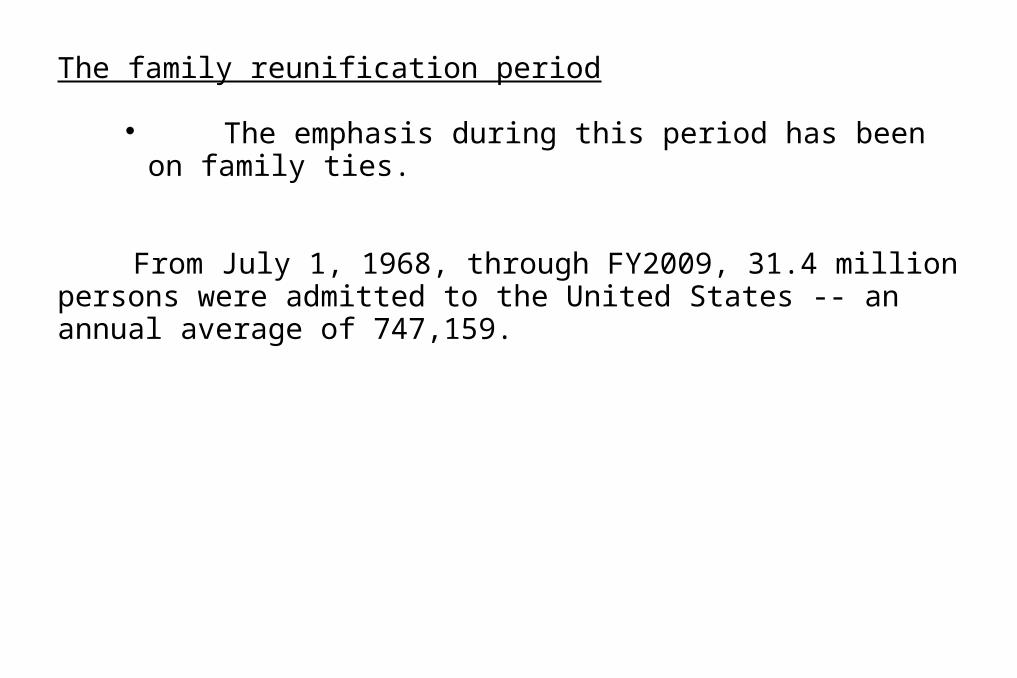
The family reunification period
The emphasis during this period has been on family ties.
From July 1, 1968, through FY2009, 31.4 million persons were admitted to the United States -- an annual average of 747,159.
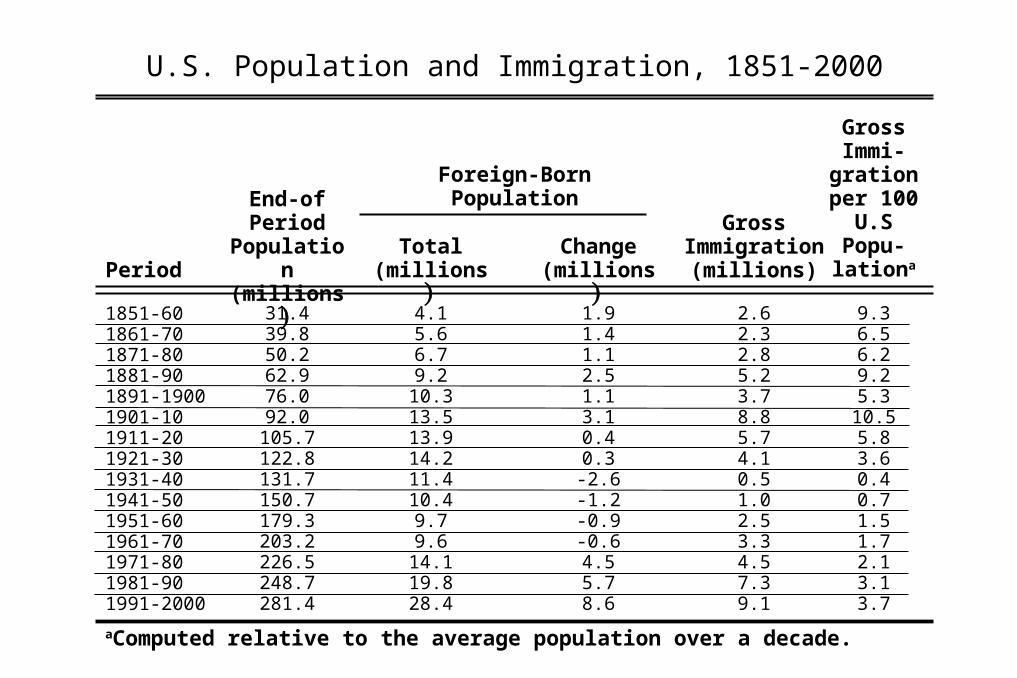
U.S. Population and Immigration, 1851-2000
Period
End-of Period
Population (millions)
GrossImmigration
(millions)
Gross Immi-
gration per 100
U.S Popu-lationa
Foreign-BornPopulation
Total(millions)
Change(millions)
aComputed relative to the average population over a decade.
1851-601861-701871-801881-901891-19001901-101911-201921-301931-401941-501951-601961-701971-801981-901991-2000
31.439.850.262.976.092.0
105.7122.8131.7150.7179.3203.2226.5248.7281.4
4.15.66.79.2
10.313.513.914.211.410.49.79.6
14.119.828.4
1.91.41.12.51.13.10.40.3-2.6-1.2-0.9-0.64.55.78.6
2.62.32.85.23.78.85.74.10.51.02.53.34.57.39.1
9.36.56.29.25.3
10.55.83.60.40.71.51.72.13.13.7
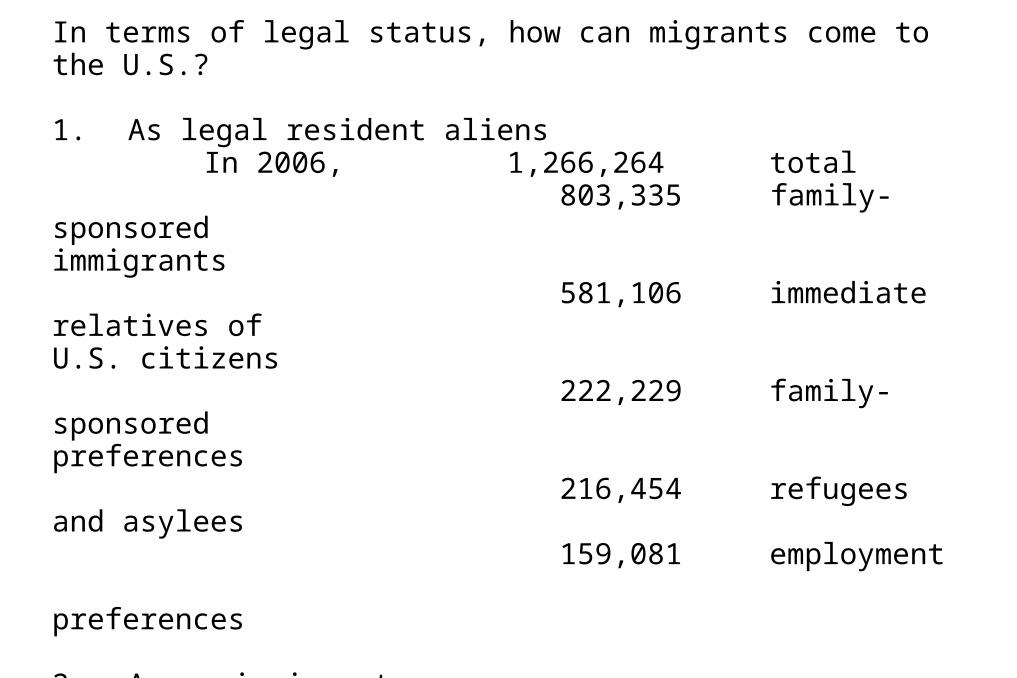
In terms of legal status, how can migrants come to the U.S.?
1. As legal resident aliensIn 2006, 1,266,264 total
803,335 family-sponsored immigrants
581,106 immediate relatives of U.S. citizens
222,229 family-sponsored preferences
216,454 refugees and asylees 159,081 employment
preferences
2. As nonimmigrantsIn 2006, 33,667,328 total
821,006 temporary workers and trainees
1,709,953 temporary workers and their families
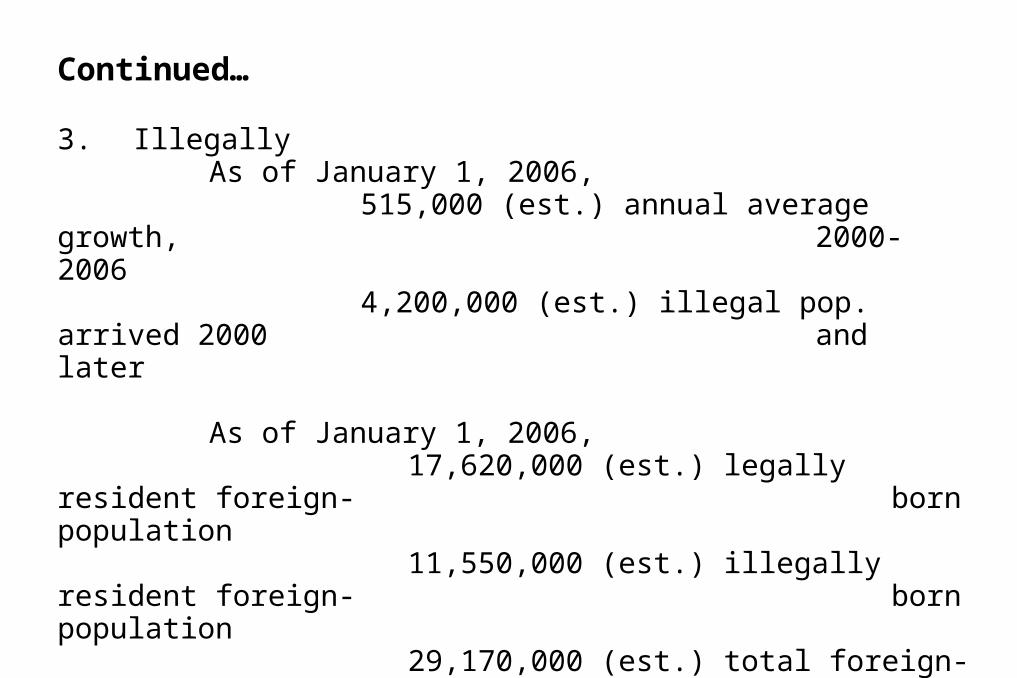
Continued…
3. IllegallyAs of January 1, 2006,
515,000 (est.) annual average growth, 2000-2006
4,200,000 (est.) illegal pop. arrived 2000 and later
As of January 1, 2006, 17,620,000 (est.) legally resident foreign-
born population 11,550,000 (est.) illegally resident foreign-
born population 29,170,000 (est.) total foreign-born
population
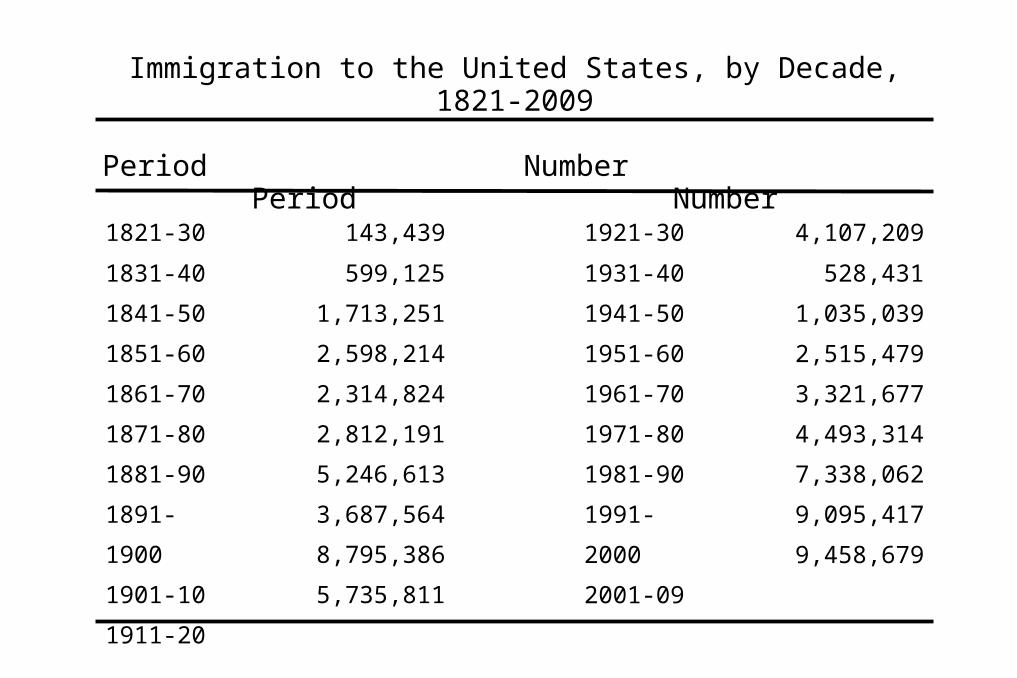
Immigration to the United States, by Decade,1821-2009
Period Number Period Number
1821-30
1831-40
1841-50
1851-60
1861-70
1871-80
1881-90
1891-1900
1901-10
1911-20
1921-30
1931-40
1941-50
1951-60
1961-70
1971-80
1981-90
1991-2000
2001-09
143,439
599,125
1,713,251
2,598,214
2,314,824
2,812,191
5,246,613
3,687,564
8,795,386
5,735,811
4,107,209
528,431
1,035,039
2,515,479
3,321,677
4,493,314
7,338,062
9,095,417
9,458,679
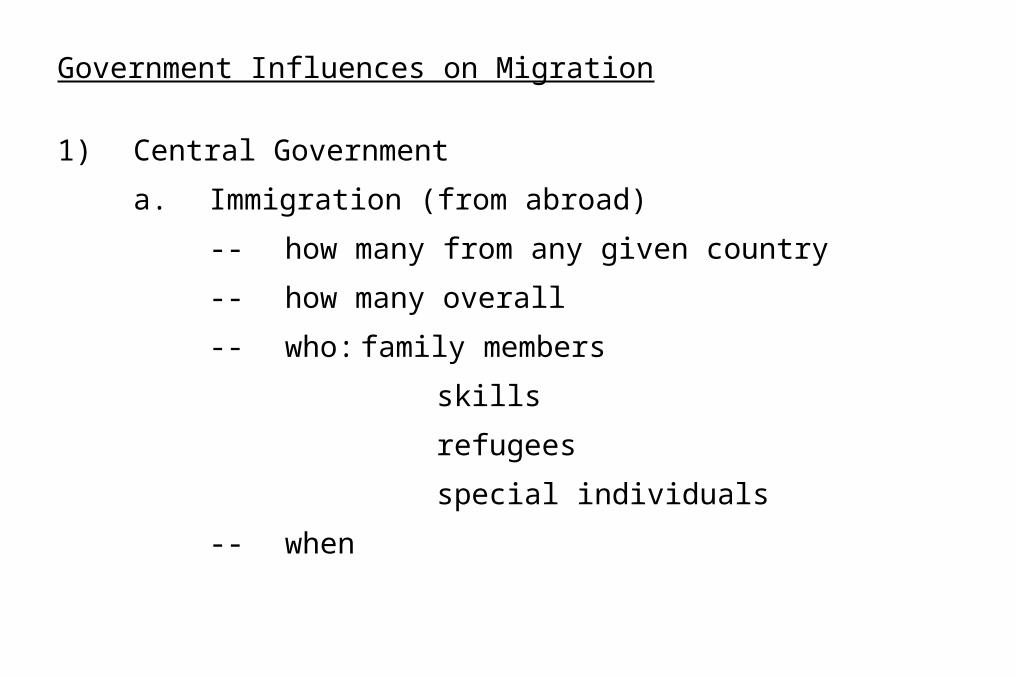
Government Influences on Migration
1) Central Government
a. Immigration (from abroad)
-- how many from any given country
-- how many overall
-- who: family members
skills
refugees
special individuals
-- when
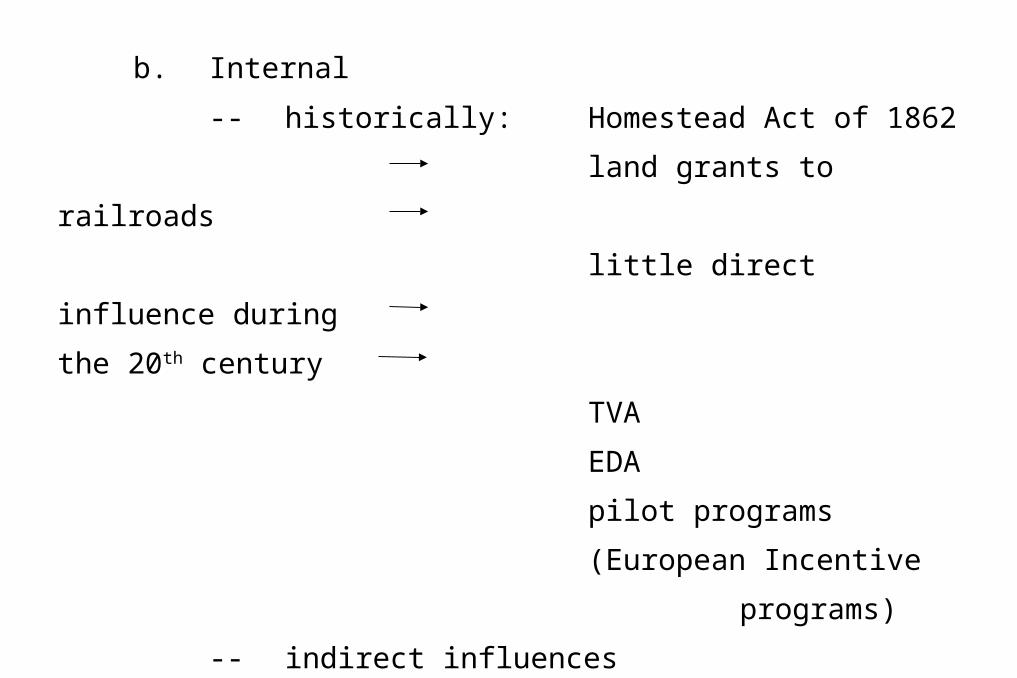
b. Internal
-- historically: Homestead Act of 1862
land grants to railroads
little direct influence during
the 20th century
TVA
EDA
pilot programs
(European Incentive
programs)
-- indirect influences
Department of Defense
impacts employment and income
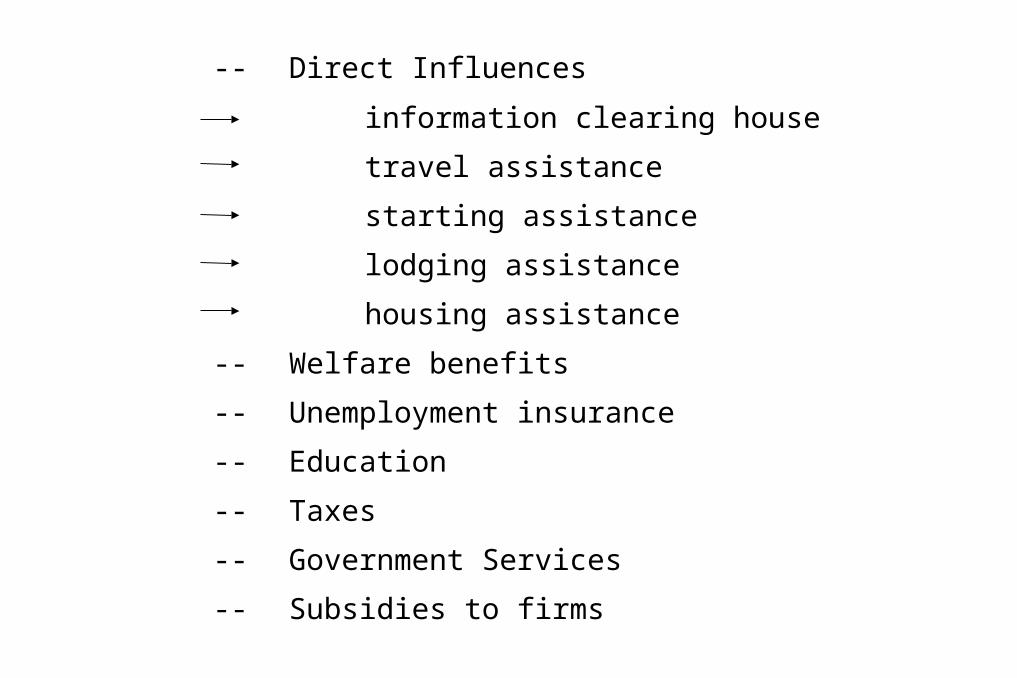
-- Direct Influences
information clearing house
travel assistance
starting assistance
lodging assistance
housing assistance
-- Welfare benefits
-- Unemployment insurance
-- Education
-- Taxes
-- Government Services
-- Subsidies to firms
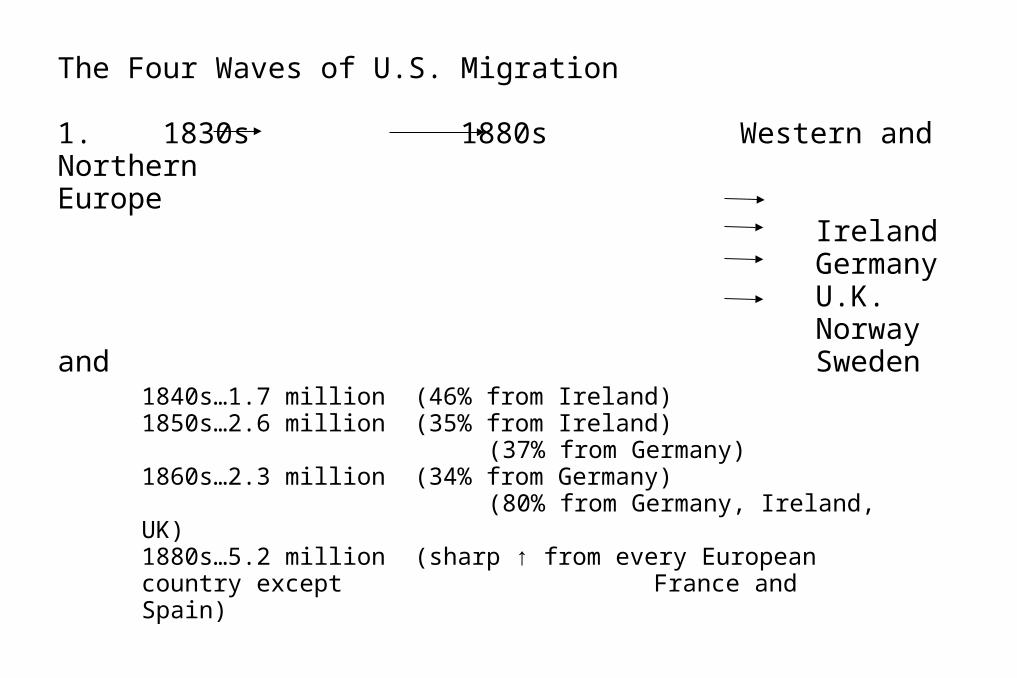
The Four Waves of U.S. Migration
1. 1830s 1880s Western and Northern Europe
IrelandGermanyU.K.Norway and Sweden
1840s…1.7 million (46% from Ireland)1850s…2.6 million (35% from Ireland)
(37% from Germany)1860s…2.3 million (34% from Germany)
(80% from Germany, Ireland, UK)1880s…5.2 million (sharp ↑ from every European country except
France and Spain)
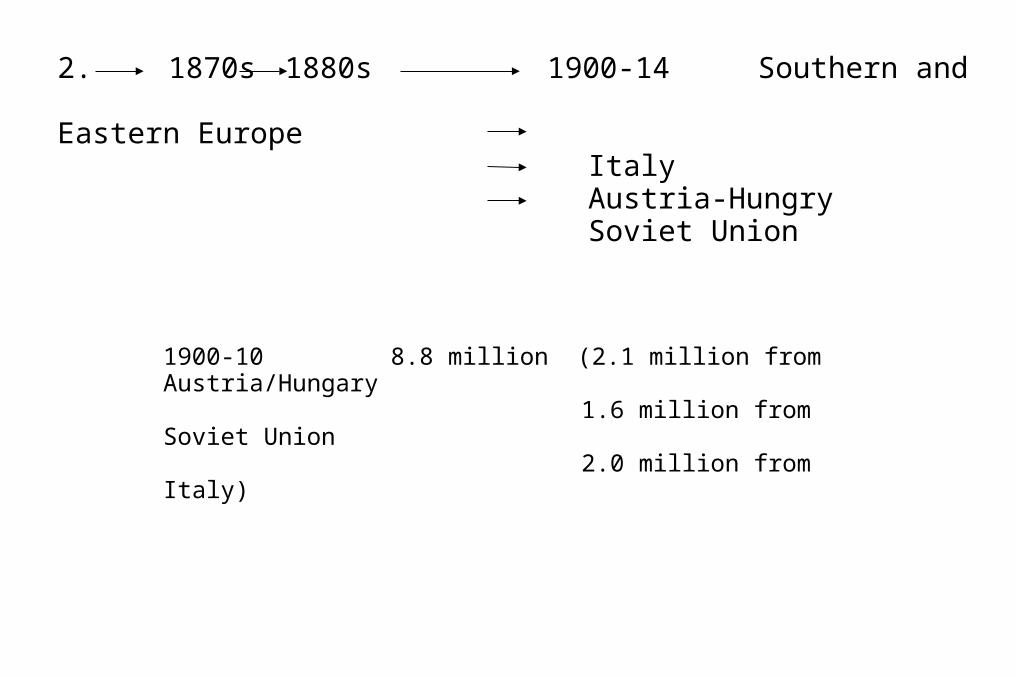
2. 1870s 1880s 1900-14 Southern and Eastern Europe
ItalyAustria-HungrySoviet Union
1900-10 8.8 million (2.1 million from Austria/Hungary 1.6 million from Soviet Union 2.0 million from Italy)
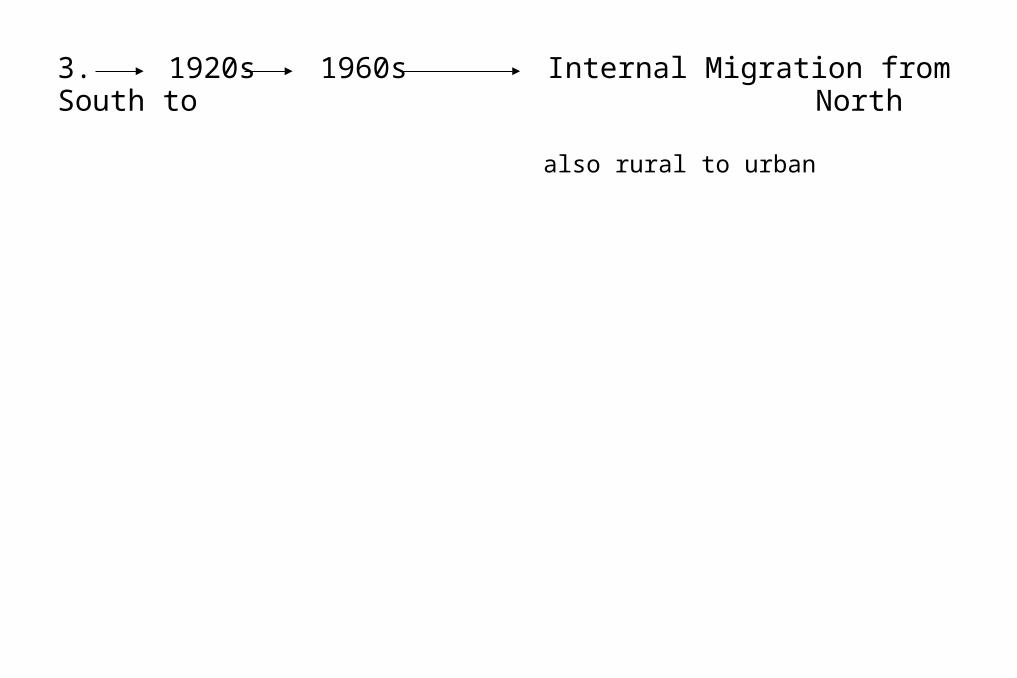
3. 1920s 1960s Internal Migration from South to North
also rural to urban
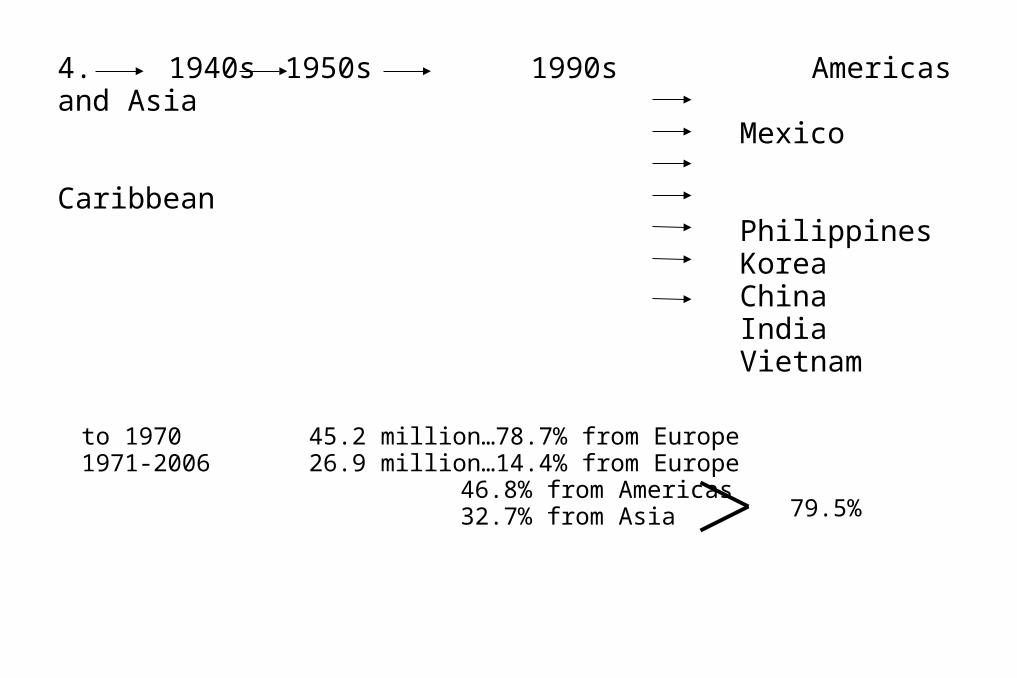
4. 1940s 1950s 1990s Americas and AsiaMexico
CaribbeanPhilippinesKoreaChinaIndiaVietnam
to 1970 45.2 million…78.7% from Europe1971-2006 26.9 million…14.4% from Europe
46.8% from Americas32.7% from Asia 79.5%
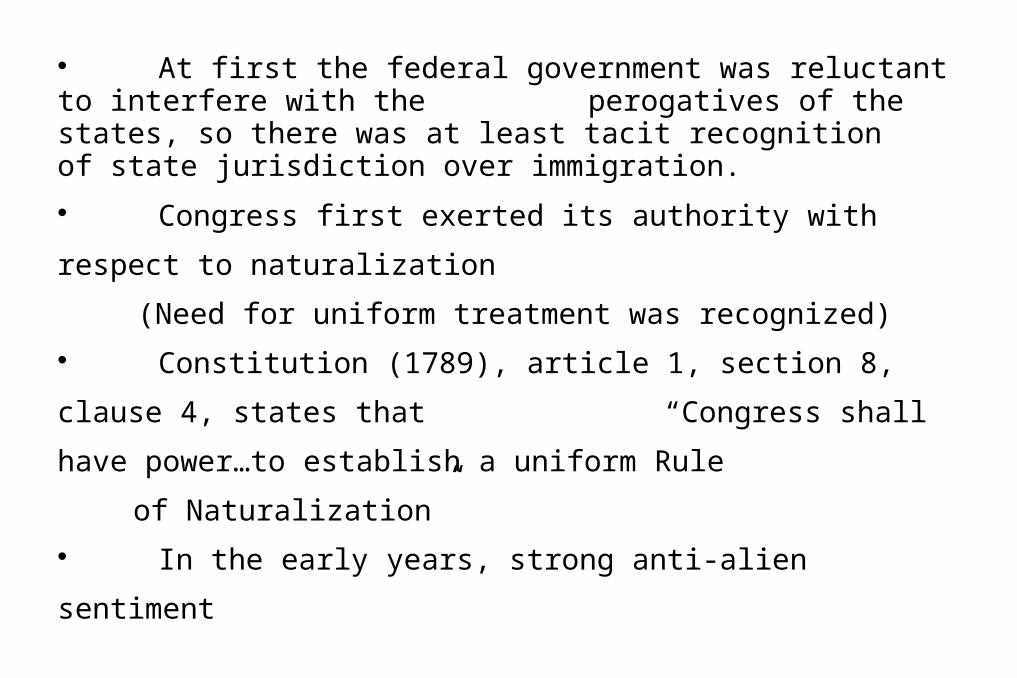
At first the federal government was reluctant to interfere with the perogatives of the states, so there was at least tacit recognition
of state jurisdiction over immigration.
Congress first exerted its authority with respect to naturalization
(Need for uniform treatment was recognized) Constitution (1789), article 1, section 8, clause 4, states that
“Congress shall have power…to establish a uniform Rule
of Naturalization” In the early years, strong anti-alien sentiment
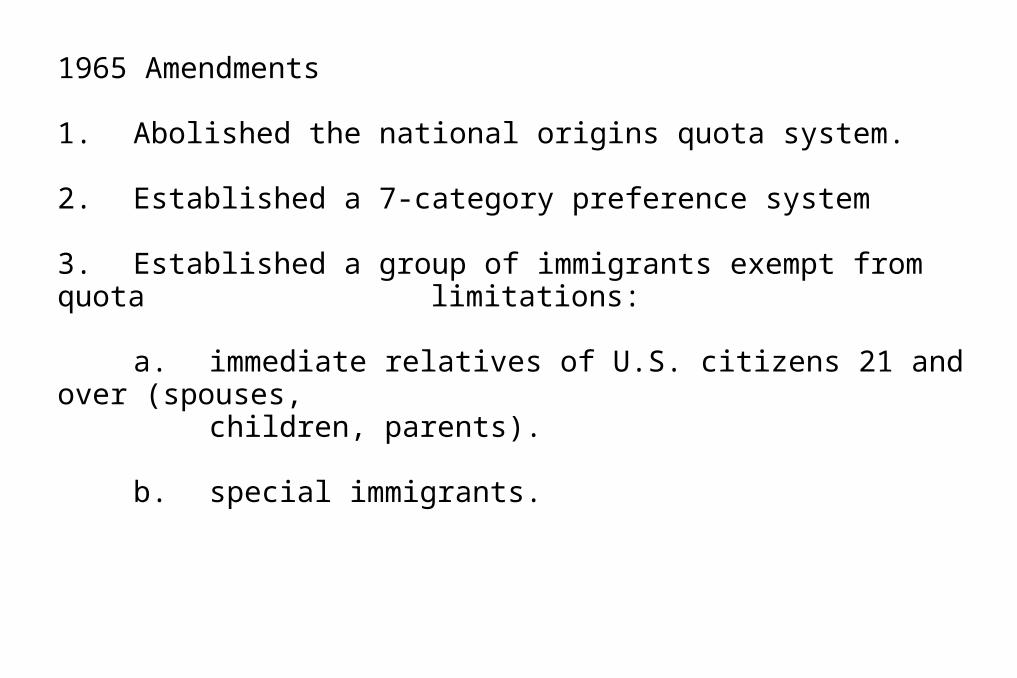
1965 Amendments
1. Abolished the national origins quota system.
2. Established a 7-category preference system
3. Established a group of immigrants exempt from quota limitations:
a. immediate relatives of U.S. citizens 21 and over (spouses,
children, parents).
b. special immigrants.
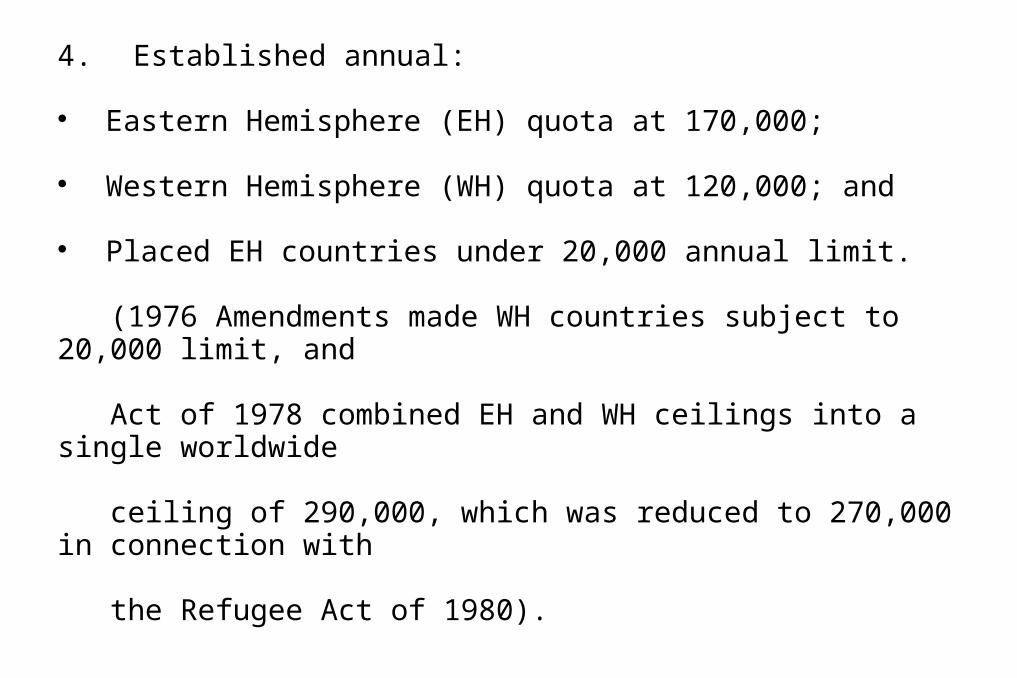
4. Established annual:
Eastern Hemisphere (EH) quota at 170,000;
Western Hemisphere (WH) quota at 120,000; and
Placed EH countries under 20,000 annual limit.
(1976 Amendments made WH countries subject to 20,000 limit, and
Act of 1978 combined EH and WH ceilings into a single worldwide
ceiling of 290,000, which was reduced to 270,000 in connection with
the Refugee Act of 1980).
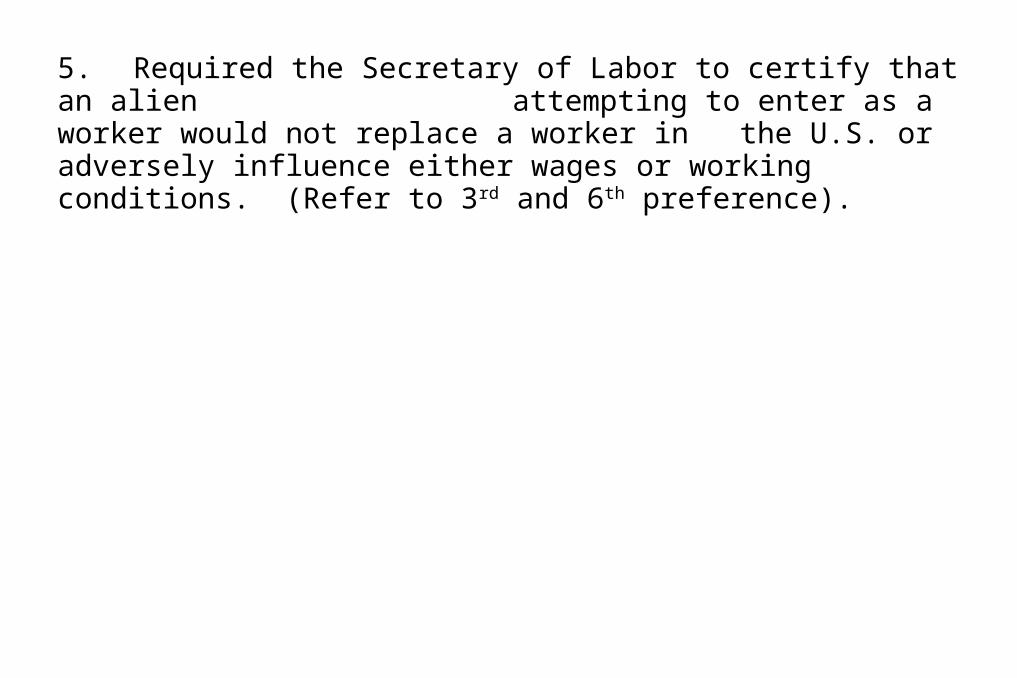
5. Required the Secretary of Labor to certify that an alien attempting to enter as a worker would not replace a worker in the U.S. or adversely influence either wages or working conditions. (Refer to 3rd and 6th preference).
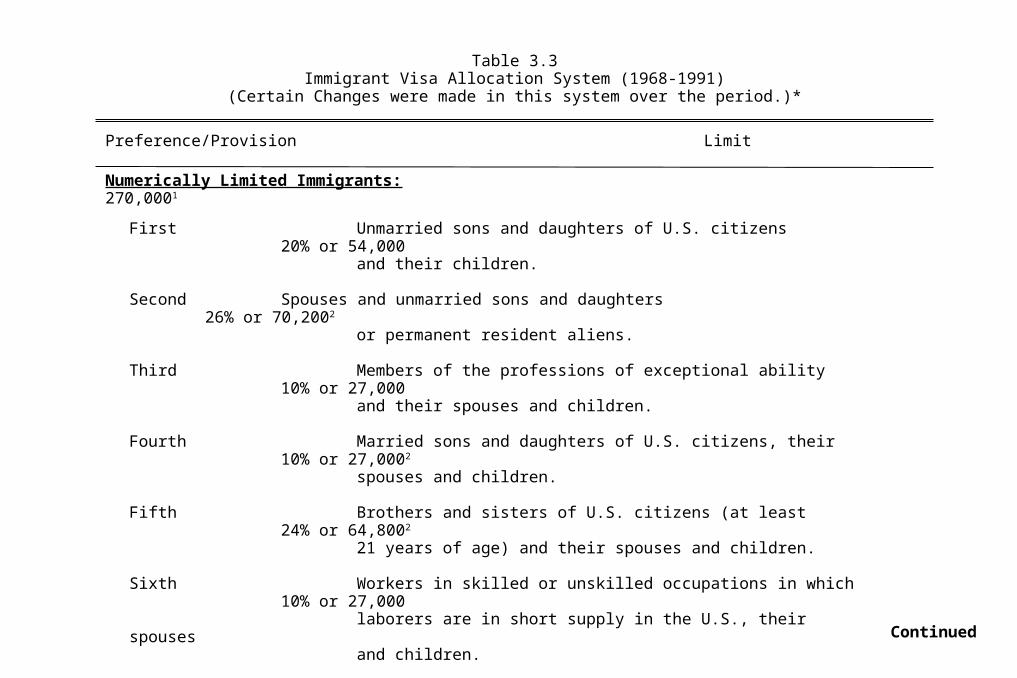
Table 3.3Immigrant Visa Allocation System (1968-1991)
(Certain Changes were made in this system over the period.)*
Preference/Provision Limit
Numerically Limited Immigrants: 270,0001
First Unmarried sons and daughters of U.S. citizens20% or 54,000
and their children.
Second Spouses and unmarried sons and daughters 26% or 70,2002
or permanent resident aliens.
Third Members of the professions of exceptional ability 10% or 27,000
and their spouses and children.
Fourth Married sons and daughters of U.S. citizens, their 10% or 27,0002
spouses and children.
Fifth Brothers and sisters of U.S. citizens (at least24% or 64,8002
21 years of age) and their spouses and children.
Sixth Workers in skilled or unskilled occupations in which 10% or 27,000
laborers are in short supply in the U.S., their spousesand children.
Nonpreference Other qualified applicantsany number not used
above2
Continued
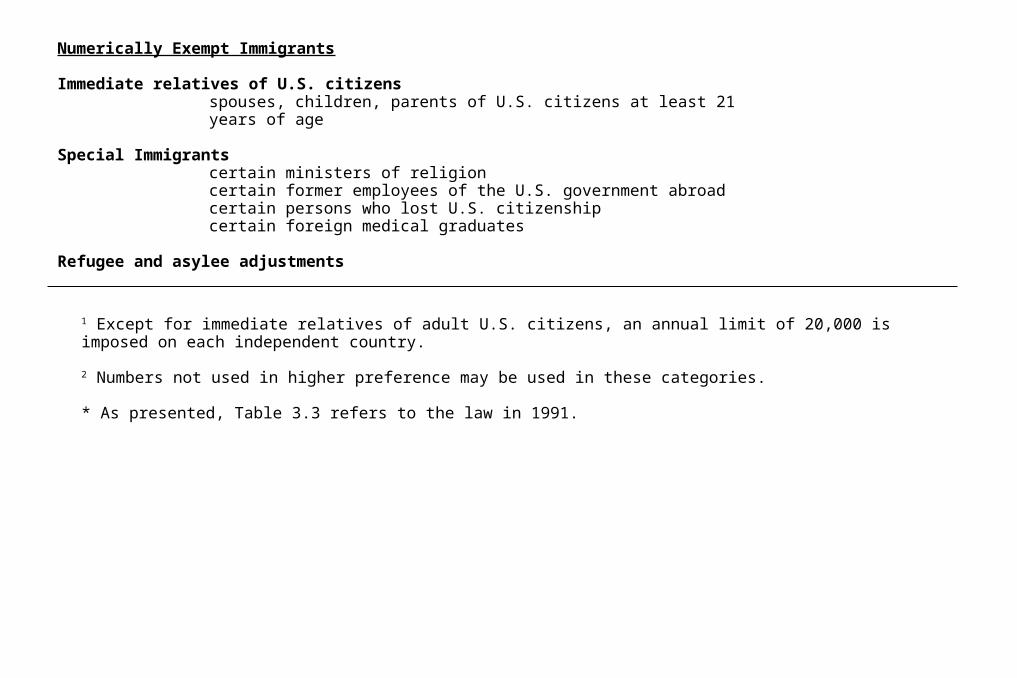
Numerically Exempt Immigrants
Immediate relatives of U.S. citizensspouses, children, parents of U.S. citizens at least 21years of age
Special Immigrantscertain ministers of religioncertain former employees of the U.S. government abroadcertain persons who lost U.S. citizenshipcertain foreign medical graduates
Refugee and asylee adjustments
1 Except for immediate relatives of adult U.S. citizens, an annual limit of 20,000 is imposed on each independent country.
2 Numbers not used in higher preference may be used in these categories.
* As presented, Table 3.3 refers to the law in 1991.
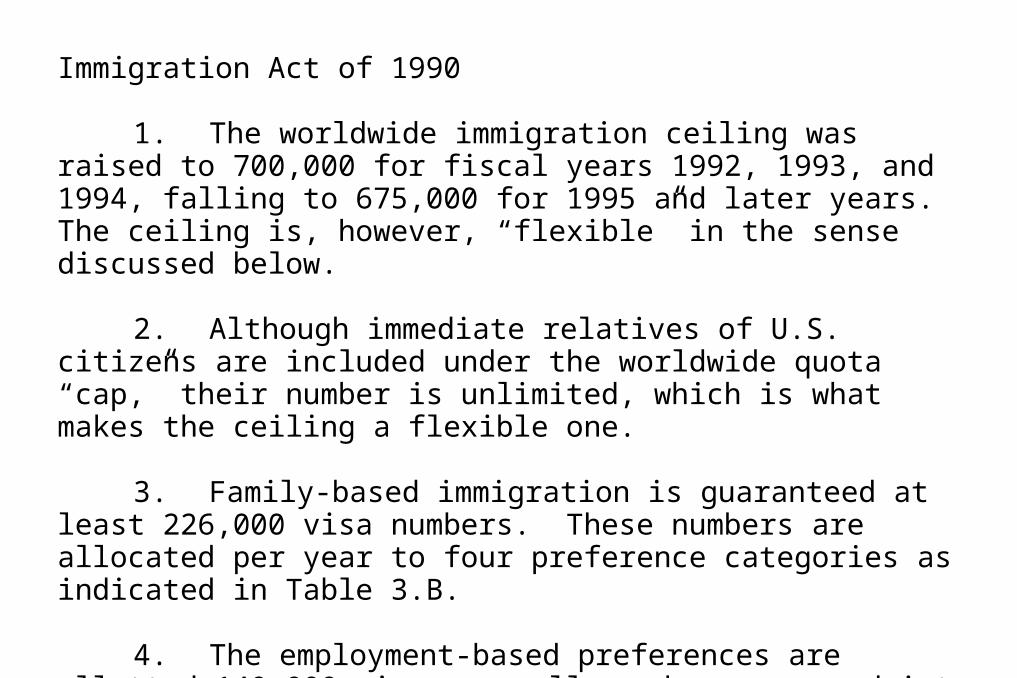
Immigration Act of 1990
1. The worldwide immigration ceiling was raised to 700,000 for fiscal years 1992, 1993, and 1994, falling to 675,000 for 1995 and later years. The ceiling is, however, “flexible” in the sense discussed below.
2. Although immediate relatives of U.S. citizens are included under the worldwide quota “cap,” their number is unlimited, which is what makes the ceiling a flexible one.
3. Family-based immigration is guaranteed at least 226,000 visa numbers. These numbers are allocated per year to four preference categories as indicated in Table 3.B.
4. The employment-based preferences are allotted 140,000 visas annually and are grouped into five preference classes as reported in Table 3.B.
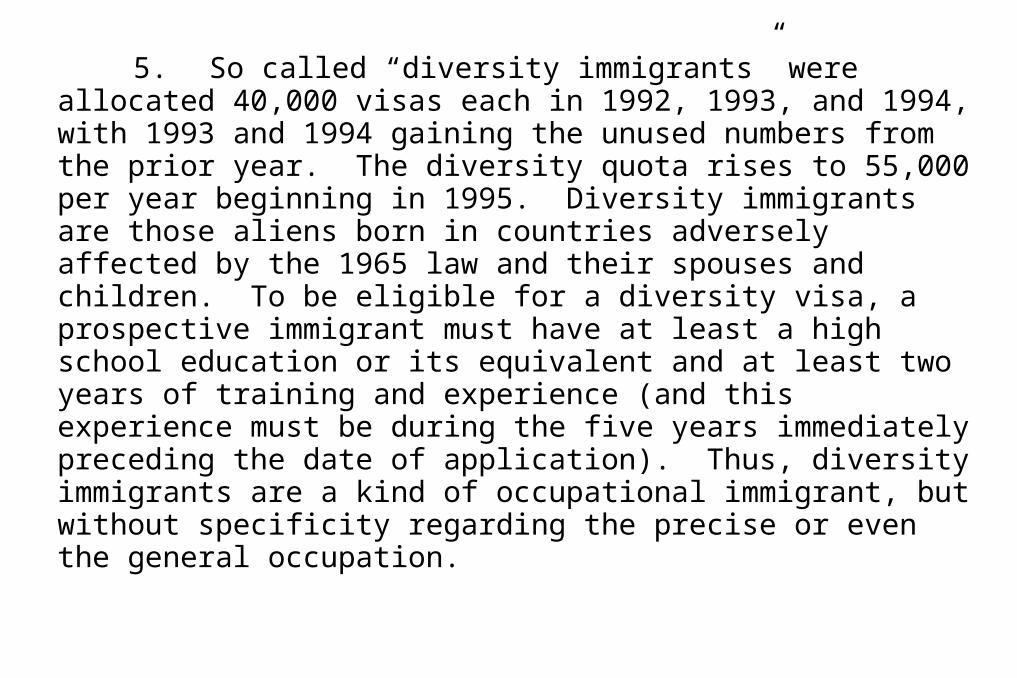
5. So called “diversity immigrants” were allocated 40,000 visas each in 1992, 1993, and 1994, with 1993 and 1994 gaining the unused numbers from the prior year. The diversity quota rises to 55,000 per year beginning in 1995. Diversity immigrants are those aliens born in countries adversely affected by the 1965 law and their spouses and children. To be eligible for a diversity visa, a prospective immigrant must have at least a high school education or its equivalent and at least two years of training and experience (and this experience must be during the five years immediately preceding the date of application). Thus, diversity immigrants are a kind of occupational immigrant, but without specificity regarding the precise or even the general occupation.
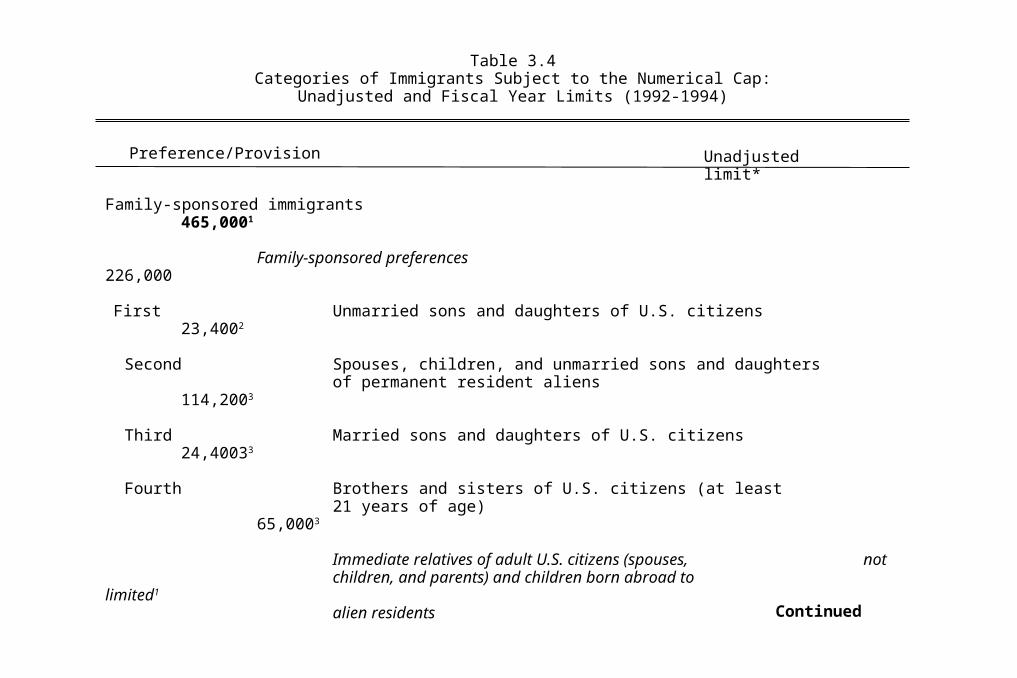
Table 3.4Categories of Immigrants Subject to the Numerical Cap:
Unadjusted and Fiscal Year Limits (1992-1994)
Preference/Provision Unadjusted limit*
Family-sponsored immigrants465,0001
Family-sponsored preferences226,000
First Unmarried sons and daughters of U.S. citizens23,4002
Second Spouses, children, and unmarried sons and daughtersof permanent resident aliens
114,2003
Third Married sons and daughters of U.S. citizens24,40033
Fourth Brothers and sisters of U.S. citizens (at least21 years of age)
65,0003
Immediate relatives of adult U.S. citizens (spouses, notchildren, and parents) and children born abroad to
limited1
alien residents Continued
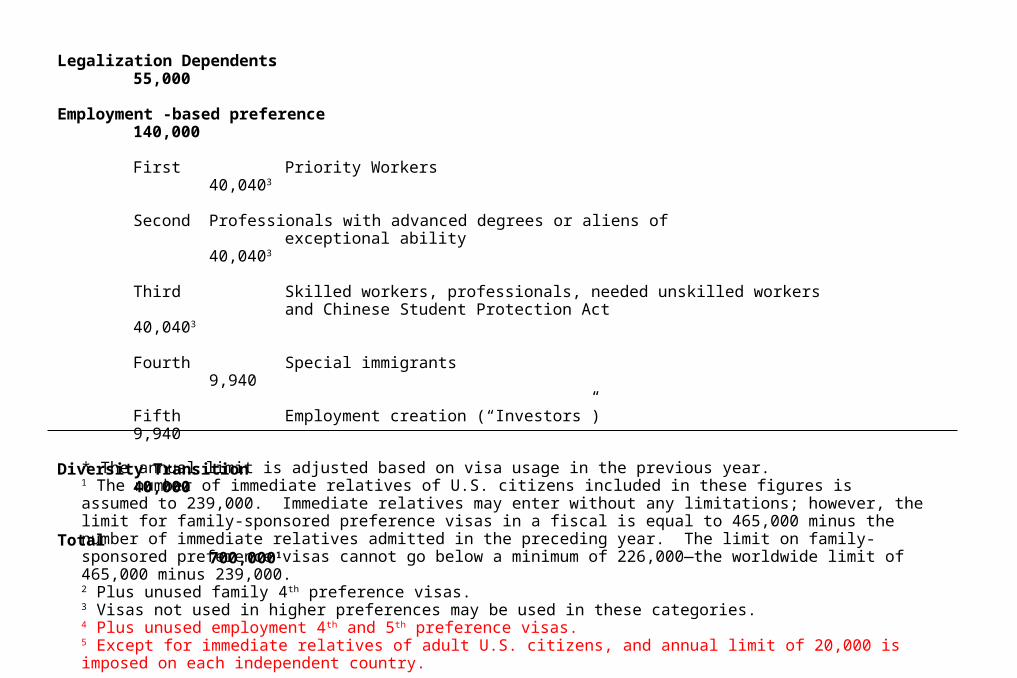
Legalization Dependents55,000
Employment -based preference140,000
First Priority Workers40,0403
Second Professionals with advanced degrees or aliens ofexceptional ability
40,0403
Third Skilled workers, professionals, needed unskilled workersand Chinese Student Protection Act
40,0403
Fourth Special immigrants9,940
Fifth Employment creation (“Investors”)9,940
Diversity Transition40,000
Total700,0001
* The annual limit is adjusted based on visa usage in the previous year.1 The number of immediate relatives of U.S. citizens included in these figures is assumed to 239,000. Immediate relatives may enter without any limitations; however, the limit for family-sponsored preference visas in a fiscal is equal to 465,000 minus the number of immediate relatives admitted in the preceding year. The limit on family-sponsored preference visas cannot go below a minimum of 226,000—the worldwide limit of 465,000 minus 239,000.2 Plus unused family 4th preference visas.3 Visas not used in higher preferences may be used in these categories.4 Plus unused employment 4th and 5th preference visas.5 Except for immediate relatives of adult U.S. citizens, and annual limit of 20,000 is imposed on each independent country.
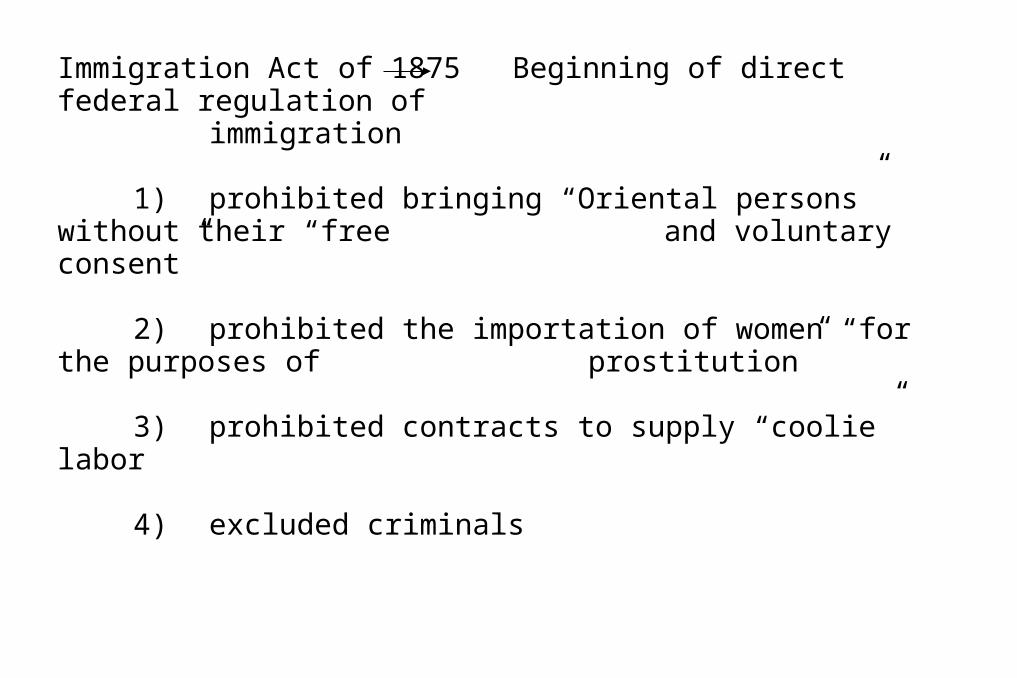
Immigration Act of 1875 Beginning of direct federal regulation of immigration
1) prohibited bringing “Oriental persons” without their “free and voluntary consent”
2) prohibited the importation of women “for the purposes of prostitution”
3) prohibited contracts to supply “coolie” labor
4) excluded criminals
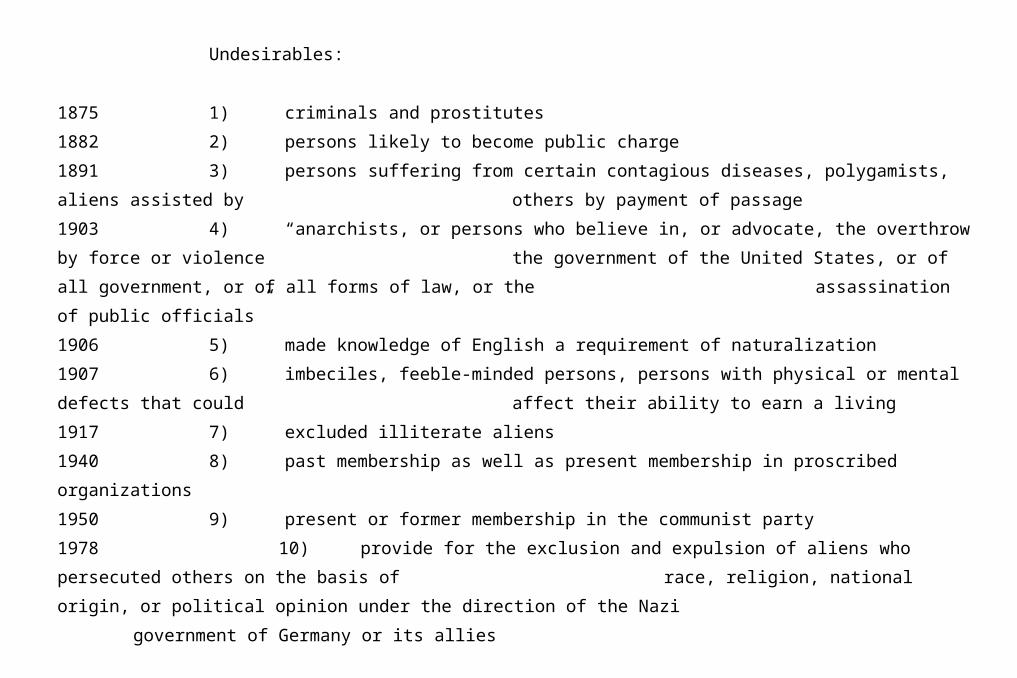
Undesirables:
1875 1) criminals and prostitutes
1882 2) persons likely to become public charge
1891 3) persons suffering from certain contagious diseases, polygamists, aliens assisted by
others by payment of passage
1903 4) “anarchists, or persons who believe in, or advocate, the overthrow by force or violence
the government of the United States, or of all government, or of all forms of law, or the
assassination of public officials”
1906 5) made knowledge of English a requirement of naturalization
1907 6) imbeciles, feeble-minded persons, persons with physical or mental defects that could
affect their ability to earn a living
1917 7) excluded illiterate aliens
1940 8) past membership as well as present membership in proscribed organizations
1950 9) present or former membership in the communist party
1978 10) provide for the exclusion and expulsion of aliens who persecuted others on the basis of
race, religion, national origin, or political opinion under the direction of the Nazi
government of Germany or its allies
by 1990 there were 32 grounds for exclusion
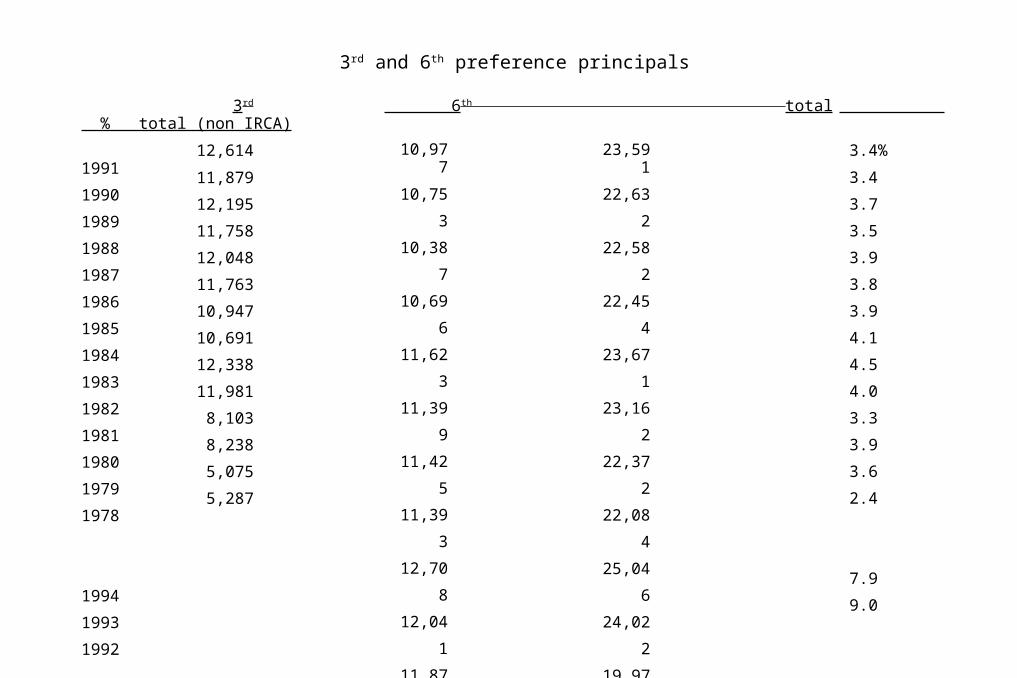
3rd and 6th preference principals
3rd 6th total % total (non IRCA)
1991
1990
1989
1988
1987
1986
1985
1984
1983
1982
1981
1980
1979
1978
1994
1993
1992
12,614
11,879
12,195
11,758
12,048
11,763
10,947
10,691
12,338
11,981
8,103
8,238
5,075
5,287
10,977
10,753
10,387
10,696
11,623
11,399
11,425
11,393
12,708
12,041
11,873
12,599
11,623
8,888
23,591
22,632
22,582
22,454
23,671
23,162
22,372
22,084
25,046
24,022
19,976
20,837
16,698
14,175
62,723
79,226
52,014
3.4%
3.4
3.7
3.5
3.9
3.8
3.9
4.1
4.5
4.0
3.3
3.9
3.6
2.4
7.9
9.0

TableTemporary Workers, Trainees, and
Their Spouses and Children, 1975-1994
Year Workers and trainees Spouses and children Total
1994
1993
1992
1991
1990
1989
1988
1987
1986
1985
1984
1983
1982
1981
2004
2005
2006
185,988
162,976
175,937
168,058
139,587
141,380
113,424
97,337
85,359
74,869
68,730
72,411
52,482
44,770
676,218
726,535
821,006
43,207
39,704
41,292
35,607
28,687
23,947
19,673
16,211
13,710
12,632
10,831
10,781
13,453
10,110
155,497
157,171
164,829
229,195
202,680
217,229
203,665
168,274
165,327
133,097
113,545
99,069
87,501
79,561
83,192
65,935
54,880
831,715
883,706
985,835

References that served as a source for the history of U.S. immigration policy
E. P. Hutchinson, Legislative History of American Immigration Policy, Philadelphia: University of Pennsylvania Press, 1981.
G. Jasso and M. R. Rosenzweig, The New Chosen People: Immigrants in the United States, New York: Russell Sage Foundation, 1984.