united states securities and ... - about hsbc | hsbc usa
TRANSCRIPT
UNITED STATES SECURITIES AND EXCHANGE COMMISSION
Washington, D.C. 20549
FORM 10-Q (Mark One)
☒ QUARTERLY REPORT PURSUANT TO SECTION 13 OR 15(d) OF THE SECURITIES EXCHANGE ACT OF 1934
For the quarterly period ended March 31, 2021OR
☐ TRANSITION REPORT PURSUANT TO SECTION 13 OR 15(d) OF THE SECURITIES EXCHANGE ACT OF 1934
For the transition period from to Commission file number 001-07436
HSBC USA Inc.(Exact name of registrant as specified in its charter)
Maryland 13-2764867(State of incorporation) (I.R.S. Employer Identification No.)
452 Fifth Avenue, New York, New York 10018(Address of principal executive offices) (Zip Code)
Registrant's telephone number, including area code (212) 525-5000Securities registered pursuant to Section 12(b) of the Act:
Title of Each Class Trading Symbol(s) Name of Each Exchange on Which Registered$100,000,000 Zero Coupon Callable Accreting Notes due January 15, 2043 HBA/43 New York Stock Exchange$50,000,000 Zero Coupon Callable Accreting Notes due January 29, 2043 HBA/43A New York Stock Exchange
Indicate by check mark whether the registrant (1) has filed all reports required to be filed by Section 13 or 15(d) of the Securities Exchange Act of 1934 during the preceding 12 months (or for such shorter period that the registrant was required to file such reports), and (2) has been subject to such filing requirements for the past 90 days. Yes ☒ No ☐
Indicate by check mark whether the registrant has submitted electronically every Interactive Data File required to be submitted pursuant to Rule 405 of Regulation S-T during the preceding 12 months (or for such shorter period that the registrant was required to submit such files). Yes ☒ No ☐
Indicate by check mark whether the registrant is a large accelerated filer, an accelerated filer, a non-accelerated filer, smaller reporting company, or an emerging growth company. See the definitions of "large accelerated filer," "accelerated filer," "smaller reporting company," and "emerging growth company" in Rule 12b-2 of the Exchange Act. (Check one):
Large accelerated filer ☐ Accelerated filer ☐ Non-accelerated filer ☒ Smaller reporting company ☐ Emerging growth company ☐
If an emerging growth company, indicate by check mark if the registrant has elected not to use the extended transition period for complying with any new or revised financial accounting standards provided pursuant to Section 13(a) of the Exchange Act. ☐
Indicate by check mark whether the registrant is a shell company (as defined in Rule 12b-2 of the Exchange Act). Yes ☐ No ☒As of April 23, 2021, there were 714 shares of the registrant's common stock outstanding, all of which are owned by HSBC North America Holdings Inc.
TABLE OF CONTENTS
Part I Page Item 1. Financial Statements (Unaudited):
Consolidated Statement of Income (Loss)............................................................................................... 3Consolidated Statement of Comprehensive Loss.................................................................................... 4Consolidated Balance Sheet.................................................................................................................... 5Consolidated Statement of Changes in Equity........................................................................................ 7Consolidated Statement of Cash Flows................................................................................................... 8Notes to the Consolidated Financial Statements..................................................................................... 9
Item 2. Management's Discussion and Analysis of Financial Condition and Results of Operations:Forward-Looking Statements.................................................................................................................. 72Executive Overview................................................................................................................................ 74Basis of Reporting................................................................................................................................... 79Balance Sheet Review............................................................................................................................. 80Results of Operations............................................................................................................................... 85Segment Results - Group Reporting Basis.............................................................................................. 90Credit Quality.......................................................................................................................................... 95Liquidity and Capital Resources.............................................................................................................. 103Off-Balance Sheet Arrangements, Credit Derivatives and Other Contractual Obligations.................... 107Fair Value................................................................................................................................................ 107Risk Management.................................................................................................................................... 109Consolidated Average Balances and Interest Rates................................................................................. 115
Item 3. Quantitative and Qualitative Disclosures about Market Risk.................................................................... 116Item 4. Controls and Procedures............................................................................................................................. 116Part II Item 1. Legal Proceedings...................................................................................................................................... 116Item 5. Other Information....................................................................................................................................... 116Item 6. Exhibits....................................................................................................................................................... 118Signatures........................................................................................................................................................................... 119
Part/Item No.
HSBC USA Inc.
2
PART I
Item 1. Financial Statements
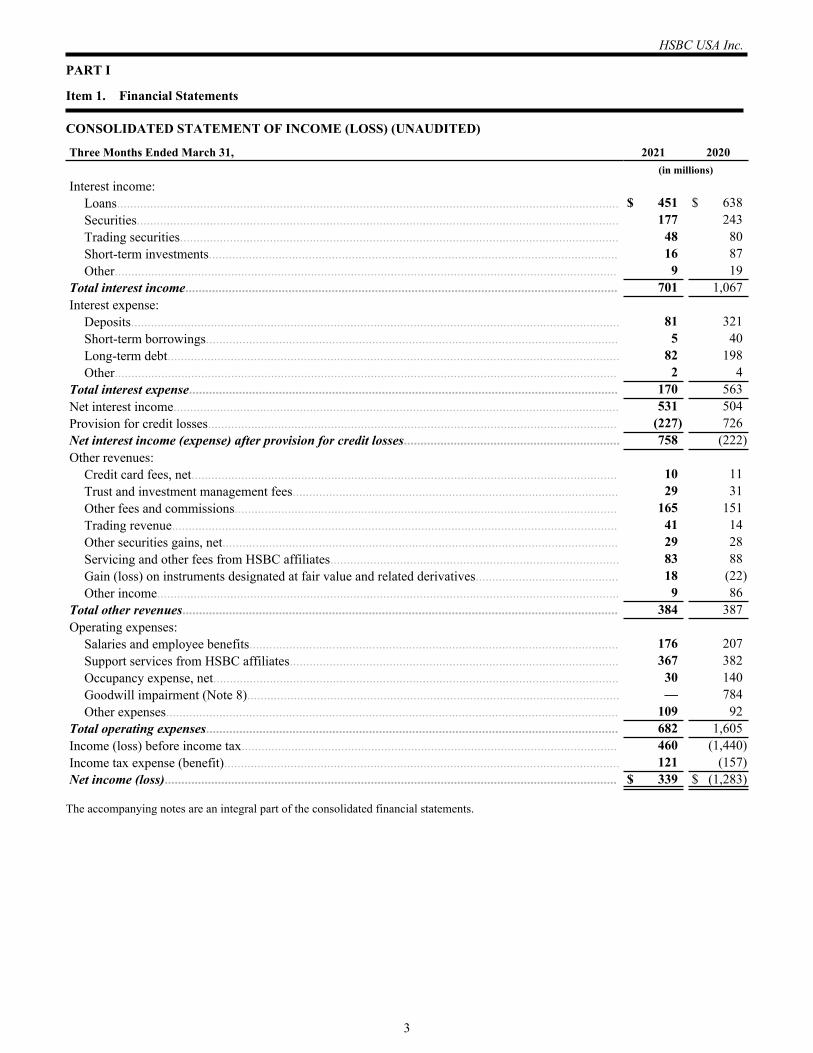
CONSOLIDATED STATEMENT OF INCOME (LOSS) (UNAUDITED)
Three Months Ended March 31, 2021 2020 (in millions)Interest income:
Loans....................................................................................................................................................... $ 451 $ 638 Securities................................................................................................................................................. 177 243 Trading securities.................................................................................................................................... 48 80 Short-term investments........................................................................................................................... 16 87 Other....................................................................................................................................................... 9 19
Total interest income.................................................................................................................................. 701 1,067 Interest expense:
Deposits................................................................................................................................................... 81 321 Short-term borrowings............................................................................................................................ 5 40 Long-term debt........................................................................................................................................ 82 198 Other....................................................................................................................................................... 2 4
Total interest expense................................................................................................................................. 170 563 Net interest income...................................................................................................................................... 531 504 Provision for credit losses........................................................................................................................... (227) 726 Net interest income (expense) after provision for credit losses................................................................. 758 (222) Other revenues:
Credit card fees, net................................................................................................................................ 10 11 Trust and investment management fees.................................................................................................. 29 31 Other fees and commissions................................................................................................................... 165 151 Trading revenue...................................................................................................................................... 41 14 Other securities gains, net....................................................................................................................... 29 28 Servicing and other fees from HSBC affiliates....................................................................................... 83 88 Gain (loss) on instruments designated at fair value and related derivatives........................................... 18 (22) Other income........................................................................................................................................... 9 86
Total other revenues................................................................................................................................... 384 387 Operating expenses:
Salaries and employee benefits............................................................................................................... 176 207 Support services from HSBC affiliates................................................................................................... 367 382 Occupancy expense, net.......................................................................................................................... 30 140 Goodwill impairment (Note 8)................................................................................................................ — 784 Other expenses........................................................................................................................................ 109 92
Total operating expenses............................................................................................................................ 682 1,605 Income (loss) before income tax................................................................................................................. 460 (1,440) Income tax expense (benefit)....................................................................................................................... 121 (157) Net income (loss)........................................................................................................................................ $ 339 $ (1,283)
The accompanying notes are an integral part of the consolidated financial statements.
HSBC USA Inc.
3
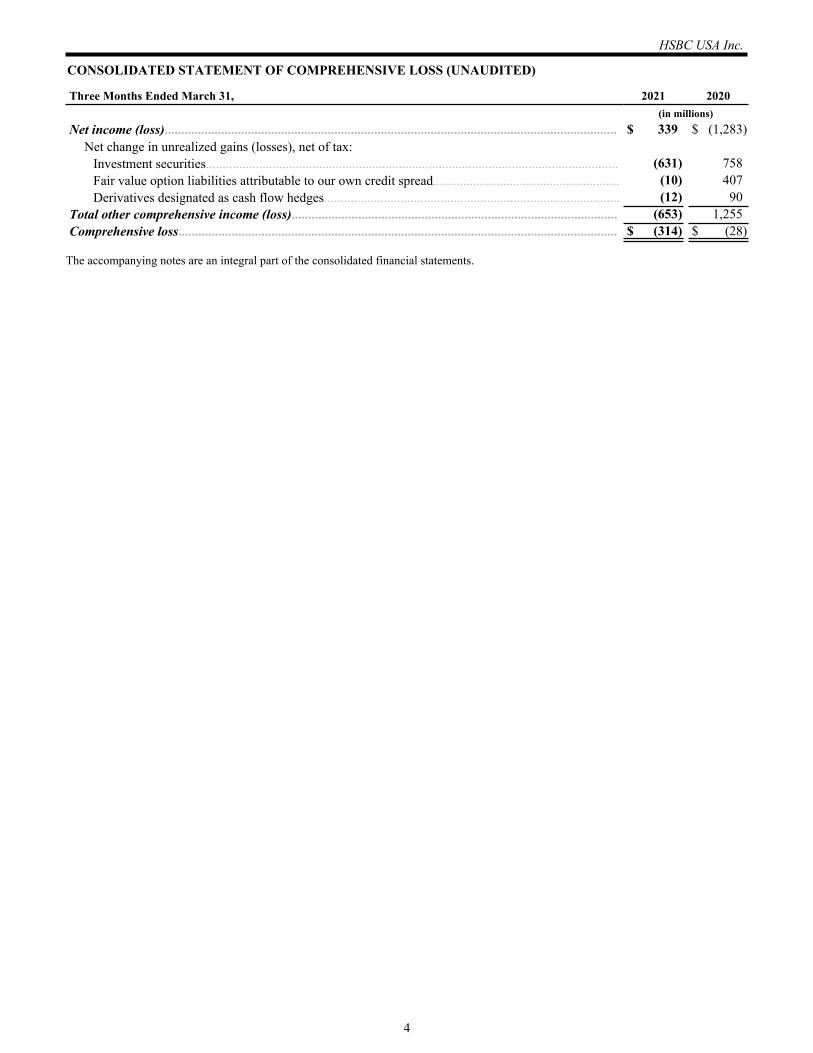
CONSOLIDATED STATEMENT OF COMPREHENSIVE LOSS (UNAUDITED)
Three Months Ended March 31, 2021 2020 (in millions)Net income (loss)........................................................................................................................................ $ 339 $ (1,283)
Net change in unrealized gains (losses), net of tax:Investment securities............................................................................................................................ (631) 758 Fair value option liabilities attributable to our own credit spread........................................................ (10) 407 Derivatives designated as cash flow hedges......................................................................................... (12) 90
Total other comprehensive income (loss).................................................................................................. (653) 1,255 Comprehensive loss.................................................................................................................................... $ (314) $ (28)
The accompanying notes are an integral part of the consolidated financial statements.
HSBC USA Inc.
4
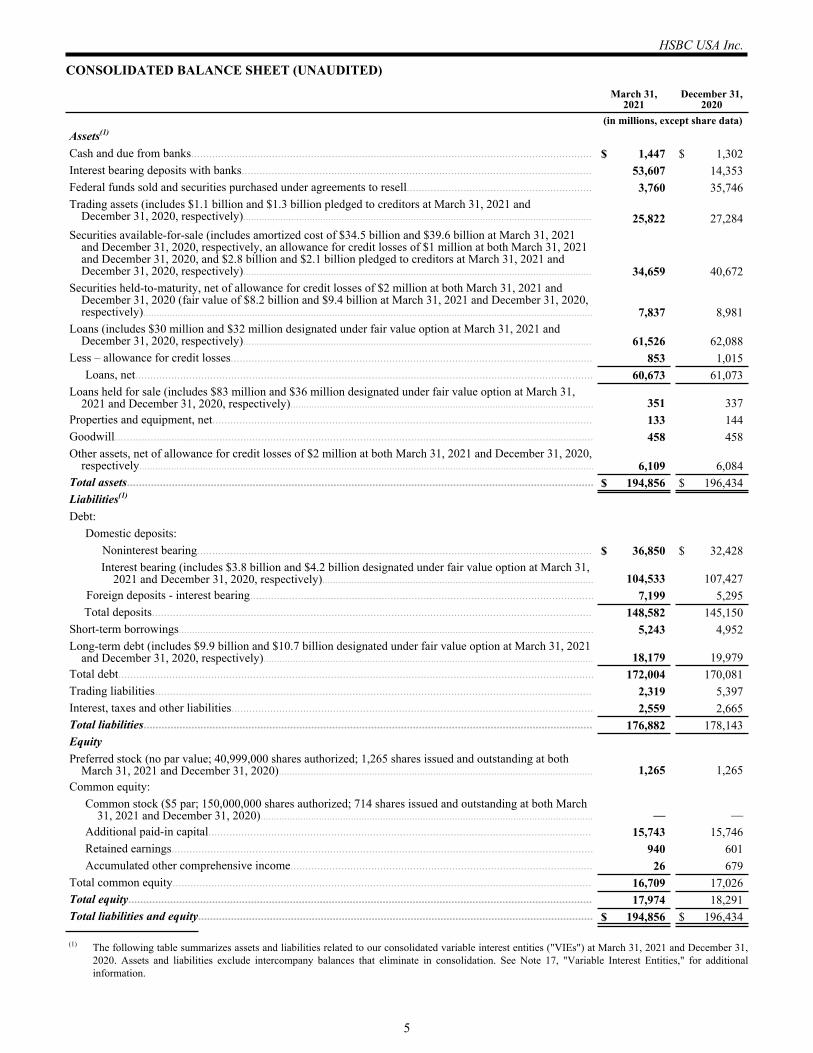
CONSOLIDATED BALANCE SHEET (UNAUDITED)
March 31, 2021
December 31, 2020
(in millions, except share data)Assets(1)
Cash and due from banks...................................................................................................................................... $ 1,447 $ 1,302 Interest bearing deposits with banks..................................................................................................................... 53,607 14,353 Federal funds sold and securities purchased under agreements to resell.............................................................. 3,760 35,746 Trading assets (includes $1.1 billion and $1.3 billion pledged to creditors at March 31, 2021 and
December 31, 2020, respectively)................................................................................................................................... 25,822 27,284 Securities available-for-sale (includes amortized cost of $34.5 billion and $39.6 billion at March 31, 2021
and December 31, 2020, respectively, an allowance for credit losses of $1 million at both March 31, 2021 and December 31, 2020, and $2.8 billion and $2.1 billion pledged to creditors at March 31, 2021 and December 31, 2020, respectively)................................................................................................................................... 34,659 40,672
Securities held-to-maturity, net of allowance for credit losses of $2 million at both March 31, 2021 and December 31, 2020 (fair value of $8.2 billion and $9.4 billion at March 31, 2021 and December 31, 2020, respectively)......................................................................................................................................................................... 7,837 8,981
Loans (includes $30 million and $32 million designated under fair value option at March 31, 2021 and December 31, 2020, respectively)................................................................................................................................... 61,526 62,088
Less – allowance for credit losses......................................................................................................................... 853 1,015 Loans, net......................................................................................................................................................... 60,673 61,073
Loans held for sale (includes $83 million and $36 million designated under fair value option at March 31, 2021 and December 31, 2020, respectively).................................................................................................................. 351 337
Properties and equipment, net............................................................................................................................... 133 144 Goodwill................................................................................................................................................................ 458 458 Other assets, net of allowance for credit losses of $2 million at both March 31, 2021 and December 31, 2020,
respectively........................................................................................................................................................................... 6,109 6,084 Total assets............................................................................................................................................................ $ 194,856 $ 196,434 Liabilities(1)
Debt:Domestic deposits:
Noninterest bearing.................................................................................................................................... $ 36,850 $ 32,428 Interest bearing (includes $3.8 billion and $4.2 billion designated under fair value option at March 31,
2021 and December 31, 2020, respectively)...................................................................................................... 104,533 107,427 Foreign deposits - interest bearing................................................................................................................... 7,199 5,295 Total deposits................................................................................................................................................... 148,582 145,150
Short-term borrowings............................................................................................................................................................ 5,243 4,952 Long-term debt (includes $9.9 billion and $10.7 billion designated under fair value option at March 31, 2021
and December 31, 2020, respectively)............................................................................................................................ 18,179 19,979 Total debt............................................................................................................................................................... 172,004 170,081 Trading liabilities.................................................................................................................................................. 2,319 5,397 Interest, taxes and other liabilities......................................................................................................................... 2,559 2,665 Total liabilities...................................................................................................................................................... 176,882 178,143 EquityPreferred stock (no par value; 40,999,000 shares authorized; 1,265 shares issued and outstanding at both
March 31, 2021 and December 31, 2020)...................................................................................................................... 1,265 1,265 Common equity:
Common stock ($5 par; 150,000,000 shares authorized; 714 shares issued and outstanding at both March 31, 2021 and December 31, 2020)............................................................................................................................. — —
Additional paid-in capital................................................................................................................................ 15,743 15,746 Retained earnings............................................................................................................................................. 940 601 Accumulated other comprehensive income..................................................................................................... 26 679
Total common equity............................................................................................................................................ 16,709 17,026 Total equity........................................................................................................................................................... 17,974 18,291 Total liabilities and equity.................................................................................................................................... $ 194,856 $ 196,434
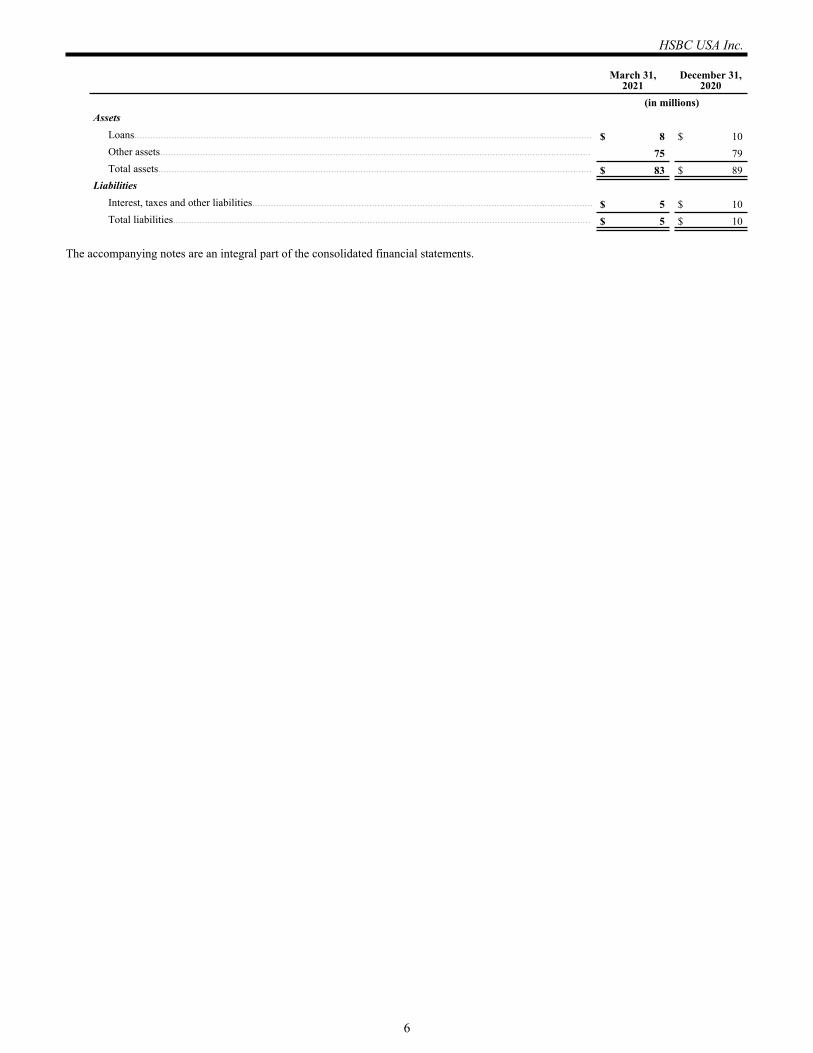
(1) The following table summarizes assets and liabilities related to our consolidated variable interest entities ("VIEs") at March 31, 2021 and December 31, 2020. Assets and liabilities exclude intercompany balances that eliminate in consolidation. See Note 17, "Variable Interest Entities," for additional information.
HSBC USA Inc.
5
March 31, 2021
December 31, 2020
(in millions)Assets
Loans............................................................................................................................................................................ $ 8 $ 10 Other assets.................................................................................................................................................................. 75 79 Total assets................................................................................................................................................................... $ 83 $ 89
LiabilitiesInterest, taxes and other liabilities................................................................................................................................ $ 5 $ 10 Total liabilities............................................................................................................................................................. $ 5 $ 10
The accompanying notes are an integral part of the consolidated financial statements.
HSBC USA Inc.
6
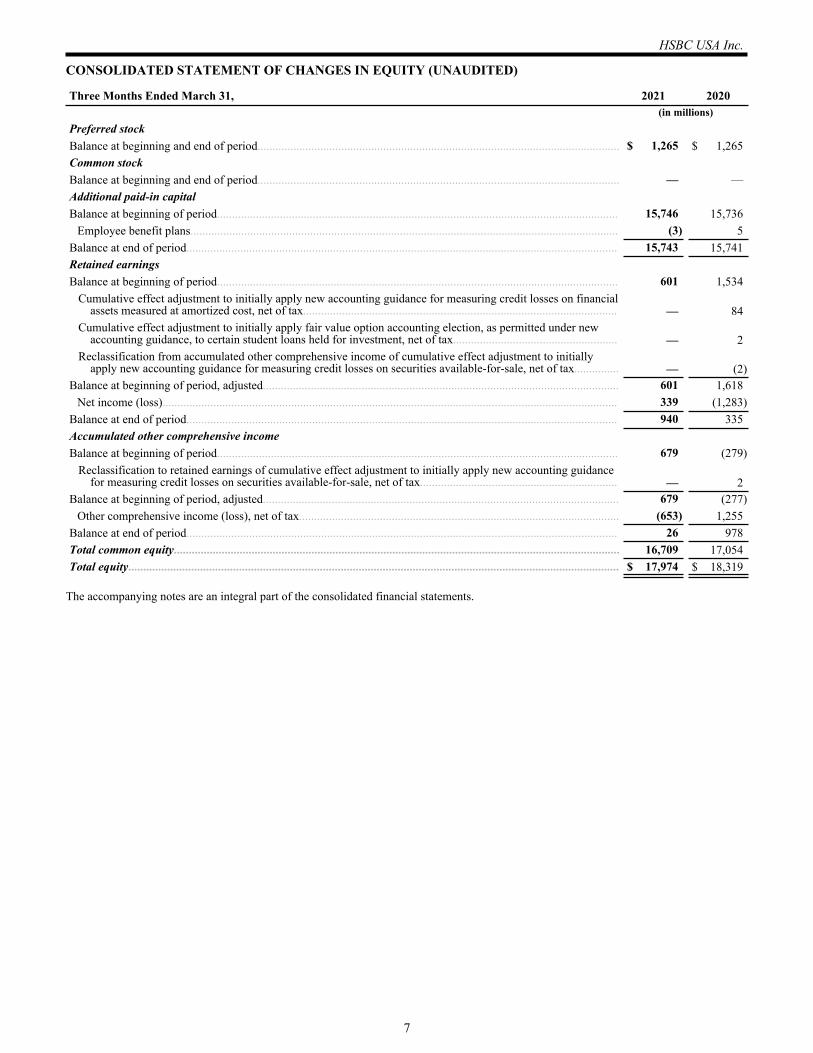
CONSOLIDATED STATEMENT OF CHANGES IN EQUITY (UNAUDITED)
Three Months Ended March 31, 2021 2020 (in millions)Preferred stockBalance at beginning and end of period......................................................................................................................... $ 1,265 $ 1,265 Common stockBalance at beginning and end of period......................................................................................................................... — — Additional paid-in capitalBalance at beginning of period...................................................................................................................................... 15,746 15,736
Employee benefit plans............................................................................................................................................... (3) 5 Balance at end of period................................................................................................................................................ 15,743 15,741 Retained earningsBalance at beginning of period...................................................................................................................................... 601 1,534
Cumulative effect adjustment to initially apply new accounting guidance for measuring credit losses on financial assets measured at amortized cost, net of tax......................................................................................................... — 84
Cumulative effect adjustment to initially apply fair value option accounting election, as permitted under new accounting guidance, to certain student loans held for investment, net of tax....................................................... — 2
Reclassification from accumulated other comprehensive income of cumulative effect adjustment to initially apply new accounting guidance for measuring credit losses on securities available-for-sale, net of tax............... — (2)
Balance at beginning of period, adjusted....................................................................................................................... 601 1,618 Net income (loss)........................................................................................................................................................ 339 (1,283)
Balance at end of period................................................................................................................................................ 940 335 Accumulated other comprehensive incomeBalance at beginning of period...................................................................................................................................... 679 (279)
Reclassification to retained earnings of cumulative effect adjustment to initially apply new accounting guidance for measuring credit losses on securities available-for-sale, net of tax.................................................................. — 2
Balance at beginning of period, adjusted....................................................................................................................... 679 (277) Other comprehensive income (loss), net of tax........................................................................................................... (653) 1,255
Balance at end of period................................................................................................................................................ 26 978 Total common equity..................................................................................................................................................... 16,709 17,054 Total equity.................................................................................................................................................................... $ 17,974 $ 18,319
The accompanying notes are an integral part of the consolidated financial statements.
HSBC USA Inc.
7
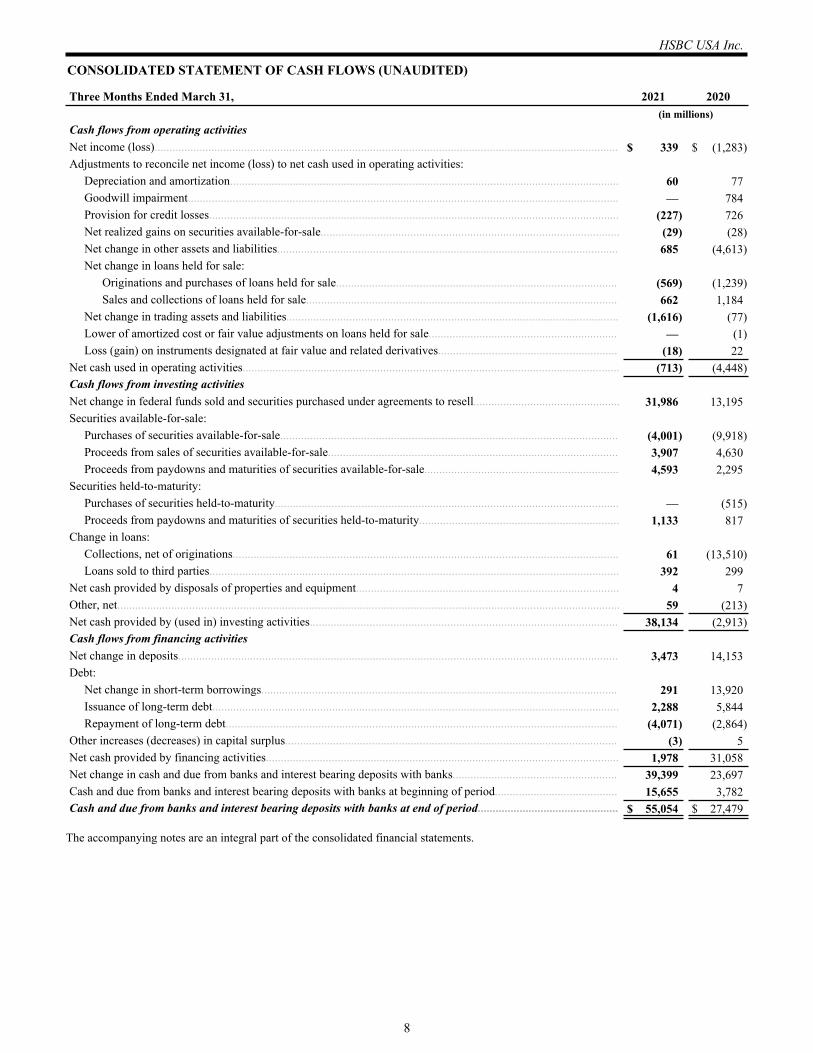
CONSOLIDATED STATEMENT OF CASH FLOWS (UNAUDITED)
Three Months Ended March 31, 2021 2020 (in millions)Cash flows from operating activitiesNet income (loss)........................................................................................................................................................... $ 339 $ (1,283) Adjustments to reconcile net income (loss) to net cash used in operating activities:
Depreciation and amortization.................................................................................................................................. 60 77 Goodwill impairment................................................................................................................................................ — 784 Provision for credit losses......................................................................................................................................... (227) 726 Net realized gains on securities available-for-sale.................................................................................................... (29) (28) Net change in other assets and liabilities.................................................................................................................. 685 (4,613) Net change in loans held for sale:
Originations and purchases of loans held for sale.............................................................................................. (569) (1,239) Sales and collections of loans held for sale........................................................................................................ 662 1,184
Net change in trading assets and liabilities............................................................................................................... (1,616) (77) Lower of amortized cost or fair value adjustments on loans held for sale............................................................... — (1) Loss (gain) on instruments designated at fair value and related derivatives............................................................ (18) 22
Net cash used in operating activities.............................................................................................................................. (713) (4,448) Cash flows from investing activitiesNet change in federal funds sold and securities purchased under agreements to resell................................................. 31,986 13,195 Securities available-for-sale:
Purchases of securities available-for-sale................................................................................................................. (4,001) (9,918) Proceeds from sales of securities available-for-sale................................................................................................. 3,907 4,630 Proceeds from paydowns and maturities of securities available-for-sale................................................................. 4,593 2,295
Securities held-to-maturity:Purchases of securities held-to-maturity................................................................................................................... — (515) Proceeds from paydowns and maturities of securities held-to-maturity................................................................... 1,133 817
Change in loans:Collections, net of originations................................................................................................................................. 61 (13,510) Loans sold to third parties......................................................................................................................................... 392 299
Net cash provided by disposals of properties and equipment........................................................................................ 4 7 Other, net........................................................................................................................................................................ 59 (213) Net cash provided by (used in) investing activities....................................................................................................... 38,134 (2,913) Cash flows from financing activitiesNet change in deposits................................................................................................................................................... 3,473 14,153 Debt:
Net change in short-term borrowings....................................................................................................................... 291 13,920 Issuance of long-term debt........................................................................................................................................ 2,288 5,844 Repayment of long-term debt................................................................................................................................... (4,071) (2,864)
Other increases (decreases) in capital surplus............................................................................................................... (3) 5 Net cash provided by financing activities...................................................................................................................... 1,978 31,058 Net change in cash and due from banks and interest bearing deposits with banks....................................................... 39,399 23,697 Cash and due from banks and interest bearing deposits with banks at beginning of period......................................... 15,655 3,782 Cash and due from banks and interest bearing deposits with banks at end of period............................................... $ 55,054 $ 27,479
The accompanying notes are an integral part of the consolidated financial statements.
HSBC USA Inc.
8
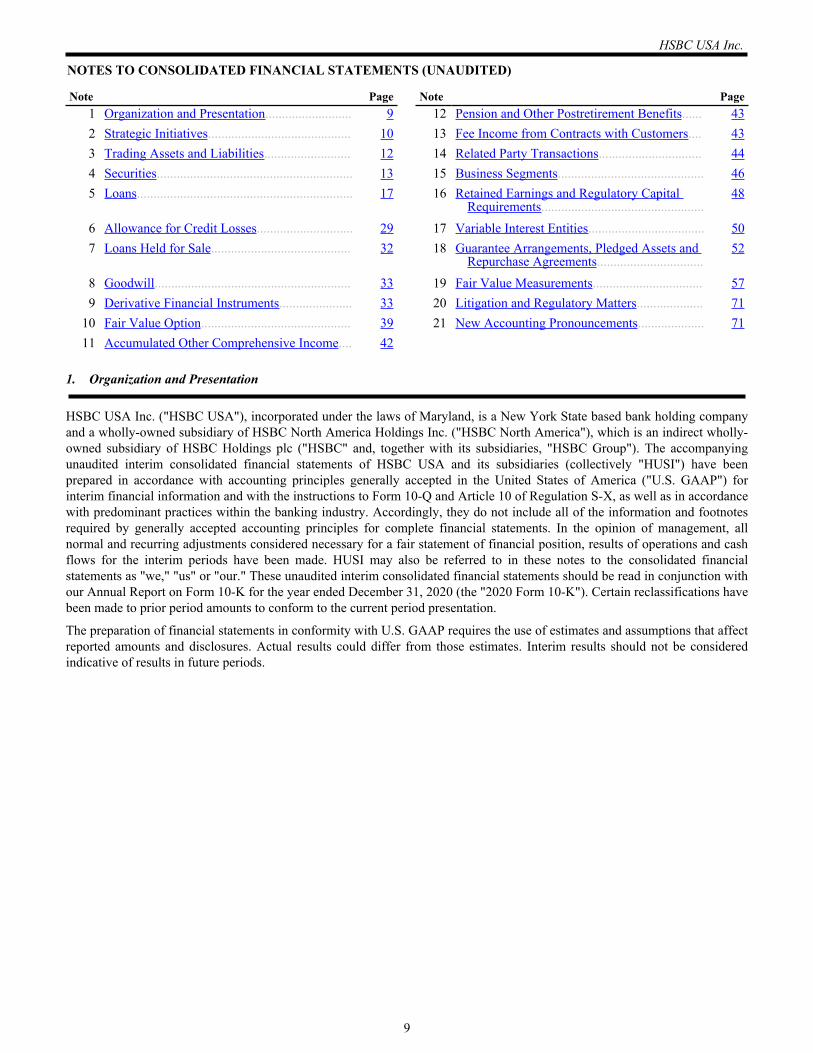
NOTES TO CONSOLIDATED FINANCIAL STATEMENTS (UNAUDITED)
Note Page Note Page 1 Organization and Presentation.......................... 9 12 Pension and Other Postretirement Benefits...... 43 2 Strategic Initiatives........................................... 10 13 Fee Income from Contracts with Customers.... 43 3 Trading Assets and Liabilities.......................... 12 14 Related Party Transactions............................... 44 4 Securities........................................................... 13 15 Business Segments............................................ 46 5 Loans................................................................. 17 16 Retained Earnings and Regulatory Capital
Requirements.................................................48
6 Allowance for Credit Losses............................. 29 17 Variable Interest Entities................................... 50 7 Loans Held for Sale.......................................... 32 18 Guarantee Arrangements, Pledged Assets and
Repurchase Agreements................................52
8 Goodwill........................................................... 33 19 Fair Value Measurements................................. 57 9 Derivative Financial Instruments...................... 33 20 Litigation and Regulatory Matters.................... 71 10 Fair Value Option............................................. 39 21 New Accounting Pronouncements.................... 71 11 Accumulated Other Comprehensive Income.... 42
1. Organization and Presentation
HSBC USA Inc. ("HSBC USA"), incorporated under the laws of Maryland, is a New York State based bank holding company and a wholly-owned subsidiary of HSBC North America Holdings Inc. ("HSBC North America"), which is an indirect wholly-owned subsidiary of HSBC Holdings plc ("HSBC" and, together with its subsidiaries, "HSBC Group"). The accompanying unaudited interim consolidated financial statements of HSBC USA and its subsidiaries (collectively "HUSI") have been prepared in accordance with accounting principles generally accepted in the United States of America ("U.S. GAAP") for interim financial information and with the instructions to Form 10-Q and Article 10 of Regulation S-X, as well as in accordance with predominant practices within the banking industry. Accordingly, they do not include all of the information and footnotes required by generally accepted accounting principles for complete financial statements. In the opinion of management, all normal and recurring adjustments considered necessary for a fair statement of financial position, results of operations and cash flows for the interim periods have been made. HUSI may also be referred to in these notes to the consolidated financial statements as "we," "us" or "our." These unaudited interim consolidated financial statements should be read in conjunction with our Annual Report on Form 10-K for the year ended December 31, 2020 (the "2020 Form 10-K"). Certain reclassifications have been made to prior period amounts to conform to the current period presentation.
The preparation of financial statements in conformity with U.S. GAAP requires the use of estimates and assumptions that affect reported amounts and disclosures. Actual results could differ from those estimates. Interim results should not be considered indicative of results in future periods.
HSBC USA Inc.
9
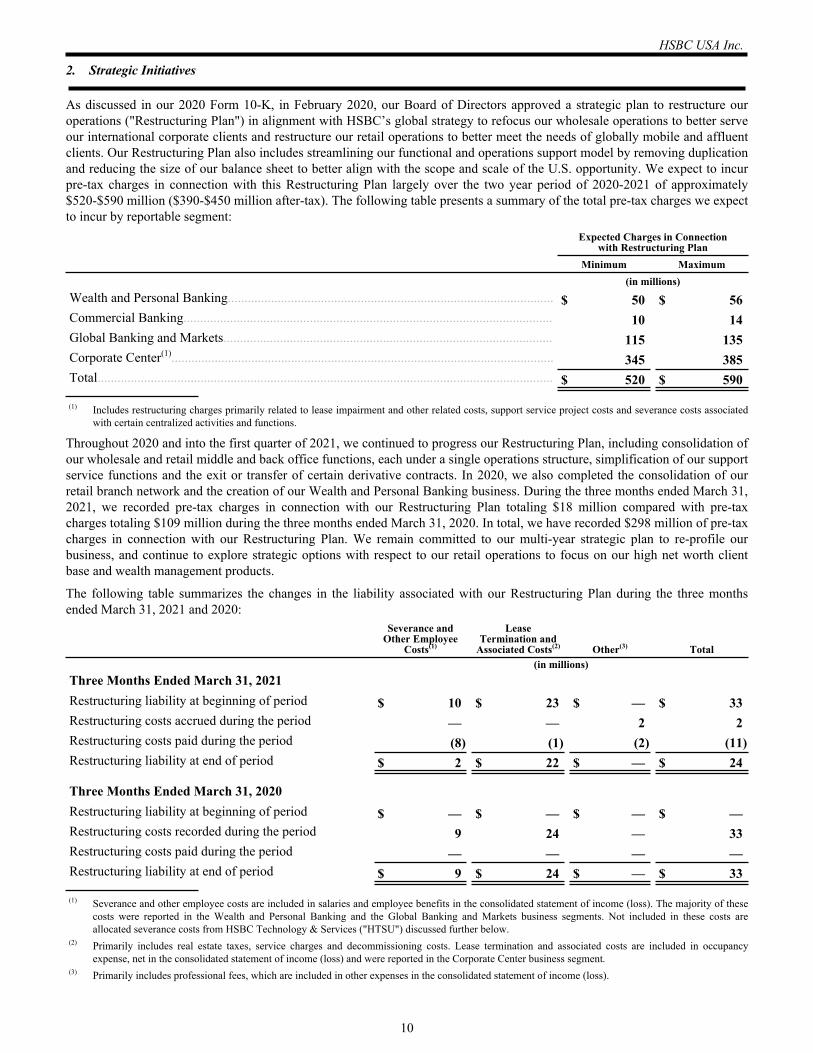
2. Strategic Initiatives
As discussed in our 2020 Form 10-K, in February 2020, our Board of Directors approved a strategic plan to restructure our operations ("Restructuring Plan") in alignment with HSBC’s global strategy to refocus our wholesale operations to better serve our international corporate clients and restructure our retail operations to better meet the needs of globally mobile and affluent clients. Our Restructuring Plan also includes streamlining our functional and operations support model by removing duplication and reducing the size of our balance sheet to better align with the scope and scale of the U.S. opportunity. We expect to incur pre-tax charges in connection with this Restructuring Plan largely over the two year period of 2020-2021 of approximately $520-$590 million ($390-$450 million after-tax). The following table presents a summary of the total pre-tax charges we expect to incur by reportable segment:
Expected Charges in Connectionwith Restructuring Plan
Minimum Maximum (in millions)Wealth and Personal Banking.................................................................................................. $ 50 $ 56 Commercial Banking............................................................................................................... 10 14 Global Banking and Markets................................................................................................... 115 135 Corporate Center(1)................................................................................................................... 345 385 Total......................................................................................................................................... $ 520 $ 590
(1) Includes restructuring charges primarily related to lease impairment and other related costs, support service project costs and severance costs associated with certain centralized activities and functions.
Throughout 2020 and into the first quarter of 2021, we continued to progress our Restructuring Plan, including consolidation of our wholesale and retail middle and back office functions, each under a single operations structure, simplification of our support service functions and the exit or transfer of certain derivative contracts. In 2020, we also completed the consolidation of our retail branch network and the creation of our Wealth and Personal Banking business. During the three months ended March 31, 2021, we recorded pre-tax charges in connection with our Restructuring Plan totaling $18 million compared with pre-tax charges totaling $109 million during the three months ended March 31, 2020. In total, we have recorded $298 million of pre-tax charges in connection with our Restructuring Plan. We remain committed to our multi-year strategic plan to re-profile our business, and continue to explore strategic options with respect to our retail operations to focus on our high net worth client base and wealth management products.
The following table summarizes the changes in the liability associated with our Restructuring Plan during the three months ended March 31, 2021 and 2020:
Severance and Other Employee
Costs(1)
Lease Termination and
Associated Costs(2) Other(3) Total (in millions)Three Months Ended March 31, 2021Restructuring liability at beginning of period $ 10 $ 23 $ — $ 33 Restructuring costs accrued during the period — — 2 2 Restructuring costs paid during the period (8) (1) (2) (11) Restructuring liability at end of period $ 2 $ 22 $ — $ 24
Three Months Ended March 31, 2020Restructuring liability at beginning of period $ — $ — $ — $ — Restructuring costs recorded during the period 9 24 — 33 Restructuring costs paid during the period — — — — Restructuring liability at end of period $ 9 $ 24 $ — $ 33
(1) Severance and other employee costs are included in salaries and employee benefits in the consolidated statement of income (loss). The majority of these costs were reported in the Wealth and Personal Banking and the Global Banking and Markets business segments. Not included in these costs are allocated severance costs from HSBC Technology & Services ("HTSU") discussed further below.
(2) Primarily includes real estate taxes, service charges and decommissioning costs. Lease termination and associated costs are included in occupancy expense, net in the consolidated statement of income (loss) and were reported in the Corporate Center business segment.
(3) Primarily includes professional fees, which are included in other expenses in the consolidated statement of income (loss).
HSBC USA Inc.
10
In connection with the restructuring costs reflected above, during the first quarter of 2020, we determined that we would exit approximately 60 branches (in addition to the approximately 20 branches for which we disclosed plans to exit in 2019). As a result, we recorded impairment charges during the first quarter of 2020 to write-down the lease right-of-use ("ROU") assets, net of estimated sublease income, by $52 million (which was increased to $67 million during the fourth quarter of 2020) and to write-down the leasehold improvement assets associated with these branches by $16 million based on their estimated remaining useful lives. The branches targeted for exit were closed by the end of the second quarter of 2020. These impairment charges are reflected in occupancy expense, net in the consolidated statement of income (loss) and were reported in the Corporate Center business segment.
In addition, during the first quarter of 2021, we recorded $4 million of trading losses associated with the continued exit of certain derivative contracts as part of our Restructuring Plan. These losses are included in trading revenue in the consolidated statement of income (loss) and were reported in the Global Banking and Markets business segment. During the first quarter of 2021, as part of our Restructuring Plan, we also continued to transfer interest rate derivative contracts associated with Fixed Income activities to HSBC Bank plc. These activities are being consolidated in and operated from HSBC Bank plc to better utilize HSBC Group's global scale, which allows us to record revenue as a business introducer and hold fewer assets on our balance sheet. Transfers of interest rate derivative contracts with a notional value of $14.8 billion were completed during the first quarter of 2021 with the remainder of these contracts with a current notional value of up to $59.8 billion expected to be completed during the remainder of 2021. The transferred derivatives were substantially fully collateralized which resulted in an immaterial impact on our consolidated balance sheet.
Our Restructuring Plan also resulted in costs being allocated to us from HTSU, primarily severance costs and support service project costs, which are reflected in support services from HSBC affiliates in the consolidated statement of income (loss). During the first quarter of 2021, we recorded $12 million of allocated costs from HTSU related to restructuring activities compared with $8 million of allocated costs during the first quarter of 2020. These costs were reported in the Corporate Center business segment.
HSBC Group Restructuring Separate from the charges related to our Restructuring Plan as detailed above, during the first quarter of 2021, we also recorded $7 million of allocated costs from other HSBC affiliates related to the HSBC Group's restructuring activities, primarily support service project costs and severance costs. These costs are reflected in support services from HSBC affiliates in the consolidated statement of income (loss) and were reported in the Corporate Center business segment.
HSBC USA Inc.
11
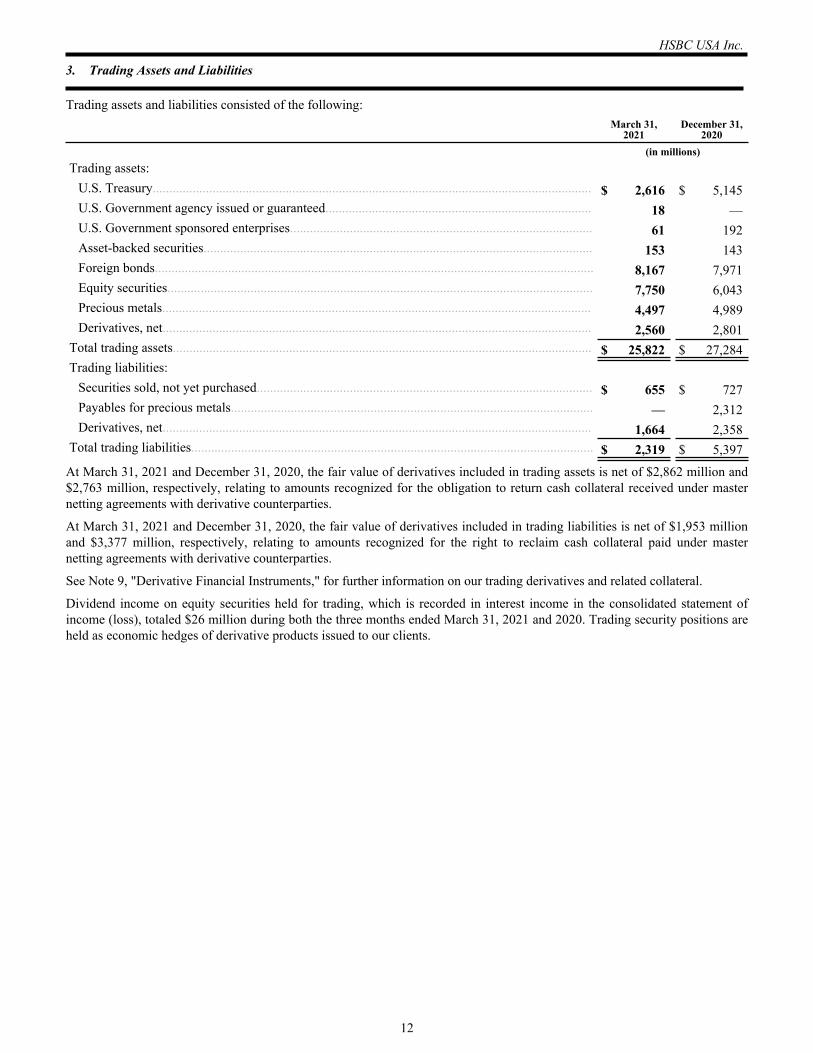
3. Trading Assets and Liabilities
Trading assets and liabilities consisted of the following:March 31,
2021December 31,
2020 (in millions)Trading assets:
U.S. Treasury.................................................................................................................................... $ 2,616 $ 5,145 U.S. Government agency issued or guaranteed................................................................................ 18 — U.S. Government sponsored enterprises........................................................................................... 61 192 Asset-backed securities..................................................................................................................... 153 143 Foreign bonds.................................................................................................................................... 8,167 7,971 Equity securities................................................................................................................................ 7,750 6,043 Precious metals................................................................................................................................. 4,497 4,989 Derivatives, net................................................................................................................................. 2,560 2,801
Total trading assets.............................................................................................................................. $ 25,822 $ 27,284 Trading liabilities:
Securities sold, not yet purchased..................................................................................................... $ 655 $ 727 Payables for precious metals............................................................................................................. — 2,312 Derivatives, net................................................................................................................................. 1,664 2,358
Total trading liabilities......................................................................................................................... $ 2,319 $ 5,397
At March 31, 2021 and December 31, 2020, the fair value of derivatives included in trading assets is net of $2,862 million and $2,763 million, respectively, relating to amounts recognized for the obligation to return cash collateral received under master netting agreements with derivative counterparties.
At March 31, 2021 and December 31, 2020, the fair value of derivatives included in trading liabilities is net of $1,953 million and $3,377 million, respectively, relating to amounts recognized for the right to reclaim cash collateral paid under master netting agreements with derivative counterparties.
See Note 9, "Derivative Financial Instruments," for further information on our trading derivatives and related collateral.
Dividend income on equity securities held for trading, which is recorded in interest income in the consolidated statement of income (loss), totaled $26 million during both the three months ended March 31, 2021 and 2020. Trading security positions are held as economic hedges of derivative products issued to our clients.
HSBC USA Inc.
12
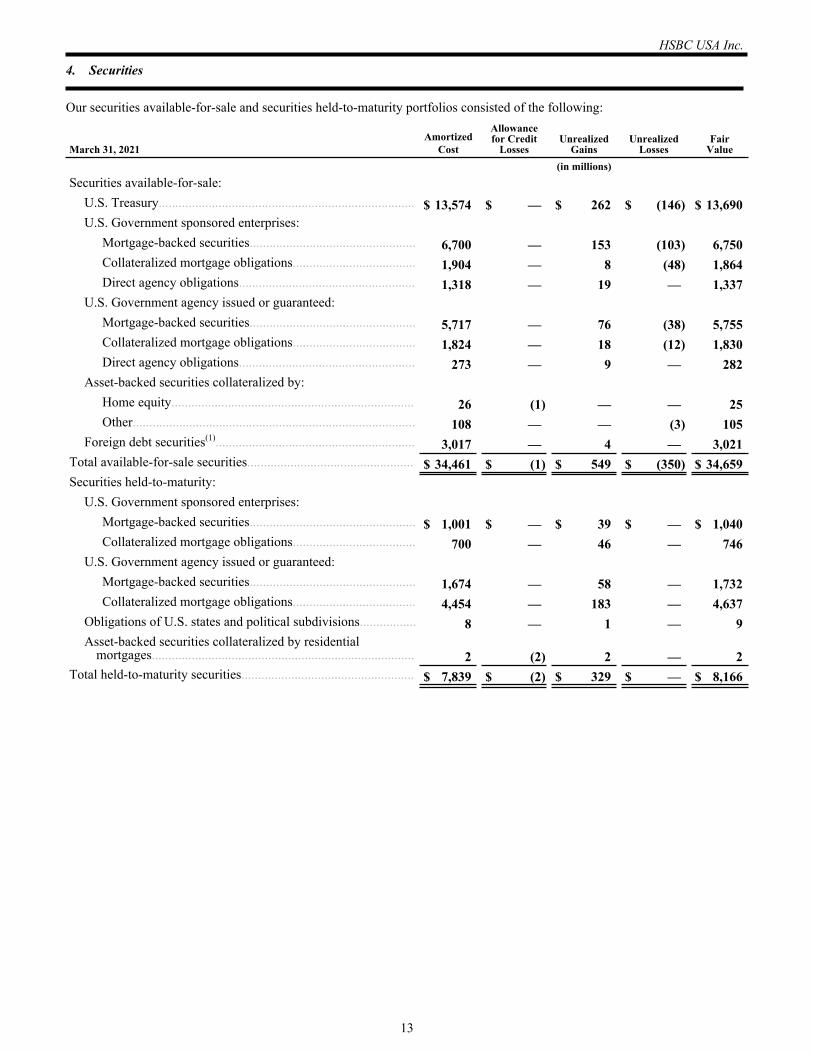
4. Securities
Our securities available-for-sale and securities held-to-maturity portfolios consisted of the following:
March 31, 2021Amortized
Cost
Allowance for Credit
LossesUnrealized
GainsUnrealized
LossesFair
Value (in millions)Securities available-for-sale:
U.S. Treasury............................................................................. $ 13,574 $ — $ 262 $ (146) $ 13,690 U.S. Government sponsored enterprises:
Mortgage-backed securities.................................................. 6,700 — 153 (103) 6,750 Collateralized mortgage obligations..................................... 1,904 — 8 (48) 1,864 Direct agency obligations..................................................... 1,318 — 19 — 1,337
U.S. Government agency issued or guaranteed:Mortgage-backed securities.................................................. 5,717 — 76 (38) 5,755 Collateralized mortgage obligations..................................... 1,824 — 18 (12) 1,830 Direct agency obligations..................................................... 273 — 9 — 282
Asset-backed securities collateralized by:Home equity......................................................................... 26 (1) — — 25 Other..................................................................................... 108 — — (3) 105
Foreign debt securities(1)............................................................ 3,017 — 4 — 3,021 Total available-for-sale securities.................................................. $ 34,461 $ (1) $ 549 $ (350) $ 34,659 Securities held-to-maturity:
U.S. Government sponsored enterprises:Mortgage-backed securities.................................................. $ 1,001 $ — $ 39 $ — $ 1,040 Collateralized mortgage obligations..................................... 700 — 46 — 746
U.S. Government agency issued or guaranteed:Mortgage-backed securities.................................................. 1,674 — 58 — 1,732 Collateralized mortgage obligations..................................... 4,454 — 183 — 4,637
Obligations of U.S. states and political subdivisions................. 8 — 1 — 9 Asset-backed securities collateralized by residential
mortgages............................................................................... 2 (2) 2 — 2 Total held-to-maturity securities.................................................... $ 7,839 $ (2) $ 329 $ — $ 8,166
HSBC USA Inc.
13
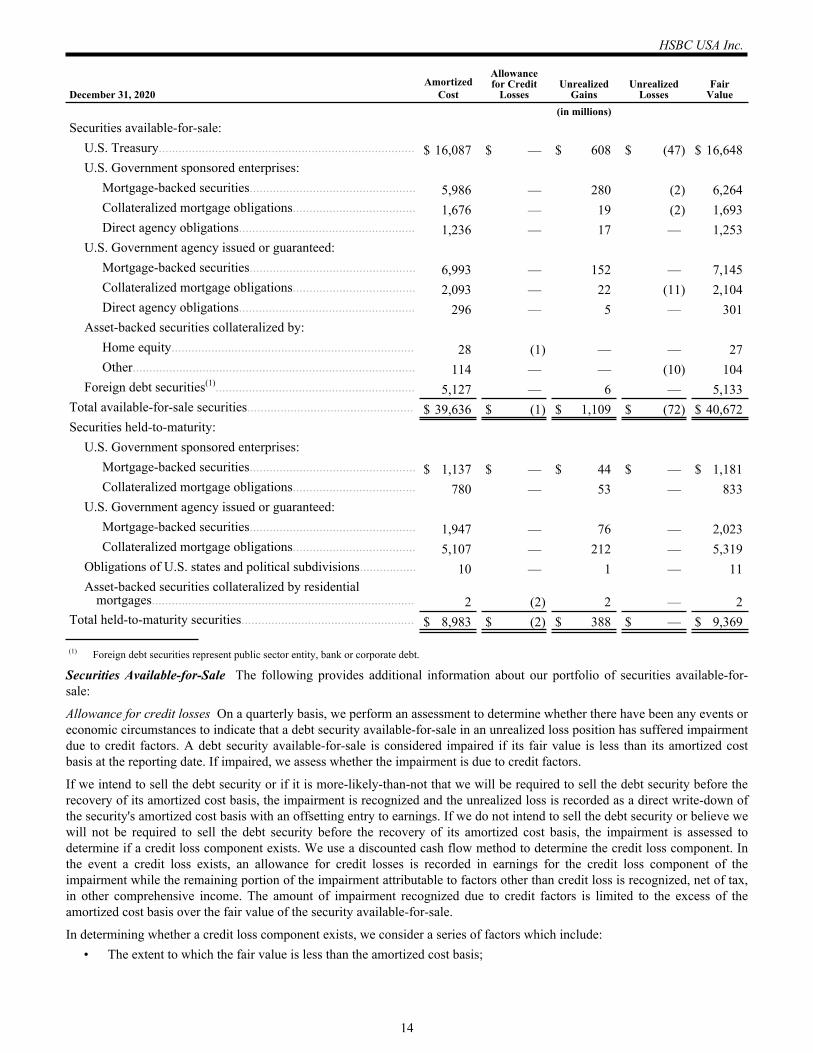
December 31, 2020Amortized
Cost
Allowance for Credit
LossesUnrealized
GainsUnrealized
LossesFair
Value (in millions)Securities available-for-sale:
U.S. Treasury............................................................................. $ 16,087 $ — $ 608 $ (47) $ 16,648 U.S. Government sponsored enterprises:
Mortgage-backed securities.................................................. 5,986 — 280 (2) 6,264 Collateralized mortgage obligations..................................... 1,676 — 19 (2) 1,693 Direct agency obligations..................................................... 1,236 — 17 — 1,253
U.S. Government agency issued or guaranteed:Mortgage-backed securities.................................................. 6,993 — 152 — 7,145 Collateralized mortgage obligations..................................... 2,093 — 22 (11) 2,104 Direct agency obligations..................................................... 296 — 5 — 301
Asset-backed securities collateralized by:Home equity......................................................................... 28 (1) — — 27 Other..................................................................................... 114 — — (10) 104
Foreign debt securities(1)............................................................ 5,127 — 6 — 5,133 Total available-for-sale securities.................................................. $ 39,636 $ (1) $ 1,109 $ (72) $ 40,672 Securities held-to-maturity:
U.S. Government sponsored enterprises:Mortgage-backed securities.................................................. $ 1,137 $ — $ 44 $ — $ 1,181 Collateralized mortgage obligations..................................... 780 — 53 — 833
U.S. Government agency issued or guaranteed:Mortgage-backed securities.................................................. 1,947 — 76 — 2,023 Collateralized mortgage obligations..................................... 5,107 — 212 — 5,319
Obligations of U.S. states and political subdivisions................. 10 — 1 — 11 Asset-backed securities collateralized by residential
mortgages............................................................................... 2 (2) 2 — 2 Total held-to-maturity securities.................................................... $ 8,983 $ (2) $ 388 $ — $ 9,369
(1) Foreign debt securities represent public sector entity, bank or corporate debt.
Securities Available-for-Sale The following provides additional information about our portfolio of securities available-for-sale:
Allowance for credit losses On a quarterly basis, we perform an assessment to determine whether there have been any events or economic circumstances to indicate that a debt security available-for-sale in an unrealized loss position has suffered impairment due to credit factors. A debt security available-for-sale is considered impaired if its fair value is less than its amortized cost basis at the reporting date. If impaired, we assess whether the impairment is due to credit factors.
If we intend to sell the debt security or if it is more-likely-than-not that we will be required to sell the debt security before the recovery of its amortized cost basis, the impairment is recognized and the unrealized loss is recorded as a direct write-down of the security's amortized cost basis with an offsetting entry to earnings. If we do not intend to sell the debt security or believe we will not be required to sell the debt security before the recovery of its amortized cost basis, the impairment is assessed to determine if a credit loss component exists. We use a discounted cash flow method to determine the credit loss component. In the event a credit loss exists, an allowance for credit losses is recorded in earnings for the credit loss component of the impairment while the remaining portion of the impairment attributable to factors other than credit loss is recognized, net of tax, in other comprehensive income. The amount of impairment recognized due to credit factors is limited to the excess of the amortized cost basis over the fair value of the security available-for-sale.
In determining whether a credit loss component exists, we consider a series of factors which include:• The extent to which the fair value is less than the amortized cost basis;
HSBC USA Inc.
14
• The credit protection features embedded within the instrument, which includes but is not limited to credit subordination positions, payment structure, over collateralization, protective triggers and financial guarantees provided by third parties;
• Changes in the near term prospects of the issuer or the underlying collateral of a security such as changes in default rates, loss severities given default and significant changes in prepayment assumptions;
• The level of excess cash flows generated from the underlying collateral supporting the principal and interest payments of the debt securities; and
• Any adverse change to the credit conditions of the issuer, the monoline insurer or the security such as credit downgrades by external rating agencies or changes to internal ratings.
At both March 31, 2021 and December 31, 2020, the allowance for credit losses on securities available-for-sale was $1 million.
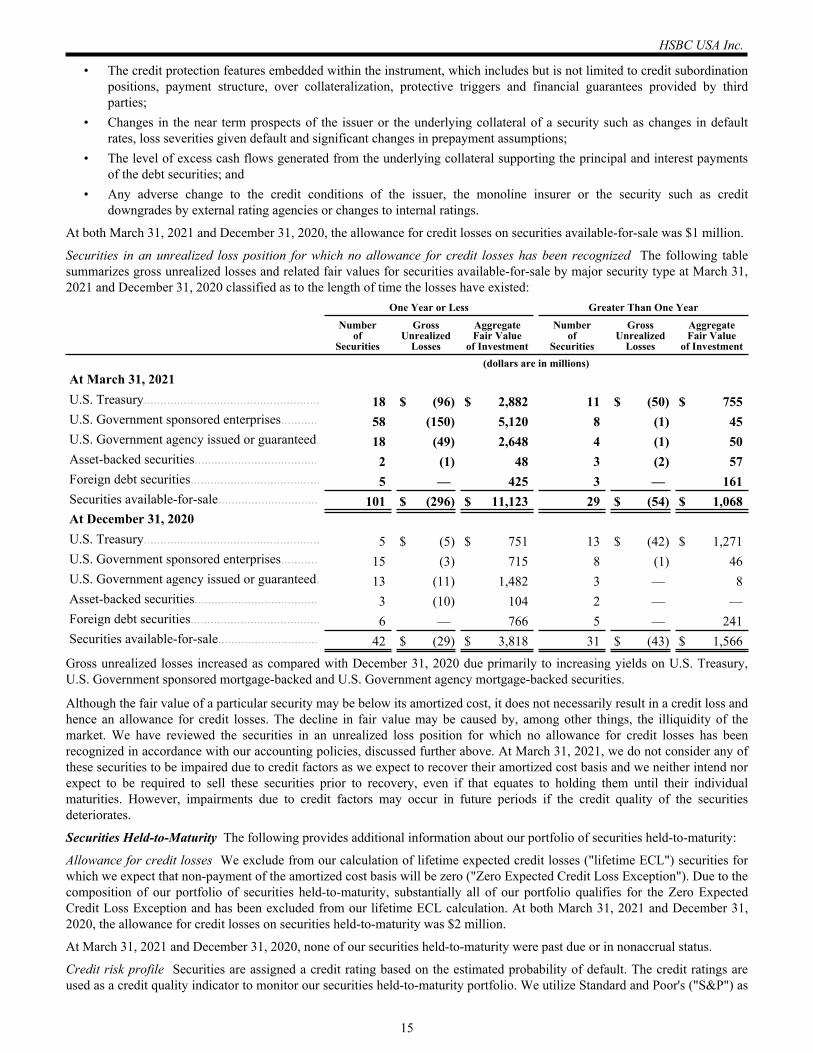
Securities in an unrealized loss position for which no allowance for credit losses has been recognized The following table summarizes gross unrealized losses and related fair values for securities available-for-sale by major security type at March 31, 2021 and December 31, 2020 classified as to the length of time the losses have existed: One Year or Less Greater Than One Year
Numberof
Securities
GrossUnrealized
Losses
AggregateFair Value
of Investment
Numberof
Securities
GrossUnrealized
Losses
AggregateFair Value
of Investment (dollars are in millions)At March 31, 2021U.S. Treasury..................................................... 18 $ (96) $ 2,882 11 $ (50) $ 755 U.S. Government sponsored enterprises........... 58 (150) 5,120 8 (1) 45 U.S. Government agency issued or guaranteed. 18 (49) 2,648 4 (1) 50 Asset-backed securities..................................... 2 (1) 48 3 (2) 57 Foreign debt securities....................................... 5 — 425 3 — 161 Securities available-for-sale.............................. 101 $ (296) $ 11,123 29 $ (54) $ 1,068 At December 31, 2020U.S. Treasury..................................................... 5 $ (5) $ 751 13 $ (42) $ 1,271 U.S. Government sponsored enterprises........... 15 (3) 715 8 (1) 46 U.S. Government agency issued or guaranteed. 13 (11) 1,482 3 — 8 Asset-backed securities..................................... 3 (10) 104 2 — — Foreign debt securities....................................... 6 — 766 5 — 241 Securities available-for-sale.............................. 42 $ (29) $ 3,818 31 $ (43) $ 1,566
Gross unrealized losses increased as compared with December 31, 2020 due primarily to increasing yields on U.S. Treasury, U.S. Government sponsored mortgage-backed and U.S. Government agency mortgage-backed securities.
Although the fair value of a particular security may be below its amortized cost, it does not necessarily result in a credit loss and hence an allowance for credit losses. The decline in fair value may be caused by, among other things, the illiquidity of the market. We have reviewed the securities in an unrealized loss position for which no allowance for credit losses has been recognized in accordance with our accounting policies, discussed further above. At March 31, 2021, we do not consider any of these securities to be impaired due to credit factors as we expect to recover their amortized cost basis and we neither intend nor expect to be required to sell these securities prior to recovery, even if that equates to holding them until their individual maturities. However, impairments due to credit factors may occur in future periods if the credit quality of the securities deteriorates.
Securities Held-to-Maturity The following provides additional information about our portfolio of securities held-to-maturity:
Allowance for credit losses We exclude from our calculation of lifetime expected credit losses ("lifetime ECL") securities for which we expect that non-payment of the amortized cost basis will be zero ("Zero Expected Credit Loss Exception"). Due to the composition of our portfolio of securities held-to-maturity, substantially all of our portfolio qualifies for the Zero Expected Credit Loss Exception and has been excluded from our lifetime ECL calculation. At both March 31, 2021 and December 31, 2020, the allowance for credit losses on securities held-to-maturity was $2 million.
At March 31, 2021 and December 31, 2020, none of our securities held-to-maturity were past due or in nonaccrual status.
Credit risk profile Securities are assigned a credit rating based on the estimated probability of default. The credit ratings are used as a credit quality indicator to monitor our securities held-to-maturity portfolio. We utilize Standard and Poor's ("S&P") as
HSBC USA Inc.
15
the primary source of our credit ratings. If S&P ratings are not available, ratings by Moody's and Fitch are used in that order. Investment grade includes securities with credit ratings of at least BBB- or above. At March 31, 2021 and December 31, 2020, all of our securities held-to-maturity were investment grade.
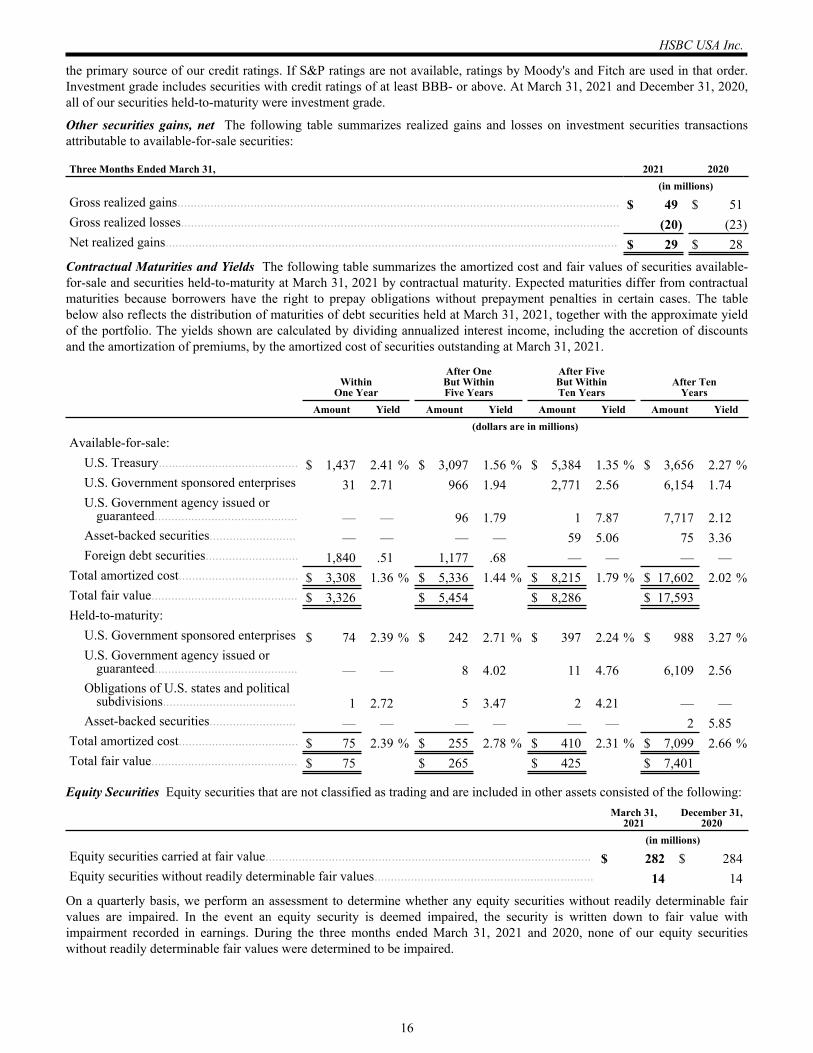
Other securities gains, net The following table summarizes realized gains and losses on investment securities transactions attributable to available-for-sale securities:
Three Months Ended March 31, 2021 2020 (in millions)Gross realized gains..................................................................................................................................... $ 49 $ 51 Gross realized losses.................................................................................................................................... (20) (23) Net realized gains........................................................................................................................................ $ 29 $ 28
Contractual Maturities and Yields The following table summarizes the amortized cost and fair values of securities available-for-sale and securities held-to-maturity at March 31, 2021 by contractual maturity. Expected maturities differ from contractual maturities because borrowers have the right to prepay obligations without prepayment penalties in certain cases. The table below also reflects the distribution of maturities of debt securities held at March 31, 2021, together with the approximate yield of the portfolio. The yields shown are calculated by dividing annualized interest income, including the accretion of discounts and the amortization of premiums, by the amortized cost of securities outstanding at March 31, 2021.
Within
One Year
After OneBut WithinFive Years
After FiveBut WithinTen Years
After TenYears
Amount Yield Amount Yield Amount Yield Amount Yield (dollars are in millions)Available-for-sale:
U.S. Treasury.......................................... $ 1,437 2.41 % $ 3,097 1.56 % $ 5,384 1.35 % $ 3,656 2.27 %U.S. Government sponsored enterprises 31 2.71 966 1.94 2,771 2.56 6,154 1.74 U.S. Government agency issued or
guaranteed........................................... — — 96 1.79 1 7.87 7,717 2.12 Asset-backed securities.......................... — — — — 59 5.06 75 3.36 Foreign debt securities............................ 1,840 .51 1,177 .68 — — — —
Total amortized cost.................................... $ 3,308 1.36 % $ 5,336 1.44 % $ 8,215 1.79 % $ 17,602 2.02 %Total fair value............................................ $ 3,326 $ 5,454 $ 8,286 $ 17,593 Held-to-maturity:
U.S. Government sponsored enterprises $ 74 2.39 % $ 242 2.71 % $ 397 2.24 % $ 988 3.27 %U.S. Government agency issued or
guaranteed........................................... — — 8 4.02 11 4.76 6,109 2.56 Obligations of U.S. states and political
subdivisions........................................ 1 2.72 5 3.47 2 4.21 — — Asset-backed securities.......................... — — — — — — 2 5.85
Total amortized cost.................................... $ 75 2.39 % $ 255 2.78 % $ 410 2.31 % $ 7,099 2.66 %Total fair value............................................ $ 75 $ 265 $ 425 $ 7,401
Equity Securities Equity securities that are not classified as trading and are included in other assets consisted of the following:March 31,
2021December 31,
2020 (in millions)Equity securities carried at fair value.................................................................................................. $ 282 $ 284 Equity securities without readily determinable fair values.................................................................. 14 14
On a quarterly basis, we perform an assessment to determine whether any equity securities without readily determinable fair values are impaired. In the event an equity security is deemed impaired, the security is written down to fair value with impairment recorded in earnings. During the three months ended March 31, 2021 and 2020, none of our equity securities without readily determinable fair values were determined to be impaired.
HSBC USA Inc.
16
Also included in other assets were investments in Federal Home Loan Bank ("FHLB") stock and Federal Reserve Bank stock of $192 million and $559 million, respectively, at March 31, 2021 and $259 million and $559 million, respectively, at December 31, 2020.
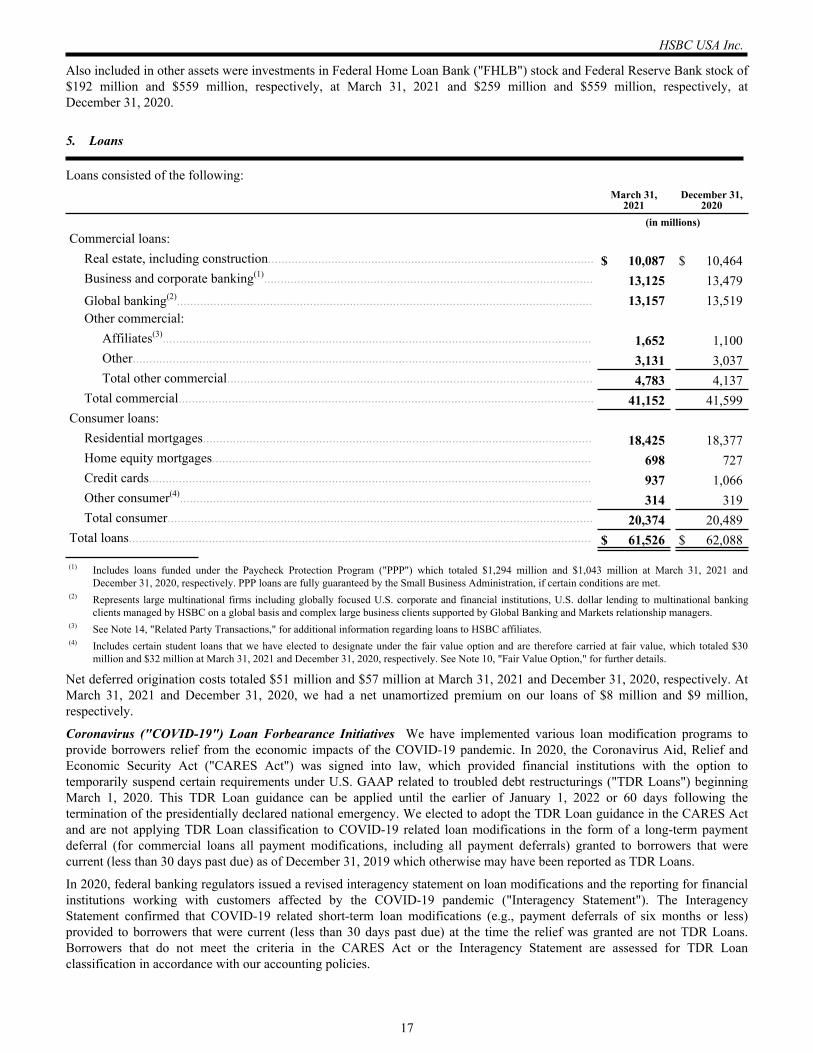
5. Loans
Loans consisted of the following:March 31,
2021December 31,
2020 (in millions)Commercial loans:
Real estate, including construction.................................................................................................. $ 10,087 $ 10,464 Business and corporate banking(1)................................................................................................... 13,125 13,479 Global banking(2)............................................................................................................................. 13,157 13,519 Other commercial:
Affiliates(3)................................................................................................................................. 1,652 1,100 Other.......................................................................................................................................... 3,131 3,037 Total other commercial.............................................................................................................. 4,783 4,137
Total commercial............................................................................................................................. 41,152 41,599 Consumer loans:
Residential mortgages..................................................................................................................... 18,425 18,377 Home equity mortgages.................................................................................................................. 698 727 Credit cards..................................................................................................................................... 937 1,066 Other consumer(4)............................................................................................................................ 314 319 Total consumer................................................................................................................................ 20,374 20,489
Total loans........................................................................................................................................... $ 61,526 $ 62,088
(1) Includes loans funded under the Paycheck Protection Program ("PPP") which totaled $1,294 million and $1,043 million at March 31, 2021 and December 31, 2020, respectively. PPP loans are fully guaranteed by the Small Business Administration, if certain conditions are met.
(2) Represents large multinational firms including globally focused U.S. corporate and financial institutions, U.S. dollar lending to multinational banking clients managed by HSBC on a global basis and complex large business clients supported by Global Banking and Markets relationship managers.
(3) See Note 14, "Related Party Transactions," for additional information regarding loans to HSBC affiliates.(4) Includes certain student loans that we have elected to designate under the fair value option and are therefore carried at fair value, which totaled $30
million and $32 million at March 31, 2021 and December 31, 2020, respectively. See Note 10, "Fair Value Option," for further details.
Net deferred origination costs totaled $51 million and $57 million at March 31, 2021 and December 31, 2020, respectively. At March 31, 2021 and December 31, 2020, we had a net unamortized premium on our loans of $8 million and $9 million, respectively.
Coronavirus ("COVID-19") Loan Forbearance Initiatives We have implemented various loan modification programs to provide borrowers relief from the economic impacts of the COVID-19 pandemic. In 2020, the Coronavirus Aid, Relief and Economic Security Act ("CARES Act") was signed into law, which provided financial institutions with the option to temporarily suspend certain requirements under U.S. GAAP related to troubled debt restructurings ("TDR Loans") beginning March 1, 2020. This TDR Loan guidance can be applied until the earlier of January 1, 2022 or 60 days following the termination of the presidentially declared national emergency. We elected to adopt the TDR Loan guidance in the CARES Act and are not applying TDR Loan classification to COVID-19 related loan modifications in the form of a long-term payment deferral (for commercial loans all payment modifications, including all payment deferrals) granted to borrowers that were current (less than 30 days past due) as of December 31, 2019 which otherwise may have been reported as TDR Loans.
In 2020, federal banking regulators issued a revised interagency statement on loan modifications and the reporting for financial institutions working with customers affected by the COVID-19 pandemic ("Interagency Statement"). The Interagency Statement confirmed that COVID-19 related short-term loan modifications (e.g., payment deferrals of six months or less) provided to borrowers that were current (less than 30 days past due) at the time the relief was granted are not TDR Loans. Borrowers that do not meet the criteria in the CARES Act or the Interagency Statement are assessed for TDR Loan classification in accordance with our accounting policies.
HSBC USA Inc.
17
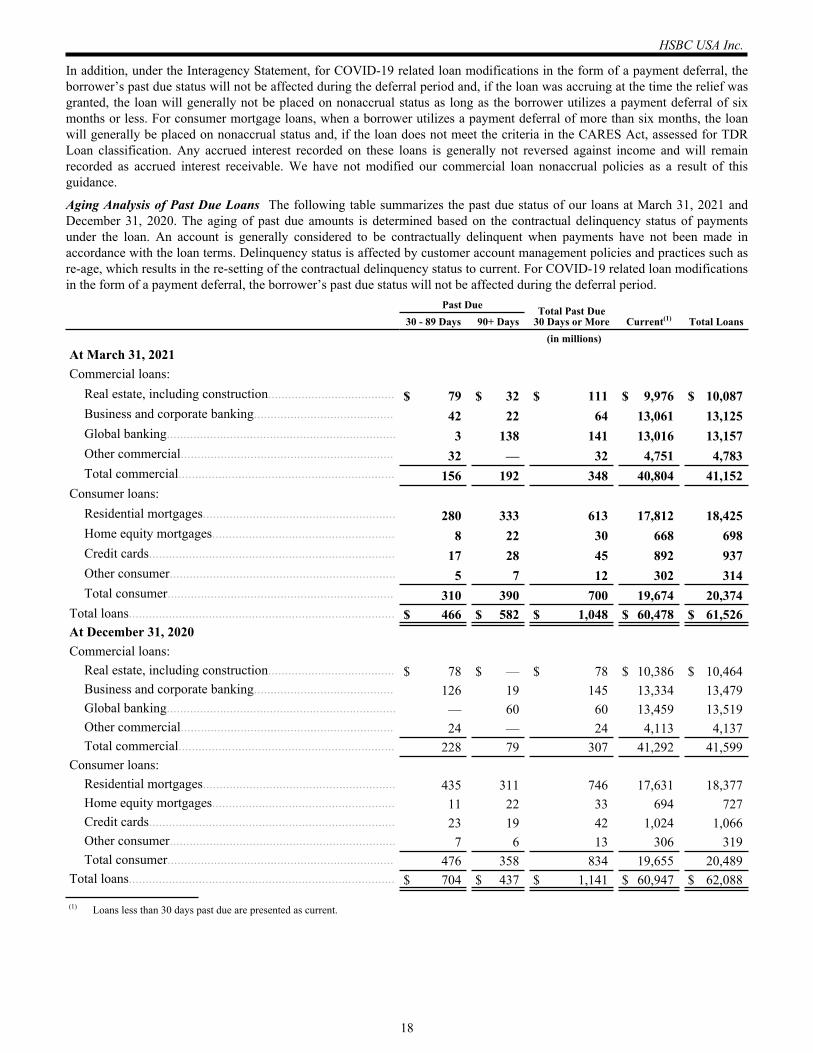
In addition, under the Interagency Statement, for COVID-19 related loan modifications in the form of a payment deferral, the borrower’s past due status will not be affected during the deferral period and, if the loan was accruing at the time the relief was granted, the loan will generally not be placed on nonaccrual status as long as the borrower utilizes a payment deferral of six months or less. For consumer mortgage loans, when a borrower utilizes a payment deferral of more than six months, the loan will generally be placed on nonaccrual status and, if the loan does not meet the criteria in the CARES Act, assessed for TDR Loan classification. Any accrued interest recorded on these loans is generally not reversed against income and will remain recorded as accrued interest receivable. We have not modified our commercial loan nonaccrual policies as a result of this guidance.
Aging Analysis of Past Due Loans The following table summarizes the past due status of our loans at March 31, 2021 and December 31, 2020. The aging of past due amounts is determined based on the contractual delinquency status of payments under the loan. An account is generally considered to be contractually delinquent when payments have not been made in accordance with the loan terms. Delinquency status is affected by customer account management policies and practices such as re-age, which results in the re-setting of the contractual delinquency status to current. For COVID-19 related loan modifications in the form of a payment deferral, the borrower’s past due status will not be affected during the deferral period. Past Due Total Past Due
30 Days or More
30 - 89 Days 90+ Days Current(1) Total Loans (in millions)At March 31, 2021Commercial loans:
Real estate, including construction...................................... $ 79 $ 32 $ 111 $ 9,976 $ 10,087 Business and corporate banking.......................................... 42 22 64 13,061 13,125 Global banking..................................................................... 3 138 141 13,016 13,157 Other commercial................................................................ 32 — 32 4,751 4,783 Total commercial................................................................. 156 192 348 40,804 41,152
Consumer loans:Residential mortgages.......................................................... 280 333 613 17,812 18,425 Home equity mortgages....................................................... 8 22 30 668 698 Credit cards.......................................................................... 17 28 45 892 937 Other consumer.................................................................... 5 7 12 302 314 Total consumer.................................................................... 310 390 700 19,674 20,374
Total loans................................................................................ $ 466 $ 582 $ 1,048 $ 60,478 $ 61,526 At December 31, 2020Commercial loans:
Real estate, including construction...................................... $ 78 $ — $ 78 $ 10,386 $ 10,464 Business and corporate banking.......................................... 126 19 145 13,334 13,479 Global banking..................................................................... — 60 60 13,459 13,519 Other commercial................................................................ 24 — 24 4,113 4,137 Total commercial................................................................. 228 79 307 41,292 41,599
Consumer loans:Residential mortgages.......................................................... 435 311 746 17,631 18,377 Home equity mortgages....................................................... 11 22 33 694 727 Credit cards.......................................................................... 23 19 42 1,024 1,066 Other consumer.................................................................... 7 6 13 306 319 Total consumer.................................................................... 476 358 834 19,655 20,489
Total loans................................................................................ $ 704 $ 437 $ 1,141 $ 60,947 $ 62,088
(1) Loans less than 30 days past due are presented as current.
HSBC USA Inc.
18
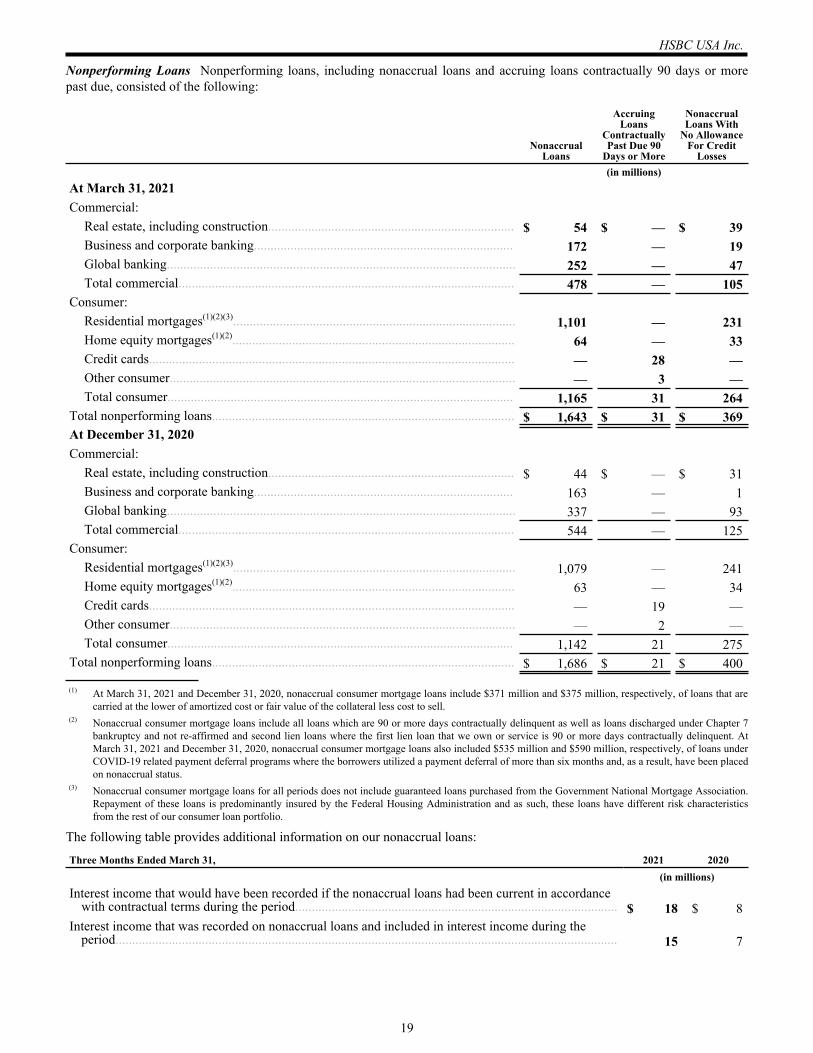
Nonperforming Loans Nonperforming loans, including nonaccrual loans and accruing loans contractually 90 days or more past due, consisted of the following:
Nonaccrual Loans
Accruing Loans
Contractually Past Due 90
Days or More
Nonaccrual Loans With
No Allowance For Credit
Losses (in millions)At March 31, 2021Commercial:
Real estate, including construction.......................................................................... $ 54 $ — $ 39 Business and corporate banking.............................................................................. 172 — 19 Global banking......................................................................................................... 252 — 47 Total commercial..................................................................................................... 478 — 105
Consumer:Residential mortgages(1)(2)(3)..................................................................................... 1,101 — 231 Home equity mortgages(1)(2)..................................................................................... 64 — 33 Credit cards.............................................................................................................. — 28 — Other consumer........................................................................................................ — 3 — Total consumer........................................................................................................ 1,165 31 264
Total nonperforming loans........................................................................................... $ 1,643 $ 31 $ 369 At December 31, 2020Commercial:
Real estate, including construction.......................................................................... $ 44 $ — $ 31 Business and corporate banking.............................................................................. 163 — 1 Global banking......................................................................................................... 337 — 93 Total commercial..................................................................................................... 544 — 125
Consumer:Residential mortgages(1)(2)(3)..................................................................................... 1,079 — 241 Home equity mortgages(1)(2)..................................................................................... 63 — 34 Credit cards.............................................................................................................. — 19 — Other consumer........................................................................................................ — 2 — Total consumer........................................................................................................ 1,142 21 275
Total nonperforming loans........................................................................................... $ 1,686 $ 21 $ 400
(1) At March 31, 2021 and December 31, 2020, nonaccrual consumer mortgage loans include $371 million and $375 million, respectively, of loans that are carried at the lower of amortized cost or fair value of the collateral less cost to sell.
(2) Nonaccrual consumer mortgage loans include all loans which are 90 or more days contractually delinquent as well as loans discharged under Chapter 7 bankruptcy and not re-affirmed and second lien loans where the first lien loan that we own or service is 90 or more days contractually delinquent. At March 31, 2021 and December 31, 2020, nonaccrual consumer mortgage loans also included $535 million and $590 million, respectively, of loans under COVID-19 related payment deferral programs where the borrowers utilized a payment deferral of more than six months and, as a result, have been placed on nonaccrual status.
(3) Nonaccrual consumer mortgage loans for all periods does not include guaranteed loans purchased from the Government National Mortgage Association. Repayment of these loans is predominantly insured by the Federal Housing Administration and as such, these loans have different risk characteristics from the rest of our consumer loan portfolio.
The following table provides additional information on our nonaccrual loans:
Three Months Ended March 31, 2021 2020(in millions)
Interest income that would have been recorded if the nonaccrual loans had been current in accordance with contractual terms during the period................................................................................................. $ 18 $ 8
Interest income that was recorded on nonaccrual loans and included in interest income during the period....................................................................................................................................................... 15 7
HSBC USA Inc.
19
Collateral-Dependent Loans Loans for which the repayment is expected to be provided substantially through the operation or sale of the collateral and the borrower is experiencing financial difficulty are considered to be collateral-dependent loans. Collateral can have a significant financial effect in mitigating our exposure to credit risk.
Collateral-dependent residential mortgage loans are carried at the lower of amortized cost or fair value of the collateral less costs to sell, with any excess in the carrying amount of the loan generally charged off at the time foreclosure is initiated or when settlement is reached with the borrower, but not to exceed the end of the month in which the account becomes six months contractually delinquent. Collateral values are based on broker price opinions or appraisals which are updated at least every 180 days less estimated costs to sell. During the quarterly period between updates, real estate price trends are reviewed on a geographic basis and incorporated as necessary. At March 31, 2021 and December 31, 2020, we had collateral-dependent residential mortgage loans totaling $805 million and $817 million, respectively.
For collateral-dependent commercial loans, the allowance for expected credit losses is individually assessed based on the fair value of the collateral. Various types of collateral are used, including real estate, inventory, equipment, accounts receivable, securities and cash, among others. For commercial real estate loans, collateral values are generally based on appraisals which are updated based on management judgment under the specific circumstances on a case-by-case basis. In situations where an appraisal is not used, borrower-specific factors such as operating results, cash flows and debt service ratios are reviewed along with relevant market data of comparable properties in order to create a 10-year cash flow model to be discounted at appropriate rates to present value. The collateral value for securities is based on their quoted market prices or broker quotes. The collateral value for other financial assets is generally based on appraisals or is estimated using a discounted cash flow analysis. Commercial loan balances are charged off at the time all or a portion of the balance is deemed uncollectible. At March 31, 2021 and December 31, 2020, we had collateral-dependent commercial loans totaling $431 million and $456 million, respectively.
Troubled debt restructurings TDR Loans represent loans for which the original contractual terms have been modified to provide for terms that are less than what we would be willing to accept for new loans with comparable risk because of deterioration in the borrower's financial condition.
Modifications for consumer or commercial loans may include changes to one or more terms of the loan, including, but not limited to, a change in interest rate, extension of the amortization period, reduction in payment amount and partial forgiveness or deferment of principal, accrued interest or other loan covenants. A substantial amount of our modifications involve interest rate reductions on consumer loans, which lower the amount of interest income we are contractually entitled to receive in future periods. Through lowering the interest rate and other loan term changes, we believe we are able to increase the amount of cash flow that will ultimately be collected from the loan, given the borrower's financial condition. Once a consumer loan is classified as a TDR Loan, it continues to be reported as such until it is paid off or charged-off. For commercial loans, if subsequent performance is in accordance with the new terms and the loan is upgraded, it is possible the loan will no longer be reported as a TDR Loan at the earliest one year after the restructuring. During the three months ended March 31, 2021 and 2020, there were no commercial loans that met this criteria and were removed from TDR Loan classification.
As previously discussed, we have implemented various loan modification payment deferral programs to provide borrowers relief from the economic impacts of COVID-19. Substantially all of the loans under these programs are not classified as TDR Loans due to our election to suspend TDR Loan classification under the CARES Act or their short-term nature as discussed under the Interagency Statement.
HSBC USA Inc.
20
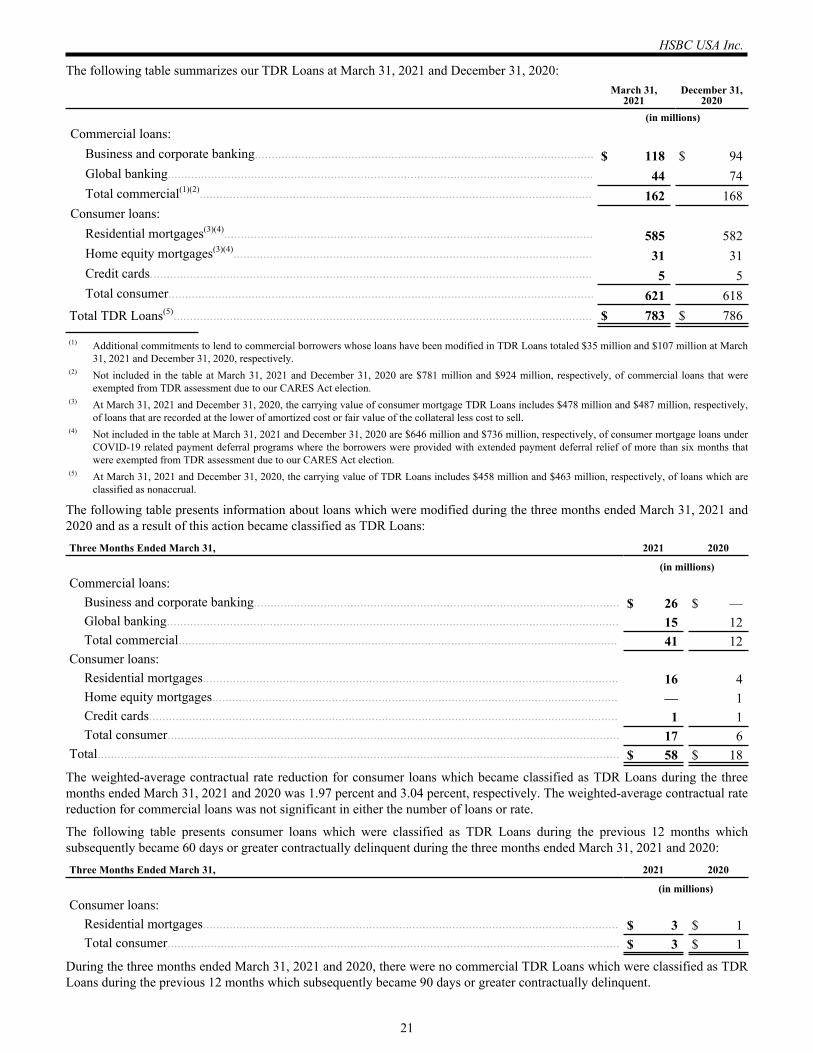
The following table summarizes our TDR Loans at March 31, 2021 and December 31, 2020:March 31,
2021December 31,
2020 (in millions)Commercial loans:
Business and corporate banking...................................................................................................... $ 118 $ 94 Global banking................................................................................................................................ 44 74 Total commercial(1)(2)...................................................................................................................... 162 168
Consumer loans:Residential mortgages(3)(4)............................................................................................................... 585 582 Home equity mortgages(3)(4)............................................................................................................ 31 31 Credit cards..................................................................................................................................... 5 5 Total consumer................................................................................................................................ 621 618
Total TDR Loans(5).............................................................................................................................. $ 783 $ 786
(1) Additional commitments to lend to commercial borrowers whose loans have been modified in TDR Loans totaled $35 million and $107 million at March 31, 2021 and December 31, 2020, respectively.
(2) Not included in the table at March 31, 2021 and December 31, 2020 are $781 million and $924 million, respectively, of commercial loans that were exempted from TDR assessment due to our CARES Act election.
(3) At March 31, 2021 and December 31, 2020, the carrying value of consumer mortgage TDR Loans includes $478 million and $487 million, respectively, of loans that are recorded at the lower of amortized cost or fair value of the collateral less cost to sell.
(4) Not included in the table at March 31, 2021 and December 31, 2020 are $646 million and $736 million, respectively, of consumer mortgage loans under COVID-19 related payment deferral programs where the borrowers were provided with extended payment deferral relief of more than six months that were exempted from TDR assessment due to our CARES Act election.
(5) At March 31, 2021 and December 31, 2020, the carrying value of TDR Loans includes $458 million and $463 million, respectively, of loans which are classified as nonaccrual.
The following table presents information about loans which were modified during the three months ended March 31, 2021 and 2020 and as a result of this action became classified as TDR Loans:Three Months Ended March 31, 2021 2020
(in millions)Commercial loans:
Business and corporate banking.............................................................................................................. $ 26 $ — Global banking........................................................................................................................................ 15 12 Total commercial.................................................................................................................................... 41 12
Consumer loans:Residential mortgages............................................................................................................................. 16 4 Home equity mortgages.......................................................................................................................... — 1 Credit cards............................................................................................................................................. 1 1 Total consumer........................................................................................................................................ 17 6
Total............................................................................................................................................................. $ 58 $ 18
The weighted-average contractual rate reduction for consumer loans which became classified as TDR Loans during the three months ended March 31, 2021 and 2020 was 1.97 percent and 3.04 percent, respectively. The weighted-average contractual rate reduction for commercial loans was not significant in either the number of loans or rate.
The following table presents consumer loans which were classified as TDR Loans during the previous 12 months which subsequently became 60 days or greater contractually delinquent during the three months ended March 31, 2021 and 2020:Three Months Ended March 31, 2021 2020
(in millions)Consumer loans:
Residential mortgages............................................................................................................................. $ 3 $ 1 Total consumer........................................................................................................................................ $ 3 $ 1
During the three months ended March 31, 2021 and 2020, there were no commercial TDR Loans which were classified as TDR Loans during the previous 12 months which subsequently became 90 days or greater contractually delinquent.
HSBC USA Inc.
21
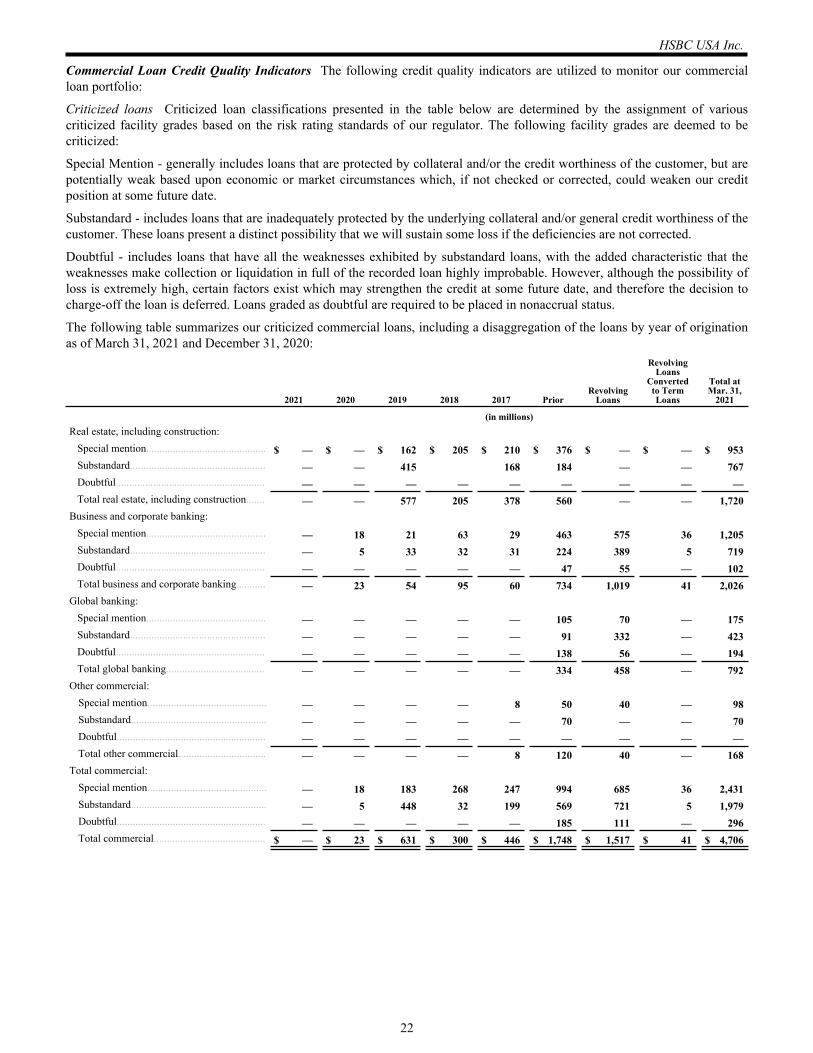
Commercial Loan Credit Quality Indicators The following credit quality indicators are utilized to monitor our commercial loan portfolio:
Criticized loans Criticized loan classifications presented in the table below are determined by the assignment of various criticized facility grades based on the risk rating standards of our regulator. The following facility grades are deemed to be criticized:
Special Mention - generally includes loans that are protected by collateral and/or the credit worthiness of the customer, but are potentially weak based upon economic or market circumstances which, if not checked or corrected, could weaken our credit position at some future date.
Substandard - includes loans that are inadequately protected by the underlying collateral and/or general credit worthiness of the customer. These loans present a distinct possibility that we will sustain some loss if the deficiencies are not corrected.
Doubtful - includes loans that have all the weaknesses exhibited by substandard loans, with the added characteristic that the weaknesses make collection or liquidation in full of the recorded loan highly improbable. However, although the possibility of loss is extremely high, certain factors exist which may strengthen the credit at some future date, and therefore the decision to charge-off the loan is deferred. Loans graded as doubtful are required to be placed in nonaccrual status.
The following table summarizes our criticized commercial loans, including a disaggregation of the loans by year of origination as of March 31, 2021 and December 31, 2020:
2021 2020 2019 2018 2017 PriorRevolving
Loans
Revolving Loans
Converted to Term Loans
Total at Mar. 31,
2021
(in millions)Real estate, including construction:
Special mention............................................. $ — $ — $ 162 $ 205 $ 210 $ 376 $ — $ — $ 953 Substandard................................................... — — 415 168 184 — — 767 Doubtful........................................................ — — — — — — — — — Total real estate, including construction....... — — 577 205 378 560 — — 1,720
Business and corporate banking:Special mention............................................. — 18 21 63 29 463 575 36 1,205 Substandard................................................... — 5 33 32 31 224 389 5 719 Doubtful........................................................ — — — — — 47 55 — 102 Total business and corporate banking........... — 23 54 95 60 734 1,019 41 2,026
Global banking:Special mention............................................. — — — — — 105 70 — 175 Substandard................................................... — — — — — 91 332 — 423 Doubtful........................................................ — — — — — 138 56 — 194 Total global banking..................................... — — — — — 334 458 — 792
Other commercial:Special mention............................................. — — — — 8 50 40 — 98 Substandard................................................... — — — — — 70 — — 70 Doubtful........................................................ — — — — — — — — — Total other commercial................................. — — — — 8 120 40 — 168
Total commercial:Special mention............................................. — 18 183 268 247 994 685 36 2,431 Substandard................................................... — 5 448 32 199 569 721 5 1,979 Doubtful........................................................ — — — — — 185 111 — 296 Total commercial.......................................... $ — $ 23 $ 631 $ 300 $ 446 $ 1,748 $ 1,517 $ 41 $ 4,706
HSBC USA Inc.
22

2020 2019 2018 2017 2016 PriorRevolving
Loans
Revolving Loans
Converted to Term Loans
Total at Dec. 31,
2020
(in millions)Real estate, including construction:
Special mention............................................. $ — $ 306 $ 115 $ 171 $ 85 $ 437 $ — $ — $ 1,114 Substandard................................................... — 186 — 169 — 86 — — 441 Doubtful........................................................ — — — — — — — — — Total real estate, including construction....... — 492 115 340 85 523 — — 1,555
Business and corporate banking:Special mention............................................. 17 71 43 32 10 390 600 48 1,211 Substandard................................................... 1 44 25 23 31 181 435 1 741 Doubtful........................................................ — — — — — 41 57 — 98 Total business and corporate banking........... 18 115 68 55 41 612 1,092 49 2,050
Global banking:Special mention............................................. — — — — — 142 98 — 240 Substandard................................................... — — 48 — — 131 477 — 656 Doubtful........................................................ — — — — — 82 160 — 242 Total global banking..................................... — — 48 — — 355 735 — 1,138
Other commercial:Special mention............................................. — — — — — 44 40 — 84 Substandard................................................... — — — — — 70 — — 70 Doubtful........................................................ — — — — — — — — — Total other commercial................................. — — — — — 114 40 — 154
Total commercial:Special mention............................................. 17 377 158 203 95 1,013 738 48 2,649 Substandard................................................... 1 230 73 192 31 468 912 1 1,908 Doubtful........................................................ — — — — — 123 217 — 340 Total commercial.......................................... $ 18 $ 607 $ 231 $ 395 $ 126 $ 1,604 $ 1,867 $ 49 $ 4,897
HSBC USA Inc.
23
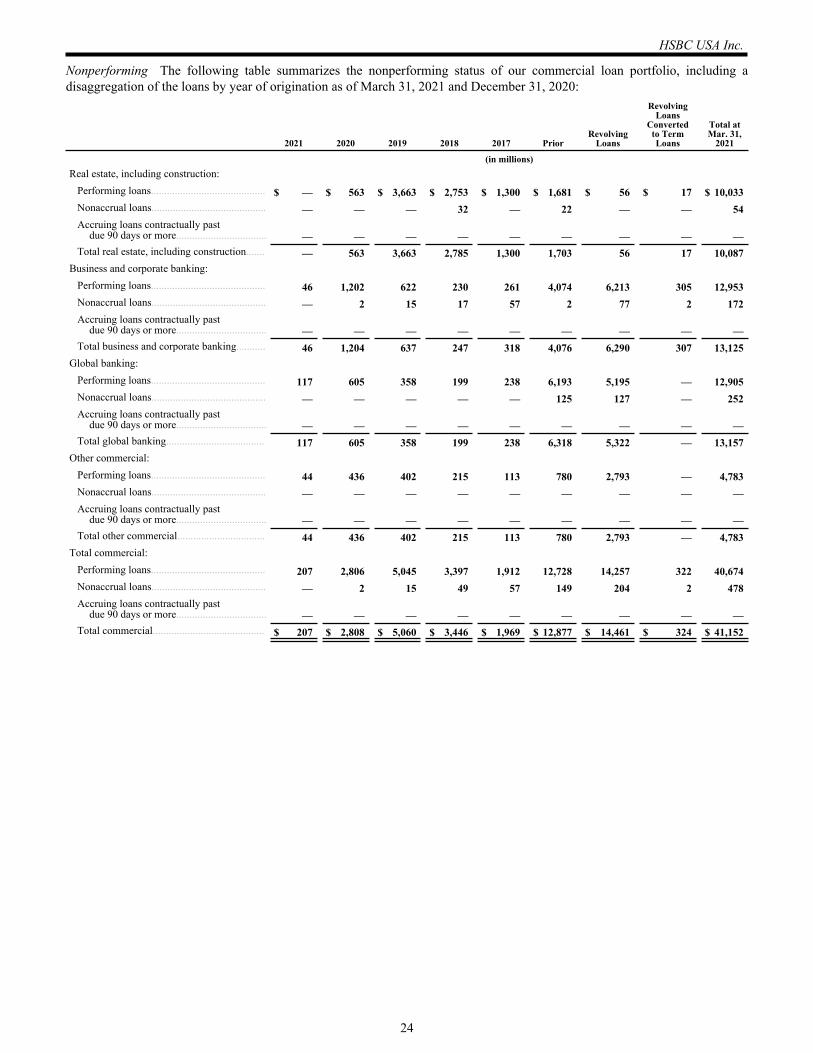
Nonperforming The following table summarizes the nonperforming status of our commercial loan portfolio, including a disaggregation of the loans by year of origination as of March 31, 2021 and December 31, 2020:
2021 2020 2019 2018 2017 PriorRevolving
Loans
Revolving Loans
Converted to Term Loans
Total at Mar. 31,
2021
(in millions)Real estate, including construction:
Performing loans........................................... $ — $ 563 $ 3,663 $ 2,753 $ 1,300 $ 1,681 $ 56 $ 17 $ 10,033 Nonaccrual loans........................................... — — — 32 — 22 — — 54 Accruing loans contractually past
due 90 days or more.................................. — — — — — — — — — Total real estate, including construction....... — 563 3,663 2,785 1,300 1,703 56 17 10,087
Business and corporate banking:Performing loans........................................... 46 1,202 622 230 261 4,074 6,213 305 12,953 Nonaccrual loans........................................... — 2 15 17 57 2 77 2 172 Accruing loans contractually past
due 90 days or more.................................. — — — — — — — — — Total business and corporate banking........... 46 1,204 637 247 318 4,076 6,290 307 13,125
Global banking:Performing loans........................................... 117 605 358 199 238 6,193 5,195 — 12,905 Nonaccrual loans........................................... — — — — — 125 127 — 252 Accruing loans contractually past
due 90 days or more.................................. — — — — — — — — — Total global banking..................................... 117 605 358 199 238 6,318 5,322 — 13,157
Other commercial:Performing loans........................................... 44 436 402 215 113 780 2,793 — 4,783 Nonaccrual loans........................................... — — — — — — — — — Accruing loans contractually past
due 90 days or more.................................. — — — — — — — — — Total other commercial................................. 44 436 402 215 113 780 2,793 — 4,783
Total commercial:Performing loans........................................... 207 2,806 5,045 3,397 1,912 12,728 14,257 322 40,674 Nonaccrual loans........................................... — 2 15 49 57 149 204 2 478 Accruing loans contractually past
due 90 days or more.................................. — — — — — — — — — Total commercial.......................................... $ 207 $ 2,808 $ 5,060 $ 3,446 $ 1,969 $ 12,877 $ 14,461 $ 324 $ 41,152
HSBC USA Inc.
24
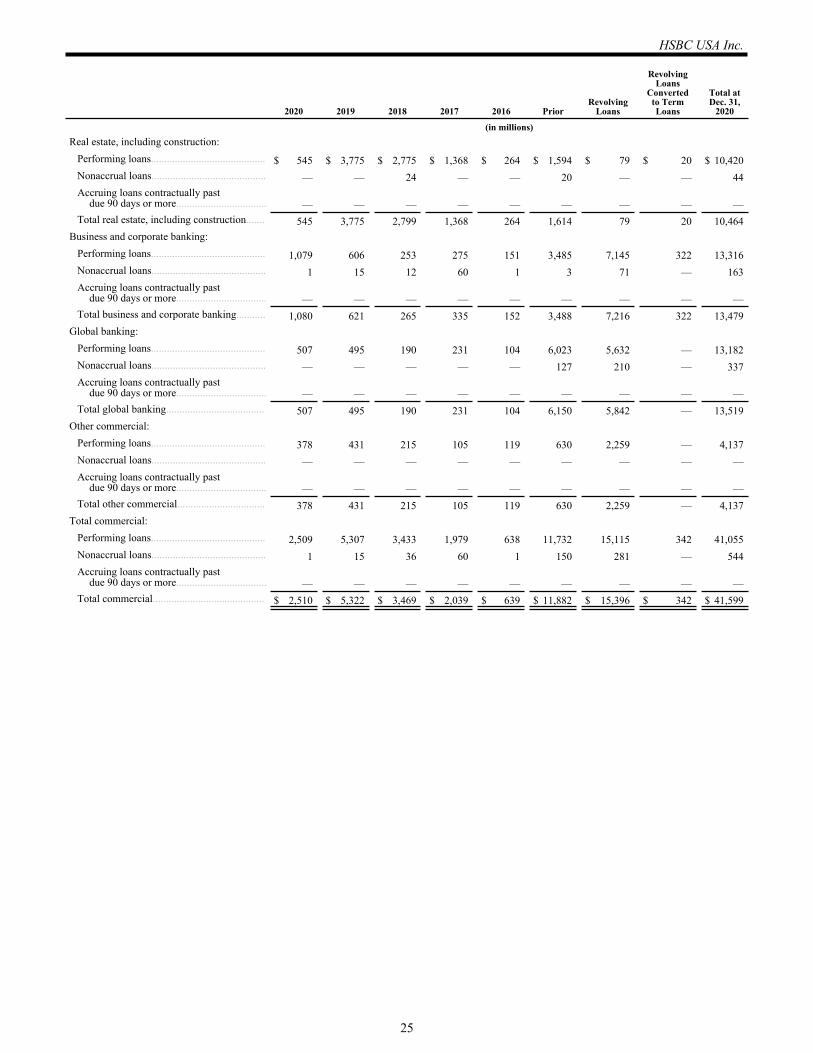
2020 2019 2018 2017 2016 PriorRevolving
Loans
Revolving Loans
Converted to Term Loans
Total at Dec. 31,
2020
(in millions)Real estate, including construction:
Performing loans........................................... $ 545 $ 3,775 $ 2,775 $ 1,368 $ 264 $ 1,594 $ 79 $ 20 $ 10,420 Nonaccrual loans........................................... — — 24 — — 20 — — 44 Accruing loans contractually past
due 90 days or more.................................. — — — — — — — — — Total real estate, including construction....... 545 3,775 2,799 1,368 264 1,614 79 20 10,464
Business and corporate banking:Performing loans........................................... 1,079 606 253 275 151 3,485 7,145 322 13,316 Nonaccrual loans........................................... 1 15 12 60 1 3 71 — 163 Accruing loans contractually past
due 90 days or more.................................. — — — — — — — — — Total business and corporate banking........... 1,080 621 265 335 152 3,488 7,216 322 13,479
Global banking:Performing loans........................................... 507 495 190 231 104 6,023 5,632 — 13,182 Nonaccrual loans........................................... — — — — — 127 210 — 337 Accruing loans contractually past
due 90 days or more.................................. — — — — — — — — — Total global banking..................................... 507 495 190 231 104 6,150 5,842 — 13,519
Other commercial:Performing loans........................................... 378 431 215 105 119 630 2,259 — 4,137 Nonaccrual loans........................................... — — — — — — — — — Accruing loans contractually past
due 90 days or more.................................. — — — — — — — — — Total other commercial................................. 378 431 215 105 119 630 2,259 — 4,137
Total commercial:Performing loans........................................... 2,509 5,307 3,433 1,979 638 11,732 15,115 342 41,055 Nonaccrual loans........................................... 1 15 36 60 1 150 281 — 544 Accruing loans contractually past
due 90 days or more.................................. — — — — — — — — — Total commercial.......................................... $ 2,510 $ 5,322 $ 3,469 $ 2,039 $ 639 $ 11,882 $ 15,396 $ 342 $ 41,599
HSBC USA Inc.
25
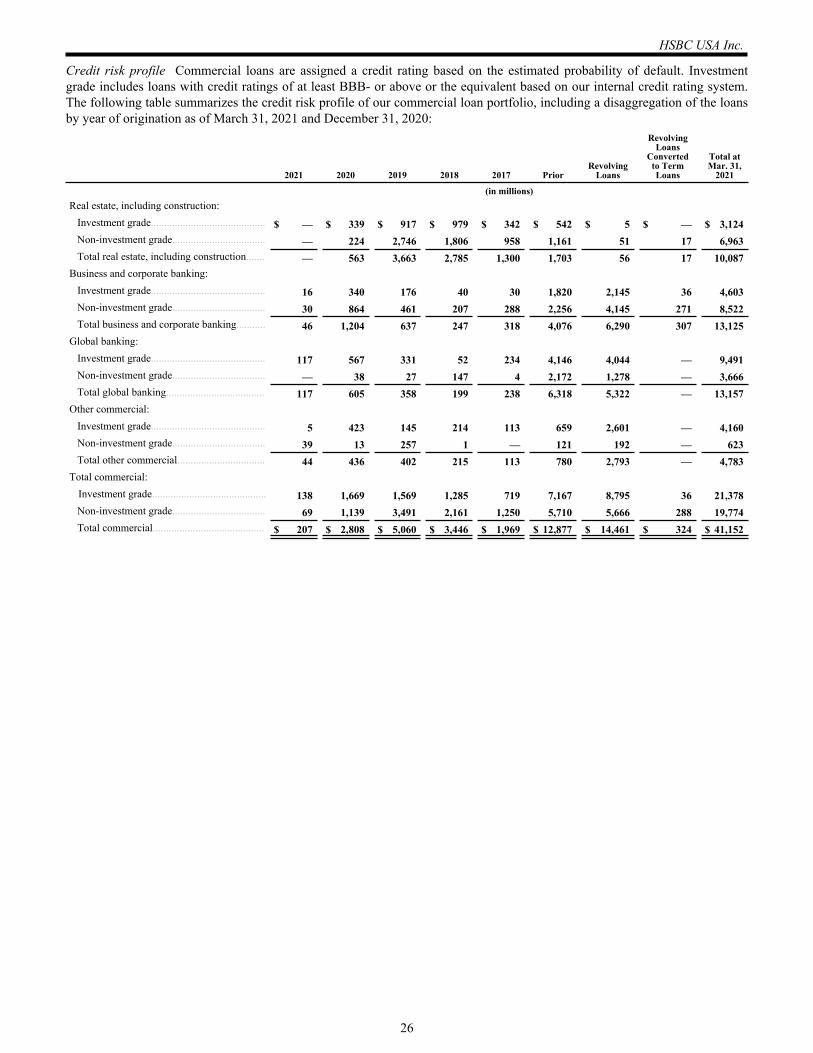
Credit risk profile Commercial loans are assigned a credit rating based on the estimated probability of default. Investment grade includes loans with credit ratings of at least BBB- or above or the equivalent based on our internal credit rating system. The following table summarizes the credit risk profile of our commercial loan portfolio, including a disaggregation of the loans by year of origination as of March 31, 2021 and December 31, 2020:
2021 2020 2019 2018 2017 PriorRevolving
Loans
Revolving Loans
Converted to Term Loans
Total at Mar. 31,
2021
(in millions)Real estate, including construction:
Investment grade........................................... $ — $ 339 $ 917 $ 979 $ 342 $ 542 $ 5 $ — $ 3,124 Non-investment grade................................... — 224 2,746 1,806 958 1,161 51 17 6,963 Total real estate, including construction....... — 563 3,663 2,785 1,300 1,703 56 17 10,087
Business and corporate banking:Investment grade........................................... 16 340 176 40 30 1,820 2,145 36 4,603 Non-investment grade................................... 30 864 461 207 288 2,256 4,145 271 8,522 Total business and corporate banking........... 46 1,204 637 247 318 4,076 6,290 307 13,125
Global banking:Investment grade........................................... 117 567 331 52 234 4,146 4,044 — 9,491 Non-investment grade................................... — 38 27 147 4 2,172 1,278 — 3,666 Total global banking..................................... 117 605 358 199 238 6,318 5,322 — 13,157
Other commercial:Investment grade........................................... 5 423 145 214 113 659 2,601 — 4,160 Non-investment grade................................... 39 13 257 1 — 121 192 — 623 Total other commercial................................. 44 436 402 215 113 780 2,793 — 4,783
Total commercial:Investment grade........................................... 138 1,669 1,569 1,285 719 7,167 8,795 36 21,378 Non-investment grade................................... 69 1,139 3,491 2,161 1,250 5,710 5,666 288 19,774 Total commercial.......................................... $ 207 $ 2,808 $ 5,060 $ 3,446 $ 1,969 $ 12,877 $ 14,461 $ 324 $ 41,152
HSBC USA Inc.
26
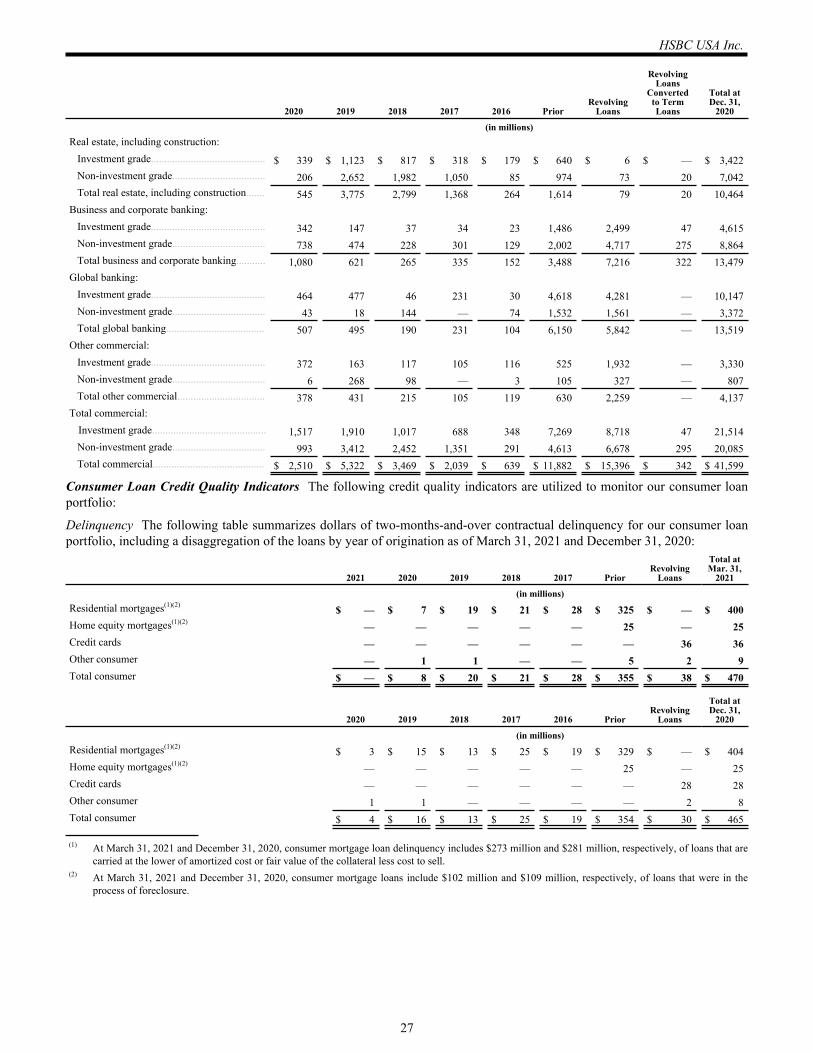
2020 2019 2018 2017 2016 PriorRevolving
Loans
Revolving Loans
Converted to Term Loans
Total at Dec. 31,
2020
(in millions)Real estate, including construction:
Investment grade........................................... $ 339 $ 1,123 $ 817 $ 318 $ 179 $ 640 $ 6 $ — $ 3,422 Non-investment grade................................... 206 2,652 1,982 1,050 85 974 73 20 7,042 Total real estate, including construction....... 545 3,775 2,799 1,368 264 1,614 79 20 10,464
Business and corporate banking:Investment grade........................................... 342 147 37 34 23 1,486 2,499 47 4,615 Non-investment grade................................... 738 474 228 301 129 2,002 4,717 275 8,864 Total business and corporate banking........... 1,080 621 265 335 152 3,488 7,216 322 13,479
Global banking:Investment grade........................................... 464 477 46 231 30 4,618 4,281 — 10,147 Non-investment grade................................... 43 18 144 — 74 1,532 1,561 — 3,372 Total global banking..................................... 507 495 190 231 104 6,150 5,842 — 13,519
Other commercial:Investment grade........................................... 372 163 117 105 116 525 1,932 — 3,330 Non-investment grade................................... 6 268 98 — 3 105 327 — 807 Total other commercial................................. 378 431 215 105 119 630 2,259 — 4,137
Total commercial:Investment grade........................................... 1,517 1,910 1,017 688 348 7,269 8,718 47 21,514 Non-investment grade................................... 993 3,412 2,452 1,351 291 4,613 6,678 295 20,085 Total commercial.......................................... $ 2,510 $ 5,322 $ 3,469 $ 2,039 $ 639 $ 11,882 $ 15,396 $ 342 $ 41,599
Consumer Loan Credit Quality Indicators The following credit quality indicators are utilized to monitor our consumer loan portfolio:
Delinquency The following table summarizes dollars of two-months-and-over contractual delinquency for our consumer loan portfolio, including a disaggregation of the loans by year of origination as of March 31, 2021 and December 31, 2020:
2021 2020 2019 2018 2017 PriorRevolving
Loans
Total at Mar. 31,
2021
(in millions)Residential mortgages(1)(2) $ — $ 7 $ 19 $ 21 $ 28 $ 325 $ — $ 400 Home equity mortgages(1)(2) — — — — — 25 — 25 Credit cards — — — — — — 36 36 Other consumer — 1 1 — — 5 2 9 Total consumer $ — $ 8 $ 20 $ 21 $ 28 $ 355 $ 38 $ 470
2020 2019 2018 2017 2016 PriorRevolving
Loans
Total at Dec. 31,
2020
(in millions)Residential mortgages(1)(2) $ 3 $ 15 $ 13 $ 25 $ 19 $ 329 $ — $ 404 Home equity mortgages(1)(2) — — — — — 25 — 25 Credit cards — — — — — — 28 28 Other consumer 1 1 — — — — 2 8 Total consumer $ 4 $ 16 $ 13 $ 25 $ 19 $ 354 $ 30 $ 465
(1) At March 31, 2021 and December 31, 2020, consumer mortgage loan delinquency includes $273 million and $281 million, respectively, of loans that are carried at the lower of amortized cost or fair value of the collateral less cost to sell.
(2) At March 31, 2021 and December 31, 2020, consumer mortgage loans include $102 million and $109 million, respectively, of loans that were in the process of foreclosure.
HSBC USA Inc.
27
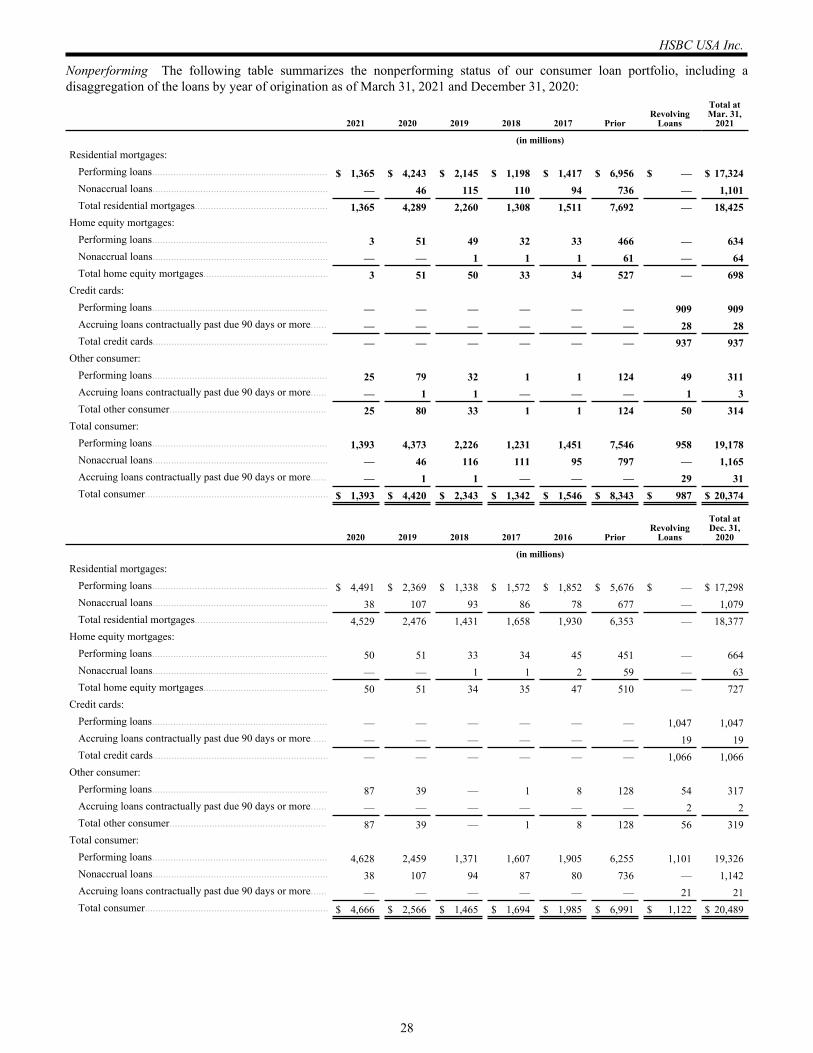
Nonperforming The following table summarizes the nonperforming status of our consumer loan portfolio, including a disaggregation of the loans by year of origination as of March 31, 2021 and December 31, 2020:
2021 2020 2019 2018 2017 PriorRevolving
Loans
Total at Mar. 31,
2021
(in millions)Residential mortgages:
Performing loans.................................................................. $ 1,365 $ 4,243 $ 2,145 $ 1,198 $ 1,417 $ 6,956 $ — $ 17,324 Nonaccrual loans.................................................................. — 46 115 110 94 736 — 1,101 Total residential mortgages.................................................. 1,365 4,289 2,260 1,308 1,511 7,692 — 18,425
Home equity mortgages:Performing loans.................................................................. 3 51 49 32 33 466 — 634 Nonaccrual loans.................................................................. — — 1 1 1 61 — 64 Total home equity mortgages............................................... 3 51 50 33 34 527 — 698
Credit cards:Performing loans.................................................................. — — — — — — 909 909 Accruing loans contractually past due 90 days or more...... — — — — — — 28 28 Total credit cards.................................................................. — — — — — — 937 937
Other consumer:Performing loans.................................................................. 25 79 32 1 1 124 49 311 Accruing loans contractually past due 90 days or more...... — 1 1 — — — 1 3 Total other consumer........................................................... 25 80 33 1 1 124 50 314
Total consumer:Performing loans.................................................................. 1,393 4,373 2,226 1,231 1,451 7,546 958 19,178 Nonaccrual loans.................................................................. — 46 116 111 95 797 — 1,165 Accruing loans contractually past due 90 days or more...... — 1 1 — — — 29 31 Total consumer..................................................................... $ 1,393 $ 4,420 $ 2,343 $ 1,342 $ 1,546 $ 8,343 $ 987 $ 20,374
2020 2019 2018 2017 2016 PriorRevolving
Loans
Total at Dec. 31,
2020
(in millions)Residential mortgages:
Performing loans.................................................................. $ 4,491 $ 2,369 $ 1,338 $ 1,572 $ 1,852 $ 5,676 $ — $ 17,298 Nonaccrual loans.................................................................. 38 107 93 86 78 677 — 1,079 Total residential mortgages.................................................. 4,529 2,476 1,431 1,658 1,930 6,353 — 18,377
Home equity mortgages:Performing loans.................................................................. 50 51 33 34 45 451 — 664 Nonaccrual loans.................................................................. — — 1 1 2 59 — 63 Total home equity mortgages............................................... 50 51 34 35 47 510 — 727
Credit cards:Performing loans.................................................................. — — — — — — 1,047 1,047 Accruing loans contractually past due 90 days or more...... — — — — — — 19 19 Total credit cards.................................................................. — — — — — — 1,066 1,066
Other consumer:Performing loans.................................................................. 87 39 — 1 8 128 54 317 Accruing loans contractually past due 90 days or more...... — — — — — — 2 2 Total other consumer........................................................... 87 39 — 1 8 128 56 319
Total consumer:Performing loans.................................................................. 4,628 2,459 1,371 1,607 1,905 6,255 1,101 19,326 Nonaccrual loans.................................................................. 38 107 94 87 80 736 — 1,142 Accruing loans contractually past due 90 days or more...... — — — — — — 21 21 Total consumer..................................................................... $ 4,666 $ 2,566 $ 1,465 $ 1,694 $ 1,985 $ 6,991 $ 1,122 $ 20,489
HSBC USA Inc.
28
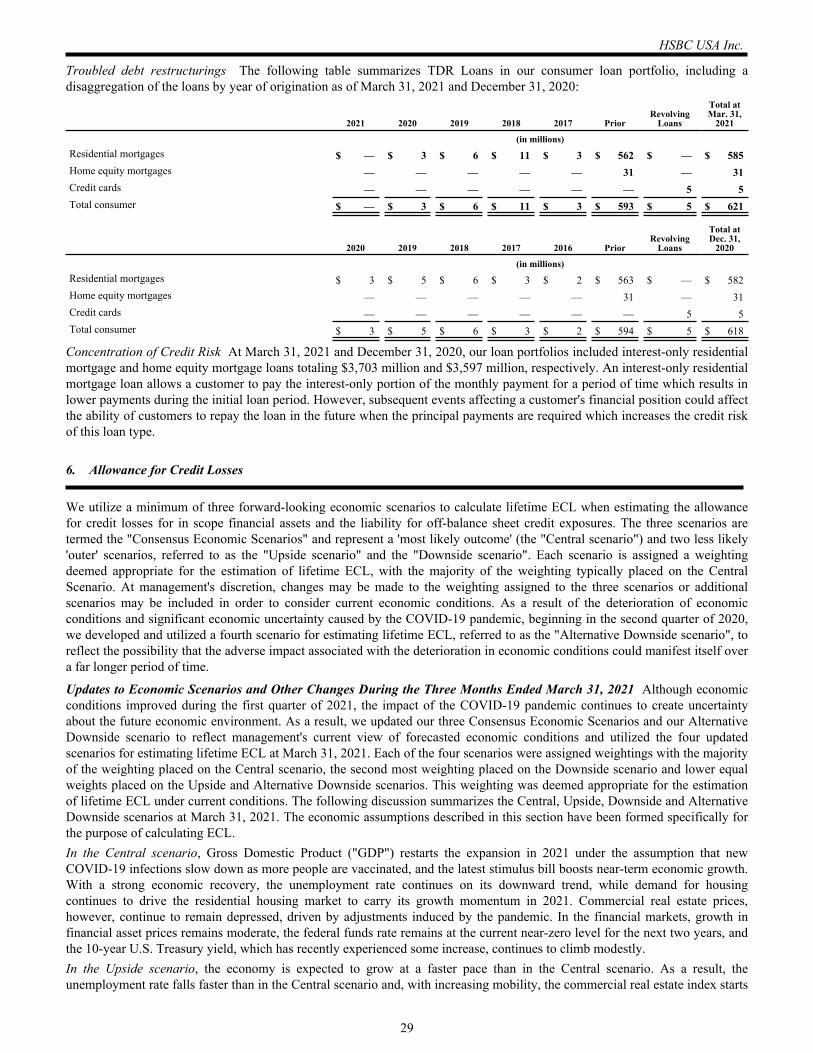
Troubled debt restructurings The following table summarizes TDR Loans in our consumer loan portfolio, including a disaggregation of the loans by year of origination as of March 31, 2021 and December 31, 2020:
2021 2020 2019 2018 2017 PriorRevolving
Loans
Total at Mar. 31,
2021
(in millions)Residential mortgages $ — $ 3 $ 6 $ 11 $ 3 $ 562 $ — $ 585 Home equity mortgages — — — — — 31 — 31 Credit cards — — — — — — 5 5 Total consumer $ — $ 3 $ 6 $ 11 $ 3 $ 593 $ 5 $ 621
2020 2019 2018 2017 2016 PriorRevolving
Loans
Total at Dec. 31,
2020
(in millions)Residential mortgages $ 3 $ 5 $ 6 $ 3 $ 2 $ 563 $ — $ 582 Home equity mortgages — — — — — 31 — 31 Credit cards — — — — — — 5 5 Total consumer $ 3 $ 5 $ 6 $ 3 $ 2 $ 594 $ 5 $ 618
Concentration of Credit Risk At March 31, 2021 and December 31, 2020, our loan portfolios included interest-only residential mortgage and home equity mortgage loans totaling $3,703 million and $3,597 million, respectively. An interest-only residential mortgage loan allows a customer to pay the interest-only portion of the monthly payment for a period of time which results in lower payments during the initial loan period. However, subsequent events affecting a customer's financial position could affect the ability of customers to repay the loan in the future when the principal payments are required which increases the credit risk of this loan type.
6. Allowance for Credit Losses
We utilize a minimum of three forward-looking economic scenarios to calculate lifetime ECL when estimating the allowance for credit losses for in scope financial assets and the liability for off-balance sheet credit exposures. The three scenarios are termed the "Consensus Economic Scenarios" and represent a 'most likely outcome' (the "Central scenario") and two less likely 'outer' scenarios, referred to as the "Upside scenario" and the "Downside scenario". Each scenario is assigned a weighting deemed appropriate for the estimation of lifetime ECL, with the majority of the weighting typically placed on the Central Scenario. At management's discretion, changes may be made to the weighting assigned to the three scenarios or additional scenarios may be included in order to consider current economic conditions. As a result of the deterioration of economic conditions and significant economic uncertainty caused by the COVID-19 pandemic, beginning in the second quarter of 2020, we developed and utilized a fourth scenario for estimating lifetime ECL, referred to as the "Alternative Downside scenario", to reflect the possibility that the adverse impact associated with the deterioration in economic conditions could manifest itself over a far longer period of time.
Updates to Economic Scenarios and Other Changes During the Three Months Ended March 31, 2021 Although economic conditions improved during the first quarter of 2021, the impact of the COVID-19 pandemic continues to create uncertainty about the future economic environment. As a result, we updated our three Consensus Economic Scenarios and our Alternative Downside scenario to reflect management's current view of forecasted economic conditions and utilized the four updated scenarios for estimating lifetime ECL at March 31, 2021. Each of the four scenarios were assigned weightings with the majority of the weighting placed on the Central scenario, the second most weighting placed on the Downside scenario and lower equal weights placed on the Upside and Alternative Downside scenarios. This weighting was deemed appropriate for the estimation of lifetime ECL under current conditions. The following discussion summarizes the Central, Upside, Downside and Alternative Downside scenarios at March 31, 2021. The economic assumptions described in this section have been formed specifically for the purpose of calculating ECL.In the Central scenario, Gross Domestic Product ("GDP") restarts the expansion in 2021 under the assumption that new COVID-19 infections slow down as more people are vaccinated, and the latest stimulus bill boosts near-term economic growth. With a strong economic recovery, the unemployment rate continues on its downward trend, while demand for housing continues to drive the residential housing market to carry its growth momentum in 2021. Commercial real estate prices, however, continue to remain depressed, driven by adjustments induced by the pandemic. In the financial markets, growth in financial asset prices remains moderate, the federal funds rate remains at the current near-zero level for the next two years, and the 10-year U.S. Treasury yield, which has recently experienced some increase, continues to climb modestly.In the Upside scenario, the economy is expected to grow at a faster pace than in the Central scenario. As a result, the unemployment rate falls faster than in the Central scenario and, with increasing mobility, the commercial real estate index starts
HSBC USA Inc.
29
to recover in the second half of 2021. In this scenario, the equity price index climbs with strong momentum, and overall optimism drives the 10-year U.S. Treasury yield to a level that is significantly higher than in the Central Scenario.In the Downside scenario, the re-opening of the economy is delayed due to a slow vaccine rollout and the economic recovery is quite anemic, with the unemployment rate reversing its downward trend and remaining at a high level. In this scenario, the residential housing market slowly loses its momentum due to weakness in the labor market and the commercial real estate market suffers a heavier blow than the residential housing market. The equity price index in this scenario loses about half of its value by the end of 2022, driven by an overall erosion of consumer and business sentiments, and the Federal Reserve Board ("FRB") keeps its policy rate at the lowest level for the next two years.In the Alternative Downside scenario, the U.S. economy re-enters into a recession in the second half of 2021 and stays in for most of 2022. An extended period of economic contraction and stagnation keeps the unemployment rate at a very high level, which pressures residential housing prices to fall further, while at the same time, contracting corporate activities and rising unemployment pushes the commercial real estate market into a severe downturn. In this scenario, financial markets experience a major sell-off and volatility in the financial markets remains extremely high in 2021, widening corporate credit spreads substantially, and flight to safe haven assets pushes the 10-year U.S. Treasury yield to near-zero levels in 2022.The following table presents the forecasted key macroeconomic variables in our Central scenarios used for estimating lifetime ECL at March 31, 2021 and December 31, 2020:
For the Quarter EndedJune 30, 2021 December 31, 2021 June 30, 2022 December 31, 2022
Unemployment rate (quarterly average):Forecast at March 31, 2021...................... 6.0 % 5.5 % 4.9 % 4.4 %Forecast at December 31, 2020................ 6.8 6.2 5.9 5.4
GDP growth rate (year-over-year):Forecast at March 31, 2021...................... 11.0 (1) 4.3 3.7 3.0 Forecast at December 31, 2020................ 9.2 (1) 5.3 3.1 1.8
(1) Represents the change in forecasted GDP for the quarter ended June 30, 2021 relative to the GDP for the quarter ended June 30, 2020. The GDP year-over-year growth rate for the quarter ended June 30, 2020 was a decline of 9.0 percent.
In addition to the updates to the economic scenarios, we decreased the management judgment allowance on our commercial loan portfolio for risk factors associated with economic uncertainty relating to the impact of COVID-19 that are not fully captured in the models. We also decreased the management judgment allowance on our consumer loan portfolio for risk factors primarily associated with forbearance accounts that are not fully captured in the models.
While we believe that the assumptions used in our credit loss models are reasonable within the parameters for which the models have been built and calibrated to operate, the severe projections of macro-economic variables during the current COVID-19 pandemic represent events outside the parameters for which the models have been built. As a result, adjustments to model outputs to reflect consideration of management judgment are used with stringent governance in place to ensure an appropriate lifetime ECL estimate.
The circumstances around the COVID-19 pandemic are evolving and will continue to impact our business and our allowance for credit losses in future periods. The details of how various U.S. Government actions will impact our customers and therefore the impact on our allowance for credit losses remains uncertain. We will continue to monitor the COVID-19 situation closely and will continue to adapt our Consensus Economic Scenarios approach as necessary to reflect management's current view of forecasted economic conditions.
HSBC USA Inc.
30
Allowance for Credit Losses / Liability for Off-Balance Sheet Credit Exposures The following table summarizes our allowance for credit losses and the liability for off-balance sheet credit exposures:
March 31, 2021
December 31, 2020
(in millions)
Allowance for credit losses:Loans............................................................................................................................................... $ 853 $ 1,015 Securities held-to-maturity(1)........................................................................................................... 2 2 Other financial assets measured at amortized cost(2)....................................................................... 2 2 Securities available-for-sale(1)......................................................................................................... 1 1
Total allowance for credit losses......................................................................................................... $ 858 $ 1,020
Liability for off-balance sheet credit exposures.................................................................................. $ 155 $ 237
(1) See Note 4, "Securities," for additional information regarding the allowance for credit losses associated with our security portfolios.(2) Primarily includes accrued interest receivables and customer acceptances.
The following table summarizes the changes in the allowance for credit losses on loans by product or line of business during the three months ended March 31, 2021 and 2020:
Three Months Ended March 31, 2021Allowance for credit losses – beginning of
period...................................................... $ 145 $ 375 $ 287 $ 7 $ (9) $ 22 $ 161 $ 27 $ 1,015 Provision charged (credited) to income...... (25) (53) (65) — (2) (3) (1) 4 (145)
Charge-offs.............................................. — (2) — — (1) — (18) (4) (25) Recoveries............................................... — 1 — — 3 2 2 — 8
Net (charge-offs) recoveries....................... — (1) — — 2 2 (16) (4) (17) Allowance for credit losses – end of period $ 120 $ 321 $ 222 $ 7 $ (9) $ 21 $ 144 $ 27 $ 853
Three Months Ended March 31, 2020Allowance for credit losses – beginning of
period...................................................... $ 153 $ 239 $ 106 $ 9 $ 12 $ 6 $ 105 $ 7 $ 637 Cumulative effect adjustment to initially
apply new accounting guidance for measuring credit losses(1)........................ (112) (60) 51 (5) (86) 7 32 3 (170)
Allowance for credit losses – beginning of period, adjusted...................................... 41 179 157 4 (74) 13 137 10 467
Provision charged (credited) to income...... 51 213 110 1 30 3 95 9 512 Charge-offs.............................................. — (12) (19) — 1 (2) (22) (2) (56) Recoveries............................................... — 2 — — 2 2 2 — 8
Net (charge-offs) recoveries....................... — (10) (19) — 3 — (20) (2) (48) Allowance for credit losses – end of period $ 92 $ 382 $ 248 $ 5 $ (41) $ 16 $ 212 $ 17 $ 931
Commercial Loans Consumer Loans
Real Estate, including
Construction
Businessand
Corporate Banking
GlobalBanking
OtherComm'l
ResidentialMortgages
HomeEquity
MortgagesCreditCards
OtherConsumer
Total Loans
(in millions)
(1) See Note 2, "Summary of Significant Accounting Policies and New Accounting Pronouncements," in our 2020 Form 10-K for additional discussion.
HSBC USA Inc.
31
The following table summarizes the changes in the liability for off-balance sheet credit exposures during the three months ended March 31, 2021 and 2020:Three Months Ended March 31, 2021 2020 (in millions)Balance at beginning of period.................................................................................................................... $ 237 $ 104 Cumulative effect adjustment to initially apply new accounting guidance for measuring credit losses(1).. — 54 Balance at beginning of period, adjusted..................................................................................................... 237 158 Provision charged (credited) to income....................................................................................................... (82) 213 Balance at end of period.............................................................................................................................. $ 155 $ 371
(1) See Note 2, "Summary of Significant Accounting Policies and New Accounting Pronouncements," in our 2020 Form 10-K for additional discussion
Accrued Interest Receivables The following table summarizes accrued interest receivables associated with financial assets carried at amortized cost and securities available-for-sale along with the related allowance for credit losses, which are reported net in other assets on the consolidated balance sheet. These accrued interest receivables are excluded from the amortized cost basis disclosures presented elsewhere in these financial statements, including Note 4, "Securities," and Note 5, "Loans."
March 31, 2021
December 31, 2020
(in millions)Accrued interest receivables:
Loans............................................................................................................................................... $ 137 $ 140 Securities held-to-maturity.............................................................................................................. 20 23 Other financial assets measured at amortized cost.......................................................................... 1 1 Securities available-for-sale............................................................................................................ 90 100
Total accrued interest receivables........................................................................................................ 248 264 Allowance for credit losses ................................................................................................................. 2 2 Accrued interest receivables, net......................................................................................................... $ 246 $ 262
During the three months ended March 31, 2021 and 2020, we charged-off accrued interest receivables by reversing interest income for loans of nil and $1 million, respectively.
7. Loans Held for Sale
Loans held for sale consisted of the following:March 31,
2021December 31,
2020
(in millions)Commercial loans:
Real estate, including construction.................................................................................................. $ — $ 10 Global banking................................................................................................................................ 256 119 Total commercial............................................................................................................................. 256 129
Consumer loans:Residential mortgages..................................................................................................................... 95 208 Total consumer................................................................................................................................ 95 208
Total loans held for sale....................................................................................................................... $ 351 $ 337
Commercial Loans Included in commercial loans held for sale are certain loans that we have elected to designate under the fair value option which consists of loans that we originate in connection with our participation in a number of syndicated credit facilities with the intent of selling them to unaffiliated third parties as well as loans that we purchase from the secondary market and hold as hedges against our exposure to certain total return swaps. The fair value of these loans totaled $83 million and $36 million at March 31, 2021 and December 31, 2020, respectively. See Note 10, "Fair Value Option," for additional information.
Commercial loans held for sale also includes certain loans that we no longer intend to hold for investment and were transferred to held for sale which totaled $173 million and $93 million at March 31, 2021 and December 31, 2020, respectively. During
HSBC USA Inc.
32
both the three months ended March 31, 2021 and 2020, we recorded no lower of amortized cost or fair value adjustments on commercial loans held for sale.
Consumer Loans Included in residential mortgage loans held for sale are agency-eligible residential mortgage loans which are originated and held for sale to third parties, currently on a servicing retained basis. Gains and losses from the sale of these residential mortgage loans are reflected as a component of other income in the consolidated statement of income (loss).
Loans held for sale are subject to market risk, liquidity risk and interest rate risk, in that their value will fluctuate as a result of changes in market conditions, as well as the credit environment. Interest rate risk for agency-eligible residential mortgage loans held for sale is partially mitigated through an economic hedging program to offset changes in the fair value of these mortgage loans held for sale, from the time of commitment to sale, attributable to changes in market interest rates. Revenue associated with this economic hedging program, which is reflected as a component of other income in the consolidated statement of income (loss), was a gain of $2 million during the three months ended March 31, 2021 compared with a loss of $3 million during the three months ended March 31, 2020.
Valuation Allowances Excluding the commercial loans designated under the fair value option discussed above, loans held for sale are recorded at the lower of amortized cost or fair value, with adjustments to fair value being recorded as a valuation allowance through other revenues. The valuation allowance on consumer loans held for sale was nil at both March 31, 2021 and December 31, 2020. The valuation allowance on commercial loans held for sale was $1 million at both March 31, 2021 and December 31, 2020.
8. Goodwill
Goodwill was $458 million at both March 31, 2021 and December 31, 2020. Goodwill for these periods reflects accumulated impairment losses of $1,819 million, which were recognized in prior periods. During the first quarter of 2021, there were no events or changes in circumstances to indicate that it is more likely than not the fair value of our Commercial Banking reporting unit has reduced below its carrying amount.
During the first quarter of 2020, as a result of the deterioration in economic conditions caused by the spread of the COVID-19 pandemic and its impact on our businesses including changes to the interest rate environment as a result of FRB actions to combat the economic effects of the virus, we performed an interim impairment test of goodwill and determined that the fair value of our Commercial Banking reporting unit exceeded its carrying value, including goodwill. However, the cash flow projections for our Retail Banking and Wealth Management and our Private Banking reporting units were significantly lower than previous estimates which, in conjunction with valuation estimates under a market approach and in consideration of a challenging macroeconomic outlook, resulted in a fair value that was significantly lower than their book values, including goodwill. As a result, we recorded a non-cash impairment charge of $784 million in the first quarter of 2020, representing the entire amount of goodwill previously allocated to these reporting units. Beginning in the second quarter of 2020, our Retail Banking and Wealth Management and our Private Banking reporting units are being reported together within a newly created Wealth and Personal Banking segment for segment reporting purposes.
9. Derivative Financial Instruments
In the normal course of business, the derivative instruments we enter into are for trading, market making and risk management purposes. For financial reporting purposes, derivative instruments are designated in one of the following categories: (a) hedging instruments designated as qualifying hedges under derivative and hedge accounting principles, (b) financial instruments held for trading or (c) non-qualifying economic hedges. The derivative instruments held are predominantly swaps, futures, options and forward contracts. All derivatives are stated at fair value. Where we enter into enforceable master netting agreements with counterparties, the master netting agreements permit us to net those derivative asset and liability positions and to offset cash collateral held and posted with the same counterparty.
The following table presents the fair value of derivative contracts by major product type on a gross basis. Gross fair values exclude the effects of both counterparty netting as well as collateral, and therefore are not representative of our exposure. The table below also presents the amounts of counterparty netting and cash collateral that have been offset in the consolidated balance sheet, as well as cash and securities collateral posted and received under enforceable master netting agreements that do not meet the criteria for netting. Derivative assets and liabilities which are not subject to an enforceable master netting agreement, or are subject to a netting agreement where an appropriate legal opinion to determine such agreements are enforceable has not been either sought or obtained, have not been netted in the following table. Where we have received or posted collateral under netting agreements where an appropriate legal opinion to determine such agreements are enforceable has not been either sought or obtained, the related collateral also has not been netted in the following table.
HSBC USA Inc.
33
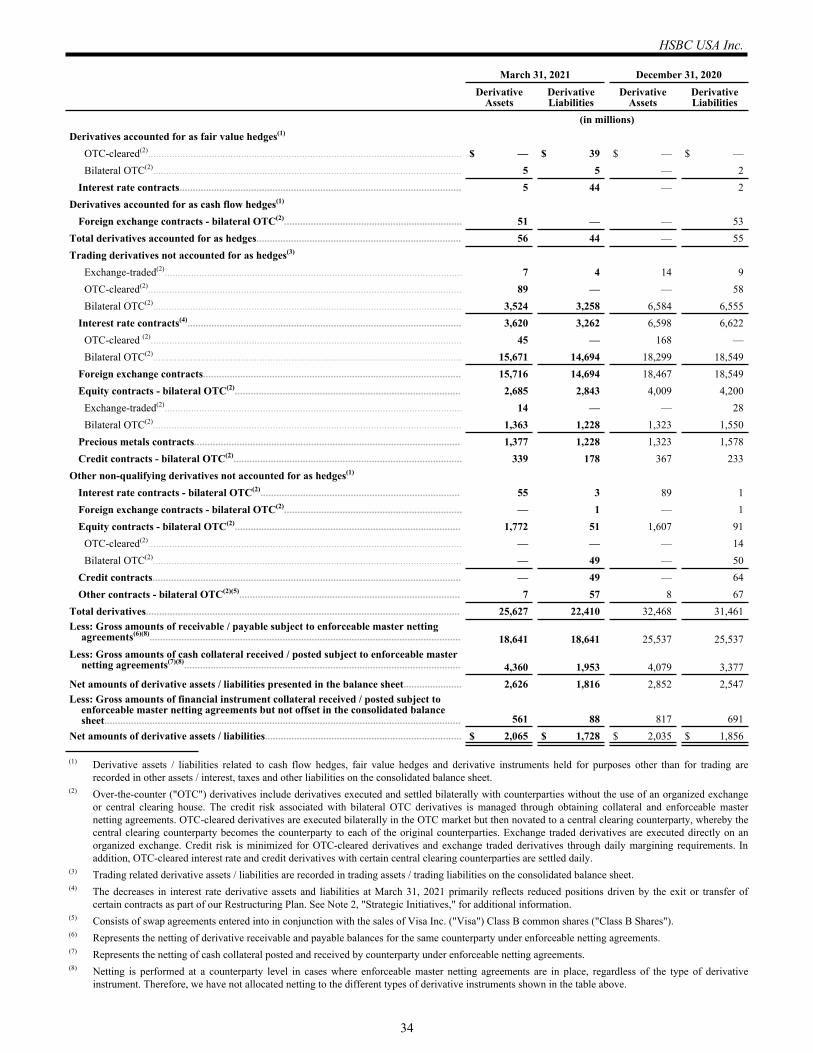
March 31, 2021 December 31, 2020Derivative
AssetsDerivative Liabilities
Derivative Assets
Derivative Liabilities
(in millions)Derivatives accounted for as fair value hedges(1)
OTC-cleared(2)...................................................................................................................... $ — $ 39 $ — $ — Bilateral OTC(2).................................................................................................................... 5 5 — 2
Interest rate contracts.......................................................................................................... 5 44 — 2 Derivatives accounted for as cash flow hedges(1)
Foreign exchange contracts - bilateral OTC(2)................................................................... 51 — — 53 Total derivatives accounted for as hedges............................................................................. 56 44 — 55 Trading derivatives not accounted for as hedges(3)
Exchange-traded(2)................................................................................................................ 7 4 14 9 OTC-cleared(2)...................................................................................................................... 89 — — 58 Bilateral OTC(2).................................................................................................................... 3,524 3,258 6,584 6,555
Interest rate contracts(4)....................................................................................................... 3,620 3,262 6,598 6,622 OTC-cleared (2)..................................................................................................................... 45 — 168 — Bilateral OTC(2).................................................................................................................... 15,671 14,694 18,299 18,549
Foreign exchange contracts................................................................................................. 15,716 14,694 18,467 18,549 Equity contracts - bilateral OTC(2)..................................................................................... 2,685 2,843 4,009 4,200
Exchange-traded(2)................................................................................................................ 14 — — 28 Bilateral OTC(2).................................................................................................................... 1,363 1,228 1,323 1,550
Precious metals contracts.................................................................................................... 1,377 1,228 1,323 1,578 Credit contracts - bilateral OTC(2)...................................................................................... 339 178 367 233
Other non-qualifying derivatives not accounted for as hedges(1)
Interest rate contracts - bilateral OTC(2)........................................................................... 55 3 89 1 Foreign exchange contracts - bilateral OTC(2)................................................................... — 1 — 1 Equity contracts - bilateral OTC(2)..................................................................................... 1,772 51 1,607 91
OTC-cleared(2)...................................................................................................................... — — — 14 Bilateral OTC(2).................................................................................................................... — 49 — 50
Credit contracts.................................................................................................................... — 49 — 64 Other contracts - bilateral OTC(2)(5)................................................................................... 7 57 8 67
Total derivatives...................................................................................................................... 25,627 22,410 32,468 31,461 Less: Gross amounts of receivable / payable subject to enforceable master netting
agreements(6)(8)..................................................................................................................... 18,641 18,641 25,537 25,537 Less: Gross amounts of cash collateral received / posted subject to enforceable master
netting agreements(7)(8)........................................................................................................ 4,360 1,953 4,079 3,377 Net amounts of derivative assets / liabilities presented in the balance sheet...................... 2,626 1,816 2,852 2,547 Less: Gross amounts of financial instrument collateral received / posted subject to
enforceable master netting agreements but not offset in the consolidated balance sheet...................................................................................................................................... 561 88 817 691
Net amounts of derivative assets / liabilities.......................................................................... $ 2,065 $ 1,728 $ 2,035 $ 1,856
(1) Derivative assets / liabilities related to cash flow hedges, fair value hedges and derivative instruments held for purposes other than for trading are recorded in other assets / interest, taxes and other liabilities on the consolidated balance sheet.
(2) Over-the-counter ("OTC") derivatives include derivatives executed and settled bilaterally with counterparties without the use of an organized exchange or central clearing house. The credit risk associated with bilateral OTC derivatives is managed through obtaining collateral and enforceable master netting agreements. OTC-cleared derivatives are executed bilaterally in the OTC market but then novated to a central clearing counterparty, whereby the central clearing counterparty becomes the counterparty to each of the original counterparties. Exchange traded derivatives are executed directly on an organized exchange. Credit risk is minimized for OTC-cleared derivatives and exchange traded derivatives through daily margining requirements. In addition, OTC-cleared interest rate and credit derivatives with certain central clearing counterparties are settled daily.
(3) Trading related derivative assets / liabilities are recorded in trading assets / trading liabilities on the consolidated balance sheet.(4) The decreases in interest rate derivative assets and liabilities at March 31, 2021 primarily reflects reduced positions driven by the exit or transfer of
certain contracts as part of our Restructuring Plan. See Note 2, "Strategic Initiatives," for additional information.(5) Consists of swap agreements entered into in conjunction with the sales of Visa Inc. ("Visa") Class B common shares ("Class B Shares").(6) Represents the netting of derivative receivable and payable balances for the same counterparty under enforceable netting agreements.(7) Represents the netting of cash collateral posted and received by counterparty under enforceable netting agreements.(8) Netting is performed at a counterparty level in cases where enforceable master netting agreements are in place, regardless of the type of derivative
instrument. Therefore, we have not allocated netting to the different types of derivative instruments shown in the table above.
HSBC USA Inc.
34
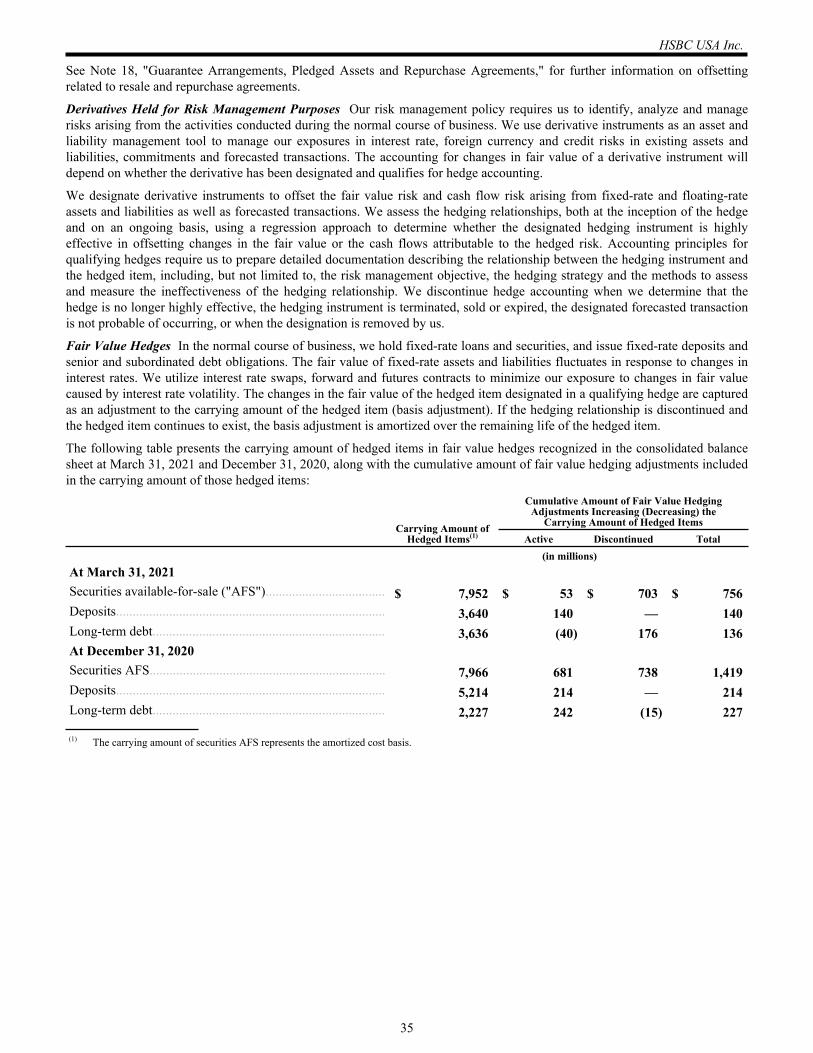
See Note 18, "Guarantee Arrangements, Pledged Assets and Repurchase Agreements," for further information on offsetting related to resale and repurchase agreements.
Derivatives Held for Risk Management Purposes Our risk management policy requires us to identify, analyze and manage risks arising from the activities conducted during the normal course of business. We use derivative instruments as an asset and liability management tool to manage our exposures in interest rate, foreign currency and credit risks in existing assets and liabilities, commitments and forecasted transactions. The accounting for changes in fair value of a derivative instrument will depend on whether the derivative has been designated and qualifies for hedge accounting.
We designate derivative instruments to offset the fair value risk and cash flow risk arising from fixed-rate and floating-rate assets and liabilities as well as forecasted transactions. We assess the hedging relationships, both at the inception of the hedge and on an ongoing basis, using a regression approach to determine whether the designated hedging instrument is highly effective in offsetting changes in the fair value or the cash flows attributable to the hedged risk. Accounting principles for qualifying hedges require us to prepare detailed documentation describing the relationship between the hedging instrument and the hedged item, including, but not limited to, the risk management objective, the hedging strategy and the methods to assess and measure the ineffectiveness of the hedging relationship. We discontinue hedge accounting when we determine that the hedge is no longer highly effective, the hedging instrument is terminated, sold or expired, the designated forecasted transaction is not probable of occurring, or when the designation is removed by us.
Fair Value Hedges In the normal course of business, we hold fixed-rate loans and securities, and issue fixed-rate deposits and senior and subordinated debt obligations. The fair value of fixed-rate assets and liabilities fluctuates in response to changes in interest rates. We utilize interest rate swaps, forward and futures contracts to minimize our exposure to changes in fair value caused by interest rate volatility. The changes in the fair value of the hedged item designated in a qualifying hedge are captured as an adjustment to the carrying amount of the hedged item (basis adjustment). If the hedging relationship is discontinued and the hedged item continues to exist, the basis adjustment is amortized over the remaining life of the hedged item.
The following table presents the carrying amount of hedged items in fair value hedges recognized in the consolidated balance sheet at March 31, 2021 and December 31, 2020, along with the cumulative amount of fair value hedging adjustments included in the carrying amount of those hedged items:
Carrying Amount of
Hedged Items(1)
Cumulative Amount of Fair Value Hedging Adjustments Increasing (Decreasing) the
Carrying Amount of Hedged ItemsActive Discontinued Total
(in millions)At March 31, 2021Securities available-for-sale ("AFS").................................... $ 7,952 $ 53 $ 703 $ 756 Deposits................................................................................. 3,640 140 — 140 Long-term debt...................................................................... 3,636 (40) 176 136 At December 31, 2020Securities AFS....................................................................... 7,966 681 738 1,419 Deposits................................................................................. 5,214 214 — 214 Long-term debt...................................................................... 2,227 242 (15) 227
(1) The carrying amount of securities AFS represents the amortized cost basis.
HSBC USA Inc.
35
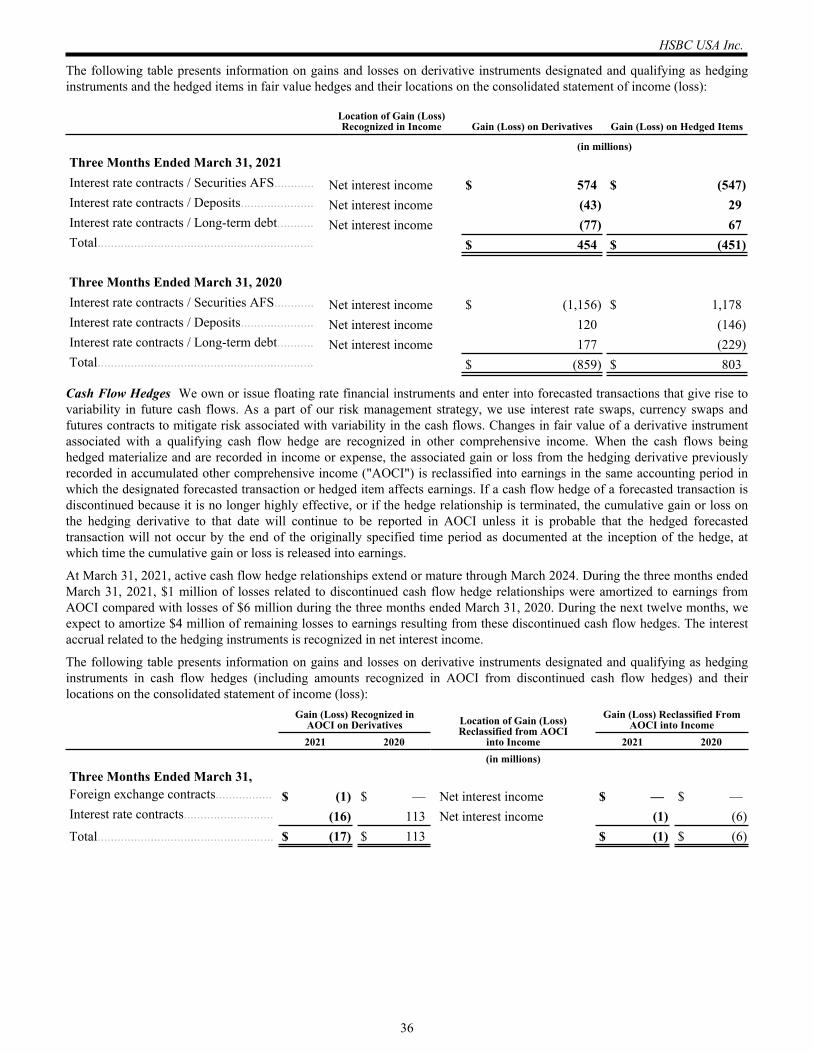
The following table presents information on gains and losses on derivative instruments designated and qualifying as hedging instruments and the hedged items in fair value hedges and their locations on the consolidated statement of income (loss):
Location of Gain (Loss) Recognized in Income Gain (Loss) on Derivatives Gain (Loss) on Hedged Items
(in millions)Three Months Ended March 31, 2021Interest rate contracts / Securities AFS............ Net interest income $ 574 $ (547) Interest rate contracts / Deposits...................... Net interest income (43) 29 Interest rate contracts / Long-term debt........... Net interest income (77) 67 Total................................................................. $ 454 $ (451)
Three Months Ended March 31, 2020Interest rate contracts / Securities AFS............ Net interest income $ (1,156) $ 1,178 Interest rate contracts / Deposits...................... Net interest income 120 (146) Interest rate contracts / Long-term debt........... Net interest income 177 (229) Total................................................................. $ (859) $ 803
Cash Flow Hedges We own or issue floating rate financial instruments and enter into forecasted transactions that give rise to variability in future cash flows. As a part of our risk management strategy, we use interest rate swaps, currency swaps and futures contracts to mitigate risk associated with variability in the cash flows. Changes in fair value of a derivative instrument associated with a qualifying cash flow hedge are recognized in other comprehensive income. When the cash flows being hedged materialize and are recorded in income or expense, the associated gain or loss from the hedging derivative previously recorded in accumulated other comprehensive income ("AOCI") is reclassified into earnings in the same accounting period in which the designated forecasted transaction or hedged item affects earnings. If a cash flow hedge of a forecasted transaction is discontinued because it is no longer highly effective, or if the hedge relationship is terminated, the cumulative gain or loss on the hedging derivative to that date will continue to be reported in AOCI unless it is probable that the hedged forecasted transaction will not occur by the end of the originally specified time period as documented at the inception of the hedge, at which time the cumulative gain or loss is released into earnings.
At March 31, 2021, active cash flow hedge relationships extend or mature through March 2024. During the three months ended March 31, 2021, $1 million of losses related to discontinued cash flow hedge relationships were amortized to earnings from AOCI compared with losses of $6 million during the three months ended March 31, 2020. During the next twelve months, we expect to amortize $4 million of remaining losses to earnings resulting from these discontinued cash flow hedges. The interest accrual related to the hedging instruments is recognized in net interest income.
The following table presents information on gains and losses on derivative instruments designated and qualifying as hedging instruments in cash flow hedges (including amounts recognized in AOCI from discontinued cash flow hedges) and their locations on the consolidated statement of income (loss):
Gain (Loss) Recognized in
AOCI on Derivatives Location of Gain (Loss)Reclassified from AOCI
into Income
Gain (Loss) Reclassified FromAOCI into Income
2021 2020 2021 2020 (in millions)
Three Months Ended March 31,Foreign exchange contracts................. $ (1) $ — Net interest income $ — $ — Interest rate contracts........................... (16) 113 Net interest income (1) (6) Total..................................................... $ (17) $ 113 $ (1) $ (6)
HSBC USA Inc.
36
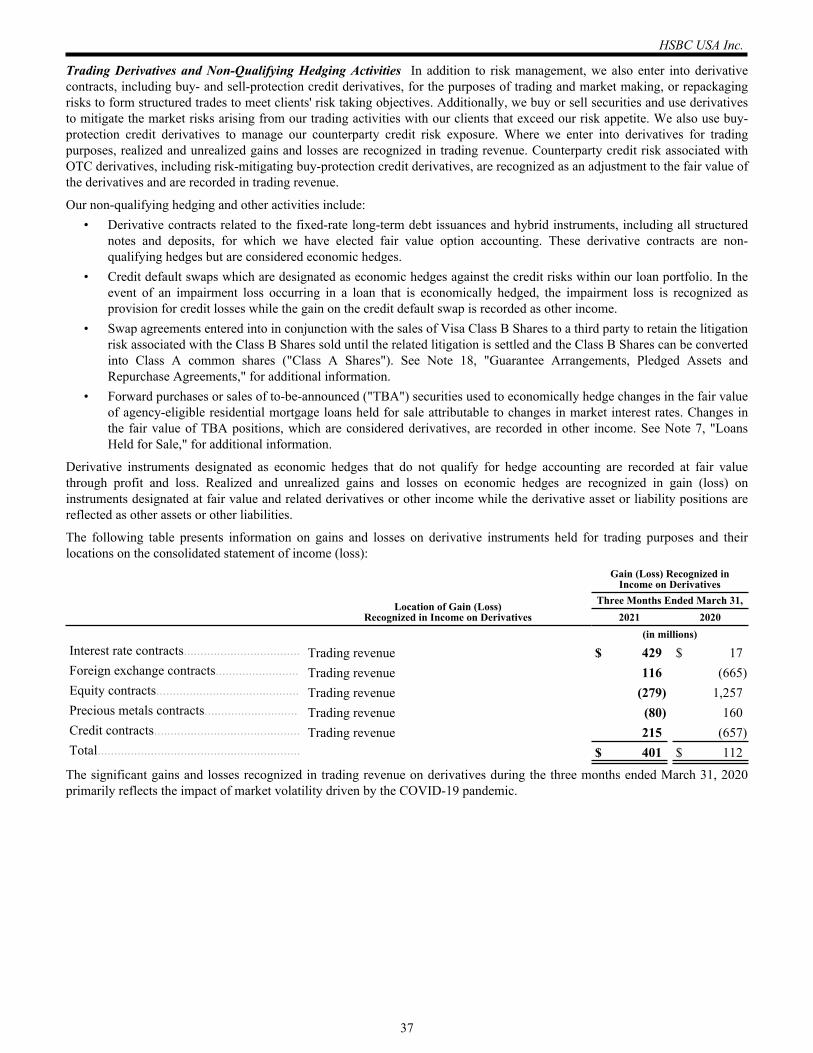
Trading Derivatives and Non-Qualifying Hedging Activities In addition to risk management, we also enter into derivative contracts, including buy- and sell-protection credit derivatives, for the purposes of trading and market making, or repackaging risks to form structured trades to meet clients' risk taking objectives. Additionally, we buy or sell securities and use derivatives to mitigate the market risks arising from our trading activities with our clients that exceed our risk appetite. We also use buy-protection credit derivatives to manage our counterparty credit risk exposure. Where we enter into derivatives for trading purposes, realized and unrealized gains and losses are recognized in trading revenue. Counterparty credit risk associated with OTC derivatives, including risk-mitigating buy-protection credit derivatives, are recognized as an adjustment to the fair value of the derivatives and are recorded in trading revenue.
Our non-qualifying hedging and other activities include:• Derivative contracts related to the fixed-rate long-term debt issuances and hybrid instruments, including all structured
notes and deposits, for which we have elected fair value option accounting. These derivative contracts are non-qualifying hedges but are considered economic hedges.
• Credit default swaps which are designated as economic hedges against the credit risks within our loan portfolio. In the event of an impairment loss occurring in a loan that is economically hedged, the impairment loss is recognized as provision for credit losses while the gain on the credit default swap is recorded as other income.
• Swap agreements entered into in conjunction with the sales of Visa Class B Shares to a third party to retain the litigation risk associated with the Class B Shares sold until the related litigation is settled and the Class B Shares can be converted into Class A common shares ("Class A Shares"). See Note 18, "Guarantee Arrangements, Pledged Assets and Repurchase Agreements," for additional information.
• Forward purchases or sales of to-be-announced ("TBA") securities used to economically hedge changes in the fair value of agency-eligible residential mortgage loans held for sale attributable to changes in market interest rates. Changes in the fair value of TBA positions, which are considered derivatives, are recorded in other income. See Note 7, "Loans Held for Sale," for additional information.
Derivative instruments designated as economic hedges that do not qualify for hedge accounting are recorded at fair value through profit and loss. Realized and unrealized gains and losses on economic hedges are recognized in gain (loss) on instruments designated at fair value and related derivatives or other income while the derivative asset or liability positions are reflected as other assets or other liabilities.
The following table presents information on gains and losses on derivative instruments held for trading purposes and their locations on the consolidated statement of income (loss):
Location of Gain (Loss)
Recognized in Income on Derivatives
Gain (Loss) Recognized in Income on Derivatives
Three Months Ended March 31,2021 2020
(in millions)Interest rate contracts................................... Trading revenue $ 429 $ 17 Foreign exchange contracts......................... Trading revenue 116 (665) Equity contracts........................................... Trading revenue (279) 1,257 Precious metals contracts............................ Trading revenue (80) 160 Credit contracts............................................ Trading revenue 215 (657) Total............................................................. $ 401 $ 112
The significant gains and losses recognized in trading revenue on derivatives during the three months ended March 31, 2020 primarily reflects the impact of market volatility driven by the COVID-19 pandemic.
HSBC USA Inc.
37
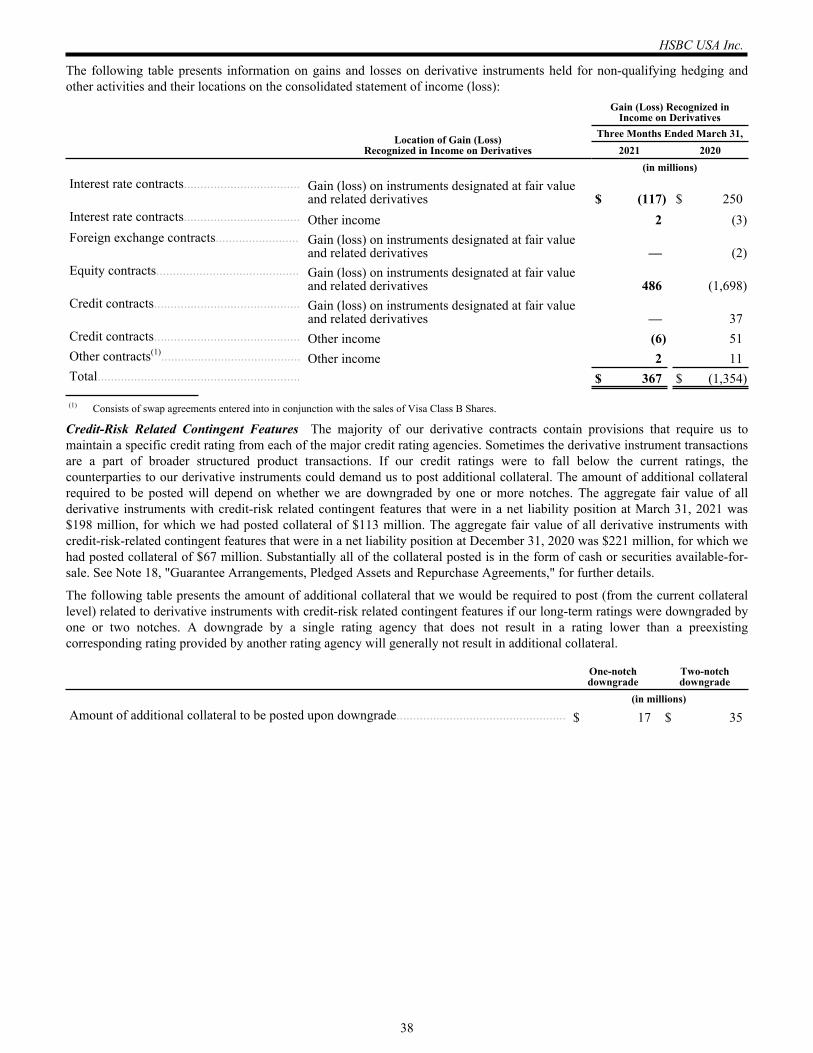
The following table presents information on gains and losses on derivative instruments held for non-qualifying hedging and other activities and their locations on the consolidated statement of income (loss):
Location of Gain (Loss)
Recognized in Income on Derivatives
Gain (Loss) Recognized in Income on Derivatives
Three Months Ended March 31,2021 2020
(in millions)Interest rate contracts................................... Gain (loss) on instruments designated at fair value
and related derivatives $ (117) $ 250 Interest rate contracts................................... Other income 2 (3) Foreign exchange contracts......................... Gain (loss) on instruments designated at fair value
and related derivatives — (2) Equity contracts........................................... Gain (loss) on instruments designated at fair value
and related derivatives 486 (1,698) Credit contracts............................................ Gain (loss) on instruments designated at fair value
and related derivatives — 37 Credit contracts............................................ Other income (6) 51 Other contracts(1).......................................... Other income 2 11 Total............................................................. $ 367 $ (1,354)
(1) Consists of swap agreements entered into in conjunction with the sales of Visa Class B Shares.
Credit-Risk Related Contingent Features The majority of our derivative contracts contain provisions that require us to maintain a specific credit rating from each of the major credit rating agencies. Sometimes the derivative instrument transactions are a part of broader structured product transactions. If our credit ratings were to fall below the current ratings, the counterparties to our derivative instruments could demand us to post additional collateral. The amount of additional collateral required to be posted will depend on whether we are downgraded by one or more notches. The aggregate fair value of all derivative instruments with credit-risk related contingent features that were in a net liability position at March 31, 2021 was $198 million, for which we had posted collateral of $113 million. The aggregate fair value of all derivative instruments with credit-risk-related contingent features that were in a net liability position at December 31, 2020 was $221 million, for which we had posted collateral of $67 million. Substantially all of the collateral posted is in the form of cash or securities available-for-sale. See Note 18, "Guarantee Arrangements, Pledged Assets and Repurchase Agreements," for further details.
The following table presents the amount of additional collateral that we would be required to post (from the current collateral level) related to derivative instruments with credit-risk related contingent features if our long-term ratings were downgraded by one or two notches. A downgrade by a single rating agency that does not result in a rating lower than a preexisting corresponding rating provided by another rating agency will generally not result in additional collateral.
One-notch downgrade
Two-notch downgrade
(in millions)Amount of additional collateral to be posted upon downgrade................................................... $ 17 $ 35
HSBC USA Inc.
38
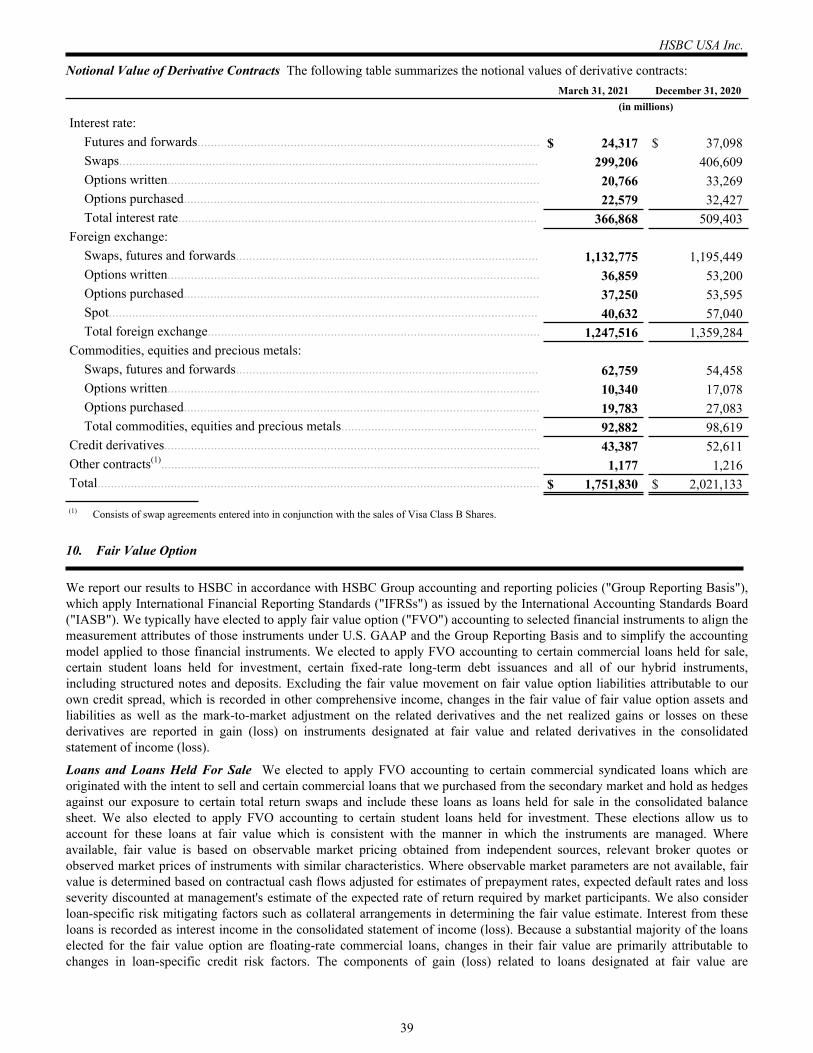
Notional Value of Derivative Contracts The following table summarizes the notional values of derivative contracts:March 31, 2021 December 31, 2020
(in millions)Interest rate:
Futures and forwards....................................................................................................... $ 24,317 $ 37,098 Swaps.............................................................................................................................. 299,206 406,609 Options written................................................................................................................ 20,766 33,269 Options purchased........................................................................................................... 22,579 32,427 Total interest rate............................................................................................................ 366,868 509,403
Foreign exchange:Swaps, futures and forwards........................................................................................... 1,132,775 1,195,449 Options written................................................................................................................ 36,859 53,200 Options purchased........................................................................................................... 37,250 53,595 Spot................................................................................................................................. 40,632 57,040 Total foreign exchange.................................................................................................... 1,247,516 1,359,284
Commodities, equities and precious metals:Swaps, futures and forwards........................................................................................... 62,759 54,458 Options written................................................................................................................ 10,340 17,078 Options purchased........................................................................................................... 19,783 27,083 Total commodities, equities and precious metals........................................................... 92,882 98,619
Credit derivatives................................................................................................................. 43,387 52,611 Other contracts(1).................................................................................................................. 1,177 1,216 Total..................................................................................................................................... $ 1,751,830 $ 2,021,133
(1) Consists of swap agreements entered into in conjunction with the sales of Visa Class B Shares.
10. Fair Value Option
We report our results to HSBC in accordance with HSBC Group accounting and reporting policies ("Group Reporting Basis"), which apply International Financial Reporting Standards ("IFRSs") as issued by the International Accounting Standards Board ("IASB"). We typically have elected to apply fair value option ("FVO") accounting to selected financial instruments to align the measurement attributes of those instruments under U.S. GAAP and the Group Reporting Basis and to simplify the accounting model applied to those financial instruments. We elected to apply FVO accounting to certain commercial loans held for sale, certain student loans held for investment, certain fixed-rate long-term debt issuances and all of our hybrid instruments, including structured notes and deposits. Excluding the fair value movement on fair value option liabilities attributable to our own credit spread, which is recorded in other comprehensive income, changes in the fair value of fair value option assets and liabilities as well as the mark-to-market adjustment on the related derivatives and the net realized gains or losses on these derivatives are reported in gain (loss) on instruments designated at fair value and related derivatives in the consolidated statement of income (loss).
Loans and Loans Held For Sale We elected to apply FVO accounting to certain commercial syndicated loans which are originated with the intent to sell and certain commercial loans that we purchased from the secondary market and hold as hedges against our exposure to certain total return swaps and include these loans as loans held for sale in the consolidated balance sheet. We also elected to apply FVO accounting to certain student loans held for investment. These elections allow us to account for these loans at fair value which is consistent with the manner in which the instruments are managed. Where available, fair value is based on observable market pricing obtained from independent sources, relevant broker quotes or observed market prices of instruments with similar characteristics. Where observable market parameters are not available, fair value is determined based on contractual cash flows adjusted for estimates of prepayment rates, expected default rates and loss severity discounted at management's estimate of the expected rate of return required by market participants. We also consider loan-specific risk mitigating factors such as collateral arrangements in determining the fair value estimate. Interest from these loans is recorded as interest income in the consolidated statement of income (loss). Because a substantial majority of the loans elected for the fair value option are floating-rate commercial loans, changes in their fair value are primarily attributable to changes in loan-specific credit risk factors. The components of gain (loss) related to loans designated at fair value are
HSBC USA Inc.
39
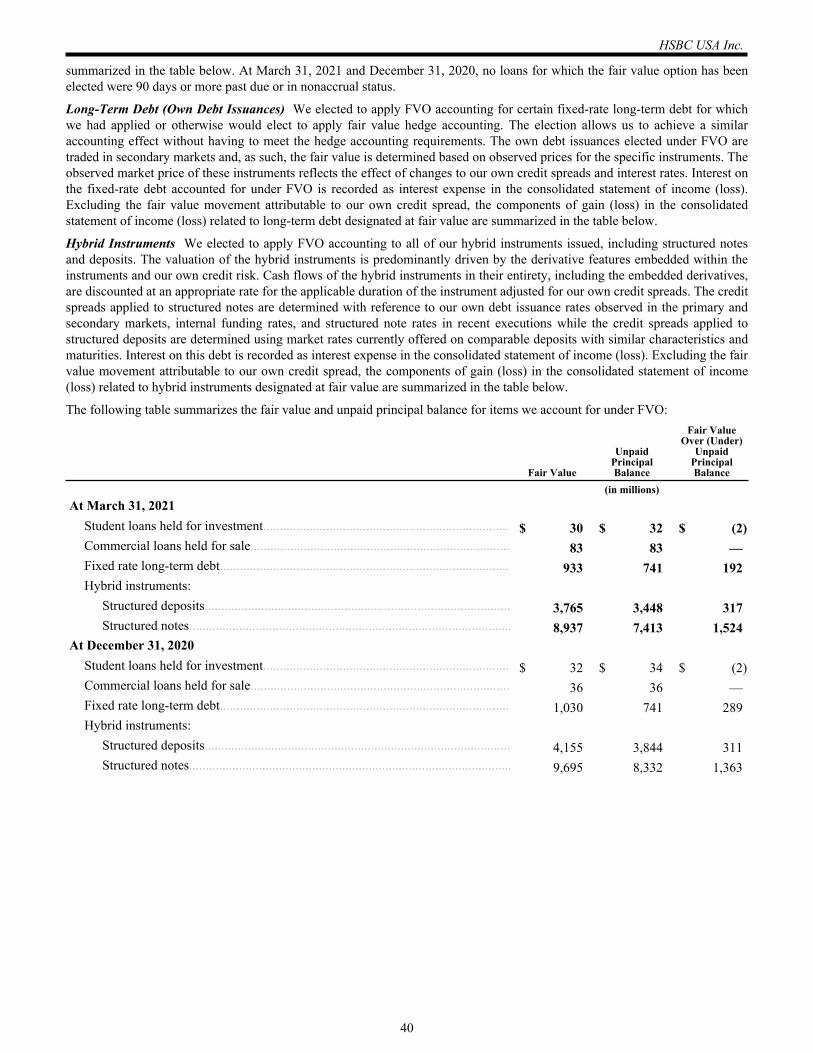
summarized in the table below. At March 31, 2021 and December 31, 2020, no loans for which the fair value option has been elected were 90 days or more past due or in nonaccrual status.
Long-Term Debt (Own Debt Issuances) We elected to apply FVO accounting for certain fixed-rate long-term debt for which we had applied or otherwise would elect to apply fair value hedge accounting. The election allows us to achieve a similar accounting effect without having to meet the hedge accounting requirements. The own debt issuances elected under FVO are traded in secondary markets and, as such, the fair value is determined based on observed prices for the specific instruments. The observed market price of these instruments reflects the effect of changes to our own credit spreads and interest rates. Interest on the fixed-rate debt accounted for under FVO is recorded as interest expense in the consolidated statement of income (loss). Excluding the fair value movement attributable to our own credit spread, the components of gain (loss) in the consolidated statement of income (loss) related to long-term debt designated at fair value are summarized in the table below.
Hybrid Instruments We elected to apply FVO accounting to all of our hybrid instruments issued, including structured notes and deposits. The valuation of the hybrid instruments is predominantly driven by the derivative features embedded within the instruments and our own credit risk. Cash flows of the hybrid instruments in their entirety, including the embedded derivatives, are discounted at an appropriate rate for the applicable duration of the instrument adjusted for our own credit spreads. The credit spreads applied to structured notes are determined with reference to our own debt issuance rates observed in the primary and secondary markets, internal funding rates, and structured note rates in recent executions while the credit spreads applied to structured deposits are determined using market rates currently offered on comparable deposits with similar characteristics and maturities. Interest on this debt is recorded as interest expense in the consolidated statement of income (loss). Excluding the fair value movement attributable to our own credit spread, the components of gain (loss) in the consolidated statement of income (loss) related to hybrid instruments designated at fair value are summarized in the table below.
The following table summarizes the fair value and unpaid principal balance for items we account for under FVO:
Fair Value
Unpaid Principal Balance
Fair Value Over (Under)
Unpaid Principal Balance
(in millions)At March 31, 2021
Student loans held for investment.......................................................................... $ 30 $ 32 $ (2) Commercial loans held for sale.............................................................................. 83 83 — Fixed rate long-term debt....................................................................................... 933 741 192 Hybrid instruments:
Structured deposits............................................................................................ 3,765 3,448 317 Structured notes................................................................................................. 8,937 7,413 1,524
At December 31, 2020Student loans held for investment.......................................................................... $ 32 $ 34 $ (2) Commercial loans held for sale.............................................................................. 36 36 — Fixed rate long-term debt....................................................................................... 1,030 741 289 Hybrid instruments:
Structured deposits............................................................................................ 4,155 3,844 311 Structured notes................................................................................................. 9,695 8,332 1,363
HSBC USA Inc.
40
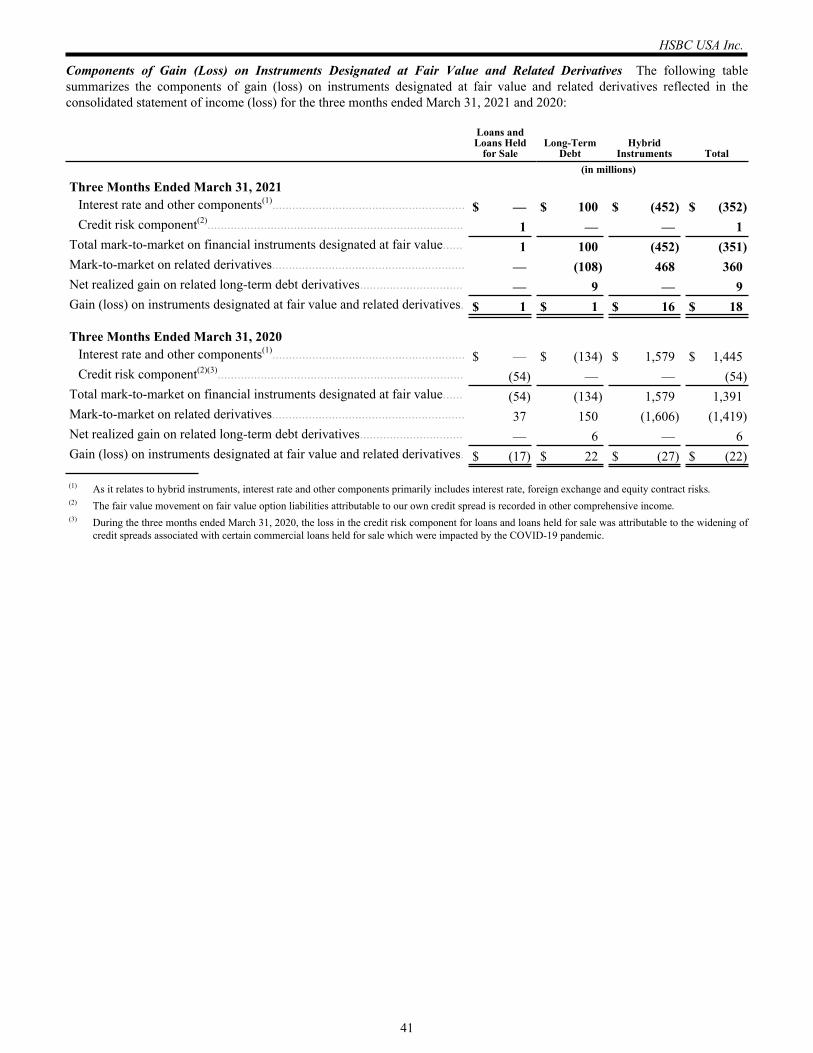
Components of Gain (Loss) on Instruments Designated at Fair Value and Related Derivatives The following table summarizes the components of gain (loss) on instruments designated at fair value and related derivatives reflected in the consolidated statement of income (loss) for the three months ended March 31, 2021 and 2020:
Loans and Loans Held
for SaleLong-Term
DebtHybrid
Instruments Total(in millions)
Three Months Ended March 31, 2021Interest rate and other components(1).......................................................... $ — $ 100 $ (452) $ (352) Credit risk component(2)............................................................................. 1 — — 1
Total mark-to-market on financial instruments designated at fair value...... 1 100 (452) (351) Mark-to-market on related derivatives.......................................................... — (108) 468 360 Net realized gain on related long-term debt derivatives............................... — 9 — 9 Gain (loss) on instruments designated at fair value and related derivatives. $ 1 $ 1 $ 16 $ 18
Three Months Ended March 31, 2020Interest rate and other components(1).......................................................... $ — $ (134) $ 1,579 $ 1,445 Credit risk component(2)(3).......................................................................... (54) — — (54)
Total mark-to-market on financial instruments designated at fair value...... (54) (134) 1,579 1,391 Mark-to-market on related derivatives.......................................................... 37 150 (1,606) (1,419) Net realized gain on related long-term debt derivatives............................... — 6 — 6 Gain (loss) on instruments designated at fair value and related derivatives. $ (17) $ 22 $ (27) $ (22)
(1) As it relates to hybrid instruments, interest rate and other components primarily includes interest rate, foreign exchange and equity contract risks.(2) The fair value movement on fair value option liabilities attributable to our own credit spread is recorded in other comprehensive income.(3) During the three months ended March 31, 2020, the loss in the credit risk component for loans and loans held for sale was attributable to the widening of
credit spreads associated with certain commercial loans held for sale which were impacted by the COVID-19 pandemic.
HSBC USA Inc.
41
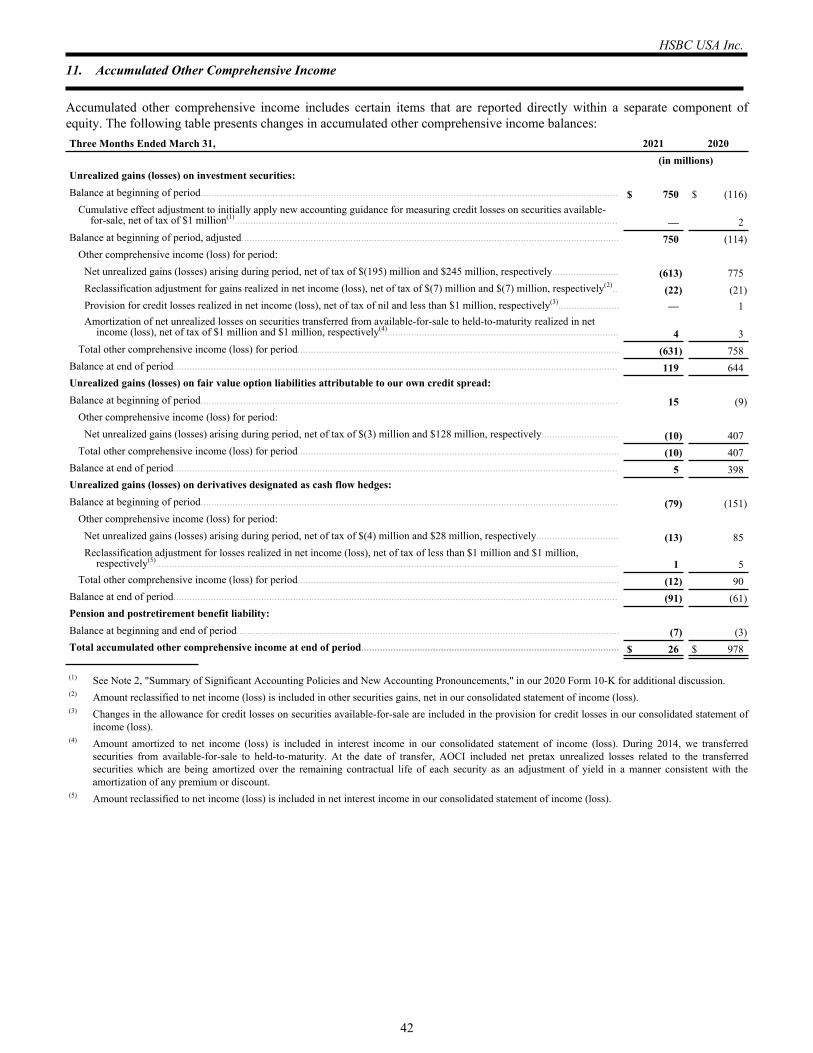
11. Accumulated Other Comprehensive Income
Accumulated other comprehensive income includes certain items that are reported directly within a separate component of equity. The following table presents changes in accumulated other comprehensive income balances:Three Months Ended March 31, 2021 2020 (in millions)Unrealized gains (losses) on investment securities:Balance at beginning of period............................................................................................................................................................. $ 750 $ (116)
Cumulative effect adjustment to initially apply new accounting guidance for measuring credit losses on securities available-for-sale, net of tax of $1 million(1)................................................................................................................................................ — 2
Balance at beginning of period, adjusted.............................................................................................................................................. 750 (114) Other comprehensive income (loss) for period:
Net unrealized gains (losses) arising during period, net of tax of $(195) million and $245 million, respectively......................... (613) 775 Reclassification adjustment for gains realized in net income (loss), net of tax of $(7) million and $(7) million, respectively(2).. (22) (21) Provision for credit losses realized in net income (loss), net of tax of nil and less than $1 million, respectively(3)....................... — 1 Amortization of net unrealized losses on securities transferred from available-for-sale to held-to-maturity realized in net
income (loss), net of tax of $1 million and $1 million, respectively(4)....................................................................................... 4 3 Total other comprehensive income (loss) for period......................................................................................................................... (631) 758
Balance at end of period....................................................................................................................................................................... 119 644 Unrealized gains (losses) on fair value option liabilities attributable to our own credit spread:Balance at beginning of period............................................................................................................................................................. 15 (9)
Other comprehensive income (loss) for period:Net unrealized gains (losses) arising during period, net of tax of $(3) million and $128 million, respectively............................. (10) 407
Total other comprehensive income (loss) for period......................................................................................................................... (10) 407 Balance at end of period....................................................................................................................................................................... 5 398 Unrealized gains (losses) on derivatives designated as cash flow hedges:Balance at beginning of period............................................................................................................................................................. (79) (151)
Other comprehensive income (loss) for period:Net unrealized gains (losses) arising during period, net of tax of $(4) million and $28 million, respectively............................... (13) 85 Reclassification adjustment for losses realized in net income (loss), net of tax of less than $1 million and $1 million,
respectively(5).............................................................................................................................................................................. 1 5 Total other comprehensive income (loss) for period......................................................................................................................... (12) 90
Balance at end of period....................................................................................................................................................................... (91) (61) Pension and postretirement benefit liability:Balance at beginning and end of period................................................................................................................................................ (7) (3) Total accumulated other comprehensive income at end of period................................................................................................. $ 26 $ 978
(1) See Note 2, "Summary of Significant Accounting Policies and New Accounting Pronouncements," in our 2020 Form 10-K for additional discussion. (2) Amount reclassified to net income (loss) is included in other securities gains, net in our consolidated statement of income (loss).(3) Changes in the allowance for credit losses on securities available-for-sale are included in the provision for credit losses in our consolidated statement of
income (loss).(4) Amount amortized to net income (loss) is included in interest income in our consolidated statement of income (loss). During 2014, we transferred
securities from available-for-sale to held-to-maturity. At the date of transfer, AOCI included net pretax unrealized losses related to the transferred securities which are being amortized over the remaining contractual life of each security as an adjustment of yield in a manner consistent with the amortization of any premium or discount.
(5) Amount reclassified to net income (loss) is included in net interest income in our consolidated statement of income (loss).
HSBC USA Inc.
42
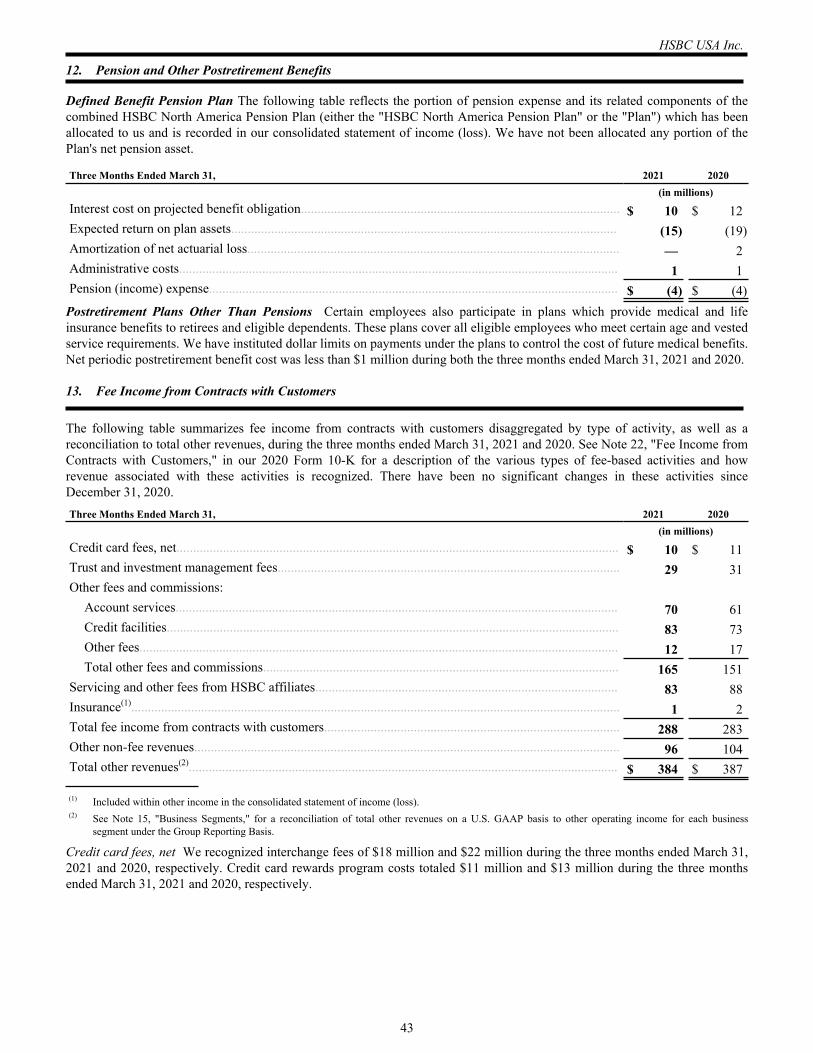
12. Pension and Other Postretirement Benefits
Defined Benefit Pension Plan The following table reflects the portion of pension expense and its related components of the combined HSBC North America Pension Plan (either the "HSBC North America Pension Plan" or the "Plan") which has been allocated to us and is recorded in our consolidated statement of income (loss). We have not been allocated any portion of the Plan's net pension asset.
Three Months Ended March 31, 2021 2020 (in millions)Interest cost on projected benefit obligation................................................................................................ $ 10 $ 12 Expected return on plan assets.................................................................................................................... (15) (19) Amortization of net actuarial loss................................................................................................................ — 2 Administrative costs.................................................................................................................................... 1 1 Pension (income) expense........................................................................................................................... $ (4) $ (4)
Postretirement Plans Other Than Pensions Certain employees also participate in plans which provide medical and life insurance benefits to retirees and eligible dependents. These plans cover all eligible employees who meet certain age and vested service requirements. We have instituted dollar limits on payments under the plans to control the cost of future medical benefits. Net periodic postretirement benefit cost was less than $1 million during both the three months ended March 31, 2021 and 2020.
13. Fee Income from Contracts with Customers
The following table summarizes fee income from contracts with customers disaggregated by type of activity, as well as a reconciliation to total other revenues, during the three months ended March 31, 2021 and 2020. See Note 22, "Fee Income from Contracts with Customers," in our 2020 Form 10-K for a description of the various types of fee-based activities and how revenue associated with these activities is recognized. There have been no significant changes in these activities since December 31, 2020.Three Months Ended March 31, 2021 2020 (in millions)Credit card fees, net..................................................................................................................................... $ 10 $ 11 Trust and investment management fees....................................................................................................... 29 31 Other fees and commissions:
Account services..................................................................................................................................... 70 61 Credit facilities........................................................................................................................................ 83 73 Other fees................................................................................................................................................ 12 17 Total other fees and commissions........................................................................................................... 165 151
Servicing and other fees from HSBC affiliates........................................................................................... 83 88 Insurance(1)................................................................................................................................................... 1 2 Total fee income from contracts with customers......................................................................................... 288 283 Other non-fee revenues................................................................................................................................ 96 104 Total other revenues(2)................................................................................................................................. $ 384 $ 387
(1) Included within other income in the consolidated statement of income (loss).(2) See Note 15, "Business Segments," for a reconciliation of total other revenues on a U.S. GAAP basis to other operating income for each business
segment under the Group Reporting Basis.
Credit card fees, net We recognized interchange fees of $18 million and $22 million during the three months ended March 31, 2021 and 2020, respectively. Credit card rewards program costs totaled $11 million and $13 million during the three months ended March 31, 2021 and 2020, respectively.
HSBC USA Inc.
43
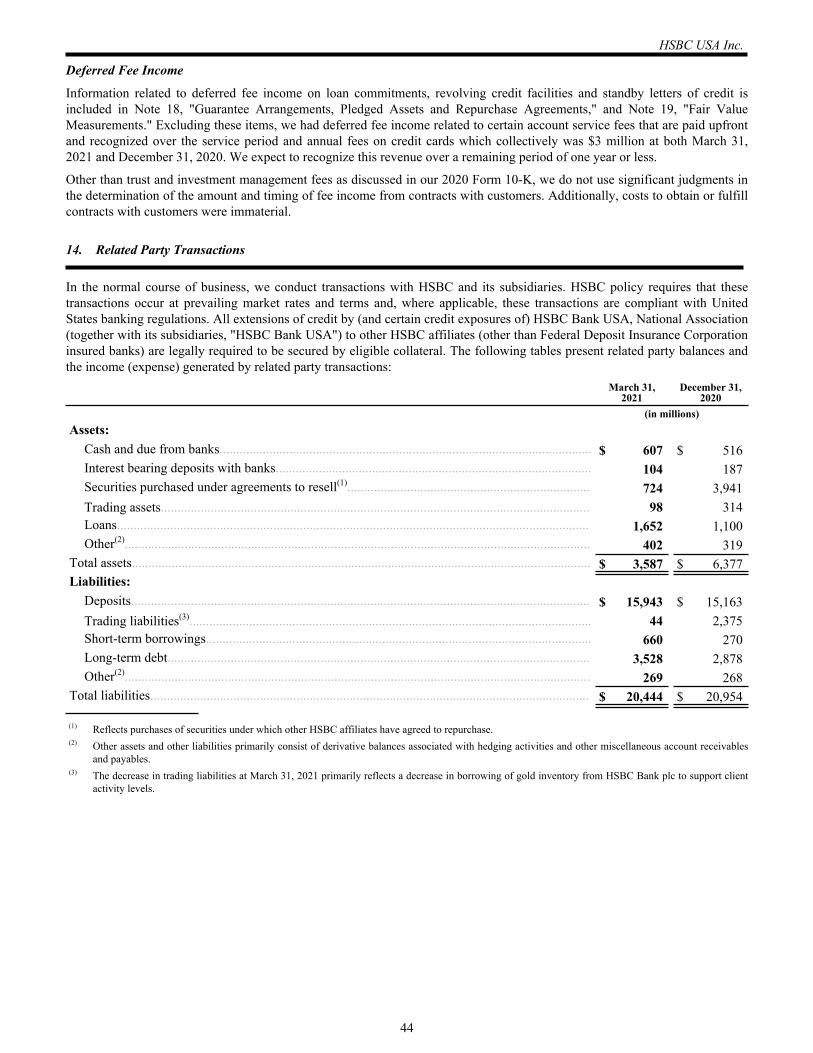
Deferred Fee Income
Information related to deferred fee income on loan commitments, revolving credit facilities and standby letters of credit is included in Note 18, "Guarantee Arrangements, Pledged Assets and Repurchase Agreements," and Note 19, "Fair Value Measurements." Excluding these items, we had deferred fee income related to certain account service fees that are paid upfront and recognized over the service period and annual fees on credit cards which collectively was $3 million at both March 31, 2021 and December 31, 2020. We expect to recognize this revenue over a remaining period of one year or less.
Other than trust and investment management fees as discussed in our 2020 Form 10-K, we do not use significant judgments in the determination of the amount and timing of fee income from contracts with customers. Additionally, costs to obtain or fulfill contracts with customers were immaterial.
14. Related Party Transactions
In the normal course of business, we conduct transactions with HSBC and its subsidiaries. HSBC policy requires that these transactions occur at prevailing market rates and terms and, where applicable, these transactions are compliant with United States banking regulations. All extensions of credit by (and certain credit exposures of) HSBC Bank USA, National Association (together with its subsidiaries, "HSBC Bank USA") to other HSBC affiliates (other than Federal Deposit Insurance Corporation insured banks) are legally required to be secured by eligible collateral. The following tables present related party balances and the income (expense) generated by related party transactions:
March 31, 2021
December 31, 2020
(in millions)Assets:
Cash and due from banks................................................................................................................ $ 607 $ 516 Interest bearing deposits with banks............................................................................................... 104 187 Securities purchased under agreements to resell(1)......................................................................... 724 3,941 Trading assets................................................................................................................................. 98 314 Loans.............................................................................................................................................. 1,652 1,100 Other(2)............................................................................................................................................ 402 319
Total assets.......................................................................................................................................... $ 3,587 $ 6,377 Liabilities:
Deposits.......................................................................................................................................... $ 15,943 $ 15,163 Trading liabilities(3)......................................................................................................................... 44 2,375 Short-term borrowings.................................................................................................................... 660 270 Long-term debt............................................................................................................................... 3,528 2,878 Other(2)............................................................................................................................................ 269 268
Total liabilities.................................................................................................................................... $ 20,444 $ 20,954
(1) Reflects purchases of securities under which other HSBC affiliates have agreed to repurchase.(2) Other assets and other liabilities primarily consist of derivative balances associated with hedging activities and other miscellaneous account receivables
and payables.(3) The decrease in trading liabilities at March 31, 2021 primarily reflects a decrease in borrowing of gold inventory from HSBC Bank plc to support client
activity levels.
HSBC USA Inc.
44
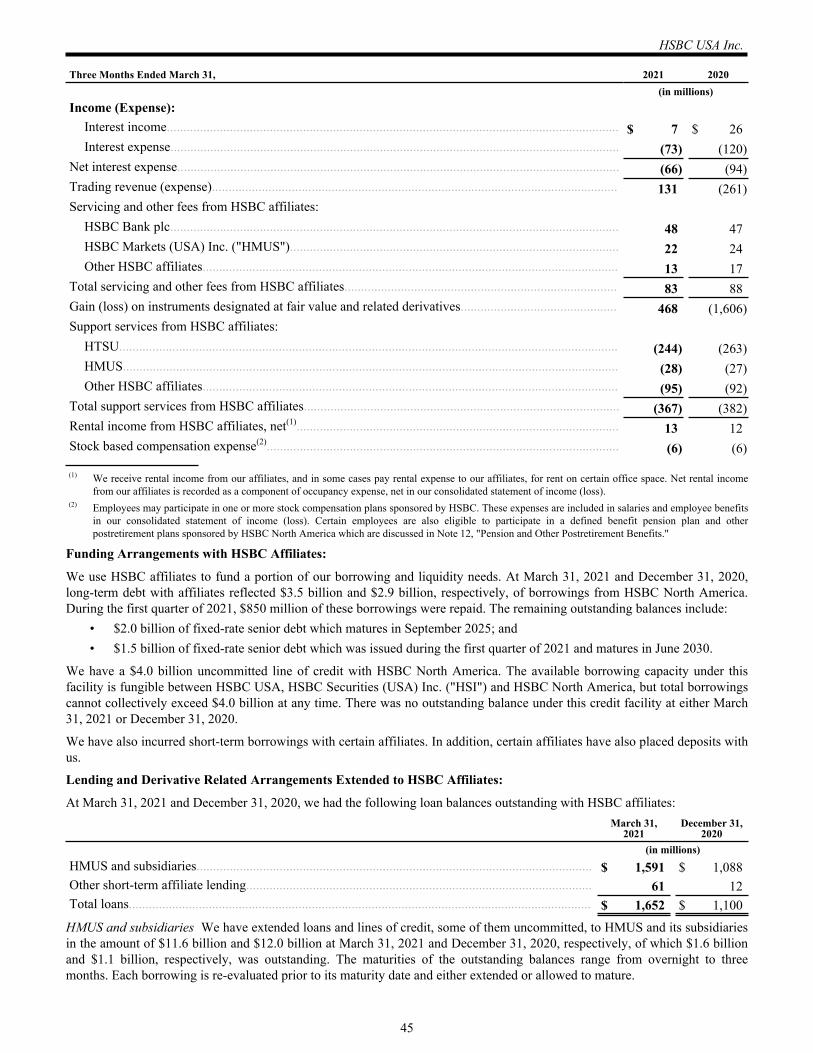
Three Months Ended March 31, 2021 2020 (in millions)Income (Expense):
Interest income........................................................................................................................................ $ 7 $ 26 Interest expense....................................................................................................................................... (73) (120)
Net interest expense..................................................................................................................................... (66) (94) Trading revenue (expense).......................................................................................................................... 131 (261) Servicing and other fees from HSBC affiliates:
HSBC Bank plc....................................................................................................................................... 48 47 HSBC Markets (USA) Inc. ("HMUS")................................................................................................... 22 24 Other HSBC affiliates............................................................................................................................. 13 17
Total servicing and other fees from HSBC affiliates.................................................................................. 83 88 Gain (loss) on instruments designated at fair value and related derivatives............................................... 468 (1,606) Support services from HSBC affiliates:
HTSU...................................................................................................................................................... (244) (263) HMUS..................................................................................................................................................... (28) (27) Other HSBC affiliates............................................................................................................................. (95) (92)
Total support services from HSBC affiliates............................................................................................... (367) (382) Rental income from HSBC affiliates, net(1)................................................................................................. 13 12 Stock based compensation expense(2).......................................................................................................... (6) (6)
(1) We receive rental income from our affiliates, and in some cases pay rental expense to our affiliates, for rent on certain office space. Net rental income from our affiliates is recorded as a component of occupancy expense, net in our consolidated statement of income (loss).
(2) Employees may participate in one or more stock compensation plans sponsored by HSBC. These expenses are included in salaries and employee benefits in our consolidated statement of income (loss). Certain employees are also eligible to participate in a defined benefit pension plan and other postretirement plans sponsored by HSBC North America which are discussed in Note 12, "Pension and Other Postretirement Benefits."
Funding Arrangements with HSBC Affiliates:
We use HSBC affiliates to fund a portion of our borrowing and liquidity needs. At March 31, 2021 and December 31, 2020, long-term debt with affiliates reflected $3.5 billion and $2.9 billion, respectively, of borrowings from HSBC North America. During the first quarter of 2021, $850 million of these borrowings were repaid. The remaining outstanding balances include:
• $2.0 billion of fixed-rate senior debt which matures in September 2025; and • $1.5 billion of fixed-rate senior debt which was issued during the first quarter of 2021 and matures in June 2030.
We have a $4.0 billion uncommitted line of credit with HSBC North America. The available borrowing capacity under this facility is fungible between HSBC USA, HSBC Securities (USA) Inc. ("HSI") and HSBC North America, but total borrowings cannot collectively exceed $4.0 billion at any time. There was no outstanding balance under this credit facility at either March 31, 2021 or December 31, 2020.
We have also incurred short-term borrowings with certain affiliates. In addition, certain affiliates have also placed deposits with us.
Lending and Derivative Related Arrangements Extended to HSBC Affiliates:
At March 31, 2021 and December 31, 2020, we had the following loan balances outstanding with HSBC affiliates:March 31,
2021December 31,
2020 (in millions)HMUS and subsidiaries....................................................................................................................... $ 1,591 $ 1,088 Other short-term affiliate lending........................................................................................................ 61 12 Total loans........................................................................................................................................... $ 1,652 $ 1,100
HMUS and subsidiaries We have extended loans and lines of credit, some of them uncommitted, to HMUS and its subsidiaries in the amount of $11.6 billion and $12.0 billion at March 31, 2021 and December 31, 2020, respectively, of which $1.6 billion and $1.1 billion, respectively, was outstanding. The maturities of the outstanding balances range from overnight to three months. Each borrowing is re-evaluated prior to its maturity date and either extended or allowed to mature.
HSBC USA Inc.
45
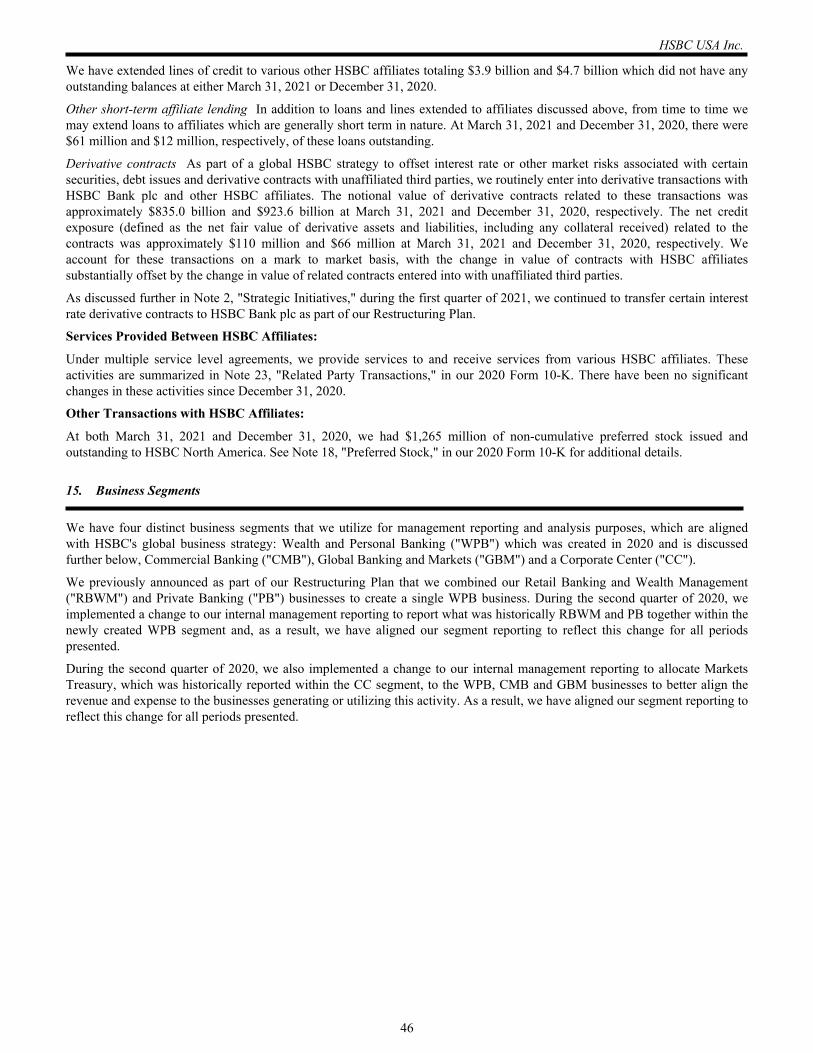
We have extended lines of credit to various other HSBC affiliates totaling $3.9 billion and $4.7 billion which did not have any outstanding balances at either March 31, 2021 or December 31, 2020.
Other short-term affiliate lending In addition to loans and lines extended to affiliates discussed above, from time to time we may extend loans to affiliates which are generally short term in nature. At March 31, 2021 and December 31, 2020, there were $61 million and $12 million, respectively, of these loans outstanding.
Derivative contracts As part of a global HSBC strategy to offset interest rate or other market risks associated with certain securities, debt issues and derivative contracts with unaffiliated third parties, we routinely enter into derivative transactions with HSBC Bank plc and other HSBC affiliates. The notional value of derivative contracts related to these transactions was approximately $835.0 billion and $923.6 billion at March 31, 2021 and December 31, 2020, respectively. The net credit exposure (defined as the net fair value of derivative assets and liabilities, including any collateral received) related to the contracts was approximately $110 million and $66 million at March 31, 2021 and December 31, 2020, respectively. We account for these transactions on a mark to market basis, with the change in value of contracts with HSBC affiliates substantially offset by the change in value of related contracts entered into with unaffiliated third parties.
As discussed further in Note 2, "Strategic Initiatives," during the first quarter of 2021, we continued to transfer certain interest rate derivative contracts to HSBC Bank plc as part of our Restructuring Plan.
Services Provided Between HSBC Affiliates:
Under multiple service level agreements, we provide services to and receive services from various HSBC affiliates. These activities are summarized in Note 23, "Related Party Transactions," in our 2020 Form 10-K. There have been no significant changes in these activities since December 31, 2020.
Other Transactions with HSBC Affiliates:
At both March 31, 2021 and December 31, 2020, we had $1,265 million of non-cumulative preferred stock issued and outstanding to HSBC North America. See Note 18, "Preferred Stock," in our 2020 Form 10-K for additional details.
15. Business Segments
We have four distinct business segments that we utilize for management reporting and analysis purposes, which are aligned with HSBC's global business strategy: Wealth and Personal Banking ("WPB") which was created in 2020 and is discussed further below, Commercial Banking ("CMB"), Global Banking and Markets ("GBM") and a Corporate Center ("CC").
We previously announced as part of our Restructuring Plan that we combined our Retail Banking and Wealth Management ("RBWM") and Private Banking ("PB") businesses to create a single WPB business. During the second quarter of 2020, we implemented a change to our internal management reporting to report what was historically RBWM and PB together within the newly created WPB segment and, as a result, we have aligned our segment reporting to reflect this change for all periods presented.
During the second quarter of 2020, we also implemented a change to our internal management reporting to allocate Markets Treasury, which was historically reported within the CC segment, to the WPB, CMB and GBM businesses to better align the revenue and expense to the businesses generating or utilizing this activity. As a result, we have aligned our segment reporting to reflect this change for all periods presented.
HSBC USA Inc.
46
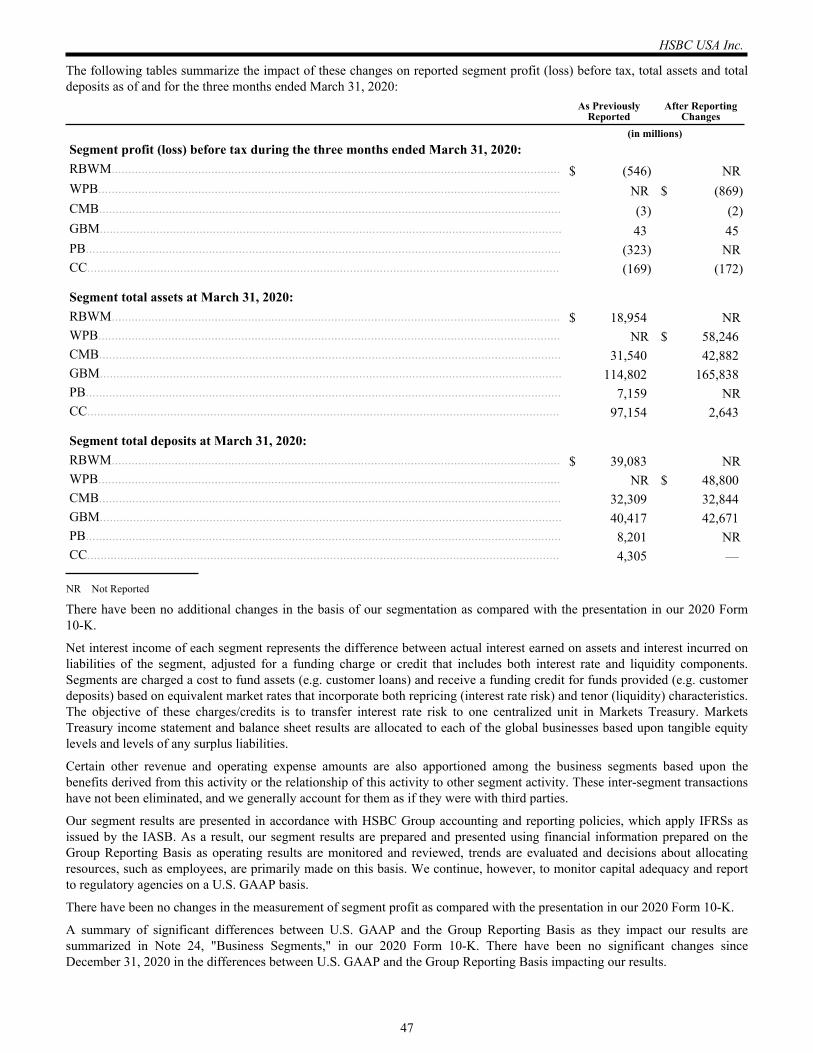
The following tables summarize the impact of these changes on reported segment profit (loss) before tax, total assets and total deposits as of and for the three months ended March 31, 2020:
As Previously Reported
After Reporting Changes
(in millions)Segment profit (loss) before tax during the three months ended March 31, 2020:RBWM....................................................................................................................................... $ (546) NRWPB........................................................................................................................................... NR $ (869) CMB........................................................................................................................................... (3) (2) GBM........................................................................................................................................... 43 45 PB............................................................................................................................................... (323) NRCC.............................................................................................................................................. (169) (172)
Segment total assets at March 31, 2020:RBWM....................................................................................................................................... $ 18,954 NRWPB........................................................................................................................................... NR $ 58,246 CMB........................................................................................................................................... 31,540 42,882 GBM........................................................................................................................................... 114,802 165,838 PB............................................................................................................................................... 7,159 NRCC.............................................................................................................................................. 97,154 2,643
Segment total deposits at March 31, 2020:RBWM....................................................................................................................................... $ 39,083 NRWPB........................................................................................................................................... NR $ 48,800 CMB........................................................................................................................................... 32,309 32,844 GBM........................................................................................................................................... 40,417 42,671 PB............................................................................................................................................... 8,201 NRCC.............................................................................................................................................. 4,305 —
NR Not Reported
There have been no additional changes in the basis of our segmentation as compared with the presentation in our 2020 Form 10-K.
Net interest income of each segment represents the difference between actual interest earned on assets and interest incurred on liabilities of the segment, adjusted for a funding charge or credit that includes both interest rate and liquidity components. Segments are charged a cost to fund assets (e.g. customer loans) and receive a funding credit for funds provided (e.g. customer deposits) based on equivalent market rates that incorporate both repricing (interest rate risk) and tenor (liquidity) characteristics. The objective of these charges/credits is to transfer interest rate risk to one centralized unit in Markets Treasury. Markets Treasury income statement and balance sheet results are allocated to each of the global businesses based upon tangible equity levels and levels of any surplus liabilities.
Certain other revenue and operating expense amounts are also apportioned among the business segments based upon the benefits derived from this activity or the relationship of this activity to other segment activity. These inter-segment transactions have not been eliminated, and we generally account for them as if they were with third parties.
Our segment results are presented in accordance with HSBC Group accounting and reporting policies, which apply IFRSs as issued by the IASB. As a result, our segment results are prepared and presented using financial information prepared on the Group Reporting Basis as operating results are monitored and reviewed, trends are evaluated and decisions about allocating resources, such as employees, are primarily made on this basis. We continue, however, to monitor capital adequacy and report to regulatory agencies on a U.S. GAAP basis.
There have been no changes in the measurement of segment profit as compared with the presentation in our 2020 Form 10-K.
A summary of significant differences between U.S. GAAP and the Group Reporting Basis as they impact our results are summarized in Note 24, "Business Segments," in our 2020 Form 10-K. There have been no significant changes since December 31, 2020 in the differences between U.S. GAAP and the Group Reporting Basis impacting our results.
HSBC USA Inc.
47
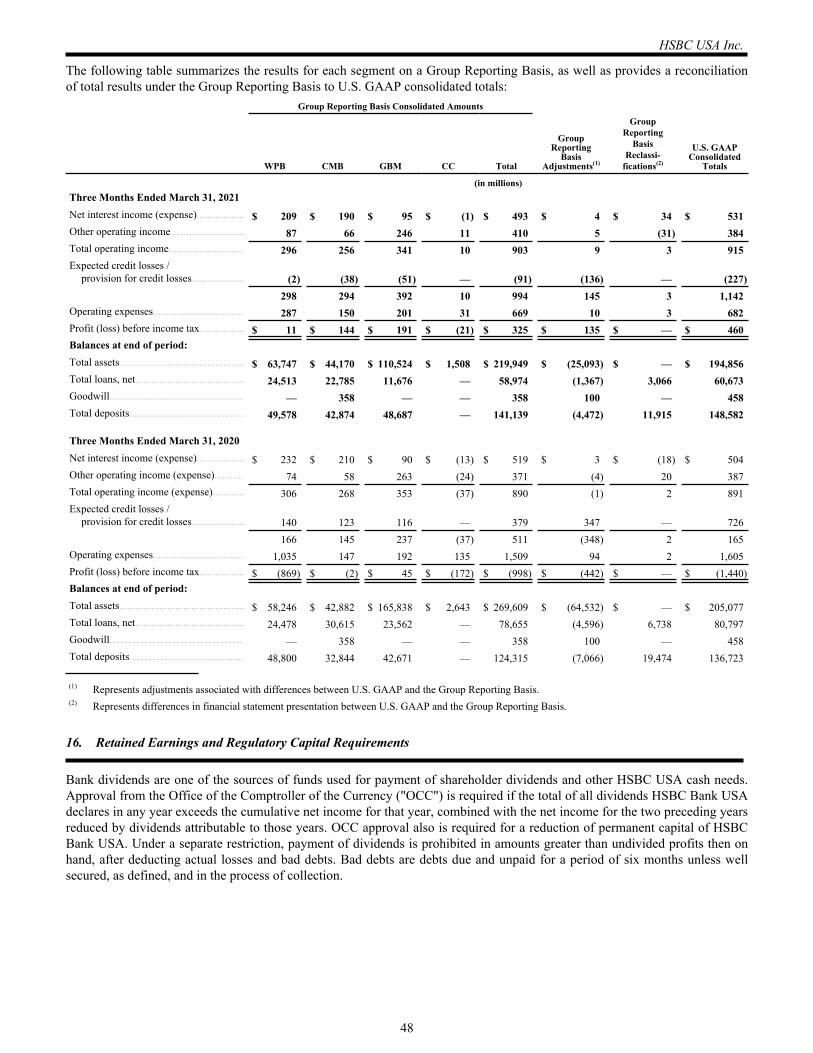
The following table summarizes the results for each segment on a Group Reporting Basis, as well as provides a reconciliation of total results under the Group Reporting Basis to U.S. GAAP consolidated totals:
Three Months Ended March 31, 2021Net interest income (expense).................. $ 209 $ 190 $ 95 $ (1) $ 493 $ 4 $ 34 $ 531 Other operating income............................ 87 66 246 11 410 5 (31) 384 Total operating income............................ 296 256 341 10 903 9 3 915 Expected credit losses /
provision for credit losses.................... (2) (38) (51) — (91) (136) — (227) 298 294 392 10 994 145 3 1,142
Operating expenses.................................. 287 150 201 31 669 10 3 682 Profit (loss) before income tax................. $ 11 $ 144 $ 191 $ (21) $ 325 $ 135 $ — $ 460 Balances at end of period:Total assets............................................... $ 63,747 $ 44,170 $ 110,524 $ 1,508 $ 219,949 $ (25,093) $ — $ 194,856 Total loans, net......................................... 24,513 22,785 11,676 — 58,974 (1,367) 3,066 60,673 Goodwill.................................................. — 358 — — 358 100 — 458 Total deposits........................................... 49,578 42,874 48,687 — 141,139 (4,472) 11,915 148,582
Three Months Ended March 31, 2020Net interest income (expense).................. $ 232 $ 210 $ 90 $ (13) $ 519 $ 3 $ (18) $ 504 Other operating income (expense)........... 74 58 263 (24) 371 (4) 20 387 Total operating income (expense)............ 306 268 353 (37) 890 (1) 2 891 Expected credit losses /
provision for credit losses.................... 140 123 116 — 379 347 — 726 166 145 237 (37) 511 (348) 2 165
Operating expenses.................................. 1,035 147 192 135 1,509 94 2 1,605 Profit (loss) before income tax................. $ (869) $ (2) $ 45 $ (172) $ (998) $ (442) $ — $ (1,440) Balances at end of period:Total assets............................................... $ 58,246 $ 42,882 $ 165,838 $ 2,643 $ 269,609 $ (64,532) $ — $ 205,077 Total loans, net......................................... 24,478 30,615 23,562 — 78,655 (4,596) 6,738 80,797 Goodwill.................................................. — 358 — — 358 100 — 458 Total deposits........................................... 48,800 32,844 42,671 — 124,315 (7,066) 19,474 136,723
Group Reporting Basis Consolidated Amounts
WPB CMB GBM CC Total
Group Reporting
BasisAdjustments(1)
Group Reporting
BasisReclassi-
fications(2)
U.S. GAAPConsolidated
Totals
(in millions)
(1) Represents adjustments associated with differences between U.S. GAAP and the Group Reporting Basis. (2) Represents differences in financial statement presentation between U.S. GAAP and the Group Reporting Basis.
16. Retained Earnings and Regulatory Capital Requirements
Bank dividends are one of the sources of funds used for payment of shareholder dividends and other HSBC USA cash needs. Approval from the Office of the Comptroller of the Currency ("OCC") is required if the total of all dividends HSBC Bank USA declares in any year exceeds the cumulative net income for that year, combined with the net income for the two preceding years reduced by dividends attributable to those years. OCC approval also is required for a reduction of permanent capital of HSBC Bank USA. Under a separate restriction, payment of dividends is prohibited in amounts greater than undivided profits then on hand, after deducting actual losses and bad debts. Bad debts are debts due and unpaid for a period of six months unless well secured, as defined, and in the process of collection.
HSBC USA Inc.
48
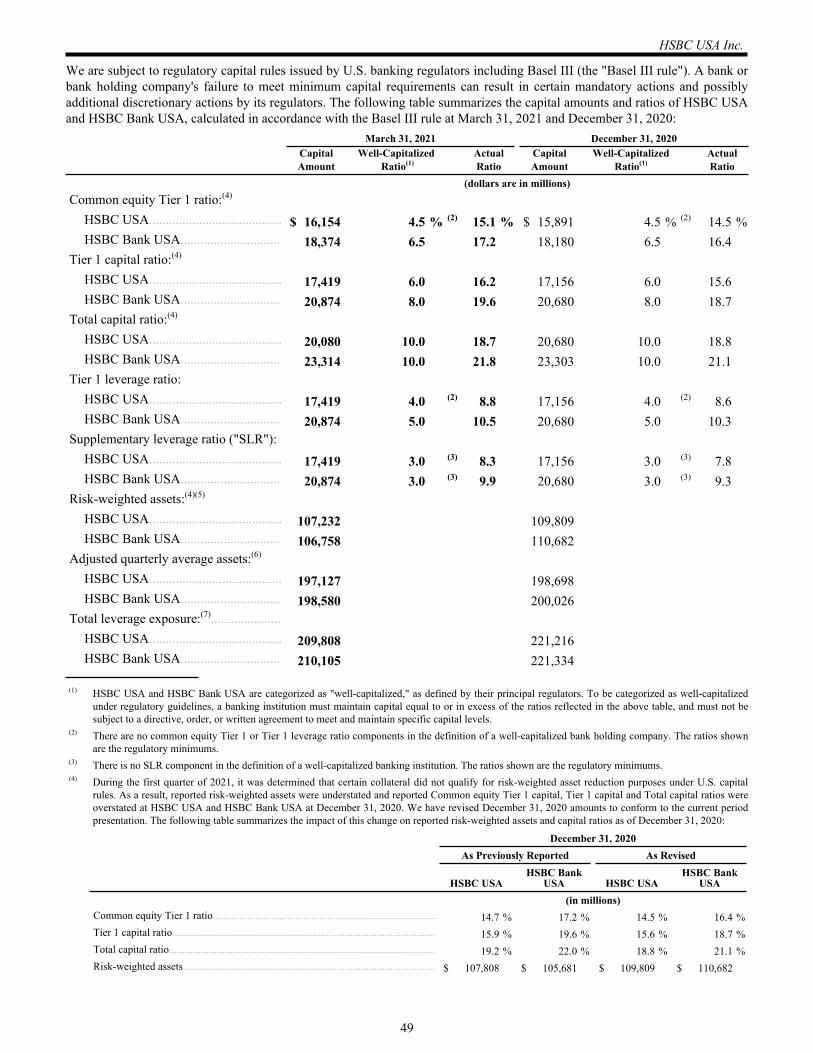
We are subject to regulatory capital rules issued by U.S. banking regulators including Basel III (the "Basel III rule"). A bank or bank holding company's failure to meet minimum capital requirements can result in certain mandatory actions and possibly additional discretionary actions by its regulators. The following table summarizes the capital amounts and ratios of HSBC USA and HSBC Bank USA, calculated in accordance with the Basel III rule at March 31, 2021 and December 31, 2020:
March 31, 2021 December 31, 2020
CapitalAmount
Well-Capitalized Ratio(1)
ActualRatio
CapitalAmount
Well-CapitalizedRatio(1)
ActualRatio
(dollars are in millions)Common equity Tier 1 ratio:(4)
HSBC USA........................................ $ 16,154 4.5 % (2) 15.1 % $ 15,891 4.5 % (2) 14.5 %HSBC Bank USA.............................. 18,374 6.5 17.2 18,180 6.5 16.4
Tier 1 capital ratio:(4)
HSBC USA........................................ 17,419 6.0 16.2 17,156 6.0 15.6 HSBC Bank USA.............................. 20,874 8.0 19.6 20,680 8.0 18.7
Total capital ratio:(4)
HSBC USA........................................ 20,080 10.0 18.7 20,680 10.0 18.8 HSBC Bank USA.............................. 23,314 10.0 21.8 23,303 10.0 21.1
Tier 1 leverage ratio:HSBC USA........................................ 17,419 4.0 (2) 8.8 17,156 4.0 (2) 8.6 HSBC Bank USA.............................. 20,874 5.0 10.5 20,680 5.0 10.3
Supplementary leverage ratio ("SLR"):HSBC USA........................................ 17,419 3.0 (3) 8.3 17,156 3.0 (3) 7.8 HSBC Bank USA.............................. 20,874 3.0 (3) 9.9 20,680 3.0 (3) 9.3
Risk-weighted assets:(4)(5)
HSBC USA........................................ 107,232 109,809 HSBC Bank USA.............................. 106,758 110,682
Adjusted quarterly average assets:(6)
HSBC USA........................................ 197,127 198,698 HSBC Bank USA.............................. 198,580 200,026
Total leverage exposure:(7).....................HSBC USA........................................ 209,808 221,216 HSBC Bank USA.............................. 210,105 221,334
(1) HSBC USA and HSBC Bank USA are categorized as "well-capitalized," as defined by their principal regulators. To be categorized as well-capitalized under regulatory guidelines, a banking institution must maintain capital equal to or in excess of the ratios reflected in the above table, and must not be subject to a directive, order, or written agreement to meet and maintain specific capital levels.
(2) There are no common equity Tier 1 or Tier 1 leverage ratio components in the definition of a well-capitalized bank holding company. The ratios shown are the regulatory minimums.
(3) There is no SLR component in the definition of a well-capitalized banking institution. The ratios shown are the regulatory minimums.(4) During the first quarter of 2021, it was determined that certain collateral did not qualify for risk-weighted asset reduction purposes under U.S. capital
rules. As a result, reported risk-weighted assets were understated and reported Common equity Tier 1 capital, Tier 1 capital and Total capital ratios were overstated at HSBC USA and HSBC Bank USA at December 31, 2020. We have revised December 31, 2020 amounts to conform to the current period presentation. The following table summarizes the impact of this change on reported risk-weighted assets and capital ratios as of December 31, 2020:
December 31, 2020As Previously Reported As Revised
HSBC USAHSBC Bank
USA HSBC USAHSBC Bank
USA(in millions)
Common equity Tier 1 ratio.................................................................................... 14.7 % 17.2 % 14.5 % 16.4 %Tier 1 capital ratio................................................................................................... 15.9 % 19.6 % 15.6 % 18.7 %Total capital ratio.................................................................................................... 19.2 % 22.0 % 18.8 % 21.1 %Risk-weighted assets............................................................................................... $ 107,808 $ 105,681 $ 109,809 $ 110,682
HSBC USA Inc.
49
(5) Calculated using the generally-applicable Standardized Approach.(6) Represents the Tier 1 leverage ratio denominator which reflects quarterly average assets adjusted for amounts permitted to be deducted from Tier 1
capital.(7) Represents the SLR denominator which includes adjusted quarterly average assets plus certain off-balance sheet exposures.
In response to the COVID-19 pandemic, the federal banking agencies issued a final rule that provides the option to transition in the regulatory capital impacts of the new current expected credit loss accounting standard over a five-year period. HSBC North America and HSBC Bank USA have elected the five-year transition option and, as a result, beginning in 2020, our capital ratios are reported in accordance with the transition rules in the final rule. Accordingly, during 2020 and 2021, we will exclude from regulatory capital the change in retained earnings resulting from adoption of the new accounting standard on January 1, 2020 as well as 25 percent of the change in the allowance for credit losses recognized between January 1, 2020 and December 31, 2021. Beginning January 1, 2022, the excluded impacts will be phased in to regulatory capital over a three-year transition period and will be fully reflected at January 1, 2025.
Also in response to the COVID-19 pandemic, the federal banking agencies issued final rules that permitted intermediate holding companies, such as HSBC North America, and depository institutions, such as HSBC Bank USA, to temporarily exclude U.S. Treasury securities and deposits at Federal Reserve Banks from the denominator of their SLR. The rules were designed to allow banking institutions to expand their balance sheets to accommodate increased customer deposits while continuing to provide credit to companies and households. These changes took effect in 2020 and expired on April 1, 2021.
17. Variable Interest Entities
In the ordinary course of business, we have organized special purpose entities ("SPEs") primarily to structure financial products to meet our clients' investment needs, to facilitate clients to access and raise financing from capital markets and to securitize financial assets held to meet our own funding needs. For disclosure purposes, we aggregate SPEs based on the purpose, risk characteristics and business activities of the SPEs. An SPE is a VIE if it lacks sufficient equity investment at risk to finance its activities without additional subordinated financial support or, as a group, the holders of the equity investment at risk lack either a) the power through voting or similar rights to direct the activities of the entity that most significantly impacts the entity's economic performance; or b) the obligation to absorb the entity's expected losses, the right to receive the expected residual returns, or both.
Variable Interest Entities We consolidate VIEs in which we hold a controlling financial interest as evidenced by the power to direct the activities of a VIE that most significantly impact its economic performance and the obligation to absorb losses of, or the right to receive benefits from, the VIE that could potentially be significant to the VIE and therefore are deemed to be the primary beneficiary. We take into account our entire involvement in a VIE (explicit or implicit) in identifying variable interests that individually or in the aggregate could be significant enough to warrant our designation as the primary beneficiary and hence require us to consolidate the VIE or otherwise require us to make appropriate disclosures. We consider our involvement to be potentially significant where we, among other things, (i) enter into derivative contracts to absorb the risks and benefits from the VIE or from the assets held by the VIE; (ii) provide a financial guarantee that covers assets held or liabilities issued by a VIE; (iii) sponsor the VIE in that we design, organize and structure the transaction; and (iv) retain a financial or servicing interest in the VIE.
We are required to evaluate whether to consolidate a VIE when we first become involved and on an ongoing basis. In almost all cases, a qualitative analysis of our involvement in the entity provides sufficient evidence to determine whether we are the primary beneficiary. In rare cases, a more detailed analysis to quantify the extent of variability to be absorbed by each variable interest holder is required to determine the primary beneficiary.
HSBC USA Inc.
50
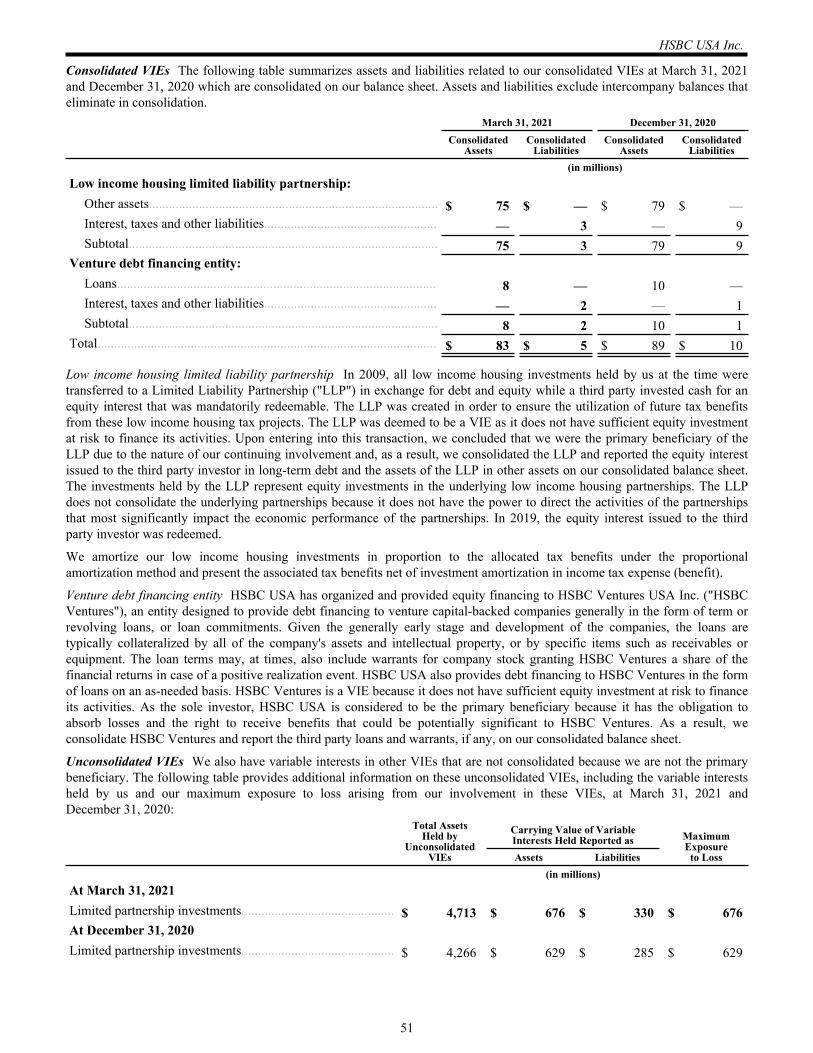
Consolidated VIEs The following table summarizes assets and liabilities related to our consolidated VIEs at March 31, 2021 and December 31, 2020 which are consolidated on our balance sheet. Assets and liabilities exclude intercompany balances that eliminate in consolidation. March 31, 2021 December 31, 2020
Consolidated
AssetsConsolidated
LiabilitiesConsolidated
AssetsConsolidated
Liabilities (in millions)Low income housing limited liability partnership:
Other assets....................................................................................... $ 75 $ — $ 79 $ — Interest, taxes and other liabilities.................................................... — 3 — 9 Subtotal............................................................................................. 75 3 79 9
Venture debt financing entity:Loans................................................................................................ 8 — 10 — Interest, taxes and other liabilities.................................................... — 2 — 1 Subtotal............................................................................................. 8 2 10 1
Total...................................................................................................... $ 83 $ 5 $ 89 $ 10
Low income housing limited liability partnership In 2009, all low income housing investments held by us at the time were transferred to a Limited Liability Partnership ("LLP") in exchange for debt and equity while a third party invested cash for an equity interest that was mandatorily redeemable. The LLP was created in order to ensure the utilization of future tax benefits from these low income housing tax projects. The LLP was deemed to be a VIE as it does not have sufficient equity investment at risk to finance its activities. Upon entering into this transaction, we concluded that we were the primary beneficiary of the LLP due to the nature of our continuing involvement and, as a result, we consolidated the LLP and reported the equity interest issued to the third party investor in long-term debt and the assets of the LLP in other assets on our consolidated balance sheet. The investments held by the LLP represent equity investments in the underlying low income housing partnerships. The LLP does not consolidate the underlying partnerships because it does not have the power to direct the activities of the partnerships that most significantly impact the economic performance of the partnerships. In 2019, the equity interest issued to the third party investor was redeemed.
We amortize our low income housing investments in proportion to the allocated tax benefits under the proportional amortization method and present the associated tax benefits net of investment amortization in income tax expense (benefit).
Venture debt financing entity HSBC USA has organized and provided equity financing to HSBC Ventures USA Inc. ("HSBC Ventures"), an entity designed to provide debt financing to venture capital-backed companies generally in the form of term or revolving loans, or loan commitments. Given the generally early stage and development of the companies, the loans are typically collateralized by all of the company's assets and intellectual property, or by specific items such as receivables or equipment. The loan terms may, at times, also include warrants for company stock granting HSBC Ventures a share of the financial returns in case of a positive realization event. HSBC USA also provides debt financing to HSBC Ventures in the form of loans on an as-needed basis. HSBC Ventures is a VIE because it does not have sufficient equity investment at risk to finance its activities. As the sole investor, HSBC USA is considered to be the primary beneficiary because it has the obligation to absorb losses and the right to receive benefits that could be potentially significant to HSBC Ventures. As a result, we consolidate HSBC Ventures and report the third party loans and warrants, if any, on our consolidated balance sheet.
Unconsolidated VIEs We also have variable interests in other VIEs that are not consolidated because we are not the primary beneficiary. The following table provides additional information on these unconsolidated VIEs, including the variable interests held by us and our maximum exposure to loss arising from our involvement in these VIEs, at March 31, 2021 and December 31, 2020:
Total Assets Held by
Unconsolidated VIEs
Carrying Value of Variable Interests Held Reported as Maximum
Exposureto LossAssets Liabilities
(in millions)At March 31, 2021Limited partnership investments.............................................. $ 4,713 $ 676 $ 330 $ 676 At December 31, 2020Limited partnership investments.............................................. $ 4,266 $ 629 $ 285 $ 629
HSBC USA Inc.
51
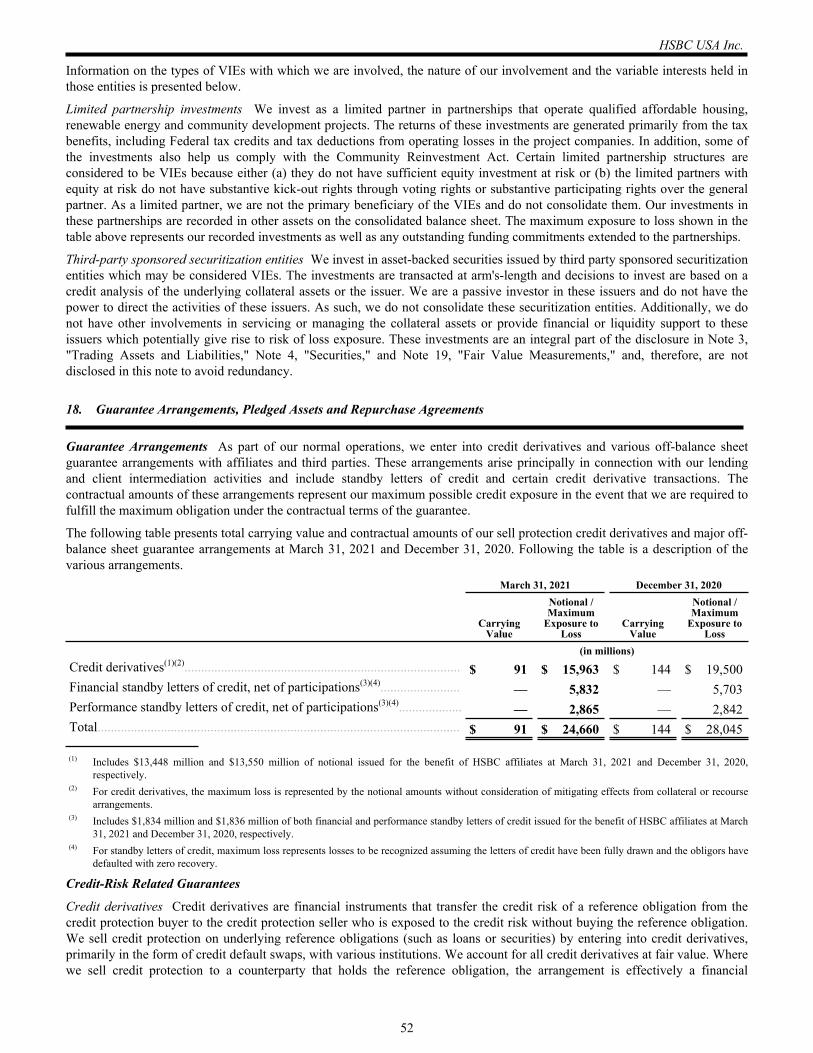
Information on the types of VIEs with which we are involved, the nature of our involvement and the variable interests held in those entities is presented below.
Limited partnership investments We invest as a limited partner in partnerships that operate qualified affordable housing, renewable energy and community development projects. The returns of these investments are generated primarily from the tax benefits, including Federal tax credits and tax deductions from operating losses in the project companies. In addition, some of the investments also help us comply with the Community Reinvestment Act. Certain limited partnership structures are considered to be VIEs because either (a) they do not have sufficient equity investment at risk or (b) the limited partners with equity at risk do not have substantive kick-out rights through voting rights or substantive participating rights over the general partner. As a limited partner, we are not the primary beneficiary of the VIEs and do not consolidate them. Our investments in these partnerships are recorded in other assets on the consolidated balance sheet. The maximum exposure to loss shown in the table above represents our recorded investments as well as any outstanding funding commitments extended to the partnerships.
Third-party sponsored securitization entities We invest in asset-backed securities issued by third party sponsored securitization entities which may be considered VIEs. The investments are transacted at arm's-length and decisions to invest are based on a credit analysis of the underlying collateral assets or the issuer. We are a passive investor in these issuers and do not have the power to direct the activities of these issuers. As such, we do not consolidate these securitization entities. Additionally, we do not have other involvements in servicing or managing the collateral assets or provide financial or liquidity support to these issuers which potentially give rise to risk of loss exposure. These investments are an integral part of the disclosure in Note 3, "Trading Assets and Liabilities," Note 4, "Securities," and Note 19, "Fair Value Measurements," and, therefore, are not disclosed in this note to avoid redundancy.
18. Guarantee Arrangements, Pledged Assets and Repurchase Agreements
Guarantee Arrangements As part of our normal operations, we enter into credit derivatives and various off-balance sheet guarantee arrangements with affiliates and third parties. These arrangements arise principally in connection with our lending and client intermediation activities and include standby letters of credit and certain credit derivative transactions. The contractual amounts of these arrangements represent our maximum possible credit exposure in the event that we are required to fulfill the maximum obligation under the contractual terms of the guarantee.
The following table presents total carrying value and contractual amounts of our sell protection credit derivatives and major off-balance sheet guarantee arrangements at March 31, 2021 and December 31, 2020. Following the table is a description of the various arrangements. March 31, 2021 December 31, 2020
Carrying
Value
Notional / Maximum
Exposure to Loss
CarryingValue
Notional / Maximum
Exposure to Loss
(in millions)Credit derivatives(1)(2)................................................................................... $ 91 $ 15,963 $ 144 $ 19,500 Financial standby letters of credit, net of participations(3)(4)........................ — 5,832 — 5,703 Performance standby letters of credit, net of participations(3)(4)................... — 2,865 — 2,842 Total............................................................................................................. $ 91 $ 24,660 $ 144 $ 28,045
(1) Includes $13,448 million and $13,550 million of notional issued for the benefit of HSBC affiliates at March 31, 2021 and December 31, 2020, respectively.
(2) For credit derivatives, the maximum loss is represented by the notional amounts without consideration of mitigating effects from collateral or recourse arrangements.
(3) Includes $1,834 million and $1,836 million of both financial and performance standby letters of credit issued for the benefit of HSBC affiliates at March 31, 2021 and December 31, 2020, respectively.
(4) For standby letters of credit, maximum loss represents losses to be recognized assuming the letters of credit have been fully drawn and the obligors have defaulted with zero recovery.
Credit-Risk Related Guarantees
Credit derivatives Credit derivatives are financial instruments that transfer the credit risk of a reference obligation from the credit protection buyer to the credit protection seller who is exposed to the credit risk without buying the reference obligation. We sell credit protection on underlying reference obligations (such as loans or securities) by entering into credit derivatives, primarily in the form of credit default swaps, with various institutions. We account for all credit derivatives at fair value. Where we sell credit protection to a counterparty that holds the reference obligation, the arrangement is effectively a financial
HSBC USA Inc.
52
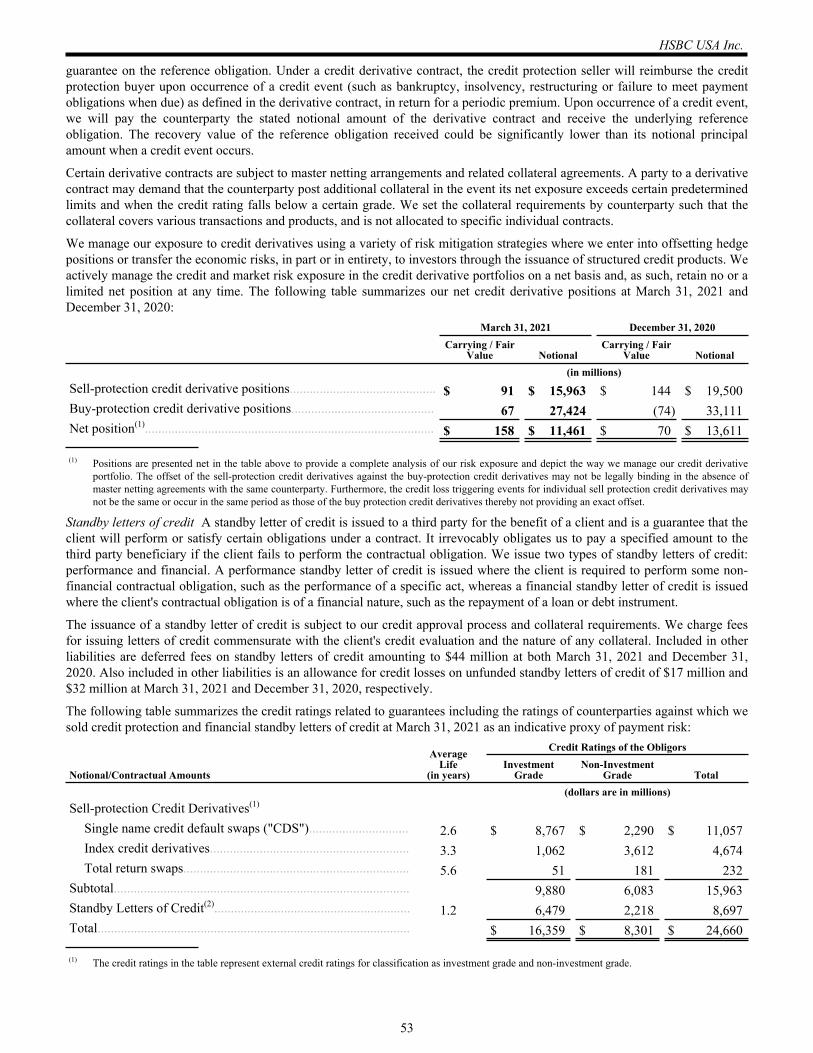
guarantee on the reference obligation. Under a credit derivative contract, the credit protection seller will reimburse the credit protection buyer upon occurrence of a credit event (such as bankruptcy, insolvency, restructuring or failure to meet payment obligations when due) as defined in the derivative contract, in return for a periodic premium. Upon occurrence of a credit event, we will pay the counterparty the stated notional amount of the derivative contract and receive the underlying reference obligation. The recovery value of the reference obligation received could be significantly lower than its notional principal amount when a credit event occurs.
Certain derivative contracts are subject to master netting arrangements and related collateral agreements. A party to a derivative contract may demand that the counterparty post additional collateral in the event its net exposure exceeds certain predetermined limits and when the credit rating falls below a certain grade. We set the collateral requirements by counterparty such that the collateral covers various transactions and products, and is not allocated to specific individual contracts.
We manage our exposure to credit derivatives using a variety of risk mitigation strategies where we enter into offsetting hedge positions or transfer the economic risks, in part or in entirety, to investors through the issuance of structured credit products. We actively manage the credit and market risk exposure in the credit derivative portfolios on a net basis and, as such, retain no or a limited net position at any time. The following table summarizes our net credit derivative positions at March 31, 2021 and December 31, 2020: March 31, 2021 December 31, 2020
Carrying / Fair
Value NotionalCarrying / Fair
Value Notional (in millions)Sell-protection credit derivative positions............................................ $ 91 $ 15,963 $ 144 $ 19,500 Buy-protection credit derivative positions........................................... 67 27,424 (74) 33,111 Net position(1)....................................................................................... $ 158 $ 11,461 $ 70 $ 13,611
(1) Positions are presented net in the table above to provide a complete analysis of our risk exposure and depict the way we manage our credit derivative portfolio. The offset of the sell-protection credit derivatives against the buy-protection credit derivatives may not be legally binding in the absence of master netting agreements with the same counterparty. Furthermore, the credit loss triggering events for individual sell protection credit derivatives may not be the same or occur in the same period as those of the buy protection credit derivatives thereby not providing an exact offset.
Standby letters of credit A standby letter of credit is issued to a third party for the benefit of a client and is a guarantee that the client will perform or satisfy certain obligations under a contract. It irrevocably obligates us to pay a specified amount to the third party beneficiary if the client fails to perform the contractual obligation. We issue two types of standby letters of credit: performance and financial. A performance standby letter of credit is issued where the client is required to perform some non-financial contractual obligation, such as the performance of a specific act, whereas a financial standby letter of credit is issued where the client's contractual obligation is of a financial nature, such as the repayment of a loan or debt instrument.
The issuance of a standby letter of credit is subject to our credit approval process and collateral requirements. We charge fees for issuing letters of credit commensurate with the client's credit evaluation and the nature of any collateral. Included in other liabilities are deferred fees on standby letters of credit amounting to $44 million at both March 31, 2021 and December 31, 2020. Also included in other liabilities is an allowance for credit losses on unfunded standby letters of credit of $17 million and $32 million at March 31, 2021 and December 31, 2020, respectively.
The following table summarizes the credit ratings related to guarantees including the ratings of counterparties against which we sold credit protection and financial standby letters of credit at March 31, 2021 as an indicative proxy of payment risk: Average
Life(in years)
Credit Ratings of the Obligors
Notional/Contractual AmountsInvestment
GradeNon-Investment
Grade Total (dollars are in millions)Sell-protection Credit Derivatives(1)
Single name credit default swaps ("CDS").............................. 2.6 $ 8,767 $ 2,290 $ 11,057 Index credit derivatives............................................................ 3.3 1,062 3,612 4,674 Total return swaps.................................................................... 5.6 51 181 232
Subtotal......................................................................................... 9,880 6,083 15,963 Standby Letters of Credit(2)........................................................... 1.2 6,479 2,218 8,697 Total.............................................................................................. $ 16,359 $ 8,301 $ 24,660
(1) The credit ratings in the table represent external credit ratings for classification as investment grade and non-investment grade.
HSBC USA Inc.
53
(2) External ratings for most of the obligors are not available. Presented above are the internal credit ratings which are developed using similar methodologies and rating scale equivalent to external credit ratings for purposes of classification as investment grade and non-investment grade.
Our internal credit ratings are determined based on HSBC's risk rating systems and processes which assign a credit grade based on a scale which ranks the risk of default of a client. The credit grades are assigned and used for managing risk and determining level of credit exposure appetite based on the client's operating performance, liquidity, capital structure and debt service ability. In addition, we also incorporate subjective judgments into the risk rating process concerning such things as industry trends, comparison of performance to industry peers and perceived quality of management. We compare our internal risk ratings to outside external rating agency benchmarks, where possible, at the time of formal review and regularly monitor whether our risk ratings are comparable to the external ratings benchmark data.
A non-investment grade rating of a referenced obligor has a negative impact to the fair value of the credit derivative and increases the likelihood that we will be required to perform under the credit derivative contract. We employ market-based parameters and, where possible, use the observable credit spreads of the referenced obligors as measurement inputs in determining the fair value of the credit derivatives. We believe that such market parameters are more indicative of the current status of payment/performance risk than external ratings by the rating agencies which may not be forward-looking in nature and, as a result, lag behind those market-based indicators.
Non Credit-Risk Related Guarantees and Other Arrangements
Visa covered litigation In 2008, we received Class B Shares as part of Visa's initial public offering ("IPO"). Pursuant to the IPO, we, along with all the other Class B shareholders, agreed to indemnify Visa for the claims and obligations arising from certain specific covered litigation. The Class B Shares are not eligible to be converted into publicly traded Class A Shares until settlement of the covered litigation described in Note 29, "Litigation and Regulatory Matters" in our 2020 Form 10-K. Accordingly, the Class B Shares are considered restricted and are only transferable under limited circumstances, which include transfers to other Class B shareholders.
In 2017, we sold substantially all of our remaining Visa Class B Shares to a third party. Under the terms of the sale agreements, we entered into swap agreements with the purchaser to retain the litigation risk associated with the Class B Shares sold until the related litigation is settled and the Class B Shares can be converted into Class A Shares. These swaps had a carrying value of $57 million and $67 million at March 31, 2021 and December 31, 2020, respectively. The swap agreements we entered into with the purchaser requires us to (a) make periodic payments, calculated by reference to the market price of Class A Shares and (b) make or receive payments based on subsequent changes in the conversion rate of Class B Shares into Class A Shares. We have entered into a total return swap position to economically hedge the periodic payments made under these swap agreements. The payments under the derivative will continue until the Class B Shares are able to be converted into Class A Shares. The fair value of the swap agreements is estimated using a discounted cash flow methodology and is dependent upon the final resolution of the related litigation. Changes in fair value between periods are recognized in other income (loss). See Note 9, "Derivative Financial Instruments," for further information.
Clearing houses and exchanges We are a member of various exchanges and clearing houses that trade and clear securities and/or derivatives contracts. Under the Dodd-Frank Wall Street Reform and Consumer Protection Act of 2010, members of a clearing house may be required to contribute to a guaranty fund to backstop members' obligations to the clearing house. As a member, we may be required to pay a proportionate share of the financial obligations of another member who defaults on its obligations to the exchange or the clearing house. Our guarantee obligations would arise only if the exchange or clearing house had exhausted its resources. Any potential contingent liability under these membership agreements cannot be estimated.
Lease Obligations We are obligated under a number of noncancellable operating leases for premises and equipment. See Note 11, "Leases," in our 2020 Form 10-K, for a full discussion of our leases, including a maturity analysis of our operating lease liabilities.
Mortgage Loan Repurchase Obligations We originate and sell mortgage loans to third parties and provide various representations and warranties related to, among other things, the ownership of the loans, the validity of the liens, the loan selection and origination process, and the compliance to the origination criteria established by the government agencies. In the event of a breach of our representations and warranties, we may be obligated to repurchase the loans with identified defects or to indemnify the buyers. Our contractual obligation arises only when the breach of representations and warranties are discovered and repurchase is demanded.
In estimating our repurchase liability arising from breaches of representations and warranties, we consider historical losses on residual risks not covered by settlement agreements adjusted for any risk factors not captured in the historical losses as well as the level of outstanding repurchase demands received. Outstanding repurchase demands received were immaterial at March 31, 2021 and December 31, 2020.
Our estimated repurchase liability for obligations arising from the breach of representations and warranties associated with mortgage loans sold was $4 million and $3 million at March 31, 2021 and December 31, 2020, respectively. Our repurchase
HSBC USA Inc.
54
liability represents our best estimate of the loss that has been incurred, including interest, arising from breaches of representations and warranties associated with mortgage loans sold. Because the level of mortgage loan repurchase losses is dependent upon economic factors, investor demand strategies and other external risk factors such as housing market trends that may change, the level of the liability for mortgage loan repurchase losses requires significant judgment. We continue to evaluate our methods of determining the best estimate of loss based on recent trends. As these estimates are influenced by factors outside our control, there is uncertainty inherent in these estimates making it reasonably possible that they could change. The range of reasonably possible losses in excess of our recorded repurchase liability is between zero and $25 million at March 31, 2021. This estimated range of reasonably possible losses was determined based upon modifying the assumptions utilized in our best estimate of probable losses to reflect what we believe to be reasonably possible adverse assumptions.
Securitization Activity In addition to the repurchase risk described above, we have also been involved as a sponsor/seller of loans used to facilitate whole loan securitizations underwritten by our affiliate, HSI. In this regard, we began acquiring residential mortgage loans in 2005 which were warehoused on our balance sheet with the intent of selling them to HSI to facilitate HSI's whole loan securitization program which was discontinued in 2007. During 2005-2007, we purchased and sold $24 billion of such loans to HSI which were subsequently securitized and sold by HSI to third parties. See "Mortgage Securitization Matters" in Note 29, "Litigation and Regulatory Matters," in our 2020 Form 10-K for additional discussion of related exposure. The outstanding principal balance on these loans was approximately $3.0 billion and $3.1 billion at March 31, 2021 and December 31, 2020, respectively.
Pledged Assets
Pledged assets included in the consolidated balance sheet consisted of the following:March 31,
2021December 31,
2020 (in millions)Interest bearing deposits with banks(1)................................................................................................ $ 1,138 $ 2,158 Trading assets(2)................................................................................................................................... 1,115 1,265 Securities available-for-sale(3)............................................................................................................. 8,781 8,652 Securities held-to-maturity(3)............................................................................................................... 917 1,076 Loans(4) ............................................................................................................................................... 18,938 18,146 Other assets(5)...................................................................................................................................... 1,566 2,352 Total.................................................................................................................................................... $ 32,455 $ 33,649
(1) Represents gross amount of cash on deposit with banks related to derivative collateral-support agreements, of which a majority has been netted against derivative liabilities on the consolidated balance sheet.
(2) Trading assets are primarily pledged against liabilities associated with repurchase agreements.(3) Securities are primarily pledged against derivatives, public fund deposits, trust deposits and various short-term and long term borrowings, as well as
providing capacity for potential secured borrowings from the FHLB and the Federal Reserve Bank of New York.(4) Loans are primarily residential mortgage loans pledged against current and potential borrowings from the FHLB and the Federal Reserve Bank of New
York.(5) Represents gross amount of cash on deposit with non-banks related to derivative collateral support agreements, of which a majority has been netted
against derivative liabilities on the consolidated balance sheet.
Debt securities pledged as collateral under repurchase agreements that can be sold or repledged by the secured party continue to be reported on the consolidated balance sheet. The fair value of securities available-for-sale that could be sold or repledged was $2,821 million and $2,077 million at March 31, 2021 and December 31, 2020, respectively. The fair value of trading assets that could be sold or repledged was $1,115 million and $1,265 million at March 31, 2021 and December 31, 2020, respectively.
The fair value of collateral we accepted under security resale agreements but was not reported on the consolidated balance sheet was $7,019 million and $41,447 million at March 31, 2021 and December 31, 2020, respectively. Of this collateral, $6,619 million and $41,047 million could be sold or repledged at March 31, 2021 and December 31, 2020, respectively, of which $1,046 million and $4,063 million, respectively, had been sold or repledged as collateral under repurchase agreements or to cover short sales.
Repurchase Agreements
We enter into purchases of securities under agreements to resell (resale agreements) and sales of securities under agreements to repurchase (repurchase agreements) identical or substantially the same securities. Resale and repurchase agreements are accounted for as secured lending and secured borrowing transactions, respectively.
Repurchase agreements may require us to deposit cash or other collateral with the lender. In connection with resale agreements, it is our policy to obtain possession of collateral, which may include the securities purchased, with market value in excess of the
HSBC USA Inc.
55
principal amount loaned. The market value of the collateral subject to the resale and repurchase agreements is regularly monitored, and additional collateral is obtained or provided when appropriate, to ensure appropriate collateral coverage of these secured financing transactions.
The following table provides information about resale and repurchase agreements that are subject to offset at March 31, 2021 and December 31, 2020:
Gross Amounts Not Offset in the Balance Sheet
Gross Amounts
Recognized
Gross Amounts Offset in the
Balance Sheet(1)
Net Amounts Presented in the Balance Sheet
Financial Instruments(2)
Cash Collateral Received / Pledged Net Amount(3)
(in millions)At March 31, 2021Assets:
Securities purchased under resale agreements... $ 7,190 $ 3,430 $ 3,760 $ 3,687 $ 10 $ 63
Liabilities:Securities sold under repurchase agreements...... $ 5,147 $ 3,430 $ 1,717 $ 1,654 $ 62 $ 1
At December 31, 2020Assets:
Securities purchased under resale agreements... $ 41,382 $ 5,636 $ 35,746 $ 35,746 $ — $ —
Liabilities:Securities sold under repurchase agreements...... $ 7,401 $ 5,636 $ 1,765 $ 1,762 $ — $ 3
(1) Represents recognized amount of resale and repurchase agreements with counterparties subject to legally enforceable netting agreements that meet the applicable netting criteria as permitted by generally accepted accounting principles.
(2) Represents securities received or pledged to cover financing transaction exposures.(3) Represents the amount of our exposure that is not collateralized / covered by pledged collateral.
The following table provides the class of collateral pledged and remaining contractual maturity of repurchase agreements accounted for as secured borrowings at March 31, 2021 and December 31, 2020:
Overnight and
ContinuousUp to 30
Days31 to 90
Days91 Days to One Year
Greater Than One
Year Total(in millions)
At March 31, 2021U.S. Treasury, U.S. Government sponsored and U.S. Government agency securities....................... $ 324 $ 1,928 $ 2,895 $ — $ — $ 5,147
At December 31, 2020U.S. Treasury, U.S. Government sponsored and U.S. Government agency securities....................... $ 4,091 $ 2,810 $ 500 $ — $ — $ 7,401
HSBC USA Inc.
56
19. Fair Value Measurements
Accounting principles related to fair value measurements provide a framework for measuring fair value that focuses on the exit price that would be received to sell an asset or paid to transfer a liability in the principal market (or in the absence of the principal market, the most advantageous market) accessible in an orderly transaction between willing market participants (the "Fair Value Framework"). Where required by the applicable accounting standards, assets and liabilities are measured at fair value using the "highest and best use" valuation premise. Fair value measurement guidance clarifies that financial instruments do not have alternative use and, as such, the fair value of financial instruments should be determined using an "in-exchange" valuation premise. However, the fair value measurement guidance provides a valuation exception and permits an entity to measure the fair value of a group of financial assets and financial liabilities with offsetting credit risks and/or market risks based on the exit price it would receive or pay to transfer the net risk exposure of a group of assets or liabilities if certain conditions are met. We elected to apply the measurement exception to a group of derivative instruments with offsetting credit risks and market risks, which primarily relate to interest rate, foreign currency, debt and equity price risk, and commodity price risk as of the reporting date.
Fair Value Adjustments The best evidence of fair value is quoted market price in an actively traded market, where available. In the event listed price or market quotes are not available, valuation techniques that incorporate relevant transaction data and market parameters reflecting the attributes of the asset or liability under consideration are applied. Where applicable, fair value adjustments are made to ensure the financial instruments are appropriately recorded at fair value. The fair value adjustments reflect the risks associated with the products, contractual terms of the transactions, and the liquidity of the markets in which the transactions occur. The fair value adjustments are broadly categorized by the following major types:
Credit valuation adjustment - The credit valuation adjustment is an adjustment to a group of financial assets and financial liabilities, predominantly derivative assets and derivative liabilities, to reflect the credit quality of the parties to the transaction in arriving at fair value. A credit valuation adjustment to a financial asset is required to reflect the default risk of the counterparty. A debit valuation adjustment to a financial liability is recorded to reflect the default risk of HUSI. See "Valuation Techniques - Derivatives" below for additional details.
Liquidity risk adjustment - The liquidity risk adjustment (primarily in the form of bid-offer adjustment) reflects the cost that would be incurred to close out the market risks by hedging, disposing or unwinding the position. Valuation models generally produce mid-market values. The bid-offer adjustment is made in such a way that results in a measure that reflects the exit price that most represents the fair value of the financial asset or financial liability under consideration or, where applicable, the fair value of the net market risk exposure of a group of financial assets or financial liabilities. These adjustments relate primarily to Level 2 assets.
Model valuation adjustment - Where fair value measurements are determined using an internal valuation model based on observable and unobservable inputs, certain valuation inputs may be less readily determinable. There may be a range of possible valuation inputs that market participants may assume in determining the fair value measurement. The resultant fair value measurement has inherent measurement risk if one or more parameters are unobservable and must be estimated. An input valuation adjustment is necessary to reflect the likelihood that market participants may use different input parameters, and to mitigate the possibility of measurement error. In addition, the values derived from valuation techniques are affected by the choice of valuation model and model limitation. When different valuation techniques are available, the choice of valuation model can be subjective. Furthermore, the valuation model applied may have measurement limitations. In those cases, an additional valuation adjustment is also applied to mitigate the measurement risk. Model valuation adjustments are not material and relate primarily to Level 2 instruments.
We apply stress scenarios in determining appropriate liquidity risk and model risk adjustments for Level 3 fair values by reviewing the historical data for unobservable inputs (e.g., correlation, volatility). Some stress scenarios involve at least a 95 percent confidence interval (i.e., two standard deviations). We also utilize unobservable parameter adjustments when instruments are valued using internally developed models which reflects the uncertainty in the value estimates provided by the model.
Funding Fair Value Adjustment ("FFVA") - The FFVA reflects the estimated present value of the future market funding cost or benefit associated with funding uncollateralized derivative exposure at rates other than the Overnight Indexed Swap ("OIS") rate. See "Valuation Techniques - Derivatives" below for additional details.
Fair Value Hierarchy The Fair Value Framework establishes a three-tiered fair value hierarchy as follows:
Level 1 quoted market price - Level 1 inputs are quoted prices (unadjusted) in active markets for identical assets or liabilities.
Level 2 valuation technique using observable inputs - Level 2 inputs include quoted prices for similar assets or liabilities in active markets, quoted prices for identical or similar assets or liabilities in markets that are inactive, and measurements
HSBC USA Inc.
57
determined using valuation models where all significant inputs are observable, such as interest rates and yield curves that are observable at commonly quoted intervals.
Level 3 valuation technique with significant unobservable inputs - Level 3 inputs are unobservable inputs for the asset or liability and include situations where fair values are measured using valuation techniques based on one or more significant unobservable inputs.
Classification within the fair value hierarchy is based on whether the lowest hierarchical level input that is significant to the fair value measurement is observable. As such, the classification within the fair value hierarchy is dynamic and can be transferred to other hierarchy levels in each reporting period.
Where fair value measurements are determined based on information obtained from independent pricing services or brokers, Finance applies appropriate validation procedures to substantiate fair value. For price validation purposes, quotations from at least two independent pricing sources are obtained for each financial instrument, where possible.
The following factors are considered in determining fair values:• similarities between the asset or the liability under consideration and the asset or liability for which quotation is
received;• collaboration of pricing by referencing to other independent market data such as market transactions and relevant
benchmark indices;• consistency among different pricing sources;• the valuation approach and the methodologies used by the independent pricing sources in determining fair value;• the elapsed time between the date to which the market data relates and the measurement date; • the source of the fair value information; and• whether the security is traded in an active or inactive market.
Greater weight is given to quotations of instruments with recent market transactions, pricing quotes from dealers who stand ready to transact, quotations provided by market-makers who structured such instrument and market consensus pricing based on inputs from a large number of survey participants. Any significant discrepancies among the external quotations are reviewed and adjustments to fair values are recorded where appropriate. Where the transaction volume of a specific instrument has been reduced and the fair value measurement becomes less transparent, Finance will apply more detailed procedures to understand and challenge the appropriateness of the unobservable inputs and the valuation techniques used by the independent pricing service. Where applicable, Finance will develop a fair value estimate using its own pricing model inputs to test reasonableness. Where fair value measurements are determined using internal valuation models, Finance will validate the fair value measurement by either developing unobservable inputs based on the industry consensus pricing surveys in which we participate or back testing by observing the actual settlements occurring soon after the measurement date.
HSBC USA Inc.
58
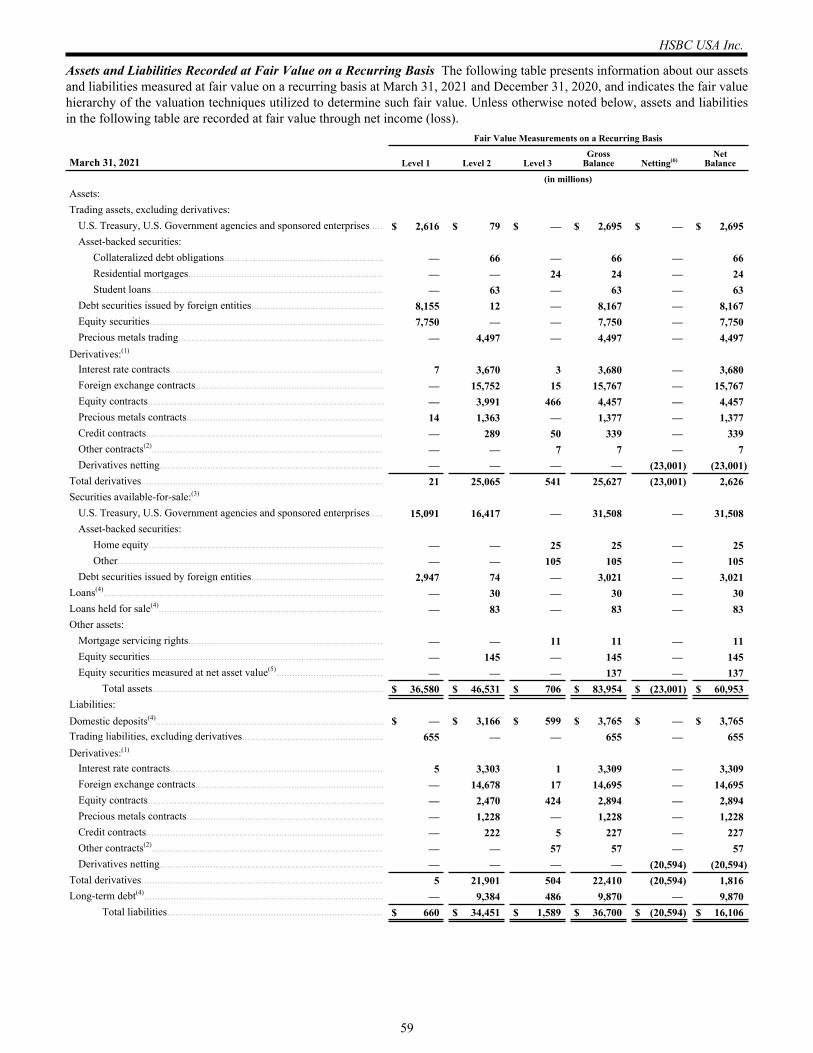
Assets and Liabilities Recorded at Fair Value on a Recurring Basis The following table presents information about our assets and liabilities measured at fair value on a recurring basis at March 31, 2021 and December 31, 2020, and indicates the fair value hierarchy of the valuation techniques utilized to determine such fair value. Unless otherwise noted below, assets and liabilities in the following table are recorded at fair value through net income (loss).
Fair Value Measurements on a Recurring Basis
March 31, 2021 Level 1 Level 2 Level 3Gross
Balance Netting(6)Net
Balance
(in millions)Assets:Trading assets, excluding derivatives:
U.S. Treasury, U.S. Government agencies and sponsored enterprises..... $ 2,616 $ 79 $ — $ 2,695 $ — $ 2,695 Asset-backed securities:
Collateralized debt obligations............................................................ — 66 — 66 — 66 Residential mortgages......................................................................... — — 24 24 — 24 Student loans....................................................................................... — 63 — 63 — 63
Debt securities issued by foreign entities.................................................. 8,155 12 — 8,167 — 8,167 Equity securities........................................................................................ 7,750 — — 7,750 — 7,750 Precious metals trading............................................................................. — 4,497 — 4,497 — 4,497
Derivatives:(1)
Interest rate contracts................................................................................ 7 3,670 3 3,680 — 3,680 Foreign exchange contracts....................................................................... — 15,752 15 15,767 — 15,767 Equity contracts......................................................................................... — 3,991 466 4,457 — 4,457 Precious metals contracts.......................................................................... 14 1,363 — 1,377 — 1,377 Credit contracts......................................................................................... — 289 50 339 — 339 Other contracts(2)....................................................................................... — — 7 7 — 7 Derivatives netting.................................................................................... — — — — (23,001) (23,001)
Total derivatives........................................................................................... 21 25,065 541 25,627 (23,001) 2,626 Securities available-for-sale:(3)
U.S. Treasury, U.S. Government agencies and sponsored enterprises..... 15,091 16,417 — 31,508 — 31,508 Asset-backed securities:
Home equity........................................................................................ — — 25 25 — 25 Other.................................................................................................... — — 105 105 — 105
Debt securities issued by foreign entities.................................................. 2,947 74 — 3,021 — 3,021 Loans(4)......................................................................................................... — 30 — 30 — 30 Loans held for sale(4).................................................................................... — 83 — 83 — 83 Other assets:
Mortgage servicing rights......................................................................... — — 11 11 — 11 Equity securities........................................................................................ — 145 — 145 — 145 Equity securities measured at net asset value(5)........................................ — — — 137 — 137
Total assets....................................................................................... $ 36,580 $ 46,531 $ 706 $ 83,954 $ (23,001) $ 60,953 Liabilities:Domestic deposits(4)...................................................................................... $ — $ 3,166 $ 599 $ 3,765 $ — $ 3,765 Trading liabilities, excluding derivatives..................................................... 655 — — 655 — 655 Derivatives:(1)
Interest rate contracts................................................................................ 5 3,303 1 3,309 — 3,309 Foreign exchange contracts....................................................................... — 14,678 17 14,695 — 14,695 Equity contracts......................................................................................... — 2,470 424 2,894 — 2,894 Precious metals contracts.......................................................................... — 1,228 — 1,228 — 1,228 Credit contracts......................................................................................... — 222 5 227 — 227 Other contracts(2)....................................................................................... — — 57 57 — 57 Derivatives netting.................................................................................... — — — — (20,594) (20,594)
Total derivatives........................................................................................... 5 21,901 504 22,410 (20,594) 1,816 Long-term debt(4).......................................................................................... — 9,384 486 9,870 — 9,870
Total liabilities................................................................................. $ 660 $ 34,451 $ 1,589 $ 36,700 $ (20,594) $ 16,106
HSBC USA Inc.
59
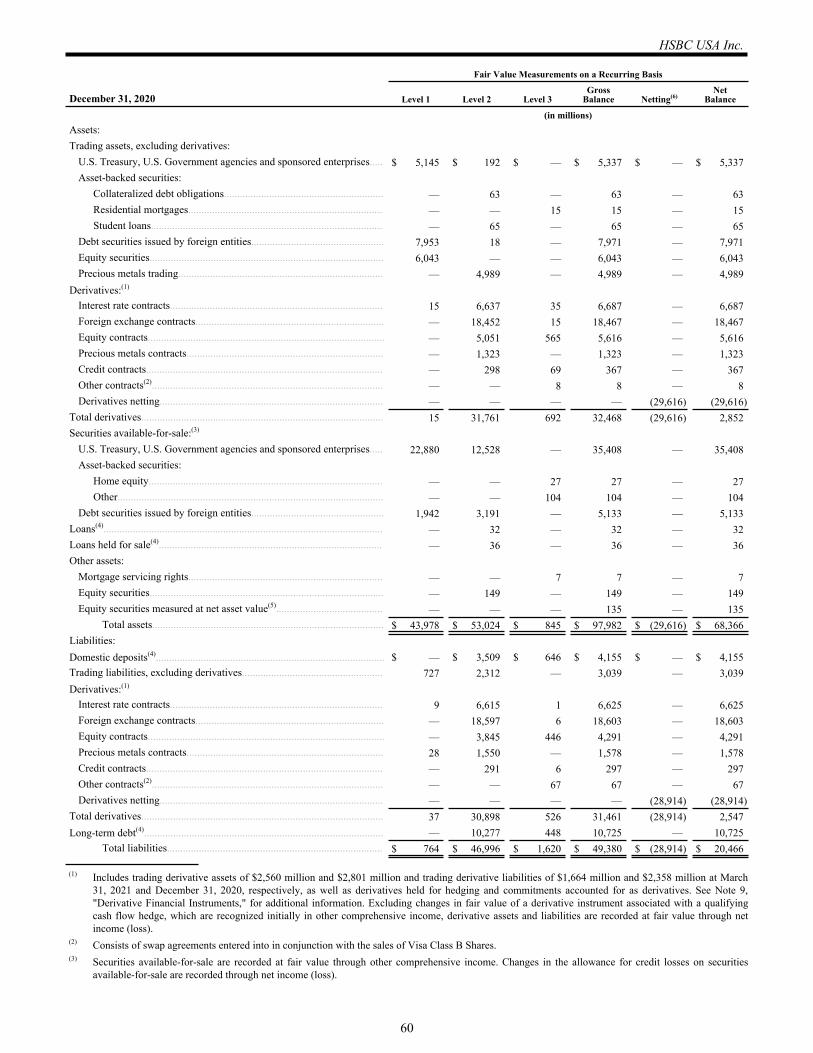
Fair Value Measurements on a Recurring Basis
December 31, 2020 Level 1 Level 2 Level 3Gross
Balance Netting(6)Net
Balance
(in millions)Assets:Trading assets, excluding derivatives:
U.S. Treasury, U.S. Government agencies and sponsored enterprises..... $ 5,145 $ 192 $ — $ 5,337 $ — $ 5,337 Asset-backed securities:
Collateralized debt obligations............................................................ — 63 — 63 — 63 Residential mortgages......................................................................... — — 15 15 — 15 Student loans....................................................................................... — 65 — 65 — 65
Debt securities issued by foreign entities.................................................. 7,953 18 — 7,971 — 7,971 Equity securities........................................................................................ 6,043 — — 6,043 — 6,043 Precious metals trading............................................................................. — 4,989 — 4,989 — 4,989
Derivatives:(1)
Interest rate contracts................................................................................ 15 6,637 35 6,687 — 6,687 Foreign exchange contracts....................................................................... — 18,452 15 18,467 — 18,467 Equity contracts......................................................................................... — 5,051 565 5,616 — 5,616 Precious metals contracts.......................................................................... — 1,323 — 1,323 — 1,323 Credit contracts......................................................................................... — 298 69 367 — 367 Other contracts(2)....................................................................................... — — 8 8 — 8 Derivatives netting.................................................................................... — — — — (29,616) (29,616)
Total derivatives........................................................................................... 15 31,761 692 32,468 (29,616) 2,852 Securities available-for-sale:(3)
U.S. Treasury, U.S. Government agencies and sponsored enterprises..... 22,880 12,528 — 35,408 — 35,408 Asset-backed securities:
Home equity........................................................................................ — — 27 27 — 27 Other.................................................................................................... — — 104 104 — 104
Debt securities issued by foreign entities.................................................. 1,942 3,191 — 5,133 — 5,133 Loans(4)......................................................................................................... — 32 — 32 — 32 Loans held for sale(4).................................................................................... — 36 — 36 — 36 Other assets:
Mortgage servicing rights......................................................................... — — 7 7 — 7 Equity securities........................................................................................ — 149 — 149 — 149 Equity securities measured at net asset value(5)........................................ — — — 135 — 135
Total assets....................................................................................... $ 43,978 $ 53,024 $ 845 $ 97,982 $ (29,616) $ 68,366 Liabilities:Domestic deposits(4)...................................................................................... $ — $ 3,509 $ 646 $ 4,155 $ — $ 4,155 Trading liabilities, excluding derivatives..................................................... 727 2,312 — 3,039 — 3,039 Derivatives:(1)
Interest rate contracts................................................................................ 9 6,615 1 6,625 — 6,625 Foreign exchange contracts....................................................................... — 18,597 6 18,603 — 18,603 Equity contracts......................................................................................... — 3,845 446 4,291 — 4,291 Precious metals contracts.......................................................................... 28 1,550 — 1,578 — 1,578 Credit contracts......................................................................................... — 291 6 297 — 297 Other contracts(2)....................................................................................... — — 67 67 — 67 Derivatives netting.................................................................................... — — — — (28,914) (28,914)
Total derivatives........................................................................................... 37 30,898 526 31,461 (28,914) 2,547 Long-term debt(4).......................................................................................... — 10,277 448 10,725 — 10,725
Total liabilities................................................................................. $ 764 $ 46,996 $ 1,620 $ 49,380 $ (28,914) $ 20,466
(1) Includes trading derivative assets of $2,560 million and $2,801 million and trading derivative liabilities of $1,664 million and $2,358 million at March 31, 2021 and December 31, 2020, respectively, as well as derivatives held for hedging and commitments accounted for as derivatives. See Note 9, "Derivative Financial Instruments," for additional information. Excluding changes in fair value of a derivative instrument associated with a qualifying cash flow hedge, which are recognized initially in other comprehensive income, derivative assets and liabilities are recorded at fair value through net income (loss).
(2) Consists of swap agreements entered into in conjunction with the sales of Visa Class B Shares.(3) Securities available-for-sale are recorded at fair value through other comprehensive income. Changes in the allowance for credit losses on securities
available-for-sale are recorded through net income (loss).
HSBC USA Inc.
60
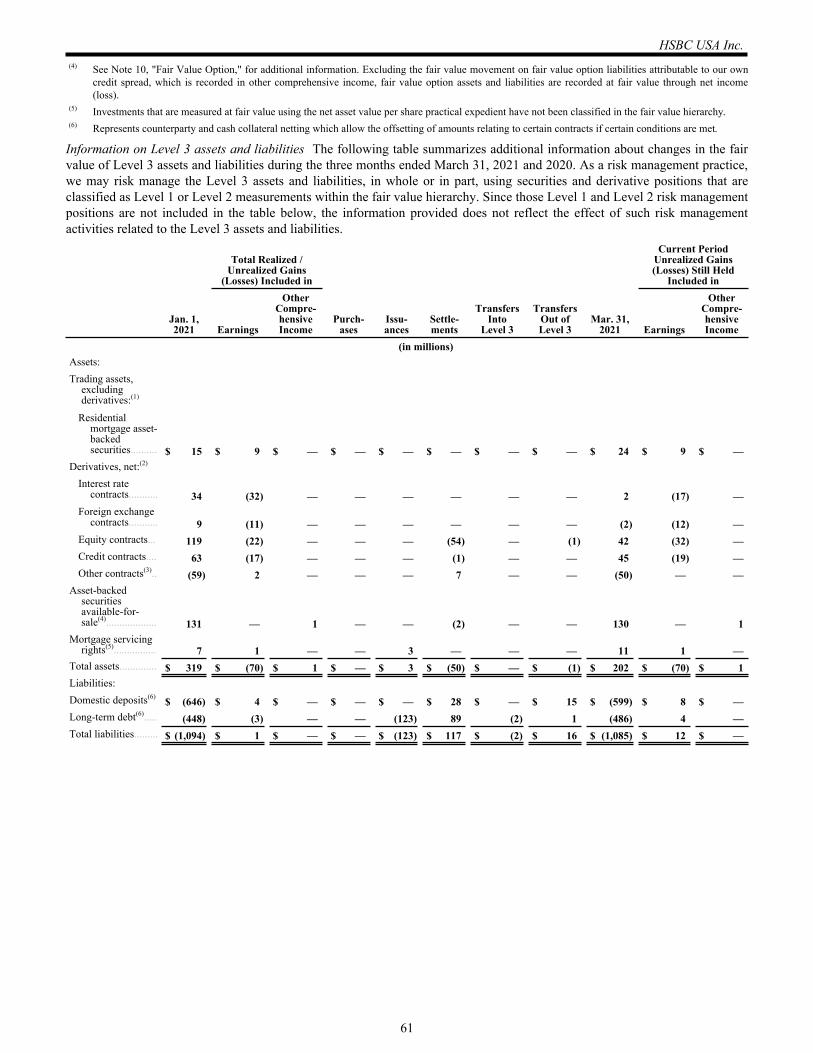
(4) See Note 10, "Fair Value Option," for additional information. Excluding the fair value movement on fair value option liabilities attributable to our own credit spread, which is recorded in other comprehensive income, fair value option assets and liabilities are recorded at fair value through net income (loss).
(5) Investments that are measured at fair value using the net asset value per share practical expedient have not been classified in the fair value hierarchy.(6) Represents counterparty and cash collateral netting which allow the offsetting of amounts relating to certain contracts if certain conditions are met.
Information on Level 3 assets and liabilities The following table summarizes additional information about changes in the fair value of Level 3 assets and liabilities during the three months ended March 31, 2021 and 2020. As a risk management practice, we may risk manage the Level 3 assets and liabilities, in whole or in part, using securities and derivative positions that are classified as Level 1 or Level 2 measurements within the fair value hierarchy. Since those Level 1 and Level 2 risk management positions are not included in the table below, the information provided does not reflect the effect of such risk management activities related to the Level 3 assets and liabilities.
Jan. 1,2021
Total Realized / Unrealized Gains
(Losses) Included in
Purch-ases
Issu-ances
Settle-ments
TransfersInto
Level 3
TransfersOut ofLevel 3
Mar. 31,2021
Current Period Unrealized Gains(Losses) Still Held
Included in
Earnings
Other Compre-hensive Income Earnings
Other Compre-hensive Income
(in millions)Assets:Trading assets,
excluding derivatives:(1)
Residential mortgage asset-backed securities.......... $ 15 $ 9 $ — $ — $ — $ — $ — $ — $ 24 $ 9 $ —
Derivatives, net:(2)
Interest rate contracts........... 34 (32) — — — — — — 2 (17) —
Foreign exchange contracts........... 9 (11) — — — — — — (2) (12) —
Equity contracts... 119 (22) — — — (54) — (1) 42 (32) — Credit contracts.... 63 (17) — — — (1) — — 45 (19) — Other contracts(3).. (59) 2 — — — 7 — — (50) — —
Asset-backed securities available-for-sale(4)................... 131 — 1 — — (2) — — 130 — 1
Mortgage servicing rights(5)................ 7 1 — — 3 — — — 11 1 —
Total assets.............. $ 319 $ (70) $ 1 $ — $ 3 $ (50) $ — $ (1) $ 202 $ (70) $ 1 Liabilities:Domestic deposits(6) $ (646) $ 4 $ — $ — $ — $ 28 $ — $ 15 $ (599) $ 8 $ — Long-term debt(6)..... (448) (3) — — (123) 89 (2) 1 (486) 4 — Total liabilities......... $ (1,094) $ 1 $ — $ — $ (123) $ 117 $ (2) $ 16 $ (1,085) $ 12 $ —
HSBC USA Inc.
61
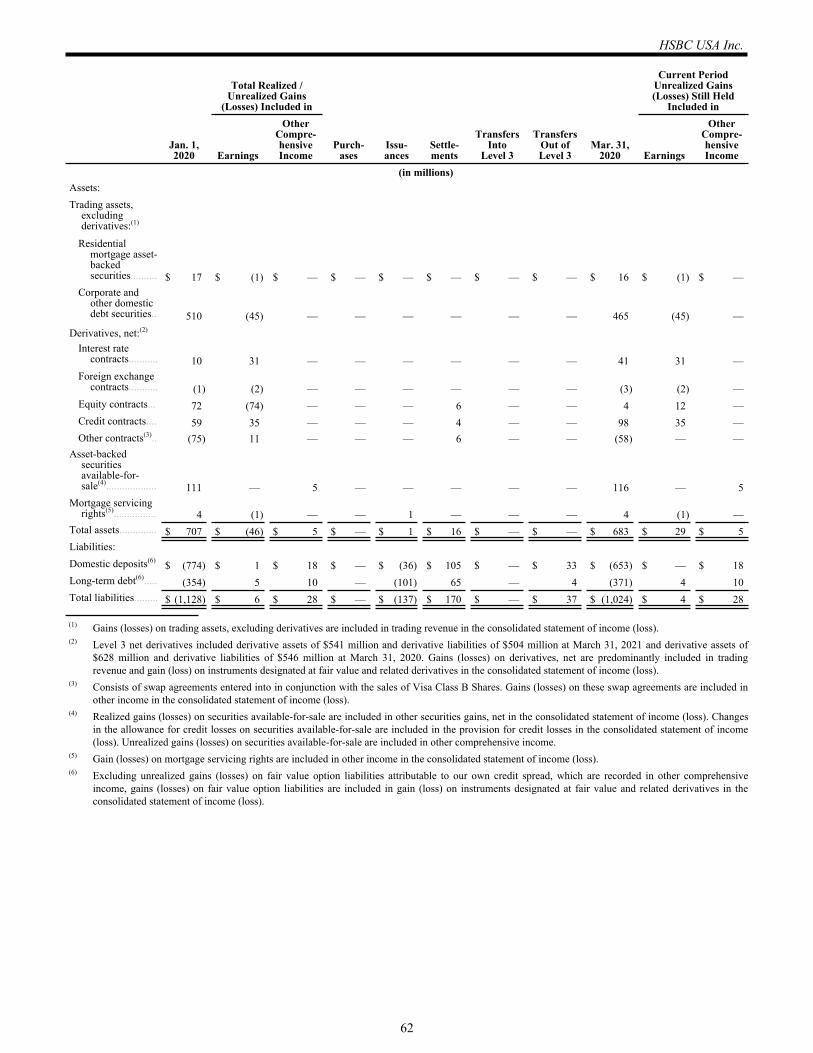
Jan. 1,2020
Total Realized / Unrealized Gains
(Losses) Included in
Purch-ases
Issu-ances
Settle-ments
TransfersInto
Level 3
TransfersOut ofLevel 3
Mar. 31,2020
Current PeriodUnrealized Gains(Losses) Still Held
Included in
Earnings
Other Compre-hensive Income Earnings
Other Compre-hensive Income
(in millions)Assets:Trading assets,
excluding derivatives:(1)
Residential mortgage asset-backed securities.......... $ 17 $ (1) $ — $ — $ — $ — $ — $ — $ 16 $ (1) $ —
Corporate and other domestic debt securities.. 510 (45) — — — — — — 465 (45) —
Derivatives, net:(2)
Interest rate contracts........... 10 31 — — — — — — 41 31 —
Foreign exchange contracts........... (1) (2) — — — — — — (3) (2) —
Equity contracts... 72 (74) — — — 6 — — 4 12 — Credit contracts.... 59 35 — — — 4 — — 98 35 — Other contracts(3).. (75) 11 — — — 6 — — (58) — —
Asset-backed securities available-for-sale(4)................... 111 — 5 — — — — — 116 — 5
Mortgage servicing rights(5)................ 4 (1) — — 1 — — — 4 (1) —
Total assets.............. $ 707 $ (46) $ 5 $ — $ 1 $ 16 $ — $ — $ 683 $ 29 $ 5 Liabilities:Domestic deposits(6) $ (774) $ 1 $ 18 $ — $ (36) $ 105 $ — $ 33 $ (653) $ — $ 18 Long-term debt(6)..... (354) 5 10 — (101) 65 — 4 (371) 4 10 Total liabilities......... $ (1,128) $ 6 $ 28 $ — $ (137) $ 170 $ — $ 37 $ (1,024) $ 4 $ 28
(1) Gains (losses) on trading assets, excluding derivatives are included in trading revenue in the consolidated statement of income (loss).(2) Level 3 net derivatives included derivative assets of $541 million and derivative liabilities of $504 million at March 31, 2021 and derivative assets of
$628 million and derivative liabilities of $546 million at March 31, 2020. Gains (losses) on derivatives, net are predominantly included in trading revenue and gain (loss) on instruments designated at fair value and related derivatives in the consolidated statement of income (loss).
(3) Consists of swap agreements entered into in conjunction with the sales of Visa Class B Shares. Gains (losses) on these swap agreements are included in other income in the consolidated statement of income (loss).
(4) Realized gains (losses) on securities available-for-sale are included in other securities gains, net in the consolidated statement of income (loss). Changes in the allowance for credit losses on securities available-for-sale are included in the provision for credit losses in the consolidated statement of income (loss). Unrealized gains (losses) on securities available-for-sale are included in other comprehensive income.
(5) Gain (losses) on mortgage servicing rights are included in other income in the consolidated statement of income (loss).(6) Excluding unrealized gains (losses) on fair value option liabilities attributable to our own credit spread, which are recorded in other comprehensive
income, gains (losses) on fair value option liabilities are included in gain (loss) on instruments designated at fair value and related derivatives in the consolidated statement of income (loss).
HSBC USA Inc.
62
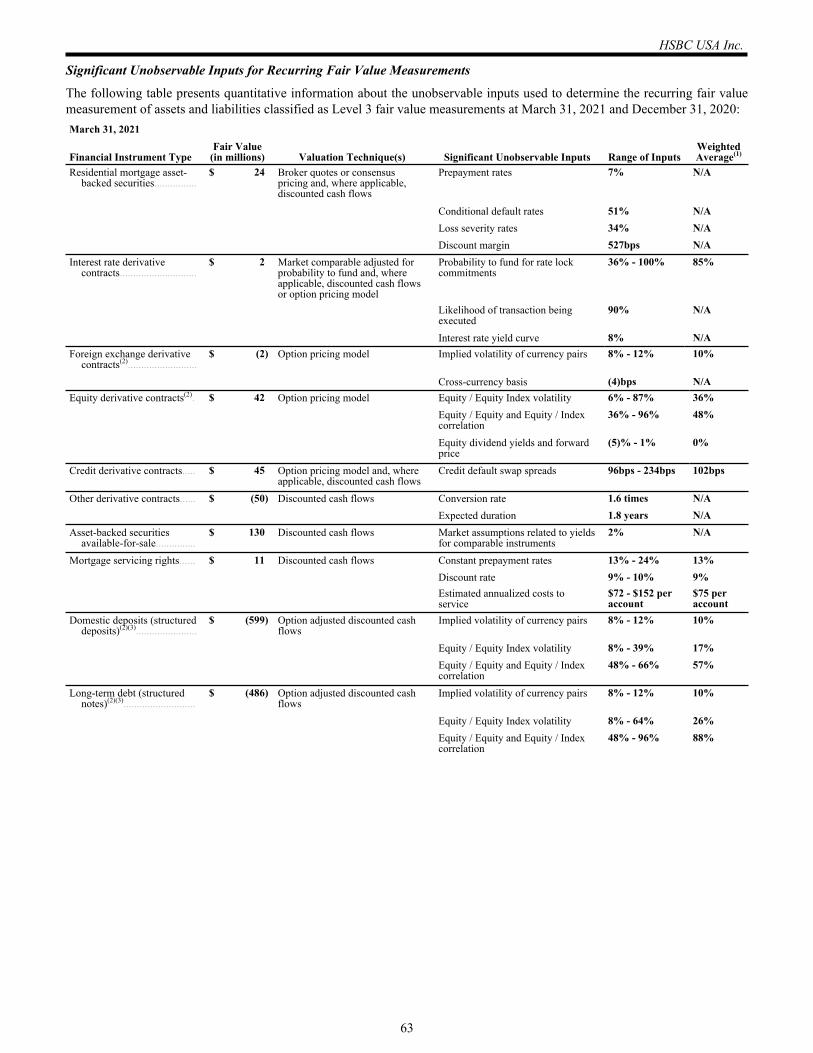
Significant Unobservable Inputs for Recurring Fair Value Measurements
The following table presents quantitative information about the unobservable inputs used to determine the recurring fair value measurement of assets and liabilities classified as Level 3 fair value measurements at March 31, 2021 and December 31, 2020:March 31, 2021
Financial Instrument TypeFair Value
(in millions) Valuation Technique(s) Significant Unobservable Inputs Range of InputsWeighted Average(1)
Residential mortgage asset-backed securities................
$ 24 Broker quotes or consensus pricing and, where applicable, discounted cash flows
Prepayment rates 7% N/A
Conditional default rates 51% N/ALoss severity rates 34% N/ADiscount margin 527bps N/A
Interest rate derivative contracts.............................
$ 2 Market comparable adjusted for probability to fund and, where applicable, discounted cash flows or option pricing model
Probability to fund for rate lock commitments
36% - 100% 85%
Likelihood of transaction being executed
90% N/A
Interest rate yield curve 8% N/AForeign exchange derivative
contracts(2)..........................$ (2) Option pricing model Implied volatility of currency pairs 8% - 12% 10%
Cross-currency basis (4)bps N/AEquity derivative contracts(2). $ 42 Option pricing model Equity / Equity Index volatility 6% - 87% 36%
Equity / Equity and Equity / Index correlation
36% - 96% 48%
Equity dividend yields and forward price
(5)% - 1% 0%
Credit derivative contracts..... $ 45 Option pricing model and, where applicable, discounted cash flows
Credit default swap spreads 96bps - 234bps 102bps
Other derivative contracts...... $ (50) Discounted cash flows Conversion rate 1.6 times N/AExpected duration 1.8 years N/A
Asset-backed securities available-for-sale...............
$ 130 Discounted cash flows Market assumptions related to yields for comparable instruments
2% N/A
Mortgage servicing rights...... $ 11 Discounted cash flows Constant prepayment rates 13% - 24% 13%Discount rate 9% - 10% 9%Estimated annualized costs to service
$72 - $152 per account
$75 per account
Domestic deposits (structured deposits)(2)(3).......................
$ (599) Option adjusted discounted cash flows
Implied volatility of currency pairs 8% - 12% 10%
Equity / Equity Index volatility 8% - 39% 17%Equity / Equity and Equity / Index correlation
48% - 66% 57%
Long-term debt (structured notes)(2)(3)...........................
$ (486) Option adjusted discounted cash flows
Implied volatility of currency pairs 8% - 12% 10%
Equity / Equity Index volatility 8% - 64% 26%Equity / Equity and Equity / Index correlation
48% - 96% 88%
HSBC USA Inc.
63
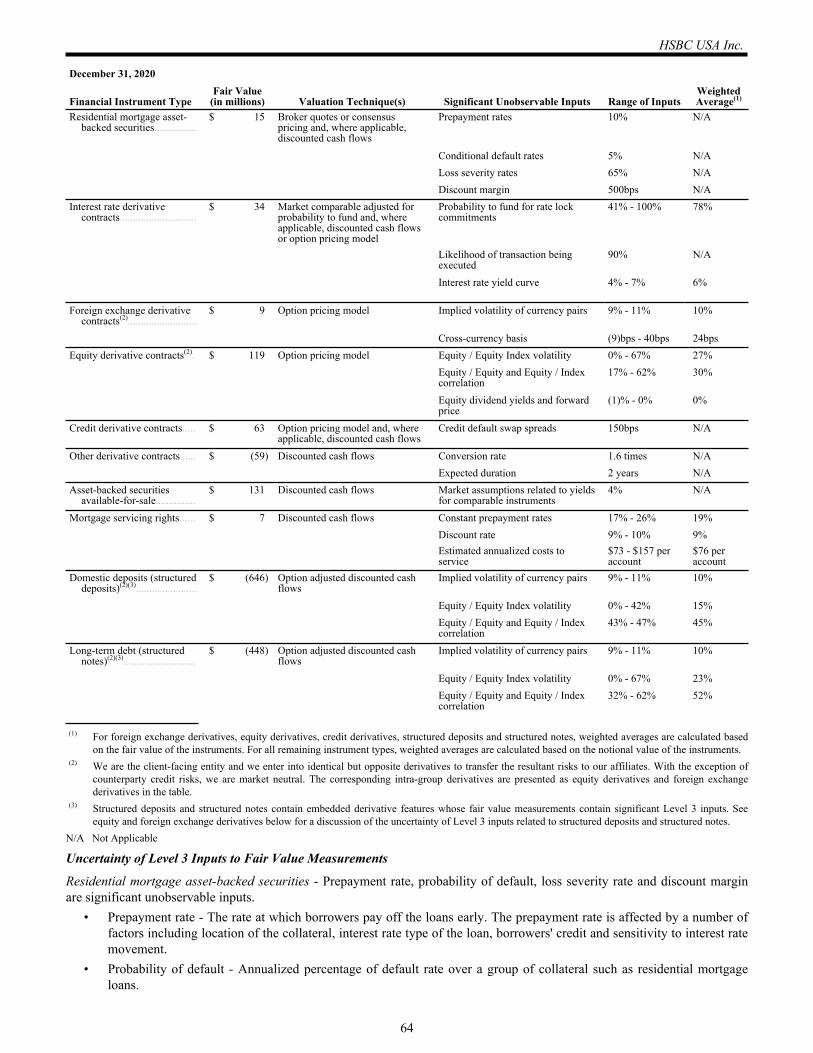
December 31, 2020
Financial Instrument TypeFair Value
(in millions) Valuation Technique(s) Significant Unobservable Inputs Range of InputsWeighted Average(1)
Residential mortgage asset-backed securities................
$ 15 Broker quotes or consensus pricing and, where applicable, discounted cash flows
Prepayment rates 10% N/A
Conditional default rates 5% N/ALoss severity rates 65% N/ADiscount margin 500bps N/A
Interest rate derivative contracts.............................
$ 34 Market comparable adjusted for probability to fund and, where applicable, discounted cash flows or option pricing model
Probability to fund for rate lock commitments
41% - 100% 78%
Likelihood of transaction being executed
90% N/A
Interest rate yield curve 4% - 7% 6%
Foreign exchange derivative contracts(2)..........................
$ 9 Option pricing model Implied volatility of currency pairs 9% - 11% 10%
Cross-currency basis (9)bps - 40bps 24bpsEquity derivative contracts(2). $ 119 Option pricing model Equity / Equity Index volatility 0% - 67% 27%
Equity / Equity and Equity / Index correlation
17% - 62% 30%
Equity dividend yields and forward price
(1)% - 0% 0%
Credit derivative contracts..... $ 63 Option pricing model and, where applicable, discounted cash flows
Credit default swap spreads 150bps N/A
Other derivative contracts...... $ (59) Discounted cash flows Conversion rate 1.6 times N/AExpected duration 2 years N/A
Asset-backed securities available-for-sale...............
$ 131 Discounted cash flows Market assumptions related to yields for comparable instruments
4% N/A
Mortgage servicing rights...... $ 7 Discounted cash flows Constant prepayment rates 17% - 26% 19%Discount rate 9% - 10% 9%Estimated annualized costs to service
$73 - $157 per account
$76 per account
Domestic deposits (structured deposits)(2)(3).......................
$ (646) Option adjusted discounted cash flows
Implied volatility of currency pairs 9% - 11% 10%
Equity / Equity Index volatility 0% - 42% 15%Equity / Equity and Equity / Index correlation
43% - 47% 45%
Long-term debt (structured notes)(2)(3)...........................
$ (448) Option adjusted discounted cash flows
Implied volatility of currency pairs 9% - 11% 10%
Equity / Equity Index volatility 0% - 67% 23%Equity / Equity and Equity / Index correlation
32% - 62% 52%
(1) For foreign exchange derivatives, equity derivatives, credit derivatives, structured deposits and structured notes, weighted averages are calculated based on the fair value of the instruments. For all remaining instrument types, weighted averages are calculated based on the notional value of the instruments.
(2) We are the client-facing entity and we enter into identical but opposite derivatives to transfer the resultant risks to our affiliates. With the exception of counterparty credit risks, we are market neutral. The corresponding intra-group derivatives are presented as equity derivatives and foreign exchange derivatives in the table.
(3) Structured deposits and structured notes contain embedded derivative features whose fair value measurements contain significant Level 3 inputs. See equity and foreign exchange derivatives below for a discussion of the uncertainty of Level 3 inputs related to structured deposits and structured notes.
N/A Not Applicable
Uncertainty of Level 3 Inputs to Fair Value Measurements
Residential mortgage asset-backed securities - Prepayment rate, probability of default, loss severity rate and discount margin are significant unobservable inputs.
• Prepayment rate - The rate at which borrowers pay off the loans early. The prepayment rate is affected by a number of factors including location of the collateral, interest rate type of the loan, borrowers' credit and sensitivity to interest rate movement.
• Probability of default - Annualized percentage of default rate over a group of collateral such as residential mortgage loans.
HSBC USA Inc.
64
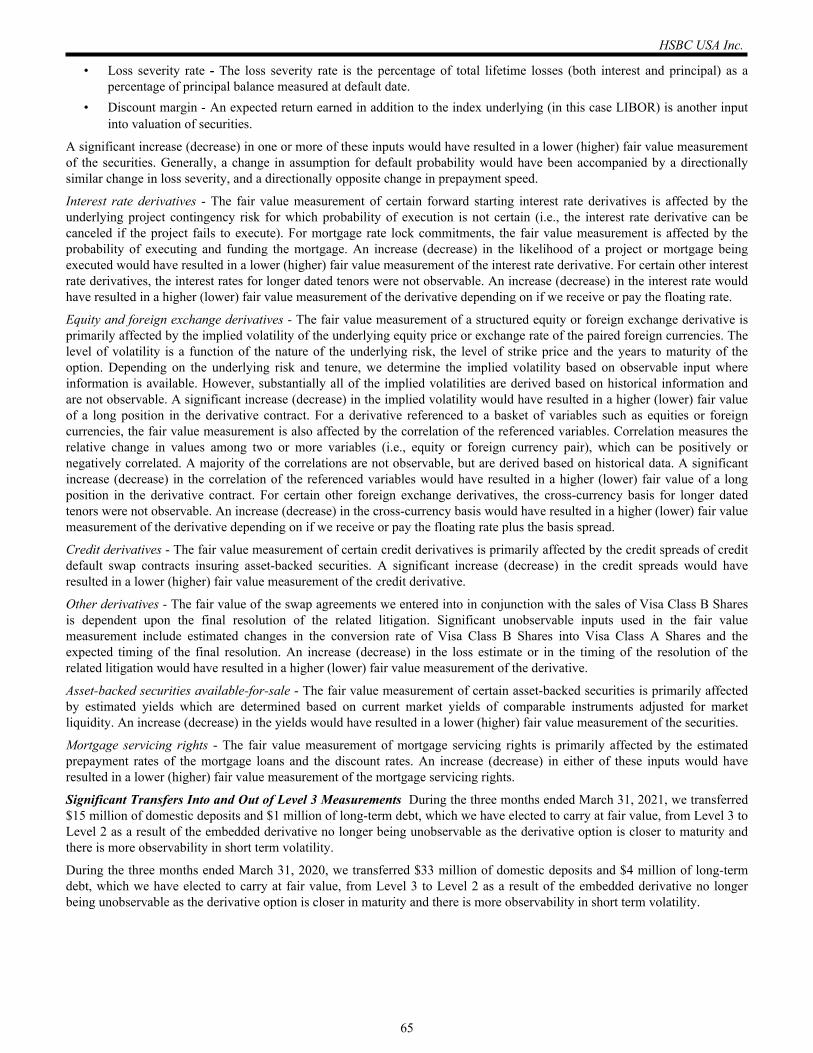
• Loss severity rate - The loss severity rate is the percentage of total lifetime losses (both interest and principal) as a percentage of principal balance measured at default date.
• Discount margin - An expected return earned in addition to the index underlying (in this case LIBOR) is another input into valuation of securities.
A significant increase (decrease) in one or more of these inputs would have resulted in a lower (higher) fair value measurement of the securities. Generally, a change in assumption for default probability would have been accompanied by a directionally similar change in loss severity, and a directionally opposite change in prepayment speed.
Interest rate derivatives - The fair value measurement of certain forward starting interest rate derivatives is affected by the underlying project contingency risk for which probability of execution is not certain (i.e., the interest rate derivative can be canceled if the project fails to execute). For mortgage rate lock commitments, the fair value measurement is affected by the probability of executing and funding the mortgage. An increase (decrease) in the likelihood of a project or mortgage being executed would have resulted in a lower (higher) fair value measurement of the interest rate derivative. For certain other interest rate derivatives, the interest rates for longer dated tenors were not observable. An increase (decrease) in the interest rate would have resulted in a higher (lower) fair value measurement of the derivative depending on if we receive or pay the floating rate.
Equity and foreign exchange derivatives - The fair value measurement of a structured equity or foreign exchange derivative is primarily affected by the implied volatility of the underlying equity price or exchange rate of the paired foreign currencies. The level of volatility is a function of the nature of the underlying risk, the level of strike price and the years to maturity of the option. Depending on the underlying risk and tenure, we determine the implied volatility based on observable input where information is available. However, substantially all of the implied volatilities are derived based on historical information and are not observable. A significant increase (decrease) in the implied volatility would have resulted in a higher (lower) fair value of a long position in the derivative contract. For a derivative referenced to a basket of variables such as equities or foreign currencies, the fair value measurement is also affected by the correlation of the referenced variables. Correlation measures the relative change in values among two or more variables (i.e., equity or foreign currency pair), which can be positively or negatively correlated. A majority of the correlations are not observable, but are derived based on historical data. A significant increase (decrease) in the correlation of the referenced variables would have resulted in a higher (lower) fair value of a long position in the derivative contract. For certain other foreign exchange derivatives, the cross-currency basis for longer dated tenors were not observable. An increase (decrease) in the cross-currency basis would have resulted in a higher (lower) fair value measurement of the derivative depending on if we receive or pay the floating rate plus the basis spread.
Credit derivatives - The fair value measurement of certain credit derivatives is primarily affected by the credit spreads of credit default swap contracts insuring asset-backed securities. A significant increase (decrease) in the credit spreads would have resulted in a lower (higher) fair value measurement of the credit derivative.
Other derivatives - The fair value of the swap agreements we entered into in conjunction with the sales of Visa Class B Shares is dependent upon the final resolution of the related litigation. Significant unobservable inputs used in the fair value measurement include estimated changes in the conversion rate of Visa Class B Shares into Visa Class A Shares and the expected timing of the final resolution. An increase (decrease) in the loss estimate or in the timing of the resolution of the related litigation would have resulted in a higher (lower) fair value measurement of the derivative.
Asset-backed securities available-for-sale - The fair value measurement of certain asset-backed securities is primarily affected by estimated yields which are determined based on current market yields of comparable instruments adjusted for market liquidity. An increase (decrease) in the yields would have resulted in a lower (higher) fair value measurement of the securities.
Mortgage servicing rights - The fair value measurement of mortgage servicing rights is primarily affected by the estimated prepayment rates of the mortgage loans and the discount rates. An increase (decrease) in either of these inputs would have resulted in a lower (higher) fair value measurement of the mortgage servicing rights.
Significant Transfers Into and Out of Level 3 Measurements During the three months ended March 31, 2021, we transferred $15 million of domestic deposits and $1 million of long-term debt, which we have elected to carry at fair value, from Level 3 to Level 2 as a result of the embedded derivative no longer being unobservable as the derivative option is closer to maturity and there is more observability in short term volatility.
During the three months ended March 31, 2020, we transferred $33 million of domestic deposits and $4 million of long-term debt, which we have elected to carry at fair value, from Level 3 to Level 2 as a result of the embedded derivative no longer being unobservable as the derivative option is closer in maturity and there is more observability in short term volatility.
HSBC USA Inc.
65
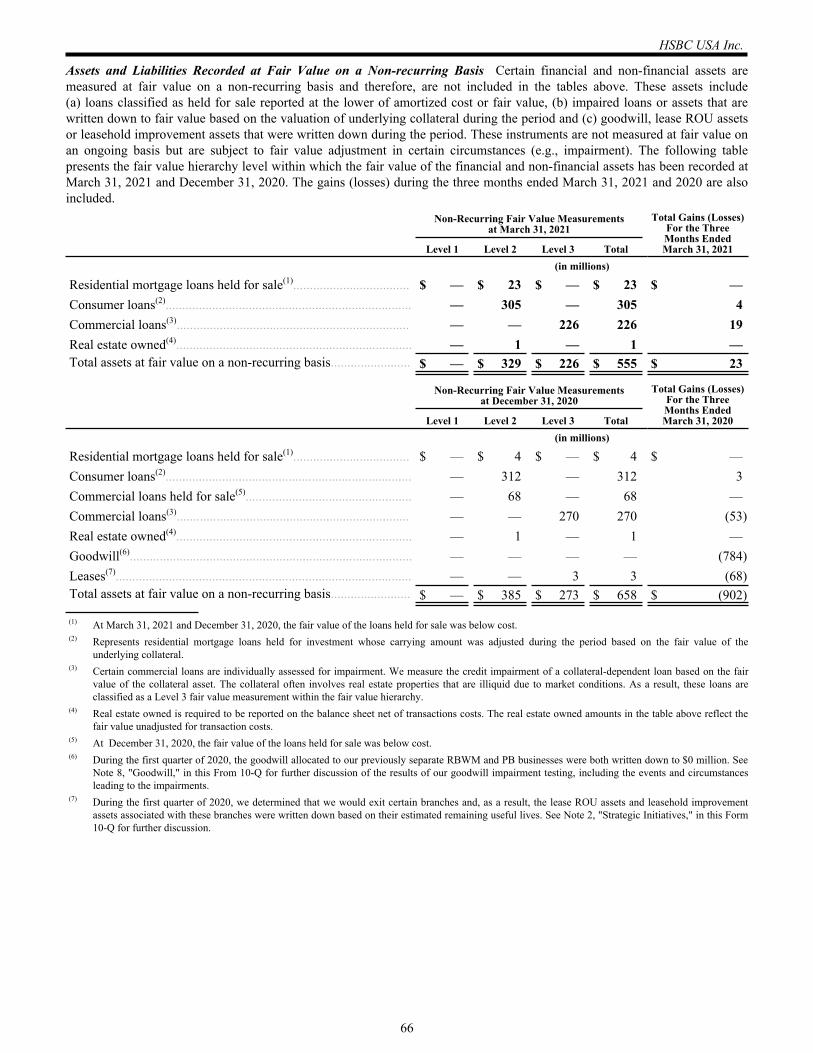
Assets and Liabilities Recorded at Fair Value on a Non-recurring Basis Certain financial and non-financial assets are measured at fair value on a non-recurring basis and therefore, are not included in the tables above. These assets include (a) loans classified as held for sale reported at the lower of amortized cost or fair value, (b) impaired loans or assets that are written down to fair value based on the valuation of underlying collateral during the period and (c) goodwill, lease ROU assets or leasehold improvement assets that were written down during the period. These instruments are not measured at fair value on an ongoing basis but are subject to fair value adjustment in certain circumstances (e.g., impairment). The following table presents the fair value hierarchy level within which the fair value of the financial and non-financial assets has been recorded at March 31, 2021 and December 31, 2020. The gains (losses) during the three months ended March 31, 2021 and 2020 are also included.
Non-Recurring Fair Value Measurements
at March 31, 2021Total Gains (Losses)
For the Three Months Ended March 31, 2021 Level 1 Level 2 Level 3 Total
(in millions)
Residential mortgage loans held for sale(1)................................... $ — $ 23 $ — $ 23 $ — Consumer loans(2).......................................................................... — 305 — 305 4 Commercial loans(3)...................................................................... — — 226 226 19 Real estate owned(4)....................................................................... — 1 — 1 — Total assets at fair value on a non-recurring basis........................ $ — $ 329 $ 226 $ 555 $ 23
Non-Recurring Fair Value Measurements
at December 31, 2020Total Gains (Losses)
For the Three Months Ended March 31, 2020 Level 1 Level 2 Level 3 Total
(in millions)
Residential mortgage loans held for sale(1)................................... $ — $ 4 $ — $ 4 $ — Consumer loans(2).......................................................................... — 312 — 312 3 Commercial loans held for sale(5).................................................. — 68 — 68 — Commercial loans(3)...................................................................... — — 270 270 (53) Real estate owned(4)....................................................................... — 1 — 1 — Goodwill(6)..................................................................................... — — — — (784) Leases(7)......................................................................................... — — 3 3 (68) Total assets at fair value on a non-recurring basis........................ $ — $ 385 $ 273 $ 658 $ (902)
(1) At March 31, 2021 and December 31, 2020, the fair value of the loans held for sale was below cost.(2) Represents residential mortgage loans held for investment whose carrying amount was adjusted during the period based on the fair value of the
underlying collateral. (3) Certain commercial loans are individually assessed for impairment. We measure the credit impairment of a collateral-dependent loan based on the fair
value of the collateral asset. The collateral often involves real estate properties that are illiquid due to market conditions. As a result, these loans are classified as a Level 3 fair value measurement within the fair value hierarchy.
(4) Real estate owned is required to be reported on the balance sheet net of transactions costs. The real estate owned amounts in the table above reflect the fair value unadjusted for transaction costs.
(5) At December 31, 2020, the fair value of the loans held for sale was below cost.(6) During the first quarter of 2020, the goodwill allocated to our previously separate RBWM and PB businesses were both written down to $0 million. See
Note 8, "Goodwill," in this From 10-Q for further discussion of the results of our goodwill impairment testing, including the events and circumstances leading to the impairments.
(7) During the first quarter of 2020, we determined that we would exit certain branches and, as a result, the lease ROU assets and leasehold improvement assets associated with these branches were written down based on their estimated remaining useful lives. See Note 2, "Strategic Initiatives," in this Form 10-Q for further discussion.
HSBC USA Inc.
66
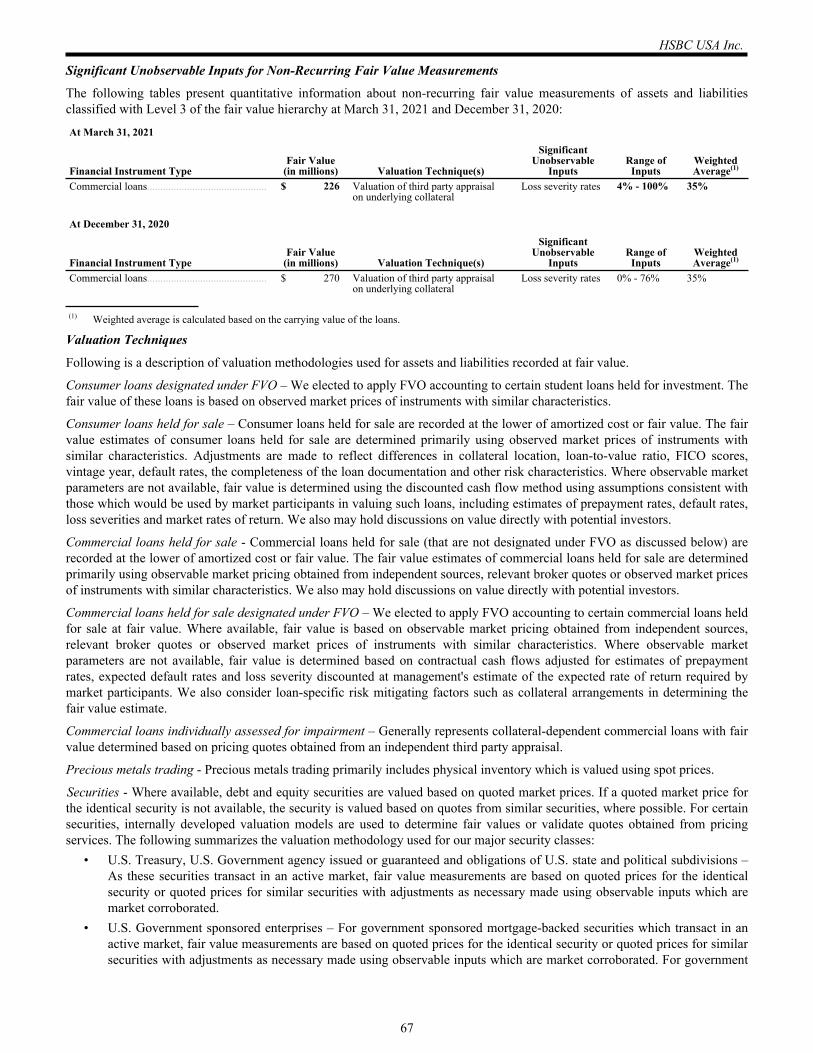
Significant Unobservable Inputs for Non-Recurring Fair Value Measurements
The following tables present quantitative information about non-recurring fair value measurements of assets and liabilities classified with Level 3 of the fair value hierarchy at March 31, 2021 and December 31, 2020:
At March 31, 2021
Financial Instrument TypeFair Value
(in millions) Valuation Technique(s)
Significant Unobservable
InputsRange of
InputsWeighted Average(1)
Commercial loans............................................. $ 226 Valuation of third party appraisal on underlying collateral
Loss severity rates 4% - 100% 35%
At December 31, 2020
Financial Instrument TypeFair Value
(in millions) Valuation Technique(s)
Significant Unobservable
InputsRange of
InputsWeighted Average(1)
Commercial loans............................................. $ 270 Valuation of third party appraisal on underlying collateral
Loss severity rates 0% - 76% 35%
(1) Weighted average is calculated based on the carrying value of the loans.
Valuation Techniques
Following is a description of valuation methodologies used for assets and liabilities recorded at fair value.
Consumer loans designated under FVO – We elected to apply FVO accounting to certain student loans held for investment. The fair value of these loans is based on observed market prices of instruments with similar characteristics.
Consumer loans held for sale – Consumer loans held for sale are recorded at the lower of amortized cost or fair value. The fair value estimates of consumer loans held for sale are determined primarily using observed market prices of instruments with similar characteristics. Adjustments are made to reflect differences in collateral location, loan-to-value ratio, FICO scores, vintage year, default rates, the completeness of the loan documentation and other risk characteristics. Where observable market parameters are not available, fair value is determined using the discounted cash flow method using assumptions consistent with those which would be used by market participants in valuing such loans, including estimates of prepayment rates, default rates, loss severities and market rates of return. We also may hold discussions on value directly with potential investors.
Commercial loans held for sale - Commercial loans held for sale (that are not designated under FVO as discussed below) are recorded at the lower of amortized cost or fair value. The fair value estimates of commercial loans held for sale are determined primarily using observable market pricing obtained from independent sources, relevant broker quotes or observed market prices of instruments with similar characteristics. We also may hold discussions on value directly with potential investors.
Commercial loans held for sale designated under FVO – We elected to apply FVO accounting to certain commercial loans held for sale at fair value. Where available, fair value is based on observable market pricing obtained from independent sources, relevant broker quotes or observed market prices of instruments with similar characteristics. Where observable market parameters are not available, fair value is determined based on contractual cash flows adjusted for estimates of prepayment rates, expected default rates and loss severity discounted at management's estimate of the expected rate of return required by market participants. We also consider loan-specific risk mitigating factors such as collateral arrangements in determining the fair value estimate.
Commercial loans individually assessed for impairment – Generally represents collateral-dependent commercial loans with fair value determined based on pricing quotes obtained from an independent third party appraisal.
Precious metals trading - Precious metals trading primarily includes physical inventory which is valued using spot prices.
Securities - Where available, debt and equity securities are valued based on quoted market prices. If a quoted market price for the identical security is not available, the security is valued based on quotes from similar securities, where possible. For certain securities, internally developed valuation models are used to determine fair values or validate quotes obtained from pricing services. The following summarizes the valuation methodology used for our major security classes:
• U.S. Treasury, U.S. Government agency issued or guaranteed and obligations of U.S. state and political subdivisions – As these securities transact in an active market, fair value measurements are based on quoted prices for the identical security or quoted prices for similar securities with adjustments as necessary made using observable inputs which are market corroborated.
• U.S. Government sponsored enterprises – For government sponsored mortgage-backed securities which transact in an active market, fair value measurements are based on quoted prices for the identical security or quoted prices for similar securities with adjustments as necessary made using observable inputs which are market corroborated. For government
HSBC USA Inc.
67
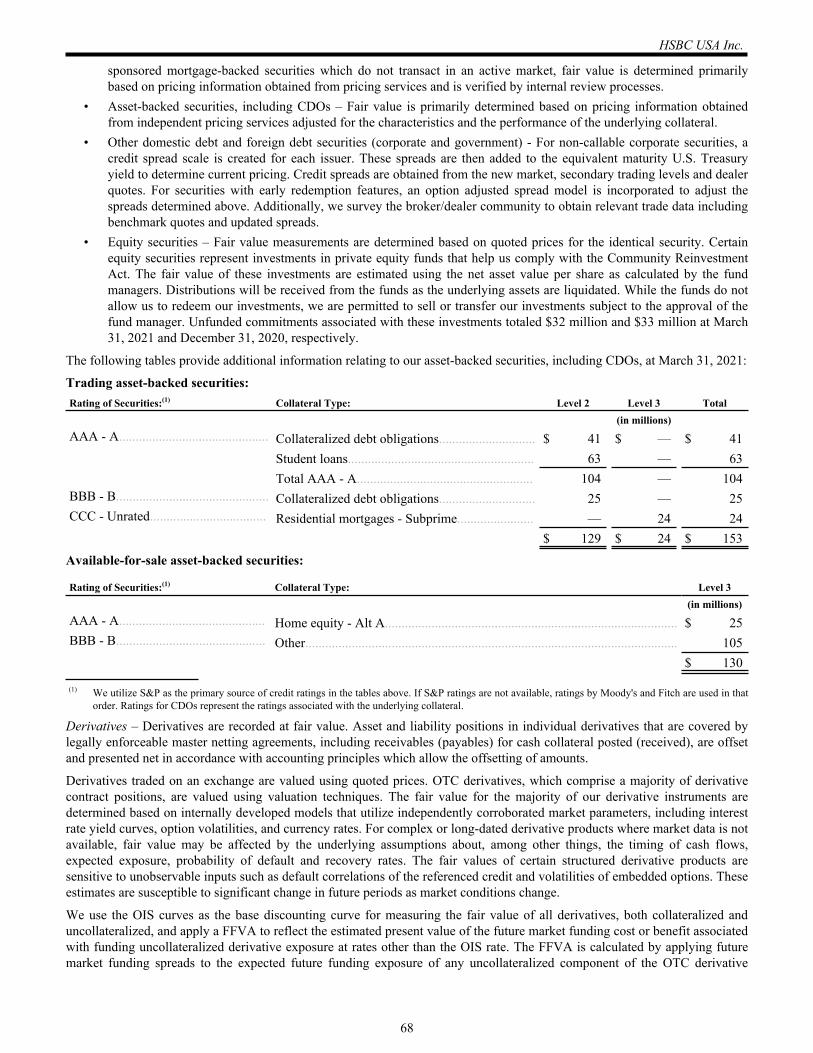
sponsored mortgage-backed securities which do not transact in an active market, fair value is determined primarily based on pricing information obtained from pricing services and is verified by internal review processes.
• Asset-backed securities, including CDOs – Fair value is primarily determined based on pricing information obtained from independent pricing services adjusted for the characteristics and the performance of the underlying collateral.
• Other domestic debt and foreign debt securities (corporate and government) - For non-callable corporate securities, a credit spread scale is created for each issuer. These spreads are then added to the equivalent maturity U.S. Treasury yield to determine current pricing. Credit spreads are obtained from the new market, secondary trading levels and dealer quotes. For securities with early redemption features, an option adjusted spread model is incorporated to adjust the spreads determined above. Additionally, we survey the broker/dealer community to obtain relevant trade data including benchmark quotes and updated spreads.
• Equity securities – Fair value measurements are determined based on quoted prices for the identical security. Certain equity securities represent investments in private equity funds that help us comply with the Community Reinvestment Act. The fair value of these investments are estimated using the net asset value per share as calculated by the fund managers. Distributions will be received from the funds as the underlying assets are liquidated. While the funds do not allow us to redeem our investments, we are permitted to sell or transfer our investments subject to the approval of the fund manager. Unfunded commitments associated with these investments totaled $32 million and $33 million at March 31, 2021 and December 31, 2020, respectively.
The following tables provide additional information relating to our asset-backed securities, including CDOs, at March 31, 2021:
Trading asset-backed securities:Rating of Securities:(1) Collateral Type: Level 2 Level 3 Total (in millions)AAA - A............................................. Collateralized debt obligations............................. $ 41 $ — $ 41
Student loans........................................................ 63 — 63 Total AAA - A..................................................... 104 — 104
BBB - B.............................................. Collateralized debt obligations............................. 25 — 25 CCC - Unrated................................... Residential mortgages - Subprime....................... — 24 24
$ 129 $ 24 $ 153
Available-for-sale asset-backed securities:
Rating of Securities:(1) Collateral Type: Level 3 (in millions)AAA - A............................................ Home equity - Alt A........................................................................................ $ 25 BBB - B............................................. Other................................................................................................................ 105
$ 130
(1) We utilize S&P as the primary source of credit ratings in the tables above. If S&P ratings are not available, ratings by Moody's and Fitch are used in that order. Ratings for CDOs represent the ratings associated with the underlying collateral.
Derivatives – Derivatives are recorded at fair value. Asset and liability positions in individual derivatives that are covered by legally enforceable master netting agreements, including receivables (payables) for cash collateral posted (received), are offset and presented net in accordance with accounting principles which allow the offsetting of amounts.
Derivatives traded on an exchange are valued using quoted prices. OTC derivatives, which comprise a majority of derivative contract positions, are valued using valuation techniques. The fair value for the majority of our derivative instruments are determined based on internally developed models that utilize independently corroborated market parameters, including interest rate yield curves, option volatilities, and currency rates. For complex or long-dated derivative products where market data is not available, fair value may be affected by the underlying assumptions about, among other things, the timing of cash flows, expected exposure, probability of default and recovery rates. The fair values of certain structured derivative products are sensitive to unobservable inputs such as default correlations of the referenced credit and volatilities of embedded options. These estimates are susceptible to significant change in future periods as market conditions change.
We use the OIS curves as the base discounting curve for measuring the fair value of all derivatives, both collateralized and uncollateralized, and apply a FFVA to reflect the estimated present value of the future market funding cost or benefit associated with funding uncollateralized derivative exposure at rates other than the OIS rate. The FFVA is calculated by applying future market funding spreads to the expected future funding exposure of any uncollateralized component of the OTC derivative
HSBC USA Inc.
68
portfolio. The expected future funding exposure is calculated by a simulation methodology, where available, and is adjusted for events that may terminate the exposure, such as the default of HUSI or the counterparty.
Significant inputs related to derivative classes are broken down as follows:• Credit Derivatives – Use credit default curves and recovery rates which are generally provided by broker quotes and
various pricing services. Certain credit derivatives may also use correlation inputs in their model valuation.• Interest Rate Derivatives – Swaps use interest rate curves based on currency that are actively quoted by brokers and
other pricing services. Options will also use volatility inputs which are also quoted in the broker market.• Foreign Exchange ("FX") Derivatives – FX transactions, to the extent possible, use spot and forward FX rates which are
quoted in the broker market. Where applicable, we also use implied volatility of currency pairs as inputs.• Equity Derivatives – Use listed equity security pricing and implied volatilities from equity traded options position.• Precious Metal Derivatives – Use spot and forward metal rates which are quoted in the broker market.
As discussed earlier, we make fair value adjustments to model valuations in order to ensure that those values represent appropriate estimates of fair value. These adjustments, which are applied consistently over time, are generally required to reflect factors such as bid-ask spreads and counterparty credit risk that can affect prices in arms-length transactions with unrelated third parties. Such adjustments are based on management judgment and may not be observable.
We estimate the counterparty credit risk for financial assets and our own credit standing for financial liabilities (the "credit valuation adjustments") in determining the fair value measurement. For derivative instruments, we calculate the credit valuation adjustment by applying the probability of default of the counterparty to the expected exposure, and multiplying the result by the expected loss given default. We also take into consideration the risk mitigating factors including collateral agreements and master netting agreements in determining credit valuation adjustments. We estimate the implied probability of default based on the credit spread of the specific counterparty observed in the credit default swap market. Where credit default spread of the counterparty is not available, we use the credit default spread of a specific proxy (e.g., the credit default swap spread of the counterparty's parent) or a proxy based on credit default swaps referencing to credit names of similar credit standing.
Real estate owned - Fair value is determined based on third party appraisals obtained at the time we take title to the property and, if less than the carrying amount of the loan, the carrying amount of the loan is adjusted to the fair value. The carrying amount of the property is further reduced, if necessary, at least every 90 days to reflect observable local market data, including local area sales data.
Mortgage servicing rights - Mortgage servicing rights are recorded at fair value. The fair value for the mortgage servicing rights is determined based on a single rate path cash flow analysis approach which involves discounting servicing cash flows under static interest rate projections at risk-adjusted rates. The valuation model also incorporates our best estimates of the prepayment speed of the mortgage loans, current cost to service and discount rates which are unobservable.
Structured notes and deposits designated under FVO – Structured notes and deposits are hybrid instruments containing embedded derivatives and are elected to be measured at fair value in their entirety under FVO accounting principles. The valuation of hybrid instruments is predominantly driven by the derivative features embedded within the instruments and our own credit risk. The valuation of embedded derivatives may include significant unobservable inputs such as correlation of the referenced credit names or volatility of the embedded option. Cash flows of the funded notes and deposits in their entirety, including the embedded derivatives, are discounted at the relevant interest rates for the duration of the instrument adjusted for our own credit spreads. The credit spreads so applied are determined with reference to our own debt issuance rates observed in primary and secondary markets, internal funding rates, and the structured note rates in recent executions.
Long-term debt designated under FVO – We elected to apply FVO accounting to certain of our own debt issuances for which fair value hedge accounting otherwise would have been applied. These own debt issuances elected under FVO are traded in secondary markets and, as such, the fair value is determined based on observed prices for the specific instrument. The observed market price of these instruments reflects the effect of our own credit spreads. The credit spreads applied to these instruments were derived from the spreads at the measurement date.
HSBC USA Inc.
69
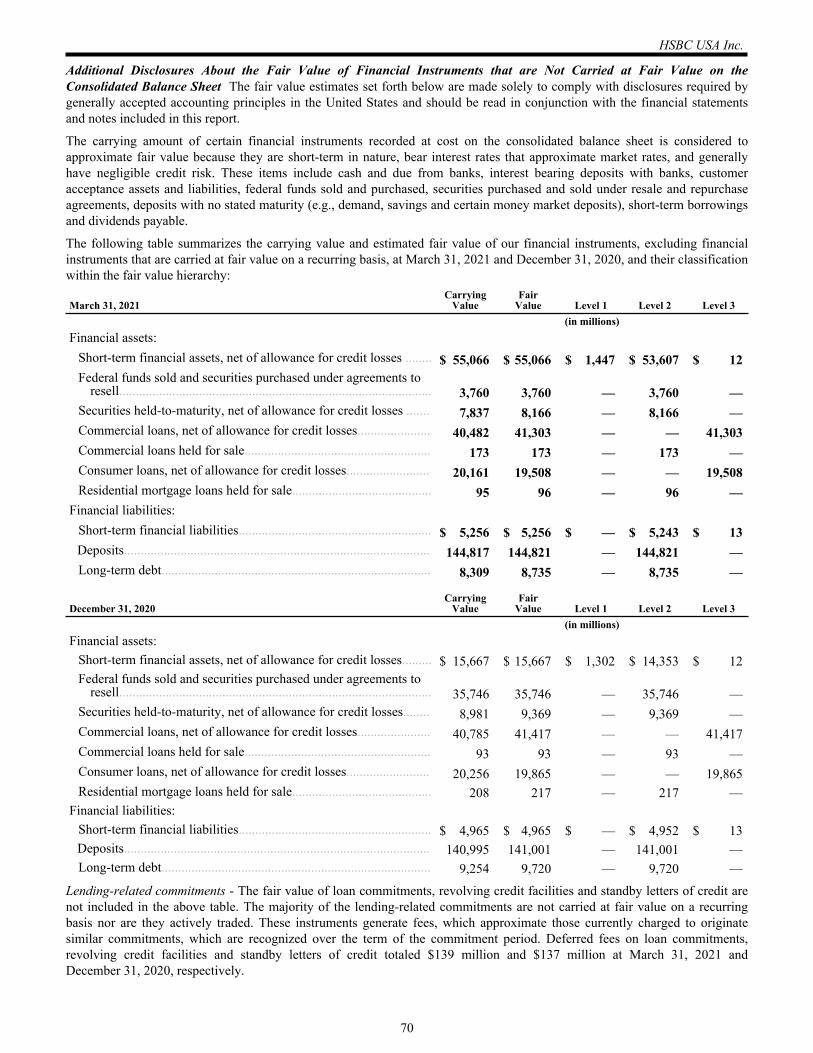
Additional Disclosures About the Fair Value of Financial Instruments that are Not Carried at Fair Value on the Consolidated Balance Sheet The fair value estimates set forth below are made solely to comply with disclosures required by generally accepted accounting principles in the United States and should be read in conjunction with the financial statements and notes included in this report.
The carrying amount of certain financial instruments recorded at cost on the consolidated balance sheet is considered to approximate fair value because they are short-term in nature, bear interest rates that approximate market rates, and generally have negligible credit risk. These items include cash and due from banks, interest bearing deposits with banks, customer acceptance assets and liabilities, federal funds sold and purchased, securities purchased and sold under resale and repurchase agreements, deposits with no stated maturity (e.g., demand, savings and certain money market deposits), short-term borrowings and dividends payable.
The following table summarizes the carrying value and estimated fair value of our financial instruments, excluding financial instruments that are carried at fair value on a recurring basis, at March 31, 2021 and December 31, 2020, and their classification within the fair value hierarchy:
March 31, 2021Carrying
ValueFair
Value Level 1 Level 2 Level 3 (in millions)Financial assets:
Short-term financial assets, net of allowance for credit losses ........ $ 55,066 $ 55,066 $ 1,447 $ 53,607 $ 12 Federal funds sold and securities purchased under agreements to
resell.............................................................................................. 3,760 3,760 — 3,760 — Securities held-to-maturity, net of allowance for credit losses ....... 7,837 8,166 — 8,166 — Commercial loans, net of allowance for credit losses...................... 40,482 41,303 — — 41,303 Commercial loans held for sale........................................................ 173 173 — 173 — Consumer loans, net of allowance for credit losses......................... 20,161 19,508 — — 19,508 Residential mortgage loans held for sale.......................................... 95 96 — 96 —
Financial liabilities:Short-term financial liabilities.......................................................... $ 5,256 $ 5,256 $ — $ 5,243 $ 13 Deposits............................................................................................ 144,817 144,821 — 144,821 — Long-term debt................................................................................. 8,309 8,735 — 8,735 —
December 31, 2020Carrying
ValueFair
Value Level 1 Level 2 Level 3 (in millions)Financial assets:
Short-term financial assets, net of allowance for credit losses......... $ 15,667 $ 15,667 $ 1,302 $ 14,353 $ 12 Federal funds sold and securities purchased under agreements to
resell.............................................................................................. 35,746 35,746 — 35,746 — Securities held-to-maturity, net of allowance for credit losses........ 8,981 9,369 — 9,369 — Commercial loans, net of allowance for credit losses...................... 40,785 41,417 — — 41,417 Commercial loans held for sale........................................................ 93 93 — 93 — Consumer loans, net of allowance for credit losses......................... 20,256 19,865 — — 19,865 Residential mortgage loans held for sale.......................................... 208 217 — 217 —
Financial liabilities:Short-term financial liabilities.......................................................... $ 4,965 $ 4,965 $ — $ 4,952 $ 13 Deposits............................................................................................ 140,995 141,001 — 141,001 — Long-term debt................................................................................. 9,254 9,720 — 9,720 —
Lending-related commitments - The fair value of loan commitments, revolving credit facilities and standby letters of credit are not included in the above table. The majority of the lending-related commitments are not carried at fair value on a recurring basis nor are they actively traded. These instruments generate fees, which approximate those currently charged to originate similar commitments, which are recognized over the term of the commitment period. Deferred fees on loan commitments, revolving credit facilities and standby letters of credit totaled $139 million and $137 million at March 31, 2021 and December 31, 2020, respectively.
HSBC USA Inc.
70
20. Litigation and Regulatory Matters
The following supplements, and should be read together with, the disclosure in Note 29, "Litigation and Regulatory Matters," in our 2020 Form 10-K. Only those matters with significant updates and new matters since our disclosure in our 2020 Form 10-K are reported herein.
In addition to the matters described below and in our 2020 Form 10-K, in the ordinary course of business, we are routinely named as defendants in, or as parties to, various legal actions and proceedings relating to activities of our current and/or former operations. These legal actions and proceedings may include claims for substantial or indeterminate compensatory or punitive damages, or for injunctive relief. In the ordinary course of business, we also are subject to governmental and regulatory examinations, information-gathering requests, investigations and proceedings (both formal and informal), certain of which may result in adverse judgments, settlements, fines, penalties, injunctions or other relief. In connection with formal and informal inquiries by these regulators, we receive numerous requests, subpoenas and orders seeking documents, testimony and other information in connection with various aspects of our regulated activities.
Due to the inherent unpredictability of legal matters, including litigation, governmental and regulatory matters, particularly where the damages sought are substantial or indeterminate or when the proceedings or investigations are in the early stages, we cannot determine with any degree of certainty the timing or ultimate resolution of such matters or the eventual loss, fines, penalties or business impact, if any, that may result. We establish reserves for litigation, governmental and regulatory matters when those matters present loss contingencies that are both probable and can be reasonably estimated. Once established, reserves are adjusted from time to time, as appropriate, in light of additional information. The actual costs of resolving litigation and regulatory matters, however, may be substantially higher than the amounts reserved for those matters.
For the legal matters disclosed below, including litigation and governmental and regulatory matters, as well as for the legal matters disclosed in Note 29, "Litigation and Regulatory Matters," in our 2020 Form 10-K, as to which a loss in excess of accrued liability is reasonably possible in future periods and for which there is sufficient currently available information on the basis of which management believes it can make a reliable estimate, we believe a reasonable estimate could be as much as $150 million for HUSI. The legal matters underlying this estimate of possible loss will change from time to time and actual results may differ significantly from this current estimate.
In addition, based on the facts currently known for each of the ongoing investigations disclosed in Note 29, "Litigation and Regulatory Matters," in our 2020 Form 10-K, it is not practicable at this time for us to determine the terms on which these ongoing investigations will be resolved or the timing of such resolution. As matters progress, it is possible that any fines and/or penalties could be significant.
Given the substantial or indeterminate amounts sought in certain of these matters, and the inherent unpredictability of such matters, an adverse outcome in certain of these matters could have a material adverse effect on our consolidated financial statements in any particular quarterly or annual period.
Mortgage Securitization Matters In 2013, Deutsche Bank National Trust Company, as trustee of HASCO 2007-NC1, filed a complaint in New York County Supreme Court, State of New York, naming HSBC Bank USA as the sole defendant. The parties finalized the settlement of the matter in March 2021, and the matter is now concluded.
Mortgage Securitization Trust Litigation The court granted in part and denied in part the motion to dismiss in the action brought by IKB Bank AG in New York State court. A trial has been scheduled for Fall 2022 in the RMBS Recovery Holdings I, LLC case pending in Virginia state court. Anti-Terrorism Act Cases
Mary Zapata, et al. v. HSBC Holdings plc, et al. Following the US Court of Appeals for the Second Circuit's decision affirming the lower court's dismissal of the action, the matter is now concluded.
Dana Bernhardt et al. v. HSBC Holdings plc, et al. In February 2021, plaintiffs filed an appeal of the decision granting the HSBC defendants' motion to dismiss.
Rigoberto Vasquez and Eva Garcia et al v. Hong Kong and Shanghai Banking Corporation Ltd., HSBC Bank USA, N.A., et al. By agreement among the parties, plaintiffs will dismiss the appeal. The matter is now concluded.
21. New Accounting Pronouncements
There have been no accounting pronouncements issued that are expected to have or could have a material impact on our consolidated financial statements.
HSBC USA Inc.
71
Item 2. Management's Discussion and Analysis of Financial Condition and Results of Operations
Forward-Looking Statements
Certain matters discussed throughout this Form 10-Q are forward-looking statements within the meaning of the Private Securities Litigation Reform Act of 1995. In addition, we may make or approve certain statements in future filings with the United States Securities and Exchange Commission ("SEC"), in press releases, or oral or written presentations by representatives of HSBC USA Inc. ("HSBC USA" and, together with its subsidiaries, "HUSI") that are not statements of historical fact and may also constitute forward-looking statements. Words such as "may," "will," "should," "would," "could," "appears," "believe," "intends," "expects," "estimates," "targeted," "plans," "anticipates," "goal," and similar expressions are intended to identify forward-looking statements but should not be considered as the only means through which these statements may be made. All discussions related to strategy, including the matters discussed under the heading "Management's Discussion and Analysis of Financial Condition and Results of Operations - Executive Overview" and discussions of those matters elsewhere in this Form 10-Q are forward-looking statements. These matters or statements will relate to our future structure, operations, strategy, financial condition, economic forecast, results of operations, plans, objectives, performance or business developments and will involve known and unknown risks, uncertainties and other factors that may cause our actual results, performance or achievements to be materially different from that which was expressed or implied by such forward-looking statements.
All forward-looking statements are, by their nature, subject to risks and uncertainties, many of which are beyond our control. Our actual future results may differ materially from those set forth in our forward-looking statements. While there is no assurance that any list of risks and uncertainties or risk factors is complete, below are certain factors which could cause actual results to differ materially from those in the forward-looking statements:
• the impact of the coronavirus ("COVID-19") pandemic and subsequent outbreaks, including the economic downturn and recovery, effect on global trade and changes in customer behavior and corporate strategy;
• our ability to effectively implement and deliver on our business strategies, and the effect implementation of our business strategy may have on our operations and relationships with our customers, regulators, employees and other stakeholders;
• uncertainty concerning the future market and economic conditions in the United States and abroad, including but not limited to, changes in interest rates, energy prices and unemployment levels, a decline in housing prices, the availability of credit and liquidity, changes in consumer confidence and consumer spending and behavior, consumer perception as to the continuing availability of credit and price competition in the market segments we serve and the consequences of unexpected geopolitical events, such as trade disputes;
• compliance with the Chinese National Security Law and the Hong Kong Autonomy Act, which may impact, among other things, individuals or entities with which we are able to conduct business;
• changes in laws and regulatory requirements;• the potential impact of any legal, regulatory or policy changes affecting financial institutions and the global economy
as a result of the new administration;• the ability to deliver on our regulatory priorities;• capital and liquidity requirements under Basel guidance, the Federal Reserve Board's ("FRB") Comprehensive Capital
Analysis and Review ("CCAR") program, and the Dodd-Frank Wall Street Reform and Consumer Protection Act of 2010 ("Dodd-Frank Act" or "Dodd-Frank") stress testing ("DFAST"), including the U.S. FRB requirements for U.S. global systemically important banks ("G-SIBs") and U.S. intermediate holding companies ("IHCs") owned by non-U.S. G-SIBs to issue total loss-absorbing capacity ("TLAC") instruments;
• regulatory requirements in the U.S. and in non-U.S. jurisdictions to facilitate the future orderly resolution of large financial institutions;
• changes in central banks' policies with respect to the provision or removal of liquidity support to financial markets;• the ability of HSBC Holdings plc ("HSBC" and, together with its subsidiaries, "HSBC Group") and HSBC Bank USA,
National Association (together with its subsidiaries, "HSBC Bank USA") to fulfill the requirements imposed by applicable consent orders or guidance from regulators generally;
• the use of us as a conduit for illegal activities without our knowledge by third parties;• the ability to successfully manage our risks;• the possibility of the inadequacy of our data management and policies and processes;• the financial condition of our clients and counterparties and our ability to manage counterparty risk;
HSBC USA Inc.
72
• concentrations of credit and market risk;• increases in our allowance for credit losses and changes in our assessment of our loan portfolios;• the ability to successfully implement changes to our operational practices as needed and/or required from time to time;• damage to our reputation;• the ability to attract or retain key employees, including foreign workers, and customers;• the effects of competition in the markets where we operate including increased competition from non-bank financial
services companies, including securities firms;• the effects of operational risks that are inherent in banking operations, including fraudulent and other criminal
activities, breakdowns in processes or procedures and systems failure or non-availability;• disruption in our operations from the external environment arising from events such as natural disasters, climate
change, outbreaks of contagious disease, acts of war, terrorist attacks, or essential utility outages;• a failure in or a breach of our operation or security systems or infrastructure, or those of third party servicers or
vendors, including as a result of cyberattacks;• the ability of third party suppliers, outsourcing vendors, off-shored functions and our affiliates to provide adequate
services;• losses suffered due to the negligence, fraud or misconduct of our employees or the negligence, fraud or misconduct on
the part of third parties;• a failure in our internal controls;• our ability to meet our funding requirements;• adverse changes to our credit ratings;• financial difficulties or credit downgrades of mortgage bond insurers;• changes in Financial Accounting Standards Board ("FASB") and International Accounting Standards Board ("IASB")
accounting standards and their interpretation;• heightened regulatory and government enforcement scrutiny of financial institutions, including in connection with
product governance and sales practices, account opening and closing procedures, customer and employee complaints and sales compensation structures related to such practices;
• possible negative impact of regulatory investigations and legal proceedings related to alleged foreign exchange manipulation;
• changes in the methodology for determining benchmark rates and the implementation of alternative benchmark rates, such as the Secured Overnight Financing Rate ("SOFR");
• heightened regulatory and government enforcement scrutiny of financial markets, with a particular focus on traded asset classes, including foreign exchange;
• the possibility of incorrect assumptions or estimates in our financial statements, including reserves related to litigation, deferred tax assets and the fair value of certain assets and liabilities;
• model limitations or failure;• the possibility of incorrect interpretations, application of or changes in tax laws to which we and our clients are
subject;• the potential for additional financial contribution requirements to the HSBC North America Holdings Inc. ("HSBC
North America") pension plan;• unexpected and/or increased expenses relating to, among other things, litigation and regulatory matters, remediation
efforts, penalties and fines; and• the other risk factors and uncertainties described under Item 1A, "Risk Factors," in our Annual Report on Form 10-K
for the year ended December 31, 2020 (the "2020 Form 10-K").
Forward-looking statements are based on our current views and assumptions and speak only as of the date they are made. We undertake no obligation to update any forward-looking statement to reflect subsequent circumstances or events. You should, however, consider any additional disclosures of a forward-looking nature that arise after the date hereof as may be discussed in any of our subsequent Annual Reports on Form 10-K, Quarterly Reports on Form 10-Q or Current Reports on Form 8-K.
HSBC USA Inc.
73
Executive Overview
HSBC USA is a wholly-owned subsidiary of HSBC North America, which is an indirect wholly-owned subsidiary of HSBC. HUSI may also be referred to in Management's Discussion and Analysis of Financial Condition and Results of Operations ("MD&A") as "we," "us" or "our."
Economic Environment The U.S. economy continued its recovery during the first quarter of 2021 after deteriorating rapidly into recession during the second quarter of 2020 driven by the COVID-19 pandemic which resulted in disruption to business and economic activity as well as to the capital markets. COVID-19's effects in the U.S. and globally have been extreme, and the duration of the pandemic and its ultimate repercussions continue to remain unclear. Unprecedented government economic intervention, including additional government support enacted during the first quarter of 2021, has likely dampened the pandemic's effects, but at uncertain long-term cost. However, these government support measures combined with accelerated progress on vaccinations and the easing of restrictions by many states, have helped speed the economic recovery along considerably. U.S. Gross Domestic Product ("GDP") is currently forecast to grow at an annual rate in excess of 6.0 percent in the first quarter of 2021 while the U.S. economy added over 400 thousand jobs during the first quarter of 2021 and the total unemployment rate fell to 6.0 percent at March 2021 as compared with 6.7 percent at December 2020. In March 2021, the FRB decided to hold short-term interest rates steady (at near zero) and indicated it expects short-term rates to remain low for some time. The FRB also announced that it will continue to increase its holdings of U.S. Treasury and U.S. Government agency mortgage-backed securities, thereby supporting the flow of credit to households and businesses.
Although the U.S. economy improved in the first quarter of 2021, the impact of the COVID-19 pandemic on economic conditions both in the United States and abroad continues to create global uncertainty about the future economic environment, including the pace and extent of an economic recovery. Concerns over interest rate levels, energy prices, domestic and global policy issues, including civil unrest in the U.S., trade policy in the U.S. and geopolitical events as well as the implications of those events on the markets in general further add to this global uncertainty. Interest rate levels and energy prices, in combination with global economic conditions, fiscal and monetary policy and the level of regulatory and government scrutiny of financial institutions will continue to impact our results in 2021 and beyond.
Performance, Developments and Trends As mentioned above, the COVID-19 pandemic has disrupted global financial markets, negatively affected supply and demand across a broad range of industries and caused disruption to our customers, vendors and employees. This pandemic has had a significant impact on our business, financial condition and results of operations. Despite the improvement in economic conditions during the first quarter of 2021 as discussed above, the circumstances around this pandemic will continue to impact our business in future periods. The extent of such impact will depend on the outcome of certain developments, including but not limited to, the duration of the pandemic as well as its continuing impact on our customers, vendors and employees, all of which are uncertain. See Part II, Item 1A, "Risk Factors - Risks related to the impact of COVID-19," in our 2020 Form 10-K for further discussion.
We continue to progress our strategic plan to restructure our operations ("Restructuring Plan") as discussed further in Note 2, "Strategic Initiatives," in the accompanying consolidated financial statements. We remain committed to our multi-year strategic plan to re-profile our business, and continue to explore strategic options with respect to our retail operations to focus on our high net worth client base and wealth management products.
HSBC USA Inc.
74
The following table sets forth selected financial highlights of HUSI on a U.S. GAAP basis for the three months ended March 31, 2021 and 2020 and at March 31, 2021 and December 31, 2020:
Three Months Ended March 31, 2021 2020 (dollars are in millions)
Net income (loss)................................................................................................................................ $ 339 $ (1,283) Rate of return on average:
Total assets....................................................................................................................................... .7 % (2.7) %Risk-weighted assets(1)..................................................................................................................... 1.3 (4.0) Common equity................................................................................................................................ 8.1 (29.9) Tangible common equity.................................................................................................................. 8.4 (32.2) Total equity....................................................................................................................................... 7.6 (27.9)
Net interest margin.............................................................................................................................. 1.17 1.15 Efficiency ratio.................................................................................................................................... 74.5 180.1 Commercial net charge-off ratio(2)...................................................................................................... .01 .23 Consumer net charge-off ratio(2)......................................................................................................... .32 .37
(1) Prior period amount has been revised to conform to the current period presentation. See Note 16, "Retained Earnings and Regulatory Capital Requirements," in the accompanying consolidated financial statements for further discussion.
(2) Excludes loans held for sale.
March 31, 2021
December 31, 2020
(dollars are in millions)Additional Select Ratios:
Allowance as a percent of loans(1)...................................................................................................... 1.39 % 1.63 %Commercial allowance as a percent of loans(1)................................................................................... 1.63 1.96 Consumer allowance as a percent of loans(1)...................................................................................... .90 .98 Consumer two-months-and-over contractual delinquency................................................................. 2.31 2.27 Loans to deposits ratio(2)..................................................................................................................... 46.50 48.90 Common equity Tier 1 capital to risk-weighted assets(3).................................................................... 15.1 14.5 Tier 1 capital to risk-weighted assets(3).............................................................................................. 16.2 15.6 Total capital to risk-weighted assets(3)................................................................................................ 18.7 18.8 Tier 1 leverage ratio............................................................................................................................ 8.8 8.6 Supplementary leverage ratio............................................................................................................. 8.3 7.8 Total equity to total assets.................................................................................................................. 9.2 9.3
Select Balance Sheet Data:Cash and interest bearing deposits with banks................................................................................... $ 55,054 $ 15,655 Trading assets..................................................................................................................................... 25,822 27,284 Securities available-for-sale............................................................................................................... 34,659 40,672 Loans: Commercial loans............................................................................................................................ 41,152 41,599 Consumer loans............................................................................................................................... 20,374 20,489 Total loans.......................................................................................................................................... 61,526 62,088 Deposits.............................................................................................................................................. 148,582 145,150
(1) Excludes loans held for sale.(2) Represents period end loans, net of allowance for loan losses, as a percentage of core deposits as calculated in accordance with Federal Financial
Institutions Examination Council guidelines which generally include all domestic demand, money market and other savings accounts, as well as time deposits with balances not exceeding $250,000.
HSBC USA Inc.
75
(3) Prior period amounts have been revised to conform to the current period presentation. See Note 16, "Retained Earnings and Regulatory Capital Requirements," in the accompanying consolidated financial statements for further discussion.
Net income (loss) was income of $339 million during the three months ended March 31, 2021 compared with a loss of $1,283 million during the three months ended March 31, 2020. Income (loss) before income tax was income of $460 million during the three months ended March 31, 2021 compared with a loss of $1,440 million during the three months ended March 31, 2020. The increase in income (loss) before income tax during the three months ended March 31, 2021 was due primarily to a lower provision for credit losses driven by improved economic conditions and lower operating expenses driven by the non-recurrence of a $784 million goodwill impairment charge recorded during the first quarter of 2020 and lower occupancy expense. Also contributing to the increase was higher net interest income.
Our reported results in all periods were impacted by certain items management believes to be significant, which affect comparability between periods. Significant items are excluded to arrive at adjusted performance because management would ordinarily identify and consider them separately to better understand underlying business trends. The following table summarizes the impact of these significant items for all periods presented:Three Months Ended March 31, 2021 2020 (in millions)Income (loss) before income tax, as reported.............................................................................................. $ 460 $ (1,440) Goodwill impairment................................................................................................................................... — 784 Costs to achieve(1)........................................................................................................................................ 25 100 Adjusted performance(2).............................................................................................................................. $ 485 $ (556)
(1) Reflects costs related to the delivery of our Restructuring Plan. Costs to achieve primarily consists of lease impairment and other related costs, severance costs, allocated costs from HSBC Technology & Services ("HTSU"), and trading losses associated with the exit of certain derivative contracts. See Note 2, "Strategic Initiatives," in the accompanying consolidated financial statements for a more detailed discussion of these costs. The expense during the three months ended March 31, 2021 also includes $7 million of allocated costs from other HSBC affiliates related to the HSBC Group's restructuring activities. The expense during the three months ended March 31, 2020 also includes a $9 million gain on the sale of one of our owned retail branch properties.
(2) Represents a non-U.S. GAAP financial measure.
Excluding the impact of the items in the table above, our adjusted performance during the three months ended March 31, 2021 increased $1,041 million compared with the prior year period due primarily to a lower provision for credit losses driven by improved economic conditions. Also contributing to the increase was lower operating expenses and higher net interest income.
See "Results of Operations" for a more detailed discussion of our operating trends. In addition, see "Balance Sheet Review" for further discussion on our asset and liability trends, "Liquidity and Capital Resources" for further discussion on funding and capital and "Credit Quality" for additional discussion on our credit trends.
London Interbank Offered Rate ("LIBOR") Transition Regulators and central banks in various national jurisdictions continue to actively work to help transition from interbank offered rates ("IBORs") to acceptable alternative rates, such as the Secured Overnight Financing Rate ("SOFR") recommended by the Alternative Reference Rates Committee convened by the FRB. We have a considerable number of contracts referencing IBORs, primarily U.S. dollar ("USD") LIBOR, such as loans, derivatives and long-term debt.
In March 2021, the United Kingdom ("U.K.") Financial Conduct Authority ("FCA") confirmed that all LIBOR tenors will either cease to be provided by any administrator or no longer be representative immediately after December 31, 2021, in the case of the one-week and two-month USD LIBOR tenors, and immediately after June 30, 2023, in the case of the remaining overnight, one-month, three-month, six-month and twelve-month USD LIBOR tenors. The extension of certain USD LIBOR tenors until June 2023 will allow many legacy LIBOR-based contracts to mature naturally and significantly aids in reducing the risks associated with transitioning legacy contracts onto replacement rates. Separately, the International Swaps and Derivatives Association ("ISDA") has confirmed that the fallback spread adjustments to be used in its ISDA fallbacks have been fixed as of the date of the FCA announcement. As a result, the ISDA fallbacks (i.e. to the adjusted risk-free rate plus the fixed spread adjustment) will automatically occur for outstanding derivative contracts that incorporate the ISDA fallback language or adhere to the ISDA fallback protocol generally when each LIBOR tenor ceases or becomes non-representative. For all outstanding derivatives referenced to USD LIBOR tenors, the ISDA fallback will occur immediately after June 30, 2023. These announcements provide clarity on the future terms of the many derivative contracts which now incorporate the ISDA fallbacks. In addition, during the first quarter of 2021, central clearing counterparties amended their rules to incorporate the new ISDA fallback language and adhere to the ISDA fallback protocol for cleared derivative contracts.
HSBC USA Inc.
76
We continue to actively participate in HSBC's global transition program with the objective of facilitating an orderly transition of all products, processes, models and curves, as well as all legacy LIBOR-based contracts, onto replacement rates. In particular, during the first quarter of 2021, we:
• implemented the capabilities to offer SOFR-based derivatives in our Markets Treasury function and SOFR-based bilateral loans in our Commercial Banking business; and
• continued to reduce our LIBOR derivative exposures through the exit or transfer of certain derivative contracts as part of our Restructuring Plan.
The ability of HUSI and its clients to transition legacy contracts onto replacement rates is dependent on the availability and market liquidity of products that reference replacement rates, including SOFR, and on our clients being ready and able to adapt their own processes and systems to accommodate the replacement products. We continue to engage with industry participants, the official sector and our clients to support an orderly transition and the mitigation of the risks resulting from the transition. For further discussion of our LIBOR transition program and the associated risks, see "Executive Overview" in MD&A in our 2020 Form 10-K.
Other COVID-19 Related Developments
The COVID-19 pandemic has significantly disrupted economic activity in many countries, including the United States, and the U.S. Government has taken multiple actions to mitigate the magnitude and persistence of the effects of the COVID-19 pandemic. The United States has been operating under a presidentially declared national emergency since March 2020. In March 2020, the Coronavirus Aid, Relief and Economic Security Act ("CARES Act") was signed into law, which provided financial assistance for businesses and individuals and targeted regulatory relief for financial institutions. In December 2020, the Consolidated Appropriations Act was signed into law, which extended many of the CARES Act programs and provided additional financial assistance for businesses and individuals.
Loan Forbearance Initiatives The CARES Act created a forbearance program for federally-backed mortgage loans and provided financial institutions with the option to temporarily suspend certain requirements under U.S. GAAP related to troubled debt restructurings ("TDR Loans") beginning March 1, 2020. This TDR Loan guidance can be applied until the earlier of January 1, 2022 or 60 days following the termination of the presidentially declared national emergency. We elected to adopt the TDR Loan guidance in the CARES Act and are not applying TDR Loan classification to COVID-19 related loan modifications in the form of a long-term payment deferral (for commercial loans all payment modifications, including all payment deferrals) granted to borrowers that were current (less than 30 days past due) as of December 31, 2019 which otherwise may have been reported as TDR Loans. The CARES Act also prohibits servicers of federally-backed mortgage loans from initiating any foreclosure action on any residential property that is not vacant or abandoned for a period of 60 days. This moratorium has been extended until June 30, 2021. In addition to these federal measures, some state governments have taken action to require forbearance with respect to certain loans and fees. We are continuing to monitor federal, state and international regulatory developments in relation to COVID-19 and their potential impact on our operations.
In 2020, federal banking regulators issued a revised interagency statement on loan modifications and the reporting for financial institutions working with customers affected by the COVID-19 pandemic ("Interagency Statement"). The Interagency Statement confirmed that COVID-19 related short-term loan modifications (e.g., payment deferrals of six months or less) provided to borrowers that were current (less than 30 days past due) at the time the relief was granted are not TDR Loans. Borrowers that do not meet the criteria in the CARES Act or the Interagency Statement are assessed for TDR Loan classification in accordance with our accounting policies. Through March 31, 2021, these loans were not significant.
In addition, under the Interagency Statement, for COVID-19 related loan modifications in the form of a payment deferral, the borrower’s past due status will not be affected during the deferral period and, if the loan was accruing at the time the relief was granted, the loan will generally not be placed on nonaccrual status as long as the borrower utilizes a payment deferral of six months or less. For consumer mortgage loans, when a borrower utilizes a payment deferral of more than six months, the loan will generally be placed on nonaccrual status and, if the loan does not meet the criteria in the CARES Act, assessed for TDR Loan classification. Any accrued interest recorded on these loans is generally not reversed against income and will remain recorded as accrued interest receivable. We have not modified our commercial loan nonaccrual policies as a result of this guidance.
HSBC USA Inc.
77
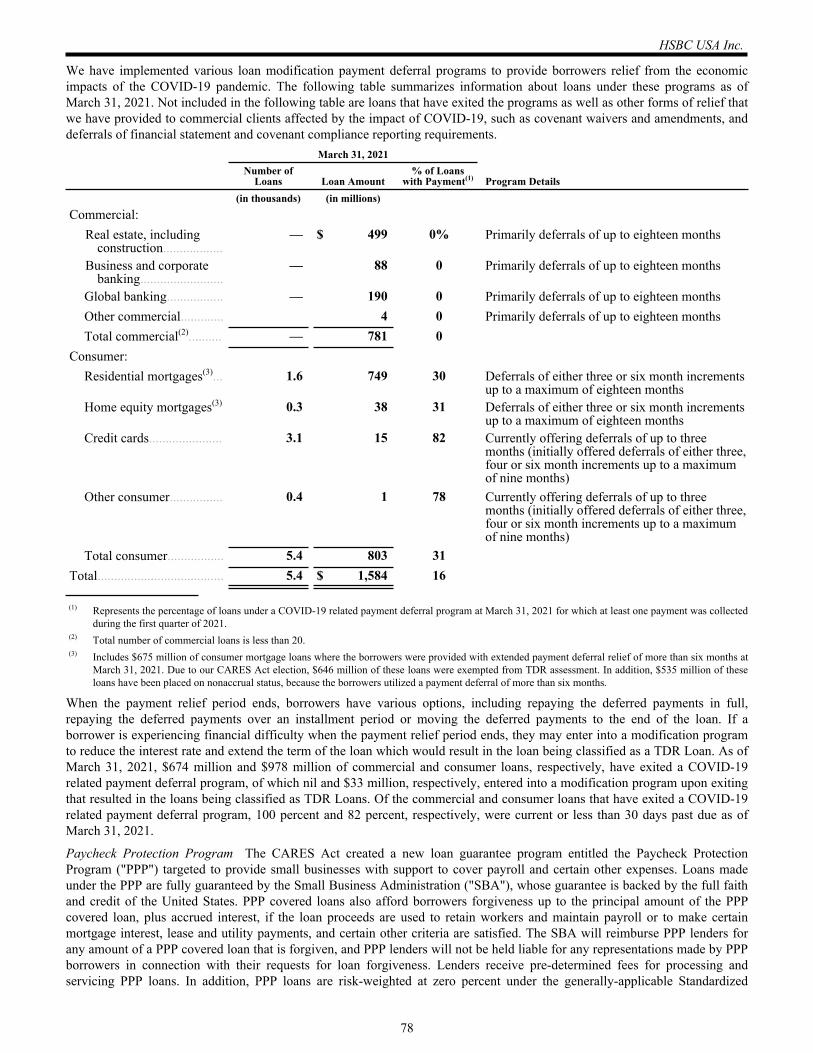
We have implemented various loan modification payment deferral programs to provide borrowers relief from the economic impacts of the COVID-19 pandemic. The following table summarizes information about loans under these programs as of March 31, 2021. Not included in the following table are loans that have exited the programs as well as other forms of relief that we have provided to commercial clients affected by the impact of COVID-19, such as covenant waivers and amendments, and deferrals of financial statement and covenant compliance reporting requirements.
March 31, 2021Number of
Loans Loan Amount% of Loans
with Payment(1) Program Details(in thousands) (in millions)
Commercial:Real estate, including
construction.................. — $ 499 0% Primarily deferrals of up to eighteen months
Business and corporate banking.........................
— 88 0 Primarily deferrals of up to eighteen months
Global banking................. — 190 0 Primarily deferrals of up to eighteen monthsOther commercial............. 4 0 Primarily deferrals of up to eighteen monthsTotal commercial(2).......... — 781 0
Consumer:Residential mortgages(3)... 1.6 749 30 Deferrals of either three or six month increments
up to a maximum of eighteen monthsHome equity mortgages(3) 0.3 38 31 Deferrals of either three or six month increments
up to a maximum of eighteen monthsCredit cards...................... 3.1 15 82 Currently offering deferrals of up to three
months (initially offered deferrals of either three, four or six month increments up to a maximum of nine months)
Other consumer................ 0.4 1 78 Currently offering deferrals of up to three months (initially offered deferrals of either three, four or six month increments up to a maximum of nine months)
Total consumer................. 5.4 803 31Total...................................... 5.4 $ 1,584 16
(1) Represents the percentage of loans under a COVID-19 related payment deferral program at March 31, 2021 for which at least one payment was collected during the first quarter of 2021.
(2) Total number of commercial loans is less than 20.(3) Includes $675 million of consumer mortgage loans where the borrowers were provided with extended payment deferral relief of more than six months at
March 31, 2021. Due to our CARES Act election, $646 million of these loans were exempted from TDR assessment. In addition, $535 million of these loans have been placed on nonaccrual status, because the borrowers utilized a payment deferral of more than six months.
When the payment relief period ends, borrowers have various options, including repaying the deferred payments in full, repaying the deferred payments over an installment period or moving the deferred payments to the end of the loan. If a borrower is experiencing financial difficulty when the payment relief period ends, they may enter into a modification program to reduce the interest rate and extend the term of the loan which would result in the loan being classified as a TDR Loan. As of March 31, 2021, $674 million and $978 million of commercial and consumer loans, respectively, have exited a COVID-19 related payment deferral program, of which nil and $33 million, respectively, entered into a modification program upon exiting that resulted in the loans being classified as TDR Loans. Of the commercial and consumer loans that have exited a COVID-19 related payment deferral program, 100 percent and 82 percent, respectively, were current or less than 30 days past due as of March 31, 2021.
Paycheck Protection Program The CARES Act created a new loan guarantee program entitled the Paycheck Protection Program ("PPP") targeted to provide small businesses with support to cover payroll and certain other expenses. Loans made under the PPP are fully guaranteed by the Small Business Administration ("SBA"), whose guarantee is backed by the full faith and credit of the United States. PPP covered loans also afford borrowers forgiveness up to the principal amount of the PPP covered loan, plus accrued interest, if the loan proceeds are used to retain workers and maintain payroll or to make certain mortgage interest, lease and utility payments, and certain other criteria are satisfied. The SBA will reimburse PPP lenders for any amount of a PPP covered loan that is forgiven, and PPP lenders will not be held liable for any representations made by PPP borrowers in connection with their requests for loan forgiveness. Lenders receive pre-determined fees for processing and servicing PPP loans. In addition, PPP loans are risk-weighted at zero percent under the generally-applicable Standardized
HSBC USA Inc.
78
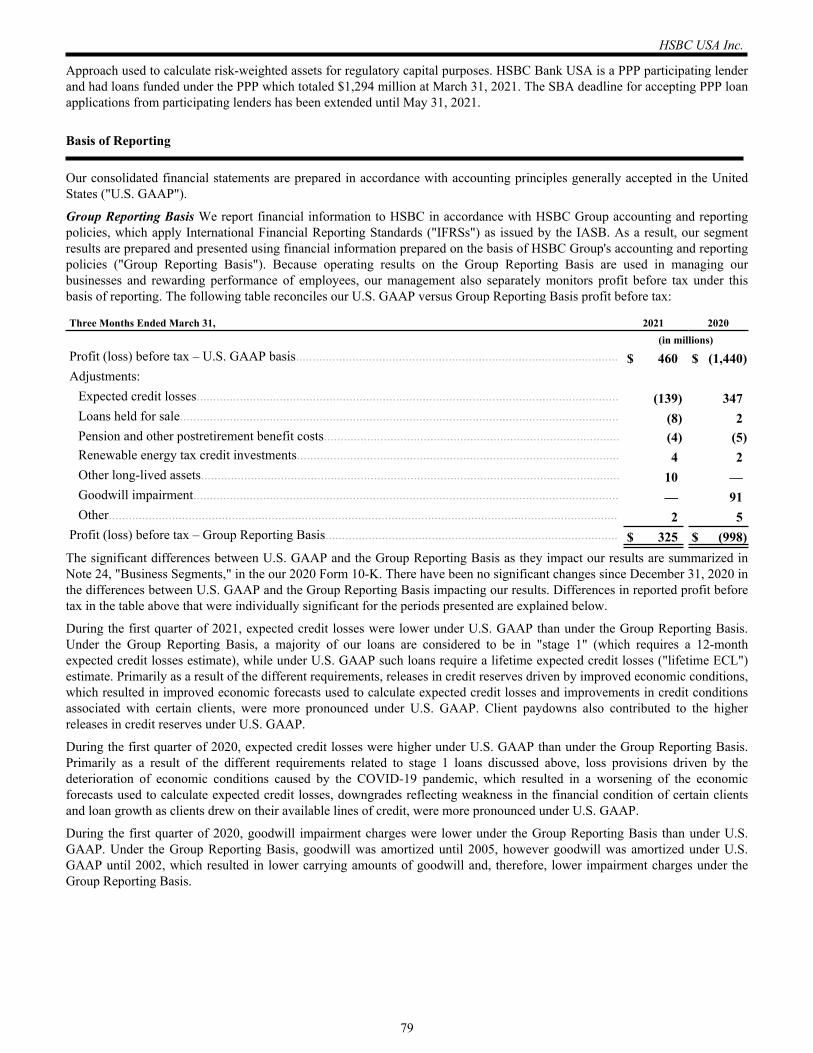
Approach used to calculate risk-weighted assets for regulatory capital purposes. HSBC Bank USA is a PPP participating lender and had loans funded under the PPP which totaled $1,294 million at March 31, 2021. The SBA deadline for accepting PPP loan applications from participating lenders has been extended until May 31, 2021.
Basis of Reporting
Our consolidated financial statements are prepared in accordance with accounting principles generally accepted in the United States ("U.S. GAAP").
Group Reporting Basis We report financial information to HSBC in accordance with HSBC Group accounting and reporting policies, which apply International Financial Reporting Standards ("IFRSs") as issued by the IASB. As a result, our segment results are prepared and presented using financial information prepared on the basis of HSBC Group's accounting and reporting policies ("Group Reporting Basis"). Because operating results on the Group Reporting Basis are used in managing our businesses and rewarding performance of employees, our management also separately monitors profit before tax under this basis of reporting. The following table reconciles our U.S. GAAP versus Group Reporting Basis profit before tax:
Three Months Ended March 31, 2021 2020 (in millions)Profit (loss) before tax – U.S. GAAP basis................................................................................................. $ 460 $ (1,440) Adjustments:
Expected credit losses............................................................................................................................... (139) 347 Loans held for sale.................................................................................................................................... (8) 2 Pension and other postretirement benefit costs......................................................................................... (4) (5) Renewable energy tax credit investments................................................................................................. 4 2 Other long-lived assets.............................................................................................................................. 10 — Goodwill impairment................................................................................................................................ — 91 Other......................................................................................................................................................... 2 5
Profit (loss) before tax – Group Reporting Basis........................................................................................ $ 325 $ (998) The significant differences between U.S. GAAP and the Group Reporting Basis as they impact our results are summarized in Note 24, "Business Segments," in the our 2020 Form 10-K. There have been no significant changes since December 31, 2020 in the differences between U.S. GAAP and the Group Reporting Basis impacting our results. Differences in reported profit before tax in the table above that were individually significant for the periods presented are explained below.
During the first quarter of 2021, expected credit losses were lower under U.S. GAAP than under the Group Reporting Basis. Under the Group Reporting Basis, a majority of our loans are considered to be in "stage 1" (which requires a 12-month expected credit losses estimate), while under U.S. GAAP such loans require a lifetime expected credit losses ("lifetime ECL") estimate. Primarily as a result of the different requirements, releases in credit reserves driven by improved economic conditions, which resulted in improved economic forecasts used to calculate expected credit losses and improvements in credit conditions associated with certain clients, were more pronounced under U.S. GAAP. Client paydowns also contributed to the higher releases in credit reserves under U.S. GAAP.
During the first quarter of 2020, expected credit losses were higher under U.S. GAAP than under the Group Reporting Basis. Primarily as a result of the different requirements related to stage 1 loans discussed above, loss provisions driven by the deterioration of economic conditions caused by the COVID-19 pandemic, which resulted in a worsening of the economic forecasts used to calculate expected credit losses, downgrades reflecting weakness in the financial condition of certain clients and loan growth as clients drew on their available lines of credit, were more pronounced under U.S. GAAP.
During the first quarter of 2020, goodwill impairment charges were lower under the Group Reporting Basis than under U.S. GAAP. Under the Group Reporting Basis, goodwill was amortized until 2005, however goodwill was amortized under U.S. GAAP until 2002, which resulted in lower carrying amounts of goodwill and, therefore, lower impairment charges under the Group Reporting Basis.
HSBC USA Inc.
79
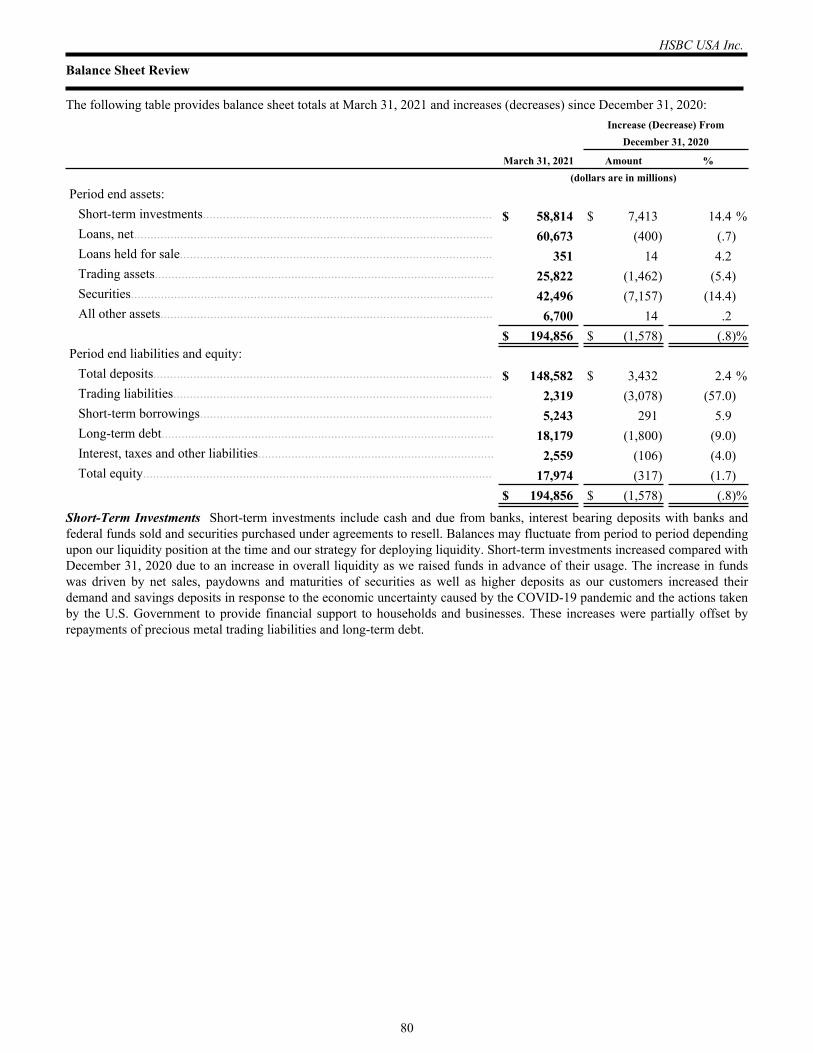
Balance Sheet Review
The following table provides balance sheet totals at March 31, 2021 and increases (decreases) since December 31, 2020: Increase (Decrease) From December 31, 2020
March 31, 2021 Amount % (dollars are in millions)Period end assets:
Short-term investments....................................................................................... $ 58,814 $ 7,413 14.4 %Loans, net............................................................................................................ 60,673 (400) (.7) Loans held for sale.............................................................................................. 351 14 4.2 Trading assets...................................................................................................... 25,822 (1,462) (5.4) Securities............................................................................................................. 42,496 (7,157) (14.4) All other assets.................................................................................................... 6,700 14 .2
$ 194,856 $ (1,578) (.8) %Period end liabilities and equity:
Total deposits...................................................................................................... $ 148,582 $ 3,432 2.4 %Trading liabilities................................................................................................ 2,319 (3,078) (57.0) Short-term borrowings........................................................................................ 5,243 291 5.9 Long-term debt.................................................................................................... 18,179 (1,800) (9.0) Interest, taxes and other liabilities....................................................................... 2,559 (106) (4.0) Total equity......................................................................................................... 17,974 (317) (1.7)
$ 194,856 $ (1,578) (.8) %
Short-Term Investments Short-term investments include cash and due from banks, interest bearing deposits with banks and federal funds sold and securities purchased under agreements to resell. Balances may fluctuate from period to period depending upon our liquidity position at the time and our strategy for deploying liquidity. Short-term investments increased compared with December 31, 2020 due to an increase in overall liquidity as we raised funds in advance of their usage. The increase in funds was driven by net sales, paydowns and maturities of securities as well as higher deposits as our customers increased their demand and savings deposits in response to the economic uncertainty caused by the COVID-19 pandemic and the actions taken by the U.S. Government to provide financial support to households and businesses. These increases were partially offset by repayments of precious metal trading liabilities and long-term debt.
HSBC USA Inc.
80
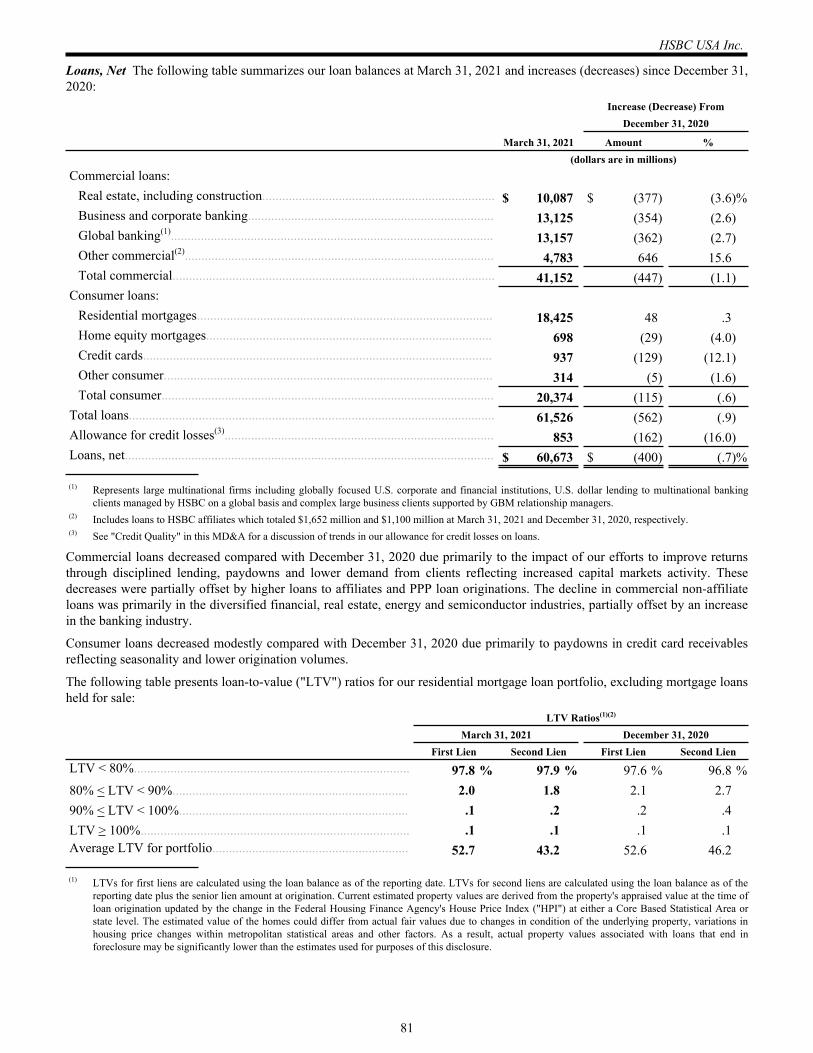
Loans, Net The following table summarizes our loan balances at March 31, 2021 and increases (decreases) since December 31, 2020: Increase (Decrease) From December 31, 2020
March 31, 2021 Amount % (dollars are in millions)Commercial loans:
Real estate, including construction...................................................................... $ 10,087 $ (377) (3.6) %Business and corporate banking.......................................................................... 13,125 (354) (2.6) Global banking(1)................................................................................................. 13,157 (362) (2.7) Other commercial(2)............................................................................................. 4,783 646 15.6 Total commercial................................................................................................. 41,152 (447) (1.1)
Consumer loans:Residential mortgages......................................................................................... 18,425 48 .3 Home equity mortgages...................................................................................... 698 (29) (4.0) Credit cards......................................................................................................... 937 (129) (12.1) Other consumer................................................................................................... 314 (5) (1.6) Total consumer.................................................................................................... 20,374 (115) (.6)
Total loans.............................................................................................................. 61,526 (562) (.9) Allowance for credit losses(3)................................................................................. 853 (162) (16.0) Loans, net............................................................................................................... $ 60,673 $ (400) (.7) %
(1) Represents large multinational firms including globally focused U.S. corporate and financial institutions, U.S. dollar lending to multinational banking clients managed by HSBC on a global basis and complex large business clients supported by GBM relationship managers.
(2) Includes loans to HSBC affiliates which totaled $1,652 million and $1,100 million at March 31, 2021 and December 31, 2020, respectively.(3) See "Credit Quality" in this MD&A for a discussion of trends in our allowance for credit losses on loans.
Commercial loans decreased compared with December 31, 2020 due primarily to the impact of our efforts to improve returns through disciplined lending, paydowns and lower demand from clients reflecting increased capital markets activity. These decreases were partially offset by higher loans to affiliates and PPP loan originations. The decline in commercial non-affiliate loans was primarily in the diversified financial, real estate, energy and semiconductor industries, partially offset by an increase in the banking industry.
Consumer loans decreased modestly compared with December 31, 2020 due primarily to paydowns in credit card receivables reflecting seasonality and lower origination volumes.
The following table presents loan-to-value ("LTV") ratios for our residential mortgage loan portfolio, excluding mortgage loans held for sale:
LTV Ratios(1)(2)
March 31, 2021 December 31, 2020 First Lien Second Lien First Lien Second LienLTV < 80%................................................................................... 97.8 % 97.9 % 97.6 % 96.8 %80% < LTV < 90%....................................................................... 2.0 1.8 2.1 2.7 90% < LTV < 100%..................................................................... .1 .2 .2 .4 LTV > 100%................................................................................. .1 .1 .1 .1 Average LTV for portfolio........................................................... 52.7 43.2 52.6 46.2
(1) LTVs for first liens are calculated using the loan balance as of the reporting date. LTVs for second liens are calculated using the loan balance as of the reporting date plus the senior lien amount at origination. Current estimated property values are derived from the property's appraised value at the time of loan origination updated by the change in the Federal Housing Finance Agency's House Price Index ("HPI") at either a Core Based Statistical Area or state level. The estimated value of the homes could differ from actual fair values due to changes in condition of the underlying property, variations in housing price changes within metropolitan statistical areas and other factors. As a result, actual property values associated with loans that end in foreclosure may be significantly lower than the estimates used for purposes of this disclosure.
HSBC USA Inc.
81
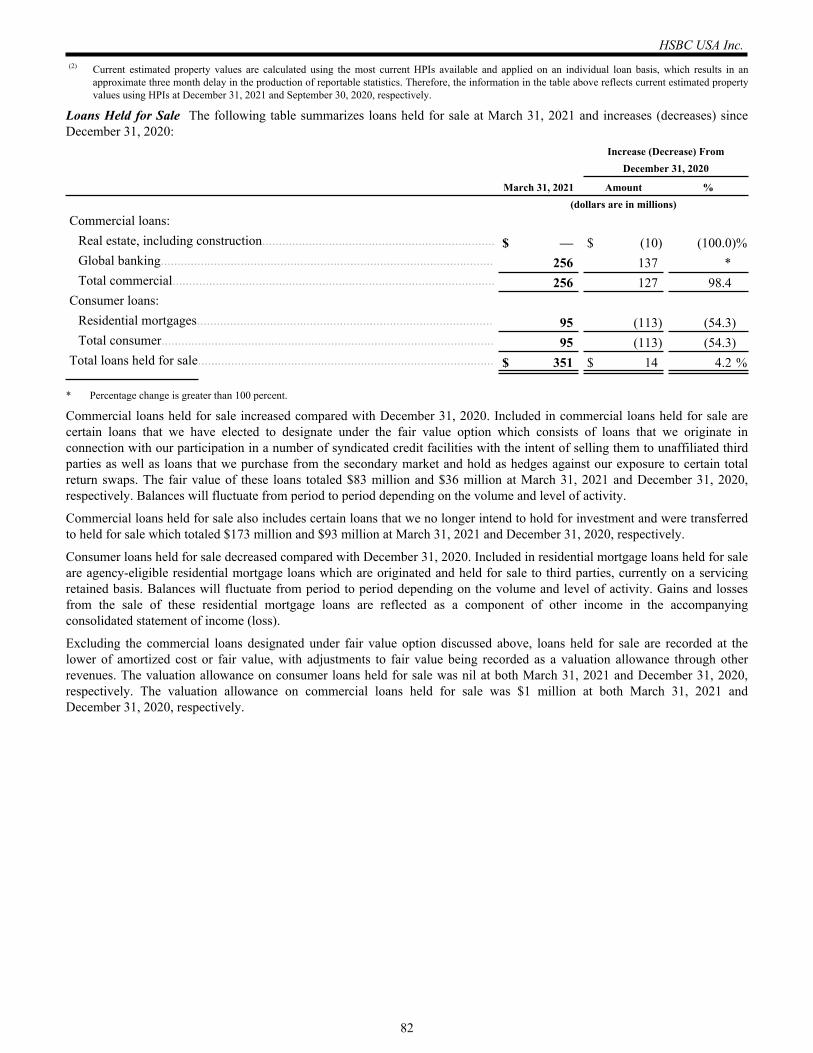
(2) Current estimated property values are calculated using the most current HPIs available and applied on an individual loan basis, which results in an approximate three month delay in the production of reportable statistics. Therefore, the information in the table above reflects current estimated property values using HPIs at December 31, 2021 and September 30, 2020, respectively.
Loans Held for Sale The following table summarizes loans held for sale at March 31, 2021 and increases (decreases) since December 31, 2020:
Increase (Decrease) From December 31, 2020
March 31, 2021 Amount % (dollars are in millions)Commercial loans:
Real estate, including construction...................................................................... $ — $ (10) (100.0) %Global banking.................................................................................................... 256 137 *Total commercial................................................................................................. 256 127 98.4
Consumer loans:Residential mortgages......................................................................................... 95 (113) (54.3) Total consumer.................................................................................................... 95 (113) (54.3)
Total loans held for sale......................................................................................... $ 351 $ 14 4.2 %
* Percentage change is greater than 100 percent.
Commercial loans held for sale increased compared with December 31, 2020. Included in commercial loans held for sale are certain loans that we have elected to designate under the fair value option which consists of loans that we originate in connection with our participation in a number of syndicated credit facilities with the intent of selling them to unaffiliated third parties as well as loans that we purchase from the secondary market and hold as hedges against our exposure to certain total return swaps. The fair value of these loans totaled $83 million and $36 million at March 31, 2021 and December 31, 2020, respectively. Balances will fluctuate from period to period depending on the volume and level of activity.
Commercial loans held for sale also includes certain loans that we no longer intend to hold for investment and were transferred to held for sale which totaled $173 million and $93 million at March 31, 2021 and December 31, 2020, respectively.
Consumer loans held for sale decreased compared with December 31, 2020. Included in residential mortgage loans held for sale are agency-eligible residential mortgage loans which are originated and held for sale to third parties, currently on a servicing retained basis. Balances will fluctuate from period to period depending on the volume and level of activity. Gains and losses from the sale of these residential mortgage loans are reflected as a component of other income in the accompanying consolidated statement of income (loss).
Excluding the commercial loans designated under fair value option discussed above, loans held for sale are recorded at the lower of amortized cost or fair value, with adjustments to fair value being recorded as a valuation allowance through other revenues. The valuation allowance on consumer loans held for sale was nil at both March 31, 2021 and December 31, 2020, respectively. The valuation allowance on commercial loans held for sale was $1 million at both March 31, 2021 and December 31, 2020, respectively.
HSBC USA Inc.
82
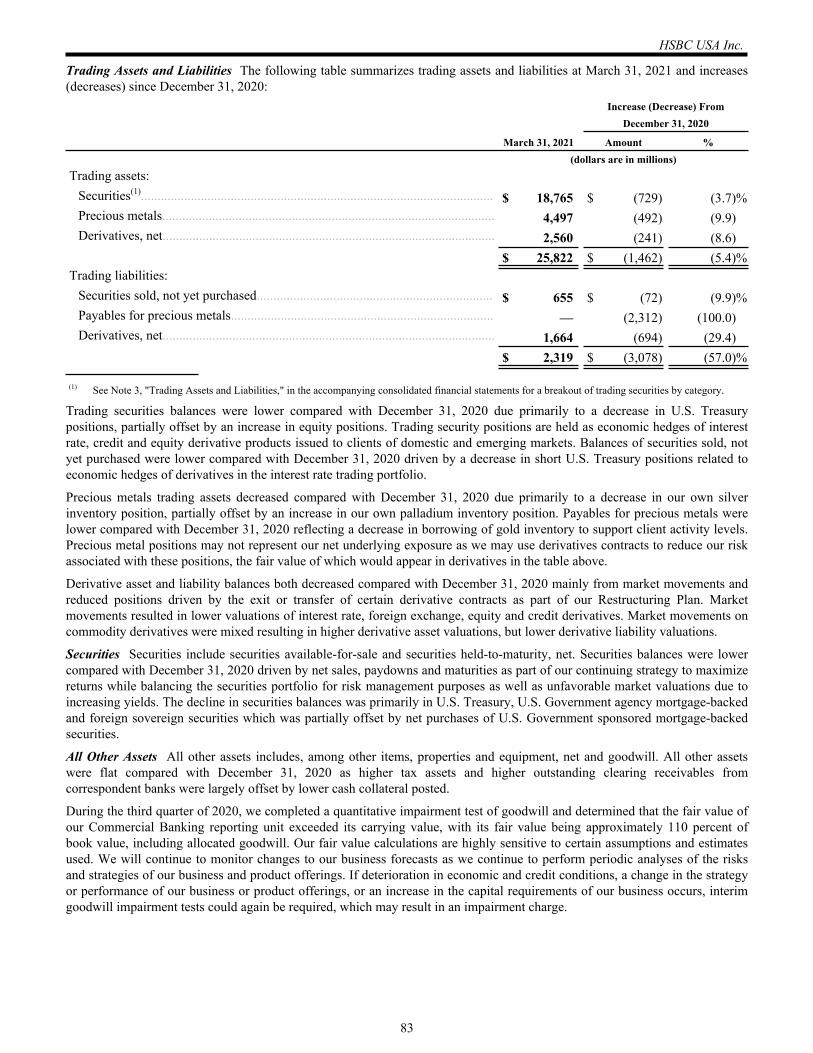
Trading Assets and Liabilities The following table summarizes trading assets and liabilities at March 31, 2021 and increases (decreases) since December 31, 2020: Increase (Decrease) From December 31, 2020
March 31, 2021 Amount % (dollars are in millions)Trading assets:
Securities(1).......................................................................................................... $ 18,765 $ (729) (3.7) %Precious metals.................................................................................................... 4,497 (492) (9.9) Derivatives, net.................................................................................................... 2,560 (241) (8.6)
$ 25,822 $ (1,462) (5.4) %Trading liabilities:
Securities sold, not yet purchased....................................................................... $ 655 $ (72) (9.9) %Payables for precious metals............................................................................... — (2,312) (100.0) Derivatives, net.................................................................................................... 1,664 (694) (29.4)
$ 2,319 $ (3,078) (57.0) %
(1) See Note 3, "Trading Assets and Liabilities," in the accompanying consolidated financial statements for a breakout of trading securities by category.
Trading securities balances were lower compared with December 31, 2020 due primarily to a decrease in U.S. Treasury positions, partially offset by an increase in equity positions. Trading security positions are held as economic hedges of interest rate, credit and equity derivative products issued to clients of domestic and emerging markets. Balances of securities sold, not yet purchased were lower compared with December 31, 2020 driven by a decrease in short U.S. Treasury positions related to economic hedges of derivatives in the interest rate trading portfolio.
Precious metals trading assets decreased compared with December 31, 2020 due primarily to a decrease in our own silver inventory position, partially offset by an increase in our own palladium inventory position. Payables for precious metals were lower compared with December 31, 2020 reflecting a decrease in borrowing of gold inventory to support client activity levels. Precious metal positions may not represent our net underlying exposure as we may use derivatives contracts to reduce our risk associated with these positions, the fair value of which would appear in derivatives in the table above.
Derivative asset and liability balances both decreased compared with December 31, 2020 mainly from market movements and reduced positions driven by the exit or transfer of certain derivative contracts as part of our Restructuring Plan. Market movements resulted in lower valuations of interest rate, foreign exchange, equity and credit derivatives. Market movements on commodity derivatives were mixed resulting in higher derivative asset valuations, but lower derivative liability valuations.
Securities Securities include securities available-for-sale and securities held-to-maturity, net. Securities balances were lower compared with December 31, 2020 driven by net sales, paydowns and maturities as part of our continuing strategy to maximize returns while balancing the securities portfolio for risk management purposes as well as unfavorable market valuations due to increasing yields. The decline in securities balances was primarily in U.S. Treasury, U.S. Government agency mortgage-backed and foreign sovereign securities which was partially offset by net purchases of U.S. Government sponsored mortgage-backed securities.
All Other Assets All other assets includes, among other items, properties and equipment, net and goodwill. All other assets were flat compared with December 31, 2020 as higher tax assets and higher outstanding clearing receivables from correspondent banks were largely offset by lower cash collateral posted.
During the third quarter of 2020, we completed a quantitative impairment test of goodwill and determined that the fair value of our Commercial Banking reporting unit exceeded its carrying value, with its fair value being approximately 110 percent of book value, including allocated goodwill. Our fair value calculations are highly sensitive to certain assumptions and estimates used. We will continue to monitor changes to our business forecasts as we continue to perform periodic analyses of the risks and strategies of our business and product offerings. If deterioration in economic and credit conditions, a change in the strategy or performance of our business or product offerings, or an increase in the capital requirements of our business occurs, interim goodwill impairment tests could again be required, which may result in an impairment charge.
HSBC USA Inc.
83
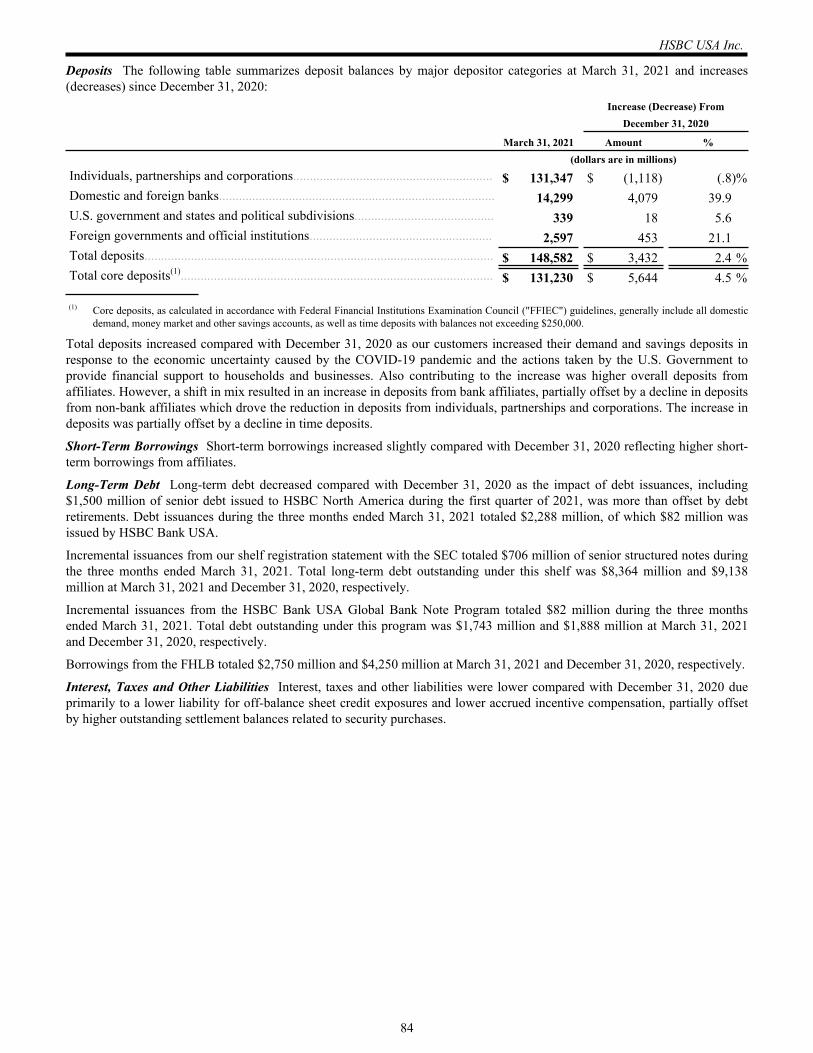
Deposits The following table summarizes deposit balances by major depositor categories at March 31, 2021 and increases (decreases) since December 31, 2020: Increase (Decrease) From December 31, 2020
March 31, 2021 Amount % (dollars are in millions)Individuals, partnerships and corporations............................................................ $ 131,347 $ (1,118) (.8) %Domestic and foreign banks................................................................................... 14,299 4,079 39.9 U.S. government and states and political subdivisions.......................................... 339 18 5.6 Foreign governments and official institutions....................................................... 2,597 453 21.1 Total deposits......................................................................................................... $ 148,582 $ 3,432 2.4 %Total core deposits(1).............................................................................................. $ 131,230 $ 5,644 4.5 %
(1) Core deposits, as calculated in accordance with Federal Financial Institutions Examination Council ("FFIEC") guidelines, generally include all domestic demand, money market and other savings accounts, as well as time deposits with balances not exceeding $250,000.
Total deposits increased compared with December 31, 2020 as our customers increased their demand and savings deposits in response to the economic uncertainty caused by the COVID-19 pandemic and the actions taken by the U.S. Government to provide financial support to households and businesses. Also contributing to the increase was higher overall deposits from affiliates. However, a shift in mix resulted in an increase in deposits from bank affiliates, partially offset by a decline in deposits from non-bank affiliates which drove the reduction in deposits from individuals, partnerships and corporations. The increase in deposits was partially offset by a decline in time deposits.
Short-Term Borrowings Short-term borrowings increased slightly compared with December 31, 2020 reflecting higher short-term borrowings from affiliates.
Long-Term Debt Long-term debt decreased compared with December 31, 2020 as the impact of debt issuances, including $1,500 million of senior debt issued to HSBC North America during the first quarter of 2021, was more than offset by debt retirements. Debt issuances during the three months ended March 31, 2021 totaled $2,288 million, of which $82 million was issued by HSBC Bank USA.
Incremental issuances from our shelf registration statement with the SEC totaled $706 million of senior structured notes during the three months ended March 31, 2021. Total long-term debt outstanding under this shelf was $8,364 million and $9,138 million at March 31, 2021 and December 31, 2020, respectively.
Incremental issuances from the HSBC Bank USA Global Bank Note Program totaled $82 million during the three months ended March 31, 2021. Total debt outstanding under this program was $1,743 million and $1,888 million at March 31, 2021 and December 31, 2020, respectively.
Borrowings from the FHLB totaled $2,750 million and $4,250 million at March 31, 2021 and December 31, 2020, respectively.
Interest, Taxes and Other Liabilities Interest, taxes and other liabilities were lower compared with December 31, 2020 due primarily to a lower liability for off-balance sheet credit exposures and lower accrued incentive compensation, partially offset by higher outstanding settlement balances related to security purchases.
HSBC USA Inc.
84
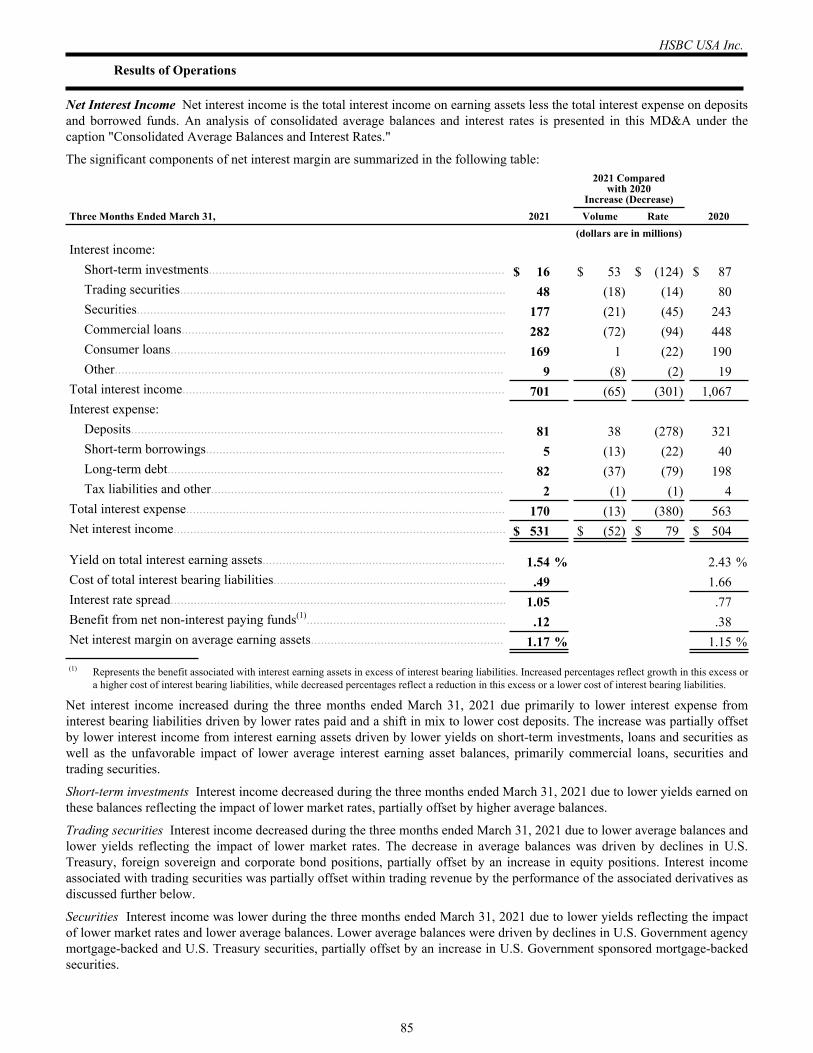
Results of Operations
Net Interest Income Net interest income is the total interest income on earning assets less the total interest expense on deposits and borrowed funds. An analysis of consolidated average balances and interest rates is presented in this MD&A under the caption "Consolidated Average Balances and Interest Rates."
The significant components of net interest margin are summarized in the following table:
2021 Comparedwith 2020
Increase (Decrease) Three Months Ended March 31, 2021 Volume Rate 2020 (dollars are in millions)Interest income:
Short-term investments......................................................................................... $ 16 $ 53 $ (124) $ 87 Trading securities.................................................................................................. 48 (18) (14) 80 Securities............................................................................................................... 177 (21) (45) 243 Commercial loans................................................................................................. 282 (72) (94) 448 Consumer loans..................................................................................................... 169 1 (22) 190 Other..................................................................................................................... 9 (8) (2) 19
Total interest income................................................................................................. 701 (65) (301) 1,067 Interest expense:
Deposits................................................................................................................ 81 38 (278) 321 Short-term borrowings.......................................................................................... 5 (13) (22) 40 Long-term debt..................................................................................................... 82 (37) (79) 198 Tax liabilities and other........................................................................................ 2 (1) (1) 4
Total interest expense................................................................................................ 170 (13) (380) 563 Net interest income.................................................................................................... $ 531 $ (52) $ 79 $ 504
Yield on total interest earning assets......................................................................... 1.54 % 2.43 %Cost of total interest bearing liabilities...................................................................... .49 1.66 Interest rate spread..................................................................................................... 1.05 .77 Benefit from net non-interest paying funds(1)............................................................ .12 .38 Net interest margin on average earning assets.......................................................... 1.17 % 1.15 %
(1) Represents the benefit associated with interest earning assets in excess of interest bearing liabilities. Increased percentages reflect growth in this excess or a higher cost of interest bearing liabilities, while decreased percentages reflect a reduction in this excess or a lower cost of interest bearing liabilities.
Net interest income increased during the three months ended March 31, 2021 due primarily to lower interest expense from interest bearing liabilities driven by lower rates paid and a shift in mix to lower cost deposits. The increase was partially offset by lower interest income from interest earning assets driven by lower yields on short-term investments, loans and securities as well as the unfavorable impact of lower average interest earning asset balances, primarily commercial loans, securities and trading securities.
Short-term investments Interest income decreased during the three months ended March 31, 2021 due to lower yields earned on these balances reflecting the impact of lower market rates, partially offset by higher average balances.
Trading securities Interest income decreased during the three months ended March 31, 2021 due to lower average balances and lower yields reflecting the impact of lower market rates. The decrease in average balances was driven by declines in U.S. Treasury, foreign sovereign and corporate bond positions, partially offset by an increase in equity positions. Interest income associated with trading securities was partially offset within trading revenue by the performance of the associated derivatives as discussed further below.
Securities Interest income was lower during the three months ended March 31, 2021 due to lower yields reflecting the impact of lower market rates and lower average balances. Lower average balances were driven by declines in U.S. Government agency mortgage-backed and U.S. Treasury securities, partially offset by an increase in U.S. Government sponsored mortgage-backed securities.
HSBC USA Inc.
85
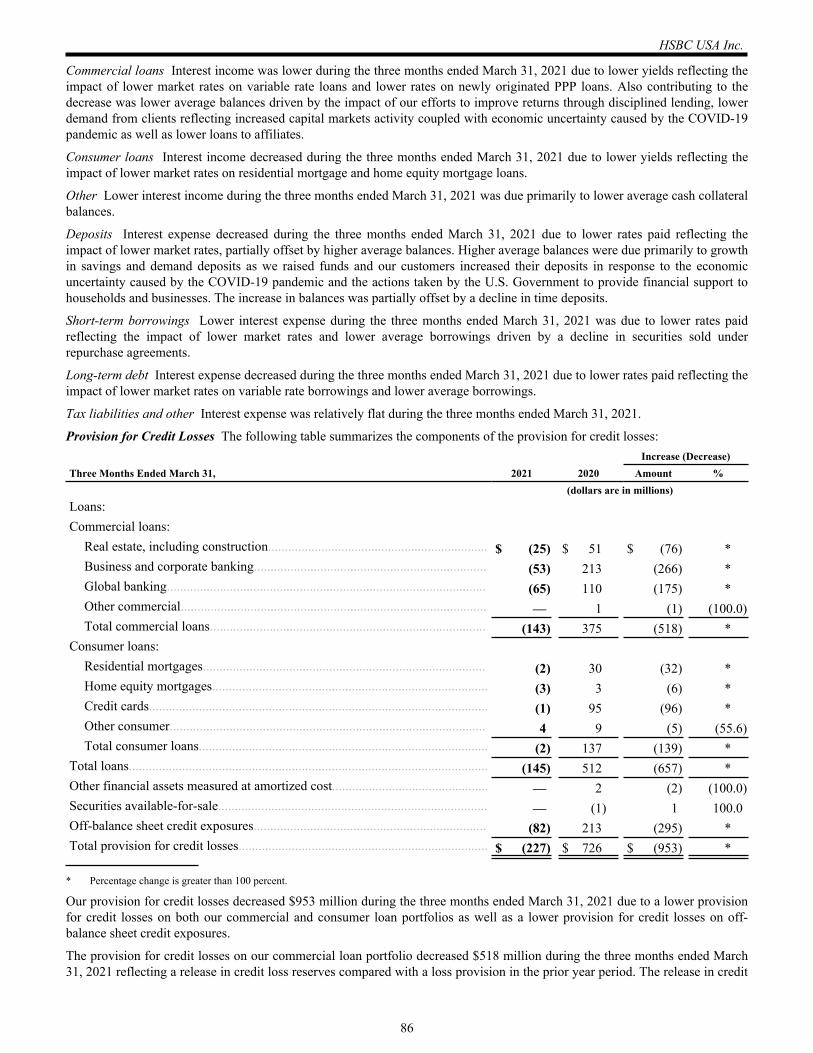
Commercial loans Interest income was lower during the three months ended March 31, 2021 due to lower yields reflecting the impact of lower market rates on variable rate loans and lower rates on newly originated PPP loans. Also contributing to the decrease was lower average balances driven by the impact of our efforts to improve returns through disciplined lending, lower demand from clients reflecting increased capital markets activity coupled with economic uncertainty caused by the COVID-19 pandemic as well as lower loans to affiliates.
Consumer loans Interest income decreased during the three months ended March 31, 2021 due to lower yields reflecting the impact of lower market rates on residential mortgage and home equity mortgage loans.
Other Lower interest income during the three months ended March 31, 2021 was due primarily to lower average cash collateral balances.
Deposits Interest expense decreased during the three months ended March 31, 2021 due to lower rates paid reflecting the impact of lower market rates, partially offset by higher average balances. Higher average balances were due primarily to growth in savings and demand deposits as we raised funds and our customers increased their deposits in response to the economic uncertainty caused by the COVID-19 pandemic and the actions taken by the U.S. Government to provide financial support to households and businesses. The increase in balances was partially offset by a decline in time deposits.
Short-term borrowings Lower interest expense during the three months ended March 31, 2021 was due to lower rates paid reflecting the impact of lower market rates and lower average borrowings driven by a decline in securities sold under repurchase agreements.
Long-term debt Interest expense decreased during the three months ended March 31, 2021 due to lower rates paid reflecting the impact of lower market rates on variable rate borrowings and lower average borrowings.
Tax liabilities and other Interest expense was relatively flat during the three months ended March 31, 2021.
Provision for Credit Losses The following table summarizes the components of the provision for credit losses:Increase (Decrease)
Three Months Ended March 31, 2021 2020 Amount % (dollars are in millions)Loans:Commercial loans:
Real estate, including construction.................................................................. $ (25) $ 51 $ (76) *Business and corporate banking...................................................................... (53) 213 (266) *Global banking................................................................................................ (65) 110 (175) *Other commercial............................................................................................ — 1 (1) (100.0) Total commercial loans................................................................................... (143) 375 (518) *
Consumer loans:Residential mortgages..................................................................................... (2) 30 (32) *Home equity mortgages................................................................................... (3) 3 (6) *Credit cards...................................................................................................... (1) 95 (96) *Other consumer............................................................................................... 4 9 (5) (55.6) Total consumer loans....................................................................................... (2) 137 (139) *
Total loans............................................................................................................ (145) 512 (657) *Other financial assets measured at amortized cost............................................... — 2 (2) (100.0) Securities available-for-sale................................................................................. — (1) 1 100.0 Off-balance sheet credit exposures...................................................................... (82) 213 (295) *Total provision for credit losses........................................................................... $ (227) $ 726 $ (953) *
* Percentage change is greater than 100 percent.
Our provision for credit losses decreased $953 million during the three months ended March 31, 2021 due to a lower provision for credit losses on both our commercial and consumer loan portfolios as well as a lower provision for credit losses on off-balance sheet credit exposures.
The provision for credit losses on our commercial loan portfolio decreased $518 million during the three months ended March 31, 2021 reflecting a release in credit loss reserves compared with a loss provision in the prior year period. The release in credit
HSBC USA Inc.
86
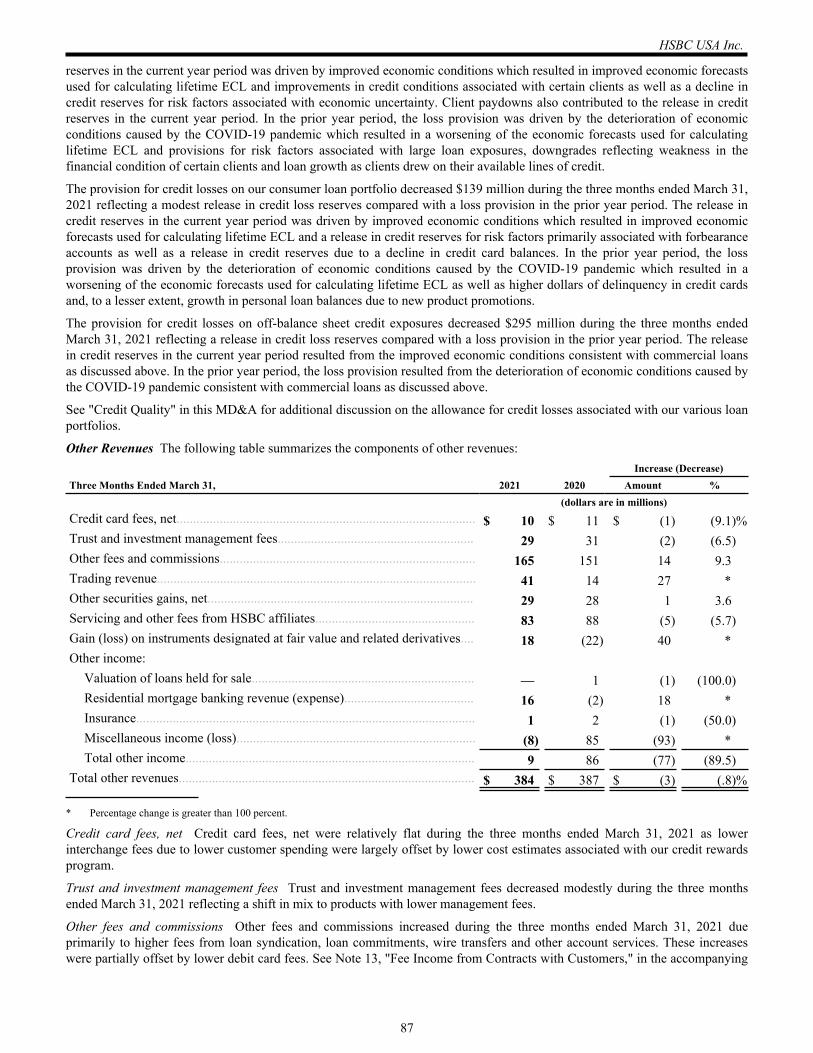
reserves in the current year period was driven by improved economic conditions which resulted in improved economic forecasts used for calculating lifetime ECL and improvements in credit conditions associated with certain clients as well as a decline in credit reserves for risk factors associated with economic uncertainty. Client paydowns also contributed to the release in credit reserves in the current year period. In the prior year period, the loss provision was driven by the deterioration of economic conditions caused by the COVID-19 pandemic which resulted in a worsening of the economic forecasts used for calculating lifetime ECL and provisions for risk factors associated with large loan exposures, downgrades reflecting weakness in the financial condition of certain clients and loan growth as clients drew on their available lines of credit.
The provision for credit losses on our consumer loan portfolio decreased $139 million during the three months ended March 31, 2021 reflecting a modest release in credit loss reserves compared with a loss provision in the prior year period. The release in credit reserves in the current year period was driven by improved economic conditions which resulted in improved economic forecasts used for calculating lifetime ECL and a release in credit reserves for risk factors primarily associated with forbearance accounts as well as a release in credit reserves due to a decline in credit card balances. In the prior year period, the loss provision was driven by the deterioration of economic conditions caused by the COVID-19 pandemic which resulted in a worsening of the economic forecasts used for calculating lifetime ECL as well as higher dollars of delinquency in credit cards and, to a lesser extent, growth in personal loan balances due to new product promotions.
The provision for credit losses on off-balance sheet credit exposures decreased $295 million during the three months ended March 31, 2021 reflecting a release in credit loss reserves compared with a loss provision in the prior year period. The release in credit reserves in the current year period resulted from the improved economic conditions consistent with commercial loans as discussed above. In the prior year period, the loss provision resulted from the deterioration of economic conditions caused by the COVID-19 pandemic consistent with commercial loans as discussed above.
See "Credit Quality" in this MD&A for additional discussion on the allowance for credit losses associated with our various loan portfolios.
Other Revenues The following table summarizes the components of other revenues:Increase (Decrease)
Three Months Ended March 31, 2021 2020 Amount % (dollars are in millions)Credit card fees, net.......................................................................................... $ 10 $ 11 $ (1) (9.1) %Trust and investment management fees........................................................... 29 31 (2) (6.5) Other fees and commissions............................................................................. 165 151 14 9.3 Trading revenue................................................................................................ 41 14 27 *Other securities gains, net................................................................................ 29 28 1 3.6 Servicing and other fees from HSBC affiliates................................................ 83 88 (5) (5.7) Gain (loss) on instruments designated at fair value and related derivatives.... 18 (22) 40 *Other income:
Valuation of loans held for sale................................................................... — 1 (1) (100.0) Residential mortgage banking revenue (expense)....................................... 16 (2) 18 *Insurance...................................................................................................... 1 2 (1) (50.0) Miscellaneous income (loss)........................................................................ (8) 85 (93) *Total other income....................................................................................... 9 86 (77) (89.5)
Total other revenues......................................................................................... $ 384 $ 387 $ (3) (.8) %
* Percentage change is greater than 100 percent.
Credit card fees, net Credit card fees, net were relatively flat during the three months ended March 31, 2021 as lower interchange fees due to lower customer spending were largely offset by lower cost estimates associated with our credit rewards program.
Trust and investment management fees Trust and investment management fees decreased modestly during the three months ended March 31, 2021 reflecting a shift in mix to products with lower management fees.
Other fees and commissions Other fees and commissions increased during the three months ended March 31, 2021 due primarily to higher fees from loan syndication, loan commitments, wire transfers and other account services. These increases were partially offset by lower debit card fees. See Note 13, "Fee Income from Contracts with Customers," in the accompanying
HSBC USA Inc.
87
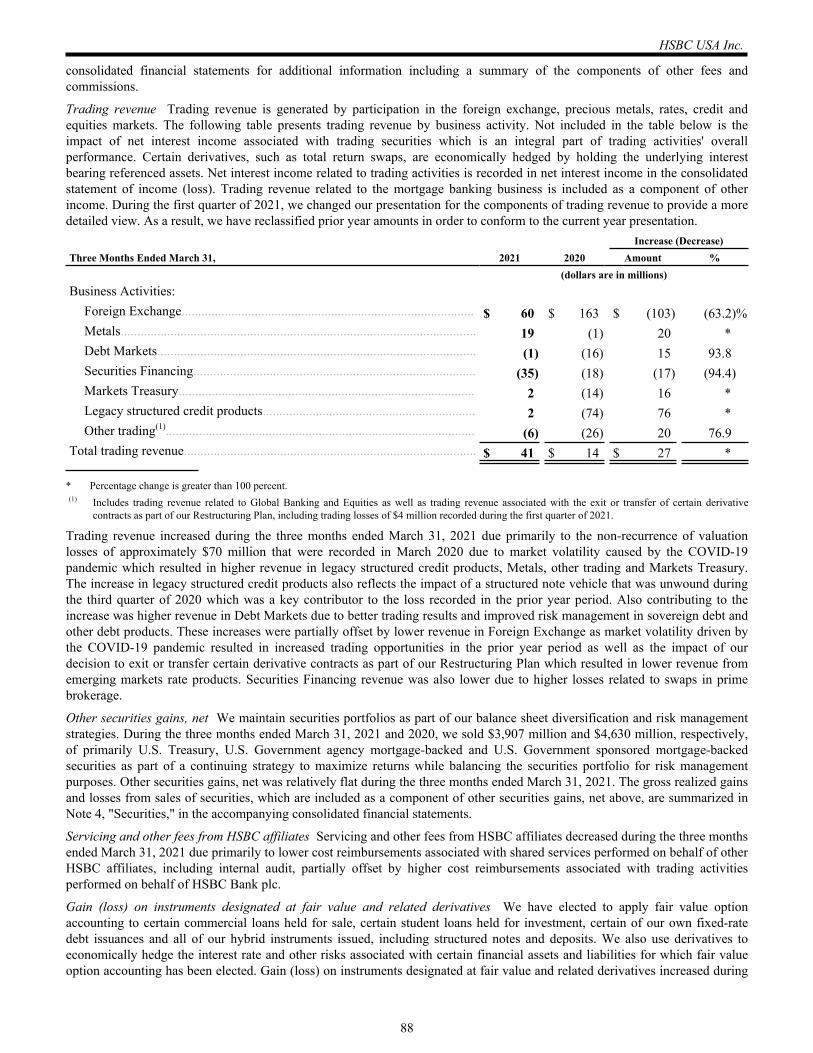
consolidated financial statements for additional information including a summary of the components of other fees and commissions.
Trading revenue Trading revenue is generated by participation in the foreign exchange, precious metals, rates, credit and equities markets. The following table presents trading revenue by business activity. Not included in the table below is the impact of net interest income associated with trading securities which is an integral part of trading activities' overall performance. Certain derivatives, such as total return swaps, are economically hedged by holding the underlying interest bearing referenced assets. Net interest income related to trading activities is recorded in net interest income in the consolidated statement of income (loss). Trading revenue related to the mortgage banking business is included as a component of other income. During the first quarter of 2021, we changed our presentation for the components of trading revenue to provide a more detailed view. As a result, we have reclassified prior year amounts in order to conform to the current year presentation.
Increase (Decrease)Three Months Ended March 31, 2021 2020 Amount % (dollars are in millions)Business Activities:
Foreign Exchange........................................................................................ $ 60 $ 163 $ (103) (63.2) %Metals........................................................................................................... 19 (1) 20 *Debt Markets................................................................................................ (1) (16) 15 93.8 Securities Financing..................................................................................... (35) (18) (17) (94.4) Markets Treasury......................................................................................... 2 (14) 16 *Legacy structured credit products................................................................ 2 (74) 76 *Other trading(1)............................................................................................. (6) (26) 20 76.9
Total trading revenue........................................................................................ $ 41 $ 14 $ 27 *
* Percentage change is greater than 100 percent.(1) Includes trading revenue related to Global Banking and Equities as well as trading revenue associated with the exit or transfer of certain derivative
contracts as part of our Restructuring Plan, including trading losses of $4 million recorded during the first quarter of 2021.
Trading revenue increased during the three months ended March 31, 2021 due primarily to the non-recurrence of valuation losses of approximately $70 million that were recorded in March 2020 due to market volatility caused by the COVID-19 pandemic which resulted in higher revenue in legacy structured credit products, Metals, other trading and Markets Treasury. The increase in legacy structured credit products also reflects the impact of a structured note vehicle that was unwound during the third quarter of 2020 which was a key contributor to the loss recorded in the prior year period. Also contributing to the increase was higher revenue in Debt Markets due to better trading results and improved risk management in sovereign debt and other debt products. These increases were partially offset by lower revenue in Foreign Exchange as market volatility driven by the COVID-19 pandemic resulted in increased trading opportunities in the prior year period as well as the impact of our decision to exit or transfer certain derivative contracts as part of our Restructuring Plan which resulted in lower revenue from emerging markets rate products. Securities Financing revenue was also lower due to higher losses related to swaps in prime brokerage.
Other securities gains, net We maintain securities portfolios as part of our balance sheet diversification and risk management strategies. During the three months ended March 31, 2021 and 2020, we sold $3,907 million and $4,630 million, respectively, of primarily U.S. Treasury, U.S. Government agency mortgage-backed and U.S. Government sponsored mortgage-backed securities as part of a continuing strategy to maximize returns while balancing the securities portfolio for risk management purposes. Other securities gains, net was relatively flat during the three months ended March 31, 2021. The gross realized gains and losses from sales of securities, which are included as a component of other securities gains, net above, are summarized in Note 4, "Securities," in the accompanying consolidated financial statements.
Servicing and other fees from HSBC affiliates Servicing and other fees from HSBC affiliates decreased during the three months ended March 31, 2021 due primarily to lower cost reimbursements associated with shared services performed on behalf of other HSBC affiliates, including internal audit, partially offset by higher cost reimbursements associated with trading activities performed on behalf of HSBC Bank plc.
Gain (loss) on instruments designated at fair value and related derivatives We have elected to apply fair value option accounting to certain commercial loans held for sale, certain student loans held for investment, certain of our own fixed-rate debt issuances and all of our hybrid instruments issued, including structured notes and deposits. We also use derivatives to economically hedge the interest rate and other risks associated with certain financial assets and liabilities for which fair value option accounting has been elected. Gain (loss) on instruments designated at fair value and related derivatives increased during
HSBC USA Inc.
88
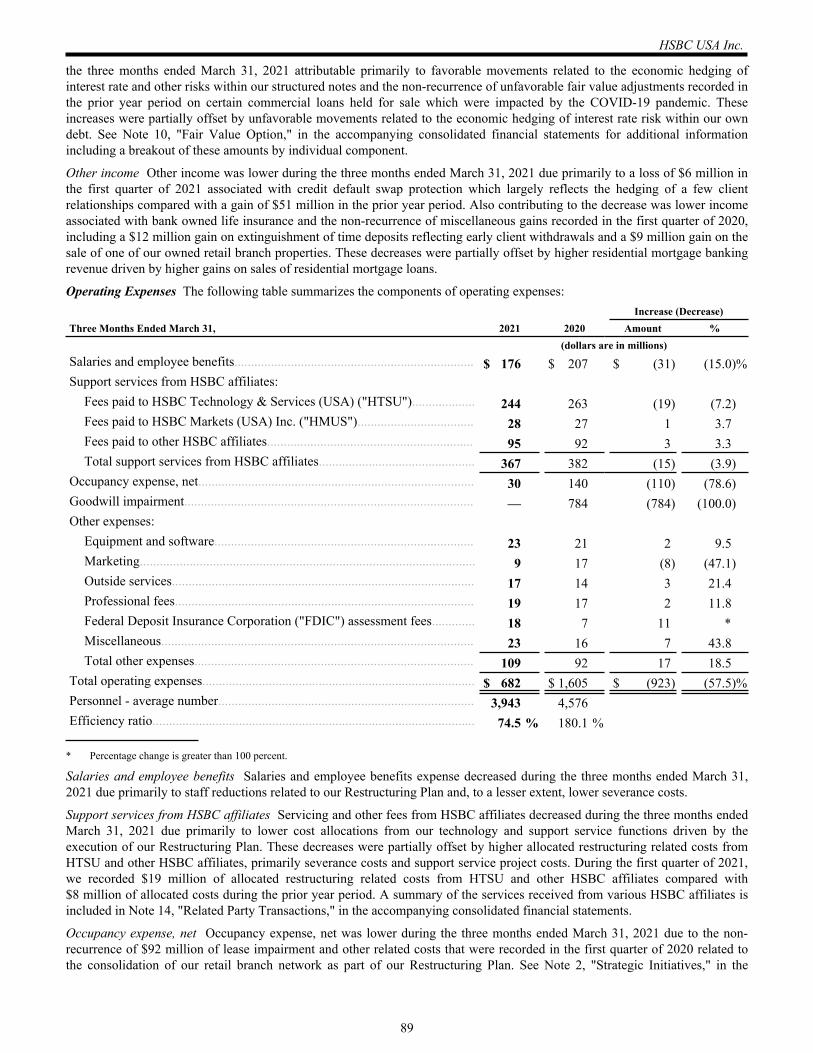
the three months ended March 31, 2021 attributable primarily to favorable movements related to the economic hedging of interest rate and other risks within our structured notes and the non-recurrence of unfavorable fair value adjustments recorded in the prior year period on certain commercial loans held for sale which were impacted by the COVID-19 pandemic. These increases were partially offset by unfavorable movements related to the economic hedging of interest rate risk within our own debt. See Note 10, "Fair Value Option," in the accompanying consolidated financial statements for additional information including a breakout of these amounts by individual component.
Other income Other income was lower during the three months ended March 31, 2021 due primarily to a loss of $6 million in the first quarter of 2021 associated with credit default swap protection which largely reflects the hedging of a few client relationships compared with a gain of $51 million in the prior year period. Also contributing to the decrease was lower income associated with bank owned life insurance and the non-recurrence of miscellaneous gains recorded in the first quarter of 2020, including a $12 million gain on extinguishment of time deposits reflecting early client withdrawals and a $9 million gain on the sale of one of our owned retail branch properties. These decreases were partially offset by higher residential mortgage banking revenue driven by higher gains on sales of residential mortgage loans.
Operating Expenses The following table summarizes the components of operating expenses:Increase (Decrease)
Three Months Ended March 31, 2021 2020 Amount % (dollars are in millions)Salaries and employee benefits........................................................................ $ 176 $ 207 $ (31) (15.0) %Support services from HSBC affiliates:
Fees paid to HSBC Technology & Services (USA) ("HTSU")................... 244 263 (19) (7.2) Fees paid to HSBC Markets (USA) Inc. ("HMUS")................................... 28 27 1 3.7 Fees paid to other HSBC affiliates.............................................................. 95 92 3 3.3 Total support services from HSBC affiliates............................................... 367 382 (15) (3.9)
Occupancy expense, net................................................................................... 30 140 (110) (78.6) Goodwill impairment....................................................................................... — 784 (784) (100.0) Other expenses:
Equipment and software.............................................................................. 23 21 2 9.5 Marketing..................................................................................................... 9 17 (8) (47.1) Outside services........................................................................................... 17 14 3 21.4 Professional fees.......................................................................................... 19 17 2 11.8 Federal Deposit Insurance Corporation ("FDIC") assessment fees............. 18 7 11 *Miscellaneous.............................................................................................. 23 16 7 43.8 Total other expenses.................................................................................... 109 92 17 18.5
Total operating expenses.................................................................................. $ 682 $ 1,605 $ (923) (57.5) %Personnel - average number............................................................................. 3,943 4,576 Efficiency ratio................................................................................................. 74.5 % 180.1 %
* Percentage change is greater than 100 percent.
Salaries and employee benefits Salaries and employee benefits expense decreased during the three months ended March 31, 2021 due primarily to staff reductions related to our Restructuring Plan and, to a lesser extent, lower severance costs.
Support services from HSBC affiliates Servicing and other fees from HSBC affiliates decreased during the three months ended March 31, 2021 due primarily to lower cost allocations from our technology and support service functions driven by the execution of our Restructuring Plan. These decreases were partially offset by higher allocated restructuring related costs from HTSU and other HSBC affiliates, primarily severance costs and support service project costs. During the first quarter of 2021, we recorded $19 million of allocated restructuring related costs from HTSU and other HSBC affiliates compared with $8 million of allocated costs during the prior year period. A summary of the services received from various HSBC affiliates is included in Note 14, "Related Party Transactions," in the accompanying consolidated financial statements.
Occupancy expense, net Occupancy expense, net was lower during the three months ended March 31, 2021 due to the non-recurrence of $92 million of lease impairment and other related costs that were recorded in the first quarter of 2020 related to the consolidation of our retail branch network as part of our Restructuring Plan. See Note 2, "Strategic Initiatives," in the
HSBC USA Inc.
89
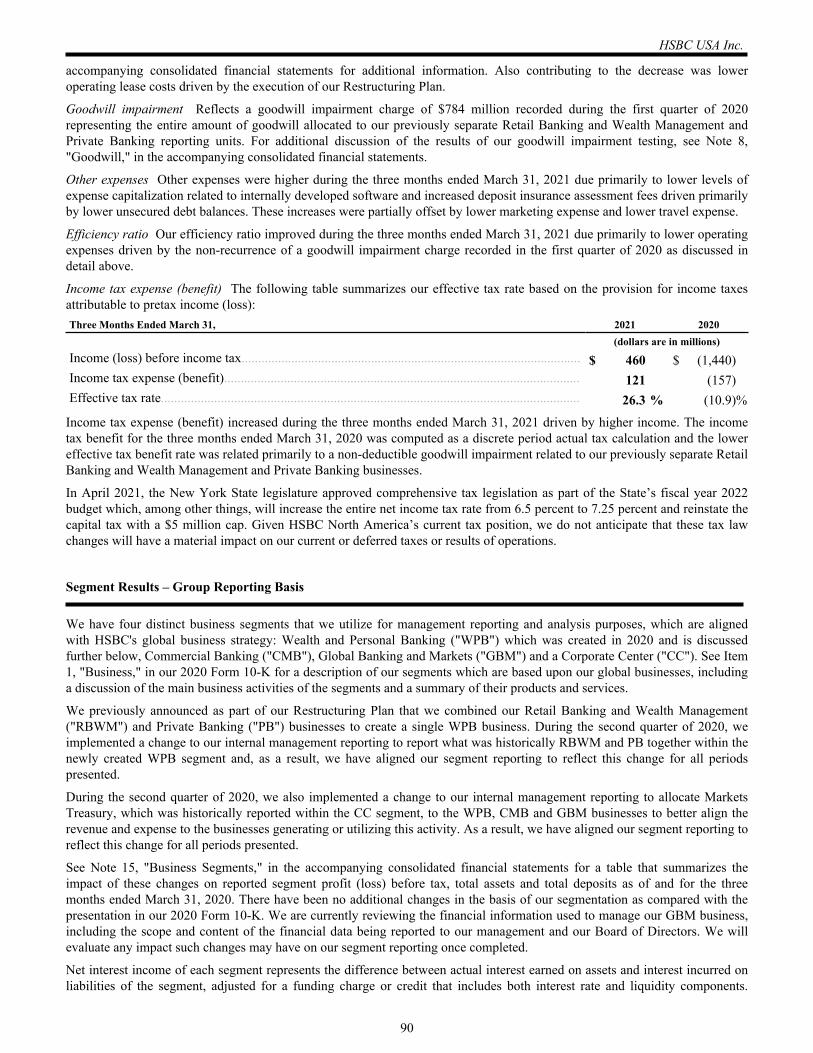
accompanying consolidated financial statements for additional information. Also contributing to the decrease was lower operating lease costs driven by the execution of our Restructuring Plan.
Goodwill impairment Reflects a goodwill impairment charge of $784 million recorded during the first quarter of 2020 representing the entire amount of goodwill allocated to our previously separate Retail Banking and Wealth Management and Private Banking reporting units. For additional discussion of the results of our goodwill impairment testing, see Note 8, "Goodwill," in the accompanying consolidated financial statements.
Other expenses Other expenses were higher during the three months ended March 31, 2021 due primarily to lower levels of expense capitalization related to internally developed software and increased deposit insurance assessment fees driven primarily by lower unsecured debt balances. These increases were partially offset by lower marketing expense and lower travel expense.
Efficiency ratio Our efficiency ratio improved during the three months ended March 31, 2021 due primarily to lower operating expenses driven by the non-recurrence of a goodwill impairment charge recorded in the first quarter of 2020 as discussed in detail above.
Income tax expense (benefit) The following table summarizes our effective tax rate based on the provision for income taxes attributable to pretax income (loss):Three Months Ended March 31, 2021 2020 (dollars are in millions)Income (loss) before income tax...................................................................................................... $ 460 $ (1,440) Income tax expense (benefit)........................................................................................................... 121 (157) Effective tax rate.............................................................................................................................. 26.3 % (10.9) %
Income tax expense (benefit) increased during the three months ended March 31, 2021 driven by higher income. The income tax benefit for the three months ended March 31, 2020 was computed as a discrete period actual tax calculation and the lower effective tax benefit rate was related primarily to a non-deductible goodwill impairment related to our previously separate Retail Banking and Wealth Management and Private Banking businesses.
In April 2021, the New York State legislature approved comprehensive tax legislation as part of the State’s fiscal year 2022 budget which, among other things, will increase the entire net income tax rate from 6.5 percent to 7.25 percent and reinstate the capital tax with a $5 million cap. Given HSBC North America’s current tax position, we do not anticipate that these tax law changes will have a material impact on our current or deferred taxes or results of operations.
Segment Results – Group Reporting Basis
We have four distinct business segments that we utilize for management reporting and analysis purposes, which are aligned with HSBC's global business strategy: Wealth and Personal Banking ("WPB") which was created in 2020 and is discussed further below, Commercial Banking ("CMB"), Global Banking and Markets ("GBM") and a Corporate Center ("CC"). See Item 1, "Business," in our 2020 Form 10-K for a description of our segments which are based upon our global businesses, including a discussion of the main business activities of the segments and a summary of their products and services.
We previously announced as part of our Restructuring Plan that we combined our Retail Banking and Wealth Management ("RBWM") and Private Banking ("PB") businesses to create a single WPB business. During the second quarter of 2020, we implemented a change to our internal management reporting to report what was historically RBWM and PB together within the newly created WPB segment and, as a result, we have aligned our segment reporting to reflect this change for all periods presented.
During the second quarter of 2020, we also implemented a change to our internal management reporting to allocate Markets Treasury, which was historically reported within the CC segment, to the WPB, CMB and GBM businesses to better align the revenue and expense to the businesses generating or utilizing this activity. As a result, we have aligned our segment reporting to reflect this change for all periods presented.
See Note 15, "Business Segments," in the accompanying consolidated financial statements for a table that summarizes the impact of these changes on reported segment profit (loss) before tax, total assets and total deposits as of and for the three months ended March 31, 2020. There have been no additional changes in the basis of our segmentation as compared with the presentation in our 2020 Form 10-K. We are currently reviewing the financial information used to manage our GBM business, including the scope and content of the financial data being reported to our management and our Board of Directors. We will evaluate any impact such changes may have on our segment reporting once completed.
Net interest income of each segment represents the difference between actual interest earned on assets and interest incurred on liabilities of the segment, adjusted for a funding charge or credit that includes both interest rate and liquidity components.
HSBC USA Inc.
90
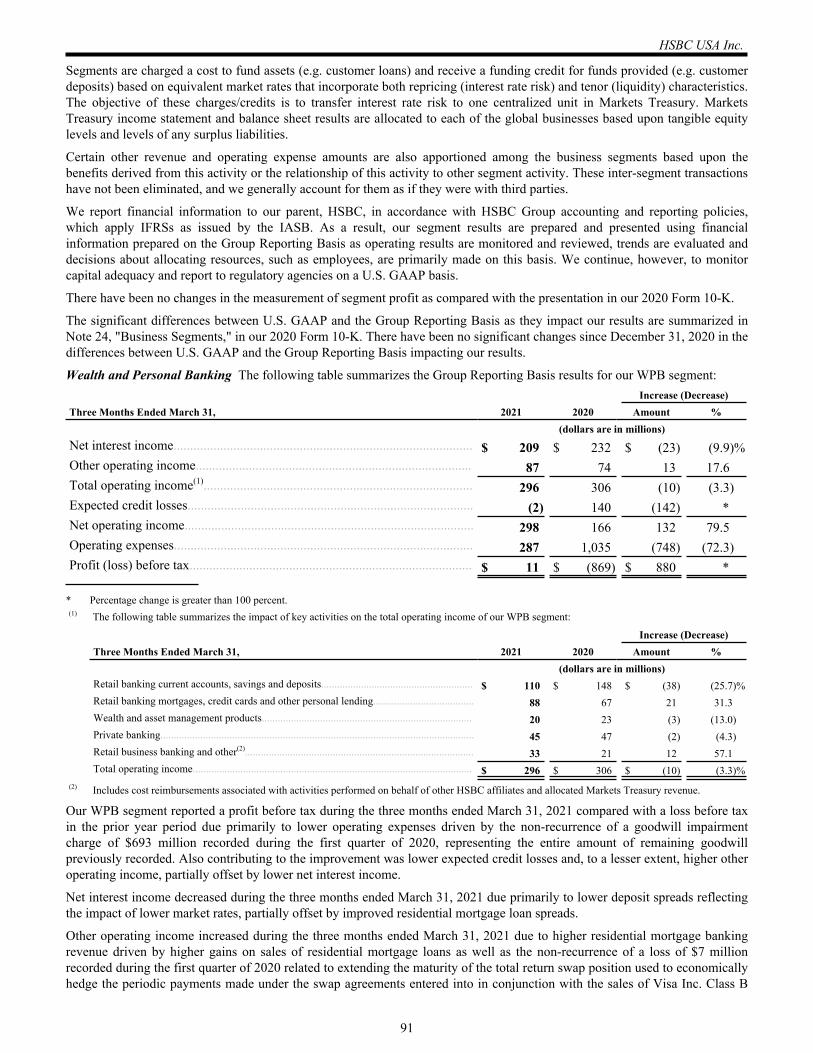
Segments are charged a cost to fund assets (e.g. customer loans) and receive a funding credit for funds provided (e.g. customer deposits) based on equivalent market rates that incorporate both repricing (interest rate risk) and tenor (liquidity) characteristics. The objective of these charges/credits is to transfer interest rate risk to one centralized unit in Markets Treasury. Markets Treasury income statement and balance sheet results are allocated to each of the global businesses based upon tangible equity levels and levels of any surplus liabilities.
Certain other revenue and operating expense amounts are also apportioned among the business segments based upon the benefits derived from this activity or the relationship of this activity to other segment activity. These inter-segment transactions have not been eliminated, and we generally account for them as if they were with third parties.
We report financial information to our parent, HSBC, in accordance with HSBC Group accounting and reporting policies, which apply IFRSs as issued by the IASB. As a result, our segment results are prepared and presented using financial information prepared on the Group Reporting Basis as operating results are monitored and reviewed, trends are evaluated and decisions about allocating resources, such as employees, are primarily made on this basis. We continue, however, to monitor capital adequacy and report to regulatory agencies on a U.S. GAAP basis.
There have been no changes in the measurement of segment profit as compared with the presentation in our 2020 Form 10-K.
The significant differences between U.S. GAAP and the Group Reporting Basis as they impact our results are summarized in Note 24, "Business Segments," in our 2020 Form 10-K. There have been no significant changes since December 31, 2020 in the differences between U.S. GAAP and the Group Reporting Basis impacting our results.
Wealth and Personal Banking The following table summarizes the Group Reporting Basis results for our WPB segment:Increase (Decrease)
Three Months Ended March 31, 2021 2020 Amount % (dollars are in millions)Net interest income.......................................................................................... $ 209 $ 232 $ (23) (9.9) %Other operating income................................................................................... 87 74 13 17.6 Total operating income(1)................................................................................. 296 306 (10) (3.3) Expected credit losses...................................................................................... (2) 140 (142) *Net operating income....................................................................................... 298 166 132 79.5 Operating expenses.......................................................................................... 287 1,035 (748) (72.3) Profit (loss) before tax..................................................................................... $ 11 $ (869) $ 880 *
* Percentage change is greater than 100 percent.(1) The following table summarizes the impact of key activities on the total operating income of our WPB segment:
Increase (Decrease)Three Months Ended March 31, 2021 2020 Amount % (dollars are in millions)Retail banking current accounts, savings and deposits......................................................... $ 110 $ 148 $ (38) (25.7) %Retail banking mortgages, credit cards and other personal lending...................................... 88 67 21 31.3 Wealth and asset management products............................................................................... 20 23 (3) (13.0) Private banking...................................................................................................................... 45 47 (2) (4.3) Retail business banking and other(2)...................................................................................... 33 21 12 57.1 Total operating income......................................................................................................... $ 296 $ 306 $ (10) (3.3) %
(2) Includes cost reimbursements associated with activities performed on behalf of other HSBC affiliates and allocated Markets Treasury revenue.
Our WPB segment reported a profit before tax during the three months ended March 31, 2021 compared with a loss before tax in the prior year period due primarily to lower operating expenses driven by the non-recurrence of a goodwill impairment charge of $693 million recorded during the first quarter of 2020, representing the entire amount of remaining goodwill previously recorded. Also contributing to the improvement was lower expected credit losses and, to a lesser extent, higher other operating income, partially offset by lower net interest income.
Net interest income decreased during the three months ended March 31, 2021 due primarily to lower deposit spreads reflecting the impact of lower market rates, partially offset by improved residential mortgage loan spreads.
Other operating income increased during the three months ended March 31, 2021 due to higher residential mortgage banking revenue driven by higher gains on sales of residential mortgage loans as well as the non-recurrence of a loss of $7 million recorded during the first quarter of 2020 related to extending the maturity of the total return swap position used to economically hedge the periodic payments made under the swap agreements entered into in conjunction with the sales of Visa Inc. Class B
HSBC USA Inc.
91
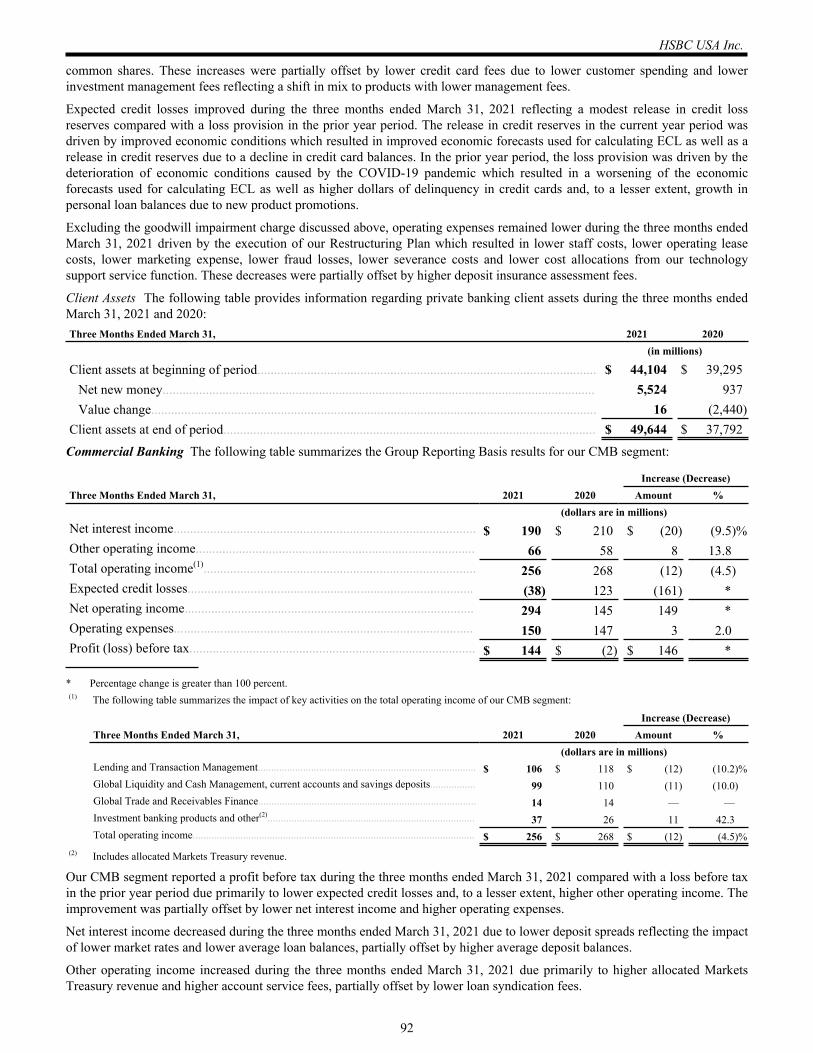
common shares. These increases were partially offset by lower credit card fees due to lower customer spending and lower investment management fees reflecting a shift in mix to products with lower management fees.
Expected credit losses improved during the three months ended March 31, 2021 reflecting a modest release in credit loss reserves compared with a loss provision in the prior year period. The release in credit reserves in the current year period was driven by improved economic conditions which resulted in improved economic forecasts used for calculating ECL as well as a release in credit reserves due to a decline in credit card balances. In the prior year period, the loss provision was driven by the deterioration of economic conditions caused by the COVID-19 pandemic which resulted in a worsening of the economic forecasts used for calculating ECL as well as higher dollars of delinquency in credit cards and, to a lesser extent, growth in personal loan balances due to new product promotions.
Excluding the goodwill impairment charge discussed above, operating expenses remained lower during the three months ended March 31, 2021 driven by the execution of our Restructuring Plan which resulted in lower staff costs, lower operating lease costs, lower marketing expense, lower fraud losses, lower severance costs and lower cost allocations from our technology support service function. These decreases were partially offset by higher deposit insurance assessment fees.
Client Assets The following table provides information regarding private banking client assets during the three months ended March 31, 2021 and 2020:Three Months Ended March 31, 2021 2020
(in millions)
Client assets at beginning of period...................................................................................................... $ 44,104 $ 39,295 Net new money.................................................................................................................................. 5,524 937 Value change...................................................................................................................................... 16 (2,440)
Client assets at end of period................................................................................................................ $ 49,644 $ 37,792
Commercial Banking The following table summarizes the Group Reporting Basis results for our CMB segment:
Increase (Decrease)Three Months Ended March 31, 2021 2020 Amount % (dollars are in millions)Net interest income........................................................................................... $ 190 $ 210 $ (20) (9.5) %Other operating income.................................................................................... 66 58 8 13.8 Total operating income(1).................................................................................. 256 268 (12) (4.5) Expected credit losses...................................................................................... (38) 123 (161) *Net operating income....................................................................................... 294 145 149 *Operating expenses.......................................................................................... 150 147 3 2.0 Profit (loss) before tax...................................................................................... $ 144 $ (2) $ 146 *
* Percentage change is greater than 100 percent.(1) The following table summarizes the impact of key activities on the total operating income of our CMB segment:
Increase (Decrease)Three Months Ended March 31, 2021 2020 Amount % (dollars are in millions)Lending and Transaction Management.................................................................................. $ 106 $ 118 $ (12) (10.2) %Global Liquidity and Cash Management, current accounts and savings deposits................. 99 110 (11) (10.0) Global Trade and Receivables Finance.................................................................................. 14 14 — — Investment banking products and other(2).............................................................................. 37 26 11 42.3 Total operating income.......................................................................................................... $ 256 $ 268 $ (12) (4.5) %
(2) Includes allocated Markets Treasury revenue.
Our CMB segment reported a profit before tax during the three months ended March 31, 2021 compared with a loss before tax in the prior year period due primarily to lower expected credit losses and, to a lesser extent, higher other operating income. The improvement was partially offset by lower net interest income and higher operating expenses.
Net interest income decreased during the three months ended March 31, 2021 due to lower deposit spreads reflecting the impact of lower market rates and lower average loan balances, partially offset by higher average deposit balances.
Other operating income increased during the three months ended March 31, 2021 due primarily to higher allocated Markets Treasury revenue and higher account service fees, partially offset by lower loan syndication fees.
HSBC USA Inc.
92
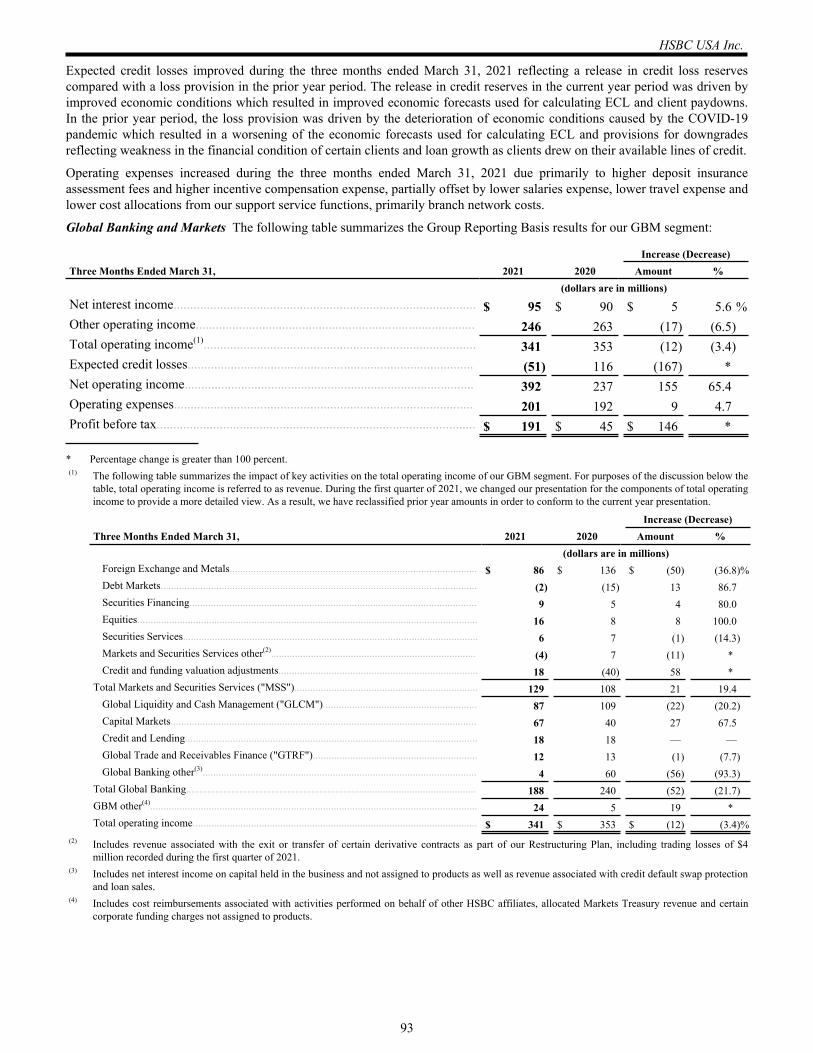
Expected credit losses improved during the three months ended March 31, 2021 reflecting a release in credit loss reserves compared with a loss provision in the prior year period. The release in credit reserves in the current year period was driven by improved economic conditions which resulted in improved economic forecasts used for calculating ECL and client paydowns. In the prior year period, the loss provision was driven by the deterioration of economic conditions caused by the COVID-19 pandemic which resulted in a worsening of the economic forecasts used for calculating ECL and provisions for downgrades reflecting weakness in the financial condition of certain clients and loan growth as clients drew on their available lines of credit.
Operating expenses increased during the three months ended March 31, 2021 due primarily to higher deposit insurance assessment fees and higher incentive compensation expense, partially offset by lower salaries expense, lower travel expense and lower cost allocations from our support service functions, primarily branch network costs.
Global Banking and Markets The following table summarizes the Group Reporting Basis results for our GBM segment:
Increase (Decrease)Three Months Ended March 31, 2021 2020 Amount % (dollars are in millions)Net interest income........................................................................................... $ 95 $ 90 $ 5 5.6 %Other operating income.................................................................................... 246 263 (17) (6.5) Total operating income(1).................................................................................. 341 353 (12) (3.4) Expected credit losses...................................................................................... (51) 116 (167) *Net operating income....................................................................................... 392 237 155 65.4 Operating expenses.......................................................................................... 201 192 9 4.7 Profit before tax................................................................................................ $ 191 $ 45 $ 146 *
* Percentage change is greater than 100 percent.(1) The following table summarizes the impact of key activities on the total operating income of our GBM segment. For purposes of the discussion below the
table, total operating income is referred to as revenue. During the first quarter of 2021, we changed our presentation for the components of total operating income to provide a more detailed view. As a result, we have reclassified prior year amounts in order to conform to the current year presentation.
Increase (Decrease)Three Months Ended March 31, 2021 2020 Amount % (dollars are in millions)
Foreign Exchange and Metals............................................................................................. $ 86 $ 136 $ (50) (36.8) %Debt Markets....................................................................................................................... (2) (15) 13 86.7 Securities Financing............................................................................................................ 9 5 4 80.0 Equities................................................................................................................................ 16 8 8 100.0 Securities Services............................................................................................................... 6 7 (1) (14.3) Markets and Securities Services other(2)............................................................................. (4) 7 (11) *Credit and funding valuation adjustments........................................................................... 18 (40) 58 *
Total Markets and Securities Services ("MSS")..................................................................... 129 108 21 19.4 Global Liquidity and Cash Management ("GLCM").......................................................... 87 109 (22) (20.2) Capital Markets................................................................................................................... 67 40 27 67.5 Credit and Lending.............................................................................................................. 18 18 — — Global Trade and Receivables Finance ("GTRF").............................................................. 12 13 (1) (7.7) Global Banking other(3)....................................................................................................... 4 60 (56) (93.3)
Total Global Banking............................................................................................................. 188 240 (52) (21.7) GBM other(4)........................................................................................................................... 24 5 19 *Total operating income........................................................................................................... $ 341 $ 353 $ (12) (3.4) %
(2) Includes revenue associated with the exit or transfer of certain derivative contracts as part of our Restructuring Plan, including trading losses of $4 million recorded during the first quarter of 2021.
(3) Includes net interest income on capital held in the business and not assigned to products as well as revenue associated with credit default swap protection and loan sales.
(4) Includes cost reimbursements associated with activities performed on behalf of other HSBC affiliates, allocated Markets Treasury revenue and certain corporate funding charges not assigned to products.
HSBC USA Inc.
93
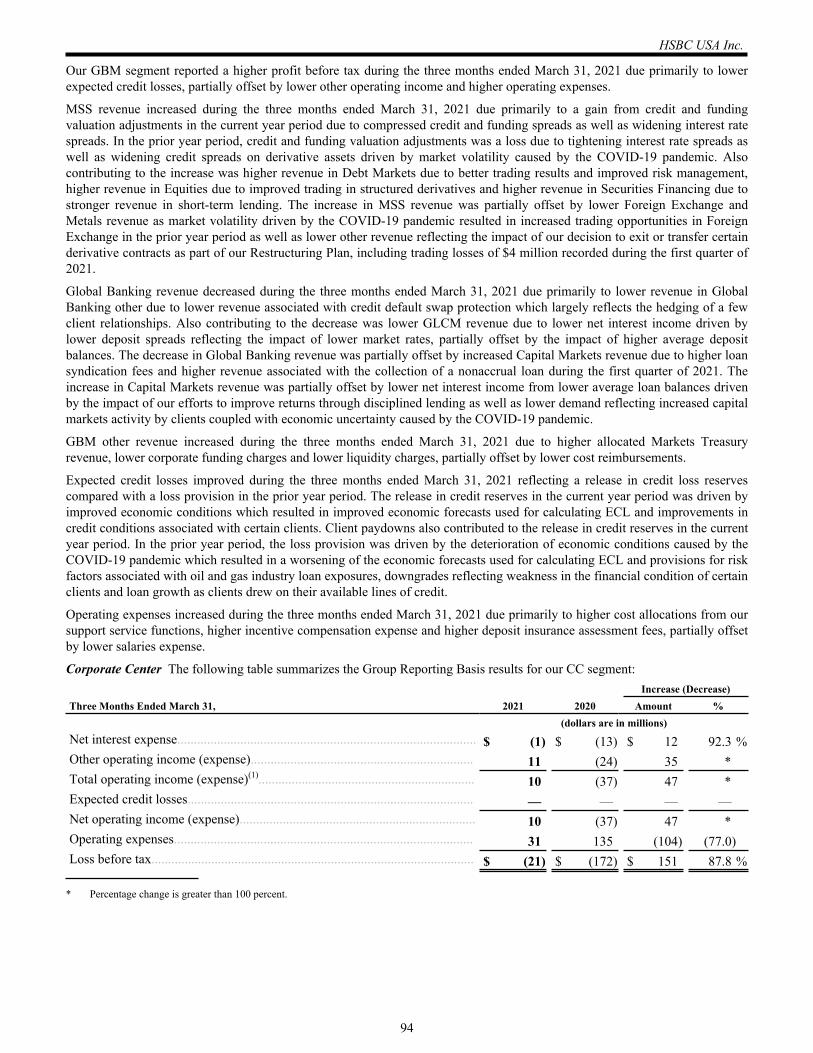
Our GBM segment reported a higher profit before tax during the three months ended March 31, 2021 due primarily to lower expected credit losses, partially offset by lower other operating income and higher operating expenses.
MSS revenue increased during the three months ended March 31, 2021 due primarily to a gain from credit and funding valuation adjustments in the current year period due to compressed credit and funding spreads as well as widening interest rate spreads. In the prior year period, credit and funding valuation adjustments was a loss due to tightening interest rate spreads as well as widening credit spreads on derivative assets driven by market volatility caused by the COVID-19 pandemic. Also contributing to the increase was higher revenue in Debt Markets due to better trading results and improved risk management, higher revenue in Equities due to improved trading in structured derivatives and higher revenue in Securities Financing due to stronger revenue in short-term lending. The increase in MSS revenue was partially offset by lower Foreign Exchange and Metals revenue as market volatility driven by the COVID-19 pandemic resulted in increased trading opportunities in Foreign Exchange in the prior year period as well as lower other revenue reflecting the impact of our decision to exit or transfer certain derivative contracts as part of our Restructuring Plan, including trading losses of $4 million recorded during the first quarter of 2021.
Global Banking revenue decreased during the three months ended March 31, 2021 due primarily to lower revenue in Global Banking other due to lower revenue associated with credit default swap protection which largely reflects the hedging of a few client relationships. Also contributing to the decrease was lower GLCM revenue due to lower net interest income driven by lower deposit spreads reflecting the impact of lower market rates, partially offset by the impact of higher average deposit balances. The decrease in Global Banking revenue was partially offset by increased Capital Markets revenue due to higher loan syndication fees and higher revenue associated with the collection of a nonaccrual loan during the first quarter of 2021. The increase in Capital Markets revenue was partially offset by lower net interest income from lower average loan balances driven by the impact of our efforts to improve returns through disciplined lending as well as lower demand reflecting increased capital markets activity by clients coupled with economic uncertainty caused by the COVID-19 pandemic.
GBM other revenue increased during the three months ended March 31, 2021 due to higher allocated Markets Treasury revenue, lower corporate funding charges and lower liquidity charges, partially offset by lower cost reimbursements.
Expected credit losses improved during the three months ended March 31, 2021 reflecting a release in credit loss reserves compared with a loss provision in the prior year period. The release in credit reserves in the current year period was driven by improved economic conditions which resulted in improved economic forecasts used for calculating ECL and improvements in credit conditions associated with certain clients. Client paydowns also contributed to the release in credit reserves in the current year period. In the prior year period, the loss provision was driven by the deterioration of economic conditions caused by the COVID-19 pandemic which resulted in a worsening of the economic forecasts used for calculating ECL and provisions for risk factors associated with oil and gas industry loan exposures, downgrades reflecting weakness in the financial condition of certain clients and loan growth as clients drew on their available lines of credit.
Operating expenses increased during the three months ended March 31, 2021 due primarily to higher cost allocations from our support service functions, higher incentive compensation expense and higher deposit insurance assessment fees, partially offset by lower salaries expense.
Corporate Center The following table summarizes the Group Reporting Basis results for our CC segment:Increase (Decrease)
Three Months Ended March 31, 2021 2020 Amount % (dollars are in millions)Net interest expense.......................................................................................... $ (1) $ (13) $ 12 92.3 %Other operating income (expense)................................................................... 11 (24) 35 *Total operating income (expense)(1)................................................................. 10 (37) 47 *Expected credit losses...................................................................................... — — — — Net operating income (expense)....................................................................... 10 (37) 47 *Operating expenses.......................................................................................... 31 135 (104) (77.0) Loss before tax................................................................................................. $ (21) $ (172) $ 151 87.8 %
* Percentage change is greater than 100 percent.
HSBC USA Inc.
94
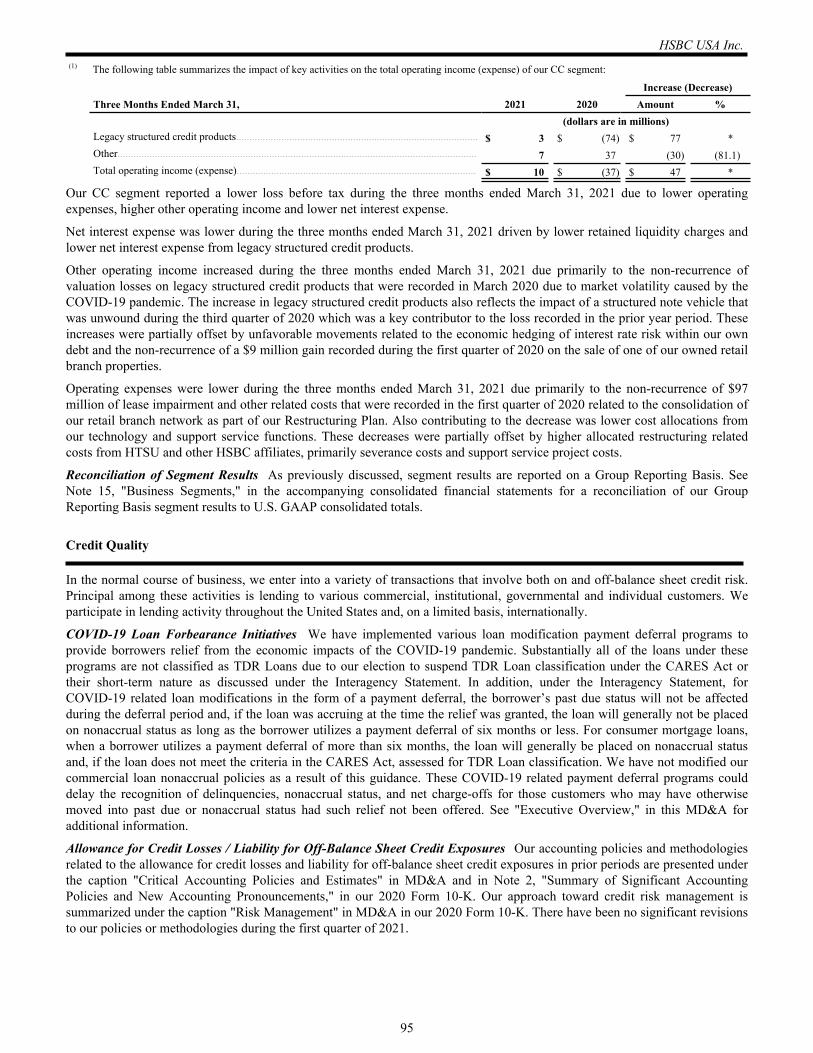
(1) The following table summarizes the impact of key activities on the total operating income (expense) of our CC segment:
Increase (Decrease)Three Months Ended March 31, 2021 2020 Amount % (dollars are in millions)Legacy structured credit products........................................................................................... $ 3 $ (74) $ 77 *Other....................................................................................................................................... 7 37 (30) (81.1) Total operating income (expense).......................................................................................... $ 10 $ (37) $ 47 *
Our CC segment reported a lower loss before tax during the three months ended March 31, 2021 due to lower operating expenses, higher other operating income and lower net interest expense.
Net interest expense was lower during the three months ended March 31, 2021 driven by lower retained liquidity charges and lower net interest expense from legacy structured credit products.
Other operating income increased during the three months ended March 31, 2021 due primarily to the non-recurrence of valuation losses on legacy structured credit products that were recorded in March 2020 due to market volatility caused by the COVID-19 pandemic. The increase in legacy structured credit products also reflects the impact of a structured note vehicle that was unwound during the third quarter of 2020 which was a key contributor to the loss recorded in the prior year period. These increases were partially offset by unfavorable movements related to the economic hedging of interest rate risk within our own debt and the non-recurrence of a $9 million gain recorded during the first quarter of 2020 on the sale of one of our owned retail branch properties.
Operating expenses were lower during the three months ended March 31, 2021 due primarily to the non-recurrence of $97 million of lease impairment and other related costs that were recorded in the first quarter of 2020 related to the consolidation of our retail branch network as part of our Restructuring Plan. Also contributing to the decrease was lower cost allocations from our technology and support service functions. These decreases were partially offset by higher allocated restructuring related costs from HTSU and other HSBC affiliates, primarily severance costs and support service project costs.
Reconciliation of Segment Results As previously discussed, segment results are reported on a Group Reporting Basis. See Note 15, "Business Segments," in the accompanying consolidated financial statements for a reconciliation of our Group Reporting Basis segment results to U.S. GAAP consolidated totals.
Credit Quality
In the normal course of business, we enter into a variety of transactions that involve both on and off-balance sheet credit risk. Principal among these activities is lending to various commercial, institutional, governmental and individual customers. We participate in lending activity throughout the United States and, on a limited basis, internationally.
COVID-19 Loan Forbearance Initiatives We have implemented various loan modification payment deferral programs to provide borrowers relief from the economic impacts of the COVID-19 pandemic. Substantially all of the loans under these programs are not classified as TDR Loans due to our election to suspend TDR Loan classification under the CARES Act or their short-term nature as discussed under the Interagency Statement. In addition, under the Interagency Statement, for COVID-19 related loan modifications in the form of a payment deferral, the borrower’s past due status will not be affected during the deferral period and, if the loan was accruing at the time the relief was granted, the loan will generally not be placed on nonaccrual status as long as the borrower utilizes a payment deferral of six months or less. For consumer mortgage loans, when a borrower utilizes a payment deferral of more than six months, the loan will generally be placed on nonaccrual status and, if the loan does not meet the criteria in the CARES Act, assessed for TDR Loan classification. We have not modified our commercial loan nonaccrual policies as a result of this guidance. These COVID-19 related payment deferral programs could delay the recognition of delinquencies, nonaccrual status, and net charge-offs for those customers who may have otherwise moved into past due or nonaccrual status had such relief not been offered. See "Executive Overview," in this MD&A for additional information.
Allowance for Credit Losses / Liability for Off-Balance Sheet Credit Exposures Our accounting policies and methodologies related to the allowance for credit losses and liability for off-balance sheet credit exposures in prior periods are presented under the caption "Critical Accounting Policies and Estimates" in MD&A and in Note 2, "Summary of Significant Accounting Policies and New Accounting Pronouncements," in our 2020 Form 10-K. Our approach toward credit risk management is summarized under the caption "Risk Management" in MD&A in our 2020 Form 10-K. There have been no significant revisions to our policies or methodologies during the first quarter of 2021.
HSBC USA Inc.
95
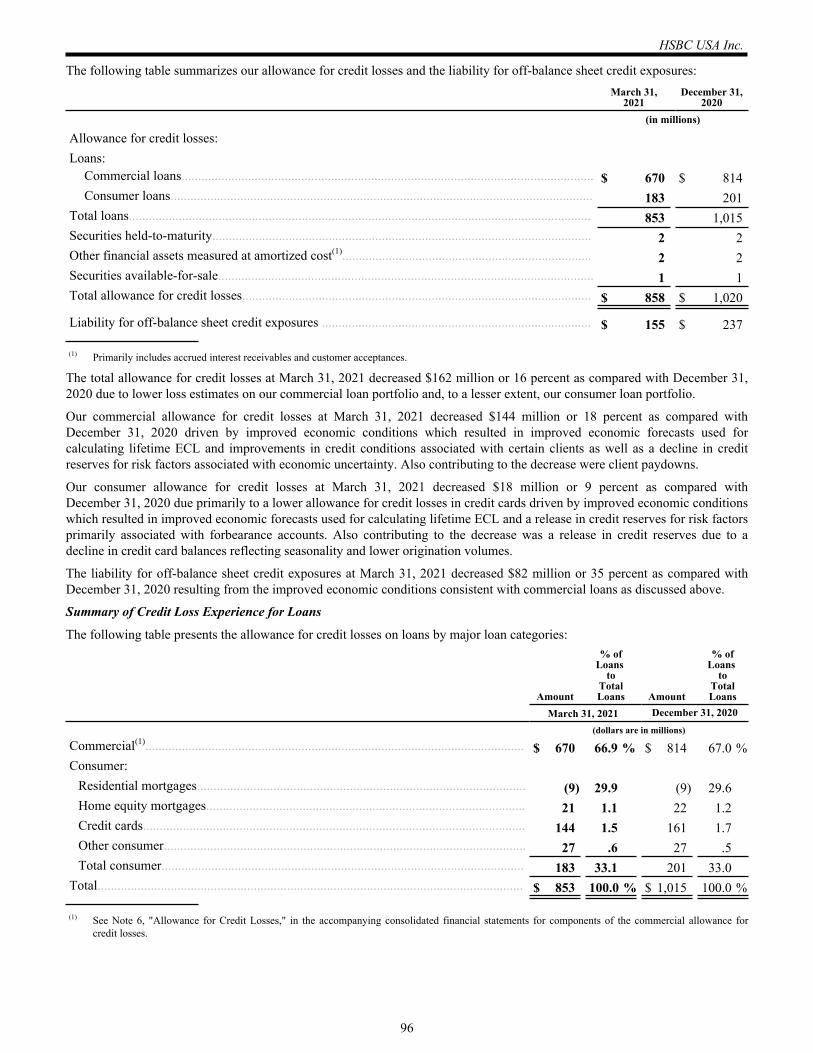
The following table summarizes our allowance for credit losses and the liability for off-balance sheet credit exposures:March 31,
2021December 31,
2020 (in millions)
Allowance for credit losses:Loans:
Commercial loans............................................................................................................................ $ 670 $ 814 Consumer loans............................................................................................................................... 183 201
Total loans........................................................................................................................................... 853 1,015 Securities held-to-maturity.................................................................................................................. 2 2 Other financial assets measured at amortized cost(1)........................................................................... 2 2 Securities available-for-sale................................................................................................................. 1 1 Total allowance for credit losses......................................................................................................... $ 858 $ 1,020
Liability for off-balance sheet credit exposures ................................................................................. $ 155 $ 237
(1) Primarily includes accrued interest receivables and customer acceptances.
The total allowance for credit losses at March 31, 2021 decreased $162 million or 16 percent as compared with December 31, 2020 due to lower loss estimates on our commercial loan portfolio and, to a lesser extent, our consumer loan portfolio.
Our commercial allowance for credit losses at March 31, 2021 decreased $144 million or 18 percent as compared with December 31, 2020 driven by improved economic conditions which resulted in improved economic forecasts used for calculating lifetime ECL and improvements in credit conditions associated with certain clients as well as a decline in credit reserves for risk factors associated with economic uncertainty. Also contributing to the decrease were client paydowns.
Our consumer allowance for credit losses at March 31, 2021 decreased $18 million or 9 percent as compared with December 31, 2020 due primarily to a lower allowance for credit losses in credit cards driven by improved economic conditions which resulted in improved economic forecasts used for calculating lifetime ECL and a release in credit reserves for risk factors primarily associated with forbearance accounts. Also contributing to the decrease was a release in credit reserves due to a decline in credit card balances reflecting seasonality and lower origination volumes.
The liability for off-balance sheet credit exposures at March 31, 2021 decreased $82 million or 35 percent as compared with December 31, 2020 resulting from the improved economic conditions consistent with commercial loans as discussed above.
Summary of Credit Loss Experience for Loans
The following table presents the allowance for credit losses on loans by major loan categories:
Amount
% ofLoans
toTotalLoans Amount
% ofLoans
toTotalLoans
March 31, 2021 December 31, 2020 (dollars are in millions)
Commercial(1).................................................................................................................. $ 670 66.9 % $ 814 67.0 %Consumer:
Residential mortgages................................................................................................... (9) 29.9 (9) 29.6 Home equity mortgages................................................................................................ 21 1.1 22 1.2 Credit cards................................................................................................................... 144 1.5 161 1.7 Other consumer............................................................................................................. 27 .6 27 .5 Total consumer............................................................................................................. 183 33.1 201 33.0
Total................................................................................................................................ $ 853 100.0 % $ 1,015 100.0 %
(1) See Note 6, "Allowance for Credit Losses," in the accompanying consolidated financial statements for components of the commercial allowance for credit losses.
HSBC USA Inc.
96
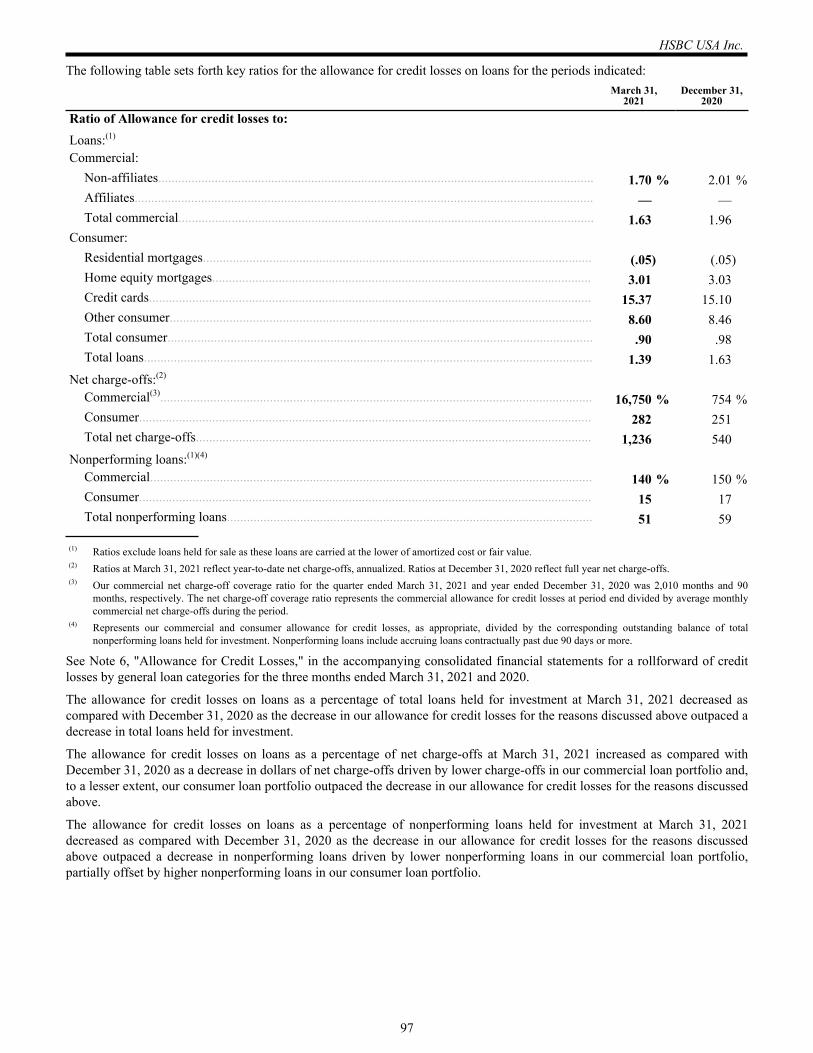
The following table sets forth key ratios for the allowance for credit losses on loans for the periods indicated:March 31,
2021December 31,
2020
Ratio of Allowance for credit losses to:Loans:(1)
Commercial:Non-affiliates................................................................................................................................... 1.70 % 2.01 %Affiliates.......................................................................................................................................... — — Total commercial............................................................................................................................. 1.63 1.96
Consumer:Residential mortgages..................................................................................................................... (.05) (.05) Home equity mortgages.................................................................................................................. 3.01 3.03 Credit cards..................................................................................................................................... 15.37 15.10 Other consumer............................................................................................................................... 8.60 8.46 Total consumer................................................................................................................................ .90 .98 Total loans....................................................................................................................................... 1.39 1.63
Net charge-offs:(2)
Commercial(3).................................................................................................................................. 16,750 % 754 %Consumer........................................................................................................................................ 282 251 Total net charge-offs....................................................................................................................... 1,236 540
Nonperforming loans:(1)(4)
Commercial..................................................................................................................................... 140 % 150 %Consumer........................................................................................................................................ 15 17 Total nonperforming loans.............................................................................................................. 51 59
(1) Ratios exclude loans held for sale as these loans are carried at the lower of amortized cost or fair value.(2) Ratios at March 31, 2021 reflect year-to-date net charge-offs, annualized. Ratios at December 31, 2020 reflect full year net charge-offs.(3) Our commercial net charge-off coverage ratio for the quarter ended March 31, 2021 and year ended December 31, 2020 was 2,010 months and 90
months, respectively. The net charge-off coverage ratio represents the commercial allowance for credit losses at period end divided by average monthly commercial net charge-offs during the period.
(4) Represents our commercial and consumer allowance for credit losses, as appropriate, divided by the corresponding outstanding balance of total nonperforming loans held for investment. Nonperforming loans include accruing loans contractually past due 90 days or more.
See Note 6, "Allowance for Credit Losses," in the accompanying consolidated financial statements for a rollforward of credit losses by general loan categories for the three months ended March 31, 2021 and 2020.
The allowance for credit losses on loans as a percentage of total loans held for investment at March 31, 2021 decreased as compared with December 31, 2020 as the decrease in our allowance for credit losses for the reasons discussed above outpaced a decrease in total loans held for investment.
The allowance for credit losses on loans as a percentage of net charge-offs at March 31, 2021 increased as compared with December 31, 2020 as a decrease in dollars of net charge-offs driven by lower charge-offs in our commercial loan portfolio and, to a lesser extent, our consumer loan portfolio outpaced the decrease in our allowance for credit losses for the reasons discussed above.
The allowance for credit losses on loans as a percentage of nonperforming loans held for investment at March 31, 2021 decreased as compared with December 31, 2020 as the decrease in our allowance for credit losses for the reasons discussed above outpaced a decrease in nonperforming loans driven by lower nonperforming loans in our commercial loan portfolio, partially offset by higher nonperforming loans in our consumer loan portfolio.
HSBC USA Inc.
97
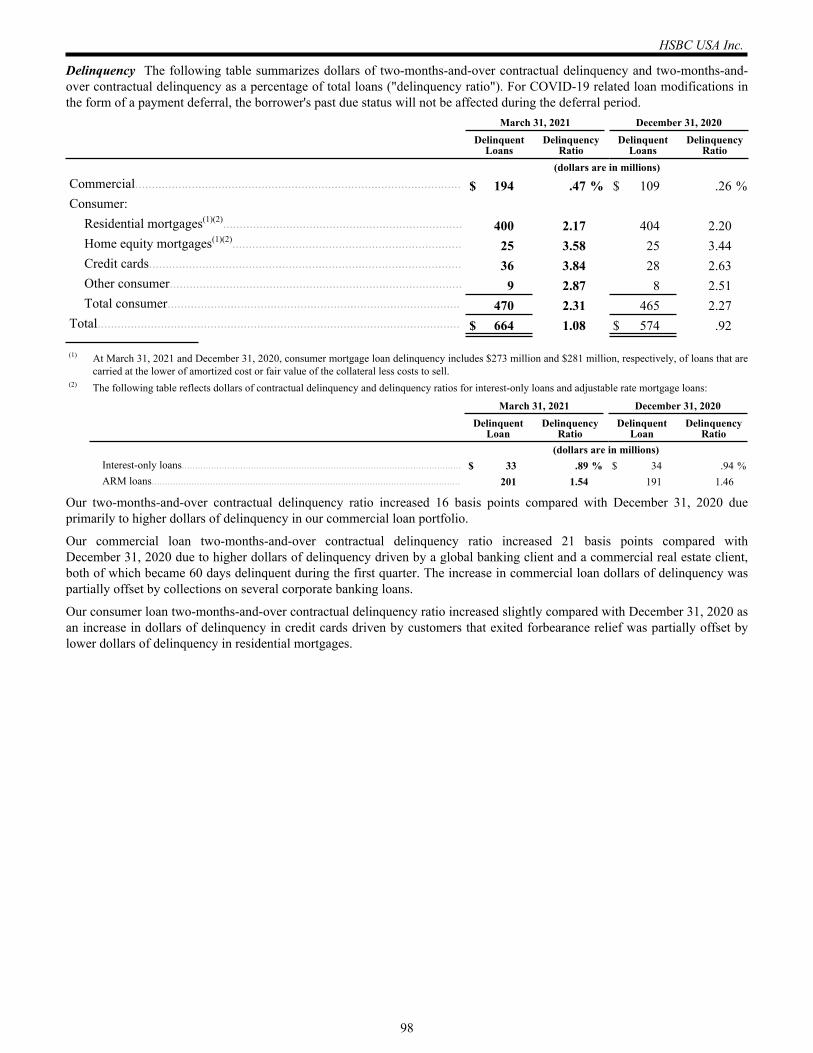
Delinquency The following table summarizes dollars of two-months-and-over contractual delinquency and two-months-and-over contractual delinquency as a percentage of total loans ("delinquency ratio"). For COVID-19 related loan modifications in the form of a payment deferral, the borrower's past due status will not be affected during the deferral period. March 31, 2021 December 31, 2020
Delinquent
LoansDelinquency
RatioDelinquent
LoansDelinquency
Ratio (dollars are in millions)Commercial.................................................................................................. $ 194 .47 % $ 109 .26 %Consumer:
Residential mortgages(1)(2)........................................................................ 400 2.17 404 2.20 Home equity mortgages(1)(2)..................................................................... 25 3.58 25 3.44 Credit cards.............................................................................................. 36 3.84 28 2.63 Other consumer........................................................................................ 9 2.87 8 2.51 Total consumer........................................................................................ 470 2.31 465 2.27
Total............................................................................................................. $ 664 1.08 $ 574 .92
(1) At March 31, 2021 and December 31, 2020, consumer mortgage loan delinquency includes $273 million and $281 million, respectively, of loans that are carried at the lower of amortized cost or fair value of the collateral less costs to sell.
(2) The following table reflects dollars of contractual delinquency and delinquency ratios for interest-only loans and adjustable rate mortgage loans:
March 31, 2021 December 31, 2020Delinquent
LoanDelinquency
RatioDelinquent
LoanDelinquency
Ratio (dollars are in millions)
Interest-only loans......................................................................................................... $ 33 .89 % $ 34 .94 %ARM loans.................................................................................................................... 201 1.54 191 1.46
Our two-months-and-over contractual delinquency ratio increased 16 basis points compared with December 31, 2020 due primarily to higher dollars of delinquency in our commercial loan portfolio.
Our commercial loan two-months-and-over contractual delinquency ratio increased 21 basis points compared with December 31, 2020 due to higher dollars of delinquency driven by a global banking client and a commercial real estate client, both of which became 60 days delinquent during the first quarter. The increase in commercial loan dollars of delinquency was partially offset by collections on several corporate banking loans.
Our consumer loan two-months-and-over contractual delinquency ratio increased slightly compared with December 31, 2020 as an increase in dollars of delinquency in credit cards driven by customers that exited forbearance relief was partially offset by lower dollars of delinquency in residential mortgages.
HSBC USA Inc.
98
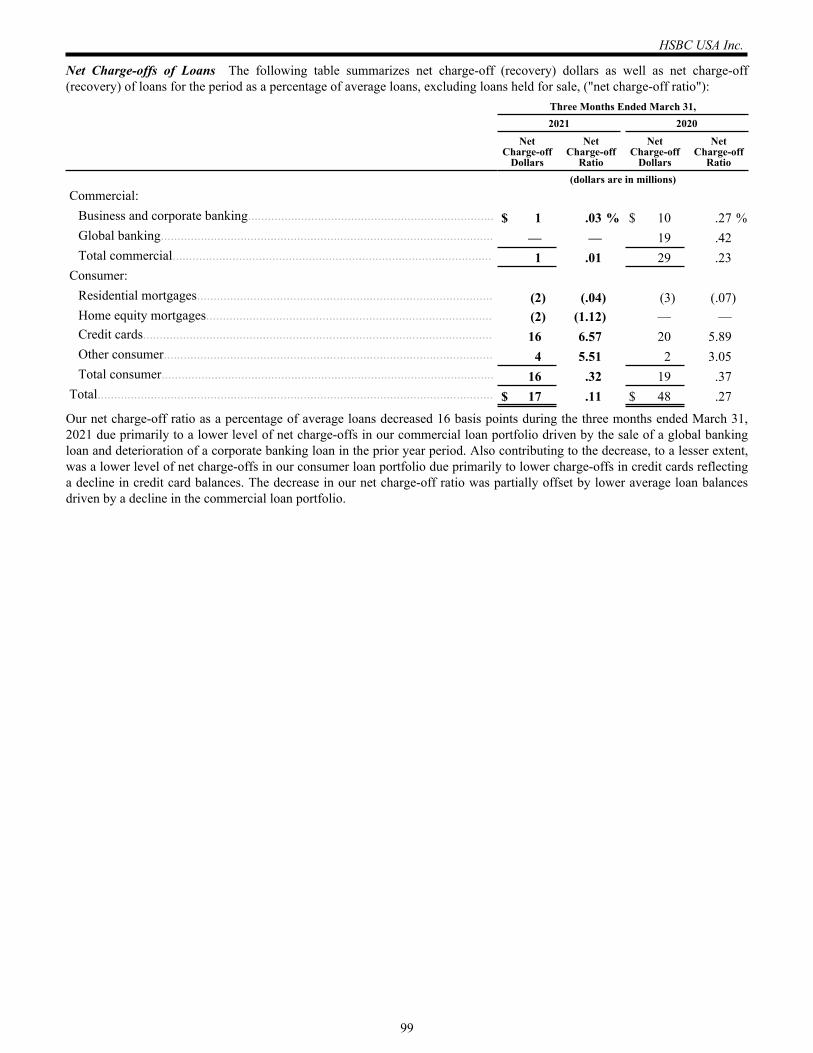
Net Charge-offs of Loans The following table summarizes net charge-off (recovery) dollars as well as net charge-off (recovery) of loans for the period as a percentage of average loans, excluding loans held for sale, ("net charge-off ratio"):
Commercial:Business and corporate banking.......................................................................... $ 1 .03 % $ 10 .27 %Global banking.................................................................................................... — — 19 .42 Total commercial................................................................................................ 1 .01 29 .23
Consumer:Residential mortgages......................................................................................... (2) (.04) (3) (.07) Home equity mortgages...................................................................................... (2) (1.12) — — Credit cards......................................................................................................... 16 6.57 20 5.89 Other consumer................................................................................................... 4 5.51 2 3.05 Total consumer.................................................................................................... 16 .32 19 .37
Total....................................................................................................................... $ 17 .11 $ 48 .27
Three Months Ended March 31,2021 2020
NetCharge-off
Dollars
NetCharge-off
Ratio
NetCharge-off
Dollars
NetCharge-off
Ratio (dollars are in millions)
Our net charge-off ratio as a percentage of average loans decreased 16 basis points during the three months ended March 31, 2021 due primarily to a lower level of net charge-offs in our commercial loan portfolio driven by the sale of a global banking loan and deterioration of a corporate banking loan in the prior year period. Also contributing to the decrease, to a lesser extent, was a lower level of net charge-offs in our consumer loan portfolio due primarily to lower charge-offs in credit cards reflecting a decline in credit card balances. The decrease in our net charge-off ratio was partially offset by lower average loan balances driven by a decline in the commercial loan portfolio.
HSBC USA Inc.
99
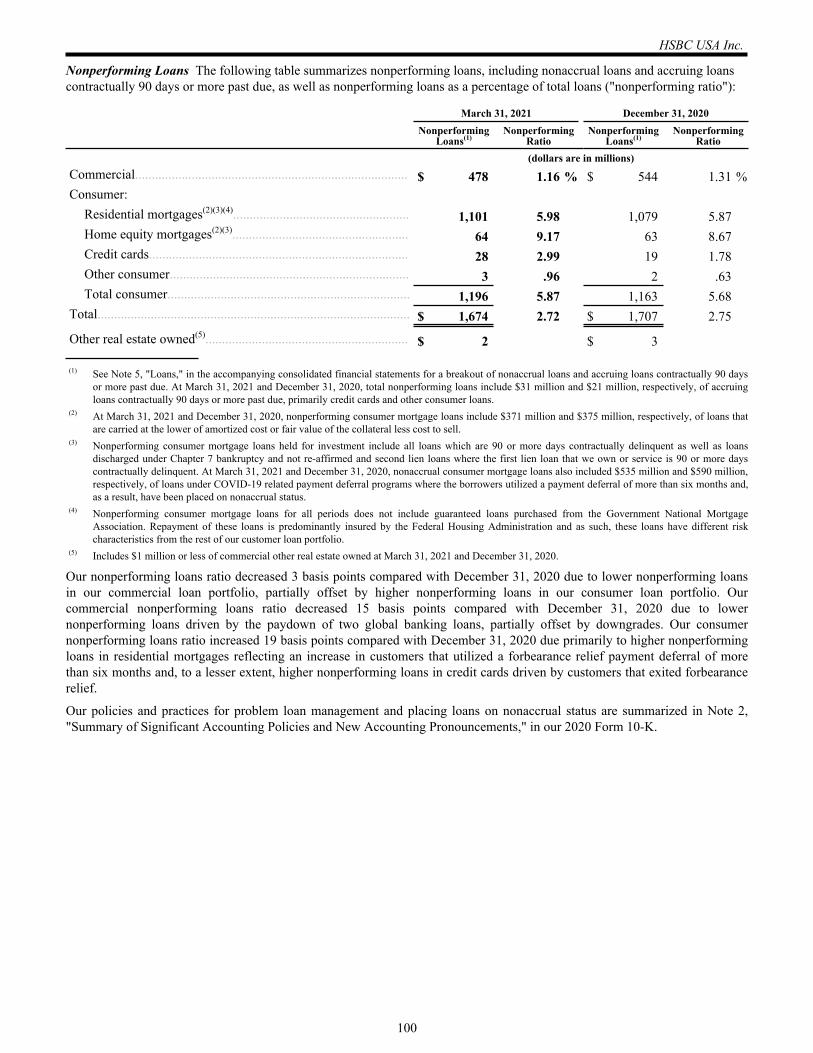
Nonperforming Loans The following table summarizes nonperforming loans, including nonaccrual loans and accruing loans contractually 90 days or more past due, as well as nonperforming loans as a percentage of total loans ("nonperforming ratio"):
March 31, 2021 December 31, 2020Nonperforming
Loans(1)Nonperforming
RatioNonperforming
Loans(1)Nonperforming
Ratio (dollars are in millions)Commercial.................................................................................. $ 478 1.16 % $ 544 1.31 %Consumer:
Residential mortgages(2)(3)(4)..................................................... 1,101 5.98 1,079 5.87 Home equity mortgages(2)(3)..................................................... 64 9.17 63 8.67 Credit cards.............................................................................. 28 2.99 19 1.78 Other consumer........................................................................ 3 .96 2 .63 Total consumer......................................................................... 1,196 5.87 1,163 5.68
Total.............................................................................................. $ 1,674 2.72 $ 1,707 2.75
Other real estate owned(5)............................................................. $ 2 $ 3
(1) See Note 5, "Loans," in the accompanying consolidated financial statements for a breakout of nonaccrual loans and accruing loans contractually 90 days or more past due. At March 31, 2021 and December 31, 2020, total nonperforming loans include $31 million and $21 million, respectively, of accruing loans contractually 90 days or more past due, primarily credit cards and other consumer loans.
(2) At March 31, 2021 and December 31, 2020, nonperforming consumer mortgage loans include $371 million and $375 million, respectively, of loans that are carried at the lower of amortized cost or fair value of the collateral less cost to sell.
(3) Nonperforming consumer mortgage loans held for investment include all loans which are 90 or more days contractually delinquent as well as loans discharged under Chapter 7 bankruptcy and not re-affirmed and second lien loans where the first lien loan that we own or service is 90 or more days contractually delinquent. At March 31, 2021 and December 31, 2020, nonaccrual consumer mortgage loans also included $535 million and $590 million, respectively, of loans under COVID-19 related payment deferral programs where the borrowers utilized a payment deferral of more than six months and, as a result, have been placed on nonaccrual status.
(4) Nonperforming consumer mortgage loans for all periods does not include guaranteed loans purchased from the Government National Mortgage Association. Repayment of these loans is predominantly insured by the Federal Housing Administration and as such, these loans have different risk characteristics from the rest of our customer loan portfolio.
(5) Includes $1 million or less of commercial other real estate owned at March 31, 2021 and December 31, 2020.
Our nonperforming loans ratio decreased 3 basis points compared with December 31, 2020 due to lower nonperforming loans in our commercial loan portfolio, partially offset by higher nonperforming loans in our consumer loan portfolio. Our commercial nonperforming loans ratio decreased 15 basis points compared with December 31, 2020 due to lower nonperforming loans driven by the paydown of two global banking loans, partially offset by downgrades. Our consumer nonperforming loans ratio increased 19 basis points compared with December 31, 2020 due primarily to higher nonperforming loans in residential mortgages reflecting an increase in customers that utilized a forbearance relief payment deferral of more than six months and, to a lesser extent, higher nonperforming loans in credit cards driven by customers that exited forbearance relief.
Our policies and practices for problem loan management and placing loans on nonaccrual status are summarized in Note 2, "Summary of Significant Accounting Policies and New Accounting Pronouncements," in our 2020 Form 10-K.
HSBC USA Inc.
100
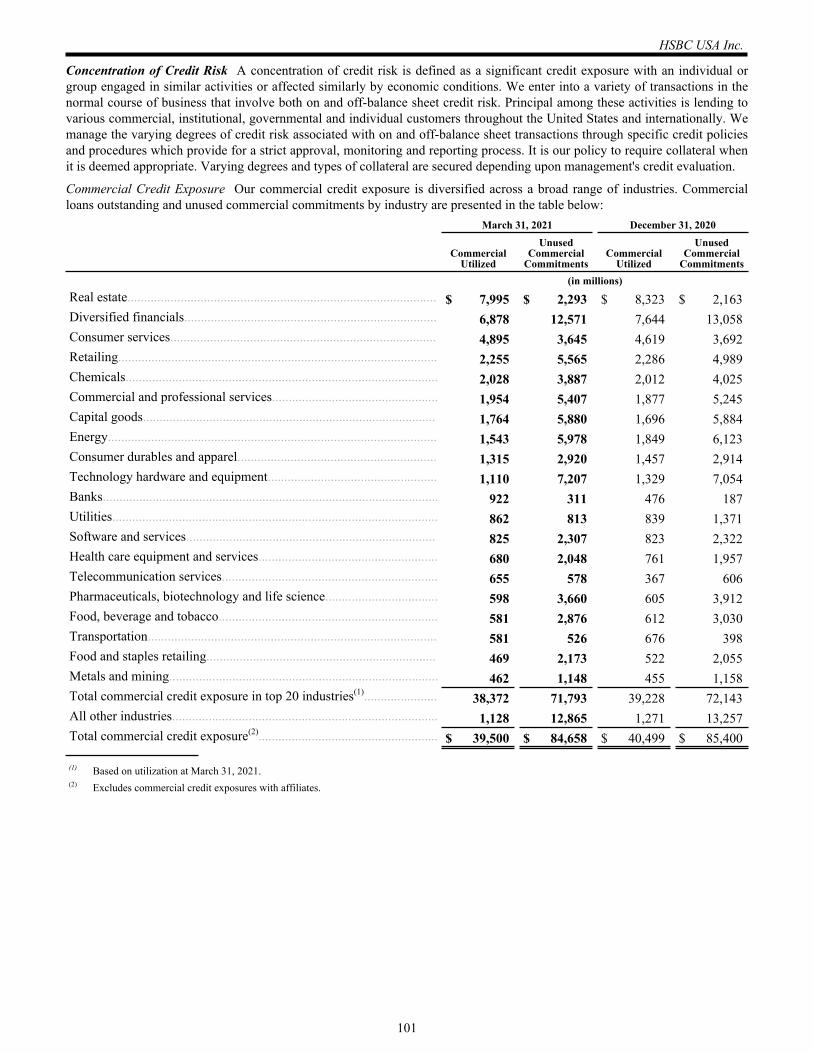
Concentration of Credit Risk A concentration of credit risk is defined as a significant credit exposure with an individual or group engaged in similar activities or affected similarly by economic conditions. We enter into a variety of transactions in the normal course of business that involve both on and off-balance sheet credit risk. Principal among these activities is lending to various commercial, institutional, governmental and individual customers throughout the United States and internationally. We manage the varying degrees of credit risk associated with on and off-balance sheet transactions through specific credit policies and procedures which provide for a strict approval, monitoring and reporting process. It is our policy to require collateral when it is deemed appropriate. Varying degrees and types of collateral are secured depending upon management's credit evaluation.
Commercial Credit Exposure Our commercial credit exposure is diversified across a broad range of industries. Commercial loans outstanding and unused commercial commitments by industry are presented in the table below:
March 31, 2021 December 31, 2020
Commercial Utilized
Unused Commercial
CommitmentsCommercial
Utilized
Unused Commercial
Commitments (in millions)Real estate............................................................................................. $ 7,995 $ 2,293 $ 8,323 $ 2,163 Diversified financials............................................................................ 6,878 12,571 7,644 13,058 Consumer services................................................................................ 4,895 3,645 4,619 3,692 Retailing................................................................................................ 2,255 5,565 2,286 4,989 Chemicals.............................................................................................. 2,028 3,887 2,012 4,025 Commercial and professional services.................................................. 1,954 5,407 1,877 5,245 Capital goods........................................................................................ 1,764 5,880 1,696 5,884 Energy................................................................................................... 1,543 5,978 1,849 6,123 Consumer durables and apparel............................................................ 1,315 2,920 1,457 2,914 Technology hardware and equipment................................................... 1,110 7,207 1,329 7,054 Banks..................................................................................................... 922 311 476 187 Utilities.................................................................................................. 862 813 839 1,371 Software and services........................................................................... 825 2,307 823 2,322 Health care equipment and services...................................................... 680 2,048 761 1,957 Telecommunication services................................................................. 655 578 367 606 Pharmaceuticals, biotechnology and life science.................................. 598 3,660 605 3,912 Food, beverage and tobacco.................................................................. 581 2,876 612 3,030 Transportation....................................................................................... 581 526 676 398 Food and staples retailing..................................................................... 469 2,173 522 2,055 Metals and mining................................................................................. 462 1,148 455 1,158 Total commercial credit exposure in top 20 industries(1)...................... 38,372 71,793 39,228 72,143 All other industries................................................................................ 1,128 12,865 1,271 13,257 Total commercial credit exposure(2)...................................................... $ 39,500 $ 84,658 $ 40,499 $ 85,400
(1) Based on utilization at March 31, 2021.(2) Excludes commercial credit exposures with affiliates.
HSBC USA Inc.
101
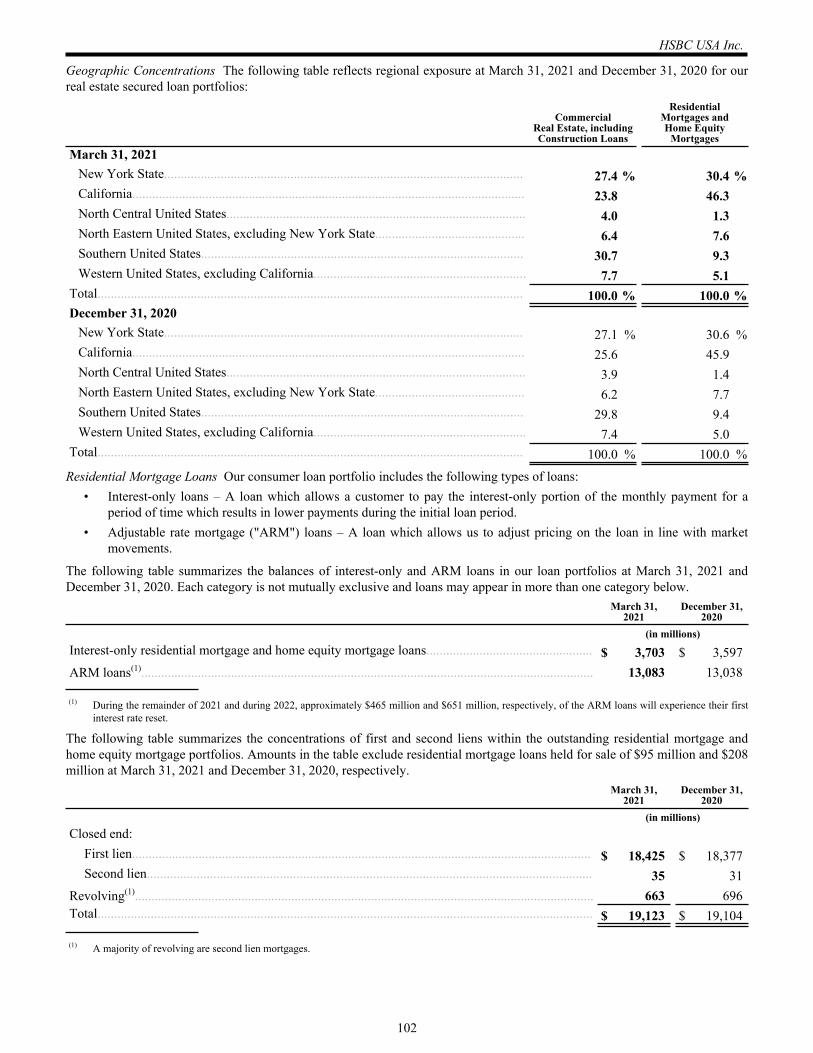
Geographic Concentrations The following table reflects regional exposure at March 31, 2021 and December 31, 2020 for our real estate secured loan portfolios:
CommercialReal Estate, including Construction Loans
ResidentialMortgages and Home Equity
MortgagesMarch 31, 2021
New York State............................................................................................................ 27.4 % 30.4 %California...................................................................................................................... 23.8 46.3 North Central United States.......................................................................................... 4.0 1.3 North Eastern United States, excluding New York State............................................. 6.4 7.6 Southern United States................................................................................................. 30.7 9.3 Western United States, excluding California................................................................ 7.7 5.1
Total................................................................................................................................ 100.0 % 100.0 %December 31, 2020
New York State............................................................................................................ 27.1 % 30.6 %California...................................................................................................................... 25.6 45.9 North Central United States.......................................................................................... 3.9 1.4 North Eastern United States, excluding New York State............................................. 6.2 7.7 Southern United States................................................................................................. 29.8 9.4 Western United States, excluding California................................................................ 7.4 5.0
Total................................................................................................................................ 100.0 % 100.0 %
Residential Mortgage Loans Our consumer loan portfolio includes the following types of loans:• Interest-only loans – A loan which allows a customer to pay the interest-only portion of the monthly payment for a
period of time which results in lower payments during the initial loan period. • Adjustable rate mortgage ("ARM") loans – A loan which allows us to adjust pricing on the loan in line with market
movements.
The following table summarizes the balances of interest-only and ARM loans in our loan portfolios at March 31, 2021 and December 31, 2020. Each category is not mutually exclusive and loans may appear in more than one category below.
March 31, 2021
December 31, 2020
(in millions)Interest-only residential mortgage and home equity mortgage loans.................................................. $ 3,703 $ 3,597 ARM loans(1)........................................................................................................................................ 13,083 13,038
(1) During the remainder of 2021 and during 2022, approximately $465 million and $651 million, respectively, of the ARM loans will experience their first interest rate reset.
The following table summarizes the concentrations of first and second liens within the outstanding residential mortgage and home equity mortgage portfolios. Amounts in the table exclude residential mortgage loans held for sale of $95 million and $208 million at March 31, 2021 and December 31, 2020, respectively.
March 31, 2021
December 31, 2020
(in millions)Closed end:
First lien.......................................................................................................................................... $ 18,425 $ 18,377 Second lien...................................................................................................................................... 35 31
Revolving(1).......................................................................................................................................... 663 696 Total..................................................................................................................................................... $ 19,123 $ 19,104
(1) A majority of revolving are second lien mortgages.
HSBC USA Inc.
102
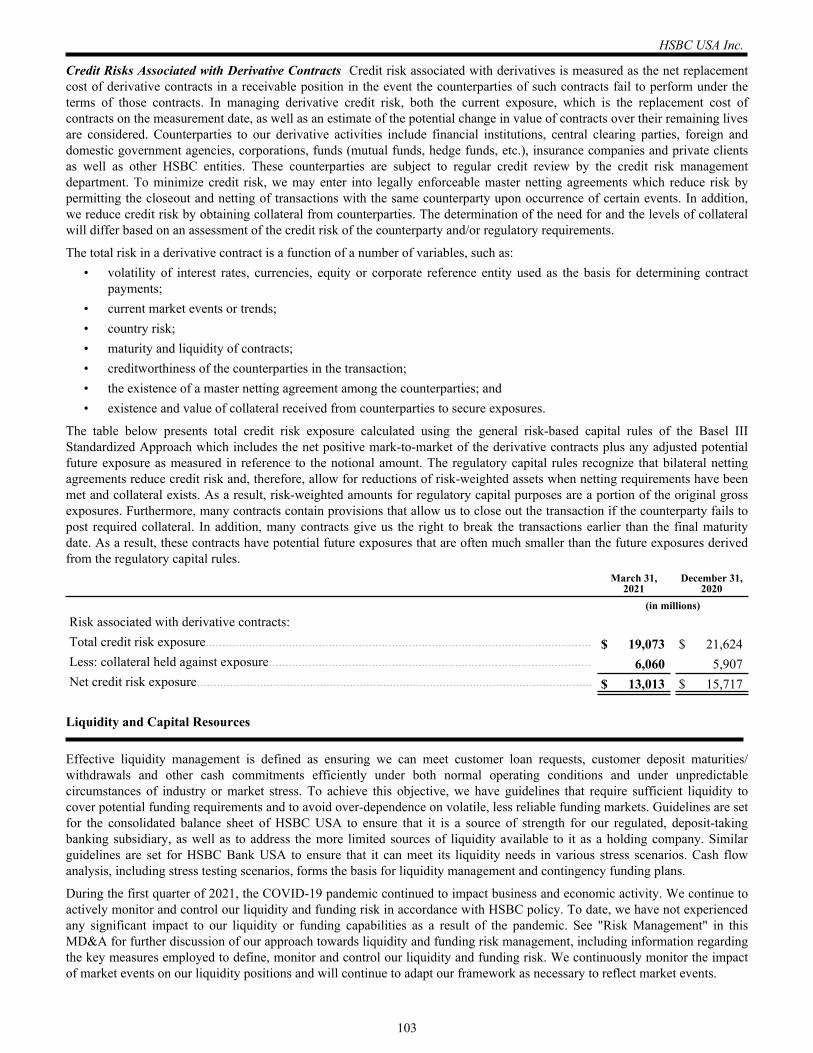
Credit Risks Associated with Derivative Contracts Credit risk associated with derivatives is measured as the net replacement cost of derivative contracts in a receivable position in the event the counterparties of such contracts fail to perform under the terms of those contracts. In managing derivative credit risk, both the current exposure, which is the replacement cost of contracts on the measurement date, as well as an estimate of the potential change in value of contracts over their remaining lives are considered. Counterparties to our derivative activities include financial institutions, central clearing parties, foreign and domestic government agencies, corporations, funds (mutual funds, hedge funds, etc.), insurance companies and private clients as well as other HSBC entities. These counterparties are subject to regular credit review by the credit risk management department. To minimize credit risk, we may enter into legally enforceable master netting agreements which reduce risk by permitting the closeout and netting of transactions with the same counterparty upon occurrence of certain events. In addition, we reduce credit risk by obtaining collateral from counterparties. The determination of the need for and the levels of collateral will differ based on an assessment of the credit risk of the counterparty and/or regulatory requirements.
The total risk in a derivative contract is a function of a number of variables, such as:• volatility of interest rates, currencies, equity or corporate reference entity used as the basis for determining contract
payments;• current market events or trends;• country risk;• maturity and liquidity of contracts;• creditworthiness of the counterparties in the transaction;• the existence of a master netting agreement among the counterparties; and• existence and value of collateral received from counterparties to secure exposures.
The table below presents total credit risk exposure calculated using the general risk-based capital rules of the Basel III Standardized Approach which includes the net positive mark-to-market of the derivative contracts plus any adjusted potential future exposure as measured in reference to the notional amount. The regulatory capital rules recognize that bilateral netting agreements reduce credit risk and, therefore, allow for reductions of risk-weighted assets when netting requirements have been met and collateral exists. As a result, risk-weighted amounts for regulatory capital purposes are a portion of the original gross exposures. Furthermore, many contracts contain provisions that allow us to close out the transaction if the counterparty fails to post required collateral. In addition, many contracts give us the right to break the transactions earlier than the final maturity date. As a result, these contracts have potential future exposures that are often much smaller than the future exposures derived from the regulatory capital rules.
March 31, 2021
December 31, 2020
(in millions)Risk associated with derivative contracts:Total credit risk exposure.................................................................................................................... $ 19,073 $ 21,624 Less: collateral held against exposure................................................................................................. 6,060 5,907 Net credit risk exposure....................................................................................................................... $ 13,013 $ 15,717
Liquidity and Capital Resources
Effective liquidity management is defined as ensuring we can meet customer loan requests, customer deposit maturities/withdrawals and other cash commitments efficiently under both normal operating conditions and under unpredictable circumstances of industry or market stress. To achieve this objective, we have guidelines that require sufficient liquidity to cover potential funding requirements and to avoid over-dependence on volatile, less reliable funding markets. Guidelines are set for the consolidated balance sheet of HSBC USA to ensure that it is a source of strength for our regulated, deposit-taking banking subsidiary, as well as to address the more limited sources of liquidity available to it as a holding company. Similar guidelines are set for HSBC Bank USA to ensure that it can meet its liquidity needs in various stress scenarios. Cash flow analysis, including stress testing scenarios, forms the basis for liquidity management and contingency funding plans.
During the first quarter of 2021, the COVID-19 pandemic continued to impact business and economic activity. We continue to actively monitor and control our liquidity and funding risk in accordance with HSBC policy. To date, we have not experienced any significant impact to our liquidity or funding capabilities as a result of the pandemic. See "Risk Management" in this MD&A for further discussion of our approach towards liquidity and funding risk management, including information regarding the key measures employed to define, monitor and control our liquidity and funding risk. We continuously monitor the impact of market events on our liquidity positions and will continue to adapt our framework as necessary to reflect market events.
HSBC USA Inc.
103
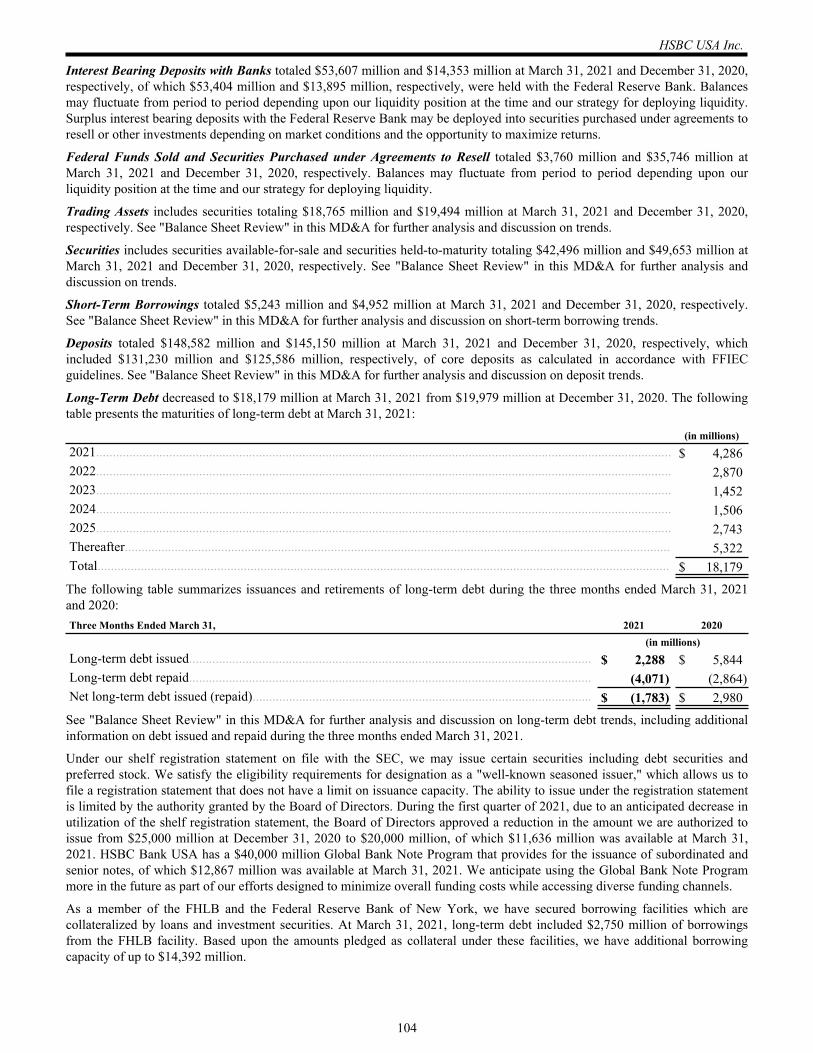
Interest Bearing Deposits with Banks totaled $53,607 million and $14,353 million at March 31, 2021 and December 31, 2020, respectively, of which $53,404 million and $13,895 million, respectively, were held with the Federal Reserve Bank. Balances may fluctuate from period to period depending upon our liquidity position at the time and our strategy for deploying liquidity. Surplus interest bearing deposits with the Federal Reserve Bank may be deployed into securities purchased under agreements to resell or other investments depending on market conditions and the opportunity to maximize returns.
Federal Funds Sold and Securities Purchased under Agreements to Resell totaled $3,760 million and $35,746 million at March 31, 2021 and December 31, 2020, respectively. Balances may fluctuate from period to period depending upon our liquidity position at the time and our strategy for deploying liquidity.
Trading Assets includes securities totaling $18,765 million and $19,494 million at March 31, 2021 and December 31, 2020, respectively. See "Balance Sheet Review" in this MD&A for further analysis and discussion on trends.
Securities includes securities available-for-sale and securities held-to-maturity totaling $42,496 million and $49,653 million at March 31, 2021 and December 31, 2020, respectively. See "Balance Sheet Review" in this MD&A for further analysis and discussion on trends.
Short-Term Borrowings totaled $5,243 million and $4,952 million at March 31, 2021 and December 31, 2020, respectively. See "Balance Sheet Review" in this MD&A for further analysis and discussion on short-term borrowing trends.
Deposits totaled $148,582 million and $145,150 million at March 31, 2021 and December 31, 2020, respectively, which included $131,230 million and $125,586 million, respectively, of core deposits as calculated in accordance with FFIEC guidelines. See "Balance Sheet Review" in this MD&A for further analysis and discussion on deposit trends.
Long-Term Debt decreased to $18,179 million at March 31, 2021 from $19,979 million at December 31, 2020. The following table presents the maturities of long-term debt at March 31, 2021: (in millions)2021............................................................................................................................................................................. $ 4,286 2022............................................................................................................................................................................. 2,870 2023............................................................................................................................................................................. 1,452 2024............................................................................................................................................................................. 1,506 2025............................................................................................................................................................................. 2,743 Thereafter.................................................................................................................................................................... 5,322 Total............................................................................................................................................................................ $ 18,179
The following table summarizes issuances and retirements of long-term debt during the three months ended March 31, 2021 and 2020:Three Months Ended March 31, 2021 2020 (in millions)Long-term debt issued......................................................................................................................... $ 2,288 $ 5,844 Long-term debt repaid......................................................................................................................... (4,071) (2,864) Net long-term debt issued (repaid)...................................................................................................... $ (1,783) $ 2,980
See "Balance Sheet Review" in this MD&A for further analysis and discussion on long-term debt trends, including additional information on debt issued and repaid during the three months ended March 31, 2021.
Under our shelf registration statement on file with the SEC, we may issue certain securities including debt securities and preferred stock. We satisfy the eligibility requirements for designation as a "well-known seasoned issuer," which allows us to file a registration statement that does not have a limit on issuance capacity. The ability to issue under the registration statement is limited by the authority granted by the Board of Directors. During the first quarter of 2021, due to an anticipated decrease in utilization of the shelf registration statement, the Board of Directors approved a reduction in the amount we are authorized to issue from $25,000 million at December 31, 2020 to $20,000 million, of which $11,636 million was available at March 31, 2021. HSBC Bank USA has a $40,000 million Global Bank Note Program that provides for the issuance of subordinated and senior notes, of which $12,867 million was available at March 31, 2021. We anticipate using the Global Bank Note Program more in the future as part of our efforts designed to minimize overall funding costs while accessing diverse funding channels.
As a member of the FHLB and the Federal Reserve Bank of New York, we have secured borrowing facilities which are collateralized by loans and investment securities. At March 31, 2021, long-term debt included $2,750 million of borrowings from the FHLB facility. Based upon the amounts pledged as collateral under these facilities, we have additional borrowing capacity of up to $14,392 million.
HSBC USA Inc.
104
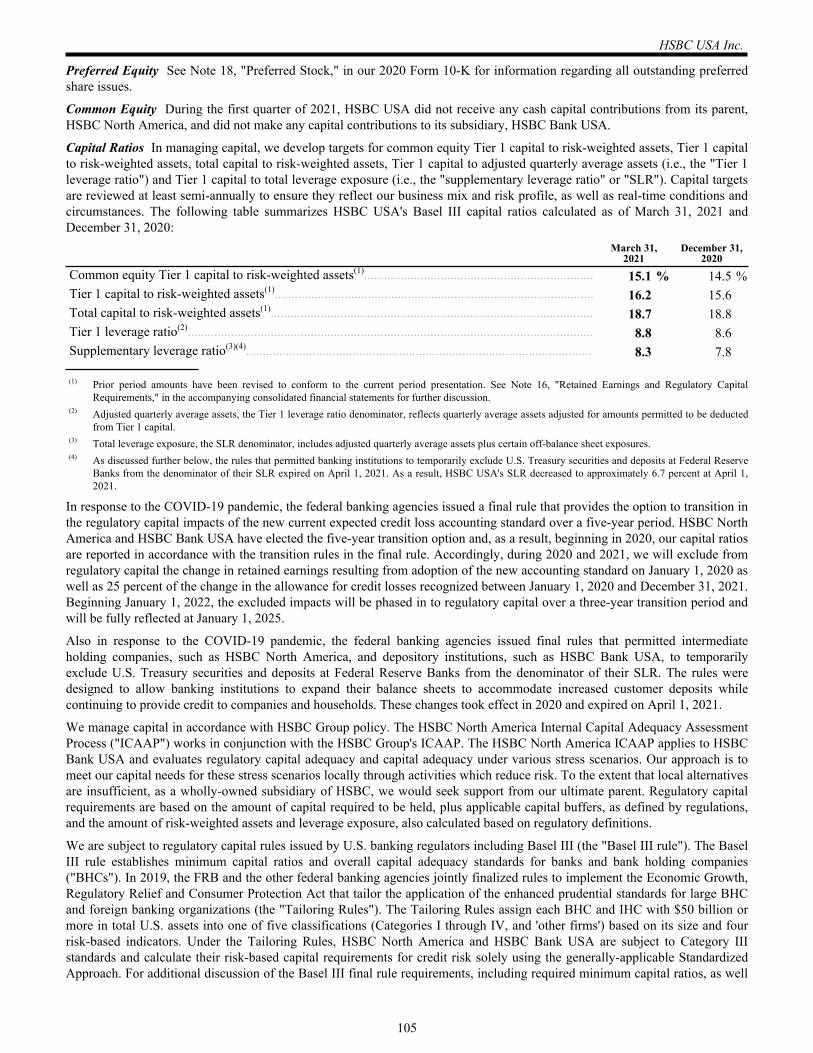
Preferred Equity See Note 18, "Preferred Stock," in our 2020 Form 10-K for information regarding all outstanding preferred share issues.
Common Equity During the first quarter of 2021, HSBC USA did not receive any cash capital contributions from its parent, HSBC North America, and did not make any capital contributions to its subsidiary, HSBC Bank USA.
Capital Ratios In managing capital, we develop targets for common equity Tier 1 capital to risk-weighted assets, Tier 1 capital to risk-weighted assets, total capital to risk-weighted assets, Tier 1 capital to adjusted quarterly average assets (i.e., the "Tier 1 leverage ratio") and Tier 1 capital to total leverage exposure (i.e., the "supplementary leverage ratio" or "SLR"). Capital targets are reviewed at least semi-annually to ensure they reflect our business mix and risk profile, as well as real-time conditions and circumstances. The following table summarizes HSBC USA's Basel III capital ratios calculated as of March 31, 2021 and December 31, 2020:
March 31, 2021
December 31, 2020
Common equity Tier 1 capital to risk-weighted assets(1)..................................................................... 15.1 % 14.5 %Tier 1 capital to risk-weighted assets(1)................................................................................................ 16.2 15.6 Total capital to risk-weighted assets(1)................................................................................................. 18.7 18.8 Tier 1 leverage ratio(2).......................................................................................................................... 8.8 8.6 Supplementary leverage ratio(3)(4)........................................................................................................ 8.3 7.8
(1) Prior period amounts have been revised to conform to the current period presentation. See Note 16, "Retained Earnings and Regulatory Capital Requirements," in the accompanying consolidated financial statements for further discussion.
(2) Adjusted quarterly average assets, the Tier 1 leverage ratio denominator, reflects quarterly average assets adjusted for amounts permitted to be deducted from Tier 1 capital.
(3) Total leverage exposure, the SLR denominator, includes adjusted quarterly average assets plus certain off-balance sheet exposures.(4) As discussed further below, the rules that permitted banking institutions to temporarily exclude U.S. Treasury securities and deposits at Federal Reserve
Banks from the denominator of their SLR expired on April 1, 2021. As a result, HSBC USA's SLR decreased to approximately 6.7 percent at April 1, 2021.
In response to the COVID-19 pandemic, the federal banking agencies issued a final rule that provides the option to transition in the regulatory capital impacts of the new current expected credit loss accounting standard over a five-year period. HSBC North America and HSBC Bank USA have elected the five-year transition option and, as a result, beginning in 2020, our capital ratios are reported in accordance with the transition rules in the final rule. Accordingly, during 2020 and 2021, we will exclude from regulatory capital the change in retained earnings resulting from adoption of the new accounting standard on January 1, 2020 as well as 25 percent of the change in the allowance for credit losses recognized between January 1, 2020 and December 31, 2021. Beginning January 1, 2022, the excluded impacts will be phased in to regulatory capital over a three-year transition period and will be fully reflected at January 1, 2025.
Also in response to the COVID-19 pandemic, the federal banking agencies issued final rules that permitted intermediate holding companies, such as HSBC North America, and depository institutions, such as HSBC Bank USA, to temporarily exclude U.S. Treasury securities and deposits at Federal Reserve Banks from the denominator of their SLR. The rules were designed to allow banking institutions to expand their balance sheets to accommodate increased customer deposits while continuing to provide credit to companies and households. These changes took effect in 2020 and expired on April 1, 2021.
We manage capital in accordance with HSBC Group policy. The HSBC North America Internal Capital Adequacy Assessment Process ("ICAAP") works in conjunction with the HSBC Group's ICAAP. The HSBC North America ICAAP applies to HSBC Bank USA and evaluates regulatory capital adequacy and capital adequacy under various stress scenarios. Our approach is to meet our capital needs for these stress scenarios locally through activities which reduce risk. To the extent that local alternatives are insufficient, as a wholly-owned subsidiary of HSBC, we would seek support from our ultimate parent. Regulatory capital requirements are based on the amount of capital required to be held, plus applicable capital buffers, as defined by regulations, and the amount of risk-weighted assets and leverage exposure, also calculated based on regulatory definitions.
We are subject to regulatory capital rules issued by U.S. banking regulators including Basel III (the "Basel III rule"). The Basel III rule establishes minimum capital ratios and overall capital adequacy standards for banks and bank holding companies ("BHCs"). In 2019, the FRB and the other federal banking agencies jointly finalized rules to implement the Economic Growth, Regulatory Relief and Consumer Protection Act that tailor the application of the enhanced prudential standards for large BHC and foreign banking organizations (the "Tailoring Rules"). The Tailoring Rules assign each BHC and IHC with $50 billion or more in total U.S. assets into one of five classifications (Categories I through IV, and 'other firms') based on its size and four risk-based indicators. Under the Tailoring Rules, HSBC North America and HSBC Bank USA are subject to Category III standards and calculate their risk-based capital requirements for credit risk solely using the generally-applicable Standardized Approach. For additional discussion of the Basel III final rule requirements, including required minimum capital ratios, as well
HSBC USA Inc.
105
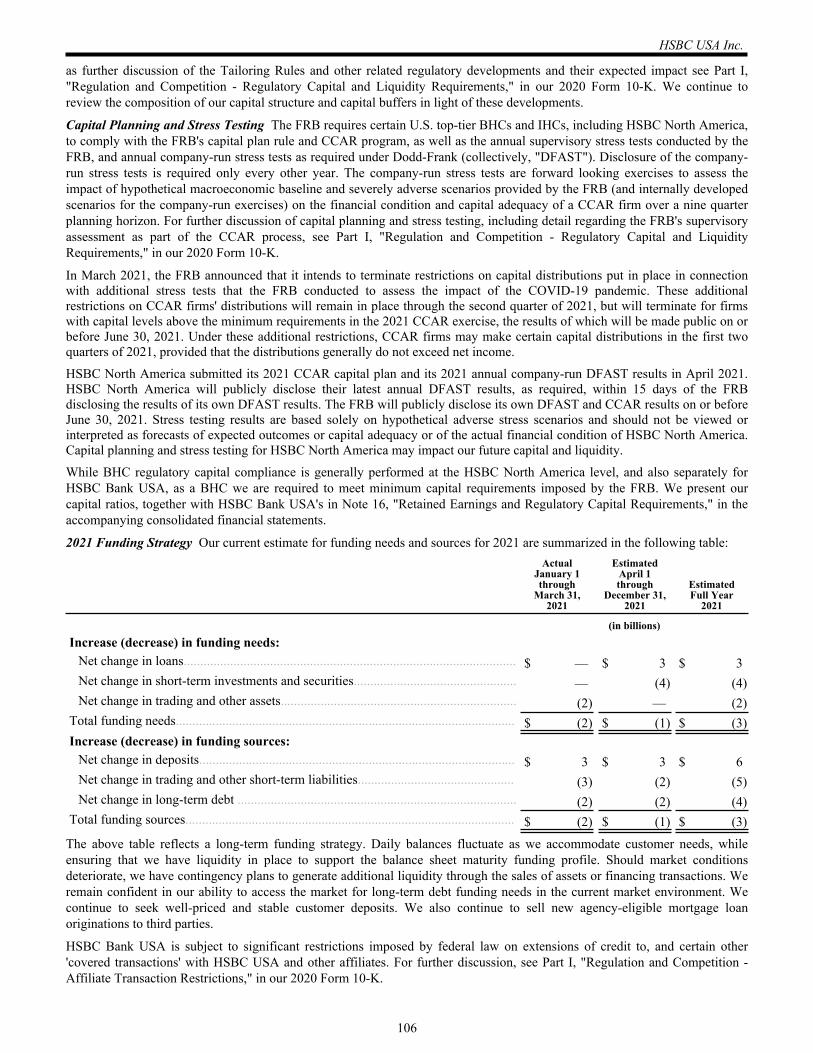
as further discussion of the Tailoring Rules and other related regulatory developments and their expected impact see Part I, "Regulation and Competition - Regulatory Capital and Liquidity Requirements," in our 2020 Form 10-K. We continue to review the composition of our capital structure and capital buffers in light of these developments.
Capital Planning and Stress Testing The FRB requires certain U.S. top-tier BHCs and IHCs, including HSBC North America, to comply with the FRB's capital plan rule and CCAR program, as well as the annual supervisory stress tests conducted by the FRB, and annual company-run stress tests as required under Dodd-Frank (collectively, "DFAST"). Disclosure of the company-run stress tests is required only every other year. The company-run stress tests are forward looking exercises to assess the impact of hypothetical macroeconomic baseline and severely adverse scenarios provided by the FRB (and internally developed scenarios for the company-run exercises) on the financial condition and capital adequacy of a CCAR firm over a nine quarter planning horizon. For further discussion of capital planning and stress testing, including detail regarding the FRB's supervisory assessment as part of the CCAR process, see Part I, "Regulation and Competition - Regulatory Capital and Liquidity Requirements," in our 2020 Form 10-K.
In March 2021, the FRB announced that it intends to terminate restrictions on capital distributions put in place in connection with additional stress tests that the FRB conducted to assess the impact of the COVID-19 pandemic. These additional restrictions on CCAR firms' distributions will remain in place through the second quarter of 2021, but will terminate for firms with capital levels above the minimum requirements in the 2021 CCAR exercise, the results of which will be made public on or before June 30, 2021. Under these additional restrictions, CCAR firms may make certain capital distributions in the first two quarters of 2021, provided that the distributions generally do not exceed net income.
HSBC North America submitted its 2021 CCAR capital plan and its 2021 annual company-run DFAST results in April 2021. HSBC North America will publicly disclose their latest annual DFAST results, as required, within 15 days of the FRB disclosing the results of its own DFAST results. The FRB will publicly disclose its own DFAST and CCAR results on or before June 30, 2021. Stress testing results are based solely on hypothetical adverse stress scenarios and should not be viewed or interpreted as forecasts of expected outcomes or capital adequacy or of the actual financial condition of HSBC North America. Capital planning and stress testing for HSBC North America may impact our future capital and liquidity.
While BHC regulatory capital compliance is generally performed at the HSBC North America level, and also separately for HSBC Bank USA, as a BHC we are required to meet minimum capital requirements imposed by the FRB. We present our capital ratios, together with HSBC Bank USA's in Note 16, "Retained Earnings and Regulatory Capital Requirements," in the accompanying consolidated financial statements.
2021 Funding Strategy Our current estimate for funding needs and sources for 2021 are summarized in the following table:Actual
January 1 through
March 31, 2021
Estimated April 1 through
December 31, 2021
Estimated Full Year
2021
(in billions)Increase (decrease) in funding needs:
Net change in loans.................................................................................................... $ — $ 3 $ 3 Net change in short-term investments and securities................................................. — (4) (4) Net change in trading and other assets....................................................................... (2) — (2)
Total funding needs...................................................................................................... $ (2) $ (1) $ (3) Increase (decrease) in funding sources:
Net change in deposits............................................................................................... $ 3 $ 3 $ 6 Net change in trading and other short-term liabilities............................................... (3) (2) (5) Net change in long-term debt .................................................................................... (2) (2) (4)
Total funding sources................................................................................................... $ (2) $ (1) $ (3)
The above table reflects a long-term funding strategy. Daily balances fluctuate as we accommodate customer needs, while ensuring that we have liquidity in place to support the balance sheet maturity funding profile. Should market conditions deteriorate, we have contingency plans to generate additional liquidity through the sales of assets or financing transactions. We remain confident in our ability to access the market for long-term debt funding needs in the current market environment. We continue to seek well-priced and stable customer deposits. We also continue to sell new agency-eligible mortgage loan originations to third parties.
HSBC Bank USA is subject to significant restrictions imposed by federal law on extensions of credit to, and certain other 'covered transactions' with HSBC USA and other affiliates. For further discussion, see Part I, "Regulation and Competition - Affiliate Transaction Restrictions," in our 2020 Form 10-K.
HSBC USA Inc.
106
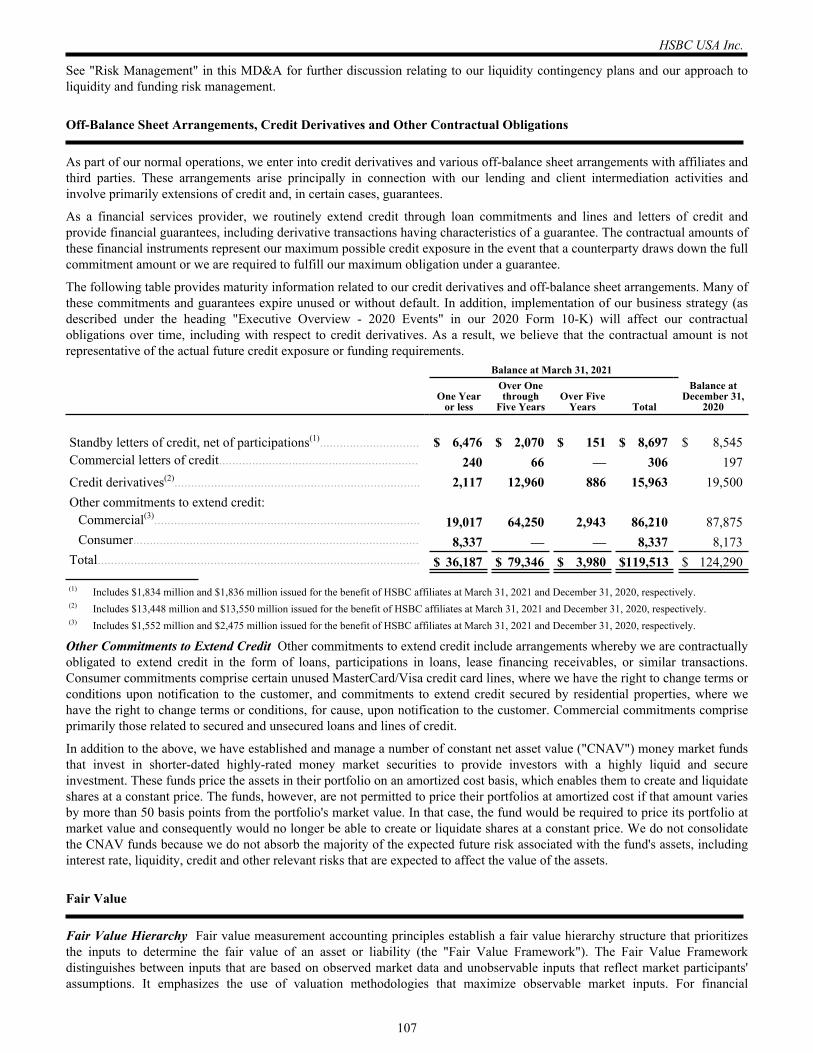
See "Risk Management" in this MD&A for further discussion relating to our liquidity contingency plans and our approach to liquidity and funding risk management.
Off-Balance Sheet Arrangements, Credit Derivatives and Other Contractual Obligations
As part of our normal operations, we enter into credit derivatives and various off-balance sheet arrangements with affiliates and third parties. These arrangements arise principally in connection with our lending and client intermediation activities and involve primarily extensions of credit and, in certain cases, guarantees.
As a financial services provider, we routinely extend credit through loan commitments and lines and letters of credit and provide financial guarantees, including derivative transactions having characteristics of a guarantee. The contractual amounts of these financial instruments represent our maximum possible credit exposure in the event that a counterparty draws down the full commitment amount or we are required to fulfill our maximum obligation under a guarantee.
The following table provides maturity information related to our credit derivatives and off-balance sheet arrangements. Many of these commitments and guarantees expire unused or without default. In addition, implementation of our business strategy (as described under the heading "Executive Overview - 2020 Events" in our 2020 Form 10-K) will affect our contractual obligations over time, including with respect to credit derivatives. As a result, we believe that the contractual amount is not representative of the actual future credit exposure or funding requirements. Balance at March 31, 2021
One Year
or less
Over One through
Five YearsOver Five
Years Total
Balance at December 31,
2020
Standby letters of credit, net of participations(1).............................. $ 6,476 $ 2,070 $ 151 $ 8,697 $ 8,545 Commercial letters of credit............................................................ 240 66 — 306 197 Credit derivatives(2).......................................................................... 2,117 12,960 886 15,963 19,500 Other commitments to extend credit:
Commercial(3)................................................................................ 19,017 64,250 2,943 86,210 87,875 Consumer...................................................................................... 8,337 — — 8,337 8,173
Total................................................................................................. $ 36,187 $ 79,346 $ 3,980 $ 119,513 $ 124,290
(1) Includes $1,834 million and $1,836 million issued for the benefit of HSBC affiliates at March 31, 2021 and December 31, 2020, respectively.(2) Includes $13,448 million and $13,550 million issued for the benefit of HSBC affiliates at March 31, 2021 and December 31, 2020, respectively.(3) Includes $1,552 million and $2,475 million issued for the benefit of HSBC affiliates at March 31, 2021 and December 31, 2020, respectively.
Other Commitments to Extend Credit Other commitments to extend credit include arrangements whereby we are contractually obligated to extend credit in the form of loans, participations in loans, lease financing receivables, or similar transactions. Consumer commitments comprise certain unused MasterCard/Visa credit card lines, where we have the right to change terms or conditions upon notification to the customer, and commitments to extend credit secured by residential properties, where we have the right to change terms or conditions, for cause, upon notification to the customer. Commercial commitments comprise primarily those related to secured and unsecured loans and lines of credit.
In addition to the above, we have established and manage a number of constant net asset value ("CNAV") money market funds that invest in shorter-dated highly-rated money market securities to provide investors with a highly liquid and secure investment. These funds price the assets in their portfolio on an amortized cost basis, which enables them to create and liquidate shares at a constant price. The funds, however, are not permitted to price their portfolios at amortized cost if that amount varies by more than 50 basis points from the portfolio's market value. In that case, the fund would be required to price its portfolio at market value and consequently would no longer be able to create or liquidate shares at a constant price. We do not consolidate the CNAV funds because we do not absorb the majority of the expected future risk associated with the fund's assets, including interest rate, liquidity, credit and other relevant risks that are expected to affect the value of the assets.
Fair Value
Fair Value Hierarchy Fair value measurement accounting principles establish a fair value hierarchy structure that prioritizes the inputs to determine the fair value of an asset or liability (the "Fair Value Framework"). The Fair Value Framework distinguishes between inputs that are based on observed market data and unobservable inputs that reflect market participants' assumptions. It emphasizes the use of valuation methodologies that maximize observable market inputs. For financial
HSBC USA Inc.
107
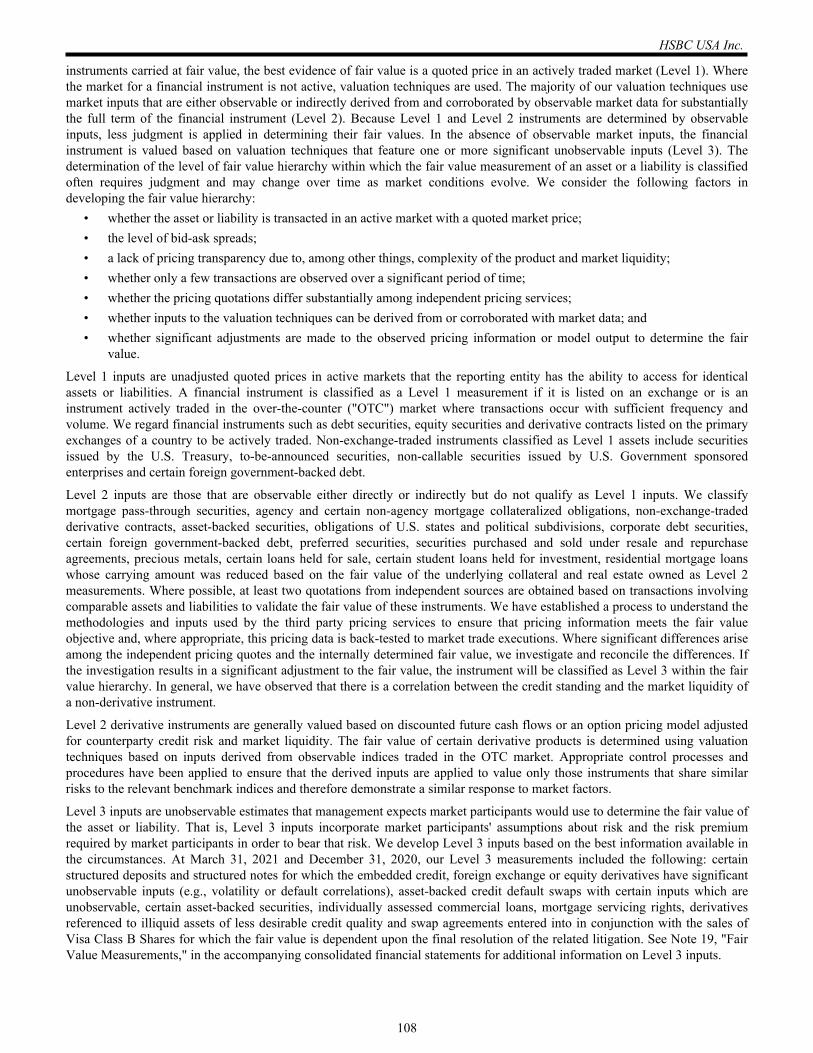
instruments carried at fair value, the best evidence of fair value is a quoted price in an actively traded market (Level 1). Where the market for a financial instrument is not active, valuation techniques are used. The majority of our valuation techniques use market inputs that are either observable or indirectly derived from and corroborated by observable market data for substantially the full term of the financial instrument (Level 2). Because Level 1 and Level 2 instruments are determined by observable inputs, less judgment is applied in determining their fair values. In the absence of observable market inputs, the financial instrument is valued based on valuation techniques that feature one or more significant unobservable inputs (Level 3). The determination of the level of fair value hierarchy within which the fair value measurement of an asset or a liability is classified often requires judgment and may change over time as market conditions evolve. We consider the following factors in developing the fair value hierarchy:
• whether the asset or liability is transacted in an active market with a quoted market price;• the level of bid-ask spreads;• a lack of pricing transparency due to, among other things, complexity of the product and market liquidity;• whether only a few transactions are observed over a significant period of time;• whether the pricing quotations differ substantially among independent pricing services;• whether inputs to the valuation techniques can be derived from or corroborated with market data; and• whether significant adjustments are made to the observed pricing information or model output to determine the fair
value.
Level 1 inputs are unadjusted quoted prices in active markets that the reporting entity has the ability to access for identical assets or liabilities. A financial instrument is classified as a Level 1 measurement if it is listed on an exchange or is an instrument actively traded in the over-the-counter ("OTC") market where transactions occur with sufficient frequency and volume. We regard financial instruments such as debt securities, equity securities and derivative contracts listed on the primary exchanges of a country to be actively traded. Non-exchange-traded instruments classified as Level 1 assets include securities issued by the U.S. Treasury, to-be-announced securities, non-callable securities issued by U.S. Government sponsored enterprises and certain foreign government-backed debt.
Level 2 inputs are those that are observable either directly or indirectly but do not qualify as Level 1 inputs. We classify mortgage pass-through securities, agency and certain non-agency mortgage collateralized obligations, non-exchange-traded derivative contracts, asset-backed securities, obligations of U.S. states and political subdivisions, corporate debt securities, certain foreign government-backed debt, preferred securities, securities purchased and sold under resale and repurchase agreements, precious metals, certain loans held for sale, certain student loans held for investment, residential mortgage loans whose carrying amount was reduced based on the fair value of the underlying collateral and real estate owned as Level 2 measurements. Where possible, at least two quotations from independent sources are obtained based on transactions involving comparable assets and liabilities to validate the fair value of these instruments. We have established a process to understand the methodologies and inputs used by the third party pricing services to ensure that pricing information meets the fair value objective and, where appropriate, this pricing data is back-tested to market trade executions. Where significant differences arise among the independent pricing quotes and the internally determined fair value, we investigate and reconcile the differences. If the investigation results in a significant adjustment to the fair value, the instrument will be classified as Level 3 within the fair value hierarchy. In general, we have observed that there is a correlation between the credit standing and the market liquidity of a non-derivative instrument.
Level 2 derivative instruments are generally valued based on discounted future cash flows or an option pricing model adjusted for counterparty credit risk and market liquidity. The fair value of certain derivative products is determined using valuation techniques based on inputs derived from observable indices traded in the OTC market. Appropriate control processes and procedures have been applied to ensure that the derived inputs are applied to value only those instruments that share similar risks to the relevant benchmark indices and therefore demonstrate a similar response to market factors.
Level 3 inputs are unobservable estimates that management expects market participants would use to determine the fair value of the asset or liability. That is, Level 3 inputs incorporate market participants' assumptions about risk and the risk premium required by market participants in order to bear that risk. We develop Level 3 inputs based on the best information available in the circumstances. At March 31, 2021 and December 31, 2020, our Level 3 measurements included the following: certain structured deposits and structured notes for which the embedded credit, foreign exchange or equity derivatives have significant unobservable inputs (e.g., volatility or default correlations), asset-backed credit default swaps with certain inputs which are unobservable, certain asset-backed securities, individually assessed commercial loans, mortgage servicing rights, derivatives referenced to illiquid assets of less desirable credit quality and swap agreements entered into in conjunction with the sales of Visa Class B Shares for which the fair value is dependent upon the final resolution of the related litigation. See Note 19, "Fair Value Measurements," in the accompanying consolidated financial statements for additional information on Level 3 inputs.
HSBC USA Inc.
108
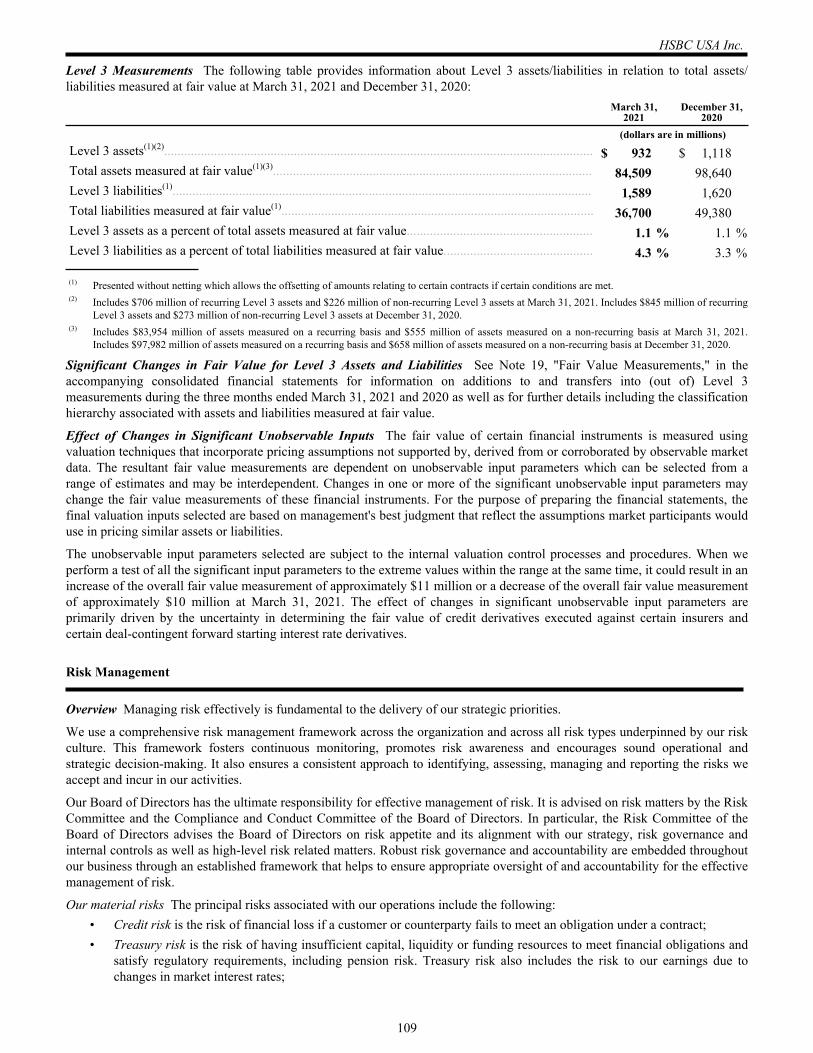
Level 3 Measurements The following table provides information about Level 3 assets/liabilities in relation to total assets/liabilities measured at fair value at March 31, 2021 and December 31, 2020:
March 31, 2021
December 31, 2020
(dollars are in millions)Level 3 assets(1)(2)................................................................................................................................. $ 932 $ 1,118 Total assets measured at fair value(1)(3)................................................................................................ 84,509 98,640 Level 3 liabilities(1).............................................................................................................................. 1,589 1,620 Total liabilities measured at fair value(1).............................................................................................. 36,700 49,380 Level 3 assets as a percent of total assets measured at fair value........................................................ 1.1 % 1.1 %Level 3 liabilities as a percent of total liabilities measured at fair value............................................. 4.3 % 3.3 %
(1) Presented without netting which allows the offsetting of amounts relating to certain contracts if certain conditions are met.(2) Includes $706 million of recurring Level 3 assets and $226 million of non-recurring Level 3 assets at March 31, 2021. Includes $845 million of recurring
Level 3 assets and $273 million of non-recurring Level 3 assets at December 31, 2020.(3) Includes $83,954 million of assets measured on a recurring basis and $555 million of assets measured on a non-recurring basis at March 31, 2021.
Includes $97,982 million of assets measured on a recurring basis and $658 million of assets measured on a non-recurring basis at December 31, 2020.
Significant Changes in Fair Value for Level 3 Assets and Liabilities See Note 19, "Fair Value Measurements," in the accompanying consolidated financial statements for information on additions to and transfers into (out of) Level 3 measurements during the three months ended March 31, 2021 and 2020 as well as for further details including the classification hierarchy associated with assets and liabilities measured at fair value.
Effect of Changes in Significant Unobservable Inputs The fair value of certain financial instruments is measured using valuation techniques that incorporate pricing assumptions not supported by, derived from or corroborated by observable market data. The resultant fair value measurements are dependent on unobservable input parameters which can be selected from a range of estimates and may be interdependent. Changes in one or more of the significant unobservable input parameters may change the fair value measurements of these financial instruments. For the purpose of preparing the financial statements, the final valuation inputs selected are based on management's best judgment that reflect the assumptions market participants would use in pricing similar assets or liabilities.
The unobservable input parameters selected are subject to the internal valuation control processes and procedures. When we perform a test of all the significant input parameters to the extreme values within the range at the same time, it could result in an increase of the overall fair value measurement of approximately $11 million or a decrease of the overall fair value measurement of approximately $10 million at March 31, 2021. The effect of changes in significant unobservable input parameters are primarily driven by the uncertainty in determining the fair value of credit derivatives executed against certain insurers and certain deal-contingent forward starting interest rate derivatives.
Risk Management
Overview Managing risk effectively is fundamental to the delivery of our strategic priorities.
We use a comprehensive risk management framework across the organization and across all risk types underpinned by our risk culture. This framework fosters continuous monitoring, promotes risk awareness and encourages sound operational and strategic decision-making. It also ensures a consistent approach to identifying, assessing, managing and reporting the risks we accept and incur in our activities.
Our Board of Directors has the ultimate responsibility for effective management of risk. It is advised on risk matters by the Risk Committee and the Compliance and Conduct Committee of the Board of Directors. In particular, the Risk Committee of the Board of Directors advises the Board of Directors on risk appetite and its alignment with our strategy, risk governance and internal controls as well as high-level risk related matters. Robust risk governance and accountability are embedded throughout our business through an established framework that helps to ensure appropriate oversight of and accountability for the effective management of risk.
Our material risks The principal risks associated with our operations include the following:• Credit risk is the risk of financial loss if a customer or counterparty fails to meet an obligation under a contract;• Treasury risk is the risk of having insufficient capital, liquidity or funding resources to meet financial obligations and
satisfy regulatory requirements, including pension risk. Treasury risk also includes the risk to our earnings due to changes in market interest rates;
HSBC USA Inc.
109
• Market risk is the risk that movements in market factors, such as foreign exchange rates, interest rates, credit spreads, equity prices and commodity prices, will reduce our income or the value of our portfolios;
• Resilience risk is the risk that we are unable to provide critical services to our customers, affiliates and counterparties as a result of sustained and significant operational disruption;
• Regulatory compliance risk is the risk that we fail to observe the letter and spirit of relevant laws, codes, rules, regulations and standards of good market practice, which as a consequence incur fines and penalties and suffer damage to our business;
• Financial crime risk is the risk that we knowingly or unknowingly help parties to commit or to further potentially illegal activity, including money laundering, fraud, bribery and corruption, tax evasion, sanctions breaches, and terrorist and proliferation financing;
• Strategic risk is the risk that the business will fail to identify, execute and react appropriately to opportunities and/or threats arising from changes in the market, some of which may emerge over a number of years such as changing economic and political circumstances, customer requirements, demographic trends, regulatory developments or competitor action; and
• Model risk is the potential for adverse consequences from business decisions informed by models, which can be exacerbated by errors in methodology, design or the way they are used.
In the course of our regular risk management activities, we use models to help quantify the risk we are taking. We believe that the assumptions used in these models are reasonable within the parameters for which the models have been built and calibrated to operate, but events may unfold differently than what is assumed in the models. Consequently, actual results may differ significantly from model projections. The severe projections of macroeconomic variables during the current COVID-19 pandemic represent events outside the parameters for which the models have been built. As a result, adjustments to model outputs to reflect consideration of management judgment are used with stringent governance in place to ensure appropriate results. Where models do not require adjustments, enhanced model monitoring confirms models are performing as intended.
See "Risk Management" in MD&A in our 2020 Form 10-K for a more complete discussion of the objectives of our risk management system as well as our risk management policies and practices. Other than the change to financial crime risk management discussed below, there have been no material changes to our approach to risk management since December 31, 2020.
Credit Risk Management Credit risk is managed through a robust risk identification and control framework which outlines clear and consistent policies, principles and guidance for risk managers. Credit risk is monitored using various internal risk management measures and within limits approved by individuals within a framework of delegated authorities. Our credit risk management procedures are designed for all stages of economic and financial cycles, including challenging periods of market volatility and economic uncertainty. The impact of the COVID-19 pandemic continued to create economic uncertainty during the first quarter of 2021. We continue to monitor the performance of our material commercial loans as conditions evolve and take necessary credit actions where warranted. See "Risk Management" in MD&A in our 2020 Form 10-K for a more complete discussion of our approach to credit risk.
Treasury Risk Management We continuously monitor our capital ratios and the impact of market events on our liquidity positions and will continue to adapt our frameworks as necessary to reflect market events and the evolving regulatory landscape and view as to best practices. See "Risk Management" in MD&A in our 2020 Form 10-K for a more complete discussion of our approach to treasury risk.
Capital risk See "Liquidity and Capital Resources" in this MD&A for a discussion of our approach to capital risk management, including our capital ratios and regulatory capital requirements.
Liquidity and funding risk As part of our approach towards liquidity and funding risk management, we employ the measures discussed below to define, monitor and control our liquidity and funding risk in accordance with HSBC policy.
The Basel Committee based Liquidity Coverage Ratio ("LCR") is designed to be a short-term liquidity measure to ensure banks have sufficient High Quality Liquid Assets ("HQLA") to cover net stressed cash outflows over the next 30 days. At both March 31, 2021 and December 31, 2020, HSBC USA's LCR exceeded 100 percent. A LCR of 100 percent or higher reflects an unencumbered HQLA balance that is equal to or exceeds liquidity needs for a 30 calendar day liquidity stress scenario. HQLA consists of cash or assets that can be converted into cash at little or no loss of value in private markets. HSBC North America and HSBC Bank USA are also subject to the U.S. LCR rule and are required to report their LCR to U.S. regulators on a daily basis. Under the Tailoring Rules, an 85 percent LCR requirement applies to Category III firms with weighted short-term wholesale funding under $75 billion, including HSBC North America, and their depository institution subsidiaries, such as HSBC Bank USA, from 100 to 85 percent beginning January 1, 2020. As a result, under the U.S. LCR rule, a LCR of 100 percent or higher reflects an unencumbered HQLA balance that is equal to or exceeds 85 percent of a Category III firm's
HSBC USA Inc.
110
liquidity needs for a 30 calendar day liquidity stress scenario. During the three months ended March 31, 2021, HSBC Bank USA's LCR under the U.S. LCR rule remained above the 100 percent minimum requirement.
The U.K. calibration of the Basel Committee based Net Stable Funding Ratio ("NSFR"), which is a longer term liquidity measure with a 12-month time horizon to ensure a sustainable maturity structure of assets and liabilities, is still pending. Therefore, our calculation of NSFR is based on our current interpretation and understanding of the Basel Committee NSFR guidance, which may differ in future periods depending on completion of the U.K. calibration. The U.K. NSFR rules are expected to become effective in January 2022. At both March 31, 2021 and December 31, 2020, HSBC USA's estimated NSFR exceeded 100 percent. A NSFR of 100 percent or more reflects an available stable funding balance from liabilities and capital over the next 12 months that is equal to or exceeds the required amount of funding for assets and off-balance sheet exposures. In October 2020, U.S. regulators issued a final rule to implement the NSFR in the United States, applicable to certain large banking organizations, including HSBC North America and HSBC Bank USA, that will take effect July 1, 2021. Consistent with the Tailoring Rules, an 85 percent NSFR requirement will apply to Category III firms with weighted short-term wholesale funding under $75 billion, including HSBC North America, and their depository institution subsidiaries, such as HSBC Bank USA, when the final rule becomes effective July 1, 2021. As a result, under the U.S. NSFR rule, a NSFR of 100 percent or more reflects an available stable funding balance from liabilities and capital over the next 12 months that is equal to or exceeds 85 percent of a Category III firm's required amount of funding for assets and off-balance sheet exposures. At both March 31, 2021 and December 31, 2020, HSBC Bank USA's estimated NSFR, based on our interpretation and understanding of the U.S. NSFR rule, exceeded 100 percent.
As a Category III firm, HSBC North America remains subject to liquidity stress testing on a monthly basis and related liquidity buffer and liquidity risk management requirements. HSBC North America and HSBC Bank USA have liquidity profiles to support compliance with these rules. HSBC North America and HSBC Bank USA may need to make changes to their liquidity profiles to support compliance with any future rules and will continue to evaluate the impact of the final U.S. NSFR rule on our operations.
Our liquidity and funding risk management approach includes deposits, supplemented by wholesale borrowing to fund our balance sheet, and using security sales or secured borrowings for liquidity stress situations in our liquidity contingency plans. In addition, regulations require banks to retain a portfolio of HQLA. As such, we are maintaining a large portfolio of high quality sovereign and sovereign guaranteed securities.
Our ability to regularly attract wholesale funds at a competitive cost is enhanced by strong ratings from the major credit ratings agencies. The following table reflects the short and long-term credit ratings of HSBC USA and HSBC Bank USA at March 31, 2021:
Moody's S&P FitchHSBC USA:
Short-term borrowings....................................................................................... P-1 A-2 F1+Long-term/senior debt........................................................................................ A2 A- A+
HSBC Bank USA:Short-term borrowings....................................................................................... P-1 A-1 F1+Long-term/senior debt........................................................................................ Aa3 A+ AA-
Rating agencies continue to evaluate economic and geopolitical trends, regulatory developments, future profitability, risk management practices and legal matters, all of which could lead to adverse ratings actions.
Although we closely monitor and strive to manage factors influencing our credit ratings, there is no assurance that our credit ratings will not change in the future. At March 31, 2021, there were no pending actions in terms of changes to ratings on the debt of HSBC USA or HSBC Bank USA from any of the rating agencies.
See "Liquidity and Capital Resources" in this MD&A for further discussion of our liquidity position, including additional information regarding our outstanding borrowings, the remaining availability of our debt issuance programs and our funding strategy.
Interest rate risk Various techniques are utilized to quantify and monitor risks associated with the repricing characteristics of our assets, liabilities and derivative contracts. See "Risk Management" in MD&A in our 2020 Form 10-K for a more complete discussion of our approach to interest rate risk.
HSBC USA Inc.
111
Economic value of equity ("EVE") EVE represents the present value of the banking book cash flows that could be provided to our equity holder under a managed run-off scenario. An EVE sensitivity represents the change in EVE due to a defined movement in interest rates. We manage to an immediate parallel upward shock of 200 basis points and an immediate parallel downward shock of 200 basis points to the market implied interest rates. At both March 31, 2021 and December 31, 2020, our EVE remained within risk appetite for the up 200 and down 200 basis point interest rate shock scenarios.
Net interest income simulation modeling techniques We utilize simulation modeling to monitor a number of interest rate scenarios for their impact on projected net interest income. These techniques simulate the impact on projected net interest income under various scenarios, such as rate shock scenarios which assume immediate market rate movements by 100 basis points, as well as scenarios in which rates gradually rise or fall by 100 basis points over a twelve month period. In the gradual scenarios, 25 percent of the interest rate movement occurs at the beginning of each quarter. The following table reflects the impact on our projected net interest income of the scenarios utilized by these modeling techniques:
March 31, 2021 December 31, 2020Amount % Amount %
(dollars are in millions)
Estimated increase (decrease) in projected net interest income (reflects projected rate movements on April 1, 2021 and January 1, 2021, respectively):Resulting from a gradual 100 basis point increase in the yield curve............................. $ 241 10 % $ 186 7 %Resulting from a gradual 100 basis point decrease in the yield curve............................. (261) (11) (213) (8)
Other significant scenarios monitored (reflects projected rate movements on April 1, 2021 and January 1, 2021, respectively):Resulting from an immediate 100 basis point increase in the yield curve...................... 361 15 274 11 Resulting from an immediate 100 basis point decrease in the yield curve...................... (485) (20) (379) (15)
The projections do not take into consideration possible complicating factors such as the effect of changes in interest rates on the credit quality, size and composition of the balance sheet. Therefore, although this provides a reasonable estimate of interest rate sensitivity, actual results will differ from these estimates, possibly by significant amounts.
Market Risk Management Exposure to market risk is separated into two portfolios:• Trading portfolios comprise positions arising from market-making and warehousing of client-derived positions. • Non-trading portfolios comprise positions that primarily arise from the interest rate management of our retail and
commercial banking assets and liabilities and financial investments classified as available-for-sale and held-to-maturity.
We apply similar risk management policies and measurement techniques to both trading and non-trading portfolios. Our objective is to manage and control market risk exposures to optimize return on risk while maintaining a market profile consistent with our established risk appetite. See "Risk Management" in MD&A in our 2020 Form 10-K for a more complete discussion of our approach to market risk.
Value at risk ("VaR") VaR is a technique for estimating potential losses on risk positions as a result of movements in market rates and prices over a specified time horizon and to a given level of confidence. The use of VaR is integrated into market risk management and calculated for all trading positions regardless of how we capitalize them. In addition, we calculate VaR for non-trading portfolios to have a complete picture of risk. VaR measures are calculated to a 99 percent confidence level and use a one-day holding period.
Trading portfolios Trading VaR generates primarily from the Markets and Securities Services unit of our GBM business segment. Portfolios comprise mainly foreign exchange products, interest rate swaps, credit default swaps and precious metals (i.e., gold, silver, platinum) in both North America and emerging markets.
HSBC USA Inc.
112
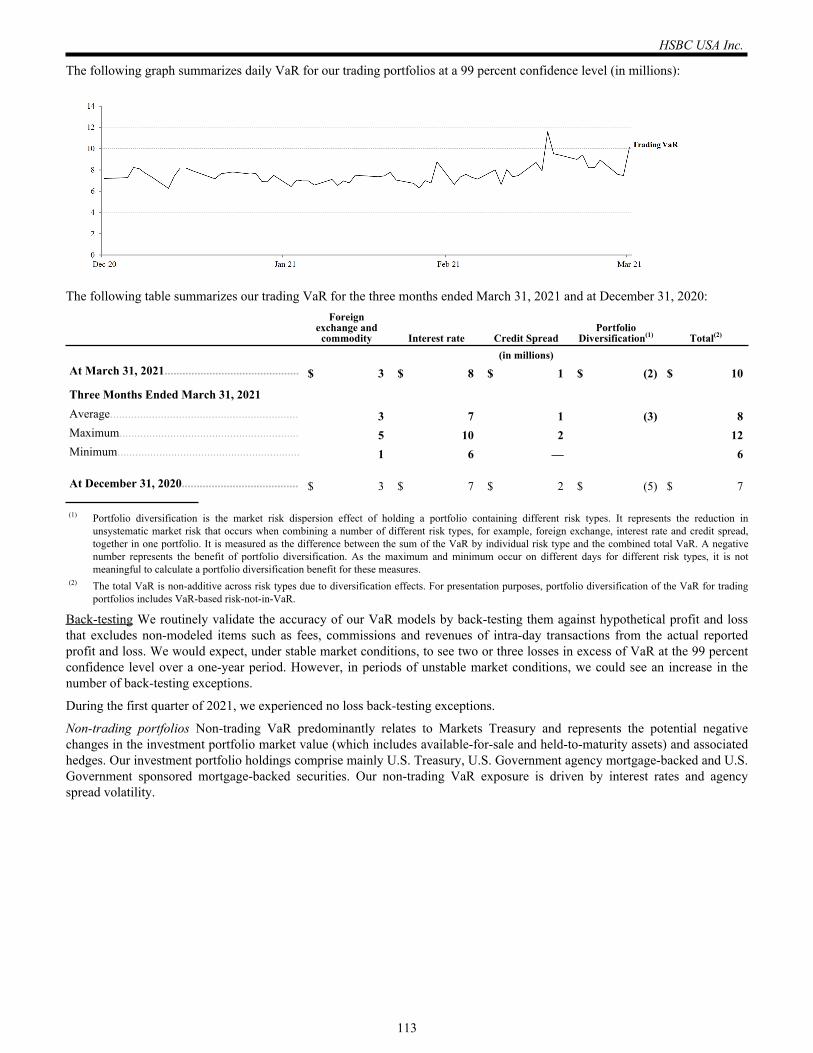
The following graph summarizes daily VaR for our trading portfolios at a 99 percent confidence level (in millions):
The following table summarizes our trading VaR for the three months ended March 31, 2021 and at December 31, 2020:Foreign
exchange and commodity Interest rate Credit Spread
Portfolio Diversification(1) Total(2)
(in millions)At March 31, 2021............................................. $ 3 $ 8 $ 1 $ (2) $ 10
Three Months Ended March 31, 2021Average............................................................... 3 7 1 (3) 8 Maximum............................................................ 5 10 2 12 Minimum............................................................. 1 6 — 6
At December 31, 2020....................................... $ 3 $ 7 $ 2 $ (5) $ 7
(1) Portfolio diversification is the market risk dispersion effect of holding a portfolio containing different risk types. It represents the reduction in unsystematic market risk that occurs when combining a number of different risk types, for example, foreign exchange, interest rate and credit spread, together in one portfolio. It is measured as the difference between the sum of the VaR by individual risk type and the combined total VaR. A negative number represents the benefit of portfolio diversification. As the maximum and minimum occur on different days for different risk types, it is not meaningful to calculate a portfolio diversification benefit for these measures.
(2) The total VaR is non-additive across risk types due to diversification effects. For presentation purposes, portfolio diversification of the VaR for trading portfolios includes VaR-based risk-not-in-VaR.
Back-testing We routinely validate the accuracy of our VaR models by back-testing them against hypothetical profit and loss that excludes non-modeled items such as fees, commissions and revenues of intra-day transactions from the actual reported profit and loss. We would expect, under stable market conditions, to see two or three losses in excess of VaR at the 99 percent confidence level over a one-year period. However, in periods of unstable market conditions, we could see an increase in the number of back-testing exceptions.
During the first quarter of 2021, we experienced no loss back-testing exceptions.
Non-trading portfolios Non-trading VaR predominantly relates to Markets Treasury and represents the potential negative changes in the investment portfolio market value (which includes available-for-sale and held-to-maturity assets) and associated hedges. Our investment portfolio holdings comprise mainly U.S. Treasury, U.S. Government agency mortgage-backed and U.S. Government sponsored mortgage-backed securities. Our non-trading VaR exposure is driven by interest rates and agency spread volatility.
HSBC USA Inc.
113
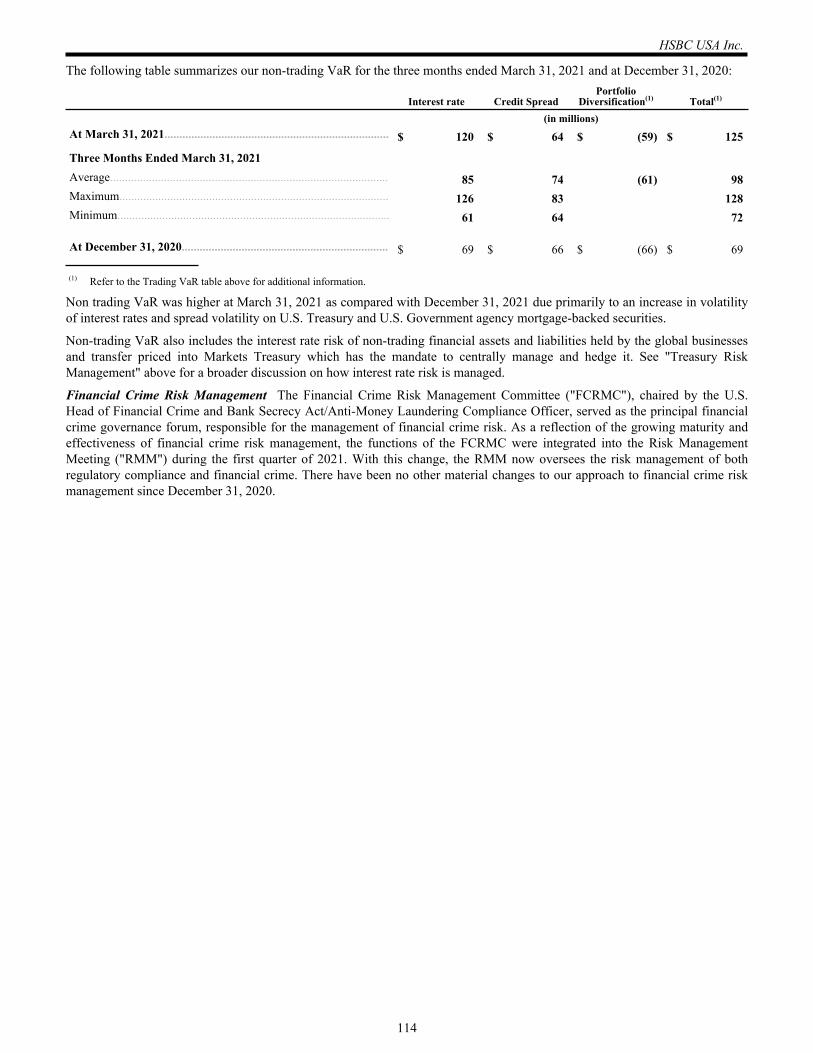
The following table summarizes our non-trading VaR for the three months ended March 31, 2021 and at December 31, 2020:
Interest rate Credit SpreadPortfolio
Diversification(1) Total(1)
(in millions)At March 31, 2021........................................................................... $ 120 $ 64 $ (59) $ 125
Three Months Ended March 31, 2021Average............................................................................................. 85 74 (61) 98 Maximum.......................................................................................... 126 83 128 Minimum........................................................................................... 61 64 72
At December 31, 2020..................................................................... $ 69 $ 66 $ (66) $ 69
(1) Refer to the Trading VaR table above for additional information.
Non trading VaR was higher at March 31, 2021 as compared with December 31, 2021 due primarily to an increase in volatility of interest rates and spread volatility on U.S. Treasury and U.S. Government agency mortgage-backed securities.
Non-trading VaR also includes the interest rate risk of non-trading financial assets and liabilities held by the global businesses and transfer priced into Markets Treasury which has the mandate to centrally manage and hedge it. See "Treasury Risk Management" above for a broader discussion on how interest rate risk is managed.
Financial Crime Risk Management The Financial Crime Risk Management Committee ("FCRMC"), chaired by the U.S. Head of Financial Crime and Bank Secrecy Act/Anti-Money Laundering Compliance Officer, served as the principal financial crime governance forum, responsible for the management of financial crime risk. As a reflection of the growing maturity and effectiveness of financial crime risk management, the functions of the FCRMC were integrated into the Risk Management Meeting ("RMM") during the first quarter of 2021. With this change, the RMM now oversees the risk management of both regulatory compliance and financial crime. There have been no other material changes to our approach to financial crime risk management since December 31, 2020.
HSBC USA Inc.
114
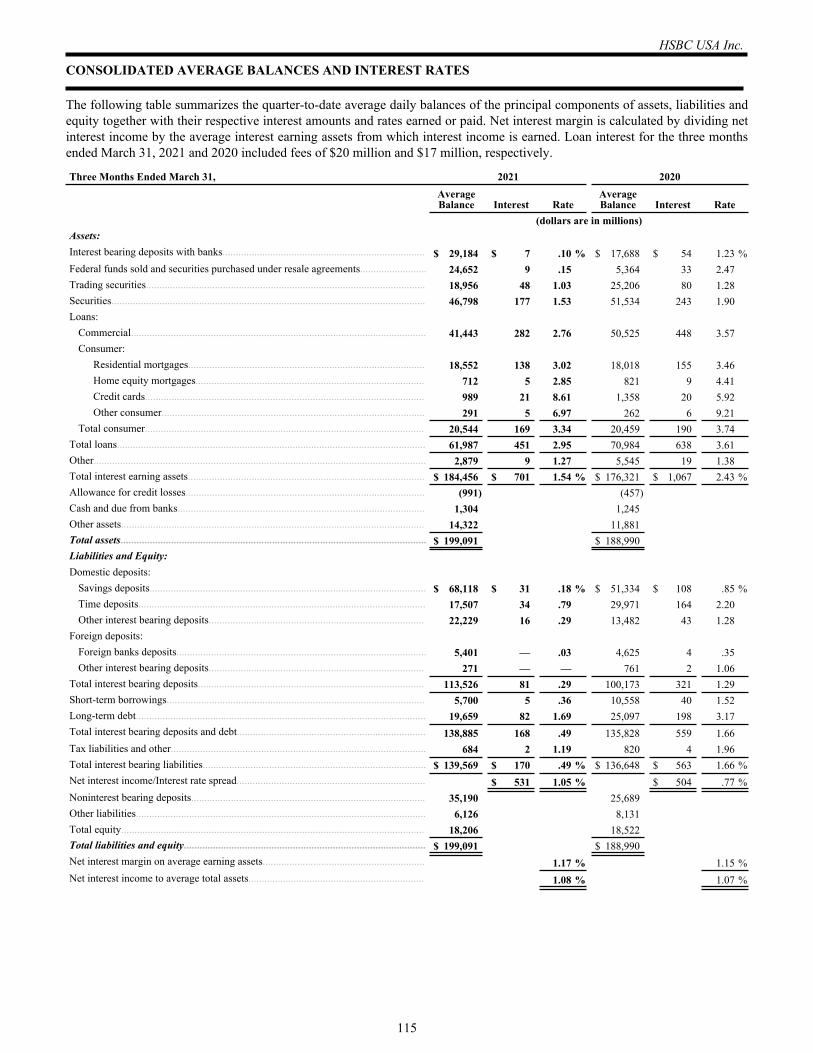
CONSOLIDATED AVERAGE BALANCES AND INTEREST RATES
The following table summarizes the quarter-to-date average daily balances of the principal components of assets, liabilities and equity together with their respective interest amounts and rates earned or paid. Net interest margin is calculated by dividing net interest income by the average interest earning assets from which interest income is earned. Loan interest for the three months ended March 31, 2021 and 2020 included fees of $20 million and $17 million, respectively.
Three Months Ended March 31, 2021 2020Average Balance Interest Rate
Average Balance Interest Rate
(dollars are in millions)Assets:Interest bearing deposits with banks............................................................................ $ 29,184 $ 7 .10 % $ 17,688 $ 54 1.23 %Federal funds sold and securities purchased under resale agreements......................... 24,652 9 .15 5,364 33 2.47 Trading securities......................................................................................................... 18,956 48 1.03 25,206 80 1.28 Securities...................................................................................................................... 46,798 177 1.53 51,534 243 1.90 Loans:
Commercial............................................................................................................... 41,443 282 2.76 50,525 448 3.57 Consumer:
Residential mortgages......................................................................................... 18,552 138 3.02 18,018 155 3.46 Home equity mortgages...................................................................................... 712 5 2.85 821 9 4.41 Credit cards......................................................................................................... 989 21 8.61 1,358 20 5.92 Other consumer................................................................................................... 291 5 6.97 262 6 9.21
Total consumer......................................................................................................... 20,544 169 3.34 20,459 190 3.74 Total loans.................................................................................................................... 61,987 451 2.95 70,984 638 3.61 Other............................................................................................................................. 2,879 9 1.27 5,545 19 1.38 Total interest earning assets......................................................................................... $ 184,456 $ 701 1.54 % $ 176,321 $ 1,067 2.43 %Allowance for credit losses.......................................................................................... (991) (457) Cash and due from banks............................................................................................. 1,304 1,245 Other assets.................................................................................................................. 14,322 11,881 Total assets................................................................................................................... $ 199,091 $ 188,990 Liabilities and Equity:Domestic deposits:
Savings deposits........................................................................................................ $ 68,118 $ 31 .18 % $ 51,334 $ 108 .85 %Time deposits............................................................................................................ 17,507 34 .79 29,971 164 2.20 Other interest bearing deposits................................................................................. 22,229 16 .29 13,482 43 1.28
Foreign deposits:Foreign banks deposits.............................................................................................. 5,401 — .03 4,625 4 .35 Other interest bearing deposits................................................................................. 271 — — 761 2 1.06
Total interest bearing deposits..................................................................................... 113,526 81 .29 100,173 321 1.29 Short-term borrowings................................................................................................. 5,700 5 .36 10,558 40 1.52 Long-term debt............................................................................................................. 19,659 82 1.69 25,097 198 3.17 Total interest bearing deposits and debt....................................................................... 138,885 168 .49 135,828 559 1.66 Tax liabilities and other................................................................................................ 684 2 1.19 820 4 1.96 Total interest bearing liabilities.................................................................................... $ 139,569 $ 170 .49 % $ 136,648 $ 563 1.66 %Net interest income/Interest rate spread....................................................................... $ 531 1.05 % $ 504 .77 %Noninterest bearing deposits........................................................................................ 35,190 25,689 Other liabilities............................................................................................................. 6,126 8,131 Total equity.................................................................................................................. 18,206 18,522 Total liabilities and equity........................................................................................... $ 199,091 $ 188,990 Net interest margin on average earning assets............................................................. 1.17 % 1.15 %Net interest income to average total assets.................................................................. 1.08 % 1.07 %
HSBC USA Inc.
115
Item 3. Quantitative and Qualitative Disclosures about Market Risk
Information required by this Item is included within Item 2. Management's Discussion and Analysis of Financial Condition and Results of Operations in the Risk Management section under the captions "Treasury Risk Management - Interest Rate Risk" and "Market Risk Management."
Item 4. Controls and Procedures
Evaluation of Disclosure Controls and Procedures We maintain a system of disclosure controls and procedures designed to ensure that information required to be disclosed by HSBC USA in the reports we file or submit under the Securities Exchange Act of 1934, as amended (the "Exchange Act"), is recorded, processed, summarized and reported on a timely basis. Our Board of Directors, operating through its Audit Committee, which is composed entirely of independent non-executive directors, provides oversight to our financial reporting process.
We conducted an evaluation, with the participation of the Chief Executive Officer and Chief Financial Officer, of the effectiveness of our disclosure controls and procedures as of the end of the period covered by this report. Based upon that evaluation, the Chief Executive Officer and Chief Financial Officer concluded that our disclosure controls and procedures were effective as of the end of the period covered by this report so as to alert them in a timely fashion to material information required to be disclosed in reports we file under the Exchange Act.
Changes in Internal Control over Financial Reporting There has been no change in our internal control over financial reporting that occurred during the quarter ended March 31, 2021 that has materially affected, or is reasonably likely to materially affect, our internal control over financial reporting.
PART II
Item 1. Legal Proceedings
See Note 20, "Litigation and Regulatory Matters," in the accompanying consolidated financial statements for our legal proceedings disclosure, which is incorporated herein by reference.
Item 5. Other Information
Disclosures pursuant to Section 13(r) of the Securities Exchange Act Section 13(r) of the Securities Exchange Act requires each issuer registered with the SEC to disclose in its annual or quarterly reports whether it or any of its affiliates have knowingly engaged in specified activities or transactions with persons or entities targeted by U.S. sanctions programs relating to Iran, terrorism, or the proliferation of weapons of mass destruction, even if those activities are not prohibited by U.S. law and are conducted outside the U.S. by non-U.S. affiliates in compliance with local laws and regulations.
To comply with this requirement, HSBC has requested relevant information from its affiliates globally. During the period covered by this Form 10-Q, HUSI did not engage in activities or transactions requiring disclosure pursuant to Section 13(r) other than those activities related to frozen accounts and transactions permitted under relevant U.S. sanctions programs described under "Frozen Accounts and Transactions" below. The following activities conducted by our affiliates are disclosed in response to Section 13(r):
Legacy contractual obligations related to guarantees Between 1996 and 2007, the HSBC Group provided guarantees to a number of its non-Iranian customers in Europe and the Middle East for various business activities in Iran. In a number of cases, the HSBC Group issued counter indemnities involving Iranian banks as the Iranian beneficiaries of the guarantees required that they be backed directly by Iranian banks. The Iranian banks to which the HSBC Group provided counter indemnities included Bank Tejarat, Bank Melli, and the Bank of Industry and Mine.
There was no measurable gross revenue in the first quarter of 2021 under those guarantees and counter indemnities. The HSBC Group does not allocate direct costs to fees and commissions and, therefore, has not disclosed a separate net profit measure. The HSBC Group is seeking to cancel all relevant guarantees and counter indemnities, and does not currently intend to provide any new guarantees or counter indemnities involving Iran. None were cancelled in the first quarter of 2021 and approximately 17 remain outstanding.
HSBC USA Inc.
116
Other relationships with Iranian banks Activity related to U.S.-sanctioned Iranian banks not covered elsewhere in this disclosure includes the matter described below.
The HSBC Group acts as the trustee and administrator for a pension scheme involving eight employees of a U.S.-sanctioned Iranian bank in Hong Kong. Under the rules of this scheme, the HSBC Group accepts contributions from the Iranian bank each month and allocates the funds into the pension accounts of the Iranian bank’s employees. The HSBC Group runs and operates this pension scheme in accordance with Hong Kong laws and regulations. Estimated gross revenue, which includes fees and/or commissions, generated by this pension scheme during the first quarter of 2021, was approximately $632.
For the Iranian bank related-activity discussed above, the HSBC Group does not allocate direct costs to fees and commissions and, therefore, has not disclosed a separate net profit measure.
The HSBC Group has been holding a safe custody box for the Central Bank of Iran. For a number of years, the box has not been accessed by the Central Bank of Iran, and no fees have been charged to the Central Bank of Iran.
The HSBC Group currently intends to continue to wind down the activity discussed in this section, to the extent legally permissible, and not enter into any new such activity.
Other activity The HSBC Group has an insurance company customer in the United Arab Emirates that, during the first quarter of 2021, made local currency payments for the reimbursement of medical treatment to a hospital located in the United Arab Emirates and owned by the Government of Iran. The HSBC Group processed these payments to the hospital made by its customer.
The HSBC Group has a customer in the United Arab Emirates that, during the first quarter of 2021, received a local currency check from a hospital located in the United Arab Emirates and owned by the Government of Iran. The HSBC Group processed this check from the hospital to its customer.
The HSBC Group has a customer in the United Arab Emirates that, during the first quarter of 2021, received a local currency check from an Iranian-owned insurance company. The HSBC Group processed this check from the insurance company to its customer.
The HSBC Group has two customers in France that, during the first quarter of 2021, each received a local currency payment from an Iranian-owned bank in relation to management charges for property owned by the Iranian-owned bank. The HSBC Group processed these payments to its customers.
The HSBC Group has a customer in Hong Kong that, during the first quarter of 2021, received local currency salary payments from an Iranian-owned bank. The HSBC Group processed these payments to its customer.
For these activities, there was no measurable gross revenue or net profit to the HSBC Group during the first quarter of 2021.
Frozen accounts and transactions The HSBC Group and HSBC Bank USA maintain several accounts that are frozen as a result of relevant sanctions programs, and safekeeping boxes and other similar custodial relationships, for which no activity, except as licensed or otherwise authorized, took place during the first quarter of 2021. There was no measurable gross revenue or net profit to the HSBC Group during the first quarter of 2021 relating to these frozen accounts.
HSBC USA Inc.
117
Item 6. Exhibits
3(i) Articles of Incorporation and amendments and supplements thereto (incorporated by reference to Exhibit 3(a) to HSBC USA Inc.'s Annual Report on Form 10-K for the year ended December 31, 1999, Exhibit 3 to HSBC USA Inc.'s Quarterly Report on Form 10-Q for the quarter ended September 30, 2000, Exhibit 3.2 to HSBC USA Inc.'s Current Report on Form 8-K filed April 4, 2005, Exhibit 3.3 to HSBC USA Inc.'s Current Report on Form 8-K filed April 4, 2005, Exhibit 3.2 to HSBC USA Inc.'s Current Report on Form 8-K filed October 14, 2005, Exhibit 3.2 to HSBC USA Inc.'s Current Report on Form 8-K filed May 22, 2006 and Exhibit 3.2 to HSBC USA Inc.'s Current Report on Form 8-K filed on May 31, 2016).
3(ii) Bylaws of HSBC USA Inc., as Amended and Restated effective April 13, 2021 (incorporated by reference to Exhibit 3.2 to HSBC USA Inc.'s Current Report on Form 8-K filed April 14, 2021).
31 Certification of Chief Executive Officer and Chief Financial Officer pursuant to Section 302 of the Sarbanes-Oxley Act of 2002.
32 Certification of Chief Executive Officer and Chief Financial Officer pursuant to Section 906 of the Sarbanes-Oxley Act of 2002.
101.INS The instance document does not appear in the interactive data file because its XBRL tags are embedded within the Inline XBRL document(1)
101.SCH Inline XBRL Taxonomy Extension Schema Document(1)
101.CAL Inline XBRL Taxonomy Extension Calculation Linkbase Document(1)
101.DEF Inline XBRL Taxonomy Extension Definition Linkbase Document(1)
101.LAB Inline XBRL Taxonomy Extension Label Linkbase Document(1)
101.PRE Inline XBRL Taxonomy Extension Presentation Linkbase Document(1)
104 Cover Page Interactive Data File (formatted as Inline XBRL and contained in Exhibit 101)
(1) Pursuant to Rule 405 of Regulation S-T, includes the following financial information included in our Quarterly Report on Form 10-Q for the quarter ended March 31, 2021, formatted in Inline eXtensible Business Reporting Language ("Inline XBRL"): (i) the Consolidated Statement of Income (Loss) for the three months ended March 31, 2021 and 2020, (ii) the Consolidated Statement of Comprehensive Loss for the three months ended March 31, 2021 and 2020, (iii) the Consolidated Balance Sheet at March 31, 2021 and December 31, 2020, (iv) the Consolidated Statement of Changes in Equity for the three months ended March 31, 2021 and 2020, (v) the Consolidated Statement of Cash Flows for the three months ended March 31, 2021 and 2020, and (vi) the Notes to Consolidated Financial Statements.
HSBC USA Inc.
118
Signatures
Pursuant to the requirements of Section 13 or 15(d) of the Securities Exchange Act of 1934, HSBC USA Inc. has duly caused this report to be signed on its behalf by the undersigned, thereunto duly authorized.
Date: April 27, 2021
HSBC USA INC.
By: /s/ KAVITA MAHTANI Kavita Mahtani Senior Executive Vice President and
Chief Financial Officer
HSBC USA Inc.
119
EXHIBIT 31
CERTIFICATION OF CHIEF EXECUTIVE OFFICER AND CHIEF FINANCIAL OFFICERPURSUANT TO SECTION 302 OF THE SARBANES-OXLEY ACT OF 2002
Certification of Chief Executive Officer
I, Michael Roberts, certify that:
1. I have reviewed this report on Form 10-Q of HSBC USA Inc.;
2. Based on my knowledge, this report does not contain any untrue statement of a material fact or omit to state a material fact necessary to make the statements made, in light of the circumstances under which such statements were made, not misleading with respect to the period covered by this report;
3. Based on my knowledge, the financial statements, and other financial information included in this report, fairly present in all material respects the financial condition, results of operations and cash flows of the registrant as of, and for, the periods presented in this report;
4. The registrant’s other certifying officer and I are responsible for establishing and maintaining disclosure controls and procedures (as defined in Exchange Act Rules 13a-15(e) and 15d-15(e)) and internal control over financial reporting (as defined in Exchange Act Rules 13a-15(f) and 15d-15(f)) for the registrant and have:
a. designed such disclosure controls and procedures, or caused such disclosure controls and procedures to be designed under our supervision, to ensure that material information relating to the registrant, including its consolidated subsidiaries, is made known to us by others within those entities, particularly during the period in which this report is being prepared;
b. designed such internal control over financial reporting, or caused such internal control over financial reporting to be designed under our supervision, to provide reasonable assurance regarding the reliability of financial reporting and the preparation of financial statements for external purposes in accordance with generally accepted accounting principles;
c. evaluated the effectiveness of the registrant’s disclosure controls and procedures and presented in this report our conclusions about the effectiveness of the disclosure controls and procedures, as of the end of the period covered by this report based on such evaluation; and
d. disclosed in this report any change in the registrant’s internal control over financial reporting that occurred during the registrant’s most recent fiscal quarter (the registrant's fourth fiscal quarter in the case of an annual report) that has materially affected, or is reasonably likely to materially affect, the registrant’s internal control over financial reporting; and
5. The registrant’s other certifying officer and I have disclosed, based on our most recent evaluation of internal control over financial reporting, to the registrant’s auditors and the audit committee of the registrant’s board of directors (or persons performing the equivalent functions):
a. all significant deficiencies and material weaknesses in the design or operation of internal control over financial reporting which are reasonably likely to adversely affect the registrant’s ability to record, process, summarize and report financial information; and
b. any fraud, whether or not material, that involves management or other employees who have a significant role in the registrant’s internal control over financial reporting.
Date: April 27, 2021
/s/ MICHAEL ROBERTSMichael RobertsChairman of the Board, Presidentand Chief Executive Officer
Certification of Chief Financial Officer
I, Kavita Mahtani, certify that:
1. I have reviewed this report on Form 10-Q of HSBC USA Inc.;
2. Based on my knowledge, this report does not contain any untrue statement of a material fact or omit to state a material fact necessary to make the statements made, in light of the circumstances under which such statements were made, not misleading with respect to the period covered by this report;
3. Based on my knowledge, the financial statements, and other financial information included in this report, fairly present in all material respects the financial condition, results of operations and cash flows of the registrant as of, and for, the periods presented in this report;
4. The registrant’s other certifying officer and I are responsible for establishing and maintaining disclosure controls and procedures (as defined in Exchange Act Rules 13a-15(e) and 15d-15(e)) and internal control over financial reporting (as defined in Exchange Act Rules 13a-15(f) and 15d-15(f)) for the registrant and have:
a. designed such disclosure controls and procedures, or caused such disclosure controls and procedures to be designed under our supervision, to ensure that material information relating to the registrant, including its consolidated subsidiaries, is made known to us by others within those entities, particularly during the period in which this report is being prepared;
b. designed such internal control over financial reporting, or caused such internal control over financial reporting to be designed under our supervision, to provide reasonable assurance regarding the reliability of financial reporting and the preparation of financial statements for external purposes in accordance with generally accepted accounting principles;
c. evaluated the effectiveness of the registrant’s disclosure controls and procedures and presented in this report our conclusions about the effectiveness of the disclosure controls and procedures, as of the end of the period covered by this report based on such evaluation; and
d. disclosed in this report any change in the registrant’s internal control over financial reporting that occurred during the registrant’s most recent fiscal quarter (the registrant's fourth fiscal quarter in the case of an annual report) that has materially affected, or is reasonably likely to materially affect, the registrant’s internal control over financial reporting; and
5. The registrant’s other certifying officer and I have disclosed, based on our most recent evaluation of internal control over financial reporting, to the registrant’s auditors and the audit committee of the registrant’s board of directors (or persons performing the equivalent functions):
a. all significant deficiencies and material weaknesses in the design or operation of internal control over financial reporting which are reasonably likely to adversely affect the registrant’s ability to record, process, summarize and report financial information; and
b. any fraud, whether or not material, that involves management or other employees who have a significant role in the registrant’s internal control over financial reporting.
Date: April 27, 2021
/s/ KAVITA MAHTANIKavita MahtaniSenior Executive Vice President andChief Financial Officer
EXHIBIT 32
CERTIFICATION OF CHIEF EXECUTIVE OFFICER AND CHIEF FINANCIAL OFFICERPURSUANT TO SECTION 906 OF THE SARBANES-OXLEY ACT OF 2002
Certification Pursuant to 18 U.S.C. Section 1350, as Adopted Pursuant toSection 906 of the Sarbanes-Oxley Act of 2002
The certification set forth below is being submitted in connection with the HSBC USA Inc. (the “Company”) Quarterly Report on Form 10-Q for the period ending March 31, 2021 as filed with the Securities and Exchange Commission on the date hereof (the “Report”) for the purpose of complying with Rule 13a-14(b) or Rule 15d-14(b) of the Securities Exchange Act of 1934 (the “Exchange Act”) and Section 1350 of Chapter 63 of Title 18 of the United States Code.
I, Michael Roberts, certify that:
1. the Report fully complies with the requirements of Section 13(a) or 15(d) of the Exchange Act; and
2. the information contained in the Report fairly presents, in all material respects, the financial condition and results of operations of HSBC USA Inc.
Date: April 27, 2021
/s/ MICHAEL ROBERTSMichael RobertsChairman of the Board, Presidentand Chief Executive Officer
This certification accompanies each Report pursuant to Section 906 of the Sarbanes-Oxley Act of 2002 and shall not, except to the extent required by the Sarbanes-Oxley Act of 2002, be deemed filed by HSBC USA Inc. for purposes of Section 18 of the Securities Exchange Act of 1934, as amended.
The signed original of this written statement required by Section 906 of the Sarbanes-Oxley Act of 2002 has been provided to HSBC USA Inc. and will be retained by HSBC USA Inc. and furnished to the Securities and Exchange Commission or its staff upon request.
Certification pursuant to 18 U.S.C. Section 1350, as Adopted Pursuant toSection 906 of the Sarbanes-Oxley Act of 2002
The certification set forth below is being submitted in connection with the HSBC USA Inc. (the “Company”) Quarterly Report on Form 10-Q for the period ending March 31, 2021 as filed with the Securities and Exchange Commission on the date hereof (the “Report”) for the purpose of complying with Rule 13a-14(b) or Rule 15d-14(b) of the Securities Exchange Act of 1934 (the “Exchange Act”) and Section 1350 of Chapter 63 of Title 18 of the United States Code.
I, Kavita Mahtani, certify that:
1. the Report fully complies with the requirements of Section 13(a) or 15(d) of the Exchange Act; and
2. the information contained in the Report fairly presents, in all material respects, the financial condition and results of operations of HSBC USA Inc.
Date: April 27, 2021
/s/ KAVITA MAHTANIKavita MahtaniSenior Executive Vice President andChief Financial Officer
This certification accompanies each Report pursuant to Section 906 of the Sarbanes-Oxley Act of 2002 and shall not, except to the extent required by the Sarbanes-Oxley Act of 2002, be deemed filed by HSBC USA Inc. for purposes of Section 18 of the Securities Exchange Act of 1934, as amended.
The signed original of this written statement required by Section 906 of the Sarbanes-Oxley Act of 2002 has been provided to HSBC USA Inc. and will be retained by HSBC USA Inc. and furnished to the Securities and Exchange Commission or its staff upon request.