united states securities and exchange … · securities registered pursuant to section 12(b) of the...
TRANSCRIPT

UNITED STATESSECURITIES AND EXCHANGE COMMISSION
Washington, D. C. 20549
FORM 10-K
[�] ANNUAL REPORT PURSUANT TO SECTION 13 OR 15(d) OF THE SECURITIESEXCHANGE ACT OF 1934 for the fiscal year ended December 31, 2016
OR
[ ] TRANSITION REPORT PURSUANT TO SECTION 13 OR 15(d) OF THE SECURITIESEXCHANGE ACT OF 1934
For the transition period from ____________ to _________________
Commission file number 1-13163
YUM! BRANDS, INC.(Exact name of registrant as specified in its charter)
North Carolina 13-3951308(State or other jurisdiction of (I.R.S. Employerincorporation or organization) Identification No.)
1441 Gardiner Lane, Louisville, Kentucky 40213(Address of principal executive offices) (Zip Code)
Registrant’s telephone number, including area code: (502) 874-8300
Securities registered pursuant to Section 12(b) of the Act
Title of Each Class Name of Each Exchange on Which RegisteredCommon Stock, no par value New York Stock Exchange
Securities registered pursuant to Section 12(g) of the Act:None
Indicate by check mark if the registrant is a well-known seasoned issuer, as defined in Rule 405 of the Securities Act. Yes ü No
Indicate by check mark if the registrant is not required to file reports pursuant to Section 13 or Section 15(d) of the Act. Yes No ü Indicate by check mark whether the registrant (1) has filed all reports required to be filed by Section 13 or 15(d) of the Securities ExchangeAct of 1934 during the preceding 12 months (or for such shorter period that the registrant was required to file such reports), and (2) hasbeen subject to such filing requirements for the past 90 days. Yes ü No Indicate by check mark whether the registrant has submitted electronically and posted on its corporate Website, if any, every InteractiveData File required to be submitted and posted pursuant to Rule 405 of Regulation S-T during the preceding 12 months (or for such shorterperiod that the registrant was required to submit and post such files). Yes ü No Indicate by check mark if disclosure of delinquent filers pursuant to Item 405 of Regulation S-K is not contained herein, and will not becontained, to the best of registrant’s knowledge, in definitive proxy or information statements incorporated by reference in Part III of thisForm 10-K or any amendment to this Form 10-K. [ü]
Indicate by check mark whether the registrant is a large accelerated filer, an accelerated filer, a non-accelerated filer or a smaller reportingcompany. See definitions of “large accelerated filer”, “accelerated filer” and “smaller reporting company” in Rule 12b-2 of the ExchangeAct (Check one): Large accelerated filer: [ü] Accelerated filer: [ ] Non-accelerated filer: [ ] Smaller reporting company: [ ] Indicate by check mark whether the registrant is a shell company (as defined in Rule 12b-2 of the Exchange Act). Yes No ü

The aggregate market value of the voting stock (which consists solely of shares of Common Stock) held by non-affiliates ofthe registrant as of June 11, 2016 computed by reference to the closing price of the registrant’s Common Stock on the New YorkStock Exchange Composite Tape on such date was approximately $31.1 billion. All executive officers and directors of the registranthave been deemed, solely for the purpose of the foregoing calculation, to be “affiliates” of the registrant. The number of sharesoutstanding of the registrant’s Common Stock as of February 14, 2017 was 353,844,095 shares.
Documents Incorporated by Reference
Portions of the definitive proxy statement furnished to shareholders of the registrant in connection with the annual meetingof shareholders to be held on May 19, 2017 are incorporated by reference into Part III.

Forward-Looking Statements
In this Form 10-K, as well as in other written reports and oral statements, we present “forward-looking statements” within themeaning of Section 27A of the Securities Act of 1933, as amended, and Section 21E of the Securities Exchange Act of 1934, asamended. We intend all forward-looking statements to be covered by the safe harbor provisions of the Private Securities LitigationReform Act of 1995, and we are including this statement for purposes of complying with those safe harbor provisions.
Forward-looking statements can be identified by the fact that they do not relate strictly to historical or current facts and by the useof forward-looking words such as “expect,” “expectation,” “believe,” “anticipate,” “may,” “could,” “intend,” “belief,” “plan,”“estimate,” “target,” “predict,” “likely,” “seek,” “project,” “model,” “ongoing,” “will,” “should,” “forecast,” “outlook” or similarterminology. Forward-looking statements are based on our current expectations, estimates, assumptions and/or projections as wellas our perception of historical trends and current conditions, as well as other factors that we believe are appropriate and reasonableunder the circumstances. Forward-looking statements are neither predictions nor guarantees of future events, circumstances orperformance and are inherently subject to known and unknown risks, uncertainties and assumptions that could cause our actualresults to differ materially from those indicated by those statements. There can be no assurance that our expectations, estimates,assumptions and/or projections will be achieved. Factors that could cause actual results and events to differ materially from ourexpectations and forward-looking statements include (i) the risks and uncertainties described in the Risk Factors included in PartI, Item 1A of this Form 10-K and (ii) the factors described in Management’s Discussion and Analysis of Financial Condition andResults of Operations included in Part II, Item 7 of this Form 10-K. You should not place undue reliance on forward-lookingstatements, which speak only as of the date hereof. The forward-looking statements included in this Form 10-K are only made asof the date of this Form 10-K and we disclaim any obligation to publicly update any forward-looking statement to reflect subsequentevents or circumstances.
2

PART I
3
Item 1. Business.
YUM! Brands, Inc. (referred to herein as “YUM”, the “Registrant” or the “Company”), was incorporated under the laws of thestate of North Carolina in 1997. The principal executive offices of YUM are located at 1441 Gardiner Lane, Louisville,Kentucky 40213, and the telephone number at that location is (502) 874-8300. Our website address is http://yum.com.
YUM, together with its subsidiaries, is referred to in this Form 10-K annual report (“Form 10-K”) as the Company. The terms“we,” “us” and “our” are also used in the Form 10-K to refer to the Company. Throughout this Form 10-K, the terms “restaurants,”“stores” and “units” are used interchangeably. While YUM! Brands, Inc., referred to as the Company, does not directly own oroperate any restaurants, throughout this document we may refer to restaurants that are owned or operated by our subsidiaries asbeing Company-owned.
Financial Information about Operating Segments and General Development of the Business
As of December 31, 2016, YUM consists of three operating segments:
• The KFC Division which includes the worldwide operations of the KFC concept• The Pizza Hut Division which includes the worldwide operations of the Pizza Hut concept• The Taco Bell Division which includes the worldwide operations of the Taco Bell concept
Effective January 2016, the India Division was segmented by brand, integrated into the global KFC, Pizza Hut and Taco BellDivisions, and is no longer a separate operating segment. While our consolidated results were not impacted, we have restated ourhistorical segment information for consistent presentation.
On October 31, 2016 (the “Distribution Date”), we completed the spin-off of our China business (the "Separation") into anindependent, publicly-traded company under the name of Yum China Holdings, Inc. (“Yum China”). On the Distribution Date,we distributed to each of our shareholders of record as of the close of business on October 19, 2016 (the “Record Date”) one shareof Yum China common stock for each share of our Common Stock held as of the Record Date. The distribution was structured tobe a tax free distribution to our U.S. shareholders for federal income tax purposes in the United States. Yum China’s commonstock now trades on the New York Stock Exchange ("NYSE") under the symbol “YUMC.” After the distribution, we do notbeneficially own any shares of Yum China common stock.
Concurrent with the Separation, a subsidiary of the Company entered into a Master License Agreement with a subsidiary of YumChina for the exclusive right to use and sublicense the use of intellectual property owned by YUM and its affiliates for thedevelopment and operation of KFC, Pizza Hut and Taco Bell restaurants in China. Prior to the Separation, our operations inmainland China were reported in our former China Division segment results. As a result of the Separation, the results of operations,assets and liabilities, and cash flows of the separated business are presented as discontinued operations in our ConsolidatedStatements of Income, Consolidated Balance Sheets and Consolidated Statements of Cash Flows for all periods presented. Seeadditional information related to the impact of the Separation in Item 8, Note 4 to the Consolidated Financial Statements.
Operating segment information for the years ended December 31, 2016, December 26, 2015 and December 27, 2014 for theCompany is included in Part II, Item 7, Management's Discussion and Analysis of Financial Condition and Results of Operations("MD&A") and in the related Consolidated Financial Statements in Part II, Item 8.
Narrative Description of Business
General
YUM has over 43,500 restaurants in more than 135 countries and territories. Through the three concepts of KFC, Pizza Hut andTaco Bell (the “Concepts”), the Company develops, operates or franchises a worldwide system of restaurants which prepare,package and sell a menu of competitively priced food items. Units are operated by a Concept or by independent franchisees orlicensees under the terms of franchise or license agreements, which require payment of sales-based fees for use of our Concepts'brands. The terms "franchise" or "franchisee" within this Form 10-K are meant to describe third parties that operate units undereither franchise or license agreements. Franchisees can range in size from individuals owning just one restaurant to large publicly-traded companies.

Restaurant Concepts
Most restaurants in each Concept offer consumers the ability to dine in and/or carry out food. In addition, Taco Bell and KFCoffer a drive-thru option in many stores. Pizza Hut offers a drive-thru option on a much more limited basis. Pizza Hut typicallyoffers delivery service, as does KFC on a more limited basis primarily in China.
Each Concept has proprietary menu items and emphasizes the preparation of food with high quality ingredients, as well as uniquerecipes and special seasonings to provide appealing, tasty and convenient food at competitive prices.
The franchise programs of the Company are designed to promote consistency and quality, and the Company is selective in grantingfranchises. The Company utilizes both store-level franchise and master franchise programs to grow its businesses. Under store-level franchise agreements, franchisees supply capital – initially by paying a franchise fee to YUM, by purchasing or leasing theland, building, equipment, signs, seating, inventories and supplies and, over the longer term, by reinvesting in thebusiness. Franchisees contribute to the Company’s revenues on an ongoing basis through the payment of royalties based on apercentage of sales (usually 4% - 6%). Under master franchise arrangements, the Company enters into agreements that allowmaster franchisees to operate restaurants as well as sub-franchise within certain geographic territories. Master franchisees areresponsible for overseeing development within their territories and collect initial fees and royalties from sub-franchisees. Masterfranchisees often pay royalties at a reduced rate to the Company. Our largest master franchisee, Yum China, pays a 3% licensefee on system sales of our Concepts in mainland China to the Company.
The Company believes that it is important to maintain strong and open relationships with its franchisees and their representatives. Tothis end, the Company invests a significant amount of time working with the franchisee community and their representativeorganizations on key aspects of the business, including products, equipment, operational improvements and standards andmanagement techniques.
Following is a brief description of each Concept:
KFC
• KFC was founded in Corbin, Kentucky by Colonel Harland D. Sanders, an early developer of the quick service foodbusiness and a pioneer of the restaurant franchise concept. The Colonel perfected his secret blend of 11 herbs and spicesfor Kentucky Fried Chicken in 1939 and signed up his first franchisee in 1952.
• KFC operates in 128 countries and territories throughout the world. As of year end 2016, KFC had 20,604 units. 93percent of the KFC units are franchised.
• KFC restaurants across the world offer fried and non-fried chicken products such as sandwiches, chicken strips, chicken-on-the-bone and other chicken products marketed under a variety of names. KFC restaurants also offer a variety ofentrees and side items suited to local preferences and tastes. Restaurant decor throughout the world is characterized bythe image of the Colonel.
Pizza Hut
• The first Pizza Hut restaurant was opened in 1958 in Wichita, Kansas, and within a year, the first franchise unit wasopened. Today, Pizza Hut is the largest restaurant chain in the world specializing in the sale of ready-to-eat pizza products.
• Pizza Hut operates in 103 countries and territories throughout the world. As of year end 2016, Pizza Hut had 16,409units. 97 percent of the Pizza Hut units are franchised.
• Pizza Hut operates in the delivery, carryout and casual dining segments around the world. Outside of the U.S., Pizza Hutoften uses unique branding to differentiate these segments. Additionally, a growing percentage of Pizza Hut's customerorders are being generated digitally.
• Pizza Hut features a variety of pizzas which are marketed under varying names. Each of these pizzas is offered with avariety of different toppings suited to local preferences and tastes. Many Pizza Huts also offer pasta and chicken wings,including approximately 5,900 stores offering wings under the brand WingStreet in the U.S. Outside the U.S., Pizza Hutcasual dining restaurants offer a variety of core menu products other than pizza, which are typically suited to localpreferences and tastes. Pizza Hut units feature a distinctive red roof logo on their signage.
4

Taco Bell
• The first Taco Bell restaurant was opened in 1962 by Glen Bell in Downey, California, and in 1964, the first Taco Bellfranchise was sold.
• Taco Bell operates in 22 countries and territories throughout the world. As of year end 2016, there were 6,604 Taco Bellunits, primarily in the U.S. 87 percent of the Taco Bell units are franchised.
• Taco Bell specializes in Mexican-style food products, including various types of tacos, burritos, quesadillas, salads,nachos and other related items. Taco Bell offers breakfast items in its U.S. stores. Taco Bell units feature a distinctivebell logo on their signage.
Restaurant Operations
Through its Concepts, YUM develops, operates and franchises a worldwide system of both traditional and non-traditional QuickService Restaurants ("QSR"). Traditional units feature dine-in, carryout and, in some instances, drive-thru or deliveryservices. Non-traditional units include express units and kiosks which have a more limited menu, usually generate lower salesvolumes and operate in non-traditional locations like malls, airports, gasoline service stations, train stations, subways, conveniencestores, stadiums, amusement parks and colleges, where a full-scale traditional outlet would not be practical or efficient.
Restaurant management structure varies by Concept and unit size. Generally, each Concept-owned restaurant is led by a restaurantgeneral manager (“RGM”), together with one or more assistant managers, depending on the operating complexity and sales volumeof the restaurant. Each Concept issues detailed manuals, which may then be customized to meet local regulations and customs.These manuals set forth standards and requirements for all aspects of restaurant operations, including food safety and quality, foodhandling and product preparation procedures, equipment maintenance, facility standards and accounting control procedures. Therestaurant management teams are responsible for the day-to-day operation of each unit and for ensuring compliance with operatingstandards. CHAMPS – which stands for Cleanliness, Hospitality, Accuracy, Maintenance, Product Quality and Speed of Service– is our proprietary systemwide program for training, measuring and rewarding employee performance against key customermeasures. CHAMPS is intended to align the operating processes of our entire system around one core set of standards. RGMs’efforts, including CHAMPS performance measures, are monitored by Area Coaches, where sufficient scale allows. Area Coachestypically work with approximately six to twelve restaurants. Various senior operators visit restaurants from time to time to promoteadherence to system standards and mentor restaurant team members.
Supply and Distribution
The Company and franchisees of the Concepts are substantial purchasers of a number of food and paper products, equipment andother restaurant supplies. The principal items purchased include chicken, cheese, beef and pork products, paper and packagingmaterials. The Company has not experienced any significant continuous shortages of supplies, and alternative sources for mostof these products are generally available. Prices paid for these supplies fluctuate. When prices increase, the Concepts may attemptto pass on such increases to their customers, although there is no assurance that this can be done practically.
In the U.S., the Company, along with the representatives of the Company’s KFC, Pizza Hut and Taco Bell franchisee groups, aremembers of Restaurant Supply Chain Solutions, LLC (“RSCS"), which is responsible for purchasing certain restaurant productsand equipment. The core mission of RSCS is to provide the lowest possible sustainable store-delivered prices for restaurantproducts and equipment. This arrangement combines the purchasing power of the Company-owned and franchisee restaurantswhich the Company believes leverages the system’s scale to drive cost savings and effectiveness in the purchasing function. TheCompany also believes that RSCS fosters closer alignment of interests and a stronger relationship with its franchisee community.
Most food products, paper and packaging supplies, and equipment used in restaurant operations are distributed to individualrestaurant units by third-party distribution companies. In the U.S., McLane Foodservice, Inc. is the exclusive distributor for themajority of items used in Company-owned restaurants and for a substantial number of franchisee stores.
Outside the U.S., we and our franchisees primarily use decentralized sourcing and distribution systems involving many differentglobal, regional and local suppliers and distributors. We and our franchisees have approximately 5,800 food and paper suppliers,including U.S.-based suppliers that export to many countries.
5
Trademarks and Patents
The Company and its Concepts own numerous registered trademarks and service marks. The Company believes that many ofthese marks, including its Kentucky Fried Chicken®, KFC®, Pizza Hut® and Taco Bell® marks, have significant value and arematerially important to its business. The Company’s policy is to pursue registration of its important marks whenever feasible andto oppose vigorously any infringement of its marks.
The use of these marks by franchisees has been authorized in our franchise agreements. Under current law and with proper use,the Company’s rights in its marks can generally last indefinitely. The Company also has certain patents on restaurant equipmentwhich, while valuable, are not material to its business.
Working Capital
Information about the Company’s working capital is included in MD&A in Part II, Item 7 and the Consolidated Statements ofCash Flows in Part II, Item 8.
Seasonal Operations
The Company does not consider its operations to be seasonal to any material degree.
Competition
The retail food industry, in which our Concepts compete, is made up of supermarkets, supercenters, warehouse stores, conveniencestores, coffee shops, snack bars, delicatessens and restaurants (including the QSR segment), and is intensely competitive withrespect to price and quality of food products, new product development, advertising levels and promotional initiatives, customerservice reputation, restaurant location and attractiveness and maintenance of properties. Competition from delivery aggregatorsand other food delivery services has also increased in recent years, particularly in urbanized areas. The industry is often affectedby changes in consumer tastes; national, regional or local economic conditions; currency fluctuations; demographic trends; trafficpatterns; the type, number and location of competing food retailers and products; and disposable purchasing power. Each of theConcepts competes with international, national and regional restaurant chains as well as locally-owned restaurants, not only forcustomers, but also for management and hourly personnel, suitable real estate sites and qualified franchisees. Given the varioustypes and vast number of competitors, our Concepts do not constitute a significant portion of the retail food industry in terms ofnumber of system units or system sales, either on a worldwide or individual country basis.
Research and Development (“R&D”)
The Company operates R&D facilities in Plano, Texas (KFC and Pizza Hut Divisions); Irvine, California (Taco Bell Division);Louisville, Kentucky (KFC U.S.) and several other locations outside the U.S. In addition to Company R&D, we regularly alsoengage independent suppliers to conduct research and development activities for the benefit of the YUM system. The Companyexpensed $24 million, $24 million and $25 million in 2016, 2015 and 2014, respectively, for R&D activities.
Environmental Matters
The Company is not aware of any federal, state or local environmental laws or regulations that will materially affect its earningsor competitive position, or result in material capital expenditures. However, the Company cannot predict the effect on its operationsof possible future environmental legislation or regulations. During 2016, there were no material capital expenditures forenvironmental control facilities and no such material expenditures are anticipated.
Government Regulation
U.S. Operations. The Company and its U.S. operations are subject to various federal, state and local laws affecting its business,including laws and regulations concerning information security, labor and employment, health, marketing, food labeling, sanitationand safety. Each of the Concepts’ restaurants in the U.S. must comply with licensing and regulation by a number of governmentalauthorities, which include health, sanitation, safety, fire and zoning agencies in the state and/or municipality in which the restaurantis located. In addition, each Concept must comply with various state and federal laws that regulate the franchisor/franchiseerelationship. To date, the Company has not been materially adversely affected by such licensing and regulation or by any difficulty,delay or failure to obtain required licenses or approvals.
6
International Operations. The Company’s restaurants outside the U.S. are subject to national and local laws and regulations whichare similar to those affecting U.S. restaurants. The restaurants outside the U.S. are also subject to tariffs and regulations on importedcommodities and equipment and laws regulating foreign investment, as well as anti-bribery and anti-corruption laws.
See Item 1A "Risk Factors" for a discussion of risks relating to federal, state, local and international regulation of our business.
Employees
As of year end 2016, the Company and its subsidiaries employed approximately 90,000 persons. The Company believes that itprovides working conditions and compensation that compare favorably with those of its principal competitors. The majority ofemployees are paid on an hourly basis. Some employees are subject to labor council relationships that vary due to the diversecultures in which the Company operates. The Company and its Concepts consider their employee relations to be good.
Financial Information about Geographic Areas
Financial information about our significant geographic areas is incorporated herein by reference from the related ConsolidatedFinancial Statements in Part II, Item 8.
Available Information
The Company makes available through the Investor Relations section of its internet website at http://yum.com its annual reporton Form 10-K, quarterly reports on Form 10-Q, current reports on Form 8-K and amendments to those reports filed or furnishedpursuant to Section 13(a) or 15(d) of the Exchange Act, as soon as reasonably practicable after electronically filing such materialwith the Securities and Exchange Commission ("SEC") at http://www.sec.gov. These reports may also be obtained by visitingthe SEC's Public Reference Room at 100 F Street, NE, Washington, DC 20549 or by calling the SEC at 1 (800) SEC-0330.
Our Corporate Governance Principles and our Code of Conduct are also located within the Investor Relations section of theCompany's website. The reference to the Company’s website address does not constitute incorporation by reference of theinformation contained on the website and should not be considered part of this document. These documents, as well as our SECfilings, are available in print free of charge to any shareholder who requests a copy from our Investor Relations Department.
7
Item 1A. Risk Factors.
You should carefully review the risks described below as they identify important factors that could cause our actual results todiffer materially from our forward-looking statements and historical trends.
Food safety and food-borne illness concerns may have an adverse effect on our business.
Food-borne illnesses, such as E. coli, hepatitis A, trichinosis and salmonella, occur or may occur within our system from time totime. In addition, food safety issues such as food tampering, contamination and adulteration occur or may occur within our systemfrom time to time. Any report or publicity linking us or one of our Concepts’ restaurants, including restaurants operated by us orour Concepts’ franchisees, or linking our competitors or our industry generally, to instances of food-borne illness or food safetyissues could adversely affect our Concepts’ brands and reputations as well as our revenues and profits, and possibly lead to productliability claims, litigation and damages. If a customer of our Concepts becomes ill as a result of food safety issues, restaurants inour system may be temporarily closed, which would decrease our revenues. In addition, instances or allegations of food-borneillness or food safety issues, real or perceived, involving our restaurants, restaurants of competitors, or suppliers or distributors(regardless of whether we use or have used those suppliers or distributors), or otherwise involving the types of food served at ourrestaurants, could result in negative publicity that could adversely affect our sales or the sales of our Concepts’ franchisees. Theoccurrence of food-borne illnesses or food safety issues could also adversely affect the price and availability of affected ingredients,which could result in disruptions in our supply chain and/or lower margins for us and our Concepts’ franchisees.
Health concerns arising from outbreaks of viruses or other diseases may have an adverse effect on our business.
Our business could be materially and adversely affected by the outbreak of a widespread health epidemic, including various strainsof avian flu or swine flu, such as H1N1. The occurrence of such an outbreak of an epidemic illness or other adverse public healthdevelopments could materially disrupt our business and operations. Such events could also significantly impact our industry andcause a temporary closure of restaurants, which would severely disrupt our operations and have a material adverse effect on ourbusiness, financial condition and results of operations.

Our operations could be disrupted if any of our employees or employees of our business partners were suspected of having theavian flu or swine flu, since this could require us or our business partners to quarantine some or all of such employees or disinfectour restaurant facilities. Outbreaks of avian flu occur from time to time around the world, and such outbreaks have resulted inconfirmed human cases. It is possible that outbreaks could reach pandemic levels. Public concern over avian flu generally maycause fear about the consumption of chicken, eggs and other products derived from poultry, which could cause customers toconsume less poultry and related products. This would likely result in lower revenues and profits. Avian flu outbreaks could alsoadversely affect the price and availability of poultry, which could negatively impact our profit margins and revenues.
Furthermore, other viruses may be transmitted through human contact, and the risk of contracting viruses could cause employeesor guests to avoid gathering in public places, which could adversely affect restaurant guest traffic or the ability to adequately staffrestaurants. We could also be adversely affected if jurisdictions in which our Concepts’ restaurants operate impose mandatoryclosures, seek voluntary closures or impose restrictions on operations of restaurants. Even if such measures are not implementedand a virus or other disease does not spread significantly, the perceived risk of infection or health risk may affect our business.
Our operating results and growth strategies are closely and increasingly tied to the success of our Concepts’ franchisees.
A significant and growing portion of our restaurants are operated by our Concepts’ franchisees. In October 2016, in connectionwith the spin-off of our China business, we announced our plan to become at least 98% franchised by the end of 2018. Ourrefranchising efforts will increase our dependence on the financial success and cooperation of our Concepts’ franchisees. Inaddition, our long-term system sales growth targets depend on an acceleration of our historical net system unit growth rate. Nearlyall of this unit growth is expected to result from new unit openings by our franchisees. If our franchisees do not meet our expectationsfor new unit development, we may fall short of our system sales growth targets.
We have limited control over how our Concepts’ franchisees’ businesses are run, and the inability of franchisees to operatesuccessfully could adversely affect our operating results through decreased royalty payments. If our Concepts’ franchisees incurtoo much debt, if their operating expenses or commodity prices increase or if economic or sales trends deteriorate such that theyare unable to operate profitably or repay existing debt, it could result in their financial distress, including insolvency orbankruptcy. If a significant franchisee or a significant number of our Concepts’ franchisees become financially distressed, ouroperating results could be impacted through reduced or delayed royalty payments. In addition, we are contingently liable on certainof our Concepts’ franchisees’ lease agreements, including lease agreements that we have guaranteed or assigned to franchisees inconnection with refranchising of certain Company restaurants, and our operating results could be impacted by any increased rentobligations for such leased properties.
Our success also depends on the willingness and ability of our Concepts’ franchisees to implement major initiatives, which mayinclude financial investment. Our Concepts may be unable to successfully implement strategies that we believe are necessary forfurther growth if their franchisees do not participate, which in turn may harm the growth prospects and financial condition of theCompany. Additionally, the failure of our Concepts’ franchisees to focus on the fundamentals of restaurant operations, such asquality service and cleanliness (even if such failures do not rise to the level of breaching the related franchise documents), couldhave a negative impact on our business.
We may not successfully implement our transformation initiatives or fully realize the anticipated benefits from the transformation.
On October 11, 2016, we announced our strategic transformation plans to drive global expansion of our KFC, Pizza Hut and TacoBell brands following the spin-off of our China business. Among other things, this transformation includes a plan to become atleast 98% franchised by the end of 2018 and to significantly reduce annual capital expenditures and our general and administrativecosts, each by the end of 2019. We cannot assure you that we will be able to successfully implement our transformation initiatives.Further, our ability to achieve the anticipated benefits of this transformation, including the anticipated levels of cost savings andefficiency, within expected timeframes is subject to many estimates and assumptions, which are, in turn, subject to significanteconomic, competitive and other uncertainties, some of which are beyond our control. There is no assurance that we will successfullyimplement, or fully realize the anticipated positive impact of, our transformation initiatives or execute successfully on ourtransformation strategy, in the expected timeframes or at all. In addition, there can be no assurance that our efforts, if properlyexecuted, will result in our desired outcome of improved financial performance.
We have significant exposure to the Chinese market through our largest franchisee, Yum China, which subjects us to risks thatcould negatively affect our business.
In connection with the spin-off of our China business in October 2016, we entered into a Master License Agreement with YumChina pursuant to which Yum China is the exclusive licensee of the KFC, Pizza Hut and Taco Bell Concepts and their related
8

marks and other intellectual property rights for restaurant services in China. Following the spin-off, Yum China is now our largestfranchisee, and our overall financial results are significantly affected by Yum China’s results, and our business is exposed to risksin China. These risks include, among others, changes in economic conditions (including consumer spending, unemployment levelsand wage and commodity inflation), consumer preferences, the regulatory environment, as well as increased media scrutiny ofour business and industry, fluctuations in foreign exchange rates and increased competition. In addition, any significant orprolonged deterioration in U.S.-China relations could adversely affect our China operations if Chinese consumers reduce thefrequency of their visits to Yum China’s restaurants. Chinese law regulates the scope of our business conducted within China.Our business is therefore subject to numerous uncertainties based on the policies of the Chinese government, as they may changefrom time to time.
Our relationship with Yum China is governed by a Master License Agreement, which may be terminated upon the occurrence ofcertain events, such as the insolvency or bankruptcy of Yum China. In addition, if we are unable to enforce our intellectual propertyor contract rights in China, if Yum China is unable or unwilling to satisfy its obligations under the Master License Agreement, orif the Master License Agreement is otherwise terminated, it could result in an interruption in the operation of our brands that havebeen exclusively licensed to Yum China for use in China. Such interruption could result in a delay in or loss of royalty incometo us, which would negatively impact our financial results.
Our international operations subject us to risks that could negatively affect our business.
A significant portion of our Concepts’ restaurants are operated in countries and territories outside of the U.S., including in emergingmarkets, and we intend to continue expansion of our international operations. As a result, our business is increasingly exposedto risks inherent in international operations. These risks, which can vary substantially by country, include political instability,corruption and social and ethnic unrest, as well as changes in economic conditions (including consumer spending, unemploymentlevels and wage and commodity inflation), the regulatory environment, income and non-income based tax rates and laws, foreignexchange control regimes, consumer preferences and the laws and policies that govern foreign investment in countries where ourrestaurants are operated. In addition, our franchisees do business in jurisdictions that may be subject to trade or economic sanctionregimes. Any failure to comply with such sanction regimes or other similar laws or regulations could result in the assessment ofdamages, the imposition of penalties, suspension of business licenses, or a cessation of operations at our franchisees’ businesses,as well as damage to our and our Concepts’ brands’ images and reputations, all of which could harm our profitability.
Foreign currency risks and foreign exchange controls could adversely affect our financial results. Our results of operations and the value of our foreign assets are affected by fluctuations in currency exchange rates, which mayadversely affect reported earnings. More specifically, an increase in the value of the U.S. dollar relative to other currencies, suchas the Chinese Renminbi (“RMB”), Australian Dollar, the British Pound and the Euro, as well as currencies in certain other markets,such as the Malaysian Ringgit and Russian Ruble, could have an adverse effect on our reported earnings. There can be no assuranceas to the future effect of any such changes on our results of operations, financial condition or cash flows. In addition, the Chinesegovernment restricts the convertibility of RMB into foreign currencies and, in certain cases, the remittance of currency out ofChina. Yum China’s income is almost exclusively derived from the earnings of its Chinese subsidiaries, with substantially allrevenues of its Chinese subsidiaries denominated in RMB. Any significant fluctuation in the value of the RMB could materiallyimpact the U.S. dollar value of royalty payments made to us by Yum China, which could result in lower revenues. In additionrestrictions on the conversion of RMB to U.S. dollars or further restrictions on the remittance of currency out of China could resultin delays in the remittance of Yum China’s license fee, which could impact our liquidity.
Failure to protect the integrity and security of personal information of our customers and employees could result in substantialcosts, expose us to litigation and damage our reputation.
We receive and maintain certain personal, financial and other information about our customers, employees and franchisees. Theuse and handling of this information is regulated by evolving and increasingly demanding laws and regulations in variousjurisdictions, as well as by certain third-party contracts. If our security and information systems are compromised as a result ofdata corruption or loss, cyber-attack or a network security incident or if our employees, franchisees or vendors fail to comply withthese laws and regulations and this information is obtained by unauthorized persons or used inappropriately, it could result inliabilities and penalties and could damage our reputation, cause us to incur substantial costs and result in a loss of customerconfidence, which could adversely affect our results of operations and financial condition. Additionally, we could be subject tolitigation and government enforcement actions as a result of any such failure.
Further, data privacy is subject to frequently changing rules and regulations, which sometimes conflict among the variousjurisdictions and countries where we, our Concepts and our Concepts’ franchisees do business. Our failure to adhere to or
9

successfully implement appropriate processes in this area could result in legal liability or impairment to our and our brands’reputations.
Our inability or failure to recognize, respond to and effectively manage the accelerated impact of social media could adverselyimpact our business.
In recent years, there has been a marked increase in the use of social media platforms, including blogs, chat platforms, social mediawebsites, and other forms of Internet-based communications which allow individuals access to a broad audience of consumersand other interested persons. The rising popularity of social media and other consumer-oriented technologies has increased thespeed and accessibility of information dissemination. Many social media platforms immediately publish the content theirsubscribers and participants post, often without filters or checks on accuracy of the content posted. Information posted on suchplatforms at any time may be adverse to our interests and/or may be inaccurate. The dissemination of information via social mediacould harm our business, reputation, financial condition, and results of operations, regardless of the information’s accuracy. Thedamage may be immediate without affording us an opportunity for redress or correction.
In addition, social media is frequently used by our Concepts to communicate with their respective customers and the public ingeneral. Failure by our Concepts to use social media effectively or appropriately, particularly as compared to our Concept’srespective competitors, could lead to a decline in brand value, customer visits and revenue. Other risks associated with the useof social media include improper disclosure of proprietary information, negative comments about our Concepts’ brands, exposureof personally identifiable information, fraud, hoaxes or malicious dissemination of false information. The inappropriate use ofsocial media by our customers or employees could increase our costs, lead to litigation or result in negative publicity that coulddamage our reputation and adversely affect our results of operations.
Shortages or interruptions in the availability and delivery of food and other supplies may increase costs or reduce revenues.
The products sold by our Concepts and their franchisees are sourced from a wide variety of domestic and international suppliers.We, along with our Concepts’ franchisees, are also dependent upon third parties to make frequent deliveries of food products andsupplies that meet our specifications at competitive prices. Shortages or interruptions in the supply of food items and other suppliesto our restaurants could adversely affect the availability, quality and cost of items we use and the operations of our restaurants. Suchshortages or disruptions could be caused by inclement weather, natural disasters, increased demand, problems in production ordistribution, restrictions on imports or exports, the inability of vendors to obtain credit, political instability in the countries inwhich suppliers and distributors are located, the financial instability of suppliers and distributors, suppliers’ or distributors’ failureto meet our standards, product quality issues, inflation, other factors relating to the suppliers and distributors and the countries inwhich they are located, food safety warnings or advisories or the prospect of such pronouncements, the cancellation of supply ordistribution agreements or an inability to renew such arrangements or to find replacements on commercially reasonable terms, orother conditions beyond our control or the control of our Concepts’ franchisees. In the U.S., the Company, along withrepresentatives of the Company’s KFC, Pizza Hut and Taco Bell franchisee groups, are members of Restaurant Supply ChainSolutions, LLC (“RSCS"), which is responsible for purchasing certain restaurant products and equipment. Any failure or inabilityof RSCS to perform its purchasing obligations could result in shortages or interruptions in the availability of food and othersupplies.
A shortage or interruption in the availability of certain food products or supplies could increase costs and limit the availability ofproducts critical to restaurant operations, which in turn could lead to restaurant closures and/or a decrease in sales. In addition,failure by a key supplier or distributor for our Concepts and/or our Concepts’ franchisees to meet its service requirements couldlead to a disruption of service or supply until a new supplier or distributor is engaged, and any disruption could have an adverseeffect on our business.
We may not achieve our target development goals, aggressive development could cannibalize existing sales and new restaurantsmay not be profitable.
Our growth strategy depends on our and our franchisees’ ability to increase our net restaurant count in markets around the world,especially in emerging markets. The successful development of new units depends in large part on the ability of our Concepts’franchisees to open new restaurants and to operate these restaurants profitably. We cannot guarantee that we, or our Concepts’franchisees, including Yum China, will be able to achieve our expansion goals or that new restaurants will be operatedprofitably. Further, there is no assurance that any new restaurant will produce operating results similar to those of our existingrestaurants. Other risks that could impact our ability to increase the number of our restaurants include prevailing economicconditions and our, or our Concepts’ franchisees’, ability to obtain suitable restaurant locations, negotiate acceptable lease orpurchase terms for the locations, obtain required permits and approvals in a timely manner, hire and train qualified restaurantcrews and meet construction schedules.
10

Expansion into target markets could also be affected by our Concepts’ franchisees’ ability to obtain financing to construct andopen new restaurants. If it becomes more difficult or more expensive for our Concepts’ franchisees to obtain financing to developnew restaurants, the expected growth of our system could slow and our future revenues and operating cash flows could be adverselyimpacted.
In addition, the new restaurants could impact the sales of our Concepts’ existing restaurants nearby. There can be no assurancethat sales cannibalization will not occur or become more significant in the future as we increase our presence in existing markets.
Labor shortages or difficulty finding qualified employees could slow our growth, harm our business and reduce our profitability.
Restaurant operations are highly service-oriented and our success depends in part upon our and our Concepts’ franchisees’ abilityto attract, retain and motivate a sufficient number of qualified employees, including restaurant managers and other crew members.The market for qualified employees in our industry is very competitive. Any future inability to recruit and retain qualified individualsmay delay the planned openings of new restaurants by us and our Concepts’ franchisees and could adversely impact our Concepts’existing restaurants. Any such delays, material increases in employee turnover rate in existing restaurants or widespread employeedissatisfaction could have a material adverse effect on our and our Concepts’ franchisees’ business and results of operations.
In addition, strikes, work slowdowns or other job actions may become more common in the U.S. In the event of a strike, workslowdown or other labor unrest, the ability to adequately staff our Concept’s restaurants could be impaired, which could result inreduced revenue and customer claims, and may distract our management from focusing on our business and strategic priorities.
Changes in labor and other operating costs could adversely affect our results of operations.
An increase in the costs of employee wages, benefits and insurance (including workers’ compensation, general liability, propertyand health) as well as other operating costs such as rent and energy costs could adversely affect our operating results. Suchincreases could result from government imposition of higher minimum wages or from general economic or competitive conditions.Any increase in such operating expenses could adversely affect our and our Concepts’ franchisees’ profit margins. In addition,competition for qualified employees could also compel us or our Concepts’ franchisees to pay higher wages to attract or retainkey crew members, which could result in higher labor costs and decreased profitability.
A broader standard for determining joint employer status may adversely affect our business operations and increase our liabilitiesresulting from actions by our Concepts’ franchisees.
In 2015, the National Labor Relations Board (the “NLRB”) adopted a new and broader standard for determining when two ormore otherwise unrelated employers may be found to be a joint employer of the same employees under the National Labor RelationsAct. In addition, the general counsel’s office of the NLRB has issued complaints naming McDonald’s Corporation as a jointemployer of workers at its franchisees for alleged violations of the U.S. Fair Labor Standards Act. The NLRB’s proposed andevolving joint employer liability standard could cause us or our Concepts to be liable or held responsible for unfair labor practices,violations of wage and hour laws, and other violations and could also require our Concepts to conduct collective bargainingnegotiations, regarding employees of our Concepts’ franchisees. Further, there is no assurance that we or our Concepts will notreceive similar complaints as McDonald’s Corporation in the future, which could result in legal proceedings based on the actionsof our Concepts’ franchisees. In such events, our operating expenses may increase as a result of required modifications to ourbusiness practices, increased litigation, governmental investigations or proceedings, administrative enforcement actions, fines andcivil liability.
An increase in food prices may have an adverse impact on our and our franchisees’ profit margins.
Our and our Concepts’ franchisees’ businesses depend on reliable sources of large quantities of raw materials such as protein(including poultry, pork, beef and seafood), cheese, oil, flour and vegetables (including potatoes and lettuce). Raw materialspurchased for use in our Concepts’ restaurants are subject to price volatility caused by any fluctuation in aggregate supply anddemand, or other external conditions, such as weather conditions or natural events or disasters that affect expected harvests ofsuch raw materials. As a result, the historical prices of raw materials used in the operation of our Concepts’ restaurants havefluctuated. We cannot assure you that we or our Concepts’ franchisees will continue to be able to purchase raw materials atreasonable prices, or that raw materials prices will remain stable in the future. In addition, a significant increase in gasoline pricescould result in the imposition of fuel surcharges by our distributors.
Because we and our Concepts’ franchisees provide competitively priced food, we may not have the ability to pass through to ourcustomers the full amount of any commodity price increases. If we and our Concepts’ franchisees are unable to manage the cost
11
of raw materials or to increase the prices of products proportionately, it may have an adverse impact on our and our franchisees’profit margins.
Our Concepts’ brands may be limited or diluted through franchisee and third-party activity.
Although we monitor and regulate franchisee activities through our franchise agreements, franchisees or other third parties mayrefer to or make statements about our Concepts’ brands that do not make proper use of our trademarks or required designations,that improperly alter trademarks or branding, or that are critical of our Concepts’ brands or place our Concepts’ brands in a contextthat may tarnish their reputation. This may result in dilution of or harm to our intellectual property or the value of our Concept’sbrands.Franchisee noncompliance with the terms and conditions of our franchise agreements may reduce the overall goodwill of ourConcepts’ brands, whether through the failure to meet health and safety standards, engage in quality control or maintain productconsistency, or through the participation in improper or objectionable business practices. Moreover, unauthorized third partiesmay use our intellectual property to trade on the goodwill of our Concepts’ brands, resulting in consumer confusion or dilution.Any reduction of our Concepts’ brands’ goodwill, consumer confusion, or dilution is likely to impact sales, and could materiallyand adversely impact our business and results of operations.
Our success depends substantially on our corporate reputation and on the value and perception of our brands.
Our success depends in large part upon our ability and our Concepts’ franchisees’ ability to maintain and enhance the value of ourbrands and our customers’ loyalty to our brands. Brand value is based in part on consumer perceptions on a variety of subjectivequalities. Business incidents, whether isolated or recurring, and whether originating from us, franchisees, competitors, suppliersor distributors, can significantly reduce brand value and consumer trust, particularly if the incidents receive considerable publicityor result in litigation. For example, our Concepts’ brands could be damaged by claims or perceptions about the quality or safetyof our products or the quality or reputation of our suppliers, distributors or franchisees, regardless of whether such claims orperceptions are true. Similarly, entities in our supply chain may engage in conduct, including alleged human rights abuses orenvironmental wrongdoing, and any such conduct could damage our or our Concepts’ brands’ reputations. Any such incidents(even if resulting from actions of a competitor or franchisee) could cause a decline directly or indirectly in consumer confidencein, or the perception of, our Concepts’ brands and/or our products and reduce consumer demand for our products, which wouldlikely result in lower revenues and profits. Additionally, our corporate reputation could suffer from a real or perceived failure ofcorporate governance or misconduct by a company officer, or an employee or representative of us or a franchisee.
We could be party to litigation that could adversely affect us by increasing our expenses, diverting management attention orsubjecting us to significant monetary damages and other remedies.
We are regularly involved in legal proceedings, which include consumer, employment, real estate related, tort, intellectual property,breach of contract, securities, derivative and other litigation (see the discussion of Legal Proceedings in Note 20 to the consolidatedfinancial statements included in Item 8 of this Form 10-K). Plaintiffs in these types of lawsuits often seek recovery of very largeor indeterminate amounts, and the magnitude of the potential loss relating to such lawsuits may not be accuratelyestimated. Regardless of whether any such claims have merit, or whether we are ultimately held liable or settle, such litigationmay be expensive to defend and may divert resources and management attention away from our operations and negatively impactreported earnings. With respect to insured claims, a judgment for monetary damages in excess of any insurance coverage couldadversely affect our financial condition or results of operations. Any adverse publicity resulting from these allegations may alsoadversely affect our reputation, which in turn could adversely affect our results of operations.
In addition, the restaurant industry around the world has been subject to claims that relate to the nutritional content of food products,as well as claims that the menus and practices of restaurant chains have led to customer health issues, including weight gain andother adverse effects. These concerns could lead to an increase in the regulation of the content or marketing of our products. Wemay also be subject to such claims in the future and, even if we are not, publicity about these matters (particularly directed at thequick service and fast-casual segments of the retail food industry) may harm our reputation and adversely affect our business,financial condition and results of operations.
Changes in, or noncompliance with, governmental regulations may adversely affect our business operations, growth prospects orfinancial condition.
Our Concepts and their franchisees are subject to numerous laws and regulations around the world. These laws change regularlyand are increasingly complex. For example, we are subject to:
12

• The Americans with Disabilities Act in the U.S. and similar state laws that give civil rights protections to individualswith disabilities in the context of employment, public accommodations and other areas.
• The U.S. Fair Labor Standards Act, which governs matters such as minimum wages, overtime and other workingconditions, as well as family leave mandates and a variety of similar state laws that govern these and other employmentlaw matters.
• Laws and regulations in government-mandated health care benefits such as the Patient Protection and Affordable CareAct.
• Laws and regulations relating to nutritional content, nutritional labeling, product safety, product marketing and menulabeling.
• Laws relating to state and local licensing.• Laws relating to the relationship between franchisors and franchisees.• Laws and regulations relating to health, sanitation, food, workplace safety, child labor, including laws prohibiting the use
of certain “hazardous equipment” by employees younger than the age of 18 years of age, and fire safety and prevention.• Laws and regulations relating to union organizing rights and activities.• Laws relating to information security, privacy, cashless payments, and consumer protection.• Laws relating to currency conversion or exchange.• Laws relating to international trade and sanctions.• Tax laws and regulations.• Anti-bribery and anti-corruption laws.• Environmental laws and regulations.• Federal and state immigration laws and regulations in the U.S.
Compliance with new or existing laws and regulations could impact our operations. The compliance costs associated with theselaws and regulations could be substantial. Any failure or alleged failure to comply with these laws or regulations could adverselyaffect our reputation, international expansion efforts, growth prospects and financial results or result in, among other things,litigation, revocation of required licenses, internal investigations, governmental investigations or proceedings, administrativeenforcement actions, fines and civil and criminal liability. Publicity relating to any such noncompliance could also harm ourreputation and adversely affect our revenues.
Failure to comply with anti-bribery or anti-corruption laws could adversely affect our business operations.
The U.S. Foreign Corrupt Practices Act, the UK Bribery Act and other similar applicable laws prohibiting bribery of governmentofficials and other corrupt practices are the subject of increasing emphasis and enforcement around the world. Although we haveimplemented policies and procedures designed to promote compliance with these laws, there can be no assurance that our employees,contractors, agents or other third parties will not take actions in violation of our policies or applicable law, particularly as weexpand our operations in emerging markets and elsewhere. Any such violations or suspected violations could subject us to civilor criminal penalties, including substantial fines and significant investigation costs, and could also materially damage our reputation,brands, international expansion efforts and growth prospects, business and operating results. Publicity relating to anynoncompliance or alleged noncompliance could also harm our reputation and adversely affect our revenues and results of operations.
Tax matters, including changes in tax rates, disagreements with taxing authorities and imposition of new taxes could impact ourresults of operations and financial condition.
A significant percentage of our income is earned outside the U.S. and currently taxed at lower rates than the U.S. statutoryrates. However, if the cash generated by our U.S. business is not sufficient to meet our need for cash in the U.S., we may need torepatriate a greater portion of our international earnings to the U.S. in the future. We are required to record U.S. income taxexpense in our financial statements at the point in time when our management determines that we no longer have the ability andintent to indefinitely postpone tax consequences related to those international earnings. This could cause our worldwide effectivetax rate to increase materially.
We are subject to income taxes as well as non-income based taxes, such as payroll, sales, use, value-added, net worth, property,withholding and franchise taxes in both the U.S. and various foreign jurisdictions. We are also subject to regular reviews,examinations and audits by the U.S. Internal Revenue Service (“IRS”) and other taxing authorities with respect to such incomeand non-income based taxes inside and outside of the U.S. If the IRS or another taxing authority disagrees with our tax positions,we could face additional tax liabilities, including interest and penalties. Payment of such additional amounts upon final settlementor adjudication of any disputes could have a material impact on our results of operations and financial position.
In addition, we are directly and indirectly affected by new tax legislation and regulation and the interpretation of tax laws andregulations worldwide. Changes in legislation, regulation or interpretation of existing laws and regulations in the U.S. and other
13

jurisdictions where we are subject to taxation could increase our taxes and have an adverse effect on our operating results andfinancial condition.
The Yum China spin-off and certain related transactions could result in substantial U.S. tax liability.
We received opinions of outside counsel substantially to the effect that, for U.S. federal income tax purposes, the Yum China spin-off and certain related transactions qualify as generally tax-free under Sections 355 and 361 of the U.S. Internal Revenue Code.The opinions relied on various facts and assumptions, as well as certain representations as to factual matters and undertakings(including with respect to future conduct) made by Yum China and us. If any of these facts, assumptions, representations orundertakings are incorrect or not satisfied, we may not be able to rely on these opinions of outside counsel. Accordingly,notwithstanding receipt of the opinions of outside counsel, the conclusions reached in the tax opinions may be challenged by theIRS. Because the opinions are not binding on the IRS or the courts, there can be no assurance that the IRS or the courts will notprevail in any such challenge.
If, notwithstanding receipt of any opinion, the IRS were to conclude that the Yum China spin-off was taxable, in general, we wouldrecognize taxable gain as if we had sold the Yum China common stock in a taxable sale for its fair market value. In addition, eachU.S. holder of our Common Stock who received shares of Yum China common stock in the spin-off transaction would generallybe treated as having received a taxable distribution of property in an amount equal to the fair market value of the shares of YumChina common stock received. That distribution would be taxable to each such U.S. stockholder as a dividend to the extent ofour current and accumulated earnings and profits. For each such U.S. stockholder, any amount that exceeded our earnings andprofits would be treated first as a non-taxable return of capital to the extent of such stockholder’s tax basis in our shares of CommonStock with any remaining amount being taxed as a capital gain.
The Yum China spin-off may be subject to China indirect transfer tax.
In February 2015, the Chinese State Administration of Taxation (“SAT”) issued the Bulletin on Several Issues of Enterprise IncomeTax on Income Arising from Indirect Transfers of Property by Non-resident Enterprises (“Bulletin 7”). Pursuant to Bulletin 7, an“indirect transfer” of Chinese taxable assets, including equity interests in a China resident enterprise (“Chinese interests”), by anon-resident enterprise, may be recharacterized and treated as a direct transfer of Chinese taxable assets, if such arrangement doesnot have reasonable commercial purpose and the transferor has avoided payment of Chinese enterprise income tax. Using generalanti-tax avoidance provisions, the SAT may treat an indirect transfer as a direct transfer of Chinese interests if the transfer hasavoided Chinese tax by way of an arrangement without reasonable commercial purpose. As a result, gains derived from suchindirect transfer may be subject to Chinese enterprise income tax, and the transferee or other person who is obligated to pay forthe transfer would be obligated to withhold the applicable taxes, currently at a rate of up to 10% of the capital gain in the case ofan indirect transfer of equity interests in a China resident enterprise.
We evaluated the potential applicability of Bulletin 7 in connection with the Separation in the form of a tax free restructuring andbelieve it is more likely than not that Bulletin 7 does not apply. We believe that the restructuring has reasonable commercialpurpose.
However, given how recently Bulletin 7 was promulgated, there are significant uncertainties regarding what constitutes a reasonablecommercial purpose, how the safe harbor provisions for group restructurings are to be interpreted and how the Chinese taxauthorities will ultimately view the spin-off. As a result, our position could be challenged by the Chinese tax authorities resultingin a tax at a rate of 10% assessed on the difference between the fair market value and the tax basis of Yum China. As our tax basisin Yum China was minimal, the amount of such a tax could be significant and have a material adverse effect on our results ofoperations and our financial condition.
Failure to protect our service marks or other intellectual property could harm our business.
We regard our Yum®, KFC®, Pizza Hut® and Taco Bell® service marks, and other service marks and trademarks related to ourrestaurant businesses, as having significant value and being important to our marketing efforts. We rely on a combination ofprotections provided by contracts, copyrights, patents, trademarks, service marks and other common law rights, such as tradesecret and unfair competition laws, to protect our restaurants and services from infringement. We have registered certain trademarksand service marks in the U.S. and foreign jurisdictions. However, from time to time we become aware of names and marks identicalor confusingly similar to our service marks being used by other persons. Although our policy is to oppose any such infringement,further or unknown unauthorized uses or other misappropriation of our trademarks or service marks could diminish the value ofour brands and adversely affect our business. In addition, effective intellectual property protection may not be available in everycountry in which our Concepts have, or intend to open or franchise, a restaurant. There can be no assurance that these protectionswill be adequate, and defending or enforcing our service marks and other intellectual property could result in the expenditure of
14

significant resources. We may also face claims of infringement that could interfere with the use of the proprietary know-how,concepts, recipes, or trade secrets used in our business. Defending against such claims may be costly, and we may be prohibitedfrom using such proprietary information in the future or forced to pay damages, royalties, or other fees for using such proprietaryinformation, any of which could negatively affect our business, reputation, financial condition, and results of operations.
Our business may be adversely impacted by changes in consumer discretionary spending and general economic conditions.
Purchases at our restaurants are discretionary for consumers and, therefore, our results of operations are susceptible to economicslowdowns and recessions. Our results of operations are dependent upon discretionary spending by consumers, which may beaffected by general economic conditions globally or in one or more of the markets we serve. Some of the factors that impactdiscretionary consumer spending include unemployment rates, fluctuations in the level of disposable income, the price of gasoline,stock market performance and changes in the level of consumer confidence. These and other macroeconomic factors could havean adverse effect on our sales, profitability or development plans, which could harm our financial condition and operating results.
The retail food industry in which we operate is highly competitive.
The retail food industry in which we operate is highly competitive with respect to price and quality of food products, new productdevelopment, advertising levels and promotional initiatives, customer service, reputation, restaurant location, and attractivenessand maintenance of properties. If consumer or dietary preferences change, if our marketing efforts are unsuccessful, or if ourConcepts’ restaurants are unable to compete successfully with other retail food outlets in new and existing markets, our businesscould be adversely affected. We also face growing competition as a result of convergence in grocery, convenience, deli andrestaurant services, including the offering by the grocery industry of convenient meals, including pizzas and entrees with sidedishes. Competition from delivery aggregators and other food delivery services has also increased in recent years, particularly inurbanized areas. Increased competition could have an adverse effect on our sales, profitability or development plans, which couldharm our financial condition and operating results.
Our substantial indebtedness makes us more sensitive to adverse economic conditions, may limit our ability to plan for or respondto significant changes in our business, and requires a significant amount of cash to service our debt payment obligations that wemay be unable to generate or obtain.
In 2016, we increased our indebtedness from approximately $4 billion to approximately $9 billion. The proceeds from the debtwere primarily used to return capital to shareholders through share repurchases and dividends. Subject to the limits contained inthe agreements governing our indebtedness, we may be able to incur additional debt from time to time, which would intensify therisks related to our high level of indebtedness.
Specifically, our high level of indebtedness could have important potential consequences, including, but not limited to:• increasing our vulnerability to, and reducing our flexibility to plan for and respond to, adverse economic and industry
conditions and changes in our business and the competitive environment;• requiring the dedication of a substantial portion of our cash flow from operations to the payment of principal of, and
interest on, indebtedness, thereby reducing the availability of such cash flow to fund working capital, capital expenditures,acquisitions, dividends, share repurchases or other corporate purposes;
• increasing our vulnerability to a further downgrade of our credit rating, which could adversely affect our cost of funds,liquidity and access to capital markets;
• restricting us from making strategic acquisitions or causing us to make non-strategic divestitures;• placing us at a disadvantage compared to other less leveraged competitors or competitors with comparable debt at
more favorable interest rates;• increasing our exposure to the risk of increased interest rates insofar as current and future borrowings are subject to
variable rates of interest;• making it more difficult for us to repay, refinance or satisfy our obligations with respect to our debt;• limiting our ability to borrow additional funds in the future and increasing the cost of any such borrowing; • imposing restrictive covenants on our operations, which, if not complied with, could result in an event of default, which
in turn, if not cured or waived, could result in the acceleration of the applicable debt, and may result in the accelerationof any other debt to which a cross-acceleration or cross-default provision applies; and
• increasing our exposure to risks related to fluctuations in foreign currency as we earn profits in a variety of currenciesaround the world and our debt is denominated in U.S. dollars.
There is no assurance that we will generate cash flow from operations or that future debt or equity financings will be available tous to enable us to pay our indebtedness or to fund other liquidity needs. If our business does not generate sufficient cash flow fromoperation in the amounts projected or at all, or if future borrowings are not available to us in amounts sufficient to pay our
15
indebtedness or to fund other liquidity needs, our financial condition and results of operations may be adversely affected. As aresult, we may need to refinance all or a portion of our indebtedness on or before maturity. There is no assurance that we will beable to refinance any of our indebtedness on favorable terms, or at all. Any inability to generate sufficient cash flow or refinanceour indebtedness on favorable terms could have a material adverse effect on our business and financial condition.
16
Item 1B. Unresolved Staff Comments.
The Company has received no written comments regarding its periodic or current reports from the staff of the Securities andExchange Commission that were issued 180 days or more preceding the end of its 2016 fiscal year and that remain unresolved.
Item 2. Properties.
As of year end 2016, the Company’s Concepts owned approximately 860 units and leased land, building or both for approximately2,000 units worldwide. These units are further detailed as follows:
• The KFC Division owned approximately 260 units and leased land, building or both in approximately 1,165 units.
• The Pizza Hut Division owned approximately 70 units and leased land, building or both in approximately 480 units.
• The Taco Bell Division owned approximately 530 units and leased land, building or both in approximately 355 units.
Company-owned restaurants in the U.S. with leases are generally leased for initial terms of 15 or 20 years and generally haverenewal options; however, Pizza Hut delivery/carryout units in the U.S. generally are leased for significantly shorter initial termswith shorter renewal options. Company-owned restaurants outside the U.S. with leases have initial lease terms and renewal optionsthat vary by country. The Company currently has land, buildings or both related to approximately 700 units, not included in theproperty counts above, that it leases or subleases to franchisees, principally in the U.S., United Kingdom, Germany and France.
The KFC Division and Pizza Hut Division corporate headquarters and a KFC and Pizza Hut research facility in Plano, Texas areowned by Pizza Hut. Taco Bell leases its corporate headquarters and research facility in Irvine, California. The YUM corporateheadquarters and a KFC research facility in Louisville, Kentucky are owned by KFC. Additional information about the Company’sproperties is included in the Consolidated Financial Statements in Part II, Item 8.
The Company believes that its properties are generally in good operating condition and are suitable for the purposes for whichthey are being used.
Item 3. Legal Proceedings.
The Company is subject to various lawsuits covering a variety of allegations. The Company believes that the ultimate liability,if any, in excess of amounts already provided for these matters in the Consolidated Financial Statements, is not likely to have amaterial adverse effect on the Company’s annual results of operations, financial condition or cash flows. Matters faced by theCompany include, but are not limited to, claims from franchisees, suppliers, employees, customers and others related to operational,contractual or employment issues as well as claims that the Company has infringed on third party intellectual property rights. Inaddition, the Company brings claims from time-to-time relating to infringement of, or challenges to, our intellectual property,including registered marks. Finally, as a publicly-traded company, disputes arise from time-to-time with our shareholders, includingallegations that the Company breached federal securities laws or that officers and/or directors breached fiduciary duties.Descriptions of current specific claims and contingencies appear in Note 20, Contingencies, to the Consolidated FinancialStatements included in Part II, Item 8, which is incorporated by reference into this item.

Item 4. Mine Safety Disclosures.
Not applicable.
Executive Officers of the Registrant.
The executive officers of the Company as of February 21, 2017, and their ages and current positions as of that date are as follows:
Greg Creed, 59, is Chief Executive Officer of YUM. He has served in this position since January 2015. He served as Chief ExecutiveOfficer of Taco Bell Division from January 2014 to December 2014 and as Chief Executive Officer of Taco Bell U.S. from 2011 toDecember 2013. Prior to this position, Mr. Creed served as President and Chief Concept Officer of Taco Bell U.S., a position heheld beginning in December 2006.
Roger Eaton, 56, is Chief Executive Officer of KFC Division, a position he has held since August 2015. Prior to that, he served asPresident of KFC Division from January 2014 to August 2015 and as Chief Operations Officer of YUM from November 2011 toAugust 2015. Prior to these positions, Mr. Eaton served as Chief Executive Officer of KFC U.S. and YUM Operational ExcellenceOfficer from February 2011 to November 2011.
David Gibbs, 53, is President and Chief Financial Officer of YUM. He has served in this position since May 2016. Prior to thisposition, he served as Chief Executive Officer of Pizza Hut Division from January 2015 to April 2016. From January 2014 toDecember 2014, Mr. Gibbs served as President of Pizza Hut U.S. Prior to this position, Mr. Gibbs served as President and ChiefFinancial Officer of Yum! Restaurants International, Inc. (“YRI”) from May 2012 through December 2013. Mr. Gibbs served asChief Financial Officer of YRI from January 2011 to April 2012. He was Chief Financial Officer of Pizza Hut U.S. from September2005 to December 2010.
Marc Kesselman, 45, is General Counsel, Corporate Secretary and Chief Government Affairs Officer of YUM. He has served asGeneral Counsel and Corporate Secretary of YUM since February 2016 and as Chief Government Affairs Officer since November2016. Mr. Kesselman joined YUM from Dean Foods where he held the position of Executive Vice President, General Counsel,Corporate Secretary & Government Affairs from January 2015 to January 2016. Prior to this position, he worked at PepsiCo fromJanuary 2009 to January 2015, most recently serving as Senior Vice President and General Counsel of PepsiCo Americas Foods &Frito Lay North America. From May 2006 to December 2008 he served as General Counsel of the United States Department ofAgriculture.
Brian Niccol, 42, is Chief Executive Officer of Taco Bell Division, a position he has held since January 2015. From January 2014to December 2014, Mr. Niccol served as President of Taco Bell Division. From May 2013 to December 2013 Mr. Niccol served asPresident of Taco Bell U.S. Mr. Niccol served as Chief Marketing and Innovation Officer of Taco Bell U.S. from October 2011 toApril 2013. Prior to this position, he served as General Manager of Pizza Hut U.S. from February 2011 to September 2011. FromSeptember 2007 to January 2011 he was Chief Marketing Officer of Pizza Hut U.S.
David Russell, 47, is Senior Vice President, Finance and Corporate Controller of YUM. He has served in this position since December2012. He has been Vice President and Corporate Controller since February 2011. Effective December 2012, his duties and title wereexpanded to include Vice President, Finance. From November 2010 to February 2011, Mr. Russell served as Vice President, Controller-Designate. From January 2008 to November 2010, he served as Vice President and Assistant Controller.
Tracy Skeans, 44, is Chief Transformation and People Officer of YUM. She has served as Chief People Officer since January 2016and Chief Transformation Officer since November 2016. From January 2015 to December 2015, she was President of Pizza HutInternational. Prior to this position, Ms. Skeans served as Chief People Officer of Pizza Hut Division from December 2013 toDecember 2014 and Chief People Officer of Pizza Hut U.S. from October 2011 to November 2013. From June 2006 to September2011, she served as Director of Human Resources for Pizza Hut U.S.
Executive officers are elected by and serve at the discretion of the Board of Directors.
17

PART II
18
Item 5. Market for the Registrant’s Common Stock, Related Stockholder Matters and IssuerPurchases of Equity Securities.
The Company’s Common Stock trades under the symbol YUM and is listed on the NYSE. The following sets forth the high andlow NYSE composite closing sale prices by quarter for the Company’s Common Stock and dividends per common share. OnOctober 31, 2016 (the "Distribution Date"), we completed the spin-off of our China business (the "Separation") into an independent,publicly-traded company under the name Yum China Holdings, Inc. ("Yum China"). On the Distribution Date we distributed toeach of our shareholders of record as of the close of business on October 19, 2016 (the "Record Date"), one share of Yum Chinacommon stock for each share of our Common Stock held as of the Record Date. Stock prices prior to November 1, 2016, do notreflect any adjustment for the impact of the Separation.
2016
Quarter High LowDividendsDeclared
First $ 78.79 $ 65.24 $ 0.46Second 84.19 78.98 0.46Third 91.26 79.33 —Fourth (to October 31) 91.25 85.36 0.51Fourth (from November 1) 64.74 59.70 0.30
2015
Quarter High LowDividendsDeclared
First $ 81.80 $ 70.01 $ —Second 94.88 78.29 0.82Third 92.75 76.10 —Fourth 83.42 67.12 0.92
On December 21, 2016, the Company declared its first dividend since the separation of its China business of $0.30 per share ofCommon Stock. The quarterly dividend was distributed February 3, 2017, to shareholders of record at the close of business onJanuary 13, 2017. The Company currently targets an annual dividend payout ratio of approximately 45% to 50% of net income.
As of February 14, 2017, there were 52,541 registered holders of record of the Company’s Common Stock.

Issuer Purchases of Equity Securities
The following table provides information as of December 31, 2016, with respect to shares of Common Stock repurchased by theCompany during the quarter then ended. Share prices for shares repurchased prior to November 1, 2016, do not reflect anyadjustment for the impact of the Separation.
Fiscal Periods
Total numberof sharespurchased
(thousands)Average pricepaid per share
Total number of sharespurchased as part of
publicly announced plansor programs(thousands)
Approximate dollar valueof shares that may yet bepurchased under the plans
or programs(millions)
Period 10 7,458 $ 89.15 7,458 $ 9409/4/16 - 10/1/16Period 11 5,047 $ 89.15 5,047 $ 49010/2/16 - 10/29/16Period 12 3,511 $ 61.38 3,511 $ 2,27510/30/16 - 11/26/16Period 13 5,638 $ 63.84 5,638 $ 1,91511/27/16 - 12/31/16Total 21,654 $ 78.06 21,654 $ 1,915
On March 4, 2016, our Board of Directors authorized share repurchases through December 2016 of up to $500 million (excludingapplicable transaction fees) of our outstanding Common Stock. On May 20, 2016, our Board of Directors authorized sharerepurchases through December 2016 of up to $4.2 billion (excluding applicable transaction fees) of our outstanding CommonStock. This authorization superseded all previous unutilized authorizations. On November 17, 2016, our Board of Directorsauthorized additional share repurchases through December 2017 of up to $2.0 billion (excluding applicable transaction fees) ofour outstanding Common Stock. As of December 31, 2016, we have remaining capacity to repurchase up to $1.9 billion ofCommon Stock under the November 2016 authorization.
19

Stock Performance Graph
This graph compares the cumulative total return of our Common Stock to the cumulative total return of the S&P 500 Stock Indexand the S&P 500 Consumer Discretionary Sector, a peer group that includes YUM, for the period from December 30, 2011 toDecember 30, 2016, the last trading day of our 2016 fiscal year. The graph assumes that the value of the investment in our CommonStock and each index was $100 at December 30, 2011, and that all dividends were reinvested. For the purpose of this graph, thedistribution of 100% of the outstanding common stock of Yum China Holdings, Inc. (“Yum China”) to our stockholders, pursuantto which Yum China became an independent company, is treated as a non-taxable cash dividend of $24.51 per share, an amountequal to the opening price of Yum China common stock when it began trading on November 1, 2016, that was deemed reinvestedin YUM Common Stock at the closing price on November 1, 2016.
12/30/2011 12/28/2012 12/27/2013 12/26/2014 12/24/2015 12/30/2016YUM $ 100 $ 112 $ 130 $ 131 $ 136 $ 167S&P 500 $ 100 $ 114 $ 152 $ 176 $ 178 $ 198
S&P ConsumerDiscretionary $ 100 $ 121 $ 175 $ 194 $ 214 $ 227
20

Item 6. Selected Financial Data.Selected Financial DataYUM! Brands, Inc. and Subsidiaries(in millions, except per share and unit amounts)
Fiscal Year2016(a)(f) 2015(a) 2014(a) 2013(a) 2012(a)(f)
Income Statement DataRevenues
Company sales $ 4,200 $ 4,356 $ 4,503 $ 4,384 $ 5,036Franchise and license fees and income 2,166 2,084 2,084 2,033 1,940Total 6,366 6,440 6,587 6,417 6,976
Closures and impairment income (expenses) (14) (15) (18) (6) (28)Refranchising gain (loss)(b) 141 (23) 16 95 61Operating Profit(c) 1,625 1,402 1,517 1,530 1,408Interest expense, net(c) 307 141 143 251 157Income before income taxes 1,318 1,261 1,374 1,279 1,251Income from continuing operations 994 936 1,006 922 884Income from discontinued operations, net of tax 625 357 45 169 713Net Income 1,619 1,293 1,051 1,091 1,597Basic earnings per common share from continuing operations 2.52 2.15 2.27 2.04 1.91Basic earnings per common share from discontinued operations 1.59 0.82 0.10 0.37 1.55Basic earnings per common share 4.11 2.97 2.37 2.41 3.46Diluted earnings per common share from continuing operations 2.48 2.11 2.22 2.00 1.87Diluted earnings per common share from discontinued operations 1.56 0.81 0.10 0.36 1.51Diluted earnings per common share 4.04 2.92 2.32 2.36 3.38Diluted earnings per common share from continuing operationsexcluding Special Items(c)
2.45 2.33 2.20 2.04 1.90
Cash Flow DataProvided by operating activities $ 1,204 $ 1,213 $ 1,217 $ 1,289 $ 1,373Capital spending 422 461 508 481 444Proceeds from refranchising of restaurants 346 219 83 250 337Repurchase shares of Common Stock 5,402 1,200 820 770 965Dividends paid on Common Stock 744 730 669 615 544Balance Sheet DataTotal assets $ 5,478 $ 4,916 $ 5,132 $ 4,975 $ 5,262Long-term debt 9,061 3,007 3,042 2,888 2,905Total debt 9,127 3,928 3,308 2,958 2,914Other DataNumber of stores at year end
Company 2,859 3,159 3,247 3,071 2,997 Franchise 40,758 39,263 37,984 36,746 35,461 System 43,617 42,422 41,231 39,817 38,458
KFC Division system sales growth(d)
Reported 2% (3)% 1% (2)% 6%Local currency(e) 7% 5 % 4% — % 8%
Pizza Hut Division system sales growth(d)
Reported —% (1)% 1% 3 % 5%Local currency(e) 2% 3 % 2% 4 % 7%
Taco Bell Division system sales growth(d)
Reported 6% 8 % 4% 4 % 7%Local currency(e) 6% 8 % 4% 4 % 9%
Shares outstanding at year end 355 420 434 443 451Cash dividends declared per Common Share $ 1.73 $ 1.74 $ 1.56 $ 1.41 $ 1.24Market price per share at year end(g) $ 63.33 $ 74.00 $ 73.14 $ 73.87 $ 64.72
21
(a) Financial data for prior years has been recast to present the results of the Separation as discontinued operations and reflectsamounts related to continuing operations unless otherwise noted. Store count data for prior years has been recast toexclude the Little Sheep and East Dawning stores operated by our former China Division and reflect all other formerChina Division Company operated stores as franchise units within the KFC and Pizza Hut Divisions. KFC Division,Pizza Hut Division and Taco Bell Division system sales growth has been recast to reflect the integration of the formerIndia and China Divisions. See Note 4 regarding details of the Separation.
(b) See Note 5 for discussion of Refranchising gain (loss) for fiscal years 2016, 2015 and 2014. Fiscal year 2013 primarilyreflects net gains from refranchising Taco Bell restaurants in the U.S. Fiscal year 2012 included $122 million in net gainsfrom refranchising restaurants in the U.S., primarily Taco Bells, and $70 million in losses related to the refranchising ofour then remaining Company-owned Pizza Hut UK dine-in restaurants.
(c) In addition to the results provided in accordance with U.S. Generally Accepted Accounting Principles (“GAAP”),theCompany provides non-GAAP measurements which present operating results from continuing operations on a basisexcluding Special Items. The Company uses earnings from continuing operations excluding Special Items as a keyperformance measure of results of operations for the purpose of evaluating performance internally and Special Items arenot included in any of our segment results. This non-GAAP measurement is not intended to replace the presentation ofour financial results in accordance with GAAP. Rather, the Company believes that the presentation of earnings fromcontinuing operations excluding Special Items provides additional information to investors to facilitate the comparisonof past and present results, excluding items that the Company does not believe are indicative of our ongoing operationsdue to their size and/or nature.
2016, 2015 and 2014 Special Items are described in further detail within our Management's Discussion and Analysis ofFinancial Condition and Results of Operations. Special Items in 2013 positively impacted Operating Profit by $73 million,primarily due to refranchising gains on the sale of restaurants in the U.S. (primarily Taco Bells), partially offset by $10million in pension settlement charges and $5 million of expense related to U.S. productivity initiatives and realignmentof resources. Additionally, in 2013, we incurred $118 million of premiums paid and other costs related to theextinguishment of debt that were considered Special Items and were recorded in Interest expense, net. Special Items in2012 negatively impacted Operating Profit by $16 million, primarily due to $84 million in pension settlement chargesand $70 million of losses associated with the refranchising of the Pizza Hut UK dine-in business, partially offset by $122million in U.S. refranchising net gains. Special Items resulted in cumulative net tax benefits of $23 million and $1million in 2013 and 2012, respectively.
(d) System sales growth includes the results of all restaurants regardless of ownership, including company-owned andfranchise restaurants that operate our Concepts. Sales of franchise restaurants typically generate ongoing franchise feesfor the Company at a rate of 3% to 6% of sales. Franchise restaurant sales are not included in Company sales on theConsolidated Statements of Income; however, the franchise fees are included in the Company’s revenues. We believesystem sales growth is useful to investors as a significant indicator of the overall strength of our business as it incorporatesall of our revenue drivers, Company and franchise same-store sales as well as net unit growth.
(e) Local currency represents the percentage change excluding the impact of foreign currency translation. These amountsare derived by translating current year results at prior year average exchange rates. We believe the elimination of theforeign currency translation impact provides better year-to-year comparability without the distortion of foreign currencyfluctuations.
(f) Fiscal years 2015, 2014, 2013 and 2012 include 52 weeks and fiscal year 2016 includes 53 weeks. The estimated impactsof the 53rd week on Company sales, Franchise and license fees and income and Operating Profit in 2016 were increasesof $55 million, $21 million and $27 million, respectively. The 53rd week positively impacted Division system salesgrowth by 1%, 1% and 2% for KFC, Pizza Hut and Taco Bell, respectively. Refer to Note 2 for additional details relatedto our fiscal calendar.
(g) Historical stock prices prior to November 1, 2016, do not reflect any adjustment for the impact of the Separation.
The selected financial data should be read in conjunction with the Consolidated Financial Statements.
22

Item 7. Management’s Discussion and Analysis of Financial Condition and Results of Operations.
23
Introduction and Overview
The following Management’s Discussion and Analysis (“MD&A”), should be read in conjunction with the Consolidated FinancialStatements (“Financial Statements”) in Item 8 and the Forward-Looking Statements and the Risk Factors set forth in Item 1A.
YUM! Brands, Inc. (“YUM” or the “Company”) operates or franchises a worldwide system of over 43,500 restaurants in morethan 135 countries and territories operating under the KFC, Pizza Hut or Taco Bell (collectively the "Concepts") brands. Thesethree Concepts are the global leaders in the chicken, pizza and Mexican-style food categories, respectively. Of the over 43,500restaurants, 7% are operated by the Company and its subsidiaries and 93% are operated by franchisees.
As of December 31, 2016, YUM consists of three operating segments:
• The KFC Division which includes the worldwide operations of the KFC concept • The Pizza Hut Division which includes the worldwide operations of the Pizza Hut concept • The Taco Bell Division which includes the worldwide operations of the Taco Bell concept
Effective January 2016, the India Division was segmented by brand, integrated into the global KFC, Pizza Hut and Taco BellDivisions, and is no longer a separate operating segment. While our consolidated results were not impacted, we have restated ourhistorical segment information for consistent presentation.
On October 31, 2016 (the “Distribution Date”), we completed the spin-off of our China business (the "Separation") into anindependent, publicly-traded company under the name of Yum China Holdings, Inc. (“Yum China”). On the Distribution Date, wedistributed to each of our shareholders of record as of the close of business on October 19, 2016 (the “Record Date”), one share ofYum China common stock for each share of our Common Stock held as of the Record Date. The distribution was structured to bea tax free distribution to our U.S. shareholders for federal income tax purposes in the United States. Yum China’s common stocknow trades on the New York Stock Exchange under the symbol “YUMC.” After the distribution, we do not beneficially own anyshares of Yum China common stock.
Concurrent with the Separation, a subsidiary of the Company entered into a Master License Agreement with a subsidiary of YumChina for the exclusive right to use and sublicense the use of intellectual property owned by YUM and its affiliates for the developmentand operation of KFC, Pizza Hut and Taco Bell restaurants in China. Prior to the Separation, our operations in mainland Chinawere reported in our former China Division segment results. As a result of the Separation, the results of operations, assets andliabilities, and cash flows of the separated business are presented as discontinued operations in our Consolidated Statements ofIncome, Consolidated Balance Sheets and Consolidated Statements of Cash Flows for all periods presented. See additionalinformation related to the impact of the Separation in Item 8, Note 4 to the Consolidated Financial Statements.
On October 11, 2016, we announced our strategic transformation plans to drive global expansion of our KFC, Pizza Hut and TacoBell brands (“YUM’s Strategic Transformation Initiatives”) following the Separation. Major features of the Company’stransformation and growth strategy involve being more focused, franchised and efficient. YUM’s Strategic TransformationInitiatives below represent the continuation of YUM’s transformation of its operating model and capital structure.
• More Focused. Four growth drivers will form the basis of YUM’s strategic plans and repeatable business model to acceleratesame-store sales growth and net-new restaurant development at KFC, Pizza Hut and Taco Bell around the world over thelong term. The Company will focus on becoming best-in-class in:
• Building Distinctive, Relevant Brands • Developing Unmatched Franchise Operating Capability • Driving Bold Restaurant Development • Growing Unrivaled Culture and Talent
• More Franchised. YUM intends to increase franchise restaurant ownership to at least 98% by the end of 2018.
• More Efficient. The Company intends to revamp its financial profile, improving the efficiency of its organization and coststructure globally, by:
• Reducing annual capital expenditures to approximately $100 million in 2019; • Reducing General and administrative ("G&A") expenses by a cumulative ~$300 million over the next three years;
and

• Maintaining an optimized capital structure of ~5.0x Earnings Before Interest, Taxes, Depreciation andAmortization (“EBITDA”) leverage.
Since the fourth quarter of 2015, we have returned approximately $7.2 billion of capital to shareholders through share repurchasesand cash dividends, funding the repurchases through a recapitalization and issuance of $5.2 billion of incremental borrowings in2016. Over the next 3 years, we intend to return an additional $6.5 - $7.0 billion to shareholders through share repurchases andcash dividends. We intend to fund these shareholder returns through a combination of refranchising proceeds, free cash flowgeneration and maintenance of our five times EBITDA leverage. We anticipate generating proceeds in excess of $2 billion, net oftax, through our refranchising initiatives. Refer to the Liquidity and Capital Resources section of this MD&A for additional details. We intend for this MD&A to provide the reader with information that will assist in understanding our results of operations, includingperformance metrics that management uses to assess the Company's performance. Throughout this MD&A, we commonly discussthe following performance metrics:
• The Company provides certain percentage changes excluding the impact of foreign currency translation (“FX” or“Forex”). These amounts are derived by translating current year results at prior year average exchange rates. We believe theelimination of the foreign currency translation impact provides better year-to-year comparability without the distortion offoreign currency fluctuations.
• System sales growth includes the results of all restaurants regardless of ownership, including company-owned and franchiserestaurants that operate our Concepts. Sales of franchise restaurants typically generate ongoing franchise and license fees forthe Company at a rate of 3% to 6% of sales. Franchise restaurant sales are not included in Company sales on the ConsolidatedStatements of Income; however, the franchise and license fees are included in the Company’s revenues. We believe systemsales growth is useful to investors as a significant indicator of the overall strength of our business as it incorporates all of ourrevenue drivers, Company and franchise same-store sales as well as net unit growth.
• Same-store sales growth is the estimated percentage change in sales of all restaurants that have been open and in the YUMsystem one year or more.
• Company restaurant profit ("Restaurant profit") is defined as Company sales less expenses incurred directly by our Company-owned restaurants in generating Company sales. Company restaurant margin as a percentage of sales is defined as Restaurantprofit divided by Company sales. Within the Company Sales and Restaurant Profit sections of this MD&A, Store PortfolioActions represent the net impact of new unit openings, acquisitions, refranchising and store closures, and Other primarilyrepresents the impact of same-store sales as well as the impact of changes in costs such as inflation/deflation.
• Operating margin is Operating Profit divided by Total revenues.
• In addition to the results provided in accordance with U.S. Generally Accepted Accounting Principles ("GAAP") , the Companyhas provided non-GAAP measurements which present Diluted Earnings Per Share from Continuing Operations excludingSpecial Items, our Effective Tax Rate excluding Special Items, Core Operating Profit and Core Operating Profit excluding 53rd
week. Core Operating Profit excludes Special Items and foreign currency translation and we use Core Operating Profit for thepurposes of evaluating performance internally. Special Items are not included in any of our externally reported segment results,and we believe the elimination of the foreign currency translation impact provides better year-to-year comparability withoutthe distortion of foreign currency fluctuations. We provide Core Operating Profit excluding 53rd week to further enhance thecomparability of fiscal 2016, which had a 53rd week, with prior year results. These non-GAAP measurements are not intendedto replace the presentation of our financial results in accordance with GAAP. Rather, the Company believes that the presentationof Diluted Earnings Per Share from Continuing Operations excluding Special Items, our Effective Tax Rate excluding SpecialItems, Core Operating Profit and Core Operating Profit excluding 53rd week, provide additional information to investors tofacilitate the comparison of past and present operations, excluding items that the Company does not believe are indicative ofour ongoing operations due to their size and/or nature.
All Note references herein refer to the Notes to the Financial Statements. Tabular amounts are displayed in millions of U.S. dollarsexcept per share and unit count amounts, or as otherwise specifically identified. Unless otherwise stated, financial results hereinreflect continuing operations of the Company. Percentages may not recompute due to rounding.
24

Results of Operations
Summary
All comparisons within this summary are versus the same period a year ago, exclude the impact of Special Items and include theimpact of a 53rd week in 2016, unless otherwise noted.
2016 diluted EPS from Continuing Operations increased 18% to $2.48 per share. 2016 diluted EPS from Continuing Operationsexcluding Special Items increased 5% to $2.45 per share.
Foreign currency translation from our international operations negatively impacted GAAP Operating Profit by $55 million.
2016 financial highlights are below:
2016 % ChangeSystem Sales, ex
FXSame Store
Sales Net New UnitsGAAP
Operating ProfitCore Operating
ProfitKFC Division 7% 3 % 3% 5% 11%Pizza Hut Division 2% (1)% 2% 7% 9%Taco Bell Division 6% 2 % 3% 11% 10%Worldwide 5% 1 % 3% 16% 13%
Results Excluding 53rd Week (2016 % Change)System Sales, ex FX Core Operating Profit
KFC Division 6% 10%Pizza Hut Division 1% 7%Taco Bell Division 4% 8%Worldwide 4% 11%
25

Worldwide
GAAP Results
Amount % B/(W)2016 2015 2014 2016 2015
Company sales $ 4,200 $ 4,356 $ 4,503 (4) (3)Franchise and license fees and income 2,166 2,084 2,084 4 —Total revenues $ 6,366 $ 6,440 $ 6,587 (1) (2)Restaurant profit $ 702 $ 709 $ 633 (1) 12Restaurant Margin % 16.7% 16.3% 14.1% 0.4 ppts. 2.2 ppts.
Operating Profit $ 1,625 $ 1,402 $ 1,517 16 (8)
Interest expense, net 307 141 143 NM 1Income tax provision 324 325 368 — 11Income from continuing operations 994 936 1,006 6 (7)Income from discontinued operations, net of tax 625 357 45 75 NMNet Income $ 1,619 $ 1,293 $ 1,051 25 23Diluted EPS(a) from continuing operations $ 2.48 $ 2.11 $ 2.22 18 (5)Diluted EPS(a) from discontinued operations $ 1.56 $ 0.81 $ 0.10 94 NMDiluted EPS(a) $ 4.04 $ 2.92 $ 2.32 39 26Effective tax rate - continuing operations 24.6% 25.8% 26.7% 1.2 ppts. 0.9 ppts.
(a) See Note 3 for the number of shares used in these calculations.
Performance Metrics
% Increase(Decrease)
Unit Count 2016 2015 2014 2016 2015Franchise 40,758 39,263 37,984 4 3Company-owned 2,859 3,159 3,247 (9) (3)
43,617 42,422 41,231 3 3
% B/(W)2016 2015
System Sales Growth, reported 2 —Same-Store Sales Growth 1 2System Sales Growth, excluding FX 5 5System Sales Growth, excluding FX and 53rd week 4 N/A
Non-GAAP ItemsCore Operating Profit Growth 13 6Core Operating Profit Growth excluding 53rd week 11 N/ADiluted EPS from Continuing Operations excluding Special Items 5 6
26

Extra Week in 2016
Fiscal 2016 included a 53rd week for all of our U.S. businesses and certain of our non-U.S. businesses that report 13 four-weekperiods versus 12 months. See Note 2 for additional details related to our fiscal calendar. The following table summarizes theestimated impact of the 53rd week on Revenues and Operating Profit:
KFCDivision
Pizza HutDivision
Taco BellDivision Unallocated Total
RevenuesCompany sales $ 26 $ 5 $ 24 $ — $ 55Franchise and license fees and income 8 6 7 — 21
Total revenues $ 34 $ 11 $ 31 $ — $ 76
Operating ProfitFranchise and license fees and income $ 8 $ 6 $ 7 $ — $ 21Restaurant profit 6 1 7 — 14G&A expenses (3) (2) (2) (1) (8)
Operating Profit $ 11 $ 5 $ 12 $ (1) $ 27
27
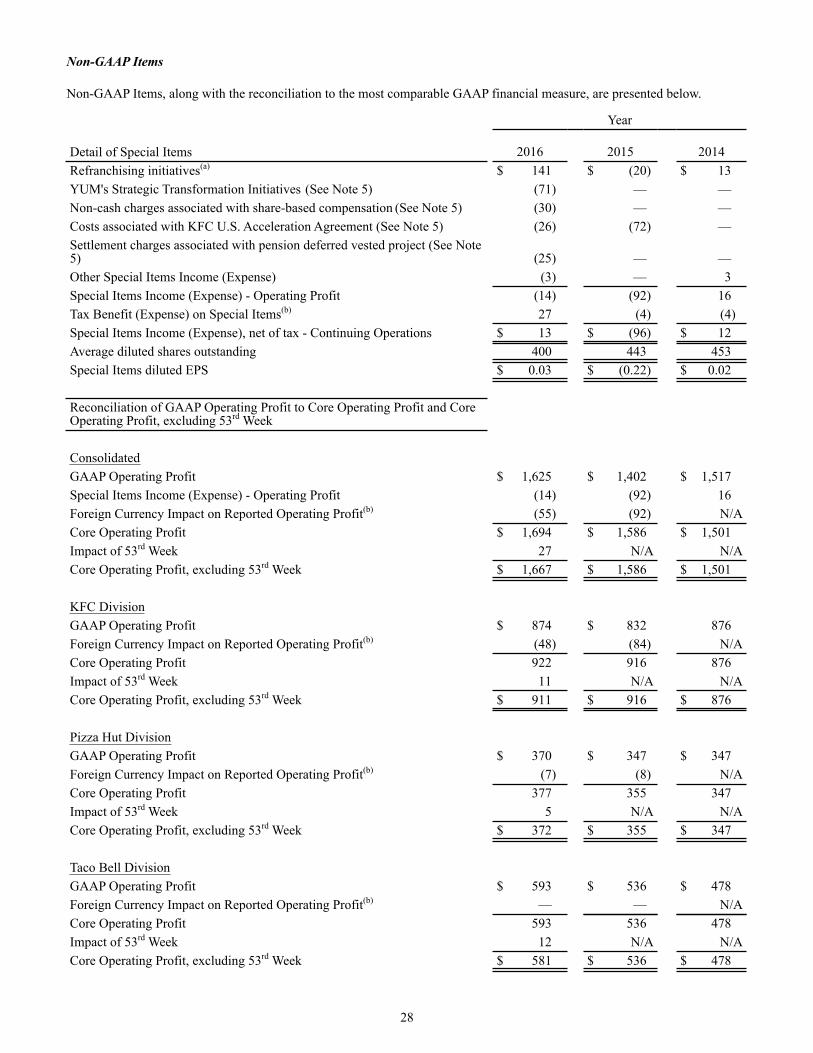
Non-GAAP Items
Non-GAAP Items, along with the reconciliation to the most comparable GAAP financial measure, are presented below.
Year Detail of Special Items 2016 2015 2014Refranchising initiatives(a) $ 141 $ (20) $ 13YUM's Strategic Transformation Initiatives (See Note 5) (71) — —Non-cash charges associated with share-based compensation (See Note 5) (30) — —Costs associated with KFC U.S. Acceleration Agreement (See Note 5) (26) (72) —Settlement charges associated with pension deferred vested project (See Note5) (25) — —Other Special Items Income (Expense) (3) — 3Special Items Income (Expense) - Operating Profit (14) (92) 16Tax Benefit (Expense) on Special Items(b) 27 (4) (4)Special Items Income (Expense), net of tax - Continuing Operations $ 13 $ (96) $ 12Average diluted shares outstanding 400 443 453Special Items diluted EPS $ 0.03 $ (0.22) $ 0.02
Reconciliation of GAAP Operating Profit to Core Operating Profit and CoreOperating Profit, excluding 53rd Week
ConsolidatedGAAP Operating Profit $ 1,625 $ 1,402 $ 1,517Special Items Income (Expense) - Operating Profit (14) (92) 16Foreign Currency Impact on Reported Operating Profit(b) (55) (92) N/ACore Operating Profit $ 1,694 $ 1,586 $ 1,501Impact of 53rd Week 27 N/A N/ACore Operating Profit, excluding 53rd Week $ 1,667 $ 1,586 $ 1,501
KFC DivisionGAAP Operating Profit $ 874 $ 832 876Foreign Currency Impact on Reported Operating Profit(b) (48) (84) N/ACore Operating Profit 922 916 876Impact of 53rd Week 11 N/A N/ACore Operating Profit, excluding 53rd Week $ 911 $ 916 $ 876
Pizza Hut DivisionGAAP Operating Profit $ 370 $ 347 $ 347Foreign Currency Impact on Reported Operating Profit(b) (7) (8) N/ACore Operating Profit 377 355 347Impact of 53rd Week 5 N/A N/ACore Operating Profit, excluding 53rd Week $ 372 $ 355 $ 347
Taco Bell DivisionGAAP Operating Profit $ 593 $ 536 $ 478Foreign Currency Impact on Reported Operating Profit(b) — — N/ACore Operating Profit 593 536 478Impact of 53rd Week 12 N/A N/ACore Operating Profit, excluding 53rd Week $ 581 $ 536 $ 478
28
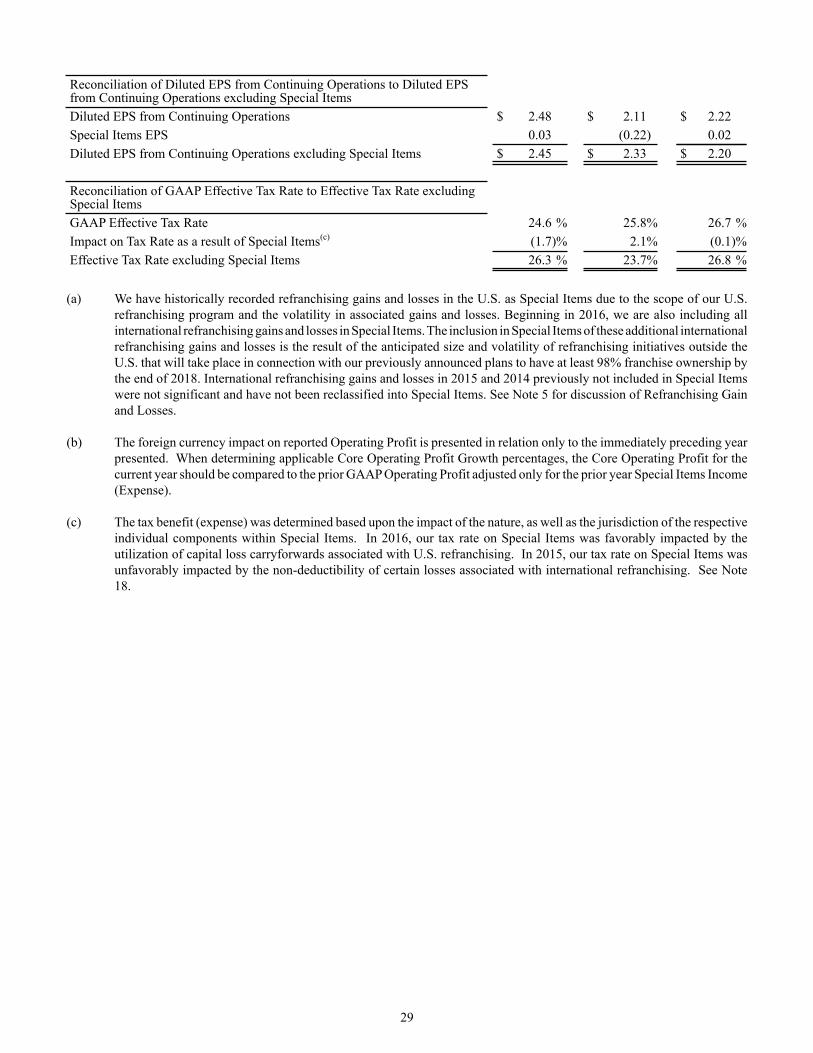
(a) We have historically recorded refranchising gains and losses in the U.S. as Special Items due to the scope of our U.S.refranchising program and the volatility in associated gains and losses. Beginning in 2016, we are also including allinternational refranchising gains and losses in Special Items. The inclusion in Special Items of these additional internationalrefranchising gains and losses is the result of the anticipated size and volatility of refranchising initiatives outside theU.S. that will take place in connection with our previously announced plans to have at least 98% franchise ownership bythe end of 2018. International refranchising gains and losses in 2015 and 2014 previously not included in Special Itemswere not significant and have not been reclassified into Special Items. See Note 5 for discussion of Refranchising Gainand Losses.
(b) The foreign currency impact on reported Operating Profit is presented in relation only to the immediately preceding yearpresented. When determining applicable Core Operating Profit Growth percentages, the Core Operating Profit for thecurrent year should be compared to the prior GAAP Operating Profit adjusted only for the prior year Special Items Income(Expense).
(c) The tax benefit (expense) was determined based upon the impact of the nature, as well as the jurisdiction of the respectiveindividual components within Special Items. In 2016, our tax rate on Special Items was favorably impacted by theutilization of capital loss carryforwards associated with U.S. refranchising. In 2015, our tax rate on Special Items wasunfavorably impacted by the non-deductibility of certain losses associated with international refranchising. See Note18.
Reconciliation of Diluted EPS from Continuing Operations to Diluted EPSfrom Continuing Operations excluding Special ItemsDiluted EPS from Continuing Operations $ 2.48 $ 2.11 $ 2.22Special Items EPS 0.03 (0.22) 0.02Diluted EPS from Continuing Operations excluding Special Items $ 2.45 $ 2.33 $ 2.20
Reconciliation of GAAP Effective Tax Rate to Effective Tax Rate excludingSpecial ItemsGAAP Effective Tax Rate 24.6 % 25.8% 26.7 %Impact on Tax Rate as a result of Special Items(c) (1.7)% 2.1% (0.1)%Effective Tax Rate excluding Special Items 26.3 % 23.7% 26.8 %
29

KFC Division
The KFC Division has 20,604 units, 80% of which are located outside the U.S. The KFC Division has experienced significantunit growth in emerging markets, which comprised approximately 60% of both the Division’s units and profits, respectively, asof the end of 2016. Additionally, 93% of the KFC Division units were operated by franchisees as of the end of 2016.
% B/(W) % B/(W)2016 2015
2016 2015 2014 Reported Ex FXEx-FX and53rd Week Reported Ex FX
System Sales Growth(Decline) 2 7 6 (3) 5Same-Store SalesGrowth 3 N/A N/A 1 N/A
Company sales $2,166 $2,203 $2,440 (2) 5 3 (10) 4Franchise and licensefees and income 1,066 1,032 1,067 3 8 7 (3) 5Total revenues $3,232 $3,235 $3,507 — 6 5 (8) 4
Restaurant profit $ 319 $ 308 $ 311 4 10 8 (1) 13
Restaurant margin % 14.7% 14.0% 12.8% 0.7 ppts. 0.7 ppts. 0.7 ppts. 1.2 ppts. 1.2 ppts.
G&A expenses $ 391 $ 401 $ 399 2 (1) — — (11)Operating Profit $ 874 $ 832 $ 876 5 11 10 (5) 5
% Increase (Decrease)Unit Count 2016 2015 2014 2016 2015
Franchise 19,183 18,452 17,894 4 3Company-owned 1,421 1,500 1,526 (5) (2)
20,604 19,952 19,420 3 3
2015 New Builds Closures Refranchised Acquired Other 2016Franchise 18,452 976 (409) 163 — 1 19,183Company-owned 1,500 120 (35) (163) — (1) 1,421Total 19,952 1,096 (444) — — — 20,604
2014 New Builds Closures Refranchised Acquired Other 2015Franchise 17,894 975 (511) 117 (12) (11) 18,452Company-owned 1,526 106 (27) (117) 12 — 1,500Total 19,420 1,081 (538) — — (11) 19,952
30

Company Sales and Restaurant Profit
The changes in Company sales and Restaurant profit were as follows:
2016 vs. 2015
Income / (Expense) 2015
StorePortfolioActions Other FX 53rd Week 2016
Company sales $ 2,203 $ 24 $ 52 $ (139) $ 26 $ 2,166Cost of sales (757) (10) (10) 50 (9) (736)Cost of labor (513) (3) (16) 29 (6) (509)Occupancy and other (625) 3 (15) 40 (5) (602)Restaurant profit $ 308 $ 14 $ 11 $ (20) $ 6 $ 319
2015 vs. 2014
Income / (Expense) 2014
StorePortfolioActions Other FX 2015
Company sales $ 2,440 $ 56 $ 46 $ (339) $ 2,203Cost of sales (858) (27) 11 117 (757)Cost of labor (568) (10) (15) 80 (513)Occupancy and other (703) (16) (1) 95 (625)Restaurant profit $ 311 $ 3 $ 41 $ (47) $ 308
In 2016, the increase in Company sales associated with store portfolio actions was driven by international net new unit growth,partially offset by refranchising. The increase in Restaurant profit associated with store portfolio actions was driven by internationalnet new unit growth. Significant other factors impacting Company sales and/or Restaurant profit were company same-store salesgrowth of 2%, partially offset by wage inflation and higher commodity costs.
In 2015, the increase in Company sales and Restaurant profit associated with store portfolio actions was driven by internationalnet new unit growth, partially offset by refranchising. Significant other factors impacting Company sales and/or Restaurant profitwere company same-store sales growth of 2%.
Franchise and License Fees and Income
In 2016, the increase in Franchise and license fees and income, excluding the impacts of foreign currency translation and 53rd
week, was driven by international net new unit growth, franchise same-store sales growth of 3% and refranchising.
In 2015, the increase in Franchise and license fees and income, excluding the impact of foreign currency translation, was drivenby international net new unit growth, franchise same-store sales growth of 1% and refranchising.
G&A Expenses
In 2016, G&A expenses, excluding the impacts of foreign currency translation and 53rd week, were even with prior year as theimpact of higher compensation costs due to increased headcount and wage inflation in international markets and higher incentivecompensation was offset by lower U.S. pension costs.
In 2015, the increase in G&A expenses, excluding the impact of foreign currency translation, was driven by higher incentivecompensation,increased headcount in international markets and higher pension costs, including lapping the favorable resolutionof a pension issue in the UK in 2014.
31

Operating Profit
In 2016, the increase in Operating Profit, excluding the impacts of foreign currency translation and 53rd week, was driven byinternational net new unit growth and same-store sales growth, partially offset by higher restaurant operating costs and advertisingcontributions associated with the KFC U.S. Acceleration Agreement.
In 2015, the increase in Operating Profit, excluding the impact of foreign currency translation, was driven by same-store sales andinternational net new unit growth, partially offset by higher G&A expenses.
32
Pizza Hut Division
The Pizza Hut Division has 16,409 units, 53% of which are located outside the U.S. The Pizza Hut Division operates as one brandthat uses multiple distribution channels including delivery, dine-in and express (e.g. airports). Emerging markets comprisedapproximately one-third of both units and profits for the Division as of the end of 2016. Additionally, 97% of the Pizza HutDivision units were operated by franchisees as of the end of 2016.
% B/(W) % B/(W)2016 2015
2016 2015 2014 Reported Ex FXEx-FX and53rd Week Reported Ex FX
System Sales Growth(Decline) — 2 1 (1) 3Same-Store SalesGrowth (Decline) (1) N/A N/A — N/A
Company sales $ 494 $ 609 $ 609 (19) (17) (18) — 3Franchise and licensefees and income 617 605 606 2 4 3 — 4
Total revenues $1,111 $1,214 $1,215 (8) (7) (8) — 3
Restaurant profit $ 41 $ 59 $ 49 (31) (31) (33) 20 17Restaurant margin % 8.3% 9.7% 8.1% (1.4) ppts. (1.6) ppts. (1.7) ppts. 1.6 ppts. 1.1 ppts.
G&A expenses $ 241 $ 272 $ 253 12 10 11 (7) (13)Operating Profit $ 370 $ 347 $ 347 7 9 7 — 2
% Increase (Decrease)Unit Count 2016 2015 2014 2016 2015
Franchise 15,856 15,304 14,817 4 3Company-owned 553 759 788 (27) (4)
16,409 16,063 15,605 2 3
2015 New Builds Closures Refranchised Acquired Other 2016Franchise 15,304 881 (547) 218 — — 15,856Company-owned 759 45 (33) (218) — — 553Total 16,063 926 (580) — — — 16,409

2014 New Builds Closures Refranchised Acquired Other 2015Franchise 14,817 915 (479) 90 (44) 5 15,304Company-owned 788 55 (38) (90) 44 — 759Total 15,605 970 (517) — — 5 16,063
Company Sales and Restaurant Profit
The changes in Company sales and Restaurant profit were as follows:
2016 vs. 2015
Income / (Expense) 2015
StorePortfolioActions Other FX 53rd Week 2016
Company sales $ 609 $ (120) $ 10 $ (10) $ 5 $ 494Cost of sales (169) 34 (3) 3 (2) (137)Cost of labor (190) 40 (8) 3 (1) (156)Occupancy and other (191) 33 (5) 4 (1) (160)Restaurant profit $ 59 $ (13) $ (6) $ — $ 1 $ 41
2015 vs. 2014
Income / (Expense) 2014
StorePortfolioActions Other FX 2015
Company sales $ 609 $ 22 $ (4) $ (18) $ 609Cost of sales (181) (6) 12 6 (169)Cost of labor (189) (6) (1) 6 (190)Occupancy and other (190) (8) (1) 8 (191)Restaurant profit $ 49 $ 2 $ 6 $ 2 $ 59
In 2016, the decrease in Company sales and Restaurant profit associated with store portfolio actions was driven by refranchising.Significant other factors impacting Company sales and/or Restaurant profit were higher labor costs and increased advertisingspend in the U.S., partially offset by company same-store sales growth of 2%.
In 2015, the increase in Company sales and Restaurant profit associated with store portfolio actions was driven by the impact ofacquisitions in Canada and the U.S. and net new unit growth, partially offset by refranchising. Significant other factors impactingCompany sales and/or Restaurant profit were commodity deflation, primarily in the U.S., partially offset by company same-storesales declines of 1%.
Franchise and License Fees and Income
In 2016, the increase in Franchise and license fees income, excluding the impacts of foreign currency translation and 53rd week,was driven by net new unit growth, refranchising and higher fees from expiring development agreements, partially offset byfranchise same-store sales declines of 2%.
In 2015, the increase in Franchise and license fees and income, excluding the impact of foreign currency translation, was drivenby net new unit growth. Franchise same-store sales were even.
33

G&A Expenses
In 2016, the decrease in G&A expenses, excluding the impacts of foreign currency translation and 53rd week, was driven by lowerlitigation settlement costs and legal fees, refranchising and lower U.S. pension costs, partially offset by higher incentivecompensation costs.
In 2015, the increase in G&A expenses, excluding the impact of foreign currency translation, was driven by strategic internationalinvestments and higher U.S. pension costs.
Operating Profit
In 2016, the increase in Operating Profit, excluding the impacts of foreign currency translation and 53rd week, was driven by lowerG&A expenses and net new unit growth, partially offset by franchise same-store sales declines.
In 2015, the increase in Operating Profit, excluding the impact of foreign currency translation, was driven by net new unit growthand lower commodity costs, partially offset by higher G&A expenses.
34
Taco Bell Division
The Taco Bell Division has 6,604 units, the vast majority of which are in the U.S. The Company owns 14% of the Taco Bell unitsin the U.S., where the brand has historically achieved high restaurant margins and returns.
% B/(W) % B/(W)2016 2015
2016 2015 2014 Reported Ex FXEx-FX and53rd Week Reported Ex FX
System Sales Growth 6 6 4 8 8
Same-Store SalesGrowth 2 N/A N/A 5 N/ACompany sales $1,540 $1,544 $1,454 — — (2) 6 6Franchise and licensefees and income 485 447 411 8 9 7 9 9Total revenues $2,025 $1,991 $1,865 2 2 — 7 7
Restaurant profit $ 342 $ 342 $ 274 — — (2) 25 25Restaurant margin % 22.2% 22.2% 18.8% — ppts. — ppts. (0.1) ppts. 3.4 ppts. 3.4 ppts.
G&A expenses $ 213 $ 230 $ 187 7 7 8 (23) (23)Operating Profit $ 593 $ 536 $ 478 11 10 8 12 12
% Increase (Decrease)Unit Count 2016 2015 2014 2016 2015
Franchise 5,719 5,507 5,273 4 4Company-owned 885 900 933 (2) (4)
6,604 6,407 6,206 3 3
2015 New Builds Closures Refranchised Acquired Other 2016Franchise 5,507 260 (94) 46 (1) 1 5,719Company-owned 900 34 (4) (46) 1 — 885Total 6,407 294 (98) — — 1 6,604

2014 New Builds Closures Refranchised Acquired Other 2015Franchise 5,273 240 (80) 65 — 9 5,507Company-owned 933 37 (5) (65) — — 900Total 6,206 277 (85) — — 9 6,407
Company Sales and Restaurant Profit
The changes in Company sales and Restaurant profit were as follows:
2016 vs. 2015
Income / (Expense) 2015
StorePortfolioActions Other 53rd Week 2016
Company sales $ 1,544 $ (37) $ 9 $ 24 $ 1,540Cost of sales (422) 11 21 (6) (396)Cost of labor (428) 10 (19) (7) (444)Occupancy and other (352) 7 (9) (4) (358)Restaurant profit $ 342 $ (9) $ 2 $ 7 $ 342
2015 vs. 2014
Income / (Expense) 2014
StorePortfolioActions Other 2015
Company sales $ 1,454 $ 39 $ 51 $ 1,544Cost of sales (432) (10) 20 (422)Cost of labor (414) (13) (1) (428)Occupancy and other (334) (11) (7) (352)Restaurant profit $ 274 $ 5 $ 63 $ 342
In 2016, the decrease in Company sales and Restaurant profit associated with store portfolio actions was driven by refranchising,partially offset by net new unit growth. Significant other factors impacting Company sales and/or Restaurant profit were companysame-store sales growth of 1% and favorable commodity costs, partially offset by higher labor costs and store-level investments.
In 2015, the increase in Company sales and Restaurant profit associated with store portfolio actions was driven by net new unitgrowth. Significant other factors impacting Company sales and/or Restaurant profit were company same-store sales growth of 4%and commodity deflation.
Franchise and License Fees and Income
In 2016, the increase in Franchise and license fees and income, excluding the impacts of foreign currency translation and the 53rd
week, was driven by net new unit growth, franchise same-store sales growth of 2% and refranchising.
In 2015, the increase in Franchise and license fees and income was driven by franchise same-store sales growth of 5%, net newunit growth and lapping franchise incentives provided in the first quarter of 2014 related to the national launch of breakfast.
G&A Expenses
In 2016, the decrease in G&A expenses was driven by lower U.S. pension costs, lapping the Live Más Scholarship contribution,and lower litigation costs.
In 2015, the increase in G&A expenses was driven by higher incentive compensation costs, investment spending on strategicgrowth and technology initiatives, higher U.S. pension costs, higher litigation costs and the creation of the Live Más Scholarship.
35

Operating Profit
In 2016, the increase in Operating Profit, excluding the impacts of foreign currency translation and 53rd week, was driven by same-store sales growth, net new unit growth and lower G&A expenses, partially offset by higher restaurant operating costs andrefranchising.
In 2015, the increase in Operating Profit was driven by same-store sales growth and net new unit growth, partially offset by higherG&A expenses.
36
Corporate & Unallocated
% B/(W)
Income/(Expense) 2016 2015 2014 2016 2015Corporate G&A expenses $ (316) $ (196) $ (189) (62) (3)Unallocated Franchise and license fees and income (2) — — NM NMUnallocated Franchise and license expenses (24) (71) — 67 NMRefranchising gain (loss) (See Note 5) 141 (23) 16 NM NMUnallocated Other income (expense) (11) (23) (11) 47 NMInterest expense, net (307) (141) (143) NM 1Income tax provision (See Note 18) (324) (325) (368) — 11Effective tax rate (See Note 18) 24.6% 25.8% 26.7% 1.2 ppts. 0.9 ppts.
Corporate G&A Expenses
In 2016, the increase in Corporate G&A expenses was driven by incremental costs associated with YUM's Strategic TransformationInitiatives (See Note 5), non-cash charges associated with the modification of certain Executive Income Deferral (“EID”) share-based compensation awards (See Note 5 ), Retirement plan settlement charges (See Note 5) and higher incentive compensationcosts, partially offset by lower professional and legal fees.
In 2015, the increase in Corporate G&A expenses was driven by higher pension costs.
Unallocated Franchise and License fees and income
In 2016, Unallocated Franchise and license fees and income reflects charges related to the KFC U.S. Acceleration Agreement.See Note 5.
Unallocated Franchise and License expenses
In 2016 and 2015, Unallocated Franchise and license expenses reflect charges related to the KFC U.S. Acceleration Agreement.See Note 5.
Unallocated Other Income (Expense)
In 2016, Unallocated Other (income) expense primarily includes write-downs related to our decision to dispose of ourcorporate aircraft and foreign exchange losses. See Note 8.
In 2015 and 2014, Unallocated Other (income) expense primarily includes foreign exchange losses.
Interest Expense, Net
The increase in interest expense, net for 2016 was driven by increased outstanding borrowings. See Note 11.
The decrease in interest expense, net for 2015 was driven by lower effective interest rates on outstanding borrowings, partiallyoffset by increased short-term borrowings.

Income Tax Provision
See Note 18 for discussion of our income tax provision.
Income from Discontinued Operations, Net of Tax
The following table is a summary of the operating results of the China business which have been reflected in discontinued operations.See Note 4 for additional information.
2016(a) 2015 2014
Total revenues $ 5,776 $ 6,909 $ 6,934Total income from discontinued operations before income taxes(b)(c) 571 526 53Income tax (benefit) provision(c)(d) (65) 164 38Income from discontinued operations, net of tax(c) 625 357 45
(a) Includes Yum China financial results from January 1, 2016 to October 31, 2016.
(b) Includes costs incurred to execute the Separation of $68 million and $9 million for 2016 and 2015, respectively. Suchcosts primarily relate to transaction advisors, legal and other consulting fees.
(c) During 2014, we recorded a $463 million non-cash impairment charge related to China's investment in the Little Sheeprestaurant business. The tax benefit associated with these losses of $76 million and the losses allocated to the noncontrollingfounding shareholder of $26 million resulted in a net impact of $361 million on Income from discontinued operations,net of tax.
(d) During 2016, we recorded a tax benefit of $233 million related to previously recorded losses associated with China'sLittle Sheep business. The tax benefit associated with these losses was able to be recognized as a result of legal entityrestructuring completed in anticipation of the China spin-off.
37
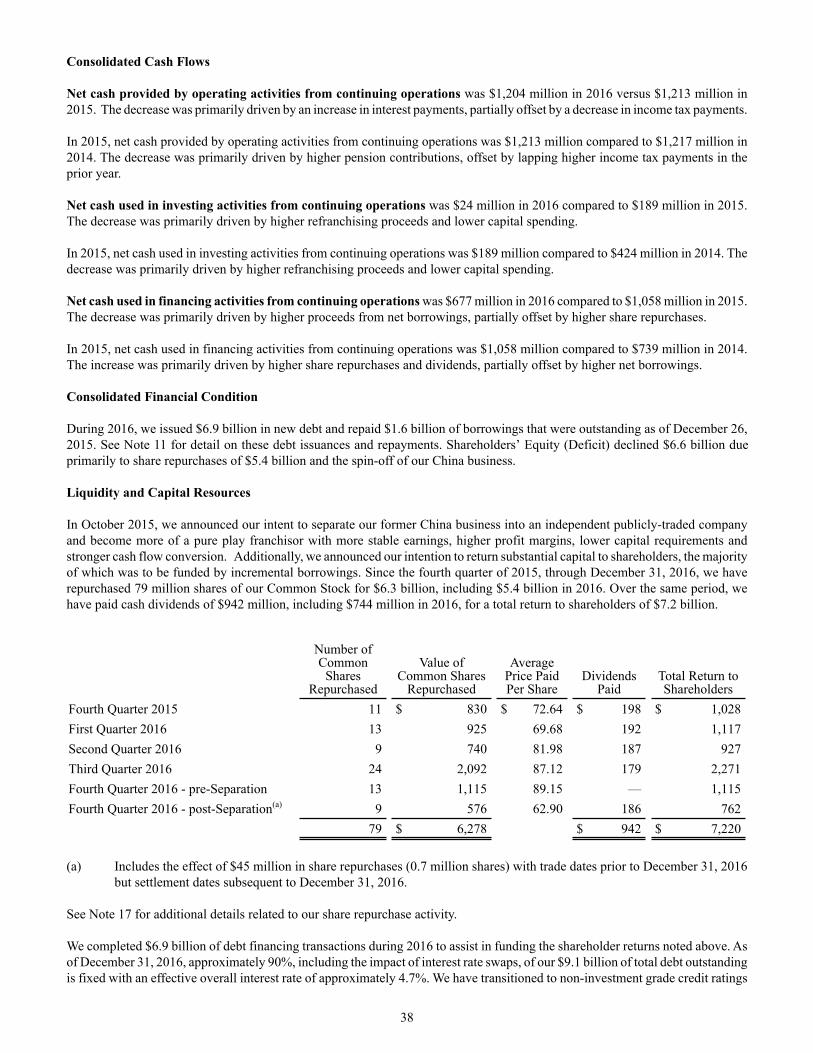
Consolidated Cash Flows
Net cash provided by operating activities from continuing operations was $1,204 million in 2016 versus $1,213 million in2015. The decrease was primarily driven by an increase in interest payments, partially offset by a decrease in income tax payments.
In 2015, net cash provided by operating activities from continuing operations was $1,213 million compared to $1,217 million in2014. The decrease was primarily driven by higher pension contributions, offset by lapping higher income tax payments in theprior year.
Net cash used in investing activities from continuing operations was $24 million in 2016 compared to $189 million in 2015.The decrease was primarily driven by higher refranchising proceeds and lower capital spending.
In 2015, net cash used in investing activities from continuing operations was $189 million compared to $424 million in 2014. Thedecrease was primarily driven by higher refranchising proceeds and lower capital spending.
Net cash used in financing activities from continuing operations was $677 million in 2016 compared to $1,058 million in 2015.The decrease was primarily driven by higher proceeds from net borrowings, partially offset by higher share repurchases.
In 2015, net cash used in financing activities from continuing operations was $1,058 million compared to $739 million in 2014.The increase was primarily driven by higher share repurchases and dividends, partially offset by higher net borrowings.
Consolidated Financial Condition
During 2016, we issued $6.9 billion in new debt and repaid $1.6 billion of borrowings that were outstanding as of December 26,2015. See Note 11 for detail on these debt issuances and repayments. Shareholders’ Equity (Deficit) declined $6.6 billion dueprimarily to share repurchases of $5.4 billion and the spin-off of our China business.
Liquidity and Capital Resources
In October 2015, we announced our intent to separate our former China business into an independent publicly-traded companyand become more of a pure play franchisor with more stable earnings, higher profit margins, lower capital requirements andstronger cash flow conversion. Additionally, we announced our intention to return substantial capital to shareholders, the majorityof which was to be funded by incremental borrowings. Since the fourth quarter of 2015, through December 31, 2016, we haverepurchased 79 million shares of our Common Stock for $6.3 billion, including $5.4 billion in 2016. Over the same period, wehave paid cash dividends of $942 million, including $744 million in 2016, for a total return to shareholders of $7.2 billion.
Number ofCommon
SharesRepurchased
Value ofCommon Shares
Repurchased
AveragePrice PaidPer Share
DividendsPaid
Total Return toShareholders
Fourth Quarter 2015 11 $ 830 $ 72.64 $ 198 $ 1,028First Quarter 2016 13 925 69.68 192 1,117Second Quarter 2016 9 740 81.98 187 927Third Quarter 2016 24 2,092 87.12 179 2,271Fourth Quarter 2016 - pre-Separation 13 1,115 89.15 — 1,115Fourth Quarter 2016 - post-Separation(a) 9 576 62.90 186 762
79 $ 6,278 $ 942 $ 7,220
(a) Includes the effect of $45 million in share repurchases (0.7 million shares) with trade dates prior to December 31, 2016but settlement dates subsequent to December 31, 2016.
See Note 17 for additional details related to our share repurchase activity.
We completed $6.9 billion of debt financing transactions during 2016 to assist in funding the shareholder returns noted above. Asof December 31, 2016, approximately 90%, including the impact of interest rate swaps, of our $9.1 billion of total debt outstandingis fixed with an effective overall interest rate of approximately 4.7%. We have transitioned to non-investment grade credit ratings
38

of BB (Standard & Poor's)/Ba3 (Moody's) with a balance sheet more consistent with highly-levered peer restaurant franchisecompanies. We are now managing a capital structure which is levered in-line with our target of approximately five times EBITDA,and which we believe provides an attractive balance between optimized interest rates, duration and flexibility with diversifiedsources of liquidity and maturities spread over multiple years. See Note 11 for details of our financing activities supporting thereturn of capital initiative.
In October 2016, we announced YUM’s Strategic Transformation Initiatives to drive global expansion of the KFC, Pizza Hut andTaco Bell brands following the Separation on October 31, 2016. As part of this transformation we intend to own less than 1,000stores by the end of 2018 and, by 2019, reduce annual run-rate capital expenditures to approximately $100 million, improve ourefficiency by lowering G&A expenses to 1.7% of system sales and increase free cash flow conversion to 100%.
Over the next 3 years, we intend to return an additional $6.5 to $7.0 billion to shareholders through share repurchases and cashdividends. We intend to fund these additional shareholder returns through a combination of free cash flow generation, refranchisingproceeds and maintenance of our five times EBITDA leverage. We anticipate generating proceeds in excess of $2 billion, net oftax, through the refranchising of over 2,000 stores.
We have historically generated substantial cash flows from the operations of our company-owned stores and from our extensivefranchise operations, which require a limited YUM investment. Our annual operating cash flows from continuing operations haveapproximated $1.2 billion each of the past three years. Going forward, we anticipate that any decrease in operating cash flowsfrom the operation of fewer Company-owned stores due to refranchising will be offset with savings generated from decreasedcapital investment and G&A expense required to support company operations. To the extent operating cash flows plus other sourcesof cash such as refranchising proceeds do not cover our anticipated cash needs, we maintain $1 billion of undrawn capacity underour existing revolving credit facility.
Our balance sheet often reflects a working capital deficit, which is not uncommon in our industry and is also historically commonfor YUM. Company sales are paid in cash or by credit card (which is quickly converted into cash) and our royalty receivablesfrom franchisees are generally due within 30 days of the period in which the related sales occur. Substantial amounts of cashreceived have historically been either invested in new restaurant assets which are non-current in nature or returned to shareholders.As part of our working capital strategy we negotiate favorable credit terms with vendors and, as a result, our on-hand inventoryturns faster than the related short-term liabilities. Accordingly, it is not unusual for current liabilities to exceed current assets. Webelieve such a deficit has no significant impact on our liquidity or operations.
We generate a significant amount of cash from operating activities outside the U.S. that we have used historically to fund ourinternational development. To the extent we have needed to repatriate international cash to fund our U.S. discretionary cashspending, including returns to shareholders and debt repayments, we have historically been able to do so in a tax-efficient manner.If we experience an unforeseen decrease in our cash flows from our U.S. businesses or are unable to refinance future U.S. debtmaturities we may be required to repatriate future international earnings at tax rates higher than we have historically experienced.
Borrowing Capacity
Securitization Notes. In May 2016, Taco Bell Funding, LLC, a newly formed special purpose subsidiary of the Company, issuedan aggregate of $2.3 billion of fixed rate senior secured notes (“Class A-2 Notes”). In connection with the issuance of the Class A-2Notes, Taco Bell Funding, LLC also issued variable rate notes (the “Variable Funding Notes” and, together with the Class A-2Notes, the “Securitization Notes”) pursuant to a new revolving financing facility, which allows for the borrowing of up to $100million including the issuance of letters of credit up to $50 million. We have no outstanding borrowings related to the VariableFunding Notes and have $15 million in letters of credit outstanding as of December 31, 2016 related to this facility. TheSecuritization Notes contain cross-default provisions whereby the failure to pay principal on any outstanding Securitization Noteswill constitute an event of default under any other Securitization Notes.
The Company used certain of the proceeds from the sale of the Class A-2 Notes to pay down the entire outstanding balance of $2billion of its Unsecured Short-term Loan Credit Facility ("Bridge Facility"), at which time the Bridge Facility was terminated, aswell as to pay related fees and expenses and fund certain accounts related to the Securitization Notes. The remaining proceeds ofthe Securitization Notes were used to return capital to shareholders through share repurchases and for general corporate purposes.
Credit Agreement. In June 2016, three wholly-owned subsidiaries of the Company, KFC Holding Co., Pizza Hut Holdings, LLCand Taco Bell of America, LLC, as co-borrowers (the "Borrowers") entered into a new credit agreement (the “Credit Agreement”)providing for (i) a $500 million Term Loan A facility (the “Term Loan A Facility”), (ii) a $2 billion Term Loan B facility (the“Term Loan B Facility”) and (iii) a $1 billion revolving facility (the “Revolving Facility”) which has no outstanding borrowings
39

and has $5 million in letters of credit outstanding as of December 31, 2016, each of which may be increased subject to certainconditions. Our Term Loan A Facility and Term Loan B Facility contain cross-default provisions whereby the failure to payprincipal of or otherwise perform any agreement or condition under indebtedness of certain subsidiaries with a principal amountin excess of $100 million will constitute an event of default under the Credit Agreement.
Subsidiary Senior Unsecured Notes. On June 16, 2016, the Borrowers issued an aggregate of $1.05 billion Senior UnsecuredNotes due 2024 and an aggregate of $1.05 billion Senior Unsecured Notes due 2026 (together, the “Subsidiary Senior UnsecuredNotes”). Our Subsidiary Senior Unsecured Notes contain cross-default provisions whereby the acceleration of the maturity of theindebtedness of certain subsidiaries with a principal amount in excess of $100 million or the failure to pay principal of suchindebtedness will constitute an event of default under the Subsidiary Senior Unsecured Notes.
We used certain of the proceeds from the Subsidiary Senior Unsecured Notes and the Term Loan A Facility and the Term Loan BFacility to repay all outstanding amounts under our senior unsecured revolving credit facility (the “Senior Unsecured RevolvingCredit Facility”) which had outstanding borrowings of $701 million as of December 26, 2015. Concurrent with this repaymentthe Senior Unsecured Revolving Credit Facility was terminated. The remaining proceeds are being used to return capital toshareholders through share repurchases and for general corporate purposes.
The majority of our remaining long-term debt primarily comprises Senior, unsecured obligations ("YUM Senior Unsecured Notes")which ranks equally in right of payment with all of our existing and future unsecured unsubordinated indebtedness. The YUMSenior Unsecured Notes have varying maturity dates from 2018 through 2043 and stated interest rates ranging from 3.75% to6.88%. Amounts outstanding under YUM Senior Unsecured Notes were $2.2 billion at December 31, 2016. Our YUM SeniorUnsecured Notes contain cross-default provisions whereby the acceleration of the maturity of any of our indebtedness in a principalamount in excess of $50 million will constitute a default under the YUM Senior Unsecured Notes unless such indebtedness isdischarged, or the acceleration of the maturity of that indebtedness is annulled, within 30 days after notice.
The following table summarizes the future maturities of our outstanding long-term debt, excluding capital leases, as of December31, 2016.
2017 2018 2019 2020 2021 2022 2023 2024 2025 2026 2037 2043 Total
Securitization Notes $ 23 $ 23 $ 23 $ 789 $ 15 $ 15 $ 479 $ 10 $ 10 $ 907 $ 2,294
Credit Agreement 32 45 51 76 395 20 1,871 2,490
Subsidiary Senior Unsecured Notes 1,050 1,050 2,100
YUM Senior Unsecured Notes 325 250 350 350 325 325 275 2,200
Total $ 55 $ 393 $ 324 $1,215 $ 760 $ 35 $2,675 $1,060 $ 10 $1,957 $ 325 $ 275 $ 9,084
As a result of issuing the Securitization Notes and the Subsidiary Senior Unsecured Notes and executing the Credit Agreementwe have completed our recapitalization plan. Full year 2016 interest expense was $333 million and we currently expect annualizedinterest expense of approximately $430 million based on existing debt levels and current interest rates on our variable-rate debt.
See Note 11 for details on the the Securitization Notes, Subsidiary Senior Unsecured Notes, the Credit Agreement and YUMSenior Unsecured Notes.
Contractual Obligations
Our significant contractual obligations and payments as of December 31, 2016 included:
TotalLess than 1
Year 1-3 Years 3-5 YearsMore than 5
YearsLong-term debt obligations(a) $ 12,304 $ 462 $ 1,481 $ 2,628 $ 7,733Capital leases(b) 181 16 31 29 105Operating leases(b) 1,204 171 276 186 571Purchase obligations(c) 417 273 115 28 1Benefit plans(d) 249 120 38 28 63Total contractual obligations $ 14,355 $ 1,042 $ 1,941 $ 2,899 $ 8,473
40

(a) Amounts include maturities of debt outstanding as of December 31, 2016 and expected interest payments on thoseoutstanding amounts on a nominal basis. See Note 11.
(b) These obligations, which are shown on a nominal basis, relate primarily to approximately 2,000 company-ownedrestaurants. See Note 12.
(c) Purchase obligations include agreements to purchase goods or services that are enforceable and legally binding on usand that specify all significant terms, including: fixed or minimum quantities to be purchased; fixed, minimum or variableprice provisions; and the approximate timing of the transaction. We have excluded agreements that are cancelable withoutpenalty. Purchase obligations relate primarily to supply agreements, marketing, information technology, purchases ofproperty, plant and equipment ("PP&E") as well as consulting, maintenance and other agreements.
(d) Includes actuarially-determined timing of payments from our most significant unfunded pension plan as well as scheduledpayments from our deferred compensation plan and other unfunded benefit plans where payment dates are determinable.This table excludes $37 million of future benefit payments for deferred compensation and other unfunded benefit plansto be paid upon separation of employee's service or retirement from the company, as we cannot reasonably estimate thedates of these future cash payments.
We sponsor noncontributory defined benefit pension plans covering certain salaried and hourly employees, the most significantof which are in the U.S. and UK. The most significant of the U.S. plans, the YUM Retirement Plan (the “Plan”), is funded whilebenefits from our other significant U.S. plan are paid by the Company as incurred (see footnote (d) above). Our funding policyfor the Plan is to contribute annually amounts that will at least equal the minimum amounts required to comply with the PensionProtection Act of 2006. However, additional voluntary contributions are made from time-to-time to improve the Plan’s fundedstatus. At December 31, 2016 the Plan was in a net underfunded position of $58 million. The UK pension plans were in a netoverfunded position of $44 million at our 2016 measurement date.
We do not anticipate making any significant contributions to the Plan in 2017. Investment performance and corporate bond rateshave a significant effect on our net funding position as they drive our asset balances and discount rate assumptions. Future changesin investment performance and corporate bond rates could impact our funded status and the timing and amounts of requiredcontributions in 2017 and beyond.
Our post-retirement health care plan in the U.S. is not required to be funded in advance, but is pay as you go. We made post-retirement benefit payments of $5 million in 2016 and no future funding amounts are included in the contractual obligationstable. See Note 15.
We have excluded from the contractual obligations table payments we may make for exposures for which we are self-insured,including workers’ compensation, employment practices liability, general liability, automobile liability, product liability andproperty losses (collectively “property and casualty losses”) and employee healthcare and long-term disability claims. The majorityof our recorded liability for self-insured property and casualty losses and employee healthcare and long-term disability claimsrepresents estimated reserves for incurred claims that have yet to be filed or settled.
We have not included in the contractual obligations table approximately $4 million of liabilities for unrecognized tax benefitsrelating to various tax positions we have taken. These liabilities may increase or decrease over time as a result of tax examinations,and given the status of the examinations, we cannot reliably estimate the period of any cash settlement with the respective taxingauthorities. These liabilities exclude amounts that are temporary in nature and for which we anticipate that over time there willbe no net cash outflow.
We have excluded from the contractual obligations table certain commitments associated with the KFC U.S. AccelerationAgreement (See Note 5) as we cannot reliably estimate the specific timing of the remaining investments to be made in each of thenext two years. In connection with this agreement we anticipate investing a total of approximately $120 million from 2015 through2018 primarily to fund new back-of-house equipment for franchisees and to provide incentives to accelerate franchisee storeremodels, of which $98 million has been invested through 2016.
41
Off-Balance Sheet Arrangements
See the Lease Guarantees and Franchise Loan Pool and Equipment Guarantees sections of Note 20 for discussion of our off-balance sheet arrangements.

New Accounting Pronouncements Not Yet Adopted
In May 2014, the Financial Accounting Standards Board ("FASB") issued Accounting Standards Update ("ASU") No. 2014-09,Revenue from Contracts with Customers (Topic 606), to provide principles within a single framework for revenue recognition oftransactions involving contracts with customers across all industries. The standard allows for either a full retrospective or modifiedretrospective transition method. In March and April 2016, the FASB issued the following amendments to clarify the implementationof ASU 2014-09: ASU No. 2016-08, Revenue from Contracts with Customers (Topic 606): Principal versus Agent Considerations(Reporting Revenue Gross versus Net) and ASU No. 2016-10 Revenue from Contracts with Customers (Topic 606): IdentifyingPerformance Obligations and Licensing. We intend to adopt the new standards using the full retrospective transition method inthe first quarter of 2018.
We do not believe these standards will impact the recognition of our two largest sources of revenue, sales in company-ownedrestaurants and sales-based continuing fees from franchisees. Additionally, we do not expect the new standards will materiallyimpact the recognition of refranchising gains and losses as these transactions are divestitures of businesses and thus outside thescope of the standards. See Note 2 for a description of our current accounting policies.
The standards require that the transaction price received from customers be allocated to each separate and distinct performanceobligation. The transaction price attributable to each separate and distinct performance obligation is then recognized as theperformance obligations are satisfied. We are currently evaluating the standards to determine whether the services we providerelated to upfront fees we receive from franchisees such as initial or renewal fees contain separate and distinct performanceobligations from the franchise right. If we determine these services are not separate and distinct from the overall franchise right,the fees received will be recognized as revenue over the term of each respective franchise agreement. We currently recognizeupfront franchise fees such as initial and renewal fees when the related services have been provided, which is when a store opensfor initial fees and when renewal options become effective for renewal fees. The standards require the unamortized portion offees received to be presented in our Consolidated Balance Sheets as a contract liability. Any contract liabilities required to berecorded as a result of adopting these standards may be material to our Consolidated Balance Sheets given the volume of ourfranchise agreements and their duration, which is typically equal to or in excess of ten years.
Similarly, we are currently evaluating whether the benefits we receive from incentive payments we may make to our franchisees(e.g. equipment funding provided under the KFC U.S. Acceleration Agreement, see Note 5) are separate and distinct from thebenefits we receive from the franchise right. If they cannot be separated from the franchise right then such incentive paymentswould be amortized as a reduction of revenue over the term of the franchise agreement. Currently, we recognize any paymentsmade to franchisees within our Consolidated Statements of Income when we are obligated to make the payment.
We are also evaluating whether the standards will have an impact on transactions currently not included in our revenues such asfranchisee contributions to and subsequent expenditures from advertising cooperatives that we are required to consolidate. We actas an agent in regard to these franchisee contributions and expenditures and as such we do not currently include them in ourConsolidated Statements of Income or Cash Flows. See Note 2 for details. We are evaluating whether the new standards willimpact the principal/agent determinations in these arrangements. If we determine we are the principal in these arrangements wewould include contributions to and expenditures from these advertising cooperatives within our Consolidated Statements of Incomeand Cash Flows. While any such change has the potential to materially impact our gross amount of reported revenues and expenses,such impact would largely be offsetting and we would not expect there to be a significant impact on our reported Net Income.
In February 2016, the FASB issued ASU No. 2016-02, Leases (Topic 842), which increases transparency and comparability amongorganizations by requiring that substantially all lease assets and liabilities be recognized on the balance sheet and disclosing keyinformation about leasing arrangements. ASU 2016-02 is effective for the Company in our first quarter of fiscal 2019 with earlyadoption permitted. The standard must be adopted using a modified retrospective transition approach for leases existing at, orentered into after, the beginning of the earliest comparative period presented in the financial statements. We currently plan to adoptASU 2016-02 in the first quarter of 2019 and we are evaluating the impact the adoption of this standard will have on our FinancialStatements. Based on our current volume of store leases and subleases (See Note 12) to franchisees we expect this adoption willresult in a material increase in the assets and liabilities on our Consolidated Balance Sheets; however, we believe the impact willbe less material over time as we execute our strategy to be at least 98% franchised by 2019 and thus are a party to fewer leases.Further, we do not anticipate adoption will have a significant impact on our Consolidated Statements of Income or Cash Flows.
In March 2016, the FASB issued ASU No. 2016-09, Compensation - Stock Compensation (Topic 718): Improvements to EmployeeShare-Based Payment Accounting, which is intended to simplify several aspects of the accounting for employee share-basedpayment transactions, including their income tax consequences, classification of awards as either equity or liabilities andclassification on the statement of cash flows. ASU 2016-09 is effective for the Company in our first quarter of fiscal 2017. Uponadoption of this standard, excess tax benefits associated with share-based compensation, which we currently recognize within
42
Common Stock, will be reflected within the Income tax provision in our Consolidated Statements of Income. Additionally, ourConsolidated Statements of Cash Flows will present such excess tax benefits, which are currently presented as a financing activity,as an operating activity. The impact of adopting this standard on our Financial Statements will be dependent on the timing andintrinsic value of future share-based compensation award exercises. Given the current intrinsic value of our outstanding share-based compensation awards, we currently anticipate a significant impact to our reported tax rate as exercises occur.
In June 2016, the FASB issued ASU No. 2016-13, Financial Instruments-Credit Losses (Topic 326): Measurement of Credit Losseson Financial Instruments, which requires measurement and recognition of expected versus incurred credit losses for financialassets held. ASU 2016-13 is effective for the Company in our first quarter of fiscal 2020 with early adoption permitted beginningin the first quarter of fiscal 2019. We are currently evaluating the impact the adoption of this standard will have on our FinancialStatements.
In October 2016, the FASB issued ASU No. 2016-16, Income Taxes (Topic 740): Intra-Entity Transfers of Assets Other ThanInventory, which requires the recognition of the income tax consequences of an intra-entity transfer of an asset, other than inventory,when the transfer occurs. The guidance will require a modified retrospective application with a cumulative adjustment to openingretained earnings at the beginning of our first quarter of fiscal 2019 but permits adoption at the beginning of an earlier annualperiod. We are currently evaluating the impact of adopting ASU 2016-16 on our Financial Statements.
43
Critical Accounting Policies and Estimates
Our reported results are impacted by the application of certain accounting policies that require us to make subjective or complexjudgments. These judgments involve estimations of the effect of matters that are inherently uncertain and may significantly impactour quarterly or annual results of operations or financial condition. Changes in the estimates and judgments could significantlyaffect our results of operations and financial condition and cash flows in future years. A description of what we consider to beour most significant critical accounting policies follows.
Impairment or Disposal of Long-Lived Assets
We review long-lived assets of restaurants (primarily PP&E and allocated intangible assets subject to amortization) semi-annuallyfor impairment, or whenever events or changes in circumstances indicate that the carrying amount of a restaurant may not berecoverable. We evaluate recoverability based on the restaurant’s forecasted undiscounted cash flows, which incorporate our bestestimate of sales growth and margin improvement based upon our plans for the unit and actual results at comparable restaurants. Forrestaurant assets that are deemed to not be recoverable, we write-down the impaired restaurant to its estimated fair value. Keyassumptions in the determination of fair value are the future after-tax cash flows of the restaurant, which are reduced by futureroyalties a franchisee would pay, and a discount rate. The after-tax cash flows incorporate reasonable sales growth and marginimprovement assumptions that would be used by a franchisee in the determination of a purchase price for the restaurant. Estimatesof future cash flows are highly subjective judgments and can be significantly impacted by changes in the business or economicconditions.
We perform an impairment evaluation at a restaurant group level if it is more likely than not that we will refranchise restaurantsas a group. Expected net sales proceeds are generally based on actual bids from the buyer, if available, or anticipated bids giventhe discounted projected after-tax cash flows for the group of restaurants. Historically, these anticipated bids have been reasonablyaccurate estimations of the proceeds ultimately received. The after-tax cash flows used in determining the anticipated bidsincorporate reasonable assumptions we believe a franchisee would make such as sales growth and margin improvement as wellas expectations as to the useful lives of the restaurant assets. These after-tax cash flows also include a deduction for the anticipated,future royalties we would receive under a franchise agreement with terms substantially at market entered into simultaneously withthe refranchising transaction.
The discount rate used in the fair value calculations is our estimate of the required rate of return that a franchisee would expectto receive when purchasing a similar restaurant or groups of restaurants and the related long-lived assets. The discount rateincorporates rates of returns for historical refranchising market transactions and is commensurate with the risks and uncertaintyinherent in the forecasted cash flows.
Impairment of Goodwill
We evaluate goodwill for impairment on an annual basis as of the beginning of our fourth quarter or more often if an event occursor circumstances change that indicates impairment might exist. Goodwill is evaluated for impairment by determining whetherthe fair value of our reporting units exceed their carrying values. Our reporting units are our business units (which are alignedbased on geography) in our KFC, Pizza Hut and Taco Bell Divisions. Fair value is the price a willing buyer would pay for the

reporting unit, and is generally estimated using discounted expected future after-tax cash flows from Company-owned restaurantoperations and franchise royalties.
Future cash flow estimates and the discount rate are the key assumptions when estimating the fair value of a reporting unit. Futurecash flows are based on growth expectations relative to recent historical performance and incorporate sales growth and marginimprovement assumptions that we believe a third-party buyer would assume when determining a purchase price for the reportingunit. The sales growth and margin improvement assumptions that factor into the discounted cash flows are highly correlated ascash flow growth can be achieved through various interrelated strategies such as product pricing and restaurant productivityinitiatives. The discount rate is our estimate of the required rate of return that a third-party buyer would expect to receive whenpurchasing a business from us that constitutes a reporting unit. We believe the discount rate is commensurate with the risks anduncertainty inherent in the forecasted cash flows.
The fair values of all our reporting units with goodwill balances were substantially in excess of their respective carrying valuesas of the 2016 goodwill testing date.
When we refranchise restaurants, we include goodwill in the carrying amount of the restaurants disposed of based on the relativefair values of the portion of the reporting unit disposed of in the refranchising versus the portion of the reporting unit that will beretained. The fair value of the portion of the reporting unit disposed of in a refranchising is determined by reference to thediscounted value of the future cash flows expected to be generated by the restaurant and retained by the franchisee, which includea deduction for the anticipated, future royalties the franchisee will pay us associated with the franchise agreement entered intosimultaneously with the refranchising transaction. Appropriate adjustments are made to the fair value determinations if suchfranchise agreement is determined to not be at prevailing market rates. When determining whether such franchise agreement isat prevailing market rates our primary consideration is consistency with the terms of our current franchise agreements both withinthe country that the restaurants are being refranchised in and around the world. The Company believes consistency in royaltyrates as a percentage of sales is appropriate as the Company and franchisee share in the impact of near-term fluctuations in salesresults with the acknowledgment that over the long-term the royalty rate represents an appropriate rate for both parties.
The discounted value of the future cash flows expected to be generated by the restaurant and retained by the franchisee is reducedby future royalties the franchisee will pay the Company. The Company thus considers the fair value of future royalties to bereceived under the franchise agreement as fair value retained in its determination of the goodwill to be written off whenrefranchising. Others may consider the fair value of these future royalties as fair value disposed of and thus would conclude thata larger percentage of a reporting unit’s fair value is disposed of in a refranchising transaction.
During 2016, the Company's reporting units with the most significant refranchising activity and recorded goodwill were PizzaHut U.S. and Taco Bell U.S. Within Pizza Hut U.S., 195 restaurants were refranchised (representing 38% of beginning-of-yearcompany units) and $3 million in goodwill was written off (representing 4% of beginning-of-year goodwill). Within Taco BellU.S., 46 restaurants were refranchised (representing 5% of beginning-of-year company units) and $2 million in goodwill waswritten off (representing 2% of beginning-of-year goodwill).
See Note 2 for a further discussion of our policies regarding goodwill.
Self-Insured Property and Casualty Losses
We record our best estimate of the remaining cost to settle incurred self-insured property and casualty losses. The estimate isbased on the results of an independent actuarial study and considers historical claim frequency and severity as well as changes infactors such as our business environment, benefit levels, medical costs and the regulatory environment that could impact overallself-insurance costs. Additionally, our reserve includes a risk margin to cover unforeseen events that may occur over the severalyears required to settle claims, increasing our confidence level that the recorded reserve is adequate.
See Note 20 for a further discussion of our insurance programs.
Pension Plans
Certain of our employees are covered under defined benefit pension plans. Our two most significant plans are in the U.S. andcombined had a projected benefit obligation (“PBO”) of $993 million and a fair value of plan assets of $837 million at December31, 2016.
The PBO reflects the actuarial present value of all benefits earned to date by employees and incorporates assumptions as to futurecompensation levels. Due to the relatively long time frame over which benefits earned to date are expected to be paid, our PBOs
44

are highly sensitive to changes in discount rates. For our U.S. plans, we measured our PBOs using a discount rate of 4.60% atDecember 31, 2016. This discount rate was determined with the assistance of our independent actuary. The primary basis for thisdiscount rate determination is a model that consists of a hypothetical portfolio of ten or more corporate debt instruments rated Aaor higher by Moody’s or Standard & Poor's ("S&P") with cash flows that mirror our expected benefit payment cash flows underthe plans. We exclude from the model those corporate debt instruments flagged by Moody’s or S&P for a potential downgrade(if the potential downgrade would result in a rating below Aa by both Moody's and S&P) and bonds with yields that were twostandard deviations or more above the mean. In considering possible bond portfolios, the model allows the bond cash flows fora particular year to exceed the expected benefit payment cash flows for that year. Such excesses are assumed to be reinvested atappropriate one-year forward rates and used to meet the benefit payment cash flows in a future year. The weighted-average yieldof this hypothetical portfolio was used to arrive at an appropriate discount rate. We also ensure that changes in the discount rateas compared to the prior year are consistent with the overall change in prevailing market rates and make adjustments as necessary. A50 basis-point increase in this discount rate would have decreased these U.S. plans’ PBOs by approximately $60 million at ourmeasurement date. Conversely, a 50 basis-point decrease in this discount rate would have increased our U.S. plans’ PBOs byapproximately $65 million at our measurement date.
The pension expense we will record in 2017 is also impacted by the discount rate, as well as the long-term rates of return on planassets and mortality assumptions we selected at our measurement date. We expect pension expense for our U.S. plans, excludingthe impact of settlement charges associated with the deferred vested payout program in 2016 (See Note 5), to be largely unchangedin 2017. A 50 basis-point decrease in our discount rate assumption at our 2016 measurement date would increase our 2017 U.S.pension expense by approximately $8 million. A 50 basis-point increase in our discount rate assumption at our 2016 measurementdate would decrease our 2017 U.S. pension expense by approximately $4 million.
Our estimated long-term rate of return on U.S. plan assets is based upon the weighted-average of historical returns for each assetcategory. Our expected long-term rate of return on U.S. plan assets, for purposes of determining 2017 pension expense, atDecember 31, 2016 was 6.5%. We believe this rate is appropriate given the composition of our plan assets and historical marketreturns thereon. A 100 basis point change in our expected long-term rate of return on plan assets assumption would impact our2017 U.S. pension expense by approximately $8 million. Additionally, every 100 basis point variation in actual return on planassets versus our expected return of 6.5% will impact our unrecognized pre-tax actuarial net loss by approximately $8 million.
A decrease in discount rates over time has largely contributed to an unrecognized pre-tax actuarial net loss of $150 million includedin Accumulated other comprehensive income (loss) for these U.S. plans at December 31, 2016. We will recognize approximately$7 million of such loss in net periodic benefit cost in 2017 versus $6 million recognized in 2016. See Note 15.
Income Taxes
At December 31, 2016, we had valuation allowances of approximately $195 million to reduce our $1.1 billion of deferred taxassets to amounts that are more likely than not to be realized. The net deferred tax assets primarily relate to capital loss carryforwardsand temporary differences in profitable U.S. federal, state and foreign jurisdictions, net operating losses in certain foreignjurisdictions, the majority of which do not expire, and U.S. foreign tax credit carryovers that expire 10 years from inception andfor which we anticipate having foreign earnings to utilize. In evaluating our ability to recover our deferred tax assets, we considerfuture taxable income in the various jurisdictions as well as carryforward periods and restrictions on usage. The estimation offuture taxable income in these jurisdictions and our resulting ability to utilize deferred tax assets can significantly change basedon future events, including our determinations as to feasibility of certain tax planning strategies and refranchising plans. Thus,recorded valuation allowances may be subject to material future changes.
As a matter of course, we are regularly audited by federal, state and foreign tax authorities. We recognize the benefit of positionstaken or expected to be taken in our tax returns in our Income tax provision when it is more likely than not that the position wouldbe sustained upon examination by these tax authorities. A recognized tax position is then measured at the largest amount of benefitthat is greater than fifty percent likely of being realized upon settlement. At December 31, 2016, we had $91 million of unrecognizedtax benefits, $87 million of which are temporary in nature and, if recognized, would not impact the effective tax rate. We evaluateunrecognized tax benefits, including interest thereon, on a quarterly basis to ensure that they have been appropriately adjusted forevents, including audit settlements, which may impact our ultimate payment for such exposures.
We have investments in foreign subsidiaries where the carrying values for financial reporting exceed the tax basis. We have notprovided deferred tax on the portion of the excess that we believe is indefinitely reinvested, as we have the ability and intent toindefinitely postpone these basis differences from reversing with a tax consequence. We estimate that our total temporarydifference upon which we have not provided deferred tax is approximately $2.1 billion at December 31, 2016. A determinationof the deferred tax liability on this amount is not practicable.
45
If our intentions regarding our ability and intent to postpone these basis differences from reversing with a tax consequence change,deferred tax may need to be provided that could materially impact the provision for income taxes.
See Note 18 for a further discussion of our income taxes.
46
Item 7A. Quantitative and Qualitative Disclosures About Market Risk.
The Company is exposed to financial market risks associated with interest rates, foreign currency exchange rates and commodityprices. In the normal course of business and in accordance with our policies, we manage these risks through a variety of strategies,which may include the use of financial and commodity derivative instruments to hedge our underlying exposures. Our policiesprohibit the use of derivative instruments for trading purposes, and we have processes in place to monitor and control their use.
Interest Rate Risk
We have a market risk exposure to changes in interest rates, principally in the U.S. Our outstanding Long-term debt of $9.1 billionincludes 73% fixed-rate debt and 27% variable-rate debt. We have attempted to minimize the interest rate risk related to $1.55billion of this variable-rate debt through the use of interest rate swaps. As a result, approximately 90% of our $9.1 billion ofoutstanding debt at December 31, 2016 is effectively fixed-rate debt. See Note 11 for details on these issuances and repaymentsand Note 13 for details related to interest rate swaps.
As of December 31, 2016 and December 26, 2015 a hypothetical 100 basis-point increase in short-term interest rates would result,over the following twelve-month period after consideration of the aforementioned interest rate swaps, in an increase ofapproximately $10 million and $14 million, respectively, in Interest expense, net within our Consolidated Statements of Income.These estimated amounts are based upon the current level of variable-rate debt that has not been swapped to fixed and assume nochanges in the volume or composition of that debt and include no impact from interest income related to cash and cash equivalents.
The fair value of our cumulative fixed-rate debt of $6.6 billion as of December 31, 2016, would decrease approximately $375million as a result of the same hypothetical 100 basis-point increase. At December 31, 2016, a hypothetical 100 basis-point decreasein short-term interest rates would decrease the fair value of our interest rate swaps approximately $55 million. Fair value wasdetermined based on the present value of expected future cash flows considering the risks involved and using discount ratesappropriate for the durations.
Foreign Currency Exchange Rate Risk
Changes in foreign currency exchange rates impact the translation of our reported foreign currency denominated earnings, cashflows and net investments in foreign operations and the fair value of our foreign currency denominated financial instruments.Historically, we have chosen not to hedge foreign currency risks related to our foreign currency denominated earnings and cashflows through the use of financial instruments. We attempt to minimize the exposure related to our net investments in foreignoperations by financing those investments with local currency denominated debt when practical. In addition, we attempt tominimize the exposure related to foreign currency denominated financial instruments by purchasing goods and services from thirdparties in local currencies when practical. Consequently, foreign currency denominated financial instruments consist primarily ofintercompany receivables and payables. At times, we utilize forward contracts and cross-currency swaps to reduce our exposurerelated to these intercompany receivables and payables. The notional amount and maturity dates of these contracts match thoseof the underlying receivables or payables such that our foreign currency exchange risk related to these instruments is minimized.
The Company’s foreign currency net asset exposure (defined as foreign currency assets less foreign currency liabilities) totaledapproximately $2.1 billion as of December 31, 2016. Operating in international markets exposes the Company to movements inforeign currency exchange rates. The Company’s primary exposures result from our operations in Asia-Pacific, Europe and theAmericas. For the fiscal year ended December 31, 2016 Operating Profit would have decreased approximately $105 million ifall foreign currencies had uniformly weakened 10% relative to the U.S. dollar. This estimated reduction assumes no changes insales volumes or local currency sales or input prices.
Commodity Price Risk
We are subject to volatility in food costs as a result of market risk associated with commodity prices. Our ability to recoverincreased costs through higher pricing is, at times, limited by the competitive environment in which we operate. We manage ourexposure to this risk primarily through pricing agreements with our vendors.
Item 8. Financial Statements and Supplementary Data.
47
INDEX TO FINANCIAL INFORMATION
PageReference
Consolidated Financial Statements
Report of Independent Registered Public Accounting Firm 48
Consolidated Statements of Income for the fiscal years ended December 31, 2016,December 26, 2015 and December 27, 2014 49
Consolidated Statements of Comprehensive Income for the fiscal years endedDecember 31, 2016, December 26, 2015 and December 27, 2014 50
Consolidated Statements of Cash Flows for the fiscal years ended December 31, 2016,December 26, 2015 and December 27, 2014 51
Consolidated Balance Sheets as of December 31, 2016 and December 26, 2015 52
Consolidated Statements of Shareholders’ Equity (Deficit) for the fiscal years ended December 31, 2016, December 26, 2015 and December 27, 2014 53
Notes to Consolidated Financial Statements 54
Financial Statement Schedules
No schedules are required because either the required information is not present or not present in amounts sufficient to requiresubmission of the schedule, or because the information required is included in the above-listed financial statements or notesthereto.
Report of Independent Registered Public Accounting Firm
The Board of Directors and ShareholdersYUM! Brands, Inc.:
We have audited the accompanying consolidated balance sheets of YUM! Brands, Inc. and Subsidiaries (YUM) as of December 31,2016 and December 26, 2015, and the related consolidated statements of income, comprehensive income, cash flows andshareholders’ equity (deficit) for each of the fiscal years in the three-year period ended December 31, 2016. We also have auditedYUM’s internal control over financial reporting as of December 31, 2016, based on criteria established in Internal Control -Integrated Framework (2013) issued by the Committee of Sponsoring Organizations of the Treadway Commission. YUM’smanagement is responsible for these consolidated financial statements, for maintaining effective internal control over financialreporting, and for its assessment of the effectiveness of internal control over financial reporting, included in the accompanyingItem 9A, “Management’s Report on Internal Control over Financial Reporting.” Our responsibility is to express an opinion onthese consolidated financial statements and an opinion on YUM’s internal control over financial reporting based on our audits.
We conducted our audits in accordance with the standards of the Public Company Accounting Oversight Board (United States).Those standards require that we plan and perform the audits to obtain reasonable assurance about whether the financial statementsare free of material misstatement and whether effective internal control over financial reporting was maintained in all materialrespects. Our audits of the consolidated financial statements included examining, on a test basis, evidence supporting the amountsand disclosures in the financial statements, assessing the accounting principles used and significant estimates made by management,and evaluating the overall financial statement presentation. Our audit of internal control over financial reporting included obtainingan understanding of internal control over financial reporting, assessing the risk that a material weakness exists, and testing andevaluating the design and operating effectiveness of internal control based on the assessed risk. Our audits also included performingsuch other procedures as we considered necessary in the circumstances. We believe that our audits provide a reasonable basis forour opinions.
A company’s internal control over financial reporting is a process designed to provide reasonable assurance regarding the reliabilityof financial reporting and the preparation of financial statements for external purposes in accordance with generally acceptedaccounting principles. A company’s internal control over financial reporting includes those policies and procedures that (1) pertainto the maintenance of records that, in reasonable detail, accurately and fairly reflect the transactions and dispositions of the assetsof the company; (2) provide reasonable assurance that transactions are recorded as necessary to permit preparation of financialstatements in accordance with generally accepted accounting principles, and that receipts and expenditures of the company arebeing made only in accordance with authorizations of management and directors of the company; and (3) provide reasonableassurance regarding prevention or timely detection of unauthorized acquisition, use, or disposition of the company’s assets thatcould have a material effect on the financial statements.
Because of its inherent limitations, internal control over financial reporting may not prevent or detect misstatements. Also,projections of any evaluation of effectiveness to future periods are subject to the risk that controls may become inadequate becauseof changes in conditions, or that the degree of compliance with the policies or procedures may deteriorate.
In our opinion, the consolidated financial statements referred to above present fairly, in all material respects, the financial positionof YUM as of December 31, 2016 and December 26, 2015, and the results of its operations and its cash flows for each of the fiscalyears in the three-year period ended December 31, 2016, in conformity with U.S. generally accepted accounting principles. Alsoin our opinion, YUM maintained, in all material respects, effective internal control over financial reporting as of December 31,2016, based on criteria established in Internal Control - Integrated Framework (2013) issued by the Committee of SponsoringOrganizations of the Treadway Commission.
/s/ KPMG LLP
Louisville, KentuckyFebruary 21, 2017
48

Consolidated Statements of IncomeYUM! Brands, Inc. and SubsidiariesFiscal years ended December 31, 2016, December 26, 2015 and December 27, 2014(in millions, except per share data)
2016 2015 2014RevenuesCompany sales $ 4,200 $ 4,356 $ 4,503Franchise and license fees and income 2,166 2,084 2,084Total revenues 6,366 6,440 6,587Costs and Expenses, NetCompany restaurants
Food and paper 1,269 1,348 1,471Payroll and employee benefits 1,109 1,131 1,172Occupancy and other operating expenses 1,120 1,168 1,227
Company restaurant expenses 3,498 3,647 3,870General and administrative expenses 1,161 1,099 1,028Franchise and license expenses 202 237 159Closures and impairment (income) expenses 14 15 18Refranchising (gain) loss (141) 23 (16)Other (income) expense 7 17 11Total costs and expenses, net 4,741 5,038 5,070
Operating Profit 1,625 1,402 1,517
Interest expense, net 307 141 143
Income from continuing operations before income taxes 1,318 1,261 1,374
Income tax provision 324 325 368Income from continuing operations 994 936 1,006Income from discontinued operations, net of tax 625 357 45Net Income $ 1,619 $ 1,293 $ 1,051
Basic Earnings per Common Share from continuing operations $ 2.52 $ 2.15 $ 2.27Basic Earnings per Common Share from discontinued operations $ 1.59 $ 0.82 $ 0.10Basic Earnings Per Common Share $ 4.11 $ 2.97 $ 2.37
Diluted Earnings per Common Share from continuing operations $ 2.48 $ 2.11 $ 2.22Diluted Earnings per Common Share from discontinued operations
$ 1.56 $ 0.81 $ 0.10Diluted Earnings Per Common Share $ 4.04 $ 2.92 $ 2.32
Dividends Declared Per Common Share $ 1.73 $ 1.74 $ 1.56
See accompanying Notes to Consolidated Financial Statements.
49

Consolidated Statements of Comprehensive IncomeYUM! Brands, Inc. and SubsidiariesFiscal years ended December 31, 2016, December 26, 2015 and December 27, 2014(in millions)
2016 2015 2014
Net Income - YUM! Brands, Inc. $ 1,619 $ 1,293 $ 1,051Other comprehensive income (loss), net of tax:
Translation adjustments and gains (losses) from intra-entity transactions ofa long-term investment nature
Adjustments and gains (losses) arising during the year (166) (253) (147)Reclassifications of adjustments and (gains) losses into Net Income (11) 115 2
(177) (138) (145)Tax (expense) benefit 20 — 4
(157) (138) (141)
Changes in pension and post-retirement benefitsUnrealized gains (losses) arising during the year (63) 101 (209)Reclassification of (gains) losses into Net Income 44 53 27
(19) 154 (182)Tax (expense) benefit 5 (57) 69
(14) 97 (113)
Changes in derivative instrumentsUnrealized gains (losses) arising during the year 48 32 23Reclassification of (gains) losses into Net Income (8) (41) (23)
40 (9) —Tax (expense) benefit (16) 1 —
24 (8) —
Other comprehensive income (loss), net of tax (147) (49) (254)Comprehensive Income $ 1,472 $ 1,244 $ 797
See accompanying Notes to Consolidated Financial Statements.
50

Consolidated Statements of Cash FlowsYUM! Brands, Inc. and SubsidiariesFiscal years ended December 31, 2016, December 26, 2015 and December 27, 2014(in millions)
2016 2015 2014Cash Flows – Operating Activities from Continuing OperationsNet Income $ 1,619 $ 1,293 $ 1,051Income from discontinued operations, net of tax (625) (357) (45)Depreciation and amortization 309 322 328Closures and impairment (income) expenses 14 15 18Refranchising (gain) loss (141) 23 (16)Contributions to defined benefit pension plans (41) (98) (18)Deferred income taxes 27 (102) (46)Excess tax benefit from share-based compensation (83) (47) (40)Share-based compensation expense 80 46 45Changes in accounts and notes receivable (46) (35) (21)Changes in inventories — (3) (2)Changes in prepaid expenses and other current assets 6 (13) 2Changes in accounts payable and other current liabilities 17 93 23Changes in income taxes payable 16 15 (135)Other, net 52 61 73Net Cash Provided by Operating Activities from Continuing Operations 1,204 1,213 1,217Cash Flows – Investing Activities from Continuing OperationsCapital spending (422) (461) (508)Proceeds from refranchising of restaurants 346 219 83Other, net 52 53 1Net Cash Used in Investing Activities from Continuing Operations (24) (189) (424)Cash Flows – Financing Activities from Continuing OperationsProceeds from long-term debt 6,900 — —Repayments of long-term debt (324) (261) (65)Revolving credit facilities, three months or less, net (701) 285 416Short-term borrowings, by original maturity
More than three months – proceeds 1,400 609 —More than three months – payments (2,000) — —Three months or less, net — — —
Repurchase shares of Common Stock (5,402) (1,200) (820)Excess tax benefit from share-based compensation 83 47 40Dividends paid on Common Stock (744) (730) (669)Debt issuance costs (86) — —Net transfers from discontinued operations 289 235 372
Other, net (92) (43) (13)Net Cash Used in Financing Activities from Continuing Operations (677) (1,058) (739)Effect of Exchange Rate on Cash and Cash Equivalents (25) 11 12Net Increase (Decrease) in Cash, Cash Equivalents, Restricted Cash and Restricted Cash Equivalents -Continuing Operations
478 (23) 66
Cash, Cash Equivalents, Restricted Cash and Restricted Cash Equivalents – Beginning of Year 334 357 291Cash, Cash Equivalents, Restricted Cash and Restricted Cash Equivalents – End of Year $ 812 $ 334 $ 357
Cash Provided by Operating Activities from Discontinued Operations $ 829 $ 931 $ 832Cash Used in Investing Activities from Discontinued Operations (287) (493) (512)Cash Used in Financing Activities from Discontinued Operations (292) (234) (375)
See accompanying Notes to Consolidated Financial Statements.
51

Consolidated Balance SheetsYUM! Brands, Inc. and SubsidiariesDecember 31, 2016 and December 26, 2015(in millions)
2016 2015ASSETSCurrent AssetsCash and cash equivalents $ 704 $ 313Accounts and notes receivable, net 370 324Inventories 36 40Prepaid expenses and other current assets 238 133Advertising cooperative assets, restricted 134 103Current assets of discontinued operations — 774
Total Current Assets 1,482 1,687
Property, plant and equipment, net 2,160 2,347Goodwill 541 571Intangible assets, net 151 164Other assets 370 330Deferred income taxes 774 591Noncurrent assets of discontinued operations — 2,371
Total Assets $ 5,478 $ 8,061
LIABILITIES AND SHAREHOLDERS’ EQUITY (DEFICIT)Current LiabilitiesAccounts payable and other current liabilities $ 1,132 $ 1,074Income taxes payable 37 55Short-term borrowings 66 921Advertising cooperative liabilities 134 103Current liabilities of discontinued operations — 934
Total Current Liabilities 1,369 3,087
Long-term debt 9,061 3,007Other liabilities and deferred credits 704 745Noncurrent liabilities of discontinued operations — 247
Total Liabilities 11,134 7,086
Redeemable noncontrolling interest - discontinued operations — 6
Shareholders’ Equity (Deficit)Common Stock, no par value, 750 shares authorized; 355 shares and 420 shares issued in2016 and 2015, respectively — —Retained earnings (Accumulated Deficit) (5,223) 1,150Accumulated other comprehensive income (loss) (433) (239)
Total Shareholders’ Equity (Deficit) – YUM! Brands, Inc. (5,656) 911Noncontrolling interests - discontinued operations — 58
Total Shareholders’ Equity (Deficit) (5,656) 969Total Liabilities, Redeemable Noncontrolling Interest and Shareholders’ Equity(Deficit) $ 5,478 $ 8,061
See accompanying Notes to Consolidated Financial Statements.
52

Consolidated Statements of Shareholders’ Equity (Deficit)YUM! Brands, Inc. and SubsidiariesFiscal years ended December 31, 2016, December 26, 2015 and December 27, 2014(in millions)
Yum! Brands, Inc.Issued Common
StockRetainedEarnings
(AccumulatedDeficit)
AccumulatedOther
ComprehensiveIncome(Loss)
NoncontrollingInterests
TotalShareholders'
Equity(Deficit)
RedeemableNoncontrolling
InterestShares Amount
Balance at December 28, 2013 443 $ — $ 2,102 $ 64 $ 63 $ 2,229 $ 39
Net Income (loss) 1,051 (1) 1,050 (29)Translation adjustments and gains (losses)from intra-entity transactions of a long-terminvestment nature (net of tax impact of $4million) (143) (1) (144) (1)Reclassification of translation adjustmentsinto income 2 2Pension and post-retirement benefit plans(net of tax impact of $69 million) (113) (113)Comprehensive Income (loss) 795 (30)Dividends declared (691) (4) (695)Repurchase of shares of Common Stock (11) (95) (725) (820)Employee stock option and SARs exercises(includes tax impact of $37 million) 2 33 33Compensation-related events (includes taximpact of $5 million) 62 62Balance at December 27, 2014 434 $ — $ 1,737 $ (190) $ 57 $ 1,604 $ 9
Net Income (loss) 1,293 6 1,299 (1)Translation adjustments and gains (losses)from intra-entity transactions of a long-terminvestment nature (net of tax impact of $3million) (250) (4) (254) (2)Reclassification of translation adjustmentsinto income (net of tax impact of $3 million) 112 112Pension and post-retirement benefit plans(net of tax impact of $57 million) 97 97Net unrealized loss on derivative instruments(net of tax impact of $1 million) (8) (8)Comprehensive Income (loss) 1,246 (3)Dividends declared (756) (756)Acquisition of Little Sheep store-levelnoncontrolling interests 1 (1) —Repurchase of shares of Common Stock (16) (76) (1,124) (1,200)Employee stock option and SARs exercises(includes tax impact of $43 million) 2 11 11Compensation-related events (includes taximpact of $7 million) 64 64Balance at December 26, 2015 420 $ — $ 1,150 $ (239) $ 58 $ 969 $ 6
Net Income (loss) 1,619 18 1,637 (7)Translation adjustments and gains (losses)from intra-entity transactions of a long-terminvestment nature (net of tax impact of $20million) (146) (3) (149) 1Reclassification of translation adjustmentsinto income (11) (11)Pension and post-retirement benefit plans(net of tax impact of $5 million) (14) (14)Net unrealized gain on derivative instruments(net of tax impact of $16 million) 24 24Comprehensive Income (loss) 1,487 (6)Dividends declared (661) (6) (667)Separation of China business (1,932) (47) (67) (2,046)Repurchase of shares of Common Stock (68) (49) (5,399) (5,448)Employee stock option and SARs exercises(includes tax impact of $75 million) 3 1 1Compensation-related events (includes taximpact of $11 million) 48 48Balance at December 31, 2016 355 $ — $ (5,223) $ (433) $ — $ (5,656) $ —
See accompanying Notes to Consolidated Financial Statements.
53
Notes to Consolidated Financial Statements(Tabular amounts in millions, except share data)
54
Note 1 – Description of Business
YUM! Brands, Inc. and its Subsidiaries (collectively referred to herein as “YUM” or the “Company”) comprise the worldwideoperations of KFC, Pizza Hut and Taco Bell (collectively the “Concepts”). YUM has over 43,500 units of which 58% are locatedoutside the U.S. in more than 135 countries and territories. YUM was created as an independent, publicly-owned company onOctober 6, 1997 via a tax-free distribution by our former parent, PepsiCo, Inc., of our Common Stock to its shareholders. Referencesto YUM throughout these Consolidated Financial Statements are made using the first person notations of “we,” “us” or “our.”
Through our widely-recognized Concepts, we develop, operate or franchise a system of both traditional and non-traditional quickservice restaurants. The terms "franchise" or "franchisee" within these Consolidated Financial Statements are meant to describethird parties that operate units under either franchise or license agreements. Each Concept has proprietary menu items andemphasizes the preparation of food with high quality ingredients as well as unique recipes and special seasonings to provideappealing, convenient, tasty and attractive food at competitive prices. Our traditional restaurants feature dine-in, carryout and, insome instances, drive-thru or delivery service. Non-traditional units include express units and kiosks which have a more limitedmenu and operate in non-traditional locations like malls, airports, gasoline service stations, train stations, subways, conveniencestores, stadiums, amusement parks and colleges, where a full-scale traditional outlet would not be practical or efficient. We alsooperate multibrand units, where two or more of our Concepts are operated in a single unit.
As of December 31, 2016, YUM consisted of three operating segments:
• The KFC Division which includes our worldwide operations of the KFC concept• The Pizza Hut Division which includes our worldwide operations of the Pizza Hut concept• The Taco Bell Division which includes our worldwide operations of the Taco Bell concept
Effective January 2016, the Company's India Division was segmented by brand, integrated into the global KFC, Pizza Hut andTaco Bell Divisions, and is no longer a separate operating segment. While our consolidated results were not impacted, we haverestated our historical segment information for consistent presentation. Integrating India into our Brand Divisions increased 2015Total revenues for the KFC, Pizza Hut and Taco Bell Divisions by $105 million, $8 million and $3 million, respectively. 2015Operating Profit decreased by $16 million, and $3 million for the KFC and Taco Bell Divisions, respectively, and increased lessthan $1 million for the Pizza Hut Division. Integrating India into our Brand Divisions increased 2014 Total revenues for the KFC,Pizza Hut and Taco Bell Divisions by $128 million, $11 million and $2 million, respectively. 2014 Operating Profit decreased by$6 million, $1 million and $2 million for the KFC, Pizza Hut and Taco Bell Divisions, respectively.
On October 31, 2016 (the “Distribution Date”), we completed the spin-off of our China business (the "Separation") into anindependent, publicly-traded company under the name of Yum China Holdings, Inc. (“Yum China”). On the Distribution Date,we distributed to each of our shareholders of record as of the close of business on October 19, 2016 (the “Record Date”) one shareof Yum China common stock for each share of our Common Stock held as of the Record Date. The distribution was structured tobe a tax free distribution to our U.S. shareholders for federal income tax purposes in the United States. Yum China’s commonstock now trades on the New York Stock Exchange ("NYSE") under the symbol “YUMC.” After the distribution, we do notbeneficially own any shares of Yum China common stock.
Concurrent with the Separation, a subsidiary of the Company entered into a Master License Agreement with a subsidiary of YumChina for the exclusive right to use and sublicense the use of intellectual property owned by YUM and its affiliates for thedevelopment and operation of KFC, Pizza Hut and Taco Bell restaurants in China. Prior to the Separation, our operations inmainland China were reported in our former China Division segment results. As a result of the Separation, the results of operations,assets and liabilities, and cash flows of the separated business are presented as discontinued operations in our ConsolidatedStatements of Income, Consolidated Balance Sheets and Consolidated Statements of Cash Flows for all periods presented. Seeadditional information related to the impact of the Separation in Note 4.
Note 2 – Summary of Significant Accounting Policies
Our preparation of the accompanying Consolidated Financial Statements in conformity with Generally Accepted AccountingPrinciples in the United States of America (“GAAP”) requires us to make estimates and assumptions that affect reported amountsof assets and liabilities, disclosure of contingent assets and liabilities at the date of the financial statements, and the reportedamounts of revenues and expenses during the reporting period. Actual results could differ from these estimates.

Principles of Consolidation and Basis of Preparation. Intercompany accounts and transactions have been eliminated inconsolidation. We consolidate entities in which we have a controlling financial interest, the usual condition of which is ownershipof a majority voting interest. We also consider for consolidation an entity, in which we have certain interests, where the controllingfinancial interest may be achieved through arrangements that do not involve voting interests. Such an entity, known as a variableinterest entity (“VIE”), is required to be consolidated by its primary beneficiary. The primary beneficiary is the entity that possessesthe power to direct the activities of the VIE that most significantly impact its economic performance and has the obligation toabsorb losses or the right to receive benefits from the VIE that are significant to it.
Our most significant variable interests are in entities that operate restaurants under our Concepts’ franchise and licensearrangements. We do not have an equity interest in any of our franchisee businesses. Additionally, we do not typically providesignificant financial support such as loans or guarantees to our franchisees. However, we do have variable interests in certainfranchisees through real estate lease arrangements to which we are a party. At the end of 2016, YUM has future lease paymentsdue from franchisees, on a nominal basis, of approximately $250 million, and we are contingently liable on certain other leaseagreements that have been assigned to franchisees. See the Lease Guarantees and Franchise Loan Pool and Equipment Guaranteessections in Note 20. As our franchise and license arrangements provide our franchisee entities the power to direct the activitiesthat most significantly impact their economic performance, we do not consider ourselves the primary beneficiary of any suchentity that might otherwise be considered a VIE.
See Note 20 for additional information on our entity that operates a franchise lending program that is a VIE in which we have avariable interest but for which we are not the primary beneficiary and thus do not consolidate.
We participate in various advertising cooperatives with our franchisees established to collect and administer funds contributed foruse in advertising and promotional programs designed to increase sales and enhance the reputation of the Company and its franchiseowners. Contributions to the advertising cooperatives are required for both Company-owned and franchise restaurants and aregenerally based on a percentage of restaurant sales. We maintain certain variable interests in these cooperatives. As the cooperativesare required to spend all funds collected on advertising and promotional programs, total equity at risk is not sufficient to permitthe cooperatives to finance their activities without additional subordinated financial support. Therefore, these cooperatives areVIEs. As a result of our voting rights, we consolidate certain of these cooperatives for which we are the primarybeneficiary. Advertising cooperative assets, consisting primarily of cash received from the Company and franchisees and accountsreceivable from franchisees, can only be used to settle obligations of the respective cooperative. Advertising cooperative liabilitiesrepresent the corresponding obligation arising from the receipt of the contributions to purchase advertising and promotionalprograms for which creditors do not have recourse to the general credit of the Company as the primary beneficiary. Therefore,we report all assets and liabilities of these advertising cooperatives that we consolidate as Advertising cooperative assets, restrictedand Advertising cooperative liabilities in the Consolidated Balance Sheet. As the contributions to these cooperatives are designatedand segregated for advertising, we act as an agent for the franchisees with regard to these contributions. Thus, we do not reflectfranchisee contributions to these cooperatives in our Consolidated Statements of Income or Consolidated Statements of CashFlows.
Fiscal Year. Our fiscal years have historically ended on the last Saturday in December and, as a result, a 53rd week was addedevery five or six years. The first three quarters of each fiscal year consisted of 12 weeks and the fourth quarter consisted of 16weeks in fiscal years with 52 weeks and 17 weeks in fiscal years with 53 weeks. Our U.S. subsidiaries and certain internationalsubsidiaries operated on similar fiscal calendars. Our remaining international subsidiaries operated on a monthly calendar, andthus never had a 53rd week, with two months in the first quarter, three months in the second and third quarters and four months inthe fourth quarter. Certain international subsidiaries within our KFC, Pizza Hut and Taco Bell divisions have historically closedapproximately one month or one period earlier to facilitate consolidated reporting.
Fiscal year 2016 included 53 weeks for YUM, our U.S. businesses and for our international subsidiaries that report on a periodcalendar. The 53rd week added $76 million to Total revenues and $27 million to Operating Profit in our 2016 Consolidated Statementof Income.
On January 27, 2017, YUM’s Board of Directors approved a change in its fiscal year from a year ending on the last Saturday ofDecember to a year beginning on January 1 and ending December 31 of each year, commencing with the year ending December 31,2017. In connection with the new fiscal year, the Company will move from a 52-week periodic fiscal calendar with three 12-weekinterim quarters and a 16-week fourth quarter to a monthly reporting calendar with each quarter comprised of three months. OurU.S. subsidiaries will continue to report on a period calendar as described above.
The change in the Company’s fiscal year was made primarily to accommodate the removal of aforementioned reporting lags fromcertain of our international subsidiary fiscal calendars, which will significantly improve the alignment of our global reporting
55

calendars. As a result of removing these reporting lags each international subsidiary will now operate either on a monthly calendarconsistent with the Company’s new calendar or on a periodic calendar consistent with our U.S. subsidiaries.
The change to the Company’s fiscal year is effective in 2017 and does not impact the Company’s results for the fiscal year endedDecember 31, 2016. However, we will restate previously issued financial statements when presenting financial statements underour new calendar in 2017.
Foreign Currency. The functional currency of our foreign entities is the currency of the primary economic environment in whichthe entity operates. Functional currency determinations are made based upon a number of economic factors, including but notlimited to cash flows and financing transactions. The operations, assets and liabilities of our entities outside the United States areinitially measured using the functional currency of that entity. Income and expense accounts for our operations of these foreignentities are then translated into U.S. dollars at the average exchange rates prevailing during the period. Assets and liabilities ofthese foreign entities are then translated into U.S. dollars at exchange rates in effect at the balance sheet date. As of December 31,2016, net cumulative translation adjustment losses of $313 million are recorded in Accumulated other comprehensive income(loss) in the Consolidated Balance Sheet.
The majority of our foreign currency net asset exposure is in countries where we have company-owned restaurants. As we manageand share resources at the individual brand level within a country, cumulative translation adjustments are recorded and tracked atthe foreign-entity level that represents the operations of our individual brands within that country. Translation adjustments recordedin Accumulated other comprehensive income (loss) are subsequently recognized as income or expense generally only upon saleof the related investment in a foreign entity, or upon a sale of assets and liabilities within a foreign entity that represents a completeor substantially complete liquidation of that foreign entity. For purposes of determining whether a sale or complete or substantiallycomplete liquidation of an investment in a foreign entity has occurred, we consider those same foreign entities for which we recordand track cumulative translation adjustments. See Note 5 for information on the liquidation of our Mexico and Pizza Hut Australiaforeign entities and related Income Statement recognition of translation adjustments.
Gains and losses arising from the impact of foreign currency exchange rate fluctuations on transactions in foreign currency areincluded in Other (income) expense in our Consolidated Statements of Income.
Reclassifications. We have reclassified certain items in the Consolidated Financial Statements for prior periods to be comparablewith the classification for the fiscal year ended December 31, 2016. These reclassifications had no effect on previously reportedNet Income.
Franchise Operations. We execute store-level franchise agreements for units operated by third parties which set out the termsof our arrangement with the franchisee. Additionally, we execute master franchise agreements in certain regions that transferadministrative and development obligations and sub-franchising rights to a franchisee in exchange for a reduced continuingfee. Our franchise agreements typically require the franchisee to pay an initial, non-refundable fee upon an individual store openingand continuing fees based upon a percentage of sales. Subject to our approval and their payment of a renewal fee, a franchiseemay generally renew the franchise agreement upon its expiration.
The internal costs we incur to provide support services to our franchisees are charged to General and Administrative (“G&A”)expenses as incurred. Certain direct costs of our franchise operations are charged to Franchise and license expenses. These costsinclude provisions for estimated uncollectible fees, rent or depreciation expense associated with restaurants we lease or subleaseto franchisees, franchise marketing funding, amortization expense for franchise-related intangible assets, value added taxes onroyalties and certain other direct incremental franchise support costs.
Revenue Recognition. Revenues from Company-owned restaurants are recognized when payment is tendered at the time ofsale. The Company presents sales net of sales-related taxes. Income from our franchisees includes initial fees, continuing fees,renewal fees and rental income from restaurants we lease or sublease to them. We recognize initial fees received from a franchiseeas revenue when we have performed substantially all initial services required by the franchise agreement, which is generally uponthe opening of a store. We recognize continuing fees, which are based upon a percentage of franchisee sales as those sales occurand rental income is recognized as it is earned. We recognize renewal fees when a renewal agreement with a franchisee becomeseffective. We present initial fees collected upon the sale of a Company-owned restaurant to a franchisee in Refranchising (gain)loss.
While the majority of our franchise agreements are entered into with terms and conditions consistent with those at a prevailingmarket rate, there are instances when we enter into franchise agreements with terms that are not at market rates (for example,below-market continuing fees) for a specified period of time. We recognize the estimated value of terms in franchise agreementsentered into concurrently with a refranchising transaction that are not consistent with market terms as part of the upfront
56

refranchising gain (loss) and amortize that amount into Franchise and license fees and income over the period such terms are ineffect. The value of terms that are not considered to be at market within franchise agreements is estimated based upon the differencebetween the present value of the cash expected to be received under the franchise agreement and the present value of the cash thatwould have been expected to be received under a franchise agreement with terms substantially consistent with market.
Direct Marketing Costs. To the extent we participate in advertising cooperatives, we expense our contributions as incurred whichare based on a percentage of sales. We charge direct marketing costs incurred outside of a cooperative to expense ratably in relationto revenues over the year in which incurred and, in the case of advertising production costs, in the year the advertisement is firstshown. Deferred direct marketing costs, which are classified as prepaid expenses, consist of media and related advertisingproduction costs which will generally be used for the first time in the next fiscal year and have historically not been significant. Ouradvertising expenses were $260 million, $255 million and $261 million in 2016, 2015 and 2014, respectively. We report the vastmajority of our direct marketing costs in Occupancy and other operating expenses as they are incurred as a percentage of sales byCompany-owned restaurants. Advertising incurred on behalf of franchised restaurants is recorded within Franchise and licenseexpenses.
Research and Development Expenses. Research and development expenses, which we expense as incurred, are reported inG&A expenses. Research and development expenses were $24 million, $24 million and $25 million in 2016, 2015 and 2014,respectively.
Share-Based Employee Compensation. We recognize ongoing share-based payments to employees, including grants ofemployee stock options and stock appreciation rights (“SARs”), in the Consolidated Financial Statements as compensation costover the service period based on their fair value on the date of grant. This compensation cost is recognized over the service periodon a straight-line basis for awards that actually vest. We present this compensation cost consistent with the other compensationcosts for the employee recipient in either Payroll and employee benefits or G&A expenses. See Note 16 for further discussion ofour share-based compensation plans.
Legal Costs. Settlement costs are accrued when they are deemed probable and reasonably estimable. Anticipated legal feesrelated to self-insured workers' compensation, employment practices liability, general liability, automobile liability, product liabilityand property losses (collectively, "property and casualty losses") are accrued when deemed probable and reasonably estimable.Legal fees not related to self-insured property and casualty losses are recognized as incurred. See Note 20 for further discussionof our legal proceedings.
Impairment or Disposal of Property, Plant and Equipment. Property, plant and equipment (“PP&E”) is tested for impairmentwhenever events or changes in circumstances indicate that the carrying value of the assets may not be recoverable. The assets arenot recoverable if their carrying value is less than the undiscounted cash flows we expect to generate from such assets. If theassets are not deemed to be recoverable, impairment is measured based on the excess of their carrying value over their fair value.
For purposes of impairment testing for our restaurants, we have concluded that an individual restaurant is the lowest level ofindependent cash flows unless it is more likely than not that we will refranchise restaurants as a group. We review our long-livedassets of such individual restaurants (primarily PP&E and allocated intangible assets subject to amortization) semi-annually forimpairment, or whenever events or changes in circumstances indicate that the carrying amount of a restaurant may not berecoverable. We use two consecutive years of operating losses as our primary indicator of potential impairment for our semi-annual impairment testing of these restaurant assets. We evaluate the recoverability of these restaurant assets by comparing theestimated undiscounted future cash flows, which are based on our entity-specific assumptions, to the carrying value of suchassets. For restaurant assets that are not deemed to be recoverable, we write-down an impaired restaurant to its estimated fairvalue, which becomes its new cost basis. Fair value is an estimate of the price a franchisee would pay for the restaurant and itsrelated assets and is determined by discounting the estimated future after-tax cash flows of the restaurant, which include a deductionfor royalties we would receive under a franchise agreement with terms substantially at market. The after-tax cash flows incorporatereasonable assumptions we believe a franchisee would make such as sales growth and margin improvement. The discount rateused in the fair value calculation is our estimate of the required rate of return that a franchisee would expect to receive whenpurchasing a similar restaurant and the related long-lived assets. The discount rate incorporates rates of returns for historicalrefranchising market transactions and is commensurate with the risks and uncertainty inherent in the forecasted cash flows.
In executing our refranchising initiatives, we most often offer groups of restaurants for sale. When we believe it is more likelythan not a restaurant or groups of restaurants will be refranchised for a price less than their carrying value, but do not believe therestaurant(s) have met the criteria to be classified as held for sale, we review the restaurants for impairment. We evaluate therecoverability of these restaurant assets by comparing estimated sales proceeds plus holding period cash flows, if any, to thecarrying value of the restaurant or group of restaurants. For restaurant assets that are not deemed to be recoverable, we recognizeimpairment for any excess of carrying value over the fair value of the restaurants, which is based on the expected net sales
57

proceeds. To the extent ongoing agreements to be entered into with the franchisee simultaneous with the refranchising are expectedto contain terms, such as royalty rates, not at prevailing market rates, we consider the off-market terms in our impairmentevaluation. We recognize any such impairment charges in Refranchising (gain) loss. Refranchising (gain) loss includes the gainsor losses from the sales of our restaurants to new and existing franchisees, including any impairment charges discussed above,and the related initial franchise fees. We recognize gains on restaurant refranchisings when the sale transaction closes and controlof the restaurant operations have transferred to the franchisee.
When we decide to close a restaurant, it is reviewed for impairment and depreciable lives are adjusted based on the expecteddisposal date. Other costs incurred when closing a restaurant such as costs of disposing of the assets as well as other facility-related expenses from previously closed stores are generally expensed as incurred. Additionally, at the date we cease using aproperty under an operating lease, we record a liability for the net present value of any remaining lease obligations, net of estimatedsublease income, if any. Any costs recorded upon store closure as well as any subsequent adjustments to liabilities for remaininglease obligations as a result of lease termination or changes in estimates of sublease income are recorded in Closures and impairment(income) expenses. To the extent we sell assets, primarily land, associated with a closed store, any gain or loss upon that sale isalso recorded in Closures and impairment (income) expenses.
Considerable management judgment is necessary to estimate future cash flows, including cash flows from continuing use, terminalvalue, sublease income and refranchising proceeds. Accordingly, actual results could vary significantly from our estimates.
Guarantees. We recognize, at inception of a guarantee, a liability for the fair value of certain obligations undertaken. The majorityof our guarantees are issued as a result of assigning our interest in obligations under operating leases as a condition to therefranchising of certain Company restaurants. We recognize a liability for the fair value of such lease guarantees upon refranchisingand upon subsequent renewals of such leases when we remain contingently liable. The related expense and any subsequent changesare included in Refranchising (gain) loss. Any expense and subsequent changes in the guarantees for other franchise supportguarantees not associated with a refranchising transaction are included in Franchise and license expense.
Income Taxes. We record deferred tax assets and liabilities for the future tax consequences attributable to temporary differencesbetween the financial statement carrying amounts of existing assets and liabilities and their respective tax bases as well as operatingloss, capital loss and tax credit carryforwards. Deferred tax assets and liabilities are measured using enacted tax rates expectedto apply to taxable income in the years in which those differences or carryforwards are expected to be recovered or settled. Theeffect on deferred tax assets and liabilities of a change in tax rates is recognized in our Income tax provision in the period thatincludes the enactment date. Additionally, in determining the need for recording a valuation allowance against the carrying amountof deferred tax assets, we consider the amount of taxable income and periods over which it must be earned, actual levels of pasttaxable income and known trends and events or transactions that are expected to affect future levels of taxable income. Wherewe determine that it is more likely than not that all or a portion of an asset will not be realized, we record a valuation allowance.
We recognize the benefit of positions taken or expected to be taken in our tax returns in our income tax provision when it is morelikely than not (i.e. a likelihood of more than fifty percent) that the position would be sustained upon examination by taxauthorities. A recognized tax position is then measured at the largest amount of benefit that is greater than fifty percent likely ofbeing realized upon settlement. We evaluate these amounts on a quarterly basis to ensure that they have been appropriately adjustedfor audit settlements and other events we believe may impact the outcome. Changes in judgment that result in subsequentrecognition, derecognition or a change in measurement of a tax position taken in a prior annual period (including any relatedinterest and penalties) are recognized as a discrete item in the interim period in which the change occurs. We recognize accruedinterest and penalties related to unrecognized tax benefits as components of our income tax provision.
We do not record a U.S. deferred tax liability for the excess of the book basis over the tax basis of our investments in foreignsubsidiaries to the extent that the basis difference results from earnings that meet the indefinite reversal criteria. This criteria ismet if the foreign subsidiary has invested, or will invest, the undistributed earnings indefinitely. The decision as to the amount ofundistributed earnings that we intend to maintain in non-U.S. subsidiaries considers items including, but not limited to, forecastsand budgets of financial needs of cash for working capital, liquidity plans and expected cash requirements in the United States.
See Note 18 for a further discussion of our income taxes.
Fair Value Measurements. Fair value is the price we would receive to sell an asset or pay to transfer a liability (exit price) in anorderly transaction between market participants. For those assets and liabilities we record or disclose at fair value, we determinefair value based upon the quoted market price, if available. If a quoted market price is not available for identical assets, wedetermine fair value based upon the quoted market price of similar assets or the present value of expected future cash flowsconsidering the risks involved, including counterparty performance risk if appropriate, and using discount rates appropriate for
58

the duration. The fair values are assigned a level within the fair value hierarchy, depending on the source of the inputs into thecalculation.
Level 1 Inputs based upon quoted prices in active markets for identical assets.
Level 2 Inputs other than quoted prices included within Level 1 that are observable for the asset, either directly orindirectly.
Level 3 Inputs that are unobservable for the asset.
Cash and Cash Equivalents. Cash equivalents represent funds we have temporarily invested (with original maturities notexceeding three months), including short-term, highly liquid debt securities. Cash and overdraft balances that meet the criteria forright of setoff are presented net on our Consolidated Balance Sheet.
Receivables. The Company’s receivables are primarily generated from ongoing business relationships with our franchisees as aresult of franchise and lease agreements. Trade receivables consisting of royalties from franchisees, including Yum China, aregenerally due within 30 days of the period in which the corresponding sales occur and are classified as Accounts and notes receivableon our Consolidated Balance Sheet. Yum China is our largest franchisee and we recorded franchise fee revenues of approximately$240 million from Yum China in 2016. Our provision for uncollectible franchisee receivable balances is based upon pre-definedaging criteria or upon the occurrence of other events that indicate that we may not collect the balance due. Additionally, we monitorthe financial condition of our franchisees and record provisions for estimated losses on receivables when we believe it probablethat our franchisees will be unable to make their required payments. While we use the best information available in making ourdetermination, the ultimate recovery of recorded receivables is also dependent upon future economic events and other conditionsthat may be beyond our control. We recorded $5 million and $3 million in net provisions within Franchise and license expensesin 2015 and 2014, respectively, related to uncollectible franchise and license trade receivables. Net provisions in 2016 related touncollectible franchise and license trade receivables were less than $1 million. Trade receivables that are ultimately deemed to beuncollectible, and for which collection efforts have been exhausted, are written off against the allowance for doubtful accounts.
2016 2015Accounts and notes receivable $ 383 $ 338Allowance for doubtful accounts (13) (14)Accounts and notes receivable, net $ 370 $ 324 Our financing receivables primarily consist of notes receivables and direct financing leases with franchisees which we enter intofrom time-to-time. As these receivables primarily relate to our ongoing business agreements with franchisees, we consider suchreceivables to have similar risk characteristics and evaluate them as one collective portfolio segment and class for determiningthe allowance for doubtful accounts. We monitor the financial condition of our franchisees and record provisions for estimatedlosses on receivables when we believe it is probable that our franchisees will be unable to make their required payments. Balancesof notes receivable and direct financing leases due within one year are included in Accounts and notes receivable while amountsdue beyond one year are included in Other assets. Amounts included in Other assets totaled $21 million (net of an allowance of$2 million) and $16 million (net of an allowance of $4 million) at December 31, 2016 and December 26, 2015,respectively. Financing receivables that are ultimately deemed to be uncollectible, and for which collection efforts have beenexhausted, are written off against the allowance for doubtful accounts. Interest income recorded on financing receivables hashistorically been insignificant.
Inventories. We value our inventories at the lower of cost (computed on the first-in, first-out method) or market.
Property, Plant and Equipment. We state PP&E at cost less accumulated depreciation and amortization. We calculatedepreciation and amortization on a straight-line basis over the estimated useful lives of the assets as follows: 5 to 25 years forbuildings and leasehold improvements, 3 to 20 years for machinery and equipment and 3 to 7 years for capitalized softwarecosts. We suspend depreciation and amortization on assets that are held for sale.
Leases and Leasehold Improvements. The Company leases land, buildings or both for certain of its restaurants and restaurantsupport centers worldwide. The length of our lease terms, which vary by country and often include renewal options, are animportant factor in determining the appropriate accounting for leases including the initial classification of the lease as capital oroperating and the timing of recognition of rent expense over the duration of the lease. We include renewal option periods in
59
determining the term of our leases when failure to renew the lease would impose a penalty on the Company in such an amountthat a renewal appears to be reasonably assured at the inception of the lease. The primary penalty to which we are subject is theeconomic detriment associated with the existence of leasehold improvements which might be impaired if we choose not to continuethe use of the leased property. Leasehold improvements are amortized over the shorter of their estimated useful lives or the leaseterm. We generally do not receive leasehold improvement incentives upon opening a store that is subject to a lease.
We expense rent associated with leased land or buildings while a restaurant is being constructed whether rent is paid or we aresubject to a rent holiday. Additionally, certain of the Company's operating leases contain predetermined fixed escalations of theminimum rent during the lease term. For leases with fixed escalating payments and/or rent holidays, we record rent expense ona straight-line basis over the lease term, including any option periods considered in the determination of that lease term. Contingentrentals are based on sales levels in excess of stipulated amounts, and thus are not considered minimum lease payments and areincluded in rent expense when attainment of the contingency is considered probable (e.g. when Company sales occur).
Internal Development Costs and Abandoned Site Costs. We capitalize direct costs associated with the site acquisition andconstruction of a Company unit on that site, including direct internal payroll and payroll-related costs. Only those site-specificcosts incurred subsequent to the time that the site acquisition is considered probable are capitalized. If we subsequently make adetermination that it is probable a site for which internal development costs have been capitalized will not be acquired or developed,any previously capitalized internal development costs are expensed and included in G&A expenses.
Goodwill and Intangible Assets. From time-to-time, the Company acquires restaurants from one of our Concept’s franchiseesor acquires another business. Goodwill from these acquisitions represents the excess of the cost of a business acquired over thenet of the amounts assigned to assets acquired, including identifiable intangible assets and liabilities assumed. Goodwill is notamortized and has been assigned to reporting units for purposes of impairment testing. Our reporting units are our business units(which are aligned based on geography) in our KFC, Pizza Hut and Taco Bell Divisions.
We evaluate goodwill for impairment on an annual basis or more often if an event occurs or circumstances change that indicateimpairment might exist. We have selected the beginning of our fourth quarter as the date on which to perform our ongoing annualimpairment test for goodwill. We may elect to perform a qualitative assessment for our reporting units to determine whether it ismore likely than not that the fair value of the reporting unit is greater than its carrying value. If a qualitative assessment is notperformed, or if as a result of a qualitative assessment it is not more likely than not that the fair value of a reporting unit exceedsits carrying value, then the reporting unit’s fair value is compared to its carrying value. Fair value is the price a willing buyerwould pay for a reporting unit, and is generally estimated using discounted expected future after-tax cash flows from Company-owned restaurant operations and franchise royalties. The discount rate is our estimate of the required rate of return that a third-party buyer would expect to receive when purchasing a business from us that constitutes a reporting unit. We believe the discountrate is commensurate with the risks and uncertainty inherent in the forecasted cash flows. If the carrying value of a reporting unitexceeds its fair value, goodwill is written down to its implied fair value.
If we record goodwill upon acquisition of a restaurant(s) from a franchisee and such restaurant(s) is then sold within two years ofacquisition, the goodwill associated with the acquired restaurant(s) is written off in its entirety. If the restaurant is refranchisedtwo years or more subsequent to its acquisition, we include goodwill in the carrying amount of the restaurants disposed of basedon the relative fair values of the portion of the reporting unit disposed of in the refranchising and the portion of the reporting unitthat will be retained. The fair value of the portion of the reporting unit disposed of in a refranchising is determined by referenceto the discounted value of the future cash flows expected to be generated by the restaurant and retained by the franchisee, whichincludes a deduction for the anticipated, future royalties the franchisee will pay us associated with the franchise agreement enteredinto simultaneously with the refranchising transition. The fair value of the reporting unit retained is based on the price a willingbuyer would pay for the reporting unit and includes the value of franchise agreements. Appropriate adjustments are made if afranchise agreement includes terms that are determined to not be at prevailing market rates. As such, the fair value of the reportingunit retained can include expected cash flows from future royalties from those restaurants currently being refranchised, futureroyalties from existing franchise businesses and company restaurant operations. As a result, the percentage of a reporting unit’sgoodwill that will be written off in a refranchising transaction will be less than the percentage of the reporting unit’s Company-owned restaurants that are refranchised in that transaction and goodwill can be allocated to a reporting unit with only franchiserestaurants.
Our definite-lived intangible assets that are not allocated to an individual restaurant are evaluated for impairment whenever eventsor changes in circumstances indicate that the carrying amount of the intangible asset may not be recoverable. An intangible assetthat is deemed not recoverable on an undiscounted basis is written down to its estimated fair value, which is our estimate of theprice a willing buyer would pay for the intangible asset based on discounted expected future after-tax cash flows. For purposesof our impairment analysis, we update the cash flows that were initially used to value the definite-lived intangible asset to reflectour current estimates and assumptions over the asset’s future remaining life.
60

Derivative Financial Instruments. We use derivative instruments primarily to hedge interest rate and foreign currency risks.These derivative contracts are entered into with financial institutions. We do not use derivative instruments for trading purposesand we have procedures in place to monitor and control their use.
We record all derivative instruments on our Consolidated Balance Sheet at fair value. For derivative instruments that are designatedand qualify as a cash flow hedge, the effective portion of the gain or loss on the derivative instrument is reported as a componentof other comprehensive income (loss) and reclassified into earnings in the same period or periods during which the hedgedtransaction affects earnings. Any ineffective portion of the gain or loss on the derivative instrument for a cash flow hedge isrecorded in the results of operations immediately. For derivative instruments not designated as hedging instruments, the gain orloss is recognized in the results of operations immediately.
As a result of the use of derivative instruments, the Company is exposed to risk that the counterparties will fail to meet theircontractual obligations. To mitigate the counterparty credit risk, we only enter into contracts with carefully selected major financialinstitutions based upon their credit ratings and other factors, and continually assess the creditworthiness of counterparties. AtDecember 31, 2016 and December 26, 2015, all of the counterparties to our interest rate swaps, foreign currency swaps and foreigncurrency forwards had investment grade ratings according to the three major ratings agencies. To date, all counterparties haveperformed in accordance with their contractual obligations.
Common Stock Share Repurchases. From time-to-time, we repurchase shares of our Common Stock under share repurchaseprograms authorized by our Board of Directors. Shares repurchased constitute authorized, but unissued shares under the NorthCarolina laws under which we are incorporated. Additionally, our Common Stock has no par or stated value. Accordingly, werecord the full value of share repurchases, upon the trade date, against Common Stock on our Consolidated Balance Sheet exceptwhen to do so would result in a negative balance in such Common Stock account. In such instances, on a period basis, we recordthe cost of any further share repurchases as a reduction in Retained earnings (Accumulated Deficit). Due to the large number ofshare repurchases of our stock over the past several years, our Common Stock balance is frequently zero at the end of anyperiod. Accordingly, $5,399 million, $1,124 million and $725 million in share repurchases were recorded as a reduction in Retainedearnings (Accumulated Deficit) in 2016, 2015 and 2014, respectively. See Note 17 for additional information on our sharerepurchases.
Pension and Post-retirement Medical Benefits. We measure and recognize the overfunded or underfunded status of our pensionand post-retirement plans as an asset or liability in our Consolidated Balance Sheet as of our fiscal year end. The funded statusrepresents the difference between the projected benefit obligations and the fair value of plan assets, which is calculated on a plan-by-plan basis. The projected benefit obligation and related funded status are determined using assumptions as of the end of eachyear. The projected benefit obligation is the present value of benefits earned to date by plan participants, including the effect offuture salary increases, as applicable. The difference between the projected benefit obligations and the fair value of plan assetsthat has not previously been recognized in our Consolidated Statement of Income is recorded as a component of Accumulatedother comprehensive income (loss).
The net periodic benefit costs associated with the Company's defined benefit pension and post-retirement medical plans aredetermined using assumptions regarding the projected benefit obligation and, for funded plans, the market-related value of planassets as of the beginning of each year. We have elected to use a market-related value of plan assets to calculate the expected returnon assets in net periodic benefit costs. We recognize differences in the fair value versus the market-related value of plan assetsevenly over five years. For each individual plan we amortize into pension expense the net amounts in Accumulated othercomprehensive income (loss), as adjusted for the difference between the fair value and market-related value of plan assets, to theextent that such amounts exceed 10% of the greater of a plan’s projected benefit obligation or market-related value of assets, overthe remaining service period of active participants in the plan or, for plans with no active participants, over the expected averagelife expectancy of the inactive participants in the plan. We record a curtailment when an event occurs that significantly reducesthe expected years of future service or eliminates the accrual of defined benefits for the future services of a significant number ofemployees. We record a curtailment gain when the employees who are entitled to the benefits terminate their employment; werecord a curtailment loss when it becomes probable a loss will occur.
We recognize settlement gains or losses only when we have determined that the cost of all settlements in a year will exceed thesum of the service and interest costs within an individual plan.
Recently Adopted Accounting Pronouncements. In April 2015, the Financial Accounting Standards Board ("FASB") issuedAccounting Standards Update ("ASU") No. 2015-03, “Interest - Imputation of Interest: Simplifying the Presentation of DebtIssuance Costs” (ASU 2015-03). ASU 2015-03 amended the then current presentation guidance by requiring that debt issuancecosts related to a recognized debt liability be presented in the balance sheet as a direct deduction from the carrying amount of that
61

debt liability, consistent with debt discounts. ASU 2015-03 was effective for the Company beginning with the quarter ended March19, 2016. The adoption of this standard required restatement of our Consolidated Balance Sheet as of December 26, 2015. As aresult, Other assets and Long-term debt each decreased by $13 million and Prepaid expenses and other current assets and Short-term borrowings each decreased by $1 million versus amounts previously reported.
In November 2016, the FASB issued ASU No. 2016-18, Statement of Cash Flows (Topic 230): Restricted Cash. ASU 2016-18requires entities to show the changes in the total of cash, cash equivalents, restricted cash and restricted cash equivalents in thestatement of cash flows. We adopted ASU 2016-18 beginning with the quarter ended December 31, 2016 on a retrospective basis.As a result Net Cash Provided by Operating Activities from Continuing Operations increased by $5 million in 2015. End-of-period cash, cash equivalents and restricted cash increased by $21 million and $16 million as of December 26, 2015 and December27, 2014, respectively. We classify restricted cash within our Consolidated Balance Sheets consistent with the nature of therestriction (e.g. cash restricted for future interest payments within the next 12 months is classified in Prepaid expenses and othercurrent assets).
In August 2014, the FASB issued ASU No. 2014-15, Presentation of Financial Statements-Going Concern (Subtopic 205-40).ASU 2014-15 requires management to evaluate whether there are conditions or events, considered in the aggregate, that raisesubstantial doubt about the entity’s ability to continue as a going concern for a period of one year following the date its financialstatements are issued. If such conditions or events exist, an entity should disclose that there is substantial doubt about the entity’sability to continue as a going concern for a period of one year following the date its financial statements are issued. Disclosureshould include the principal conditions or events that raise substantial doubt, management’s evaluation of the significance of thoseconditions or events in relation to the entity’s ability to meet its obligations, and management’s plans that are intended to mitigatethose conditions or events. We adopted ASU 2014-15 effective December 31, 2016. The adoption had no impact on ourConsolidated Financial Statements.
62
Note 3 – Earnings Per Common Share (“EPS”)
2016 2015 2014Income from continuing operations $ 994 $ 936 $ 1,006Income from discontinued operations 625 357 45Net Income $ 1,619 $ 1,293 $ 1,051
Weighted-average common shares outstanding (for basic calculation) 394 436 444Effect of dilutive share-based employee compensation 6 7 9Weighted-average common and dilutive potential common shares outstanding(for diluted calculation) 400 443 453
Basic EPS from continuing operations $ 2.52 $ 2.15 $ 2.27Basic EPS from discontinued operations 1.59 0.82 0.10Basic EPS $ 4.11 $ 2.97 $ 2.37
Diluted EPS from continuing operations $ 2.48 $ 2.11 $ 2.22Diluted EPS from discontinued operations 1.56 0.81 $ 0.10Diluted EPS $ 4.04 $ 2.92 $ 2.32Unexercised employee stock options and stock appreciation rights (in millions)excluded from the diluted EPS computation(a) 5.0 4.5 5.5
(a) These unexercised employee stock options and stock appreciation rights were not included in the computation of dilutedEPS because to do so would have been antidilutive for the periods presented.
Note 4 - Discontinued Operations
As discussed in Note 1, on October 31, 2016, the Company completed the Separation of our China business.
In connection with the Separation, the Company and Yum China entered into a Separation and Distribution Agreement as well asvarious other agreements that provide a framework for the relationships between the parties, including among others a Tax Matters

Agreement, an Employee Matters Agreement, a Transition Services Agreement and a Master License Agreement. These agreementsprovided for the allocation between the Company and Yum China of assets, employees, liabilities and obligations (includinginvestments, property, employee benefits and tax-related assets and liabilities) attributable to periods prior to, at and after theSeparation and govern certain relationships between the Company and Yum China after the Separation.
For all the periods prior to the Separation, the financial results of Yum China are presented as Income from discontinued operations,net of tax in the Consolidated Statements of Income, Assets and Liabilities of discontinued operations in the Consolidated BalanceSheets and Cash flows from discontinued operations in our Consolidated Statements of Cash Flows.
Prior to the Separation, an intercompany franchise agreement existed between an entity of Yum China and a Company entityrequiring Yum China to remit to the Company royalties on sales earned by KFC and Pizza Hut Company-owned stores in China.The royalties related to the franchise agreement were eliminated as intercompany transactions and were not separately reflectedin our previously issued financial statements. Additionally, third-party franchisees of Yum China paid to a Company entity royaltiesas a percentage of their sales. We have restated the results of our KFC and Pizza Hut Divisions for periods prior to the Separationto reflect the royalties that were previously eliminated as intercompany transactions and related taxes that were previously includedin our China Division results. We have also restated the results of our KFC and Pizza Hut Divisions to include the royalties paidby third-party franchisees previously included in China Division results that will be continued pursuant to the Master LicenseAgreement following the Separation. For 2016, 2015, and 2014 the combined impact to our KFC and Pizza Hut Divisions'Franchise and license fees and income was $208 million, $244 million, and $242 million, respectively. The value added taxassociated with this royalty revenue was recorded as an increase in Franchise and license expenses and the combined impact toour KFC and Pizza Hut Divisions' Franchise and license expense totaled $13 million, $16 million and $16 million in 2016, 2015and 2014, respectively. The net increases in the KFC and Pizza Hut Divisions' Operating Profit were offset with a correspondingreduction in Income from discontinued operations such that there is no impact on total reported Net income. Subsequent to theSeparation, all royalty revenues earned by us under the Master License Agreement with Yum China are reflected as Franchise andlicense fees and income in our Consolidated Statements of Income. Cash inflows from Yum China to the Company from the dateof Separation through the end of 2016 related to the Master License Agreement were $16 million and primarily related to royaltyrevenues.
The financial results of Yum China presented in discontinued operations reflect the results of the former China Division, anoperating segment of the Company until the Separation, adjusted for the transactions discussed above and the inclusion of certainG&A expenses, non-cash impairment charges, refranchising gains, interest and taxes that were previously not allocated to butwere related to the former China Division's historical results of operations. The following table presents the financial results ofthe Company’s discontinued operations:
2016(a) 2015 2014Company sales $ 5,667 $ 6,789 $ 6,821Franchise and license fees and income 109 120 113Company restaurant expenses (4,766) (5,913) (6,011)G&A expenses(b) (406) (405) (391)Franchise and license expenses (45) (48) (44)Closures and impairment expenses(c) (57) (64) (517)Refranchising gain 12 13 17Other income(d) 49 27 52Interest income, net 8 7 13Income from discontinued operations before income taxes 571 526 53Income tax benefit (provision)(e) 65 (164) (38)
Income from discontinued operations - including noncontrolling interests 636 362 15(Income) loss from discontinued operations - noncontrolling interests (11) (5) 30Income from discontinued operations - YUM! Brands, Inc. $ 625 $ 357 $ 45
(a) Includes Yum China financial results from January 1, 2016 to October 31, 2016.
(b) Includes costs incurred to execute the Separation of $68 million and $9 million for 2016 and 2015, respectively. Suchcosts primarily relate to transaction advisors, legal and other consulting fees.
63
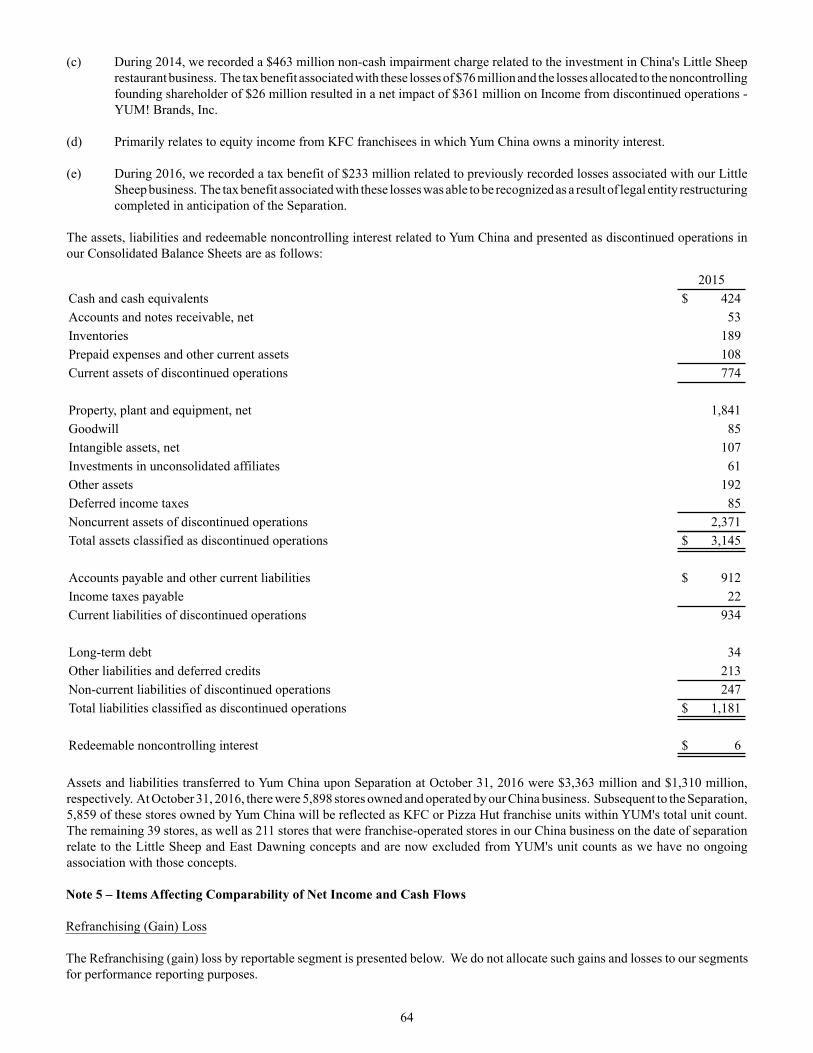
(c) During 2014, we recorded a $463 million non-cash impairment charge related to the investment in China's Little Sheeprestaurant business. The tax benefit associated with these losses of $76 million and the losses allocated to the noncontrollingfounding shareholder of $26 million resulted in a net impact of $361 million on Income from discontinued operations -YUM! Brands, Inc.
(d) Primarily relates to equity income from KFC franchisees in which Yum China owns a minority interest.
(e) During 2016, we recorded a tax benefit of $233 million related to previously recorded losses associated with our LittleSheep business. The tax benefit associated with these losses was able to be recognized as a result of legal entity restructuringcompleted in anticipation of the Separation.
The assets, liabilities and redeemable noncontrolling interest related to Yum China and presented as discontinued operations inour Consolidated Balance Sheets are as follows:
2015Cash and cash equivalents $ 424Accounts and notes receivable, net 53Inventories 189Prepaid expenses and other current assets 108Current assets of discontinued operations 774
Property, plant and equipment, net 1,841Goodwill 85Intangible assets, net 107Investments in unconsolidated affiliates 61Other assets 192Deferred income taxes 85Noncurrent assets of discontinued operations 2,371Total assets classified as discontinued operations $ 3,145
Accounts payable and other current liabilities $ 912Income taxes payable 22Current liabilities of discontinued operations 934
Long-term debt 34Other liabilities and deferred credits 213Non-current liabilities of discontinued operations 247Total liabilities classified as discontinued operations $ 1,181
Redeemable noncontrolling interest $ 6
Assets and liabilities transferred to Yum China upon Separation at October 31, 2016 were $3,363 million and $1,310 million,respectively. At October 31, 2016, there were 5,898 stores owned and operated by our China business. Subsequent to the Separation,5,859 of these stores owned by Yum China will be reflected as KFC or Pizza Hut franchise units within YUM's total unit count.The remaining 39 stores, as well as 211 stores that were franchise-operated stores in our China business on the date of separationrelate to the Little Sheep and East Dawning concepts and are now excluded from YUM's unit counts as we have no ongoingassociation with those concepts.
64
Note 5 – Items Affecting Comparability of Net Income and Cash Flows
Refranchising (Gain) Loss
The Refranchising (gain) loss by reportable segment is presented below. We do not allocate such gains and losses to our segmentsfor performance reporting purposes.
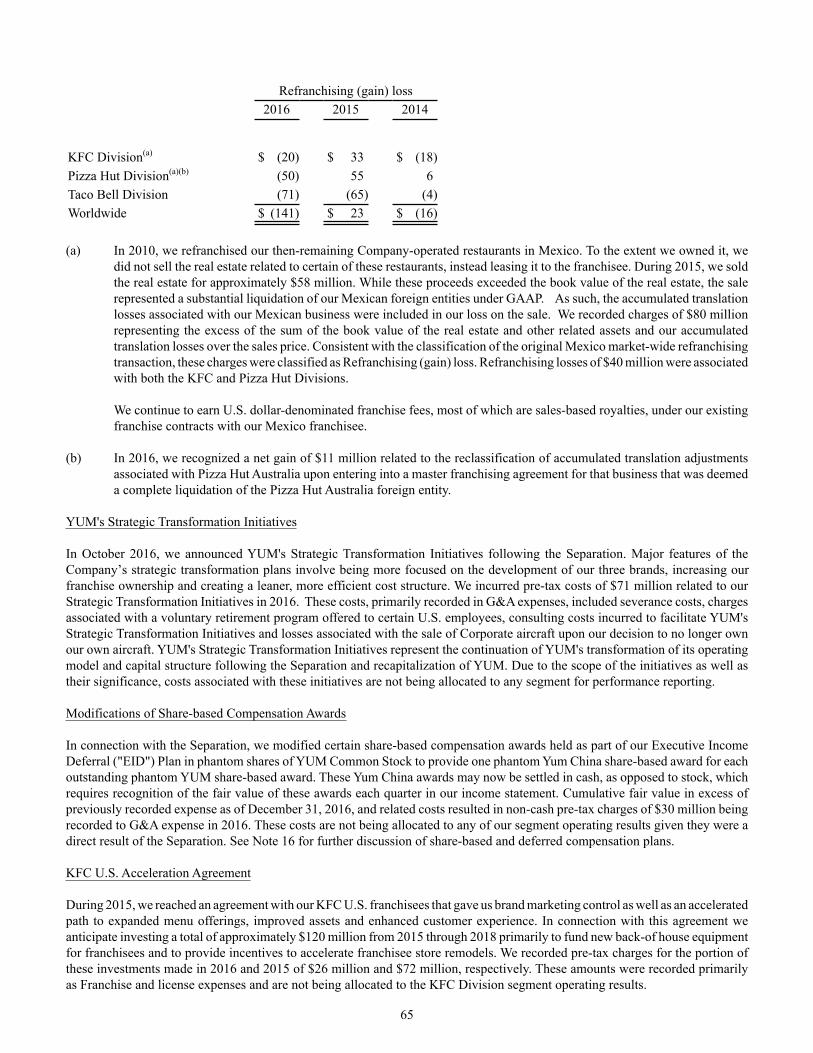
Refranchising (gain) loss2016 2015 2014
KFC Division(a) $ (20) $ 33 $ (18)Pizza Hut Division(a)(b) (50) 55 6Taco Bell Division (71) (65) (4)Worldwide $ (141) $ 23 $ (16)
(a) In 2010, we refranchised our then-remaining Company-operated restaurants in Mexico. To the extent we owned it, wedid not sell the real estate related to certain of these restaurants, instead leasing it to the franchisee. During 2015, we soldthe real estate for approximately $58 million. While these proceeds exceeded the book value of the real estate, the salerepresented a substantial liquidation of our Mexican foreign entities under GAAP. As such, the accumulated translationlosses associated with our Mexican business were included in our loss on the sale. We recorded charges of $80 millionrepresenting the excess of the sum of the book value of the real estate and other related assets and our accumulatedtranslation losses over the sales price. Consistent with the classification of the original Mexico market-wide refranchisingtransaction, these charges were classified as Refranchising (gain) loss. Refranchising losses of $40 million were associatedwith both the KFC and Pizza Hut Divisions.
We continue to earn U.S. dollar-denominated franchise fees, most of which are sales-based royalties, under our existingfranchise contracts with our Mexico franchisee.
(b) In 2016, we recognized a net gain of $11 million related to the reclassification of accumulated translation adjustmentsassociated with Pizza Hut Australia upon entering into a master franchising agreement for that business that was deemeda complete liquidation of the Pizza Hut Australia foreign entity.
YUM's Strategic Transformation Initiatives
In October 2016, we announced YUM's Strategic Transformation Initiatives following the Separation. Major features of theCompany’s strategic transformation plans involve being more focused on the development of our three brands, increasing ourfranchise ownership and creating a leaner, more efficient cost structure. We incurred pre-tax costs of $71 million related to ourStrategic Transformation Initiatives in 2016. These costs, primarily recorded in G&A expenses, included severance costs, chargesassociated with a voluntary retirement program offered to certain U.S. employees, consulting costs incurred to facilitate YUM'sStrategic Transformation Initiatives and losses associated with the sale of Corporate aircraft upon our decision to no longer ownour own aircraft. YUM's Strategic Transformation Initiatives represent the continuation of YUM's transformation of its operatingmodel and capital structure following the Separation and recapitalization of YUM. Due to the scope of the initiatives as well astheir significance, costs associated with these initiatives are not being allocated to any segment for performance reporting.
Modifications of Share-based Compensation Awards
In connection with the Separation, we modified certain share-based compensation awards held as part of our Executive IncomeDeferral ("EID") Plan in phantom shares of YUM Common Stock to provide one phantom Yum China share-based award for eachoutstanding phantom YUM share-based award. These Yum China awards may now be settled in cash, as opposed to stock, whichrequires recognition of the fair value of these awards each quarter in our income statement. Cumulative fair value in excess ofpreviously recorded expense as of December 31, 2016, and related costs resulted in non-cash pre-tax charges of $30 million beingrecorded to G&A expense in 2016. These costs are not being allocated to any of our segment operating results given they were adirect result of the Separation. See Note 16 for further discussion of share-based and deferred compensation plans.
KFC U.S. Acceleration Agreement
During 2015, we reached an agreement with our KFC U.S. franchisees that gave us brand marketing control as well as an acceleratedpath to expanded menu offerings, improved assets and enhanced customer experience. In connection with this agreement weanticipate investing a total of approximately $120 million from 2015 through 2018 primarily to fund new back-of house equipmentfor franchisees and to provide incentives to accelerate franchisee store remodels. We recorded pre-tax charges for the portion ofthese investments made in 2016 and 2015 of $26 million and $72 million, respectively. These amounts were recorded primarilyas Franchise and license expenses and are not being allocated to the KFC Division segment operating results.
65

In addition to the investments above we agreed to fund $60 million of incremental system advertising. During 2016 and 2015, weincurred $20 million and $10 million in incremental system advertising expense, respectively, with the remaining funding to occurin 2017 and 2018. The amounts recorded were primarily in Franchise and license expenses and are included in the KFC Divisionsegment operating results.
YUM Retirement Plan Settlement Charge
During the fourth quarter of 2016, the Company allowed certain former employees with deferred vested balances in the YUMRetirement Plan ("the Plan") an opportunity to voluntarily elect an early payout of their pension benefits. As a result of settlementpayments made of approximately $205 million related to this program, all of which were funded from existing Plan assets, werecorded a pre-tax settlement charge to G&A expenses in 2016 of $25 million that was not allocated to any of our segment operatingresults due to the size and non-recurring nature of the program. See Note 15 for further discussion of our pension plans.
Store Closure and Impairment Activity
Store closure (income) costs and Store impairment charges by reportable segment are presented below.
2016
KFC Pizza Hut Taco Bell WorldwideStore closure (income) costs(a) $ 3 $ (4) $ — $ (1)Store impairment charges 8 4 3 15Closure and impairment (income) expenses $ 11 $ — $ 3 $ 14
2015
KFC Pizza Hut Taco Bell WorldwideStore closure (income) costs(a) $ 1 $ (2) $ (1) $ (2)Store impairment charges 8 5 4 17Closure and impairment (income) expenses $ 9 $ 3 $ 3 $ 15
2014
KFC Pizza Hut Taco Bell WorldwideStore closure (income) costs(a) $ 2 $ 1 $ — $ 3Store impairment charges 8 4 3 15Closure and impairment (income) expenses $ 10 $ 5 $ 3 $ 18
(a) Store closure (income) costs include the net gain or loss on sales of real estate on which we formerly operated a Company-owned restaurant that was closed, lease reserves established when we cease using a property under an operating leaseand subsequent adjustments to those reserves and other facility-related expenses from previously closed stores. Remaininglease obligations for closed stores were not material at December 31, 2016 or December 26, 2015.
66

Note 6 – Supplemental Cash Flow Data
2016 2015 2014Cash Paid For:
Interest $ 297 $ 145 $ 141Income taxes(a) 317 390 495
Significant Non-Cash Investing and Financing Activities:Capital lease obligations incurred $ 9 $ 25 $ 17
Reconciliation of Cash and cash equivalents to Consolidated Statements of CashFlows:
Cash and cash equivalents as presented in Consolidated Balance Sheets $ 704 $ 313 $ 341Restricted cash included in Prepaid expenses and other current assets(b) 55 — —Restricted cash included in Other assets(c) 53 21 16Cash, Cash Equivalents and Restricted Cash as presented in ConsolidatedStatements of Cash Flows $ 812 $ 334 $ 357
(a) 2014 includes $200 million of cash paid related to the resolution of a valuation issue with the Internal Revenue Service("IRS") related to years 2004 through 2008. See Note 18.
(b) Restricted cash within Prepaid expenses and other current assets primarily relates to the Taco Bell Securitization. SeeNote 11.
(c) Primarily cash balances required to meet statutory minimum net worth requirements for legal entities which enter intoU.S. franchise agreements and trust accounts related to our self-insurance programs.
67
Note 7 – Franchise and License Fees and Income
2016 2015 2014Initial fees, including renewal fees $ 81 $ 78 $ 76Initial franchise fees included in Refranchising (gain) loss (9) (6) (2)
72 72 74Continuing fees and rental income 2,094 2,012 2,010Franchise and license fees and income $ 2,166 $ 2,084 $ 2,084
Note 8 – Other (Income) Expense
2016 2015 2014Foreign exchange net (gain) loss and other $ (2) $ 17 $ 11Loss associated with corporate aircraft(a) 9 — —Other (income) expense $ 7 $ 17 $ 11
(a) During 2016, we made the decision to no longer operate a corporate aircraft fleet and offered our owned aircraft forsale, one of which was sold during 2016 and one that is classified as held for sale at the end of 2016 within Prepaidexpenses and other current assets. The losses associated with the sale and planned sale reflect the shortfall of theexpected or actual proceeds, less any selling costs, over the carrying value of the aircraft. See Note 5.
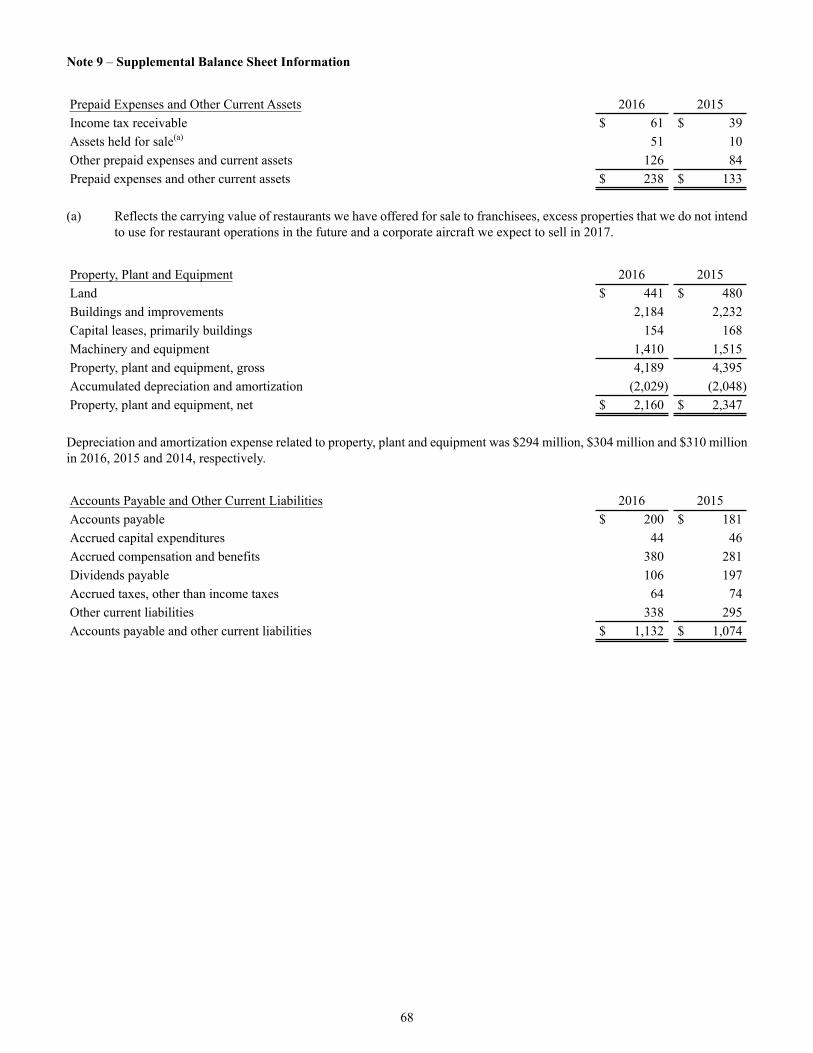
Note 9 – Supplemental Balance Sheet Information
Prepaid Expenses and Other Current Assets 2016 2015Income tax receivable $ 61 $ 39Assets held for sale(a) 51 10Other prepaid expenses and current assets 126 84Prepaid expenses and other current assets $ 238 $ 133
(a) Reflects the carrying value of restaurants we have offered for sale to franchisees, excess properties that we do not intendto use for restaurant operations in the future and a corporate aircraft we expect to sell in 2017.
Property, Plant and Equipment 2016 2015Land $ 441 $ 480Buildings and improvements 2,184 2,232Capital leases, primarily buildings 154 168Machinery and equipment 1,410 1,515Property, plant and equipment, gross 4,189 4,395Accumulated depreciation and amortization (2,029) (2,048)Property, plant and equipment, net $ 2,160 $ 2,347
Depreciation and amortization expense related to property, plant and equipment was $294 million, $304 million and $310 millionin 2016, 2015 and 2014, respectively.
Accounts Payable and Other Current Liabilities 2016 2015Accounts payable $ 200 $ 181Accrued capital expenditures 44 46Accrued compensation and benefits 380 281Dividends payable 106 197Accrued taxes, other than income taxes 64 74Other current liabilities 338 295Accounts payable and other current liabilities $ 1,132 $ 1,074
68
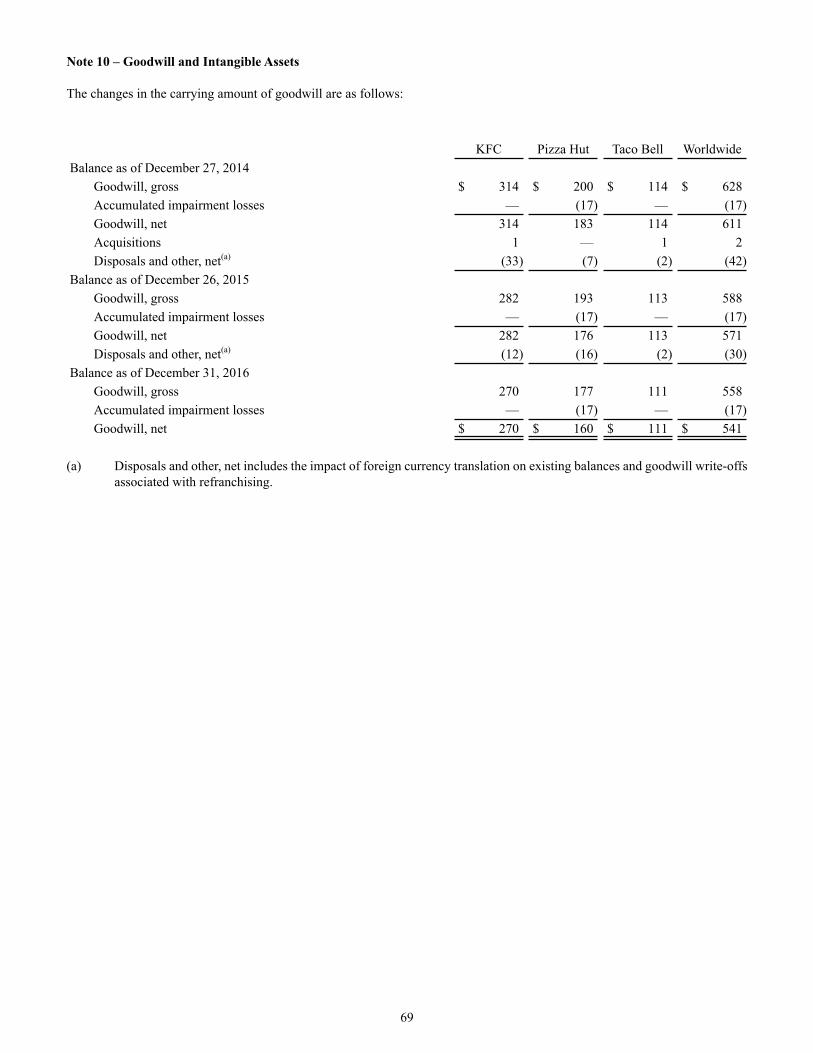
Note 10 – Goodwill and Intangible Assets
The changes in the carrying amount of goodwill are as follows:
KFC Pizza Hut Taco Bell WorldwideBalance as of December 27, 2014
Goodwill, gross $ 314 $ 200 $ 114 $ 628Accumulated impairment losses — (17) — (17)Goodwill, net 314 183 114 611Acquisitions 1 — 1 2Disposals and other, net(a) (33) (7) (2) (42)
Balance as of December 26, 2015Goodwill, gross 282 193 113 588Accumulated impairment losses — (17) — (17)Goodwill, net 282 176 113 571Disposals and other, net(a) (12) (16) (2) (30)
Balance as of December 31, 2016Goodwill, gross 270 177 111 558Accumulated impairment losses — (17) — (17)Goodwill, net $ 270 $ 160 $ 111 $ 541
(a) Disposals and other, net includes the impact of foreign currency translation on existing balances and goodwill write-offsassociated with refranchising.
69

Intangible assets, net for the years ended 2016 and 2015 are as follows:
2016 2015
Gross CarryingAmount
AccumulatedAmortization
Gross CarryingAmount
AccumulatedAmortization
Definite-lived intangible assetsReacquired franchise rights $ 84 $ (49) $ 92 $ (49)Franchise contract rights 99 (73) 99 (70)Lease tenancy rights 56 (9) 55 (9)Other 36 (24) 37 (22)
$ 275 $ (155) $ 283 $ (150)
Indefinite-lived intangible assetsKFC trademark $ 31 $ 31
Amortization expense for all definite-lived intangible assets was $12 million in 2016, $13 million in 2015 and $13 million in2014. Amortization expense for definite-lived intangible assets is expected to approximate $10 million in 2017, $9 million in2018, $7 million in 2019, $7 million in 2020 and $6 million in 2021.
70
Note 11 – Short-term Borrowings and Long-term Debt
2016 2015Short-term BorrowingsCurrent maturities of long-term debt $ 65 $ 312Unsecured Short-Term Loan Credit Facility (the "Bridge Facility") — 600Other 9 9
$ 74 $ 921Less current portion of debt issuance costs and discounts (8) —Short-term borrowings $ 66 $ 921
Long-term DebtSecuritization Notes $ 2,294 $ —Subsidiary Senior Unsecured Notes 2,100 —Term Loan A Facility 500 —Term Loan B Facility 1,990 —YUM Senior Unsecured Notes 2,200 2,500Senior Unsecured Revolving Credit Facility — 701Capital lease obligations (See Note 12) 121 134
9,205 3,335Less debt issuance costs and discounts (79) (16)Less current maturities of long-term debt (65) (312)Long-term debt $ 9,061 $ 3,007
During the year ended December 31, 2016, a subsidiary of Taco Bell issued $2.3 billion in Securitization Notes. Additionally, in2016 a group of our subsidiaries issued $2.1 billion in Senior Unsecured Notes and entered into a Credit Agreement providing forsenior, secured credit facilities consisting of a $500 million Term Loan A Facility, a $2.0 billion Term Loan B Facility and a $1.0billion revolving credit facility with $995 million in borrowings available as of December 31, 2016 (net of $5 million in outstandingletters of credit) During 2016, YUM repaid $300 million in YUM Senior Unsecured Notes and repaid and terminated the Bridge

Facility, which had $600 million of outstanding borrowings as of December 26, 2015. We also repaid and terminated the SeniorUnsecured Revolving Credit Facility, which had $701 million of outstanding borrowings as of December 26, 2015.
Securitization Notes
On May 11, 2016 Taco Bell Funding, LLC (the “Issuer”), a newly formed, special purpose limited liability company and a direct,wholly-owned subsidiary of Taco Bell Corp. ("TBC") completed a securitization transaction and issued $800 million of itsSeries 2016-1 3.832% Fixed Rate Senior Secured Notes, Class A-2-I (the “Class A-2-I Notes”), $500 million of its Series 2016-14.377% Fixed Rate Senior Secured Notes, Class A-2-II (the “Class A-2-II Notes”) and $1.0 billion of its Series 2016-1 4.970%Fixed Rate Senior Secured Notes, Class A-2-III (the “Class A-2-III Notes” and, together with the Class A-2-I Notes and theClass A-2-II Notes, the “Class A-2 Notes”). In connection with the issuance of the Class A-2 Notes, the Issuer also entered intoa revolving financing facility of Series 2016-1 Senior Notes, Class A-1 (the “Variable Funding Notes”), which allows for theborrowing of up to $100 million and the issuance of up to $50 million in letters of credit. The Class A-2 Notes and the VariableFunding Notes are referred to collectively as the “Securitization Notes”. The Class A-2 Notes were issued under a Base Indenture,dated as of May 11, 2016 (the “Base Indenture”), and the related Series 2016-1 Supplement thereto, dated as of May 11, 2016 (the“Series 2016-1 Supplement”). The Base Indenture and the Series 2016-1 Supplement (collectively, the “Indenture”) allow theIssuer to issue additional series of notes.
The Securitization Notes were issued in a transaction pursuant to which certain of TBC’s domestic assets, consisting principallyof franchise-related agreements and domestic intellectual property, were contributed to the Issuer and the Issuer’s special purpose,wholly-owned subsidiaries (the “Guarantors”, and collectively with the Issuer, the "Securitization Entities") to secure theSecuritization Notes. The Securitization Notes are secured by substantially all of the assets of the Securitization Entities, andinclude a lien on all existing and future U.S. Taco Bell franchise and license agreements and the royalties payable thereunder,existing and future U.S. Taco Bell intellectual property, certain transaction accounts and a pledge of the equity interests in asset-owning Securitization Entities. The remaining U.S. Taco Bell assets that were excluded from the transfers to the SecuritizationEntities continue to be held by Taco Bell of America, LLC, a limited liability company ("TBA") and TBC. The SecuritizationNotes are not guaranteed by the remaining U.S. Taco Bell assets, the Company, or any other subsidiary of the Company.
Payments of interest and principal on the Securitization Notes are made from the royalty fees paid pursuant to the franchise andlicense agreements with all U.S. Taco Bell restaurants, including both company and franchise operated restaurants. Interest onand principal payments of the Class A-2 Notes are due on a quarterly basis. In general, no amortization of principal of the ClassA-2 Notes is required prior to their anticipated repayment dates unless as of any quarterly measurement date the consolidatedleverage ratio (the ratio of total debt to Net Cash Flow (as defined in the Indenture)) for the preceding four fiscal quarters of eitherthe Company and its subsidiaries or the Issuer and its subsidiaries exceeds 5.0:1, in which case amortization payments of 1% peryear of the outstanding principal as of the closing of the Securitization Notes is required. As of the most recent quarterly measurementdate the consolidated leverage ratio exceeded 5.0:1 and, as a result, amortization payments are required. The legal final maturitydate of the Notes is in May 2046, but the anticipated repayment dates of the Class A-2-I Notes, the Class A-2-II Notes and theClass A-2-III Notes will be 4, 7 and 10 years, respectively (the “Anticipated Repayment Dates”) from the date of issuance. If theIssuer has not repaid or refinanced a series of Class A-2 Notes prior to its respective Anticipated Repayment Dates, rapidamortization of principal on all Securitization Notes will occur and additional interest will accrue on the Class A-2 Notes, as statedin the Indenture.
Interest on the Variable Funding Notes will be based on (i) the prime rate, (ii) the overnight federal funds rates, (iii) the Londoninterbank offered rate (“LIBOR”) for U.S. Dollars or (iv) with respect to advances made by conduit investors, the weighted averagecost of, or related to, the issuance of commercial paper allocated to fund or maintain such advances, plus any applicable margin,in each case as more fully set forth in the Variable Funding Note Purchase Agreement. It is anticipated that outstanding principalof and interest on the Variable Funding Notes, if any, will be repaid in full on or prior to May 2021, subject to two additional one-year extensions at the option of the Issuer and further extensions as agreed between the Issuer and the Administrative Agent.Following the anticipated repayment date and any extensions thereof, additional interest will accrue on the Variable Funding Notesequal to 5.00% per year. As of December 31, 2016, $15 million of letters of credit were outstanding against the Variable FundingNotes, which relate primarily to interest reserves required under the Indenture. The Variable Funding Notes were undrawn atDecember 31, 2016.
The Company paid debt issuance costs of $31 million in connection with the issuance of the Securitization Notes. The debtissuance costs are being amortized to Interest expense, net through the Anticipated Repayment Dates of the Securitization Notesutilizing the effective interest rate method. We classify these deferred costs on our Consolidated Balance Sheet as a reduction inthe related debt when borrowings are outstanding or within Other assets if borrowings are not outstanding. As of December 31,2016, the effective interest rates, including the amortization of debt issuance costs, were 4.18%, 4.59%, and 5.14% for the ClassA-2-I Notes, Class A-2-II Notes and Class A-2-III Notes, respectively.
71

The Securitization Notes are subject to a series of covenants and restrictions customary for transactions of this type, including(i) that the Issuer maintains specified reserve accounts to be available to make required interest payments in respect of theSecuritization Notes, (ii) provisions relating to optional and mandatory prepayments and the related payment of specified amounts,including specified make-whole payments in the case of the Class A-2 Notes under certain circumstances, (iii) certainindemnification payments relating to taxes, enforcement costs and other customary items and (iv) covenants relating torecordkeeping, access to information and similar matters. The Securitization Notes are also subject to rapid amortization eventsprovided for in the Indenture, including events tied to failure to maintain a stated debt service coverage ratio (as defined in theIndenture) of at least 1.1:1, gross domestic sales for branded restaurants being below certain levels on certain measurement dates,a manager termination event, an event of default and the failure to repay or refinance the Class A-2 Notes on the AnticipatedRepayment Date (subject to limited cure rights). The Securitization Notes are also subject to certain customary events of default,including events relating to non-payment of required interest or principal due on the Securitization Notes, failure to comply withcovenants within certain time frames, certain bankruptcy events, breaches of specified representations and warranties, failure ofsecurity interests to be effective, certain judgments and failure of the Securitization Entities to maintain a stated debt servicecoverage ratio. As of December 31, 2016, we were in compliance with all of our debt covenant requirements and were not subjectto any rapid amortization events.
In accordance with the Indenture, certain cash accounts have been established with the Indenture trustee for the benefit of the noteholders, and are restricted in their use. The Indenture requires a certain amount of securitization cash flow collections to beallocated on a weekly basis and maintained in a cash reserve account. As of December 31, 2016, the Company had restricted cashof $55 million primarily related to required interest reserves. Such restricted cash is included in Prepaid expenses and other currentassets on the Consolidated Balance Sheet as of December 31, 2016. Once the required obligations are satisfied, there are no furtherrestrictions, including payment of dividends, on the cash flows of the Securitization Entities.
Additional cash reserves are required if any of the rapid amortization events occur, as noted above, or in the event that as of anyquarterly measurement date the Securitization Entities fail to maintain a debt service coverage ratio (or the ratio of Net Cash Flowto all debt service payments for the preceding four fiscal quarters) of at least 1.75:1. The amount of weekly securitization cashflow collections that exceed the required weekly allocations is generally remitted to the Company. During the quarter endedDecember 31, 2016, the Securitization Entities maintained a debt service coverage ratio significantly in excess of the 1.75:1requirement.
Credit Facilities and Subsidiary Senior Unsecured Notes
On June 16, 2016, KFC Holding Co., Pizza Hut Holdings, LLC, a limited liability company, and TBA, each of which is a wholly-owned subsidiary of the Company, as co-borrowers (the "Borrowers"), entered into a credit agreement providing for senior securedcredit facilities consisting of a $500 million Term Loan A facility (the “Term Loan A Facility"), a $2.0 billion Term Loan B facility(the “Term Loan B Facility”) and a $1.0 billion revolving facility (the “Revolving Facility”), each of which may be increasedsubject to certain conditions. The Term Loan A Facility, the Term Loan B Facility, and the Revolving Facility are collectivelyreferred to as the "Credit Agreement". Through December 31, 2016, there have been no outstanding borrowings under the RevolvingFacility.
The Term Loan A Facility is subject to quarterly amortization payments beginning one full fiscal quarter after the first anniversaryof the closing date, in an amount equal to 1.25% of the initial principal amount of the facility, in each of the second and third yearsof the facility; in an amount equal to 1.875% of the initial principal amount of the facility, in the fourth year of the facility; andin an amount equal to 3.75% of the initial principal amount of the facility, in the fifth year of the facility, with the balance payableat maturity on the fifth anniversary of the closing date. The Term Loan B Facility is subject to quarterly amortization paymentsin an amount equal to 0.25% of the initial principal amount of the facility, with the balance payable at maturity on the seventhanniversary of the closing date.
The interest rate for the Term Loan A Facility and for borrowings under the Revolving Facility ranges from 2.00% to 2.50% plusLIBOR or from 1.00% to 1.50% plus the Base Rate (as defined in the Credit Agreement), at the Borrowers’ election, based uponthe total net leverage ratio of the Borrowers and the Specified Guarantors. The Specified Guarantors are the following subisidiariesof the Company: YUM Restaurant Services Group, LLC, Restaurant Concepts LLC and TBC and their subsidiaries, excludingTaco Bell Funding LLC, and its special purpose, wholly-owned subsidiaries (see above). The interest rate for the Term Loan BFacility is either LIBOR plus 2.75% or the Base Rate plus 1.75%, at the Borrowers’ election. Interest on any outstanding borrowingsunder the Credit Agreement is payable at least quarterly. The Term Loan A Facility and the Revolving Facility mature in June2021 and the Term Loan B Facility matures in June 2023.
72

The Credit Agreement is unconditionally guaranteed by the Company and certain of the Borrowers’ principal domestic subsidiariesand excludes Taco Bell Funding LLC and its special purpose, wholly-owned subsidiaries (see above). The Credit Agreement isalso secured by first priority liens on substantially all assets of the Borrowers and each subsidiary guarantor, excluding the stockof certain subsidiaries and certain real property, and subject to other customary exceptions.
The Credit Agreement is subject to certain mandatory prepayments, including an amount equal to 50% of excess cash flow (asdefined in the Credit Agreement) on an annual basis and the proceeds of certain asset sales, casualty events and issuances ofindebtedness, subject to customary exceptions and reinvestment rights.
The Credit Agreement includes two financial maintenance covenants which require the Borrowers to maintain a total leverageratio (defined as the ratio of Consolidated Total Debt to Consolidated EBITDA (as these terms are defined in the Credit Agreement))of 5.0:1 or less and a fixed charge coverage ratio (defined as the ratio of EBITDA minus capital expenditures to fixed charges(inclusive of rental expense and scheduled amortization)) of at least 1.5:1, each as of the last day of each fiscal quarter. The CreditAgreement includes other affirmative and negative covenants and events of default that are customary for facilities of this type.The Credit Agreement contains, among other things, limitations on certain additional indebtedness and liens, and certain othertransactions specified in the agreement. We were in compliance with all debt covenants as of December 31, 2016.
Additionally, on June 16, 2016, the Borrowers issued $1.05 billion aggregate principal amount of 5.00% Senior Unsecured Notesdue 2024 and $1.05 billion aggregate principal amount of 5.25% Senior Unsecured Notes due 2026 (together, the “SubsidiarySenior Unsecured Notes”). Interest on each series of Subsidiary Senior Unsecured Notes is payable semi-annually in arrears onJune 1 and December 1, beginning on December 1, 2016. The Subsidiary Senior Unsecured Notes are guaranteed on a seniorunsecured basis by (i) the Company, (ii) the Specified Guarantors and (iii) by each of the Borrower's and the Specified Guarantors’domestic subsidiaries that guarantees the Borrower's obligations under the Credit Agreement, except for any of the Company’sforeign subsidiaries. The indenture governing the Subsidiary Senior Unsecured Notes contains covenants and events of defaultthat are customary for debt securities of this type. We were in compliance with all debt covenants as of December 31, 2016.
During 2016, the Company paid debt issuance costs of $56 million in connection with the issuance of the Credit Agreement andthe Subsidiary Senior Unsecured Notes. The debt issuance costs are being amortized to Interest expense, net through the contractualmaturity of the agreements utilizing the effective interest rate method. We classify these deferred costs on our Consolidated BalanceSheet as a reduction in the related debt when borrowings are outstanding or within Other assets if borrowings are not outstanding.As of December 31, 2016, the effective interest rates, including the amortization of debt issuance costs and the impact of theinterest rate swaps on Term Loan B Facility (See Note 13), were 5.16%, 5.39%, 3.01%, and 3.91% for the Subsidiary SeniorUnsecured Notes due 2024, the Subsidiary Senior Unsecured Notes due 2026, the Term Loan A Facility, and the Term Loan BFacility, respectively.
YUM Senior Unsecured Notes
The majority of our remaining long-term debt primarily comprises YUM Senior Unsecured Notes with varying maturity datesfrom 2018 through 2043 and stated interest rates ranging from 3.75% to 6.88%. The YUM Senior Unsecured Notes representsenior, unsecured obligations and rank equally in right of payment with all of our existing and future unsecured unsubordinatedindebtedness. Our YUM Senior Unsecured Notes contain cross-default provisions whereby the acceleration of the maturity ofany of our indebtedness in a principal amount in excess of $50 million will constitute a default under the YUM Senior UnsecuredNotes unless such indebtedness is discharged, or the acceleration of the maturity of that indebtedness is annulled, within 30 daysafter notice.
During the second quarter of 2016, we repaid $300 million of YUM Senior Unsecured Notes upon their maturity.
73

The following table summarizes all YUM Senior Unsecured Notes issued that remain outstanding at December 31, 2016:
Interest Rate
Issuance Date(a) Maturity DatePrincipal Amount
(in millions) Stated Effective(b)
October 2007 March 2018 $ 325 6.25% 6.36%October 2007 November 2037 $ 325 6.88% 7.45%August 2009 September 2019 $ 250 5.30% 5.59%August 2010 November 2020 $ 350 3.88% 4.01%August 2011 November 2021 $ 350 3.75% 3.88%October 2013 November 2023 $ 325 3.88% 4.01%October 2013 November 2043 $ 275 5.35% 5.42%
(a) Interest payments commenced approximately six months after issuance date and are payable semi-annually thereafter.
(b) Includes the effects of the amortization of any (1) premium or discount; (2) debt issuance costs; and (3) gain or loss uponsettlement of related treasury locks and forward starting interest rate swaps utilized to hedge the interest rate risk priorto debt issuance.
The annual maturities of short-term borrowings and long-term debt as of December 31, 2016, excluding capital lease obligationsof $121 million are as follows:
Year ended:2017 $ 642018 3932019 3242020 1,2152021 760Thereafter 6,337Total $ 9,093
Interest expense on short-term borrowings and long-term debt was $333 million, $153 million and $151 million in 2016, 2015and 2014, respectively.
74
Note 12 – Leases
At December 31, 2016, we operated approximately 2,800 restaurants, leasing the underlying land and/or building in approximately2,000 of those restaurants with the vast majority of our commitments expiring within 20 years from the inception of the lease. Inaddition, the Company leases or subleases approximately 700 units to franchisees, principally in the U.S., United Kingdom,Germany and France.
We also lease office space for headquarters and support functions, as well as certain office and restaurant equipment. We do notconsider any of these individual leases material to our operations. Most leases require us to pay related executory costs, whichinclude property taxes, maintenance and insurance.

Future minimum commitments and amounts to be received as lessor or sublessor under non-cancelable leases are set forthbelow:
Commitments Lease Receivables
Capital
OperatingDirect
Financing
Operating2017 $ 16 $ 171 $ 3 $ 402018 16 148 2 362019 15 128 2 302020 15 101 2 232021 14 85 1 20Thereafter 105 571 5 86
$ 181 $ 1,204 $ 15 $ 235
At December 31, 2016 and December 26, 2015, the present value of minimum payments under capital leases was $121 millionand $134 million, respectively. At December 31, 2016, unearned income associated with direct financing lease receivables was$2 million.
The details of rental expense and income are set forth below:
2016 2015 2014Rental expenseMinimum $ 213 $ 221 $ 243Contingent 29 34 37
$ 242 $ 255 $ 280Rental income $ 79 $ 73 $ 83
75
Note 13 - Derivative Instruments
We use derivative instruments to manage certain of our market risks related to fluctuations in interest rates and foreign currencyexchange rates.
Interest Rate Swaps
We enter into interest rate swaps with the objective of reducing our exposure to interest rate risk for a portion of our variable-ratedebt interest payments. On July 25, 2016, we agreed with multiple counterparties to swap the variable LIBOR-based componentof the interest payments related to $1.55 billion of our $2.0 billion Term Loan B Facility, resulting in a fixed rate of 3.92% on theswapped portion of the Term Loan B Facility. These interest rate swaps will expire in July 2021 and the notional amount, maturitydate and variable rate of these swaps match those of the related debt. These interest rate swaps are designated cash flow hedgesas the changes in the future cash flows of the swaps are expected to offset changes in interest payments on the related variable-rate debt. There were no other interest rate swaps outstanding as of December 31, 2016.
The effective portion of gains or losses on the interest rate swaps is reported as a component of Accumulated other comprehensiveincome ("AOCI") and reclassified into Interest expense, net in our Consolidated Statement of Income in the same period or periodsduring which the related hedged interest payments affect earnings. Gains or losses on the swaps representing hedge ineffectivenessare recognized in current earnings. As of December 31, 2016, the swaps were highly effective cash flow hedges and noineffectiveness has been recorded.
Foreign Currency Contracts
We enter into foreign currency forward and swap contracts with the objective of reducing our exposure to earnings volatility arisingfrom foreign currency fluctuations associated with certain foreign currency denominated intercompany receivables andpayables. The notional amount, maturity date, and currency of these contracts match those of the underlying intercompanyreceivables or payables. Our foreign currency contracts are designated cash flow hedges as the future cash flows of the contractsare expected to offset changes in intercompany receivables and payables due to foreign currency exchange rate fluctuations.

The effective portion of gains or losses on the foreign currency contracts is reported as a component of AOCI. Amounts arereclassified from AOCI each quarter to offset foreign currency transaction gains or losses recorded within Other (income) expensewhen the related intercompany receivables and payables affect earnings due to their functional currency remeasurements. Gainsor losses on the foreign currency contracts representing hedge ineffectiveness are recognized in current earnings. As of December31, 2016, all foreign currency contracts were highly effective cash flow hedges and no ineffectiveness has been recorded.
As of December 31, 2016 and December 26, 2015, foreign currency forward and swap contracts outstanding had total notionalamounts of $437 million and $470 million, respectively. As of December 31, 2016 we have foreign currency forward and swapcontracts with durations expiring as early as January 2017 and as late as 2020.
As a result of the use of derivative instruments, the Company is exposed to risk that the counterparties will fail to meet theircontractual obligations. To mitigate the counterparty credit risk, we only enter into contracts with carefully selected major financialinstitutions based upon their credit ratings and other factors, and continually assess the creditworthiness of counterparties. AtDecember 31, 2016, all of the counterparties to our interest rate swaps and foreign currency contracts had investment grade ratingsaccording to the three major ratings agencies. To date, all counterparties have performed in accordance with their contractualobligations.
Gains and losses on derivative instruments designated as cash flow hedges recognized in OCI and reclassifications from AOCIinto Net Income:
Gains/(Losses)Recognized in
OCI
(Gains)/LossesReclassified from
AOCI into NetIncome
2016 2015 2016 2015
Interest rate swaps $ 47 $ — $ (4) $ —Foreign currency contracts 1 32 (4) (41)Income tax benefit/(expense) (19) (4) 3 5
As of December 31, 2016, the estimated net gain included in AOCI related to our cash flow hedges that will be reclassified intoearnings in the next 12 months is $3 million, based on current LIBOR interest rates.
See Note 14 for the fair value of our derivative assets and liabilities.
76
Note 14 – Fair Value Disclosures
As of December 31, 2016 the carrying values of cash and cash equivalents, restricted cash, short-term investments, accountsreceivable, short -term borrowings and accounts payable approximated their fair values because of the short-term nature of theseinstruments. The fair value of notes receivable net of allowances and lease guarantees less subsequent amortization approximatestheir carrying value. The following table presents the carrying value and estimated fair value of the Company’s debt obligations:
12/31/2016 12/26/2015
CarryingValue
Fair Value(Level 2)
CarryingValue
Fair Value(Level 2)
Debt obligationsSecuritization Notes(a) $ 2,294 $ 2,315 $ — $ —Subsidiary Senior Unsecured Notes(b) 2,100 2,175 — —Term Loan A Facility(b) 500 501 — —Term Loan B Facility(b) 1,990 2,016 — —YUM Senior Unsecured Notes(b) 2,200 2,216 2,500 2,393
(a) We estimated the fair value of the Securitization Notes by obtaining broker quotes from two separate brokerage firmsthat are knowledgeable about the Company’s Securitization Notes and, at times, trade these notes. The markets in whichthe Securitization Notes trade are not considered active markets.
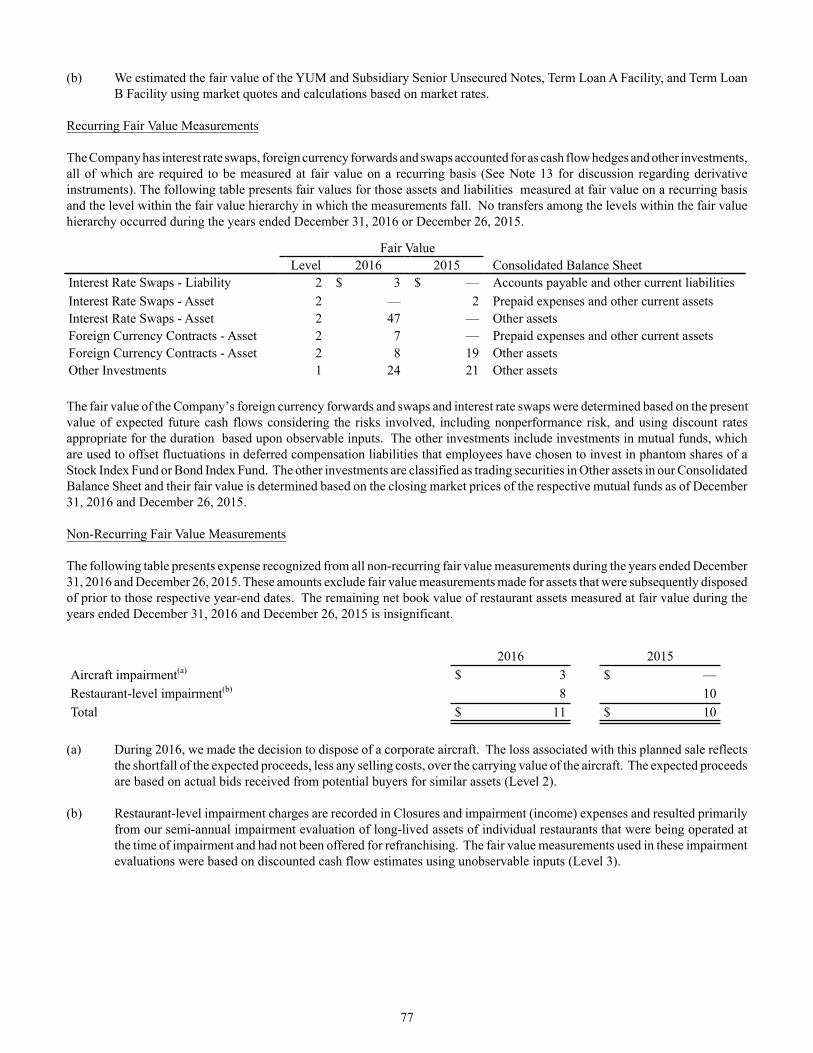
(b) We estimated the fair value of the YUM and Subsidiary Senior Unsecured Notes, Term Loan A Facility, and Term LoanB Facility using market quotes and calculations based on market rates.
Recurring Fair Value Measurements
The Company has interest rate swaps, foreign currency forwards and swaps accounted for as cash flow hedges and other investments,all of which are required to be measured at fair value on a recurring basis (See Note 13 for discussion regarding derivativeinstruments). The following table presents fair values for those assets and liabilities measured at fair value on a recurring basisand the level within the fair value hierarchy in which the measurements fall. No transfers among the levels within the fair valuehierarchy occurred during the years ended December 31, 2016 or December 26, 2015.
Fair ValueLevel 2016 2015 Consolidated Balance Sheet
Interest Rate Swaps - Liability 2 $ 3 $ — Accounts payable and other current liabilitiesInterest Rate Swaps - Asset 2 — 2 Prepaid expenses and other current assetsInterest Rate Swaps - Asset 2 47 — Other assetsForeign Currency Contracts - Asset 2 7 — Prepaid expenses and other current assetsForeign Currency Contracts - Asset 2 8 19 Other assetsOther Investments 1 24 21 Other assets
The fair value of the Company’s foreign currency forwards and swaps and interest rate swaps were determined based on the presentvalue of expected future cash flows considering the risks involved, including nonperformance risk, and using discount ratesappropriate for the duration based upon observable inputs. The other investments include investments in mutual funds, whichare used to offset fluctuations in deferred compensation liabilities that employees have chosen to invest in phantom shares of aStock Index Fund or Bond Index Fund. The other investments are classified as trading securities in Other assets in our ConsolidatedBalance Sheet and their fair value is determined based on the closing market prices of the respective mutual funds as of December31, 2016 and December 26, 2015.
Non-Recurring Fair Value Measurements
The following table presents expense recognized from all non-recurring fair value measurements during the years ended December31, 2016 and December 26, 2015. These amounts exclude fair value measurements made for assets that were subsequently disposedof prior to those respective year-end dates. The remaining net book value of restaurant assets measured at fair value during theyears ended December 31, 2016 and December 26, 2015 is insignificant.
2016 2015Aircraft impairment(a) $ 3 $ —Restaurant-level impairment(b) 8 10Total $ 11 $ 10
(a) During 2016, we made the decision to dispose of a corporate aircraft. The loss associated with this planned sale reflectsthe shortfall of the expected proceeds, less any selling costs, over the carrying value of the aircraft. The expected proceedsare based on actual bids received from potential buyers for similar assets (Level 2).
(b) Restaurant-level impairment charges are recorded in Closures and impairment (income) expenses and resulted primarilyfrom our semi-annual impairment evaluation of long-lived assets of individual restaurants that were being operated atthe time of impairment and had not been offered for refranchising. The fair value measurements used in these impairmentevaluations were based on discounted cash flow estimates using unobservable inputs (Level 3).
77

Note 15 – Pension, Retiree Medical and Retiree Savings Plans
U.S. Pension Plans
We sponsor qualified and supplemental (non-qualified) noncontributory defined benefit plans covering certain full-time salariedand hourly U.S. employees. The qualified plan meets the requirements of certain sections of the Internal Revenue Code and providesbenefits to a broad group of employees with restrictions on discriminating in favor of highly compensated employees with regardto coverage, benefits and contributions. The supplemental plans provide additional benefits to certain employees. We fund oursupplemental plans as benefits are paid.
The most significant of our U.S. plans is the YUM Retirement Plan (the “Plan”), which is a qualified plan. Our funding policywith respect to the Plan is to contribute amounts necessary to satisfy minimum pension funding requirements, including requirementsof the Pension Protection Act of 2006, plus additional amounts from time-to-time as are determined to be necessary to improvethe Plan’s funded status. We do not expect to make any significant contributions to the Plan in 2017. Our two significant U.S.plans were previously amended such that any salaried employee hired or rehired by YUM after September 30, 2001 is not eligibleto participate in those plans.
During the fourth quarter of 2016, the Company allowed certain former employees with deferred vested balances in the Plan anopportunity to voluntarily elect an early payout of their benefits. See Note 5 for details.
We do not anticipate any plan assets being returned to the Company during 2017 for any U.S. plans.
Obligation and Funded Status at Measurement Date:
The following chart summarizes the balance sheet impact, as well as benefit obligations, assets, and funded status associated withour two significant U.S. pension plans. The actuarial valuations for all plans reflect measurement dates coinciding with our fiscalyear end.
78

2016 2015Change in benefit obligation
Benefit obligation at beginning of year $ 1,134 $ 1,301Service cost 17 18Interest cost 54 55Plan amendments 4 28Curtailments (4) (2)Special termination benefits 3 1Benefits paid (26) (50)Settlement payments(a) (260) (16)Actuarial (gain) loss 77 (196)Administrative expense (6) (5)
Benefit obligation at end of year $ 993 $ 1,134
Change in plan assets
Fair value of plan assets at beginning of year $ 1,004 $ 991Actual return on plan assets 87 (10)Employer contributions 38 94Settlement payments(a) (260) (16)Benefits paid (26) (50)Administrative expenses (6) (5)
Fair value of plan assets at end of year $ 837 $ 1,004
Funded status at end of year $ (156) $ (130)
(a) For discussion of the settlement payments and settlement losses, see Note 5.
Amounts recognized in the Consolidated Balance Sheet:2016 2015
Accrued benefit liability - current $ (16) $ (13)Accrued benefit liability - non-current (140) (117)
$ (156) $ (130)
The accumulated benefit obligation was $960 million and $1,088 million at December 31, 2016 and December 26, 2015,respectively.
Information for pension plans with an accumulated benefit obligation in excess of plan assets:2016 2015
Projected benefit obligation $ 993 $ 101Accumulated benefit obligation 960 88Fair value of plan assets 837 —
79
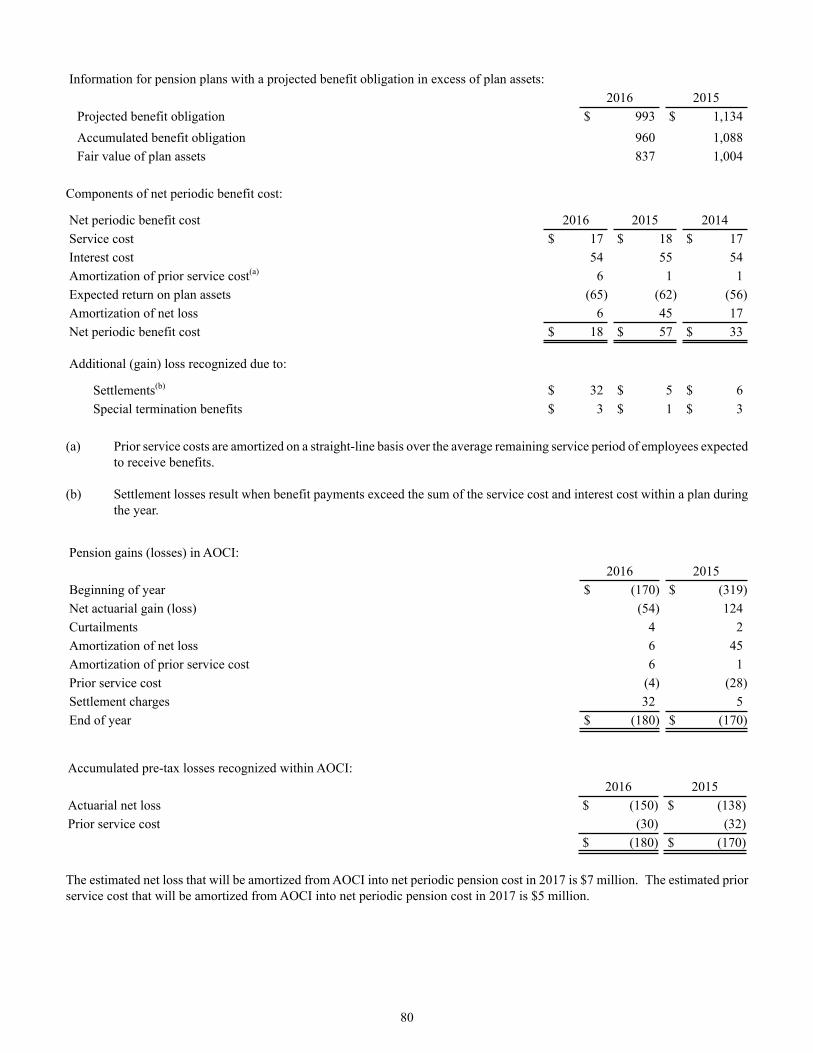
Information for pension plans with a projected benefit obligation in excess of plan assets:2016 2015
Projected benefit obligation $ 993 $ 1,134Accumulated benefit obligation 960 1,088Fair value of plan assets 837 1,004
Components of net periodic benefit cost:
Net periodic benefit cost 2016 2015 2014Service cost $ 17 $ 18 $ 17Interest cost 54 55 54Amortization of prior service cost(a) 6 1 1Expected return on plan assets (65) (62) (56)Amortization of net loss 6 45 17Net periodic benefit cost $ 18 $ 57 $ 33
Additional (gain) loss recognized due to:
Settlements(b) $ 32 $ 5 $ 6Special termination benefits $ 3 $ 1 $ 3
(a) Prior service costs are amortized on a straight-line basis over the average remaining service period of employees expectedto receive benefits.
(b) Settlement losses result when benefit payments exceed the sum of the service cost and interest cost within a plan duringthe year.
Pension gains (losses) in AOCI:2016 2015
Beginning of year $ (170) $ (319)Net actuarial gain (loss) (54) 124Curtailments 4 2Amortization of net loss 6 45Amortization of prior service cost 6 1Prior service cost (4) (28)Settlement charges 32 5End of year $ (180) $ (170)
Accumulated pre-tax losses recognized within AOCI:2016 2015
Actuarial net loss $ (150) $ (138)Prior service cost (30) (32)
$ (180) $ (170)
The estimated net loss that will be amortized from AOCI into net periodic pension cost in 2017 is $7 million. The estimated priorservice cost that will be amortized from AOCI into net periodic pension cost in 2017 is $5 million.
80

Weighted-average assumptions used to determine benefit obligations at the measurement dates:2016 2015
Discount rate 4.60% 4.90%Rate of compensation increase 3.75% 3.75%
Weighted-average assumptions used to determine the net periodic benefit cost for fiscal years:2016 2015 2014
Discount rate 4.90% 4.30% 5.40%Long-term rate of return on plan assets 6.75% 6.75% 6.90%Rate of compensation increase 3.75% 3.75% 3.75%
Our estimated long-term rate of return on plan assets represents the weighted-average of expected future returns on the assetcategories included in our target investment allocation based primarily on the historical returns for each asset category.
Plan Assets
The fair values of our pension plan assets at December 31, 2016 and December 26, 2015 by asset category and level within thefair value hierarchy are as follows:
2016 2015Level 1:
Cash $ 2 $ 3Cash Equivalents(a) 12 9Fixed Income Securities - U.S. Corporate(b) 172 221Equity Securities – U.S. Large cap(b) 244 310Equity Securities – U.S. Mid cap(b) 41 50Equity Securities – U.S. Small cap(b) 43 51Equity Securities – Non-U.S.(b) 83 100
Level 2:
Fixed Income Securities – U.S. Corporate(c) 76 68Fixed Income Securities – U.S. Government and Government Agencies(d) 152 195Fixed Income Securities – Other(d) 31 17Total fair value of plan assets(e) $ 856 $ 1,024
(a) Short-term investments in money market funds.
(b) Securities held in common trusts.
(c) Investments held directly by the Plan.
(d) Includes securities held in common trusts and investments held directly by the Plan.
(e) 2016 and 2015 exclude net unsettled trade payables of $19 million and $20 million, respectively.
Our primary objectives regarding the investment strategy for the Plan’s assets are to reduce interest rate and market risk and toprovide adequate liquidity to meet immediate and future payment requirements. To achieve these objectives, we are using acombination of active and passive investment strategies. The Plan's equity securities, currently targeted to be 50% of our investmentmix, consist primarily of low-cost index funds focused on achieving long-term capital appreciation. The Plan diversifies its equityrisk by investing in several different U.S. and foreign market index funds. Investing in these index funds provides the Plan withthe adequate liquidity required to fund benefit payments and plan expenses. The fixed income asset allocation, currently targeted
81

to be 50% of our mix, is actively managed and consists of long-duration fixed income securities that help to reduce exposure tointerest rate variation and to better correlate asset maturities with obligations. The fair values of all pension plan assets aredetermined based on closing market prices or net asset values.
A mutual fund held as an investment by the Plan includes shares of YUM Common Stock valued at $0.3 million and $0.5 millionat December 31, 2016 and December 26, 2015, respectively, (less than 1% of total plan assets in each instance).
Benefit Payments
The benefits expected to be paid in each of the next five years and in the aggregate for the five years thereafter are set forth below:
Year ended:2017 $ 1282018 452019 422020 432021 462022 - 2026 259
Expected benefits are estimated based on the same assumptions used to measure our benefit obligation on the measurement dateand include benefits attributable to estimated future employee service.
International Pension Plans
We also sponsor various defined benefit plans covering certain of our non-U.S. employees, the most significant of which are inthe UK. Both of our UK plans have previously been frozen such that existing participants can no longer earn future service credits.
At the end of 2016 and 2015, the projected benefit obligations of these UK plans totaled $261 million and $233 million, respectivelyand plan assets totaled $305 million and $291 million, respectively. These plans were both in a net overfunded position at the endof 2016 and 2015 and related expense amounts recorded in each of 2016, 2015 and 2014 were not significant.
The funding rules for our pension plans outside of the U.S. vary from country to country and depend on many factors includingdiscount rates, performance of plan assets, local laws and regulations. We do not plan to make significant contributions to eitherof our UK plans in 2017.
Retiree Medical Benefits
Our post-retirement plan provides health care benefits, principally to U.S. salaried retirees and their dependents, and includesretiree cost-sharing provisions. This plan was previously amended such that any salaried employee hired or rehired by YUM afterSeptember 30, 2001 is not eligible to participate in this plan. Employees hired prior to September 30, 2001 are eligible for benefitsif they meet age and service requirements and qualify for retirement benefits. We fund our post-retirement plan as benefits arepaid.
At the end of 2016 and 2015, the accumulated post-retirement benefit obligation was $55 million and $59 million,respectively. Actuarial gains of $10 million and $8 million were recognized in AOCI at the end of 2016 and 2015, respectively.The net periodic benefit cost recorded was $3 million in both 2016 and 2015 and $5 million in 2014, the majority of which isinterest cost on the accumulated post-retirement benefit obligation. The weighted-average assumptions used to determine benefitobligations and net periodic benefit cost for the post-retirement medical plan are identical to those as shown for the U.S. pensionplans. Our assumed heath care cost trend rates for the following year as of 2016 and 2015 are 6.6% and 6.8%, respectively, withexpected ultimate trend rates of 4.5% reached in 2038.
There is a cap on our medical liability for certain retirees. The cap for Medicare-eligible retirees was reached in 2000 and the capfor non-Medicare eligible retirees was reached in 2014; with the cap, our annual cost per retiree will not increase. A one-percentage-point increase or decrease in assumed health care cost trend rates would have less than a $4 million impact on total service and
82

interest cost and on the post-retirement benefit obligation. The benefits expected to be paid in each of the next five years areapproximately $5 million and in aggregate for the five years thereafter are $19 million.
Retiree Savings Plan
We sponsor a contributory plan to provide retirement benefits under the provisions of Section 401(k) of the Internal Revenue Code(the “401(k) Plan”) for eligible U.S. salaried and hourly employees. Participants are able to elect to contribute up to 75% of eligiblecompensation on a pre-tax basis. Participants may allocate their contributions to one or any combination of multiple investmentoptions or a self-managed account within the 401(k) Plan. We match 100% of the participant’s contribution to the 401(k) Plan upto 6% of eligible compensation. We recognized as compensation expense our total matching contribution of $14 million in 2016,$13 million in 2015 and $12 million in 2014.
83
Note 16 – Share-based and Deferred Compensation Plans
Overview
At year end 2015, we had four stock award plans in effect: the YUM! Brands, Inc. Long-Term Incentive Plan (the “LTIP”), the1997 Long-Term Incentive Plan, the YUM! Brands, Inc. Restaurant General Manager Stock Option Plan and the YUM! Brands,Inc. SharePower Plan. In May 2016, concurrent with Shareholder approval to increase the authorized shares available for issuanceunder the LTIP, we cancelled authorized but unissued awards under the other three plans and will only issue new awards underthe LTIP. Outstanding awards under the other plans will continue to be governed by their original award terms and will be issuedunder the LTIP. Under all our award terms, the exercise price of stock options and SARs granted must be equal to or greater thanthe average market price or the ending market price of the Company’s stock on the date of grant.
Potential awards to employees and non-employee directors under the LTIP includes stock options, incentive stock options, SARs,restricted stock, restricted stock units (“RSUs”), performance restricted stock units, performance share units (“PSUs”) andperformance units. We have issued only stock options, SARs, RSUs and PSUs under the LTIP. While awards under the LTIP canhave varying vesting provisions and exercise periods, outstanding awards under the LTIP vest in periods ranging from immediateto five years. Stock options and SARs expire ten years after grant.
At year end 2016, approximately 27 million shares were available for future share-based compensation grants under the LTIP.
Our EID Plan allows participants to defer receipt of a portion of their annual salary and all or a portion of their incentivecompensation. As defined by the EID Plan, we credit the amounts deferred with earnings based on the investment options selectedby the participants. These investment options are limited to cash, phantom shares of our Common Stock, phantom shares of aStock Index Fund and phantom shares of a Bond Index Fund. Investments in cash and phantom shares of both index funds willbe distributed in cash at a date as elected by the employee and therefore are classified as a liability on our Consolidated BalanceSheets. We recognize compensation expense for the appreciation or the depreciation, if any, of investments in cash and both ofthe index funds. Deferrals into the phantom shares of our Common Stock will be distributed in shares of our Common Stock,under the LTIP, at a date as elected by the employee and therefore are classified in Common Stock on our Consolidated BalanceSheets. We do not recognize compensation expense for the appreciation or the depreciation, if any, of investments in phantomshares of our Common Stock. Our EID plan also allows certain participants to defer incentive compensation to purchase phantomshares of our Common Stock and receive a 33% Company match on the amount deferred. Deferrals receiving a match are similarto a RSU award in that participants will generally forfeit both the match and incentive compensation amounts deferred if theyvoluntarily separate from employment during a vesting period that is two years from the date of deferral. We expense the intrinsicvalue of the match and the incentive compensation over the requisite service period which includes the vesting period.
Historically, the Company has repurchased shares on the open market in excess of the amount necessary to satisfy award exercisesand expects to continue to do so in 2017.
In connection with the Separation of our China business, under the provisions of our LTIP, employee stock options, SARs, RSUsand PSUs were adjusted to maintain the pre-spin intrinsic value of the awards. Depending on the tax laws of the country ofemployment, awards were modified using either the shareholder method or the employer method. Share issuances for Yum Chinaawards held by YUM employees will be satisfied by Yum China. Share issuances for YUM awards held by Yum China employeeswill be satisfied by YUM. Share-based compensation for YUM employees is based on both YUM and Yum China awards heldby those employees.
The shareholder method was based on the premise that employees holding YUM awards prior to the Separation should receivean equal number of awards of both YUM and Yum China. For stock options and SARs, exercise prices of these post-Separation

YUM and Yum China awards were established that, on a combined basis, maintained the intrinsic value on the YUM award priorto the Separation. The exercise prices provided for an initial intrinsic value in each of the post-Separation YUM and YUM Chinaawards that was proportionate to the market value of the two companies on November 1, 2016. For RSUs and PSUs modifiedunder the shareholder method, each YUM award was modified into one YUM award and one Yum China award.
Under the employer method, employees holding YUM awards prior to the Separation had their awards converted into awards ofthe company that they worked for subsequent to the Separation. For stock options and SARs modified under the employer method,the exercise prices of the awards were modified to maintain the pre-Separation intrinsic value of the awards in relation to the post-Separation stock price of the applicable company. For RSUs and PSUs modified under the employer method, the number ofawards was modified to maintain the pre-Separation intrinsic value of the awards in relation to the post-Separation stock price ofthe applicable company.
As a result of the modifications made to outstanding awards under our shared-based and deferred compensation plans as describedabove, the total number of YUM stock option and SAR awards decreased by approximately 1.3 million shares. The total numberof YUM RSU and PSU awards did not change significantly. The modifications to the outstanding equity awards resulted in aninsignificant amount of additional compensation expense.
Investments in phantom shares of our Common Stock held within our EID Plan by employees that remained with YUM post-Separation that were converted into phantom investments in Yum China will now be allowed to be transferred into cash, phantomshares of a Stock Index Fund and phantom shares of a Bond Index Fund within the EID Plan. As such, distributions of currentinvestments in phantom shares of Yum China may now be paid in cash at a date as elected by the employee and therefore areclassified as a liability on our Consolidated Balance Sheets. At the Separation date and subsequent to the spinoff through December31, 2016, we recorded G&A expense related to the cumulative mark-to-market value of these awards in excess of previouslyrecorded fair value charges totaling $28 million. Awards that are remaining in the Yum China investment option when they aredue for distribution will be paid out in shares of Yum China stock.
Award Valuation
We estimated the fair value of each stock option and SAR award as of the date of grant using the Black-Scholes option-pricingmodel with the following weighted-average assumptions:
2016 2015 2014Risk-free interest rate 1.4% 1.3% 1.6%Expected term (years) 6.4 years 6.4 years 6.2 yearsExpected volatility 27.0% 26.9% 29.7%Expected dividend yield 2.6% 2.2% 2.1%
The above table does not reflect valuations performed in connection with modifications to awards made in connection with theSeparation. All option and SAR awards granted during 2016 occurred prior to the Separation.
We believe it is appropriate to group our stock option and SAR awards into two homogeneous groups when estimating expectedterm. These groups consist of grants made primarily to restaurant-level employees, which cliff-vest after 4 years and expire 10years after grant, and grants made to executives, which typically have a graded vesting schedule of 25% per year over 4 years andexpire 10 years after grant. We use a single weighted-average term for our awards that have a graded vesting schedule. Basedon analysis of our historical exercise and post-vesting termination behavior, we have determined that our restaurant-level employeesand our executives exercised the awards on average after 4.75 years and 6.5 years, respectively.
When determining expected volatility, we consider both historical volatility of our stock as well as implied volatility associatedwith our publicly traded options. The expected dividend yield is based on the annual dividend yield at the time of grant.
The fair values of RSU awards are based on the closing price of our Common Stock on the date of grant. The fair values of PSUawards with market-based conditions have been valued based on the outcome of a Monte Carlo simulation.
84

Award Activity
Stock Options and SARs
Shares(in thousands)
Weighted-AverageExercisePrice(a)
Weighted- AverageRemaining
Contractual Term(years)(a)
AggregateIntrinsic Value(in millions)
Outstanding at the beginning of the year 25,933 $ 51.79Granted 4,329 70.64Exercised (5,886) 40.84Forfeited or expired (1,101) 70.66Outstanding at October 31, 2016 23,275 57.20Equitable adjustment (1,283) (b)
Exercised (631) 24.66Forfeited or expired (119) 52.13Outstanding at the end of the year 21,242 (c) $ 40.78 5.63 $ 479Exercisable at the end of the year 13,710 $ 35.37 4.21 $ 383
(a) Activity and amounts that occurred after October 31, 2016 reflect modifications related to the Separation.
(b) Adjustment to maintain intrinsic value upon Separation.
(c) Outstanding awards include 1,341 options and 19,901 SARs with weighted average exercise prices of $33.33 and$41.28, respectively. Outstanding awards represent YUM awards held by employees of both YUM and Yum China.
The weighted-average grant-date fair value of stock options and SARs granted during 2016, 2015 and 2014 was $14.40, $15.95and $17.28, respectively. The total intrinsic value of stock options and SARs exercised during the years ended December 31,2016, December 26, 2015 and December 27, 2014, was $263 million, $153 million and $141 million, respectively.
As of December 31, 2016, $61 million of unrecognized compensation cost related to unvested stock options and SARs, whichwill be reduced by any forfeitures that occur, is expected to be recognized over a remaining weighted-average period ofapproximately 1.8 years. This reflects unrecognized cost for both YUM and Yum China awards held by YUM employees. Thetotal fair value at grant date of awards that vested during 2016, 2015 and 2014 was $41 million, $42 million and $34 million,respectively.
RSUs and PSUs
As of December 31, 2016, there was $21 million of unrecognized compensation cost related to 0.9 million unvested RSUs andPSUs.
Impact on Net Income
The components of share-based compensation expense and the related income tax benefits are shown in the following table:
2016 2015 2014Options and SARs $ 38 $ 41 $ 39Restricted Stock Units 38 3 5Performance Share Units 4 2 1Total Share-based Compensation Expense $ 80 (a) $ 46 $ 45Deferred Tax Benefit recognized $ 26 $ 15 $ 14
EID compensation expense not share-based $ 5 $ 1 $ 8
85

(a) Includes $30 million due to modifications of awards in connection with the Separation that was not allocated to any ofour operating segments for performance purposes. See Note 5.
Cash received from stock option exercises for 2016, 2015 and 2014, was $5 million, $12 million and $29 million, respectively. Taxbenefits realized on our tax returns from tax deductions associated with share-based compensation for 2016, 2015 and 2014 totaled$109 million, $62 million and $58 million, respectively.
86
Note 17 – Shareholders’ Equity
Under the authority of our Board of Directors, we repurchased shares of our Common Stock during 2016, 2015 and 2014. Allamounts exclude applicable transaction fees.
Shares Repurchased(thousands)
Dollar Value of SharesRepurchased
Authorization Date 2016 2015 2014 2016 2015 2014November 2016 1,337 — — $ 85 $ — $ —May 2016 50,435 — — 4,200 — —March 2016 2,823 — — 229 — —December 2015 13,368 932 — 933 67 —November 2014 — 13,231 — — 1,000 —November 2013 — 1,779 8,488 — 133 617November 2012 — — 2,737 — — 203
Total 67,963 (a) 15,942 11,225 $ 5,447 (a) $ 1,200 $ 820
(a) Includes the effect of $45 million in share repurchases (0.7 million shares) with trade dates prior to December 31, 2016but settlement dates subsequent to December 31, 2016.
On November 17, 2016, our Board of Directors authorized share repurchases through December 2017 of up to $2.0 billion(excluding applicable transaction fees). On December 31, 2016 we have remaining capacity to repurchase up to $1.9 billion ofour Common Stock under this authorization.

Changes in accumulated other comprehensive income (loss) ("OCI") are presented below.
TranslationAdjustments and
Gains (Losses) FromIntra-Entity
Transactions of aLong-Term Nature(a)
Pension and Post-RetirementBenefits(b)
DerivativeInstruments(c) Total
Balance at December 27, 2014, netof tax $ 29 $ (210) $ (9) $ (190)
Gains (losses) arising duringthe year classified intoaccumulated OCI, net of tax (250) 63 28 (159)
(Gains) losses reclassifiedfrom accumulated OCI, netof tax 112 34 (36) 110
OCI, net of tax (138) 97 (8) (49)
Balance at December 26, 2015, netof tax $ (109) $ (113) $ (17) $ (239)
Gains (losses) arising duringthe year classified intoaccumulated OCI, net of tax (146) (42) 29 (159)
(Gains) losses reclassifiedfrom accumulated OCI, netof tax (11) 28 (5) 12
OCI, net of tax (157) (14) 24 (147)
Separation of China business (47) — — (47)
Balance at December 31,2016, netof tax $ (313) $ (127) $ 7 $ (433)
(a) Amounts reclassified from accumulated OCI during 2016 and 2015 are due to substantial liquidations of foreign entitiesrelated to Pizza Hut Australia and Mexico refranchising transactions, respectively.
(b) Amounts reclassified from accumulated OCI for pension and post-retirement benefit plan losses during 2016 includeamortization of net losses of $7 million, settlement charges of $32 million, amortization of prior service cost of $5 millionand related income tax benefit of $16 million. Amounts reclassified from accumulated OCI for pension and post-retirementbenefit plan losses during 2015 include amortization of net losses of $46 million, settlement charges of $5 million,amortization of prior service cost of $2 million and related income tax benefit of $19 million. See Note 15.
(c) See Note 13 for details on amounts reclassified from accumulated OCI.
87

Note 18 – Income Taxes
U.S. and foreign income before taxes are set forth below:
2016 2015 2014U.S. $ 366 $ 479 $ 506Foreign 952 782 868
$ 1,318 $ 1,261 $ 1,374
The details of our income tax provision (benefit) are set forth below:
2016 2015 2014Current: Federal $ 123 $ 268 $ 239
Foreign 161 131 173State 13 28 2
$ 297 $ 427 414
Deferred: Federal $ 18 $ (117) (34)Foreign 3 15 (13)State 6 — 1
$ 27 $ (102) $ (46)$ 324 $ 325 $ 368
The reconciliation of income taxes calculated at the U.S. federal statutory rate to our effective tax rate is set forth below:
2016 2015 2014U.S. federal statutory rate $ 461 35.0% $ 441 35.0% $ 481 35.0%State income tax, net of federal tax benefit 15 1.1 12 0.9 8 0.6Statutory rate differential attributable to foreignoperations (136) (10.3) (180) (14.3) (147) (10.7)Adjustments to reserves and prior years (11) (0.9) 13 1.0 2 0.1Change in valuation allowances (3) (0.2) 41 3.3 22 1.6Other, net (2) (0.1) (2) (0.1) 2 0.1Effective income tax rate $ 324 24.6% $ 325 25.8% $ 368 26.7%
Statutory rate differential attributable to foreign operations. This item includes local taxes, withholding taxes, and shareholder-level taxes, net of foreign tax credits. The favorable impact is primarily attributable to a majority of our income being earnedoutside of the U.S. where tax rates are generally lower than the U.S. rate.
In 2015, this benefit was positively impacted by the repatriation of current year foreign earnings as we recognized excess foreigntax credits, resulting from the related effective foreign tax rate being higher than the U.S. federal statutory rate.
Adjustments to reserves and prior years. This item includes: (1) changes in tax reserves, including interest thereon, establishedfor potential exposure we may incur if a taxing authority takes a position on a matter contrary to our position; and (2) the effectsof reconciling income tax amounts recorded in our Consolidated Statements of Income to amounts reflected on our tax returns,including any adjustments to the Consolidated Balance Sheets. The impact of certain effects or changes may offset items reflectedin the 'Statutory rate differential attributable to foreign operations' line.
In 2016, this item was favorably impacted by the resolution of uncertain tax positions in the U.S.
In 2014, this item was favorably impacted by the resolution of uncertain tax positions in certain foreign jurisdictions.
88

Change in valuation allowances. This item relates to changes for deferred tax assets generated or utilized during the current yearand changes in our judgment regarding the likelihood of using deferred tax assets that existed at the beginning of the year. Theimpact of certain changes may offset items reflected in the 'Statutory rate differential attributable to foreign operations' line.
In 2016, $3 million of net tax benefit was driven by $14 million in net tax expense for valuation allowances recorded againstdeferred tax assets generated in the current year and $17 million in net tax benefit for valuation allowances resulting from achange in judgment regarding the future use of certain deferred tax assets that existed at the beginning of the year.
In 2015, $41 million of net tax expense was driven by $17 million for valuation allowances recorded against deferred tax assetsgenerated in the current year and $24 million in net tax expense resulting from a change in judgment regarding the future use ofcertain deferred tax assets that existed at the beginning of the year.
In 2014, $22 million of net tax expense was driven by $28 million for valuation allowances recorded against deferred tax assetsgenerated during the current year, partially offset by $6 million in net tax benefit resulting from a change in judgment regardingthe future use of certain deferred tax assets that existed at the beginning of the year.
Other. This item primarily includes the impact of permanent differences related to current year earnings as well as U.S. taxcredits and deductions.
The details of 2016 and 2015 deferred tax assets (liabilities) are set forth below:
2016 2015Operating losses $ 172 $ 157Capital losses 184 41Tax credit carryforwards 284 282Employee benefits 185 152Share-based compensation 100 121Self-insured casualty claims 32 35Lease-related liabilities 65 69Various liabilities 56 64Property, plant and equipment 37 33Deferred income and other 32 51
Gross deferred tax assets 1,147 1,005Deferred tax asset valuation allowances (195) (205)
Net deferred tax assets $ 952 $ 800
Intangible assets, including goodwill $ (107) $ (111)Property, plant and equipment (46) (46)Other (31) (60)
Gross deferred tax liabilities $ (184) $ (217)Net deferred tax assets (liabilities) $ 768 $ 583
Reported in Consolidated Balance Sheets as:Deferred income taxes $ 774 $ 591Other liabilities and deferred credits (6) (8)
$ 768 $ 583We have investments in foreign subsidiaries where the carrying values for financial reporting exceed the tax basis. We have notprovided deferred tax on the portion of the excess that we believe is indefinitely reinvested, as we have the ability and intent toindefinitely postpone these basis differences from reversing with a tax consequence. We estimate that our total temporarydifference upon which we have not provided deferred tax is approximately $2.1 billion at December 31, 2016. A determinationof the deferred tax liability on this amount is not practicable.
89

At December 31, 2016, the Company has foreign operating and capital loss carryforwards of $0.5 billion and U.S. state operatingloss, capital loss and tax credit carryforwards of $1.0 billion and U.S. federal capital loss and tax credit carryforwards of $0.7billion. These losses are being carried forward in jurisdictions where we are permitted to use tax losses from prior periods toreduce future taxable income and will expire as follows:
Year of Expiration
2017 2018-2021 2022-2035 Indefinitely TotalForeign $ 20 $ 53 $ 93 $ 321 $ 487U.S. state 7 97 908 — 1,012U.S. federal — 524 220 — 744
$ 27 $ 674 $ 1,221 $ 321 $ 2,243
We recognize the benefit of positions taken or expected to be taken in tax returns in the financial statements when it is more likelythan not that the position would be sustained upon examination by tax authorities. A recognized tax position is measured at thelargest amount of benefit that is greater than fifty percent likely of being realized upon settlement.
The Company had $91 million and $98 million of unrecognized tax benefits at December 31, 2016 and December 26, 2015,respectively, $87 million and $89 million of which are temporary in nature and if recognized, would not impact the effectiveincome tax rate. A reconciliation of the beginning and ending amount of unrecognized tax benefits follows:
2016 2015Beginning of Year $ 98 $ 115 Additions on tax positions - current year — — Additions for tax positions - prior years 1 5 Reductions for tax positions - prior years (5) (13) Reductions for settlements (1) (7) Reductions due to statute expiration (2) (2) Foreign currency translation adjustment — —End of Year $ 91 $ 98
The Company believes its unrecognized tax benefits will not materially increase or decrease in the next 12 months.
The Company’s income tax returns are subject to examination in the U.S. federal jurisdiction and numerous U.S. state and foreignjurisdictions.
The Company has settled audits with the IRS through fiscal year 2010. Our operations in certain foreign jurisdictions remainsubject to examination for tax years as far back as 2006, some of which years are currently under audit by local tax authorities.
The accrued interest and penalties related to income taxes at December 31, 2016 and December 26, 2015 are set forth below:
2016 2015Accrued interest and penalties $ 9 $ 15
During 2016, 2015 and 2014, a net benefit of $4 million, and net expense of $5 million and $11 million, respectively, for interestand penalties was recognized in our Consolidated Statements of Income as components of its Income tax provision.
In October 2016, the Company completed the separation of its China business into an independent publicly-traded company. Thetransaction has been treated as qualifying as a tax-free reorganization for U.S. income tax purposes. In addition, the Companyconsidered the China indirect income tax on indirect transfers of assets by nonresident enterprises and concluded that it does notapply to the separation transaction.
90

Note 19 – Reportable Operating Segments
See Note 1 for a description of our operating segments.
Revenues2016 2015 2014
KFC Division(a) $ 3,232 $ 3,235 $ 3,507Pizza Hut Division(a) 1,111 1,214 1,215Taco Bell Division(a) 2,025 1,991 1,865Unallocated(b)(f) (2) — —
$ 6,366 $ 6,440 $ 6,587
Operating Profit; Interest Expense, Net;and
Income Before Income Taxes2016 2015 2014
KFC Division $ 874 $ 832 $ 876Pizza Hut Division 370 347 347Taco Bell Division 593 536 478Unallocated Franchise and license fees and income(b)(f) (2) — —Unallocated restaurant costs(b) — — (1)Unallocated Franchise and license expenses(b)(f) (24) (71) —Unallocated and corporate expenses(b)(g) (316) (196) (189)Unallocated Refranchising gain (loss)(b) 141 (23) 16Unallocated Other income (expense)(b)(h) (11) (23) (10)Operating Profit 1,625 1,402 1,517Interest expense, net(b) (307) (141) (143)Income Before Income Taxes $ 1,318 $ 1,261 $ 1,374
Depreciation and Amortization2016 2015 2014
KFC Division $ 173 $ 186 197Pizza Hut Division 36 40 39Taco Bell Division 91 88 83Corporate 9 8 9
$ 309 $ 322 $ 328
Capital Spending2016 2015 2014
KFC Division $ 211 $ 280 $ 294Pizza Hut Division 70 54 62Taco Bell Division 132 116 143Corporate 9 11 9
$ 422 $ 461 $ 508
91
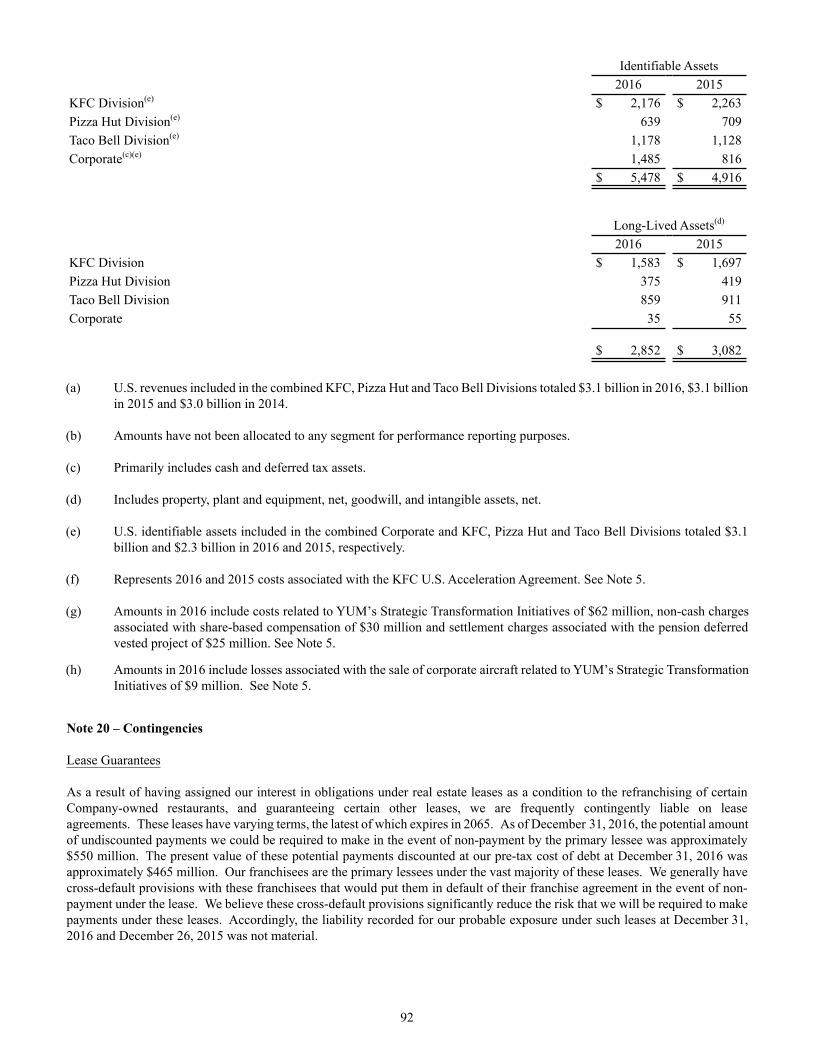
Identifiable Assets2016 2015
KFC Division(e) $ 2,176 $ 2,263Pizza Hut Division(e) 639 709Taco Bell Division(e) 1,178 1,128Corporate(c)(e) 1,485 816
$ 5,478 $ 4,916
Long-Lived Assets(d)
2016 2015KFC Division $ 1,583 $ 1,697Pizza Hut Division 375 419Taco Bell Division 859 911Corporate 35 55
$ 2,852 $ 3,082
(a) U.S. revenues included in the combined KFC, Pizza Hut and Taco Bell Divisions totaled $3.1 billion in 2016, $3.1 billionin 2015 and $3.0 billion in 2014.
(b) Amounts have not been allocated to any segment for performance reporting purposes.
(c) Primarily includes cash and deferred tax assets.
(d) Includes property, plant and equipment, net, goodwill, and intangible assets, net.
(e) U.S. identifiable assets included in the combined Corporate and KFC, Pizza Hut and Taco Bell Divisions totaled $3.1billion and $2.3 billion in 2016 and 2015, respectively.
(f) Represents 2016 and 2015 costs associated with the KFC U.S. Acceleration Agreement. See Note 5.
(g) Amounts in 2016 include costs related to YUM’s Strategic Transformation Initiatives of $62 million, non-cash chargesassociated with share-based compensation of $30 million and settlement charges associated with the pension deferredvested project of $25 million. See Note 5.
(h) Amounts in 2016 include losses associated with the sale of corporate aircraft related to YUM’s Strategic TransformationInitiatives of $9 million. See Note 5.
92
Note 20 – Contingencies
Lease Guarantees
As a result of having assigned our interest in obligations under real estate leases as a condition to the refranchising of certainCompany-owned restaurants, and guaranteeing certain other leases, we are frequently contingently liable on leaseagreements. These leases have varying terms, the latest of which expires in 2065. As of December 31, 2016, the potential amountof undiscounted payments we could be required to make in the event of non-payment by the primary lessee was approximately$550 million. The present value of these potential payments discounted at our pre-tax cost of debt at December 31, 2016 wasapproximately $465 million. Our franchisees are the primary lessees under the vast majority of these leases. We generally havecross-default provisions with these franchisees that would put them in default of their franchise agreement in the event of non-payment under the lease. We believe these cross-default provisions significantly reduce the risk that we will be required to makepayments under these leases. Accordingly, the liability recorded for our probable exposure under such leases at December 31,2016 and December 26, 2015 was not material.

Franchise Loan Pool and Equipment Guarantees
We have agreed to provide financial support, if required, to a variable interest entity that operates a franchisee lending programused primarily to assist franchisees in the development of new restaurants or the upgrade of existing restaurants and, to a lesserextent, in connection with the Company’s refranchising programs in the U.S. We have determined that we are not required toconsolidate this entity as we share the power to direct this entity’s lending activity with other parties. We have provided guaranteesof 20% of the outstanding loans of the franchisee loan program. As such, at December 31, 2016 our guarantee exposure underthis program is approximately $4 million based on total loans outstanding of $21 million.
In addition to the guarantees described above, YUM has agreed to provide guarantees of up to approximately $110 million onbehalf of franchisees for several financing programs related to specific initiatives, primarily equipment purchases. At December 31,2016, our guarantee exposure under these financing programs is approximately $6 million based on total loans outstanding of $10million.
Insurance Programs
We are self-insured for a substantial portion of our current and prior years’ coverage including property and casualty losses. Tomitigate the cost of our exposures for certain property and casualty losses, we self-insure the risks of loss up to defined maximumper occurrence retentions on a line-by-line basis. The Company then purchases insurance coverage, up to a certain limit, for lossesthat exceed the self-insurance per occurrence retention. The insurers’ maximum aggregate loss limits are significantly above ouractuarially determined probable losses; therefore, we believe the likelihood of losses exceeding the insurers’ maximum aggregateloss limits is remote.
The following table summarizes the 2016 and 2015 activity related to our net self-insured property and casualty reserves as ofDecember 31, 2016.
BeginningBalance Expense Payments
EndingBalance
2016 Activity $ 102 42 (46) $ 982015 Activity $ 116 39 (53) $ 102
Due to the inherent volatility of actuarially determined property and casualty loss estimates, it is reasonably possible that we couldexperience changes in estimated losses which could be material to our growth in quarterly and annual Net Income. We believethat we have recorded reserves for property and casualty losses at a level which has substantially mitigated the potential negativeimpact of adverse developments and/or volatility.
In the U.S. and in certain other countries, we are also self-insured for healthcare claims and long-term disability for eligibleparticipating employees subject to certain deductibles and limitations. We have accounted for our retained liabilities for propertyand casualty losses, healthcare and long-term disability claims, including reported and incurred but not reported claims, based oninformation provided by independent actuaries.
Legal Proceedings
We are subject to various claims and contingencies related to lawsuits, real estate, environmental and other matters arising in thenormal course of business. An accrual is recorded with respect to claims or contingencies for which a loss is determined to beprobable and reasonably estimable.
The Company and Taco Bell were named as defendants in a number of putative class action suits filed in 2007, 2008, 2009 and2010 alleging violations of California labor laws including unpaid overtime, failure to timely pay wages on termination, failureto pay accrued vacation wages, failure to pay minimum wage, denial of meal and rest breaks, improper wage statements, unpaidbusiness expenses, wrongful termination, discrimination, conversion and unfair or unlawful business practices in violation ofCalifornia Business & Professions Code §17200. Some plaintiffs also sought penalties for alleged violations of California’s LaborCode under California’s Private Attorneys General Act (“PAGA”) as well as statutory “waiting time” penalties and alleged violationsof California’s Unfair Business Practices Act. Plaintiffs sought to represent a California state-wide class of hourly employees.
These matters were consolidated, and the consolidated case is styled In Re Taco Bell Wage and Hour Actions. The In Re TacoBell Wage and Hour Actions plaintiffs filed a consolidated complaint in June 2009, and in March 2010 the court approved the
93

parties’ stipulation to dismiss the Company from the action, leaving Taco Bell as the sole defendant. Plaintiffs filed their motionfor class certification on the vacation and final pay claims in December 2010, and on September 26, 2011, the court issued itsorder denying the certification of the vacation and final pay claims. Plaintiffs then sought to certify four separate meal and restbreak classes. On January 2, 2013, the court rejected three of the proposed classes but granted certification with respect to thelate meal break class. The parties thereafter agreed on a list of putative class members, and the class notice and opt out formswere mailed on January 21, 2014.
Per order of the court, plaintiffs filed a second amended complaint to clarify the class claims. Plaintiffs also filed a motion forpartial summary judgment. Taco Bell filed motions to strike and to dismiss, as well as a motion to alter or amend the secondamended complaint. On August 29, 2014, the court denied plaintiffs’ motion for partial summary judgment. On that same date,the court granted Taco Bell’s motion to dismiss all but one of the PAGA claims. On October 29, 2014, plaintiffs filed a motionto amend the operative complaint and a motion to amend the class certification order. On December 16, 2014, the court partiallygranted both motions, rejecting plaintiffs’ proposed on-duty meal period class but certifying a limited rest break class and certifyingan underpaid meal premium class, and allowing the plaintiffs to amend the complaint to reflect those certifications. On December30, 2014, plaintiffs filed the third amended complaint. On February 26, 2015, the court denied a motion by Taco Bell to dismissor strike the underpaid meal premium class.
Beginning on February 22, 2016, the late meal period class claim, the limited rest break class claim, the underpaid meal premiumclass claim, and the associated statutory “waiting time” penalty claim was tried to a jury. On March 9, 2016, the jury returnedverdicts in favor of Taco Bell on the late meal period claim, the limited rest break claim, and the statutory “waiting time” penaltyclaim. The jury found for the plaintiffs on the underpaid meal premium class claim, awarding approximately $0.5 million. Abench trial was subsequently conducted with respect to the PAGA claims and plaintiffs’ Business & Professions Code §17200claim. On April 8, 2016, the court returned a verdict in favor of Taco Bell on the PAGA claims and the §17200 claim. In a separateruling issued the same day, the court also ruled that plaintiffs were entitled to prejudgment interest on the underpaid meal premiumclass claim, awarding approximately $0.3 million. Taco Bell denies liability as to the underpaid meal premium class claim andfiled a post-trial motion to overturn the verdict. Plaintiffs’ also filed various post-trial motions. On July 15, 2016, the court deniedTaco Bell’s motion to overturn the verdict. The court denied Plaintiffs’ motions: (1) for a new trial, (2) for judgment as a matterof law to overturn the verdicts in favor of Taco Bell, (3) challenging the jury instructions and special verdict forms, and (4) tooverturn the court’s rejection of the §17200 claims for meal and rest break violations. The court also denied Plaintiffs’ motionsfor additional costs and for enhanced awards to two of the named Plaintiffs. The court granted Plaintiffs’ motion for judgment onthe §17200 claim regarding the underpaid meal premium claim, but rejected awarding any additional damages, finding that thejury verdict sufficiently compensated the class. The court granted Plaintiffs’ motion for attorneys’ fees, but awarded onlyapproximately $1.1 million of the $7.3 million requested. The court also granted Plaintiffs’ bill of costs, but only awardedapproximately $0.1 million of Plaintiffs’ $0.2 million. Thereafter, both Plaintiffs and Taco Bell timely filed notices of appeal andthe matter is now before the Ninth Circuit. We have provided for a reasonable estimate of the possible loss relating to this lawsuit.However, in view of the inherent uncertainties of litigation, there can be no assurance that this lawsuit will not result in losses inexcess of those currently provided for in our Consolidated Financial Statements.
We are engaged in various other legal proceedings and have certain unresolved claims pending, the ultimate liability for which,if any, cannot be determined at this time. However, based upon consultation with legal counsel, we are of the opinion that suchproceedings and claims are not expected to have a material adverse effect, individually or in the aggregate, on our ConsolidatedFinancial Statements.
94

Note 21 – Selected Quarterly Financial Data (Unaudited)
2016First
QuarterSecondQuarter
ThirdQuarter
FourthQuarter
Total
Revenues:Company sales $ 887 $ 996 $ 993 $ 1,324 $ 4,200Franchise and license fees and income 477 481 508 700 2,166Total revenues 1,364 1,477 1,501 2,024 6,366
Restaurant profit 147 165 159 231 702Operating Profit(a) 356 408 372 489 1,625Income from continuing operations, net of tax 240 265 204 285 994Income (loss) from discontinued operations, netof tax 151 74 418 (18) 625Net Income 391 339 622 267 1,619Basic earnings per common share fromcontinuing operations 0.58 0.65 0.52 0.77 2.52Basic earnings(loss) per common share fromdiscontinued operations 0.36 0.17 1.07 (0.05) 1.59Basic earnings per common share 0.94 0.82 1.59 0.72 4.11Diluted earnings per common share fromcontinuing operations 0.57 0.64 0.51 0.76 2.48Diluted earnings (loss) per common share fromdiscontinued operations 0.36 0.17 1.05 (0.05) 1.56Diluted earnings per common share 0.93 0.81 1.56 0.71 4.04Dividends declared per common share 0.46 0.46 — 0.81 1.73
2015First
QuarterSecondQuarter
ThirdQuarter
FourthQuarter
Total
Revenues:Company sales $ 944 $ 1,051 $ 1,033 $ 1,328 $ 4,356Franchise and license fees and income 467 475 494 648 2,084Total revenues 1,411 1,526 1,527 1,976 6,440
Restaurant profit 149 177 160 223 709Operating Profit(b) 355 279 339 429 1,402Income from continuing operations, net of tax 246 169 231 290 936Income (loss) from discontinued operations, netof tax 116 66 190 (15) 357Net Income 362 235 421 275 1,293Basic earnings per common share fromcontinuing operations 0.56 0.39 0.53 0.67 2.15Basic earnings (loss) per common share fromdiscontinued operations 0.27 0.15 0.44 (0.03) 0.82Basic earnings per common share 0.83 0.54 0.97 0.64 2.97Diluted earnings per common share fromcontinuing operations 0.55 0.38 0.52 0.66 2.11Diluted earnings (loss) per common share fromdiscontinued operations 0.26 0.15 0.43 (0.03) 0.81Diluted earnings per common share 0.81 0.53 0.95 0.63 2.92Dividends declared per common share — 0.82 — 0.92 1.74
95

(a) Includes net gains from refranchising initiatives of $3 million, $53 million, $21 million and $64 million in the first,second, third and fourth quarters, respectively, costs associated with YUM’s Strategic Transformation Initiatives of $5million, $27 million and $39 million in the second, third and fourth quarters, respectively, a non-cash charge associatedwith the modification of EID share-based compensation awards in connection with the Separation of $30 million in thefourth quarter, costs associated with KFC U.S. Acceleration Agreement of $9 million, $8 million and $9 million in thefirst, second and fourth quarters, respectively, and charges incurred as a result of settlement payments of deferred vestedpension balances in the Plan of $1 million and $24 million in the third and fourth quarters, respectively. See Note 5.
(b) Includes net gains from refranchising initiatives of $7 million and $49 million in the first and fourth quarters, respectively,and net losses from refranchising initiatives of $72 million and $4 million in the second and third quarters, respectively.Also includes costs associated with KFC U.S. Acceleration Agreement of $2 million, $8 million, $21 million and $41million in the first, second, third and fourth quarters, respectively. See Note 5.
96
Item 9. Changes In and Disagreements with Accountants on Accounting and Financial Disclosure.
None.
Item 9A. Controls and Procedures.
Evaluation of Disclosure Controls and Procedures
The Company has evaluated the effectiveness of the design and operation of its disclosure controls and procedures pursuant toRules 13a-15(e) and 15d-15(e) under the Securities Exchange Act of 1934 as of the end of the period covered by this report. Basedon the evaluation, performed under the supervision and with the participation of the Company’s management, including the ChiefExecutive Officer (the “CEO”) and the Chief Financial Officer (the “CFO”), the Company’s management, including the CEO andCFO, concluded that the Company’s disclosure controls and procedures were effective as of the end of the period covered by thisreport.
Management’s Report on Internal Control Over Financial Reporting
Our management is responsible for establishing and maintaining adequate internal control over financial reporting, as such termis defined in Rules 13a-15(f) under the Securities Exchange Act of 1934. Under the supervision and with the participation of ourmanagement, including our principal executive officer and principal financial officer, we conducted an evaluation of theeffectiveness of our internal control over financial reporting based on the framework in Internal Control – Integrated Framework(2013) issued by the Committee of Sponsoring Organizations of the Treadway Commission. Based on our evaluation under theframework in Internal Control – Integrated Framework (2013), our management concluded that our internal control over financialreporting was effective as of December 31, 2016.
KPMG LLP, an independent registered public accounting firm, has audited the Consolidated Financial Statements included in thisAnnual Report on Form 10-K and the effectiveness of our internal control over financial reporting and has issued their report,included herein.
Changes in Internal Control
There were no changes with respect to the Company’s internal control over financial reporting or in other factors that materiallyaffected, or are reasonably likely to materially affect, internal control over financial reporting during the quarter ended December 31,2016.
Item 9B. Other Information.
None.

PART III
97
Item 10. Directors, Executive Officers and Corporate Governance.
Information regarding Section 16(a) compliance, the Audit Committee and the Audit Committee financial expert, the Company’scode of ethics and background of the directors appearing under the captions “Stock Ownership Information,” “Governance of theCompany,” “Executive Compensation” and “Item 1: Election of Directors and Director biographies” is incorporated by referencefrom the Company’s definitive proxy statement which will be filed with the Securities and Exchange Commission no later than120 days after December 31, 2016.
Information regarding executive officers of the Company is included in Part I.
Item 11. Executive Compensation.
Information regarding executive and director compensation and the Compensation Committee appearing under the captions“Governance of the Company” and “Executive Compensation” is incorporated by reference from the Company’s definitive proxystatement which will be filed with the Securities and Exchange Commission no later than 120 days after December 31, 2016.
Item 12. Security Ownership of Certain Beneficial Owners and Management and Related StockholderMatters.
Information regarding equity compensation plans and security ownership of certain beneficial owners and management appearingunder the captions “Executive Compensation” and “Stock Ownership Information” is incorporated by reference from theCompany’s definitive proxy statement which will be filed with the Securities and Exchange Commission no later than 120 daysafter December 31, 2016.
Item 13. Certain Relationships and Related Transactions, and Director Independence.
Information regarding certain relationships and related transactions and information regarding director independence appearingunder the caption “Governance of the Company” is incorporated by reference from the Company’s definitive proxy statementwhich will be filed with the Securities and Exchange Commission no later than 120 days after December 31, 2016.
Item 14. Principal Accountant Fees and Services.
Information regarding principal accountant fees and services and audit committee pre-approval policies and procedures appearingunder the caption “Item 2: Ratification of Independent Auditors” is incorporated by reference from the Company’s definitiveproxy statement which will be filed with the Securities and Exchange Commission no later than 120 days after December 31,2016.

PART IV
98
Item 15. Exhibits and Financial Statement Schedules.
(a) (1) Financial Statements: Consolidated Financial Statements filed as part of this report are listed under PartII, Item 8 of this Form 10-K.
(2) Financial Statement Schedules: No schedules are required because either the required information is notpresent or not present in amounts sufficient to require submission of the schedule, or because the informationrequired is included in the Consolidated Financial Statements thereto filed as a part of this Form 10-K.
(3) Exhibits: The exhibits listed in the accompanying Exhibit Index are filed as part of this Form 10-K. TheIndex to Exhibits specifically identifies each management contract or compensatory plan required to befiled as an exhibit to this Form 10-K.
SIGNATURES
Pursuant to the requirements of Section 13 or 15(d) of the Securities Exchange Act of 1934, the registrant has duly caused thisForm 10-K annual report to be signed on its behalf by the undersigned, thereunto duly authorized.
Date: February 21, 2017
YUM! BRANDS, INC.
By: /s/ Greg Creed
99
Pursuant to the requirements of the Securities Exchange Act of 1934, this annual report has been signed below by the followingpersons on behalf of the registrant and in the capacities and on the dates indicated.
Signature Title Date
/s/ Greg Creed Chief Executive Officer February 21, 2017Greg Creed (principal executive officer)
/s/ David Gibbs President and Chief Financial Officer February 21, 2017David Gibbs (principal financial officer)
/s/ David E. RussellSenior Vice President, Finance andCorporate Controller February 21, 2017
David E. Russell (principal accounting officer)
/s/ Paget L. Alves Director February 21, 2017Paget L. Alves
/s/ Michael J. Cavanagh Director February 21, 2017Michael J. Cavanagh
/s/ Brian Cornell Director February 21, 2017Brian Cornell
/s/ David W. Dorman Director February 21, 2017David W. Dorman
/s/ Mirian Graddick-Weir Director February 21, 2017Mirian Graddick-Weir
/s/ Thomas C. Nelson Director February 21, 2017Thomas C. Nelson
/s/ Thomas M. Ryan Director February 21, 2017Thomas M. Ryan
/s/ P. Justin Skala Director February 21, 2017P. Justin Skala
/s/ Elane Stock Director February 21, 2017Elane Stock
/s/ Robert D. Walter Director February 21, 2017Robert D. Walter
100
YUM! Brands, Inc.Exhibit Index
(Item 15)
ExhibitNumber Description of Exhibits
2.1 * Separation and Distribution Agreement, dated as of October 31, 2016, by and among YUM, YumRestaurants Consulting (Shanghai) Company Limited and Yum China Holdings, Inc., which isincorporated herein by reference from Exhibit 2.1 to YUM's Report on Form 8-K filed on November3, 2016.
3.1 Restated Articles of Incorporation of YUM, effective May 26, 2011, which is incorporated hereinby reference from Exhibit 3.1 to YUM's Report on Form 8-K filed on May 31, 2011.
3.2 Amended and restated Bylaws of YUM, effective July 15, 2016, which are incorporated herein byreference from Exhibit 3.1 to YUM's Report on Form 8-K filed on July 19, 2016.
4.1 Indenture, dated as of May 1, 1998, between YUM and The Bank of New York Mellon Trust Company,N.A., successor in interest to The First National Bank of Chicago, which is incorporated herein byreference from Exhibit 4.1 to YUM's Report on Form 8-K filed on May 13, 1998.
(i) 6.25% Senior Notes due March 15, 2018 issued under the foregoing May 1, 1998indenture, which notes are incorporated by reference from Exhibit 4.2 to YUM's Reporton Form 8-K filed on October 22, 2007.
(ii) 6.875% Senior Notes due November 15, 2037 issued under the foregoing May 1, 1998indenture, which notes are incorporated by reference from Exhibit 4.3 to YUM's Reporton Form 8-K filed on October 22, 2007.
(iii) 5.30% Senior Notes due September 15, 2019 issued under the foregoing May 1, 1998indenture, which notes are incorporated by reference from Exhibit 4.1 to YUM's Reporton Form 8-K filed on August 25, 2009.
(iv) 3.875% Senior Notes due November 1, 2020 issued under the foregoing May 1, 1998indenture, which notes are incorporated by reference from Exhibit 4.2 to YUM's Reporton Form 8-K filed on August 31, 2010.
(v) 3.750% Senior Notes due November 1, 2021 issued under the foregoing May 1, 1998indenture, which notes are incorporated by reference from Exhibit 4.2 to YUM's Reporton Form 8-K filed August 29, 2011.
(vi) 3.875% Senior Notes due November 1, 2023 issued under the foregoing May 1, 1998indenture, which notes are incorporated by reference from Exhibit 4.2 to YUM's Reporton Form 8-K filed October 31, 2013.
(vii) 5.350% Senior Notes due November 1, 2043 issued under the foregoing May 1, 1998indenture, which notes are incorporated by reference from Exhibit 4.3 to YUM's Reporton Form 8-K filed October 31, 2013.
101

10.1 Credit Agreement, dated as of June 16, 2016, by and among Pizza Hut Holdings, LLC, KFC HoldingCo., and Taco Bell of America, LLC, as the borrowers, the lenders party thereto, JPMorgan Chase Bank,N.A., as Administrative Agent and Collateral Agent, JPMorgan Chase Bank, N.A., Goldman SachsBank USA, Wells Fargo Securities, LLC, Citigroup Global Markets Inc., Merrill Lynch, Pierce, Fenner& Smith Incorporated, Morgan Stanley Senior Funding, Inc., Fifth Third Bank and The Bank of Tokyo-Mitsubishi UFJ, Ltd., as Joint Lead Arrangers and Joint Bookrunners, Barclays Bank PLC, The Bankof Nova Scotia, Cooperatieve Rabobank U.A., New York Branch, and Industrial and Commercial Bankof China Limited, New York Branch, as Co-Documentation Agents and Co-Managers, which isincorporated herein by reference from Exhibit 4.1 to YUM's Quarterly Report on Form 10-Q for thequarter ended June 11, 2016.
10.2† YUM Director Deferred Compensation Plan, as effective October 7, 1997, which is incorporated hereinby reference from Exhibit 10.7 to YUM's Annual Report on Form 10-K for the fiscal year endedDecember 27, 1997.
10.2.1† YUM Director Deferred Compensation Plan, Plan Document for the 409A Program, as effective January1, 2005, and as Amended through November 14, 2008, which is incorporated by reference from Exhibit10.7.1 to YUM's Quarterly Report on Form 10-Q for the quarter ended June 13, 2009.
10.3† YUM Executive Incentive Compensation Plan, as effective May 20, 2004, and as Amended throughthe Second Amendment, as effective May 21, 2009, which is incorporated herein by reference fromExhibit A of YUM's Definitive Proxy Statement on Form DEF 14A for the Annual Meeting ofShareholders held on May 21, 2009.
10.4† YUM Executive Income Deferral Program, as effective October 7, 1997, and as amended through May16, 2002, which is incorporated herein by reference from Exhibit 10.10 to YUM's Annual Report onForm 10-K for the fiscal year ended December 31, 2005.
10.4.1† YUM! Brands Executive Income Deferral Program, Plan Document for the 409A Program, as effectiveJanuary 1, 2005, and as Amended through June 30, 2009, which is incorporated by reference fromExhibit 10.10.1 to YUM's Quarterly Report on Form 10-Q for the quarter ended June 13, 2009.
10.5† YUM! Brands Pension Equalization Plan, Plan Document for the Pre-409A Program, as effectiveJanuary 1, 2005, and as Amended through December 31, 2010, which is incorporated by reference fromExhibit 10.7 to Yum's Quarterly Report on Form 10-Q for the quarter ended March 19, 2011.
10.5.1† YUM! Brands, Inc. Pension Equalization Plan, Plan Document for the 409A Program, as effectiveJanuary 1, 2005, and as Amended through December 30, 2008, which is incorporated by reference fromExhibit 10.13.1 to YUM's Quarterly Report on Form 10-Q for the quarter ended June 13, 2009.
10.5.2† YUM! Brands Pension Equalization Plan Amendment, as effective January 1, 2012, which isincorporated by reference from Exhibit 10.7.2 to Yum’s Quarterly Report on Form 10-Q for the quarterended March 23, 2013.
10.5.3† YUM! Brands Pension Equalization Plan Amendment, as effective January 1, 2013, which isincorporated by reference from Exhibit 10.7.3 to Yum’s Quarterly Report on Form 10-Q for the quarterended March 23, 2013.
10.6† Form of Directors' Indemnification Agreement, which is incorporated herein by reference from Exhibit10.17 to YUM's Annual Report on Form 10-K for the fiscal year ended December 27, 1997.
10.7† Form of YUM! Brands, Inc. Change in Control Severance Agreement, which is incorporated herein byreference from Exhibit 10.1 to Yum’s Report on Form 8-K filed on March 21, 2013.
10.8† YUM! Long Term Incentive Plan, as Amended and Restated effective as of May 20, 2016 as incorporatedby reference from Form DEF 14A filed on April 18, 2016.
102
10.14.1† YUM! Brands Leadership Retirement Plan, Plan Document for the 409A Program, as effective January1, 2005, and as Amended through December, 2009, which is incorporated by reference from Exhibit10.21.1 to YUM's Annual Report on Form 10-K for the fiscal year ended December 26, 2009.
10.15† 1999 Long Term Incentive Plan Award (Restricted Stock Unit Agreement) by and between the Companyand David C. Novak, dated as of January 24, 2008, which is incorporated herein by reference fromExhibit 10.33 to YUM's Annual Report on Form 10-K for the fiscal year ended December 29, 2007.
10.16† YUM! Performance Share Plan, as amended and restated January 1, 2013, which is incorporated byreference from Exhibit 10.1 to YUM's Quarterly Report on Form 10-Q for the quarter ended June 13,2015.
10.17† YUM! Brands Third Country National Retirement Plan, as effective January 1, 2009, which isincorporated by reference from Exhibit 10.25 to YUM's Annual Report on Form 10-K for the fiscalyear ended December 26, 2009.
10.18† 2010 YUM! Brands Supplemental Long Term Disability Coverage Summary, as effective January 1,2010, which is incorporated by reference from Exhibit 10.26 to YUM's Annual Report on Form 10-Kfor the fiscal year ended December 26, 2009.
10.9† YUM SharePower Plan, as effective October 7, 1997, and as amended through June 23, 2003, whichis incorporated herein by reference from Exhibit 10.23 to YUM's Annual Report on Form 10-K for thefiscal year ended December 31, 2005.
10.10† Form of YUM Director Stock Option Award Agreement, which is incorporated herein by referencefrom Exhibit 10.25 to YUM's Quarterly Report on Form 10-Q for the quarter ended September 4, 2004.
10.11† Form of YUM 1999 Long Term Incentive Plan Award Agreement, which is incorporated herein byreference from Exhibit 10.26 to YUM's Quarterly Report on Form 10-Q for the quarter ended September4, 2004.
10.11.1† Form of YUM 1999 Long Term Incentive Plan Award Agreement (2013) (Stock Options), which isincorporated herein by reference from Exhibit 10.15.1 to YUM’s Quarterly Report on Form 10-Q forthe quarter ended March 23, 2013.
10.11.2† Form of YUM 1999 Long Term Incentive Plan Award Agreement (2015) (Stock Options), which isincorporated herein by reference from Exhibit 10.15.2 to YUM's Annual Report on Form 10-K for thefiscal year ended December 27, 2014.
10.12† YUM! Brands, Inc. International Retirement Plan, as in effect January 1, 2005, which is incorporatedherein by reference from Exhibit 10.27 to YUM's Annual Report on Form 10-K for the fiscal year endedDecember 25, 2004.
10.13† Form of 1999 Long Term Incentive Plan Award Agreement (Stock Appreciation Rights) which isincorporated by reference from Exhibit 99.1 to YUM's Report on Form 8-K as filed on January 30,2006.
10.13.1† Form of YUM 1999 Long Term Incentive Plan Award Agreement (2013) (Stock Appreciation Rights),which is incorporated by reference from Exhibit 10.18.1 to YUM’s Quarterly Report on Form 10-Q forthe quarter ended March 23, 2013.
10.13.2† Form of YUM 1999 Long Term Incentive Plan Award Agreement (2015) (Stock Appreciation Rights),which is incorporated herein by reference from Exhibit 10.18.2 to YUM's Annual Report on Form 10-K for the fiscal year ended December 27, 2014.
10.14† YUM! Brands Leadership Retirement Plan, as in effect January 1, 2005, which is incorporated hereinby reference from Exhibit 10.32 to YUM's Quarterly Report on Form 10-Q for the quarter ended March24, 2007.
103

10.19† 1999 Long Term Incentive Plan Award (Restricted Stock Unit Agreement) by and between the Companyand Jing-Shyh S. Su, dated as of May 20, 2010, which is incorporated by reference from Exhibit 10.27to YUM's Annual Report on Form 10-K for the fiscal year ended December 25, 2010.
10.20† 1999 Long Term Incentive Plan Award (Stock Appreciation Rights) by and between the Company andDavid C. Novak, dated as of February 6, 2015, which is incorporated herein by reference from Exhibit10.27 to YUM's Annual Report on Form 10-K for the fiscal year ended December 27, 2014.
10.21† YUM! Brands, Inc. Compensation Recovery Policy, Amended and Restated January 1, 2015, which isincorporated herein by reference from Exhibit 10.28 to YUM's Annual Report on Form 10-K for thefiscal year ended December 27, 2014.
10.22† Retirement Agreement and General Release, dated August 13, 2015, by and between the Company andJing-Shyh S. Su, which is incorporated by reference from Exhibit 10.29 to YUM's Quarterly Report onForm 10-Q for the quarter ended September 5, 2015.
10.23† Letter of Understanding dated December 7, 2015 by and between the Company and Patrick J. Grismer,which is incorporated by reference from Exhibit 10.30 to YUM's Annual Report on Form 10-K for thefiscal year ended December 31, 2015.
10.24† Letter of Understanding dated June 6, 2016 by and between the Company and David C. Novak, whichis incorporated herein by reference from Exhibit 10.31 to YUM's Quarterly Report on Form 10-Q forthe quarter ended June 11, 2016.
10.25 Indenture, dated as of June 16, 2016, by and among KFC Holding Co., Pizza Hut Holdings, LLC andTaco Bell of America, LLC, as issuers, the Guarantors named therein and The Bank of New York MellonTrust Company, N.A., as trustee, which is incorporated herein by reference from Exhibit 4.1 to YUM'sReport on Form 8-K filed on June 21, 2016.
10.26 Base Indenture, dated as of May 11, 2016, between Taco Bell Funding, LLC, as issuer and Citibank,N.A., as trustee and securities intermediary, which is incorporated herein by reference from Exhibit 4.1to YUM’s Report on Form 8-K filed on May 16, 2016.
10.27 Series 2016-1 Supplement to Base Indenture dated as of May 11, 2016, by and between Taco BellFunding, LLC, as issuer and Citibank, N.A. as trustee and Series 2016-1 securities intermediary, whichis incorporated herein by reference from Exhibit 4.2 to YUM’s Report on Form 8-K filed on May 16,2016.
10.28 Guarantee and Collateral Agreement, dated as of May 11, 2016, by Taco Bell Franchise Holder 1, LLC,Taco Bell Franchisor, LLC, Taco Bell IP Holder, LLC and Taco Bell Franchisor Holdings, LLC in favorof Citibank, N.A., which is incorporated herein by reference from Exhibit 10.2 to YUM’s Report onForm 8-K filed on May 16, 2016.
10.29 Management Agreement, dated as of May 11, 2016, among Taco Bell Funding, LLC, as issuer, TacoBell Franchise Holder 1, LLC, Taco Bell Franchisor, LLC, Taco Bell IP Holder, LLC, Taco BellFranchisor Holdings, LLC, Citibank, N.A. and Taco Bell Corp., as manager, which is incorporatedherein by reference from Exhibit 10.3 to YUM’s Report on Form 8-K filed on May 16, 2016.
10.30 Master License Agreement, dated as of October 31, 2016, by and between Yum! Restaurants Asia Pte.Ltd. and Yum Restaurants Consulting (Shanghai) Company Limited, which is incorporated herein byreference from Exhibit 10.1 to YUM's Report on Form 8-K filed on November 3, 2016.
10.31 Tax Matters Agreement, dated as of October 31, 2016, by and among YUM, Yum China Holdings, Inc.and Yum Restaurants Consulting (Shanghai) Company Limited, which is incorporated herein byreference from Exhibit 10.2 to YUM's Report on Form 8-K filed on November 3, 2016.
12.1 Computation of ratio of earnings to fixed charges.
104

21.1 Active Subsidiaries of YUM.
23.1 Consent of KPMG LLP.
31.1 Certification of the Chief Executive Officer pursuant to Rule 13a-14(a) of Securities Exchange Act of1934, as adopted pursuant to Section 302 of the Sarbanes-Oxley Act of 2002.
31.2 Certification of the Chief Financial Officer pursuant to Rule 13a-14(a) of Securities Exchange Act of1934, as adopted pursuant to Section 302 of the Sarbanes-Oxley Act of 2002.
32.1 Certification of the Chief Executive Officer pursuant to 18 U.S.C. Section 1350, as adopted pursuantto Section 906 of the Sarbanes-Oxley Act of 2002.
32.2 Certification of the Chief Financial Officer pursuant to 18 U.S.C. Section 1350, as adopted pursuantto Section 906 of the Sarbanes-Oxley Act of 2002.
101.INS Instance Document - the instance document does not appear in the Interactive Data File because itsXBRL tags are embedded within the Inline XBRL document
101.SCH XBRL Taxonomy Extension Schema Document
101.CAL XBRL Taxonomy Extension Calculation Linkbase Document
101.LAB XBRL Taxonomy Extension Label Linkbase Document
101.PRE XBRL Taxonomy Extension Presentation Linkbase Document
101.DEF XBRL Taxonomy Extension Definition Linkbase Document
* Certain schedules and exhibits to this agreement have been omitted in accordance with Item 601(b)(2) ofRegulation S-K. A copy of any omitted schedules and/or exhibits will be furnished to the Securities andExchange Commission upon request.
† Indicates a management contract or compensatory plan.
105