united states -...
TRANSCRIPT

UNITED STATESSECURITIES AND EXCHANGE COMMISSION
WASHINGTON, D.C. 20549____________________________________
FORM 10-K_____________________________________
x ANNUAL REPORT PURSUANT TO SECTION 13 OR 15(d) OF THE SECURITIES EXCHANGE ACT OF 1934For the Fiscal Year Ended December 31, 2017
-OR-
¨ TRANSITION REPORT FILED PURSUANT TO SECTION 13 OR 15(d) OF THE SECURITIESEXCHANGE ACT OF 1934
COMMISSION FILE NUMBER 1-12291
THE AES CORPORATION(Exact name of registrant as specified in its charter)
Delaware 54 1163725(State or other jurisdiction of incorporation or organization) (I.R.S. Employer Identification No.)
4300 Wilson Boulevard Arlington, Virginia 22203(Address of principal executive offices) (Zip Code)
Registrant's telephone number, including area code: (703) 522-1315Securities registered pursuant to Section 12(b) of the Act:
Title of Each Class Name of Each Exchange on Which RegisteredCommon Stock, par value $0.01 per share New York Stock Exchange
Securities registered pursuant to Section 12(g) of the Act: NoneIndicate by check mark if the Registrant is a well-known seasoned issuer, as defined in Rule 405 of the Securities Act. Yes x No oIndicate by check mark if the Registrant is not required to file reports pursuant to Section 13 or Section 15 (d) of the Act. Yes x No oIndicate by check mark whether the registrant (1) has filed all reports required to be filed by Section 13 or 15(d) of the Securities Exchange Act of 1934 during the
preceding 12 months (or for such shorter period that the registrant was required to file such reports), and (2) has been subject to such filing requirements for the past90 days. Yes x No o
Indicate by check mark whether the registrant has submitted electronically and posted on its corporate Web site, if any, every Interactive Data File required to besubmitted and posted pursuant to Rule 405 of Regulation S-T during the preceding 12 months (or for such shorter period that the registrant was required to submit and postsuch files). Yes x No o
Indicate by check mark if disclosure of delinquent filers pursuant to Item 405 of Regulation S-K is not contained herein, and will not be contained, to the best of registrant'sknowledge, in definitive proxy or information statements incorporated by reference in Part III of this Form 10-K or any amendment to this Form 10-K. x
Indicate by check mark whether the registrant is a large accelerated filer, an accelerated filer, a non-accelerated filer, smaller reporting company, or an emerging growthcompany. See the definitions of “large accelerated filer,” “accelerated filer,” “smaller reporting company,” and “emerging growth company” in Rule 12b-2 of the Exchange Act.(Check one):
Large accelerated filer x Accelerated filer ¨ Smaller reporting company ¨ Emerging growth company ¨
Non-accelerated filer ¨ (Do not check if a smaller reporting company)
If an emerging growth company, indicate by check mark if the registrant has elected not to use the extended transition period for complying with any new or revisedfinancial accounting standards provided pursuant to Section 13(a) of the Exchange Act. ¨
Indicate by check mark whether the Registrant is a shell company (as defined in Rule 12b-2 of the Exchange Act). Yes o No xThe aggregate market value of the voting and non-voting common equity held by non-affiliates on June 30, 2017 , the last business day of the Registrant's most recently
completed second fiscal quarter (based on the adjusted closing sale price of $10.75 of the Registrant's Common Stock, as reported by the New York Stock Exchange on suchdate) was approximately $7.10 billion .
The number of shares outstanding of Registrant's Common Stock, par value $0.01 per share, on February 21, 2018 was 660,449,495 .
DOCUMENTS INCORPORATED BY REFERENCEPortions of Registrant's Proxy Statement for its 2018 annual meeting of stockholders are incorporated by reference in Parts II and III

THE AES CORPORATION FISCAL YEAR 2017 FORM 10-KTABLE OF CONTENTS
Glossary of Terms 1PART I 3
ITEM 1. BUSINESS 5ITEM 1A. RISK FACTORS 45ITEM 1B. UNRESOLVED STAFF COMMENTS 62ITEM 2. PROPERTIES 62ITEM 3. LEGAL PROCEEDINGS 62ITEM 4. MINE SAFETY DISCLOSURES 64
PART II 65ITEM 5. MARKET FOR REGISTRANT’S COMMON EQUITY, RELATED STOCKHOLDER MATTERS AND ISSUER PURCHASES OF EQUITY SECURITIES 65ITEM 6. SELECTED FINANCIAL DATA 66ITEM 7. MANAGEMENT’S DISCUSSION AND ANALYSIS OF FINANCIAL CONDITION AND RESULTS OF OPERATIONS 68
Executive Summary 68Overview of 2017 Results and Strategic Performance 68Review of Consolidated Results of Operations 69SBU Performance Analysis 75Key Trends and Uncertainties 87Capital Resources and Liquidity 92Critical Accounting Policies and Estimates 99
ITEM 7A. QUANTITATIVE AND QUALITATIVE DISCLOSURES ABOUT MARKET RISK 103ITEM 8. FINANCIAL STATEMENTS AND SUPPLEMENTARY DATA 106
Consolidated Balance Sheets 107Consolidated Statements of Operations 108Consolidated Statements of Comprehensive Loss 109Consolidated Statements of Changes in Equity 110Consolidated Statements of Cash Flows 111Note 1 - General and Summary of Significant Accounting Policies 112Note 2 - Inventory 122Note 3 - Property, Plant and Equipment 122Note 4 - Fair Value 123Note 5 - Derivative Instruments and Hedging Activities 128Note 6 - Financing Receivables 129Note 7 - Investments in and Advances to Affiliates 130Note 8 - Goodwill and Other Intangible Assets 131Note 9 - Regulatory Assets and Liabilities 133Note 10 - Debt 134Note 11 - Commitments 137Note 12 - Contingencies 138Note 13 - Benefit Plans 139Note 14 - Equity 142Note 15 - Segment and Geographic Information 145Note 16 - Share-Based Compensation 147Note 17 - Redeemable Stock of Subsidiaries 149Note 18 - Other Income and Expense 150Note 19 - Asset Impairment Expense 150Note 20 - Income Taxes 152Note 21 - Discontinued Operations 156Note 22 - Held-for-Sale Businesses and Dispositions 158Note 23 - Acquisitions 159Note 24 - Earnings Per Share 160Note 25 - Risks and Uncertainties 160Note 26 - Related Party Transactions 163Note 27 - Selected Quarterly Financial Data (Unaudited) 164Note 28 - Subsequent Events 164
ITEM 9. CHANGES IN AND DISAGREEMENTS WITH ACCOUNTANTS ON ACCOUNTING AND FINANCIAL DISCLOSURE 166ITEM 9A. CONTROLS AND PROCEDURES 166ITEM 9B. OTHER INFORMATION 169
PART III 170ITEM 10. DIRECTORS, EXECUTIVE OFFICERS AND CORPORATE GOVERNANCE 170ITEM 11. EXECUTIVE COMPENSATION 170ITEM 12. SECURITY OWNERSHIP OF CERTAIN BENEFICIAL OWNERS AND MANAGEMENT AND RELATED STOCKHOLDER MATTERS 170ITEM 13. CERTAIN RELATIONSHIPS AND RELATED PARTY TRANSACTIONS, AND DIRECTOR INDEPENDENCE 171ITEM 14. PRINCIPAL ACCOUNTANT FEES AND SERVICES 171
PART IV - ITEM 15. EXHIBITS AND FINANCIAL STATEMENT SCHEDULES 172SIGNATURES 175

GLOSSARY OF TERMSThe following terms and abbreviations appear in the text of this report and have the definitions indicated below:
Adjusted EPS Adjusted Earnings Per Share, a non-GAAP measureAdjusted PTC Adjusted Pre-tax Contribution, a non-GAAP measure of operating performanceAES The Parent Company and its subsidiaries and affiliatesAOCL Accumulated Other Comprehensive LossASC Accounting Standards CodificationASEP National Authority of Public ServicesBACT Best Available Control TechnologyBART Best Available Retrofit TechnologyBOT Build, Operate and TransferBTA Best Technology AvailableCAA United States Clean Air ActCAMMESA Wholesale Electric Market Administrator in ArgentinaCCGT Combined Cycle Gas TurbineCDPQ La Caisse de dépôt et placement du QuebécCEO Chief Executive OfficerCHP Combined Heat and PowerCOFINS Contribuição para o Financiamento da Seguridade SocialCO 2 Carbon DioxideCOSO Committee of Sponsoring Organizations of the Treadway CommissionCP Capacity PerformanceCPI United States Consumer Price IndexCPP Clean Power PlanCRES Competitive Retail Electric ServiceCSAPR Cross-State Air Pollution RuleCWA U.S. Clean Water ActDG Comp Directorate-General for Competition of the European CommissionDodd-Frank Act Dodd-Frank Wall Street Reform and Consumer Protection ActDP&L The Dayton Power & Light CompanyDPL DPL Inc.DPLER DPL Energy Resources, Inc.DPP Dominican Power PartnersEBITDA Earnings before Interest, Taxes, Depreciation & AmortizationEPA United States Environmental Protection AgencyEPC Engineering, Procurement, and ConstructionERC Energy Regulatory CommissionERCOT Electric Reliability Council of TexasESP Electric Security PlanEU ETS European Union Greenhouse Gas Emission Trading SchemeEURIBOR Euro Inter Bank Offered RateEUSGU Electric Utility Steam Generating UnitEVN Electricity of VietnamEVP Executive Vice PresidentFASB Financial Accounting Standards BoardFERC Federal Energy Regulatory CommissionFONINVEMEM Fund for the Investment Needed to Increase the Supply of Electricity in the Wholesale MarketFPA Federal Power ActFX Foreign ExchangeGAAP Generally Accepted Accounting Principles in the United StatesGHG Greenhouse GasGRIDCO Grid Corporation of Odisha Ltd.GWh Gigawatt HoursHLBV Hypothetical Liquidation Book ValueIBEX Independent Bulgarian Power ExchangeIDEM Indiana Department of Environmental Management

IPALCO IPALCO Enterprises, Inc.IPL Indiana, Indianapolis Power & Light CompanyIPP Independent Power ProducersISO Independent System OperatorIURC Indiana Utility Regulatory Commission
1

LIBOR London Inter Bank Offered RateLNG Liquefied Natural GasMATS Mercury and Air Toxics StandardsMISO Midcontinent Independent System Operator, Inc.MRE Energy Reallocation MechanismMW MegawattsMWh Megawatt HoursNCI Noncontrolling InterestNCRE Non-Conventional Renewable EnergyNEK Natsionalna Elektricheska Kompania (state-owned electricity public supplier in Bulgaria)NEPCO National Electric Power CompanyNERC North American Electric Reliability CorporationNM Not MeaningfulNOV Notice of ViolationNO X Nitrogen DioxideNPDES National Pollutant Discharge Elimination SystemNSPS New Source Performance StandardsNYSE New York Stock ExchangeO&M Operations and MaintenanceONS National System OperatorOPGC Odisha Power Generation Corporation, Ltd.Parent Company The AES CorporationPet Coke Petroleum CokePIS Partially Integrated SystemPJM PJM Interconnection, LLCPM Particulate MatterPPA Power Purchase AgreementPREPA Puerto Rico Electric Power AuthorityPSD Prevention of Significant DeteriorationPSU Performance Stock UnitPUCO The Public Utilities Commission of OhioPURPA Public Utility Regulatory Policies ActQF Qualifying FacilityRGGI Regional Greenhouse Gas InitiativeRMRR Routine Maintenance, Repair and ReplacementRSU Restricted Stock UnitRTO Regional Transmission OrganizationSADI Argentine Interconnected SystemSBU Strategic Business UnitSCE Southern California EdisonSEC United States Securities and Exchange CommissionSEM Single Electricity MarketSIC Central Interconnected Electricity SystemSIN National Interconnected SystemSING Northern Interconnected Electricity SystemSIP State Implementation PlanSNE National Secretary of EnergySO 2 Sulfur DioxideSSO Standard Service OfferTECONS Term Convertible Preferred SecuritiesU.S. United StatesVAT Value Added TaxVIE Variable Interest EntityVinacomin Vietnam National Coal-Mineral Industries Holding Corporation Ltd.YPF Argentina state-owned gas company

2

PART IIn this Annual Report the terms “AES,” “the Company,” “us,” or “we” refer to The AES Corporation and all of its subsidiaries and affiliates,
collectively. The terms “The AES Corporation” and “Parent Company” refer only to the parent, publicly held holding company, The AES Corporation,excluding its subsidiaries and affiliates.
FORWARD-LOOKING INFORMATIONIn this filing we make statements concerning our expectations, beliefs, plans, objectives, goals, strategies, and future events or performance.
Such statements are “forward-looking statements” within the meaning of the Private Securities Litigation Reform Act of 1995. Although we believethat these forward-looking statements and the underlying assumptions are reasonable, we cannot assure you that they will prove to be correct.
Forward-looking statements involve a number of risks and uncertainties, and there are factors that could cause actual results to differmaterially from those expressed or implied in our forward-looking statements. Some of those factors (in addition to others described elsewhere inthis report and in subsequent securities filings) include:
• the economic climate, particularly the state of the economy in the areas in which we operate, including the fact that the global economyfaces considerable uncertainty for the foreseeable future, which further increases many of the risks discussed in this Form 10-K;
• changes in inflation, demand for power, interest rates and foreign currency exchange rates, including our ability to hedge our interest rateand foreign currency risk;
• changes in the price of electricity at which our generation businesses sell into the wholesale market and our utility businesses purchase todistribute to their customers, and the success of our risk management practices, such as our ability to hedge our exposure to such marketprice risk;
• changes in the prices and availability of coal, gas and other fuels (including our ability to have fuel transported to our facilities) and thesuccess of our risk management practices, such as our ability to hedge our exposure to such market price risk, and our ability to meet creditsupport requirements for fuel and power supply contracts;
• changes in and access to the financial markets, particularly changes affecting the availability and cost of capital in order to refinanceexisting debt and finance capital expenditures, acquisitions, investments and other corporate purposes;
• our ability to manage liquidity and comply with covenants under our recourse and non-recourse debt, including our ability to manage oursignificant liquidity needs and to comply with covenants under our senior secured credit facility and other existing financing obligations;
• changes in our or any of our subsidiaries' corporate credit ratings or the ratings of our or any of our subsidiaries' debt securities or preferredstock, and changes in the rating agencies' ratings criteria;
• our ability to purchase and sell assets at attractive prices and on other attractive terms;• our ability to compete in markets where we do business;• our ability to manage our operational and maintenance costs, the performance and reliability of our generating plants, including our ability to
reduce unscheduled down times;• our ability to locate and acquire attractive "greenfield" or "brownfield" projects and our ability to finance, construct and begin operating our
"greenfield" or "brownfield" projects on schedule and within budget;• our ability to enter into long-term contracts, which limit volatility in our results of operations and cash flow, such as PPAs, fuel supply, and
other agreements and to manage counterparty credit risks in these agreements;• variations in weather, especially mild winters and cooler summers in the areas in which we operate, the occurrence of difficult hydrological
conditions for our hydropower plants, as well as hurricanes and other storms and disasters, and low levels of wind or sunlight for our windand solar facilities;
• our ability to meet our expectations in the development, construction, operation and performance of our new facilities, whether greenfield,brownfield or investments in the expansion of existing facilities;
• the success of our initiatives in other renewable energy projects and energy storage projects;• our ability to keep up with advances in technology;• the potential effects of threatened or actual acts of terrorism and war;• the expropriation or nationalization of our businesses or assets by foreign governments, with or without adequate compensation;• our ability to achieve reasonable rate treatment in our utility businesses;
3

• changes in laws, rules and regulations affecting our international businesses;• changes in laws, rules and regulations affecting our North America business, including, but not limited to, regulations which may affect
competition, the ability to recover net utility assets and other potential stranded costs by our utilities;• changes in law resulting from new local, state, federal or international energy legislation and changes in political or regulatory oversight or
incentives affecting our wind business and solar projects, our other renewables projects and our initiatives in GHG reductions and energystorage, including tax incentives;
• changes in environmental laws, including requirements for reduced emissions of sulfur, nitrogen, carbon, mercury, hazardous air pollutantsand other substances, GHG legislation, regulation, and/or treaties and coal ash regulation;
• changes in tax laws, including U.S. tax reform, and the effects of our strategies to reduce tax payments;• the effects of litigation and government and regulatory investigations;• our ability to maintain adequate insurance;• decreases in the value of pension plan assets, increases in pension plan expenses, and our ability to fund defined benefit pension and other
postretirement plans at our subsidiaries;• losses on the sale or write-down of assets due to impairment events or changes in management intent with regard to either holding or
selling certain assets;• changes in accounting standards, corporate governance and securities law requirements;• our ability to maintain effective internal controls over financial reporting;• our ability to attract and retain talented directors, management and other personnel, including, but not limited to, financial personnel in our
foreign businesses that have extensive knowledge of accounting principles generally accepted in the United States; and• cyber-attacks and information security breaches.
These factors in addition to others described elsewhere in this Form 10-K, including those described under Item 1A.— Risk Factors , and insubsequent securities filings, should not be construed as a comprehensive listing of factors that could cause results to vary from our forward-lookinginformation.
We undertake no obligation to publicly update or revise any forward-looking statements, whether as a result of new information, future events,or otherwise. If one or more forward-looking statements are updated, no inference should be drawn that additional updates will be made with respectto those or other forward-looking statements.
4

ITEM 1. BUSINESS
Item 1.— Business is an outline of our strategy and our businesses by SBU, including key financial drivers. Additional items that may have animpact on our businesses are discussed in Item 1A.— Risk Factors and Item 3.— Legal Proceedings .
Executive SummaryIncorporated in 1981, AES is a power generation and utility company, providing affordable, sustainable energy through our diverse portfolio of
thermal and renewable generation facilities and distribution businesses. Our vision is to be the world's leading sustainable power company thatsafely provides reliable, affordable energy. We do this by leveraging our unique electricity platforms and the knowledge of our people to provide theenergy and infrastructure solutions our customers need. Our people share a passion to help meet the world's current and increasing energy needs,while providing communities and countries the opportunity for economic growth due to the availability of reliable, affordable electric power.
In 2017, we announced the sale or retirement of 4.3 GW of mostly merchant coal-fired generation, representing 30% of our coal-fired capacity.
Future growth across our company will be heavily weighted toward less carbon-intensive wind, solar and gas generation. In 2017, AES andAIMCo completed the joint acquisition of sPower, the leading independent solar developer in the United States. sPower has 1.3 GW of solar andwind projects and an additional 10 GW of renewables in its development pipeline. sPower's robust development pipeline and expertise position AESto significantly grow our renewables portfolio in the coming years.
Growth in renewables not only provides an opportunity for direct investments in solar and wind generation, but also presents significantpotential for energy storage. We are a leader in lithium-ion, battery-based energy storage, with approximately 400 MW in operation, underconstruction or in advanced development across seven countries. We believe that battery-based energy storage will play a critical role in anincreasingly renewables-based generation mix. In January 2018, we partnered with Siemens to form Fluence, a new global energy storagetechnology and services company. Through a sales partnership with Siemens' global sales force, Fluence will be able to sell energy storagesolutions and services in 160 countries as this market grows.
AES continues to invest in LNG opportunities to provide cleaner alternatives to countries with oil-fired power generation. Specifically, AESintroduced LNG in the Dominican Republic in 2003 and currently has a 380 MW
5

CCGT and LNG storage and regasification facility under construction in Panama.
In the United States, primarily at IPL, we completed a multi-year rate base investment in environmental upgrades to our coal plants and are inthe process of re-powering several units from coal to gas.
As a result of our efforts to decrease our exposure to coal-fired generation and increase our portfolio of renewables, energy storage and naturalgas capacity, we are significantly reducing our carbon dioxide emissions per MWh of generation. Under our current strategy, we anticipate areduction of carbon intensity levels by 25% from 2016 to 2020 and by 50% from 2016 to 2030.
In February 2018, we announced a reorganization as a part of our on-going strategy to simplify our portfolio, optimize our cost structure andreduce our carbon intensity. Reflecting this simplified portfolio, we will manage our global operations separate from our growth and commercialactivities.
Strategic Priorities
We have made significant progress towards meeting our strategic goals to maximize value for our shareholders.
Leveraging Our Platforms Focusing our growth in markets where we already operate and have a competitive advantage to realize attractive risk-
adjusted returns
● In 2017, brought on-line seven projects for a total of 279 MW ● 4,401 MW currently under construction and expected to come on-line through 2021 ● Will continue to advance select projects from our development pipeline Reducing Complexity
Exiting businesses and markets where we do not have a competitive advantage, simplifying our portfolio and reducingrisk
● Since 2011 ○ Announced or closed $5.4 billion in equity proceeds from sales or sell-downs ○ Decreased total number of countries where we have operations from 28 to 16 ● In 2017, announced or closed $1.1 billion in equity proceeds from sales or sell-downs of three businesses Performance Excellence Striving to be the low-cost manager of a portfolio of assets and deriving synergies and scale from our businesses ● Since 2012, achieved $300 million in cost savings and revenue enhancements, including $50 million in 2017 ○ Includes overhead reductions, procurement efficiencies and operational improvements
○ Expect to achieve an additional $50 million in 2018 and another $50 million from 2019 to 2020, for a total of $400
million in annual savings in 2020 Expanding Access to Capital Optimizing risk-adjusted returns in existing businesses and growth projects ● Adjust our global exposure to commodity, fuel, country and other macroeconomic risks
● Building strategic partnerships at the project and business level with an aim to optimize our risk-adjusted returns in our
business and growth projects Allocating Capital in a Disciplined Manner
Maximizing risk-adjusted returns to our shareholders by investing our free cash flow to strengthen our credit and deliverattractive growth in cash flow and earnings
● In 2017, we generated substantial cash by executing on our strategy, which we allocated in line with our capitalallocation framework
○ Used $341 million to prepay and refinance Parent Company debt ○ Returned $317 million to shareholders through quarterly dividends ■ Increased our quarterly dividend by 8.3% to $0.13 per share beginning in the first quarter of 2018 ○ Invested $481 million in our subsidiaries
6


_____________________________(1) Investments in subsidiaries excludes $2.2 billion investment in DPL(2) Excludes working capital adjustments and growth activity prior to the close of the acquisition.
Segments
We are organized into five market-oriented SBUs: US (United States), Andes (Chile, Colombia, and Argentina), Brazil , MCAC (Mexico,Central America, and the Caribbean), and Eurasia (Europe and Asia) — which are led by our SBU Presidents. The Eurasia SBU resulted from themerger of the Europe and Asia SBUs in Q3 2017, in order to leverage scale. Within our five SBUs, we have two lines of business. The first businessline is generation, where we own and/or operate power plants to generate and sell power to customers, such as utilities, industrial users, and otherintermediaries. The second business line is utilities, where we own and/or operate utilities to generate or purchase, distribute, transmit and sellelectricity to end-user customers in the residential, commercial, industrial and governmental sectors within a defined service area. In certaincircumstances, our utilities also generate and sell electricity on the wholesale market.
The Company measures the operating performance of its SBUs using Adjusted PTC and Consolidated Free Cash Flow ("Free Cash Flow"),both non-GAAP measures. The Adjusted PTC and Free Cash Flow by SBU for the year ended December 31, 2017 are shown below. Thepercentages for Adjusted PTC and Free Cash Flow are the contribution by each SBU to the gross metric, i.e., the total Adjusted PTC by SBU,before deductions for Corporate. See Item 7.— Management's Discussion and Analysis of Financial Condition and Results of Operations—SBUPerformance Analysis of this Form 10-K for reconciliation and definitions of Adjusted PTC and Free Cash Flow.
7

The following summarizes our businesses within our five SBUs.
8

9

10

OverviewGeneration
We currently own and/or operate a generation portfolio of 34,905 MW, including our integrated utility. Our generation fleet is diversified by fueltype. See discussion below under Fuel Costs .
Performance drivers of our generation businesses include types of electricity sales agreements, plant reliability and flexibility, fuel costs,seasonality, weather variations and economic activity, fixed-cost management, and competition.
Contract Sales — Most of our generation businesses sell electricity under medium- or long-term contracts ("contract sales") or under short-term agreements in competitive markets ("short-term sales"). Our medium-term contract sales have terms of 2 to 5 years, while our long-termcontracts have terms of more than 5 years.
In contract sales, our generation businesses recover variable costs, including fuel and variable O&M costs, either through direct or indexation-based contractual pass-throughs or tolling arrangements. When the contract does not include a fuel pass-through, we typically hedge fuel costs orenter into fuel supply agreements for a similar contract period (see discussion below under Fuel Costs ). These contracts are intended to reduceexposure to the volatility of fuel and electricity prices by linking the business's revenues and costs. These contracts also help us to fund a significantportion of the total capital cost of the project through long-term non-recourse project-level financing.
Capacity Payments in Contract Sales — Most of our contract sales include a capacity payment that covers projected fixed costs of the plant,including fixed O&M expenses, and a return on capital invested. In addition, most of our contracts require that the majority of the capacity paymentbe denominated in the currency matching our fixed costs. We generally structure our business to eliminate or reduce foreign exchange risk bymatching the currency of revenue and expenses, including fixed costs and debt. Our project debt may consist of both fixed and floating rate debt forwhich we typically hedge a significant portion of our exposure. Some of our contracted businesses also receive a regulated market-based capacitypayment, which is discussed in more detail in the Capacity Payments and Short-Term Sales sections below.
Thus, these contracts, or other related commercial arrangements, significantly mitigate our exposure to changes in power and fuel prices,currency fluctuations and changes in interest rates. In addition, these contracts generally provide for a recovery of our fixed operating expenses anda return on our investment, as long as we operate the plant to the reliability and efficiency standards required in the contract.
Short-Term Sales — Our other generation businesses sell power and ancillary services under short-term contracts with average terms of lessthan 2 years, including spot sales, directly in the short-term market or at regulated prices. The short-term markets are typically administered by asystem operator to coordinate dispatch. Short-term markets generally operate on merit order dispatch, where the least expensive generationfacilities, based upon variable cost or bid price, are dispatched first and the most expensive facilities are dispatched last. The short-term price istypically set at the marginal cost of energy or bid price (the cost of the last plant required to meet system demand). As a result, the cash flows andearnings associated with these businesses are more sensitive to fluctuations in the market price for electricity. In addition, many of these wholesalemarkets include markets for ancillary services to support the reliable operation of the transmission system. Across our portfolio, we provide a widearray of ancillary services, including voltage support, frequency regulation and spinning reserves.
Capacity Payments — Many of the markets in which we operate include regulated capacity markets. These capacity markets are intended toprovide additional revenue based upon availability without reliance on the energy margin from the merit order dispatch. Capacity markets aretypically priced based on the cost of a new entrant and the system capacity relative to the desired level of reserve margin (generation available inexcess of peak demand). Our generating facilities selling in the short-term markets typically receive capacity payments based on their availability inthe market. Our most significant capacity revenues are earned by our generation capacity in Ohio and Northern Ireland.
Plant Reliability and Flexibility — Our contract and short-term sales provide incentives to our generation plants to optimally manage availability,operating efficiency and flexibility. Capacity payments under contract sales are frequently tied to meeting minimum standards. In short-term sales,our plants must be reliable and flexible to capture peak market prices and to maximize market-based revenues. In addition, our flexibility allows us tocapture ancillary service revenue while meeting local market needs.
Fuel Costs — For our thermal generation plants, fuel is a significant component of our total cost of generation. For contract sales, we oftenenter into fuel supply agreements to match the contract period, or we may hedge our
11

fuel costs. Some of our contracts have periodic adjustments for changes in fuel cost indices. In those cases, we have fuel supply agreements withshorter terms to match those adjustments. For certain projects, we have tolling arrangements where the power offtaker is responsible for the supplyand cost of fuel to our plants.
In short-term sales, we sell power at market prices that are generally reflective of the market cost of fuel at the time, and thus procure fuelsupply on a short-term basis, generally designed to match up with our market sales profile. Since fuel price is often the primary determinant forpower prices, the economics of projects with short-term sales are often subject to volatility of relative fuel prices. For further information regardingcommodity price risk please see Item 7A.— Quantitative and Qualitative Disclosures about Market Risk in this Form 10-K.
37% of the capacity of our generation plants are fueled by natural gas. Generally, we use gas from local suppliers in each market. A fewexceptions to this are AES Gener in Chile, where we purchase imported gas from third parties, and our plants in the Dominican Republic, where weimport LNG to utilize in the local market.
33% of the capacity of our generation fleet is coal-fired. In the U.S., most of our plants are supplied from domestic coal. At our non-U.S.generation plants, and at our plant in Hawaii, we source coal internationally. Across our fleet, we utilize our global sourcing program to maximize thepurchasing power of our fuel procurement.
26% of the capacity of our generation plants are fueled by renewables, including hydro, solar, wind, energy storage, biomass and landfill gas,which do not have significant fuel costs.
4% of the capacity of our generation fleet utilizes pet coke, diesel or oil for fuel. Oil and diesel are sourced locally at prices linked tointernational markets, while pet coke is largely sourced from Mexico and the U.S.
Seasonality, Weather Variations and Economic Activity — Our generation businesses are affected by seasonal weather patterns and,therefore, operating margin is not generated evenly throughout the year. Additionally, weather variations, including temperature, solar and windresources, and hydrological conditions, may also have an impact on generation output at our renewable generation facilities. In competitive marketsfor power, local economic activity can also have an impact on power demand and short-term prices for power.
Fixed-Cost Management — In our businesses with long-term contracts, the majority of the fixed O&M costs are recovered through the capacitypayment. However, for all generation businesses, managing fixed costs and reducing them over time is a driver of business performance.
Competition — For our businesses with medium- or long-term contracts, there is limited competition during the term of the contract. For short-term sales, plant dispatch and the price of electricity are determined by market competition and local dispatch and reliability rules.
Utilities
AES' six utility businesses distribute power to 2.4 million people in two countries. AES' two utilities in the U.S. also include generation capacitytotaling 5,373 MW. Our utility businesses consist of IPL (an integrated utility), DPL, including DP&L (transmission and distribution) and AES OhioGeneration (generation), and four utilities in El Salvador (distribution).
In general, our utilities sell electricity directly to end-users, such as homes and businesses, and bill customers directly. Key performancedrivers for utilities include the regulated rate of return and tariff, seasonality, weather variations, economic activity, reliability of service andcompetition. Revenue from utilities is classified as regulated on the Consolidated Statements of Operations.
Regulated Rate of Return and Tariff — In exchange for the right to sell or distribute electricity in a service territory, our utility businesses aresubject to government regulation. This regulation sets the framework for the prices ("tariffs") that our utilities are allowed to charge customers forelectricity and establishes service standards that we are required to meet.
Our utilities are generally permitted to earn a regulated rate of return on assets, determined by the regulator based on the utility's allowedregulatory asset base, capital structure and cost of capital. The asset base on which the utility is permitted a return is determined by the regulatorand is based on the amount of assets that are considered used and useful in serving customers. Both the allowed return and the asset base areimportant components of the utility's earning power. The allowed rate of return and operating expenses deemed reasonable by the regulator arerecovered through the regulated tariff that the utility charges to its customers.
The tariff may be reviewed and reset by the regulator from time to time depending on local regulations, or the utility may seek a change in itstariffs. The tariff is generally based upon usage level and may include a pass-through of costs that are not controlled by the utility, such as the costsof fuel (in the case of integrated utilities) and/or the costs of purchased energy, to the customer. Components of the tariff that are directly passedthrough to the
12

customer are usually adjusted through a summary regulatory process or an existing formula-based mechanism. In some regulatory regimes,customers with demand above an established level are unregulated and can choose to contract with other retail energy suppliers directly and paynon-bypassable fees, which are fees to the distribution company for use of its distribution system.
The regulated tariff generally recognizes that our utility businesses should recover certain operating and fixed costs, as well as manageuncollectible amounts, quality of service and non-technical losses. Utilities, therefore, need to manage costs to the levels reflected in the tariff, or risknon-recovery of costs or diminished returns.
Seasonality, Weather Variations, and Economic Activity — Our utility businesses are affected by seasonal weather patterns and, therefore,operating margin is not generated evenly throughout the year. Additionally, weather variations may also have an impact based on the number ofcustomers, temperature variances from normal conditions, and customers' historic usage levels and patterns. Retail sales, after adjustments forweather variations, are affected by changes in local economic activity, energy efficiency and distributed generation initiatives, as well as the numberof retail customers.
Reliability of Service — Our utility businesses must meet certain reliability standards, such as duration and frequency of outages. Thosestandards may be explicit, with defined performance incentives or penalties, or implicit, where the utility must operate to meet customerexpectations.
Competition — Our integrated utility, IPL, and our regulated utility DP&L, operate as the sole distributors of electricity within their respectivejurisdictions. IPL owns and operates all of the businesses and facilities necessary to generate, transmit and distribute electricity. DP&L owns andoperates all of the businesses and facilities necessary to transmit and distribute electricity. Competition in the regulated electric business is primarilyfrom the on-site generation for industrial customers. IPL is exposed to the volatility in wholesale prices to the extent our generating capacity exceedsthe native load served under the regulated tariff and short-term contracts. See the full discussion under the US SBU.
At our distribution business in El Salvador, we face relatively limited competition due to significant barriers to entry. At many of thesebusinesses, large customers, as defined by the relevant regulator, have the option to both leave and return to regulated service.
Development and Construction
We develop and construct new generation facilities. For our utility business, new plants may be built or existing plants retrofitted in response tocustomer needs or to comply with regulatory developments. The projects are developed subject to regulatory approval that permits recovery of ourcapital cost and a return on our investment. For our generation businesses, our priority for development is platform expansion opportunities, wherewe can add on to our existing facilities in our key platform markets where we have a competitive advantage. We make the decision to invest in newprojects by evaluating the project returns and financial profile against a fair risk-adjusted return for the investment and against alternative uses ofcapital, including corporate debt repayment and share buybacks.
In some cases, we enter into long-term contracts for output from new facilities prior to commencing construction. To limit required equitycontributions from The AES Corporation, we also seek non-recourse project debt financing and other sources of capital, including partners where itis commercially attractive. We typically contract with a third party to manage construction, although our construction management team supervisesthe construction work and tracks progress against the project's budget and the required safety, efficiency and productivity standards.
Segments
The segment reporting structure uses the Company's management reporting structure as its foundation to reflect how the Company managesthe business internally. It is organized by geographic regions which provide a socio-political-economic understanding of our business. For financialreporting purposes, the Company's corporate activities are reported within "Corporate and Other" because they do not require separate disclosure.See Item 7.— Management's Discussion and Analysis of Financial Condition and Results of Operations and Note 15 — Segment and GeographicInformation included in Item 8.— Financial Statements and Supplementary Data of this Form 10-K for further discussion of the Company's segmentstructure.
13

US SBUOur US SBU has 18 generation facilities and two utilities in the United States.
Generation — Operating installed capacity of our US SBU totals 12,371 MW. IPL's parent, IPALCO Enterprises, Inc., and DPL Inc. are SECregistrants, and as such, follow public filing requirements of the Securities Exchange Act of 1934. The following table lists our US SBU generationfacilities:
Business Location Fuel Gross MW AES EquityInterest Year Acquired or
Began Operation ContractExpiration Date Customer(s)
Southland—Alamitos US-CA Gas 2,075 100% 1998 2019-2020 Southern California Edison
Southland—Redondo Beach US-CA Gas 1,392 100% 1998 2018 Southern California Edison
sPower (1)(2) US-Various Solar 1,245 50% 2017 2028-2046 Various
Southland—Huntington Beach US-CA Gas 474 100% 1998 2019-2020 Southern California Edison
Shady Point US-OK Coal 360 100% 1991 2018 Oklahoma Gas & Electric
Buffalo Gap II (3) US-TX Wind 233 100% 2007 Hawaii US-HI Coal 206 100% 1992 2022 Hawaiian Electric Co.
Warrior Run US-MD Coal 205 100% 2000 2030 First Energy
Buffalo Gap III (3) US-TX Wind 170 100% 2008 sPower (2) US-Various Wind 142 50% 2017 2036 Various
Distributed PV - Commercial & Utility (3)
US-Various
Solar
126
100%
2015-2017
2029-2042
Utility, Municipality, Education,
Non-ProfitBuffalo Gap I (3) US-TX Wind 119 100% 2006 2021 Direct Energy
Laurel Mountain US-WV Wind 98 100% 2011 Mountain View I & II US-CA Wind 65 100% 2008 2021 Southern California Edison
Mountain View IV US-CA Wind 49 100% 2012 2032 Southern California Edison
Laurel Mountain ES
US-WV
EnergyStorage
27
100%
2011
Warrior Run ES
US-MD
EnergyStorage
10
100%
2016
Advancion Applications Center
US-PA
EnergyStorage
2
100%
2013
6,998 _____________________________
(1) sPower solar MW shown in Direct Current.(2) Unconsolidated entity, accounted for as an equity affiliate.(3) AES owns these assets together with third-party tax equity investors with variable ownership interests. The tax equity investors receive a portion of the economic attributes of the facilities, including tax
attributes, that vary over the life of the projects. The proceeds from the issuance of tax equity are recorded as noncontrolling interest in the Company's Consolidated Balance Sheets.
Under construction — The following table lists our plants under construction in the US SBU:
Business Location Fuel Gross MW AES Equity Interest Expected Date of Commercial Operations
Eagle Valley CCGT US-IN Gas 671 70% 1H 2018
Distributed PV - Commercial US-Various Solar 27 100% 1H-2H 2018
Lawai
US-HI
Solar/EnergyStorage
48
100%
1H 2019
Southland Re-powering US-CA Gas 1,284 100% 1H 2020
Alamitos Energy Center US-CA Energy Storage 100 100% 1H 2021
2,130
Utilities — The following table lists our U.S. utilities and their generation facilities:
Business Location Approximate Number of Customers Served asof 12/31/2017 GWh Sold in 2017 Fuel Gross MW AES Equity
Interest Year Acquired or BeganOperation
DPL (1) US-OH 521,000 14,771 Coal/Gas/Diesel/Solar 2,125 100% 2011
IPL (2) US-IN 490,000 13,484 Coal/Gas/Oil 3,248 70% 2001
1,011,000 28,255 5,373 _____________________________
(1) As of December 31, 2017, DPL's subsidiary AES Ohio Generation, LLC owned the following plants (the Peaker Assets): Tait Units 1-7 and diesels, Yankee Street, Yankee Solar, Monument, Montpelier,Hutchings and Sidney. AES Ohio Generation jointly-owned the following plants: Conesville Unit 4, Killen and Stuart. DPL subsidiary DP&L also owned a 4.9% equity ownership in OVEC, an electricgenerating company. OVEC has two plants in Cheshire, Ohio and Madison, Indiana with a combined generation capacity of approximately 2,109 MW. DP&L’s share of this generation is approximately 103MW. AES’ share of the AES Ohio Generation jointly-owned plants, Conesville Unit 4, Stuart and Killen, represents 1,152 MW.
(2) CDPQ owns direct and indirect interests in IPALCO which total approximately 30%. AES owns 85% of AES US Investments and AES US Investments owns 82.35% of IPALCO. IPL plants: Georgetown,Harding Street, Petersburg and Eagle Valley (new CCGT currently under construction). 3.2 MW of IPL total is considered a transmission asset.
14

The following map illustrates the location of our U.S. facilities:
U.S. BusinessesU.S. Utilities
IPL
Regulatory Framework and Market Structure — IPL is subject to comprehensive regulation by the IURC with respect to its services andfacilities, retail rates and charges, the issuance of long-term securities, and certain other matters. The regulatory power of the IURC over IPL'sbusiness is typical of regulation generally imposed by state public utility commissions. The IURC sets tariff rates for electric service provided by IPL.The IURC considers all allowable costs for ratemaking purposes, including a fair return on assets used and useful to providing service to customers.
IPL's tariff rates consist of basic rates and approved charges. In addition, IPL's rates include various adjustment mechanisms, including, butnot limited to: (i) a rider to reflect changes in fuel and purchased power costs to meet IPL's retail load requirements, and (ii) a rider for the timelyrecovery of costs incurred to comply with environmental laws and regulations. These components function somewhat independently of one another,and are subject to review at the same time as any review of IPL's basic rates and charges.
IPL is one of many transmission system owner members in MISO, an RTO which maintains functional control over the combined transmissionsystems of its members and manages one of the largest energy and ancillary services markets in the U.S. MISO operates on a merit order dispatch,considering transmission constraints and other reliability issues to meet the total demand in the MISO region. IPL offers electricity in the MISO day-ahead and real-time markets.
Business Description — IPL is engaged primarily in generating, transmitting, distributing and selling electric energy to retail customers in thecity of Indianapolis and neighboring areas within the state of Indiana. IPL has an exclusive right to provide electric service to those customers. IPL'sservice area covers about 528 square miles with an estimated population of approximately 941,000. IPL owns and operates four generating stationsall within the state of Indiana. IPL’s largest generating station, Petersburg, is coal-fired. The second largest, Harding Street, is natural gas-fired anduses natural gas and fuel oil to power combustion turbines. In addition, IPL operates a 20 MW battery-based energy storage unit at this location.The third, Eagle Valley, retired its coal-fired units in April 2016
15

and the new CCGT is expected to be completed in the first half of 2018 with installed capacity of 671 MW. The fourth, Georgetown, is a smallpeaking station that uses natural gas to power combustion turbines.
In December 2017, IPL filed an updated petition with the IURC requesting an increase to its basic rates and charges primarily to recover thecost of the new CCGT at Eagle Valley. The requested increase is proposed to coincide with the completion of the CCGT, which is expected in thefirst half of 2018. IPL’s proposed increase was $125 million annually, or 9%. In February 2018, IPL filed an update to the petition to reflect the newlyenacted U.S. tax law, which reduced the revenue increase IPL is seeking to $97 million, or 7%. An order on this proceeding will likely be issued bythe IURC by the first quarter of 2019.
Environmental Regulation — For information on compliance with environmental regulations see Item 1. — United States Environmental andLand-Use Legislation and Regulations .
Key Financial Drivers — IPL's financial results are driven primarily by retail demand, weather, generating unit availability, outage costs and, toa lesser extent, wholesale prices. In addition, IPL's financial results are likely to be driven by many factors, including, but not limited to:
• Rate case outcomes• Timely completion of major construction projects and recovery of capital expenditures through base rate growth• Passage of new legislation or implementation of or changes in regulations
Construction and Development — IPL's construction program is composed of capital expenditures necessary for prudent utility operations andcompliance with environmental laws and regulations, along with discretionary investments designed to replace aging equipment or improve overallperformance.
DPL
Regulatory Framework and Market Structure — DPL is an energy holding company whose principal subsidiaries include DP&L and AES OhioGeneration, LLC, both of which operate in Ohio. Electric customers within Ohio are permitted to purchase power under contract from a CRESProvider or from their local utility under SSO rates. The SSO generation supply is provided by third parties through a competitive bid process. Ohioutilities have the exclusive right to provide transmission and distribution services in their state certified territories.
DP&L is regulated by the PUCO for its distribution services and facilities, retail rates and charges, reliability of service, compliance withrenewable energy portfolio requirements, energy efficiency program requirements, and certain other matters. The PUCO maintains jurisdiction overthe delivery of electricity, SSO, and other retail electric services.
While Ohio allows customers to choose retail generation providers, DP&L is required to provide retail generation service at SSO rates to anycustomer that has not signed a contract with a CRES provider. SSO rates are subject to rules and regulations of the PUCO and are establishedthrough a competitive bid process for the supply of power to SSO customers. DP&L's distribution rates are regulated by the PUCO and areestablished through a traditional cost-based rate-setting process. DP&L is permitted to recover its costs of providing distribution service as well asearn a regulated rate of return on assets, determined by the regulator, based on the utility's allowed regulated asset base, capital structure and costof capital. DP&L's rates include various adjustment mechanisms including, but not limited to, the timely recovery of costs incurred to comply withalternative energy, renewables, energy efficiency, and economic development costs. DP&L's wholesale transmission rates are regulated by theFERC.
DP&L is a member of PJM, an RTO that operates the transmission systems owned by utilities operating in all or parts of Pennsylvania, NewJersey, Maryland, Delaware, D.C., Virginia, Ohio, West Virginia, Kentucky, North Carolina, Tennessee, Indiana and Illinois. PJM also runs the day-ahead and real-time energy markets, ancillary services market and forward capacity market for its members.
As a member of PJM, AES Ohio Generation is subject to charges and costs associated with PJM operations as approved by the FERC. Thecapacity construct of PJM operates under the Capacity Performance ("CP") program, which offers capacity revenues combined with penalties fornon-performance or under-performance during certain periods identified as "capacity performance hours." This linkage between non- or under-performance during specific hours means that a generation unit that is generally performing well on an annual basis, may incur substantial penaltiesif it happens to be unavailable for service during some capacity performance hours. Similarly, a generation unit that is generally performing poorly onan annual basis may avoid such penalties if its outages happen to occur only during hours that are not capacity performance hours. An annual“stop-loss” provision exists that limits the size of penalties to 150% of the net cost of new entry, which is a value computed by PJM. This level is
16

likely to be larger than the capacity price established under the CP program, so that there is potential that participation in the CP program couldresult in capacity penalties that exceed capacity revenues. The purpose of the CP program is to enable PJM to obtain sufficient resources to reliablymeet the needs of electric customers within the PJM footprint. PJM conducts an auction to establish the price by zone.
Business Description — DP&L transmits, distributes and sells electricity to retail customers in a 6,000 square mile area of West Central Ohio.Ohio consumers have the right to choose the electric generation supplier from whom they purchase retail generation service; however, retailtransmission and distribution services are still regulated. DP&L has the exclusive right to provide such transmission and distribution services tothose customers. Additionally, DP&L procures retail SSO electric service on behalf of residential, commercial, industrial and governmentalcustomers.
In October 2017, the PUCO approved DP&L's most recent ESP. The agreement establishes a six year settlement, an updated framework toprovide retail services including rate structures, non-bypassable charges, and other specific rate recovery true-up mechanisms. The settlement alsoestablishes a three-year non-bypassable distribution modernization rider designed to collect $105 million in revenue per year which could beextended by PUCO for an additional two years.
In October 2017, DP&L transferred its interest in its coal-fired and certain other generating units to AES Ohio Generation. AES OhioGeneration, solely or through jointly-owned facilities, owns coal-fired and peaking generation units representing 2,125 MW located in Ohio andIndiana. AES Ohio Generation sells all of its energy and capacity into the wholesale market.
In January 2017, Stuart Unit 1 failed and was retired. In March 2017 it was decided to retire the Stuart coal-fired and diesel-fired generatingunits and Killen coal-fired generating unit and combustion turbine on or before June 1, 2018. In December 2017, AES Ohio Generation sold itsundivided interests in Zimmer and Miami Fort, and entered into an agreement to sell its 973 MW of peaking capacity.
Environmental Regulation — For information on compliance with environmental regulations see Item 1. — United States Environmental andLand-Use Legislation and Regulations .
Key Financial Drivers — DPL's financial results are primarily driven by retail demand, weather, energy efficiency, generating unit availability,outage costs, and wholesale prices. In addition, DPL financial results are likely to be driven by many factors, including, but not limited to:
• PJM capacity prices
• Outcome of DP&L's pending distribution rate case
• Recovery in the power market, particularly as it relates to an expansion in dark spreads
• DPL's ability to reduce its cost structure
Construction and Development — Planned construction additions primarily relate to new investments in and upgrades to DPL's power plantequipment and transmission and distribution system. Capital projects are subject to continuing review and are revised in light of changes in financialand economic conditions, load forecasts, legislative and regulatory developments, and changing environmental standards, among other factors.
DPL is projecting to spend an estimated $359 million in capital projects for the period 2018 through 2020 with 94% attributable to Transmissionand Distribution. DPL's ability to complete capital projects and the reliability of future service will be affected by its financial condition, the availabilityof internal funds and the reasonable cost of external funds. We expect to finance these construction additions with a combination of cash on hand,short-term financing, long-term debt and cash flows from operations.
U.S. Generation
Business Description — In the U.S., we own a diversified generation portfolio in terms of geography, technology and fuel source. The principalmarkets and locations where we are engaged in the generation and supply of electricity (energy and capacity) are the Western Electric CoordinatingCouncil, PJM, Southwest Power Pool Electric Energy Network and Hawaii. AES Southland, in the Western Electric Coordinating Council, is our mostsignificant generating business.
Many of our U.S. generation plants provide baseload operations and are required to maintain a guaranteed level of availability. Any change inavailability has a direct impact on financial performance. The plants are generally eligible for availability bonuses on an annual basis if they meetcertain requirements. In addition to plant availability, fuel cost is a key business driver for some of our facilities.
17

AES Southland
Business Description — In terms of aggregate installed capacity, AES Southland is one of the largest generation operators in California, withan installed gross capacity of 3,941 MW, accounting for approximately 5% of the state's installed capacity and 17% of the peak demand of SCE. Thethree coastal power plants comprising AES Southland are in areas that are critical for local reliability and play an important role in integrating theincreasing amounts of renewable generation resources in California.
All of AES Southland's capacity is contracted through a long-term agreement (the “Tolling Agreement”), expiring on May 31, 2018. In 2017, theCalifornia Public Utilities Commission approved the Resource Adequacy Purchase Agreements (the “RAPAs”) between the SCE and AESHuntington Beach, LLC and AES Alamitos, LLC for the period of June 1, 2018 through 2020, and the SCE and AES Redondo Beach for the periodof June 1, 2018 through December 31, 2018. Under the RAPAs, the generating stations will only provide resource adequacy capacity, and have noobligation to produce or sell any energy to SCE. However, the generating stations may bid energy into the California ISO markets.
Under the current Tolling Agreement, approximately 98% of AES Southland's revenue comes from availability. Historically, AES Southland hasgenerally met or exceeded its contractual availability requirements under the Tolling Agreement and may capture bonuses for exceeding availabilityrequirements in peak periods.
Under the Tolling Agreement, the offtaker provides gas to the three facilities thus AES Southland is not exposed to significant fuel price risk. Ifthe units operate better than the guaranteed efficiency, AES Southland gets credit for the gas that is not consumed. Conversely, AES Southland isresponsible for the cost of fuel in excess of what would have been consumed had the guaranteed efficiency been achieved. The business is alsoexposed to replacement power costs for a limited period if dispatched by the offtaker and not able to meet the required generation.
Environmental Regulation — For a discussion of environmental regulatory matters affecting U.S. Generation, see Item 1. — United StatesEnvironmental and Land-Use Legislation and Regulations .
Re-powering — In November 2014, AES Southland was awarded 20-year contracts by SCE to provide 1,284 MW of combined cycle gas-firedgeneration and 100 MW of interconnected battery-based energy storage. Under the contracts, all capacity will be sold to SCE in exchange for afixed monthly capacity fee that covers fixed operating cost, debt service and return on capital. In addition, SCE will reimburse variable costs andprovide the natural gas and charging electricity .
In April 2017, the California Energy Commission unanimously approved the licenses for the new combined cycle projects at AES Alamitos andAES Huntington Beach. In June 2017, AES closed the financing of $2.0 billion, funded with a combination of non-recourse debt and AES equity. Theconstruction of this new capacity started during 2017 and commercial operation of the gas-fired capacity is expected in 2020 and the energy storagecapacity in 2021.
Key Financial Drivers — AES Southland's contractual availability is the single most important driver of operations. Its units are generallyrequired to achieve at least 86% availability in each contract year. AES Southland has historically met or exceeded its contractual availability.
Additional U.S. Generation Businesses
Regulatory Framework and Market Structure — For the non-renewable businesses, coal and natural gas are used as the primary fuels. Coalprices are set by market factors internationally, while natural gas is generally set domestically. Price variations for these fuels can change thecomposition of generation costs and energy prices in our generation businesses.
Many of these generation businesses have entered into long-term PPAs with utilities or other offtakers. Some businesses with PPAs havemechanisms to recover fuel costs from the offtaker, including an energy payment partially based on the market price of fuel. When market pricefluctuations in fuel are borne by the offtaker, revenue may change as fuel prices fluctuate, but the variable margin or profitability should remainconsistent. These businesses often have an opportunity to increase or decrease profitability from payments under their PPAs depending on suchitems as plant efficiency and availability, heat rate, ability to buy coal at lower costs through AES' global sourcing program and fuel flexibility.
Several of our generation businesses in the U.S. currently operate as QFs, including Hawaii, Shady Point and Warrior Run, as defined underthe PURPA. These businesses entered into long-term contracts with electric utilities that had a mandatory obligation to purchase power from QFs atthe utility's avoided cost (i.e., the likely costs for
18

both energy and capital investment that would have been incurred by the purchasing utility if that utility had to provide its own generating capacity orpurchase it from another source). To be a QF, a cogeneration facility must produce electricity and useful thermal energy for an industrial orcommercial process or heating or cooling applications in certain proportions to the facility's total energy output and meet certain efficiency standards.To be a QF, a small power production facility must generally use a renewable resource as its energy input and meet certain size criteria.
Our non-QF generation businesses in the U.S. currently operate as Exempt Wholesale Generators as defined under EPAct 1992. Thesebusinesses, subject to approval of FERC, have the right to sell power at market-based rates, either directly to the wholesale market or to a third-party offtaker such as a power marketer or utility/industrial customer. Under the Federal Power Act and FERC's regulations, approval from FERC tosell wholesale power at market-based rates is generally dependent upon a showing to FERC that the seller lacks market power in generation andtransmission, that the seller and its affiliates cannot erect other barriers to market entry and that there is no opportunity for abusive transactionsinvolving regulated affiliates of the seller.
The U.S. wholesale electricity market consists of multiple distinct regional markets that are subject to both federal regulation, as implementedby the FERC, and regional regulation as defined by rules designed and implemented by the RTOs, non-profit corporations that operate the regionaltransmission grid and maintain organized markets for electricity. These rules, for the most part, govern such items as the determination of themarket mechanism for setting the system marginal price for energy and the establishment of guidelines and incentives for the addition of newcapacity. See Item 1A.— Risk Factors for additional discussion on U.S. regulatory matters.
Business Description — Additional businesses include thermal, wind, and solar generating facilities, of which our U.S. Renewables businessesand AES Hawaii are the most significant.
U.S. Renewables
sPower owns and/or operates more than 150 utility and distributed electrical generation systems across the U.S., actively buying, developing,constructing and operating renewable assets in the United States.
AES Distributed Energy develops, constructs and sells electricity generated by photovoltaic solar energy systems to public sector, utility, andnon-profit entities through PPAs.
Excluding sPower wind plants, AES has 734 MW of wind capacity in the U.S., located in California, Texas and West Virginia. Mountain View I& II, Mountain View IV and Buffalo Gap I sell under long-term PPAs through which the energy price on the entire production of these facilities isguaranteed. Laurel Mountain, Buffalo Gap II and Buffalo Gap III are exposed to the volatility of energy prices and their revenue may changematerially as energy prices fluctuate in their respective markets of operations.
AES manages the U.S. Renewables portfolio as part of its broader investments in the U.S., leveraging operational and commercial resourcesto supplement the experienced subject matter experts in the renewable industry to achieve optimal results. A portion of U.S. Solar projects and themajority of wind projects have been financed with tax equity structures. Under these tax equity structures, the tax equity investors receive a portionof the economic attributes of the facilities, including tax attributes that vary over the life of the projects. Based on certain liquidation provisions of thetax equity structures, this could result in variability to earnings attributable to AES compared to the earnings reported at the facilities.
AES Hawaii
AES Hawaii receives a fuel payment from its offtaker under a PPA expiring in 2022, which is based on a fixed rate indexed to the GrossNational Product — Implicit Price Deflator. Since the fuel payment is not directly linked to market prices for fuel, the risk arising from fluctuations inmarket prices for coal is borne by AES Hawaii.
To mitigate the risk from such fluctuations, AES Hawaii has entered into fixed-price coal purchase commitments that end in December 2018;the business could be subject to variability in coal pricing beginning in January 2019. To mitigate fuel risk beyond December 2018, AES Hawaiiplans to seek additional fuel purchase commitments on favorable terms. However, if market prices rise and AES Hawaii is unable to procure coalsupply on favorable terms, the financial performance of AES Hawaii could be materially and adversely affected.
Environmental Regulation — For a discussion of environmental laws and regulations affecting the U.S. business, see Item 1.— United StatesEnvironmental and Land-Use Legislation and Regulations .
Key Financial Drivers — U.S. thermal generation's financial results are driven by fuel costs and outages. The Company has entered into long-term fuel contracts to mitigate the risks associated with fluctuating prices. In
19

addition, major maintenance requiring units to be off-line is performed during periods when power demand is typically lower. The financial results ofU.S. Wind are primarily driven by increased production due to faster and less turbulent wind and reduced turbine outages. In addition, PJM andERCOT power prices impact financial results for the wind projects that are operating without long-term contracts for all or some of their capacity.The financial results of U.S. Solar are primarily driven by the amount of sunshine hours available at the facilities, cell maintenance and growth inprojects. Tax reform enacted December 22, 2017 will change the taxation of U.S. Generation’s operations beginning in 2018. For additional detailssee Key Trends and Uncertainties in Item 7.— Management’s Discussion and Analysis of Financial Condition and Results of Operations .
Construction and Development — Planned capital projects include the AES Southland re-powering described above. In addition to the newconstruction project, U.S. Generation performs capital projects related to major plant maintenance, repairs and upgrades to be compliant with newenvironmental laws and regulations.
Andes SBUGeneration — Our Andes SBU has generation facilities in three countries — Chile, Colombia and Argentina. AES Gener, which owns all of our
assets in Chile, Chivor in Colombia and TermoAndes in Argentina, as detailed below, is a publicly listed company in Chile. AES has a 66.7%ownership interest in AES Gener and this business is consolidated in our financial statements.
Operating installed capacity of our Andes SBU totals 9,326 MW, of which 44% , 45% and 11% are located in Argentina, Chile and Colombia,respectively. The following table lists our Andes SBU generation facilities:
Business Location Fuel GrossMW AES Equity
Interest Year Acquired orBegan Operation Contract
Expiration Date Customer(s)
Chivor Colombia Hydro 1,000 67% 2000 Short-term Various
Tunjita Colombia Hydro 20 67% 2016 Colombia Subtotal 1,020 Guacolda (1) Chile Coal 760 33% 2000 2018-2032 Various
Electrica Santiago (2) Chile Gas/Diesel 750 67% 2000 Gener-SIC (3) Chile Hydro/Coal/Diesel/Biomass 690 67% 2000 2020-2037 Various
Electrica Angamos
Chile
Coal
558
67%
2011
2026-2037
Minera Escondida, MineraSpence, Quebrada Blanca
Cochrane
Chile
Coal
550
40%
2016
2030-2034
SQM, Sierra Gorda, QuebradaBlanca
Gener-SING (4)
Chile
Coal
277
67%
2000
2018-2037
Minera Escondida, Codelco,
SQM, Quebrada BlancaElectrica Ventanas (5) Chile Coal 272 67% 2010 2025 Gener
Electrica Campiche (6) Chile Coal 272 67% 2013 2020 Gener
Andes Solar Chile Solar 21 67% 2016 2037 Quebrada Blanca
Cochrane ES Chile Energy Storage 20 40% 2016 Electrica Angamos ES Chile Energy Storage 20 67% 2011 Norgener ES (Los Andes) Chile Energy Storage 12 67% 2009 Chile Subtotal 4,202 TermoAndes (7) Argentina Gas/Diesel 643 67% 2000 Short-term Various
AES Gener Subtotal 5,865 Alicura Argentina Hydro 1,050 100% 2000 2017 Various
Paraná-GT Argentina Gas/Diesel 845 100% 2001 San Nicolás Argentina Coal/Gas/Oil 675 100% 1993 Guillermo Brown (8) Argentina Gas/Diesel 576 —% 2016 Los Caracoles (8)
Argentina
Hydro
125
—%
2009
2019
Energia Provincial Sociedad del
Estado (EPSE)Cabra Corral Argentina Hydro 102 100% 1995 Various
Ullum Argentina Hydro 45 100% 1996 Various
Sarmiento Argentina Gas/Diesel 33 100% 1996 El Tunal Argentina Hydro 10 100% 1995 Various
Argentina Subtotal 3,461 9,326 _____________________________
(1) Guacolda plants: Guacolda 1, 2, 3, 4, and 5 are unconsolidated entities for which the results of operations are reflected in Net equity in earnings of affiliates . The Company's ownership in Guacolda is heldthrough AES Gener, a 67%-owned consolidated subsidiary. AES Gener owns 50% of Guacolda, resulting in an AES effective ownership in Guacolda of 33%.
(2) Electrica Santiago plants: Nueva Renca, Renca, Los Vientos and Santa Lidia. AES Gener announced the sale of this business in December 2017.(3) Gener-SIC plants: Alfalfal, Laguna Verde, Laguna Verde Turbogas, Laja, Maitenes, Queltehues, Ventanas 1, Ventanas 2 and Volcán.(4) Gener-SING plants: Norgener 1 and Norgener 2.(5) Electrica Ventanas plant: Ventanas 3.
20

(6) Electrica Campiche plant: Ventanas 4.(7) TermoAndes is located in Argentina, but is connected to both the SING in Chile and the SADI in Argentina.(8) AES operates these facilities through management or O&M agreements and owns no equity interest in these businesses.
Under construction — The following table lists our plants under construction in the Andes SBU:
Business Location Fuel Gross MW AES Equity Interest Expected Date of Commercial Operations
Alto Maipo Chile Hydro 531 62% 1H 2019 (1)
_____________________________(1) This date is under review pending lender approval of an EPC contract. See Item 7.— Management's Discussion and Analysis of Financial Condition and Results of Operations—Key Trends and Uncertainties
—Alto Maipo .
The following map illustrates the location of our Andes facilities:
Andes BusinessesChile
Regulatory Framework and Market Structure — Chile has operated a single power market, managed by CISEN, since November 2017.Previously, Chile had two main power systems, the SIC and SING, largely as a result of its geographic shape and size. The SIC servedapproximately 92% of the Chilean population, including the densely populated Santiago Metropolitan Region, representing 75% of the country'selectricity demand. The SING, which mainly supplied mining companies, served about 6% of the Chilean population, representing 25% of Chile'selectricity demand.
CISEN coordinates all generation and transmission companies previously in the SIC and SING. CISEN minimizes the operating costs of theelectricity system, while maximizing service quality and reliability requirements. CISEN dispatches plants in merit order based on their variable costof production, allowing for electricity to be supplied at the lowest available cost. In the SIC, thermoelectric generation is required to fulfill demand notsatisfied by hydroelectric output and is critical to guaranteeing reliable and dependable electricity supply under dry hydrological conditions. In theSING, which includes the Atacama Desert, the driest desert in the world, thermoelectric capacity represents the majority of installed capacity ashydroelectric generation is not feasible. The
21

fuels used for thermoelectric generation, mainly coal, diesel and LNG, are indexed to international prices. In 2017, the generation installed capacityin the Chilean market was composed primarily of the following:
SIC SING CISEN
Thermoelectric 44% 84% 54%
Hydroelectric 38% — 29%
Solar 8% 11% 9%
Wind 7% 3% 6%
Other 3% 2% 2%
In the SIC, where hydroelectric plants represent a large part of the system's installed capacity, hydrological conditions influence reservoir waterlevels and largely determine the dispatch of the system's hydroelectric and thermoelectric generation plants and, therefore, influence spot marketprices. Precipitation in Chile occurs principally in the southern cone mostly from June to August, and is scarce during the remainder of the year.During 2017 spot prices were also affected by a 14% increase in installed renewable energy capacity, totaling 564 MW, bringing total installedcapacity to 4,719 MW.
The Ministry of Energy has primary responsibility for the Chilean electricity system directly or through the National Energy Commission and theSuperintendency of Electricity and Fuels. The electricity sector is divided into three segments: generation, transmission and distribution. Generally,generation and transmission growth is subject to market competition, while transmission operation and distribution are subject to price regulation. InJuly 2016, modifications to the Transmission Law were enacted. This law establishes that the transmission system will be completely paid for by theend-users, gradually allocating the costs on the demand side from 2019 through 2034.
All generators can sell energy through contracts with regulated distribution companies or directly to unregulated customers. Unregulatedcustomers are customers whose connected capacity is higher than 2 MW. Customers with connected capacity between 0.5 MW and 2.0 MW canopt for regulated or unregulated contracts for a minimum period of four years. By law, both regulated and unregulated customers are required topurchase all electricity under contract. Generators may also sell energy to other power generation companies on a short-term basis at negotiatedprices outside the spot market. Electricity prices in Chile are denominated in U.S. dollars, although payments are made in Chilean pesos.
Business Description — In Chile, through AES Gener, we are engaged in the generation and supply of electricity (energy and capacity) in theCISEN. AES Gener is the second largest generation operator in Chile with installed capacity of 4,150 MW, excluding energy storage andTermoAndes, and a market share of approximately 18% as of December 31, 2017.
AES Gener owns a diversified generation portfolio in Chile in terms of geography, technology, customers and fuel source. AES Gener'sinstalled capacity is located near the principal electricity consumption centers, including Santiago, Valparaiso and Antofagasta. AES Gener's diversegeneration portfolio provides flexibility for the management of contractual obligations with regulated and unregulated customers, provides backupenergy to the spot market and facilitates operations under a variety of market and hydrological conditions.
Our commercial strategy in Chile aims to maximize margin while reducing cash flow volatility. To achieve this, we contract a significant portionof our coal and hydroelectric baseload capacity under long-term agreements with a diversified customer base. Power plants not considered withinour baseload capacity (higher variable cost units, mainly diesel and gas fired) sell energy on the spot market when operating during scarce systemsupply conditions, such as low hydrology and/or plant outages. In Chile, sales on the spot market are made only to other generation companies whoare members of the CISEN at the system marginal cost.
AES Gener currently has long-term contracts, with an average remaining term of approximately 11 years, with regulated distributioncompanies and unregulated customers, such as mining and industrial companies. In general, these long-term contracts include both fixed andvariable payments which are indexed to the CPI and the international price of coal. In some cases, the contracts include pass-through of fuel andregulatory costs, including changes in law.
In addition to energy payments, AES Gener also receives capacity payments to remain available during periods of peak demand. CISENannually determines the capacity requirements for each power plant. The capacity price is fixed semiannually by the National Energy Commissionand indexed to the CPI and other relevant indices.
The Chilean government allows the export of energy generated from plants in the SING to Argentina utilizing transmission lines owned by AESGener.
Environmental Regulation — During 2016, the Environmental Ministry updated the Atmospheric
22

Decontamination Plans for the Santiago, Ventanas and Huasco regions. Our plants in these regions — Nueva Renca, Ventanas and Guacolda —are evaluating operational improvements and additional investments to comply with the new requirements. As of December 31, 2017, the regulatordid not issue the decree that provides the framework and time line for these investments.
Chilean law requires every electricity generator to supply a certain portion of its total contractual obligations with NCREs. Generationcompanies are able to meet this requirement by constructing NCRE generation capacity (wind, solar, biomass, geothermal and small hydroelectrictechnology) or purchasing NCREs from qualified generators. Non-compliance with the NCRE requirements will result in fines. AES Gener currentlyfulfills the NCRE requirements utilizing AES Gener's solar and biomass power plants and by purchasing NCREs from other generation companies.AES Gener has also sold and contracted certain water rights to companies to construct small hydro projects to ensure longer term NCREcompliance. At present, AES Gener is in the process of negotiating additional NCRE supply contracts to meet the future requirements.
In September 2014 a new emission tax, or "green tax" was enacted, effective January 2017. Emissions of PM, SO 2 , NO x and CO 2 aremonitored for plants with an installed capacity over 50 MW; these emissions are taxed. In the case of CO 2 , the tax will be equivalent to $5 per tonemitted. PPAs originating from the SING have "change of law" clauses allowing the Company to pass the green tax costs to customers. DistributionPPAs originating from the SIC do not allow for the pass through of these costs; however, the costs can be passed through to unregulatedcustomers. The Company is currently discussing the pass-through mechanism with each distribution customer.
Key Financial Drivers — Hedge levels at AES Gener limit volatility to the underlying financial drivers. In addition, financial results are likely tobe driven by many factors, including, but not limited to:
• Dry hydrology scenarios• Forced outages• Changes in current regulatory rulings altering the ability to pass through or recover certain costs• Fluctuations of the Chilean peso (our hedging strategy reduces this risk, but some residual risk remains)• Tax policy changes• Legislation promoting renewable energy and strengthening regulations on thermal generation assets• Market price risk when re-contracting
Construction and Development — AES Gener continues to advance the construction of the 531 MW Alto Maipo run-of-the-river hydroelectricplant. Alto Maipo is the largest project in construction in the SIC market. When completed, it will include 74 km of tunnel works, two caverns, 17 kmof transmission lines as part of the construction, and is 90% underground. Alto Maipo has two main contractors and covers three adjacent valleys inthe Chilean Andes. The project currently employs approximately 4,500 people. See Item 7.— Management's Discussion and Analysis of FinancialCondition and Results of Operations—Key Trends and Uncertainties—Alto Maipo .
Colombia
Regulatory Framework and Market Structure — Electricity supply in Colombia is concentrated in one main system, the SIN, whichencompasses one-third of Colombia's territory, providing electricity to 97% of the country's population. The SIN's installed capacity, primarilyhydroelectric (70%) and thermal (29%), totaled 16,782 MW as of December 31, 2017. The marked seasonal variations in Colombia's hydrologyresult in price volatility in the short-term market. In 2017, 87% of total energy demand was supplied by hydroelectric plants.
The electricity sector in Colombia operates under a competitive market framework for the generation and sale of electricity, and a regulatedframework for transmission and distribution. The distinct activities of the electricity sector are governed by Colombian laws and the CREG. Othergovernment entities have a role in the electricity industry, including the Ministry of Mines and Energy, which defines the government's policy for theenergy sector; the Public Utility Superintendency of Colombia, which is in charge of overseeing utility companies; and the Mining and EnergeticPlanning Unit, which is in charge of expansion of the generation and transmission network.
The generation sector is organized on a competitive basis with companies selling their generation in the wholesale market at the short-termprice or under bilateral contracts with other participants, including distribution companies, generators and traders, and unregulated customers atfreely negotiated prices. The National Dispatch Center dispatches generators in merit order based on bid offers in order to ensure that demand willbe satisfied by the lowest cost combination of available generating units.
23

The Colombian government and regulatory entity carried out various studies to improve the market. As a result, resolutions were issued in2017 capping spot prices to reflect the true value of thermal plants; allowing small scale self-generation and distributed generation the option to sellexcess energy to the grid; and a proposal to change the methodology for determining capacity payments for existing plants based on a new auctionwith the objective of reducing the reliability charges.
Business Description — We operate in Colombia through AES Chivor, a subsidiary of AES Gener, which owns a hydroelectric plant with aninstalled capacity of 1,000 MW, and Tunjita, a 20 MW run-of-river hydroelectric, both located approximately 160 km east of Bogota. AES Chivor’sinstalled capacity accounted for approximately 6% of system capacity by the end of 2017. AES Chivor is dependent on hydrological conditions,which influence generation and spot prices of non-contracted generation in Colombia.
AES Chivor's commercial strategy aims to reduce margin volatility by selling a significant portion of expected generation by bidding in publicauctions for one to three year contracts, mainly with distribution companies. The remaining generation is sold on the spot market to other generationand trading companies at the system marginal cost. Additionally, AES Chivor receives reliability payments to maintain plant availability duringperiods of power scarcity, such as adverse hydrological conditions, in order to prevent power shortages.
Key Financial Drivers — Hydrological conditions largely influence Chivor's generation abilities. Maintaining the appropriate contract level, whilemaximizing revenue through the sale of excess generation, is key to Chivor's results of operations. Hedge levels at Chivor limit volatility in theunderlying financial drivers. In addition to hydrology, financial results are driven by many factors, including, but not limited to:
• Forced outages• Fluctuations of the Colombian peso• Exposure to the spot market
Argentina
Regulatory Framework and Market Structure — Argentina has one main power system, the SADI, which serves 96% of the country. As ofDecember 31, 2017, the installed capacity of the SADI totaled 36,505 MW. The SADI's installed capacity is composed primarily of thermoelectricgeneration (63%) and hydroelectric generation (32%).
Thermoelectric generation in the SADI is primarily natural gas. However, natural gas shortages in winter (June to August), lead to the use ofalternative fuels, such as oil and coal. The SADI is also highly reliant on hydroelectric plants. Hydrological conditions impact reservoir water levelsand largely influence the dispatch of the system's hydroelectric and thermoelectric generation plants and, therefore, influence spot market prices.Precipitation in Argentina occurs principally in the southern cone mostly from June to August.
Regulatory Framework — The Argentine regulatory framework divides the electricity sector into generation, transmission and distribution. Thewholesale electric market is made up of generation companies, transmission companies, distribution companies and large customers who arepermitted to trade electricity. Generation companies can sell their output in the spot market or under PPAs. CAMMESA manages the electricitymarket and is responsible for dispatch coordination. The Electricity National Regulatory Agency is in charge of regulating public service activities andthe Ministry of Energy and Mining, through the Energy Secretariat, regulates system framework and grants concessions or authorizations for sectoractivities. In Argentina, the regulator establishes the prices for electricity and fuel and adjusts them periodically for inflation, changes in fuel pricesand other factors. In these cases, our businesses are particularly sensitive to changes in regulation.
The Argentine electric market is an "average cost" system, with generators being compensated for fixed costs and non-fuel variable costs plusa rate of return. All fuels, except coal, are to be provided by CAMMESA. Thermoelectric natural gas plants, such as TermoAndes, are not subject toCAMMESA fuel purchases and are able to purchase gas directly from the producers.
Argentina’s new administration continues introducing regulatory improvements with the intention to normalize the energy sector. Among others,Resolution 19/2017 was enacted to set higher tariffs, denominated in USD, for energy and capacity prices. The Resolution also ceased non-cashretention of margins. Likewise, long term USD denominated PPAs have been awarded to develop 9.4 GW of new capacity (thermal and renewable)through the execution of competitive auctions. During 2017, the government has continued increasing residential and industrial tariffs in order toreduce the system deficit aiming to have all subsidies removed by the end of 2019.
AES Argentina has contributed certain accounts receivable to fund the construction of new power plants under FONINVEMEM agreements.These receivables accrue interest and are collected in monthly installments over 10
24

years once the related plants begin to operate. AES Argentina has three FONINVEMEM funds related to operational plants under which paymentsare being received. AES Argentina will receive a pro rata ownership interest in these plants once the accounts receivables have been fully repaid.See Item 7.— Management's Discussion and Analysis of Financial Condition and Results of Operations—Capital Resources and Liquidity—Long-Term Receivables and Note 6 . — Financing Receivables in Item 8.— Financial Statements and Supplementary Data of this Form 10-K for furtherdiscussion of receivables in Argentina.
Business Description — As of December 31, 2017, AES Argentina operates 4,104 MW, representing 11% of the country's total installedcapacity. The installed capacity in the SADI includes the TermoAndes plant, a subsidiary of AES Gener, which is connected both to the SADI andthe Chilean SING markets. AES Argentina has a diversified generation portfolio.
AES Argentina primarily sells its energy in the wholesale electric market where prices are largely regulated. In 2017, approximately 93% of theenergy was sold in the wholesale electric market and 7% was sold under contract, as a result of contract sales made by TermoAndes.
All thermoelectric facilities not subject to fuel procurement from CAMMESA, including the portion of TermoAndes plant committed to EnergyPlus contracts, are able to use natural gas and receive gas supplied from Argentine sources. In recent years, gas supply restrictions in Argentina,particularly during the winter season, have affected the operation of certain plants, such as the TermoAndes plant.
Since December 2015, foreign currency controls were lifted, allowing the Argentine peso to float under the administration of Argentinian CentralBank. Over the course of 2017, the Argentine peso devalued by approximately 17%.
Tax Regulation — On December 29, 2017, Law 27430 was enacted in Argentina, which introduced a tax reform with several changes in theArgentine tax system, to be effective on January 1, 2018. This tax reform will reduce the statutory corporate tax rate of companies from 35% to 30%in 2018 and 2019, and 25% from 2020 onward. The law also eliminates the Equalization Tax on the distribution of earnings generated after January1, 2018. The Equalization Tax is to be replaced with a withholding tax on dividends at the rate of 7% for 2018 and 2019, and 13% from 2020onward.
Key Financial Drivers — Financial results are driven by many factors, including, but not limited to:
• Forced outages• Exposure to fluctuations of the Argentine peso• Changes in hydrology• Timely collection of FONINVEMEM installment and outstanding receivables (See Note 6 .— Financing Receivables in Item 8.— Financial
Statements and Supplementary Data of this Form 10-K for further discussion)• Gas prices for contracted generation (Energy Plus)
Brazil SBUOur Brazil SBU operates three generation businesses. Tietê is a publicly listed company in Brazil. AES controls and consolidates Tietê through
its 24% economic interest.
Generation — Operating installed capacity of our three generation businesses totals 3,684 MW. The following table lists our Brazil SBUgeneration facilities:
Business Location Fuel Gross MW AES Equity Interest Year Acquired or BeganOperation Contract Expiration
Date Customer(s)
Tietê (1) Brazil Hydro 2,658 24% 1999 2029 Various
Alto Sertão II Brazil Wind 386 24% 2017 2033-2035 Tietê Subtotal 3,044 Uruguaiana Brazil Gas 640 46% 2000 3,684
_____________________________
(1) Tietê plants: Água Vermelha (1,396 MW), Bariri (143 MW), Barra Bonita (141 MW), Caconde (80 MW), Euclides da Cunha (109 MW), Ibitinga (132 MW), Limoeiro (32 MW), Mogi-Guaçu (7 MW), NovaAvanhandava (347 MW), Promissão (264 MW), Sao Joaquim (3 MW) and Sao Jose (4 MW).
25

The following map illustrates the location of our Brazil facilities:
Brazil BusinessesBrazil Utility
Business Description — Eletropaulo distributes electricity to the greater São Paulo area, Brazil's main economic and financial center.Eletropaulo holds a 30-year concession that expires in 2028. AES owns 17% of the economic interest in Eletropaulo. In November 2017,Eletropaulo converted its preferred shares into ordinary shares and transitioned the listing of those shares into the Novo Mercado, which is a listingsegment of the Brazilian stock exchange with the highest standards of corporate governance. Upon conversion of the preferred shares into ordinaryshares, AES no longer controlled Eletropaulo and accounted for its ownership interest as an equity method investment. In December 2017, all thecriteria were met for Eletropaulo to be classified as a discontinued operation.
Brazil Generation
Regulatory Framework and Market Structure — In Brazil, the Ministry of Mines and Energy determines the maximum amount of energy a plantcan sell, called a physical guarantee, representing the long-term average expected energy production of the plant. Under current rules, physicalguarantee energy can be sold to distribution companies through long-term regulated auctions or under unregulated bilateral contracts with largeconsumers or energy trading companies.
The ONS is responsible for managing the operation of the national grid. The ONS dispatches generators based on hydrological conditions,reservoir levels, electricity demand, fuel prices and thermal generation availability. The consequences of unfavorable hydrology are (i) thermal plantsbecome more expensive to dispatch in the system, (ii) the need for hydro plants to purchase energy in the spot market to fulfill their contractualobligations and (iii) high spot prices. Given the importance of hydro generation in the country, the ONS sometimes reduces dispatch of hydrofacilities and increases dispatch of thermal facilities to maintain reservoir levels in the system.
26

A mechanism known as the MRE was created under ONS to share hydrological risk across MRE hydro generators. If the hydro plantsgenerate less than the total MRE physical guarantee, the hydro generators may need to purchase energy in the short-term market. When total hydrogeneration is higher than the total MRE physical guarantee, the surplus is proportionally shared among its participants and they may sell the excessenergy on the spot market.
Brazil has installed capacity of 156,436 MW, which is primarily hydroelectric (64%) and thermal (17%).
Business Description — Tietê has a portfolio of 12 hydroelectric power plants in the state of São Paulo with total installed capacity of 2,658MW. Tietê represents approximately 10% of the total generation capacity in the state of São Paulo. Tietê operates under a 30-year concessionexpiring in 2029. AES owns 24% of Tietê and is the controlling shareholder and manages and consolidates this business. Tietê's strategy is tocontract most of its physical guarantee requirements and sell the remaining portion in the spot market. The commercial strategy is reassessedperiodically according to changes in market conditions, hydrology and other factors. Tietê generally sells available energy through medium-termbilateral contracts.
Under the concession agreement, Tietê is required to increase its capacity in the state of São Paulo by 15% (or 400 MW). In 2017, Tietêacquired two solar plants and was successful in a bid to develop a third solar project in the state of São Paulo, totaling 75% of the obligation. Theseassets are not subject to return at the end of the concession. Also in 2017, Tietê acquired Alto Sertão II Wind Complex (“Alto Sertão II”) located inthe state of Bahia, with an installed capacity of 386 MW. Alto Sertão II is subject to 20-year PPAs expiring between 2033 and 2035. Through itsownership of Tietê, AES owns a 24% economic interest in Alto Sertão II.
Uruguaiana is a 640 MW gas-fired combined cycle power plant located in the town of Uruguaiana in the state of Rio Grande do Sul. AESmanages and has a 46% economic interest in the plant. The plant's operations have been largely suspended due to the unavailability of gas. Theplant operated for short periods of time in 2013, 2014 and 2015 when short-term supply of LNG was sourced for the facility. The plant did notoperate in 2016 or 2017. AES has evaluated several alternatives to bring gas supply on a competitive basis to Uruguaiana. One of the challenges isthe capacity restrictions on the Argentinean pipeline, especially during the winter season when gas demand in Argentina is very high. Uruguaianacontinues to work toward securing gas on a long-term basis.
Key Financial Drivers — As the system is highly dependent on hydroelectric generation, electricity pricing is driven by hydrology in Brazil. Plantavailability is also a significant financial driver as in times of high hydrology AES is more exposed to the spot market. The availability of gas is also adriver for continued operations at Uruguaiana. Tietê's financial results are driven by many factors, including, but not limited to:
• Hydrology, impacting quantity of energy generated in MRE
• Demand growth
• Re-contracting price
• Asset management and plant availability
• Cost management
• Ability to execute on its growth strategy
Construction and Development — As part of the initiative to pursue opportunities in renewable generation, Tietê has invested in three specialpurpose entities slated to construct photovoltaic power plants with a total projected capacity of 91 MW, subject to 20-year PPAs. Commercialoperation is expected by the end of 2018.
MCAC SBUOur MCAC SBU has a portfolio of distribution businesses and generation facilities, including renewable energy, in five countries, with a total
capacity of 3,381 MW and distribution networks serving 1.4 million customers as of December 31, 2017 .
27
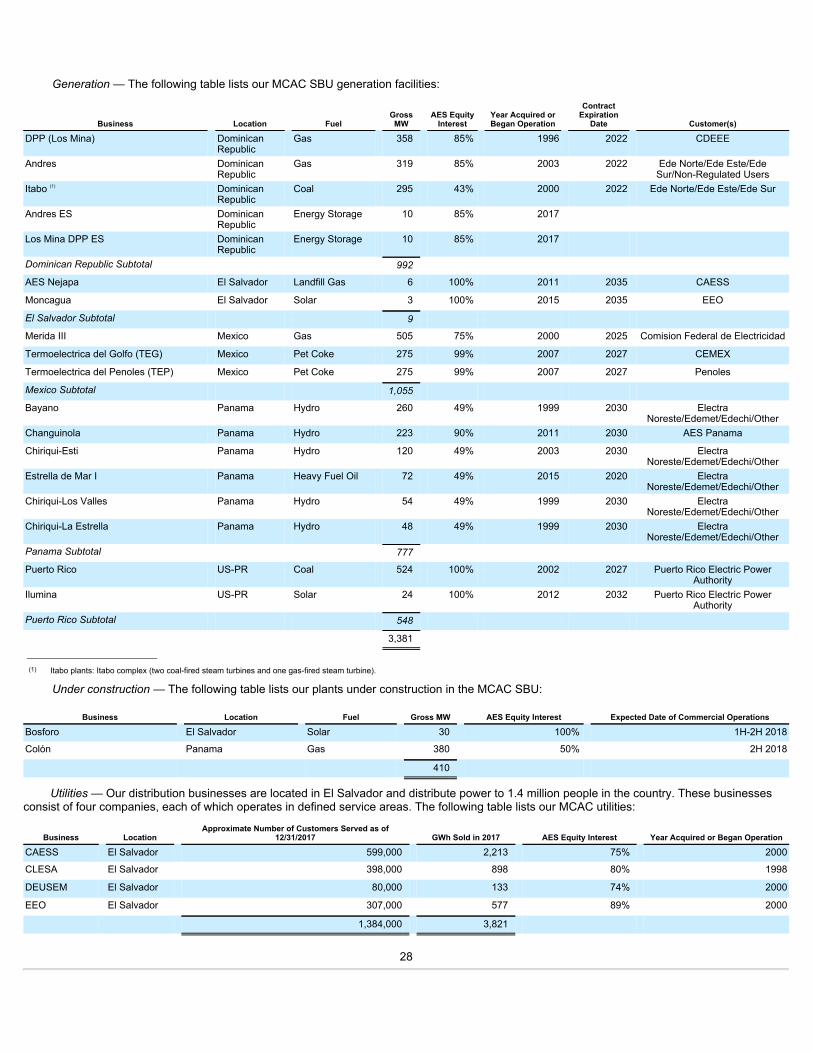
Generation — The following table lists our MCAC SBU generation facilities:
Business Location Fuel GrossMW AES Equity
Interest Year Acquired orBegan Operation
ContractExpiration
Date Customer(s)
DPP (Los Mina)
DominicanRepublic
Gas
358
85%
1996
2022
CDEEE
Andres
DominicanRepublic
Gas
319
85%
2003
2022
Ede Norte/Ede Este/EdeSur/Non-Regulated Users
Itabo (1)
DominicanRepublic
Coal
295
43%
2000
2022
Ede Norte/Ede Este/Ede Sur
Andres ES
DominicanRepublic
Energy Storage
10
85%
2017
Los Mina DPP ES
DominicanRepublic
Energy Storage
10
85%
2017
Dominican Republic Subtotal 992 AES Nejapa El Salvador Landfill Gas 6 100% 2011 2035 CAESS
Moncagua El Salvador Solar 3 100% 2015 2035 EEO
El Salvador Subtotal 9 Merida III Mexico Gas 505 75% 2000 2025 Comision Federal de Electricidad
Termoelectrica del Golfo (TEG) Mexico Pet Coke 275 99% 2007 2027 CEMEX
Termoelectrica del Penoles (TEP) Mexico Pet Coke 275 99% 2007 2027 Penoles
Mexico Subtotal 1,055 Bayano
Panama
Hydro
260
49%
1999
2030
Electra
Noreste/Edemet/Edechi/OtherChanguinola Panama Hydro 223 90% 2011 2030 AES Panama
Chiriqui-Esti
Panama
Hydro
120
49%
2003
2030
ElectraNoreste/Edemet/Edechi/Other
Estrella de Mar I
Panama
Heavy Fuel Oil
72
49%
2015
2020
ElectraNoreste/Edemet/Edechi/Other
Chiriqui-Los Valles
Panama
Hydro
54
49%
1999
2030
ElectraNoreste/Edemet/Edechi/Other
Chiriqui-La Estrella
Panama
Hydro
48
49%
1999
2030
ElectraNoreste/Edemet/Edechi/Other
Panama Subtotal 777 Puerto Rico
US-PR
Coal
524
100%
2002
2027
Puerto Rico Electric Power
AuthorityIlumina
US-PR
Solar
24
100%
2012
2032
Puerto Rico Electric Power
AuthorityPuerto Rico Subtotal 548 3,381 _____________________________
(1) Itabo plants: Itabo complex (two coal-fired steam turbines and one gas-fired steam turbine).
Under construction — The following table lists our plants under construction in the MCAC SBU:
Business Location Fuel Gross MW AES Equity Interest Expected Date of Commercial Operations
Bosforo El Salvador Solar 30 100% 1H-2H 2018
Colón Panama Gas 380 50% 2H 2018
410
Utilities — Our distribution businesses are located in El Salvador and distribute power to 1.4 million people in the country. These businessesconsist of four companies, each of which operates in defined service areas. The following table lists our MCAC utilities:
Business Location Approximate Number of Customers Served as of12/31/2017 GWh Sold in 2017 AES Equity Interest Year Acquired or Began Operation
CAESS El Salvador 599,000 2,213 75% 2000
CLESA El Salvador 398,000 898 80% 1998
DEUSEM El Salvador 80,000 133 74% 2000
EEO El Salvador 307,000 577 89% 2000
1,384,000 3,821
28

The following map illustrates the location of our MCAC facilities:
MCAC BusinessesDominican Republic
Regulatory Framework and Market Structure — The Dominican Republic energy market is a decentralized industry consisting of generation,transmission and distribution businesses. Generation companies can earn revenue through short- and long-term PPAs, ancillary services, and acompetitive wholesale generation market. All generation, transmission and distribution companies are subject to and regulated by the GeneralElectricity Law.
Two main agencies are responsible for monitoring compliance with the General Electricity Law:
• The National Energy Commission drafts and coordinates the legal framework and regulatory legislation. They propose and adopt policiesand procedures to implement best practices, support the proper functioning and development of the energy sector, and promote investment.
• The Superintendence of Electricity's main responsibilities include monitoring compliance with legal provisions, rules, and technicalprocedures governing generation, transmission, distribution and commercialization of electricity. In addition, they monitor behavior in theelectric market in order to avoid monopolistic practices. In addition to the two agencies responsible for monitoring compliance with theGeneral Electricity Law, the Industrial and Commerce Ministry supervises commercial and industrial activities in the Dominican Republic aswell as the fuels and natural gas commercialization to the end users.
The Dominican Republic has one main interconnected system with approximately 3,692 MW of installed capacity, composed primarily ofthermal (79%), hydroelectric (17%) and wind (4%) generation plants/farms.
Business Description — AES Dominicana consists of three operating subsidiaries, Itabo, Andres and Los Mina. With a total of 992 MW ofinstalled capacity, AES has 26% of the system capacity and supplies approximately 46% of energy demand via these generation facilities. AES hasa strategic partnership with the Estrella and Linda Groups ("Estrella-Linda"), a consortium of two leading Dominican industrial groups that manage adiversified business portfolio.
Itabo is 42.5% owned by AES. Itabo owns and operates two thermal power generation units with a total of 295 MW of installed capacity. Itabo'sPPAs with government-owned distribution companies expired in July 2016. The
29

Dominican Corporation of State Electrical Companies sponsored a bidding process, which was awarded in April 2017 for a total of 196 MW ofinstalled capacity and secured supply and competitive pricing for actual and future distribution energy requirements.
Andres and Los Mina are owned 85% by AES. Andres has a combined cycle natural gas turbine, an energy storage solution and generationcapacity of 329 MW as well as the only LNG import facility in the country, with 160,000 cubic meters of storage capacity. Los Mina has a combinedcycle with two natural gas turbines, an energy storage solution and generation capacity of 368 MW. Both Andres and Los Mina have in aggregate697 MW of installed capacity, of which 625 MW is mostly contracted until 2022 with government-owned distribution companies and large customers.
AES Dominicana has a long-term LNG purchase contract through 2023 for 33.6 trillion btu/year with a price linked to NYMEX Henry Hub. TheLNG contract terms allow delivery to various markets in Latin America. These plants capitalize on the competitively-priced LNG contract by sellingpower where the market is dominated by fuel oil-based generation. Andres has a long-term contract to sell re-gasified LNG to industrial users withinthe Dominican Republic using compression technology to transport it within the country thereby capturing demand from industrial and commercialcustomers.
Key Financial Drivers — Financial results are driven by many factors, including, but not limited to:
• Changes in spot prices due to fluctuations in commodity prices, (since fuel is a pass-through cost under the PPAs, any variation in oil priceswill impact the spot sales for both Andres and Itabo).
• Contracting levels and the extent of capacity awarded.
• Supply shortages in the near term (next two to three years) may provide opportunities for short term upside, but new generation is expectedto come online beginning 2018.
• Additional sales derived from domestic natural gas demand are expected to continue providing income and growth based on the entry offuture projects and the fees from the infrastructure service.
El Salvador
Regulatory Framework and Market Structure — El Salvador national electric market is composed of generation, distribution, transmission andmarketing businesses, as well as a market and system operator and regulatory agencies. The operation of the transmission system and thewholesale market is based on production costs with a marginal economic model that rewards efficiency and allows investors to have guaranteedprofits, while end users get affordable rates. The energy sector is governed by the General Electricity Law which defines two regulatory entitiesresponsible for monitoring its compliance:
• The National Energy Council is the highest authority on energy policy and strategy, and the coordinating body for the different energysectors. One of its main objectives is to promote investment in non-conventional renewable sources to diversify the energy matrix.
• The General Superintendence of Electricity and Telecommunications ("SIGET") regulates the market and sets consumer prices. SIGET,jointly with the distribution companies in El Salvador, completed the tariff reset process in December 2017 and developed the tariffcalculation applicable from 2018 until 2022.
El Salvador has a national electric grid which interconnects with Guatemala and Honduras. The sector has approximately 1,882 MW ofinstalled capacity, composed primarily of thermal (40%), hydroelectric (29%), geothermal (11%), biomass (13%), solar (5%) and other renewable(2%) generation plants/farms.
Business Description — AES El Salvador is the majority owner of four of the five distribution companies operating in El Salvador (CAESS,CLESA, EEO and DEUSEM). AES El Salvador's territory covers 77% of the country and accounted for 4,124 GWh of the wholesale market energypurchases during 2017, or about 65% market share.
Construction and Development — As part of the initiative to pursue opportunities in renewable generation, AES El Salvador has entered into ajoint venture with Corporacion Multi-Inversiones, a Guatemalan investment group, to develop, construct, and operate Bosforo, a 100 MW solar farmwith an estimated cost of $158 million. 10 MW of the project are under construction and expected to become operational during the first half of 2018.The energy produced by this project will be contracted directly by AES' utilities in El Salvador.
Panama
Regulatory Framework and Market Structure — The Panamanian power sector is composed of three distinct operating business units:generation, distribution and transmission. Generators can enter into long-term PPAs with distributors or unregulated consumers. In addition,generators can enter into alternative supply contracts with each
30

other. Outside of the PPA market, generators may buy and sell energy in the short-term market. Generators can only contract up to their firmcapacity.
Three main agencies are responsible for monitoring compliance with the General Electricity Law:
• The SNE has the responsibilities of planning, supervising and controlling policies of the energy sector within Panama. With theseresponsibilities, the SNE proposes laws and regulations to the executive agencies that regulate the procurement of energy andhydrocarbons for the country.
• The regulator of public services, known as the ASEP, is an autonomous agency of the government. ASEP is responsible for the control andoversight of public services, including electricity, the transmission and distribution of natural gas utilities, and the companies that providesuch services.
• The National Dispatch Center implements the economic dispatch of electricity in the wholesale market. The National Dispatch Center'sobjectives are to minimize the total cost of generation and maintain the reliability and security of the electric power system. Short-termpower prices are determined on an hourly basis by the last dispatched generating unit. Physical generation of energy is determined by theNational Dispatch Center regardless of contractual arrangements.
Panama's current total installed capacity is 2,983 MW, composed primarily of hydroelectric (57%) and thermal (38%) generation.
Business Description — AES owns and operates five hydroelectric plants and one thermoelectric power plant, Estrella del Mar I, representing705 MW and 72 MW of hydro and thermal capacity, respectively and 26% of the total installed capacity in Panama.
The majority of hydroelectric plants in Panama are based on run-of-river technology, with the exception of the 260 MW Bayano plant.Hydrological conditions have an important influence on profitability. Variations in hydrology can result in excess or a shortfall in energy productionrelative to our contract obligations. Hydro generation is generally in a shortfall position during low inflows from January through May, AES Panamamay purchase energy in the short-term market to cover contractual obligations. During the remainder of the year, energy generation is generally inexcess of contractual commitments, excess generation is sold on the short-term market.
A portion of the PPAs with distribution companies will expire in December 2018, reducing the total contracted capacity in Panama from 496MW to 430 MW. Another portion contracted through Estrella del Mar I will expire in June 2020, reducing the total contracted capacity to 350 MWthrough December 2030.
Key Financial Drivers — Financial results are driven by many factors, including, but not limited to:
• Changes in hydrology which impacts commodity prices and exposes the business to variability in the cost of replacement power.
• Fluctuations in commodity prices, mainly oil, affect the cost of thermal generation and spot prices.
• Constraints imposed by the capacity of the transmission lines connecting the west side of the country with the load, keeping surplus powertrapped during the wet season.
• Country demand as GDP growth is expected to remain strong over the short and medium term.
Construction and Development — In August 2015, AES executed a partnership agreement with Deeplight Corporation, a minority partner, toconstruct, operate, and maintain a natural gas power generation plant and a liquefied natural gas terminal, in order to purchase and sell energy andcapacity as well as commercialize natural gas and other ancillary activities related to natural gas. As of December 31, 2017, amounts capitalizedinclude $666 million recorded in construction-in-progress and the project is scheduled to initiate operations in the second half of 2018.
Mexico
Regulatory Framework and Market Structure — Mexico has a single electric grid, the National Electricity System, covering all of Mexico'sterritory through the Interconnected National Electricity, Baja California and Southern Baja California Systems. The market comprises generation,transmission, distribution and commercialization segments.
Three main agencies, in addition to the Ministry of Energy, are responsible for monitoring compliance with the Electric Industry Law:
• The Energy Regulatory Commission is responsible for the establishment of directives, orders, methodologies and standards oriented toregulate the electric and fuel markets.
31

• The National Center for Energy Control, as new ISO, is responsible for managing the wholesale electricity market, transmission anddistribution infrastructure, planning the network developments, guaranteeing open access to network infrastructure, executing competitivemechanisms to cover regulated demand, and setting transmission charges.
• The Federal Electricity Commission ("CFE") owns the transmission and distribution grids and it is also the country's basic supplier. CFE isthe offtaker for IPP generators, and together with its own power units has more than 50% of the current generation market share.
Mexico has an installed capacity totaling 74 GW with a generation mix primarily comprising of thermal (71%) and hydroelectric (17%) plants.
Business Description — AES has 1,055 MW of installed capacity in Mexico. The TEG and TEP pet coke-fired plants, located in Tamuin, SanLuis Potosi, supply power to their offtakers under long-term PPAs expiring in 2027 with a 90% availability guarantee. TEG and TEP secure their fuelunder a long-term contract.
Merida is a CCGT, located in Merida, on Mexico's Yucatan Peninsula. Merida sells power to the CFE under a capacity and energy based long-term PPA through 2025. Additionally, the plant purchases natural gas and diesel under a long-term contract with one of the CFE’s subsidiaries, thecost of which is then passed through to CFE under the terms of the PPA.
AES has partnered in a joint venture with Grupo BAL to co-invest in power and related infrastructure projects in Mexico, focusing on renewableand natural gas generation . The first development, a 306 MW wind project, expects to begin construction in the first half of 2018.
Key Financial Drivers — Financial results are driven by many factors, including, but not limited to:• As the companies are fully contracted, improved operational performance provides additional benefits, including performance incentives
and/or excess energy sales.• Changes in the Locational Marginal Price and the Transmission High Tension Tariff.
Puerto Rico
Regulatory Framework and Market Structure — Puerto Rico has a single electric grid managed by PREPA, a state-owned entity that suppliesvirtually all of the electric power consumed in Puerto Rico and generates, transmits and distributes electricity to 1.5 million customers. The PuertoRico Energy Commission ("PREC") is the main regulatory body. The commission approves wholesale and retail rates, sets efficiency andinterconnection standards, and oversees PREPA's compliance with Puerto Rico's renewable portfolio standard.
Puerto Rico's electricity is 98% produced by thermal plants (47% from petroleum, 34% from natural gas, 17% from coal).
Business Description — AES Puerto Rico owns and operates a coal-fired cogeneration plant and a solar plant of 524 MW and 24 MW,respectively, representing approximately 9% of the installed capacity in Puerto Rico. Both plants have long-term PPAs expiring in 2027 and 2032,respectively, with PREPA. See Item 7.— Management's Discussion and Analysis of Financial Condition and Results of Operations—Key Trends andUncertainties—Macroeconomic and Political—Puerto Rico for further discussion of the long-term PPA with PREPA.
Eurasia SBUGeneration — Our Eurasia SBU has generation facilities in seven countries. Operating installed capacity totaled 6,143 MW. The following table
lists our Eurasia SBU generation facilities:
32

Business Location Fuel GrossMW AES Equity
Interest Year Acquired orBegan Operation Contract
Expiration Date Customer(s)
Maritza Bulgaria Coal 690 100% 2011 2026 Natsionalna Elektricheska
St. Nikola Bulgaria Wind 156 89% 2010 2025 Natsionalna Elektricheska
Bulgaria Subtotal 846 OPGC (1) India Coal 420 49% 1998 2026 GRID Corporation Ltd.
India Subtotal 420 Amman East Jordan Gas 381 37% 2009 2033 National Electric Power Company
IPP4 Jordan Heavy Fuel Oil 250 36% 2014 2039 National Electric Power Company
Jordan Subtotal 631 Elsta (1)(2)
Netherlands
Gas
630
50%
1998
2018
DowBenelux/Delta/Nutsbedrijven/Essent
EnergyNetherlands ES Netherlands Energy Storage 10 100% 2015 Netherlands Subtotal 640 Masinloc (3)
Philippines
Coal
630
51%
2008
Mid- and long-
term Various
Masinloc ES (3) Philippines Energy Storage 10 51% 2016 Philippines Subtotal 640 Ballylumford
United Kingdom
Gas
1,015
100%
2010
2023
Power NI/Single Electricity Market
(SEM)Kilroot (4) United Kingdom Coal/Oil 701 99% 1992 Single Electricity Market (SEM)
Kilroot ES United Kingdom Energy Storage 10 100% 2015 United Kingdom Subtotal 1,726 Mong Duong 2 Vietnam Coal 1,240 51% 2015 2040 EVN
Vietnam Subtotal 1,240 6,143 _____________________________(1) Unconsolidated entity, the results of operations of which are reflected in Equity in Earnings of Affiliates.(2) Plant will be sold upon expiration of the PPA in September 2018.(3) Announced the sale of this business in December 2017.(4) Includes Kilroot Open Cycle Gas Turbine.
Under construction — The following table lists our plants under construction in the Eurasia SBU:
Business Location Fuel Gross MW AES Equity Interest Expected Date of Commercial Operations
OPGC 2 (1) India Coal 1,320 49% 2H 2018
Delhi ES India Energy Storage 10 50% 2H 2018
1,330 (2) _____________________________(1) Unconsolidated entity, accounted for as an equity affiliate.(2) In December 2017, AES announced the sale of Masinloc. As such, 335 MW under construction at Masinloc 2 has been excluded from this table.
33

The following map illustrates the location of our Eurasia facilities:
Eurasia BusinessesBulgaria
Regulatory Framework and Market Structure — The electricity sector in Bulgaria allows both regulated and competitive segments. NEK, thestate-owned electricity public supplier and energy trading company, acts as a single buyer and seller for all regulated transactions on the market.Electricity outside the regulated market trades at bilaterally negotiated prices in an open market or on the day-ahead IBEX market. In March 2017,IBEX introduced an intra-day market platform. In addition, IBEX launched a platform for trading long-term contracts in Q4 2016. Effective January 1,2018 all electricity outside regulated quotas may only be traded via the IBEX platform. Bulgaria is working with the European Commission and theWorld Bank on a model that will allow the gradual phase out of regulated energy prices.
Bulgaria’s power sector is supported by a diverse generation mix, a stable regulatory environment, universal access to the grid, and numerouscross-border connections in neighboring countries. In addition, it plays an important role in the energy balance on the Balkan region.
Bulgaria has 13 GW of installed capacity enabling the country to meet and exceed domestic demand and export energy. Installed capacity is39% coal-fired and 16% nuclear.
Business Description — Our Maritza plant is a 690 MW lignite fuel thermal power plant commissioned in June 2011. Maritza's entire poweroutput is contracted with NEK under a 15-year PPA, expiring in May 2026.
AES also owns an 89% economic interest in the St. Nikola wind farm with 156 MW of installed capacity. St. Nikola was commissioned in March2010. Its entire power output is contracted with NEK under a 15-year PPA expiring in March 2025.
Our plants in Bulgaria operate under long-term PPAs with NEK, which has previously experienced liquidity issues. In April 2016, NEK paidMaritza its overdue receivables in exchange for amending the PPA and reducing the capacity payment to Maritza by 14% through the remainingPPA term. Maritza has experienced timely collection of outstanding receivables from NEK since May 2016. However, NEK's liquidity positionremains subject to political conditions and regulatory changes in Bulgaria.
The DG Comp is reviewing NEK’s PPA with Maritza pursuant to the European Commission’s state aid rules.
34

Maritza believes that its PPA is legal and in compliance with all applicable laws. See Item 7.— Management's Discussion and Analysis of FinancialCondition and Results of Operations—Key Trends and Uncertainties—Regulatory .
Key Financial Drivers — Both businesses, Maritza and St. Nikola, operate under PPA contracts. For the duration of the PPA, financial resultsare driven by many factors, including, but not limited to:
• Regulatory changes to the Bulgaria power market• Results of the DG Comp review• The availability of the operating units• The level of wind resources for St. Nikola• NEK's ability to meet the payment terms of the PPA contract
United Kingdom
Regulatory Framework and Market Structure — The electricity sector in Northern Ireland is operated by the SEM. It is based on a grossmandatory pool within which all generators with capacity higher than 10 MW must trade the physical delivery of power. Generators are centrallydispatched based on merit order and physical constraints of the system.
In addition, the SEM has a capacity payment mechanism to ensure that sufficient generating capacity is offered to the market. The capacitypayment is derived from a regulated Euro-based capacity payment pool, established a year ahead by the regulatory authority. Capacity paymentsare based on the expected availability of a unit and are subject to volatility due to seasonal influences, demand, and the actual generation availableover each trading period. In the second quarter of 2018 regulatory authorities are expected to update the market framework to reflect the integrationof the SEM day-ahead and intra-day markets with EU energy markets, introduce a new competitive capacity auction, and revise arrangements forsystem services to incentivize flexibility. The market will be renamed I-SEM (Integrated Single Electricity Market) to reflect these changes.
Northern Ireland's power sector is supported by a diverse generation mix, a stable regulatory environment, universal access to the grid, andconnections between Northern and Southern Ireland and the UK. Installed capacity in the SEM is 49% gas fired and 26% from renewable sources,resulting in sensitivity to gas prices relative to order of merit. SEM has also set a target of 40% renewable generation by 2020.
Business Description — AES has two generation plants in the United Kingdom, both of which are located in Northern Ireland within the GreaterBelfast region. Kilroot is a 701 MW coal-fired merchant plant, with an additional 10 MW of energy storage, that bids into the I-SEM. Kilroot's coalfired units failed to clear in the first I-SEM capacity auction process. Consequently, AES announced its intent to shut down the coal units on orbefore May 31, 2018, pending the results of an assessment by the regulator to determine the long term needs of the Northern Ireland power grid.Ballylumford is a 1,015 MW gas-fired plant, of which 600 MW is contracted under a PPA with Power NI Power Procurement Business expiring in2023. The 415 MW remaining capacity is bid into the SEM market, with 310 MW subject to a supplemental Local Reserve Services Agreement withthe system operator. One of Ballylumford's B-station units failed to clear the aforementioned I-SEM capacity auction; as a result, AES intends toretire that unit at the end of December 2018.
Key Financial Drivers — Financial results are driven by many factors, including, but not limited to:• Regulatory changes to the market structure and payment mechanisms• Investments to maintain compliance with European Union environmental legislation• Availability of the operating units and order of merit• Commodity prices (gas, coal and CO 2 ) and sufficient market liquidity to hedge prices in the short-term• Electricity demand in the SEM (including impact of wind generation)
Kazakhstan
Regulatory Framework and Market Structure — The Kazakhstan government has grouped generators into fifteen groups based on a numberof factors, including plant type and fuel used. Each group has a fixed tariff-cap level and all generators must sell electricity at or below theirrespective tariff-cap levels.
Business Description — AES operated four plants with a total capacity of 2,776 MW. Our two hydroelectric plants, representing 1,033 MW,were operated under a concession agreement until early October 2017, when the plants were transferred back to the Republic of Kazakhstan. Theremaining 1,743 MW coal-fired capacity was sold in the second quarter of 2017.
35

Jordan
Regulatory framework and market structure — The Jordan electricity transmission market is a single-buyer model with the state ownedNEPCO responsible for transmission. NEPCO generally enters into long term power purchase agreements with IPP's to fulfill energy procurementrequests from distribution utilities. The sector is prioritizing renewable energy development, with 2,200 MW of renewable energy installed capacityexpected by year 2020, 700 MW of which was already connected to the grid.
Business Description — In Jordan, AES has a 37% controlling interest in Amman East, a 381 MW oil/gas-fired plant fully contracted with thenational utility under a 25-year PPA expiring in 2033, and a 36% controlling interest in the IPP4 plant, a 250 MW oil/gas-fired peaker plant whichcommenced operations in July 2014, fully contracted with the national utility until 2039. We consolidate the results in our operations as we havecontrolling interest in these businesses.
Construction and Development — AES, in conjunction with Mitsui & Co of Japan and NEBRAS Power of Qatar, have signed an agreement toconstruct a 52 MW solar project in Jordan. Construction of the plant has not begun, but is expected to be completed mid-2019 to coincide with thestart of a PPA to provide energy to NEPCO through 2038.
India
Regulatory framework and Market Structure — The power sector is largely dominated by state and central government-owned generation anddistribution utilities. Electricity is generally sold to state utilities under long-term PPAs. The tariffs are fixed on yearly basis by the ElectricityRegulatory Commissions of the Centre and the State(s) or determined through competitive bidding process. Orissa Electricity RegulatoryCommission ("OERC") regulates the electricity purchase and procurement process for the Distribution Licensees, including the price at which theelectricity from generating companies shall be procured for supply within the state of Orissa. OERC also facilitates interstate transmission andwheeling of electricity. OERC is guided by the National Electricity Policy, National Electricity Plan and Tariff Policy issued by the Government ofIndia.
The power sector in India is composed of coal, gas, hydroelectric, renewable and nuclear energy. Total installed capacity as of December 31,2017 was 331 GW, of which 66% is thermal generation. Renewable energy is adding capacity at a rapid pace and currently represents 18% of thetotal installed capacity.
Business Description — OPGC is a 420 MW coal-fired generation facility located in the state of Odisha. OPGC has a 30-year PPA withGRIDCO Limited, a state utility, expiring in 2026. OPGC is an unconsolidated entity and results are reported as Net equity in earnings of affiliates onour Consolidated Statements of Operations.
Construction and Development — AES has one 1,320 MW coal-fired project under construction and expected to begin operations by the end of2018. As of December 31, 2017 , total capitalized costs at the project level were $1.1 billion. Currently, 50% of the expansion capacity, or 660 MW,is contracted with GRIDCO for a period of 25 years. The remaining 50% of the generation capacity is proposed to be offered to GRIDCO under anew PPA.
Environmental Regulation — The Ministry of Environment, Forest and Climate Change in India amended the Environment (Protection) Ruleswith stricter emission limits for thermal power plants via their notification issued in December 2015. All existing plants installed before December 31,2003 are required to meet revised emission limits within two years and any new thermal power plants that will be operational from January 1, 2017are required to operate with the revised emission limits. As a result of this amendment, FGD systems need to be installed in the existing OPGC unitsto comply with the new SO 2 emissions requirements, and new design options modifications to the schedule of the expansion project have beenevaluated. As these amendments will require substantial investment to meet the revised environmental guidelines across the public and privatepower sectors in India, amendments and implementation time lines are still under review by the Ministry of Power, Government of India. We believethe cost of complying with the new environmental regulations for particulate matters, water consumption, So x and No x limits will be a pass-throughin the GRIDCO tariff for both the existing and expansion units.
Key Financial Drivers — Financial results are driven by many factors, including, but not limited to:• Operating performance of the facility
• Regulatory and environmental policy changes
• Tariff determination by the OERC
36

Philippines
Regulatory Framework and market structure — The Philippines' power sector is divided into generation, transmission, distribution and supply.Generation and supply are open and competitive sectors, while transmission and distribution are regulated sectors. The ERC is an independentregulatory body performing administrative and other functions for the electric industry.
The Philippine power market is divided into three grids representing the three major island groups, Luzon, Visayas and Mindanao. Luzon,which includes Manila, the country's largest island, has limited interconnection with Visayas, and represents 86% of the total demand of bothregions. Luzon and Visayas together have an installed capacity of approximately 18 GW. For Luzon, the largest generation sources are 50% coaland 29% natural gas.
The sale of power is conducted primarily through medium- or long-term bilateral contracts between generation companies and distributionutilities which are approved by the ERC. Distribution utilities and electric cooperatives are allowed to pass on to their end-users the bilateral contractrates, including WESM purchases, as approved by the ERC.
Business Description — The Masinloc plant is a 630 MW gross coal-fired plant located in Zambales, Philippines, is interconnected to the LuzonGrid, and is 51% owned by AES. More than 95% of Masinloc's current peak capacity is contracted through bilateral contracts. 430 MW is contractedwith Meralco, the largest distribution company in the Philippines, under a PPA expiring in 2019. Following an ERC Order limiting power supplyagreement extensions to one year, a supplemental PPA extending the contract with Meralco an additional three years was submitted for approvalwith the ERC. Masinloc's remaining contracts on existing units expire between 2018 and 2026. Masinloc has been granted a retail electricity supplierlicense from the ERC and currently markets power to contestable customers. Unlike Masinloc's contracts with distribution utilities, it's contract withcontestable customers do not require ERC approval to be implemented. On December 17, 2017, the Company entered into an agreement to sell itsMasinloc business. Closing is expected during the first half of 2018 subject to certain regulatory approvals.
Construction and Development — AES is constructing a 335 MW gross unit expansion to the Masinloc plant. The total capitalized cost as ofDecember 31, 2017 is $394 million. The expansion unit is included in the Masinloc facilities to be sold as announced in December. The sale isexpected to close in the first half of 2018.
Key Financial Drivers — Financial results are driven by many factors, including, but not limited to:
• Operating performance of the facility
• Demand from contracted customers
• Whole sale electricity price in the market
Vietnam
Regulatory Framework and Market Structure — The Ministry of Industry and Trade is primarily responsible for formulating a program torestructure the power industry, developing the electricity market, and promulgating electricity market regulations. The fuel supply is owned by thegovernment through Vinacomin, a state owned entity, and Petro Vietnam.
The Vietnam power market is divided into three regions (North, Central and South), with total installed capacity of approximately 45 GW. Thefuel mix in Vietnam is composed primarily of hydropower at 35% and coal at 37%. EVN, the national utility, owns 57% of installed generationcapacity.
The government is in the process of realigning EVN-owned companies into three different independent operations in order to create acompetitive power market. A competitive electricity market has already been established. A pilot competitive wholesale electricity market has beendeveloped, and will be implemented over the next five years. The retail market will undergo similar reforms after 2022. BOT power plants will notparticipate in the power market; alternatively the single buyer will bid the tariff on the power pool on their behalf.
Business Description — Mong Duong II is a 1,240 MW gross coal-fired plant located in Quang Ninh Province of Vietnam and was constructedunder a BOT service concession agreement expiring in 2040. This is the first and largest coal-fired BOT plant using pulverized coal fired boilertechnology in Vietnam. The BOT company has a PPA with EVN and a Coal Supply Agreement with Vinacomin both expiring in 2040.
Key Financial Drivers — Financial results are driven by many factors, including, but not limited to, the operating performance and availability ofthe facility.
37

Financial Data by Country
See the table with our consolidated operations for each of the three years ended December 31, 2017 , 2016 and 2015 , and property, plantand equipment as of December 31, 2017 and 2016 , by country, in Note 15 — Segment and Geographic Information included in Item 8.— FinancialStatements and Supplementary Data of this Form 10-K for further information.
Environmental and Land-Use Regulations
The Company faces certain risks and uncertainties related to numerous environmental laws and regulations, including existing and potentialGHG legislation or regulations, and actual or potential laws and regulations pertaining to water discharges, waste management (including disposal ofcoal combustion residuals), and certain air emissions, such as SO 2 , NO X , PM, mercury and other hazardous air pollutants. Such risks anduncertainties could result in increased capital expenditures or other compliance costs which could have a material adverse effect on certain of ourU.S. or international subsidiaries, and our consolidated results of operations. For further information about these risks, see Item 1A.— Risk Factors— Our businesses are subject to stringent environmental laws and regulations; Our businesses are subject to enforcement initiatives fromenvironmental regulatory agencies; and Regulators, politicians, non-governmental organizations and other private parties have expressed concernabout greenhouse gas, or GHG, emissions and the potential risks associated with climate change and are taking actions which could have amaterial adverse impact on our consolidated results of operations, financial condition and cash flows in this Form 10-K. For a discussion of the lawsand regulations of individual countries within each SBU where our subsidiaries operate, see discussion within Item 1.— Business of this Form 10-Kunder the applicable SBUs.
Many of the countries in which the Company does business also have laws and regulations relating to the siting, construction, permitting,ownership, operation, modification, repair and decommissioning of, and power sales from, electric power generation or distribution assets. Inaddition, international projects funded by the International Finance Corporation, the private sector lending arm of the World Bank, or many otherinternational lenders are subject to World Bank environmental standards or similar standards, which tend to be more stringent than local countrystandards. The Company often has used advanced generation technologies in order to minimize environmental impacts, such as combined fluidizedbed boilers and advanced gas turbines, and environmental control devices such as flue gas desulphurization for SO 2 emissions and selectivecatalytic reduction for NO x emissions.
Environmental laws and regulations affecting electric power generation and distribution facilities are complex, change frequently and havebecome more stringent over time. The Company has incurred and will continue to incur capital costs and other expenditures to comply with theseenvironmental laws and regulations. See Item 7 .— Management's Discussion and Analysis of Financial Condition and Results of Operations —Environmental Capital Expenditures in this Form 10-K for more detail. The Company may be required to make significant capital or otherexpenditures to comply with these regulations. There can be no assurance that the businesses operated by the subsidiaries of the Company will beable to recover any of these compliance costs from their counterparties or customers such that the Company's consolidated results of operations,financial condition and cash flows would not be materially affected.
Various licenses, permits and approvals are required for our operations. Failure to comply with permits or approvals, or with environmentallaws, can result in fines, penalties, capital expenditures, interruptions or changes to our operations. Certain subsidiaries of the Company are subjectto litigation or regulatory action relating to environmental permits or approvals. See Item 3. — Legal Proceedings in this Form 10-K for more detailwith respect to environmental litigation and regulatory action.
United States Environmental and Land-Use Legislation and Regulations
In the U.S. the CAA and various state laws and regulations regulate emissions of air pollutants, including SO 2 , NO X , PM, GHGs, mercury andother hazardous air pollutants. Certain applicable rules are discussed in further detail below.
CSAPR — CSAPR addresses the "good neighbor" provision of the CAA, which prohibits sources within each state from emitting any airpollutant in an amount which will contribute significantly to any other state’s nonattainment, or interference with maintenance of, any NAAQS. TheCSAPR required significant reductions in SO 2 and NO X emissions from power plants in many states in which subsidiaries of the Company operate.The Company is required to comply with the CSAPR in several states, including Ohio, Indiana, Oklahoma and Maryland. The CSAPR isimplemented, in part, through a market-based program under which compliance may be achievable
38

through the acquisition and use of emissions allowances created by the EPA. The Company complies with CSAPR through operation of existingcontrols and purchases of allowances on the open market, as needed.
On October 26, 2016, the EPA published a final rule to update the CSAPR to address the 2008 ozone NAAQS ("CSAPR Update Rule"). TheCSAPR Update Rule finds that NO x ozone season emissions in 22 states (including Indiana, Maryland, Ohio and Oklahoma) affect the ability ofdownwind states to attain and maintain the 2008 ozone NAAQS, and, accordingly, the EPA issued federal implementation plans that both updatedexisting CSAPR NO x ozone season emission budgets for electric generating units within these states and implemented these budgets throughmodifications to the CSAPR NO x ozone season allowance trading program. Implementation started in the 2017 ozone season (May-September2017). Affected facilities began to receive fewer ozone season NO x allowances in 2017, resulting in the need to purchase additional allowances.While the Company's 2017 CSAPR compliance costs were immaterial, the future availability of and cost to purchase allowances to meet theemission reduction requirements is uncertain at this time, but it could be material if certain facilities will need to purchase additional allowancesbased on reduced allocations.
New Source Review ("NSR") — The NSR requirements under the CAA impose certain requirements on major emission sources, such aselectric generating stations, if changes are made to the sources that result in a significant increase in air emissions. Certain projects, includingpower plant modifications, are excluded from these NSR requirements, if they meet the RMRR exclusion of the CAA. There is ongoing uncertainty,and significant litigation, regarding which projects fall within the RMRR exclusion. The EPA has pursued a coordinated compliance and enforcementstrategy to address NSR compliance issues at the nation's coal-fired power plants. The strategy has included both the filing of suits against powerplant owners and the issuance of NOVs to a number of power plant owners alleging NSR violations. See Item 3.— Legal Proceedings in thisForm 10-K for more detail with respect to environmental litigation and regulatory action, including a NOV issued by the EPA against IPL concerningNSR and prevention of significant deterioration issues under the CAA.
In 2000, Stuart Station received an NOV from the EPA alleging that certain activities undertaken in the past are outside the scope of theRMRR exclusion. Hutchings Station also received such an NOV in 2009. Additionally, generation units partially owned by AES but operated by otherutilities have received such NOVs relating to equipment repairs or replacements alleged to be outside the RMRR exclusion. The NOVs issued toAES-operated plants have not been pursued through litigation by the EPA.
If NSR requirements were imposed on any of the power plants owned by the Company's subsidiaries, the results could have a materialadverse impact on the Company's business, financial condition and results of operations. In connection with the imposition of any such NSRrequirements on IPL, the utility would seek recovery of any operating or capital expenditures related to air pollution control technology to reduceregulated air emissions, but not fines or penalties; however, there can be no assurances that they would be successful in that regard.
Regional Haze Rule — The EPA's "Regional Haze Rule" is intended to reduce haze and protect visibility in designated federal areas, and setsguidelines for determining BART at affected plants and how to demonstrate "reasonable progress" toward eliminating man-made haze by 2064. TheRegional Haze Rule required states to consider five factors when establishing BART for sources, including the availability of emission controls, thecost of the controls and the effect of reducing emission on visibility in Class I areas (including wilderness areas, national parks and similar areas).The statute requires compliance within five years after the EPA approves the relevant SIP or issues a federal implementation plan, althoughindividual states may impose more stringent compliance schedules.
In September 2017, the EPA published a final rule affirming the continued validity of the EPA's previous determination allowing states to relyon the CSAPR to satisfy BART requirements. All of the Company’s facilities that are subject to BART comply by meeting the requirements ofCSAPR.
The second phase of the Regional Haze Rule begins in 2019 and states must submit regional haze plans for this second implementationperiod in 2021, to continue to demonstrate reasonable progress towards reducing visibility impairment in Class I areas. States may need to requireadditional emissions controls for visibility impairing pollutants, including on BART sources, during the second implementation period. We currentlycannot predict the impact of this second implementation period, if any, on any of our Company’s U.S. subsidiaries.
National Ambient Air Quality Standards ("NAAQS") — Under the CAA, the EPA sets NAAQS for six principal pollutants considered harmful topublic health and the environment, including ozone, particulate matter, NO x and SO 2 , which result from coal combustion. Areas meeting theNAAQS are designated "attainment areas" while those that do not meet the NAAQS are considered "nonattainment areas." Each state must developa plan to bring nonattainment areas into compliance with the NAAQS, which may include imposing operating limits on individual plants. The EPA isrequired to review NAAQS at five-year intervals.
39

Based on the current and potential future ambient standards, certain of the states in which the Company's subsidiaries operate havedetermined or will be required to determine whether certain areas within such states meet the NAAQS. Some of these states may be required tomodify their State Implementation Plans to detail how the states will attain or maintain their attainment status. As part of this process, it is possiblethat the applicable state environmental regulatory agency or the EPA may require reductions of emissions from our generating stations to reachattainment status for ozone, fine particulate matter, NO x or SO 2 . The compliance costs of the Company's U.S. subsidiaries could be material.
On September 30, 2015, IDEM published its final rule establishing reduced SO 2 limits for IPL facilities in accordance with a new one-hourstandard of 75 parts per billion, for the areas in which IPL's Harding Street, Petersburg, and Eagle Valley Generating Stations operate. Thecompliance date for these requirements was January 1, 2017. No impact is expected for Eagle Valley or Harding Street Generating Stationsbecause these facilities ceased coal combustion prior to the compliance date. However, improvements to the existing FGD systems at IPL’sPetersburg station were required to meet the emission limits imposed by the rule. On April 26, 2017, the IURC approved IPL’s request for NAAQSSO 2 compliance at its Petersburg generation station with 80% of qualifying costs recovered through a rate adjustment mechanism and theremainder recorded as a regulatory asset for recovery in a subsequent rate case. The approved capital cost of the NAAQS SO 2 compliance plan isapproximately $29 million.
Greenhouse Gas Emissions — In January 2011, the EPA began regulating GHG emissions from certain stationary sources pursuant to twoCAA programs: the Title V Operating Permit program and the preconstruction permitting program for certain new construction or majormodifications, known as the PSD. Obligations relating to Title V permits include record-keeping and monitoring requirements. Sources subject toPSD can be required to implement BACT. If future modifications to our U.S.-based businesses' sources become subject to PSD for other pollutants,it may trigger GHG BACT requirements. The EPA has issued guidance on what BACT entails for the control of GHG and has now proposed NSPSfor modified and reconstructed units (see below) that will serve as a floor (maximum emission rate) for future BACT requirements. Individual statesmust determine what controls are required for facilities within their jurisdiction on a case-by-case basis. The ultimate impact of the BACTrequirements applicable to us on our operations cannot be determined at this time as our U.S.-based businesses will not be required to implementBACT until one of them constructs a new major source or makes a major modification of an existing major source. However, the cost of compliancecould be material.
On October 23, 2015, the EPA's rule establishing NSPS for new electric generating units became effective. The NSPS establish CO 2
emissions standards of 1400 lbs/MWh for newly constructed coal-fueled electric generating plants, which reflects the partial capture and storage ofCO 2 emissions from the plants. The NSPS for large, newly constructed natural gas combined cycle facilities is 1,000 lbs/MWh. These standardsapply to any electric generating unit with construction commencing after January 8, 2014. The EPA also promulgated NSPS applicable to modifiedand reconstructed electric generating units, which will serve as a floor for future BACT determinations for such units. The NSPS applicable tomodified and reconstructed coal-fired units will be 1,800 lbs CO 2 /MWh for sources with heat input greater than 2,000 MMBtu per hour. For smallersources, below 2,000 MMBtu per hour, the standard is 2,000 lbs CO 2 /MWh. The NSPS could have an impact on the Company's plans to constructand/or modify or reconstruct electric generating units in some locations.
On December 22, 2015, the EPA's final CO 2 emission rules for existing power plants under Clean Air Act Section 111(d) (called the CPP) alsobecame effective. The CPP provides for interim emissions performance rates that must be achieved beginning in 2022 and final emissionsperformance rates that must be achieved starting in 2030. Under the CPP, states are required to meet state-wide emission rate standards orequivalent mass-based standards, with the goal being a 32% reduction in total U.S. power sector emissions from 2005 levels by 2030. The CPPrequires states to submit, by 2016, implementation plans to meet the standards or a request for an extension to 2018. If a state fails to develop andsubmit an approvable implementation plan, the EPA will finalize a federal plan for that state. The full impact of the CPP would depend on thefollowing:
• whether and how the states in which the Company's U.S. businesses operate respond to the CPP;• whether the states adopt an emissions trading regime and, if so, which trading regime;• how other states respond to the CPP, which will affect the size and robustness of any emissions trading market; and• how other companies may respond in the face of increased carbon costs.
Several states and industry groups challenged the NSPS for CO 2 in the D.C. Circuit. Pursuant to a court order issued in August 2017, thelitigation is being held in indefinite abeyance pending further court order.
40

In addition, several states and industry groups filed petitions in the D.C. Circuit challenging the CPP and requested a stay of the rule while thechallenge was considered. The D.C. Circuit denied the stay and granted requests to consider the challenges on an expedited basis. On February 9,2016, the U.S. Supreme Court issued orders staying implementation of the CPP pending resolution of challenges to the rule. On March 28, 2017,the EPA filed a motion in the D.C. Circuit to hold the challenges to both the CPP and the GHG NSPS in abeyance in light of an Executive Ordersigned the same day. On April 28, 2017, the D.C. Circuit issued orders holding the challenges to both rules in abeyance for 60 days, withsubsequent extensions granted by the court. The most recent extension of the CPP litigation was set to expire in January 2018 but, on January 10,2018, the EPA filed a status report requesting that the court continue to hold the case in abeyance pending the conclusion of further rulemaking onthe CPP. On October 16, 2017, the EPA published in the Federal Register a proposed rule that would rescind the CPP. On December 28, 2017, theEPA published an Advance Notice of Proposed Rulemaking to solicit comments as EPA considers a potential rule to establish emission guidelinesto replace the CPP and limit GHG emissions from existing electric generating units under Section 111(d) of the CAA. Some states andenvironmental groups have opposed EPA’s most recent request to continue to hold the CPP appeals in abeyance and the D.C. Circuit has not yetacted upon EPA’s request.
By order of the U.S. Supreme Court, the CPP has been stayed pending resolution of the challenges to the rule. Due to the future uncertainty ofthe CPP, we cannot at this time determine the impact on our operations or consolidated financial results, but we believe the cost to comply with theCPP, should it be upheld and implemented in its current or a substantially similar form, could be material. The GHG NSPS remains in effect at thistime, and, absent further action from the EPA that rescinds or substantively revises the NSPS, it could impact any Company plans to constructand/or modify or reconstruct electric generating units in some locations, which may have a material impact on our business, financial condition orresults of operations.
The Company will likely not know the answers to the above questions regarding the CPP until later in 2018 or potentially 2019. As the firstcompliance period would not end until 2025, and because we cannot predict whether the CPP will survive the legal challenges or be repealed orreplaced through rulemaking, it is too soon to determine the CPP's potential impact on our business, operations or financial condition, but any suchimpact could be material.
Cooling Water Intake — The Company's facilities are subject to a variety of rules governing water use and discharge. In particular, theCompany's U.S. facilities are subject to the CWA Section 316(b) rule issued by the EPA that seeks to protect fish and other aquatic organisms byrequiring existing steam electric generating facilities to utilize the BTA for cooling water intake structures. On August 15, 2014, the EPA published itsfinal standards to protect fish and other aquatic organisms drawn into cooling water systems at large power plants and other industrial facilities.These standards require subject facilities that utilize at least 25% of the withdrawn water exclusively for cooling purposes and have a design intakeflow of greater than two million gallons per day to choose among seven BTA options to reduce fish impingement. In addition, facilities that withdrawat least 125 million gallons per day for cooling purposes must conduct studies to assist permitting authorities to determine whether and what site-specific controls, if any, would be required to reduce entrainment of aquatic organisms. This decision-making process would include public input aspart of permit renewal or permit modification. It is possible this process could result in the need to install closed-cycle cooling systems (closed-cyclecooling towers), or other technology. Finally, the standards require that new units added to an existing facility to increase generation capacity arerequired to reduce both impingement and entrainment that achieves one of two alternatives under national BTA standards for entrainment. It is notyet possible to predict the total impacts of this recent final rule at this time, including any challenges to such final rule and the outcome of any suchchallenges. However, if additional capital expenditures are necessary, they could be material.
AES Southland's current plan is to comply with the California State Water Resources Board's ("SWRCB") Statewide Water Quality ControlPolicy on the Use of Coastal and Estuarine Waters for Power Plant Cooling ("OTC Policy") by shutting down and permanently retiring all existinggenerating units at AES Alamitos, AES Huntington Beach and AES Redondo Beach that utilize OTC by December 31, 2020, the compliance dateincluded in the OTC Policy. New air-cooled combined cycle gas turbine generators and battery energy storage systems will be constructed at theAES Alamitos and AES Huntington Beach generating stations, and there is currently no plan to replace the OTC generating units at the AESRedondo Beach generating station. The execution of the implementation plan for compliance with the SWRCB's OTC Policy is entirely dependenton the Company's ability to execute on long-term power purchase agreements to support project financing of the replacement generating units atAES Alamitos and AES Huntington Beach. The SWRCB is currently reviewing the implementation plan and latest information on OTC generatingunit retirement dates and new generation availability to evaluate the impact on electrical system reliability, which could result in the extension ofOTC compliance dates for specific units. The Company’s California subsidiaries have signed 20-year term power purchase agreements withSouthern California
41

Edison for the new generating capacity which have been approved by the California Public Utilities Commission. Construction of new generatingcapacity began in June 2017 at AES Huntington Beach and July 2017 at AES Alamitos. Construction at both sites is on schedule and will require thefollowing existing OTC units to retire earlier than December 31, 2020 to provide interconnection capacity and/or emissions credits prior to startup ofthe new generating units:
• Redondo Beach Unit 7 - September 30, 2019
• Huntington Beach Unit 1 - December 31, 2019
• Alamitos Units 1, 2, and 6 - December 31, 2019
The remaining AES OTC generating units in California will be shutdown and permanently retired by December 31, 2020.
Power plants are required to comply with the more stringent of state or federal requirements. At present, the California state requirements aremore stringent and have earlier compliance dates than the federal EPA requirements, and are therefore applicable to the Company's Californiaassets. Challenges to the federal EPA's rule have been filed and consolidated in the U.S. Court of Appeals for the Second Circuit, althoughimplementation of the rule has not been stayed while the challenges proceed. The Company anticipates once-through cooling and CWA Section316(b) compliance regulations and costs would have a material impact on our consolidated financial condition or results of operations.
Water Discharges — On June 29, 2015, the EPA and the U.S. Army Corps of Engineers published a final rule defining federal jurisdiction overwaters of the U.S. This rule, which became effective on August 28, 2015, may expand or otherwise change the number and types of waters orfeatures subject to federal permitting. On October 9, 2015, the U.S. Court of Appeals for the Sixth Circuit issued an order to temporarily stay the"Waters of the U.S." rule nationwide while that court determined whether it had authority to hear the challenges to the rule. The order was inresponse to challenges brought by 18 states and followed an August 2015 court decision in the U.S. District Court of North Dakota to stay the rule in13 other states. On January 22, 2018, the U.S. Supreme Court decided that challenges to the rule must be reviewed in U.S. district courts andremanded the case to the U.S. Court of Appeals for the Sixth Circuit with instructions to dismiss the case for lack of jurisdiction. That action would liftthe nationwide stay of the rule, leaving the stay in place only for those 13 states addressed in the order issued by the U.S. District Court for theDistrict of North Dakota. On January 31, 2018, the EPA and the U.S. Army Corps of Engineers announced a rule that will delay the effective date ofthe "Waters of the U.S." rule by two years from the date the rule is published in the Federal Register. On June 27, 2017, the EPA proposed a rulethat would rescind the “Waters of the U.S.” rule and re-codify the definition of “Waters of the United States” that existed prior to the 2015 rule. Wecannot predict the outcome of the judicial challenges to the rule or the regulatory process to rescind the rule, but if the “Waters of the U.S.” rule isultimately implemented in its current or substantially similar form and survives the legal challenges, it could have a material impact on our business,financial condition or results of operations.
Certain of the Company's U.S.-based businesses are subject to National Pollutant Discharge Elimination System permits that regulate specificindustrial waste water and storm water discharges to the waters of the U.S. under the CWA. On January 7, 2013, the Ohio Environmental ProtectionAgency issued an NPDES permit for J.M. Stuart Station, which included a compliance schedule for performing a study to justify an alternate thermallimitation or take undefined measures to meet certain temperature limits. On February 1, 2013, DPL appealed various aspects of the final permit. Asa result of DPL’s decision to retire Stuart generating station, we do not expect a material impact.
On August 28, 2012, the IDEM issued NPDES permits to the IPL Petersburg, Harding Street and Eagle Valley generating stations, whichbecame effective in October 2012. These permits set new water quality-based effluent discharge limits for the Harding Street and Petersburgfacilities, as well as monitoring and other requirements designed to protect aquatic life, with full compliance required by October 2015. The extendedcompliance deadline was September 29, 2017 for IPL's Harding Street and Petersburg facilities through agreed orders with IDEM. The deadline forPetersburg to commission a portion of the treatment system was subsequently extended to April 11, 2018.
On November 3, 2015, the EPA published its final ELG rule to reduce toxic pollutants discharged into waters of the U.S. by power plants.These effluent limitations for existing and new sources include dry handling of fly ash, closed-loop or dry handling of bottom ash and more stringenteffluent limitations for flue gas de-sulfurization wastewater. The required compliance time lines for existing sources was to be established betweenNovember 1, 2018 and December 31, 2023. On September 18, 2017, the EPA published a final rule delaying certain compliance
42

dates of the ELG rule for two years while it administratively reconsiders the rule. IPL has installed a dry bottom ash handling system in response tothe CCR rule described below in advance of the ELG compliance date. As a result of the decision to retire Stuart and Killen generating stations, wedo not expect the ELG rule to have a material impact on these two stations. While we are still evaluating the effects of the rule on our other U.S.businesses, we anticipate that the implementation of its current requirements could have a material adverse effect on our results of operations,financial condition and cash flows, and a postponement or reconsideration of the rule that leads to less stringent requirements would likely offsetsome or all of the adverse effects of the rule.
Selenium Rule — In June 2016, the EPA published the final national chronic aquatic life criterion for the pollutant Selenium in fresh water.NPDES permits may be updated to include Selenium water quality based effluent limits based on a site specific evaluation process which includesdetermining if there is a reasonable potential to exceed the revised final Selenium water quality standards for the specific receiving water bodyutilizing actual and/or project discharge information for the generating facilities. As a result, it is not yet possible to predict the total impacts of thisfinal rule at this time, including any challenges to such final rule and the outcome of any such challenges. However, if additional capital expendituresare necessary, they could be material. IPL would seek recovery of these capital expenditures; however, there is no guarantee it would be successfulin this regard.
Waste Management — In the course of operations, the Company's facilities generate solid and liquid waste materials requiring eventualdisposal or processing. With the exception of coal combustion residuals ("CCR"), the wastes are not usually physically disposed of on our property,but are shipped off site for final disposal, treatment or recycling. CCR, which consists of bottom ash, fly ash and air pollution control wastes, isdisposed of at some of our coal-fired power generation plant sites using engineered, permitted landfills. Waste materials generated at our electricpower and distribution facilities may include asbestos, CCR, oil, scrap metal, rubbish, small quantities of industrial hazardous wastes such as spentsolvents, tree and land clearing wastes and polychlorinated biphenyl contaminated liquids and solids. The Company endeavors to ensure that all ofits solid and liquid wastes are disposed of in accordance with applicable national, regional, state and local regulations. On October 19, 2015, an EPArule regulating CCR under the Resource Conservation and Recovery Act as nonhazardous solid waste became effective. The rule establishednationally applicable minimum criteria for the disposal of CCR in new and currently operating landfills and surface impoundments, and may imposeclosure and/or corrective action requirements for existing CCR landfills and impoundments under certain specified conditions. The primaryenforcement mechanisms under this regulation would be actions commenced by the states and private lawsuits. On December 16, 2016, PresidentObama signed into law the Water Infrastructure Improvements for the Nation Act ("WIN Act"), which includes provisions to implement the CCR rulethrough a state permitting program, or if the state chooses not to participate, a possible federal permit program. On September 13, 2017, the EPAindicated that it would reconsider certain provisions of the CCR Rule in response to two petitions it received to reconsider the final rule. OnNovember 7, 2017, the EPA requested that legal challenges be held in abeyance and certain provisions of the rule be remanded without vacatur. Itis too early to determine whether the results of the groundwater monitoring data or the outcome of CCR litigation or a potential CCR Remand Rulemay have a material impact on our business, financial condition or results of operations.
The existing ash ponds at IPL's Petersburg Station do not meet certain structural stability requirements set forth in the CCR rule. IDEM hasextended IPL's deadline to comply with the requirements or cease use of the ash ponds to April 11, 2018.
Comprehensive Environmental Response, Compensation and Liability Act of 1980 — This act, also know as "Superfund," may be the sourceof claims against certain of the Company's U.S. subsidiaries from time to time. There is ongoing litigation at a site known as the South DaytonLandfill where a group of companies already recognized as potentially responsible parties have sued DP&L and other unrelated entities seeking acontribution toward the costs of assessment and remediation. DP&L is actively opposing such claims. In 2003, DP&L received notice that the EPAconsiders DP&L to be a potentially responsible party at the Tremont City landfill Superfund site. The EPA has taken no further action with respect toDP&L since 2003 regarding the Tremont City landfill. The Company is unable to determine whether there will be any liability, or the size of anyliability that may ultimately be assessed against DP&L at these two sites, but any such liability could be material to DP&L.
Unit Retirement and Replacement Generation — In addition to the five oil-fired peaking units IPL retired in the second quarter of 2013, the fourcoal-fired units at Eagle Valley were retired in April 2016. To replace this generation, IPL received approval from the IURC in May 2014 to build a644 to 685 MW CCGT at its Eagle Valley Station site in Indiana and refuel its Harding Street Station Units 5 and 6 from coal to natural gas(approximately 100 MW net capacity each) with a total budget of $655 million. The current estimated cost of these projects is $655 million. IPL wasgranted authority to accrue post in-service allowance for debt and equity funds used during construction, and to defer the recognition of depreciationexpense of the CCGT and refueling project. The costs to
43

build and operate the CCGT and the refueling project, other than fuel costs, will not be recoverable by IPL through rates until the conclusion of abase rate case proceeding with the IURC after construction is completed. The CCGT is expected to be completed in the first half of 2018, and therefueling project was completed in December 2015.
For a discussion of the retirement of AES Southland's OTC generating units due to U.S. cooling water intake regulations, please see —Cooling Water Intake, above.
International Environmental Regulations
For a discussion of the material environmental regulations applicable to the Company's businesses located outside of the U.S., seeEnvironmental Regulation under the discussion of the various countries in which the Company's subsidiaries operate in Business—Our Organizationand Segments , above.
Customers
We sell to a wide variety of customers. No individual customer accounted for 10% or more of our 2017 total revenue. In our generationbusiness, we own and/or operate power plants to generate and sell power to wholesale customers such as utilities and other intermediaries. Ourutilities sell to end-user customers in the residential, commercial, industrial and governmental sectors in a defined service area.
Executive Officers
The following individuals are our executive officers:
Bernerd Da Santos , 54 years old, was appointed Chief Operating Officer and Executive Vice President in December 2017. Previously, Mr.Da Santos held several positions at the Company, including Chief Operating Officer and Senior Vice President (2014 - 2017), Chief FinancialOfficer, Global Finance Operations (2012-2014), Chief Financial Officer of Global Utilities (2011-2012), Chief Financial Officer of Latin America andAfrica (2009-2011), Chief Financial Officer of Latin America (2007-2009), Managing Director of Finance for Latin America (2005-2007) and VP andController of EDC (Venezuela). Prior to joining AES in 2000, Mr. Da Santos held a number of financial leadership positions at EDC. Mr. Da Santos isthe chairman of AES Gener in Chile and a member of the Board of Directors of Companhia Brasiliana de Energia, AES Tietê, Companhia deAlumbrado Electrico de San Salvador ("CAESS"), Empresa Electrica de Oriente ("EEO"), Companhia de Alumbrado Electrico de Santa Ana, andIndianapolis Power & Light. Mr. Da Santos holds a bachelor's degree with Cum Laude distinction in Business Administration and PublicAdministration from Universidad José Maria Vargas, a bachelor's degree with Cum Laude distinction in Business Management and Finance, and anMBA with Cum Laude distinction from Universidad José Maria Vargas.
Paul L. Freedman , 47 years old, has been Senior Vice President and General Counsel since February 2018. Prior to assuming his currentposition, Mr. Freedman served as Chief of Staff to the CEO from April 2016 to February 2018, Assistant General Counsel from 2014 to 2016,General Counsel, North America Generation, from 2011 to 2014, Senior Corporate Counsel from 2010-2011 and Counsel 2007 to 2010. Mr.Freedman is a member of the boards of IPALCO, AES U.S. Investments, DP&L and Fluence. He is also an alternate Director at AES Gener. Prior tojoining AES, Mr. Freedman was Chief Counsel for credit programs at the U.S. Agency for International Development and he previously worked asan associate at the law firms of White & Case, LLP and Freshfields. Mr. Freedman received a B.A. from Columbia University and a J.D. from theGeorgetown University Law Center.
Andrés R. Gluski , 60 years old, has been President, CEO and a member of our Board of Directors since September 2011 and is Chairman ofthe Strategy and Investment Committee of the Board. Prior to assuming his current position, Mr. Gluski served as EVP and Chief Operating Officer("COO") of the Company since March 2007. Prior to becoming the COO of AES, Mr. Gluski was EVP and the Regional President of Latin Americafrom 2006 to 2007. Mr. Gluski was Senior Vice President ("SVP") for the Caribbean and Central America from 2003 to 2006, CEO of La Electricidadde Caracas ("EDC") from 2002 to 2003 and CEO of AES Gener (Chile) in 2001. Prior to joining AES in 2000, Mr. Gluski was EVP and ChiefFinancial Officer ("CFO") of EDC, EVP of Banco de Venezuela (Grupo Santander), Vice President ("VP") for Santander Investment, and EVP andCFO of CANTV (subsidiary of GTE). Mr. Gluski has also worked with the International Monetary Fund in the Treasury and Latin AmericanDepartments and served as Director General of the Ministry of Finance of Venezuela. From 2013-2016, Mr. Gluski served on President Obama'sExport Council. Mr. Gluski is a member of the Board of Waste Management and AES Gener in Chile. Mr. Gluski is also Chairman of the AmericasSociety/Council of the Americas, and Director of the Edison Electric Institute. Mr. Gluski is a magna cum laude graduate of Wake Forest Universityand holds an M.A. and a Ph.D. in Economics from the University of Virginia.
Tish Mendoza , 42 years old, is Chief Human Resources Officer and Senior Vice President, Global Human Resources and InternalCommunications since 2015. Prior to assuming her current position, Ms. Mendoza was the
44

Vice President of Human Resources, Global Utilities from 2011 to 2012 and Vice President of Global Compensation, Benefits and HRIS, includingExecutive Compensation, from 2008 to 2011 and acted in the same capacity as the Director of the function from 2006 to 2008. In 2015, Ms.Mendoza was appointed a member of the Boards of AES Chivor S.A. and DP&L, and sits on AES' compensation and benefits committees. She isalso currently serving as co-chair of Evanta Global HR, and is part of its governing body in Washington, D.C. Prior to joining AES, Ms. Mendoza wasVice President of Human Resources for a product company in the Treasury Services division of JP Morgan Chase and Vice President of HumanResources and Compensation and Benefits at Vastera, Inc, a former technology and managed services company. Ms. Mendoza earned certificatesin Leadership and Human Resource Management, and a bachelor's degree in Business Administration and Human Resources.
Thomas M. O'Flynn , 57 years old, has served as EVP and CFO of the Company since September 2012. Previously, Mr. O'Flynn served asSenior Advisor to the Private Equity Group of Blackstone, an investment and advisory group and held this position from 2010 to 2012. During thisperiod, Mr. O'Flynn also served as COO and CFO of Transmission Developers, Inc., a Blackstone-controlled company that develops innovativepower transmission projects in an environmentally responsible manner. From 2001 to 2009, he served as the CFO of PSEG, a New Jersey-basedmerchant power and utility company. He also served as President of PSEG Energy Holdings from 2007 to 2009. From 1986 to 2001, Mr. O'Flynnwas in the Global Power and Utility Group of Morgan Stanley. He served as a Managing Director for his last five years and as head of the NorthAmerican Power Group from 2000 to 2001. He was responsible for senior client relationships and led a number of large merger, financing,restructuring and advisory transactions. Mr. O'Flynn is the chairman of IPALCO, AES U.S. Investments and FTP Power, LLC. Mr. O'Flynn previouslyserved as a member of the Boards of DP&L and its parent company, DPL, Inc. from February 2013 through February 2015 and served on the Boardof Silver Ridge Power, a joint venture between AES and Riverstone Holdings LLC from September 2012 through July 2014. He is also currently onthe Board of Directors of the New Jersey Performing Arts Center and was the inaugural Chairman of the Institute for Sustainability and Energy atNorthwestern University, of which he is still an active Board member. Mr. O'Flynn has a BA in Economics from Northwestern University and an MBAin Finance from the University of Chicago.
How to Contact AES and Sources of Other Information
Our principal offices are located at 4300 Wilson Boulevard, Arlington, Virginia 22203. Our telephone number is (703) 522-1315. Our websiteaddress is http://www.aes.com . Our annual reports on Form 10-K, quarterly reports on Form 10-Q and current reports on Form 8-K and anyamendments to such reports filed pursuant to Section 13(a) or Section 15(d) of the Securities Exchange Act of 1934 (the "Exchange Act") areposted on our website. After the reports are filed with, or furnished to the SEC, they are available from us free of charge. Material contained on ourwebsite is not part of and is not incorporated by reference in this Form 10-K. You may also read and copy any materials we file with the SEC at theSEC's Public Reference Room at 100 F Street, N.E., Washington, D.C. 20549. You may obtain information about the operation of the PublicReference Room by calling the SEC at 1-800-SEC-0330. The SEC maintains an internet website that contains the reports, proxy and informationstatements and other information that we file electronically with the SEC at www.sec.gov .
Our CEO and our CFO have provided certifications to the SEC as required by Section 302 of the Sarbanes-Oxley Act of 2002. Thesecertifications are included as exhibits to this Annual Report on Form 10-K.
Our CEO provided a certification pursuant to Section 303A of the New York Stock Exchange Listed Company Manual on May 19, 2017.
Our Code of Business Conduct ("Code of Conduct") and Corporate Governance Guidelines have been adopted by our Board of Directors. TheCode of Conduct is intended to govern, as a requirement of employment, the actions of everyone who works at AES, including employees of oursubsidiaries and affiliates. Our Ethics and Compliance Department provides training, information, and certification programs for AES employeesrelated to the Code of Conduct. The Ethics and Compliance Department also has programs in place to prevent and detect criminal conduct, promotean organizational culture that encourages ethical behavior and a commitment to compliance with the law, and to monitor and enforce AES policieson corruption, bribery, money laundering and associations with terrorists groups. The Code of Conduct and the Corporate Governance Guidelinesare located in their entirety on our website. Any person may obtain a copy of the Code of Conduct or the Corporate Governance Guidelines withoutcharge by making a written request to: Corporate Secretary, The AES Corporation, 4300 Wilson Boulevard, Arlington, VA 22203. If anyamendments to, or waivers from, the Code of Conduct or the Corporate Governance Guidelines are made, we will disclose such amendments orwaivers on our website.
ITEM 1A. RISK FACTORS
You should consider carefully the following risks, along with the other information contained in or incorporated by reference in this Form 10-K.Additional risks and uncertainties also may adversely affect our business and
45

operations, including those discussed in Item 7.—Management's Discussion and Analysis of Financial Condition and Results of Operations in thisForm 10-K. If any of the following events actually occur, our business, financial results and financial condition could be materially adversely affected.
We routinely encounter and address risks, some of which may cause our future results to be different, sometimes materially different, than wepresently anticipate. The categories of risk we have identified in Item 1A.— Risk Factors of this Form 10-K include the following:
• risks related to our high level of indebtedness;• risks associated with our ability to raise needed capital;• external risks associated with revenue and earnings volatility;• risks associated with our operations; and• risks associated with governmental regulation and laws.
These risk factors should be read in conjunction with Item 7.— Management's Discussion and Analysis of Financial Condition and Results ofOperations , and the Consolidated Financial Statements and related notes included elsewhere in this report.
Risks Related to our High Level of IndebtednessWe have a significant amount of debt, a large percentage of which is secured, which could adversely affect our business and the
ability to fulfill our obligations.
As of December 31, 2017 , we had approximately $20 billion of outstanding indebtedness on a consolidated basis. All outstanding borrowings,if any, under The AES Corporation's senior secured credit facility and secured term loan are secured by certain of our assets, including the pledge ofcapital stock of many of The AES Corporation's directly held subsidiaries. Most of the debt of The AES Corporation's subsidiaries is secured bysubstantially all of the assets of those subsidiaries. Since we have such a high level of debt, a substantial portion of cash flow from operations mustbe used to make payments on this debt. Furthermore, since a significant percentage of our assets are used to secure this debt, this reduces theamount of collateral available for future secured debt or credit support and reduces our flexibility in operating these secured assets. This high levelof indebtedness and related security could have other important consequences to us and our investors, including:
• making it more difficult to satisfy debt service and other obligations at the holding company and/or individual subsidiaries;• increasing our vulnerability to general adverse industry and economic conditions, including but not limited to adverse changes in foreign
exchange rates and commodity prices;• reducing the availability of cash flow to fund other corporate purposes and grow our business;• limiting our flexibility in planning for, or reacting to, changes in our business and the industry;• placing us at a competitive disadvantage to our competitors that are not as highly leveraged; and• limiting, along with the financial and other restrictive covenants relating to such indebtedness, among other things, our ability to borrow
additional funds as needed or take advantage of business opportunities as they arise, pay cash dividends or repurchase common stock.
The agreements governing our indebtedness, including the indebtedness of our subsidiaries, limit, but do not prohibit the incurrence of additionalindebtedness. To the extent we become more leveraged, the risks described above would increase. Further, our actual cash requirements in thefuture may be greater than expected. Accordingly, our cash flows may not be sufficient to repay at maturity all of the outstanding debt as it becomesdue and, in that event, we may not be able to borrow money, sell assets, raise equity or otherwise raise funds on acceptable terms or at all torefinance our debt as it becomes due. See Note 10 . — Debt included in Item 8. —Financial Statements and Supplementary Data of this Form 10-Kfor a schedule of our debt maturities.
The AES Corporation is a holding company and its ability to make payments on its outstanding indebtedness, including its publicdebt securities, is dependent upon the receipt of funds from its subsidiaries by way of dividends, fees, interest, loans or otherwise.
The AES Corporation is a holding company with no material assets other than the stock of its subsidiaries. Almost all of The AES Corporation'scash flow is generated by the operating activities of its subsidiaries. Therefore, The AES Corporation's ability to make payments on its indebtednessand to fund its other obligations is dependent not only on the ability of its subsidiaries to generate cash, but also on the ability of the subsidiaries todistribute cash to it in the form of dividends, fees, interest, tax sharing payments, loans or otherwise.
46

However, our subsidiaries face various restrictions in their ability to distribute cash to The AES Corporation. Most of the subsidiaries areobligated, pursuant to loan agreements, indentures or non-recourse financing arrangements, to satisfy certain restricted payment covenants or otherconditions before they may make distributions to The AES Corporation, if at all. Business performance and local accounting and tax rules may alsolimit dividend distributions. Subsidiaries in foreign countries may also be prevented from distributing funds to The AES Corporation as a result offoreign governments restricting the repatriation of funds or the conversion of currencies.
The AES Corporation's subsidiaries are separate and distinct legal entities and, unless they have expressly guaranteed any of The AESCorporation's indebtedness, have no obligation, contingent or otherwise, to pay any amounts due pursuant to such debt or to make any fundsavailable whether by dividends, fees, loans or other payments.
Even though The AES Corporation is a holding company, existing and potential future defaults by subsidiaries or affiliates couldadversely affect The AES Corporation.
We attempt to finance our domestic and foreign projects primarily under loan agreements and related documents which, except as notedbelow, require the loans to be repaid solely from the project's revenues and provide that the repayment of the loans (and interest thereon) is securedsolely by the capital stock, physical assets, contracts and cash flow of that project subsidiary or affiliate. This type of financing is usually referred toas non-recourse debt or "non-recourse financing." In some non-recourse financings, The AES Corporation has explicitly agreed to undertake certainlimited obligations and contingent liabilities, most of which by their terms will only be effective or will be terminated upon the occurrence of futureevents. These obligations and liabilities take the form of guarantees, indemnities, letters of credit, letter of credit reimbursement agreements andagreements to pay, in certain circumstances, the project lenders or other parties.
As of December 31, 2017 , we had approximately $20 billion of outstanding indebtedness on a consolidated basis, of which approximately $4.6billion was recourse debt of The AES Corporation and approximately $15.3 billion was non-recourse debt. In addition, we have outstandingguarantees, indemnities, letters of credit, and other credit support commitments which are further described in this Form 10-K in Item 7.—Management's Discussion and Analysis of Financial Condition and Results of Operations — Capital Resources and Liquidity — Parent CompanyLiquidity .
Some of our subsidiaries are currently in default with respect to all or a portion of their outstanding indebtedness. The total debt classified ascurrent in our Consolidated Balance Sheets related to such defaults was $1 billion as of December 31, 2017 . While the lenders under our non-recourse financings generally do not have direct recourse to The AES Corporation (other than to the extent of any credit support given by The AESCorporation), defaults thereunder can still have important consequences for The AES Corporation, including, without limitation:
• reducing The AES Corporation's receipt of subsidiary dividends, fees, interest payments, loans and other sources of cash since the projectsubsidiary will typically be prohibited from distributing cash to The AES Corporation during the pendency of any default;
• under certain circumstances, triggering The AES Corporation's obligation to make payments under any financial guarantee, letter of creditor other credit support which The AES Corporation has provided to or on behalf of such subsidiary;
• triggering defaults in The AES Corporation's outstanding debt. For example, The AES Corporation's senior secured credit facility, securedterm loan, and outstanding senior notes include events of default for certain bankruptcy related events involving material subsidiaries. Inaddition, The AES Corporation's senior secured credit facility includes certain events of default relating to accelerations of outstandingmaterial debt of material subsidiaries or any subsidiaries that in the aggregate constitute a material subsidiary; or
• foreclosure on the assets that are pledged under the non-recourse loans, resulting in write-downs of assets and eliminating any and allpotential future benefits derived from those assets.
None of the projects that are currently in default are owned by subsidiaries that individually or in the aggregate meet the applicable standard ofmateriality in The AES Corporation's senior secured credit facility or other debt agreements in order for such defaults to trigger an event of default orpermit acceleration under such indebtedness. However, as a result of future mix of distributions, write-down of assets, dispositions and othermatters that affect our financial position and results of operations, it is possible that one or more of these subsidiaries, individually or in theaggregate, could fall within the applicable standard of materiality and thereby upon an acceleration of such
47

subsidiary's debt, trigger an event of default and possible acceleration of the indebtedness under The AES Corporation's senior secured creditfacility or other indebtedness of The AES Corporation.
Risks Associated with our Ability to Raise Needed CapitalThe AES Corporation, or the Parent Company, has significant cash requirements and limited sources of liquidity.
The AES Corporation requires cash primarily to fund:
• principal repayments of debt;• interest;• acquisitions;• construction and other project commitments;• other equity commitments, including business development investments;• equity repurchases and/or cash dividends on our common stock;• taxes; and• Parent Company overhead costs.
The AES Corporation's principal sources of liquidity are:
• dividends and other distributions from its subsidiaries;• proceeds from debt and equity financings at the Parent Company level; and• proceeds from asset sales.
For a more detailed discussion of The AES Corporation's cash requirements and sources of liquidity, please see Item 7.— Management'sDiscussion and Analysis of Financial Condition and Results of Operations—Capital Resources and Liquidity in this Form 10-K.
While we believe that these sources will be adequate to meet our obligations at the Parent Company level for the foreseeable future, this beliefis based on a number of material assumptions, including, without limitation, assumptions about our ability to access the capital or commerciallending markets, the operating and financial performance of our subsidiaries, exchange rates, our ability to sell assets, and the ability of oursubsidiaries to pay dividends and other distributions. Any number of assumptions could prove to be incorrect, and, therefore there can be noassurance that these sources will be available when needed or that our actual cash requirements will not be greater than expected. In addition, ourcash flow may not be sufficient to repay at maturity the entire principal outstanding under our credit facility, term loan, and our debt securities and wemay have to refinance such obligations. There can be no assurance that we will be successful in obtaining such refinancing on terms acceptable tous or at all and any of these events could have a material effect on us.
Our ability to grow our business could be materially adversely affected if we were unable to raise capital on favorable terms.
From time to time, we rely on access to capital markets as a source of liquidity for capital requirements not satisfied by operating cash flows.Our ability to arrange for financing on either a recourse or non-recourse basis and the costs of such capital are dependent on numerous factors,some of which are beyond our control, including:
• general economic and capital market conditions;• the availability of bank credit;• the financial condition, performance and prospects of The AES Corporation in general and/or that of any subsidiary requiring the financing
as well as companies in our industry or similar financial circumstances; and• changes in tax and securities laws which are conducive to raising capital.
Should future access to capital not be available to us, we may have to sell assets or decide not to build new plants, or expand or improveexisting facilities, either of which would affect our future growth, results of operations or financial condition.
A downgrade in the credit ratings of The AES Corporation or its subsidiaries could adversely affect our ability to access the capitalmarkets which could increase our interest costs or adversely affect our liquidity and cash flow.
48

If any of the credit ratings of The AES Corporation or its subsidiaries were to be downgraded, our ability to raise capital on favorable termscould be impaired and our borrowing costs could increase. Furthermore, depending on The AES Corporation's credit ratings and the trading pricesof its equity and debt securities, counterparties may no longer be as willing to accept general unsecured commitments by The AES Corporation toprovide credit support. Accordingly, with respect to both new and existing commitments, The AES Corporation may be required to provide someother form of assurance, such as a letter of credit and/or collateral, to backstop or replace any credit support by The AES Corporation. There can beno assurance that such counterparties will accept such guarantees or that AES could arrange such further assurances in the future. In addition, tothe extent The AES Corporation is required and able to provide letters of credit or other collateral to such counterparties, it will limit the amount ofcredit available to The AES Corporation to meet its other liquidity needs.
We may not be able to raise sufficient capital to fund developing projects in certain less developed economies which could changeor in some cases adversely affect our growth strategy.
Part of our strategy is to grow our business by developing businesses in less developed economies where the return on our investment maybe greater than projects in more developed economies. Commercial lending institutions sometimes refuse to provide non-recourse project financingin certain less developed economies, and in these situations we have sought and will continue to seek direct or indirect (through credit support orguarantees) project financing from a limited number of multilateral or bilateral international financial institutions or agencies. As a precondition tomaking such project financing available, the lending institutions may also require governmental guarantees for certain project and sovereign relatedrisks. There can be no assurance, however, that project financing from the international financial agencies or that governmental guarantees will beavailable when needed, and if they are not, we may have to abandon the project or invest more of our own funds which may not be in line with ourinvestment objectives and would leave less funds for other projects.
External Risks Associated with Revenue and Earnings VolatilityOur businesses may incur substantial costs and liabilities and be exposed to price volatility as a result of risks associated with the
wholesale electricity markets, which could have a material adverse effect on our financial performance.
Some of our businesses sell electricity in the spot markets in cases where they operate at levels in excess of their power sales agreements orretail load obligations. Our businesses may also buy electricity in the wholesale spot markets. As a result, we are exposed to the risks of rising andfalling prices in those markets. The open market wholesale prices for electricity can be volatile and generally reflect the variable cost of the sourcegeneration which could include renewable sources at near zero pricing or thermal sources subject to fluctuating cost of fuels such as coal, naturalgas or oil derivative fuels in addition to other factors described below. Consequently, any changes in the generation supply stack and cost of coal,natural gas, or oil derivative fuels may impact the open market wholesale price of electricity.
Volatility in market prices for fuel and electricity may result from, among other things:
• plant availability in the markets generally;• availability and effectiveness of transmission facilities owned and operated by third parties;• competition;• seasonality;• hydrology and other weather conditions;• illiquid markets;• transmission or transportation constraints or inefficiencies;• renewables source contribution to the supply stack;• increased adoption of distributed generation;• energy efficiency and demand side resources;• available supplies of natural gas, crude oil and refined products, and coal;• generating unit performance;• natural disasters, terrorism, wars, embargoes, and other catastrophic events;• energy, market and environmental regulation, legislation and policies;• general economic conditions in areas where we operate which impact energy consumption; and• bidding behavior and market bidding rules.
49

Our financial position and results of operations may fluctuate significantly due to fluctuations in currency exchange ratesexperienced at our foreign operations.
Our exposure to currency exchange rate fluctuations results primarily from the translation exposure associated with the preparation of theConsolidated Financial Statements, as well as from transaction exposure associated with transactions in currencies other than an entity's functionalcurrency. While the Consolidated Financial Statements are reported in U.S. dollars, the financial statements of many of our subsidiaries outside theU.S. are prepared using the local currency as the functional currency and translated into U.S. dollars by applying appropriate exchange rates. As aresult, fluctuations in the exchange rate of the U.S. dollar relative to the local currencies where our subsidiaries outside the U.S. report could causesignificant fluctuations in our results. In addition, while our expenses with respect to foreign operations are generally denominated in the samecurrency as corresponding sales, we have transaction exposure to the extent receipts and expenditures are not denominated in the subsidiary'sfunctional currency. Moreover, the costs of doing business abroad may increase as a result of adverse exchange rate fluctuations. Our financialposition and results of operations could be affected by fluctuations in the value of a number of currencies.
Wholesale Power Prices are declining in many markets and this could have a material adverse effect on our operations andopportunities for future growth.
The wholesale prices offered for electricity have declined significantly in recent years in many markets in which the Company hasbusinesses. This price decline is due to a variety of factors, including the increased penetration of renewable generation resources, cheap naturalgas and demand side management. The levelized cost of electricity from new solar and wind generation sources has dropped substantially in recentyears as solar panel costs have declined and wind turbine costs have declined, while wind capacity factors have increased. These renewableresources have no fuel costs and very low operational costs. In many instances energy from these facilities are bid into the wholesale spot market ata price of zero or close to zero during certain times of the day, driving down the clearing price for all generators selling power in the relevant spotmarket. Also, in many markets new power purchase agreements have been awarded for renewable generation at prices significantly lower than theprices being awarded just a few years ago.
This trend of declining wholesale prices could continue and could have a material adverse impact on the financial performance of our existinggeneration assets to the extent they currently sell power into the spot market or will seek to sell power into the spot market once their powerpurchase agreements expire. The trend of declining prices can also make it more difficult for us to obtain attractive prices under new long-termpower purchase agreements for any new generation facilities we may seek to develop. As a result, the trend can have an adverse impact on ouropportunities for new investments.
We may not be adequately hedged against our exposure to changes in commodity prices or interest rates.
We routinely enter into contracts to hedge a portion of our purchase and sale commitments for electricity, fuel requirements and othercommodities to lower our financial exposure related to commodity price fluctuations. As part of this strategy, we routinely utilize fixed price orindexed forward physical purchase and sales contracts, futures, financial swaps, and option contracts traded in the over-the-counter markets or onexchanges. We also enter into contracts which help us manage our interest rate exposure. However, we may not cover the entire exposure of ourassets or positions to market price or interest rate volatility, and the coverage will vary over time. Furthermore, the risk management practices wehave in place may not always perform as planned. In particular, if prices of commodities or interest rates significantly deviate from historical prices orinterest rates or if the price or interest rate volatility or distribution of these changes deviates from historical norms, our risk management practicesmay not protect us from significant losses. As a result, fluctuating commodity prices or interest rates may negatively impact our financial results tothe extent we have unhedged or inadequately hedged positions. In addition, certain types of economic hedging activities may not qualify for hedgeaccounting under U.S. GAAP, resulting in increased volatility in our net income. The Company may also suffer losses associated with "basis risk"which is the difference in performance between the hedge instrument and the targeted underlying exposure. Furthermore, there is a risk that thecurrent counterparties to these arrangements may fail or are unable to perform part or all of their obligations under these arrangements.
For our businesses with PPA pricing that does not perfectly pass through our fuel costs, the businesses attempt to manage the exposurethrough flexible fuel purchasing and timing of entry and terms of our fuel supply agreements; however, these risk management efforts may not besuccessful and the resulting commodity exposure could have a material impact on these businesses and/or our results of operations.
50

Supplier and/or customer concentration may expose the Company to significant financial credit or performance risks.
We often rely on a single contracted supplier or a small number of suppliers for the provision of fuel, transportation of fuel and other servicesrequired for the operation of some of our facilities. If these suppliers cannot perform, we would seek to meet our fuel requirements by purchasingfuel at market prices, exposing us to market price volatility and the risk that fuel and transportation may not be available during certain periods at anyprice, which could adversely impact the profitability of the affected business and our results of operations, and could result in a breach ofagreements with other counterparties, including, without limitation, offtakers or lenders.
At times, we rely on a single customer or a few customers to purchase all or a significant portion of a facility's output, in some cases underlong-term agreements that account for a substantial percentage of the anticipated revenue from a given facility. Counterparties to these agreementsmay breach or may be unable to perform their obligations. We may not be able to enter into replacement agreements on terms as favorable as ourexisting agreements, or at all. If we were unable to enter into replacement PPAs, these businesses may have to sell power at market prices. Abreach by a counterparty of a PPA or other agreement could also result in the breach of other agreements, including, without limitation, the debtdocuments of the affected business.
The failure of any supplier or customer to fulfill its contractual obligations to The AES Corporation or our subsidiaries could have a materialadverse effect on our financial results. Consequently, the financial performance of our facilities is dependent on the credit quality of, and continuedperformance by, suppliers and customers.
The market pricing of our common stock may be volatile in future periods.
The market price for our common stock could fluctuate substantially in the future. Stock price movements on a quarter-by-quarter basis for thepast two years are presented in Item 5.— Market For Registrant's Common Equity, Related Stockholder Matters and Issuer Purchases of EquitySecurities — Market Information of this Form 10-K. Factors that could affect the price of our common stock in the future include general conditions inour industry, in the power markets in which we participate and in the world, including environmental and economic developments, over which wehave no control, as well as developments specific to us, including risks that could result in revenue and earnings volatility as well as other riskfactors described in Item 1A.— Risk Factors and those matters described in Item 7.— Management's Discussion and Analysis of FinancialConditions and Results of Operations .
Risks Associated with our OperationsWe do a significant amount of business outside the U.S., including in developing countries, which presents significant risks.
A significant amount of our revenue is generated outside the U.S. and a significant portion of our international operations is conducted indeveloping countries. Part of our growth strategy is to expand our business in certain developing countries in which AES has an existing presenceas such countries may have higher growth rates and offer greater opportunities to expand from our platforms, with potentially higher returns than insome more developed countries. International operations, particularly the operation, financing and development of projects in developing countries,entail significant risks and uncertainties, including, without limitation:
• economic, social and political instability in any particular country or region;• adverse changes in currency exchange rates;• government restrictions on converting currencies or repatriating funds;• unexpected changes in foreign laws and regulations or in trade, monetary or fiscal policies;• high inflation and monetary fluctuations;• restrictions on imports of coal, oil, gas or other raw materials required by our generation businesses to operate;• threatened or consummated expropriation or nationalization of our assets by foreign governments;• risks relating to the failure to comply with the U.S. Foreign Corrupt Practices Act, United Kingdom Bribery Act or other anti-bribery laws
applicable to our operations;• difficulties in hiring, training and retaining qualified personnel, particularly finance and accounting personnel with GAAP expertise;• unwillingness of governments and their agencies, similar organizations or other counterparties to honor their contracts;• unwillingness of governments, government agencies, courts or similar bodies to enforce contracts that are economically advantageous to
subsidiaries of the Company and economically unfavorable to
51

counterparties, against such counterparties, whether such counterparties are governments or private parties;• inability to obtain access to fair and equitable political, regulatory, administrative and legal systems;• adverse changes in government tax policy;• difficulties in enforcing our contractual rights or enforcing judgments or obtaining a favorable result in local jurisdictions; and• potentially adverse tax consequences of operating in multiple jurisdictions.
Any of these factors, by itself or in combination with others, could materially and adversely affect our business, results of operations andfinancial condition. Our operations may experience volatility in revenues and operating margin which have caused and are expected to causesignificant volatility in our results of operations and cash flows. The volatility is caused by regulatory and economic difficulties, political instability andcurrency devaluations being experienced in many of these countries. This volatility reduces the predictability and enhances the uncertaintyassociated with cash flows from these businesses. A number of our businesses are facing challenges associated with regulatory changes.
The operation of power generation, distribution and transmission facilities involves significant risks that could adversely affect ourfinancial results. We and/or our subsidiaries may not have adequate risk mitigation and/or insurance coverage for liabilities.
We are in the business of generating and distributing electricity, which involves certain risks that can adversely affect financial and operatingperformance, including:
• changes in the availability of our generation facilities or distribution systems due to increases in scheduled and unscheduled plant outages,equipment failure, failure of transmission systems, labor disputes, disruptions in fuel supply, poor hydrologic and wind conditions, inability tocomply with regulatory or permit requirements or catastrophic events such as fires, floods, storms, hurricanes, earthquakes, dam failures,explosions, terrorist acts, cyber attacks or other similar occurrences; and
• changes in our operating cost structure, including, but not limited to, increases in costs relating to gas, coal, oil and other fuel; fueltransportation; purchased electricity; operations, maintenance and repair; environmental compliance, including the cost of purchasingemissions offsets and capital expenditures to install environmental emission equipment; transmission access; and insurance.
Our businesses require reliable transportation sources (including related infrastructure such as roads, ports and rail), power sources and watersources to access and conduct operations. The availability and cost of this infrastructure affects capital and operating costs and levels of productionand sales. Limitations, or interruptions in this infrastructure or at the facilities of our subsidiaries, including as a result of third parties intentionally orunintentionally disrupting this infrastructure or the facilities of our subsidiaries, could impede their ability to produce electricity. This could have amaterial adverse effect on our businesses' results of operations, financial condition and prospects.
In addition, a portion of our generation facilities were constructed many years ago. Older generating equipment may require significant capitalexpenditures for maintenance. The equipment at our plants, whether old or new, is also likely to require periodic upgrading, improvement or repair,and replacement equipment or parts may be difficult to obtain in circumstances where we rely on a single supplier or a small number of suppliers.The inability to obtain replacement equipment or parts may impact the ability of our plants to perform and could, therefore, have a material impact onour business and results of operations. Breakdown or failure of one of our operating facilities may prevent the facility from performing underapplicable power sales agreements which, in certain situations, could result in termination of a power purchase or other agreement or incurrence ofa liability for liquidated damages and/or other penalties.
As a result of the above risks and other potential hazards associated with the power generation, distribution and transmission industries, wemay from time to time become exposed to significant liabilities for which we may not have adequate risk mitigation and/or insurance coverage.Power generation involves hazardous activities, including acquiring, transporting and unloading fuel, operating large pieces of rotating equipmentand delivering electricity to transmission and distribution systems. In addition to natural risks, such as earthquakes, floods, lightning, hurricanes andwind, hazards, such as fire, explosion, collapse and machinery failure, are inherent risks in our operations which may occur as a result of inadequateinternal processes, technological flaws, human error or actions of third parties or other external events. The control and management of these risksdepend upon adequate development and training of personnel and on the existence of operational procedures, preventative maintenance
52

plans and specific programs supported by quality control systems which reduce, but do not eliminate, the possibility of the occurrence and impact ofthese risks.
The hazards described above, along with other safety hazards associated with our operations, can cause significant personal injury or loss oflife, severe damage to and destruction of property, plant and equipment, contamination of, or damage to, the environment and suspension ofoperations. The occurrence of any one of these events may result in our being named as a defendant in lawsuits asserting claims for substantialdamages, environmental cleanup costs, personal injury and fines and/or penalties. We maintain an amount of insurance protection that we believe iscustomary, but there can be no assurance that our insurance will be sufficient or effective under all circumstances and against all hazards orliabilities to which we may be subject. A claim for which we are not fully insured or insured at all could hurt our financial results and materially harmour financial condition. Further, due to the cyclical nature of the insurance markets, we cannot provide assurance that insurance coverage willcontinue to be available on terms similar to those presently available to us or at all. Any losses not covered by insurance could have a materialadverse effect on our financial condition, results of operations or cash flows.
Our businesses' insurance does not cover every potential risk associated with its operations. Adequate coverage at reasonable rates is notalways obtainable. In addition, insurance may not fully cover the liability or the consequences of any business interruptions such as equipmentfailure or labor dispute. The occurrence of a significant adverse event not fully or partially covered by insurance could have a material adverse effecton the Company's business, results or operations, financial condition and prospects.
Any of the above risks could have a material adverse effect on our business and results of operations.
We may not be able to attract and retain skilled people, which could have a material adverse effect on our operations.
Our operating success and ability to carry out growth initiatives depends in part on our ability to retain executives and to attract and retainadditional qualified personnel who have experience in our industry and in operating a company of our size and complexity, including people in ourforeign businesses. The inability to attract and retain qualified personnel could have a material adverse effect on our business, because of thedifficulty of promptly finding qualified replacements. For example, we routinely are required to assess the financial impacts of complicated businesstransactions which occur on a worldwide basis. These assessments are dependent on hiring personnel on a worldwide basis with sufficient expertisein U.S. GAAP to timely and accurately comply with U.S. reporting obligations. An inability to maintain adequate internal accounting and managerialcontrols and hire and retain qualified personnel could have an adverse effect on our financial and tax reporting.
We have contractual obligations to certain customers to provide full requirements service, which makes it difficult to predict andplan for load requirements and may result in increased operating costs to certain of our businesses.
We have contractual obligations to certain customers to supply power to satisfy all or a portion of their energy requirements. The uncertaintyregarding the amount of power that our power generation and distribution facilities must be prepared to supply to customers may increase ouroperating costs. A significant under- or over-estimation of load requirements could result in our facilities not having enough or having too muchpower to cover their obligations, in which case we would be required to buy or sell power from or to third parties at prevailing market prices. Thoseprices may not be favorable and thus could increase our operating costs.
We may not be able to enter into long-term contracts, which reduce volatility in our results of operations.
Many of our generation plants conduct business under long-term sales and supply contracts, which helps these businesses to manage risks byreducing the volatility associated with power and input costs and providing a stable revenue and cost structure. In these instances, we rely on powersales contracts with one or a limited number of customers for the majority of, and in some cases all of, the relevant plant's output and revenues overthe term of the power sales contract. The remaining terms of the power sales contracts of our generation plants range from one to 25 years. In manycases, we also limit our exposure to fluctuations in fuel prices by entering into long-term contracts for fuel with a limited number of suppliers. In theseinstances, the cash flows and results of operations are dependent on the continued ability of customers and suppliers to meet their obligations underthe relevant power sales contract or fuel supply contract, respectively. Some of our long-term power sales agreements are at prices above currentspot market prices and some of our long-term fuel supply contracts are at prices below current market prices. The loss of significant power salescontracts or fuel supply contracts, or the failure by any of the parties to such contracts that prevents us from fulfilling our obligations thereunder,could adversely impact our strategy by resulting in costs that exceed revenue, which could have a material adverse impact on our business,
53

results of operations and financial condition. In addition, depending on market conditions and regulatory regimes, it may be difficult for us to securelong-term contracts, either where our current contracts are expiring or for new development projects. The inability to enter into long-term contractscould require many of our businesses to purchase inputs at market prices and sell electricity into spot markets, which may not be favorable.
We have sought to reduce counterparty credit risk under our long-term contracts in part by entering into power sales contracts with utilities orother customers of strong credit quality and by obtaining guarantees from certain sovereign governments of the customer's obligations. However,many of our customers do not have, or have failed to maintain, an investment-grade credit rating, and our generation business cannot always obtaingovernment guarantees and if they do, the government does not always have an investment grade credit rating. We have also sought to reduce ourcredit risk by locating our plants in different geographic areas in order to mitigate the effects of regional economic downturns. However, there can beno assurance that our efforts to mitigate this risk will be successful.
Competition is increasing and could adversely affect us.
The power production markets in which we operate are characterized by numerous strong and capable competitors, many of whom may haveextensive and diversified developmental or operating experience (including both domestic and international) and financial resources similar to orgreater than ours. Further, in recent years, the power production industry has been characterized by strong and increasing competition with respectto both obtaining power sales agreements and acquiring existing power generation assets. In certain markets, these factors have caused reductionsin prices contained in new power sales agreements and, in many cases, have caused higher acquisition prices for existing assets throughcompetitive bidding practices. The evolution of competitive electricity markets and the development of highly efficient gas-fired power plants andrenewables such as wind and solar have also caused, or are anticipated to cause, price pressure in certain power markets where we sell or intendto sell power. These competitive factors could have a material adverse effect on us.
Some of our subsidiaries participate in defined benefit pension plans and their net pension plan obligations may require additionalsignificant contributions.
Certain of our subsidiaries have defined benefit pension plans covering substantially all of their respective employees. Of the thirty one suchdefined benefit plans, five are at U.S. subsidiaries and the remaining plans are at foreign subsidiaries. Pension costs are based upon a number ofactuarial assumptions, including an expected long-term rate of return on pension plan assets, the expected life span of pension plan beneficiariesand the discount rate used to determine the present value of future pension obligations. Any of these assumptions could prove to be wrong,resulting in a shortfall of pension plan assets compared to pension obligations under the pension plan. The Company periodically evaluates thevalue of the pension plan assets to ensure that they will be sufficient to fund the respective pension obligations. The Company's exposure to marketvolatility is mitigated to some extent due to the fact that the asset allocations in our largest plans include a significant weighting of investments infixed income securities that are less volatile than investments in equity securities. Future downturns in the debt and/or equity markets, or theinaccuracy of any of our significant assumptions underlying the estimates of our subsidiaries' pension plan obligations, could result in an increase inpension expense and future funding requirements, which may be material. Our subsidiaries who participate in these plans are responsible forsatisfying the funding requirements required by law in their respective jurisdiction for any shortfall of pension plan assets compared to pensionobligations under the pension plan. This may necessitate additional cash contributions to the pension plans that could adversely affect the ParentCompany and our subsidiaries' liquidity.For additional information regarding the funding position of the Company's pension plans, see Item 7.— Management's Discussion and Analysis ofFinancial Condition and Results of Operations—Critical Accounting Policies and Estimates—Pension and Other Postretirement Plans and Note 13 .— Benefit Plans included in Item 8.— Financial Statements and Supplementary Data included in this Form 10-K.
Our business is subject to substantial development uncertainties.
Certain of our subsidiaries and affiliates are in various stages of developing and constructing power plants, some but not all of which havesigned long-term contracts or made similar arrangements for the sale of electricity. Successful completion depends upon overcoming substantialrisks, including, but not limited to, risks relating to siting, financing, engineering and construction, permitting, governmental approvals,commissioning delays, or the potential for termination of the power sales contract as a result of a failure to meet certain milestones. For additionalinformation regarding our projects under construction see Item 1.— Business—Our Organization and Segments included in this Form 10-K.
In certain cases, our subsidiaries may enter into obligations in the development process even though the subsidiaries have not yet securedfinancing, power purchase arrangements, or other aspects of the development
54

process. For example, in certain cases, our subsidiaries may instruct contractors to begin the construction process or seek to procure equipmenteven where they do not have financing or a power purchase agreement in place (or conversely, to enter into a power purchase, procurement orother agreement without financing in place). If the project does not proceed, our subsidiaries may remain obligated for certain liabilities even thoughthe project will not proceed. Development is inherently uncertain and we may forgo certain development opportunities and we may undertakesignificant development costs before determining that we will not proceed with a particular project. We believe that capitalized costs for projectsunder development are recoverable; however, there can be no assurance that any individual project will be completed and reach commercialoperation. If these development efforts are not successful, we may abandon a project under development and write off the costs incurred inconnection with such project. At the time of abandonment, we would expense all capitalized development costs incurred in connection therewith andcould incur additional losses associated with any related contingent liabilities.
In some of our joint venture projects and businesses, we have granted protective rights to minority shareholders or we own lessthan a majority of the equity in the project or business and do not manage or otherwise control the project or business, which entailscertain risks.
We have invested in some joint ventures where our subsidiaries share operational, management, investment and/or other control rights withour joint venture partners. In many cases, we may exert influence over the joint venture pursuant to a management contract, by holding positions onthe board of the joint venture company or on management committees and/or through certain limited governance rights, such as rights to vetosignificant actions. However, we do not always have this type of influence over the project or business in every instance and we may be dependenton our joint venture partners or the management team of the joint venture to operate, manage, invest or otherwise control such projects orbusinesses. Our joint venture partners or the management team of our joint ventures may not have the level of experience, technical expertise,human resources, management and other attributes necessary to operate these projects or businesses optimally, and they may not share ourbusiness priorities. In some joint venture agreements where we do have majority control of the voting securities, we have entered into shareholderagreements granting protective minority rights to the other shareholders.
The approval of joint venture partners also may be required for us to receive distributions of funds from jointly owned entities or to transfer ourinterest in projects or businesses. The control or influence exerted by our joint venture partners may result in operational management and/orinvestment decisions which are different from the decisions our subsidiaries would make if they operated independently and could impact theprofitability and value of these joint ventures. In addition, in the event that a joint venture partner becomes insolvent or bankrupt or is otherwiseunable to meet its obligations to the joint venture or its share of liabilities at the joint venture, we may be subject to joint and several liability for thesejoint ventures, if and to the extent provided for in our governing documents or applicable law.
Our renewable energy projects and other initiatives face considerable uncertainties, including development, operational, andregulatory challenges.
Wind, solar, and energy storage projects are subject to substantial risks. Projects of this nature have been developed through advancement intechnologies which may not be proven or whose commercial application is limited, and which are unrelated to our core business. Some of thesebusiness lines are dependent upon favorable regulatory incentives to support continued investment, and there is significant uncertainty about theextent to which such favorable regulatory incentives will be available in the future.
Furthermore, production levels for our wind and solar projects may be dependent upon adequate wind or sunlight resulting in volatility inproduction levels and profitability. For example, for our wind projects, wind resource estimates are based on historical experience when availableand on wind resource studies conducted by an independent engineer, and are not expected to reflect actual wind energy production in any givenyear.
As a result, these types of renewable energy projects face considerable risk relative to our core business, including the risk that favorableregulatory regimes expire or are adversely modified. In addition, because certain of these projects depend on technology outside of our expertise ingeneration and utility businesses, there are risks associated with our ability to develop and manage such projects profitably. Furthermore, at thedevelopment or acquisition stage, because of the nascent nature of these industries or the limited experience with the relevant technologies, ourability to predict actual performance results may be hindered and the projects may not perform as predicted. There are also risks associated with thefact that some of these projects exist in markets where long-term fixed price contracts for the major cost and revenue components may beunavailable, which in turn may result in these projects having relatively high levels of volatility. Even where available, many of our renewable projectssell power under a Feed-in-Tariff, which may be eliminated or reduced, which can impact the profitability of these projects, or make money throughthe sale of Emission Reductions products, such as Certified Emissions
55

Reductions, Renewable Energy Certificates or Renewable Obligation Certificates, and the price of these products may be volatile. These projectscan be capital-intensive and generally are designed with a view to obtaining third party financing, which may be difficult to obtain. As a result, thesecapital constraints may reduce our ability to develop these projects or obtain third party financing for these projects.
Impairment of goodwill or long-lived assets would negatively impact our consolidated results of operations and net worth.
As of December 31, 2017 , the Company had approximately $1.1 billion of goodwill, which represented approximately 3.2% of the total assetson its Consolidated Balance Sheets. Goodwill is not amortized, but is evaluated for impairment at least annually, or more frequently if impairmentindicators are present. We may be required to evaluate the potential impairment of goodwill outside of the required annual evaluation process if weexperience situations, including but not limited to: deterioration in general economic conditions, or our operating or regulatory environment;increased competitive environment; increase in fuel costs, particularly when we are unable to pass through the impact to customers; negative ordeclining cash flows; loss of a key contract or customer, particularly when we are unable to replace it on equally favorable terms; divestiture of asignificant component of our business; or adverse actions or assessments by a regulator. These types of events and the resulting analyses couldresult in goodwill impairment, which could substantially affect our results of operations for those periods. Additionally, goodwill may be impaired if ouracquisitions do not perform as expected. See the risk factor Our acquisitions may not perform as expected for further discussion.
Long-lived assets are initially recorded at fair value and are amortized or depreciated over their estimated useful lives. Long-lived assets areevaluated for impairment only when impairment indicators, similar to those described above for goodwill, are present, whereas goodwill is alsoevaluated for impairment on an annual basis.
Certain of our businesses are sensitive to variations in weather.
Our businesses are affected by variations in general weather patterns and unusually severe weather. Our businesses forecast electric sales onthe basis of normal weather, which represents a long-term historical average. While we also consider possible variations in normal weather patternsand potential impacts on our facilities and our businesses, there can be no assurance that such planning can prevent these impacts, which canadversely affect our business. Generally, demand for electricity peaks in winter and summer. Typically, when winters are warmer than expected andsummers are cooler than expected, demand for energy is lower, resulting in less demand for electricity than forecasted. Significant variations fromnormal weather where our businesses are located could have a material impact on our results of operations.
In addition, we are dependent upon hydrological conditions prevailing from time to time in the broad geographic regions in which ourhydroelectric generation facilities are located. If hydrological conditions result in droughts or other conditions that negatively affect our hydroelectricgeneration business, our results of operations could be materially adversely affected.
Cyber-attacks and data security breaches could adversely harm our business.
Our business is heavily reliant on electronic systems and network technologies to operate our generation and transmission infrastructure. Wealso use various financial, accounting and other infrastructure systems. Our infrastructure may be targeted by nation states, hacktivists, criminals,insiders or terrorist groups. Such an attack may result in interruption of operations, property damage, our ability to control our infrastructure assets,release of sensitive customer information and limited communications with third parties. Any loss or corruption of confidential or proprietary datathrough such breach may:
• impair our reputation;• impact our operations and strategic objectives;• expose us to legal claims;• result in substantial revenue loss; and• require extensive repair and restoration costs for additional security measures to avert future cyber-attacks.
In addition, a breach of our financial and accounting systems could impact our ability to correctly record, process and report financialinformation.
We have implemented measures to help prevent unauthorized access to our systems and facilities, including some measures to comply withmandatory regulatory reliability standards, and we also maintain insurance coverage to mitigate some of these risks. To date, we have not seenmaterial impact on our business or operations due to a cyber-attack; however we cannot guarantee that our security measures will prevent futurecyber-attacks
56

and security breaches. We continue to assess potential threats and vulnerabilities and make investments to address them, including globalmonitoring of networks and systems, identifying and implementing new technology, improving user awareness through employee security training,and updating security policies for the Company and its third-party providers.
Our acquisitions may not perform as expected.
Historically, acquisitions have been a significant part of our growth strategy. We may continue to grow our business through acquisitions.Although acquired businesses may have significant operating histories, we will have a limited or no history of owning and operating many of thesebusinesses and possibly limited or no experience operating in the country or region where these businesses are located. Some of these businessesmay have been government owned and some may be operated as part of a larger integrated utility prior to their acquisition. If we were to acquireany of these types of businesses, there can be no assurance that:
• we will be successful in transitioning them to private ownership;• such businesses will perform as expected;• integration or other one-time costs will not be greater than expected;• we will not incur unforeseen obligations or liabilities;• such businesses will generate sufficient cash flow to support the indebtedness incurred to acquire them or the capital expenditures needed
to develop them; or• the rate of return from such businesses will justify our decision to invest capital to acquire them.
Risks associated with Governmental Regulation and LawsOur operations are subject to significant government regulation and our business and results of operations could be adversely
affected by changes in the law or regulatory schemes.
Our ability to predict, influence or respond appropriately to changes in law or regulatory schemes, including any ability to obtain expected orcontracted increases in electricity tariff or contract rates or tariff adjustments for increased expenses, could adversely impact our results ofoperations or our ability to meet publicly announced projections or analysts' expectations. Furthermore, changes in laws or regulations or changes inthe application or interpretation of regulatory provisions in jurisdictions where we operate, particularly at our utilities where electricity tariffs aresubject to regulatory review or approval, could adversely affect our business, including, but not limited to:
• changes in the determination, definition or classification of costs to be included as reimbursable or pass-through costs to be included in therates we charge our customers, including but not limited to costs incurred to upgrade our power plants to comply with more stringentenvironmental regulations;
• changes in the determination of what is an appropriate rate of return on invested capital or a determination that a utility's operating incomeor the rates it charges customers are too high, resulting in a reduction of rates or consumer rebates;
• changes in the definition or determination of controllable or non-controllable costs;• adverse changes in tax law;• changes in law or regulation which limit or otherwise affect the ability of our counterparties (including sovereign or private parties) to fulfill
their obligations (including payment obligations) to us or our subsidiaries;• changes in environmental law which impose additional costs or limit the dispatch of our generating facilities within our subsidiaries;• changes in the definition of events which may or may not qualify as changes in economic equilibrium;• changes in the timing of tariff increases;• other changes in the regulatory determinations under the relevant concessions;• other changes related to licensing or permitting which affect our ability to conduct business; or• other changes that impact the short- or long-term price-setting mechanism in the markets where we operate.
Any of the above events may result in lower margins for the affected businesses, which can adversely affect our business.
In many countries where we conduct business, the regulatory environment is constantly changing and it may be difficult to predict the impact ofthe regulations on our businesses. On July 21, 2010, President Obama signed
57

the Dodd-Frank Act. The Dodd-Frank Act substantially expands the regulation regarding the trading, clearing and reporting of derivativetransactions, and the Dodd-Frank Act provides for commercial end-user exemptions which may apply to our derivative transactions. However, evenwith the exemption, the Dodd-Frank Act could still have a material adverse impact on the Company, as the regulation of derivatives (which includescapital and margin requirements for non-exempt companies), could limit the availability of derivative transactions that we use to reduce interest rate,commodity and currency risks, which would increase our exposure to these risks. The impacts described above could also result from our (or oursubsidiaries') efforts to comply with European Market Infrastructure Regulation, which includes regulations related to the trading, reporting andclearing of derivatives. It is also possible that additional similar regulations may be passed in other jurisdictions where we conduct business. Any ofthese outcomes could have a material adverse effect on the Company.
Our business in the United States is subject to the provisions of various laws and regulations administered in whole or in part by theFERC and NERC, including PURPA, the Federal Power Act, and the EPAct 2005. Actions by the FERC, NERC and by state utilitycommissions can have a material effect on our operations.
Several of our generation businesses in the U.S. currently operate QFs as defined under PURPA. These businesses entered into long-termcontracts with electric utilities that had a mandatory obligation under PURPA to purchase power from QFs at the utility's avoided cost (i.e., the costsfor both energy and capital investment that would have been incurred by the purchasing utility if that utility had to provide its own generating capacityor purchase it from another source). EPAct 2005 authorizes the FERC to eliminate the obligation of electric utilities under Section 210 of PURPA toenter into new contracts for the purchase or sale of electricity from or to QFs if certain market conditions are met. Pursuant to this authority, theFERC has instituted a rebuttable presumption that utilities located within the control areas of MISO, PJM , ISO New England, Inc., the New YorkIndependent System Operator, Inc., and ERCOT are not required to purchase or sell power from or to QFs above a certain size. In addition, theFERC is authorized under EPAct 2005 to remove the purchase/sale obligations of individual utilities on a case-by-case basis. While this law doesnot affect existing contracts, as a result of the changes to PURPA, our QFs may face a more difficult market environment when their current long-term contracts expire.
EPAct 2005 repealed PUHCA 1935 and enacted PUHCA 2005 in its place. PUHCA 1935 had the effect of requiring utility holding companiesto operate in geographically proximate regions and therefore limited the range of potential combinations and mergers among utilities. Bycomparison, PUHCA 2005 has no such restrictions and simply provides the FERC and state utility commissions with enhanced access to the booksand records of certain utility holding companies. The repeal of PUHCA 1935 removed barriers to mergers and other potential combinations whichcould result in the creation of large, geographically dispersed utility holding companies. These entities may have enhanced financial strength andtherefore an increased ability to compete with us in the U.S. generation market.
In accordance with Congressional mandates in the EPAct 1992 and now in EPAct 2005, the FERC has strongly encouraged competition inwholesale electric markets. Increased competition may have the effect of lowering our operating margins. Among other steps, the FERC hasencouraged RTOs and ISOs to develop demand response bidding programs as a mechanism for responding to peak electric demand. Theseprograms may reduce the value of our peaking assets which rely on very high prices during a relatively small number of hours to recover their costs.Similarly, the FERC is encouraging the construction of new transmission infrastructure in accordance with provisions of EPAct 2005. Although newtransmission lines may increase market opportunities, they may also increase the competition in our existing markets.
While the FERC continues to promote competition, some state utility commissions have reversed course and begun to encourage theconstruction of generation facilities by traditional utilities to be paid for on a cost-of-service basis by retail ratepayers. Such actions have the effect ofreducing sale opportunities in the competitive wholesale generating markets in which we operate.
FERC has civil penalty authority over violations of any provision of Part II of the FPA which concerns wholesale generation or transmission, aswell as any rule or order issued thereunder. The FPA also provides for the assessment of criminal fines and imprisonment for violations under theFPA. This penalty authority was enhanced in EPAct 2005. As a result, FERC is authorized to assess a maximum penalty authority established bystatute has been and will continue to be adjusted periodically to account for inflation. With this expanded enforcement authority, violations of theFPA and FERC's regulations could potentially have more serious consequences than in the past.
Pursuant to EPAct 2005, the NERC has been certified by FERC as the Electric Reliability Organization ("ERO") to develop mandatory andenforceable electric system reliability standards applicable throughout the U.S. to improve the overall reliability of the electric grid. These standardsare subject to FERC review and approval.
58

Once approved, the reliability standards may be enforced by FERC independently, or, alternatively, by the ERO and regional reliability organizationswith responsibility for auditing, investigating and otherwise ensuring compliance with reliability standards, subject to FERC oversight. Violations ofNERC reliability standards are subject to FERC's penalty authority under the FPA and EPAct 2005.
Our utility businesses in the U.S. face significant regulation by their respective state utility commissions. The regulatory discretion isreasonably broad in both Indiana and Ohio and includes regulation as to services and facilities, the valuation of property, the construction, purchase,or lease of electric generating facilities, the classification of accounts, rates of depreciation, the increase or decrease in retail rates and charges, theissuance of certain securities, the acquisition and sale of some public utility properties or securities and certain other matters. These businessesface the risk of unexpected or adverse regulatory action which could have a material adverse effect on our results of operations, financial condition,and cash flows. See Item 1.— Business—US SBU—U.S. Businesses—U.S. Utilities for further information on the regulation faced by our U.S.utilities.
Our businesses are subject to stringent environmental laws and regulations.
Our businesses are subject to stringent environmental laws and regulations by many federal, regional, state and local authorities, internationaltreaties and foreign governmental authorities. These laws and regulations generally concern emissions into the air, effluents into the water, use ofwater, wetlands preservation, remediation of contamination, waste disposal, endangered species and noise regulation, among others. Failure tocomply with such laws and regulations or to obtain or comply with any necessary environmental permits pursuant to such laws and regulations couldresult in fines or other sanctions. Environmental laws and regulations affecting power generation and distribution are complex and have tended tobecome more stringent over time. Congress and other domestic and foreign governmental authorities have either considered or implementedvarious laws and regulations to restrict or tax certain emissions, particularly those involving air emissions and water discharges. See the variousdescriptions of these laws and regulations contained in Item 1.— Business of this Form 10-K. These laws and regulations have imposed, andproposed laws and regulations could impose in the future, additional costs on the operation of our power plants. We have incurred and will continueto incur significant capital and other expenditures to comply with these and other environmental laws and regulations. Changes in, or newdevelopment of, environmental restrictions may force the Company to incur significant expenses or expenses that may exceed our estimates. Therecan be no assurance that we would be able to recover all or any increased environmental costs from our customers or that our business, financialcondition, including recorded asset values or results of operations, would not be materially and adversely affected by such expenditures or anychanges in domestic or foreign environmental laws and regulations.
Our businesses are subject to enforcement initiatives from environmental regulatory agencies.
The EPA has pursued an enforcement initiative against coal-fired generating plants alleging wide-spread violations of the new source reviewand prevention of significant deterioration provisions of the CAA. The EPA has brought suit against a number of companies and has obtainedsettlements with many of these companies over such allegations. The allegations typically involve claims that a company made major modificationsto a coal-fired generating unit without proper permit approval and without installing best available control technology. The principal, but not exclusive,focus of this EPA enforcement initiative is emissions of SO 2 and NO x . In connection with this enforcement initiative, the EPA has imposed fines andrequired companies to install improved pollution control technologies to reduce emissions of SO 2 and NO x . In addition to EPA enforcement, stateregulatory agencies and non-governmental environmental organizations have pursued civil lawsuits against power plants in situations where theEPA has not taken such action. These civil suits have resulted in judgments and/or settlements that require the installation of expensive pollutioncontrols or the accelerated retirement of certain electric generating units. There can be no assurance that foreign environmental regulatory agenciesor environmental organizations in countries in which our subsidiaries operate will not pursue similar enforcement initiatives under relevant laws andregulations.
Regulators, politicians, non-governmental organizations and other private parties have expressed concern about greenhouse gas,or GHG, emissions and the potential risks associated with climate change and are taking actions which could have a material adverseimpact on our consolidated results of operations, financial condition and cash flows.
As discussed in Item 1.— Business , at the international, federal and various regional and state levels, rules are in effect and policies are underdevelopment to regulate GHG emissions, thereby effectively imposing a cost on such emissions in order to create financial incentives to reducethem. In 2017 , the Company's subsidiaries operated businesses which had total CO 2 emissions of approximately 62.88 million metric tonnes,approximately 28.7 million of which were emitted by businesses located in the U.S. (both figures are ownership adjusted). The Company uses CO 2
emission estimation methodologies supported by "The Greenhouse Gas Protocol" reporting standard on GHG
59

emissions. For existing power generation plants, CO 2 emissions data are either obtained directly from plant continuous emission monitoringsystems or calculated from actual fuel heat inputs and fuel type CO 2 emission factors. The estimated annual CO 2 emissions from fossil fuel-firedelectric power generation facilities of the Company's subsidiaries that are in construction or development and have received the necessary airpermits for commercial operations are approximately 10.3 million metric tonnes (ownership adjusted). This overall estimate is based on a number ofprojections and assumptions that may prove to be incorrect, such as the forecasted dispatch, anticipated plant efficiency, fuel type, CO 2 emissionsrates and our subsidiaries' achieving completion of such construction and development projects. However, it is certain that the projects underconstruction or development when completed will increase emissions of our portfolio and therefore could increase the risks associated withregulation of GHG emissions. Because there is significant uncertainty regarding these estimates, actual emissions from these projects underconstruction or development may vary substantially from these estimates.
The non-utility, generation subsidiaries of the Company often seek to pass on any costs arising from CO 2 emissions to contract counterparties,but there can be no assurance that such subsidiaries of the Company will effectively pass such costs onto the contract counterparties or that thecost and burden associated with any dispute over which party bears such costs would not be burdensome and costly to the relevant subsidiaries ofthe Company. The utility subsidiaries of the Company may seek to pass on any costs arising from CO 2 emissions to customers, but there can be noassurance that such subsidiaries of the Company will effectively pass such costs to the customers, or that they will be able to fully or timely recoversuch costs.
Foreign, federal, state or regional regulation of GHG emissions could have a material adverse impact on the Company's financial performance.The actual impact on the Company's financial performance and the financial performance of the Company's subsidiaries will depend on a number offactors, including among others, the degree and timing of GHG emissions reductions required under any such legislation or regulation, the cost ofemissions reduction equipment and the price and availability of offsets, the extent to which market based compliance options are available, theextent to which our subsidiaries would be entitled to receive GHG emissions allowances without having to purchase them in an auction or on theopen market and the impact of such legislation or regulation on the ability of our subsidiaries to recover costs incurred through rate increases orotherwise. As a result of these factors, our cost of compliance could be substantial and could have a material adverse impact on our results ofoperations.
In January 2005, based on European Community "Directive 2003/87/EC on Greenhouse Gas Emission Allowance Trading," the EU ETScommenced operation as the largest multi-country GHG emission trading scheme in the world. On February 16, 2005, the Kyoto Protocol becameeffective. The Kyoto Protocol requires all developed countries that have ratified it to substantially reduce their GHG emissions, including CO 2 .However, the United States never ratified the Kyoto Protocol and, to date, compliance with the Kyoto Protocol and the EU ETS has not had amaterial adverse effect on the Company's consolidated results of operations, financial condition and cash flows.
In December 2015, the Parties to the United Nations Framework Convention on Climate Change ("UNFCCC") convened for the 21stConference of the Parties in Paris, France. The result was the so-called Paris Agreement. The Paris Agreement has a long-term goal of keeping theincrease in global average temperature to well below 2°C above pre-industrial levels. In furtherance of this goal, participating countries submittedcomprehensive national climate action plans and have agreed to meet every five years to set more ambitious targets as required by science, toreport to each other and the public on how well they are doing to implement their targets and to track progress towards the long-term goal through arobust transparency and accountability system. We anticipate that the Paris Agreement will continue the trend toward efforts to de-carbonize theglobal economy and to further limit GHG emissions, including in those countries where the Company does business. It is difficult to predict thenature, timing and scope of such regulation but it could have a material adverse effect on the Company's financial performance.
In the U.S., there currently is no federal legislation imposing mandatory GHG emission reductions (including for CO 2 ) affecting the electricpower generation facilities of the Company's subsidiaries. However, in 2011, the EPA adopted regulations pertaining to GHG emissions that requirenew and existing sources of GHG emissions to potentially obtain new source review permits from the EPA prior to construction or modification, butonly if they also must obtain a new source review permit for increases in other regulated pollutants. Additionally, in 2015, the EPA promulgated arule establishing New Source Performance Standards for CO 2 emissions for newly constructed and modified/reconstructed fossil-fueled EUSGUslarger than 25 MW. Also in 2015, the EPA promulgated the CPP, which is applicable to preexisting EUSGUs, and requires interim reductionsbeginning in 2022, with full compliance achieved by 2030. Under the CPP, states are required to develop and submit plans that establishperformance standards or, through emissions trading programs, otherwise meet a state-wide emissions rate average or mass-based goal. Theseactions have been challenged in Court and the current Administration has announced plans to significantly amend or rescind the rules. For furtherdiscussion of the regulation of GHG emissions, including the
60

U.S. Supreme Court's issued order staying implementation of the CPP, and the EPA's proposal to rescind the CPP, see Item 1. — Business—Environmental and Land-Use Regulations—United States Environmental and Land-Use Legislation and Regulations—Greenhouse Gas Emissionsabove.
Such regulations, and in particular regulations applying to modified or existing EUSGUs, could increase our costs directly and indirectly andhave a material adverse effect on our business and/or results of operations. See Item 1.— Business of this Form 10-K for further discussion aboutthese environmental agreements, laws and regulations.
At the state level, the RGGI, a cap-and-trade program covering CO 2 emissions from electric power generation facilities in the Northeast,became effective in January 2009, and California has adopted comprehensive legislation and regulation that requires GHG reductions from multipleindustrial sectors, including the electric power generation industry. At this time, other than with regard to RGGI (further described below) andproposed Hawaii regulations relating to the collection of fees on GHG emissions, the impact of both of which we do not expect to be material, theCompany cannot estimate the costs of compliance with U.S. federal, regional or state GHG emissions reduction legislation or initiatives, due to thefact that most of these proposals are not being actively pursued or are in the early stages of development and any final regulations or laws, ifadopted, could vary drastically from current proposals; in the case of California, we anticipate no material impact due to the fact that we expect suchcosts will be passed through to our offtakers under the terms of existing tolling agreements.
The auctions of RGGI allowances needed by power generators to comply with state programs implementing RGGI occur approximately everyquarter. Our subsidiary in Maryland is our only subsidiary that was subject to RGGI in 2017 . Of the approximately 28.7 million metric tonnes of CO 2emitted in the United States by our subsidiaries in 2017 (ownership adjusted), approximately 1.2 million metric tonnes were emitted by oursubsidiary in Maryland. The Company estimates that the RGGI compliance costs could be approximately $3.5 million for 2018 . There is a risk thatour actual compliance costs under RGGI will differ from our estimates by a material amount and that our model could underestimate our costs ofcompliance.
In addition to government regulators, other groups such as politicians, environmentalists and other private parties have expressed increasingconcern about GHG emissions. For example, certain financial institutions have expressed concern about providing financing for facilities whichwould emit GHGs, which can affect our ability to obtain capital, or if we can obtain capital, to receive it on commercially viable terms. Further, ratingagencies may decide to downgrade our credit ratings based on the emissions of the businesses operated by our subsidiaries or increasedcompliance costs which could make financing unattractive. In addition, plaintiffs have brought tort lawsuits against the Company because of itssubsidiaries' GHG emissions. While the litigation mentioned has been dismissed, it is impossible to predict whether similar future lawsuits are likelyto prevail or result in damages awards or other relief. Consequently, it is impossible to determine whether such lawsuits are likely to have a materialadverse effect on the Company's consolidated results of operations and financial condition.
Furthermore, according to the Intergovernmental Panel on Climate Change, physical risks from climate change could include, but are notlimited to, increased runoff and earlier spring peak discharge in many glacier and snow-fed rivers, warming of lakes and rivers, an increase in sealevel, changes and variability in precipitation and in the intensity and frequency of extreme weather events. Physical impacts may have the potentialto significantly affect the Company's business and operations, and any such potential impact may render it more difficult for our businesses to obtainfinancing. For example, extreme weather events could result in increased downtime and operation and maintenance costs at the electric powergeneration facilities and support facilities of the Company's subsidiaries. Variations in weather conditions, primarily temperature and humidity alsowould be expected to affect the energy needs of customers. A decrease in energy consumption could decrease the revenues of the Company'ssubsidiaries. In addition, while revenues would be expected to increase if the energy consumption of customers increased, such increase couldprompt the need for additional investment in generation capacity. Changes in the temperature of lakes and rivers and changes in precipitation thatresult in drought could adversely affect the operations of the fossil fuel-fired electric power generation facilities of the Company's subsidiaries.Changes in temperature, precipitation and snow pack conditions also could affect the amount and timing of hydroelectric generation.
In addition to potential physical risks noted by the Intergovernmental Panel on Climate Change, there could be damage to the reputation of theCompany due to public perception of GHG emissions by the Company's subsidiaries, and any such negative public perception or concerns couldultimately result in a decreased demand for electric power generation or distribution from our subsidiaries. The level of GHGs emitted bysubsidiaries of the Company is not a factor in the compensation of executives of the Company.
61

If any of the foregoing risks materialize, costs may increase or revenues may decrease and there could be a material adverse effect on theelectric power generation businesses of the Company's subsidiaries and on the Company's consolidated results of operations, financial conditionand cash flows.
Tax legislation initiatives or challenges to our tax positions could adversely affect our results of operations and financial condition.
Our subsidiaries have operations in the U.S. and various non-U.S. jurisdictions. As such, we are subject to the tax laws and regulations of theU.S. federal, state and local governments and of many non-U.S. jurisdictions. From time to time, legislative measures may be enacted that couldadversely affect our overall tax positions regarding income or other taxes. There can be no assurance that our effective tax rate or tax payments willnot be adversely affected by these legislative measures.
The Tax Cuts and Jobs Act (the "2017 Act") enacted December 22, 2017 introduced significant changes to current U.S. federal tax law,including but not limited to lowering the corporate income tax rate, introducing new limits on interest expense deductibility, and changing the way inwhich foreign earnings are taxed. These changes are complex and are subject to additional guidance to be issued by the U.S. Treasury and theInternal Revenue Service. In addition, the reaction to the federal tax changes by the individual states is evolving. Our interpretations andassumptions around U.S. tax reform may evolve in future periods as further administrative guidance and regulations are issued, which maymaterially affect our effective tax rate or tax payments. For further details, please see Item 7.— Management's Discussion and Analysis of FinancialCondition and Results of Operations—Key Trends and Uncertainties in this Form 10-K.
Additionally, longstanding international tax norms that determine how and where cross-border international trade is subjected to tax areevolving. The Organization for Economic Cooperation and Development ("OECD"), in coordination with the G8 and G20, through its Base Erosionand Profit Shifting project (“BEPS") introduced a series of recommendations that many tax jurisdictions have adopted, or may adopt in the future, aslaw. As these and other tax laws, related regulations and double-tax conventions change, our financial results could be materially impacted. Giventhe unpredictability of these possible changes and their potential interdependency, it is very difficult to assess whether the overall effect of suchpotential tax changes would be cumulatively positive or negative for our earnings and cash flow, but such changes could adversely impact ourresults of operations.
U.S. federal, state and local, as well as non-U.S., tax laws and regulations are extremely complex and subject to varying interpretations. Therecan be no assurance that our tax positions will be sustained if challenged by relevant tax authorities and if not sustained, there could be a materialimpact on our results of operations.
We and our affiliates are subject to material litigation and regulatory proceedings.
We and our affiliates are parties to material litigation and regulatory proceedings. See Item 3.— Legal Proceedings below. There can be noassurances that the outcome of such matters will not have a material adverse effect on our consolidated financial position.
ITEM 1B. UNRESOLVED STAFF COMMENTS
None.
ITEM 2. PROPERTIES
We maintain offices in many places around the world, generally pursuant to the provisions of long- and short-term leases, none of which webelieve are material. With a few exceptions, our facilities, which are described in Item 1 — Business of this Form 10-K, are subject to mortgages orother liens or encumbrances as part of the project's related finance facility. In addition, the majority of our facilities are located on land that is leased.However, in a few instances, no accompanying project financing exists for the facility, and in a few of these cases, the land interest may not besubject to any encumbrance and is owned outright by the subsidiary or affiliate.
ITEM 3. LEGAL PROCEEDINGS
The Company is involved in certain claims, suits and legal proceedings in the normal course of business. The Company has accrued forlitigation and claims where it is probable that a liability has been incurred and the amount of loss can be reasonably estimated. The Companybelieves, based upon information it currently possesses and taking into account established reserves for estimated liabilities and its insurancecoverage, that the ultimate outcome of these proceedings and actions is unlikely to have a material adverse effect on the Company's financialstatements. It is reasonably possible, however, that some matters could be decided unfavorably to the Company and could require the Company topay damages or make expenditures in amounts that could be material but cannot be estimated as of December 31, 2017 .
62

In December 2001, Grid Corporation of Odisha (“GRIDCO”) served a notice to arbitrate pursuant to the Indian Arbitration and Conciliation Actof 1996 on the Company, AES Orissa Distribution Private Limited (“AES ODPL”), and Jyoti Structures (“Jyoti”) pursuant to the terms of theshareholders agreement between GRIDCO, the Company, AES ODPL, Jyoti and the Central Electricity Supply Company of Orissa Ltd. (“CESCO”),an affiliate of the Company. In the arbitration, GRIDCO asserted that a comfort letter issued by the Company in connection with the Company'sindirect investment in CESCO obligates the Company to provide additional financial support to cover all of CESCO's financial obligations toGRIDCO. GRIDCO appeared to be seeking approximately $189 million in damages, plus undisclosed penalties and interest, but a detailed allegeddamage analysis was not filed by GRIDCO. The Company counterclaimed against GRIDCO for damages. In June 2007, a 2-to-1 majority of thearbitral tribunal rendered its award rejecting GRIDCO's claims and holding that none of the respondents, the Company, AES ODPL, or Jyoti, hadany liability to GRIDCO. The respondents' counterclaims were also rejected. A majority of the tribunal later awarded the respondents, including theCompany, some of their costs relating to the arbitration. GRIDCO filed challenges of the tribunal's awards with the local Indian court. GRIDCO'schallenge of the costs award has been dismissed by the court, but its challenge of the liability award remains pending. A hearing on the liabilityaward is scheduled for March 15, 2018. The Company believes that it has meritorious defenses to the claims asserted against it and will defenditself vigorously in these proceedings; however, there can be no assurances that it will be successful in its efforts.
In January 2012, the Brazil Federal Tax Authority issued an assessment alleging that AES Tietê had paid PIS and COFINS taxes from 2007 to2010 at a lower rate than the tax authority believed was applicable. AES Tietê challenged the assessment on the grounds that the tax rate was setin the applicable legislation. In April 2013, the FIAC determined that AES Tietê should have calculated the taxes at the higher rate and that AESTietê was liable for unpaid taxes, interest, and penalties totaling approximately R$1.17 billion ( $353 million ) as estimated by AES Tietê. AES Tietêappealed to the SIAC. In January 2015, the SIAC issued a decision in AES Tietê's favor, finding that AES Tietê was not liable for unpaid taxes. Thepublic prosecutor subsequently filed an appeal, which was denied as untimely. The Tax Authority thereafter filed a motion for clarification of theSIAC's decision, which was denied in September 2016. The Tax Authority later filed a special appeal (“Special Appeal”), which was rejected asuntimely in October 2016. The Tax Authority thereafter filed an interlocutory appeal with the Superior Administrative Court (“SAC”). In March 2017,the President of the SAC determined that the SAC would analyze the Special Appeal on timeliness and, if required, the merits. AES Tietê haschallenged the Special Appeal. AES Tietê believes it has meritorious defenses to the claim and will defend itself vigorously in these proceedings;however, there can be no assurances that it will be successful in its efforts.
In January 2015, DPL received NOVs from the EPA alleging violations of opacity at Stuart and Killen Stations, and in October 2015, IPLreceived a similar NOV alleging violations at Petersburg Station. In February 2017, the EPA issued a second NOV for DPL Stuart Station, allegingviolations of opacity in 2016. Moreover, in February 2016, IPL received an NOV from the EPA alleging violations of NSR and other CAA regulations,the Indiana SIP, and the Title V operating permit at Petersburg Station. It is too early to determine whether the NOVs could have a material impacton our business, financial condition or results of our operations. IPL would seek recovery of any operating or capital expenditures, but not fines orpenalties, related to air pollution control technology to reduce regulated air emissions; however, there can be no assurances that we would besuccessful in this regard.
In September 2015, AES Southland Development, LLC and AES Redondo Beach, LLC filed a lawsuit against the California CoastalCommission (the “CCC”) over the CCC's determination that the site of AES Redondo Beach included approximately 5.93 acres of CCC-jurisdictionalwetlands. The CCC has asserted that AES Redondo Beach has improperly installed and operated water pumps affecting the alleged wetlands inviolation of the California Coastal Act and Redondo Beach Local Coastal Program and has ordered AES Redondo Beach to restore the site.Additional potential outcomes of the CCC determination could include an order requiring AES Redondo Beach to fund a wetland mitigation projectand/or pay fines or penalties. AES Redondo Beach believes that it has meritorious arguments and intends to vigorously prosecute such lawsuit, butthere can be no assurances that it will be successful.
In October 2015, Ganadera Guerra, S.A. (“GG”) and Constructora Tymsa, S.A. (“CT”) filed separate lawsuits against AES Panama in the localcourts of Panama. The claimants allege that AES Panama profited from a hydropower facility (La Estrella) being partially located on land ownedinitially by GG and currently by CT, and that AES Panama must pay compensation for its use of the land. The damages sought from AES Panamaare approximately $685 million (GG) and $100 million (CT). In October 2016, the court dismissed GG's claim because of GG's failure to comply witha court order requiring GG to disclose certain information. GG has refiled its lawsuit. Also, there are ongoing administrative proceedings concerningwhether AES Panama is entitled to acquire an easement over the land and whether AES Panama can continue to occupy the land. AES Panamabelieves it has
63

meritorious defenses and claims and will assert them vigorously; however, there can be no assurances that it will be successful in its efforts.
In January 2017, the Superintendencia del Medio Ambiente (“SMA”) issued a Formulation of Charges asserting that Alto Maipo is in violation ofcertain conditions of the Environmental Approval Resolution (“RCA”) governing Alto Maipo’s hydropower project, for, among other things, operatingvehicles at unauthorized times and failing to mitigate the impact of water intrusion during tunnel construction. In February 2017, Alto Maiposubmitted a compliance plan to the SMA which, if approved by the agency, would resolve the matter without materially impacting construction of theproject. In June 2017, the SMA issued a resolution detailing its comments on the compliance plan. Alto Maipo responded to the SMA’s comments inJuly 2017. In January 2018, the SMA requested additional information from Alto Maipo relating to the compliance plan and Formulation of Charges.In February 2018, Alto Maipo submitted certain information to the SMA, which is under consideration by the agency. The outcome of this matter isuncertain, but an adverse decision by the SMA could have a negative impact on the construction of the project. Alto Maipo will pursue its interestsvigorously in this matter; however, there can be no assurance that it will be successful in its efforts.
In June 2017, Alto Maipo terminated one of its contractors, Constructora Nuevo Maipo S.A. (“CNM”), given CNM’s stoppage of tunnelingworks, its failure to produce a completion plan, and its other breaches of contract. Alto Maipo also initiated arbitration against CNM to recoverexcess completion costs and other damages relating to these breaches. CNM subsequently initiated a separate arbitration, seeking a declarationthat its termination was wrongful, damages, and other relief. CNM has not supported its alleged damages, but it has asserted that it is entitled torecover over $20 million in damages, legal costs, and approximately $73 million that was drawn by Alto Maipo under letters of credit. Thearbitrations have been consolidated into a single action. The evidentiary hearing is scheduled for May 20-31, 2019. In the interim, CNM requestedthat the arbitral Tribunal issue an order requiring Alto Maipo to immediately return or escrow the letter of credit funds. In February 2018, the Tribunaldenied CNM’s request for interim relief. However, the ultimate merits of CNM’s arbitration claims will be decided after the May 2018 hearing,including in relation to the letters of credit. In addition, CNM is attempting to seek relief in the Chilean court of appeals concerning the draws on theletters of credit. That action is pending . Alto Maipo believes it has meritorious claims and defenses and will assert them vigorously in theseproceedings; however, there can be no assurances that it will be successful in its efforts.
In October 2017, the Ministry of Justice (“MOJ”) of the Republic of Kazakhstan (“ROK”) filed a lawsuit in the Specialized Economic Court ofEastern-Kazakhstan Region (“Economic Court”) against Tau Power BV (an AES affiliate), Altai Power LLP (an AES affiliate), the Company, and twohydropower plants (“HPPs”) previously under concession to Tau Power. In its lawsuit, the MOJ references a 2013 treaty arbitration award (“2013Award”) against the ROK concerning the ROK’s energy laws. While its lawsuit is unclear, the MOJ appears to seek relief relating to the net incomedistributed by the HPPs during certain years of the concession period. In November 2017, the Economic Court issued a decision that purports toallow the MOJ to enforce the 2013 Award in Kazakhstan. The decision was affirmed on intermediate appeal. The AES defendants have appealed tothe Kazakhstan Supreme Court. The AES defendants believe that the lawsuit is without merit and they will assert their defenses vigorously;however, there can be no assurances that they will be successful in their efforts.
ITEM 4. MINE SAFETY DISCLOSURES
Not applicable.
64

PART IIITEM 5. MARKET FOR REGISTRANT'S COMMON EQUITY, RELATED STOCKHOLDER MATTERS AND ISSUER PURCHASES OF EQUITYSECURITIES
Recent Sales of Unregistered Securities
None.
Purchases of Equity Securities by the Issuer and Affiliated Purchasers
Stock Repurchase Program — The Board authorization permits the Parent Company to repurchase stock through a variety of methods,including open market repurchases and/or privately negotiated transactions. There can be no assurances as to the amount, timing or prices ofrepurchases, which may vary based on market conditions and other factors. The Program does not have an expiration date and can be modified orterminated by the Board of Directors at any time. The cumulative repurchase from the commencement of the Program in July 2010 throughDecember 31, 2017 is 154.3 million shares at a total cost of $1.9 billion , at an average price per share of $12.12 (including a nominal amount ofcommissions). As of December 31, 2017 , $246 million remained available for repurchase under the Program. No repurchases were made by TheAES Corporation of its common stock during the year ended December 31, 2017 . The Parent Company repurchased 8,686,983 and 39,684,131shares of its common stock in 2016 and 2015 , respectively.
Market Information
Our common stock is traded on the NYSE under the symbol "AES." The closing price of our common stock as reported by the NYSE onFebruary 21, 2018 , was $10.23 per share. The following tables present the high and low intraday sale prices of our common stock and cashdividends declared for the indicated periods.
2017 2016
Sales Price Cash Dividends Sales Price Cash Dividends
High Low Declared High Low DeclaredFirst Quarter $ 12.06 $ 10.93 $ 0.12 $ 11.80 $ 8.22 $ 0.11Second Quarter 12.05 10.95 — 12.48 10.49 —Third Quarter 11.66 10.60 0.12 13.32 11.85 0.11Fourth Quarter 11.34 10.00 0.25 12.75 10.98 0.23
Dividends
The Parent Company commenced a quarterly cash dividend in the fourth quarter of 2012. The Parent Company has increased this dividendannually and the cash dividend for the last three years are displayed below.
Commencing the fourth quarter of 2017 2016 2015
Cash dividend $0.13 $0.12 $0.11
The fourth quarter 2017 cash dividend is to be paid in the first quarter of 2018 . There can be no assurance that the AES Board will declare adividend in the future or, if declared, the amount of any dividend. Our ability to pay dividends will also depend on receipt of dividends from ourvarious subsidiaries across our portfolio.
Under the terms of our senior secured credit facility, which we entered into with a commercial bank syndicate, we have limitations on our abilityto pay cash dividends and/or repurchase stock. Our subsidiaries' ability to declare and pay cash dividends to us is also subject to certain limitationscontained in the project loans, governmental provisions and other agreements to which our subsidiaries are subject. See the information containedunder Item 12.— Security Ownership of Certain Beneficial Owners and Management and Related Stockholder Matters—Securities Authorized forIssuance under Equity Compensation Plans of this Form 10-K.
Holders
As of February 21, 2018 , there were approximately 4,120 record holders of our common stock.
65

Performance GraphTHE AES CORPORATION
PEER GROUP INDEX/STOCK PRICE PERFORMANCE
Source: Bloomberg
We have selected the Standard and Poor's ("S&P") 500 Utilities Index as our peer group index. The S&P 500 Utilities Index is a publishedsector index comprising the 28 electric and gas utilities included in the S&P 500.
The five year total return chart assumes $100 invested on December 31, 2012 in AES Common Stock, the S&P 500 Index and the S&P 500Utilities Index. The information included under the heading Performance Graph shall not be considered "filed" for purposes of Section 18 of theSecurities Exchange Act of 1934 or incorporated by reference in any filing under the Securities Act of 1933 or the Securities Exchange Act of 1934.
ITEM 6. SELECTED FINANCIAL DATA
The following table presents our selected financial data as of the dates and for the periods indicated. This data should be read together withItem 7.— Management's Discussion and Analysis of Financial Condition and Results of Operations and the Consolidated Financial Statements andthe notes thereto included in Item 8.— Financial Statements and Supplementary Data of this Form 10-K. The selected financial data for each of theyears in the five year period ended December 31, 2017 have been derived from our audited Consolidated Financial Statements. Prior periodamounts have been restated to reflect discontinued operations in all periods presented. Prior to July 1, 2014, a discontinued operation was acomponent of the Company that either had been disposed of or was classified as held-for-sale and where the Company did not expect to havesignificant cash flows or significant continuing involvement with the component as of one year after its disposal or sale. Effective July 1, 2014, theCompany adopted new accounting guidance under which the Company reports a business as discontinued operations if the disposal represents astrategic shift that has (or will have) a major effect on the Company’s operations and financial results when the business is sold or classified as held-for-sale. Please refer to Note 1 in Item 8.— Financial Statements and Supplementary Data of this Form 10-K for further explanation. Our historicalresults are not necessarily indicative of our future results.
Acquisitions, disposals, reclassifications and changes in accounting principles affect the comparability of information included in the tablesbelow. Please refer to the Notes to the Consolidated Financial Statements included in Item 8.— Financial Statements and Supplementary Data ofthis Form 10-K for further explanation of the effect of such activities. Please also refer to Item 1A.— Risk Factors of this Form 10-K and Note 25 —Risks and Uncertainties to the Consolidated Financial Statements included in Item 8.— Financial Statements and
66

Supplementary Data of this Form 10-K for certain risks and uncertainties that may cause the data reflected herein not to be indicative of our futurefinancial condition or results of operations.
SELECTED FINANCIAL DATA
2017 2016 2015 2014 2013Statement of Operations Data for the Years Ended December 31: (in millions, except per share amounts)
Revenue $ 10,530 $ 10,281 $ 11,260 $ 12,604 $ 12,051
Income (loss) from continuing operations (1) (148) 191 682 941 751
Income (loss) from continuing operations attributable to The AES Corporation, net of tax (507) (20) 318 678 264
Income (loss) from discontinued operations attributable to The AES Corporation, net of tax (654) (1,110) (12) 91 (150)
Net income (loss) attributable to The AES Corporation $ (1,161) $ (1,130) $ 306 $ 769 $ 114
Per Common Share Data
Basic earnings (loss) per share: Income (loss) from continuing operations attributable to The AES Corporation, net of tax $ (0.77) $ (0.04) $ 0.46 $ 0.94 $ 0.36
Income (loss) from discontinued operations attributable to The AES Corporation, net of tax (0.99) (1.68) (0.01) 0.13 (0.21)
Basic earnings (loss) per share $ (1.76) $ (1.72) $ 0.45 $ 1.07 $ 0.15
Diluted earnings (loss) per share: Income (loss) from continuing operations attributable to The AES Corporation, net of tax $ (0.77) $ (0.04) $ 0.46 $ 0.94 $ 0.35
Income (loss) from discontinued operations attributable to The AES Corporation, net of tax (0.99) (1.68) (0.02) 0.12 (0.20)
Diluted earnings (loss) per share $ (1.76) $ (1.72) $ 0.44 $ 1.06 $ 0.15
Dividends Declared Per Common Share $ 0.49 $ 0.45 $ 0.41 $ 0.25 $ 0.17
Cash Flow Data for the Years Ended December 31: Net cash provided by operating activities $ 2,489 $ 2,884 $ 2,134 $ 1,791 $ 2,715
Net cash used in investing activities (2,749) (2,108) (2,366) (656) (1,774)
Net cash provided by (used in) financing activities 43 (747) 28 (1,262) (1,136)
Total (decrease) increase in cash and cash equivalents (295) 26 (231) (119) (253)
Cash and cash equivalents, ending 949 1,244 1,218 1,517 1,636
Balance Sheet Data at December 31: Total assets $ 33,112 $ 36,124 $ 36,545 $ 38,676 $ 40,100
Non-recourse debt (noncurrent) 13,176 13,731 12,184 12,077 11,486
Non-recourse debt (noncurrent)—Discontinued operations — 758 772 1,226 1,629
Recourse debt (noncurrent) 4,625 4,671 4,966 5,047 5,485
Redeemable stock of subsidiaries 837 782 538 78 78
Retained earnings (accumulated deficit) (2,276) (1,146) 143 512 (150)
The AES Corporation stockholders' equity 2,465 2,794 3,149 4,272 4,330_____________________________
(1) Includes pre-tax impairment expense of $537 million , $1.1 billion , $602 million , $383 million , and $596 million for the years ended December 31, 2017 , 2016 , 2015 , 2014 and 2013 , respectively. SeeNote 8 — Goodwill and Other Intangible Assets and Note 19 — Asset Impairment Expense included in Item 8.— Financial Statements and Supplementary Data of this Form 10-K for further information.
67

ITEM 7. MANAGEMENT'S DISCUSSION AND ANALYSIS OF FINANCIAL CONDITION AND RESULTS OF OPERATIONS
Executive SummaryDiluted loss per share from continuing operations for the year ended December 31, 2017 was $0.77 , an increase of $0.73 compared to the
year ended December 31, 2016 . The increase was primarily due to a one-time transition tax on foreign earnings following the enactment of the U.S.Tax Cuts and Jobs Act in the fourth quarter of 2017. This impact was partially offset by lower impairment expense, primarily at DPL in the US SBU.Adjusted EPS, a non-GAAP financial measure, for the year ended December 31, 2017 increased $0.14 to $1.08 , reflecting higher margins, primarilyat the MCAC SBU, and contributions from new businesses in the U.S. and MCAC.
Strategic Priorities
As a result of our efforts to decrease our exposure to coal-fired generation and increase our portfolio of renewables, energy storage, andnatural gas capacity, we are significantly reducing our carbon intensity. In 2017, AES and AIMCo completed the joint acquisition of sPower, thelargest independent solar developer in the United States. In addition, we announced the sale or retirement of 4.5 GW of mostly merchant coal-firedgeneration, representing 31% of our coal-fired capacity.
In February 2018, we announced a reorganization as a part of our ongoing strategy to simplify our portfolio, optimize our cost structure, andreduce our carbon intensity. Reflecting this simplified portfolio, we will manage our global operations separate from our growth and commercialactivities.
Overview of 2017 Results and Strategic PerformanceEarnings Per Share and Free Cash Flow Results in 2017 (in millions, except per share amounts)
Years Ended December 31, 2017 2016 2015Diluted earnings (loss) per share from continuing operations $ (0.77) $ (0.04) $ 0.46
Adjusted EPS (a non-GAAP measure) (1) 1.08 0.94 1.24Net cash provided by operating activities 2,489 2,884 2,134
Free Cash Flow (a non-GAAP measure) (1) 1,921 2,244 1,628_____________________________
(1) See reconciliation and definition under SBU Performance Analysis—Non-GAAP Measures .
Diluted loss per share from continuing operations increased to a loss per share of $0.77 primarily due to a higher effective tax rate as a resultof the U.S. Tax Reform Law enacted on December 22, 2017, partially offset by prior year impairments at DPL.
Adjusted EPS, a non-GAAP measure, increased by 15% to $1.08 primarily driven by higher margins at our MCAC SBU, contributions fromnew solar projects in the US, a one-time allowance on a non-trade receivable recognized in 2016, and the favorable impact of the YPF legalsettlement at AES Uruguaiana, which was partially offset by higher adjusted effective tax rate.
Net cash provided by operating activities decreased by 14% to $2.5 billion primarily driven the collection of $360 million of overdue receivablesat Maritza in 2016 and additional investments in working capital at Eletropaulo of $189 million. These decreases were partially offset by the $98million increase in operating margin, excluding non cash drivers, at the Andes SBU.
Free Cash Flow, a non-GAAP measure, decreased by 14% to $1.9 billion primarily driven by a $ 395 million decrease in net cash provided byoperating activities.
68

Review of Consolidated Results of OperationsYears Ended December 31, 2017 2016 2015 % Change 2017 vs.
2016 % Change 2016 vs.2015
(in millions, except per share amounts)
Revenue:
US SBU $ 3,229 $ 3,429 $ 3,593 -6 % -5 %
Andes SBU 2,710 2,506 2,489 8 % 1 %
Brazil SBU 542 450 962 20 % -53 %
MCAC SBU 2,448 2,172 2,353 13 % -8 %
Eurasia SBU 1,590 1,670 1,875 -5 % -11 %
Corporate and Other 35 77 31 -55 % NM
Intersegment eliminations (24) (23) (43) -4 % 47 %
Total Revenue 10,530 10,281 11,260 2 % -9 %
Operating Margin:
US SBU 567 582 621 -3 % -6 %
Andes SBU 658 634 618 4 % 3 %
Brazil SBU 203 186 397 9 % -53 %
MCAC SBU 589 523 543 13 % -4 %
Eurasia SBU 423 429 452 -1 % -5 %
Corporate and Other 23 15 33 53 % -55 %
Intersegment eliminations 1 11 (1) 91 % NM
Total Operating Margin 2,464 2,380 2,663 4 % -11 %
General and administrative expenses (215) (194) (196) 11 % -1 %
Interest expense (1,170) (1,134) (1,145) 3 % -1 %
Interest income 244 245 256 — % -4 %
Loss on extinguishment of debt (68) (13) (182) NM -93 %
Other expense (57) (79) (24) -28 % NM
Other income 120 64 84 88 % -24 %
Gain (loss) on disposal and sale of bus inesses (52) 29 29 NM — %
Goodwill impairment expense — — (317) — % -100 %
Asset impairment expense (537) (1,096) (285) -51 % NM
Foreign currency transaction gains (losses) 42 (15) 106 NM NM
Income tax expense (990) (32) (412) NM -92 %
Net equity in earnings of affiliates 71 36 105 97 % -66 %
INCOME (LOSS) FROM CONTINUING OPE RATIONS (148) 191 682 NM -72 %
Income (loss) from operations of discontinued businesses (18) 151 80 NM 89 %
Net loss from disposal and impairments of discontinued operations (611) (1,119) — -45 % NM
NET INCOME (LOSS) (777) (777) 762 — % NM
Noncontrolling interests: Less: Income from continuing operations attributable to non controlling interests andredeemable stock of subsidiaries (359) (211) (364) 70 % -42 %
Less: Income from discontinued operations attributable to noncontrolling interests (25) (142) (92) -82 % 54 %
NET INCOME (LOSS) ATTRIBUTABLE TO THE AES CORPORATION $ (1,161) $ (1,130) $ 306 3 % NMAMOUNTS ATTRIBUTABLE TO THE AES CORPORATION COMMONSTOCKHOLDERS:
Income (loss) from continuing operations, net of tax $ (507) $ (20) $ 318 NM NM
Loss from discontinued operations, net of tax (654) (1,110) (12) -41 % NM
NET INCOME (LOSS) ATTRIBUTABLE TO THE AES CORPORATION $ (1,161) $ (1,130) $ 306 3 % NM
Net cash provided by operating activities $ 2,489 $ 2,884 $ 2,134 -14 % 35 %
DIVIDENDS DECLARED PER COMMON SHARE $ 0.49 $ 0.45 $ 0.41 9 % 10 %
Components of Revenue, Cost of Sales and Operating Margin — Revenue includes revenue earned from the sale of energy from our utilitiesand the production of energy from our generation plants, which are classified as regulated and non-regulated, respectively, on the ConsolidatedStatements of Operations. Revenue also includes the gains or losses on derivatives associated with the sale of electricity.
Cost of sales includes costs incurred directly by the businesses in the ordinary course of business. Examples include electricity and fuel

purchases, operations and maintenance costs, depreciation and amortization expense, bad debt expense and recoveries, and generaladministrative and support costs (including employee-related costs
69

directly associated with the operations of the business). Cost of sales also includes the gains or losses on derivatives (including embeddedderivatives other than foreign currency embedded derivatives) associated with the purchase of electricity or fuel.
Operating margin is defined as revenue less cost of sales.
Consolidated Revenue and Operating Margin(in millions)
Year Ended December 31, 2017
Consolidated Revenue — Revenue increased $249 million , or 2% , in 2017 compared to 2016 primarily driven by:
• $276 million in MCAC primarily due to the commencement of the combined cycle operations at Los Mina in June 2017 as well as higherrates in the Dominican Republic and higher pass through costs in El Salvador, partially offset by hurricane impacts at Puerto Rico; and
• $204 million in Andes primarily due to the start of commercial operations at Cochrane as well as higher availability at Argentina, partiallyoffset by lower spot sales at Chivor.
These positive impacts were partially offset by a decrease of $200 million in the U.S. mainly due to lower retail tariffs as well as lowerwholesale volume and price at DPL.
Consolidated Operating Margin — Operating margin increased $84 million , or 4% , in 2017 compared to 2016 primarily driven by:
• The favorable impact of FX of $39 million , primarily in Brazil, Argentina, and Colombia.
Excluding the FX impact mentioned above:
• $65 million in MCAC due to the commencement of the Los Mina combined cycle operations in June 2017 in the Dominican Republic as wellas higher availability due to forced outages in 2016 at Mexico.
These positive impacts were partially offset by a decrease of $15 million in the U.S. driven by lower retail margin, lower volumes, and lowercommercial availability at DPL as well as a negative impact at IPL mainly due to one-off accruals due to the implementation of new base ratesin Q2 2016.
Year Ended December 31, 2016
Consolidated Revenue — Revenue decreased $979 million , or 9% , in 2016 compared to 2015 primarily driven by:
• The unfavorable FX impacts of $326 million, primarily in Argentina of $94 million, Kazakhstan of $63 million and Colombia of $54 million.
Excluding the FX impact mentioned above:
• $483 million in Brazil due to lower rates for energy sold under new contracts at Tietê as well as operations in 2015 but not in 2016 atUruguaiana;
• $164 million in the U.S. primarily due to the sale of DPLER in January 2016 as well as lower rates at DPL, partially offset by higher retailrates at IPL;
• $141 million in MCAC primarily due to lower pass-through costs at El Salvador; and
70

• $95 million in Eurasia primarily due to lower pass-through costs at IPP4 in Jordan, partially offset by the full operations at Mong Duong in2016 compared to Unit 1 in March 2015 with principal operations commencing in April 2015.
These decreases were partially offset by an increase of $165 million in Andes mainly due to the commencement of operations at Cochrane inChile with Unit1 operational in July 2016 and principal operations in October.
Consolidated Operating Margin — Operating margin decreased $283 million , or 11% , in 2016 compared to 2015 primarily driven by:
• The unfavorable FX impacts of $88 million, primarily in Kazakhstan, Argentina, and Colombia.
Excluding the FX impact mentioned above:
• $198 million in Brazil driven by the revenue drivers above; and
• $39 million in the U.S. driven by the revenue drivers above.These decreases were partially offset by an increase of $52 million in Andes driven by the revenue drivers above as well as lower spot pricesat Gener Chile.
See Item 7. — Management's Discussion and Analysis of Financial Condition and Results of Operations—SBU Performance Analysis of thisForm 10-K for additional discussion and analysis of operating results for each SBU.
Consolidated Results of Operations — OtherGeneral and administrative expenses
General and administrative expenses include expenses related to corporate staff functions and initiatives, executive management, finance,legal, human resources and information systems, as well as global development costs.
General and administrative expenses increased $21 million , or 11% , in 2017 from 2016 primarily due to severance costs related to workforcereductions associated with a major restructuring program, increased professional fees and increased business development activity.
General and administrative expenses decreased $2 million , or 1% , in 2016 from 2015 with no material drivers.
Interest expense
Interest expense increased $36 million , or 3% , in 2017 from 2016 primarily due to a $30 million increase at Andes SBU, driven by lowercapitalized interest in 2017 due to Cochrane plant starting commercial operations in the second half of 2016.
Interest expense decreased $11 million , or 1% in 2016 from 2015 primarily due to a decrease in debt balance at the Parent Company and USSBU, partially offset by higher interest expense due to Mong Duong assets being placed in service, which ended the interest capitalization period atthe Eurasia SBU.
Interest income
Interest income decreased $1 million in 2017 from 2016 with no material drivers.
Interest income decreased $11 million , or 4% , in 2016 from 2015 primarily due to prior year recognition of accumulated interest on VATbalances at the Andes SBU and lower short term investment balances at the Brazil SBU in 2016, partially offset by higher interest incomerecognized on the financing element of the service concession arrangement at Mong Duong in the Eurasia SBU, which became fully operational inApril 2015.
Loss on extinguishment of debt
Loss on extinguishment of debt was $68 million for the year ended December 31, 2017 primarily related to losses of $92 million , $20 million ,and $9 million on debt extinguishments at the Parent Company, AES Gener, and IPALCO, respectively. The loss was partially offset by a gain onearly retirement of debt at Alicura of $65 million.
Loss on extinguishment of debt was $13 million for the year ended December 31, 2016 . This loss was primarily related to losses of $14 millionrecognized on debt extinguishment at the Parent Company.
Loss on extinguishment of debt was $182 million for the year ended December 31, 2015 . This loss was primarily related to losses of $105million, $22 million, and $19 million recognized on debt extinguishments at the Parent Company, IPL, and the Dominican Republic, respectively.
71

Other income and expense
Other income increased $56 million , or 88% , in 2017 from 2016 primarily due to the favorable impact at Brazil SBU as a result of thesettlement of legal proceeding at AES Uruguaiana related to YPF's breach of the parties’ gas supply agreement in 2017.
Other income decreased $20 million , or 24% , in 2016 from 2015 primarily due to gains on early contract termination in 2015.
Other expense decreased $22 million , or 28% , in 2017 from 2016 primarily due to the 2016 recognition of a full allowance on a non-tradereceivable in the MCAC SBU as a result of payment delays. This decrease was partially offset by the 2017 loss on disposal of assets at DPL as aresult of the decision to close the coal-fired and diesel-fired generating units at Stuart and Killen on or before June 1, 2018 and the write-off of waterrights in the Andes SBU for projects that are no longer being pursued.
Other expense increased $55 million in 2016 from 2015 primarily due to the 2016 recognition of a full allowance on a non-trade receivable inthe MCAC SBU as a result of payment delays.
See Note 18 — Other Income and Expense included in Item 8.— Financial Statements and Supplementary Data of this Form 10-K for furtherinformation.
Gain (loss) on disposal and sale of businesses
Loss on disposal and sale of businesses was $52 million for the year ended December 31, 2017 primarily due to the $49 million and $33million loss on sale of Kazakhstan CHPs and hydroelectric plants, respectively, partially offset by the recognition of a $23 million gain related to theexpiration of a contingency at Masinloc.
Gain on disposal and sale of businesses was $29 million for the year ended December 31, 2016 primarily due to the $49 million gain on sale ofDPLER, partially offset by the $20 million loss on the deconsolidation of U.K. Wind.
Gain on disposal and sale of businesses was $29 million for the year ended December 31, 2015 primarily due to the $22 million gain on sale ofArmenia Mountain.
Goodwill impairment expense
There were no goodwill impairments for the years ended December 31, 2017 or 2016 .
Goodwill impairment expense was $317 million for the year ended December 31, 2015 due to a goodwill impairment at DP&L.
See Note 8 — Goodwill and Other Intangible Assets included in Item 8.— Financial Statements and Supplementary Data of this Form 10-K forfurther information.
Asset impairment expense
Asset impairment expense decreased $559 million , or 51% , in 2017 from 2016 mainly driven by the prior year US SBU impairment of $859million at DPL, partially offset by a $121 million impairment in the current year at Laurel Mountain as a result of a decline in forward pricing.
Asset impairment expense increased $811 million in 2016 from 2015 primarily due to asset impairments recognized during 2016 at DPL in theUS SBU, resulting from lower forecasted revenues from the PJM capacity auction and higher anticipated environmental compliance costs.
See Note 19 — Asset Impairment Expense included in Item 8.— Financial Statements and Supplementary Data of this Form 10-K for furtherinformation.
72

Foreign currency transaction gains (losses)
Foreign currency transaction gains (losses) in millions were as follows:
Years Ended December 31, 2017 2016 2015Mexico $ 17 $ (8) $ (6)Philippines 15 12 8Bulgaria 14 (8) 3Chile 8 (9) (18)AES Corporation 3 (50) (31)Argentina 1 37 124United Kingdom (3) 13 11Colombia (23) (8) 29Other 10 6 (14)
Total (1) $ 42 $ (15) $ 106_____________________________
(1) Includes gains of $21 million , $17 million and $247 million on foreign currency derivative contracts for the years ended December 31, 2017 , 2016 and 2015 , respectively.
The Company recognized net foreign currency transaction gains of $42 million for the year ended December 31, 2017 primarily driven bytransactions associated with VAT activity in Mexico, the amortization of frozen embedded derivatives in the Philippines, and appreciation of the Euroin Bulgaria. These gains were partially offset by unfavorable foreign currency derivatives in Colombia.
The Company recognized net foreign currency transaction losses of $15 million for the year ended December 31, 2016 primarily due toremeasurement losses on intercompany notes, and losses on swaps and options at The AES Corporation. This loss was partially offset in Argentina,mainly due to the favorable impact of foreign currency derivatives related to government receivables.
The Company recognized net foreign currency transaction gains of $106 million for the year ended December 31, 2015 primarily due to foreigncurrency derivatives related to government receivables in Argentina and depreciation of the Colombian peso in Colombia. These gains were partiallyoffset due to decreases in the valuation of intercompany notes at The AES Corporation and unfavorable devaluation of the Chilean peso in Chile.
Income tax expense
Income tax expense increased $958 million to $990 million in 2017 as compared to 2016. The Company's effective tax rates were 128% and17% for the years ended December 31, 2017 and 2016 , respectively.
The net increase in the 2017 effective tax rate was due primarily to expense related to the U.S. tax reform one-time transition tax andremeasurement of deferred tax assets. Further, the 2016 rate was impacted by the items described below.
Income tax expense decreased $380 million to $32 million in 2016 as compared to 2015. The Company's effective tax rates were 17% and42% for the years ended December 31, 2016 and 2015 , respectively.
The net decrease in the 2016 effective tax rate was due, in part, to the 2016 asset impairments in the U.S., as well as the devaluation of thepeso in certain of our Mexican subsidiaries and the release of valuation allowance at certain of our Brazilian subsidiaries. These favorable itemswere partially offset by the unfavorable impact of Chilean income tax law reform enacted during the first quarter of 2016. Further, the 2015 rate wasdue, in part, to the nondeductible 2015 impairment of goodwill at DP&L and Chilean withholding taxes offset by the release of valuation allowance atcertain of our businesses in Brazil, Vietnam and the U.S. See Note 19 — Asset Impairment Expense included in Item 8.— Financial Statements andSupplementary Data of this Form 10-K for additional information regarding the 2016 U.S. asset impairments. See Note 20 — Income Taxes includedin Item 8.— Financial Statements and Supplementary Data of this Form 10-K for additional information regarding the 2016 Chilean income tax lawreform.
Our effective tax rate reflects the tax effect of significant operations outside the U.S., which are generally taxed at rates different than the U.S.statutory rate. Foreign earnings may be taxed at rates higher than the new U.S. corporate rate of 21% and a greater portion of our foreign earningsmay be subject to current U.S. taxation under the new tax rules. A future proportionate change in the composition of income before income taxesfrom foreign and domestic tax jurisdictions could impact our periodic effective tax rate. The Company also benefits from reduced tax rates in certaincountries as a result of satisfying specific commitments regarding employment and capital investment. See Note 20 — Income Taxes included inItem 8.— Financial Statements and Supplementary Data of this Form 10-K for additional information regarding these reduced rates.
73

Net equity in earnings of affiliates
Net equity in earnings of affiliates increased $35 million , or 97% , in 2017 from 2016 primarily due to earnings at the sPower equity methodinvestment purchased in 2017, partially offset by fixed asset impairments in 2017 at the Distributed Energy entities, accounted for as equity affiliates.The $42 million equity earnings recorded for the investment in sPower includes the allocation of $53 million of project income to AES through theapplication of the HLBV model. This income includes the impact of day one gain described in Note 1 — General and Summary of SignificantAccounting Policies—Allocation of Earnings included in Item 8.— Financial Statements and Supplementary Data of this Form 10-K. The net projectincome at sPower in the period after the acquisition was $20 million.
Net equity in earnings of affiliates decreased $69 million , or 66% , in 2016 from 2015 as a result of the restructuring of Guacolda in September2015, which resulted in a $66 million benefit. No comparable transaction occurred in 2016.
See Note 7 — Investments In and Advances to Affiliates included in Item 8.— Financial Statements and Supplementary Data of this Form 10-Kfor further information.
Net income (loss) from discontinued operations
Net loss from discontinued operations was $629 million for the year ended December 31, 2017 primarily due to the after-tax loss ondeconsolidation of Eletropaulo of $611 million recognized in the fourth quarter of 2017. The remaining loss was due to a loss contingencyrecognized by our equity affiliate, partially offset by the income from operations of Eletropaulo prior to the date of deconsolidation.
Net loss from discontinued operations was $968 million for the year ended December 31, 2016 due to the sale of Sul, partially offset by theincome from operations of Eletropaulo. The loss includes an after-tax loss on the impairment of Sul of $382 million recognized in the second quarterof 2016 and an additional after-tax loss on the sale of Sul of $737 million recognized upon disposal in October 2016. There was no significant lossfrom operations related to the Sul discontinued business.
Net income from discontinued operations was $80 million for the year ended December 31, 2015 primarily due to the income from operationsof Eletropaulo. There was no significant loss from operations related to the Sul discontinued business.
See Note 21 — Discontinued Operations included in Item 8.— Financial Statements and Supplementary Data of this Form 10-K for furtherinformation.
Net income attributable to noncontrolling interests and redeemable stock of subsidiaries
Net income attributable to noncontrolling interests and redeemable stock of subsidiaries increased $148 million , or 70% , in 2017 from 2016primarily due to:
• Asset impairment at Buffalo Gap I and II in 2016.
Net income attributable to noncontrolling interests and redeemable stock of subsidiaries decreased $153 million , or 42% , in 2016 from 2015primarily due to:
• Lower earnings at Tietê,• Asset impairments at Buffalo Gap I and II.
These decreases were offset by:• Lower asset impairment at Buffalo Gap III in 2015.
Net income (loss) attributable to The AES Corporation
Net loss attributable to The AES Corporation increased $31 million , or 3% , in 2017 compared to 2016 as a result of:• Impact due to U.S. Tax Reform Law enacted on December 22, 2017;• Current year losses on sale of Kazakhstan CHPs and hydroelectric plants;• Current year loss on deconsolidation of Eletropaulo;• Current year impairments at Laurel Mountain, Kazakhstan CHPs and hydroelectric plants and Kilroot; and• Higher loss on extinguishment of debt.
These increases were partially offset by:
74

• Prior year impairments at DPL;• Prior year loss from discontinued operations as a result of the sale of Sul;• Higher margin at our MCAC SBU;• The favorable impact of the YPF legal settlement at AES Uruguaiana; and• Higher gains on foreign currency transactions.
Net income attributable to The AES Corporation decreased $1.4 billion , to a loss of $1.1 billion in 2016 compared to income of $306 million in2015 as result of:
• Impairments and loss on sale at discontinued businesses;• Higher impairment expense on long lived assets;• Lower operating margins at our US, Brazil and Eurasia SBUs;• Lower equity in earnings of affiliates due to the 2015 restructuring at Guacolda; and• Lower gains on foreign currency derivatives.
These decreases were partially offset by:• Lower effective tax rate;• Lower debt extinguishment expense; and• Absence of goodwill impairment expense.
SBU Performance AnalysisSegments
We are organized into five market-oriented SBUs: US (United States), Andes (Chile, Colombia, and Argentina), Brazil , MCAC (Mexico,Central America, and the Caribbean), and Eurasia (Europe and Asia). In February 2018, we announced a reorganization as a part of our ongoingstrategy to simplify our portfolio, optimize our cost structure, and reduce our carbon intensity. The evaluation of the impact this reorganization willhave on our segment reporting structure is still ongoing.
Non-GAAP MeasuresAdjusted Operating Margin, Adjusted PTC, Adjusted EPS, and Free Cash Flow are non-GAAP supplemental measures that are used by
management and external users of our consolidated financial statements such as investors, industry analysts and lenders.
For the year ending December 31, 2017, the Company changed the definition of Adjusted Operating Margin, Adjusted PTC and Adjusted EPSto exclude (a) associated benefits and costs due to acquisitions, dispositions, and early plant closures; including the tax impact of decisions made atthe time of sale to repatriate sales proceeds; (b) costs directly associated with a major restructuring program, including, but not limited to, workforcereduction efforts, relocations, and office consolidation; and (c) tax benefit or expense related to the enactment effects of 2017 U.S. tax law reform.
We have excluded from our adjusted financial results costs associated with non-recurring restructuring initiatives to simplify the organizationand improve efficiency. These restructuring initiatives would result in significant incremental costs above normal operations and the inclusion of suchcosts would result in a lack of comparability in our results of operations and could be misleading to investors.
The Company amended its Adjusted EPS definition to exclude the specific enactment effects of the transformational U.S. tax reform enactedon December 22, 2017. Such effects include a one-time transition tax on foreign earnings and the remeasurement of deferred tax assets andliabilities to the lower corporate tax rate. As permitted by the SEC in SAB 118, the Company recorded provisional amounts for these effects in its2017 income from continuing operations . Changes in our estimates of these enactment effects may occur in future periods.
We believe excluding these benefits and costs better reflect the business performance by removing the variability caused by strategicdecisions to dispose of or acquire business interests or close plants early, as well as the costs directly associated with a major restructuring programand the impact of the 2017 U.S. tax law reform, which affect results in a given period or periods. The Company has also reflected these changes inthe comparative periods ending December 31, 2016 and December 31, 2015 .
75

Adjusted Operating Margin
We define Adjusted Operating Margin as Operating Margin, adjusted for the impact of NCI, excluding (a) unrealized gains or losses related toderivative transactions; (b) gains, losses and associated benefits and costs due to dispositions and acquisitions of business interests, including earlyplant closures; and (c) costs directly associated with a major restructuring program, including, but not limited to, workforce reduction efforts,relocations, and office consolidation. See Review of Consolidated Results of Operations for definitions of Operating Margin and cost of sales.
The GAAP measure most comparable to Adjusted Operating Margin is Operating Margin. We believe that Adjusted Operating Margin betterreflects the underlying business performance of the Company. Factors in this determination include the impact of NCI, where AES consolidates theresults of a subsidiary that is not wholly owned by the Company, as well as the variability due to unrealized derivatives gains or losses related toderivative transactions and strategic decisions to dispose of or acquire business interests. Adjusted Operating Margin should not be construed as analternative to Operating Margin, which is determined in accordance with GAAP.
Reconciliation of Adjusted Operating Margin (in millions) Years Ended December 31,
2017 2016 2015
Operating Margin $ 2,464 $ 2,380 $ 2,663
Noncontrolling interests adjustment (690) (644) (705)
Unrealized derivative losses (gains) (5) 9 19
Disposition/acquisition losses 22 — —
Restructuring costs 22 — —
Total Adjusted Operating Margin $ 1,813 $ 1,745 $ 1,977
Adjusted PTC
We define Adjusted PTC as pre-tax income from continuing operations attributable to The AES Corporation excluding gains or losses of theconsolidated entity due to (a) unrealized gains or losses related to derivative transactions; (b) unrealized foreign currency gains or losses; (c) gains,losses and associated benefits and costs due to dispositions and acquisitions of business interests, including early plant closures; (d) losses due toimpairments; (e) gains, losses and costs due to the early retirement of debt; and (f) costs directly associated with a major restructuring program,including, but not limited to, workforce reduction efforts, relocations, and office consolidation . Adjusted PTC also includes net equity in earnings ofaffiliates on an after-tax basis adjusted for the same gains or losses excluded from consolidated entities.
Adjusted PTC reflects the impact of NCI and excludes the items specified in the definition above. In addition to the revenue and cost of salesreflected in Operating Margin, Adjusted PTC includes the other components of our income statement, such as general and administrative expensesin the corporate segment, as well as business development costs, interest expense and interest income, other expense and other income, realizedforeign currency transaction gains and losses, and net equity in earnings of affiliates .
The GAAP measure most comparable to Adjusted PTC is income from continuing operations attributable to The AES Corporation . We believethat Adjusted PTC better reflects the underlying business performance of the Company and is considered in the Company's internal evaluation offinancial performance. Factors in this determination include the variability due to unrealized gains or losses related to derivative transactions,unrealized
76

foreign currency gains or losses, losses due to impairments and strategic decisions to dispose of or acquire business interests, retire debt orimplement restructuring initiatives, which affect results in a given period or periods. In addition, earnings before tax represents the businessperformance of the Company before the application of statutory income tax rates and tax adjustments, including the effects of tax planning,corresponding to the various jurisdictions in which the Company operates. Adjusted PTC should not be construed as an alternative to income fromcontinuing operations attributable to The AES Corporation , which is determined in accordance with GAAP.
Reconciliation of Adjusted PTC (in millions) Years Ended December 31,
2017 2016 2015
Income (loss) from continuing operations, net of tax, attributable to The AES Corporation $ (507) $ (20) $ 318
Income tax (benefit) expense attributable to The AES Corporation 828 (111) 263
Pre-tax contribution 321 (131) 581
Unrealized derivative gains (3) (9) (166)
Unrealized foreign currency (gains) losses (59) 22 95
Disposition/acquisition (gains) losses 123 6 (42)
Impairment losses 542 933 504
Loss on extinguishment of debt 62 29 179
Restructuring costs (1) 31 — —
Total Adjusted PTC $ 1,017 $ 850 $ 1,151_____________________________
(1) In February 2018, the Company announced a reorganization as a part of its on-going strategy to simplify its portfolio, optimize its cost structure and reduce its carbon intensity.
Adjusted EPS
We define Adjusted EPS as diluted earnings per share from continuing operations excluding gains or losses of both consolidated entities andentities accounted for under the equity method due to (a) unrealized gains or losses related to derivative transactions; (b) unrealized foreigncurrency gains or losses; (c) gains or losses and associated benefits and costs due to dispositions and acquisitions of business interests, includingearly plant closures, and the tax impact from the repatriation of sales proceeds; (d) losses due to impairments; (e) gains, losses and costs due to theearly retirement of debt; (f) costs directly associated with a major restructuring program, including, but not limited to, workforce reduction efforts,relocations, and office consolidation; and (g) tax benefit or expense related to the enactment effects of 2017 U.S. tax law reform.
The GAAP measure most comparable to Adjusted EPS is diluted earnings per share from continuing operations. We believe that AdjustedEPS better reflects the underlying business performance of the Company and is considered in the Company's internal evaluation of financialperformance. Factors in this determination include the variability due to unrealized gains or losses related to derivative transactions, unrealizedforeign currency gains or losses, losses due to impairments and strategic decisions to dispose of or acquire business interests, retire debt orimplement restructuring initiatives, which affect results in a given period or periods. Adjusted EPS should not be construed as an alternative todiluted earnings per share from continuing operations, which is determined in accordance with GAAP.
77

The Company reported a loss from continuing operations of $0.77 and $0.04 per share for the years ended December 31, 2017 and 2016 .For purposes of measuring diluted loss per share under GAAP, common stock equivalents were excluded from weighted average shares as theirinclusion would be anti-dilutive. However, for purposes of computing Adjusted EPS, the Company has included the impact of dilutive common stockequivalents. The table below reconciles the weighted average shares used in GAAP diluted loss per share to the weighted average shares used incalculating the non-GAAP measure of Adjusted EPS.
Reconciliation of Denominator Used For Adjusted Earnings Per Share Years Ended December 31, 2017 Years Ended December 31, 2016
(in millions, except per share data) Loss Shares $ pershare Loss Shares $ per
share
GAAP DILUTED LOSS PER SHARE
Loss from continuing operations attributable to The AES Corporation common stockholders $ (507) 660 $ (0.77) $ (25) 660 $ (0.04)
EFFECT OF DILUTIVE SECURITIES
Restricted stock units — 2 0.01 — 2 —
NON-GAAP DILUTED LOSS PER SHARE $ (507) 662 $ (0.76) $ (25) 662 $ (0.04)
Reconciliation of Adjusted EPS Years Ended December 31, 2017 2016 2015
Diluted earnings (loss) per share from continuing operations $ (0.76) $ (0.04) $ 0.46
Unrealized derivative gains — (0.01) (0.24)
Unrealized foreign currency (gains) losses (0.10) 0.03 0.15 Disposition/acquisition (gains) losses 0.19 (1) 0.01 (2) (0.06) (3)
Impairment losses 0.82 (4) 1.41 (5) 0.73 (6)
Loss on extinguishment of debt 0.09 (7) 0.05 (8) 0.26 (9)
Restructuring costs 0.05 — —
U.S. Tax Law Reform Impact 1.08 (10) — — Less: Net income tax benefit on adjustments (0.29) (11) (0.51) (12) (0.06) (13)
Adjusted EPS $ 1.08 $ 0.94 $ 1.24 _____________________________
(1) Amount primarily relates to loss on sale of Kazakhstan CHPs of $49 million , or $0.07 per share, realized derivative losses associated with the sale of Sul of $38 million , or $0.06 per share, loss on sale ofKazakhstan Hydroelectric plants of $33 million , or $0.05 per share, costs associated with early plant closure of DPL of $24 million , or $0.04 per share; partially offset by gain on Masinloc contingentconsideration of $23 million or $0.03 per share and gain on sale of Zimmer and Miami Fort of $13 million , or $0.02 per share.
(2) Amount primarily relates to the loss on deconsolidation of UK Wind of $20 million , or $ 0.03 per share, and losses associated with the sale of Sul of $10 million, or $0.02 ; partially offset by the gain on sale ofDPLER of $22 million , or $0.03 per share.
(3) Amount primarily relates to the gains on the sale of Armenia Mountain of $22 million , or $0.03 per share and from the sale of Solar Spain and Solar Italy of $7 million , or $0.01 per share.(4) Amount primarily relates to asset impairment at Kazakhstan CHPs of $94 million , or $0.14 per share, at Kazakhstan hydroelectric plants of $92 million , or $0.14 per share, at Laurel Mountain wind farm of
$121 million , or $0.18 per share, at DPL of $175 million , or $0.27 per share and at Kilroot of $37 million , or $0.05 per share.(5) Amount primarily relates to asset impairments at DPL of $859 million , or $1.30 per share; $159 million at Buffalo Gap II ( $49 million , or $0.07 per share, net of NCI); and $77 million at Buffalo Gap I ( $23
million , or $0.03 per share, net of NCI).(6) Amount primarily relates to the goodwill impairment at DPL of $317 million , or $0.46 per share, and asset impairments at Kilroot of $121 million ( $119 million , or $0.17 per share, net of NCI), at Buffalo Gap
III of $116 million ( $27 million , or $0.04 per share, net of NCI), and at U.K. Wind (Development Projects) of $38 million ( $30 million , or $0.04 per share, net of NCI).(7) Amount primarily relates to losses on early retirement of debt at the Parent Company of $92 million , or $0.14 per share, at AES Gener of $20 million , or $0.02 per share, at IPALCO of $9 million or $0.01 per
share; partially offset by a gain on early retirement of debt at Alicura of $65 million , or $0.10 per share.(8) Amount primarily relates to the loss on early retirement of debt at the Parent Company of $19 million , or $0.03 per share.(9) Amount primarily relates to the loss on early retirement of debt at the Parent Company of $116 million , or $0.17 per share and at IPL of $22 million ( $17 million , or $0.02 per share, net of NCI).(10) Amount relates to a one-time transition tax on foreign earnings of $675 million , or $1.02 per share and the remeasurement of deferred tax assets and liabilities to the lower corporate tax rate of $39 million ,
or $0.06 per share.(11) Amount primarily relates to the income tax benefit associated with asset impairment losses of $148 million , or $0.22 per share in the twelve months ended December 31, 2017.(12) Amount primarily relates to the income tax benefit associated with asset impairment of $332 million , or $0.50 per share in the twelve months ended December 31, 2016.(13) Amount primarily relates to the income tax benefit associated with losses on extinguishment of debt of $55 million , or $0.08 per share in the twelve months ended December 31, 2015.
78

Free Cash FlowWe define Free Cash Flow as net cash from operating activities (adjusted for service concession asset capital expenditures) less maintenance
capital expenditures (including non-recoverable environmental capital expenditures), net of reinsurance proceeds from third parties. Upon theCompany's adoption of the accounting guidance for service concession arrangements effective January 1, 2015, capital expenditures related toservice concession assets that would have been classified as investing activities on the Consolidated Statement of Cash Flows are now classified asoperating activities. See Note 1 — General and Summary of Significant Accounting Policies included in Item 8. —Financial Statements andSupplementary Data of this Form 10-K for further information on the adoption of this guidance.
We also exclude environmental capital expenditures that are expected to be recovered through regulatory, contractual or other mechanisms.An example of recoverable environmental capital expenditures is IPL's investment in MATS-related environmental upgrades that are recoveredthrough a tracker. See Item 1. — Business—US SBU—IPL—Environmental Matters for details of these investments.
The GAAP measure most comparable to Free Cash Flow is net cash provided by operating activities. We believe that Free Cash Flow is auseful measure for evaluating our financial condition because it represents the amount of cash generated by the business after the funding ofmaintenance capital expenditures that may be available for investing in growth opportunities or for repaying debt.
The presentation of Free Cash Flow has material limitations. Free Cash Flow should not be construed as an alternative to net cash fromoperating activities, which is determined in accordance with GAAP. Free Cash Flow does not represent our cash flow available for discretionarypayments because it excludes certain payments that are required or to which we have committed, such as debt service requirements and dividendpayments. Our definition of Free Cash Flow may not be comparable to similarly titled measures presented by other companies.
Reconciliation of Free Cash Flow (in millions) Years Ended December 31,
2017 2016 2015
Net Cash provided by operating activities $ 2,489 $ 2,884 $ 2,134
Add: capital expenditures related to service concession assets (1) 6 29 165
Less: maintenance capital expenditures, net of reinsurance proceeds (551) (624) (611)
Less: non-recoverable environmental capital expenditures (2) (23) (45) (60)
Free Cash Flow $ 1,921 $ 2,244 $ 1,628_____________________________
(1) Service concession asset expenditures are included in net cash provided by operating activities, but are excluded from the Free Cash Flow non-GAAP metric.(2) Excludes IPL's recoverable environmental capital expenditures of $54 million , $186 million and $262 million for the years ended December 31, 2017 , 2016 and 2015 , respectively.
79

US SBUThe following table summarizes Operating Margin, Adjusted Operating Margin, Adjusted PTC, and Free Cash Flow (in millions) for the periods
indicated:
For the Years Ended December 31, 2017 2016 2015 $ Change 2017 vs.2016 % Change 2017 vs.
2016 $ Change 2016 vs.2015 % Change 2016 vs.
2015
Operating Margin $ 567 $ 582 $ 621 $ (15) -3 % $ (39) -6 %
Adjusted Operating Margin 509 513 598 (4) -1 % (85) -14 %
Adjusted PTC 361 347 360 14 4 % (13) -4 %
Operating Cash Flow 776 912 845 (136) -15 % 67 8 %
Free Cash Flow 597 671 616 (74) -11 % 55 9 %
Free Cash Flow Attributable to NCI 41 57 25 (16) -28 % 32 NM_____________________________
(1) See Item 1. — Business for the respective ownership interest for key businesses. In addition, AES owns 70% of IPL as of March 2016 compared to 75% beginning April 2015, 85% beginning in February2015 and 100% prior to February 2015.
Fiscal year 2017 versus 2016
Operating Margin decreased $15 million , or 3% , which was driven primarily by the following (in millions):
IPL Decrease due to implementation of new base rates in Q2 2016 which resulted in a favorable change in accrual $ (18)
Total IPL Decrease(18)
DPL Lower retail margin due to lower regulated rates (22)Lower volumes primarily due to the shutdown of Stuart Unit 1 and lower commercial availability
(21)Lower depreciation expense driven by lower PP&E carrying values from impairments in 2016 and 2017 26
Other7
Total DPL Decrease(10)
Other Business Drivers13
Total US SBU Operating Margin Decrease $ (15)
Adjusted Operating Margin decreased $4 million due to the drivers above, adjusted for NCI and excluding unrealized gains and losses onderivatives, one-time restructuring charges and costs associated with early plant closures.
Adjusted PTC increased $14 million driven by earnings from equity affiliates due to the 2017 acquisition of sPower, the Company's share ofearnings at Distributed Energy due to new project growth, and an increase in insurance recoveries at DPL. The increase in Adjusted PTC waspartially offset by the decrease of $4 million in Adjusted Operating Margin described above and a 2016 gain on contract termination at DP&L.
Free Cash Flow decreased $74 million , of which $16 million was attributable to NCI. The decrease was driven by changes in net cashprovided by operating activities comprising:
• A decrease of $49 million in Operating Margin (net of $34 million of decreased depreciation);• Increases in working capital of $144 million primarily related to an increase of $66 million in inventory balances as mild weather in 2015
drove inventory optimization efforts in 2016 and higher payments for purchased power and general accounts payable of $57 million at DPLand IPL; and
• Decreases in working capital of $86 million primarily driven by higher collections at IPL of $27 million due to the monetization of higherreceivable balances from December 2016 generated by favorable weather and rates and additional regulatory asset payments of $31million primarily driven by higher MISO cost collection.
Free Cash Flow was also impacted by a net increase of $33 million in other drivers, primarily related to a $51 million reduction in maintenanceand non-recoverable environmental capital expenditures due to declining investment in our remaining coal generation capacity and $12 million ininsurance proceeds at DPL.
80

Fiscal year 2016 versus 2015
Operating Margin decreased by $39 million , or 6% , which was driven primarily by the following (in millions):
US Generation
Southland related to an increase in depreciation expense as a result of a change in estimated useful lives of the plants$ (17)
Impact from sale of Armenia Mountain in July 2015 (10)
Warrior Run due to lower availability and higher maintenance cost primarily due to major outages in 2016(8)
Laurel Mountain due to lower regulation dispatch as well as lower energy and regulation pricing(8)
Other(4)
Total US Generation Decrease(47)
DPL
Impact of lower wholesale prices and completion of DP&L’s transition to a competitive-bid market (42)Decrease in RTO capacity and other revenues primarily due to lower capacity cleared in the auction (21)Lower depreciation expense due to June 2016 fixed asset impairment and decrease in generating facility maintenance and other expenses 17
Other2
Total DPL Decrease(44)
IPL Higher retail margin driven by environmental revenues and higher rates due to a new rate order 36Change in accrual resulting from the implementation of new rates 18Other (2)
Total IPL Increase52
Total US SBU Operating Margin Decrease $ (39)
Adjusted Operating Margin decreased $85 million due to the drivers above, adjusted for NCI and excluding unrealized gains and losses onderivatives.
Adjusted PTC decreased $13 million driven by the decrease of $85 million in Adjusted Operating Margin described above, partially offset by again on contract termination at DP&L, lower interest expense at DPL and IPL in part due to the sell-down impacts and the impact of HLBV at ourDistributed Energy business as a result of new projects achieving COD in 2016.
Free Cash Flow increased $55 million , of which $32 million was attributable to NCI. The increase was driven by changes in net cash providedby operating activities comprising:
• A decrease of $21 million in Operating Margin (net of $28 million in increased depreciation and $10 million in other non-cash impacts);• Decrease in working capital of $169 million primarily driven by a $142 million reduction in inventory holdings as we focused on inventory
optimization efforts and reductions in working capital needs of $17 million resulting from the sale of MC 2 and DPLER; and• Increases in working capital of $97 million primarily related to an increase in receivables of $80 million resulting from higher rates at IPL and
favorable weather in Q4 2016.
Free Cash was also impacted by a $12 million increase in maintenance capital expenditures due to higher expenditures at IPL. Free Cash Flowwas also impacted by lower interest payments of $16 million due to debt repayments at DPL and lower interest rates.
ANDES SBUThe following table summarizes Operating Margin, Adjusted Operating Margin, Adjusted PTC, and Free Cash Flow (in millions) for the periods
indicated:
For the Years Ended December 31, 2017 2016 2015 $ Change 2017 vs.2016 % Change 2017 vs.
2016 $ Change 2016 vs.2015 % Change 2016 vs.
2015
Operating Margin $ 658 $ 634 $ 618 $ 24 4 % $ 16 3 %
Adjusted Operating Margin 450 442 466 8 2 % (24) -5 %
Adjusted PTC 386 390 482 (4) -1 % (92) -19 %
Operating Cash Flow 714 475 462 239 50 % 13 3 %
Free Cash Flow 620 383 343 237 62 % 40 12 %
Free Cash Flow Attributable to NCI 204 119 119 85 71 % — — %_____________________________

(1) See Item 1. — Business for the respective ownership interest for key businesses. In addition, AES owned 71% of Gener and Chivor prior to sell down effective December 2015 which resulted in ownership of67%. The Alto Maipo (under construction) and Cochrane plants are owned 62% and 40% respectively.
81

Fiscal year 2017 versus 2016
Including the favorable impact of foreign currency translation and remeasurement of $19 million , Operating Margin increased $24 million , or4% , which was driven primarily by the following (in millions):
Gener Negative impact of new regulation on Emissions (Green Taxes) $ (41)Lower availability of efficient generation resulting in higher replacement energy and fixed costs mainly associated with major maintenance at VentanasComplex (29)Lower margin at the SING market primarily associated with lower contract sales and increase in coal prices at Norgener partially offset by higher spot sales (21)Start of operations at Cochrane Units I and II in July and October 2016, respectively 72
Other1
Total Gener Decrease(18)
Argentina Higher capacity payments primarily associated to changes in regulation in 2017 64Lower generation at CTSN mainly associated with lower demand (26)Higher fixed costs mainly associated with higher people costs driven by inflation (11)Favorable FX impact 9
Total Argentina Increase36
Chivor Higher contract sales primarily associated to an increase in contracted capacity at higher prices 35Lower spot sales mainly associated to lower generation and lower spot prices (37)Other 8
Total Chivor Increase6
Total Andes SBU Operating Margin Increase $ 24
Adjusted Operating Margin increased $8 million due to the drivers above, adjusted for NCI and excluding restructuring charges.
Adjusted PTC decreased $4 million , driven by higher interest expense, mainly due to the issuance of debt at Argentina and lower interestcapitalization in Cochrane and Chivor, and the write-off of water rights at Gener resulting from a business development project that is no longerpursued. These negative impacts were partially offset by the increase in Adjusted Operating Margin, foreign currency gains in Argentina associatedwith the collection of financing receivables, prepayment of financial debt denominated in U.S. dollars in 2017, and lower foreign currency lossesassociated with the sale of Argentina’s sovereign bonds at Termoandes.
Free Cash Flow increased $237 million , of which $85 million was attributable to NCI. The increase was driven by changes in net cash providedby operating activities comprising:
• $98 million increase in Operating Margin (net of higher depreciation of $33 million and $41 million of environmental tax accruals in Chileimpacting margin, but not free cash flow);
• Decreases in working capital of $130 million primarily driven by higher VAT Refunds of $60 million at Alto Maipo and other ConstructionProjects and $38 million in collections of financing receivables related to the commencement of operations of Guillermo Brown andCochrane; and
• Increases in working capital of $55 million primarily related to $40 million in lower collections of receivables at Chivor.
Free Cash Flow was also impacted by a net increase of $64 million in other drivers, primarily related to a $58 million decrease in taxes and $34million in dividends received from Guacolda, partially offset by a $27 million increase in interest payments.
82

Fiscal year 2016 versus 2015
Including the unfavorable impact of foreign currency translation and remeasurement of $36 million , Operating Margin increased $16 million ,or 3% , which was driven primarily by the following (in millions):
Gener Lower spot prices on energy and fuel purchases $ 82Start of operations of Cochrane Plant 36Other (3)
Total Gener Increase115
Argentina Higher rates driven by annual price review granted by Resolution 22/2016 61Lower availability mainly associated with planned major maintenance (20)Higher fixed costs primarily driven by higher inflation and by higher maintenance cost (44)Unfavorable FX remeasurement impacts (21)
Total Argentina Decrease(24)
Chivor Higher volume of energy sales to Spot Market 14Unfavorable FX remeasurement impacts (15)Lower spot sales prices (72)Other (2)
Total Chivor Decrease(75)
Total Andes SBU Operating Margin Increase $ 16
Adjusted Operating Margin decreased $24 million due to the drivers above, adjusted for NCI.
Adjusted PTC decreased $92 million driven by the decrease in Equity Earnings of $54 million mainly related to Guacolda’s reorganization inSeptember 2015, the decrease of $24 million in Adjusted Operating Margin and the increase of $12 million in interest expense primarily associatedwith lower interest capitalization after the beginning of commercial operations at Cochrane.
Free Cash Flow increased $40 million , none of which was attributable to NCI. The increase was driven by changes in net cash provided byoperating activities comprising:
• An increase of $58 million in Operating Margin (net of $42 million in increased depreciation and other non-cash impacts);• Decrease in working capital of $178 million, primarily driven by $83 million in higher collections at Chivor related to Q4 2015 sales, a $38
million positive impact related to a one-time interest rate swap termination payment at Ventanas in July 2015, and $57 million in collectionsof financing receivables and maintenance remuneration from CAMMESSA in Argentina; and
• Increases in working capital of $137 million primarily related to an increase in VAT accruals of $107 million related to our Cochrane and AltoMaipo construction projects.
Free Cash Flow was also impacted by a $57 million increase in taxes at Chile and Chivor, a $29 million increase in interest payments at Generdue to new unsecured notes issued in July 2015 as part of the Ventanas refinancing, and a $27 million reduction in maintenance and non-recoverable capital expenditures due to lower expenditures on emissions and control equipment at Chile.
BRAZIL SBUThe following table summarizes Operating Margin, Adjusted Operating Margin, Adjusted PTC, and Free Cash Flow (in millions) for the periods
indicated:
For the Years Ended December 31, 2017 2016 2015 $ Change 2017 vs.2016 % Change 2017 vs.
2016 $ Change 2016 vs.2015 % Change 2016 vs.
2015
Operating Margin $ 203 $ 186 $ 397 $ 17 9 % $ (211) -53 %
Adjusted Operating Margin 48 41 97 7 17 % (56) -58 %
Adjusted PTC 60 38 92 22 58 % (54) -59 %
Operating Cash Flow 469 716 136 (247) (34)% 580 NM
Free Cash Flow 279 532 (24) (253) (48)% 556 NM
Free Cash Flow Attributable to NCI 204 422 5 (218) (52)% 417 NM_____________________________
(1) See Item 1. — Business for the respective ownership interest for key businesses.
83

Fiscal year 2017 versus 2016
Including the favorable impact of foreign currency translation of $19 million , Operating Margin increased $17 million , or 9% , which was drivenprimarily by the following (in millions):
Tietê Net impact of volume and prices of bilateral contracts due to higher energy purchased $ (100)Net impact of volume and prices of lower energy purchased in spot market 71Higher volume due to acquisition of new wind entities - Alto Sertão II 23Favorable FX impacts 21Other 4
Total Tietê Increase19
Other Business Drivers(2)
Total Brazil SBU Operating Margin Increase $ 17
Adjusted Operating Margin increased $7 million due to the drivers above, adjusted for NCI and excluding costs due to dispositions andacquisitions of business interests.
Adjusted PTC increased $22 million , driven by a $28 million increase from the settlement of a legal dispute with YPF at Uruguaiana as well asthe $7 million of increase in Adjusted Operating Margin described above, partially offset by $5 million of higher interest expense over Alto Sertão IIdebt.
Free Cash Flow decreased $253 million , of which $218 million was attributable to NCI. The decrease was driven by changes in net cashprovided by operating activities comprising:
• $35 million increase in Operating Margin (net of increased depreciation of $18 million);• $58 million decrease due to the sale of Sul in October 2016;• Increases in working capital of $913 million, primarily related to $600 million of higher costs deferred in net regulatory assets at Eletropaulo
resulting from unfavorable hydrology in prior periods and $198 million of lower collections of energy sales at Eletropaulo due to higher tariffflags in 2016; and
• Decreases in working capital of $445 million, primarily due to $411 million related to timing of payments for energy purchases due to lowerenergy costs and lower regulatory charges at Eletropaulo and Tietê.
Free Cash Flow was also impacted by an increase of $240 million in other drivers, primarily related to $93 million of lower tax payments atTietê and Eletropaulo, $71 million in lower interest paid at Tietê and Eletropaulo, and $60 million collected from a legal dispute settlement with YPFat Uruguaiana.
Fiscal year 2016 versus 2015
Including the unfavorable impact of foreign currency translation of $14 million , Operating Margin decreased $211 million , or 53% , which wasdriven primarily by the following (in millions):
Tietê
Lower rates for energy sold under new contracts$ (239)
Unfavorable FX impacts(14)
Higher fixed costs due to higher legal settlements(13)
Lower rates for energy purchases mainly due to decrease in spot market prices 78Other (2)
Total Tietê Decrease(190)
Uruguaiana Operations in 2015 compared to not operating in 2016 (20)
Total Uruguaiana Decrease(20)
Other Business Drivers(1)
Total Brazil SBU Operating Margin Decrease $ (211)
Adjusted Operating Margin decreased $56 million due to the drivers above, adjusted for NCI and excluding unrealized gains and losses onderivatives.

Adjusted PTC decreased $54 million , driven by the decrease of $56 million in Adjusted Operating Margin described above.
Free Cash Flow increased $556 million , of which $417 million was attributable to NCI. The increase was driven by changes in net cashprovided by operating activities comprising:
• $308 million decrease in Operating Margin (net of $45 million in non-cash impacts, primarily due to the reversal of a contingent regulatoryliability at Eletropaulo in 2015);
84

• Decreases in working capital of $1.5 billion, primarily due to $974 million in higher collections of costs deferred in net regulatory assets atEletropaulo and Sul resulting from unfavorable hydrology in 2015 and $416 million of higher collections on energy sales in 2016; and
• Increases in working capital of $623 million primarily due to $581 million related to regulatory charges and timing of payments for energypurchases at Eletropaulo and Sul in 2016.
MCAC SBUThe following table summarizes Operating Margin, Adjusted Operating Margin, Adjusted PTC, and Free Cash Flow (in millions) for the periods
indicated:
For the Years Ended December 31, 2017 2016 2015 $ Change 2017 vs.2016 % Change 2017 vs.
2016 $ Change 2016 vs.2015 % Change 2016 vs.
2015
Operating Margin $ 589 $ 523 $ 543 $ 66 13% $ (20) -4 %
Adjusted Operating Margin 470 413 438 57 14% (25) -6 %
Adjusted PTC 340 267 327 73 27% (60) -18 %
Operating Cash Flow 427 312 705 115 37% (393) -56 %
Free Cash Flow 345 219 625 126 58% (406) -65 %
Free Cash Flow Attributable to NCI 61 51 127 10 20% (76) -60 %_____________________________
(1) See Item 1. — Business for the respective ownership interest for key businesses. AES owned 92% of Andres and Los Mina and 46% of Itabo in the Dominican Republic until December 2015 when theownership changed to 90% at Andres and Los Mina and 45% at Itabo until October 2017.
Fiscal year 2017 versus 2016
Operating Margin increased $66 million , or 13% , which was driven primarily by the following (in millions):
Dominican Republic Higher contracted energy sales net of LNG fuel consumption mainly driven by Los Mina combined cycle commencement of operations in June 2017 $ 34
Other6
Total Dominican Republic Increase40
Mexico
Higher availability as a result of a plant forced maintenance in 2016 13
Other7
Total Mexico Increase20
Other Business Drivers6
Total MCAC SBU Operating Margin Increase $ 66
Adjusted Operating Margin increased $57 million due to the drivers above, adjusted for NCI and excluding unrealized gains and losses onderivatives and one-time restructuring charges.
Adjusted PTC increased $73 million , driven by the increase in Adjusted Operating Margin of $57 million as described above.
Free Cash Flow increased $126 million , of which $10 million was attributable to NCI. The increase was driven by changes in net cash providedby operating activities comprising:
• $73 million increase in Operating Margin (net of higher depreciation of $7 million);• Decreases in working capital in Dominican Republic of $61 million primarily due to the collection of past overdue amounts as part of the sale
of receivables executed with the distribution companies and CDEEE in 2017; and• Increases in working capital in Puerto Rico of $10 million primarily related to lower payments and collections caused by Hurricane Maria.
Free Cash Flow was also impacted by lower tax payments of $17 million in El Salvador and a $10 million decrease in maintenance and non-recoverable environmental capital expenditures, partially offset by higher interest payments in Dominican Republic of $25 million due to the issuanceof new Senior Notes in Los Mina.
85

Fiscal year 2016 versus 2015
Operating Margin decreased $20 million , or 4% , which was driven primarily by the following (in millions):
Mexico Lower availability and related costs $ (11)
Other(6)
Total Mexico Decrease(17)
El Salvador Higher fixed costs and lower energy sales margin (10)
Total El Salvador Decrease(10)
Panama Expenses related to the ongoing construction of a natural gas generation plant and a liquefied natural gas terminal (19)
Commencement of power barge operations at the end of March 201513
Other(3)
Total Panama Decrease(9)
Dominican Republic Higher contracted and spot energy sales 24
Total Dominican Republic Increase24
Other Business Drivers(8)
Total MCAC SBU Operating Margin Decrease $ (20)
Adjusted Operating Margin decreased $25 million due to the drivers above, adjusted for NCI and excluding unrealized gains and losses onderivatives.
Adjusted PTC decreased $60 million , driven by the decrease in Adjusted Operating Margin of $25 million described above as well as a 2015compensation agreement regarding early termination of the original Barge PPA of $10 million and a $26 million allowance recognized in 2016 atPuerto Rico.
Free Cash Flow decreased $406 million , of which $76 million was attributable to NCI. The decrease was driven by changes in net cashprovided by operating activities comprising:
• A decrease of $10 million in Operating Margin (net of $10 million in depreciation); and• Increases in working capital of $338 million, primarily related to higher accounts receivable balances for the Dominican Republic of $243
million due to collections of overdue receivables in September 2015 and for Puerto Rico of $47 million primarily due to lower sales in Q42015.
Free Cash Flow was also impacted by a $13 million increase in maintenance and non-recoverable environmental capital expenditures.
EURASIA SBUThe following table summarizes Operating Margin, Adjusted Operating Margin, Adjusted PTC, and Free Cash Flow (in millions) for the periods
indicated:
For the Years Ended December 31, 2017 2016 2015 $ Change 2017 vs.2016 % Change 2017 vs.
2016 $ Change 2016 vs.2015 % Change 2016 vs.
2015
Operating Margin $ 423 $ 429 $ 452 $ (6) -1 % $ (23) -5 %
Adjusted Operating Margin 308 305 346 3 1 % (41) -12 %
Adjusted PTC 290 283 331 7 2 % (48) -15 %
Operating Cash Flow 610 892 354 (282) -32 % 538 NM
Free Cash Flow 586 865 437 (279) -32 % 428 98 %
Free Cash Flow Attributable to NCI 173 177 112 (4) -2 % 65 58 %_____________________________
(1) See Item 1. — Business for the respective ownership interest for key businesses.
Fiscal year 2017 versus 2016

Operating Margin decreased $6 million , or 1% , and Adjusted Operating Margin increased $3 million , or 1% , with no material drivers.
Adjusted PTC increased $7 million , primarily driven by the increase of in Adjusted Operating Margin, adjusted for NCI and excludingunrealized gains and losses on derivatives.
Free Cash Flow decreased $279 million , of which $4 million was attributable to NCI. The decrease was primarily driven by changes in net cashprovided by operating activities, specifically:
• A decrease of $28 million in Operating Margin (net of $22 million in decreased depreciation);
86

• A reduction in cash receipts of $362 million, primarily attributable to a $360 million payment made in April 2016 from NEK, net of paymentsto the fuel supplier, for Maritza related to overdue receivables; and
• Decreases in working capital of $64 million primarily related to lower working capital requirements of $50 million at Masinloc and MongDuong due to the timing of payments for coal purchases.
Free Cash Flow was also impacted by a $25 million reduction in maintenance and non-recoverable environmental capital expenditures and a$20 million decrease in interest payments.
Fiscal year 2016 versus 2015
Including the unfavorable impact of foreign currency translation of $36 million , Operating Margin decreased $23 million , or 5% , which wasdriven primarily by the following (in millions):
Kazakhstan
Unfavorable FX impact due to KZT depreciation against USD$ (29)
Other(1)
Total Kazakhstan Decrease(30)
Maritza
Lower contracted capacity prices due to PPA amendment(18)
Other(2)
Total Maritza Decrease(20)
Ballylumford
Higher contracted revenues27
Lower plant capacity resulting from the retirement of one generation facility(21)
Total Ballylumford Increase6
Mong Duong
Impact of full year operations for 2016 compared to commencement of principal operations in April 201516
Total Mong Duong Increase16
Other Business Drivers 5
Total Eurasia SBU Operating Margin Decrease $ (23)
Adjusted Operating Margin decreased $41 million due to the drivers above, adjusted for NCI and excluding unrealized gains and losses onderivatives.
Adjusted PTC decreased $48 million , driven by the decrease of $41 million in Adjusted Operating Margin described above, lower equityearnings at OPGC in India due to lower tariffs and the net impact of higher interest expense and higher interest income at Mong Duong.
Free Cash Flow increased $428 million , of which $65 million was attributable to NCI. The increase was driven by a $26 million reduction inmaintenance and non-recoverable environmental capital expenditures and changes in net cash provided by operating activities comprising:
• A decrease of $43 million in Operating Margin (net of $20 million in decreased depreciation and other non-cash impacts);• Increases in working capital of $472 million from increased collections of $360 million at Maritza from NEK, net of payments to the fuel
supplier, and a reduction in working capital requirements of $58 million at Mong Duong due to higher working capital needs in 2015 inpreparation for commencement of plant operations; and
• Decreases in working capital of $47 million attributable to a $24 million decrease in CO 2 allowances due to a price decrease at Maritza anda higher interest expense of $34 million as capitalization of interest ceased upon COD of Mong Duong in 2015.
Key Trends and UncertaintiesDuring 2018 and beyond, we expect to face the following challenges at certain of our businesses. Management expects that improved
operating performance at certain businesses, growth from new businesses, and global cost reduction initiatives may lessen or offset their impact. Ifthese favorable effects do not occur, or if the challenges described below and elsewhere in this section impact us more significantly than wecurrently anticipate, or if volatile foreign currencies and commodities move more unfavorably, then these adverse factors (or other adverse factorsunknown to us) may impact our operating margin, net income attributable to The AES Corporation and cash flows. We continue to monitor ouroperations and address challenges as they arise. For the risk factors related to our business, see Item 1.— Business and Item 1A.— Risk Factors of

this Form 10-K.
Macroeconomic and PoliticalThe political environments in some countries where our subsidiaries conduct business have changed during
87

2017. This could result in significant impacts to tax laws, and environmental and energy policies. Additionally, we operate in multiple countries andas such are subject to volatility in exchange rates at the subsidiary level. See Item 7A.— Quantitative and Qualitative Disclosures About Market Riskfor further information.
United States Tax Law Reform
On December 22, 2017, the United States enacted the Tax Cuts and Jobs Act (the “2017 Act”). The legislation significantly revised the U.S.corporate income tax system by, among other things, lowering the corporate income tax rate, introducing new limitations on interest expensedeductions, subjecting foreign earnings in excess of an allowable return to current U.S. taxation, and adopting a semi-territorial corporate taxsystem. These changes will materially impact our effective tax rate in future periods. Furthermore, we anticipate that higher U.S. tax expense mayfully utilize our remaining net operating loss carryforwards in the near term, which could lead to material cash tax payments in the United States.Specific provisions of the 2017 Act and their potential impacts on the Company are noted below. Our interpretation of the 2017 Act may change asthe U.S. Treasury and the Internal Revenue Service issue additional guidance. Such changes may be material.
Lower Tax Rate — The corporate tax rate decreased from 35 percent to 21 percent beginning in 2018. In addition to deferred taxremeasurement impacts, the lower tax rate will result in the recognition, at December 31, 2017, of a regulatory liability at IPL and DPL. Theregulatory liability will reflect deferred taxes that will flow back to ratepayers over time.
Limitation on Interest Expense Deductions — The 2017 Act introduced a new limitation on the deductibility of net interest expense beginningJanuary 1, 2018. The deduction will be limited to interest income, plus 30 percent of tax basis EBITDA through 2021 (30 percent of EBIT beginningJanuary 1, 2022). This determination is made at the consolidated group level, although it applies separately to partnerships. The limitation does notapply to interest expense attributable to regulated utility property. The U.S. Treasury and Internal Revenue Service are expected to provideguidance to clarify how the exception will apply to regulated utility holding companies. Given typical project financing and current U.S. holdingcompany debt levels, we anticipate that this limitation will materially, negatively impact our effective tax rate.
Cost Recovery — The 2017 Act amended depreciation rules to provide full expensing (100% bonus depreciation) for assets that commenceconstruction and are placed in service before January 1, 2023. This provision is phased down by 20 percent ratably through 2027. The immediatefull expensing provision is elective, but it does not apply to regulated utility property. This change is not expected to impact the Company’s effectivetax rate; however, if elected, it could impact taxable income and cash taxes in future periods.
Transition to a Participation Exemption System — A transition tax will be imposed on previously untaxed, deferred foreign earnings at a rate ofeither 8 percent or 15.5 percent, depending on the liquidity of the underlying foreign earnings. Prospectively, a 100 percent dividends receiveddeduction will apply to foreign source dividends upon repatriation.
Global Intangible Low Taxed Income (“GILTI”) — A new provision in the U.S. tax law subjects the foreign earnings of foreign subsidiaries tocurrent U.S. taxation to the extent that those earnings exceed an allowable economic return on investment. The allowable return is 10 percent of theadjusted tax basis in the foreign subsidiaries’ tangible property, reduced by interest expense. The foreign earnings subject to current taxation underthe GILTI provision are not limited to those derived from intangible property and may include gains derived from some future asset sales. Althoughthe new GILTI rules provide for a reduced 10.5 percent effective tax rate on captured income (increasing to 13.125% January 1, 2026), by way of a50 percent deduction, companies with a net operating loss or otherwise insufficient taxable income will not benefit from the lower effective tax rateand may not be able to utilize foreign tax credits.
We expect that the GILTI provision may capture a very significant portion of our foreign earnings and subject those foreign earnings to currentU.S. taxation. As a result, we expect the GILTI provision to materially, negatively impact our effective tax rate. Prospectively, the consequences ofthe new GILTI provision may be mitigated by foreign tax credits. However, additional guidance from the U.S. Treasury and Internal Revenue Servicewill be required to determine the extent to which the Company will be able to claim such foreign tax credits and mitigate the negative consequencesof the GILTI provision.
State Taxes — The reactions of the individual states to federal tax reform are still evolving. Most states will assess whether and how thefederal changes will be incorporated into their state tax legislation. As we expect higher taxable income in the future due to the federal changes, thismay also lead to higher state taxable income. Our current state tax provisions predominantly have full valuation allowances against state netoperating losses. These positions will be re-assessed in the future as state tax law evolves and may result in
88

material changes in position.
Tax Equity Structures — Our U.S. renewable energy portfolio operates primarily through tax equity partnerships. We cannot be certain of theimpacts U.S. tax reform may have on availability or pricing of tax equity for future growth opportunities. Impacts of provisions such as the lower taxrate and immediate expensing may impact the amount and timing of returns allocable to our partners in our existing tax equity structures.
SAB 118 — As further explained in Note 20— Income Taxes included in Item 8.— Financial Statements and Supplementary Data of this Form10-K we have included certain reasonable estimates of the impact of U.S. tax law reform subject to potential adjustments in future periods.
Puerto Rico — Our subsidiaries in Puerto Rico have long-term PPAs with state-owned PREPA, which has been facing economic challengesthat could impact the Company.
In order to address these challenges, on June 30, 2016, the Puerto Rico Oversight, Management, and Economic Stability Act (“PROMESA”)was signed into law. PROMESA created a structure for exercising federal oversight over the fiscal affairs of U.S. territories and allowed for theestablishment of an Oversight Board with broad powers of budgetary and financial control over Puerto Rico. PROMESA also created procedures foradjusting debts accumulated by the Puerto Rico government and, potentially, other territories (“Title III”). Finally, PROMESA expedites the approvalof key energy projects and other critical projects in Puerto Rico.
PREPA entered into preliminary Restructuring Support Agreements (“RSAs”) with their lenders. Under PROMESA, PREPA submitted the RSAto the Oversight Board for approval on April 28, 2017, which the board denied on June 28, 2017. As a consequence, on July 2, 2017, the OversightBoard filed for bankruptcy on behalf of PREPA under Title III.
As a result of the bankruptcy filing, AES Puerto Rico and AES Ilumina’s non-recourse debt of $365 million and $36 million , respectively, are indefault and have been classified as current as of December 31, 2017 .
Additionally, on July 18, 2017, Moody's downgraded AES Puerto Rico to Caa1 from B3 due to the heightened default risk for AES Puerto Ricoas a result of PREPA's bankruptcy protection. This protection gives PREPA the ability to renegotiate contracts, which could impact the value of ourassets in Puerto Rico or otherwise have a material impact on the Company. In this regard, PREPA had requested the Company to renegotiate its 24MW AES Ilumina’s PPA. After the event of the Hurricanes Maria and Irma, these negotiations were put on hold.
In September 2017, Puerto Rico and the U.S. Virgin Islands were severely impacted by Hurricanes Irma and Maria, disrupting the operations ofAES Puerto Rico, AES Ilumina, and certain Distributed Energy assets. The Company sustained modest damage to its 24 MW AES Ilumina solarplant, resulting in a $2 million loss, and minor damage to its 524 MW AES Puerto Rico thermal plants, both located in Puerto Rico.
As a result of the hurricanes, PREPA has declared an event of Force Majeure. However, both units of AES Puerto Rico and approximately75% of AES Ilumina have been available to generate electricity since mid-October which, in accordance with the PPAs, will allow AES Puerto Ricoto invoice capacity, even under Force Majeure. Puerto Rico’s infrastructure was severely damaged, including electric infrastructure and transmissionlines. The extensive structural damage caused by hurricane winds and flooding is expected to take significant time and cost to repair.
Due to the extensive damage from the hurricanes, energy demand in Puerto Rico has decreased and is expected to remain low until economicactivity has recovered. Despite the decrease in demand, AES Puerto Rico has resumed generation and continues to be the lowest cost and EPAcompliant energy provider in Puerto Rico. Therefore, we expect AES Puerto Rico to continue to be a critical supplier to PREPA.
On October 24, 2017, the U.S. Congress approved a $37 billion emergency disaster relief bill which will allow the U.S. Government to helpvictims from the hurricanes and assist with the infrastructure rebuild in the affected areas through the Federal Emergency ManagementAgency. This supplemental appropriation includes an allocation of $5 billion for the Disaster Assistance Direct Loan Program to assist localgovernments, like Puerto Rico, in providing essential services, such as reestablishing electricity.
In November 2017, AES Puerto Rico signed a Forbearance and Standstill Agreement with its lenders to prevent the lenders from taking anyaction against the company due to the default events. This agreement will expire on March 22, 2018.
The Company's receivable balances in Puerto Rico as of December 31, 2017 totaled $86 million , of which $53 million was overdue. Despitethe disruption caused by the hurricanes and the Title III protection, PREPA has
89

restarted the payments to the generators. AES Puerto Rico has been able to collect $28 million of overdue amounts as of December 31, 2017 .
In January 2018, Puerto Rico announced its intention to privatize PREPA. The plan will need to be approved by the Oversight Board, and, ifapproved, could take 18 months to complete. It is difficult to predict the outcome of the proposed privatization, but the impact on our businesses inPuerto Rico and AES could be material.
Considering the information available as of the filing date, Management believes the carrying amount of our assets in Puerto Rico of $627million is recoverable and no reserve on the receivables is necessary as of December 31, 2017 .
Brazil — Brazilian President Michael Temer continues to seek economic reforms that would improve the economic outlook in Brazil, which maybenefit our businesses in the country. Corruption investigations and the 2018 presidential campaign have limited Mr. Temer's ability to implementthese reforms. Despite these limitations, the Brazilian economy is showing moderate signs of improvement.
United Kingdom — In June 2016, the United Kingdom ("U.K.") held a referendum in which voters approved an exit from the European Union(“E.U.”), commonly referred to as “Brexit.” In December 2017, the U.K. and E.U. agreed terms to conclude Phase 1 negotiations and have movedinto Phase 2 of negotiations with respect to long-term trading relationship and a potential transitional period. The U.K. is expected to exit the E.U. onMarch 29, 2019. While the full impact of the Brexit remains uncertain, these changes may adversely affect our operations and financial results.
RegulatoryInternational Trade Commission — In September 2017, the U.S. International Trade Commission ("ITC") determined that serious injury has
been caused by foreign solar photovoltaic panels to U.S. manufacturers. The ITC proposed recommendations for remedies that include tariffs atvarious levels, a quota system and licensing fees. In January 2018, the U.S. President approved tariffs of 30% in the first year, which will graduallydecrease to 15% over four years. AES is evaluating the impact of these tariffs, but they will likely increase the cost of solar photovoltaic panels in theshort term. The Company has taken mitigating action to limit our exposure to these increased costs, such as acquiring solar panels for committedprojects in 2017 in anticipation of the new tariff, however these tariffs may impact the economics of future solar development projects in the U.S.,including those of our solar businesses.
Maritza PPA Review — The DG Comp continues to review whether Maritza’s PPA with NEK is compliant with the European Commission’sstate aid rules. Although no formal investigation has been launched by DG Comp to date, Maritza has engaged in discussions with the DG Compcase team and representatives of Bulgaria to discuss the agency’s review. In the near term, Maritza expects that it will engage in discussions withBulgaria to attempt to reach a negotiated resolution concerning DG Comp’s review. The anticipated discussions could involve a range of potentialoutcomes, including but not limited to termination of the PPA and payment of some level of compensation to Maritza. Any negotiated resolutionwould be subject to mutually acceptable terms, lender consent, and DG Comp approval. At this time, we cannot predict the outcome of theanticipated discussions between Maritza and Bulgaria, nor can we predict how DG Comp might resolve its review if the discussions fail to result inan agreement concerning the review. Maritza believes that its PPA is legal and in compliance with all applicable laws, and it will take all actionsnecessary to protect its interests, whether through negotiated agreement or otherwise. However, there can be no assurances that this matter will beresolved favorably; if it is not, there could be a material adverse impact on Maritza’s and the Company’s respective financial statements.
Alto MaipoAlto Maipo has experienced construction difficulties which have resulted in increased projected costs over the original $2 billion budget. These
overages led to a series of negotiations with the intention of restructuring the project’s existing financial structure and obtaining additional funding.On March 17, 2017, AES Gener completed a legal and financial restructuring of Alto Maipo. As a part of this restructuring, AES Genersimultaneously acquired a 40% ownership interest from Minera Los Pelambres (“MLP”), a noncontrolling shareholder, for nominal consideration, andsold a 6.7% ownership interest to Strabag, one of the construction contractors. Through its 67% ownership interest in AES Gener, the Companynow has an effective 62% indirect economic interest in Alto Maipo. Additionally, certain construction milestones were amended and if Alto Maipo isunable to meet these milestones, there could be a material impact to the financing and value of the project. For additional information on risksregarding construction and development, refer to Item 1A.— Risk Factors — Our Business is Subject to Substantial Development Uncertainties ofthis Form 10-K.
Following the restructuring, the project continued to face construction difficulties, including greater than expected costs and slower thananticipated productivity by construction contractors towards agreed-upon
90

milestones. As a result of the failure to perform by one of its construction contractors, Constructora Nuevo Maipo S.A. (“CNM”), Alto Maipoterminated CNM’s contract during the second quarter of 2017. As a result of the termination of CNM, Alto Maipo’s construction debt of $618 millionand derivative liabilities of $132 million are in technical default and presented as current on the balance sheet as of December 31, 2017.
Alto Maipo is currently a party to arbitration concerning the termination of CNM and other related matters. These include Alto Maipo’s draws onletters of credit securing CNM’s performance under the parties’ construction contract totaling $73 million (the “LC Funds”). The LC Funds werecollected by Alto Maipo and are available to be utilized for on-going construction costs. In February 2018, CNM was denied their request for interimrelief to recover the LC Funds. However, the overall arbitration concerning the termination of CNM, including a final ruling on CNM’s claim to recoverthe LC Funds, is still pending. Alto Maipo cannot predict the ultimate outcome of the arbitration or any related proceedings. For more information onthe legal proceedings concerning CNM, see Item 3.— Legal Proceedings of this Form 10-K.
Construction at the project is continuing, and the project is over 61% complete. In February 2018, Alto Maipo signed an amended EPC contractwith Strabag, the permanent replacement contractor selected to complete CNM’s work, subject to approval by the project's senior lenders as part ofthe second refinancing. Alto Maipo is working to resolve the challenges described above, however, there can be no assurance that Alto Maipo willsucceed in these efforts and if there are further delays or cost overruns, or if Alto Maipo is unable to reach an agreement with the non-recourselenders, there is a risk these lenders may seek to exercise remedies available as a result of the default noted above, or Alto Maipo may not be ableto meet its contractual or other obligations and may be unable to continue with the project. If any of the above occur, there could be a materialimpairment for the Company.
The carrying value of long-lived assets and deferred tax assets of Alto Maipo as of December 31, 2017 was approximately $1.4 billion and $60million , respectively. Through its 67% ownership interest in AES Gener, the Parent Company has invested approximately $375 million in Alto Maipoand has an additional equity funding commitment of $39 million required as part of the March 2017 restructuring described above. AES Gener mayprovide material additional funding commitments as part of ongoing negotiations and future project restructurings. Even though certain constructiondifficulties have not been formally resolved, construction costs continue to be capitalized as management believes the project is probable ofcompletion. Management believes the carrying value of the long-lived asset group is recoverable and was not impaired as of December 31, 2017. Inaddition, management believes it is more likely than not the deferred tax assets will be realized; however, they could be reduced if estimates offuture taxable income are decreased.
Changuinola Tunnel LeakIncreased water levels were noted in a creek near the Changuinola power plant, a 223 MW hydroelectric power facility in Panama. After the
completion of an assessment, the Company has confirmed loss of water in specific sections of the tunnel. The plant is in operation and can generateup to its maximum capacity. Repairs will be needed to ensure the long term performance of the facility, during which time the affected units of theplant will be out of service. Subject to final inspection, the repairs may take up to 10 months to complete and are expected to commence during thefirst quarter of 2019. The Company has notified its insurers of a potential claim and has asserted claims against its construction contractor.However, there can be no assurance of collection. The Company continues to monitor the situation to identify any potential changes to the tunnel.The Company has not identified any indicators of impairment and believes the carrying value of the long-lived asset group is recoverable as ofDecember 31, 2017.
ImpairmentsLong-lived Assets — During the year ended December 31, 2017 , the Company recognized asset impairment expense of $186 million at the
Kazakhstan CHP and Hydroelectric plants, $175 million at DPL, $121 million at Laurel Mountain, $37 million at Kilroot, and $18 million at otherbusinesses in the PJM market. See Note 19 — Asset Impairment Expense included in Item 8.— Financial Statements and Supplementary Data ofthis Form 10-K for further information. After recognizing these asset impairment expenses, the carrying value of the long-lived asset groups,including those that were assessed and not impaired, excluding Alto Maipo, totaled $1 billion at December 31, 2017 .
Events or changes in circumstances that may necessitate further recoverability tests and potential impairment of long-lived assets may include,but are not limited to, adverse changes in the regulatory environment, unfavorable changes in power prices or fuel costs, increased competition dueto additional capacity in the grid, technological advancements, declining trends in demand, or an expectation that it is more likely than not that theasset will be disposed of before the end of its previously estimated useful life.
91

Goodwill — The Company currently has no reporting units considered to be "at risk." A reporting unit is considered "at risk" when its fair valueis not higher than its carrying amount by 10%. The Company monitors its reporting units at risk of Step 1 failure on an ongoing basis. It is possiblethat the Company may incur goodwill impairment charges at any reporting units containing goodwill in future periods if adverse changes in theirbusiness or operating environments occur. See Note 8 — Goodwill and Other Intangible Assets included in Item 8.— Financial Statements andSupplementary Data of this Form 10-K for further information.
Functional CurrencyArgentina — In February 2017, the Argentina Ministry of Energy issued Resolution 19/2017, which established changes to the energy price
framework. As a result of this resolution, tariffs are now priced in USD rather than Argentine pesos, and the retention of unpaid amounts andaccumulation of receivables with CAMMESA was eliminated. Concurrent with the establishment of the new price framework, AES Argentina issued$300 million of bonds denominated in USD. Given these significant changes in economic facts and circumstances, the Company changed thefunctional currency of the Argentina businesses from the Argentine peso to the USD effective February 2017. Changes to the energy frameworkcould have a material impact on the Company.
Chivor — In May 2017, the Company repaid its outstanding USD denominated debt held at Chivor. In addition, the Company updated Chivor’sfuture financing strategy to align with Colombian peso denominated operational cash flows of the business. Given these changes, the Colombianpeso is now regarded as the currency of the economic environment in which Chivor primarily operates. Therefore, the Company changed thefunctional currency of the Chivor business from USD to the Colombian peso effective May 2017.
Capital Resources and LiquidityOverview — As of December 31, 2017 , the Company had unrestricted cash and cash equivalents of $949 million , of which $11 million was
held at the Parent Company and qualified holding companies. The Company also had $424 million in short term investments, held primarily atsubsidiaries. In addition, we had restricted cash and debt service reserves of $839 million . The Company also had non-recourse and recourseaggregate principal amounts of debt outstanding of $15.3 billion and $4.6 billion , respectively. Of the approximately $2.2 billion of our current non-recourse debt, $1.1 billion was presented as such because it is due in the next twelve months and $1 billion relates to debt considered in default dueto covenant violations. Defaults at AES Puerto Rico are covenant and payment defaults, for which Forbearance and Standstill Agreements havebeen signed. All other defaults are not payment defaults, but are instead technical defaults triggered by failure to comply with other covenants and/orother conditions such as (but not limited to) failure to meet information covenants, complete construction or other milestones in an allocated time,meet certain minimum or maximum financial ratios, or other requirements contained in the non-recourse debt documents of the Company.
We expect such current maturities will be repaid from net cash provided by operating activities of the subsidiary to which the debt relates orthrough opportunistic refinancing activity or some combination thereof. We have $5 million of recourse debt which matures within the next twelvemonths. From time to time, we may elect to repurchase our outstanding debt through cash purchases, privately negotiated transactions or otherwisewhen management believes that such securities are attractively priced. Such repurchases, if any, will depend on prevailing market conditions, ourliquidity requirements and other factors. The amounts involved in any such repurchases may be material.
We rely mainly on long-term debt obligations to fund our construction activities. We have, to the extent available at acceptable terms, utilizednon-recourse debt to fund a significant portion of the capital expenditures and investments required to construct and acquire our electric powerplants, distribution companies and related assets. Our non-recourse financing is designed to limit cross default risk to the Parent Company or othersubsidiaries and affiliates. Our non-recourse long-term debt is a combination of fixed and variable interest rate instruments. Generally, a portion orall of the variable rate debt is fixed through the use of interest rate swaps. In addition, the debt is typically denominated in the currency that matchesthe currency of the revenue expected to be generated from the benefiting project, thereby reducing currency risk. In certain cases, the currency ismatched through the use of derivative instruments. The majority of our non-recourse debt is funded by international commercial banks, with debtcapacity supplemented by multilaterals and local regional banks.
Given our long-term debt obligations, the Company is subject to interest rate risk on debt balances that accrue interest at variable rates. Whenpossible, the Company will borrow funds at fixed interest rates or hedge its variable rate debt to fix its interest costs on such obligations. In addition,the Company has historically tried to maintain at least 70% of its consolidated long-term obligations at fixed interest rates, including fixing theinterest rate through the use of interest rate swaps. These efforts apply to the notional amount of the swaps compared to the amount of
92

related underlying debt. Presently, the Parent Company's only material unhedged exposure to variable interest rate debt relates to indebtednessunder its $521 million outstanding secured term loan due 2022 and drawings of $207 million under its secured credit facility. On a consolidatedbasis, of the Company's $20 billion of total debt outstanding as of December 31, 2017 , approximately $3.2 billion bore interest at variable rates thatwere not subject to a derivative instrument which fixed the interest rate. Brazil holds $1 billion of our floating rate non-recourse exposure as we haveno ability to fix local debt interest rates efficiently.
In addition to utilizing non-recourse debt at a subsidiary level when available, the Parent Company provides a portion, or in certain instancesall, of the remaining long-term financing or credit required to fund development, construction or acquisition of a particular project. These investmentshave generally taken the form of equity investments or intercompany loans, which are subordinated to the project's non-recourse loans. Wegenerally obtain the funds for these investments from our cash flows from operations, proceeds from the sales of assets and/or the proceeds fromour issuances of debt, common stock and other securities. Similarly, in certain of our businesses, the Parent Company may provide financialguarantees or other credit support for the benefit of counterparties who have entered into contracts for the purchase or sale of electricity, equipmentor other services with our subsidiaries or lenders. In such circumstances, if a business defaults on its payment or supply obligation, the ParentCompany will be responsible for the business' obligations up to the amount provided for in the relevant guarantee or other credit support. AtDecember 31, 2017 , the Parent Company had provided outstanding financial and performance-related guarantees or other credit supportcommitments to or for the benefit of our businesses, which were limited by the terms of the agreements, of approximately $842 million in aggregate(excluding those collateralized by letters of credit and other obligations discussed below).
As a result of the Parent Company's below investment grade rating, counterparties may be unwilling to accept our general unsecuredcommitments to provide credit support. Accordingly, with respect to both new and existing commitments, the Parent Company may be required toprovide some other form of assurance, such as a letter of credit, to backstop or replace our credit support. The Parent Company may not be able toprovide adequate assurances to such counterparties. To the extent we are required and able to provide letters of credit or other collateral to suchcounterparties, this will reduce the amount of credit available to us to meet our other liquidity needs. At December 31, 2017 , we had $36 million inletters of credit outstanding, provided under our senior secured credit facility, $52 million in letters of credit outstanding, provided under ourunsecured senior credit facility. These letters of credit operate to guarantee performance relating to certain project development activities andbusiness operations. During the year ended December 31, 2017 , the Company paid letter of credit fees ranging from 0.25% to 2.25% per annumon the outstanding amounts.
We expect to continue to seek, where possible, non-recourse debt financing in connection with the assets or businesses that we or ouraffiliates may develop, construct or acquire. However, depending on local and global market conditions and the unique characteristics of individualbusinesses, non-recourse debt may not be available on economically attractive terms or at all. If we decide not to provide any additional funding orcredit support to a subsidiary project that is under construction or has near-term debt payment obligations and that subsidiary is unable to obtainadditional non-recourse debt, such subsidiary may become insolvent, and we may lose our investment in that subsidiary. Additionally, if any of oursubsidiaries lose a significant customer, the subsidiary may need to withdraw from a project or restructure the non-recourse debt financing. If we orthe subsidiary choose not to proceed with a project or are unable to successfully complete a restructuring of the non-recourse debt, we may lose ourinvestment in that subsidiary.
Many of our subsidiaries depend on timely and continued access to capital markets to manage their liquidity needs. The inability to raisecapital on favorable terms, to refinance existing indebtedness or to fund operations and other commitments during times of political or economicuncertainty may have material adverse effects on the financial condition and results of operations of those subsidiaries. In addition, changes in thetiming of tariff increases or delays in the regulatory determinations under the relevant concessions could affect the cash flows and results ofoperations of our businesses.
Long-Term Receivables — As of December 31, 2017 , the Company had approximately $194 million of accounts receivable classified asNoncurrent assets—other primarily related to certain of its generation businesses in Argentina. The noncurrent receivables mostly consist ofaccounts receivable in Argentina that, pursuant to amended agreements or government resolutions, have collection periods that extend beyondDecember 31, 2018 , or one year from the latest balance sheet date. The majority of Argentinian receivables have been converted into long-termfinancing for the construction of power plants. See Note 6 — Financing Receivables included in Item 8.— Financial Statements and SupplementaryData and Item 1.— Business—Regulatory Matters—Argentina of this Form 10-K for further information.
93

Consolidated Cash FlowsThe following table reflects the changes in operating, investing, and financing cash flows for the comparative twelve month periods (in
millions):
December 31, $ Change
Cash flows provided by (used in): 2017 2016 2015 2017 vs. 2016 2016 vs. 2015
Operating activities $ 2,489 $ 2,884 $ 2,134 $ (395) $ 750
Investing activities (2,749) (2,108) (2,366) (641) 258
Financing activities 43 (747) 28 790 (775)
Operating Activities
The following table summarizes the key components of our consolidated operating cash flows (in millions):
December 31, $ Change
2017 2016 2015 2017 vs. 2016 2016 vs. 2015
Net income (loss) $ (777) $ (777) $ 762 $ — $ (1,539)
Depreciation and amortization 1,169 1,176 1,144 (7) 32
Impairment expenses 537 1,098 602 (561) 496
Loss on the extinguishment of debt 68 20 186 48 (166)
Deferred income taxes 672 (793) (50) 1,465 (743)Net loss from disposal and impairments of discontinuedbusinesses 611 1,383 — (772) 1,383
Other adjustments to net income 275 225 (73) 50 298
Non-cash adjustments to net income (loss) 3,332 3,109 1,809 223 1,300
Net income, adjusted for non-cash items $ 2,555 $ 2,332 $ 2,571 $ 223 $ (239)
Net change in operating assets and liabilities (1) (66) 552 (437) (618) 989
Net cash provided by operating activities (2) $ 2,489 $ 2,884 $ 2,134 $ (395) $ 750_____________________________
(1) Refer to the table below for explanations of the variance in operating assets and liabilities.(2) Amounts included in the table above include the results of discontinued operations, where applicable.
Fiscal Year 2017 versus 2016
Net change in operating assets and liabilities decreased by $618 million for the year ended December 31, 2017 compared to the year endedDecember 31, 2016 , which was primarily driven by (in millions):
Increases in:
Accounts receivable, primarily at Maritza and Eletropaulo $ (414)
Prepaid expenses and other current assets, primarily short-term regulatory assets at Eletropaulo and Sul (763)
Accounts payable and other current liabilities, primarily at Eletropaulo, Tietê, Gener and Maritza, partially offset by Corporate 783
Income taxes payable, net, and other taxes payable, primarily at Gener, Tietê and Eletropaulo 252
Decreases in:
Other liabilities, primarily due to higher deferrals into regulatory liabilities related to energy costs in 2016 compared to 2017 at Eletropaulo (362)
Other (114)
Total decrease in cash from changes in operating assets and liabilities $ (618)
Fiscal Year 2016 versus 2015
Net change in operating assets and liabilities increased by $989 million for the year ended December 31, 2016 compared to the year endedDecember 31, 2015 , which was primarily driven by (in millions):
Decreases in:
Other assets, primarily long-term regulatory assets at Eletropaulo and service concession assets at Vietnam $ 1,054
Accounts receivable, primarily at Maritza and Eletropaulo 615
Prepaid expenses and other current assets, primarily regulatory assets at Eletropaulo and Sul 215
Accounts payable and other current liabilities, primarily at Eletropaulo and Sul (651)
Income taxes payable, net and other taxes payable, primarily at Tietê, Chivor and Gener (252)

Increases in:
Other 8
Total increase in cash from changes in operating assets and liabilities $ 989
94

Investing Activities
Fiscal Year 2017 versus 2016
Net cash used in investing activities increased $641 million for the year ended December 31, 2017 compared to December 31, 2016 , whichwas primarily driven by (in millions):
Increases in:
Acquisitions of businesses, net of cash acquired, and equity method investees (related to the acquisitions of sPower and Alto Sertão II in 2017, partiallyoffset by the lower acquisition of Distributed Energy projects in 2016) $ (570)
Contributions to equity investments at OPGC and sPower (83)
Restricted cash, debt service and other assets (74)
Decreases in:
Proceeds from the sale of business, net of cash sold, related to the sale of Sul in 2016, partially offset by the sale of Zimmer and Miami Fort (523)
Short-term investments 477
Capital expenditures (1) 168
Other investing activities (36)
Total increase in net cash used in investing activities $ (641)_____________________________
(1) Refer to the tables below for a breakout of capital expenditure by type and by primary business driver.
The following table summarizes the Company's capital expenditures for growth investments, maintenance and environmental reported ininvesting cash activities for the periods indicated (in millions):
December 31, $ Change
2017 2016 2017 vs. 2016
Growth Investments $ (1,549) $ (1,510) $ (39)
Maintenance (552) (617) 65
Environmental (1) (76) (218) 142
Total capital expenditures $ (2,177) $ (2,345) $ 168_____________________________
(1) Includes both recoverable and non-recoverable environmental capital expenditures. See SBU Performance Analysis for more information.
Cash used for capital expenditures decreased by $168 million for the year ended December 31, 2017 compared to December 31, 2016 , whichwas primarily driven by (in millions):
Decreases in:
Growth expenditures at the Andes SBU, primarily due to the completion of the Cochrane project and slower than anticipated productivity by constructioncontractors at Alto Maipo $ 114Growth expenditure at the Eurasia SBU, primarily due to timing of payments resulting in more financed capex 73Maintenance and environmental expenditures at the US SBU, primarily due to lower spending at IPALCO on the NPDES and MATS compliance and HardingStreet refueling projects, decreased spending on CCR compliance and also, decreased spending at DPL on Stuart and Killen facilities due to planned plantclosures 180
Increases in:Growth expenditures at the US SBU, primarily due to increased spending at Southland re-powering and various Distributed Energy projects, offset by lowerspending related to Eagle Valley at IPALCO (233)
Other capital expenditures 34
Total decrease in net cash used for capital expenditures $ 168
Fiscal Year 2016 versus 2015
Net cash used in investing activities decreased $258 million for the year ended December 31, 2016 compared to December 31, 2015 , whichwas primarily driven by (in millions):
Increases in:
Capital expenditures (1) $ (37)
Acquisitions, net of cash acquired (primarily Distributed Energy) (38)
Proceeds from the sales of businesses, net of cash sold (primarily related to sales of DPLER and Sul) 493
Net purchases of short-term investments (297)
Decreases in:

Restricted cash, debt service and other assets 98
Other investing activities 39
Total decrease in net cash used in investing activities $ 258_____________________________
(1) Refer to the tables below for a breakout of capital expenditures by type and by primary business driver.
95

The following table summarizes the Company's capital expenditures for growth investments, maintenance and environmental for the periodsindicated (in millions):
December 31, $ Change
2016 2015 2016 vs. 2015
Growth Investments $ (1,510) $ (1,401) $ (109)
Maintenance (617) (606) (11)
Environmental (1) (218) (301) 83
Total capital expenditures $ (2,345) $ (2,308) $ (37)_____________________________
(1) Includes both recoverable and non-recoverable environmental capital expenditures.
Cash used for capital expenditures increased by $37 million for the year ended December 31, 2016 compared to December 31, 2015 , whichwas primarily driven by (in millions):
Increases in: Growth expenditures at the Eurasia SBU for the construction of the Masinloc expansion and retrofit related costs to the existing plant to increasing capacity $ (124)Growth expenditures at the MCAC SBU for the construction of Colon and Los Mina (266)
Decreases In:
Growth expenditures at the Andes SBU, primarily due to lower spending at Cochrane and the Andes Solar plant; partially offset by higher investments in AltoMaipo 280Growth expenditures at the US SBU, primarily due to lower spending related to Eagle Valley and Transmission & Distribution projects at IPALCO 20Maintenance and environmental expenditures at the US SBU, primarily due to lower spending related to MATS compliance and the conversion of HardingStreet Stations 5, 6 and 7 to natural gas upon being placed into service in late 2015 and early 2016; partially offset by higher spending on CCR compliance 63
Other capital expenditures (10)
Total increase in net cash used for capital expenditures $ (37)
Financing Activities
Net cash used in financing activities decreased $790 million for the year ended December 31, 2017 compared to December 31, 2016 , whichwas primarily driven by (in millions):
Decreases in:
Proceeds from the sale of redeemable stock of subsidiaries at IPALCO $ (134)
Contributions from noncontrolling interests and redeemable security holders at MCAC and US SBUs (117)
Repayment of non-recourse debt, primarily at the Brazil, US, Eurasia and MCAC SBUs (1) 550
Increases in:
Borrowings under the revolving credit facilities, primarily at the Parent Company and net decrease in repayments at the US SBU 382
Proceeds from sale of noncontrolling interests primarily related to the sell down of Dominican Republic business in 2017 94
Other financing activities 15
Total decrease in net cash used in financing activities $ 790_____________________________
(1) See Note 10 — Debt in Item 8.— Financial Statements and Supplementary Data of this Form 10-K for more information regarding significant recourse debt transactions.
Net cash provided by financing activities increased $775 million for the year ended December 31, 2016 compared to the year ended December31, 2015 , which was primarily driven by (in millions):
Increases in:
Distributions to noncontrolling interests, primarily at the Brazil SBU $ (150)
Contributions from noncontrolling interests, primarily at the MCAC SBU 64
Decreases in:
Net issuance of non-recourse debt, primarily at the Andes and Brazil SBUs (624)
Proceeds from the sale of redeemable stock of subsidiaries at IPALCO (327)
Proceeds from sales to noncontrolling interests, net of transaction costs (154)
Purchases of treasury stock by the Parent Company 403
Net repayments of recourse debt at the Parent Company (1) 32
Other financing activities (19)

Total increase in net cash provided by financing activities $ (775)_____________________________
(1) See Note 10 — Debt in Item 8.— Financial Statements and Supplementary Data of this Form 10-K for more information regarding significant recourse debt transactions.
Parent Company LiquidityThe following discussion of Parent Company Liquidity is included as a useful measure of the liquidity available to The AES Corporation, or the
Parent Company, given the non-recourse nature of most of our indebtedness. Parent Company Liquidity as outlined below is a non-GAAP measureand should not be construed as an alternative
96

to cash and cash equivalents which is determined in accordance with GAAP as a measure of liquidity. Cash and cash equivalents is disclosed onthe Consolidated Statements of Cash Flows. Parent Company Liquidity may differ from similarly titled measures used by other companies. Theprincipal sources of liquidity at the Parent Company level are dividends and other distributions from our subsidiaries, including refinancing proceeds,proceeds from debt and equity financings at the Parent Company level, including availability under our credit facility, and proceeds from asset sales.Cash requirements at the Parent Company level are primarily to fund interest; principal repayments of debt; construction commitments; other equitycommitments; common stock repurchases; acquisitions; taxes; Parent Company overhead and development costs; and dividends on commonstock.
The Company defines Parent Company Liquidity as cash available to the Parent Company plus available borrowings under existing creditfacility. The cash held at qualified holding companies represents cash sent to subsidiaries of the Company domiciled outside of the U.S. Suchsubsidiaries have no contractual restrictions on their ability to send cash to the Parent Company. Parent Company Liquidity is reconciled to its mostdirectly comparable U.S. GAAP financial measure, Cash and cash equivalents , at December 31, 2017 and 2016 as follows:
Parent Company Liquidity (in millions) 2017 2016
Consolidated cash and cash equivalents $ 949 $ 1,244
Less: Cash and cash equivalents at subsidiaries 938 1,144
Parent and qualified holding companies' cash and cash equivalents 11 100
Commitments under Parent Company credit facilities 1,100 800
Less: Letters of credit under the credit facilities (35) (6)
Less: Borrowings under the credit facilities (207) —
Borrowings available under Parent Company credit facilities 858 794
Total Parent Company Liquidity $ 869 $ 894
The Parent Company paid dividends of $0.48 per share to its common stockholders during the year ended December 31, 2017 . While weintend to continue payment of dividends and believe we will have sufficient liquidity to do so, we can provide no assurance that we will continue topay dividends, or if continued, the amount of such dividends.
Recourse Debt
Our total recourse debt was $4.6 billion and $4.7 billion at December 31, 2017 and 2016 , respectively. See Note 10 — Debt in Item 8.—Financial Statements and Supplementary Data of this Form 10-K for additional detail.
While we believe that our sources of liquidity will be adequate to meet our needs for the foreseeable future, this belief is based on a number ofmaterial assumptions, including, without limitation, assumptions about our ability to access the capital markets (see Key Trends and Uncertainties—Macroeconomic and Political ), the operating and financial performance of our subsidiaries, currency exchange rates, power market pool prices, andthe ability of our subsidiaries to pay dividends. In addition, our subsidiaries' ability to declare and pay cash dividends to us (at the Parent Companylevel) is subject to certain limitations contained in loans, governmental provisions and other agreements. We can provide no assurance that thesesources will be available when needed or that the actual cash requirements will not be greater than anticipated. See Item 1A.— Risk Factors — TheAES Corporation is a holding company and its ability to make payments on its outstanding indebtedness, including its public debt securities, isdependent upon the receipt of funds from its subsidiaries by way of dividends, fees, interest, loans or otherwise, of this Form 10-K.
Various debt instruments at the Parent Company level, including our senior secured credit facility, contain certain restrictive covenants. Thecovenants provide for — among other items — limitations on other indebtedness; liens, investments and guarantees; limitations on dividends, stockrepurchases and other equity transactions; restrictions and limitations on mergers and acquisitions, sales of assets, leases, transactions withaffiliates and off-balance sheet and derivative arrangements; maintenance of certain financial ratios; and financial and other reporting requirements.As of December 31, 2017 , we were in compliance with these covenants at the Parent Company level.
Non-Recourse DebtWhile the lenders under our non-recourse debt financings generally do not have direct recourse to the Parent Company, defaults thereunder
can still have important consequences for our results of operations and liquidity, including, without limitation:
• reducing our cash flows as the subsidiary will typically be prohibited from distributing cash to the Parent Company during the time period ofany default;
97

• triggering our obligation to make payments under any financial guarantee, letter of credit or other credit support we have provided to or onbehalf of such subsidiary;
• causing us to record a loss in the event the lender forecloses on the assets; and• triggering defaults in our outstanding debt at the Parent Company.
For example, our senior secured credit facility and outstanding debt securities at the Parent Company include events of default for certainbankruptcy related events involving material subsidiaries. In addition, our revolving credit agreement at the Parent Company includes events ofdefault related to payment defaults and accelerations of outstanding debt of material subsidiaries.
Some of our subsidiaries are currently in default with respect to all or a portion of their outstanding indebtedness. The total non-recourse debtclassified as current in the accompanying Consolidated Balance Sheets amounts to $2.2 billion . The portion of current debt related to such defaultswas $1 billion at December 31, 2017 , all of which was non-recourse debt related to three subsidiaries — Alto Maipo, AES Puerto Rico, and AESIlumina. See Note 10 — Debt in Item 8.— Financial Statements and Supplementary Data of this Form 10-K for additional detail.
None of the subsidiaries that are currently in default are subsidiaries that met the applicable definition of materiality under AES' corporate debtagreements as of December 31, 2017 in order for such defaults to trigger an event of default or permit acceleration under AES' indebtedness.However, as a result of additional dispositions of assets, other significant reductions in asset carrying values or other matters in the future that mayimpact our financial position and results of operations or the financial position of the individual subsidiary, it is possible that one or more of thesesubsidiaries could fall within the definition of a "material subsidiary" and thereby upon an acceleration trigger an event of default and possibleacceleration of the indebtedness under the Parent Company's outstanding debt securities. A material subsidiary is defined in the Company's seniorsecured revolving credit facility as any business that contributed 20% or more of the Parent Company's total cash distributions from businesses forthe four most recently completed fiscal quarters. As of December 31, 2017 , none of the defaults listed above individually or in the aggregate resultsin or is at risk of triggering a cross-default under the recourse debt of the Company.
Contractual Obligations and Parent Company Contingent Contractual Obligations
A summary of our contractual obligations, commitments and other liabilities as of December 31, 2017 is presented below and excludes anybusinesses classified as discontinued operations or held-for-sale (in millions):
Contractual Obligations Total Less than 1year 1-3 years 3-5 years More than 5
years Other FootnoteReference (4)
Debt Obligations (1) $ 20,404 $ 2,250 $ 2,431 $ 5,003 $ 10,720 $ — 10
Interest Payments on Long-Term Debt (2) 9,103 1,172 2,166 1,719 4,046 — n/a
Capital Lease Obligations 18 2 2 2 12 — 11
Operating Lease Obligations 935 58 116 117 644 — 11
Electricity Obligations 4,501 581 948 907 2,065 — 11
Fuel Obligations 5,859 1,759 1,642 992 1,466 — 11
Other Purchase Obligations 4,984 1,488 1,401 781 1,314 — 11Other Long-Term Liabilities Reflected on AES' Consolidated BalanceSheet under GAAP (3) 701 — 284 118 277 22 n/a
Total $ 46,505 $ 7,310 $ 8,990 $ 9,639 $ 20,544 $ 22 _____________________________
(1) Includes recourse and non-recourse debt presented on the Consolidated Balance Sheet. These amounts exclude capital lease obligations which are included in the capital lease category.(2) Interest payments are estimated based on final maturity dates of debt securities outstanding at December 31, 2017 and do not reflect anticipated future refinancing, early redemptions or new debt issuances.
Variable rate interest obligations are estimated based on rates as of December 31, 2017 .(3) These amounts do not include current liabilities on the Consolidated Balance Sheet except for the current portion of uncertain tax obligations. Noncurrent uncertain tax obligations are reflected in the "Other"
column of the table above as the Company is not able to reasonably estimate the timing of the future payments. In addition, these amounts do not include: (1) regulatory liabilities (See Note 9 — RegulatoryAssets and Liabilities ), (2) contingencies (See Note 12 — Contingencies ), (3) pension and other postretirement employee benefit liabilities (see Note 13 — Benefit Plans ), (4) derivatives and incentivecompensation (See Note 5 — Derivative Instruments and Hedging Activities ) or (5) any taxes (See Note 20 — Income Taxes ) except for uncertain tax obligations, as the Company is not able to reasonablyestimate the timing of future payments. See the indicated notes to the Consolidated Financial Statements included in Item 8 of this Form 10-K for additional information on the items excluded.
(4) For further information see the note referenced below in Item 8.— Financial Statements and Supplementary Data of this Form 10-K.
98

The following table presents our Parent Company's contingent contractual obligations as of December 31, 2017 :
Contingent contractual obligations Amount (in millions) Number of Agreements Maximum Exposure Range for EachAgreement (in millions)
Guarantees and commitments $ 815 21 $1 — 272
Letters of credit under the unsecured credit facility 52 4 $2 — 26
Asset sale related indemnities (1) 27 1 27
Letters of credit under the senior secured credit facility 36 21 <$1 — 13
Total $ 930 47 _____________________________
(1) Excludes normal and customary representations and warranties in agreements for the sale of assets (including ownership in associated legal entities) where the associated risk is considered to be nominal.
We have a diverse portfolio of performance-related contingent contractual obligations. These obligations are designed to cover potential risksand only require payment if certain targets are not met or certain contingencies occur. The risks associated with these obligations include change ofcontrol, construction cost overruns, subsidiary default, political risk, tax indemnities, spot market power prices, sponsor support and liquidateddamages under power sales agreements for projects in development, in operation and under construction. In addition, we have an asset saleprogram through which we may have customary indemnity obligations under certain assets sale agreements. While we do not expect that we will berequired to fund any material amounts under these contingent contractual obligations beyond 2017 , many of the events which would give rise tosuch obligations are beyond our control. We can provide no assurance that we will be able to fund our obligations under these contingentcontractual obligations if we are required to make substantial payments thereunder.
Critical Accounting Policies and EstimatesThe Consolidated Financial Statements of AES are prepared in conformity with U.S. GAAP, which requires the use of estimates, judgments
and assumptions that affect the reported amounts of assets and liabilities at the date of the financial statements and the reported amounts ofrevenue and expenses during the periods presented. AES' significant accounting policies are described in Note 1 — General and Summary ofSignificant Accounting Policies to the Consolidated Financial Statements included in Item 8 of this Form 10-K.
An accounting estimate is considered critical if the estimate requires management to make assumptions about matters that were highlyuncertain at the time the estimate was made, different estimates reasonably could have been used, or the impact of the estimates and assumptionson financial condition or operating performance is material.
Management believes that the accounting estimates employed are appropriate and the resulting balances are reasonable; however, actualresults could materially differ from the original estimates, requiring adjustments to these balances in future periods. Management has discussedthese critical accounting policies with the Audit Committee, as appropriate. Listed below are the Company's most significant critical accountingestimates and assumptions used in the preparation of the Consolidated Financial Statements.
Income Taxes — We are subject to income taxes in both the U.S. and numerous foreign jurisdictions. Our worldwide income tax provisionrequires significant judgment and is based on calculations and assumptions that are subject to examination by the Internal Revenue Service andother taxing authorities. Certain of the Company's subsidiaries are under examination by relevant taxing authorities for various tax years. TheCompany regularly assesses the potential outcome of these examinations in each tax jurisdiction when determining the adequacy of the provisionfor income taxes. Accounting guidance for uncertainty in income taxes prescribes a more likely than not recognition threshold. Tax reserves havebeen established, which the Company believes to be adequate in relation to the potential for additional assessments. Once established, reservesare adjusted only when there is more information available or when an event occurs necessitating a change to the reserves. While the Companybelieves that the amounts of the tax estimates are reasonable, it is possible that the ultimate outcome of current or future examinations may bematerially different than the reserve amounts.
Because we have a wide range of statutory tax rates in the multiple jurisdictions in which we operate, any changes in our geographicalearnings mix could materially impact our effective tax rate. Furthermore, our tax position could be adversely impacted by changes in tax laws, taxtreaties or tax regulations or the interpretation or enforcement thereof and such changes may be more likely or become more likely in view of recenteconomic trends in certain of the jurisdictions in which we operate. As an example, new tax laws were enacted in December 2017 in the U.S. whichdecreased the statutory income tax rate from 35% to 21%, required a one-time transition tax, and introduced numerous other changes. As furtheroutlined in Key Trends and Uncertainties , the Company anticipates that the new GILTI provisions of U.S. tax reform could materially impact theeffective tax rate in future periods.
99

Accordingly, in 2017 our net U.S. deferred tax liabilities were remeasured to the new rates. The potential future impacts of the changes in taxlaw may be material to continuing operations. See Note 20 — Income Taxes to the Consolidated Financial Statements included in Item 8 of thisForm 10-K for additional information.
The Company's provision for income taxes could be adversely impacted by changes to the U.S. taxation of earnings of our foreign subsidiaries.In accordance with SAB 118, the Company has made reasonable estimates of the impacts of U.S. tax reform on its 2017 financial results, subject topotential adjustments as we complete our analysis. Our expected effective tax rate could increase by amounts that may be material to the Company.
In addition, no taxes have been recorded on undistributed earnings for certain of our non-U.S. subsidiaries to the extent such earnings areconsidered to be indefinitely reinvested in the operations of those subsidiaries. Should the earnings be remitted as dividends, the Company may besubject to additional foreign withholding and state income taxes.
Deferred tax assets and liabilities are recognized for the future tax consequences attributable to differences between the financial statementcarrying amounts of the existing assets and liabilities, and their respective income tax bases. The Company establishes a valuation allowance whenit is more likely than not that all or a portion of a deferred tax asset will not be realized.
Sales of Noncontrolling Interests — The accounting for a sale of noncontrolling interest under the accounting standards depends on whetherthe sale is considered to be a sale of in-substance real estate, where the gain (loss) on sale would be recognized in earnings rather than withinstockholders' equity. If management's estimation process determines that there is no significant value beyond the in-substance real estate, the gain(loss) on the sale of the noncontrolling interest is recognized in earnings. However, if it is determined that significant value likely exists beyond thein-substance real estate, the gain (loss) on the sale of the noncontrolling interest would be recognized within stockholders' equity.
In-substance real estate is composed of land plus improvements and integral equipment. The determination of whether property, plant andequipment is integral equipment is based on the significance of the costs to remove the equipment from its existing location (including the cost ofrepairing damage resulting from the removal), combined with the decrease in the fair value of the equipment as a result of those removalactivities. When the combined total of removal costs and the decrease in fair value of the equipment exceeds 10% of the fair value of the equipment,the equipment is considered integral equipment. The accounting standards specifically identify power plants as an example of in-substance realestate. Where the consolidated entity in which noncontrolling interests have been sold contains in-substance real estate, management estimates theextent to which the total fair value of the assets of the entity is represented by the in-substance real estate and whether significant value existsbeyond the in-substance real estate. This estimation considers all qualitative and quantitative factors relevant for each sale and, where appropriate,includes making quantitative estimates about the fair value of the entity and its identifiable assets and liabilities (including any favorable orunfavorable contracts) by analogy to the accounting standards on business combinations. As such, these estimates may require significantjudgment and assumptions, similar to the critical accounting estimates discussed below for impairments and fair value.
Impairments — Our accounting policies on goodwill and long-lived assets are described in detail in Note 1 — General and Summary ofSignificant Accounting Policies , included in Item 8 of this Form 10-K. The Company makes considerable judgments in its impairment evaluations ofgoodwill and long-lived assets, starting with determining if an impairment indicator exists. Events that may result in an impairment analysis beingperformed include, but are not limited to: adverse changes in the regulatory environment, unfavorable changes in power prices or fuel costs,increased competition due to additional capacity in the grid, technological advancements, declining trends in demand, or an expectation it is morelikely than not that the asset will be disposed of before the end of its previously estimated useful life. The Company exercises judgment indetermining if these events represent an impairment indicator requiring the computation of the fair value of goodwill and/or the recoverability of long-lived assets. The fair value determination is typically the most judgmental part in an impairment evaluation. Please see Fair Value below for furtherdetail.
As part of the impairment evaluation process, management analyzes the sensitivity of fair value to various underlying assumptions. The levelof scrutiny increases as the gap between fair value and carrying amount decreases. Changes in any of these assumptions could result inmanagement reaching a different conclusion regarding the potential impairment, which could be material. Our impairment evaluations inherentlyinvolve uncertainties from uncontrollable events that could positively or negatively impact the anticipated future economic and operating conditions.
Further discussion of the impairment charges recognized by the Company can be found within Note 8 — Goodwill and Other Intangible Assetsand Note 19 — Asset Impairment Expense to the Consolidated Financial
100

Statements included in Item 8 of this Form 10-K.
Fair Value
Fair Value — For information regarding the fair value hierarchy, see Note 1— General and Summary of Significant Accounting Policiesincluded in Item 8 of this Form 10-K.
Fair Value of Financial Instruments — A significant number of the Company's financial instruments are carried at fair value with changes infair value recognized in earnings or other comprehensive income each period. Investments are generally fair valued based on quoted market pricesor other observable market data such as interest rate indices. The Company's investments are primarily certificates of deposit, government debtsecurities and money market funds. Derivatives are valued using observable data as inputs into internal valuation models. The Company'sderivatives primarily consist of interest rate swaps, foreign currency instruments, and commodity and embedded derivatives. Additional discussionregarding the nature of these financial instruments and valuation techniques can be found in Note 4 — Fair Value included in Item 8 of this Form10-K.
Fair Value of Nonfinancial Assets and Liabilities — Significant estimates are made in determining the fair value of long-lived tangible andintangible assets (i.e., property, plant and equipment, intangible assets and goodwill) during the impairment evaluation process. In addition, themajority of assets acquired and liabilities assumed in a business combination are required to be recognized at fair value under the relevantaccounting guidance.
The Company may engage an independent valuation firm to assist management with the valuation. The Company generally utilizes the incomeapproach to value nonfinancial assets and liabilities, specifically a Discounted Cash Flow ("DCF") model to estimate fair value by discounting ourinternal budgets and cash flow forecasts, adjusted to reflect market participant assumptions, to the extent necessary, at an appropriate discountrate.
Management applies considerable judgment in selecting several input assumptions during the development of our internal budgets and cashflow forecasts. Examples of the input assumptions that our budgets and forecasts are sensitive to include macroeconomic factors such as growthrates, industry demand, inflation, exchange rates, power prices and commodity prices. Whenever appropriate, management obtains these inputassumptions from observable market data sources (e.g., Economic Intelligence Unit) and extrapolates the market information if an input assumptionis not observable for the entire forecast period. Many of these input assumptions are dependent on other economic assumptions, which are oftenderived from statistical economic models with inherent limitations such as estimation differences. Further, several input assumptions are based onhistorical trends which often do not recur. It is not uncommon that different market data sources have different views of the macroeconomic factorexpectations and related assumptions. As a result, macroeconomic factors and related assumptions are often available in a narrow range; however,in some situations these ranges become wide and the use of a different set of input assumptions could produce significantly different budgets andcash flow forecasts.
A considerable amount of judgment is also applied in the estimation of the discount rate used in the DCF model. To the extent practical, inputsto the discount rate are obtained from market data sources (e.g., Bloomberg). The Company selects and uses a set of publicly traded companiesfrom the relevant industry to estimate the discount rate inputs. Management applies judgment in the selection of such companies based on its viewof the most likely market participants. It is reasonably possible that the selection of a different set of likely market participants could produce differentinput assumptions and result in the use of a different discount rate.
Accounting for Derivative Instruments and Hedging Activities — We enter into various derivative transactions in order to hedge ourexposure to certain market risks. We primarily use derivative instruments to manage our interest rate, commodity and foreign currency exposures.We do not enter into derivative transactions for trading purposes. See Note 5 — Derivative Instruments and Hedging Activities included in Item 8 ofthis Form 10-K for further information on the classification.
The fair value measurement standard requires the Company to consider and reflect the assumptions of market participants in the fair valuecalculation. These factors include nonperformance risk (the risk that the obligation will not be fulfilled) and credit risk, both of the reporting entity (forliabilities) and of the counterparty (for assets). Due to the nature of the Company's interest rate swaps, which are typically associated with non-recourse debt, credit risk for AES is evaluated at the subsidiary level rather than at the Parent Company level. Nonperformance risk on theCompany's derivative instruments is an adjustment to the initial asset/liability fair value position that is derived from internally developed valuationmodels that utilize observable market inputs.
As a result of uncertainty, complexity and judgment, accounting estimates related to derivative accounting could result in material changes toour financial statements under different conditions or utilizing different
101

assumptions. As a part of accounting for these derivatives, we make estimates concerning nonperformance, volatilities, market liquidity, futurecommodity prices, interest rates, credit ratings (both ours and our counterparty's), and future exchange rates. Refer to Note 4 — Fair Value includedin Item 8 of this Form 10-K for additional details.
The fair value of our derivative portfolio is generally determined using internal and third party valuation models, most of which are based onobservable market inputs, including interest rate curves and forward and spot prices for currencies and commodities. The Company derives most ofits financial instrument market assumptions from market efficient data sources (e.g., Bloomberg, Reuters and Platt's). In some cases, where marketdata is not readily available, management uses comparable market sources and empirical evidence to derive market assumptions to determine afinancial instrument's fair value. In certain instances, the published curve may not extend through the remaining term of the contract andmanagement must make assumptions to extrapolate the curve. Specifically, where there is limited forward curve data with respect to foreignexchange contracts, beyond the traded points the Company utilizes the interest rate differential approach to construct the remaining portion of theforward curve. Additionally, in the absence of quoted prices, we may rely on "indicative pricing" quotes from financial institutions to input into ourvaluation model for certain of our foreign currency swaps. These indicative pricing quotes do not constitute either a bid or ask price and thereforeare not considered observable market data. For individual contracts, the use of different valuation models or assumptions could have a materialeffect on the calculated fair value.
Regulatory Assets — Management continually assesses whether the regulatory assets are probable of future recovery by considering factorssuch as applicable regulatory changes, recent rate orders applicable to other regulated entities and the status of any pending or potentialderegulation legislation. If future recovery of costs ceases to be probable, any asset write-offs would be required to be recognized in operatingincome.
Consolidation — The Company enters into transactions impacting the Company's equity interests in its affiliates. In connection with eachtransaction, the Company must determine whether the transaction impacts the Company's consolidation conclusion by first determining whether thetransaction should be evaluated under the variable interest model or the voting model. In determining which consolidation model applies to thetransaction, the Company is required to make judgments about how the entity operates, the most significant of which are whether (i) the entity hassufficient equity to finance its activities, (ii) the equity holders, as a group, have the characteristics of a controlling financial interest, and (iii) whetherthe entity has non-substantive voting rights.
If the entity is determined to be a variable interest entity, the most significant judgment in determining whether the Company must consolidatethe entity is whether the Company, including its related parties and de facto agents, collectively have power and benefits. If AES is determined tohave power and benefits, the entity will be consolidated by AES.
Alternatively, if the entity is determined to be a voting model entity, the most significant judgments involve determining whether the non-AESshareholders have substantive participating rights. The assessment of shareholder rights and whether they are substantive participating rightsrequires significant judgment since the rights provided under shareholders' agreements may include selecting, terminating, and setting thecompensation of management responsible for implementing the subsidiary's policies and procedures, establishing operating and capital decisions ofthe entity, including budgets, in the ordinary course of business. On the other hand, if shareholder rights are only protective in nature (referred to asprotective rights) then such rights would not overcome the presumption that the owner of a majority voting interest shall consolidate its investee.Significant judgment is required to determine whether minority rights represent substantive participating rights or protective rights that do not affectthe evaluation of control. While both represent an approval or veto right, a distinguishing factor is the underlying activity or action to which the rightrelates.
Pension and Other Postretirement Plans — The Company recognizes a net asset or liability reflecting the funded status of pension andother postretirement plans with current-year changes in actuarial gains or losses recognized in AOCL, except for those plans at certain of theCompany's regulated utilities that can recover portions of their pension and postretirement obligations through future rates. The valuation of theCompany's benefit obligation, fair value of plan assets, and net periodic benefit costs requires various estimates and assumptions, the mostsignificant of which include the discount rate and expected return on plan assets. These assumptions are reviewed by the Company on an annualbasis. Refer to Note 1 — General and Summary of Significant Accounting Policies included in Item 8 of this Form 10-K for further information.
New Accounting Pronouncements — See Note 1 — General and Summary of Significant Accounting Policies included in Item 8 of this Form10-K for further information about new accounting pronouncements adopted during 2017 and accounting pronouncements issued but not yeteffective.
102

ITEM 7A. QUANTITATIVE AND QUALITATIVE DISCLOSURES ABOUT MARKET RISK
Overview Regarding Market Risks — Our businesses are exposed to and proactively manage market risk. Our primary market risk exposureis to the price of commodities, particularly electricity, oil, natural gas, coal and environmental credits. In addition, our businesses are also exposed tolower electricity prices due to increased competition, including from renewable sources such as wind and solar, as a result of lower costs of entryand lower variable costs. We operate in multiple countries and as such are subject to volatility in exchange rates at varying degrees at the subsidiarylevel and between our functional currency, the U.S. dollar, and currencies of the countries in which we operate. We are also exposed to interest ratefluctuations due to our issuance of debt and related financial instruments.
The disclosures presented in this Item 7A are based upon a number of assumptions; actual effects may differ. The safe harbor provided inSection 27A of the Securities Act of 1933 and Section 21E of the Securities Exchange Act of 1934 shall apply to the disclosures contained in thisItem 7A. For further information regarding market risk, see Item 1A.— Risk Factors , Our financial position and results of operations may fluctuatesignificantly due to fluctuations in currency exchange rates experienced at our foreign operations , Our businesses may incur substantial costs andliabilities and be exposed to price volatility as a result of risks associated with the electricity markets, which could have a material adverse effect onour financial performance, and We may not be adequately hedged against our exposure to changes in commodity prices or interest rates of this2017 Form 10-K.
Commodity Price Risk — Although we prefer to hedge our exposure to the impact of market fluctuations in the price of electricity, fuels andenvironmental credits, some of our generation businesses operate under short-term sales or under contract sales that leave an unhedged exposureon some of our capacity or through imperfect fuel pass-throughs. In our utility businesses, we may be exposed to commodity price movementsdepending on our excess or shortfall of generation relative to load obligations and sharing or pass-through mechanisms. These businesses subjectour operational results to the volatility of prices for electricity, fuels and environmental credits in competitive markets. We employ risk managementstrategies to hedge our financial performance against the effects of fluctuations in energy commodity prices. The implementation of these strategiescan involve the use of physical and financial commodity contracts, futures, swaps and options.
The portion of our sales and purchases that are not subject to such agreements or contracted businesses where indexation is not perfectlymatched to business drivers will be exposed to commodity price risk. When hedging the output of our generation assets, we utilize contract salesthat lock in the spread per MWh between variable costs and the price at which the electricity can be sold.
AES businesses will see changes in variable margin performance as global commodity prices shift. For 2018, we project pre-tax earningsexposure on a 10% move in commodity prices would be approximately $10 million for U.S. power (DPL), less than $5 million for natural gas, $5million for oil and $5 million for coal. Our estimates exclude correlation of oil with coal or natural gas. For example, a decline in oil or natural gasprices can be accompanied by a decline in coal price if commodity prices are correlated. In aggregate, the Company's downside exposure occurswith lower oil, lower natural gas, and higher coal prices. Exposures at individual businesses will change as new contracts or financial hedges areexecuted, and our sensitivity to changes in commodity prices generally increases in later years with reduced hedge levels at some of ourbusinesses.
Commodity prices affect our businesses differently depending on the local market characteristics and risk management strategies. Spot powerprices, contract indexation provisions and generation costs can be directly or indirectly affected by movements in the price of natural gas, oil andcoal. We have some natural offsets across our businesses such that low commodity prices may benefit certain businesses and be a cost to others.Exposures are not perfectly linear or symmetric. The sensitivities are affected by a number of local or indirect market factors. Examples of thesefactors include hydrology, local energy market supply/demand balances, regional fuel supply issues, regional competition, bidding strategies andregulatory interventions such as price caps. Operational flexibility changes the shape of our sensitivities. For instance, certain power plants may limitdownside exposure by reducing dispatch in low market environments. Volume variation also affects our commodity exposure. The volume soldunder contracts or retail concessions can vary based on weather and economic conditions resulting in a higher or lower volume of sales in spotmarkets. Thermal unit availability and hydrology can affect the generation output available for sale and can affect the marginal unit setting powerprices.
In the US SBU, the generation businesses are largely contracted but may have residual risk to the extent contracts are not perfectly indexed tothe business drivers. IPL primarily generates energy to meet its retail customer demand; however, it opportunistically sells surplus economic energyinto wholesale markets at market prices. Additionally, at DPL, competitive retail markets permit our customers to select alternative energy suppliersor elect to remain in aggregated customer pools for which energy is supplied by third party suppliers through a
103

competitive auction process. DPL participates in these auctions held by other utilities and sells the remainder of its economic energy into thewholesale market. Given that natural gas-fired generators generally get energy prices for many markets, higher natural gas prices tend to expandour coal fixed margins. Our non-contracted generation margins are impacted by many factors, including the growth in natural gas-fired generationplants, new energy supply from renewable sources, and increasing energy efficiency.
In the Andes SBU, our business in Chile owns assets in the central and northern regions of the country and has a portfolio of contract sales inboth. In the central region, the contract sales generally cover the efficient generation from our coal-fired and hydroelectric assets. Any residual spotprice risk will primarily be driven by the amount of hydrological inflows. In the case of low hydroelectric generation, spot price exposure is capped bythe ability to dispatch our natural gas/diesel assets, the price of which depends on fuel pricing at the time required. There is a small amount of coalgeneration in the northern region that is not covered by the portfolio of contract sales and therefore subject to spot price risk. In both regions,generators with oil or oil-linked fuel generally set power prices. In Colombia, we operate under a short-term sales strategy and have commodityexposure to unhedged volumes. Because we own hydroelectric assets there, contracts are not indexed to fuel.
In the Brazil SBU, the hydroelectric generating facility is covered by contract sales. Under normal hydrological volatility, spot price risk ismitigated through a regulated sharing mechanism across all hydroelectric generators in the country. Under drier conditions, the sharing mechanismmay not be sufficient to cover the business' contract position, and therefore it may have to purchase power at spot prices driven by the cost ofthermal generation.
In the MCAC SBU, our businesses have commodity exposure on unhedged volumes. Panama is highly contracted under a portfolio of fixedvolume contract sales. To the extent hydrological inflows are greater than or less than the contract sales volume, the business will be sensitive tochanges in spot power prices which may be driven by oil prices in some time periods. In the Dominican Republic, we own natural gas-fired assetscontracted under a portfolio of contract sales and a coal-fired asset contracted with a single contract, and both contract and spot prices may movewith commodity prices. Additionally, the contract levels do not always match our generation availability and our assets may be sellers of spot pricesin excess of contract levels or a net buyer in the spot market to satisfy contract obligations.
In the Eurasia SBU, our Kilroot facility operates on a short-term sales strategy. To the extent that sales are unhedged, the commodity risk atour Kilroot business is to the clean dark spread, which is the difference between electricity price and our coal-based variable dispatch cost, includingemissions. Natural gas-fired generators set power prices for many periods, so higher natural gas prices generally expand margins and higher coal oremissions prices reduce them. Similarly, increased wind generators displace higher cost generation, reducing Kilroot's margins, and vice versa. Twocoal-fired generating units at Kilroot and one steam gas generating unit at Ballylumford are expected to close by the end of May 2018 as a result ofunfavorable capacity market conditions in Northern Ireland. The remaining steam gas generating unit at Ballylumford and the OCGTs at bothBallylumford and Kilroot will continue to operate as peaking units at times of high demand. Our Masinloc business is a coal-fired generation facilitywhich hedges its output under a portfolio of contract sales that are indexed to fuel prices, with generation in excess of contract volume or shortfallsof generation relative to contract volumes settled in the spot market. Low oil prices may be a driver of margin compression since oil affects spotpower sale prices sold in the spot market. Our Mong Duong business has minimal exposure to commodity price risk as it has no merchant exposureand fuel is subject to a pass-through mechanism.
Foreign Exchange Rate Risk — In the normal course of business, we are exposed to foreign currency risk and other foreign operations risksthat arise from investments in foreign subsidiaries and affiliates. A key component of these risks stems from the fact that some of our foreignsubsidiaries and affiliates utilize currencies other than our consolidated reporting currency, the U.S. dollar ("USD"). Additionally, certain of ourforeign subsidiaries and affiliates have entered into monetary obligations in USD or currencies other than their own functional currencies. We havevarying degrees of exposure to changes in the exchange rate between the USD and the following currencies: Argentine peso, British pound,Brazilian real, Chilean peso, Colombian peso, Dominican peso, Euro, Indian rupee, and Mexican peso. These subsidiaries and affiliates haveattempted to limit potential foreign exchange exposure by entering into revenue contracts that adjust to changes in foreign exchange rates. We alsouse foreign currency forwards, swaps and options, where possible, to manage our risk related to certain foreign currency fluctuations.
AES enters into cash flow hedges to protect economic value of the business and minimize impact of foreign exchange rate fluctuations to AES'portfolio. While protecting cash flows, the hedging strategy is also designed to reduce forward-looking earnings foreign exchange volatility. Due tovariation of timing and amount between cash distribution and earnings exposure, the hedge impact may not fully cover the earnings exposure on arealized basis, which could result in greater volatility in earnings. The largest foreign exchange risks over a 12-month forward-
104

looking period stem from the following currencies: Brazilian real, Euro, and British pound. As of December 31, 2017 , assuming a 10% USDappreciation, cash distributions attributable to foreign subsidiaries exposed to movement in the exchange rate of the Brazilian real, Euro, and Britishpound each is projected to be reduced by less than $5 million. These numbers have been produced by applying a one-time 10% USD appreciationto forecasted exposed cash distributions for 2018 coming from the respective subsidiaries exposed to the currencies listed above, net of the impactof outstanding hedges and holding all other variables constant. The numbers presented above are net of any transactional gains/losses. Thesesensitivities may change in the future as new hedges are executed or existing hedges are unwound. Additionally, updates to the forecasted cashdistributions exposed to foreign exchange risk may result in further modification. The sensitivities presented do not capture the impacts of anyadministrative market restrictions or currency inconvertibility.
Interest Rate Risks — We are exposed to risk resulting from changes in interest rates as a result of our issuance of variable and fixed-ratedebt, as well as interest rate swap, cap, floor and option agreements.
Decisions on the fixed-floating debt mix are made to be consistent with the risk factors faced by individual businesses or plants. Depending onwhether a plant's capacity payments or revenue stream is fixed or varies with inflation, we partially hedge against interest rate fluctuations byarranging fixed-rate or variable-rate financing. In certain cases, particularly for non-recourse financing, we execute interest rate swap, cap and flooragreements to effectively fix or limit the interest rate exposure on the underlying financing. Most of our interest rate risk is related to non-recoursefinancings at our businesses.
As of December 31, 2017 , the portfolio's pre-tax earnings exposure for 2018 to a one-time 100-basis-point increase in interest rates for ourArgentine peso, Brazilian real, Chilean peso, Colombian peso, Euro and USD denominated debt would be approximately $25 million on interestexpense for the debt denominated in these currencies. These amounts do not take into account the historical correlation between these interestrates.
105

ITEM 8. FINANCIAL STATEMENTS AND SUPPLEMENTARY DATA
REPORT OF INDEPENDENT REGISTERED PUBLIC ACCOUNTING FIRM
To the Stockholders and the Board of Directors of The AES Corporation:
Opinion on the Financial Statements
We have audited the accompanying consolidated balance sheets of The AES Corporation (the Company) as of December 31, 2017 and 2016 ,and the related consolidated statements of operations, comprehensive loss, changes in equity, and cash flows for each of the three years in theperiod ended December 31, 2017 , and the related notes and the financial statement schedule listed in the Index at Item 15(a) (collectively referredto as the “financial statements”). In our opinion, the financial statements referred to above present fairly, in all material respects, the consolidatedfinancial position of the Company at December 31, 2017 and 2016 , and the consolidated results of its operations and its cash flows for each of thethree years in the period ended December 31, 2017 , in conformity with U.S. generally accepted accounting principles.
We also have audited, in accordance with the standards of the Public Company Accounting Oversight Board (United States) (PCAOB), theCompany’s internal control over financial reporting as of December 31, 2017 , based on criteria established in Internal Control — IntegratedFramework issued by the Committee of Sponsoring Organizations of the Treadway Commission (2013 framework) and our report datedFebruary 26, 2018 , expressed an unqualified opinion thereon.
Basis for Opinion
These financial statements are the responsibility of the Company’s management. Our responsibility is to express an opinion on the Company’sfinancial statements based on our audits. We are a public accounting firm registered with the PCAOB and are required to be independent withrespect to the Company in accordance with the U.S. federal securities laws and the applicable rules and regulations of the Securities and ExchangeCommission and the PCAOB.
We conducted our audits in accordance with the standards of the PCAOB. Those standards require that we plan and perform the audit toobtain reasonable assurance about whether the financial statements are free of material misstatement, whether due to error or fraud. Our auditsincluded performing procedures to assess the risks of material misstatement of the financial statements, whether due to error or fraud, andperforming procedures that respond to those risks. Such procedures include examining, on a test basis, evidence regarding the amounts anddisclosures in the financial statements. Our audits also included evaluating the accounting principles used and significant estimates made bymanagement, as well as evaluating the overall presentation of the financial statements. We believe that our audits provide a reasonable basis forour opinion.
/s/ Ernst & Young LLP
We have served as the Company's auditor since 2008.
Tysons, VirginiaFebruary 26, 2018
106

THE AES CORPORATIONCONSOLIDATED BALANCE SHEETS
DECEMBER 31, 2017 AND 2016
2017 2016 (in millions, except share and per share data)
ASSETS CURRENT ASSETS
Cash and cash equivalents $ 949 $ 1,244Restricted cash 274 277Short-term investments 424 530Accounts receivable, net of allowance for doubtful accounts of $10 and $17, respectively 1,463 1,421Inventory 562 622Prepaid expenses 62 72Other current assets 630 657Current assets of discontinued operations and held-for-sale businesses 2,034 1,593
Total current assets 6,398 6,416NONCURRENT ASSETS Property, Plant and Equipment:
Land 502 518Electric generation, distribution assets and other 24,119 24,911Accumulated depreciation (7,942) (7,919)Construction in progress 3,617 2,905
Property, plant and equipment, net 20,296 20,415Other Assets:
Investments in and advances to affiliates 1,197 621Debt service reserves and other deposits 565 438Goodwill 1,059 1,157Other intangible assets, net of accumulated amortization of $441 and $399, respectively 366 287Deferred income taxes 130 227Service concession assets, net of accumulated amortization of $206 and $114, respective ly 1,360 1,445Other noncurrent assets 1,741 1,775Noncurrent assets of discontinued operations and held-for-sale businesses — 3,343
Total other assets 6,418 9,293TOTAL ASSETS $ 33,112 $ 36,124
LIABILITIES AND EQUITY CURRENT LIABILITIES
Accounts payable $ 1,371 $ 1,238Accrued interest 228 216Accrued and other liabilities 1,232 1,117Non-recourse debt, including $1,012 and $273, respectively, related to variable interest entities 2,164 1,052Current liabilities of discontinued operations and held-for-sale businesses 1,033 1,654
Total current liabilities 6,028 5,277NONCURRENT LIABILITIES
Recourse debt 4,625 4,671Non-recourse debt, including $1,358 and $1,502 respectively, related to variable interest entities 13,176 13,731Deferred income taxes 1,006 804Pension and other postretirement liabilities 230 237Other noncurrent liabilities 2,365 2,327Noncurrent liabilities of discontinued operations and held-for-sale businesses — 2,595
Total noncurrent liabilities 21,402 24,365Commitments and Contingencies (see Notes 11 and 12)

Redeemable stock of subsidiaries 837 782EQUITY THE AES CORPORATION STOCKHOLDERS’ EQUITY
Common stock ($0.01 par value, 1,200,000,000 shares authorized; 816,312,913 issued and 660,388,128 outstanding atDecember 31, 2017 and 816,061,123 issued and 659,182,232 outstanding at December 31, 2016) 8 8Additional paid-in capital 8,501 8,592Accumulated deficit (2,276) (1,146)Accumulated other comprehensive loss (1,876) (2,756)Treasury stock, at cost (155,924,785 and 156,878,891 shares at December 31, 2017 and 2016, respectively) (1,892) (1,904)
Total AES Corporation stockholders’ equity 2,465 2,794NONCONTROLLING INTERESTS 2,380 2,906
Total equity 4,845 5,700TOTAL LIABILITIES AND EQUITY $ 33,112 $ 36,124
See Accompanying Notes to Consolidated Financial Statements.
107

THE AES CORPORATIONCONSOLIDATED STATEMENTS OF OPERATIONS
YEARS ENDED DECEMBER 31, 2017 , 2016 , AND 2015
2017 2016 2015 (in millions, except per share amounts)
Revenue: Regulated $ 3,109 $ 3,310 $ 3,240Non-Regulated 7,421 6,971 8,020
Total revenue 10,530 10,281 11,260Cost of Sales:
Regulated (2,656) (2,844) (3,074)Non-Regulated (5,410) (5,057) (5,523)
Total cost of sales (8,066) (7,901) (8,597)Operating margin 2,464 2,380 2,663General and administrative expenses (215) (194) (196)Interest expense (1,170) (1,134) (1,145)Interest income 244 245 256Loss on extinguishment of debt (68) (13) (182)Other expense (57) (79) (24)Other income 120 64 84Gain (loss) on disposal and sale of bus inesses (52) 29 29Goodwill impairment expense — — (317)Asset impairment expense (537) (1,096) (285)Foreign currency transaction gains (losses) 42 (15) 106INCOME FROM CONTINUING OPERATIONS BEFORE TAXES AND EQUITY IN EARNINGS OF AFFILIATES 771 187 989Income tax expense (990) (32) (412)Net equity in earnings of affiliates 71 36 105INCOME (LOSS) FROM CONTINUING OPE RATIONS (148) 191 682Income (loss) from operations of discontinued businesses, net of income tax benefit (expense) of $(21), $229, and $(5 3),
respectively (18) 151 80Net loss from disposal and impairments of discontinued businesses, net of income tax benefit of $0, $266, and $0, respectively (611) (1,119) —NET INCOME (LOSS) (777) (777) 762
Noncontrolling interests: Less: Income from continuing operations attributable to non controlling interests and redeemable stock of subsidiaries (359) (211) (364)Less: Income from discontinued operations attributable to noncontrolling interests (25) (142) (92)
NET INCOME (LOSS) ATTRIBUTABLE TO THE AES CORPORATION $ (1,161) $ (1,130) $ 306AMOUNTS ATTRIBUTABLE TO THE AES CORPORATION COMMON STOCKHOLDERS:
Income (loss) from continuing operations, net of tax $ (507) $ (20) $ 318Loss from discontinued operations, net of tax (654) (1,110) (12)NET INCOME (LOSS) ATTRIBUTABLE TO THE AES CORPORATION $ (1,161) $ (1,130) $ 306
BASIC EARNINGS PER SHARE:
Income (loss) from continuing operations attributable to The AES Corporation common stockholders, net of tax $ (0.77) $ (0.04) $ 0.46Loss from discontinued operations attributable to The AES Corporation common stockholders, net of tax (0.99) (1.68) (0.01)NET INCOME (LOSS) ATTRIBUTABLE TO THE AES CORPORATION COMMON STOCKHOLDERS $ (1.76) $ (1.72) $ 0.45
DILUTED EARNINGS PER SHARE:
Income (loss) from continuing operations attributable to The AES Corporation common stockholders, net of tax $ (0.77) $ (0.04) $ 0.46
Loss from discontinued operations attributable to The AES Corporation common stockholders, net of tax (0.99) (1.68) (0.02)NET INCOME (LOSS) ATTRIBUTABLE TO THE AES CORPORATION COMMON STOCKHOLDERS $ (1.76) $ (1.72) $ 0.44
DIVIDENDS DECLARED PER COMMON SHARE $ 0.49 $ 0.45 $ 0.41
See Accompanying Notes to Consolidated Financial Statements.
108

THE AES CORPORATIONCONSOLIDATED STATEMENTS OF COMPREHENSIVE LOSS
YEARS ENDED DECEMBER 31, 2017 , 2016 , AND 2015
2017 2016 2015 (in millions)NET INCOME (LOSS) $ (777) $ (777) $ 762
Foreign currency translation activity: Foreign currency translation adjustments, net of income tax benefit (expense) of $17, $1, and $1, respectively (9) 189 (1,019)Reclassification to earnings, net of $0 income tax for all periods 643 992 —
Total foreign currency translation adjustments 634 1,181 (1,019)Derivative activity:
Change in derivative fair value, net of income tax benefit (expense) of $10, $(7) and $16, respectively (12) 5 (57)Reclassification to earnings, net of income tax expense of $1, $8 and $11, respectively 50 37 66
Total change in fair value of derivatives 38 42 9Pension activity:
Change in pension adjustments due to prior service cost, net of income tax expense of $1, $6, and $0 respectively 2 11 1Change in pension adjustments due to net actuarial gain (loss) for the period, net of income tax benefit (expense) of $6,$106, and $(29), respectively (21) (208) 60Reclassification to earnings, net of income tax expense of $135, $3, and $9, respectively 266 10 16
Total pension adjustments 247 (187) 77OTHER COMPREHENSIVE INCOME (LOSS) 919 1,036 (933)COMPREHENSIVE INCOME (LOSS) 142 259 (171)Less: Comprehensive income attributable to noncontrolling interests (390) (262) (133)COMPREHENSIVE LOSS ATTRIBUTABLE TO THE AES CORPORATION $ (248) $ (3) $ (304)
See Accompanying Notes to Consolidated Financial Statements.
109

THE AES CORPORATIONCONSOLIDATED STATEMENTS OF CHANGES IN EQUITY
YEARS ENDED DECEMBER 31, 2017 , 2016 , AND 2015
THE AES CORPORATION STOCKHOLDERS Common Stock Treasury Stock Additional
Paid-InCapital
RetainedEarnings
(AccumulatedDeficit)
AccumulatedOther
ComprehensiveLoss Noncontrolling
Interests(in millions) Shares Amount Shares Amount Balance at December 31, 2014 814.5 $ 8 110.7 $ (1,371) $ 8,409 $ 512 $ (3,286) $ 3,053Net income — — — — — 306 — 456Total foreign currency translation adjustment, net of income tax — — — — — — (674) (345)Total change in derivative fair value, net of income tax — — — — — — 43 (34)Total pension adjustments, net of income tax — — — — — — 21 56Total other comprehensive loss (610) (323)Cumulative effect of a change in accounting principle — — — — — (18) 13 —Acquisition of a business (1)
— — — — — — — 15Disposition of businesses — — — — — — — (41)Distributions to noncontrolling interests — — — — (27) — — (383)Contributions from noncontrolling interests — — — — — — — 126Dividends declared on common stock — — — — — (280) — —Purchase of treasury stock — — 39.7 (482) — — — —Issuance and exercise of stock-based compensation benefit plans, net ofincome tax 1.3 — (1.4) 16 13 — — —Sale of subsidiary shares to noncontrolling interests — — — — 323 (377) — 119Balance at December 31, 2015 815.8 $ 8 149.0 $ (1,837) $ 8,718 $ 143 $ (3,883) $ 3,022Net income (loss) — — — — — (1,130) — 353Total foreign currency translation adjustment, net of income tax — — — — — — 1,109 72Total change in derivative fair value, net of income tax — — — — — — 30 12Total pension adjustments, net of income tax — — — — — — (12) (175)Total other comprehensive income (loss) 1,127 (91)Fair value adjustment (2)
— — — — 17 (4) — (17)Disposition of businesses — — — — — — — (2)Distributions to noncontrolling interests — — — — (10) — — (430)Contributions from noncontrolling interests — — — — — — — 60Dividends declared on common stock — — — — (226) (71) — —Purchase of treasury stock — — 8.7 (79) — — — —Issuance and exercise of stock-based compensation benefit plans, net ofincome tax 0.3 — (0.8) 12 11 — — —Sale of subsidiary shares to noncontrolling interests — — — — 84 (84) — 17Acquisition and reclassification of subsidiary shares from noncontrollinginterests — — — — (2) — — (17)
Less: Net loss attributable to redeemable stock of subsidiaries (3) — — — — — — — 11
Balance at December 31, 2016 816.1 $ 8 156.9 $ (1,904) $ 8,592 $ (1,146) $ (2,756) $ 2,906Net income (loss) — — — — — (1,161) — 384Total foreign currency translation adjustment, net of income tax — — — — — — 661 (27)Total change in derivative fair value, net of income tax — — — — — — 23 15Total pension adjustments, net of income tax — — — — — — 229 18Total other comprehensive income 913 6Cumulative effect of a change in accounting principle — — — — — 31 — —Fair value adjustment (2)
— — — — (25) — — —Disposition of businesses — — — — — — — (666)Distributions to noncontrolling interests — — — — — — — (426)Contributions from noncontrolling interests — — — — — — — 11Dividends declared on common stock — — — — (324) — — —Issuance and exercise of stock-based compensation benefit plans, net ofincome tax 0.2 — (1.0) 12 5 — — —Sale of subsidiary shares to noncontrolling interests — — — — 13 — 7 83Acquisition of subsidiary shares from noncontrolling interests — — — — 240 — (40) 68Less: Net loss attributable to redeemable stock of subsidiaries (3)
— — — — — — — 14

Balance at December 31, 2017 816.3 $ 8 155.9 $ (1,892) $ 8,501 $ (2,276) $ (1,876) $ 2,380
(1) Fair value of a tax equity partner's right to preferential returns recognized as a result of the acquisition of Solar Power PR, LLC, which was previously accounted for as an equity method investment.(2) Adjustment to the carrying amount of noncontrolling interest and redeemable stock of subsidiaries to fair value.(3) Net income attributable to noncontrolling interest of $398 million and net loss attributable to redeemable stock of subsidiaries of $14 million for the year ended December 31, 2017. Net income attributable to noncontrolling interest of $364million and net loss attributable to redeemable stock of subsidiaries of $11 million for the year ended December 31, 2016.
See Accompanying Notes to Consolidated Financial Statements
110

THE AES CORPORATIONCONSOLIDATED STATEMENTS OF CASH FLOWS
YEARS ENDED DECEMBER 31, 2017 , 2016 , AND 2015
2017 2016 2015OPERATING ACTIVITIES: (in millions)
Net income (loss) $ (777) $ (777) $ 762Adjustments to net income (loss):
Depreciation and amortization 1,169 1,176 1,144Loss (gain) on sales and disposals of bus inesses 52 (29) (29)Impairment expenses 537 1,098 602Deferred income taxes 672 (793) (50)Provisions for (reversals of) contingencies 34 48 (72)Loss on extinguishment of debt 68 20 186Loss on sale and disposal of assets 43 38 20Net loss from disposal and impairments of discontinued businesses 611 1,383 —Other 146 168 8
Changes in operating assets and liabilities: (Increase) decrease in accounts receivable (177) 237 (378)(Increase) decrease in inventory (28) 42 (26)(Increase) decrease in prepaid expenses and other current assets 107 870 655(Increase) decrease in other assets (295) (251) (1,305)Increase (decrease) in accounts payable and other current liabilities 163 (620) 31Increase (decrease) in income tax payables, net and other tax payables 53 (199) 53Increase (decrease) in other liabilities 111 473 533
Net cash provided by operating activities 2,489 2,884 2,134INVESTING ACTIVITIES:
Capital expenditures (2,177) (2,345) (2,308)Acquisitions of businesses, net of cash acquired, and equity method investments (625) (55) (17)Proceeds from the sale of businesses, net of cash sold, and equity method investments 108 631 138Sale of short-term investments 3,540 4,904 4,851Purchase of short-term investments (3,310) (5,151) (4,801)Increase in restricted cash, debt service reserves, and other assets (135) (61) (159)Contributions to equity investments (89) (6) (3)Other investing (61) (25) (67)Net cash used in investing activities (2,749) (2,108) (2,366)
FINANCING ACTIVITIES: Borrowings under the revolving credit facilities 2,156 1,465 959Repayments under the revolving credit facilities (1,742) (1,433) (937)Issuance of recourse debt 1,025 500 575Repayments of recourse debt (1,353) (808) (915)Issuance of non-recourse debt 3,222 2,978 4,248Repayments of non-recourse debt (2,360) (2,666) (3,312)Payments for financing fees (100) (105) (90)Distributions to noncontrolling interests (424) (476) (326)Contributions from noncontrolling interests and redeemable security holders 73 190 126Proceeds from the sale of redeemable stock of subsidiaries — 134 461Dividends paid on AES common stock (317) (290) (276)Payments for financed capital expenditures (179) (113) (150)Purchase of treasury stock — (79) (482)Proceeds from sales to noncontrolling interests, net of transaction costs 94 — 154Other financing (52) (44) (7)Net cash provided by (used in) financing activities 43 (747) 28Effect of exchange rate changes on cash 3 9 (52)

Decrease (increase) in cash of discontinued operations and held-for-sale businesses (81) (12) 25Total increase (decrease) in cash and cash equivalents (295) 26 (231)Cash and cash equivalents, beginning 1,244 1,218 1,449Cash and cash equivalents, ending $ 949 $ 1,244 $ 1,218
SUPPLEMENTAL DISCLOSURES: Cash payments for interest, net of amounts capitalized $ 1,196 $ 1,273 $ 1,265Cash payments for income taxes, net of refunds $ 377 $ 487 $ 388
SCHEDULE OF NONCASH INVESTING AND FINANCING ACTIVITIES: Assets acquired through capital lease and other liabilities $ — $ 5 $ 18Dividends declared but not yet paid $ 86 $ 174 $ 135Conversion of Alto Maipo loans and accounts payable into equity (see Note 14— Equity ) $ 279 $ — $ —Return Share Transfer Payment due (see Note 22— Held-for-Sale Businesses and Dispositions ) $ 75 $ — $ —
See Accompanying Notes to Consolidated Financial Statements.
111

THE AES CORPORATIONNOTES TO CONSOLIDATED FINANCIAL STATEMENTS
DECEMBER 31, 2017, 2016, AND 2015
1 . GENERAL AND SUMMARY OF SIGNIFICANT ACCOUNTING POLICIESThe AES Corporation is a holding company (the "Parent Company") that, through its subsidiaries and affiliates, (collectively, "AES" or "the
Company") operates a geographically diversified portfolio of electricity generation and distribution businesses. Generally, the liabilities of individualoperating entities are non-recourse to the Parent Company and are isolated to the operating entities. Most of our operating entities are structured aslimited liability entities, which limit the liability of shareholders. The structure is generally the same regardless of whether a subsidiary is consolidatedunder a voting or variable interest model. The preparation of these consolidated financial statements is in conformity with accounting principlesgenerally accepted in the United States of America ("US GAAP").
PRINCIPLES OF CONSOLIDATION — The consolidated financial statements of the Company include the accounts of The AES Corporationand its controlled subsidiaries. Furthermore, VIEs in which the Company has an ownership interest and is the primary beneficiary, thus controllingthe VIE, have been consolidated. Intercompany transactions and balances are eliminated in consolidation. Investments in entities where theCompany has the ability to exercise significant influence, but not control, are accounted for using the equity method of accounting.
NONCONTROLLING INTERESTS — Noncontrolling interests are classified as a separate component of equity in the Consolidated BalanceSheets and Consolidated Statements of Changes in Equity. Additionally, net income and comprehensive income attributable to noncontrollinginterests are reflected separately from consolidated net income and comprehensive income on the Consolidated Statements of Operations andConsolidated Statements of Changes in Equity. Any change in ownership of a subsidiary while the controlling financial interest is retained isaccounted for as an equity transaction between the controlling and noncontrolling interests (unless the transaction qualifies as a sale of in-substancereal estate). Losses continue to be attributed to the noncontrolling interests, even when the noncontrolling interests' basis has been reduced to zero.
Equity securities with redemption features that are not solely within the control of the issuer are classified outside of permanent equity. Generally, initial measurement will be at fair value. Subsequent measurement and classification vary depending on whether the instrument isprobable of becoming redeemable. Where the equity instrument is not probable of becoming redeemable subsequent allocation of income anddividends is classified in permanent equity. For those securities where it is probable that the instrument will become redeemable or that are currentlyredeemable, AES recognizes changes in the fair value at each accounting period against retained earnings subject to the floor of the initial fairvalue. Further, the allocation of income and dividends, as well as the adjustment to fair value, is classified outside permanent equity. Amounts thatare mandatory redeemable are classified as a liability.
EQUITY METHOD INVESTMENTS — Investments in entities over which the Company has the ability to exercise significant influence, but notcontrol, are accounted for using the equity method of accounting and reported in Investments in and advances to affiliates on the ConsolidatedBalance Sheets. The Company’s proportionate share of the net income or loss of these companies is included in our results of operations.
The Company utilizes the cumulative earning approach to determine whether distributions received from equity method investees are returnson investment or returns of investment. The Company discontinues the application of the equity method when an investment is reduced to zero andthe Company is not otherwise committed to provide further financial support to the investee. The Company resumes the application of the equitymethod accounting to the extent that net income is greater than the share of net losses not previously recorded.
Upon acquiring the investment, we determine the fair value of the identifiable assets and assumed liabilities and the basis difference betweeneach fair value and the carrying amount of the corresponding asset or liability in the financial statements of the investee. The AES share of theamortization of the basis difference is recognized in our net equity in earnings of affiliates over the life of the asset or liability.
The Company periodically assesses if impairment indicators exist at our equity method investments. When an impairment is observed, anyexcess of the carrying amount over its estimated fair value is recognized as impairment expense when the loss in value is deemed other-than-temporary and included in Other non-operating expense in the Consolidated Statements of Operations.
ALLOCATION OF EARNINGS — Certain of the Company's businesses are subject to profit-sharing arrangements where the allocation ofcash distributions and the sharing of tax benefits are not based on fixed
112

THE AES CORPORATIONNOTES TO CONSOLIDATED FINANCIAL STATEMENTS—(Continued)
DECEMBER 31, 2017, 2016, AND 2015
ownership percentages. These arrangements exist for certain renewable generation partnerships to designate different allocations of value amonginvestors, where the allocations change in form or percentage over the life of the partnership. For these businesses, the Company uses thehypothetical liquidation at book value (“HLBV”) method when it is a reasonable approximation of the profit-sharing arrangement. The HLBV methodcalculates the proceeds that would be attributable to each partner based on the liquidation provisions of the respective operating partnershipagreement if the partnership was to be liquidated at book value at the balance sheet date. Each partner’s share of income in the period is equal tothe change in the amount of net equity they are legally able to claim based on a hypothetical liquidation of the entity at the end of a reporting periodcompared to the beginning of that period, adjusted for any capital transactions.
The HLBV method is used both to allocate the equity earnings attributable to AES when the Company accounts for the renewable business asan equity method investment and to calculate the earnings attributable to noncontrolling interest when the business is consolidated by AES. Where,prior to the commencement of operating activities for a respective renewable energy facility, HLBV results in an immediate decrease in thehypothetical liquidation proceeds attributable to the tax equity investor due to the recognition of ITCs or other adjustments as required by the U.S.Internal Revenue Code, the Company records the impact (sometimes referred to as the ‘Day one gain’) to income in the same period.
USE OF ESTIMATES — US GAAP requires the Company to make estimates and assumptions that affect the asset and liability balancesreported as of the date of the consolidated financial statements, as well as the revenues and expenses recognized during the reporting period.Actual results could differ from those estimates. Items subject to such estimates and assumptions include: the carrying amount and estimated usefullives of long-lived assets; asset retirement obligations; impairment of goodwill, long-lived assets and equity method investments; valuationallowances for receivables and deferred tax assets; the recoverability of regulatory assets; regulatory liabilities; the fair value of financialinstruments; the fair value of assets and liabilities acquired in a business combination; the measurement of equity method investments ornoncontrolling interest using the HLBV method for certain renewable generation partnerships; the determination of whether a sale of noncontrollinginterests is considered to be a sale of in-substance real estate (as opposed to an equity transaction); pension liabilities; environmental liabilities; theimpact of U.S. tax reform; and potential litigation claims and settlements.
HELD-FOR-SALE BUSINESSES — A business classified as held-for-sale is reflected on the balance sheet at the lower of its carrying amountor estimated fair value less cost to sell. A loss is recognized if the carrying amount of the business exceeds its estimated fair value less cost to sell.This loss is limited to the carrying value of long lived assets until the completion of the sale, at which point, any additional loss is recognized. If thefair value of the business subsequently exceeds the carrying amount while the business is still held-for-sale, any impairment expense previouslyrecognized will be reversed up to the lower of the previously recognized expense or the subsequent excess.
Assets and liabilities related to a business classified as held-for-sale are segregated in the current balance sheet in the period in which thebusiness is classified as held-for-sale. Assets and liabilities of held-for-sale businesses are classified as current when they are expected to bedisposed of within twelve months. Transactions between the business held-for-sale and businesses that are expected to continue to exist after thedisposal are not eliminated to appropriately reflect the continuing operations and balances held-for-sale. See Note 22 — Held-for-Sale Businessesand Dispositions for further information.
DISCONTINUED OPERATIONS — Discontinued operations reporting occurs only when the disposal of a business or a group of businessesrepresents a strategic shift that has (or will have) a major effect on the Company's operations and financial results. The Company reports financialresults for discontinued operations separately from continuing operations to distinguish the financial impact of disposal transactions from ongoingoperations. Prior period amounts in the statement of operations and balance sheet are retrospectively revised to reflect the businesses determinedto be discontinued operations. The cash flows of businesses that are determined to be discontinued operations are included within the relevantcategories within operating, investing and financing activities on the face of the Statements of Cash Flows.
Transactions between the businesses determined to be discontinued operations and businesses that are expected to continue to exist after thedisposal are not eliminated to appropriately reflect the continuing operations and balances held for sale. The results of discontinued operationsinclude any gain or loss recognized on closing or adjustment of the carrying amount to fair value less cost to sell, including gains or lossesassociated with
113

THE AES CORPORATIONNOTES TO CONSOLIDATED FINANCIAL STATEMENTS—(Continued)
DECEMBER 31, 2017, 2016, AND 2015
noncontrolling interests upon completion of the disposal transaction. See Note 21 — Discontinued Operations for further information.
RECLASSIFICATIONS — To comply with newly adopted accounting standards, certain prior period amounts in the consolidated financialstatements have been reclassified to conform to the current presentation. The recognition of excess tax benefits related to share-based paymentsresulted in a reclassification from Deferred income taxes to Retained earnings in the Consolidated Balance Sheet for the year ended December 31,2016. See further detail in the new accounting pronouncements discussion.
FAIR VALUE — Fair value is the price that would be received to sell an asset or paid to transfer a liability in an orderly, hypotheticaltransaction between market participants at the measurement date, or exit price. The Company applies the fair value measurement accountingguidance to financial assets and liabilities in determining the fair value of investments in marketable debt and equity securities, included in theConsolidated Balance Sheet line items Short-term investments and Other assets (noncurrent) ; derivative assets, included in Other current assetsand Other assets (noncurrent) ; and, derivative liabilities, included in Accrued and other liabilities (current) and Other long-term liabilities . TheCompany applies the fair value measurement guidance to nonfinancial assets and liabilities upon the acquisition of a business or in conjunction withthe measurement of an asset retirement obligation or a potential impairment loss on an asset group or goodwill.
When determining the fair value measurements for assets and liabilities required to be reflected at their fair values, the Company considers theprincipal or most advantageous market in which it would transact and considers assumptions that market participants would use when pricing theassets or liabilities, such as inherent risk, transfer restrictions and risk of nonperformance. The Company is prohibited from including transactioncosts and any adjustments for blockage factors in determining fair value.
In determining fair value measurements, the Company maximizes the use of observable inputs and minimizes the use of unobservable inputs.Assets and liabilities are categorized within a fair value hierarchy based upon the lowest level of input that is significant to the fair valuemeasurement:
• Level 1: Quoted prices in active markets for identical assets or liabilities• Level 2: Inputs other than Level 1 that are observable, either directly or indirectly, such as quoted prices in active markets for similar assets or
liabilities, quoted prices for identical or similar assets or liabilities in markets that are not active or other inputs that are observable or can becorroborated by observable market data for substantially the full term of the assets or liabilities; or
• Level 3: Unobservable inputs that are supported by little or no market activity and that are significant to the fair values of the assets or liabilities
Any transfers between all levels within the fair value hierarchy levels are recognized at the end of the reporting period.
CASH AND CASH EQUIVALENTS — The Company considers unrestricted cash on hand, cash balances not restricted as to withdrawal orusage, deposits in banks, certificates of deposit and short-term marketable securities with original maturities of three months or less to be cash andcash equivalents.
RESTRICTED CASH AND DEBT SERVICE RESERVES — Cash balances restricted as to withdrawal or usage, primarily via contract, areconsidered restricted cash.
INVESTMENTS IN MARKETABLE SECURITIES — The Company's marketable investments are primarily unsecured debentures, certificatesof deposit, government debt securities and money market funds.
Short-term investments consist of marketable equity securities and debt securities with original maturities in excess of three months withremaining maturities of less than one year. Marketable debt securities where the Company has both the positive intent and ability to hold to maturityare classified as held-to-maturity and are carried at amortized cost. Remaining marketable securities are classified as available-for-sale or tradingand are carried at fair value.
Available-for-sale and trading investment's unrealized gains or losses are reflected in AOCL, a separate component of equity, and theConsolidated Statements of Operations, respectively .. Interest and dividends on investments are reported in interest income and other income ,respectively. Gains and losses on sales of investments are determined using the specific identification method.
114

THE AES CORPORATIONNOTES TO CONSOLIDATED FINANCIAL STATEMENTS—(Continued)
DECEMBER 31, 2017, 2016, AND 2015
ACCOUNTS AND NOTES RECEIVABLE AND ALLOWANCE FOR DOUBTFUL ACCOUNTS — Accounts and notes receivable are carriedat amortized cost. The Company periodically assesses the collectability of accounts receivable, considering factors such as historical collectionexperience, the age of accounts receivable and other currently available evidence supporting collectability, and records an allowance for doubtfulaccounts for the estimated uncollectible amount as appropriate. Certain of our businesses charge interest on accounts receivable. Interest income isrecognized on an accrual basis. When collection of such interest is not reasonably assured, interest income is recognized as cash is received.Individual accounts and notes receivable are written off when they are no longer deemed collectible.
INVENTORY — Inventory primarily consists of fuel and other raw materials used to generate power, and operational spare parts and suppliesused to maintain power generation and distribution facilities. Inventory is carried at lower of cost or net realizable value. Cost is the sum of thepurchase price and expenditures incurred to bring the inventory to its existing location. Inventory is primarily valued using the average cost method.Generally, if it is expected fuel inventory will not be recovered through revenue earned from power generation, an impairment is recognized to reflectthe fuel at market value. The carrying amount of spare parts and supplies is typically reduced only in instances where the items are consideredobsolete.
LONG-LIVED ASSETS — Long-lived assets include property, plant and equipment, assets under capital leases and intangible assets subjectto amortization (i.e., finite-lived intangible assets).
Property, plant and equipment — Property, plant and equipment are stated at cost, net of accumulated depreciation. The cost of renewals andimprovements that extend the useful life of property, plant and equipment are capitalized.
Construction progress payments, engineering costs, insurance costs, salaries, interest and other costs directly relating to construction inprogress are capitalized during the construction period, provided the completion of the construction project is deemed probable, or expensed at thetime construction completion is determined to no longer be probable. The continued capitalization of such costs is subject to risks related tosuccessful completion, including those related to government approvals, site identification, financing, construction permitting and contractcompliance. Construction-in-progress balances are transferred to electric generation and distribution assets when an asset group is ready for itsintended use. Government subsidies, liquidated damages recovered for construction delays, and income tax credits are recorded as a reduction toproperty, plant and equipment and reflected in cash flows from investing activities. Maintenance and repairs are charged to expense as incurred.
Depreciation, after consideration of salvage value and asset retirement obligations, is computed using the straight-line method over theestimated useful lives of the assets, which are determined on a composite or component basis. Capital spare parts, including rotable spare parts,are included in electric generation and distribution assets. If the spare part is considered a component, it is depreciated over its useful life after thepart is placed in service. If the spare part is deemed part of a composite asset, the part is depreciated over the composite useful life even whenbeing held as a spare part.
The Company's Brazilian subsidiaries operate under concession contracts. Certain estimates are utilized to determine depreciation expensefor the Brazilian subsidiaries, including the useful lives of the property, plant and equipment and the amounts to be recovered at the end of theconcession contract. The amounts to be recovered under these concession contracts are based on estimates that are inherently uncertain andactual amounts recovered may differ from those estimates. These concession contracts are not within the scope of ASC 853— Service ConcessionArrangements .
Intangible Assets Subject to Amortization — Finite-lived intangible assets are amortized over their useful lives which range from 3 – 50 years.The Company accounts for purchased emission allowances as intangible assets and records an expense when they are utilized or sold. Grantedemission allowances are valued at zero.
115

THE AES CORPORATIONNOTES TO CONSOLIDATED FINANCIAL STATEMENTS—(Continued)
DECEMBER 31, 2017, 2016, AND 2015
Impairment of Long-lived Assets — When circumstances indicate the carrying amount of long-lived assets in a held-for-use asset group maynot be recoverable, the Company evaluates the assets for potential impairment using internal projections of undiscounted cash flows resulting fromthe use and eventual disposal of the assets. Events or changes in circumstances that may necessitate a recoverability evaluation include, but arenot limited to, adverse changes in the regulatory environment, unfavorable changes in power prices or fuel costs, increased competition due toadditional capacity in the grid, technological advancements, declining trends in demand, or an expectation it is more likely than not that the asset willbe disposed of before the end of its previously estimated useful life. If the carrying amount of the assets exceeds the undiscounted cash flows, animpairment expense is recognized for the amount by which the carrying amount of the asset group exceeds its fair value (subject to the carryingamount not being reduced below fair value for any individual long-lived asset that is determinable without undue cost and effort). An impairmentexpense for certain assets may be reduced by the establishment of a regulatory asset if recovery through approved rates is probable.
SERVICE CONCESSION ASSETS — Service concession assets are stated at cost, net of accumulated amortization, in accordance with ASC853. Service concession assets represent the cost of all infrastructure to be transferred to the public-sector entity grantors at the end of theconcession. These costs primarily represent construction progress payments, engineering costs, insurance costs, salaries, interest and other costsdirectly relating to construction of the service concession infrastructure. Government subsidies, liquidated damages recovered for constructiondelays and income tax credits are recorded as a reduction to Service Concession Assets. Service concession assets are amortized and recognizedin earnings as a cost of goods sold as infrastructure construction revenue is recognized. Services provided under concession arrangements arerecognized on a straight line basis.
DEBT ISSUANCE COSTS — Costs incurred in connection with the issuance of long-term debt are deferred and presented as a directreduction from the face amount of that debt and amortized over the related financing period using the effective interest method. Debt issuance costsrelated to a line-of-credit or revolving credit facility are deferred and presented as an asset and amortized over the related financing period. Make-whole payments in connection with early debt retirements are classified as cash flows used in financing activities.
GOODWILL AND INDEFINITE-LIVED INTANGIBLE ASSETS — The Company evaluates goodwill and indefinite-lived intangible assets forimpairment on an annual basis and whenever events or changes in circumstances necessitate an evaluation for impairment. The Company's annualimpairment testing date is October first.
Goodwill — Goodwill represents the excess of the purchase price of the business acquisition over the fair value of identifiable net assetsacquired. Goodwill resulting from an acquisition is assigned to the reporting units that are expected to benefit from the synergies of the acquisition.Generally, each AES business with a goodwill balance constitutes a reporting unit as they are not similar to other businesses in a segment nor arethey reported to segment management together with other businesses.
Goodwill is evaluated for impairment either under the qualitative assessment option or the two-step quantitative test. If goodwill is determinedto be impaired, the fair value of individual assets and liabilities is determined to compute the implied fair value of goodwill. If the carrying amount ofgoodwill exceeds its implied fair value, the excess is recognized as an impairment loss up to the carrying amount of the goodwill.
Indefinite-Lived Intangible Assets — The Company's indefinite-lived intangible assets primarily include land-use rights and water rights.Indefinite-lived Intangible Assets are evaluated for impairment either under the qualitative assessment option or the two-step quantitative test. If thecarrying amount of an intangible asset being tested for impairment exceeds its fair value, the excess is recognized as impairment expense.
ACCOUNTS PAYABLE AND OTHER ACCRUED LIABILITIES — Accounts payable consists of amounts due to trade creditors related to theCompany's core business operations. These payables include amounts owed to vendors and suppliers for items such as energy purchased forresale, fuel, maintenance, inventory and other raw materials. Other accrued liabilities include items such as income taxes, regulatory liabilities, legalcontingencies and employee-related costs, including payroll, benefits and related taxes.
REGULATORY ASSETS AND LIABILITIES — The Company recognizes assets and liabilities that result from regulated ratemakingprocesses. Regulatory assets generally represent incurred costs which have been deferred due to the probable future recovery via customer rates.Generally, returns earned on regulatory assets are reflected in the Consolidated Statement of Operations within Interest Income . Regulatoryliabilities generally represent
116

THE AES CORPORATIONNOTES TO CONSOLIDATED FINANCIAL STATEMENTS—(Continued)
DECEMBER 31, 2017, 2016, AND 2015
obligations to refund customers. Management continually assesses whether regulatory assets are probable of future recovery and regulatoryliabilities are probable of future payment by considering factors such as applicable regulatory changes, recent rate orders applicable to otherregulated entities, and the status of any pending or potential deregulation legislation. If future recovery of costs previously deferred ceases to beprobable, the related regulatory assets are written off and recognized in income from continuing operations.
PENSION AND OTHER POSTRETIREMENT PLANS — The Company recognizes in its Consolidated Balance Sheets an asset or liabilityreflecting the funded status of pension and other postretirement plans with current-year changes in actuarial gains or losses recognized in AOCL,except for those plans at certain of the Company's regulated utilities that can recover portions of their pension and postretirement obligationsthrough future rates. All plan assets are recorded at fair value. AES follows the measurement date provisions of the accounting guidance, whichrequire a year-end measurement date of plan assets and obligations for all defined benefit plans.
INCOME TAXES — Deferred tax assets and liabilities are recognized for the future tax consequences attributable to differences between thefinancial statement carrying amounts of the existing assets and liabilities, and their respective income tax bases. The Company establishes avaluation allowance when it is more likely than not that all or a portion of a deferred tax asset will not be realized. The Company's tax positions areevaluated under a more likely than not recognition threshold and measurement analysis before they are recognized for financial statement reporting.
Uncertain tax positions have been classified as noncurrent income tax liabilities unless expected to be paid within one year. The Company'spolicy for interest and penalties related to income tax exposures is to recognize interest and penalties as a component of the provision for incometaxes in the Consolidated Statements of Operations.
The Company has not yet determined its accounting policy election, as outlined by SAB 118, with respect to the new GILTI provisions of U.S.tax reform, applicable from January 1, 2018. See Note 20 — Income Taxes for additional discussion regarding the U.S. tax reform.
ASSET RETIREMENT OBLIGATIONS — The Company records the fair value of a liability for a legal obligation to retire an asset in the periodin which the obligation is incurred. When a new liability is recognized, the Company capitalizes the costs of the liability by increasing the carryingamount of the related long-lived asset. The liability is accreted to its present value each period and the capitalized cost is depreciated over the usefullife of the related asset. Upon settlement of the obligation, the Company eliminates the liability and, based on the actual cost to retire, may incur again or loss.
FOREIGN CURRENCY TRANSLATION — A business's functional currency is the currency of the primary economic environment in which thebusiness operates and is generally the currency in which the business generates and expends cash. Subsidiaries and affiliates whose functionalcurrency is a currency other than the U.S. dollar translate their assets and liabilities into U.S. dollars at the current exchange rates in effect at theend of the fiscal period. Adjustments arising from the translation of the balance sheet of such subsidiaries are included in AOCL. The revenue andexpense accounts of such subsidiaries and affiliates are translated into U.S. dollars at the average exchange rates for the period. Gains and losseson intercompany foreign currency transactions that are long-term in nature and which the Company does not intend to settle in the foreseeablefuture, are also recognized in AOCL. Gains and losses that arise from exchange rate fluctuations on transactions denominated in a currency otherthan the functional currency are included in determining net income. Accumulated foreign currency translation adjustments are reclassified fromAOCL to net income only when realized upon sale or upon complete or substantially complete liquidation of the investment in a foreign entity. Theaccumulated adjustments are included in carrying amounts in impairment assessments where the Company has committed to a plan that will causethe accumulated adjustments to be reclassified to earnings.
REVENUE RECOGNITION — Revenue from utilities is classified as regulated in the Consolidated Statements of Operations. Revenue fromthe sale of energy is recognized in the period during which the sale occurs. The calculation of revenue earned but not yet billed is based on thenumber of days not billed in the month, the estimated amount of energy delivered during those days and the estimated average price per customerclass for that month. Differences between actual and estimated unbilled revenue are usually immaterial. The Company has businesses where it sellsand purchases power to and from ISOs and RTOs. In those instances, the Company accounts for these transactions on a net hourly basis becausethe transactions are settled on a net hourly basis.
117

THE AES CORPORATIONNOTES TO CONSOLIDATED FINANCIAL STATEMENTS—(Continued)
DECEMBER 31, 2017, 2016, AND 2015
Revenue from generation businesses is classified as non-regulated in the Consolidated Statements of Operations. Revenue is recognizedbased upon output delivered and capacity provided, at rates as specified under contract terms or prevailing market rates. Certain of the Company'sPPAs meet the definition of an operating lease or contain similar arrangements. Typically, minimum lease payments from such PPAs are recognizedas revenue on a straight-line basis over the lease term whereas contingent rentals are recognized when earned. Revenue is recorded net of anytaxes assessed on and collected from customers, which are remitted to the governmental authorities.
SHARE-BASED COMPENSATION — The Company grants share-based compensation in the form of stock options, restricted stock units,performance stock units, and performance cash units. The expense is based on the grant-date fair value of the equity or liability instrument issuedand is recognized on a straight-line basis over the requisite service period, net of estimated forfeitures. The Company uses a Black-Scholes optionpricing model to estimate the fair value of stock options granted to its employees.
GENERAL AND ADMINISTRATIVE EXPENSES — General and administrative expenses include corporate and other expenses related tocorporate staff functions and initiatives, primarily executive management, finance, legal, human resources and information systems, which are notdirectly allocable to our business segments. Additionally, all costs associated with corporate business development efforts are classified as generaland administrative expenses.
DERIVATIVES AND HEDGING ACTIVITIES — Under the accounting standards for derivatives and hedging, the Company recognizes allcontracts that meet the definition of a derivative, except those designated as normal purchase or normal sale at inception, as either assets orliabilities in the Consolidated Balance Sheets and measures those instruments at fair value. See the Company's fair value policy and Note 4— FairValue and Fair value in this section for additional discussion regarding the determination of fair value.
PPAs and fuel supply agreements are evaluated to assess if they contain either a derivative or an embedded derivative requiring separatevaluation and accounting. Generally, these agreements do not meet the definition of a derivative, often due to the inability to be net settled. On aquarterly basis, we evaluate the markets for commodities to be delivered under these agreements to determine if facts and circumstances havechanged such that the agreements could be net settled and meet the definition of a derivative.
The Company typically designates its derivative instruments as cash flow hedges if they meet the criteria specified in ASC 815, Derivatives andHedging . The Company enters into interest rate swap agreements in order to hedge the variability of expected future cash interest payments.Foreign currency contracts are used to reduce risks arising from the change in fair value of certain foreign currency denominated assets andliabilities. The objective of these practices is to minimize the impact of foreign currency fluctuations on operating results. The Company also entersinto commodity contracts to economically hedge price variability inherent in electricity sales arrangements. The objectives of the commoditycontracts are to minimize the impact of variability in spot electricity prices and stabilize estimated revenue streams. The Company does not usederivative instruments for speculative purposes.
For our hedges, changes in fair value that are considered highly effective are deferred in AOCL and are recognized into earnings as thehedged transactions affect earnings. Any ineffectiveness is recognized in earnings immediately. If a derivative is no longer highly effective, hedgeaccounting will be discontinued prospectively. For cash flow hedges of forecasted transactions, AES estimates the future cash flows of theforecasted transactions and evaluates the probability of the occurrence and timing of such transactions.
Changes in the fair value of derivatives not designated and qualifying as cash flow hedges are immediately recognized in earnings. Regardlessof when gains or losses on derivatives are recognized in earnings, they are generally classified as interest expense for interest rate and cross-currency derivatives, foreign currency transaction gains or losses for foreign currency derivatives, and non-regulated revenue or non-regulated costof sales for commodity and other derivatives. Cash flows arising from derivatives are included in the Consolidated Statements of Cash Flows as anoperating activity given the nature of the underlying risk being economically hedged and the lack of significant financing elements, except that cashflows on designated and qualifying hedges of variable-rate interest during construction are classified as an investing activity. The Company haselected not to offset net derivative positions in the financial statements.
NEW ACCOUNTING PRONOUNCEMENTS — The following table provides a brief description of recent accounting pronouncements that hadand/or could have a material impact on the Company’s consolidated financial statements. Accounting pronouncements not listed below wereassessed and determined to be either not applicable
118

THE AES CORPORATIONNOTES TO CONSOLIDATED FINANCIAL STATEMENTS—(Continued)
DECEMBER 31, 2017, 2016, AND 2015
or are expected to have no material impact on the Company’s consolidated financial statements.
New Accounting Standards Adopted
ASU Number and Name Description Date of AdoptionEffect on the financial statements
upon adoption
2016-09, Compensation — StockCompensation (Topic 718):Improvements to EmployeeShare-Based PaymentAccounting
The standard simplifies the following aspects of accounting for share-basedpayments awards: accounting for income taxes, classification of excess taxbenefits on the statement of cash flows, forfeitures, statutory tax withholdingrequirements, classification of awards as either equity or liabilities and classificationof employee taxes paid on statement of cash flows when an employer withholdsshares for tax-withholding purposes. Transition method: The recognition of excess tax benefits and tax deficienciesarising from vesting or settlement were applied retrospectively. The elimination ofthe requirement that excess tax benefits be realized before they are recognizedwas adopted on a modified retrospective basis.
January 1, 2017 The recognition of excess taxbenefits in the provision forincome taxes in the period whenthe awards vest or are settled,rather than in paid-in-capital inthe period when the excess taxbenefits are realized, resulted ina decrease of $31 million todeferred tax liabilities, offset byan increase to retainedearnings.
New Accounting Standards Issued But Not Yet Effective
ASU Number and Name Description Date of AdoptionEffect on the financial statements
upon adoption
2018-02, Income Statement —Reporting Comprehensive Income(Topic 220), Reclassification ofCertain Tax Effects from AOCI
This amendment allows a reclassification of the stranded tax effects resulting fromthe implementation of the Tax Cuts and Jobs Act from AOCI to retained earnings.Because this amendment only relates to the reclassification of the income taxeffects of the Tax Cuts and Jobs Act, the underlying guidance that requires that theeffect of a change in tax laws or rates be included in income from continuingoperations is not affected.
January 1, 2019.Early adoption is
permitted.
The Company is currentlyevaluating the impact ofadopting the standard on itsconsolidated financialstatements.
2017-12, Derivatives and Hedging(Topic 815): Targetedimprovements to Accounting forHedging Activities
The standard updates the hedge accounting model to expand the ability to hedgenonfinancial and financial risk components, reduce complexity, and ease certaindocumentation and assessment requirements. When facts and circumstances arethe same as at the previous quantitative test, a subsequent quantitativeeffectiveness test is not required. The standard also eliminates the requirement toseparately measure and report hedge ineffectiveness. For cash flow hedges, thismeans that the entire change in the fair value of a hedging instrument will berecorded in other comprehensive income and amounts deferred will be reclassifiedto earnings in the same income statement line as the hedged item.Transition method: modified retrospective with the cumulative effect adjustmentrecorded to the opening balance of retained earnings as of the initial applicationdate. Prospective for presentation and disclosures.
January 1, 2019.Early adoption is
permitted.
The Company is currentlyevaluating the impact ofadopting the standard on itsconsolidated financialstatements.
2017-11, Earnings Per Share(Topic 260); DistinguishingLiabilities from Equity (Topic 480);Derivatives and Hedging (Topic815): Accounting for CertainFinancial Instruments and CertainMandatorily RedeemableNoncontrolling Interests
Part 1 of this standard changes the classification of certain equity-linked financialinstruments when assessing whether the instrument is indexed to an entity’s ownstock. Transition method: retrospective.
January 1, 2019.Early adoption is
permitted.
The Company is currentlyevaluating the impact ofadopting the standard on itsconsolidated financialstatements.
2017-08, Receivables —Nonrefundable Fees and OtherCosts (Subtopic 310-20):Premium Amortization onPurchased Callable DebtSecurities
This standard shortens the period of amortization for the premium on certaincallable debt securities to the earliest call date. Transition method: modified retrospective.
January 1, 2019.Early adoption is
permitted.
The Company is currentlyevaluating the impact ofadopting the standard on itsconsolidated financialstatements.
2017-05, Other Income — Gainsand Losses from theDerecognition of NonfinancialAssets (Topic 610-20)
This standard clarifies the scope and application of ASC 610-20 on the sale,transfer, and derecognition of nonfinancial assets and in substance nonfinancialassets to non-customers, including partial sales. It also clarifies that thederecognition of businesses is under scope of ASC 810. The standard must beadopted concurrently with ASC 606, however an entity will not have to apply thesame transition method as ASC 606. Transition method: full or modified retrospective.
Under a modified retrospective approach, the guidance shall be applied to allcontracts that are not completed as of the initial application date (January 1, 2018).The Company has identified contracts executed during Q4 2017 that would not becompleted as of this date and is in the process of assessing those under the newstandard. However, no adjustment is expected as of the initial application date.
January 1, 2018.Early adoption is
permitted only as ofJanuary 1, 2017.
The Company does not expectany impact on its consolidatedfinancial statements uponadoption of the standard, willadopt the standard on January1, 2018, and plans to use themodified retrospectiveapproach.
119

THE AES CORPORATIONNOTES TO CONSOLIDATED FINANCIAL STATEMENTS—(Continued)
DECEMBER 31, 2017, 2016, AND 2015
2017-04, Intangibles — Goodwilland Other (Topic 350): Simplifyingthe Test for Goodwill Impairment
This standard simplifies the accounting for goodwill impairment by removing therequirement to calculate the implied fair value. Instead, it requires that an entityrecords an impairment charge based on the excess of a reporting unit's carryingamount over its fair value. Transition method: prospective.
January 1, 2020.Early adoption ispermitted as of
January 1, 2017.
The Company is currentlyevaluating the impact ofadopting the standard on itsconsolidated financialstatements.
2017-01, Business Combinations(Topic 805): Clarifying theDefinition of a Business
The standard requires an entity to first evaluate whether substantially all of the fairvalue of the gross assets acquired is concentrated in a single identifiable asset or agroup of similar identifiable assets, and if that threshold is met, the set is not abusiness. As a second step, to be considered a business at least one substantiveprocess should exist. The revised definition of a business will reduce the number oftransactions that are accounted for as business combinations.Transition Method: prospective.
January 1, 2018.Early adoption is
permitted.
This revised definition willreduce the number oftransactions that are accountedfor as a business, therefore,acquisitions and dispositionwould fall under a differentaccounting model.
2016-18, Statement of CashFlows (Topic 230): RestrictedCash (a consensus of the FASBEmerging Issues Task Force)
This standard requires that a statement of cash flows explain the change during theperiod in the total of cash, cash equivalents, and amounts generally described asrestricted cash or restricted cash equivalents. Therefore, amounts generallydescribed as restricted cash and restricted cash equivalents should be includedwith cash and cash equivalents when reconciling the beginning-of-period and end-of-period total amounts shown on the statement of cash flows. Transition method: retrospective.
January 1, 2018.Early adoption is
permitted.
The Company has performed apreliminary evaluation andexpects an increase in cashprovided by operating activitiesof approximately $5 million for2017 and 2016 and a decreaseof $5 million in 2015. Net cashused in investing activities areexpected to decrease byapproximately $150 million and$230 million for 2017 and 2015,respectively, with an increase of$10 million expected for 2016.
2016-13, Financial Instruments —Credit Losses (Topic 326):Measurement of Credit Losses onFinancial Instruments
The standard updates the impairment model for financial assets measured atamortized cost. For trade and other receivables, held-to-maturity debt securities,loans and other instruments, entities will be required to use a new forward-looking"expected loss" model that generally will result in the earlier recognition ofallowance for losses. For available-for-sale debt securities with unrealized losses,entities will measure credit losses as it is done today, except that the losses will berecognized as an allowance rather than a reduction in the amortized cost of thesecurities.Transition method: various.
January 1, 2020.Early adoption is
permitted only as ofJanuary 1, 2019.
The Company is currentlyevaluating the impact ofadopting the standard on itsconsolidated financialstatements.
2016-02, 2018-01, Leases (Topic842)
See discussion of the ASU below. January 1, 2019.Early adoption is
permitted.
The Company is currentlyevaluating the impact ofadopting the standard on itsconsolidated financialstatements and intends to adoptthe standard as of January 1,2019.
2014-09, 2015-14, 2016-08,2016-10, 2016-12, 2016-20,2017-10, 2017-13, Revenue fromContracts with Customers (Topic606)
See discussion of the ASU below. January 1, 2018.Early adoption is
permitted only as ofJanuary 1, 2017.
The Company will adopt thestandard on January 1, 2018;see below for the evaluation ofthe impact of its adoption on theconsolidated financialstatements.
ASU 2014-09 and its subsequent corresponding updates provides the principles an entity must apply to measure and recognize revenue. Thecore principle is that an entity shall recognize revenue to depict the transfer of promised goods or services to customers in an amount that reflectsthe consideration to which the entity expects to be entitled in exchange for those goods or services. Amendments to the standard were issued thatprovide further clarification of the principle and to provide certain transition expedients. The standard will replace most existing revenue recognitionguidance in GAAP.
The standard requires retrospective application and allows either a full retrospective adoption in which all of the periods are presented underthe new standard or a modified retrospective approach in which the cumulative effect of initially applying the guidance is recognized at the date ofinitial application.
In 2016, the Company established a cross-functional implementation team and is in the process of evaluating changes to our businessprocesses, systems and controls to support recognition and disclosure under the new standard. At this time, we do not expect any significant impacton our financial systems or a material change to controls as a result of the implementation of the new revenue recognition standard.
120

THE AES CORPORATIONNOTES TO CONSOLIDATED FINANCIAL STATEMENTS—(Continued)
DECEMBER 31, 2017, 2016, AND 2015
Given the complexity and diversity of our non-regulated arrangements, the Company is assessing the standard on a contract by contract basisapplying the interpretations reached during 2017 on key issues. These include the application of the practical expedient for measuring progresstoward satisfaction of a performance obligation, when variable quantities would be considered variable consideration versus an option to acquireadditional goods and services, how to allocate variable consideration to one or more, but not all, distinct goods or services promised in a series ofdistinct goods or services that forms part of a single performance obligation. Additionally, the Company has been working on the application of thestandard to contracts that are under the scope of Service Concession Arrangements (Topic 853) and assessing the gross versus net presentationfor spot energy sales and purchases. Through this assessment, the Company to date has identified limited situations where revenue recognizedunder ASC 606 could differ from that recognized under ASC 605 and where the presentation of sales to and purchases from the energy spotmarkets will change.
The cumulative effect of applying the new standard that the Company expects to recognize at the date of initial application is mainly related toa contract under the scope of Topic 853. For this contract, the Company has concluded that revenue recognized since the inception of theagreement would be higher through January 1, 2018 under ASC 606. This will result in a decrease to the opening balance of Accumulated deficit ofapproximately $60 million and Accumulated other comprehensive loss of approximately $20 million , and an increase to the opening balance ofNoncontrolling interest of approximately $80 million . Additionally, the application of ASC 606 will result in a reclassification from Service concessionassets to Other noncurrent assets of $1,360 million . Given the limited impact, the Company expects to use the modified retrospective approach.
We are continuing to work with various non-authoritative industry groups, and monitoring the FASB and Transition Resource Group activity.
ASU 2016-02 and its subsequent corresponding updates require lessees to recognize assets and liabilities for most leases but recognizeexpenses in a manner similar to today’s accounting. For Lessors, the guidance modifies the lease classification criteria and the accounting for sales-type and direct financing leases. The guidance also eliminates today’s real estate-specific provisions.
The standard must be adopted using a modified retrospective approach at the beginning of the earliest comparative period presented in thefinancial statements (January 1, 2017). The FASB proposed amending the standard to give another option for transition. The proposed transitionmethod would allow entities to not apply the new lease standard in the comparative periods presented in their financial statements in the year ofadoption. Under the proposed transition method, the entity would apply the transition provisions on January 1, 2019 (i.e., the effective date). Attransition, lesses and lessors are permitted to make an election to apply a package of practical expedients that allow them not to reassess: (1)whether any expired or existing contracts are or contain leases, (2) lease classification for any expired or existing leases, and (3) whether initialdirect costs for any expired or existing leases qualify for capitalization under ASC 842. These three practical expedients must be elected as apackage and must be consistently applied to all leases. Furthermore, entities are also permitted to make an election to use hindsight whendetermining lease term and lessees can elect to use hindsight when assessing the impairment of right-of-use assets.
The Company has established a task force focused on the identification of contracts that would be under the scope of the new standard and onthe assessment and measurement of the right-of-use asset and related liability. Additionally, the implementation team has been working on theidentification and selection of a lease accounting system that would support the implementation and the subsequent accounting. The implementationteam is in the process of evaluating changes to our business processes, systems and controls to support recognition and disclosure under the newstandard.
As the Company has preliminarily concluded that at transition it would be using the package of practical expedients, the main impact expectedas of the effective date is the recognition of the right to use asset and the related liability in the financial statements for all those contracts thatcontain a lease and for which the Company is the lessee. However, income statement presentation and the expense recognition pattern will notchange.
Under ASC 842, it is expected that fewer contracts will contain a lease. However, due to the elimination of today's real estate-specific guidanceand changes to certain lessor classification criteria, more leases will qualify as sales-type leases and direct financing leases. Under these twomodels, a lessor will derecognize the asset and will recognize a lease receivable. According to ASC 842, the lease receivable does not includevariable payments that depend on the use of the asset (e.g. Mwh produced by a facility). Therefore, the lease receivable could be lower than thecarrying amount of the underlying asset at lease commencement, In such circumstances, the difference
121

THE AES CORPORATIONNOTES TO CONSOLIDATED FINANCIAL STATEMENTS—(Continued)
DECEMBER 31, 2017, 2016, AND 2015
between the initially recognized lease receivable and the carrying amount of the underlying asset is recognized as a selling loss at leasecommencement. The Company is assessing how this guidance will apply to new renewable contracts executed or modified after the effective datewhere all the payments are contingent on the level of production and is also evaluating the related impact to HLBV accounting.
2 . INVENTORYInventory is valued primarily using the average-cost method. The following table summarizes the Company's inventory balances as of the
dates indicated (in millions):
December 31, 2017 2016Fuel and other raw materials $ 284 $ 302Spare parts and supplies 278 320
Total $ 562 $ 622
3 . PROPERTY, PLANT AND EQUIPMENTThe following table summarizes the components of the electric generation and distribution assets and other property, plant and equipment (in
millions) with their estimated useful lives (in years). The amounts are stated net of all prior asset impairment losses recognized.
December 31,
Estimated Useful Life 2017 2016Electric generation and distribution facilities 8 - 40 $ 21,529 $ 22,337Other buildings 5 - 71 1,971 1,906Furniture, fixtures and equipment 2 - 32 284 303Other 5 - 44 335 365
Total electric generation and distribution assets and other 24,119 24,911Accumulated depreciation (7,942) (7,919)
Net electric generation and distribution assets and other $ 16,177 $ 16,992
The following table summarizes depreciation expense (including the amortization of assets recorded under capital leases and the amortizationof asset retirement obligations) and interest capitalized during development and construction on qualifying assets for the periods indicated (inmillions):
Years Ended December 31, 2017 2016 2015Depreciation expense $ 1,005 $ 1,002 $ 958Interest capitalized during development and construction 139 118 84
Property, plant and equipment, net of accumulated depreciation, of $10 billion was mortgaged, pledged or subject to liens as of December 31,2017 and 2016 , including assets classified as held-for-sale.
The following table summarizes regulated and non-regulated generation and distribution property, plant and equipment and accumulateddepreciation as of the dates indicated (in millions):
December 31, 2017 2016Regulated generation, distribution assets and other, gross $ 8,093 $ 7,815Regulated accumulated depreciation (3,357) (3,299)
Regulated generation, distribution assets and other, net 4,736 4,516Non-regulated generation, distribution assets and other, gross 16,026 17,096Non-regulated accumulated depreciation (4,585) (4,620)
Non-regulated generation, distribution assets and other, net 11,441 12,476Net electric generation, distribution assets and other $ 16,177 $ 16,992
The following table presents amounts recognized related to asset retirement obligations for the periods indicated (in millions):
2017 2016Balance at January 1 $ 357 $ 247
Additional liabilities incurred 1 12Liabilities settled (21) (4)Accretion expense 16 15Change in estimated cash flows 25 86Other (10) 1
Balance at December 31 $ 368 $ 357

122

THE AES CORPORATIONNOTES TO CONSOLIDATED FINANCIAL STATEMENTS—(Continued)
DECEMBER 31, 2017, 2016, AND 2015
The Company's asset retirement obligations primarily include active ash landfills, water treatment basins and the removal or dismantlement ofcertain plants and equipment. The $25 million increase in estimated cash flows for 2017 is primarily related to the legal obligations for the demolitionof the Huntington Beach Units in connection with the Southland re-powering project.
4 . FAIR VALUEThe fair value of current financial assets and liabilities, debt service reserves and other deposits approximate their reported carrying amounts.
The estimated fair values of the Company's assets and liabilities have been determined using available market information. By virtue of theseamounts being estimates and based on hypothetical transactions to sell assets or transfer liabilities, the use of different market assumptions and/orestimation methodologies may have a material effect on the estimated fair value amounts.
Valuation Techniques — The fair value measurement accounting guidance describes three main approaches to measuring the fair value ofassets and liabilities: (1) market approach, (2) income approach and (3) cost approach. The market approach uses prices and other relevantinformation generated from market transactions involving identical or comparable assets or liabilities. The income approach uses valuationtechniques to convert future amounts to a single present value amount. The measurement is based on current market expectations of the return onthose future amounts. The cost approach is based on the amount that would currently be required to replace an asset. The Company measures itsinvestments and derivatives at fair value on a recurring basis. Additionally, in connection with annual or event-driven impairment evaluations, certainnonfinancial assets and liabilities are measured at fair value on a nonrecurring basis. These include long-lived tangible assets (i.e., property, plantand equipment), goodwill and intangible assets (e.g., sales concessions, land use rights and water rights, etc.). In general, the Company determinesthe fair value of investments and derivatives using the market approach and the income approach, respectively. In the nonrecurring measurementsof nonfinancial assets and liabilities, all three approaches are considered; however, the value estimated under the income approach is often themost representative of fair value.
Investments — The Company's investments measured at fair value generally consist of marketable debt and equity securities. Equity securitiesare either measured at fair value using quoted market prices or based on comparisons to market data obtained for similar assets. Debt securitiesprimarily consist of unsecured debentures and certificates of deposit held by our Brazilian subsidiaries. Returns and pricing on these instruments aregenerally indexed to the market interest rates in Brazil. Debt securities are measured at fair value based on comparisons to market data obtained forsimilar assets.
Derivatives — Derivatives are measured at fair value using quoted market prices or the income approach utilizing volatilities, spot and forwardbenchmark interest rates (such as LIBOR and EURIBOR), foreign exchange rates, credit data, and commodity prices, as applicable. Whensignificant inputs are not observable, the Company uses relevant techniques to determine the inputs, such as regression analysis or prices forsimilarly traded instruments available in the market.
The Company's methodology to fair value its derivatives is to start with any observable inputs; however, in certain instances the publishedforward rates or prices may not extend through the remaining term of the contract and management must make assumptions to extrapolate thecurve, which necessitates the use of unobservable inputs, such as proxy commodity prices or historical settlements to forecast forward prices.Specifically, where there is limited forward curve data with respect to foreign exchange contracts, beyond the traded points, the Company utilizesthe interest rate differential approach to construct the remaining portion of the forward curve. Similarly, in certain instances, the spread that reflectsthe credit or nonperformance risk is unobservable requiring the use of proxy yield curves of similar credit quality.
To determine the fair value of a derivative, cash flows are discounted using the relevant spot benchmark interest rate. The Company thenmakes a credit valuation adjustment ("CVA"), as applicable, by further discounting the cash flows for nonperformance or credit risk based on theobservable or estimated debt spread of the Company's subsidiary or its counterparty and the tenor of the respective derivative instrument. The CVAfor potential future scenarios in which the derivative is in an asset position is based on the counterparty's credit ratings, credit default swap spreads,and debt spreads, as available. The CVA for potential future scenarios in which the derivative is in a liability position is based on the ParentCompany's or the subsidiary's current debt spread. In the absence of readily obtainable credit information, the Parent Company's or the subsidiary'sestimated credit rating (based on applying a standard industry model to historical financial information and then considering other relevant
123

THE AES CORPORATIONNOTES TO CONSOLIDATED FINANCIAL STATEMENTS—(Continued)
DECEMBER 31, 2017, 2016, AND 2015
information) and spreads of comparably rated entities or the respective country's debt spreads are used as a proxy. All derivative instruments areanalyzed individually and are subject to unique risk exposures.
The fair value hierarchy of an asset or a liability is based on the level of significance of the input assumptions. An input assumption isconsidered significant if it affects the fair value by at least 10%. Assets and liabilities are classified as Level 3 when the use of unobservable inputs issignificant. When the use of unobservable inputs is insignificant, assets and liabilities are classified as Level 2. Transfers between Level 3 and Level2 are determined as of the end of the reporting period and result from changes in significance of unobservable inputs used to calculate the CVA.
Debt — Recourse and non-recourse debt are carried at amortized cost. The fair value of recourse debt is estimated based on quoted marketprices. The fair value of non-recourse debt is estimated based upon interest rates and other features of the loan. In general, the carrying amount ofvariable rate debt is a close approximation of its fair value. For fixed rate loans, the fair value is estimated using quoted market prices or discountedcash flow ("DCF") analyses. The fair value of recourse and non-recourse debt excludes accrued interest at the valuation date. The fair value wasdetermined using available market information as of December 31, 2017 . The Company is not aware of any factors that would significantly affectthe fair value amounts subsequent to December 31, 2017 .
Nonrecurring measurements — For nonrecurring measurements derived using the income approach, fair value is generally determined usingvaluation models based on the principles of DCF. The income approach is most often used in the impairment evaluation of long-lived tangibleassets, equity method investments, goodwill, and intangible assets. Where the use of market observable data is limited or not available for certaininput assumptions, the Company develops its own estimates using a variety of techniques such as regression analysis and extrapolations.Depending on the complexity of a valuation, an independent valuation firm may be engaged to assist management in the valuation process.
For nonrecurring measurements derived using the market approach, recent market transactions involving the sale of identical or similar assetsare considered. The use of this approach is limited because it is often difficult to identify sale transactions of identical or similar assets. Thisapproach is used in impairment evaluations of certain intangible assets. Otherwise, it is used to corroborate the fair value determined under theincome approach.
For nonrecurring measurements derived using the cost approach, fair value is typically based upon a replacement cost approach. Thisapproach involves a considerable amount of judgment, which is why its use is limited to the measurement of long-lived tangible assets. Like themarket approach, this approach is also used to corroborate the fair value determined under the income approach.
Fair Value Considerations — In determining fair value, the Company considers the source of observable market data inputs, liquidity of theinstrument, the credit risk of the counterparty and the risk of the Company's or its counterparty's nonperformance. The conditions and criteria usedto assess these factors are:
Sources of market assumptions — The Company derives most of its market assumptions from market efficient data sources (e.g., Bloombergand Reuters). To determine fair value, where market data is not readily available, management uses comparable market sources and empiricalevidence to develop its own estimates of market assumptions.
Market liquidity — The Company evaluates market liquidity based on whether the financial or physical instrument, or the underlying asset, istraded in an active or inactive market. An active market exists if the prices are fully transparent to market participants, can be measured by marketbid and ask quotes, the market has a relatively large proportion of trading volume as compared to the Company's current trading volume and themarket has a significant number of market participants that will allow the market to rapidly absorb the quantity of assets traded without significantlyaffecting the market price. Another factor the Company considers when determining whether a market is active or inactive is the presence ofgovernment or regulatory controls over pricing that could make it difficult to establish a market-based price when entering into a transaction.
Nonperformance risk — Nonperformance risk refers to the risk that an obligation will not be fulfilled and affects the value at which a liability istransferred or an asset is sold. Nonperformance risk includes, but may not be limited to, the Company or its counterparty's credit and settlement risk.Nonperformance risk adjustments are dependent on credit spreads, letters of credit, collateral, other arrangements available and the nature ofmaster netting arrangements. The Company is party to various interest rate swaps and options; foreign currency options and forwards; andderivatives and embedded derivatives, which subject the Company to nonperformance risk. The financial and physical instruments held at thesubsidiary level are generally non-recourse to the Parent Company.
124

THE AES CORPORATIONNOTES TO CONSOLIDATED FINANCIAL STATEMENTS—(Continued)
DECEMBER 31, 2017, 2016, AND 2015
Nonperformance risk on the investments held by the Company is incorporated in the fair value derived from quoted market data to mark theinvestments to fair value.
Recurring Measurements — The following table presents, by level within the fair value hierarchy, as described in Note 1— General andSummary of Significant Accounting Policies , the Company's financial assets and liabilities that were measured at fair value on a recurring basis asof the dates indicated (in millions). For the Company's investments in marketable debt and equity securities, the security classes presented aredetermined based on the nature and risk of the security and are consistent with how the Company manages, monitors and measures its marketablesecurities:
December 31, 2017 December 31, 2016
Level 1 Level 2 Level 3 Total Level 1 Level 2 Level 3 TotalAssets
AVAILABLE FOR SALE: Debt securities:
Unsecured debentures $ — $ 207 $ — $ 207 $ — $ 205 $ — $ 205Certificates of deposit — 153 — 153 — 260 — 260Government debt securities — — — — — 9 — 9
Subtotal — 360 — 360 — 474 — 474Equity securities:
Mutual funds — 52 — 52 — 48 — 48Subtotal — 52 — 52 — 48 — 48
Total available for sale — 412 — 412 — 522 — 522TRADING:
Equity securities: Mutual funds 20 — — 20 16 — — 16
Total trading 20 — — 20 16 — — 16DERIVATIVES:
Interest rate derivatives — 15 — 15 — 18 — 18Cross-currency derivatives — 29 — 29 — 4 — 4Foreign currency derivatives — 29 240 269 — 54 255 309Commodity derivatives — 30 5 35 — 38 7 45
Total derivatives — assets — 103 245 348 — 114 262 376TOTAL ASSETS $ 20 $ 515 $ 245 $ 780 $ 16 $ 636 $ 262 $ 914
Liabilities DERIVATIVES:
Interest rate derivatives $ — $ 111 $ 151 $ 262 $ — $ 121 $ 179 $ 300Cross-currency derivatives — 3 — 3 — 18 — 18Foreign currency derivatives — 30 — 30 — 64 — 64Commodity derivatives — 19 1 20 — 40 2 42
Total derivatives — liabilities — 163 152 315 — 243 181 424TOTAL LIABILITIES $ — $ 163 $ 152 $ 315 $ — $ 243 $ 181 $ 424
As of December 31, 2017 , all AFS debt securities had stated maturities within one year. For the years ended December 31, 2017 , 2016 , and2015 , no other-than-temporary impairment of marketable securities were recognized in earnings or Other Comprehensive Income (Loss). Gainsand losses on the sale of investments are determined using the specific-identification method. The following table presents gross proceeds fromsale of AFS securities for the periods indicated (in millions):
Year Ended December 31, 2017 2016 2015Gross proceeds from sales of AFS securities $ 1,398 $ 1,726 $ 1,226
Any Level 1 derivative instruments are exchange-traded commodity futures for which the pricing is observable in active markets, and as such,these are not expected to transfer to other levels. There have been no transfers between Level 1 and Level 2.
The following tables present a reconciliation of net derivative assets and liabilities measured at fair value on a recurring basis using significantunobservable inputs (Level 3) for the years ended December 31, 2017 and 2016 (presented net by type of derivative in millions). Transfers betweenLevel 3 and Level 2 are determined as of the end of the reporting period and principally result from changes in the significance of unobservableinputs used to calculate the credit valuation adjustment.

125

THE AES CORPORATIONNOTES TO CONSOLIDATED FINANCIAL STATEMENTS—(Continued)
DECEMBER 31, 2017, 2016, AND 2015
Year Ended December 31, 2017 Interest Rate Foreign Currency Commodity Total
Balance at January 1 $ (179) $ 255 $ 5 $ 81Total realized and unrealized gains (losses):
Included in earnings (1) 21 1 21Included in other comprehensive income — derivative activity (23) — — (23)Included in regulatory liabilities — — 10 10
Settlements 36 (36) (12) (12)Transfers of liabilities into Level 3 (4) — — (4)Transfers of liabilities out of Level 3 20 — — 20
Balance at December 31 $ (151) $ 240 $ 4 $ 93Total gains (losses) for the period included in earnings attributable to the change in unrealized gains(losses) relating to assets and liabilities held at the end of the period $ 7 $ (15) $ 1 $ (7)
Year Ended December 31, 2016 Interest Rate Foreign Currency Commodity Total
Balance at January 1 $ (304) $ 277 $ 3 $ (24)Total realized and unrealized gains (losses):
Included in earnings — 31 2 33Included in other comprehensive income — derivative activity (36) 6 — (30)Included in other comprehensive income — foreign currency translation activity 3 (52) — (49)Included in regulatory liabilities — — 11 11
Settlements 72 (22) (11) 39Transfers of liabilities into Level 3 (32) — — (32)Transfers of assets out of Level 3 118 15 — 133
Balance at December 31 $ (179) $ 255 $ 5 $ 81Total gains for the period included in earnings attributable to the change in unrealized gains (losses)relating to assets and liabilities held at the end of the period $ 6 $ 16 $ 2 $ 24
The following table summarizes the significant unobservable inputs used for the Level 3 derivative assets (liabilities) as of December 31, 2017(in millions, except range amounts):
Type of Derivative Fair Value Unobservable Input Amount or Range(Weighted Average)
Interest rate $ (151) Subsidiaries’ credit spreads 1.9% - 5.1% (4.9%)Foreign currency:
Argentine peso 240 Argentine peso to U.S. dollar currency exchange rate after one year (1) 22.8 - 52.3 (36.6)Commodity:
Other 4 Total $ 93 ____________________________
(1) During the year ended December 31, 2017 , the Company began utilizing the interest rate differential approach to construct the remaining portion of the forward curve after one year (beyond the tradedpoints). In previous periods, the Company used the purchasing price parity approach to construct the forward curve.
For interest rate derivatives, and foreign currency derivatives, increases (decreases) in the estimates of the Company's own credit spreadswould decrease (increase) the value of the derivatives in a liability position. For foreign currency derivatives, increases (decreases) in the estimateof the above exchange rate would increase (decrease) the value of the derivative.
Nonrecurring Measurements
When evaluating impairment of long-lived assets and equity method investments, the Company measures fair value using the applicable fairvalue measurement guidance. Impairment expense is measured by comparing the fair value at the evaluation date to their then-latest availablecarrying amount. The following table summarizes major categories of assets and liabilities measured at fair value on a nonrecurring basis during theperiod and their level within the fair value hierarchy (in millions):
Year Ended December 31, 2017
Measurement Date
Carrying Amount
(1) Fair Value
Pre-taxLossAssets Level 1 Level 2 Level 3
Long-lived assets held and used: (2)
Laurel Mountain 12/31/2017 $ 154 $ — $ — $ 33 $ 121
Kilroot 12/31/2017 69 — — 20 37
DPL 02/28/2017 77 — — 11 66

Other Various 18 — — — 18
Dispositions and held-for-sale businesses: (3)
DPL Peaker Assets 12/31/2017 346 — 237 — 109
Kazakhstan Hydroelectric (4) 06/30/2017 190 — 92 — 92
Kazakhstan CHPs 03/31/2017 171 — 29 — 94
126

THE AES CORPORATIONNOTES TO CONSOLIDATED FINANCIAL STATEMENTS—(Continued)
DECEMBER 31, 2017, 2016, AND 2015
Year Ended December 31, 2016
Measurement Date
Carrying Amount
(1) Fair Value
Pre-taxLossAssets Level 1 Level 2 Level 3
Long-lived assets held and used: (2) DPL 12/31/2016 $ 787 $ — $ 60 $ 103 $ 624Buffalo Gap I 08/31/2016 113 — — 36 77DPL 06/30/2016 324 — — 89 235Buffalo Gap II 03/31/2016 251 — — 92 159
Discontinued operations: (3) Sul 06/30/2016 1,581 — 470 — 783
_____________________________(1) Represents the carrying values at the dates of measurement, before fair value adjustment.(2) See Note 19 — Asset Impairment Expense for further information.(3) Per the Company's policy, pre-tax loss is limited to the impairment of long-lived assets. Any additional loss will be recognized on completion of the sale. Upon disposal of Sul, we incurred an additional pre-tax
loss on sale of $602 million . See Note 21 — Discontinued Operations and Note 22 — Held-for-Sale Businesses and Dispositions for further information.(4) Per the Company's policy, pre-tax loss is limited to the impairment of long-lived assets. Any additional loss will be recognized on completion of the sale. Upon disposal of Kazakhstan HPPs, we incurred an
additional pre-tax loss on disposal of $33 million . See Note 19 — Asset Impairment Expense and Note 22 — Held-for-Sale Businesses and Dispositions for further information.
The following table summarizes the significant unobservable inputs used in the Level 3 measurement of long-lived assets held and usedmeasured on a nonrecurring basis during the year ended December 31, 2017 (in millions, except range amounts):
December 31, 2017 Fair Value Valuation Technique Unobservable Input Range (Weighted Average)Long-lived assets held and used:
Laurel Mountain $ 33 Discounted cash flow Annual revenue growth -30% to 2% (0%)
Pre-tax operating margin (throughremaining life) 61% to 73% (64%)
Weighted-average cost of capital 9%Kilroot 20 Discounted cash flow Annual revenue growth -85% to 17% (-16%)
Annual pre-tax operating margin -32% to 28% (6%) Weighted-average cost of capital 8%
DPL 11 Discounted cash flow
Pre-tax operating margin (throughremaining life) 10% to 22% (15%)
Weighted-average cost of capital 7%Total $ 64
Financial Instruments not Measured at Fair Value in the Consolidated Balance Sheets
The following table presents (in millions) the carrying amount, fair value and fair value hierarchy of the Company's financial assets andliabilities that are not measured at fair value in the Consolidated Balance Sheets as of the periods indicated, but for which fair value is disclosed.
December 31, 2017
CarryingAmount
Fair Value
Total Level 1 Level 2 Level 3
Assets: Accounts receivable — noncurrent (1) $ 163 $ 217 $ — $ 6 $ 211Liabilities: Non-recourse debt 15,340 15,890 — 13,350 2,540 Recourse debt 4,630 4,920 — 4,920 —
December 31, 2016
CarryingAmount
Fair Value
Total Level 1 Level 2 Level 3
Assets: Accounts receivable — noncurrent (1) $ 232 $ 342 $ — $ 20 $ 322Liabilities: Non-recourse debt 14,783 15,185 — 14,140 1,045 Recourse debt 4,671 4,899 — 4,899 —_____________________________
(1) These amounts primarily relate to amounts due from CAMMESA, the administrator of the wholesale electricity market in Argentina, and are included in Other noncurrent assets in the accompanyingConsolidated Balance Sheets. The fair value and carrying amount of these receivables exclude VAT of $31 million and $24 million as of December 31, 2017 and 2016 , respectively.
127

THE AES CORPORATIONNOTES TO CONSOLIDATED FINANCIAL STATEMENTS—(Continued)
DECEMBER 31, 2017, 2016, AND 2015
5 . DERIVATIVE INSTRUMENTS AND HEDGING ACTIVITIESVolume of Activity — The following table presents the Company's maximum notional (in millions) over the remaining contractual period by
type of derivative as of December 31, 2017 , regardless of whether they are in qualifying cash flow hedging relationships, and the dates throughwhich the maturities for each type of derivative range:
Derivatives Maximum NotionalTranslated to USD Latest Maturity
Interest Rate (LIBOR and EURIBOR) $ 4,481 2036Cross-Currency Swaps (Chilean Unidad de Fomento and Chilean Peso) 410 2029Foreign Currency:
Argentine Peso 187 2026Chilean Peso 410 2020Colombian Peso 305 2019Others, primarily with weighted average remaining maturities of a year or less 303 2020
Accounting and Reporting — Assets and Liabilities — The following tables present the fair value of assets and liabilities related to theCompany's derivative instruments as of the periods indicated (in millions):
Fair Value December 31, 2017 December 31, 2016Assets Designated Not Designated Total Designated Not Designated Total
Interest rate derivatives $ 15 $ — $ 15 $ 18 $ — $ 18Cross-currency derivatives 29 — 29 4 — 4Foreign currency derivatives 8 261 269 9 300 309Commodity derivatives 5 30 35 20 25 45
Total assets $ 57 $ 291 $ 348 $ 51 $ 325 $ 376Liabilities
Interest rate derivatives $ 125 $ 137 $ 262 $ 295 $ 5 $ 300Cross-currency derivatives 3 — 3 18 — 18Foreign currency derivatives 1 29 30 19 45 64Commodity derivatives 9 11 20 26 16 42
Total liabilities $ 138 $ 177 $ 315 $ 358 $ 66 $ 424
December 31, 2017 December 31, 2016
Fair Value Assets Liabilities Assets LiabilitiesCurrent $ 84 $ 211 $ 99 $ 155Noncurrent 264 104 277 269
Total $ 348 $ 315 $ 376 $ 424
Credit Risk-Related Contingent Features (1) December 31, 2017 December 31, 2016Present value of liabilities subject to collateralization $ 15 $ 41Cash collateral held by third parties or in escrow 9 18
_____________________________(1) Based on the credit rating of certain subsidiaries
128

THE AES CORPORATIONNOTES TO CONSOLIDATED FINANCIAL STATEMENTS—(Continued)
DECEMBER 31, 2017, 2016, AND 2015
Earnings and Other Comprehensive Income (Loss) — The following table presents (in millions) the pre-tax gains (losses) recognized in AOCLand earnings related to all derivative instruments for the periods indicated:
Years Ended December 31,
2017 2016 2015
Effective portion of cash flow hedges
Gains (losses) recognized in AOCL
Interest rate derivatives $ (66) $ (35) $ (103)
Cross-currency derivatives 31 21 (20)
Foreign currency derivatives (5) (4) 10
Commodity derivatives 18 30 40
Total $ (22) $ 12 $ (73)
Gains (losses) reclassified from AOCL to earnings
Interest rate derivatives $ (82) $ (101) $ (116)
Cross-currency derivatives 34 8 (24)
Foreign currency derivatives (20) (8) 32
Commodity derivatives 17 56 31
Total $ (51) $ (45) $ (77)
Loss reclassified from AOCL to earnings due to discontinuance of hedge accounting (1) $ (13) $ — $ —
Gain (losses) recognized in earnings related to
Ineffective portion of cash flow hedges $ 3 $ (1) $ (6)
Not designated as hedging instruments:
Foreign currency derivatives $ 1 $ 19 $ 211
Commodity derivatives and other 14 (16) (29)
Total $ 15 $ 3 $ 182_____________________________
(1) Cash flow hedge was discontinued because it was probable the forecasted transaction will not occur.
The AOCL expected to decrease pre-tax income from continuing operations, primarily due to interest rate derivatives, for the twelve monthsended December 31, 2017 is $58 million .
6 . FINANCING RECEIVABLESReceivables with contractual maturities of greater than one year are considered financing receivables, primarily related to amended
agreements or government resolutions due from CAMMESA. The following table presents financing receivables by country as of the dates indicated(in millions):
December 31, 2017 2016
Argentina $ 177 $ 236Other 17 20
Total $ 194 $ 256
Argentina
Collection of the principal and interest on these receivables is subject to various business risks and uncertainties, including, but not limited to,the continued operation of power plants which generate cash for payments of these receivables, regulatory changes that could impact the timingand amount of collections, and economic conditions in Argentina. The Company monitors these risks, including the credit ratings of the Argentinegovernment, on a quarterly basis to assess the collectability of these receivables. The Company accrues interest on these receivables ifcollectability is reasonably assured. The Company's collection estimates are based on assumptions it believes to be reasonable, but are inherentlyuncertain. Actual future cash flows could differ from these estimates. The decrease in Argentina financing receivables was primarily due to plannedcollections and unfavorable FX impacts.
FONINVEMEM Agreements — As a result of energy market reforms in 2004 and 2010, AES Argentina entered into three agreements with theArgentine government, referred to as the FONINVEMEM Agreements, to contribute a portion of their accounts receivable into a fund for financingthe construction of combined cycle and gas-fired plants. These receivables accrue interest and are collected in monthly installments over 10 yearsonce the related plant begins operations. In addition, AES Argentina receives an ownership interest in these newly built plants once the receivableshave been fully repaid.
The FONINVEMEM receivables are denominated in Argentine pesos, but indexed to U.S. dollars, which represents a foreign currencyderivative. As of December 31, 2017 and 2016 , the amount of the foreign currency-
129

THE AES CORPORATIONNOTES TO CONSOLIDATED FINANCIAL STATEMENTS—(Continued)
DECEMBER 31, 2017, 2016, AND 2015
related derivative assets associated with the FONINVEMEM financing receivables that were excluded from the table above had a fair value of $240million and $255 million , respectively.
The receivables under the FONINVEMEM Agreements have been actively collected since the related plants commenced operations in 2010and 2016. In assessing the collectability of the receivables under these agreements, the Company also considers historic collection evidence inaccordance with the agreements.
Other Agreements — Other agreements primarily consist of resolutions passed by the Argentine government in which AES Argentina willreceive compensation for investments in new generation plants and technologies. The timing of collections depend on corresponding agreementsand collectability of these receivables are assessed on an ongoing basis.
7 . INVESTMENTS IN AND ADVANCES TO AFFILIATESThe following table summarizes the relevant effective equity ownership interest and carrying values for the Company's investments accounted
for under the equity method as of the periods indicated:
December 31, 2017 2016 2017 2016
Affiliate Country Carrying Value (in millions) Ownership Interest %sPower United States $ 508 $ — 50% —%Guacolda (1)
Chile 357 362 33% 33%OPGC (2)
India 269 195 49% 49%Elsta (3)
Netherlands 38 41 50% 50%Equity method investments of Distributed Energy (3)
United States 15 22 95% 95%Barry (3)
United Kingdom — — 100% 100%Other affiliates Various 10 1
Total $ 1,197 $ 621 _____________________________(1) The Company's ownership in Guacolda is held through AES Gener, a 67% -owned consolidated subsidiary. AES Gener owns 50% of Guacolda, resulting in an AES effective ownership in Guacolda of 33% .(2) OPGC has one coal-fired project under development which is an expansion of our existing OPGC business. The project started construction in April 2014 and is expected to begin operations in 2019.(3) Represent VIEs in which the Company holds a variable interest, but is not the primary beneficiary.
sPower — In February 2017, the Company and Alberta Investment Management Corporation (“AIMCo”) entered into an agreement to acquireFTP Power LLC (“sPower”). In July 2017, AES closed on the acquisition of its 48% ownership interest in sPower for $461 million . In November2017, AES acquired an additional 2% ownership interest in sPower for $19 million . As the Company does not control sPower, it is accounted for asan equity method investment. The sPower portfolio includes solar and wind projects in operation, under construction, and in development located inthe United States. The sPower equity method investment is reported in the US SBU reportable segment.
Guacolda — In September 2015, AES Gener and Global Infrastructure Partners ("GIP") executed a restructuring of Guacolda that increasedGuacolda's tax basis in certain long-term assets and AES Gener's equity investment. As a result, AES Gener recorded $66 million in net equity inearnings of affiliates for the year ended December 31, 2015, of which $46 million is attributable to The AES Corporation.
AES Barry Ltd. — The Company holds a 100% ownership interest in AES Barry Ltd. ("Barry"), a dormant entity in the U.K. that disposed of itsgeneration and other operating assets. Due to a debt agreement, no material financial or operating decisions can be made without the banks'consent, and the Company does not control Barry. As of December 31, 2017 and 2016 , other long-term liabilities included $45 million and $41million related to this debt agreement.
130

THE AES CORPORATIONNOTES TO CONSOLIDATED FINANCIAL STATEMENTS—(Continued)
DECEMBER 31, 2017, 2016, AND 2015
Summarized Financial Information — The following tables summarize financial information of the Company's 50%-or-less-owned affiliatesand majority-owned unconsolidated subsidiaries that are accounted for using the equity method (in millions):
50%-or-less Owned Affiliates Majority-Owned Unconsolidated Subsidiaries
Years ended December 31, 2017 2016 2015 2017 2016 2015Revenue $ 762 $ 586 $ 641 $ 16 $ 23 $ 24Operating margin 165 145 152 5 9 11Net income (loss) 72 64 210 (15) (2) 6 December 31, 2017 2016 2017 2016 Current assets $ 418 $ 308 $ 70 $ 16 Noncurrent assets 5,372 2,577 102 181 Current liabilities 633 626 10 10 Noncurrent liabilities 2,629 1,209 147 122 Stockholders' equity 2,527 1,048 15 65
At December 31, 2017 , retained earnings included $254 million related to the undistributed earnings of the Company's 50%-or-less ownedaffiliates. Distributions received from these affiliates were $69 million , $24 million , and $18 million for the years ended December 31, 2017 , 2016 ,and 2015 , respectively. As of December 31, 2017 , the aggregate carrying amount of our investments in equity affiliates exceeded the underlyingequity in their net assets by $46 million .
8 . GOODWILL AND OTHER INTANGIBLE ASSETSGoodwill — The following table summarizes the carrying amount of goodwill by reportable segment for the years ended December 31, 2017 and
2016 (in millions):
US Andes MCAC Eurasia TotalBalance as of December 31, 2016
Goodwill $ 2,674 $ 899 $ 149 $ 190 $ 3,912Accumulated impairment losses (2,633) — — (122) (2,755)
Net balance 41 899 149 68 1,157Transfer to assets held-for-sale (1)
— (30) — (68) (98)Balance as of December 31, 2017
Goodwill 2,674 869 149 122 3,814Accumulated impairment losses (2,633) — — (122) (2,755)
Net balance $ 41 $ 869 $ 149 $ — $ 1,059_____________________________
(1) See Note 22 --- Held-For-Sale Businesses and Dispositions for further information.
DP&L — During the fourth quarter of 2015, the Company performed the annual goodwill impairment test at its DP&L reporting unit andrecognized a goodwill impairment expense of $317 million . The reporting unit failed Step 1 as its fair value was less than its carrying amount, whichwas primarily due to a decrease in forecasted dark spreads that were driven by decreases in projected forward power prices, and lower thanexpected revenues from a new CP product. The fair value of the reporting unit was determined under the income approach using a discounted cashflow valuation model. The significant assumptions included within the discounted cash flow valuation model were forward commodity price curves,the amount of non-bypassable charges from the pending ESP, expected revenues from the new CP product, and planned environmentalexpenditures. In Step 2, goodwill was determined to have an implied negative fair value after the hypothetical purchase price allocation under theaccounting guidance for business combinations; therefore, a full impairment of the remaining goodwill balance of $317 million was recognized.DP&L is reported in the US SBU reportable segment.
131

THE AES CORPORATIONNOTES TO CONSOLIDATED FINANCIAL STATEMENTS—(Continued)
DECEMBER 31, 2017, 2016, AND 2015
Other Intangible Assets — The following table summarizes the balances comprising Other intangible assets in the accompanying ConsolidatedBalance Sheets (in millions) as of the periods indicated:
December 31, 2017 December 31, 2016
Gross Balance Accumulated Amortization Net Balance Gross Balance Accumulated Amortization Net BalanceSubject to Amortization
Internal-use software $ 416 $ (330) $ 86 $ 396 $ (304) $ 92Contracts 92 (21) 71 53 (15) 38
Contractual payment rights (1) 65 (47) 18 56 (42) 14
Project development rights 57 (1) 56 4 (1) 3
Other (2) 98 (42) 56 103 (37) 66Subtotal 728 (441) 287 612 (399) 213
Indefinite-Lived Intangible Assets Land use rights 45 — 45 47 — 47Water rights 20 — 20 17 — 17Other 14 — 14 10 — 10
Subtotal 79 — 79 74 — 74Total $ 807 $ (441) $ 366 $ 686 $ (399) $ 287_____________________________
(1) Represent legal rights to receive system reliability payments from the regulator.(2) Includes management rights, sales concessions, gas extraction rights, and other individually insignificant intangible assets.
The following tables summarize other intangible assets acquired during the periods indicated (in millions):
December 31, 2017 Amount Subject to Amortization/Indefinite-Lived Weighted Average Amortization Period (in
years) Amortization MethodProject Development Rights $ 53 Subject to Amortization 30 Straight-lineContracts 34 Subject to Amortization 25 Straight-lineInternal-use software 17 Subject to Amortization 7 Straight-lineOther 8 Various N/A N/A
Total $ 112
December 31, 2016 Amount Subject to Amortization/Indefinite-Lived Weighted Average Amortization Period (in
years) AmortizationMethod
Internal-use software $ 41 Subject to Amortization 4 Straight-lineContracts 24 Subject to Amortization 26 Straight-lineOther 5 Subject to Amortization 13 Straight-line
Total $ 70
The following table summarizes the estimated amortization expense by intangible asset category for 2018 through 2022 :
(in millions) 2018 2019 2020 2021 2022Internal-use software $ 17 $ 14 $ 12 $ 10 $ 9Contracts 5 5 5 5 5Other 11 12 10 8 9
Total $ 33 $ 31 $ 27 $ 23 $ 23
Intangible asset amortization expense was $34 million , $37 million and $47 million for the years ended December 31, 2017 , 2016 and 2015 ,respectively.
132

THE AES CORPORATIONNOTES TO CONSOLIDATED FINANCIAL STATEMENTS—(Continued)
DECEMBER 31, 2017, 2016, AND 2015
9 . REGULATORY ASSETS AND LIABILITIESThe Company has recorded regulatory assets and liabilities (in millions) that it expects to pass through to its customers in accordance with,
and subject to, regulatory provisions as follows:
December 31, 2017 2016 Recovery/Refund PeriodREGULATORY ASSETS
Current regulatory assets:
El Salvador tariff recoveries $ 59 $ 54 Quarterly as part of the tariff adjustment
Other 60 34 VariousTotal current regulatory assets 119 88 Noncurrent regulatory assets:
IPL and DPL defined benefit pension obligations (1) 298 316 Various
IPL and DPL income taxes recoverable from customers (1) — 87 Various
IPL deferred Midwest ISO costs 102 114 9 years
IPL environmental costs 48 41 Various
Other 94 97 VariousTotal noncurrent regulatory assets 542 655
TOTAL REGULATORY ASSETS $ 661 $ 743 REGULATORY LIABILITIES
Current regulatory liabilities:
DPL efficiency program costs $ 10 $ 14 Annually as part of the tariff adjustment
Other 7 27 VariousTotal current regulatory liabilities 17 41 Noncurrent regulatory liabilities:
IPL and DPL asset retirement obligations 830 795 Over life of assets
IPL and DPL deferred income taxes 243 2 Various
Other 6 5 VariousTotal noncurrent regulatory liabilities 1,079 802
TOTAL REGULATORY LIABILITIES $ 1,096 $ 843 _____________________________
(1) Past expenditures on which the Company earns a rate of return .
Our regulatory assets primarily consist of costs that are generally non-controllable, such as purchased electricity, energy transmission, thedifference between actual fuel costs and the fuel costs recovered in the tariffs, and other sector costs. These costs are recoverable or refundable asdefined by the laws and regulations in our various markets. Our regulatory assets also include defined pension and postretirement benefitobligations equal to the previously unrecognized actuarial gains and losses and prior services costs that are expected to be recovered throughfuture rates. Other current and noncurrent regulatory assets primarily consist of:
• Demand charges at DPL;
• Unamortized premiums reacquired or redeemed on long term debt at IPL and DPL, which are amortized over the lives of the originalissuances; and
• Unrecovered fuel and purchased power costs at IPL and DPL.
Our regulatory liabilities primarily consist of obligations for removal costs which do not have an associated legal retirement obligation. Ourregulatory liabilities also include deferred income taxes associated with the reduction of the U.S. federal income tax rate which will be passedthrough to our regulated customers via a decrease in future retail rates, see Note 20 — Income Taxes for further information.
In the accompanying Consolidated Balance Sheets the current regulatory assets and liabilities are reflected in Other current assets andAccrued and other liabilities , respectively, and the noncurrent regulatory assets and liabilities are reflected in Other noncurrent assets and Othernoncurrent liabilities , respectively. The following table summarizes regulatory assets and liabilities by reportable segment in millions as of theperiods indicated:
December 31, 2017 December 31, 2016
Regulatory Assets Regulatory Liabilities Regulatory Assets Regulatory LiabilitiesUS SBU $ 602 $ 1,095 $ 689 $ 842MCAC SBU 59 — 54 —Brazil SBU — 1 — 1
Total $ 661 $ 1,096 $ 743 $ 843

133

THE AES CORPORATIONNOTES TO CONSOLIDATED FINANCIAL STATEMENTS—(Continued)
DECEMBER 31, 2017, 2016, AND 2015
10 . DEBTNON-RECOURSE DEBT — The following table summarizes the carrying amount and terms of non-recourse debt at our subsidiaries as of the
periods indicated (in millions):
NON-RECOURSE DEBTWeighted Average
Interest Rate Maturity December 31,
2017 2016
Variable Rate: (1) Bank loans 4.52% 2018 – 2050 $ 2,488 $ 2,601Notes and bonds 8.06% 2020 – 2026 900 471
Debt to (or guaranteed by) multilateral, export credit agencies or development banks (2) 3.28% 2023 – 2034 3,668 3,189Fixed Rate:
Bank loans 4.54% 2018 – 2040 993 767Notes and bonds 5.68% 2019 – 2073 7,388 7,822
Debt to (or guaranteed by) multilateral, export credit agencies or development banks (2) 5.35% 2023 – 2034 271 328Other 5.81% 2018 – 2061 26 30
Unamortized (discount) premium & debt issuance (costs), net (394) (425)Subtotal $ 15,340 $ 14,783
Less: Current maturities (2,164) (1,052)Noncurrent maturities $ 13,176 $ 13,731_____________________________(1) The interest rate on variable rate debt represents the total of a variable component that is based on changes in an interest rate index and of a fixed component. The Company has interest rate swaps and
option agreements in an aggregate notional principal amount of approximately $3.6 billion on non-recourse debt outstanding at December 31, 2017 . These agreements economically fix the variablecomponent of the interest rates on the portion of the variable-rate debt being hedged so that the total interest rate on that debt has been fixed at rates ranging from approximately 2.49% to 8.00% . The debtagreements expire at various dates from 2018 through 2073 .
(2) Multilateral loans include loans funded and guaranteed by bilaterals, multilaterals, development banks and other similar institutions.
Non-recourse debt as of December 31, 2017 is scheduled to reach maturity as shown below (in millions):
December 31, Annual Maturities2018 $ 2,2452019 7962020 1,3962021 1,8332022 1,768Thereafter 7,696Unamortized (discount) premium & debt issuance (costs), net (394)
Total $ 15,340
As of December 31, 2017 , AES subsidiaries with facilities under construction had a total of approximately $1.8 billion of committed but unusedcredit facilities available to fund construction and other related costs. Excluding these facilities under construction, AES subsidiaries hadapproximately $1.7 billion in a number of available but unused committed credit lines to support their working capital, debt service reserves andother business needs. These credit lines can be used for borrowings, letters of credit, or a combination of these uses.
Significant transactions — During the year ended December 31, 2017 , the Company's subsidiaries had the following significant debttransactions:
Subsidiary Issuances Repayments Gain (Loss) on Extinguishment ofDebt
IPALCO $ 608 $ (528) $ (9)
Tietê 585 (293) (5)Southland 557 — —Gener 335
(426) (20)
AES Argentina 310 (181) 65Los Mina 303 (275) (4)Colon 262 — —Masinloc 160
(51) —
DPL 103 (249) (3)
Other 285 (547) (1)Total $ 3,508 $ (2,550) $ 23
Southland — In June 2017, AES Southland Energy LLC closed on $2 billion of aggregate principal long-term non-recourse debt financing tofund the Southland re-powering construction projects (“the Southland financing”). The Southland financing consists of $1.5 billion senior secured

notes, amortizing through 2040 , and $492 million senior secured term loan, amortizing through 2027 . The long-term debt financing has a combinedweighted average
134

THE AES CORPORATIONNOTES TO CONSOLIDATED FINANCIAL STATEMENTS—(Continued)
DECEMBER 31, 2017, 2016, AND 2015
cost of approximately 4.5% . As of December 31, 2017 , $557 million of the senior secured notes were outstanding under the Southland financing.AES Argentina — In February 2017, AES Argentina issued $300 million aggregate principal of unsecured and unsubordinated notes due in
2024 . The net proceeds from this issuance were used for the prepayment of $75 million of non-recourse debt related to the construction of the SanNicolas Plant resulting in a gain on extinguishment of debt of approximately $65 million .
Non-Recourse Debt Covenants, Restrictions and Defaults — The terms of the Company's non-recourse debt include certain financial andnonfinancial covenants. These covenants are limited to subsidiary activity and vary among the subsidiaries. These covenants may include, but arenot limited to, maintenance of certain reserves and financial ratios, minimum levels of working capital and limitations on incurring additionalindebtedness.
As of December 31, 2017 and 2016 , approximately $642 million and $535 million , respectively, of restricted cash was maintained inaccordance with certain covenants of the non-recourse debt agreements, and these amounts were included within Restricted cash and Debt servicereserves and other deposits in the accompanying Consolidated Balance Sheets.
Various lender and governmental provisions restrict the ability of certain of the Company's subsidiaries to transfer their net assets to the ParentCompany. Such restricted net assets of subsidiaries amounted to approximately $2.8 billion at December 31, 2017 .
The following table summarizes the Company's subsidiary non-recourse debt in default (in millions) as of December 31, 2017 . Due to thedefaults, these amounts are included in the current portion of non-recourse debt:
Primary Nature
of Default December 31, 2017
Subsidiary Default Net AssetsAlto Maipo (Chile) Covenant $ 618 $ 352AES Puerto Rico Covenant/Payment 365 692AES Ilumina Covenant 36 54
Total $ 1,019
The amounts in default related to Puerto Rico are covenant and payment defaults. In November 2017, AES Puerto Rico signed Forbearanceand Standstill Agreements with their lenders to prevent the lenders from taking action against the Company due to these default events. Theseagreements will expire on March 22, 2018.
All other defaults listed are not payment defaults. All of the subsidiary non-recourse defaults were triggered by failure to comply with covenantsand/or conditions such as (but not limited to) failure to meet information covenants, complete construction or other milestones in an allocated time,meet certain minimum or maximum financial ratios, or other requirements contained in the non-recourse debt documents of the applicablesubsidiary.
The AES Corporation's recourse debt agreements include cross-default clauses that will trigger if a subsidiary or group of subsidiaries forwhich the non-recourse debt is in default provides 20% or more of the Parent Company's total cash distributions from businesses for the four mostrecently completed fiscal quarters. As of December 31, 2017 , the Company has no defaults which result in or are at risk of triggering a cross-defaultunder the recourse debt of the Parent Company. In the event the Parent Company is not in compliance with the financial covenants of its seniorsecured revolving credit facility, restricted payments will be limited to regular quarterly shareholder dividends at the then-prevailing rate. Paymentdefaults and bankruptcy defaults would preclude the making of any restricted payments.
135

THE AES CORPORATIONNOTES TO CONSOLIDATED FINANCIAL STATEMENTS—(Continued)
DECEMBER 31, 2017, 2016, AND 2015
RECOURSE DEBT — The following table summarizes the carrying amount and terms of recourse debt of the Company as of the periodsindicated (in millions):
Interest Rate Final Maturity December 31, 2017 December 31, 2016Senior Unsecured Note LIBOR + 3.00% 2019 $ — $ 240Senior Unsecured Note 8.00% 2020 228 469Senior Unsecured Note 7.38% 2021 690 966Drawings on secured credit facility LIBOR + 2.00% 2021 207 —Senior Secured Term Loan LIBOR + 2.00% 2022 521 —Senior Unsecured Note 4.88% 2023 713 713Senior Unsecured Note 5.50% 2024 738 738Senior Unsecured Note 5.50% 2025 573 573Senior Unsecured Note 6.00% 2026 500 500Senior Unsecured Note 5.13% 2027 500 —Term Convertible Trust Securities 6.75% 2029 — 517
Unamortized (discount) premium & debt issuance (costs), net (40) (45)Subtotal $ 4,630 $ 4,671
Less: Current maturities (5) —Noncurrent maturities $ 4,625 $ 4,671
The following table summarizes the principal amounts due under our recourse debt for the next five years and thereafter (in millions):
December 31, Net Principal Amounts Due2018 $ 52019 52020 2342021 9022022 500Thereafter 3,024Unamortized (discount) premium & debt issuance (costs), net (40)
Total recourse debt $ 4,630
In August 2017, the Company issued $500 million aggregate principal amount of 5.125% senior notes due in 2027 . The Company used theseproceeds to redeem at par $240 million aggregate principal of its existing LIBOR + 3.00% senior unsecured notes due in 2019 and repurchased$217 million of its existing 8.00% senior unsecured notes due in 2020 . As a result of the latter transactions, the Company recognized a loss onextinguishment of debt of $36 million .
In May 2017, the Company closed on $525 million aggregate principal LIBOR + 2.00% secured term loan due in 2022 . In June 2017, theCompany used these proceeds to redeem at par all $517 million aggregate principal of its existing Term Convertible Securities. As a result of thelatter transaction, the Company recognized a loss on extinguishment of debt of $6 million .
In March 2017, the Company redeemed via tender offers $276 million aggregate principal of its existing 7.375% senior unsecured notes due in2021 and $24 million of its existing 8.00% senior unsecured notes due in 2020 . As a result of these transactions, the Company recognized a loss onextinguishment of debt of $47 million .
In July 2016, the Company redeemed in full the $181 million balance of its 8.00% outstanding senior unsecured notes due 2017 usingproceeds from its senior secured credit facility. As a result, the Company recognized a loss on extinguishment of debt of $16 million .
In May 2016, the Company issued $500 million aggregate principal amount of 6.00% senior notes due 2026 . The Company used theseproceeds to redeem, at par, $495 million aggregate principal of its existing LIBOR + 3.00% senior unsecured notes due 2019 . As a result of thelatter transaction, the Company recognized a loss on extinguishment of debt of $4 million .
In January 2016, the Company redeemed $125 million of its senior unsecured notes outstanding. The repayment included a portion of the7.375% senior notes due in 2021 , the 4.875% senior notes due in 2023 , the 5.5% senior notes due in 2024 , the 5.5% senior notes due in 2025and the floating rate senior notes due in 2019 . As a result of these transactions, the Company recognized a net gain on extinguishment of debt of$7 million .
Recourse Debt Covenants and Guarantees — The Company's obligations under the senior secured credit facility and senior secured term loanare, subject to certain exceptions, secured by (i) all of the capital stock of
136

THE AES CORPORATIONNOTES TO CONSOLIDATED FINANCIAL STATEMENTS—(Continued)
DECEMBER 31, 2017, 2016, AND 2015
domestic subsidiaries owned directly by the Company and 65% of the capital stock of certain foreign subsidiaries owned directly or indirectly by theCompany; and (ii) certain intercompany receivables, certain intercompany notes and certain intercompany tax sharing agreements.
The senior secured credit facility and senior secured term loan is subject to mandatory prepayment under certain circumstances, including thesale of certain assets. In such a situation, the net cash proceeds from the sale must be applied pro rata to repay the term loan, if any, using 60% ofnet cash proceeds, reduced to 50% when and if the parent's recourse debt to cash flow ratio is less than 5:1 . The lenders have the option to waivetheir pro rata redemption.
The senior secured credit facility contains customary covenants and restrictions on the Company's ability to engage in certain activities,including, but not limited to, limitations on other indebtedness, liens, investments and guarantees; limitations on restricted payments such asshareholder dividends and equity repurchases; restrictions on mergers and acquisitions, sales of assets, leases, transactions with affiliates and off-balance sheet or derivative arrangements; and other financial reporting requirements.
The senior secured credit facility also contains financial covenants, evaluated quarterly, requiring the Company to maintain a minimum ratio ofadjusted operating cash flow to interest charges on recourse debt of 1.3 times and a maximum ratio of recourse debt to adjusted operating cash flowof 7.5 times.
The terms of the Company's senior unsecured notes and senior secured term loan contain certain covenants including, without limitation,limitation on the Company's ability to incur liens or enter into sale and leaseback transactions.
TERM CONVERTIBLE TRUST SECURITIES — In 1999, AES Trust III, a wholly-owned special purpose business trust and a VIE, issuedapproximately 10.35 million of $50 par value TECONS with a quarterly coupon payment of $0.844 for total proceeds of $517 million and concurrentlypurchased $517 million of 6.75% Junior Subordinated Convertible Debentures due 2029 (the "6.75% Debentures") issued by AES. AES, at itsoption, may redeem the 6.75% Debentures which would result in the required redemption of the TECONS issued by AES Trust III for $50 perTECON. As of December 31, 2016 , the sole assets of AES Trust III were the 6.75% Debentures. In June 2017, the Company redeemed the 6.75% Debentures and redeemed at par all remaining aggregate principal of its existing TECONs.
11 . COMMITMENTSLEASES — The Company enters into long-term non-cancelable lease arrangements which, for accounting purposes, are classified as either
operating or capital leases. Operating leases primarily include certain transmission lines, office rental and site leases. Operating lease rentalexpense for the years ended December 31, 2017 , 2016 , and 2015 was $61 million , $61 million and $45 million , respectively. Capital leasesprimarily include transmission lines, vehicles, offices, and other operating equipment. Capital leases are recognized in Property, Plant andEquipment within Electric generation, distribution assets and other . The gross value of the capital lease assets as of December 31, 2017 and 2016was $27 million and $22 million , respectively. The following table shows the future minimum lease payments under operating and capital leases forcontinuing operations together with the present value of the net minimum lease payments under capital leases as of December 31, 2017 for 2018through 2022 and thereafter (in millions):
Future Commitments for
December 31, Capital Leases Operating Leases2018 $ 2 $ 582019 1 582020 1 582021 1 592022 1 58Thereafter 12 644Total $ 18 $ 935Less: Imputed interest (10) Present value of total minimum lease payments $ 8
CONTRACTS — The Company enters into long-term contracts for construction projects, maintenance and service, transmission of electricity,operations services and purchase of electricity and fuel. In general, these contracts are subject to variable quantities or prices and are terminableonly in limited circumstances. The following table shows the future minimum commitments for continuing operations under these contracts as ofDecember 31,
137

THE AES CORPORATIONNOTES TO CONSOLIDATED FINANCIAL STATEMENTS—(Continued)
DECEMBER 31, 2017, 2016, AND 2015
2017 for 2018 through 2022 and thereafter as well as actual purchases under these contracts for the years ended December 31, 2017 , 2016 , and2015 (in millions):
Actual purchases during the year ended December 31, Electricity Purchase Contracts Fuel Purchase Contracts Other Purchase Contracts2015 $ 545 $ 1,262 $ 1,8332016 420 1,790 8172017 747 1,619 1,945
Future commitments for the year ending December 31, 2018 $ 581 $ 1,759 $ 1,4882019 508 1,051 9312020 440 591 4702021 469 538 2342022 438 454 547Thereafter 2,065 1,466 1,314Total $ 4,501 $ 5,859 $ 4,984
12 . CONTINGENCIESGuarantees and Letters of Credit — In connection with certain project financings, acquisitions and dispositions, power purchases and other
agreements, the Parent Company has expressly undertaken limited obligations and commitments, most of which will only be effective or will beterminated upon the occurrence of future events. In the normal course of business, the Parent Company has entered into various agreements,mainly guarantees and letters of credit, to provide financial or performance assurance to third parties on behalf of AES businesses. Theseagreements are entered into primarily to support or enhance the creditworthiness otherwise achieved by a business on a stand-alone basis, therebyfacilitating the availability of sufficient credit to accomplish their intended business purposes. Most of the contingent obligations relate to futureperformance commitments which the Company expects to fulfill within the normal course of business. The expiration dates of these guarantees varyfrom less than one year to more than 17 years .
The following table summarizes the Parent Company's contingent contractual obligations as of December 31, 2017 . Amounts presented in thefollowing table represent the Parent Company's current undiscounted exposure to guarantees and the range of maximum undiscounted potentialexposure. The maximum exposure is not reduced by the amounts, if any, that could be recovered under the recourse or collateralization provisionsin the guarantees. There were no obligations made by the Parent Company for the direct benefit of the lenders associated with the non-recoursedebt of its businesses.
Contingent Contractual Obligations Amount (in millions) Number of Agreements Maximum Exposure Range for EachAgreement (in millions)
Guarantees and commitments $ 815 21 $1 — 272Letters of credit under the unsecured credit facility 52 4 $2 — 26Asset sale related indemnities (1) 27 1 27Letters of credit under the senior secured credit facility 36 21 <$1 — 13
Total $ 930 47 _____________________________
(1) Excludes normal and customary representations and warranties in agreements for the sale of assets (including ownership in associated legal entities) where the associated risk is considered to be nominal.
During the year ended December 31, 2017 , the Company paid letter of credit fees ranging from 0.25% to 2.25% per annum on theoutstanding amounts of letters of credit.
Environmental — The Company periodically reviews its obligations as they relate to compliance with environmental laws, including siterestoration and remediation. As of December 31, 2017 and 2016 the Company had recognized liabilities of $5 million and $9 million , respectively,for projected environmental remediation costs. Due to the uncertainties associated with environmental assessment and remediation activities, futurecosts of compliance or remediation could be higher or lower than the amount currently accrued. Moreover, where no liability has been recognized, itis reasonably possible that the Company may be required to incur remediation costs or make expenditures in amounts that could be material butcould not be estimated as of December 31, 2017 . In aggregate, the Company estimates that the range of potential losses related to environmentalmatters, where estimable, to be up to $18 million . The amounts considered reasonably possible do not include amounts accrued as discussedabove.
Litigation — The Company is involved in certain claims, suits and legal proceedings in the normal course of business. The Company accruesfor litigation and claims when it is probable that a liability has been incurred and
138

THE AES CORPORATIONNOTES TO CONSOLIDATED FINANCIAL STATEMENTS—(Continued)
DECEMBER 31, 2017, 2016, AND 2015
the amount of loss can be reasonably estimated. The Company has recognized aggregate liabilities for all claims of approximately $50 million and$59 million as of December 31, 2017 and 2016 , respectively. These amounts are reported on the Consolidated Balance Sheets within Accrued andother liabilities and Other noncurrent liabilities . A significant portion of these accrued liabilities relate to regulatory matters and commercial disputesin international jurisdictions. There can be no assurance that these accrued liabilities will be adequate to cover all existing and future claims or thatwe will have the liquidity to pay such claims as they arise.
Where no accrued liability has been recognized, it is reasonably possible that some matters could be decided unfavorably to the Company andcould require the Company to pay damages or make expenditures in amounts that could be material but could not be estimated as of December 31,2017 . The material contingencies where a loss is reasonably possible primarily include claims under financing agreements; disputes with offtakers,suppliers and EPC contractors; alleged violation of monopoly laws and regulations; income tax and non-income tax matters with tax authorities; andregulatory matters. In aggregate, the Company estimates that the range of potential losses, where estimable, related to these reasonably possiblematerial contingencies to be between $140 million and $173 million . The amounts considered reasonably possible do not include amounts accrued,as discussed above. These material contingencies do not include income tax-related contingencies which are considered part of our uncertain taxpositions.
13 . BENEFIT PLANSDefined Contribution Plan — The Company sponsors four defined contribution plans ("the DC Plans"). Two plans cover U.S. non-union
employees; one for Parent Company and certain US SBU business employees, and one for DPL employees. The remaining two plans include unionand non-union employees at IPL and union employees at DPL. The DC Plans are qualified under section 401 of the Internal Revenue Code. MostU.S. employees of the Company are eligible to participate in the appropriate plan except for those employees who are covered by a collectivebargaining agreement, unless such agreement specifically provides that the employee is considered an eligible employee under a plan. Within theDC Plans, the Company provides matching contributions in addition to other non-matching contributions. Participants are fully vested in their owncontributions. The Company's contributions vest over various time periods ranging from immediate up to five years. For the years endedDecember 31, 2017 , 2016 and 2015 , costs for defined contribution plans were approximately $23 million , $15 million and $18 million , respectively.
Defined Benefit Plans — Certain of the Company's subsidiaries have defined benefit pension plans covering substantially all of their respectiveemployees ("the DB Plans"). Pension benefits are based on years of credited service, age of the participant, and average earnings. Of the 31 activeDB Plans as of December 31, 2017 , five are at U.S. subsidiaries and the remaining plans are at foreign subsidiaries .
139

THE AES CORPORATIONNOTES TO CONSOLIDATED FINANCIAL STATEMENTS—(Continued)
DECEMBER 31, 2017, 2016, AND 2015
The following table reconciles the Company's funded status, both domestic and foreign, as of the periods indicated (in millions):
2017 2016
U.S. Foreign U.S. ForeignCHANGE IN PROJECTED BENEFIT OBLIGATION: Benefit obligation as of January 1 $ 1,188 $ 411 $ 1,172 $ 374
Service cost 13 10 13 9Interest cost 41 22 42 21Employee contributions — 1 — 1Plan amendments 1 (1) — (4)Plan curtailments 3 — 2 —Plan settlements — (2) — —Benefits paid (71) (22) (60) (19)Actuarial loss 82 29 19 58Effect of foreign currency exchange rate changes — 22 — (29)
Benefit obligation as of December 31 $ 1,257 $ 470 $ 1,188 $ 411CHANGE IN PLAN ASSETS: Fair value of plan assets as of January 1 $ 1,044 $ 402 $ 1,021 $ 379
Actual return on plan assets 141 31 61 59Employer contributions 13 18 22 18Employee contributions — 1 — 1Plan settlements — (2) — —Benefits paid (71) (22) (60) (19)Effect of foreign currency exchange rate changes — 27 — (36)
Fair value of plan assets as of December 31 $ 1,127 $ 455 $ 1,044 $ 402RECONCILIATION OF FUNDED STATUS Funded status as of December 31 $ (130) $ (15) $ (144) $ (9)
The following table summarizes the amounts recognized on the Consolidated Balance Sheets related to the funded status of the DB Plans,both domestic and foreign, as of the periods indicated (in millions):
December 31, 2017 2016Amounts Recognized on the Consolidated Balance Sheets U.S. Foreign U.S. ForeignNoncurrent assets $ — $ 69 $ — $ 60Accrued benefit liability—current — (6) — (5)Accrued benefit liability—noncurrent (130) (78) (144) (64)
Net amount recognized at end of year $ (130) $ (15) $ (144) $ (9)
The following table summarizes the Company's U.S. and foreign accumulated benefit obligation as of the periods indicated (in millions):
December 31, 2017 2016
U.S. Foreign U.S. ForeignAccumulated Benefit Obligation $ 1,236 $ 433 $ 1,167 $ 384
Information for pension plans with an accumulated benefit obligation in excess of plan assets: Projected benefit obligation $ 1,257 $ 109 $ 1,188 $ 90Accumulated benefit obligation 1,236 97 1,167 80Fair value of plan assets 1,127 33 1,044 25
Information for pension plans with a projected benefit obligation in excess of plan assets: Projected benefit obligation $ 1,257 $ 238 $ 1,188 $ 212Fair value of plan assets 1,127 154 1,044 142
The following table summarizes the significant weighted average assumptions used in the calculation of benefit obligation and net periodicbenefit cost, both domestic and foreign, as of the periods indicated:
December 31, 2017 2016

U.S. Foreign U.S. Foreign Benefit Obligation: Discount rate 3.67% 5.23% 4.28% 5.83% Rate of compensation increase 3.34% 4.65% 3.34% 4.86% Periodic Benefit Cost: Discount rate 4.28% 5.83% (1) 4.44% 6.10% (1)
Expected long-term rate of return on plan assets 6.67% 5.30% 6.67% 5.09% Rate of compensation increase 3.34% 4.86% 3.34% 4.45% _____________________________(1) Includes an inflation factor that is used to calculate future periodic benefit cost, but is not used to calculate the benefit obligation.
140

THE AES CORPORATIONNOTES TO CONSOLIDATED FINANCIAL STATEMENTS—(Continued)
DECEMBER 31, 2017, 2016, AND 2015
The Company establishes its estimated long-term return on plan assets considering various factors, which include the targeted asset allocationpercentages, historic returns, and expected future returns.
The measurement of pension obligations, costs, and liabilities is dependent on a variety of assumptions. These assumptions include estimatesof the present value of projected future pension payments to all plan participants, taking into consideration the likelihood of potential future eventssuch as salary increases and demographic experience. These assumptions may have an effect on the amount and timing of future contributions.
The assumptions used in developing the required estimates include the following key factors: discount rates; salary growth; retirement rates;inflation; expected return on plan assets; and mortality rates. The effects of actual results differing from the Company's assumptions areaccumulated and amortized over future periods and, therefore, generally affect the Company's recognized expense in such future periods.Unrecognized gains or losses are amortized using the “corridor approach,” under which the net gain or loss in excess of 10% of the greater of theprojected benefit obligation or the market-related value of the assets, if applicable, is amortized.
Sensitivity of the Company's pension funded status to the indicated increase or decrease in the discount rate and long-term rate of return onplan assets assumptions is shown below. Note that these sensitivities may be asymmetric and are specific to the base conditions at year-end 2017 .They also may not be additive, so the impact of changing multiple factors simultaneously cannot be calculated by combining the individualsensitivities shown. The funded status as of December 31, 2017 is affected by the assumptions as of that date. Pension expense for 2017 isaffected by the December 31, 2016 assumptions. The impact on pension expense from a one percentage point change in these assumptions isshown in the following table (in millions):
Increase of 1% in the discount rate $ (13)Decrease of 1% in the discount rate 12Increase of 1% in the long-term rate of return on plan assets (15)Decrease of 1% in the long-term rate of return on plan assets 15
The following table summarizes the components of the net periodic benefit cost, both domestic and foreign, for the years indicated (in millions):
December 31, 2017 2016 2015
Components of Net Periodic Benefit Cost: U.S. Foreign U.S. Foreign U.S. ForeignService cost $ 13 $ 10 $ 13 $ 9 $ 16 $ 10Interest cost 41 23 42 21 48 23Expected return on plan assets (69) (21) (68) (19) (70) (20)Amortization of prior service cost 6 — 7 (1) 7 —Amortization of net loss 18 2 18 2 20 2Curtailment loss recognized 4 — 4 — — —
Total pension cost $ 13 $ 14 $ 16 $ 12 $ 21 $ 15
The following table summarizes in millions the amounts reflected in AOCL, including AOCL attributable to noncontrolling interests, on theConsolidated Balance Sheet as of December 31, 2017 , that have not yet been recognized as components of net periodic benefit cost and amountsexpected to be reclassified to earnings in the next fiscal year (in millions):
December 31, 2017 Accumulated Other Comprehensive Income (Loss) Amounts expected to be reclassified to earnings in next fiscal year
U.S. Foreign U.S. ForeignPrior service cost $ (1) $ 1 $ — $ —Unrecognized net actuarial loss (22) (81) (2) (3)
Total $ (23) $ (80) $ (2) $ (3)
The following table summarizes the Company's target allocation for 2017 and pension plan asset allocation, both domestic and foreign, as ofthe periods indicated:
Percentage of Plan Assets as of December 31,
Target Allocations 2017 2016
Asset Category U.S. Foreign U.S. Foreign U.S. ForeignEquity securities 33% 4% 31.90% 4.61% 50.96% 18.66%Debt securities 65% 93% 64.53% 93.10% 45.88% 78.35%Real estate 2% —% 3.20% 0.44% 3.16% 0.75%Other —% 3% 0.37% 1.85% —% 2.24%
Total pension assets 100.00% 100.00% 100.00% 100.00%
141

THE AES CORPORATIONNOTES TO CONSOLIDATED FINANCIAL STATEMENTS—(Continued)
DECEMBER 31, 2017, 2016, AND 2015
The U.S. DB Plans seek to achieve the following long-term investment objectives:
• maintenance of sufficient income and liquidity to pay retirement benefits and other lump sum payments;• long-term rate of return in excess of the annualized inflation rate;• long-term rate of return, net of relevant fees, that meets or exceeds the assumed actuarial rate; and• long-term competitive rate of return on investments, net of expenses, that equals or exceeds various benchmark rates.
The asset allocation is reviewed periodically to determine a suitable asset allocation which seeks to manage risk through portfoliodiversification and takes into account the above-stated objectives, in conjunction with current funding levels, cash flow conditions and economic andindustry trends. The following table summarizes the Company's U.S. DB Plan assets by category of investment and level within the fair valuehierarchy as of the periods indicated (in millions):
December 31, 2017 December 31, 2016
U.S. Plans Level 1 Level 2 Level 3 Total Level 1 Level 2 Level 3 TotalEquity securities: Mutual funds $ 359 $ — $ — $ 359 $ 532 $ — $ — $ 532Debt securities: Government debt securities 135 — — 135 86 — — 86 Mutual funds (1) 593 — — 593 393 — — 393Real estate: Real estate — 36 — 36 — 33 — 33Other: Cash and cash equivalents 4 — — 4 — — — — Total plan assets $ 1,091 $ 36 $ — $ 1,127 $ 1,011 $ 33 $ — $ 1,044_____________________________
(1) Mutual funds categorized as debt securities consist of mutual funds for which debt securities are the primary underlying investment.
The investment strategy of the foreign DB Plans seeks to maximize return on investment while minimizing risk. The assumed asset allocationhas less exposure to equities in order to closely match market conditions and near term forecasts. The following table summarizes the Company'sforeign DB plan assets by category of investment and level within the fair value hierarchy as of the periods indicated (in millions):
December 31, 2017 December 31, 2016
Foreign Plans Level 1 Level 2 Level 3 Total Level 1 Level 2 Level 3 TotalEquity securities: Mutual funds $ 20 $ — $ — $ 20 $ 71 $ — $ — $ 71 Private equity — — 1 1 — — 4 4Debt securities: Government debt securities 11 — — 11 10 — — 10 Mutual funds (1) 323 90 — 413 215 90 — 305Real estate: Real estate — — 2 2 — — 3 3Other: Participant loans (2) — — — — — — 2 2 Other assets 1 — 7 8 4 — 3 7 Total plan assets $ 355 $ 90 $ 10 $ 455 $ 300 $ 90 $ 12 $ 402_____________________________(1) Mutual funds categorized as debt securities consist of mutual funds for which debt securities are the primary underlying investment.(2) Loans to participants are stated at cost, which approximates fair value.
The following table summarizes the estimated cash flows for U.S. and foreign expected employer contributions and expected future benefitpayments, both domestic and foreign (in millions):
U.S. ForeignExpected employer contribution in 2018 $ 39 $ 15Expected benefit payments for fiscal year ending: 2018 71 232019 73 232020 74 252021 75 262022 76 272023 - 2027 380 170
14 . EQUITYEquity Transactions with Noncontrolling Interests
Alto Maipo — In March 2017, AES Gener completed the legal and financial restructuring of Alto Maipo. As part of this restructuring, AESindirectly acquired the 40% ownership interest of the noncontrolling shareholder, for a de minimis payment, and sold a 6.7% interest in the project tothe construction contractor. This transaction resulted in a $196 million increase to the Parent Company’s Stockholders’ Equity due to an increase inadditional paid-in-capital

142

THE AES CORPORATIONNOTES TO CONSOLIDATED FINANCIAL STATEMENTS—(Continued)
DECEMBER 31, 2017, 2016, AND 2015
of $229 million , offset by the reclassification of accumulated other comprehensive losses from NCI to the Parent Company Stockholders’ Equity of$33 million . No gain or loss was recognized in net income as the sale was not considered to be a sale of in-substance real estate. After completionof the sale, the Company has an effective 62% economic interest in Alto Maipo. As the Company maintained control of the partnership after thesale, Alto Maipo continues to be consolidated by the Company within the Andes SBU reportable segment.
Dominican Republic — As part of a purchase agreement executed in 2014, Estrella and Linda Groups, an investor-based group in theDominican Republic, had options to acquire additional interests in our businesses in the Dominican Republic. In December 2015, Estrella and LindaGroups exercised their first call option to acquire an additional 2% of our businesses in the Dominican Republic for $18 million , resulting in a netincrease of $7 million to additional paid-in-capital. No gain or loss was recognized in net income as the sale was not considered to be a sale of in-substance real estate. After exercising this option, Estrella and Linda Groups held a 10% interest in our businesses in the Dominican Republic.Estrella and Linda Groups had a final option to acquire an additional 10% of our businesses in the Dominican Republic for $125 million whichexpired in December 2017.
In September 2017, Linda Group acquired 5% of our Dominican Republic business for $60 million , pre-tax. This transaction resulted in a netincrease of $25 million to the Company’s additional paid-in-capital and noncontrolling interest, respectively. No gain or loss was recognized in netincome as the sale was not considered a sale of in-substance real estate. As the Company maintained control after the sale, our businesses in theDominican Republic continue to be consolidated by the Company within the MCAC SBU reportable segment.
Jordan — In February 2016, the Company completed the sale of 40% of its interest in a wholly-owned subsidiary in Jordan that owns acontrolling interest in the Jordan IPP4 gas-fired plant for $21 million . The transaction was accounted for as a sale of in-substance real estate and apre-tax gain of $4 million , net of transaction costs, was recognized in net income. The cash proceeds from the sale are reflected in Proceeds fromthe sale of businesses, net of cash sold on the Consolidated Statement of Cash Flows for the period ended December 31, 2016. After completion ofthe sale, the Company has a 36% economic interest in Jordan IPP4 and continues to manage and operate the plant, with 40% owned by Mitsui Ltd.and 24% owned by Nebras Power Q.S.C. As the Company maintained control after the sale, Jordan IPP4 continues to be consolidated by theCompany within the Eurasia SBU reportable segment.
Brazil Reorganization — In 2015, the Company completed a restructuring of Tietê. This transaction resulted in no change of ownership orcontrol. The $27 million impact of this equity transaction was recognized in additional paid-in-capital.
Gener — In November 2015, the Company sold a 4% stake in AES Gener S.A. ("Gener") through its 99.9% owned subsidiary InversionesCachagua S.p.A ("Cachagua") for $145 million , net of transaction costs. The sale was of previously issued common shares of Gener to certaininstitutional investors and is not a sale of in-substance real estate. While the sale decreased Parent ownership interest from 70.7% to 66.7% , theParent continues to retain its controlling financial interest in the subsidiary. The difference of $24 million between the fair value of the considerationreceived, net of taxes and transaction costs, and the amount by which the NCI is adjusted was recognized in additional paid-in-capital. No pre-taxgain or loss was recognized in net income as a result of this transaction.
The following table summarizes the net income attributable to The AES Corporation and all transfers (to) from noncontrolling interests for theperiods indicated (in millions):
December 31,
2017 2016 2015
Net income (loss) attributable to The AES Corporation $ (1,161) $ (1,130) $ 306
Transfers from noncontrolling interest:
Net increase in The AES Corporation's paid-in capital for sale of subsidiary shares 13 84 323
Additional paid-in-capital, IPALCO shares, transferred to redeemable stock of subsidiaries (1) — (84) (377)
Increase (decrease) in The AES Corporation's paid-in-capital for purchase of subsidiary shares 240 (2) —
Net transfers (to) from noncontrolling interest 253 (2) (54)
Change from net income (loss) attributable to The AES Corporation and transfers (to) from noncontrolling interests $ (908) $ (1,132) $ 252_____________________________
(1) See Note 17 — Redeemable stock of subsidiaries for further information on increase in paid-in-capital transferred to redeemable stock of subsidiaries.
143

THE AES CORPORATIONNOTES TO CONSOLIDATED FINANCIAL STATEMENTS—(Continued)
DECEMBER 31, 2017, 2016, AND 2015
Deconsolidations
UK Wind — During 2016, the Company determined it no longer had control of its wind development projects in the United Kingdom (“UKWind”) as the Company no longer held seats on the board of directors. In accordance with accounting guidance, UK Wind was deconsolidated and aloss on deconsolidation of $20 million was recorded to Gain (loss) on disposal and sale of businesses in the Consolidated Statement of Operationsto write off the Company’s noncontrolling interest in the project. The UK Wind projects were reported in the Eurasia SBU reportable segment.
Accumulated Other Comprehensive Loss — The changes in AOCL by component, net of tax and noncontrolling interests, for the periodsindicated were as follows (in millions):
Foreign currency translationadjustment, net Unrealized derivative losses,
net Unfunded pensionobligations, net Total
Balance at December 31,2015 $ (3,256) $ (353) $ (274) $ (3,883)
Other comprehensive income (loss) before reclassifications 117 2 (13) 106
Amount reclassified to earnings 992 28 1 1,021
Other comprehensive income (loss) $ 1,109 $ 30 $ (12) $ 1,127
Balance at December 31, 2016 $ (2,147) $ (323) $ (286) $ (2,756)
Other comprehensive loss before reclassifications $ 18 $ (14) $ (19) $ (15)
Amount reclassified to earnings 643 37 248 928
Other comprehensive income $ 661 $ 23 $ 229 $ 913
Reclassification from NCI due to Alto Maipo Restructuring — (33) — (33)
Balance at December 31, 2017 $ (1,486) $ (333) $ (57) $ (1,876)
Reclassifications out of AOCL are presented in the following table. Amounts for the periods indicated are in millions and those in parenthesisindicate debits to the Condensed Consolidated Statements of Operations:
Details About December 31,AOCL Components Affected Line Item in the Consolidated Statements of Operations 2017 2016 2015
Foreign currency translation adjustments, net Gain (loss) on disposal and sale of businesses $ (188) $ — $ — Net loss from disposal and impairments of discontinued operations (455) (992) — Net income (loss) attributable to The AES Corporation $ (643) $ (992) $ —Unrealized derivative gains (losses), net Non-regulated revenue $ 25 $ 111 $ 43 Non-regulated cost of sales (12) (57) (14) Interest expense (79) (107) (112) Gain (loss) on disposal and sale of businesses — — (4) Foreign currency transaction gains 15 8 12 Income from continuing operations before taxes and equity in earnings of affiliates (51) (45) (75) Income tax expense 1 8 11 Net equity in earnings of affiliates — — (2) Income (loss) from continuing operations (50) (37) (66) Less: (Income) from continuing operations attributable to noncontrolling interests 13 9 18 Net income (loss) attributable to The AES Corporation $ (37) $ (28) $ (48)Amortization of defined benefit pension actuarial losses, net Non-regulated cost of sales 1 — 2 General and administrative expenses (1) (1) (2) Other expense — (1) — Income from continuing operations before taxes and equity in earnings of affiliates — (2) — Income tax expense — 3 9 Income from continuing operations — 1 9 Net loss from disposal and impairments of discontinued operations (266) (11) (25) Net income (loss) (266) (10) (16) Less: (Income) from continuing operations attributable to noncontrolling interests — 9 14 Add: Loss from discontinued operations attributable to noncontrolling interests 18 — — Net income (loss) attributable to The AES Corporation $ (248) $ (1) $ (2)

Total reclassifications for the period, net of income tax and noncontrolling interests $ (928) $ (1,021) $ (50)
Common Stock Dividends — The Parent Company paid dividends of $0.12 per outstanding share to its common stockholders during the first,second, third and fourth quarters of 2017 for dividends declared in December 2016, February, July, and October 2017, respectively.
144

THE AES CORPORATIONNOTES TO CONSOLIDATED FINANCIAL STATEMENTS—(Continued)
DECEMBER 31, 2017, 2016, AND 2015
On December 8, 2017, the Board of Directors declared a quarterly common stock dividend of $0.13 per share payable on February 15, 2018 toshareholders of record at the close of business on February 1, 2018.
Stock Repurchase Program — No shares were repurchased in 2017. The cumulative repurchases from the commencement of the Program inJuly 2010 through December 31, 2017 totaled 154.3 million shares for a total cost of $1.9 billion , at an average price per share of $12.12 (includinga nominal amount of commissions). As of December 31, 2017 , $246 million remained available for repurchase under the Program.
The common stock repurchased has been classified as treasury stock and accounted for using the cost method. A total of 155,924,785 and156,878,891 shares were held as treasury stock at December 31, 2017 and 2016 , respectively. Restricted stock units under the Company'semployee benefit plans are issued from treasury stock. The Company has not retired any common stock repurchased since it began the Program inJuly 2010.
15 . SEGMENTS AND GEOGRAPHIC INFORMATIONThe segment reporting structure uses the Company's organizational structure as its foundation to reflect how the Company manages the
businesses internally and is organized by geographic regions which provides a socio-political-economic understanding of our business. During thethird quarter of 2017, the Europe and Asia SBUs were merged in order to leverage scale and are now reported as part of the Eurasia SBU. Themanagement reporting structure is organized by five SBUs led by our President and Chief Executive Officer: US, Andes, Brazil, MCAC and EurasiaSBUs. The Company determined that it has five operating and five reportable segments corresponding to its SBUs. All prior period results havebeen retrospectively revised to reflect the new segment reporting structure. In February 2018, we announced a reorganization as a part of ourongoing strategy to simplify our portfolio, optimize our cost structure, and reduce our carbon intensity. The Company is currently evaluating theimpact this reorganization will have on our segment reporting structure.
Corporate and Other — Corporate overhead costs which are not directly associated with the operations of our five reportable segments areincluded in "Corporate and Other." Also included are certain intercompany charges such as self-insurance premiums which are fully eliminated inconsolidation.
The Company uses Adjusted PTC as its primary segment performance measure. Adjusted PTC, a non-GAAP measure, is defined by theCompany as pre-tax income from continuing operations attributable to The AES Corporation excluding gains or losses of the consolidated entity dueto (a) unrealized gains or losses related to derivative transactions; (b) unrealized foreign currency gains or losses; (c) gains, losses and associatedbenefits and costs due to dispositions and acquisitions of business interests, including early plant closures; (d) losses due to impairments; (e) gains,losses and costs due to the early retirement of debt; and (f) costs directly associated with a major restructuring program, including, but not limited to,workforce reduction efforts, relocations, and office consolidation . Adjusted PTC also includes net equity in earnings of affiliates on an after-tax basisadjusted for the same gains or losses excluded from consolidated entities. The Company has concluded Adjusted PTC better reflects the underlyingbusiness performance of the Company and is the most relevant measure considered in the Company's internal evaluation of the financialperformance of its segments. Additionally, given its large number of businesses and complexity, the Company concluded that Adjusted PTC is amore transparent measure that better assists investors in determining which businesses have the greatest impact on the Company's results.
Revenue and Adjusted PTC are presented before inter-segment eliminations, which includes the effect of intercompany transactions with othersegments except for interest, charges for certain management fees, and the write-off of intercompany balances, as applicable. All intra-segmentactivity has been eliminated within the segment. Inter-segment activity has been eliminated within the total consolidated results.
The following tables present financial information by segment for the periods indicated (in millions):
Total Revenue
Year Ended December 31, 2017 2016 2015US SBU $ 3,229 $ 3,429 $ 3,593Andes SBU 2,710 2,506 2,489Brazil SBU 542 450 962MCAC SBU 2,448 2,172 2,353Eurasia SBU 1,590 1,670 1,875Corporate and Other 35 77 31Eliminations (24) (23) (43)
Total Revenue $ 10,530 $ 10,281 $ 11,260
145

THE AES CORPORATIONNOTES TO CONSOLIDATED FINANCIAL STATEMENTS—(Continued)
DECEMBER 31, 2017, 2016, AND 2015
Reconciliation from Income from Continuing Operations before Taxes and Equity in Earnings of Affiliates: Total Adjusted PTCYear Ended December 31,
2017 2016 2015Income from continuing operations before taxes and equity in earnings of affiliates $ 771 $ 187 $ 989
Add: Net equity earnings in affiliates 71 36 105Less: Income from continuing operations before taxes, attributable to noncontrolling interests (521) (354) (513)
Pre-tax contribution 321 (131) 581Unrealized derivative gains (3) (9) (166)Unrealized foreign currency (gains) losses (59) 22 95Disposition/acquisition (gains) losses 123 6 (42)Impairment losses 542 933 504Loss on extinguishment of debt 62 29 179Restructuring costs (1)
31 — —Total Adjusted PTC $ 1,017 $ 850 $ 1,151_____________________________
(1) One-time restructuring charges consisting of severance costs related to workforce reductions.
Total Adjusted PTC
Year Ended December 31, 2017 2016 2015US SBU $ 361 $ 347 $ 360Andes SBU 386 390 482Brazil SBU 60 38 92MCAC SBU 340 267 327Eurasia SBU 290 283 331Corporate and Other (420) (475) (441)
Total Adjusted PTC $ 1,017 $ 850 $ 1,151
Total Assets Depreciation and Amortization Capital Expenditures
Year Ended December 31, 2017 2016 2015 2017 2016 2015 2017 2016 2015US SBU $ 9,852 $ 9,333 $ 9,800 $ 437 $ 471 $ 443 $ 858 $ 809 $ 861Andes SBU 8,840 8,971 8,594 250 218 175 443 538 949Brazil SBU 2,034 1,516 1,179 51 33 39 34 31 47MCAC SBU 5,532 5,162 4,820 172 165 155 482 480 201Eurasia SBU 4,557 5,777 6,200 127 149 166 211 279 131Assets of discontinued operations and held-for-sale businesses 2,034 4,936 5,411 123 128 146 315 303 252Corporate and Other 263 429 541 9 12 20 13 18 17
Total $ 33,112 $ 36,124 $ 36,545 $ 1,169 $ 1,176 $ 1,144 $ 2,356 $ 2,458 $ 2,458
Interest Income Interest Expense
Year Ended December 31, 2017 2016 2015 2017 2016 2015US SBU $ — $ — $ — $ 258 $ 236 $ 262Andes SBU 50 57 77 205 178 154Brazil SBU 45 38 31 92 69 58MCAC SBU 18 11 30 168 163 179Eurasia SBU 130 139 116 167 179 158Corporate and Other 1 — 2 280 309 334
Total $ 244 $ 245 $ 256 $ 1,170 $ 1,134 $ 1,145
Investments in and Advances to Affiliates Net Equity in Earnings of Affiliates
Year Ended December 31, 2017 2016 2015 2017 2016 2015US SBU $ 527 $ 23 $ 1 $ 41 $ 9 $ —Andes SBU 358 363 345 28 15 83MCAC SBU 3 (1) — (4) (2) —Eurasia SBU 307 236 248 9 13 18

Corporate and Other 2 — 16 (3) 1 4Total $ 1,197 $ 621 $ 610 $ 71 $ 36 $ 105
146

THE AES CORPORATIONNOTES TO CONSOLIDATED FINANCIAL STATEMENTS—(Continued)
DECEMBER 31, 2017, 2016, AND 2015
The following table presents information, by country, about the Company's consolidated operations for each of the three years endedDecember 31, 2017 , 2016 , and 2015 , and as of December 31, 2017 and 2016 (in millions). Revenue is recorded in the country in which it isearned and assets are recorded in the country in which they are located.
Total Revenue Property, Plant & Equipment, net
Year Ended December 31, 2017 2016 2015 2017 2016
United States $ 3,240 $ 3,489 $ 3,597 $ 7,403 $ 7,397Non-U.S.:
Chile 1,944 1,707 1,523 5,066 4,995
Dominican Republic 826 614 632 935 914El Salvador 686 601 736 340 327
Brazil 541 450 962 1,286 789Philippines 449 401 406 — 866Argentina 435 359 399 223 195Bulgaria 367 334 382 1,290 1,174Mexico 352 342 383 687 699Panama 338 312 297 1,615 1,233Colombia 332 437 557 332 451
United Kingdom 328 337 396 108 151Vietnam (1)
278 340 233 2 1Puerto Rico 247 301 302 565 583Jordan 95 136 248 431 452Kazakhstan 67 103 155 — 178
Other Non-U.S. 5 18 52 13 10Total Non-U.S. 7,290 6,792 7,663 12,893 13,018Total $ 10,530 $ 10,281 $ 11,260 $ 20,296 $ 20,415_____________________________
(1) The Mong Duong II power project is accounted for as a service concession arrangement. Costs of construction of the plant have been deferred in Service concession assets on the Consolidated BalanceSheets.
16 . SHARE-BASED COMPENSATIONRESTRICTED STOCKRestricted Stock Units — The Company issues restricted stock units ("RSUs") under its long-term compensation plan. The RSUs are
generally granted based upon a percentage of the participant's base salary. The units have a three -year vesting schedule and vest in one-thirdincrements over the three -year period. In all circumstances, RSUs granted by AES do not entitle the holder the right, or obligate AES, to settle theRSU in cash or other assets of AES.
For the years ended December 31, 2017 , 2016 , and 2015 , RSUs issued had a grant date fair value equal to the closing price of theCompany's stock on the grant date. The Company does not discount the grant date fair values to reflect any post-vesting restrictions. RSUs grantedto employees during the years ended December 31, 2017 , 2016 , and 2015 had grant date fair values per RSU of $11.93 , $9.42 and $12.03 ,respectively.
The following table summarizes the components of the Company's stock-based compensation related to its employee RSUs recognized in theCompany's consolidated financial statements (in millions):
December 31, 2017 2016 2015RSU expense before income tax $ 17 $ 14 $ 13Tax benefit (4) (4) (3)RSU expense, net of tax $ 13 $ 10 $ 10
Total value of RSUs converted (1) $ 10 $ 7 $ 16Total fair value of RSUs vested $ 15 $ 13 $ 12_____________________________(1) Amount represents fair market value on the date of conversion.
Cash was not used to settle RSUs or compensation cost capitalized as part of the cost of an asset for the years ended December 31, 2017 ,2016 , and 2015 . As of December 31, 2017 , total unrecognized compensation cost related to RSUs of $17 million is expected to be recognizedover a weighted average period of approximately 1.8 years. There were no modifications to RSU awards during the year ended December 31, 2017.
147

THE AES CORPORATIONNOTES TO CONSOLIDATED FINANCIAL STATEMENTS—(Continued)
DECEMBER 31, 2017, 2016, AND 2015
A summary of the activity of RSUs for the year ended December 31, 2017 follows (RSUs in thousands):
RSUs Weighted Average Grant Date FairValues Weighted Average Remaining
Vesting TermNon-vested at December 31, 2016 3,037 $ 10.70 Vested (1,337) 11.37 Forfeited and expired (280) 10.94 Granted 1,546 11.93 Non-vested at December 31, 2017 2,966 $ 11.02 1.4Vested and expected to vest at December 31, 2017 2,711 $ 11.01
The Company initially recognizes compensation cost on the estimated number of instruments for which the requisite service is expected to berendered. In 2017 , AES has estimated a weighted average forfeiture rate of 10.35% for RSUs granted in 2017 . This estimate will be revised ifsubsequent information indicates that the actual number of instruments forfeited is likely to differ from previous estimates. Based on the estimatedforfeiture rate, the Company expects to expense $17 million on a straight-line basis over a three -year period.
The following table summarizes the RSUs that vested and were converted during the periods indicated (RSUs in thousands):
Year Ended December 31, 2017 2016 2015RSUs vested during the year 1,337 1,063 954RSUs converted during the year, net of shares withheld for taxes 865 705 1,238Shares withheld for taxes 472 358 549
OTHER SHARE BASED COMPENSATIONThe Company has three other share-based award programs. The Company has recorded expenses of $8 million , $10 million and $8 million for
2017, 2016 and 2015, respectively, related to these programs.
Stock options — AES grants options to purchase shares of common stock under stock option plans to employees and non-employeedirectors. Under the terms of the plans, the Company may issue options to purchase shares of the Company's common stock at a price equal to100% of the market price at the date the option is granted. Stock options issued in 2015 have a three -year vesting schedule and vest in one-thirdincrements over the three -year period. The stock options have a contractual term of ten years. In all circumstances, stock options granted by AESdo not entitle the holder the right, or obligate AES, to settle the stock option in cash or other assets of AES.
Performance Stock Units — In 2015, 2016 and 2017, the Company issued performance stock units ("PSUs") to officers under its long-termcompensation plan. PSUs are restricted stock units; certain units awarded include a market condition and the remaining awards includeperformance conditions. Performance conditions are based on Company's Adjusted EBITDA targets for 2015 and Free Cash Flow targets for 2016and 2017. For the units subject to market conditions, the total stockholder return on AES common stock must exceed the total stockholder return ofthe Standard and Poor's 500 Utilities Sector Index over a three-year measurement period. The market and performance conditions determine thevesting and final share equivalent per PSU and can result in earning an award payout range of 0% to 200% , depending on the achievement. TheCompany believes that it is probable that the performance condition will be met and will continue to be evaluated throughout the performanceperiod. In all circumstances, PSUs granted by AES do not entitle the holder the right, or obligate AES, to settle the RSU in cash or other assets ofAES.
Performance Cash Units — In 2016 and 2017, the Company issued Performance Cash Units ("PCUs") to its officers under its long-termcompensation plan. The value of these units depends on the total stockholder return on AES common stock as compared to the total stockholderreturn of the Standard and Poor's 500 Utilities Sector Index, Standard and Poor's 500 Index and MSCI Emerging Market Index over a three -yearmeasurement period. Since PCUs are settled in cash, they qualify for liability accounting and periodic measurement is required.
148

THE AES CORPORATIONNOTES TO CONSOLIDATED FINANCIAL STATEMENTS—(Continued)
DECEMBER 31, 2017, 2016, AND 2015
17 . REDEEMABLE STOCK OF SUBSIDIARIES
The following table is a reconciliation of changes in redeemable stock of subsidiaries (in millions):
December 31, 2017 2016
Balance at the beginning of the period $ 782 $ 538
Sale of redeemable stock of subsidiaries — 134
Contributions from holders of redeemable stock of subsidiaries 50 130
Net loss attributable to redeemable stock of subsidiaries (14) (11)Fair value adjustment (1)
25 4
Other comprehensive income (loss) attributable to redeemable stock of subsidiaries (2) 6
Acquisition and reclassification of stock of subsidiaries (4) (19)
Balance at the end of the period $ 837 $ 782 _____________________________
(1) $5 million increase in fair value of DP&L preferred shares offset by $1 million decrease in fair value of Colon common stock in 2016.
The following table summarizes the Company's redeemable stock of subsidiaries balances as of the periods indicated (in millions):
December 31, 2017 2016
IPALCO common stock $ 618 $ 618
Colon quotas (1) 159 100
IPL preferred stock 60 60
Other common stock — 4
Total redeemable stock of subsidiaries $ 837 $ 782 _____________________________
(1) Characteristics of quotas are similar to common stock.
Colon — Our partner in Colon made capital contributions of $50 million and $106 million during the year ended December 31, 2017 and 2016 ,respectively. Any subsequent adjustments to allocate earnings and dividends to our partner, or measure the investment at fair value, will beclassified as temporary equity each reporting period as it is probable that the shares will become redeemable.
IPL — IPL had $60 million of cumulative preferred stock outstanding at December 31, 2017 and 2016 , which represent five series of preferredstock. The total annual dividend requirements were approximately $3 million at December 31, 2017 and 2016 . Certain series of the preferred stockwere redeemable solely at the option of the issuer at prices between $100 and $118 per share. Holders of the preferred stock are entitled to elect amajority of IPL's board of directors if IPL has not paid dividends to its preferred stockholders for four consecutive quarters. Based on the preferredstockholders' ability to elect a majority of IPL's board of directors in this circumstance, the redemption of the preferred shares is considered to be notsolely within the control of the issuer and the preferred stock is considered temporary equity.
DPL — DPL had $18 million of cumulative preferred stock outstanding as of December 31, 2015, for which redemption became probable inSeptember 2016. As such, the Company recorded an adjustment of $5 million to retained earnings to adjust the preferred shares to their redemptionvalue of $23 million . In October 2016, DPL redeemed all of its preferred shares. Upon redemption, the preferred shares were no longer outstandingand all rights of the shareholders of DPL ceased to exist.
IPALCO — In February 2015, CDPQ purchased 15% of AES US Investment, Inc., a wholly-owned subsidiary of IPALCO, for $247 million , withan option to invest an additional $349 million in IPALCO through 2016 in exchange for a 17.65% equity stake. In April 2015, CDPQ invested anadditional $214 million in IPALCO, which resulted in CDPQ's combined direct and indirect interest in IPALCO of 24.90% . As a result of thesetransactions, $84 million in taxes and transaction costs were recognized as a net decrease to equity. The Company also recognized an increase toadditional paid-in-capital and a reduction to retained earnings of $377 million for the excess of the fair value of the shares over their book value. Nogain or loss was recognized in net income as the transaction was not considered to be a sale of in-substance real estate.
In March 2016, CDPQ exercised its remaining option by investing $134 million in IPALCO, which resulted in CDPQ's combined direct andindirect interest in IPALCO of 30% . The Company also recognized an increase to additional paid-in-capital and a reduction to retained earnings of$84 million for the excess of the fair value of the shares over their book value. In June 2016, CDPQ contributed an additional $24 million to IPALCO,with no impact to the ownership structure of the investment. Any subsequent adjustments to allocate earnings and dividends to
149

THE AES CORPORATIONNOTES TO CONSOLIDATED FINANCIAL STATEMENTS—(Continued)
DECEMBER 31, 2017, 2016, AND 2015
CDPQ will be classified as NCI within permanent equity as it is not probable that the shares will become redeemable.
18 . OTHER INCOME AND EXPENSEOther Income — Other income generally includes gains on asset sales and liability extinguishments, favorable judgments on contingencies,
gains on contract terminations, allowance for funds used during construction and other income from miscellaneous transactions. The componentsare summarized as follows (in millions):
Year Ended December 31, 2017 2016 2015Legal settlements (1)
$ 60 $ — $ —Allowance for funds used during construction (US Utilities) 26 29 17Gain on sale of assets 1 4 17Contract termination — — 20Other 33 31 30
Total other income $ 120 $ 64 $ 84_____________________________
(1) In December 2016, the Company and YPF entered into a settlement in which all parties agreed to give up any and all legal action related to gas supply contracts that were terminated in 2008 and have beenin dispute since 2009. In January 2017, the YPF board approved the agreement and paid the Company $60 million, thereby resolving all uncertainties around the dispute.
Other Expense — Other expense generally includes losses on asset sales and dispositions, losses on legal contingencies, and losses fromother miscellaneous transactions. The components are summarized as follows (in millions):
Year Ended December 31, 2017 2016 2015Allowance for other receivables (1)
$ — $ 52 $ —Loss on sale and disposal of assets 28 12 —Water rights write-off 19 6 10Other 10 9 14
Total other expense $ 57 $ 79 $ 24 _____________________________
(1) During the fourth quarter of 2016, we recognized a full allowance on a non-trade receivable in the MCAC SBU as a result of payment delays and discussions with the counterparty. The allowance relates tocertain reimbursements the Company was expecting in connection with a legal matter. Management believes the counterparty is obligated to pay and plans to continue to attempt to fully collect the non-tradereceivable.
19 . ASSET IMPAIRMENT EXPENSE
Year ended December 31, (in millions) 2017 2016 2015DPL $ 175 $ 859 $ —Laurel Mountain 121 — —Kazakhstan Hydroelectric 92 — —Kazakhstan CHPs 94 — —Kilroot 37 — 121Buffalo Gap II — 159 —Buffalo Gap I — 77 —Buffalo Gap III — — 116U.K. Wind — — 37Other 18 1 11
Total $ 537 $ 1,096 $ 285
Laurel Mountain — During the fourth quarter of 2017, the Company tested the recoverability of its long-lived assets at Laurel Mountain, a windfarm in the U.S. Impairment indicators were identified based on a decline in forward pricing. The Company determined that the carrying amount wasnot recoverable. The Laurel Mountain asset group was determined to have a fair value of $33 million using the income approach. As a result, theCompany recognized an asset impairment expense of $121 million . Laurel Mountain is reported in the US SBU reportable segment.
Kilroot — During the fourth quarter of 2017, the Company tested the recoverability of its long-lived assets at Kilroot, a coal and oil-fired plant inNorthern Ireland, as Kilroot was not successful in bidding its coal units into the December 2017 capacity auction for the newly implemented I-SEMmarket. The Company determined that the carrying amount of the asset group was not recoverable. The Kilroot asset group was determined to havea fair value of $20 million using the income approach. As a result, the Company recognized an asset impairment expense of $37 million , which waslimited to the carrying value of the coal units. Kilroot is reported in the Eurasia SBU reportable segment.
150

THE AES CORPORATIONNOTES TO CONSOLIDATED FINANCIAL STATEMENTS—(Continued)
DECEMBER 31, 2017, 2016, AND 2015
During 2015, the Company tested the recoverability of long-lived assets at Kilroot when the regulator established lower capacity prices for the I-SEM. The Company determined that the carrying amount of the asset group was not recoverable. The Kilroot asset group was determined to have afair value of $70 million using the income approach. As a result, the Company recognized asset impairment expense of $121 million . Kilroot isreported in the Eurasia SBU reportable segment.
Kazakhstan Hydroelectric — In April 2017, the Republic of Kazakhstan stated the concession agreements would not be extended for ShulbinskHPP and Ust-Kamenogorsk HPP, two hydroelectric plants in Kazakhstan, and initiated the process to transfer these plants back to the government.Upon meeting the held-for-sale criteria in the second quarter of 2017, the Company performed an impairment analysis and determined the carryingvalue of the asset group of $190 million , which included cumulative translation losses of $100 million , was greater than its fair value less costs tosell of $92 million . As a result, the Company recognized asset impairment expense of $92 million limited to the carrying value of the long-livedassets. The Company completed the transfer of the plants in October 2017. Prior to their transfer, the Kazakhstan hydroelectric plants were reportedin the Eurasia SBU reportable segment. See Note 22 — Held-for-Sale Businesses and Dispositions for further information.
Kazakhstan CHPs — In January 2017, the Company entered into an agreement for the sale of Ust-Kamenogorsk CHP and Sogrinsk CHP, itscombined heating and power coal plants in Kazakhstan. Upon meeting the held-for-sale criteria in the first quarter of 2017, the Company performedan impairment analysis and determined that the carrying value of the asset group of $171 million , which included cumulative translation losses of$92 million , was greater than its fair value less costs to sell of $29 million . As a result, the Company recognized asset impairment expense of $94million limited to the carrying value of the long-lived assets. The Company completed the sale of its interest in the Kazakhstan CHP plants in April2017. Prior to their sale, the plants were reported in the Eurasia SBU reportable segment. See Note 22 — Held-for-Sale Businesses andDispositions for further information.
DPL — In March 2017, the Board of Directors of DPL approved the retirement of the DPL operated and co-owned Stuart coal-fired and diesel-fired generating units, and the Killen coal-fired generating unit and combustion turbine on or before June 1, 2018. The Company performed animpairment analysis and determined that the carrying amounts of the facilities were not recoverable. The Stuart and Killen asset groups weredetermined to have fair values of $3 million and $8 million , respectively, using the income approach. As a result, the Company recognized totalasset impairment expense of $66 million . DPL is reported in the US SBU reportable segment.
In December 2017, DPL entered into an agreement for the sale of six of its combustion turbine and diesel-fired generation facilities and relatedassets ("DPL peaker assets"). Upon meeting the held-for-sale criteria, the Company performed an impairment analysis and determined that thecarrying value of the asset group of $346 million was greater than its fair value less costs to sell of $237 million . As a result, the Companyrecognized asset impairment expense of $109 million . The DPL peaker assets are reported in the US SBU reportable segment. See Note 22 —Held-for-Sale Businesses and Dispositions for further information.
During the second quarter of 2016, the Company tested the recoverability of its long-lived generation assets at DPL. Uncertainty created by theSupreme Court of Ohio’s June 20, 2016 opinion regarding ESP 2, lower expectations of future revenue resulting from the most recent PJM capacityauction and higher anticipated environmental compliance costs resulting from third party studies were collectively determined to be an impairmentindicator for these assets. The Company performed an impairment analysis and determined that the carrying amount of Killen, a coal-firedgeneration facility, and certain DPL peaking generation facilities were not recoverable. The Killen and DPL peaking generation asset groups weredetermined to have a fair value of $84 million and $5 million , respectively, using the income approach. As a result, the Company recognized totalasset impairment expense of $235 million . DPL is reported in the US SBU reportable segment.
During the fourth quarter of 2016, the Company tested the recoverability of its long-lived coal-fired generation assets and one gas-fired peakingplant at DPL. Uncertainty around the useful life of Stuart and Killen related to the Company’s ESP proceedings and lower forward dark spreads andcapacity prices were collectively determined to be an impairment indicator for these assets. Market information indicating a significant decrease inthe fair value of Zimmer and Miami Fort was determined to be an indicator of impairment for these assets. The lower forward dark spreads andcapacity prices, along with the indicators at the other coal-fired facilities, collectively, resulted in an indicator of impairment for the Conesville assetgroup. For the gas-fired peaking plant, significant incremental capital expenditures relative to its fair value, and an impairment charge taken at thisfacility in the second quarter of 2016, were collectively determined to be impairment indicators for this asset. The Company performed animpairment analysis for each of these asset groups and determined that their carrying amounts were not
151

THE AES CORPORATIONNOTES TO CONSOLIDATED FINANCIAL STATEMENTS—(Continued)
DECEMBER 31, 2017, 2016, AND 2015
recoverable. The Stuart, Killen, Miami Fort, Zimmer, Conesville and the gas-fired peaking plant asset groups were determined to have fair values of $57 million , $43 million , $36 million , $24 million , $1 million and $2 million , respectively, using the market approach for Miami Fort and Zimmerand the income approach for the remaining asset groups. As a result, the Company recognized total asset impairment expense of $624 million .DPL is reported in the US SBU reportable segment.
Buffalo Gap I — During 2016, the Company tested the recoverability of its long-lived assets at Buffalo Gap I. Low wind production during 2016resulted in management lowering future expectations of production and therefore future forecasted revenues. As such this was determined to be animpairment indicator. The Company determined that the carrying amount of the asset group was not recoverable. The Buffalo Gap I asset groupwas determined to have a fair value of $36 million using the income approach. As a result, the Company recognized asset impairment expense of$77 million ( $23 million attributable to AES). Buffalo Gap I is reported in the US SBU reportable segment.
Buffalo Gap II — During 2016, the Company tested the recoverability of its long-lived assets at Buffalo Gap II. Impairment indicators wereidentified based on a decline in forward power curves. The Company determined that the carrying amount was not recoverable. The Buffalo Gap IIasset group was determined to have a fair value of $92 million using the income approach. As a result, the Company recognized asset impairmentexpense of $159 million ( $49 million attributable to AES). Buffalo Gap II is reported in the US SBU reportable segment.
Buffalo Gap III — During 2015, the Company tested the recoverability of its long-lived assets at Buffalo Gap III, a wind farm in Texas.Impairment indicators were identified based on a decline in forward power curves coupled with the near term expiration of favorable contracted cashflows. The Company determined that the carrying amount was not recoverable. The Buffalo Gap III asset group was determined to have a fair valueof $118 million using the income approach. As a result, the Company recognized asset impairment expense of $116 million . Buffalo Gap III isreported in the US SBU reportable segment.
U.K. Wind — During 2015, the Company decided to no longer pursue two wind projects in the U.K. based on regulatory clarifications specific tothese projects, resulting in a full impairment. Impairment indicators were also identified at four other wind projects based on their currentdevelopment status and a reassessment of the likelihood that each project would be pursued given aviation concerns, regulatory changes,economic considerations and other factors. The Company determined that the carrying amounts of each of these asset groups, which totaled $38million , were not recoverable. In aggregate, the asset groups were determined to have a fair value of $1 million using the market approach and, asa result, the Company recognized asset impairment expense of $37 million . The U.K. Wind Projects are reported in the Eurasia SBU reportablesegment. See Note 22 — Held-for-Sale Businesses and Dispositions for further information.
20 . INCOME TAXESU.S. Tax Reform — On December 22, 2017, the U.S. enacted the Tax Cuts and Jobs Act (the “2017 Act”). The 2017 Act significantly changes
U.S. corporate income tax law. Among other changes effective in 2017, the 2017 Act requires companies to pay a one-time tax on certainunrepatriated earnings of foreign subsidiaries.
The Company recognized the income tax effects of the 2017 Act in accordance with Staff Accounting Bulletin No. 118 (“SAB 118”) whichprovides SEC guidance on the application of ASC 740, Income Taxes , in the reporting period in which the 2017 Act was signed into law.Accordingly, the Company’s financial statements reflect provisional amounts for those impacts for which the accounting under ASC 740 isincomplete, but a reasonable estimate could be determined.
The Company has calculated its best estimate of the impact of the 2017 Act in its income tax provision for the year ended December 31, 2017in accordance with its understanding of the 2017 Act and guidance available as of the date of this filing, and as a result recognized $714 million oftax expense in the fourth quarter of 2017.
This total includes a provisional tax expense of $39 million related to the remeasurement of certain deferred tax assets and liabilities from 35%to 21% . The most material deferred taxes to be remeasured related to net operating losses (after reduction for the one-time transition tax) andproperty, plant and equipment. Additional time is required to finalize remeasurement effects. In accordance with U.S. GAAP, the remeasurement ofdeferred tax assets and liabilities related to regulated utilities was recorded as a regulatory liability.
The fourth quarter impact also includes provisional tax expense of $675 million related to the one-time
152

THE AES CORPORATIONNOTES TO CONSOLIDATED FINANCIAL STATEMENTS—(Continued)
DECEMBER 31, 2017, 2016, AND 2015
transition tax on the deemed repatriation of foreign earnings. The calculation of the one-time tax is quite complex, requiring determinations of liquidasset balances over three years, determination of foreign earnings and profits (“E&P," a U.S. tax measure) at multiple dates, and multiple othercomputations. Our estimated tax expense was impacted by cash and restricted cash balances at foreign subsidiaries, unbilled receivables, andother liquid assets taxable at a 15.5% rate and the balance of non-cash E&P taxable at 8% . We anticipate further guidance on the determination offair value for federal tax purposes of the shares we hold in our publicly traded subsidiaries, which are considered components of our foreignsubsidiaries' "cash position" and taxed at the 15.5% rate, and may materially impact our provisional estimate. The one-time transition tax had asignificant impact on our 2017 effective tax rate and utilized approximately $1.9 billion or 51% of our U.S. net operating losses. The ultimate impactmay differ from these provisional amounts, possibly materially, due to, among other things, additional analysis, changes in interpretations andassumptions the Company has made, additional regulatory guidance that may be issued, and actions the Company may take as a result of the 2017Act. The accounting is expected to be complete when the 2017 U.S. corporate income tax return is filed in 2018.
Argentine Tax Reform — In December 2017, the Argentine government enacted reforms to its income tax laws that resulted in a decrease tostatutory income tax rates for our Argentine businesses from 35% to 30% in 2018-2019 and to 25% for 2020 and future years. The impact ofremeasuring deferred taxes to account for the enacted change in future applicable income tax rates was recognized as income tax benefit in thefourth quarter of 2017, resulting in a decrease of $21 million to consolidated income tax expense.
Chilean Tax Reform — In February 2016, the Chilean government enacted further reforms to its income tax laws that resulted in an increaseto statutory income tax rates for most of our Chilean businesses from 25% to 25.5% in 2017 and to 27% for 2018 and future years. The impact ofremeasuring deferred taxes to account for the enacted change in future applicable income tax rates was recognized as a discrete income taxexpense in the first quarter of 2016, resulting in an increase of $26 million to consolidated income tax expense.
Income Tax Provision — The following table summarizes the expense for income taxes on continuing operations for the periods indicated (inmillions):
December 31, 2017 2016 2015Federal: Current $ — $ 2 $ 9 Deferred 545 (361) (63)State: Current — 1 1 Deferred 1 (4) (5)Foreign: Current 335 318 470 Deferred 109 76 —Total $ 990 $ 32 $ 412
Effective and Statutory Rate Reconciliation — The following table summarizes a reconciliation of the U.S. statutory federal income tax rateto the Company's effective tax rate as a percentage of income from continuing operations before taxes for the periods indicated:
December 31, 2017 2016 2015Statutory Federal tax rate 35 % 35 % 35 %State taxes, net of Federal tax benefit (7)% (18)% (6)%Taxes on foreign earnings — % (46)% 5 %Valuation allowance 10 % 10 % (5)%Uncertain tax positions — % 4 % (1)%Noncontrolling Interest on Buffalo Gap impairments — % 31 % 3 %Change in tax law 90 % 12 % — %Goodwill impairment — % — % 11 %Other—net — % (11)% — %
Effective tax rate 128 % 17 % 42 %
For 2017, the 90% change in tax law item relates primarily to the impact of U.S. and Argentina tax reform enacted in the current period. Theimpact of the U.S one-time transition tax and remeasurement of deferred taxes represents 88% and 5% , respectively, which is partially offset by thetax benefit resulting from Argentina tax reform representing 3% .
For 2016 , the 31% Buffalo Gap impairments item relates to the amounts of impairment allocated to noncontrolling interest which isnondeductible.
153

THE AES CORPORATIONNOTES TO CONSOLIDATED FINANCIAL STATEMENTS—(Continued)
DECEMBER 31, 2017, 2016, AND 2015
Income Tax Receivables and Payables — The current income taxes receivable and payable are included in Other Current Assets andAccrued and Other Liabilities , respectively, on the accompanying Consolidated Balance Sheets. The noncurrent income taxes receivable andpayable are included in Other Noncurrent Assets and Other Noncurrent Liabilities, respectively, on the accompanying Consolidated Balance Sheets.The following table summarizes the income taxes receivable and payable as of the periods indicated (in millions):
December 31, 2017 2016Income taxes receivable—current $ 147 $ 136
Total income taxes receivable $ 147 $ 136Income taxes payable—current $ 129 $ 149Income taxes payable—noncurrent 17 22
Total income taxes payable $ 146 $ 171
Deferred Income Taxes — Deferred income taxes reflect the net tax effects of (a) temporary differences between the carrying amounts ofassets and liabilities for financial reporting purposes and the amounts used for income tax purposes and (b) operating loss and tax creditcarryforwards. These items are stated at the enacted tax rates that are expected to be in effect when taxes are actually paid or recovered.
As of December 31, 2017 , the Company had federal net operating loss carryforwards for tax purposes of approximately $1.9 billion expiring inyears 2027 to 2036. The Company also had federal general business tax credit carryforwards of approximately $21 million expiring primarily from2021 to 2037, and federal alternative minimum tax credits of approximately $5 million that may be fully recovered by 2021 under the 2017 Act. TheCompany had state net operating loss carryforwards as of December 31, 2017 of approximately $9.3 billion expiring in years 2018 to 2037. As ofDecember 31, 2017 , the Company had foreign net operating loss carryforwards of approximately $2.8 billion that expire at various times beginningin 2018 and some of which carry forward without expiration, and tax credits available in foreign jurisdictions of approximately $28 million , $18 millionof which expire in 2021, $1 million of which expire in years 2023 to 2028, and $9 million of which carry forward without expiration.
Valuation allowances increased $112 million during 2017 to $988 million at December 31, 2017 . This net increase was primarily the result ofvaluation allowance activity at certain of our Brazil subsidiaries.
Valuation allowances decreased $18 million during 2016 to $876 million at December 31, 2016 . This net decrease was primarily the result ofvaluation allowance releases and foreign exchange gains at certain of our Brazil subsidiaries.
The Company believes that it is more likely than not that the net deferred tax assets as shown below will be realized when future taxableincome is generated through the reversal of existing taxable temporary differences and income that is expected to be generated by businesses thathave long-term contracts or a history of generating taxable income.
The following table summarizes deferred tax assets and liabilities, as of the periods indicated (in millions):
December 31, 2017 2016Differences between book and tax basis of property $ (1,424) $ (1,926)Other taxable temporary differences (143) (335)
Total deferred tax liability (1,567) (2,261)Operating loss carryforwards 1,439 2,088Capital loss carryforwards 63 59Bad debt and other book provisions 66 96Tax credit carryforwards 51 54Other deductible temporary differences 60 263
Total gross deferred tax asset 1,679 2,560Less: valuation allowance (988) (876)
Total net deferred tax asset 691 1,684Net deferred tax (liability) $ (876) $ (577)
The Company considers undistributed earnings of certain foreign subsidiaries to be indefinitely reinvested outside of the U.S. Except for theone-time transition tax in the U.S., no taxes have been recorded with respect to our indefinitely reinvested earnings in accordance with the relevantaccounting guidance for income taxes. Should the earnings be remitted as dividends, the Company may be subject to additional foreign withholdingand state income taxes. Under the 2017 Act, generally future distributions from foreign subsidiaries will be subject to a dividends received deductionin the U.S. As of December 31, 2017, the cumulative amount of U.S. GAAP foreign
154

THE AES CORPORATIONNOTES TO CONSOLIDATED FINANCIAL STATEMENTS—(Continued)
DECEMBER 31, 2017, 2016, AND 2015
un-remitted earnings upon which additional income taxes have not been provided is approximately $4 billion . It is not practicable to estimate theamount of any additional taxes which may be payable on the undistributed earnings.
Income from operations in certain countries is subject to reduced tax rates as a result of satisfying specific commitments regardingemployment and capital investment. The Company's income tax benefits related to the tax status of these operations are estimated to be $26 million, $20 million and $21 million for the years ended December 31, 2017 , 2016 and 2015 , respectively. The per share effect of these benefits afternoncontrolling interests was $0.03 , $0.02 and $0.02 for the years ended December 31, 2017 , 2016 and 2015 , respectively. Included in theCompany's income tax benefits is the benefit related to our operations in Vietnam, which is estimated to be $13 million , $15 million and $8 millionfor the years ended December 31, 2017, 2016 and 2015, respectively. The per share effect of these benefits related to our operations in Vietnamafter noncontrolling interest was $0.01 , $0.01 and $0.01 for the years ended December 31, 2017, 2016 and 2015, respectively.
The following table shows the income (loss) from continuing operations, before income taxes, net equity in earnings of affiliates andnoncontrolling interests, for the periods indicated (in millions):
December 31, 2017 2016 2015U.S. $ (511) $ (1,305) $ (612)Non-U.S. 1,282 1,492 1,601
Total $ 771 $ 187 $ 989
Uncertain Tax Positions — Uncertain tax positions have been classified as noncurrent income tax liabilities unless they are expected to bepaid in one year. The Company's policy for interest and penalties related to income tax exposures is to recognize interest and penalties as acomponent of the provision for income taxes in the Consolidated Statements of Operations. The following table shows the total amount of grossaccrued income taxes related to interest and penalties included in the Consolidated Balance Sheets for the periods indicated (in millions):
December 31, 2017 2016Interest related $ 7 $ 6Penalties related — —
The following table shows the expense/(benefit) related to interest and penalties on unrecognized tax benefits for the periods indicated (inmillions):
December 31, 2017 2016 2015Total expense (benefit) for interest related to unrecognized tax benefits $ 1 $ 2 $ (2)Total expense for penalties related to unrecognized tax benefits — — —
We are potentially subject to income tax audits in numerous jurisdictions in the U.S. and internationally until the applicable statute of limitationsexpires. Tax audits by their nature are often complex and can require several years to complete. The following is a summary of tax years potentiallysubject to examination in the significant tax and business jurisdictions in which we operate:
Jurisdiction Tax Years Subject to ExaminationArgentina 2011-2017Brazil 2012-2017Chile 2014-2017Colombia 2015-2017Dominican Republic 2015-2017El Salvador 2014-2017Netherlands 2014-2017Philippines 2013-2017United Kingdom 2012-2017United States (Federal) 2014-2017
As of December 31, 2017 , 2016 and 2015 , the total amount of unrecognized tax benefits was $348 million , $352 million and $364 million ,respectively. The total amount of unrecognized tax benefits that would benefit the effective tax rate as of December 31, 2017 , 2016 and 2015 is$332 million , $332 million and $343 million , respectively, of which $29 million , $24 million and $24 million , respectively, would be in the form of taxattributes that would warrant a full valuation allowance.
155

THE AES CORPORATIONNOTES TO CONSOLIDATED FINANCIAL STATEMENTS—(Continued)
DECEMBER 31, 2017, 2016, AND 2015
The total amount of unrecognized tax benefits anticipated to result in a net decrease to unrecognized tax benefits within 12 months ofDecember 31, 2017 is estimated to be between $5 million and $15 million , primarily relating to statute of limitation lapses and tax exam settlements.
The following is a reconciliation of the beginning and ending amounts of unrecognized tax benefits for the periods indicated (in millions):
December 31, 2017 2016 2015Balance at January 1 $ 352 $ 364 $ 384
Additions for current year tax positions — 2 2Additions for tax positions of prior years 2 1 12Reductions for tax positions of prior years (5) (1) (7)Effects of foreign currency translation — — (3)Settlements — (13) (17)Lapse of statute of limitations (1) (1) (7)
Balance at December 31 $ 348 $ 352 $ 364
The Company and certain of its subsidiaries are currently under examination by the relevant taxing authorities for various tax years. TheCompany regularly assesses the potential outcome of these examinations in each of the taxing jurisdictions when determining the adequacy of theamount of unrecognized tax benefit recorded. While it is often difficult to predict the final outcome or the timing of resolution of any particularuncertain tax position, we believe we have appropriately accrued for our uncertain tax benefits. However, audit outcomes and the timing of auditsettlements and future events that would impact our previously recorded unrecognized tax benefits and the range of anticipated increases ordecreases in unrecognized tax benefits are subject to significant uncertainty. It is possible that the ultimate outcome of current or futureexaminations may exceed our provision for current unrecognized tax benefits in amounts that could be material, but cannot be estimated as ofDecember 31, 2017 . Our effective tax rate and net income in any given future period could therefore be materially impacted.
21 . DISCONTINUED OPERATIONSDue to a portfolio evaluation in the first half of 2016, management decided to pursue a strategic shift of its distribution companies in Brazil, Sul
and Eletropaulo, to reduce the Company's exposure to the Brazilian distribution market.
Eletropaulo — In November 2017, Eletropaulo converted its preferred shares into ordinary shares and transitioned the listing of those sharesinto the Novo Mercado, which is a listing segment of the Brazilian stock exchange with the highest standards of corporate governance. Uponconversion of the preferred shares into ordinary shares, AES no longer controlled Eletropaulo, but maintained significant influence over thebusiness. As a result, the Company deconsolidated Eletropaulo. After deconsolidation, the Company's 17% ownership interest is reflected as anequity method investment. The Company recorded an after-tax loss on deconsolidation of $611 million , which primarily consisted of $455 millionrelated to cumulative translation losses and $243 million related to pension losses reclassified from AOCL.
In December 2017, all the remaining criteria were met for Eletropaulo to qualify as a discontinued operation. Therefore, its results of operationsand financial position were reported as such in the consolidated financial statements for all periods presented. Eletropaulo's pre-tax loss attributableto AES, including the loss on deconsolidation, for the years ended December 31, 2017 and 2016 was $633 million and $192 million , respectively.Eletropaulo's pre-tax income attributable to AES for the year ended December 31, 2015 was $73 million . Prior to its classification as discontinuedoperations, Eletropaulo was reported in the Brazil SBU reportable segment.
Sul — The Company executed an agreement for the sale of Sul, a wholly-owned subsidiary, in June 2016. The results of operations andfinancial position of Sul are reported as discontinued operations in the consolidated financial statements for all periods presented. Upon meeting theheld-for-sale criteria, the Company recognized an after-tax loss of $382 million comprised of a pre-tax impairment charge of $783 million , offset by atax benefit of $266 million related to the impairment of the Sul long lived assets and a tax benefit of $135 million for deferred taxes related to theinvestment in Sul. Prior to the impairment charge, the carrying value of the Sul asset group of $1.6 billion was greater than its approximate fair valueless costs to sell. However, the impairment charge was limited to the carrying value of the long lived assets of the Sul disposal group.
On October 31, 2016 , the Company completed the sale of Sul and received final proceeds less costs to sell of $484 million , excludingcontingent consideration. Upon disposal of Sul, the Company incurred an additional after-tax
156

THE AES CORPORATIONNOTES TO CONSOLIDATED FINANCIAL STATEMENTS—(Continued)
DECEMBER 31, 2017, 2016, AND 2015
loss on sale of $737 million . The cumulative impact to earnings of the impairment and loss on sale was $1.1 billion . This includes thereclassification of approximately $1 billion of cumulative translation losses resulting in a net reduction to the Company’s stockholders’ equity of $92million .
Sul’s pre-tax loss attributable to AES for the years ended December 31, 2016 and 2015 was $1.4 billion and $32 million , respectively. Prior toits classification as discontinued operations, Sul was reported in the Brazil SBU reportable segment.
The following table summarizes the carrying amounts of the major classes of assets and liabilities of discontinued operations at December 31,2017 and December 31, 2016 :
(in millions) December 31, 2017 December 31, 2016Assets of discontinued operations and held-for-sale businesses:
Cash and cash equivalents $ — $ 61Short-term investments — 268Accounts receivable, net of allowance for doubtful accounts of $0 and $94, respectively — 745Other current assets — 499Property, plant and equipment and intangibles, net — 2,504Investments in and advances to affiliates (1) 86 —Deferred income taxes — 554Other classes of assets that are not major — 305
Total assets of discontinued operations $ 86 $ 4,936Other assets of businesses classified as held-for-sale (2) 1,948 —
Total assets of discontinued operations and held-for-sale businesses (3) $ 2,034 $ 4,936Liabilities of discontinued operations and held-for-sale businesses:
Accounts payable $ — $ 418Accrued and other liabilities — 954Non-recourse debt — 1,009Pension and other postretirement liabilities — 1,159Other noncurrent liabilities — 678Other classes of liabilities that are not major — 31
Total liabilities of discontinued operations $ — $ 4,249Other liabilities of businesses classified as held-for-sale (2)
1,033 —
Total liabilities of discontinued operations and held-for-sale businesses (3) $ 1,033 $ 4,249 _____________________________
(1) Represents the Company's 17% ownership interest in Eletropaulo.(2) Masinloc, Eletrica Santiago, and the DPL peaker assets were classified as held-for-sale as of December 31, 2017 . See Note 22 — Held-for-Sale Businesses and Dispositions for further information.(3) Amounts at December 31, 2016 are classified as both current and long-term on the Consolidated Balance Sheet.
The following table summarizes the major line items constituting losses from discontinued operations for the periods indicated (in millions):
December 31, 2017 2016 2015Income (loss) from discontinued operations, net of tax:
Revenue — regulated $ 3,320 $ 4,036 $ 4,430Cost of sales (3,151) (3,954) (4,227)Other income and expense items that are not major (1) (166) (160) (70)
Income (loss) from operations of discontinued businesses 3 (78) 133Loss from disposal and impairments of discontinued businesses (611) (1,385) —Income (loss) from discontinued operations (608) (1,463) 133
Less: Net income attributable to noncontrolling interests (25) (142) (92)Income (loss) from discontinued operations attributable to The AES Corporation (633) (1,605) 41
Income tax benefit (expense) (21) 495 (53)Loss from discontinued operations, net of tax $ (654) $ (1,110) $ (12) _____________________________
(1) Includes a loss contingency recognized by our equity method investment in discontinued operations.
The following table summarizes the operating and investing cash flows from discontinued operations for the periods indicated (in millions):
December 31, 2017 2016 2015

Cash flows provided by (used in) operating activities of discontinued operations $ 164 $ 529 $ (125)Cash flows used in investing activities of discontinued operations (288) (368) (65)
157
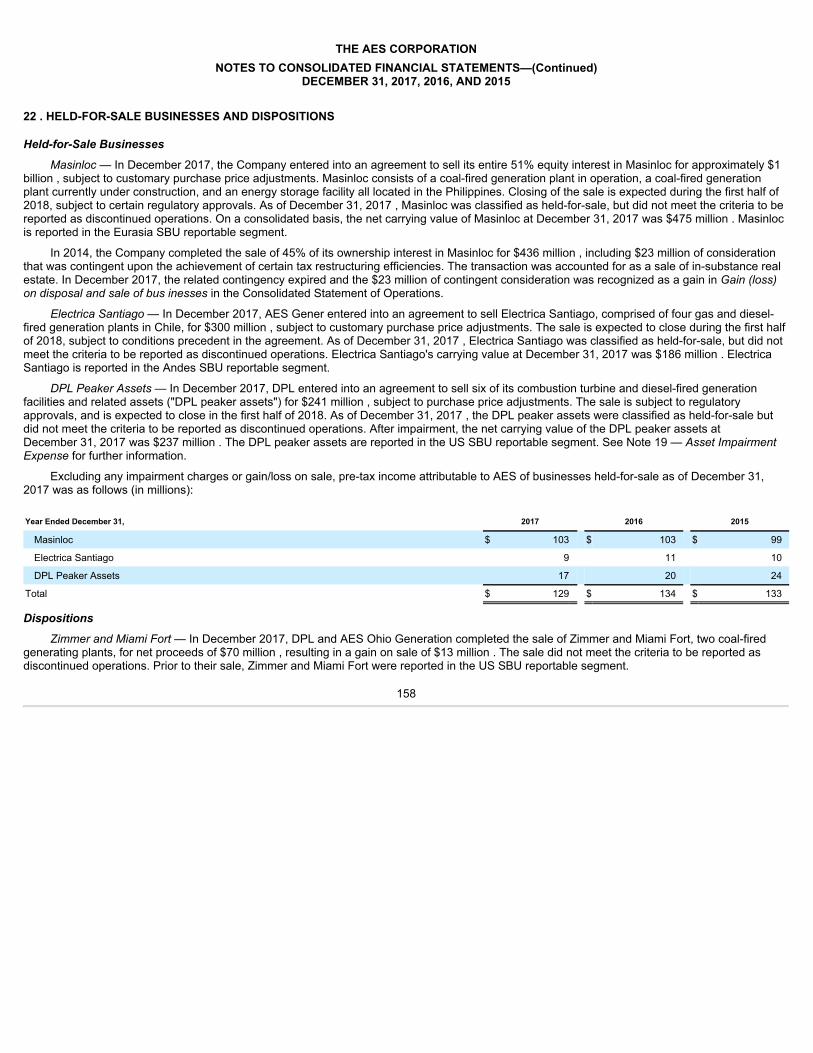
THE AES CORPORATIONNOTES TO CONSOLIDATED FINANCIAL STATEMENTS—(Continued)
DECEMBER 31, 2017, 2016, AND 2015
22 . HELD-FOR-SALE BUSINESSES AND DISPOSITIONS
Held-for-Sale Businesses
Masinloc — In December 2017, the Company entered into an agreement to sell its entire 51% equity interest in Masinloc for approximately $1billion , subject to customary purchase price adjustments. Masinloc consists of a coal-fired generation plant in operation, a coal-fired generationplant currently under construction, and an energy storage facility all located in the Philippines. Closing of the sale is expected during the first half of2018, subject to certain regulatory approvals. As of December 31, 2017 , Masinloc was classified as held-for-sale, but did not meet the criteria to bereported as discontinued operations. On a consolidated basis, the net carrying value of Masinloc at December 31, 2017 was $475 million . Masinlocis reported in the Eurasia SBU reportable segment.
In 2014, the Company completed the sale of 45% of its ownership interest in Masinloc for $436 million , including $23 million of considerationthat was contingent upon the achievement of certain tax restructuring efficiencies. The transaction was accounted for as a sale of in-substance realestate. In December 2017, the related contingency expired and the $23 million of contingent consideration was recognized as a gain in Gain (loss)on disposal and sale of bus inesses in the Consolidated Statement of Operations.
Electrica Santiago — In December 2017, AES Gener entered into an agreement to sell Electrica Santiago, comprised of four gas and diesel-fired generation plants in Chile, for $300 million , subject to customary purchase price adjustments. The sale is expected to close during the first halfof 2018, subject to conditions precedent in the agreement. As of December 31, 2017 , Electrica Santiago was classified as held-for-sale, but did notmeet the criteria to be reported as discontinued operations. Electrica Santiago's carrying value at December 31, 2017 was $186 million . ElectricaSantiago is reported in the Andes SBU reportable segment.
DPL Peaker Assets — In December 2017, DPL entered into an agreement to sell six of its combustion turbine and diesel-fired generationfacilities and related assets ("DPL peaker assets") for $241 million , subject to purchase price adjustments. The sale is subject to regulatoryapprovals, and is expected to close in the first half of 2018. As of December 31, 2017 , the DPL peaker assets were classified as held-for-sale butdid not meet the criteria to be reported as discontinued operations. After impairment, the net carrying value of the DPL peaker assets atDecember 31, 2017 was $237 million . The DPL peaker assets are reported in the US SBU reportable segment. See Note 19 — Asset ImpairmentExpense for further information.
Excluding any impairment charges or gain/loss on sale, pre-tax income attributable to AES of businesses held-for-sale as of December 31,2017 was as follows (in millions):
Year Ended December 31, 2017 2016 2015
Masinloc $ 103 $ 103 $ 99
Electrica Santiago 9 11 10
DPL Peaker Assets 17 20 24
Total $ 129 $ 134 $ 133
Dispositions
Zimmer and Miami Fort — In December 2017, DPL and AES Ohio Generation completed the sale of Zimmer and Miami Fort, two coal-firedgenerating plants, for net proceeds of $70 million , resulting in a gain on sale of $13 million . The sale did not meet the criteria to be reported asdiscontinued operations. Prior to their sale, Zimmer and Miami Fort were reported in the US SBU reportable segment.
158

THE AES CORPORATIONNOTES TO CONSOLIDATED FINANCIAL STATEMENTS—(Continued)
DECEMBER 31, 2017, 2016, AND 2015
Kazakhstan Hydroelectric — Affiliates of the Company (the “Affiliates”) previously operated Shulbinsk HPP and Ust-Kamenogorsk HPP (the“HPPs”), two hydroelectric plants in Kazakhstan, under a concession agreement with the Republic of Kazakhstan (“RoK”). In April 2017, the RoKinitiated the process to transfer these plants back to the RoK. The RoK indicated that arbitration would be necessary to determine the correct ReturnShare Transfer Payment ("RST") and, rather than paying the Affiliates, deposited the RST into an escrow account. In exchange, the Affiliatestransferred 100% of the shares in the HPPs to the RoK, under protest and with a full reservation of rights. The Company recorded a loss on disposalof $33 million in the fourth quarter of 2017. In February 2018, the Affiliates initiated the arbitration process in international court to recover at least$75 million of the RST placed in escrow, based on the September 30, 2017 RST calculation. Additional losses may be incurred if some or all of thedisputed consideration is not paid by the RoK via a mutually acceptable settlement, or upon any unfavorable decision rendered by the arbiter. Thetransfer did not meet the criteria to be reported as discontinued operations. Prior to their transfer, the Kazakhstan HPPs were reported in the EurasiaSBU reportable segment. See Note 19 — Asset Impairment Expense for further information.
Kazakhstan CHPs — In April 2017, the Company completed the sale of Ust-Kamenogorsk CHP and Sogrinsk CHP, its combined heating andpower coal plants in Kazakhstan, for net proceeds of $24 million . The Company recognized a pre-tax loss on sale of $49 million , primarily related tocumulative translation losses. The sale did not meet the criteria to be reported as discontinued operations. Prior to their sale, the Kazakhstan CHPplants were reported in the Eurasia SBU reportable segment. See Note 19 — Asset Impairment Expense for further information.
U.K. Wind — During the second quarter of 2016, the Company deconsolidated UK Wind and recorded a loss on deconsolidation of $20 millionto Gain (loss) on disposal and sale of bus inesses in the Consolidated Statement of Operations. Prior to deconsolidation, UK Wind was reported inthe Eurasia SBU reportable segment. See Note 14 — Equity and Note 19 — Asset Impairment Expense for further information.
DPLER — In January 2016, the Company completed the sale of DPLER, a competitive retail marketer selling electricity to customers in Ohio,and recognized a gain on sale of $49 million . Proceeds of $76 million were received in December 2015. DPLER did not meet the criteria to bereported as a discontinued operation. DPLER's results were therefore reflected within continuing operations in the Consolidated Statements ofOperations. Prior to its sale, DPLER was reported in the US SBU reportable segment.
Kelanitissa — In January 2016, the Company completed the sale of its interest in Kelanitissa, a diesel-fired generation plant in Sri Lanka, for$18 million , resulting in a loss on sale of $5 million . The sale did not meet the criteria to be reported as discontinued operations. Kelanitissa'sresults were therefore reflected within continuing operations in the Consolidated Statements of Operations. Prior to its sale, Kelanitissa was reportedin the Eurasia SBU reportable segment.
Armenia Mountain — Under the terms of the sale agreement for certain U.S. Wind Projects, the buyer was provided an option to purchase theCompany's 100% interest in Armenia Mountain, a wind project in Pennsylvania, for $75 million . The buyer exercised this option and AES completedthe sale of Armenia Mountain in July 2015. The sale did not meet the criteria to be reported as discontinued operations. Upon completion, netproceeds of $64 million were received and a pre-tax gain on sale of $22 million was recognized. Prior to its sale, Armenia Mountain was reported inthe US SBU reportable segment.
Excluding any impairment charge or gain/loss on sale, pre-tax income (loss) attributable to AES of disposed businesses was as follows (inmillions):
Year Ended December 31, 2017 2016 2015
Zimmer and Miami Fort $ 26 $ (14) $ 6
Kazakhstan Hydroelectric 33 34 52
Kazakhstan CHPs 13 12 16
DPLER — — 11
Armenia Mountain — — 6
Total $ 72 $ 32 $ 91
23 . ACQUISITIONS
Alto Sertão II — On August 3, 2017, the Company completed the acquisition of 100% of the Alto Sertão II Wind Complex (“Alto Sertão II”) fromRenova Energia S.A. for $181 million , subject to customary purchase price adjustments, plus the assumption of $348 million of non-recourse debt,and up to $30 million of contingent
159

THE AES CORPORATIONNOTES TO CONSOLIDATED FINANCIAL STATEMENTS—(Continued)
DECEMBER 31, 2017, 2016, AND 2015
consideration. At closing, the Company made an initial cash payment of $143 million , which excludes holdbacks related to indemnifications andpurchase price adjustments. As of December 31, 2017 , the purchase price allocation for Alto Sertão II is preliminary. The Company is in theprocess of assessing the fair value of the assets acquired and liabilities assumed in the acquisition, and expects to complete the purchase priceallocation within the one year measurement period. Alto Sertão II is a wind farm reported in the Brazil SBU reportable segment.
Bauru Solar Complex — On September 25, 2017, AES Tietê executed an investment agreement with Cobra do Brasil to provide approximately$140 million of non-convertible debentures in project financing for the construction of photovoltaic solar plants in Brazil. As of December 31, 2017 ,approximately $45 million of non-convertible debentures have been executed and distributed to the project. Upon completion of the project,expected in the first half of 2018 and subject to the solar plants’ compliance with certain technical specifications defined in the agreement, Tietêexpects to acquire the solar complex in exchange for the non-convertible debentures and an additional investment of approximately $55 million .
Distributed Energy — On February 18, 2015, the Company completed the acquisition of 100% of the common stock of Main Street PowerCompany, Inc. for approximately $25 million . The purchase consideration was composed of $20 million cash. After the date of acquisition, MainStreet Power Company, Inc. was renamed Distributed Energy, Inc.
In September 2016, Distributed Energy acquired the equity interest of various projects held by multiple partnerships for approximately $43million . These partnerships were previously classified as equity method investments. In accordance with the accounting guidance for businesscombinations, the Company has recorded the opening balance sheets of the acquired businesses based on the purchase price allocation as of theacquisition date.
24 . EARNINGS PER SHARE
Basic and diluted earnings per share are based on the weighted-average number of shares of common stock and potential common stockoutstanding during the period. Potential common stock, for purposes of determining diluted earnings per share, includes the effects of dilutiverestricted stock units, stock options and convertible securities. The effect of such potential common stock is computed using the treasury stockmethod or the if-converted method, as applicable.
The following table is a reconciliation of the numerator and denominator of the basic and diluted earnings per share computation for incomefrom continuing operations for the years ended December 31, 2017 , 2016 and 2015 , where income represents the numerator and weighted-average shares represent the denominator. Values are in millions except per share data:
Year Ended December 31, 2017 2016 2015
Loss Shares $ per Share Loss Shares $ per Share Income Shares $ per Share
BASIC EARNINGS PER SHARE Income (loss) from continuing operations attributable toThe AES Corporation common stockholders (1) $ (507) 660 $ (0.77) $ (25) 660 $ (0.04) $ 318 687 $ 0.46
EFFECT OF DILUTIVE SECURITIES Restricted stock units — — — — — — — 2 —
DILUTED EARNINGS PER SHARE $ (507) 660 $ (0.77) $ (25) 660 $ (0.04) $ 318 689 $ 0.46_____________________________
(1) Loss from continuing operations, net of tax, of $20 million less the $5 million adjustment to retained earnings to record the DP&L redeemable preferred stock at its redemption value as of December 31, 2016 .
The calculation of diluted earnings per share excluded 7 million , 8 million and 8 million stock awards outstanding for the years endedDecember 31, 2017 , 2016 and 2015 , respectively, that could potentially dilute basic earnings per share in the future. Additionally, for the yearsended December 31, 2016 and 2015 , all 15 million convertible debentures were omitted from the earnings per share calculation. The Companyredeemed all of its existing TECONs in June 2017. The stock awards and convertible debentures were excluded from the calculation because theywere anti-dilutive.
25 . RISKS AND UNCERTAINTIES
AES is a diversified power generation and utility company organized into five market-oriented SBUs. See additional discussion of theCompany's principal markets in Note 15 — Segment and Geographic Information . Within our five SBUs, we have two primary lines of business:Generation and Utilities. The Generation line of business
160

THE AES CORPORATIONNOTES TO CONSOLIDATED FINANCIAL STATEMENTS—(Continued)
DECEMBER 31, 2017, 2016, AND 2015
uses a wide range of fuels and technologies to generate electricity such as coal, gas, hydro, wind, solar and biomass. Our Utilities businesscomprises businesses that transmit, distribute, and in certain circumstances, generate power. In addition, the Company has operations in therenewables area. These efforts include projects primarily in wind and solar.
Operating and Economic Risks — The Company operates in several developing economies where macroeconomic conditions are usuallymore volatile than developed economies. Deteriorating market conditions often expose the Company to the risk of decreased earnings and cashflows due to, among other factors, adverse fluctuations in the commodities and foreign currency spot markets. Additionally, credit markets aroundthe globe continue to tighten their standards, which could impact our ability to finance growth projects through access to capital markets. Currently,the Company has a below-investment grade rating from Standard & Poor's of BB-. This could affect the Company's ability to finance new and/orexisting development projects at competitive interest rates. As of December 31, 2017 , the Company had $949 million of unrestricted cash and cashequivalents.
During 2017 , 69% of our revenue was generated outside the U.S. and a significant portion of our international operations is conducted indeveloping countries. We continue to invest in several developing countries to expand our existing platform and operations. International operations,particularly the operation, financing and development of projects in developing countries, entail significant risks and uncertainties, including, withoutlimitation:
• economic, social and political instability in any particular country or region;• inability to economically hedge energy prices;• volatility in commodity prices;• adverse changes in currency exchange rates;• government restrictions on converting currencies or repatriating funds;• unexpected changes in foreign laws, regulatory framework, or in trade, monetary or fiscal policies;• high inflation and monetary fluctuations;• restrictions on imports of coal, oil, gas or other raw materials required by our generation businesses to operate;• threatened or consummated expropriation or nationalization of our assets by foreign governments;• unwillingness of governments, government agencies, similar organizations or other counterparties to honor their commitments;• unwillingness of governments, government agencies, courts or similar bodies to enforce contracts that are economically advantageous to
subsidiaries of the Company and economically unfavorable to counterparties, against such counterparties, whether such counterparties aregovernments or private parties;
• inability to obtain access to fair and equitable political, regulatory, administrative and legal systems;• adverse changes in government tax policy;• difficulties in enforcing our contractual rights, enforcing judgments, or obtaining a just result in local jurisdictions; and• potentially adverse tax consequences of operating in multiple jurisdictions.
Any of these factors, individually or in combination with others, could materially and adversely affect our business, results of operations andfinancial condition. In addition, our Latin American operations experience volatility in revenue and earnings which have caused and are expected tocause significant volatility in our results of operations and cash flows. The volatility is caused by regulatory and economic difficulties, politicalinstability, indexation of certain PPAs to fuel prices, and currency fluctuations being experienced in many of these countries. This volatility reducesthe predictability and enhances the uncertainty associated with cash flows from these businesses.
Our inability to predict, influence or respond appropriately to changes in law or regulatory schemes, including any inability to obtain reasonableincreases in tariffs or tariff adjustments for increased expenses, could adversely impact our results of operations or our ability to meet publiclyannounced projections or analysts' expectations. Furthermore, changes in laws or regulations or changes in the application or interpretation ofregulatory provisions in jurisdictions where we operate, particularly our Utility businesses where electricity tariffs are subject to regulatory review orapproval, could adversely affect our business, including, but not limited to:
161

THE AES CORPORATIONNOTES TO CONSOLIDATED FINANCIAL STATEMENTS—(Continued)
DECEMBER 31, 2017, 2016, AND 2015
• changes in the determination, definition or classification of costs to be included as reimbursable or pass-through costs;• changes in the definition or determination of controllable or noncontrollable costs;• adverse changes in tax law;• changes in the definition of events which may or may not qualify as changes in economic equilibrium;• changes in the timing of tariff increases;• other changes in the regulatory determinations under the relevant concessions; or• changes in environmental regulations, including regulations relating to GHG emissions in any of our businesses.
Any of the above events may result in lower margins for the affected businesses, which can adversely affect our results of operations.
Alto Maipo — The Company's subsidiary, AES Gener, is currently constructing Alto Maipo, a hydroelectric facility near Santiago Chile.Increased project costs, or delays in construction, at Alto Maipo could have an adverse impact on the Company. Alto Maipo has experiencedconstruction difficulties, which have resulted in an increase in projected costs over the original $2 billion budget. These overages led to a series ofnegotiations with the intention of restructuring the project’s existing financial structure and obtaining additional funding. On March 17, 2017, AESGener completed the legal and financial restructuring of Alto Maipo, and through the Company’s 67% ownership interest in AES Gener, AES nowhas an effective 62% indirect economic interest in Alto Maipo. See Note 14 — Equity for additional information regarding the restructuring.
Following the restructuring described above, the project continued to face construction difficulties, including greater than expected costs andslower than anticipated productivity by construction contractors toward agreed-upon milestones. Furthermore, during the second quarter of 2017, asa result of the failure to perform by one of its construction contractors, Constructora Nuevo Maipo S.A. (“CNM”), Alto Maipo terminated CNM’scontract. As a result of the termination of CNM, Alto Maipo’s construction debt of $618 million and derivative liabilities of $132 million are in technicaldefault and presented as current in the balance sheet as of December 31, 2017 .
Construction at the project is continuing and the project is over 61% complete. In February 2018, Alto Maipo signed an amended EPC contractwith Strabag, the permanent replacement contractor selected to complete CNM’s work, subject to approval by the project's senior lenders as part ofthe second refinancing. Alto Maipo is working to resolve the challenges described above, however, there can be no assurance that Alto Maipo willsucceed in these efforts and if there are further delays or cost overruns, or if Alto Maipo is unable to reach an agreement with the non-recourselenders, there is a risk these lenders may seek to exercise remedies available as a result of the default noted above, or Alto Maipo may not be ableto meet its contractual or other obligations and may be unable to continue with the project. If any of the above occur, there could be a materialimpairment for the Company.
The carrying value of the long-lived assets and deferred tax assets of Alto Maipo as of December 31, 2017 was approximately $1.4 billion and$60 million , respectively. Even though certain of the construction difficulties have not been formally resolved, construction costs continue to becapitalized as management believes the project is probable of completion. Management believes the carrying value of the long-lived asset group isrecoverable and was not impaired as of December 31, 2017 . In addition, management believes it is more likely than not that the deferred tax assetswill be realized, they could be reduced if estimates of future taxable income are decreased.
Puerto Rico — In September 2017, Puerto Rico was severely impacted by Hurricanes Irma and Maria, disrupting the operations of AES PuertoRico and AES Ilumina. Puerto Rico’s infrastructure was severely damaged, including electric infrastructure and transmission lines. The extensivestructural damage caused by hurricane winds and flooding is expected to take considerable time to repair. The Company sustained modest damageto its AES Ilumina solar plant, resulting in a $2 million loss, and minor damage to its AES Puerto Rico thermal plants.
Our subsidiaries in Puerto Rico have long-term PPAs with state-owned PREPA. As a result of the hurricanes, PREPA has declared an event ofForce Majeure. However, both units of AES Puerto Rico and approximately 75% of AES Ilumina are available to generate electricity which, inaccordance with the PPAs, will allow AES Puerto Rico to invoice capacity, even under Force Majeure.
Due to the extensive damage from the hurricanes, energy demand in Puerto Rico has decreased and is expected to remain low until economicactivity has recovered. Despite the decrease in demand, AES Puerto Rico
162

THE AES CORPORATIONNOTES TO CONSOLIDATED FINANCIAL STATEMENTS—(Continued)
DECEMBER 31, 2017, 2016, AND 2015
was dispatched starting in February 2018. AES Puerto Rico continues to be the lowest cost and EPA compliant energy provider in Puerto Rico.Therefore, we expect AES Puerto Rico to continue to be a critical supplier to PREPA.
Starting prior to the hurricanes, PREPA has been facing economic challenges that could impact the Company, and on July 2, 2017, filed forbankruptcy under Title III. As a result of the bankruptcy filing, AES Puerto Rico and AES Ilumina’s non-recourse debt of $365 million and $36 million, respectively, is in default and has been classified as current as of December 31, 2017 . In November 2017, AES Puerto Rico signed a Forbearanceand Standstill Agreement with its lenders to prevent the lenders from taking any action against the company due to the default events. Thisagreement will expire on March 22, 2018.
The Company's receivable balances in Puerto Rico as of December 31, 2017 totaled $86 million , of which $53 million was overdue. After thefiling of Title III protection, and up until the disruption caused by the hurricanes, AES in Puerto Rico was collecting the overdue amounts fromPREPA in line with historic payment patterns.
Considering the information available as of the filing date, management believes the carrying amount of our assets in Puerto Rico of $627million is recoverable as of December 31, 2017 and no reserve on the receivables is required.
Foreign Currency Risks — AES operates businesses in many foreign countries and such operations could be impacted by significantfluctuations in foreign currency exchange rates. Fluctuations in currency exchange rate between U.S. dollar and the following currencies couldcreate significant fluctuations in earnings and cash flows: the Argentine peso, the Brazilian real, the Dominican Republic peso, the Euro, the Chileanpeso, the Colombian peso, and the Philippine peso.
Concentrations — Due to the geographical diversity of its operations, the Company does not have any significant concentration of customersor sources of fuel supply. Several of the Company's generation businesses rely on PPAs with one or a limited number of customers for the majorityof, and in some cases all of, the relevant businesses' output over the term of the PPAs. However, no single customer accounted for 10% or more oftotal revenue in 2017 , 2016 or 2015 .
The cash flows and results of operations of our businesses depend on the credit quality of our customers and the continued ability of ourcustomers and suppliers to meet their obligations under PPAs and fuel supply agreements. If a substantial portion of the Company's long-term PPAsand/or fuel supply were modified or terminated, the Company would be adversely affected to the extent that it would be unable to replace suchcontracts at equally favorable terms.
26 . RELATED PARTY TRANSACTIONS
Certain of our businesses in Panama and the Dominican Republic are partially owned by governments either directly or through state-ownedinstitutions. In the ordinary course of business, these businesses enter into energy purchase and sale transactions, and transmission agreementswith other state-owned institutions which are controlled by such governments. At two of our generation businesses in Mexico, the offtakers exercisesignificant influence, but not control, through representation on these businesses' Boards of Directors. These offtakers are also required to hold anominal ownership interest in such businesses. In Chile, we provide capacity and energy under contractual arrangements to our investment which isaccounted for under the equity method of accounting. Additionally, the Company provides certain support and management services to several of itsaffiliates under various agreements.
The Company's Consolidated Statements of Operations included the following transactions with related parties for the periods indicated (inmillions):
Years Ended December 31, 2017 2016 2015Revenue—Non-Regulated $ 1,297 $ 1,100 $ 1,099Cost of Sales—Non-Regulated 220 210 330Interest income 8 4 25Interest expense 36 39 33
163

THE AES CORPORATIONNOTES TO CONSOLIDATED FINANCIAL STATEMENTS—(Continued)
DECEMBER 31, 2017, 2016, AND 2015
The following table summarizes the balances receivable from and payable to related parties included in the Company's Consolidated BalanceSheets as of the periods indicated (in millions):
December 31, 2017 2016Receivables from related parties $ 250 $ 218Accounts and notes payable to related parties 727 892
The Company entered into an equity transaction with our related party, Linda Group, see Note 14 — Equity for further information.
27 . SELECTED QUARTERLY FINANCIAL DATA (UNAUDITED)
Quarterly Financial Data — The following tables summarize the unaudited quarterly Condensed Consolidated Statements of Operations for theCompany for 2017 and 2016 (amounts in millions, except per share data). Amounts have been restated to reflect discontinued operations in allperiods presented and reflect all adjustments necessary in the opinion of management for a fair statement of the results for interim periods.
Quarter Ended 2017 Mar 31 June 30 Sept 30 Dec 31Revenue $ 2,581 $ 2,613 $ 2,693 $ 2,643Operating margin 554 625 642 643
Income (loss) from continuing operations, net of tax (1) 97 141 236 (622)Income (loss) from discontinued operations, net of tax 1 9 25 (664)Net income (loss) $ 98 $ 150 $ 261 $ (1,286)Net income (loss) attributable to The AES Corporation $ (24) $ 53 $ 152 $ (1,342)Basic income (loss) per share:
Income (loss) from continuing operations attributable to The AES Corporation common stockholders, net of tax $ 0.04 $ 0.08 $ 0.22 $ (1.03)
Income (loss) from discontinued operations attributable to The AES Corporation common stockholders, net of tax — — 0.01 (1.00)
Basic income (loss) per share attributable to The AES Corporation $ 0.04 $ 0.08 $ 0.23 $ (2.03)Diluted income (loss) per share:
Income (loss) from continuing operations attributable to The AES Corporation common stockholders, net of tax $ 0.04 $ 0.08 $ 0.22 $ (1.03)
Loss from discontinued operations attributable to The AES Corporation common stockholders, net of tax — — 0.01 (1.00)
Diluted income (loss) per share attributable to The AES Corporation $ 0.04 $ 0.08 $ 0.23 $ (2.03)Dividends declared per common share $ 0.12 $ — $ 0.12 $ 0.25
Quarter Ended 2016 Mar 31 June 30 Sept 30 Dec 31Revenue $ 2,530 $ 2,452 $ 2,639 $ 2,660Operating margin 501 556 691 632
Income (loss) from continuing operations, net of tax (2) 87 2 238 (136)Loss from discontinued operations, net of tax (13) (389) (9) (557)Net income (loss) $ 74 $ (387) $ 229 $ (693)Net income (loss) attributable to The AES Corporation $ 126 $ (482) $ 175 $ (949)Basic income (loss) per share:
Income (loss) from continuing operations attributable to The AES Corporation common stockholders, net of tax $ 0.21 $ (0.15) $ 0.26 $ (0.35)
Loss from discontinued operations attributable to The AES Corporation common stockholders, net of tax (0.02) (0.58) — (1.09)
Basic income (loss) per share attributable to The AES Corporation $ 0.19 $ (0.73) $ 0.26 $ (1.44)Diluted income (loss) per share:
Income (loss) from continuing operations attributable to The AES Corporation common stockholders, net of tax $ 0.20 $ (0.15) $ 0.26 $ (0.35)
Loss from discontinued operations attributable to The AES Corporation common stockholders, net of tax (0.01) (0.58) — (1.09)
Diluted income (loss) per share attributable to The AES Corporation $ 0.19 $ (0.73) $ 0.26 $ (1.44)Dividends declared per common share $ 0.11 $ — $ 0.11 $ 0.23_____________________________
(1) Includes pre-tax impairment expense of $168 million , $90 million , $2 million and $277 million , for the first, second, third and fourth quarters of 2017 , respectively. See Note 19 — Asset Impairment Expensefor further discussion.
(2) Includes pre-tax impairment expense of $159 million , $235 million , $79 million and $623 million , for the first, second, third and fourth quarters of 2016 , respectively. See Note 19 — Asset ImpairmentExpense for further discussion.
28 . SUBSEQUENT EVENTSFluence — In July 2017, the Company entered into a joint venture with Siemens AG to form a global energy storage technology and services
company under the name Fluence. On January 1, 2018, Siemens and AES closed

164

THE AES CORPORATIONNOTES TO CONSOLIDATED FINANCIAL STATEMENTS—(Continued)
DECEMBER 31, 2017, 2016, AND 2015
on the creation of the joint venture with each party holding a 50% ownership interest. Since AES does not have the ability to control Fluence, thejoint venture will be accounted for as an equity affiliate.
165

ITEM 9. CHANGES IN AND DISAGREEMENTS WITH ACCOUNTANTS ON ACCOUNTING AND FINANCIAL DISCLOSURE
None.
ITEM 9A. CONTROLS AND PROCEDURES
Conclusion Regarding the Effectiveness of Disclosure Controls and Procedures
The Company maintains disclosure controls and procedures that are designed to ensure that information required to be disclosed in thereports that the Company files or submits under the Securities Exchange Act of 1934, as amended (the "Exchange Act") is recorded, processed,summarized and reported within the time periods specified in the SEC's rules and forms, and that such information is accumulated andcommunicated to the CEO and CFO, as appropriate, to allow timely decisions regarding required disclosures.
The Company carried out the evaluation required by Rules 13a-15(b) and 15d-15(b), under the supervision and with the participation of ourmanagement, including the CEO and CFO, of the effectiveness of our “disclosure controls and procedures” (as defined in the Exchange ActRules 13a-15(e) and 15d-15(e)). Based upon this evaluation, the CEO and CFO concluded that as of December 31, 2017 , our disclosure controlsand procedures were effective.
On August 3, 2017, AES completed the acquisition of the Wind Farm Alto Sertão II and as a result, assets acquired and liabilities assumed inthe acquisition have been included in AES’s consolidated balance sheet as of December 31, 2017 . Alto Sertão II’s total assets and total liabilitiesrepresented 1.5% and 1.4% of AES’s consolidated total assets and total liabilities, respectively, as of December 31, 2017 . Alto Sertão II’s netincome of $2.9 million for the period August 3, 2017 through December 31, 2017 was included in AES’s consolidated statement of operations for theyear ended December 31, 2017 . As permitted by the SEC guidance, Alto Sertão II’s internal controls over financial reporting have been excludedfrom management’s formal evaluation of the effectiveness of AES’s disclosure controls and procedures due to the timing of acquisition.
Management's Report on Internal Control over Financial Reporting
Management of the Company is responsible for establishing and maintaining adequate internal control over financial reporting, as defined inRule 13a-15(f) under the Exchange Act. The Company's internal control over financial reporting is a process designed to provide reasonableassurance regarding the reliability of financial reporting and the preparation of financial statements for external purposes in accordance with GAAPand includes those policies and procedures that:
• pertain to the maintenance of records that in reasonable detail, accurately and fairly reflect the transactions and dispositions of the assets ofthe Company;
• provide reasonable assurance that transactions are recorded as necessary to permit preparation of financial statements in accordance withGAAP, and that receipts and expenditures of the Company are being made only in accordance with authorizations of management anddirectors of the Company; and
• provide reasonable assurance that unauthorized acquisition, use or disposition of the Company's assets that could have a material effect onthe financial statements are prevented or detected timely.
Management, including our CEO and CFO, does not expect that our internal controls will prevent or detect all errors and all fraud. A controlsystem, no matter how well designed and operated, can provide only reasonable, not absolute, assurance that the objectives of the control systemare met. Further, the design of a control system must reflect the fact that there are resource constraints, and the benefits of controls must beconsidered relative to their costs. In addition, any evaluation of the effectiveness of controls is subject to risks that those internal controls maybecome inadequate in future periods because of changes in business conditions, or that the degree of compliance with the policies or proceduresdeteriorates.
Management assessed the effectiveness of our internal control over financial reporting as of December 31, 2017 . In making this assessment,management used the criteria established in Internal Control—Integrated Framework issued by the Committee of Sponsoring Organizations of theTreadway Commission ("COSO") in 2013. Based on this assessment, management believes that the Company maintained effective internal controlover financial reporting as of December 31, 2017 .
The effectiveness of the Company's internal control over financial reporting as of December 31, 2017 , has been audited by Ernst &Young LLP, an independent registered public accounting firm, as stated in their report, which appears herein.
Changes in Internal Control Over Financial Reporting:
166

There were no changes that occurred during the quarter ended December 31, 2017 that have materially affected, or are reasonably likely tomaterially affect, our internal control over financial reporting.
167

REPORT OF INDEPENDENT REGISTERED PUBLIC ACCOUNTING FIRM
To the Stockholders and the Board of Directors of The AES Corporation:
Opinion on Internal Control over Financial Reporting
We have audited The AES Corporation’s internal control over financial reporting as of December 31, 2017 , based on criteria established inInternal Control — Integrated Framework issued by the Committee of Sponsoring Organizations of the Treadway Commission (2013 framework)(the COSO criteria). In our opinion, The AES Corporation (the Company) maintained, in all material respects, effective internal control over financialreporting as of December 31, 2017 , based on the COSO criteria.
As indicated in the accompanying Item 9A, Management’s Report on Internal Control over Financial Reporting , management’s assessment ofand conclusion on the effectiveness of internal control over financial reporting did not include the internal controls of Alto Sertão II, which is includedin the 2017 consolidated financial statements of the Company and constituted 1.5% and 1.9% of total and net assets, respectively, as ofDecember 31, 2017 . Alto Sertão II's net income of $2.9 million for the period August 3, 2017 through December 31, 2017 was included in theCompany's consolidated statement of operations for the year then ended. Our audit of internal control over financial reporting of the Company alsodid not include an evaluation of the internal control over financial reporting of Alto Sertão II.
We also have audited, in accordance with the standards of the Public Company Accounting Oversight Board (United States) (PCAOB), theconsolidated balance sheets of the Company as of December 31, 2017 and 2016 , and the related consolidated statements of operations,comprehensive loss, changes in equity, and cash flows for each of the three years in the period ended December 31, 2017 , of the Company, andthe related notes and financial statement schedule listed in the Index at Item 15(a) (collectively referred to as the “financial statements”), and ourreport dated February 26, 2018 , expressed an unqualified opinion thereon.
Basis for Opinion
The Company’s management is responsible for maintaining effective internal control over financial reporting and for its assessment of theeffectiveness of internal control over financial reporting included in the accompanying Management’s Report on Internal Control over FinancialReporting . Our responsibility is to express an opinion on the Company’s internal control over financial reporting based on our audit. We are a publicaccounting firm registered with the PCAOB and are required to be independent with respect to the Company in accordance with the U.S. federalsecurities laws and the applicable rules and regulations of the Securities and Exchange Commission and the PCAOB.
We conducted our audit in accordance with the standards of the PCAOB. Those standards require that we plan and perform the audit to obtainreasonable assurance about whether effective internal control over financial reporting was maintained in all material respects.
Our audit included obtaining an understanding of internal control over financial reporting, assessing the risk that a material weakness exists,testing and evaluating the design and operating effectiveness of internal control based on the assessed risk, and performing such other proceduresas we considered necessary in the circumstances. We believe that our audit provides a reasonable basis for our opinion.
Definition and Limitations of Internal Control Over Financial Reporting
A company’s internal control over financial reporting is a process designed to provide reasonable assurance regarding the reliability of financialreporting and the preparation of financial statements for external purposes in accordance with generally accepted accounting principles. Acompany’s internal control over financial reporting includes those policies and procedures that (1) pertain to the maintenance of records that, inreasonable detail, accurately and fairly reflect the transactions and dispositions of the assets of the company; (2) provide reasonable assurance thattransactions are recorded as necessary to permit preparation of financial statements in accordance with generally accepted accounting principles,and that receipts and expenditures of the company are being made only in accordance with authorizations of management and directors of thecompany; and (3) provide reasonable assurance regarding prevention or timely detection of unauthorized acquisition, use, or disposition of thecompany’s assets that could have a material effect on the financial statements.
168

Because of its inherent limitations, internal control over financial reporting may not prevent or detect misstatements. Also, projections of anyevaluation of effectiveness to future periods are subject to the risk that controls may become inadequate because of changes in conditions, or thatthe degree of compliance with the policies or procedures may deteriorate.
/s/ Ernst & Young LLP
Tysons, VirginiaFebruary 26, 2018
ITEM 9B. OTHER INFORMATION
None.
169

PART III
ITEM 10. DIRECTORS, EXECUTIVE OFFICERS AND CORPORATE GOVERNANCE
The following information is incorporated by reference from the Registrant's Proxy Statement for the Registrant's 2018 Annual Meeting ofStockholders which the Registrant expects will be filed on or around March 9, 2018 (the " 2018 Proxy Statement"):
• information regarding the directors required by this item found under the heading Board of Directors ;• information regarding AES' Code of Ethics found under the heading Additional Governance Matters - AES Code of Business Conduct and
Corporate Governance Guidelines ;• information regarding compliance with Section 16 of the Exchange Act required by this item found under the heading Additional Governance
Matters - Other Governance Information - Section 16(a) Beneficial Ownership Reporting Compliance ; and• information regarding AES' Financial Audit Committee found under the heading Board and Committee Governance Matters - Financial Audit
Committee (the “Audit Committee”).
Certain information regarding executive officers required by this Item is presented as a supplementary item in Part I hereof (pursuant toInstruction 3 to Item 401(b) of Regulation S-K). The other information required by this Item, to the extent not included above, will be contained in our2018 Proxy Statement and is herein incorporated by reference.
ITEM 11. EXECUTIVE COMPENSATION
The information required by Item 402 of Regulation S-K is contained in the 2018 Proxy Statement under "Director Compensation" and"Executive Compensation" (excluding the information under the caption “Report of the Compensation Committee”) and is incorporated herein byreference.
The information required by Item 407(e)(5) of Regulation S-K is contained under the caption “Report of the Compensation Committee Report”of the Proxy Statement. Such information shall not be deemed to be “filed.”
ITEM 12. SECURITY OWNERSHIP OF CERTAIN BENEFICIAL OWNERS AND MANAGEMENT AND RELATED STOCKHOLDER MATTERS
(a) Security Ownership of Certain Beneficial Owners and Management.
See the information contained under the heading Security Ownership of Certain Beneficial Owners, Directors, and Executive Officers of the2018 Proxy Statement, which information is incorporated herein by reference.
(b) Securities Authorized for Issuance under Equity Compensation Plans.
The following table provides information about shares of AES common stock that may be issued under AES' equity compensation plans, as ofDecember 31, 2017 :
Securities Authorized for Issuance under Equity Compensation Plans (As of December 31, 2017 )
(a) (b) (c)
Plan category
Number of securitiesto be issued upon exercise of
outstanding options, warrants andrights
Weighted average exercise priceof outstanding options, warrants
and rights Number of securities remaining available for future issuance
under equity compensation plans (excluding securitiesreflected in column (a))
Equity compensation plans approved by security holders (1) 11,490,439 (2) $ 12.75 15,290,314
Equity compensation plans not approved by security holders — — —Total 11,490,439 $ 12.75 15,290,314_____________________________
(1) The following equity compensation plans have been approved by The AES Corporation's Stockholders:(A) The AES Corporation 2003 Long Term Compensation Plan was adopted in 2003 and provided for 17,000,000 shares authorized for issuance thereunder. In 2008,
an amendment to the Plan to provide an additional 12,000,000 shares was approved by AES' stockholders, bringing the total authorized shares to 29,000,000. In2010, an additional amendment to the Plan to provide an additional 9,000,000 shares was approved by AES' stockholders, bringing the total authorized shares to38,000,000. In 2015, an additional amendment to the Plan to provide an additional 7,750,000 shares was approved by AES' stockholders, bringing the totalauthorized shares to 45,750,000. The weighted average exercise price of Options outstanding under this plan included in Column (b) is $12.75 (excludingperformance stock units, restricted stock units and director stock units), with 15,290,314 shares available for future issuance).
(B) The AES Corporation 2001 Plan for outside directors adopted in 2001 provided for 2,750,000 shares authorized for issuance. There are no Options outstandingunder this plan. In conjunction with the 2010 amendment to the 2003 Long Term Compensation plan, ongoing award issuance from this plan was discontinued in2010. Any remaining shares under this plan, which are not reserved for
170

issuance under outstanding awards, are not available for future issuance and thus the amount of 2,088,633 shares is not included in Column (c) above.(C) The AES Corporation Second Amended and Restated Deferred Compensation Plan for directors provided for 2,000,000 shares authorized for issuance. Column
(b) excludes the Director stock units granted thereunder. In conjunction with the 2010 amendment to the 2003 Long Term Compensation Plan, ongoing awardissuance from this plan was discontinued in 2010 as Director stock units will be issued from the 2003 Long Term Compensation Plan. Any remaining shares underthis plan, which are not reserved for issuance under outstanding awards, are not available for future issuance and thus the amount of 105,341 shares is notincluded in Column (c) above.
(2) Includes 4,678,447 (of which 575,721 are vested and 4,102,726 are unvested) shares underlying PSU and RSU awards (assuming performance at a median level),1,642,551 shares underlying Director stock unit awards, and 5,169,441 shares issuable upon the exercise of Stock Option grants, for an aggregate number of11,490,439 shares.
ITEM 13. CERTAIN RELATIONSHIPS AND RELATED PARTY TRANSACTIONS, AND DIRECTOR INDEPENDENCE
The information regarding related party transactions required by this item is included in the 2018 Proxy Statement found under the headingsTransactions with Related Persons and Board and Committee Governance Matters and are incorporated herein by reference.
ITEM 14. PRINCIPAL ACCOUNTANT FEES AND SERVICES
The information required by this Item 14 is included in the 2018 Proxy Statement under the headings Information Regarding The IndependentRegistered Public Accounting Firm, Audit Fees, Audit Related Fees, and Pre-Approval Policies and Procedures and is incorporated herein byreference.
171

PART IVITEM 15. EXHIBITS AND FINANCIAL STATEMENT SCHEDULES
(a) Financial Statements.
Financial Statements and Schedules: PageConsolidated Balance Sheets as of December 31, 2017 and 2016 107Consolidated Statements of Operations for the years ended December 31, 2017, 2016 and 2015 108Consolidated Statements of Comprehensive Loss for the years ended December 31, 2017, 2016 and 2015 109Consolidated Statements of Changes in Equity for the years ended December 31, 2017, 2016 and 2015 110Consolidated Statements of Cash Flows for the years ended December 31, 2017, 2016 and 2015 111Notes to Consolidated Financial Statements 112Schedules S-2-S-7
(b) Exhibits.
3.1
Sixth Restated Certificate of Incorporation of The AES Corporation is incorporated herein by reference to Exhibit 3.1 of the Company's Form 10-K for the yearended December 31, 2008.
3.2 By-Laws of The AES Corporation, as amended and incorporated herein by reference to Exhibit 3.1 of the Company's Form 8-K/A filed on December 2, 2015.
4
There are numerous instruments defining the rights of holders of long-term indebtedness of the Registrant and its consolidated subsidiaries, none of whichexceeds ten percent of the total assets of the Registrant and its subsidiaries on a consolidated basis. The Registrant hereby agrees to furnish a copy of any ofsuch agreements to the Commission upon request. Since these documents are not required filings under Item 601 of Regulation S-K, the Company has electedto file certain of these documents as Exhibits 4.(a)—4.(n).
4.(a)
Junior Subordinated Indenture, dated as of March 1, 1997, between The AES Corporation and Wells Fargo Bank, National Association, as successor to BankOne, National Association (formerly known as The First National Bank of Chicago) is incorporated herein by reference to Exhibit 4.(a) of the Company's Form10-K for the year ended December 31, 2008.
4.(b)
Third Supplemental Indenture, dated as of October 14, 1999, between The AES Corporation and Wells Fargo Bank, National Association, as successor to BankOne, National Association is incorporated herein by reference to Exhibit 4.(b) of the Company's Form 10-K for the year ended December 31, 2008.
4.(c)
Senior Indenture, dated as of December 8, 1998, between The AES Corporation and Wells Fargo Bank, National Association, as successor to Bank One,National Association (formerly known as The First National Bank of Chicago) is incorporated herein by reference to Exhibit 4.01 of the Company's Form 8-K filedon December 11, 1998 (SEC File No. 001-12291).
4.(d)
Ninth Supplemental Indenture, dated as of April 3, 2003, between The AES Corporation and Wells Fargo Bank, National Association (as successor byconsolidation to Wells Fargo Bank Minnesota, National Association) is incorporated herein by reference to Exhibit 4.6 of the Company's Form S-4 filed onDecember 7, 2007.
4.(e)
Twelfth Supplemental Indenture, dated as of October 15, 2007, between The AES Corporation and Wells Fargo Bank, National Association is incorporatedherein by reference to Exhibit 4.8 of the Company's Form S-4 filed on December 7, 2007.
4.(f)
Thirteenth Supplemental Indenture, dated as of May 19, 2008, between The AES Corporation and Wells Fargo Bank, National Association is incorporatedherein by reference to Exhibit 4.(l) of the Company's Form 10-K for the year ended December 31, 2008.
4.(g)
Fifteenth Supplemental Indenture, dated as of June 15, 2011, between The AES Corporation and Wells Fargo Bank, National Association is incorporated hereinby reference to Exhibit 4.3 of the Company's Form 8-K filed on June 15, 2011.
4.(h)
Indenture, dated October 3, 2011, between Dolphin Subsidiary II, Inc. and Wells Fargo Bank, National Association is incorporated herein by reference to Exhibit4.1 of the Company's Form 8-K filed on October 5, 2011.
4.(i)
Sixteenth Supplemental Indenture, dated April 30, 2013, between The AES Corporation and Wells Fargo Bank, N.A., as Trustee is incorporated herein byreference to Exhibit 4.1 of the Company's Form 8-K filed on April 30, 2013 (SEC File No. 001-12291).
4.(j)
Seventeenth Supplemental Indenture, dated March 7, 2014, between The AES Corporation and Wells Fargo Bank, N.A. as Trustee is incorporated herein byreference to Exhibit 4.1 of the Company's Form 8-K filed on March 7, 2014.
4.(k)
Eighteenth Supplemental Indenture, dated May 20, 2014, between The AES Corporation and Wells Fargo Bank, N.A. as Trustee is incorporated herein byreference to Exhibit 4.1 of the Company's Form 8-K filed on May 20, 2014.
4.(l)
Nineteenth Supplemental Indenture, dated April 6, 2015, between The AES Corporation and Wells Fargo Bank, N.A. as Trustee is incorporated herein byreference to Exhibit 4.1 of the Company's Form 8-K filed on April 6, 2015.
4.(m)
Twentieth Supplemental Indenture, dated May 25, 2016, between The AES Corporation and Wells Fargo Bank, N.A. as Trustee is incorporated herein byreference to Exhibit 4.1 of the Company's Form 8-K filed on May 25, 2016.
4.(n)
Twenty-First Supplemental Indenture, dated August 28, 2017, between The AES Corporation and Deutsche Bank Trust Company, as Trustee is incorporatedherein by reference to Exhibit 4.1 of the Company's Form 8-K filed on August 28, 2017.
10.1
The AES Corporation Profit Sharing and Stock Ownership Plan are incorporated herein by reference to Exhibit 4(c)(1) of the Registration Statement on Form S-8 (Registration No. 33-49262) filed on July 2, 1992. (P)
10.2
The AES Corporation Incentive Stock Option Plan of 1991, as amended, is incorporated herein by reference to Exhibit 10.30 of the Company's Form 10-K forthe year ended December 31, 1995 (SEC File No. 00019281). (P)
10.3
Applied Energy Services, Inc. Incentive Stock Option Plan of 1982 is incorporated herein by reference to Exhibit 10.31 of the Registration Statement on Form S-1 (Registration No. 33-40483). (P)
10.4
Deferred Compensation Plan for Executive Officers, as amended, is incorporated herein by reference to Exhibit 10.32 of Amendment No. 1 to the RegistrationStatement on Form S-1 (Registration No. 33-40483). (P)
10.5
Deferred Compensation Plan for Directors, as amended and restated, on February 17, 2012 is incorporated herein by reference to Exhibit 10.5 of theCompany's Form 10-K for the year ended December 31, 2012.
10.6
The AES Corporation Stock Option Plan for Outside Directors, as amended and restated, on December 7, 2007 is incorporated herein by reference to Exhibit10.6 of the Company's Form 10-K for the year ended December 31, 2012.
10.7
The AES Corporation Supplemental Retirement Plan is incorporated herein by reference to Exhibit 10.63 of the Company's Form 10-K for the year endedDecember 31, 1994 (SEC File No. 00019281). (P)
10.7A
Amendment to The AES Corporation Supplemental Retirement Plan, dated March 13, 2008 is incorporated herein by reference to Exhibit 10.9.A of theCompany's Form 10-K for the year ended December 31, 2007.
172

10.8
The AES Corporation 2001 Stock Option Plan is incorporated herein by reference to Exhibit 10.12 of the Company's Form 10-K for the year endedDecember 31, 2000 (SEC File No. 001-12291).
10.9
Second Amended and Restated Deferred Compensation Plan for Directors is incorporated herein by reference to Exhibit 10.13 of the Company's Form 10-K forthe year ended December 31, 2000 (SEC File No. 001-12291).
10.10
The AES Corporation 2001 Non-Officer Stock Option Plan is incorporated herein by reference to Exhibit 10.12 of the Company's Form 10-K for the year endedDecember 31, 2002 (SEC File No. 001-12291).
10.10A
Amendment to the 2001 Stock Option Plan and 2001 Non-Officer Stock Option Plan, dated March 13, 2008 is incorporated herein by reference toExhibit 10.12A of the Company's Form 10-K for the year ended December 31, 2007.
10.11
The AES Corporation 2003 Long Term Compensation Plan, as Amended and Restated, dated April 23, 2015, is incorporated herein by reference to Exhibit 99.1of the Company's Form 8-K filed on April 23, 2015.
10.12
Form of AES Nonqualified Stock Option Award Agreement under The AES Corporation 2003 Long Term Compensation Plan (Outside Directors) is incorporatedherein by reference to Exhibit 10.2 of the Company's Form 8-K filed on April 27, 2010.
10.13
Form of AES Performance Stock Unit Award Agreement under The AES Corporation 2003 Long Term Compensation Plan is incorporated herein by referenceto Exhibit 10.13 of the Company's Form 10-K for the year ended December 31, 2015.
10.14
Form of AES Restricted Stock Unit Award Agreement under The AES Corporation 2003 Long Term Compensation Plan is incorporated herein by reference toExhibit 10.14 of the Company's Form 10-K for the year ended December 31, 2015.
10.15
Form of AES Performance Unit Award Agreement under The AES Corporation 2003 Long Term Compensation Plan is incorporated herein by reference toExhibit 10.15 of the Company's Form 10-K for the year ended December 31, 2015.
10.16
Form of AES Nonqualified Stock Option Award Agreement under The AES Corporation 2003 Long Term Compensation Plan is incorporated herein by referenceto Exhibit 10.4 of the Company's Form 10-Q for the quarter ended June 30, 2015.
10.17
Form of AES Performance Cash Unit Award Agreement under The AES Corporation 2003 Long Term Compensation Plan is incorporated herein by reference toExhibit 10.17 of the Company's Form 10-K for the year ended December 31, 2015.
10.18
The AES Corporation Restoration Supplemental Retirement Plan, as amended and restated, dated December 29, 2008 is incorporated herein by reference toExhibit 10.15 of the Company's Form 10-K for the year ended December 31, 2008.
10.18A
Amendment to The AES Corporation Restoration Supplemental Retirement Plan, dated December 9, 2011 is incorporated herein by reference to Exhibit 10.17Aof the Company's Form 10-K for the year ended December 31, 2012.
10.19
The AES Corporation International Retirement Plan, as amended and restated on December 29, 2008 is incorporated herein by reference to Exhibit 10.16 of theCompany's Form 10-K for the year ended December 31, 2008.
10.19A
Amendment to The AES Corporation International Retirement Plan, dated December 9, 2011 is incorporated herein by reference to Exhibit 10.18A of theCompany's Form 10-K for the year ended December 31, 2012.
10.20
The AES Corporation Severance Plan, as amended and restated on August 4, 2017 is incorporated herein by reference to Exhibit 10.1 of the Company's Form10-Q for the quarter ended June 30, 2017.
10.21
The AES Corporation Amended and Restated Executive Severance Plan dated August 4, 2017 is incorporated herein by reference to Exhibit 10.2 of theCompany's Form 10-Q for the period ended June 30, 2017.
10.22
The AES Corporation Performance Incentive Plan, as Amended and Restated on April 23, 2015 is incorporated herein by reference to Exhibit 99.2 of theCompany's Form 8-K filed on April 23, 2015.
10.23
The AES Corporation Deferred Compensation Program For Directors dated February 17, 2012 is incorporated herein by reference to Exhibit 10.22 of theCompany's Form 10-K filed on December 31, 2011.
10.24
The AES Corporation Employment Agreement with Andrés Gluski is incorporated herein by reference to Exhibit 99.3 of the Company's Form 8-K filed onDecember 31, 2008.
10.25
Mutual Agreement, between Andrés Gluski and The AES Corporation dated October 7, 2011 is incorporated herein by reference to Exhibit 10.2 of theCompany's Form 10-Q for the period ended September 30, 2011.
10.26
Form of Retroactive Consent to Provide for Double-Trigger Change-In-Control Transactions is incorporated herein by reference to Exhibit 10.7 of the Company'sForm 10-Q for the period ended June 30, 2015.
10.27
Amendment No. 3, dated as of July 26, 2013 to the Fifth Amended and Restated Credit and Reimbursement Agreement, dated as of July 29, 2010 isincorporated herein by reference to Exhibit 10.1 of the Company's Form 8-K filed on July 29, 2013.
10.27A
Sixth Amended and Restated Credit and Reimbursement Agreement dated as of July 26, 2013 among The AES Corporation, a Delaware corporation, theBanks listed on the signature pages thereof, Citibank, N.A., as Administrative Agent and Collateral Agent, Citigroup Global Markets Inc., as Lead Arranger andBook Runner, Banc of America Securities LLC, as Lead Arranger and Book Runner and Co-Syndication Agent, Barclays Capital, as Lead Arranger and BookRunner and Co-Syndication Agent, RBS Securities Inc., as Lead Arranger and Book Runner and Co-Syndication Agent and Union Bank, N.A., as Lead Arrangerand Book Runner and Co-Syndication Agent is incorporated herein by reference to Exhibit 10.1.A of the Company's Form 8-K filed on July 29, 2013.
10.27B
Appendices and Exhibits to the Sixth Amended and Restated Credit and Reimbursement Agreement, dated as of July 29, 2013 is incorporated herein byreference to Exhibit 10.1.B of the Company's Form 8-K filed on July 29, 2013.
10.27C
Amendment No. 1, dated as of May 6, 2016 to the Sixth Amended and Restated Credit and Reimbursement Agreement, dated as of July 23, 2013 among TheAES Corporation, a Delaware corporation, the Banks listed on the signature pages thereof and Citibank, N.A. as Administrative Agent and Collateral Agent isincorporated herein by reference to Exhibit 10.1 of the Company's Form 8-K filed on May 9, 2016.
10.27D
Amendment No. 2, dated as of June 28, 2017, to the Sixth Amended and Restated Credit and Reimbursement Agreement, dated as of July 26, 2013 amongThe AES Corporation, a Delaware corporation, the Banks listed on the signature pages thereof and Citibank, N.A. as Administrative Agent and Collateral Agentis incorporated herein by reference to Exhibit 10.1 of the Company's Form 8-K filed on June 29, 2017.
10.27E
Annex A. to Amendment No. 2, dated as of June 28, 2017, to the Sixth Amended and Restated Credit and Reimbursement Agreement, dated as of July 26,2013 is incorporated herein by reference to 10.1.A of the Company's Form 8-K filed on June 29, 2017.
10.28
Collateral Trust Agreement dated as of December 12, 2002 among The AES Corporation, AES International Holdings II, Ltd., Wilmington Trust Company, ascorporate trustee and Bruce L. Bisson, an individual trustee is incorporated herein by reference to Exhibit 4.2 of the Company's Form 8-K filed on December 17,2002 (SEC File No. 001-12291).
10.29
Security Agreement dated as of December 12, 2002 made by The AES Corporation to Wilmington Trust Company, as corporate trustee and Bruce L. Bisson, asindividual trustee is incorporated herein by reference to Exhibit 4.3 of the Company's Form 8-K filed on December 17, 2002 (SEC File No. 001-12291).
10.30
Credit Agreement dated as of May 24, 2017 among The AES Corporation, as borrower, the bank listed therein and Bank of America, N.A., as administrativeagent is incorporated herein by reference to Exhibit 10.1 of the Company's Form 8-K filed on May 24, 2017.
173

10.31
Charge Over Shares dated as of December 12, 2002 between AES International Holdings II, Ltd. and Wilmington Trust Company, as corporate trustee andBruce L. Bisson, as individual trustee is incorporated herein by reference to Exhibit 4.4 of the Company's Form 8-K filed on December 17, 2002 (SEC File No.001-12291).
10.32
Agreement and Plan of Merger, dated as of February 19, 2017, by and among AES Lumos Holdings, LLC, PIP5 Lumos LLC, AES Lumos Merger Sub, LLC,PIP5 Lumos MS LLC, FTP Power LLC and Fir Tree Solar LLC is incorporated herein by reference to Exhibit 10.31 of the Company's Form 10-K for the yearending December 31, 2016.
10.33 Consulting Agreement by and between The AES Corporation and Brian A. Miller dated February 26, 2018 (filed herewith)12 Statement of computation of ratio of earnings to fixed charges (filed herewith).21.1 Subsidiaries of The AES Corporation (filed herewith).23.1 Consent of Independent Registered Public Accounting Firm, Ernst & Young LLP (filed herewith).24 Powers of Attorney (filed herewith).31.1 Rule 13a-14(a)/15d-14(a) Certification of Andrés Gluski (filed herewith).31.2 Rule 13a-14(a)/15d-14(a) Certification of Thomas M. O'Flynn (filed herewith).32.1 Section 1350 Certification of Andrés Gluski (filed herewith).32.2 Section 1350 Certification of Thomas M. O'Flynn (filed herewith).101.INS XBRL Instance Document (filed herewith).101.SCH XBRL Taxonomy Extension Schema Document (filed herewith).101.CAL XBRL Taxonomy Extension Calculation Linkbase Document (filed herewith).101.DEF XBRL Taxonomy Extension Definition Linkbase Document (filed herewith).101.LAB XBRL Taxonomy Extension Label Linkbase Document (filed herewith).101.PRE XBRL Taxonomy Extension Presentation Linkbase Document (filed herewith).
(c) SchedulesSchedule I—Financial Information of Registrant
174

SIGNATURES
Pursuant to the requirements of Section 13 or 15(d) of the Securities Exchange Act of 1934, as amended, the Company has duly caused thisreport to be signed on its behalf by the undersigned, thereunto duly authorized.
THE AES CORPORATION(Company)
Date: February 26, 2018 By: /s/ A NDRÉS G LUSKI
Name: Andrés Gluski
President, Chief Executive Officer
Pursuant to the requirements of the Securities Exchange Act of 1934, as amended, this report has been signed below by the following personson behalf of the Company and in the capacities and on the dates indicated.
Name Title Date
* President, Chief Executive Officer (Principal Executive Officer) and Director
Andrés Gluski February 26, 2018
* Director
Charles L. Harrington February 26, 2018* Director
Kristina M. Johnson February 26, 2018
* Director
Tarun Khanna February 26, 2018
* Director
Holly K. Koeppel February 26, 2018
* Director
James H. Miller February 26, 2018 * Director
Alain Monié February 26, 2018
* Director
John B. Morse February 26, 2018
* Director
Moises Naim February 26, 2018
* Chairman of the Board and Lead Independent Director
Charles O. Rossotti February 26, 2018
* Director
Jeffrey W. Ubben February 26, 2018
/s/ THOMAS M. O'FLYNN Executive Vice President and Chief Financial Officer (Principal Financial Officer) Thomas M. O'Flynn February 26, 2018
/s/ SARAH R. BLAKE Vice President and Controller (Principal Accounting Officer)
Sarah R. Blake February 26, 2018
*By: /s/ PAUL L. FREEDMAN February 26, 2018 Attorney-in-fact
175

THE AES CORPORATION AND SUBSIDIARIES
INDEX TO FINANCIAL STATEMENT SCHEDULES
Schedule I—Condensed Financial Information of Registrant S-2
Schedules other than that listed above are omitted as the information is either not applicable, not required, or has been furnished in theconsolidated financial statements or notes thereto included in Item 8 hereof.
See Notes to Schedule I
S-1

THE AES CORPORATIONSCHEDULE I CONDENSED FINANCIAL INFORMATION OF PARENT
BALANCE SHEETS
December 31, 2017 2016 (in millions)ASSETS Current Assets:
Cash and cash equivalents $ 10 $ 109Restricted cash — 3Accounts and notes receivable from subsidiaries 143 155Prepaid expenses and other current assets 27 39
Total current assets 180 306Investment in and advances to subsidiaries and affiliates 8,239 7,561Office Equipment:
Cost 27 26Accumulated depreciation (18) (16)
Office equipment, net 9 10Other Assets:
Other intangible assets, net of accumulated amortization 3 5Deferred financing costs, net of accumulated amortization of $2 and $1, respectively 5 5Deferred income taxes 289 1,041Other assets 2 13
Total other assets 299 1,064Total assets $ 8,727 $ 8,941
LIABILITIES AND STOCKHOLDERS' EQUITY Current Liabilities:
Accounts payable $ 18 $ 18Accounts and notes payable to subsidiaries 381 304Accrued and other liabilities 246 250
Senior notes payable—current portion 5 —Total current liabilities 650 572Long-term Liabilities:
Senior notes payable 4,625 4,154Junior subordinated notes and debentures payable — 517Accounts and notes payable to subsidiaries 967 883Other long-term liabilities 20 21
Total long-term liabilities 5,612 5,575Stockholders' equity:
Common stock 8 8Additional paid-in capital 8,501 8,592Accumulated deficit (2,276) (1,146)Accumulated other comprehensive loss (1,876) (2,756)Treasury stock (1,892) (1,904)
Total stockholders' equity 2,465 2,794Total liabilities and equity $ 8,727 $ 8,941
See Notes to Schedule I.
S-2

THE AES CORPORATIONSCHEDULE I CONDENSED FINANCIAL INFORMATION OF PARENT
STATEMENTS OF OPERATIONS
For the Years Ended December 31, 2017 2016 2015 (in millions)Revenue from subsidiaries and affiliates $ 28 $ 14 $ 24Equity in earnings of subsidiaries and affiliates 630 (615) 859Interest income 49 19 24General and administrative expenses (158) (144) (154)Other income 5 7 24Other expense (554) (65) (6)Loss on extinguishment of debt (92) (14) (105)Interest expense (317) (344) (364)Income (loss) before income taxes (409) (1,142) 302Income tax benefit (expense) (752) 12 4Net income (loss) $ (1,161) $ (1,130) $ 306
See Notes to Schedule I.
S-3

THE AES CORPORATIONSCHEDULE I CONDENSED FINANCIAL INFORMATION OF PARENT
STATEMENTS OF COMPREHENSIVE LOSSYEARS ENDED DECEMBER 31, 2017 , 2016 , AND 2015
2017 2016 2015 (in millions)NET INCOME (LOSS) $ (1,161) $ (1,130) $ 306
Foreign currency translation activity: Foreign currency translation adjustments, net of income tax benefit (expense) of $11, $1 and $1, respectively 18 117 (674)Reclassification to earnings, net of $0 income tax for all periods 643 992 —
Total foreign currency translation adjustments, net of tax 661 1,109 (674)Derivative activity:
Change in derivative fair value, net of income tax benefit (expense) of $13, $(5) and $4, respectively (14) 2 (5)Reclassification to earnings, net of income tax benefit (expense) of $1, $1 and $(12), respectively 37 28 48
Total change in fair value of derivatives, net of tax 23 30 43Pension activity:
Prior service cost for the period, net of income tax expense of $1, $5 and $0, respectively 1 9 1Change in pension adjustments due to net actuarial gain (loss) for the period, net of income tax benefit (expense) of $6,$10 and $(7), respectively (20) (22) 18Reclassification of earnings due to amortization of net actuarial loss, net of income tax benefit (expense) of $(126), $2 and$(2), respectively 248 1 2
Total change in unfunded pension obligation 229 (12) 21OTHER COMPREHENSIVE INCOME (LOSS) 913 1,127 (610)COMPREHENSIVE LOSS $ (248) $ (3) $ (304)
See Notes to Schedule I.
S-4

THE AES CORPORATIONSCHEDULE I CONDENSED FINANCIAL INFORMATION OF PARENT
STATEMENTS OF CASH FLOWS
For the Years Ended December 31, 2017 2016 2015 (in millions)Net cash provided by operating activities $ 148 $ 818 $ 475Investing Activities:
Investment in and net advances to subsidiaries (339) (650) (221)Return of capital 243 247 501Decrease in restricted cash 3 29 49Additions to property, plant and equipment (13) (12) (11)
Net cash provided by (used in) investing activities (106) (386) 318Financing Activities:
Borrowings under the revolver, net 207 — —Borrowings of notes payable and other coupon bearing securities 1,025 500 575Repayments of notes payable and other coupon bearing securities (1,353) (808) (915)Loans from subsidiaries 309 183 —Purchase of treasury stock — (79) (482)Proceeds from issuance of common stock 1 1 4Common stock dividends paid (317) (290) (276)Payments for deferred financing costs (12) (12) (6)Distributions to noncontrolling interests — (2) —Other financing (7) (3) (18)
Net cash used in financing activities (147) (510) (1,118)Effect of exchange rate changes on cash 6 1 —Decrease in cash and cash equivalents (99) (77) (325)Cash and cash equivalents, beginning 109 186 511Cash and cash equivalents, ending $ 10 $ 109 $ 186Supplemental Disclosures:
Cash payments for interest, net of amounts capitalized $ 282 $ 296 $ 314Cash payments for income taxes, net of refunds $ 2 $ 6 $ —
See Notes to Schedule I.
S-5

THE AES CORPORATIONSCHEDULE I
NOTES TO SCHEDULE I1. Application of Significant Accounting Principles
The Schedule I Condensed Financial Information of the Parent includes the accounts of The AES Corporation (the “Parent Company”) andcertain holding companies.
ACCOUNTING FOR SUBSIDIARIES AND AFFILIATES — The Parent Company has accounted for the earnings of its subsidiaries on theequity method in the financial information.
INCOME TAXES — Positions taken on the Parent Company's income tax return which satisfy a more-likely-than-not threshold will berecognized in the financial statements. The income tax expense or benefit computed for the Parent Company reflects the tax assets and liabilities ona stand-alone basis and the effect of filing a consolidated U.S. income tax return with certain other affiliated companies as well as effects of U.S. taxlaw reform enacted in 2017.
ACCOUNTS AND NOTES RECEIVABLE FROM SUBSIDIARIES — Amounts have been shown in current or long-term assets based onterms in agreements with subsidiaries, but payment is dependent upon meeting conditions precedent in the subsidiary loan agreements.
2. DebtSenior and Secured Notes and Loans Payable ($ in millions)
December 31, Interest Rate Maturity 2017 2016
Senior Unsecured Note LIBOR + 3.00% 2019 $ — $ 240Senior Unsecured Note 8.00% 2020 228 469Senior Unsecured Note 7.38% 2021 690 966Drawings on secured credit facility LIBOR + 2.00% 2021 207 —Senior Secured Term Loan LIBOR + 2.00% 2022 521 —Senior Unsecured Note 4.88% 2023 713 713Senior Unsecured Note 5.50% 2024 738 738Senior Unsecured Note 5.50% 2025 573 573Senior Unsecured Note 6.00% 2026 500 500Senior Unsecured Note 5.13% 2027 500 —
Unamortized (discounts)/premiums & debt issuance (costs) (40) (45)Subtotal $ 4,630 $ 4,154
Less: Current maturities (5) —Total $ 4,625 $ 4,154
Junior Subordinated Notes Payable ($ in millions)
December 31, Interest Rate Maturity 2017 2016Term Convertible Trust Securities 6.75% 2029 $ — $ 517
FUTURE MATURITIES OF RECOURSE DEBT — As of December 31, 2017 scheduled maturities are presented in the following table (inmillions):
December 31, Annual Maturities2018 $ 52019 52020 2342021 9022022 500Thereafter 3,024Unamortized (discount)/premium & debt issuance (costs) (40)
Total debt $ 4,630
3. Dividends from Subsidiaries and AffiliatesCash dividends received from consolidated subsidiaries were $1.2 billion , $1 billion , and $748 million for the years ended December 31, 2017
, 2016 , and 2015 , respectively. There were no cash dividends received from affiliates accounted for by the equity method for the years endedDecember 31, 2017 , 2016 , and 2015 .
S-6

4. Guarantees and Letters of CreditGUARANTEES — In connection with certain of its project financing, acquisition, and power purchase agreements, the Parent Company has
expressly undertaken limited obligations and commitments, most of which will only be effective or will be terminated upon the occurrence of futureevents. These obligations and commitments, excluding those collateralized by letter of credit and other obligations discussed below, were limited asof December 31, 2017 , by the terms of the agreements, to an aggregate of approximately $842 million representing 22 agreements with individualexposures ranging from $1 million to $272 million . These amounts exclude normal and customary representations and warranties in agreements forthe sale of assets (including ownership in associated legal entities) where the associated risk is considered to be nominal.
LETTERS OF CREDIT — At December 31, 2017 , the Parent Company had $36 million in letters of credit outstanding under the seniorsecured credit facility, representing 21 agreements with individual exposures up to $13 million , and $52 million in letters of credit outstanding underthe senior unsecured credit facility, representing 4 agreements with individual exposures ranging from $2 million to $26 million . During 2017 , theParent Company paid letter of credit fees ranging from 0.25% to 2.25% per annum on the outstanding amounts.
S-7

CONSULTANTAGREEMENT
This Consultant Agreement (“Agreement”) dated February 26, 2018, by and between The AES Corporation and its subsidiaries(collectively, the “Company”) and Brian A. Miller (the “Consultant”), both hereinafter referred to collectively as the “Parties”.
WHEREAS, the Company desires to engage the Consultant to provide consulting services, as more fully described in Section 1below (the “Services”), and the Consultant desires to provide the Services, in each case, on the terms and conditions set forth herein.
1. ScopeofServices.The Consultant shall make himself available to perform such advisory and consulting services to the Companyas the Company reasonably requests. The Company and the Consultant agree that it is reasonably anticipated that the Consultant’s Serviceshereunder will require the Consultant to render Services at a level that will not exceed 20% of the average level of the Consultant’s servicesas an employee of the Company over the thirty-six (36)-month period preceding the date of this Agreement. The parties acknowledge that, forpurposes of Section 409A of the Internal Revenue Code, the Consultant will have undergone a “separation from service,” within the meaningof Section 409A, from the Company upon the date of the Consultant’s termination of employment with the Company on March 31, 2018.
The Consultant agrees that, in providing the Services, the Consultant will follow the reasonable instructions of the Company’s ChiefExecutive Officer or General Counsel, in good faith and at all times act in the interests of the Company.
The Consultant warrants that he will perform the Services in a good and prompt manner with reasonable care and in compliance with industryand professional standards and applicable laws and regulations. The Consultant will conduct himself in a manner consistent with thestandards, quality, and image of the Company.
The Consultant agrees that he will not and is not authorized to make any representation to any third party of the plans, projections orcapabilities of the Company other than disclosing such information as is publicly available. The Consultant agrees that he will not and is notauthorized to make any representation to any third party that the Consultant has any authority to bind the Company.
2.CompensationandExpenses.
(a) Compensation : In consideration for the Services to be performed by the Consultant and subject to the conditions described in thisparagraph, the Company agrees to pay the Consultant a fee of $25,000.00 per month for twenty-four (24) months, beginning with the monthending on April 30, 2018; provided that, if the Agreement is terminated by either party pursuant to Section 3 prior to March 31, 2020, theConsultant will receive a monthly payment for the last month (or portion thereof) in which the Services are performed and the Consultantshall receive no further payments under this Agreement. In order to receive the monthly fee, the Consultant must be in compliance with theterms and conditions of the separation agreement entered into between the Consultant and the Company and the Consultant must deliver tothe Company (a) a statement executed by the Consultant and dated on the15 thofeachmonththat the Consultant has fully performed hisobligations under this Agreement and (b) an executed release in the form attached hereto as Annex A (which is not revoked). The monthly fee(if payable) will be paid on the last day of each month beginning with April 30, 2018. For the avoidance of doubt, the Consultant will notreceive any payments under this Agreement if the Consultant does not perform the Services through April of 2018.
1

(b)Expenses:The Company will reimburse the Consultant for all reasonable, pre-approved travel (from execution until termination ofAgreement) and lodging expenses relating to the Consultant’s Services, in accordance with the Company’s travel policy. In addition, theCompany will reimburse Consultant for all reasonable pre-approved other expenses which Consultant incurs in connection with theperformance of the Services, including phone, fax and postage expenses. The Company will reimburse the Consultant in accordance with itsexisting policies for expense reimbursement.
3.ConsultingTermandTermination.The terms of this Agreement shall continue for twenty-four (24) months from April 1, 2018 untilMarch 31, 2020 (the “Consulting Term”). Consultant must submit final requests for reimbursement within fifteen (15) days of the endofeachmonth. The Company may terminate this Agreement by written notice to the Consultant at any time prior to the end of the ConsultingTerm in the event that the Consultant has breached in any material respect any of the terms or conditions of this Agreement. The Consultantmay terminate this Agreement at any time upon thirty (30) days’ prior written notice to the Company. In the event of termination of thisAgreement, the Consultant will not be eligible to receive any further payments under this Agreement.
4. Indemnification. The Consultant shall defend, indemnify, and hold harmless the Company, as well as its subsidiaries, and theirrespective officers, directors, agents, and employees (collectively the “Company Indemnified Parties”) from and against any and all actions,costs, claims, losses, expenses and/or damages, including attorneys’ fees, arising out of or resulting from the performance of the Servicesincluding, but not limited to, any damage or loss to the Company. The foregoing indemnification obligations shall not apply to the extent ofthe Company’s negligence or willful misconduct. The provisions contained in this paragraph shall survive the termination of this Agreement.
5.GoverningLaw.This Agreement shall be governed by the laws of the Commonwealth of Virginia and Consultant hereby submits to andagrees that the exclusive jurisdiction for any suit, action or proceeding involving this Agreement will be any federal or state court located inthe Commonwealth of Virginia. If any provision of this Agreement is deemed to be unenforceable, it shall not affect the enforceability of theremaining provisions of this Agreement. This document contains the entire agreement between Consultant and the Company concerning thesubject matter contained herein.
6. Severability. If any provision of this Agreement is held invalid or unenforceable by any court of competent jurisdiction, the otherprovisions of this Agreement will remain in full force and effect. Any provision of this Agreement held invalid or unenforceable only in partor degree will remain in full force and effect to the extent not held invalid or unenforceable.
7.Counterparts;Facsimile.This Agreement may be executed in two or more counterparts (including by facsimile), each of which shall bedeemed an original, but all of which together shall constitute one instrument.
8. BindingNatureofAgreement.This Agreement shall be binding upon and inure to the benefit of and be enforceable by the Partieshereto, their successors and permitted assigns.
9.Assignment.None of the Parties may assign or transfer this Agreement or any of their rights hereunder without the prior written consentof the Company (and its successors and assigns).
10.Notice. Any notice, communication, request, reply or advise (“Notice”) in this Agreement provided or permitted to be given, made oraccepted by either party to the other must be in writing and shall be effectively given if deposited in the United States mail, postpaid andcertified and addressed to the party to
2

be notified, with return receipt requested (mail services may include overnight Express Mail, Federal Express and UPS service), or deliveredin person to such party. Any Notice mailed shall be effective, unless otherwise stated in this Agreement, from and after the expiration of three(3) days after it is deposited in a depository of the United States Postal Service or other overnight mail services as referred to above. Oral orany other notice given in any manner shall be effective only if and when received by the other party to be notified. For purposes of Notice,the addresses of the Parties shall, until changed as hereinafter provided, be as follows:
If to Company: The AES Corporation4300 Wilson BlvdArlington, Virginia 22203Attn: General Counsel
and to Consultant at his address on file with the Company. Any party may change its address for purposes of this Section 10 by providing theother party with written notice of the new address in the manner provided above.
11. AmendmentandWaiver.Any provision of this Agreement may be amended if, but only if, such amendment is in writing and issigned by both Parties. Any provision may be waived if, but only if, such waiver is in writing and is signed by or on behalf of the partywaiving such provision.
12.CodeofConductandComplianceProgram.The Consultant hereby represents and warrants that it has received a copy of the AESCode of Conduct that he has read it and understands it and agrees to comply with all of its provisions.
The Consultant hereby agrees to the compliance terms and provisions set forth in Annex B attached hereto and made an integral part of thisAgreement hereby.
13.RelationshipofParties.The Consultant acknowledges that as of the commencement of the term of this Agreement, Consultant is notan agent, employee, representative or partner of the Company and is not capable, nor shall the Consultant hold himself out as capable, ofbinding the Company to any obligation or liability without the prior written consent of the Company. The Consultant shall be solelyresponsible for all taxes arising with respect to this Agreement. Neither the execution and delivery of this Agreement, nor consummation ofthe discussions or evaluation of a transaction contemplated herein, shall create or constitute, or be deemed to require, or be deemed to requirecreation of, a partnership, joint venture or any other form of business organization or arrangement between the Parties, unless so specified ina subsequent writing executed by the parties.
In furtherance of the foregoing, the Consultant acknowledges that he will not be entitled to participate in or receive any benefit or right as aCompany employee under any Company employee benefit and welfare plans, including, without limitation, employee insurance, pension,savings and security plans as a result of entering into this Agreement.
14. Confidential Information. During the course of implementing this Agreement, the Consultant may have access to financialinformation, trade secrets and confidential know-how which is developed by or on behalf of the Company, which information is non-public,confidential or proprietary (“Information”).
The Consultant agrees to keep the Information confidential and not to disclose the information to third parties without the prior writtenconsent from the Company.
3

The obligations of confidentiality set out in this clause do not extend to Information that (whether before or after the date of acceptance ofthis letter):
1.is in the Consultant’s possession without knowledge of an obligation of confidentiality with respect to that Information at or priorto the time of disclosure;
2.is public knowledge (otherwise than as a result of a breach of this paragraph); or3.is required by law to be disclosed.
The Consultant agrees (to the extent permitted by law) to inform the Company of the full circumstances of any disclosure of Information orupon becoming aware that Information has been disclosed in breach of this Agreement. The Consultant agrees to cooperate with theCompany to seek a procedural order or other protection in case of disclosure under line 3 above.
The Consultant agrees, upon the request of the Company, to return all Information that the Consultant was provided from the Company. TheConsultant acknowledges that some or all of the Information is or may be price sensitive information and that the use of such informationmay be regulated or prohibited by applicable legislation relating to insider dealing and the Consultant agrees not to use any Information forany unlawful purpose.
The obligations in this clause survive termination of this Agreement.
Notwithstanding the foregoing, nothing in this Agreement is intended to preclude or limit Consultant from communicating with, respondingto inquiries from, volunteering information to, or providing testimony before any federal, state or local government legislature, agency, orcommission, or any self-regulatory organization, with respect to suspected violations of law, including the Securities and ExchangeCommission, Financial Industry Regulatory Authority or New York Stock Exchange (or any other national exchange on which the shares ofthe Company’s common stock are listed). Consultant understands and agrees that he is not required to contact or receive consent from theCompany and/or its subsidiaries before engaging in such communications with any such authorities; provided, however, that Consultant (1)must inform such authority that the information provided is confidential and (2) may not provide confidential information that is protectedfrom disclosure by the attorney-client privilege or attorney work-product doctrine, except as is expressly permitted by law.
15. Entire Agreement.This Agreement is intended by the Parties hereto as a final and complete expression of their agreement andunderstanding in respect to the subject matter contained herein. This Agreement supersedes all prior agreements and understandings, writtenor oral, between the Parties with respect to such subject matter.
INWITNESSWHEREOF,THISAGREEMENTis executed and delivered effective as of the date first written above.
BrianA.Miller TheAESCorporation
/s/ Brian A. Miller By: /s/ Paul L. Freedman Name: Paul L. Freedman
Title: Senior Vice President and General Counsel
4

ANNEXA
RELEASE
THIS RELEASE, dated as of date (_______ __, _____), is made by Brian A. Miller (“Releasor”) in favor of and for the benefit of theReleased Parties (as defined below).
NOW, THEREFORE, in consideration for the payments, benefits and promises contained in the Consultant Agreement (the"Consultant Agreement"), dated _________ __, _____, by and between Brian A. Miller and The AES Corporation and its subsidiaries(collectively, the "Consideration"), and intending to be legally bound hereby, Releasor hereby agrees as follows:
1. Except as otherwise provided in this Section 1, Releasor knowingly and voluntarily hereby releases, to the fullest extentpermitted by law, The AES Corporation and all of its past, present and/or future related entities, including but not limited to parents,divisions, affiliates and subsidiaries, and each current and former bonus, pension, welfare, or other benefit plans sponsored by any of theforegoing, and each of the respective officers, directors, stockholders, trustees, employees, agents, representatives, administrators, attorneys,insurers, fiduciaries, predecessors, successors and assigns of such entities and/or benefit plans, in their individual and/or representativecapacities (hereinafter collectively referred to as the "Released Parties"), from any and all causes of action, suits, agreements, promises,damages, disputes, controversies, contentions, differences, judgments, claims and demands of any kind whatsoever ("Claims") whichReleasor or Releasor’s heirs, executors, administrators, successors and assigns ever had, now have or may have against the Released Parties,whether known or unknown to Releasor, and whether asserted or unasserted, (i) by reason of Releasor’s employment and/or cessation ofemployment with the Company, (ii) arising under or relating to the Consultant Agreement referred to above, or (iii) that otherwise arose orare based on facts which occurred on or prior to the date that Releasor signs this Release.
Such released Claims include, but are not limited to, any and all Claims under Title VII of the Civil Rights Act of 1964, the CivilRights Act of 1866, the Civil Rights Act of 1991, the Fair Labor Standards Act, the Family and Medical Leave Act of 1993, the AgeDiscrimination in Employment Act of 1967 (“ADEA”), the Older Workers' Benefit Protection Act of 1990 (“OWBPA”), the Americans WithDisabilities Act, the Employee Retirement Income Security Act of 1974 (including, without limitation, any claim for severance pay), theVirginia Human Rights Law and any and all other federal, state or local laws, statutes, rules and regulations pertaining to employment (eachas amended); any and all Claims under state contract or tort law; any and all Claims based on the design or administration of any employeebenefit plan, program policy, procedure or arrangement, whether written or oral; any and all Claims for wages, commissions, bonuses,continued employment in any position, and compensatory, punitive or liquidated damages; and any and all Claims for attorneys' fees andcosts.
2. If Releasor commences, continues, joins in, or in any other manner attempts to assert any Claim released herein against any ofthe Released Parties or otherwise breaches the promises made in this Release, Releasor shall reimburse the Released Parties for all attorneys'fees incurred by the Released Parties in defending against such a Claim and the Company shall have a right to the return of all Considerationpaid to Releasor pursuant to the Consultant Agreement, together with interest thereon, and to cease furnishing to Releasor any furtherConsideration described in the Consultant Agreement; provided that this right of return of such Consideration and the cessation of payment offurther Consideration is without prejudice to the Released Parties' other rights hereunder, including any right to obtain an agreement andrelease of any and all claims against the Released Parties. Provided, however, that this Section 2 shall not apply to any Claims
1

asserted by Releasor pursuant to the ADEA, the OWBPA, and/or any other Claims for which this Section 2 is not permitted by applicablelaw.
3. Releasor agrees that he will not bring any lawsuits or claims of any kind against the Released Parties for any of the Claimsreleased herein and that Releasor will not accept and hereby waives the benefits of any such lawsuits or claims of any kind brought onReleasor’s behalf against the Released Parties.
4. Notwithstanding the foregoing, Releasor is not releasing any of the following claims: (i) any rights or claims for indemnificationReleasor may have pursuant to any written indemnification agreement with The AES Corporation or any of its subsidiaries (collectively, theCompany”) to which Releasor is a party, the charter, bylaws, or operating agreements of the Company, or under applicable law; (ii) any rightswhich cannot be waived as a matter of law; or (iii) claims for vested retirement benefits, if any, under any Company sponsored plan. Nothingin this Release shall interfere with or waive Releasor’s right to enforce this Release in a court of competent jurisdiction or s eek a judicialdetermination of the validity of the release of Releasor’s rights under the ADEA .
5. Releasor represents that he is not receiving Medicare benefits as of the time he enters into this Release.
6. Releasor acknowledges and agrees that he (i) has been advised by the Company of his right to consult with an attorney of hisown choosing prior to executing this Release; (ii) has not been forced or pressured in any manner whatsoever to sign this Release; (iii) hasagreed to all of its terms knowingly, freely and voluntarily in exchange for good and valuable consideration; (iv) has read this Release in itsentirety and understands the terms of the Release; and (v) has been given at least twenty-one (21) days from the receipt of this Release toconsider all of its terms and to consult with counsel of his choice. Any changes to this Release during that period, whether material or not,will not extend the 21-day period. Releasor may revoke his acceptance of the Release by sending written notice of his intent to revoke hisacceptance, to the Company, at the following address: c/o General Counsel, AES Legal Department, 4300 Wilson Boulevard, Arlington,Virginia 22203, within seven (7) days of his execution of the Release. If Releasor revokes this Release, this Release and the promisescontained herein shall automatically be deemed null and void and Releasor will not be entitled to any payment pursuant to the ConsultantAgreement.
IN WITNESS WHEREOF, the undersigned has executed and delivered this Release as of the date first written above.
Brian A. Miller
ANNEXB
THEAESCORPORATION
STANDARDCOMPLIANCETERMSANDPROVISIONS
In connection with the agreement to which this Annex B is attached (“ MainAgreement”), Brian A. Miller, (the “Consultant”) herebyrepresents and warrants to and agrees with The AES Corporation (“ AES”) that, in performing his obligations under the Main Agreement,the Consultant shall be legally bound as follows:
1.1 The Consultant shall comply fully with all applicable laws of the countries in which his services to AES and its subsidiaries areprovided as well as the applicable anti-corruption, anti-money laundering, anti-terrorism and economic sanction and anti-boycott lawsof the United States including without limitation, the United States Foreign Corrupt Practices Act (“ Applicable Laws andRegulations”).
1.2 The Consultant represents and warrants that he is not a Government Official and that he does not currently employ, and will not in thefuture, without the prior written consent of AES, employ, either directly or indirectly, a Government Official, or a parent, spouse,child or sibling of a Government Official (“ FamilyMember”) who shall perform services pursuant to the Main Agreement. Forpurposes herein, “ GovernmentOfficial”shall mean any officer or employee of a government, or department (whether executive,legislative, judicial or administrative), agency or instrumentality of such government, including any government-owned business, or apublic international organization; or any person acting in an official capacity for or on behalf of such government, or any candidatefor public office or representative of a political party.
1.3 The Consultant represents and warrants that he has not, and that he has no evidence of any kind that any other person working on his

behalf has, either directly or indirectly:
i. Made a ProhibitedPayment, which is defined to include any offer, gift, payment, promise to pay, or authorization of thepayment of any money or anything of value, directly or indirectly, to a Government Official, including for the use or benefitof any other person or entity, to the extent that one knows or has reasonable grounds for believing that all or a portion of themoney or thing of value which was given or is to be given to such other person or entity, will be paid, offered, promised,given or authorized to be paid by such other person or entity, directly or indirectly, to a Government Official, for the purposeof either (i) influencing any act or decision of the Government Official in his official capacity; (ii) inducing the GovernmentOfficial to do or omit to do any act in violation of his lawful duty; (iii) securing any improper advantage; or (iv) inducing theGovernment Official to use his influence with a non-U.S. government or instrumentality thereof to affect or influence any actor decision of such government or instrumentality, in order to assist in obtaining or retaining business or in directing businessto any party.
ii. Engaged in a ProhibitedTransactionwhich is defined to include:
a. Receiving, transferring, transporting, retaining, using, structuring, diverting, or hiding the proceeds of any criminalactivity whatsoever, including drug trafficking, fraud, and bribery of a Government Official;
b.Engaging or becoming involved in, financing, or supporting financially or otherwise, sponsoring, facilitating, or giving aidto any terrorist person, activity or organization; or
c. Participating in any transaction or otherwise conducting business with a “designated person,” namely a person orentity that appears on any list issued by the United States or the United Nations with respect to money laundering,terrorism financing, drug trafficking or economic or arms embargoes (a “ DesignatedPerson”).
1.4 The Consultant will not and shall take all reasonable steps to ensure that any other persons working for him in relation to the MainAgreement (including, without limitation, any subcontractors, consultants, representatives and agents) will not, directly or indirectly,make, promise or authorize the making, of a Prohibited Payment or engage in a Prohibited Transaction with respect to the MainAgreement.
1.5 The Consultant shall promptly report to AES any Prohibited Payment or Prohibited Transaction of which he obtains knowledge, orhas reasonable grounds to believe occurred in respect of the Main Agreement.
1.6 The Consultant agrees that, if AES has any reasonable grounds to believe that a Prohibited Payment has been made, promised orauthorized, directly or indirectly, to a Government Official in connection with the Main Agreement, or that a Prohibited Transactionhas taken place in connection with the Main Agreement, he shall cooperate in good faith with AES in determining whether such aviolation occurred.
1.7 The Consultant has not and will not, either directly or indirectly, share or promise to share his fees or any other funds he receivesfrom AES or in respect of the Main Agreement with any Government Official.
1.8 The Consultant acknowledges receipt of a copy of the AES Code of Conduct.
1.9 The Consultant shall perform due diligence, as he deems warranted by the circumstances, on the reputation of any subcontractors,consultants, agents or representatives he employs in the performance of work on the Main Agreement or to provide services to theMain Agreement.
1.10 All requests for payment submitted by the Consultant to AES shall be accompanied by detailed and accurate invoices that describewith specificity the work, services or equipment for which the payment is requested. All such requests for payment shall becommensurate with the fair market value for such work, service or equipment.
1.11 If applicable, the Consultant agrees that he shall be reimbursed by AES only for reasonable lodging, meals, travel and other expensesor for such expenses incurred on behalf of third parties when supported by actual, accurate and reasonably detailed third-partyinvoices. Where Government Officials are involved, the request for reimbursement shall be accompanied by a written statement ofthe details of the expenses and an explanation of the purpose of the expenses, the reason that the participation of such officials wasnecessary, and the names of those in attendance and their employment or business affiliation.
1.12The Consultant agrees that a material breach of one or more of the covenants or representations of the Consultant (“ ComplianceBreach”) in this Annex shall be sufficient cause for AES, acting in good faith, and not without reasonable prior written notice, toterminate the Consultant’s agreements with AES in respect of the Main Agreement, in whole or in part, and to declare them nulland void, in which case the Consultant agrees that he shall forfeit any claim to any additional payments due to it under suchagreements and the Main Agreement, other than payments for services previously rendered under such agreements, in addition tobeing liable for any damages or remedies available to AES under applicable law. The Consultant shall indemnify and hold

harmless AES from any claims, costs, liabilities, obligations, and damages AES incurs (including, without limitation, for the feesof any legal counsel AES may retain or engage) as a result of such Compliance Breach.
1.13 This Annex shall be considered to be an integral part of the Main Agreement (and shall be effective on the same date as the MainAgreement) and its terms and conditions shall be deemed to be set forth in full in the Main agreement. In the event of a conflictbetween this Annex and the Main Agreement, this Annex shall prevail.
1.14 All the provisions in this Annex are material and shall survive the termination of Main Agreement between AES and the Consultant.
1.15 The Consultant shall not assign its rights and responsibilities contained in this Annex to a third party without the prior writtenapproval of AES.
CONSULTANT
Brian A. Miller
Date:
2

Exhibit 12
The AES Corporation and SubsidiariesStatement Re: Calculation of Ratio of Earnings to Fixed Charges
(in millions, unaudited)
2017 2016 2015 2014 2013
Actual:
Computation of earnings:
Income from continuing operations before income taxes and equity in earnings of affiliates $ 771 $ 187 $ 989 $ 1,224 $ 1,069
Fixed charges 1,539 1,658 1,547 1,574 1,582
Amortization of capitalized interest 33 31 30 30 29
Distributed income of equity investees 103 14 16 28 2
Less:
Capitalized interest (130) (124) (92) (71) (51)
Preference security dividend of consolidated subsidiary (1) (5) (10) (5) (6)
Noncontrolling interests in pretax income of subsidiaries that have not incurred fixed charges (53) (40) (28) (26) (40)
Earnings $ 2,262 $ 1,721 $ 2,452 $ 2,754 $ 2,585
Fixed charges:
Interest expense, debt premium and discount amortization $ 1,388 $ 1,509 $ 1,430 $ 1,485 $ 1,516
Capitalized interest 130 124 92 71 51
Preference security dividend of consolidated subsidiary 1 5 10 5 6
Interest portion of rental expense (1) 20 20 15 13 9
Fixed charges $ 1,539 $ 1,658 $ 1,547 $ 1,574 $ 1,582
Ratio of earnings to fixed charges 1.47 1.04 1.59 1.75 1.63(1) Calculated as one-third of rental expense, which is deemed to be representative of the interest factor in rental expense.

The AES Corporation2017 Form 10-K Exhibit 21.1
Name JurisdictionAES (India) Private Limited IndiaAES (NI) Limited Northern IrelandAES Abigail S.a.r.l. LuxembourgAES Africa Power Company B.V. The NetherlandsAES AgriVerde Holdings, B.V. The NetherlandsAES AgriVerde Services (Ukraine) Limited Liability Company UkraineAES Alamitos Development, Inc. DelawareAES Alamitos Energy, LLC DelawareAES Alamitos, L.L.C. DelawareAES Alicura Holdings S.C.A ArgentinaAES Americas International Holdings, Limited BermudaAES Amsterdam Holdings B.V. The NetherlandsAES Andres (BVI) Ltd. British Virgin IslandsAES Andres BV SpainAES Andres DR, S.A. Dominican RepublicAES Andres Holdings I, Ltd Cayman IslandsAES Aramtermelo Holdings B.V. The NetherlandsAES Argentina Generación S.A. ArgentinaAES Argentina Investments, Ltd. Cayman IslandsAES Argentina Operations, Ltd. Cayman IslandsAES Arlington Services, LLC DelawareAES Armenia Mountain Holdings, LLC DelawareAES Armenia Mountain Wind 2, LLC DelawareAES Aurora Holdings, Inc. DelawareAES Aurora, Inc. DelawareAES Bainbridge Holdings, LLC DelawareAES Bainbridge, LLC DelawareAES Ballylumford Holdings Limited England & WalesAES Ballylumford Limited Northern IrelandAES Baltic Holdings BV The NetherlandsAES Barka Services, Inc. DelawareAES Barry Limited United KingdomAES Barry Operations Ltd. United KingdomAES Beaver Valley, L.L.C. DelawareAES Belfast West Power Limited Northern IrelandAES BES Jordan B.V. NetherlandsAES Big Sky, L.L.C. VirginiaAES Borsod Energetic Ltd. HungaryAES Botswana Holdings B.V. The NetherlandsAES Brasil Ltda BrazilAES Brazil International Holdings, Limited BermudaAES Brazil, Inc. Delaware

AES Bulgaria B.V. The NetherlandsAES Bulgaria Energy Solutions EOOD BulgariaAES Bulgaria Holdings BV The NetherlandsAES Bussum Holdings BV The NetherlandsAES Calaca Pte. Ltd. SingaporeAES Calaca Pte. Ltd. - Philippine Branch PhilippinesAES Calgary, Inc. DelawareAES California Management Co., Inc. DelawareAES Caracoles SRL ArgentinaAES Carbon Exchange, Ltd. BermudaAES Carbon Holdings, LLC VirginiaAES Caribbean Finance Holdings, Inc. DelawareAES Caribbean Investment Holdings, Ltd. Cayman IslandsAES Cartegena Holdings BV The NetherlandsAES Cayman Guaiba, Ltd. Cayman IslandsAES Cayman Pampas, Ltd. Cayman IslandsAES CC&T International, Ltd. British Virgin IslandsAES Central America Electric Light, LLC VirginiaAES Central American Holdings, Inc. DelawareAES Central American Investment Holdings, Ltd. Cayman IslandsAES Central Asia Holdings BV The NetherlandsAES Ceprano Energia SRL ItalyAES Changuinola, S.R.L. PanamaAES Chhattisgarh Energy Private Limited IndiaAES Chigen Holdings, Ltd. Cayman IslandsAES China Generating Co. Ltd. BermudaAES China Generating Co. Ltd. - Rep Office ChinaAES Chivor & Cia S.C.A. E.S.P. ColombiaAES Chivor S.A. ColombiaAES CLESA Y Compania, Sociedad en Comandita de Capital Variable El SalvadorAES Climate Solutions Holdings I B.V. The NetherlandsAES Climate Solutions Holdings I, LLC DelawareAES Climate Solutions Holdings II, LLC DelawareAES Climate Solutions Holdings, L.P. BermudaAES Climate Solutions Holdings, LLC DelawareAES Colon Development, S. de R.L. PanamaAES Columbia Power, LLC DelawareAES Communications Latin America, Inc. DelawareAES Communications, LLC VirginiaAES Connecticut Management, L.L.C. DelawareAES Coop Holdings, LLC DelawareAES Costa Rica Energy SRL Costa RicaAES Costa Rica Holdings, Ltd. Cayman IslandsAES DE Class B I, LLC DelawareAES DE Class B II, LLC DelawareAES DE Class B III, LLC Delaware

AES DE Construction, LLC DelawareAES DE DevCo I, LLC DelawareAES DE DevCo NC, LLC DelawareAES DE Holdings I, LLC ColoradoAES DE Holdings II, LLC DelawareAES DE Holdings III, LLC DelawareAES DE Holdings IV, LLC DelawareAES DE Manager, LLC ColoradoAES DE Residential Holdings I, LLC ColoradoAES DE RS I, LLC DelawareAES DE RS II, LLC DelawareAES DE RS III, LLC DelawareAES DE Solar Access Holdings I, LLC DelawareAES Deepwater, LLC DelawareAES DE-GIE, LLC DelawareAES Desert Power, L.L.C. DelawareAES Development de Argentina S.A. ArgentinaAES Disaster Relief Fund VirginiaAES Distribuidores Salvadorenos Limitada El SalvadorAES Distribuidores Salvadorenos Y Compania S en C de C.V. El SalvadorAES Distributed Energy, Inc. DelawareAES DPL Holdings, LLC DelawareAES DPP Holdings, Ltd. Cayman IslandsAES Drax Financing, Inc. DelawareAES Drax Power Finance Holdings Limited United KingdomAES Ecotek Europe Holdings B.V. MexicoAES EDC Holding, L.L.C. DelawareAES El Salvador Electric Light, LLC VirginiaAES El Salvador Trust PanamaAES El Salvador, LLC VirginiaAES El Salvador, S.A. de C.V. El SalvadorAES Electric Ltd. United KingdomAES Electroinversora Espana S.L. SpainAES Elpa S.A. BrazilAES Elsta BV The NetherlandsAES EMEA Energy Storage BV The NetherlandsAES Empresa Electrica de El Salvador Limitada de Capital Variable El SalvadorAES Endeavor, Inc. DelawareAES Energia I, Ltd. Cayman IslandsAES Energia II, Ltd. Cayman IslandsAES Energia Mexicana I, S. de R.L. de C.V. MexicoAES Energia SRL ItalyAES Energy Developments (Pty) Ltd. Republic of South AfricaAES Energy Developments, S.L. SpainAES Energy Services Inc. OntarioAES Energy Solutions, LLC Delaware

AES Energy Storage Arizona, LLC DelawareAES Energy Storage Holdings MauritiusAES Energy Storage Holdings, LLC DelawareAES Energy Storage UK Limited United KingdomAES Energy Storage Zeeland B.V. The NetherlandsAES Energy Storage, LLC DelawareAES Energy, Ltd. BermudaAES Energy, Ltd. (Argentina Branch) ArgentinaAES Engineering, LLC DelawareAES Engineering, Ltd. Cayman IslandsAES ES Alamitos, LLC DelawareAES ES Deepwater, LLC DelawareAES ES Gilbert, LLC DelawareAES ES Holdings, LLC DelawareAES ES Tait, LLC DelawareAES Europe Services EOOD BulgariaAES European Holdings BV The NetherlandsAES Finance and Development, Inc. DelawareAES Florestal Ltda. BrazilAES Fonseca Energia Limitada de C.V. El SalvadorAES Forca, Ltd. Cayman IslandsAES Foreign Energy Holdings, LLC DelawareAES Gas Supply & Distribution Ltd. Cayman IslandsAES GEI US Finance, Inc. DelawareAES Gener S.A. ChileAES Generation Development, LLC DelawareAES GEO Energy OOD BulgariaAES Global African Power (Proprietary) Limited Republic of South AfricaAES Global Insurance Company VermontAES Global Mobility Services, LLC DelawareAES Global Power Holdings B.V. The NetherlandsAES GPH Holdings, Inc. DelawareAES Grand Dominicana, Ltd. Cayman IslandsAES Great Britain Holdings B.V. The NetherlandsAES Greece Solar, LLC DelawareAES Grid Stability, LLC DelawareAES GT Holding Pty Ltd AustraliaAES Guaiba II Empreendimentos Ltda BrazilAES Guayama Holdings BV The NetherlandsAES Hawaii Management Company, Inc. DelawareAES Hawaii, Inc. DelawareAES Highgrove Holdings, L.L.C. DelawareAES Highgrove, L.L.C. DelawareAES Hispanola Holdings BV The NetherlandsAES Hispanola Holdings II BV The NetherlandsAES Holanda Holdings C.V. The Netherlands

AES Holdings B.V. The NetherlandsAES Holdings B.V. - Vietnam Rep Office VietnamAES Holdings Brasil Ltda. BrazilAES Holland Solar, LLC DelawareAES Honduras Generacion, Sociedad en Comandita por Acciones de Capital Variable HondurasAES Horizons Holdings BV The NetherlandsAES Horizons Investments Limited United KingdomAES Hungary Energiaszolgáltató Kft. HungaryAES Huntington Beach Development, L.L.C. DelawareAES Huntington Beach Energy, LLC DelawareAES Huntington Beach, L.L.C. DelawareAES IB Valley Corporation IndiaAES- IC Ictas Enerji Uretim ve Ticaret A.S. TurkeyAES Ilumina Holdings, LLC DelawareAES Ilumina Member, LLC DelawareAES India Holdings (Mauritius) MauritiusAES India, L.L.C. DelawareAES Indiana Holdings, L.L.C. DelawareAES Intercon II, Ltd. Cayman IslandsAES Interenergy, Ltd. Cayman IslandsAES International Holdings II, Ltd. British Virgin IslandsAES International Holdings III, Ltd. British Virgin IslandsAES International Holdings, Ltd. British Virgin IslandsAES Investment Chile SpA ChileAES Italia S.r.l ItalyAES Jordan Holdco Cayman Limited Cayman IslandsAES Jordan Holdco, Ltd. Cayman IslandsAES Jordan PSC JordanAES Jordan Solar B.V. NetherlandsAES Juniper Point Holdings, LLC DelawareAES K2 Limited United KingdomAES Kalaeloa Venture, L.L.C. DelawareAES Kekaha Solar, LLC DelawareAES Keystone Wind, L.L.C. DelawareAES Keystone, L.L.C. DelawareAES Khanya - Kwazulu Natal (Proprietary) Limited South AfricaAES Khanya - Port Elizabeth (Pty) Ltd. Republic of South AfricaAES Kilroot Generating Limited Northern IrelandAES Kilroot Power Limited Northern IrelandAES King Harbor, Inc. DelawareAES LA FIT Dedeaux, LLC DelawareAES LA FIT Francisco, LLC DelawareAES LA FIT Sun Valley, LLC DelawareAES Landfill Carbon, LLC VirginiaAES LATAM Energy Development Ltd. Cayman IslandsAES Latin America S. de R.L. Panama

AES Latin American Development, Ltd. Cayman IslandsAES Laurel Mountain, LLC DelawareAES Lawai Solar, LLC DelawareAES Levant Holdings B.V. NetherlandsAES Levant Holdings B.V/ Jordan PSC JordanAES Lion Telecom Investments B.V. MexicoAES Lumos Holdings, LLC DelawareAES Maritza East 1 Ltd. BulgariaAES Maritza East 1 Services Ltd. CyprusAES Maritza East 1 Services Ltd. BulgariaAES Mayan Holdings, S. de R.L. de C.V. MexicoAES Merida B.V. The NetherlandsAES Merida III, S. de R.L. de C.V. MexicoAES Merida Management Services, S. de R.L. de C.V. MexicoAES Merida Operaciones SRL de CV MexicoAES Mexican Holdings, Ltd. Cayman IslandsAES Mexico Farms, L.L.C. DelawareAES MicroPlanet, Ltd. British Virgin IslandsAES Mid East Holdings 2, Ltd. Cayman IslandsAES Mong Duong Holdings B.V. The NetherlandsAES Mong Duong Project Holdings B.V. The NetherlandsAES Monroe Holdings B.V. The NetherlandsAES Monroe Solar A, LLC DelawareAES Monroe Solar B, LLC DelawareAES Monroe Solar C, LLC DelawareAES Monroe Solar D, LLC DelawareAES Monroe Solar E, LLC DelawareAES Mount Vernon B.V. The NetherlandsAES NA Central, L.L.C. DelawareAES Nejapa Gas Ltda. de C.V. El SalvadorAES Nejapa Services Ltda. de C.V. El SalvadorAES Netherlands Holdings B.V. The NetherlandsAES NEXT, Ltda. de C.V. El SalvadorAES Nile Power Finance (Uganda) Limited UgandaAES Nile Power Holdings Ltd. GuernseyAES Nile Power Ltd. UgandaAES Normandy Holdings B.V. The NetherlandsAES North America Development, LLC DelawareAES Oahu, LLC DelawareAES Oasis Holdco, Inc. DelawareAES Oasis Ltd. Cayman IslandsAES Oasis Mauritius Inc MauritiusAES Ocean Springs Trust Deed Cayman IslandsAES Odyssey, L.L.C. DelawareAES Ohio Generation, LLC OhioAES Operadora S.A Argentina

AES OPGC Holding MauritiusAES Orissa Distribution Private Limited IndiaAES Overseas Holdings (Cayman) Ltd. Cayman IslandsAES Overseas Holdings Limited United KingdomAES Pacific Ocean Holdings B.V. The NetherlandsAES Pacific, Inc. DelawareAES Pacific, L.L.C. DelawareAES Pak Holdings, Ltd. British Virgin IslandsAES Pakistan (Pvt) Ltd. PakistanAES Pakistan Operations, Ltd. DelawareAES Panamá, S.R.L. PanamaAES Parana Gas S.A. ArgentinaAES Parana Holdings, Ltd. Cayman IslandsAES Parana IHC, Ltd. Cayman IslandsAES Parana II Limited Partnership Cayman IslandsAES Parana Operations S.R.L. ArgentinaAES Parana Propiedades S.A ArgentinaAES Parana Uruguay S.R.L UruguayAES Pardo Holdings, Ltd. Cayman IslandsAES Pasadena, Inc. DelawareAES Peru S.R.L. PeruAES Phil Investment Pte. Ltd. SingaporeAES Philippines Energy Storage Co., Ltd. PhilippinesAES Philippines Inc. PhilippinesAES Philippines Power Foundation, Inc. PhilippinesAES Philippines Power Partners Co. Ltd. PhilippinesAES Pirin Holdings, Ltd. Cayman IslandsAES Puerto Rico Services, Inc. DelawareAES Puerto Rico, Inc. Cayman IslandsAES Puerto Rico, L.P. DelawareAES Redondo Beach, L.L.C. DelawareAES Renewables (India) Private Limited IndiaAES Riverside Holdings, LLC DelawareAES Rochester Solar, LLC DelawareAES SACEF Investment, LLC DelawareAES Saint Petersburg Holdings B.V. The NetherlandsAES San Nicolas Holding Espana, S.L. SpainAES SEB Holdings (Delaware), LLC DelawareAES SEB Holdings, Ltd. Cayman IslandsAES Services Philippines Inc. PhilippinesAES Services, Inc. DelawareAES Services, Ltd. Cayman IslandsAES Servicios America S.R. L. ArgentinaAES Servicios e Inversiones Globales SpainAES Servicios Electricos, S. de R.L. de C.V. MexicoAES Serviços TC Ltda. Brazil

AES Shady Point, LLC DelawareAES Shulbinsk GES LLP KazakhstanAES Silk Road Energy LLC RussiaAES Silk Road, Inc. DelawareAES Solar Energy B.V. The NetherlandsAES Solar Energy Holdings B.V. The NetherlandsAES Solar Energy, LLC DelawareAES Solar Espana, S.L. SpainAES Solar Holdings, LLC DelawareAES Solar Power PR, LLC DelawareAES Soluciones, Limitada de Capital Variable El SalvadorAES Solutions, LLC VirginiaAES South Africa Peakers Holdings (Proprietary) Limited South AfricaAES South America Holdings Cooperatief U.A. NetherlandsAES South America Holdings I B.V. The NetherlandsAES South America Holdings II B.V. The NetherlandsAES South American Holdings, Ltd. Cayman IslandsAES South Point, Ltd. Cayman IslandsAES Southland Development, LLC DelawareAES Southland Energy Company Holdings I, LLC DelawareAES Southland Energy Holdings II, LLC DelawareAES Southland Energy Holdings, LLC DelawareAES Southland Energy, LLC DelawareAES Stonehaven Holding, Inc. DelawareAES Strategic Equipment Holdings Corporation DelawareAES Sul, L.L.C. DelawareAES Summit Generation Ltd. United KingdomAES Swiss Lake Holdings B.V. The NetherlandsAES Tamuin Development Services S. de R.L. de C.V. MexicoAES Technology Holdings, LLC DelawareAES TEG Holdings I, LLC DelawareAES TEG Holdings, LLC DelawareAES TEG II Mexican Holdings, S. de R.L. de C.V. MexicoAES TEG II Mexican Investments, S. de R.L. de C.V. MexicoAES TEG II Operations, S. de R.L. de C.V. MexicoAES TEG Management, Inc. DelawareAES TEG Mexican Holdings, S. de R.L. de C.V. MexicoAES TEG Mexican Investments S. de R.L. de C.V. MexicoAES TEG Operations, S. de R.L. de C.V. MexicoAES TEG Power Investments B.V. The NetherlandsAES TEG Power Investments II B.V. The NetherlandsAES TEGTEP Holdings B.V. The NetherlandsAES TEP Holdings I, LLC DelawareAES TEP Holdings, LLC DelawareAES TEP Management, Inc. DelawareAES TEP Power II Investments Limited United Kingdom

AES TEP Power Investments Limited United KingdomAES Termosul I, Ltd. Cayman IslandsAES Termosul II, Ltd. Cayman IslandsAES Terneuzen Holdings B.V. The NetherlandsAES Terneuzen Management Services BV The NetherlandsAES Texas Funding III, L.L.C. DelawareAES Thames, L.L.C. DelawareAES Thomas Holdings BV The NetherlandsAES Tietê Eólica S.A. BrazilAES Tietê Inova Soluções de Energia Ltda. BrazilAES Tietê Integra Soluções em Energia Ltda BrazilAES Trade I, Ltd. Cayman IslandsAES Trade II, Ltd. Cayman IslandsAES Transgas I, Ltd. Cayman IslandsAES Transpower Private Ltd - Philippines Branch (ROHQ) PhilippinesAES Transpower Private Ltd. SingaporeAES Transpower Pte Ltd -- Hong Kong Branch Hong KongAES Treasure Cove, Ltd. Cayman IslandsAES Trinidad Services Unlimited Trinidad and TobagoAES Trust III DelawareAES U&K Holdings B.V. The NetherlandsAES U.S. Holdings, LLC DelawareAES U.S. Investments, Inc. IndianaAES U.S. Solar, LLC DelawareAES UCH Holdings (Cayman) Ltd. Cayman IslandsAES UCH Holdings, Ltd. Cayman IslandsAES UK Datacenter Services Limited United KingdomAES UK Holdings Limited United KingdomAES UK Power Financing II Ltd United KingdomAES UK Power Financing Limited United KingdomAES UK Power Holdings Limited United KingdomAES UK Power Limited United KingdomAES UK Power, L.L.C. DelawareAES Union de Negocios, S.A. de C.V. El SalvadorAES Uruguaiana Empreendimentos S.A. BrazilAES US Distributed Solar Holdings, LLC DelawareAES US Generation Holdings, LLC DelawareAES US Generation, LLC DelawareAES US Services, LLC DelawareAES US Wind Development, L.L.C. DelawareAES US Wind Generation Holdings, LLC DelawareAES Venezuela Finance United KingdomAES Volcan Holdings B.V. NetherlandsAES Warrior Run, L.L.C. DelawareAES Wawarsing Solar, LLC DelawareAES Western Power Holdings, L.L.C. Delaware

AES Western Power, L.L.C. DelawareAES Western Wind MV Acquisition, LLC DelawareAES Western Wind, L.L.C. DelawareAES Wind Bulgaria EOOD BulgariaAES Wind Generation Limited England & WalesAES Wind Generation, LLC DelawareAES Wind Investments I B.V. The NetherlandsAES Wind Investments II B.V. The NetherlandsAES WR Limited Partnership DelawareAES Yucatan, S. de R.L. de C.V. MexicoAES Zephyr 2, LLC DelawareAES Zephyr 3, LLC DelawareAES Zephyr, Inc. DelawareAES-3C Maritza East 1 Ltd. BulgariaAES-3C Maritza East 1 Ltd. CyprusAESCom Sul Ltda. BrazilAESEBA Trust Deed Cayman IslandsAES-RS Spanish Holdings, LLC DelawareAES-RS Sunshine Cooperatief U.A. NetherlandsAES-RS Sunshine Holdings, LLC DelawareAES-VCM Mong Duong Power Company Limited VietnamAgCert Canada Co. CanadaAgCert Canada Holding, Limited IrelandAgCert Chile Servicios Ambientales Limitada ChileAgCert do Brasil Soluções Ambientais Ltda. BrazilAgCert International, Limited IrelandAgCert Mexico Servicios Ambientales, Sociedade de Responsibilidad Limitada de Capital Variable MexicoAgilion Energy Private Limited IndiaAGV Solar IV Geradora de Energia S.A. BrazilAGV Solar V Geradora de Energia S.A. BrazilAGV Solar VI Geradora de Energia S.A. BrazilALBERICH Beteiligungsverwaltungs GmbH AustriaAlmacenamiento de Energia del Sureste, S. de R.L. de C.V. MexicoAlpha Water and Realty Services Corp. PhilippinesAltai Power Limited Liability Partnership KazakhstanAlto Maipo SpA ChileAM Solar B.V. NetherlandsAM Solar B.V. - Jordan Co. JordanAndes Solar SpA ChileAnhui Liyuan - AES Power Co., Ltd. ChinaArizona B&GC Solar, LLC ColoradoARNIKA Beteiligungsverwaltungs GmbH AustriaAtlantic Basin Services, Ltd. Cayman IslandsAurora Master Funding, LLC DelawareAurora Master Holdings, LLC DelawareAZ Solar I, LLC Colorado

AZ Solar II, LLC ColoradoAZ Solar Phase Zero, LLC ColoradoB.A. Services S.R.L. ArgentinaBakersfield Industrial PV 1 LLC CaliforniaBakersfield PV I, LLC CaliforniaBoa Hora 1 Geradora De Energia Solar S.A. BrazilBoa Hora 2 Geradora de Energia Solar S.A. BrazilBoa Hora 3 Geradora De Energia Solar S.A. BrazilBolton Solar I, LLC DelawareBósforo de Responsabilidad Limitada de Capital Variable El SalvadorBranch of AES Silk Road in Kazakhstan KazakhstanBrasiliana Participações S.A. BrazilBridgeport Solar, LLC ColoradoBrite Solar Fund Holdco, LLC DelawareBuffalo Gap Holdings 2, LLC DelawareBuffalo Gap Holdings 3, L.L.C. DelawareBuffalo Gap Holdings, LLC DelawareBuffalo Gap Wind Farm 2, LLC DelawareBuffalo Gap Wind Farm 3, L.L.C. DelawareBuffalo Gap Wind Farm 4, L.L.C. DelawareBuffalo Gap Wind Farm, LLC DelawareCamille Trust Cayman IslandsCamille, Ltd. Cayman IslandsCavanal Minerals, LLC DelawareCayman Energy Traders Cayman IslandsCCS Telecarrier Cayman IslandsCDEC-SIC LTDA ChileCDEC-SING Ltda ChileCemig II C.V. NetherlandsCentrais Eólicas Ametista S.A. BrazilCentrais Eólicas Borgo S.A. BrazilCentrais Eólicas Caetité S.A. BrazilCentrais Eólicas da Prata S.A. BrazilCentrais Eólicas dos Araças S.A. BrazilCentrais Eólicas Dourados S.A. BrazilCentrais Eólicas Espigão S.A. BrazilCentrais Eólicas Maron S.A. BrazilCentrais Eólicas Morrão S.A. BrazilCentrais Eólicas Pelourinho S.A. BrazilCentrais Eólicas Pilões S.A. BrazilCentrais Eólicas Seraima S.A. BrazilCentrais Eólicas Serra do Espinhaço S.A. BrazilCentrais Eólicas Tanque S.A. BrazilCentrais Eólicas Ventos do Nordeste S.A. BrazilCentral Electricity Supply Company of Orissa Limited IndiaCentral Termoelectrica Guillermo Brown S.A. Argentina

Cerulean Properties, LLC DelawareChamplin Oahu Wind Holdings, LLC DelawareCIA.TRANSMISORA DEL NORTE CHICO S.A. ChileClean Wind Energy Ltd. IsraelCloghan Limited Northern IrelandCloghan Point Holdings Limited Northern IrelandCoastal Itabo, Ltd. Cayman IslandsColon LNG Marketing S. De R.L. PanamaCompania de Alumbrado Eletrico de San Salvador, S.A. DE C.V. El SalvadorCompañía Transmisora Angamos SpA ChileCompañía Transmisora del Norte Grande SpA ChileCompass Circle Solar, LLC Rhode IslandCosta Norte LNG Terminal S. de R.L. PanamaDaggett Ridge Wind Farm, LLC DelawareDelano PV1, LLC CaliforniaDiamond Development, Inc. OhioDistribuidora Electrica de Usulutan, Sociedad Anonima de Capital Variable El SalvadorDominican Power Partners Cayman IslandsDPL Capital Trust II DelawareDPL Inc. OhioDublin Solar I, LLC IndianaEastern Solar Holdings I, LLC DelawareEletropaulo Metropolitana Eletricidade de Sao Paulo S.A. BrazilEloy ESD Solar Holdings, LLC DelawareElsta BV The NetherlandsElsta BV & Co. CV The NetherlandsEmpresa Electrica Angamos S.A. ChileEmpresa Electrica Campiche S.A. ChileEmpresa Electrica Cochrane S.A. ChileEmpresa Electrica de Oriente, S.A. de C.V. El SalvadorEmpresa Electrica Ventanas S.A. ChileEmpresa Generadora De Electricidad Itabo, S.A. Dominican RepublicEnerAB Cogeneracion I Laguna del Rey, S. de R.L. de C.V. MexicoEnerAB Suministro Calificado, S. de R.L. de C.V. MexicoENERAB, S. de R.L. de C.V. MexicoENERGEN S.A. ArgentinaEnergy Trade and Finance Corporation Cayman IslandsEólica Mesa La Paz, S. de R.L. de C.V. MexicoFluence Energy, LLC DelawareFTP Power, LLC DelawareFundacion AES Dominicana, Inc. Dominican RepublicFundacion AES Gener ChileGas Natural Atlantico II S. de R.L. PanamaGas Natural Atlantico S. De R.L. PanamaGasoducto GasAndes Argentina S.A. ArgentinaGasoducto GasAndes S.A. Chile

Gener Argentina S.A. ArgentinaGener Blue Water, Ltd. Cayman IslandsGenergia Power, Ltd. Cayman IslandsGENERGIA S.A. ChileGeorgia Solar Holdings, LLC DelawareGeorgia Solar Parent, LLC DelawareGlobal Energy Holdings C.V. The NetherlandsGNRY Holdings & Investments Limited IsraelGray Springs Vista Solar, LLC DelawareGuacolda Energy S.A. ChileHealth and Welfare Benefit Plans LLC DelawareHefei Zhongli Energy Company Ltd. ChinaHipotecaria San Miguel Limitada de Capital Variable San SalvadorHipotecaria Santa Ana Limitada de Capital Variable El SalvadorImperial Valley Solar 1 Holdings II, LLC DelawareImperial Valley Solar 1 Intermediate Holdings, LLC DelawareImperial Valley Solar 1,LLC DelawareImperial Valley Solar 3, LLC DelawareImperial Valley Solar Power, LLC DelawareImperial Valley Solar, LLC DelawareIndianapolis Power & Light Company IndianaIndimento Inversiones, S.L. SpainInstituto AES Brasil BrazilInterAndes, S.A. ArgentinaInversiones Cachagua SpA ChileInversiones LK SpA ChileInversiones Nueva Ventanas SpA ChileInversiones Termoenergia de Chile Ltda. ChileInversora de San Nicolas S.A. ArgentinaIPALCO Enterprises, Inc. IndianaIPL Funding Corporation IndianaItabo III, S.R.L. Dominican RepublicKazincbarcikai Iparteruletfejleszt Kft. HungaryKings Rooftop PV, LLC CaliforniaLa Plata II, Ltd. British Virgin IslandsLa Plata III C.V. NetherlandsLemoore PV 1 LLC CaliforniaMacGregor Park, Inc. OhioMain Street Power Canada Holdings I, LLC ColoradoManteca PV 1 LLC CaliforniaMasin-AES Pte. Ltd. SingaporeMasin-AES Pte. Ltd. - Philippine Branch PhilippinesMasinloc AES Partners Company Limited PhilippinesMasinloc AES Power Company Limited PhilippinesMasinloc Power Partners Co. Ltd. PhilippinesMauka FIT Twenty LLC Hawaii

Mercury Cayman Co II, Ltda, Agencia en Chile ChileMercury Chile Co. II Ltd. Cayman IslandsMercury Chile Holdco Ltd. Cayman IslandsMercury Chile I Limited ChileMFP CO Holdings II, LLC DelawareMFP CO Holdings, LLC DelawareMFP CO I, LLC DelawareMFP CO II, LLC ColoradoMFP CO III, LLC DelawareMFP CO Parent, LLC DelawareMiami Valley Insurance Company VermontMiami Valley Lighting, LLC OhioMid-America Capital Resources, Inc. IndianaMM Solar Holdings I, LLC ColoradoMM Solar Holdings II, LLC ColoradoMM Solar Parent, LLC DelawareMountain Minerals, LLC DelawareMountain View Power Partners IV, LLC DelawareMountain View Power Partners, LLC DelawareMSP Master Tenant I, LLC ColoradoMSP Master Tenant II, LLC ColoradoMSP QALICB II, LLC ColoradoMSP QALICB, LLC ColoradoMySolar Holdings II, LLC DelawareMySolar Holdings IV, LLC DelawareMySolar Holdings, LLC DelawareMySolar I, LLC DelawareNa Pua Makani Power Partners, LLC DelawareNew Caribbean Investments SRL Dominican RepublicNorgener Inversiones SpA ChileNorgener Renovables SpA ChileNorgener SpA ChileNova Energia Holding S.A. BrazilNovus Barre Town Solar, LLC DelawareNurenergoservice LLP KazakhstanNY RNM Project1, LLC DelawareNY RNM Project2, LLC DelawareNY RNM Project3, LLC DelawareNY RNM Project4, LLC DelawareOdisha Power Generation Corporation Limited IndiaOmega SpA ChileRemittance Processing Services, LLC IndianaRep Office of AES Silk Road in Almaty KazakhstanRincon Solar I, LLC GeorgiaRiverside Canal Power Company CaliforniaRMR Solar, LLC Delaware

Rosamond Solar, LLC ColoradoSan Bernardino Solar, LLC DelawareScituate Solar I, LLC DelawareScottsdale Solar Holdings, LLC DelawareSD Solar I, LLC ColoradoSeaWest Asset Management Services, LLC CaliforniaSeaWest Energy Project Associates, LLC DelawareSeaWest Properties, LLC CaliforniaSeaWest Wyoming, LLC DelawareSEPV Imperial, LLC DelawareShazia S.R.L. ArgentinaSociedad Electrica Santiago SpA ChileSolar Access America, LLC DelawareSolar Access CA, LLC DelawareSolar Access California, LLC ColoradoSouthern Electric Brazil Participacoes, Ltda. BrazilStore Heat and Produce Energy, Inc. IndianaStow Solar I, LLC DelawareSudbury Ervin GMC Solar, LLC DelawareSun Lake Solar, LLC DelawareSunE Solar XVII Project5, LLC DelawareSunE SunHoldings4, LLC DelawareT&T Power Holdings I, SRL BarbadosT&T Power Holdings II, Ltd. Cayman IslandsTau Power BV The NetherlandsTecnoma Energia Solar, S.L. SpainTecumseh Coal Corporation IndianaTEG Business Trust MexicoTEG/TEP Management, LLC DelawareTEP Business Trust MexicoTermoAndes S.A. ArgentinaTermoelectrica del Golfo, S. de R.L. de C.V. MexicoTermoelectrica Penoles, S. de R.L. de C.V. MexicoTerneuzen Cogen B.V. The NetherlandsThe AES Barry Foundation United KingdomThe AES Corporation DelawareThe Dayton Power and Light Company OhioThermo Fuels Company, Inc. CaliforniaTozer Road Solar, LLC MassachusettsU.S. Solar Services, LLC DelawareUSVI Solar I, LLC DelawareVillage of Waterbury Solar I, LLC DelawareWestern Solar Parent, LLC DelawareWildwood Trust Cayman IslandsYour Energy Holdings Limited England & Wales

Exhibit 23.1
Consent of Independent Registered Public Accounting Firm
We consent to the incorporation by reference in the following Registration Statements and in the related Prospectuses of The AES Corporation:
(1) Registration Statements No. 333-203684, 333-156242, 333-26225, 333-28883, 333-30352, 333-38535, 333-57482, 333-66952, 333-66954, 333-82306, 333-83574, 333-84008, 333-97707, 333-108297, 333-112331, 333-115028, 333-150508,333-135128, 333-158767, 333-166607, and 333-179701 on Form S-8;
(2) Registration Statements No. 333-64572, 333-161913, 333-186888, and 333-209671 on Form S-3;
(3) Registration Statements No. 333-38924, 333-40870, 333-44698, 333-46564, 333-37924, 333-83767, 333-81953, 333-46189, 333-39857; 333-15487, and 333-01286 on Form S-3/A, and
(4) Registration Statements No. 333-45916, 333-49644, 333-43908, 333-44845, 333-147951, 333-33283, 333-22513, and 333-180388 on Form S-4/A;
of our reports dated February 26, 2018 , with respect to the consolidated financial statements and schedule of The AES Corporation and theeffectiveness of internal control over financial reporting of The AES Corporation included in this Annual Report (Form 10-K) of The AES Corporationfor the year ended December 31, 2017 .
/s/ Ernst & Young LLP Tysons, VirginiaFebruary 26, 2018

The AES Corporation (the “Company”)Power of Attorney
The undersigned, acting in the capacity or capacities stated opposite their respective names below, hereby constitute and appoint ThomasO’Flynn and Paul L. Freedman and each of them severally, the attorneys-in-fact of the undersigned with full power to them and each of them to signfor and in the name of the undersigned in the capacities indicated below the Company’s 2017 Annual Report on Form 10-K and any and allamendments and supplements thereto. This Power of Attorney may be executed in one or more counterparts, each of which together shallconstitute one and the same instrument.
Name Title Date
/s/ Andrés Gluski Principal Executive Officer and Director February 23, 2018Andrés Gluski
/s/ Charles L. Harrington Director February 23, 2018
Charles L. Harrington
/s/ Kristina M. Johnson Director February 23, 2018Kristina M. Johnson
/s/ Tarun Khanna Director February 23, 2018
Tarun Khanna
/s/ Holly K. Koeppel Director February 23, 2018Holly K. Koeppel
/s/ James H. Miller Director February 23, 2018
James H. Miller
/s/ Alain Monié Director February 23, 2018Alain Monié
/s/ John B. Morse Director February 23, 2018
John B. Morse
/s/ Moises Naim Director February 23, 2018Moises Naim
/s/ Charles O. Rossotti Chairman and Lead Independent Director February 23, 2018
Charles O. Rossotti
/s/ Jeffrey W. Ubben Director February 23, 2018Jeffrey W. Ubben

Exhibit 31.1
CERTIFICATIONS
I, Andrés Gluski, certify that:
1. I have reviewed this Form 10-K of The AES Corporation;
2. Based on my knowledge, this report does not contain any untrue statement of a material fact or omit to state a material fact necessary tomake the statements made, in light of the circumstances under which such statements were made, not misleading with respect to the periodcovered by this report;
3. Based on my knowledge, the financial statements, and other financial information included in this report, fairly present in all materialrespects the financial condition, results of operations and cash flows of the registrant as of, and for, the periods presented in this report;
4. The registrant’s other certifying officer and I are responsible for establishing and maintaining disclosure controls and procedures (as definedin Exchange Act Rules 13a-15(e) and 15d-15(e)) and internal control over financial reporting (as defined in Exchange Act Rules 13a-15(f)and 15d-15(f)) for the registrant and have:
a) Designed such disclosure controls and procedures, or caused such disclosure controls and procedures to be designed under oursupervision, to ensure that material information relating to the registrant, including its consolidated subsidiaries, is made known tous by others within those entities, particularly during the period in which this report is being prepared;
b) Designed such internal control over financial reporting, or caused such internal control over financial reporting to be designed underour supervision, to provide reasonable assurance regarding the reliability of financial reporting and the preparation of financialstatements for external purposes in accordance with generally accepted accounting principles;
c) Evaluated the effectiveness of the registrant’s disclosure controls and procedures and presented in this report our conclusionsabout the effectiveness of the disclosure controls and procedures, as of the end of the period covered by this report based on suchevaluation; and
d) Disclosed in this report any change in the registrant’s internal control over financial reporting that occurred during the registrant’smost recent fiscal quarter (the registrant’s fourth fiscal quarter in the case of an annual report) that has materially affected, or isreasonably likely to materially affect, the registrant’s internal control over financial reporting.
5. The registrant’s other certifying officer and I have disclosed, based on our most recent evaluation of internal control over financial reporting,to the registrant’s auditors and the audit committee of the registrant’s board of directors (or persons performing the equivalent functions):
a) All significant deficiencies and material weaknesses in the design or operation of internal control over financial reporting which arereasonably likely to adversely affect the registrant’s ability to record, process, summarize and report financial information; and
b) Any fraud, whether or not material, that involves management or other employees who have a significant role in the registrant’sinternal control over financial reporting.
Date: February 26, 2018
/ s / A NDRÉS G LUSKI
Name: Andrés GluskiPresident and Chief Executive Officer

Exhibit 31.2
CERTIFICATIONS
I, Thomas M. O’Flynn, certify that:
1. I have reviewed this Form 10-K of The AES Corporation;
2. Based on my knowledge, this report does not contain any untrue statement of a material fact or omit to state a material fact necessary tomake the statements made, in light of the circumstances under which such statements were made, not misleading with respect to the periodcovered by this report;
3. Based on my knowledge, the financial statements, and other financial information included in this report, fairly present in all materialrespects the financial condition, results of operations and cash flows of the registrant as of, and for, the periods presented in this report;
4. The registrant’s other certifying officer and I are responsible for establishing and maintaining disclosure controls and procedures (as definedin Exchange Act Rules 13a-15(e) and 15d-15(e)) and internal control over financial reporting (as defined in Exchange Act Rules 13a-15(f)and 15d-15(f)) for the registrant and have:
a) Designed such disclosure controls and procedures, or caused such disclosure controls and procedures to be designed under oursupervision, to ensure that material information relating to the registrant, including its consolidated subsidiaries, is made known tous by others within those entities, particularly during the period in which this report is being prepared;
b) Designed such internal control over financial reporting, or caused such internal control over financial reporting to be designed underour supervision, to provide reasonable assurance regarding the reliability of financial reporting and the preparation of financialstatements for external purposes in accordance with generally accepted accounting principles;
c) Evaluated the effectiveness of the registrant’s disclosure controls and procedures and presented in this report our conclusionsabout the effectiveness of the disclosure controls and procedures, as of the end of the period covered by this report based on suchevaluation; and
d) Disclosed in this report any change in the registrant’s internal control over financial reporting that occurred during the registrant’smost recent fiscal quarter (the registrant’s fourth fiscal quarter in the case of an annual report) that has materially affected, or isreasonably likely to materially affect, the registrant’s internal control over financial reporting.
5. The registrant’s other certifying officer and I have disclosed, based on our most recent evaluation of internal control over financial reporting,to the registrant’s auditors and the audit committee of the registrant’s board of directors (or persons performing the equivalent functions):
a) All significant deficiencies and material weaknesses in the design or operation of internal control over financial reporting which arereasonably likely to adversely affect the registrant’s ability to record, process, summarize and report financial information; and
b) Any fraud, whether or not material, that involves management or other employees who have a significant role in the registrant’sinternal control over financial reporting.
Date: February 26, 2018
/s/ T HOMAS M. O’F LYNN
Name: Thomas M. O’FlynnExecutive Vice President and Chief Financial Officer

Exhibit 32.1
CERTIFICATION OF PERIODIC FINANCIAL REPORTS
I, Andrés Gluski, President and Chief Executive Officer of The AES Corporation, certify, pursuant to 18 U.S.C. Section 1350, as adoptedpursuant to Section 906 of the Sarbanes-Oxley Act of 2002, that:
(1) the Form 10-K for the year ended December 31, 2017 , (the “Periodic Report”) which this statement accompanies fully complies withthe requirements of Section 13(a) or 15(d) of the Securities Exchange Act of 1934 (15 U.S.C. 78m or 78o(d)); and
(2) information contained in the Periodic Report fairly presents, in all material respects, the financial condition and results of operations ofThe AES Corporation.
Date: February 26, 2018
/ S / A NDRÉS G LUSKI
Name: Andrés GluskiPresident and Chief Executive Officer

Exhibit 32.2
CERTIFICATION OF PERIODIC FINANCIAL REPORTS
I, Thomas M. O’Flynn, Executive Vice President and Chief Financial Officer of The AES Corporation, certify, pursuant to 18 U.S.C.Section 1350, as adopted pursuant to Section 906 of the Sarbanes-Oxley Act of 2002, that:
(1) the Form 10-K for the year ended December 31, 2017 , (the “Periodic Report”) which this statement accompanies fully complies withthe requirements of Section 13(a) or 15(d) of the Securities Exchange Act of 1934 (15 U.S.C. 78m or 78o(d)); and
(2) information contained in the Periodic Report fairly presents, in all material respects, the financial condition and results of operations ofThe AES Corporation.
Date: February 26, 2018
/s/ T HOMAS M. O’F LYNN
Name: Thomas M. O’FlynnExecutive Vice President and Chief Financial Officer