united states: the uphill schools’ struggle
TRANSCRIPT

United States: The Uphill Schools’Struggle
Eric A. Hanushek
Abstract The United States has seen generally flat performance on both interna-tional and national tests. Moreover, the achievement gaps between disadvantagedand more advantaged students have been large and constant for a half century.The remarkable aspect of these outcomes is that federal and state programs havechanged significantly—considerably greater resources, added school choice, test-based accountability, and school desegregation. Because of the importance of skillsfor the economy, it is important that the schools improve, but there is no indicationof finding the set of policies that will do this.
1 Introduction
Some nations have reacted strongly to international achievement results, particu-larly after the introduction and expansion of PISA results that began in 2000.1 TheGermans were horrified with the initial results in 2000, while the Finns basked in theglory of high performance. The United States reaction was, however, at best subduedto the point of generally ignoring the results.
For those who have followed the PISA scores for the United States, there are fewsurprises. In terms of time trends across the subjects, the 2018 scores in mathematicsand reading were not significantly changed over the entire period of PISA. Thescience scores were significantly better in 2018 than in 2006, but a substantial gapwith the better performing nations remains.
1PISA is the Programme for International Student Assessment, conducted by the OECD (https://www.oecd.org/pisa/).2TIMSS is the Trends in International Mathematics and Science Study. It has been operational(with a changing group of countries) since the mid-1960s, and has been organized and run bythe IEA (International Association for the Evaluation of Educational Achievement), which is aninternational cooperative (https://www.iea.nl/). See the summary of international tests in Hanushekand Woessmann (2011).
E. A. Hanushek (B)Hoover Institution, Stanford University, Stanford, USAe-mail: [email protected]
© The Author(s) 2021N. Crato (ed.), Improving a Country’s Education,https://doi.org/10.1007/978-3-030-59031-4_11
227

228 E. A. Hanushek
The international scores on PISA and on the parallel TIMSS2 testing programdid not receive much attention until the Obama administration began publicizing the2009 results. The fact that the international testing did not receive much attentiondoes not mean, however, that there was no prior attention to student achievement. Foralmost 50 years, there has been consistent testing of U.S. students, and this permitstracking changes in performance over time. For the past two decades, it has also beenpossible to compare performance across U.S. states.
As described below, the different testing programs—PISA, TIMSS, and the longi-tudinal testing within the U.S., have given very similar pictures of the performanceof U.S. students. Thus, there is no U.S. PISA shock, because the results from PISAcan overall be seen in the other existing programs.
The picture is remarkable: First, with some nuances, overall U.S. performance hasremained virtually constant for a half century; second, gaps in achievement acrosssocio-economic groups have also remained constant for the past half century.
If attention to schooling and if programmatic elements of schooling were alsoconstant, we could conclude this essay now. In other words, if a stagnant systemproduced constant results, there would not be much to say. But that is not the case.Schooling in the United States has changed in many ways. These ways have beenfocused on changing the performance picture, both in overall level and in the distri-bution of achievement. Therefore, it is useful to consider what policy changes havetaken place along with the picture of constant results.
The overall story is simple. U.S. performance on international tests has never beengood. There is a general notion in society that the schools should be doing better,and, toward that end, there have been large policy changes. Yet the changes that havebeen taken have not led to better outcomes. Even with a general appreciation for theeconomic importance of educational quality, the changes that have occurred havenot been effective.
This chapter begins with an overview of the performance of U.S. students as seenfrom both international and national tests; this includes information on the level ofachievement and the distribution of performance. It then turns to a discussion of thestructure and organization of U.S. schools (Sect. 3) and of the major programs ofthe federal government (Sect. 4) and the state governments (Sect. 5). This discus-sion is followed by consideration of evidence about why this performance measuresimportant things from the standpoint of the economy (Sect. 6) and why the U.S. hasdone better than would be expected based on the quality of its graduates (Sect. 7).It concludes with speculation about whether the good fortune of the U.S. economywill last if the schools do not improve.
2 Long Term Achievement Patterns
The international testing of achievement began in 1964 with the First InternationalMathematics Study. Of the 11 participating countries, the U.S. ranked tenth, beating

United States: The Uphill Schools’ Struggle 229
out Sweden.3 When the Second International Mathematics Study was conducted in1980–82, the U.S. was in 13th place out of 17 participants—beating out Sweden,Luxemburg, Thailand, and Swaziland. Thus, it is not a surprise if a significantproportion of developed countries taking the tests outpace the U.S.
The overall trends in performance of U.S. students are easy to describe and arevery consistent.
2.1 Pattern of PISA Scores
Since the beginning of PISA in 2000, the U.S. has been slightly above or slightlybelow the OECD average depending on the specific test. And it has stayed there.Figure 1 shows the performance on the separate reading, math, and science assess-ments of PISA. The dashed line in each panel shows the pattern of the OECDaverage. While some movement can be seen, the plots visually demonstrate thelack of significant movement.4
2.2 Pattern of National Assessment of Educational Progress(NAEP) Scores
The lack of surprise with PISA scores is easily explained by the pattern of scores ontheU.S.NationalAssessment of Educational Progress (NAEP). This is an assessmentgiven to a random sample of students using tests that can be linked over time. Figure 2displays performance on the NAEP math and reading tests for students age 13 andage 17.5 The top two lines show reading and math scores of 17-year-olds, while thebottom two lines cover 13-year-olds. These patterns are best described as flat studentperformance over three to four decades—with one exception. The math performanceof 13-year-olds rises significantly over the period. The puzzle, and the concern, isthat higher middle school math performance does not readily translate into higherperformance four years later in secondary schools. In any event, it is clear that theearlier performance improvements do not produce improved performance at the timethat students are entering the labor force or further education.
3For a history of international testing along with scores on earlier tests, see Hanushek andWoessmann (2011).4Note that the psychometric linking of the PISA scores occurred at different times for the separatesubjects so that the reading series begins in 2000, math in 2003, and science in 2006. The U.S. doesnot have reading scores for 2006 because of a problem with the testing in that year.5The National Assessment of Educational Progress has changed over time. The original test (LongTerm NAEP) began in the 1970s and considered just a national sample. In 1990, an alternate test(Main NAEP) was introduced in order to provide state representative data. The Long Term NAEPcollection was stopped in 2012. All data are cross-sectional for newly constructed representativesamples.

230 E. A. Hanushek
400425450475500525550575600
2000 2003 2006 2009 2012 2015 2018
U.S. Reading Performance on PISA
OECD average reading U.S. reading
400425450475500525550575600
2000 2003 2006 2009 2012 2015 2018
U.S. Math Performance on PISA
OECD average math U.S. math
400425450475500525550575600
2000 2003 2006 2009 2012 2015 2018
U.S. Science Performance on PISA
OECD average science U.S. science
Fig. 1 United States PISA Scores, 2000–2018. Notes U.S. reading scores for 2006 unavailablebecause of a test administration problem. Aligned math tests begin in 2003, and aligned sciencetests begin in 2006. Source https://nces.ed.gov/surveys/international/ide/
2.3 Pattern of Achievement Gaps
Educational policy clearly has a variety of objectives, but the two recurring goals arehigher overall achievement and equitable provision of education. What is a particu-larly important goal in most countries is using schooling and human capital invest-ments to break the intergenerational transmission of poverty. When translated intoachievement differences, this goal implies narrowing any gaps in student perfor-mance that are correlated with family socio-economic status (SES). Indeed, the U.S.has a wide range of programs (described below) that are aimed at improving the

United States: The Uphill Schools’ Struggle 231
Fig. 2 Long TermNAEP Scores, Math and Reading. Source https://nces.ed.gov/nationsreportcard/
education and achievement of children from poor families. Here it is important tosee what has happened to achievement gaps by SES.
Hanushek et al. (2020) combined test information from NAEP, TIMSS, and PISAwith background information on the SES of each child. They then compared overtime achievement of those in the top quarter of the SES distribution with those in thebottom quarter. Figure 3 shows the pattern of achievement gaps over the past halfcentury. Achievement gaps have not changed!
After the 1954 desegregation of schools ordered in the U.S. Supreme Court deci-sion of Brown v. Board of Education, the black-white achievement gaps narroweduntil roughly 1990, but then progress stopped (Hanushek et al. 2020). The remaininggap is unacceptably large at roughly 0.9 standard deviations. This difference impliesthat the average black student is below the twentieth percentile of white students.
2.4 Conclusions on Achievement
The pattern of achievement—as seen by PISA or more broadly by NAEP—indicateslittle has changed over long periods of time.When broken down by SES of the family,the answer is the same—no movement over long periods of time.
To put this into perspective, it is important to see what changes in school programsand policies have occurred, because they will say something about what look to begood policies.

232 E. A. Hanushek
0.25
.5.75
11.25
1.5
SESga
p-s
.d.
1960 1965 1970 1975 1980 1985 1990 1995 2000 2005birth year
PISA 75-25 SES GapNAEP TIMSSNAEP-LT17 NAEP-LT13
Fig. 3 Trend in the SES-Achievement Gap with Underlying Test Data, Birth Cohorts 1961–2001.Notes Achievement difference between the students in the top and bottom quartiles of the SESdistribution (75–25 SES-achievement gap). The separate points are the 75–25 SES-achievementgap for the individual test administrations, and the line is the quadratic trend through the points.PISA is scores in math, reading, and science for 15-year-olds; NAEP is the Main-NAEP scores foreight graders in math and reading; TIMSS is scores in math and science for eighth graders; NAEP-LT17 is the long-term trend NAEP scores in math and reading for 17-year-olds; and NAEP-LT13is the long-term trend NAEP scores in math and reading for 13-year-olds. Source Hanushek et al.(2020)
3 Organization of U.S. Schools
The picture of U.S. schools is complicated from both a governance and a deci-sion making viewpoint. By the U.S. Constitution, the individual states are theprimary government body controlling schools, but this has interacted with the federalgovernment in a variety of ways.
3.1 Governance
The U.S. education system is highly decentralized. At the beginning of the 20thCentury, there was a federal Office of Education, which was not at the “cabinetrank.” Over the past century, there have been several attempts to enhance the federalrole. In 1953, the Department of Health, Education, and Welfare was created at the

United States: The Uphill Schools’ Struggle 233
cabinet level, and the Office of Education was included along with federal health andwelfare functions. In 1979, the Department of Education was created to give cabinetrank to federal education programs, although there have been periodic attempts todisband the department and to demote the status of education at the federal level.Notwithstanding the federal department, the states retain primary responsibility foreducation programs.
The states have always established separate programs that differ in terms of regu-lations, finance, local district autonomy, accountability, and ultimately performance.But, as discussed below, they have changed the operations and details of their systemsconsiderably over time.
There was a dramatic consolidation of school districts following WWII. Whilethere were 117,000 districts in 1940, this fell to 18,000 in 1970, and 13, 600 in 2016.There were 133,000 public and private schools in 2016.
Because each of the states is free within broad bounds to set its own policies, itis difficult to implement any common policies across the country. This also makesit difficult even to describe what actions and policies have been undertaken. Thereare, however, a few notable exceptions outlined below. But there are also commontrends.
3.2 Resources and Expenditures
The first fact of U.S. schools is that expenditures have been rising very consistently—at least up to the time of the 2008 recession. Whenever discussions consider thepattern of achievement, they inevitably go to the resources available to the schools.Implicitly if not explicitly the argument inevitably turns to how resources are theanswer to any improvements. Table 1 shows the pattern of resources over the past halfcentury, both in terms of the components and of the overall spending per pupil. Therewere large decreases in pupil-teacher ratioswith increases in teacher education. Thesechanges added up to dramatic increases in real spending per pupil—over quadruplingbetween 1960 and 2016.
Table 1 Public school resources in the United States, 1960–2016
1960 1980 2000 2016
Pupil-teacher ratioa 25.8 18.7 16.4 16.0
% teachers with master’s degree or more 23.5 49.6 56.8 56.4a
median years teacher of experience 11 12 14 n.a
Real expenditure per pupilb
(2017–18 $’s)$2959 $6675 $10,131 $12,330
n.a. Not availableaData for 2012bData on expenditure per pupil are adjusted for inflation using the Consumer Price Index.Sources U.S. Department of Education (2019)

234 E. A. Hanushek
It is difficult to argue from these data that the U.S. has overly tight with resourcesfor the schools.
4 Federal Government Programs and Activities
The federal government has concentrated its attention on education of poor anddisadvantaged students. These programs have been in place for a long time and havegenerally grown in size over time.
4.1 The War on Poverty
In 1965, President Lyndon Johnson declared a “war on poverty.” Amajor componentof this was providing human capital to children from poor families so as to break thecycle of poverty. This compensatory education funding from the federal government,called Title 1 because of its legal foundations, led to a significant increase in funding,one that has grown over time.6
Soon after, the federal government initiated Head Start, a preschool program for3- and 4-year olds from poor families. While never serving all poor children, thisprogram also grew over time so that it served roughly 1 million 3- and 4-year olds,or roughly one-third of income-eligible students.
Finally, rounding out major programmatic support, the federal government legis-lated requirements for educating childrenwith both physical andmental special needsin 1975. Support for this program has been split between the federal government andstate governments. Over time, enrollment in special education has grown from 8.3%in 1976 to 13.7% in 2018. (On average, expenditures for special education studentsare roughly twice those for other children, although spending varies widely acrossdifferent disabilities).
This set of federal programs underscores the fact that the U.S. federal governmenthas programs chiefly driven by concerns about equity in education. Each of theseprograms is designed to support the education of disadvantaged students and isintended to reduce disparities in educational outcomes between children of poorfamilies and children of better off families.
It is also important to note at the outset that funding for these programswas not tiedto any specific use of the funds (other than general support for poor children). Thereare also no regular requirements that programs evaluate performance. As a result,periodic national evaluations of Title 1 compensatory funding and of Head Start7
6For a more complete history of Title 1 and of Head State, see Vinovskis (1999).7The recent randomized evaluation of Head Start found that any positive effects disappeared bygrade 3; Puma et al. (2010) and Puma et al. (2012). Note, however, that other studies have found

United States: The Uphill Schools’ Struggle 235
have not found them to be very successful in terms of increasing the achievement ofthe targeted students.
4.2 Desegregation
In 1954, the U.S. Supreme Court ruled in the court case of Brown v. Board of Educa-tion that de jure segregation of schools was unconstitutional. A number of southernstates had previously had laws that separated students by race, and this led to anextended period of legal actions designed to desegregate schools.
Segregation of schools goes beyond the laws that were the subject of the Browndecision. Because housing tends to be segregated and because schools are based onlocal political jurisdictions, there is segregation of schools both because of localschool attendance zones within large cities and because of differences in racialcomposition across school districts.
TheBrown decisionwas followed by continuing legal and policy actions revolvingaround race and schooling. Therewas a significant rise in the chance of black studentshaving white classmates through the late 1980s, but then the improvements lessened(Rivkin 2016). The main reason for the decline in exposure was the changing overallcomposition of U.S. students.White students went from 80% in 1968 to less than halftoday. The largest change has been the significant increase in Hispanic students whotoday make up over one-quarter of the public school population. The black studentpopulation has been quite constant since the 1960s at slightly over 15%.
There is no doubt that school desegregation led to better schools for black students.And, as was discussed above, this shows up in reduced achievement gaps betweenblack and white students but a pattern of change that stopped a quarter century ago.8
The combination of changing demographics, policy changes, and legal decisions,led to progress that stagnated and imply that this area offers limited possibilities forimprovement.
The changing composition of the overall student population does have potentialimpacts on the aggregate scores for U.S. students. If the immigrant population thatmakes up the majority of the increase in Hispanic students is also less preparedfor school, demographics could influence the trends in achievement that are seen.Some simple calculations that use the changing demographic composition of theU.S.student population suggests, however, that this is not a very powerful force affectingthe aggregate scores (Hanushek et al. 2020).
long term impacts of Head Start even if any achievement effects disappeared over time; Currie andThomas (2000), Johnson and Jackson (2017).8The improvement in outcomes related to desegregation is also found in the evaluation literature.See, for example, Angrist and Lang (2004), Hanushek, Kain, and Rivkin (2009).

236 E. A. Hanushek
4.3 Accountability
School accountability was universalized by the federal government when it passedthe No Child Left Behind legislation (NCLB) in 2001. NCLB called for all states toinstitute annual student testing in grades 3–8 and once in high school, and it requiredregular reporting of achievement levels bymajor subgroup (race, poverty, and specialeducation). In reality this was just an extension of the existing policy in a majorityof the states.
NCLB set the target that all students had to be proficient (as defined by theindividual states) by 2014. There were also intermediate goals that were to be metby each school between 2002 and 2014. If not met, there were various sanctions thatwere imposed as specified by the federal government: expanded student choice ofschools, remedial programs, and ultimately elimination of failing schools.
Over time, it becameapparent that few schoolswould actuallymeet the proficiencygoals. Moreover, resistance to the entire program grew over time. As a result, theNCLB legislationwas replaced in 2015with theEveryStudent SucceedsAct (ESSA).While this federal law still required annual student testing, most parts of the designof the measurement system, its goals, and its remedial actions were returned to theindividual states.
4.4 The Federal Government Role
In sum, the federal government in the U.S. has been particularly focused on equitygoals and has introduced both funding and regulatory approaches to improving theachievement of students at the bottom of the poverty distribution. As Fig. 3 showed,these policies have not been successful in terms of narrowing achievement gaps.
5 State Programs and Policies
The main responsibility for schools in the U.S. resides with the individual states.The states in turn delegate considerable responsibility to individual school districts.(Only Hawaii has a single school district that coincides with the state).
5.1 School Finance Issues
The clearestway to see the state role is by observing the pattern of revenue raising overtime. As Fig. 4 shows, a century ago almost all revenues were raised by individuallocalities. But this changed with the local share falling rather steadily. The largest

United States: The Uphill Schools’ Struggle 237
0
10
20
30
40
50
60
70
80
90
1920 1930 1940 1950 1960 1970 1980 1990 2000 2010 2015
Federal
State
Local
Perc
ent
Fig. 4 Sources ofU.S. School Revenue.NotePercentage shares of revenues forU.S. public schools.Source U.S. Department of Education (2018)
Table 2 Sources of stateschool revenue in 2015
Federal State Local
Average 8.5% 46.5% 45.0%
Minimum 4.2 24.9 3.9
Maximum 14.9 90.1 66.8
Note This table reflects the range of revenue sources across statesin 2015Source U.S. Department of Education (2019)
changes in revenues came with two policy issues. First was the increase in federalspending that occurred with the War on Poverty in the 1960s leading to an increaseof the federal government share to roughly 10%. The second was the beginning ofcourt involvement in spending, starting around 1970 and continuing to today.
The court involvement startedwith law suits that argued that the funding of schoolswas not equitable across school districts. Since some districts found it easier to raisefunds than others, a number of lawsuits were introduced individually across thestates.9 Beginning with California in the late 1960s, almost all states have now facedlaw suits about the pattern of spending. The results of these suits, which sometimesrequire changes in funding and other times do not, has been a general increase inthe state share of spending. The pattern of school revenues does, however, differnoticeably across states. As Table 2 shows, while two-thirds of revenues come fromlocalities in Illinois, only four percent do in Vermont. Federal revenues also vary
9Local districts disproportionately raise revenues by property taxes. Since localities vary widely inthe size of their tax base (which comes from the value of homes plus the value of commercial andindustrial property in the district). States will general distribute funds to districts in ways that areinversely related to the local property tax base, but this seldom completely overcomes differencesin tax bases. See Hanushek and Lindseth (2009) for a further discussion plus a history of the courtinvolvement.

238 E. A. Hanushek
0
5
10
15
20
25
30
2000
2002
2004
2006
2008
2010
2012
2014
2016
Homeschooling
Private school
Charter school
Magnet school
Total Choice Enrollment
Perc
ent o
f Tot
al S
tude
nts
Fig. 5 Students Attending Schools of Choice. Source U.S. Department of Education (2018)
noticeably, depending on the overall level of spending in each state and on theproportion of students from poor families.
A different variety of lawsuits (“adequacy cases” instead of “Equity cases”) devel-oped in the late 1980s. These put forward the general argument that, even if state fundswere equitably distributed, the level of funding was not adequate to meet the achieve-ment goals of the state. Again, these court cases pursued the general presumptionthat resources were the problem with the low achievement of students.
Importantly, the source of funds as well as the level of overall spending appears tohave little to do with student performance differences across states (Hanushek 2003).Nor does the increase in spending levels relate to the increase in student performance(Hanushek et al. 2012).10
5.2 Choice: Private, Homeschool and Charter Schools
One thing that has been happening over time is substantial changes in the percentageof students actively choosing what kind of school they attend. As recently as 2000,85% of students went to the traditional public school to which they were assigned(Fig. 5).11 By 2016, one-quarter of students made choices of the sector of instruction.
10Some recent analyses, relying on the estimated impact of court decisions, have argued that extraspending has an impact. These are part of a continuing and unresolved debate. See Jackson, Johnson,and Persico (2016), Lafortune, Rothstein, and Schanzenbach (2018).11Note that these shares of students with choice do not include a number of districts that allow orrequire students to choose among the traditional public schools. Because all students stay withinthe traditional public schools, there is no pressure on the school district to try to keep the students.This feature differs from the other forms of choice with the exception of magnet schools. Magnetschools offer specialty curricula (academic, the arts, or other vocational focus), and they offer analternative to the traditional schools.
United States: The Uphill Schools’ Struggle 239
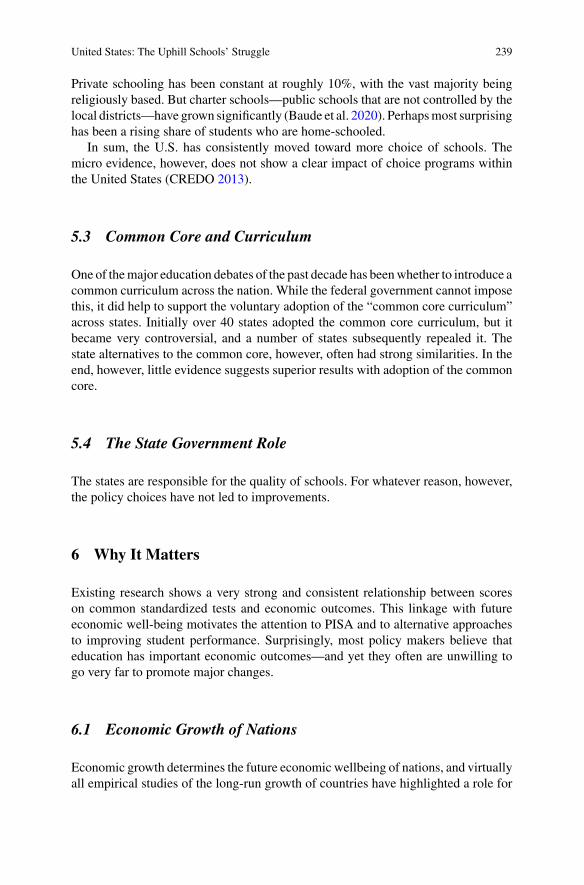
Private schooling has been constant at roughly 10%, with the vast majority beingreligiously based. But charter schools—public schools that are not controlled by thelocal districts—have grown significantly (Baude et al. 2020). Perhapsmost surprisinghas been a rising share of students who are home-schooled.
In sum, the U.S. has consistently moved toward more choice of schools. Themicro evidence, however, does not show a clear impact of choice programs withinthe United States (CREDO 2013).
5.3 Common Core and Curriculum
One of themajor education debates of the past decade has beenwhether to introduce acommon curriculum across the nation. While the federal government cannot imposethis, it did help to support the voluntary adoption of the “common core curriculum”across states. Initially over 40 states adopted the common core curriculum, but itbecame very controversial, and a number of states subsequently repealed it. Thestate alternatives to the common core, however, often had strong similarities. In theend, however, little evidence suggests superior results with adoption of the commoncore.
5.4 The State Government Role
The states are responsible for the quality of schools. For whatever reason, however,the policy choices have not led to improvements.
6 Why It Matters
Existing research shows a very strong and consistent relationship between scoreson common standardized tests and economic outcomes. This linkage with futureeconomic well-being motivates the attention to PISA and to alternative approachesto improving student performance. Surprisingly, most policy makers believe thateducation has important economic outcomes—and yet they often are unwilling togo very far to promote major changes.
6.1 Economic Growth of Nations
Economic growth determines the future economic wellbeing of nations, and virtuallyall empirical studies of the long-run growth of countries have highlighted a role for
240 E. A. Hanushek
human capital. The early economics literature overwhelmingly employed measuresrelated to school attainment, or years of schooling, to test for the effects of humancapital. But, average years of schooling is an incomplete and potentially misleadingmeasure of education when comparing different countries. It implicitly assumes thata year of schooling delivers the same increase in knowledge and skills regardless ofthe education system. For example, a year of schooling in Peru is assumed to createthe same increase in productive human capital as a year of schooling in Japan. Italso neglects cross-country differences in the quality of schools and in the strengthof family, health, and other influences is a major drawback in such research.
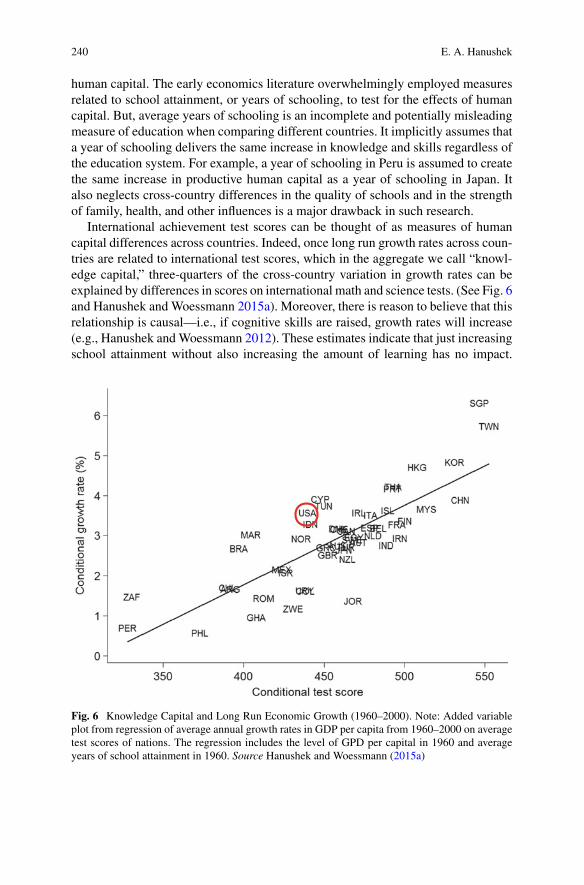
International achievement test scores can be thought of as measures of humancapital differences across countries. Indeed, once long run growth rates across coun-tries are related to international test scores, which in the aggregate we call “knowl-edge capital,” three-quarters of the cross-country variation in growth rates can beexplained by differences in scores on international math and science tests. (See Fig. 6and Hanushek and Woessmann 2015a). Moreover, there is reason to believe that thisrelationship is causal—i.e., if cognitive skills are raised, growth rates will increase(e.g., Hanushek andWoessmann 2012). These estimates indicate that just increasingschool attainment without also increasing the amount of learning has no impact.
Fig. 6 Knowledge Capital and Long Run Economic Growth (1960–2000). Note: Added variableplot from regression of average annual growth rates in GDP per capita from 1960–2000 on averagetest scores of nations. The regression includes the level of GPD per capital in 1960 and averageyears of school attainment in 1960. Source Hanushek and Woessmann (2015a)

United States: The Uphill Schools’ Struggle 241
In other words, just getting students through more schooling without ensuring highlevels of learning is not an effective policy.
The historical impact on economic growth of differences in test scores is large.One easy way to see the importance of cognitive skills is to project the economicvalue of school improvement (Hanushek et al. 2013; Hanushek and Woessmann2015b). For example, consider the estimated impact of bringing just the bottom ofthe U.S. achievement distribution up to a basic skill level—i.e., a policy similarto the ideas behind U.S. accountability policies. Hanushek and Woessmann (2015b)estimate that, according to historical growth patterns, this would lead to averageGDPlevels that were 3.3% higher across the remainder of the century when compared toexpected GDP levels with current skill levels. Such increases would be sufficient todeal with most of the fiscal problems suggested for the pension and medical systems.
While politicians may tend to underestimate the importance of education foreconomic growth, they by all public statements still think that education if extraor-dinarily important for the nation. Nonetheless, perhaps because it takes time to seethe results of any improvements, they are unwilling to make difficult decisions in theshort run.
6.2 Economic Growth of States
Given the high levels of mobility in the U.S., the work location of somebody mightbe very different from where the person grew up and went to school. As a result,states do not directly experience all of the results of their school systems. Therefore,while improving schools might be in the national interest, individual states mightbenefit less and thus might not have strong incentives to invest in better schools. Thetension in America between centralized and decentralized education policy has beena pivotal policy issue for decades.
How schools affect state-level measures of economic output is a high priorityconcern for policy makers (and researchers). In a series of studies, Hanushek et al.(2016, 2017a, b) show that economic growth of individual states, just like nations,is dependent on the quality of the labor force as measured by standardized tests, i.e.,the knowledge capital of states. Moreover, the relationship between worker skillsand growth at the state level is virtually identical to that found internationally.
Because a majority of students educated in a given state remain in the state whenentering the labor force, even with migration, it pays for each state to invest inimproved school quality. But since the labor force in each state is comprised of bothlocally educated workers and workers educated in other states, the largest gains comewhen all states improve their school quality, as opposed to a single state.
242 E. A. Hanushek
6.3 Individual Incomes
The previous sections focused on the effects of improved school quality on aggre-gate economic gains at the state and national level. Considerably more research hasfocused on the relationship between education and individual earnings. Innumerableeconomic studies show that school attainment affects earnings and income. Thesestudies, pioneered by Mincer (1970, 1974), showed that economic success dependsheavily on schooling. Nonetheless, they suffer from many of the same problemsdescribed in the previous aggregate studies. In particular, they ignore quality differ-ences in schools, and they ignore sources of skills outside of schools.As demonstratedby the landmark “Equality of Educational Opportunity” report, commonly known as“the Coleman Report,” families are very important, as are peers in schools, neigh-borhood influences, and more (Coleman et al. 1966). An extensive body of researchdocuments themultiplicity of inputs in educational production (e.g.,Hanushek2002).
The alternative, as with the aggregate studies, is to use measured skill from stan-dardized tests to capture the totality of individual skills from families, schools, andother influences. This approach also relates the research more directly to educationalpolicy. It has not been pursued extensively in the past, largely because few datasources combine information on both skills and individual earnings.
Recent international data provide the ability to estimate the economic value toindividuals of higher educational achievement. TheOECD surveyed random samplesof adults age 15–65 across 32 countries in the Program for International Assessmentof Adult Competencies (PIAAC). This survey contained information on backgroundsof individuals and their labor market experiences along with giving them a series ofstandardized tests (see Hanushek et al. 2015, 2017).
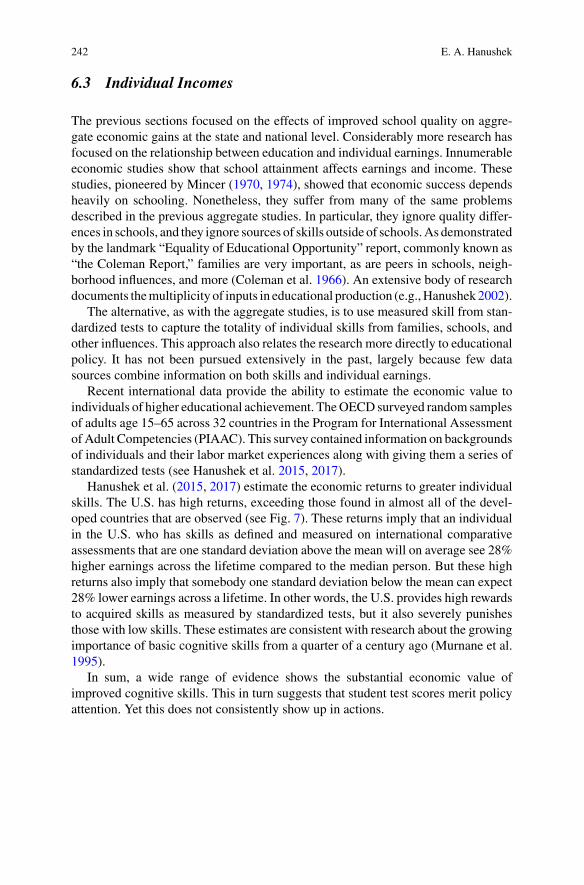
Hanushek et al. (2015, 2017) estimate the economic returns to greater individualskills. The U.S. has high returns, exceeding those found in almost all of the devel-oped countries that are observed (see Fig. 7). These returns imply that an individualin the U.S. who has skills as defined and measured on international comparativeassessments that are one standard deviation above the mean will on average see 28%higher earnings across the lifetime compared to the median person. But these highreturns also imply that somebody one standard deviation below the mean can expect28% lower earnings across a lifetime. In other words, the U.S. provides high rewardsto acquired skills as measured by standardized tests, but it also severely punishesthose with low skills. These estimates are consistent with research about the growingimportance of basic cognitive skills from a quarter of a century ago (Murnane et al.1995).
In sum, a wide range of evidence shows the substantial economic value ofimproved cognitive skills. This in turn suggests that student test scores merit policyattention. Yet this does not consistently show up in actions.

United States: The Uphill Schools’ Struggle 243
0.20
0.19
0.15
0.21
0.14
0.130.
14
0.18
0.14
0.18
0.230.
25
0.14
0.18
0.22
0.19
0.13
0.20
0.18
0.24
0.13
0.22
0.26
0.20
0.40
0.11
0.25
0.29
0.16
0.19
0.47
0.20
0.24
0.1
.2.3
.4.5
Ret
urns
to n
umer
acy
skill
s
SingaporeChile
Israel
U.S.
Indonesiaa
Ireland
TurkeySpain
Germany
KoreaU.K.
Canada
Pooled
Australia
Poland
Slovenia
New Zealand
Netherlands
Austria
Slovak R
ep.
Japan
Estonia
France
Lithuania
Belgium
Finland
Cyprus
DenmarkIta
ly
Norway
Sweden
Czech
Rep.
Greece
Fig. 7 Estimated Return to Numeracy by Country. Note: Estimates from the Program of Interna-tional Assessment of Adult Competencies (PIAAC) of the returns to skills across PIAAC countries.Coefficient estimates on numeracy score (standardized to std. dev. 1within each country) in a regres-sion of log gross hourly wage on numeracy, gender, and a quadratic polynomial in age, sample offull-time employees aged 35–54. Regressions weighted by sampling weights. Hollow bars indicatefirst-round countries, Black bars indicate second-round countries. *Jakarta only. Source Hanusheket al. (2017)
7 Why Has the U.S. Done so Well?
Onemight ask ‘howhas theU.S. done sowell over the past centurywhen achievementlevels are so low?’ As seen by the growth chart (Fig. 6), the U.S. has done better thanwould be expected by its test scores.
Perhaps the most important factor is the favorable economic institutions thatsupport productive use of resources and growth. The United States has generallyless governmental intrusion into the operation of economic markets including lowertax rates and less regulation of labor and capital markets. There are strong propertyrights, and there is quite free movement of labor and capital within the U.S. All ofthese institutional factors are thought to promote more efficiency and growth.
Of course, these favorable growth institutions may have other implications suchas a wider distribution of income or less certain provision of health care. But these aretrade-offs made with the implication that growth is stronger than in other countriesthat choose different kinds of economic and political structures.
Additionally, at least historically the U.S. has had a larger quantity of schoolingthan other countries in the world, allowing it to substitute quantity for quality. Thistrade-off includes moving toward high levels of compulsory schooling before mostother nations.

244 E. A. Hanushek
Moreover, by most evaluations, the U.S. has higher quality colleges and universi-ties than are found elsewhere. This university quality has supported an active researchand development system and has led to a high level of innovation.
Finally, in terms of factors supportingU.S. success, theUnited States has been ableto attract a highly skilled group of immigrants, thus borrowing from the educationalsystems elsewhere. For example, of all of the Ph.D’s in STEM fields in the U.S., overhalf are foreign born (Hanson and Slaughter 2019; Hanson et al. 2018).
8 Will Good Fortune Last?
The full story developed here is rather straightforward.First, theU.S. has not donewell asmeasured by international tests. PISA results for
2018 are just the most recent evidence of the mediocre performance of U.S. schools.The overall U.S. performance is around or below the average for the OECD. And,there is no evidence that equity in terms of educational achievement is improving.
Second, this long stasis is not the result of a constant, unchanging schoolingsystem. While decision making in the U.S. is complicated because the 50 statesare primary in schooling issues, there have been substantial changes aimed atimproving the schools. Funding has increased dramatically. There has been clearschool accountability. Parents have more options to choose schools that meet theirdemands.Many programs and policies are aimed at improving equity in the outcomesof schools including compensatory funding from the federal government, expansionof preschool access and usage, considerable desegregation of schools over the pasthalf century, targeted funding for special education, and added state funding fordisadvantaged students. Forwhatever reasons, these policies have not led to improvedschool outcomes in the United States.
There is at the same time considerable complacency. After all, with the currentschools, the U.S. remains a rich nation with growth that exceeds that in much of thedeveloped world. Isn’t it possible simply to continue and to expect good fortune?
Much depends on whether the offsetting forces described above remain effective.Unfortunately, that might not be the case—making it important for theU.S. to dependmore fully on its own knowledge capital. The potential for a negative change infortune appears large enough that the U.S. should work harder at finding ways toimprove its schools.
References
Angrist, J. D., & Lang, K. (2004). Does school integration generate peer effects? Evidence fromBoston’s Metco program. American Economic Review, 94(5), 1613–1634.
Baude, P. L., Casey, M., Hanushek, E. A., Phelan, G. R., & Rivkin, S. G. (2020). The evolution ofcharter school quality. Economica, 87(345), 158–189.

United States: The Uphill Schools’ Struggle 245
Coleman, J. S., Campbell, E. Q., Hobson, C. J., McPartland, J., Mood, A. M., Weinfeld, F. D., &York, R. L. (1966). Equality of educational opportunity. Washington, D.C.: U.S. GovernmentPrinting Office.
CREDO. (2013). National charter school study 2013. Stanford, CA: Center for Research onEducation Outcomes, Stanford University.
Currie, J., & Thomas, D. (2000). School quality and the longer-term effects of head start. Journalof Human Resources, 35(4), 755–774.
Hanson, G. H., Kerr, W. R., & Turner, S. (Eds.). (2018). High-skilled migration to the United Statesand its economic consequences. Chicago: University of Chicago Press.
Hanson, G. H., & Slaughter,M. J. (2019). High-skilled immigration and the rise of stem occupationsinUS employment. InC.R.Hulten,&V.A.Ramey (Eds.),Education, skills, and technical change:Implications for future US GDP Growth (pp. 465–494). Chicago: University of Chicago Press.
Hanushek, E. A. (2002). Publicly provided education. In A. J. Auerbach & M. Feldstein (Eds.),Handbook of public economics (Vol. 4, pp. 2045–2141). Amsterdam: North Holland.
Hanushek, E. A. (2003). The failure of input-based schooling policies.Economic Journal, 113(485),F64–F98.
Hanushek, E. A., Kain, J. F., & Rivkin, S. G. (2009). New Evidence about Brown V. Board ofEducation: The complex effects of school racial composition on achievement. Journal of LaborEconomics 27(3), 349–383.
Hanushek, E. A., & Lindseth, A. A. (2009). Schoolhouses, courthouses, and statehouses: Solvingthe funding-achievement puzzle in America’s public schools. Princeton, NJ: Princeton UniversityPress.
Hanushek, E. A., Peterson, P. E., Talpey, L. M., & Woessmann, L. (2020, February). Long-runtrends in the U.S. Ses-achievement Gap. NBER Working Paper No. 26764. Cambridge, MA:National Bureau of Economic Research.
Hanushek, E. A., Peterson, P. E., & Woessmann, L. (2012). Is the United States catching up?International and state trends in student achievement. Education Next, 12(4), 24–32.
Hanushek, E. A., Peterson, P. E., & Woessmann, L. (2013). Endangering prosperity: A global viewof the American school. Washington, DC: Brookings Institution Press.
Hanushek, E. A., Ruhose, J., & Woessmann, L. (2016). It pays to improve school quality: Statesthat boost student achievement could reap large economic gains. Education Next, 16(3), 16–24.
Hanushek, E. A., Ruhose, J., & Woessmann, L. (2017a). Economic gains from educational reformby US states. Journal of Human Capital 11(4), 447–486.
Hanushek, E. A., Ruhose, J., Woessmann, L. (2017b). Knowledge capital and aggregate incomedifferences: Development accounting for U.S. states. American Economic Journal: Macroeco-nomics 9(4), 184–224.
Hanushek, E. A., Schwerdt, G., Wiederhold, S., & Woessmann, L. (2015). Returns to skills aroundthe World: Evidence from PIAAC. European Economic Review, 73, 103–130.
Hanushek, E. A., Schwerdt, G., Wiederhold, S., & Woessmann, L. (2017). Coping with change:International differences in the returns to skills. Economic Letters 153, 15–19.
Hanushek, E. A., & Woessmann, L. (2011). The economics of international differences in educa-tional achievement. In E.A. Hanushek, S. Machin, & L. Woessmann (Eds.), Handbook of theeconomics of education (Vol. 3, pp. 89–200), Amsterdam: North Holland.
Hanushek, E. A., &Woessmann, L. (2012). Do better schools lead tomore growth? Cognitive skills,economic outcomes, and causation. Journal of Economic Growth, 17(4), 267–321.
Hanushek, E. A., & Woessmann, L. (2015a). The knowledge capital of nations: Education and theeconomics of growth. Cambridge, MA: MIT Press.
Hanushek, E. A., &Woessmannm, L. (2015b). Universal basic skills: What countries stand to gain.Paris: Organisation for Economic Co-operation and Development.
Jackson, C. K., Johnson, R. C., & Persico, C. (2016). The Effects of school spending on educationaland economic outcomes: Evidence from school finance reforms.Quarterly Journal of Economics,131(1), 157–218.

246 E. A. Hanushek
Johnson, R. C., & Kirabo Jackson, C. (2017, June). Reducing inequality through dynamic comple-mentarity: Evidence from head start and public school spending. NBER Working Paper No.23489. Cambridge, MA: National Bureau of Economic Research.
Lafortune, J., Rothstein, J., & Schanzenbach, D. W. (2018). School finance reform and thedistribution of student achievement. American Economic Journal: Applied Economics, 10(2),1–26.
Mincer, J. (1970). The distribution of labor incomes: A survey with special reference to the humancapital approach. Journal of Economic Literature, 8(1), 1–26.
Mincer, J. (1974). Schooling, experience, and earnings. New York: NBER.Murnane, R. J., Willett, J. B., & Levy, F. (1995). The growing importance of cognitive skills inwage determination. Review of Economics and Statistics, 77(2), 251–266.
Puma,M., Bell, S., Cook, R., &Heid, C. (2010).Head start impact study: Final report. Washington,DC: Administration for Children and Families (January).
Puma, M., Bell, S., Cook, R., Heid, C., Broene, P., Jenkins, F., Mashburn, A., & Downer, J. (2012).Third grade follow-up to the Head Start impact study final report. Washington, DC: Office ofPlanning, Research and Evaluation, Administration for Children and Families, U.S. Departmentof Health and Human Services.
Rivkin, S. G. (2016). Desegregation since the Coleman Report: Racial composition of schools andstudent learning. Education Next, 16(2), 29–37.
U.S. Department of Education. (2018). Digest of education statistics, 2017. Washington, DC:National Center for Education Statistics.
U.S. Department of Education. (2019). Digest of education statistics 2018. Washington, DC:National Center for Education Statistics.
Vinovskis, M. A. (1999). Do federal compensatory education programs really work? A briefhistorical analysis of Title I and Head Start. American Journal of Education, 107(3), 187–209.
Eric Hanushek is the Paul and Jean Hanna Senior Fellow at the Hoover Institution of StanfordUniversity. He is a recognized leader in the economic analysis of education issues, and his researchhas had broad influence on education policy in both developed and developing countries. He is theauthor of numerous widely-cited studies on the effects of class size reduction, school account-ability, teacher effectiveness, and other topics. He was the first to research teacher effectivenessby measuring students’ learning gains, which formed the conceptual basis for using value-addedmeasures to evaluate teachers and schools, now a widely adopted practice. His recent book, TheKnowledge Capital of Nations: Education and the Economics of Growth summarizes his researchestablishing the close links between countries’ long-term rates of economic growth and the skilllevels of their populations. His current research analyzes why some countries’ school systemsconsistently perform better than others. He has authored or edited twenty-four books along withover 250 articles. He is a Distinguished Graduate of the United States Air Force Academy andcompleted his Ph.D. in economics at the Massachusetts Institute of Technology.

United States: The Uphill Schools’ Struggle 247
Open Access This chapter is licensed under the terms of the Creative Commons Attribution 4.0International License (http://creativecommons.org/licenses/by/4.0/), which permits use, sharing,adaptation, distribution and reproduction in any medium or format, as long as you give appropriatecredit to the original author(s) and the source, provide a link to the Creative Commons license andindicate if changes were made.
The images or other third party material in this chapter are included in the chapter’s CreativeCommons license, unless indicated otherwise in a credit line to the material. If material is notincluded in the chapter’s Creative Commons license and your intended use is not permitted bystatutory regulation or exceeds the permitted use, you will need to obtain permission directly fromthe copyright holder.