unitor annual report 1995 - hugin onlinereports.huginonline.com/641428.pdf · ·...
TRANSCRIPT
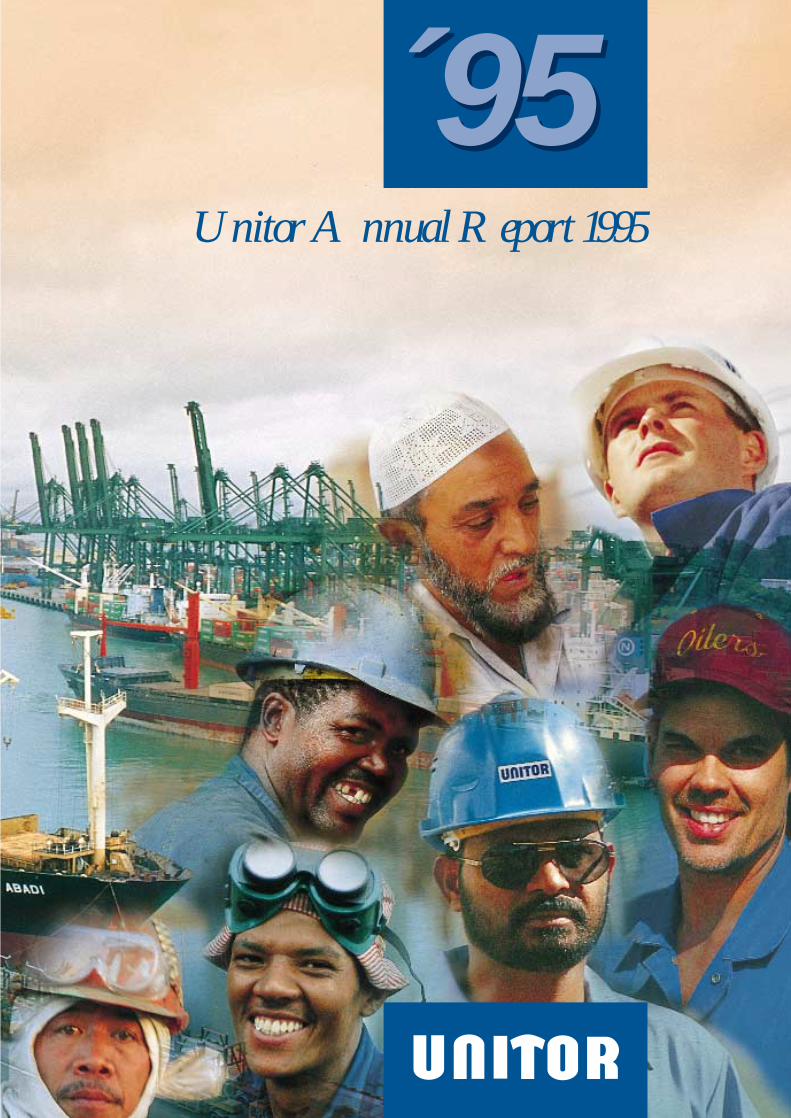
´95Unitor Annual Report 1995
´95
3 This is Unitor4-5 Unitor Group Facts in Brief
6 Highlights 19955-11 The Directors´ Report
12-13 Unitor is there -day and night14-15 60 years of Service16-17 Financial Statements Unitor Group
18 Analysis of Cashflow Unitor Group19-21 Accounting Principles
22 Financial Statements Unitor ASA23 Analysis of Cashflow Unitor ASA23 Audit Report
24-29 Investing in Unitor30-31 The Management Group
32 Organisation and Network33 Information Technology and Logistics
34-35 Marketing/Sales 36-41 Marine Products and Service42-48 Marine Systems and Contracting49-50 Safety and Environment53-68 Notes - Unitor Group/Unitor ASA
69 Definition of Key Ratios
Contents
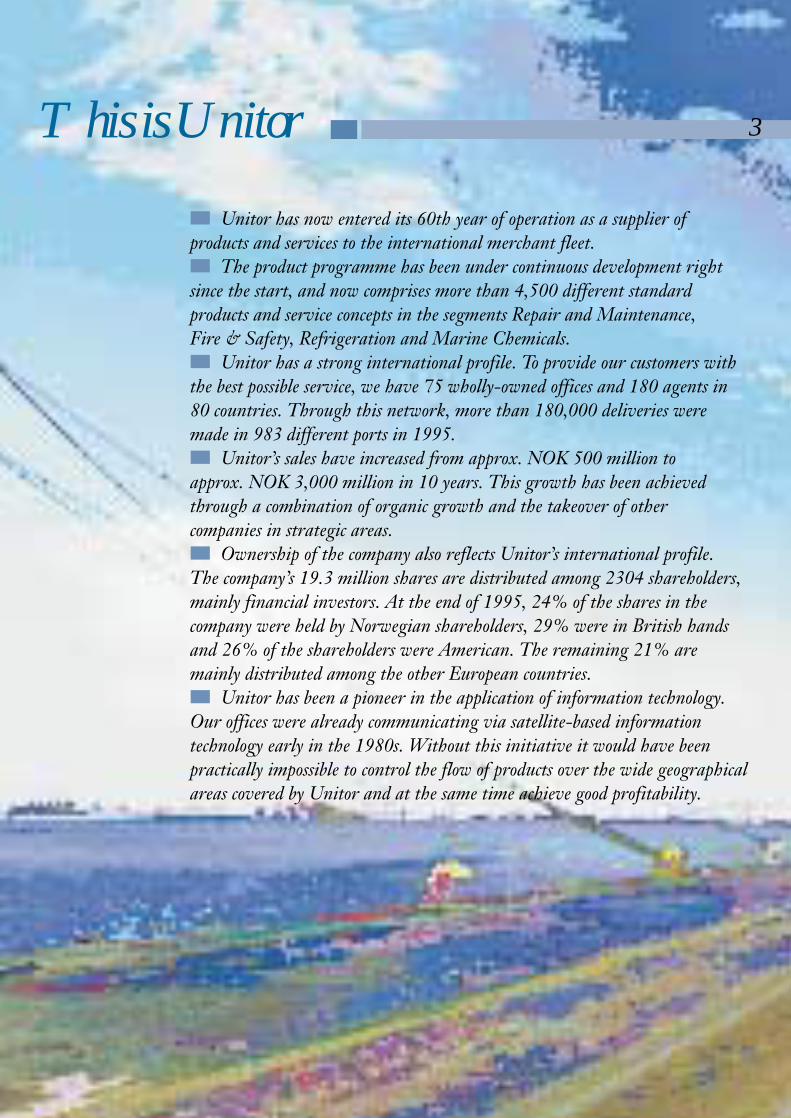
Unitor has now entered its 60th year of operation as a supplier of products and services to the international merchant fleet.
The product programme has been under continuous development rightsince the start, and now comprises more than 4,500 different standard products and service concepts in the segments Repair and Maintenance, Fire & Safety, Refrigeration and Marine Chemicals.
Unitor has a strong international profile. To provide our customers withthe best possible service, we have 75 wholly-owned offices and 180 agents in 80 countries. Through this network, more than 180,000 deliveries were made in 983 different ports in 1995.
Unitor’s sales have increased from approx. NOK 500 million to approx. NOK 3,000 million in 10 years. This growth has been achievedthrough a combination of organic growth and the takeover of other companies in strategic areas.
Ownership of the company also reflects Unitor’s international profile. The company’s 19.3 million shares are distributed among 2304 shareholders,mainly financial investors. At the end of 1995, 24% of the shares in the company were held by Norwegian shareholders, 29% were in British handsand 26% of the shareholders were American. The remaining 21% are mainly distributed among the other European countries.
Unitor has been a pioneer in the application of information technology.Our offices were already communicating via satellite-based information technology early in the 1980s. Without this initiative it would have beenpractically impossible to control the flow of products over the wide geographicalareas covered by Unitor and at the same time achieve good profitability.
This is Unitor 3
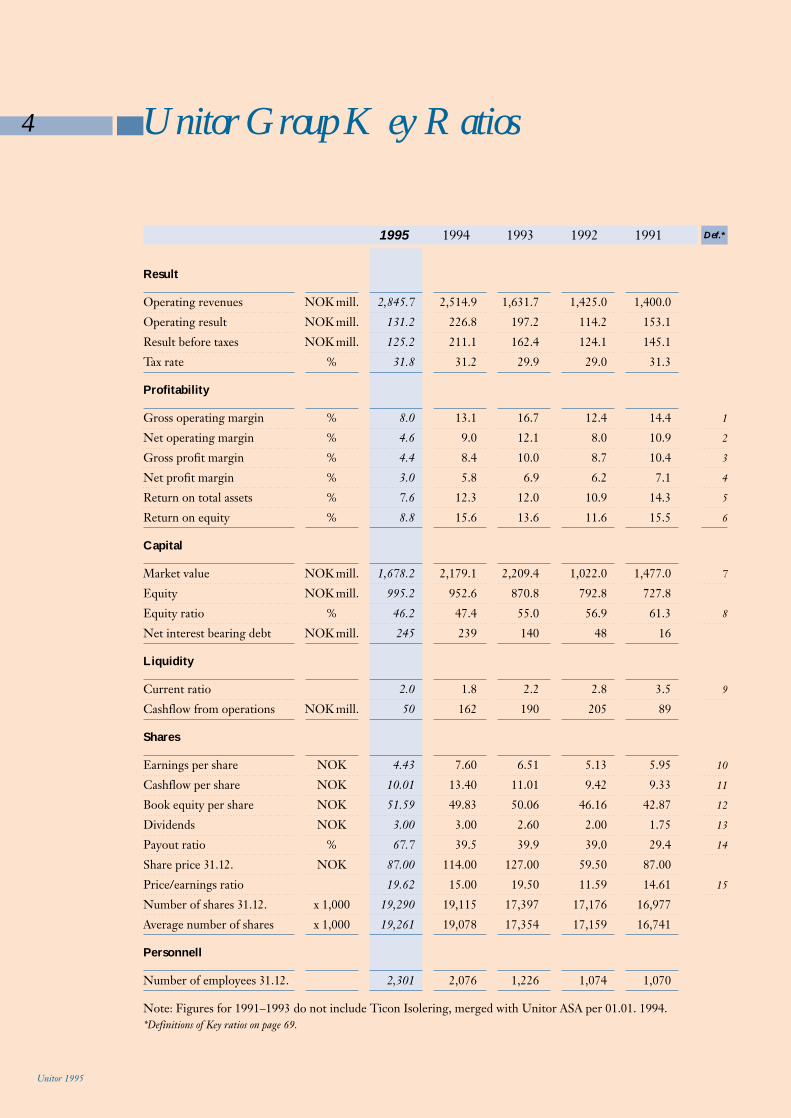
4 Unitor Group Key Ratios
Unitor 1995
1995 1994 1993 1992 1991 Def.*
Result
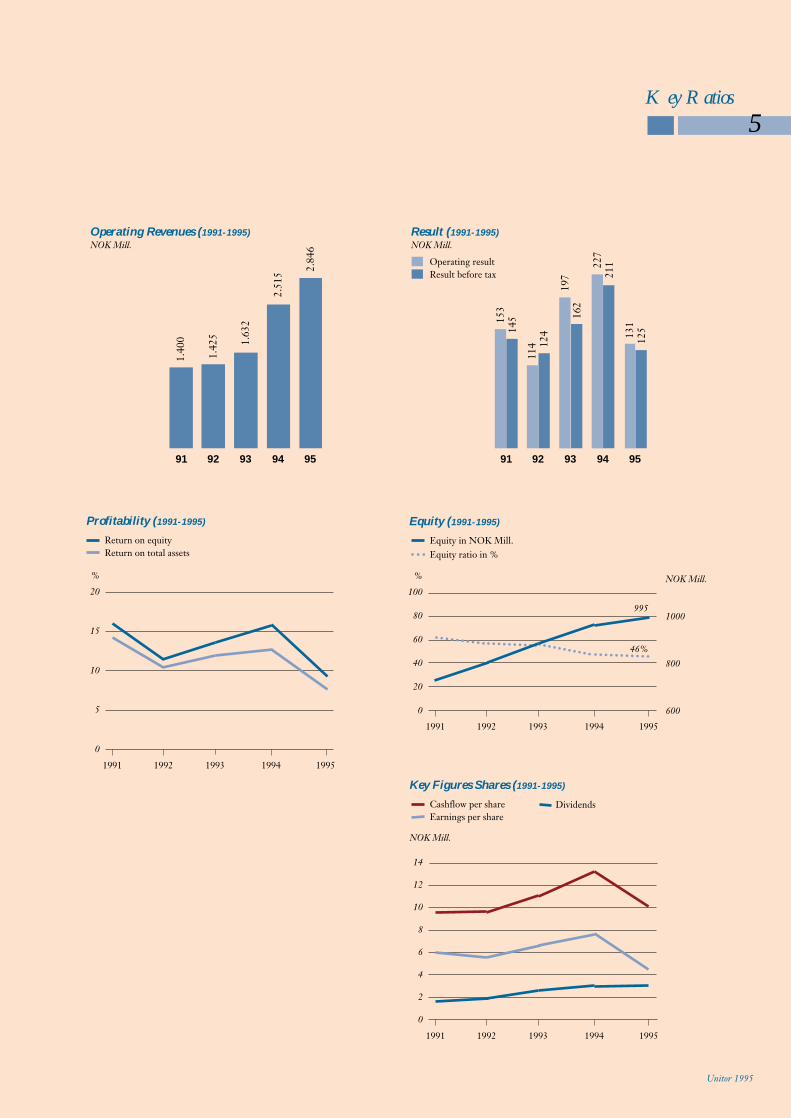
Operating revenues NOK mill. 2,845.7 2,514.9 1,631.7 1,425.0 1,400.0
Operating result NOK mill. 131.2 226.8 197.2 114.2 153.1
Result before taxes NOK mill. 125.2 211.1 162.4 124.1 145.1
Tax rate % 31.8 31.2 29.9 29.0 31.3
Profitability
Gross operating margin % 8.0 13.1 16.7 12.4 14.4 1
Net operating margin % 4.6 9.0 12.1 8.0 10.9 2
Gross profit margin % 4.4 8.4 10.0 8.7 10.4 3
Net profit margin % 3.0 5.8 6.9 6.2 7.1 4
Return on total assets % 7.6 12.3 12.0 10.9 14.3 5
Return on equity % 8.8 15.6 13.6 11.6 15.5 6
Capital
Market value NOK mill. 1,678.2 2,179.1 2,209.4 1,022.0 1,477.0 7
Equity NOK mill. 995.2 952.6 870.8 792.8 727.8
Equity ratio % 46.2 47.4 55.0 56.9 61.3 8
Net interest bearing debt NOK mill. 245 239 140 48 16
Liquidity
Current ratio 2.0 1.8 2.2 2.8 3.5 9
Cashflow from operations NOK mill. 50 162 190 205 89
Shares
Earnings per share NOK 4.43 7.60 6.51 5.13 5.95 10
Cashflow per share NOK 10.01 13.40 11.01 9.42 9.33 11
Book equity per share NOK 51.59 49.83 50.06 46.16 42.87 12
Dividends NOK 3.00 3.00 2.60 2.00 1.75 13
Payout ratio % 67.7 39.5 39.9 39.0 29.4 14
Share price 31.12. NOK 87.00 114.00 127.00 59.50 87.00
Price/earnings ratio 19.62 15.00 19.50 11.59 14.61 15
Number of shares 31.12. x 1,000 19,290 19,115 17,397 17,176 16,977
Average number of shares x 1,000 19,261 19,078 17,354 17,159 16,741
Personnell
Number of employees 31.12. 2,301 2,076 1,226 1,074 1,070
Note: Figures for 1991–1993 do not include Ticon Isolering, merged with Unitor ASA per 01.01. 1994.*Definitions of Key ratios on page 69.
Key Ratios
5
Unitor 1995
91 92 93 94 95
227
211
114 12
4
197
162
153
145
131
125
Result (1991-1995)
NOK Mill.
Operating resultResult before tax
Profitability (1991-1995)
Return on equityReturn on total assets
91 92 93 94 95
2.51
5
1.42
5 1.63
2
1.40
0
2.84
6
Operating Revenues (1991-1995)
NOK Mill.
20
15
10
5
0
1991 1992 1993 1994 1995
%
Key Figures Shares (1991-1995)
Cashflow per shareEarnings per share
14
12
10
8
6
4
2
0
1991 1992 1993 1994 1995
Dividends
NOK Mill.
Equity (1991-1995)
Equity in NOK Mill.Equity ratio in %
100
80
60
40
20
0
1000
800
600
1991 1992 1993 1994 1995
%
995
46%
NOK Mill.
6 Highlights 1995
Sales of marine chemicals increased in volume by 22% in 1995. This increase in sales was the result of Unitor’s most ambitious marketing campaign so far.
Sales of Unitor’s fire extinguishing systems increased by 42%. This increase can be attributed togrowth in the overall market resulting from the phasing out of Halon in combination with an increased share of the market.
Unitor’s administration moved into the company’s new head office at Maritim in Oslo together with the recently acquired companies Ticon Isolering and GF Marine.
The industrial section of Corroless was sold in August 1995. Unitor’s engagement in paint and corrosion protection is therefore now concentrated on special products for use on board ships.
The Industry & Offshore Division of Ticon Isolering was sold at the turn of the year 1995/96 toRheinhold & Mahla Isolering AS. Unitor is now focusing on the sections of earlier Ticon Isolering whichhave high growth potential internationally, particularly in the marine market.
The takeover of Dansystem Vejle AS – manufacturers of prefabricated refrigeration and insulationpanelling, has established Unitor as the major supplier of refrigerated and cold storage holds in theScandinavian market. This acquisition is a logical further development of Ticon’s Coldstore Divisionwhich is preparing the introduction of prefabricated refrigerated and cold storage holds on board ships.
The takeover of the New Orleans based fire & safety service company SOTEC has considerablystrengthened Unitor’s position as a supplier of fire & safety services and fire prevention systems to the marine sector of the American market.
Unitor opened its first office in the People’s Republic of China in May 1995. The office is inShanghai, and is primarily engaged in the marketing of Unitor products to Chinese shipyards. Response from the Chinese market has been good, and by the end of 1995, contracts had been concluded for more than NOK 30 million.
Unitor 1995
1,598 million in 1994) and proj-ects and production in the amountof NOK 1,214 million (NOK917 million in 1994).
Operating profit for theUnitor Group totalled NOK 131million compared with NOK 227million in 1994. A reduction in theAverage exchange rate for the USdollar from 7.07 in 1994 to 6.35 in1995affected operating profits neg-atively by an estimated NOK 63million. At the same time, operat-ing profit for the contracting busi-ness amounted to only NOK 8million in 1995 compared withNOK 32 million in 1994.Additionally, an allocation of NOK
joined the Group in recent yearsand the move of the Unitor headoffice was completed in 1995.
Operating revenues and result
Total sales for the Unitor Groupamounted to NOK 2,846 million in1995 compared with NOK 2,515 in 1994. This represents an increase of 13.2%. Adjusted forthe acquisition of companies andprice and fluctuations in currencyexchange relationships betweenthe two years, Group volumegrowth is 11.6%.
Sales are distributed betweenproducts and service in the amountof NOK 1,632 million (NOK
Unitor’s result for 1995 was negatively affected by the steepdrop in the exchange rate for USdollars during the period combin-ed with weaker than estimatedearnings in contracting andproject-related business.
Despite the weak overall result, several areas showed positive development during the course of the year. In Unitor’s traditional business and specifically the core areas of marine chemicals and fire extingu-ishing systems, we achieved substantial growth in volume andmarket shares. The task of integrating companies which
7The Directors’ Report
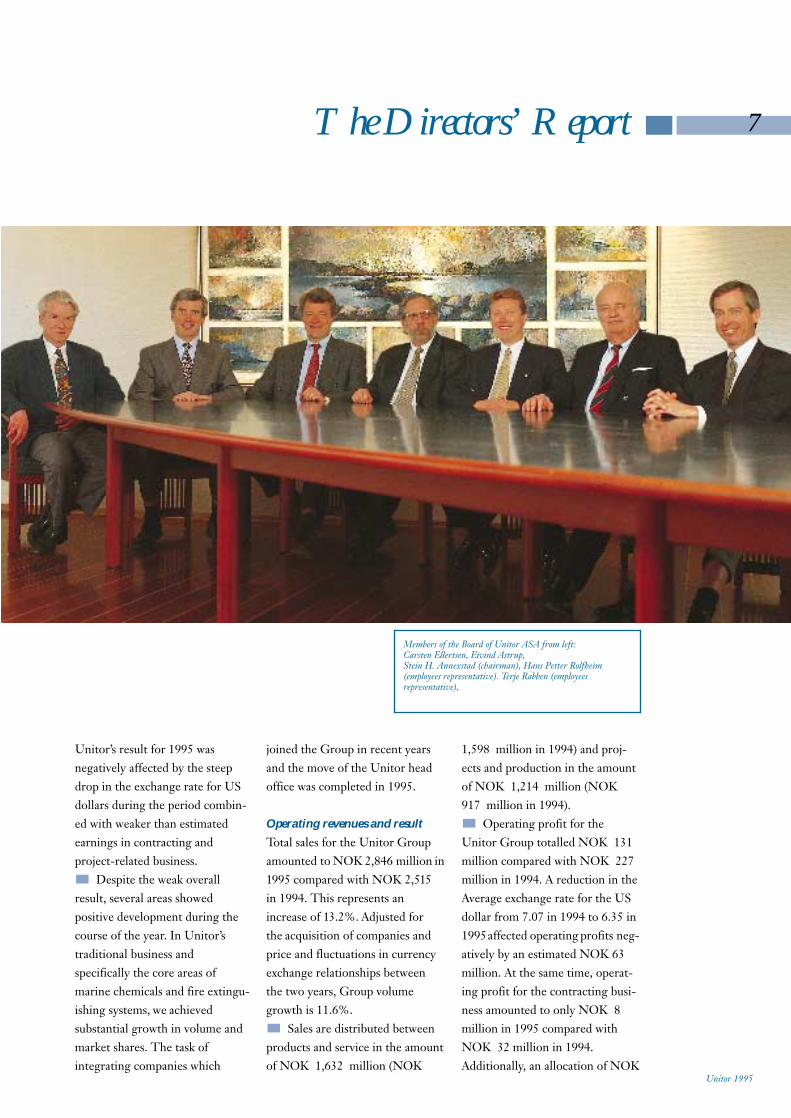
Members of the Board of Unitor ASA from left:Carsten Ellertsen, Eivind Astrup,Stein H. Annexstad (chairman), Hans Petter Rolfheim(employees representative). Terje Rabben (employees representative),
Unitor 1995

10 million was made during thefourth quarter for the implement-ation of an adopted restructuringprogramme at head office.
Net financial expenses amount-ed to NOK 6 million comparedwith NOK 16 million in 1994.The currency hedging contracts initiated at the end of 1994 in order to secure operating profits inNorwegian kroner in 1995 provid-ed a gain of NOK 26 million, compared with a gain of NOK 7million in 1994. Net interest costsamounted to NOK 24 millioncompared with NOK 19 million in1994. This change is mainly attrib-utable to acquisitions in 1994 and1995 and to the financing ofgrowth in the Unitor Group.
Pre-tax profit for the UnitorGroup was NOK 125 million
compared with NOK 211 millionin 1994. The principle reason forthis decline in profit is to be foundin the appreciably lower US dollarexchange rate in 1995 in comparis-on with 1994 (resulting in an effectof approx. NOK 44 million), inaddition to weaker earnings in
totalled NOK 210 million (NOK198 million in 1994). Of this totalfigure, investments in goodwillamounted to NOK 55 million, buildings NOK 39 million and gascylinders NOK 41 million.
Total Group capital increasedfrom NOK 2,011 million in 1994to NOK 2,153 million as at 31.December 1995, largely resultingfrom an increase in accountsreceivable and inventories. The increase reflects growth in the traditional business areas and incre-ased sales in contracting businesstowards the end of the year. In1995, through the Group’s 90%holding in K/S Team Heina,Unitor sold the product tankerM/T Team Heina. This sale reduc-ed total Group capital in theamount of NOK 170 million.
Net interest-bearing debt inc-reased by NOK 6 million in 1995from NOK 239 million in 1994 toNOK 245 million as at 31 December 1995. Adjusted forthe sale of M/T Team Heina, theincrease is NOK 161 million and ismainly connected with the financ-ing of Group acquisitions in 1995,investments in buildings and thefinancing of Unitor Group growth.Net interest-bearing debt is approx.12.5% of the total Unitor Groupcapital as at 31 December 1995compared with 13% at the end of 1994.
The Unitor Group’s interest-bearing debt was refinanced duringthe course of 1995. Through a loansyndicate comprising 7 national andinternational finance institutions, along-term loan of USD 25 millionwas established in addition to a
contracting business (effect NOK24 million). Additionally, NOK 10million was allocated for restruct-uring. The substantial growth inproject sales in the network has notresulted in an equivalent growth inearnings, due in particular to aproblem of limited duration in thesupply of parts and components tofire extinguishing projects.
Earnings per share were NOK4.43, a decline from 7.60 in 1994.The directors propose that divi-dend be maintained at NOK 3.00per share.
The currency situation
An estimated 55% of UnitorGroup sales within the network ispriced in US dollars, while onlyone-third of the costs are in thesame currency. This monetary situation is the cause of consider-able fluctuations in results when-ever there is major exchange rate imbalance. It has been Unitor’sstrategy in recent years to maintaina hedging policy whereby the anticipated total net positive cashflow in US dollars for the comingyear is sold forward prior to thestart of the financial year. Thisstrategy was modified somewhat in1995 and currently hedging con-tracts are appraised throughout theperiod based on specific appraisalsof acceptable exchange rate levels. As at 31 December 1995, USD 35million has been sold forward oncontracts maturing during the firsthalf of 1996 at an average exchange rate of 6.42.
The capital situation
Unitor Group investments in 1995
8
The Directors’Report
91 92 93 94 95
114 12
4
197
162
153
145
227
211
131
125
ResultNOK Mill.
Operating resultResult before tax
Unitor 1995
the principle of replacing petrol-eum-based products with waterbased products - the petroleum base being replaced byvarious tensides and extracts from citrus fruits.
Unitor has received several international awards for its environ-mental therapy work and is to dayincluded in the investment port-folio of several “green” funds.
More information on personnel and the environment isto be found in the last two pages of the report.
Directors’ fees and shares owned by directors, the chief executive officer and the auditorare specified in Note 26 and in thesection ‘Investments in Unitor’.
The market
During the course of the last 10years, there has been an annualgrowth of 2.5 to 4 percent in sea-borne transport. This growth willcontinue in the years ahead as a result of the anticipated growth inworld trade and because seabornetransport is the most favourable alternative from the point of viewof cost as well as being the most environmentally friendly form of transport.
Unitor deals in products andservices which are virtually indisp-ensable. The growth in the num-ber of ships in operation and in sea-borne transport in general is there-fore of major importance for thedevelopment of the marine market.
Other factors which influencethe market positively include inc-reasing international demands with regard to safety on board and
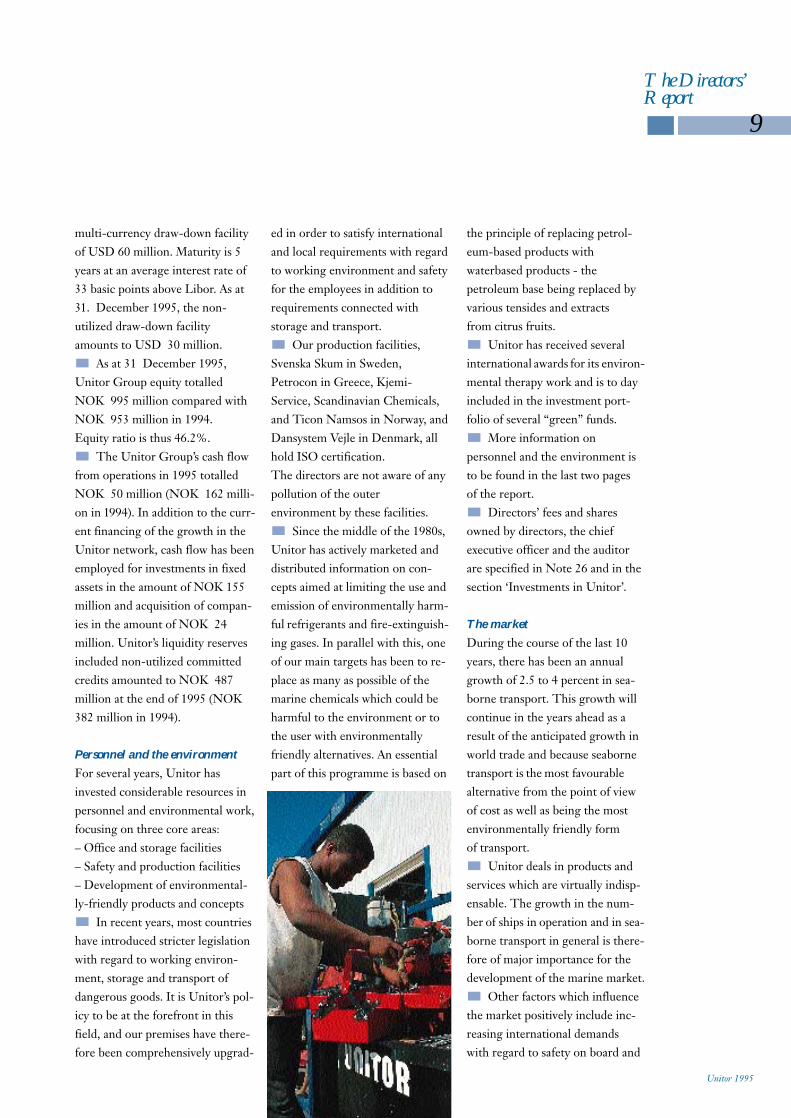
ed in order to satisfy internationaland local requirements with regardto working environment and safetyfor the employees in addition torequirements connected with storage and transport.
Our production facilities,Svenska Skum in Sweden,Petrocon in Greece, Kjemi-Service, Scandinavian Chemicals,and Ticon Namsos in Norway, andDansystem Vejle in Denmark, allhold ISO certification. The directors are not aware of anypollution of the outer environment by these facilities.
Since the middle of the 1980s,Unitor has actively marketed anddistributed information on con-cepts aimed at limiting the use andemission of environmentally harm-ful refrigerants and fire-extinguish-ing gases. In parallel with this, oneof our main targets has been to re-place as many as possible of themarine chemicals which could beharmful to the environment or tothe user with environmentally friendly alternatives. An essentialpart of this programme is based on
multi-currency draw-down facilityof USD 60 million. Maturity is 5years at an average interest rate of33 basic points above Libor. As at31. December 1995, the non-utilized draw-down facilityamounts to USD 30 million.
As at 31 December 1995,Unitor Group equity totalledNOK 995 million compared withNOK 953 million in 1994. Equity ratio is thus 46.2%.
The Unitor Group’s cash flowfrom operations in 1995 totalledNOK 50 million (NOK 162 milli-on in 1994). In addition to the curr-ent financing of the growth in theUnitor network, cash flow has beenemployed for investments in fixedassets in the amount of NOK 155million and acquisition of compan-ies in the amount of NOK 24 million. Unitor’s liquidity reserves included non-utilized committedcredits amounted to NOK 487million at the end of 1995 (NOK382 million in 1994).
Personnel and the environment
For several years, Unitor has invested considerable resources inpersonnel and environmental work,focusing on three core areas:– Office and storage facilities– Safety and production facilities– Development of environmental-ly-friendly products and concepts
In recent years, most countrieshave introduced stricter legislationwith regard to working environ-ment, storage and transport ofdangerous goods. It is Unitor’s pol-icy to be at the forefront in this field, and our premises have there-fore been comprehensively upgrad-
9
The Directors’ Report
Unitor 1995

The fire & safety company SOTEC Inc., the refrigeration insulation company DansystemVejle AS, and the air-conditioningcompany GF Marine AS, also joined the Unitor Group in 1995.
Concurrently with these majoracquisitions, numerous local ser-vice companies operating in thesame business areas were also takenover by the Unitor Group.
There are several motives behind this strategy. The marketfor fire & safety and refrigeration systems will have growth potentialfor many years ahead as a result ofthe growth in the shipbuildingmarket. The phasing out of thefire-extinguishing gas Halon andharmful refrigerants have furtheraccentuated this growth. Secondly,Unitor wishes to present a completeoffer to customers, and it is therefore our objective that thesystems and projects we supply tonewbuildings are linked with long-term service agreements tobe effectuated by service stations in the Unitor network when thevessels become operative.
The positioning of Unitor as asystem and project supplier in thefield of fire & safety and refrigerat-ion has not been merely an object-ive in itself – it is also an importanttool for creating increased activityin the Unitor service concept.
Acquisitions in fire & safetyand refrigeration have providedUnitor with important technolog-ies and market shares. Most of these companies are now integ-rated in Unitor, and our goal forthe years ahead is to create furthergrowth by marketing these prod-
the current anxiety concerning thepossibility of environmental disasters in conjunction with oldships in poor technical condition.This has resulted in stricter inter-national legislation on technicalstandards and intensified controlactivities on the part of the different port authorities. The consumption of maintenanceand safety products is therefore on the increase.
The market for newbuildingsis also in a period of growth. Theincrease in seaborne transport re-quires more ships in operation andat the same time replacements arerequired for the oldest ships in themerchant fleet. The average age ofships has now reached 14.2 yearsand even if shipbuilding is intensi-fied considerably in the years ahead, the merchant fleet willcontinue to operate old ships wellinto the next century.
Strategy and future prospects
During the course of the last dec-ade, Unitor’s growth has been based on a strategy which givespriority to organic growth comb-ined with the acquisition of com-panies in selected business areas.
During the latter part of the1980s, acquisitions were concent-rated on the chemical sector andcompanies such as Perolin Ltd.,Gamlen Inc., Rochem AG,Corroless Int. Ltd., ScandinavianChemicals AS, and Kjemi-ServiceAS joined the Unitor Group. All companies with the exceptionof Kjemi-Service and ScandinavianChemicals, which produces ourchemicals, are integrated in
Unitor. Our reason for retainingthese entities as individual companies is that approx. 50% ofthe sales take place in markets other than those covered by theUnitor network.
As a consequence of the devel-opment of chemicals as a businessarea, we now have a profitable bus-iness in chemical sales. Total salesare approx. NOK 500 million andcover approx. 30% of the internat-ional market for marine chemicals.
During the 1990s, Unitor’smain strategy has been to positionthe company as a leading supplierof fire & safety services and refrig-eration systems. Strategically imp-ortant companies such as SvenskaSkum AB, Ginge-Kerr Group,and Ticon Isolering AS, all becamepart of the Unitor Group in 1994.
The Directors’Report
10
Unitor 1995
ucts through the worldwide Unitornetwork. Additionally, we will beable to achieve lower costs as a result of higher volume and improved margins.
In order to intensify efforts inthe marine markets and on activiti-es providing good synergy effectswithin the Unitor network, Unitorsold the Industry & OffshoreDivision in Ticon Isolering toRheinhold & Mahla AS (RMI)with effect from 2 January 1996.This division recorded sales ofNOK 293 million in 1995.Payment is in the form of sharesand at the time of assignmentUnitor ASA held a 50% share inthe company. Over a period of maximum 5 years, R&MSchiffsisolierung und -ausbauGmbH, the previous parent com-pany of RMI, will take over all theshares in the company. The price will be dependent on the company’s results during the period. The sale of the Industry &Offshore Division has reduced theUnitor workforce by 520 persons.As a result of this transaction, 13% of the company’s shares were
of Unitor as an international corporation. This will contributetowards better utilization of ourestablished infrastructure and improved profitability through thesale of more quality products at the correct price level.
The combination of the manypositive trends in the developmentof the market with the basicstrategies followed by Unitorshould, in the opinion of the directors, create good opport-unities for improved profitabilityand growth in earnings per share.
The directors wish to expresstheir thanks to all Unitor employees for their hard work and dedication throughout the year.
assigned with effect from 3 January 1996.
There is also appreciablegrowth potential for Unitor withinthe traditional distribution andlogistic sections of Unitor’s busi-ness. In the years ahead thereforemajor sections of the “hardware”products which are today suppliedby local ship chandlers, will bemarketed through the Unitor network. The Unitor businessconcept, which is to supply a standardized product programmeand to purchase in volume directlyfrom manufacturer for salethrough a worldwide network, is aforward-looking and advantageousstrategy which has been shown tofunction through the development
The Directors’Report
11
The Board’s proposal for application of net profit and equity transfers in Unitor ASA:
Dividends 57,868,953
Legal reserve 11,678,875
Group contribution 17,000,000
Reversed temporary restricted fund (11,183,868)
Retained earnings (4,150,914)
Total 71,213,046
Unitor 1995
Oslo 14. March 1996
Stein H. AnnexstadChairman
Eivind Astrup Carsten Ellertsen
Christian Falck-PedersenTerje Rabben B.G. Nilson
Hans Petter Rolfheim
Karsten HoumManaging Director
12 Unitor is there – day and night
There is one aspect in particularthat distinguishes Unitor from other corporations - and that is ourunique international network.
Every hour of the day, Unitorsupplies products and service to theinternational merchant fleet frombases in 983 ports in 74 countriesall over the world. Unitor is there-fore highly internationalized desp-ite the fact that on an internationalscale we are a small company with aworkforce of 2000 and a turnoverof NOK 3 billion.
Unlike most other organizat-ions, Unitor does not have a homemarket which must first be attend-ed to before an internationalizationprocess can be implemented. Rightfrom the start, Unitor’s businessconcept has always been based oninternational presence.
For Unitorians therefore, there isnothing mystical or exotic aboutcommunicating with far-off partsof the world or even opening anew office in a country with an un-familiar culture. For Unitorians,internationalization is part andparcel of daily life, and we therefo-re use less time and resources onthe process than many others,whether we are establishing centralbases in the West or in locationssuch as Cuba or Vladivostok.
For almost 15 years, all our offices have been in communica-tion with head office and with eachother by means of satellite-basedinformation technology. This has transformed internationalcommunication into an everydayprocedure and made it possible toexercise a level of control which isin many ways better than that ofmany local companies of the samesize. As manager of the organizat-ion I receive a report every morning showing the precedingday’s total invoiced amount for ourworldwide operations, the figurefor the month so far, and the margin - all compared with theequivalent figures for the threepreceding months. At Unitor there is no need to waituntil “next month” to find out ifwe are doing well or not.
In the course of the last decade, we have developed an IT and computer system which controls the entire flow of goods,all our stocks, and all our transact-ions with our customers. We monitor all products with regard to both development ofmargins and life cycle.
Unitor 1995
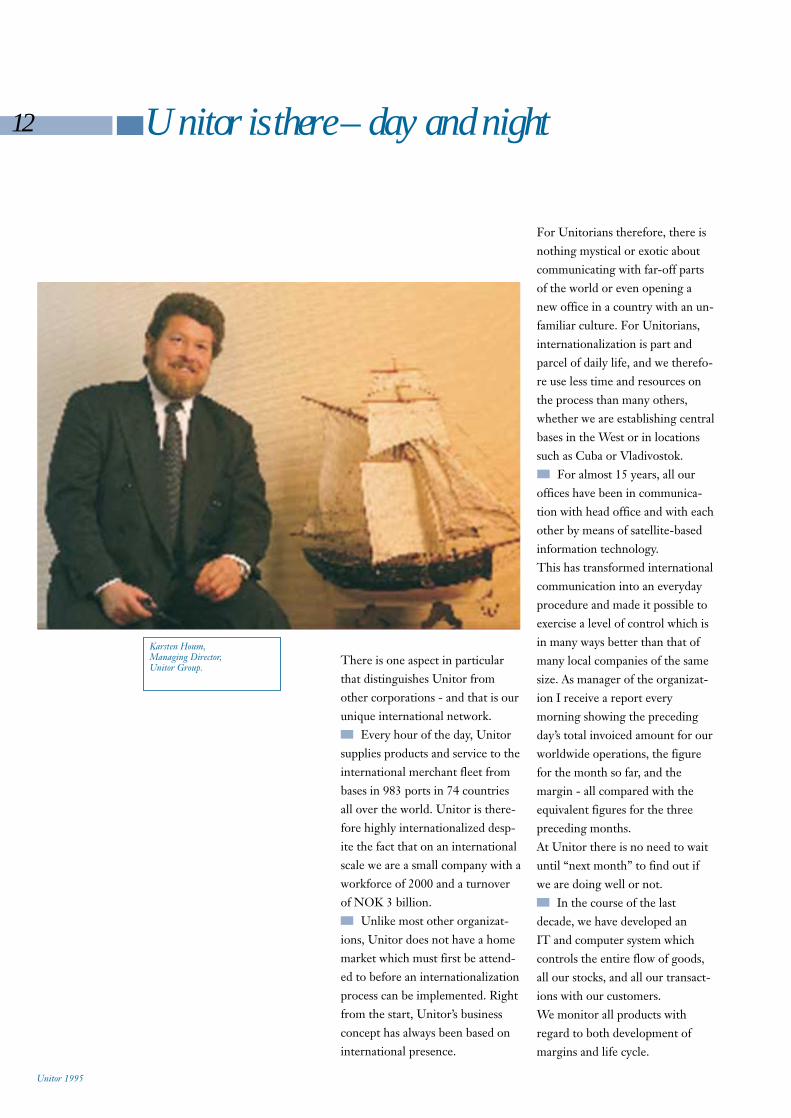
Karsten Houm,Managing Director,Unitor Group.
13
We do not just measure the profitability of products, we alsorelate the figures to geographicallocation, to customer and to ship,so that we can base all strategicand operational decisions on solid facts.
We have now been through adifficult year involving a move ofhead office and the integration ofmajor acquired companies, provid-ing us with a solid platform forfurther growth in the marine new-buildings market. Our most press-ing task now is to again focusattention on Unitor’s profitabilitylevel to ensure that the growth insales of recent years will again provide us with a satisfactory level of earnings.
Secondly, we will give priorityto the work of marketing a widerrange of products through our
60 Years of Service
Unitor 1995
After 10 years as chief execut-ive of Unitor, I have a very positiveoutlook for the future. With ourunique network, a financiallystrong balance sheet, and a highlyqualified and dedicated organizat-ion, Unitor has everything that isrequired to create continuedgrowth with good profitability.
unique international network. The opportunities are manifold,because at the present time Unitorsupplies only a small proportion ofthe products used daily by a steadily growing internationalmerchant fleet.
On May 26 1996, Unitor celebrates 60 years of service to the marine industry.
NAG A/S, as the company wasinitially called, was founded onMay 26 1936 by Mr. EinarTorbjørnsen, who believed that theNorwegian merchant fleet engaged in foreign trade needed asupplier of welding equipment,consumables, and oxygen/acetyle-ne gases. NOK 4,000 of share capital was raised, and the stagewas set for an international servicecompany with an innovative idea.
Welding work in those dayswas done in shipyards, and the cost
was high. Mr. Torbjørnsen and hiscolleagues were convinced that ifthe chief engineer had weldingequipment onboard, he could dealwith a lot of repairs while the shipwas underway. The cost of theequipment would thus be quickly recovered.
If a vessel were to have weldingequipment onboard, it was reas-oned, the crew should be trained inwelding and supplied with hand-books and literature on the subject.In addition, the shipowners wouldneed secure supplies of welding gases during a voyage. It shouldalso be possible to swap empty
cylinders for full units. This raisedthe task of establishing depots ofsuch cylinders in the various portsaround the world. In its first fullyear of business, Unitor was already getting heavily involvedwith the logistics of stockpoints,port statistics, freight costs, insurance and customs dues.
By 1939, ships could purchasewelding gases from NAG at 18ports worldwide. In 1943, thecompany name was changed toUnitor AS. To begin with, Unitorfocused on introducing gas weldingto the Norwegian fleet, but electricwelding became increasingly
prevalent during the 1950s. Threeto four week welding courses onboard ships attracted consider-able attention. By 1959, hundredsof seamen had been trained byUnitor. By the mid-nineties, thenumber of seamen trained atUnitor’s welding schools in Manila,Piraeus and Oslo numbered in the thousands.
During the fifties, the distrib-ution network was expanded andthe number of agents and depotsincreased. Unitor opened its firstbranch office in Rotterdam in1964. In the same year, the firstproducts unrelated to weldingwere introduced. By 1968, therewere 80 agents, plus branch officesin New York, London, Liverpool,and Rotterdam. In 1968, UnitorShips Service A/S became thecompany’s official name. This wasdone to reflect the importance ofservice and to emphasize the
60 yearsof Service
14
Unitor 1995
In 1968, there were 57 emp-loyees, and Unitor had a turnoverof NOK 12.9 mill. The Companygrew by an average of 30% peryear, reaching NOK 511 mill. in1981. The product line had expanded to include refrigerants,fire-fighting systems, rescue equipment and more. From 1971to 1980, the company increasedfrom 13 to 55 branch offices. 160 agents served ports where no office was established.
The seventies and eightieswere years of changing fortunesfor the industrialized world, theshipping industry, and thereby alsofor Unitor. Sparked off by the oilcrisis in 1974, the worldwideslump in the seventies continuedinto the mid-eighties. Unitor continued to grow quickly, but reorganisation, product improve-ments and cost reductions werenecessary in order to survive.
Company’s mission: to concent-rate on marketing of goods andservices to the international merchant fleet. This shift in focusto the international fleet sparkedoff a period of high growth.
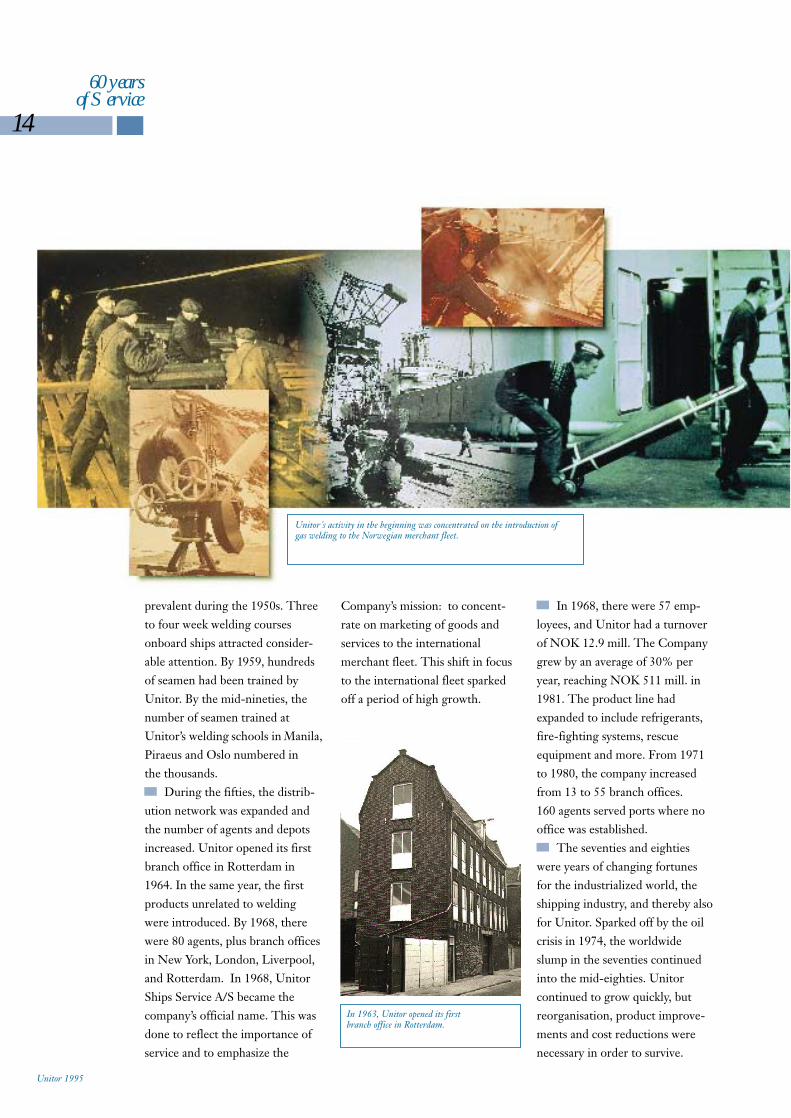
In 1963, Unitor opened its firstbranch office in Rotterdam.
Unitor´s activity in the beginning was concentrated on the introduction ofgas welding to the Norwegian merchant fleet.
In 1987, Unitor had 520 employees, 50 branch offices, and160 agents. After1985, a combinat-ion of substantial scrapping, lower oil prices and improved international cooperation in theworld economy provided a basisfor a more balanced and stablemarket. About this time, Unitorbegan to achieve success in firefighting systems for new vessels.These were essentially technicalsales and marked the start ofUnitor’s activities in the design andbuilding phase as a means of offering more complete service to the shipowners and yards.
The first half of the ninetieshave been years of continued rapidgrowth. Strategic acquisitions havebeen an important part of thisprocess. Smaller local companiesspec-ializing in central Unitor pro-duct areas like fire and safety, refrigeration and marine chemicals were acquired in many countries. Ticon Isolering was one of these, merging with Unitor in 1994. As a specialist insulation contractor, the addition of Ticonstrengthened Unitor’s capabilityand competence in the new-building sector. Considerable succ-ess has been made in integratingthe acquired companies and their
15
60 yearsof Service
product ranges into the Unitor network.
The last few years have alsobeen a time of goal-oriented development of new products andservices and applying new technol-ogy. The Unitor Oil Bag, for exam-ple, provides temporary storage forspill oil and is convenient to storein port as well as onboard a vessel.Unitor has also introduced many“green” chemical products whichare as effective, and in most casescost less, than the products they replace.
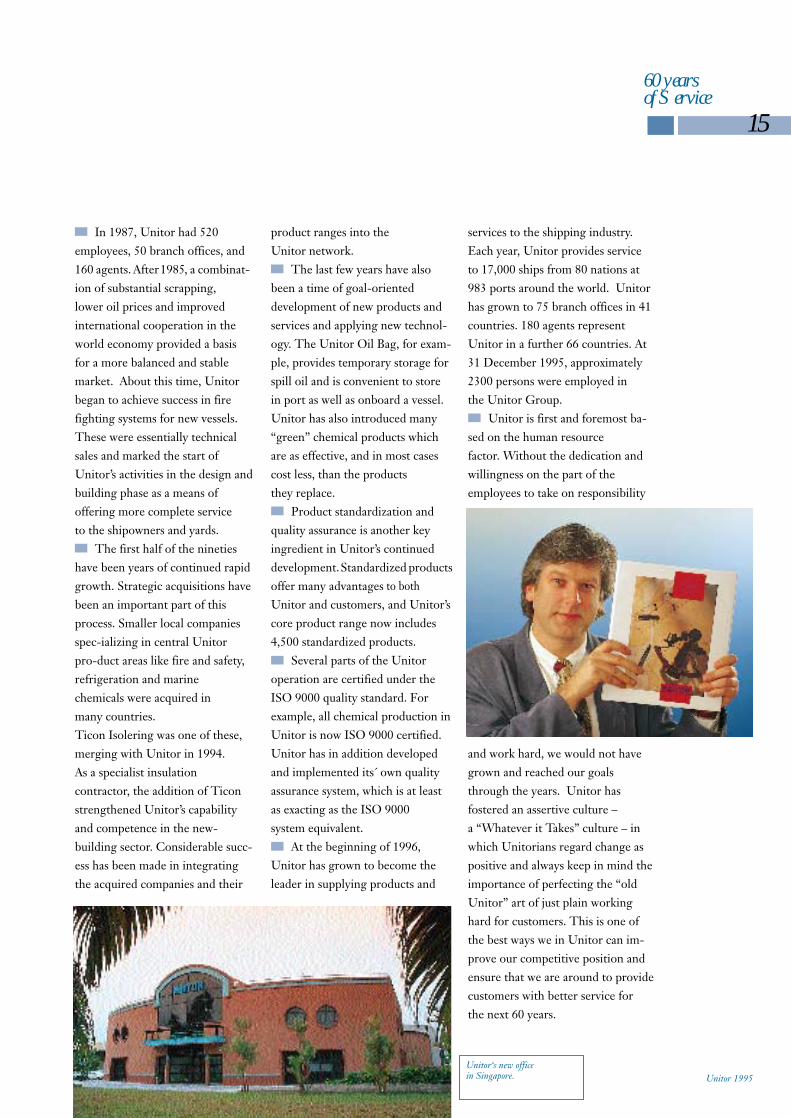
Product standardization andquality assurance is another key ingredient in Unitor’s continueddevelopment.Standardized productsoffer many advantages to bothUnitor and customers, and Unitor’score product range now includes4,500 standardized products.
Several parts of the Unitor operation are certified under theISO 9000 quality standard. Forexample, all chemical production inUnitor is now ISO 9000 certified.Unitor has in addition developedand implemented its´ own quality assurance system, which is at leastas exacting as the ISO 9000 system equivalent.
At the beginning of 1996,Unitor has grown to become the leader in supplying products and
Unitor 1995
services to the shipping industry.Each year, Unitor provides serviceto 17,000 ships from 80 nations at983 ports around the world. Unitorhas grown to 75 branch offices in 41countries. 180 agents representUnitor in a further 66 countries. At31 December 1995, approximately2300 persons were employed in the Unitor Group.
Unitor is first and foremost ba-sed on the human resource factor. Without the dedication andwillingness on the part of the employees to take on responsibility
and work hard, we would not havegrown and reached our goalsthrough the years. Unitor has fostered an assertive culture – a “Whatever it Takes” culture – inwhich Unitorians regard change aspositive and always keep in mind theimportance of perfecting the “oldUnitor” art of just plain workinghard for customers. This is one ofthe best ways we in Unitor can im-prove our competitive position andensure that we are around to providecustomers with better service for the next 60 years.
Unitor‘s new officein Singapore.
16 Unitor GroupProfit and Loss Statement 01.01-31.12
Unitor 1995
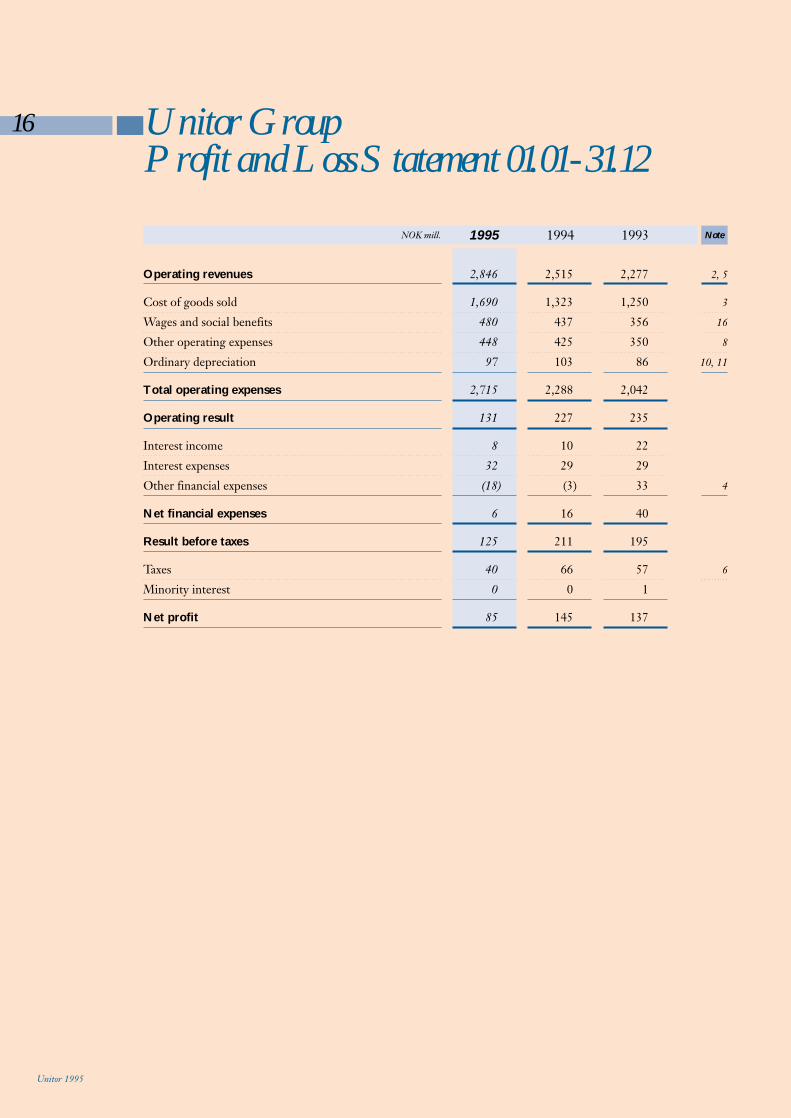
NOK mill. 1995 1994 1993 Note
Operating revenues 2,846 2,515 2,277 2, 5
Cost of goods sold 1,690 1,323 1,250 3
Wages and social benefits 480 437 356 16
Other operating expenses 448 425 350 8
Ordinary depreciation 97 103 86 10, 11
Total operating expenses 2,715 2,288 2,042
Operating result 131 227 235
Interest income 8 10 22
Interest expenses 32 29 29
Other financial expenses (18) (3) 33 4
Net financial expenses 6 16 40
Result before taxes 125 211 195
Taxes 40 66 57 6
Minority interest 0 0 1
Net profit 85 145 137

17Unitor GroupBalance Sheet as per 31.12
Unitor 1995
NOK mill. 1995 1994 1993 Note
Assets
Cash and deposits 196 161 192 7
Accounts receivable 714 587 499 8
Inventories 455 399 323 9
Other short term receivable 86 57 71
Total current assets 1,451 1,204 1,085
Long term receivable 45 45 97 17
Goodwill 209 181 175 11, 12
Fixed assets 448 581 524 10, 12
Total long term assets 702 807 796
Total assets 2,153 2,011 1,881
Liabilities and equity
Short term interest bearing liabilities 34 92 84 13
Accounts payable 280 235 172
Other short term liabilities 396 334 347 14
Total current liabilities 710 661 603
Long term interest bearing liabilities 407 308 303 15
Net pension liabilities 23 16 4 16
Deferred tax 11 40 56 17
Other long term liabilities 7 26 0
Total long term liabilities 448 390 363
Minority interest 0 7 7
Share capital 241 239 218
Other equity 754 714 690
Total equity 995 953 908 18
Total liabilities and equity 2,153 2,011 1,881
Guarantees 1 2 1
Mortgages 15 163 223 21

18 Analysis of Cashflow
Unitor 1995
* NOK mill. 1995 1994 1993
Result before taxes 125 211 194
Ordinary depreciation 97 103 86
Taxes paid (73) (56) (40)
Funds from operations 149 258 240
Net change in accounts receivable (110) (43) (50)
Net change in inventories (46) (52) (34)
Net change in other working capital items 57 (1) 34
Net change in cash from operations 50 162 190
Net change in cash from purchase and sale of activity (24) (54) (110)
Investments in fixed assets (155) (134) (97)
Disposal of fixed assets 237 31 30
Net change in cash from investments 58 (157) (177)
Net change in financial investments 6 58 (36)
New long term liabilities 441 73 12
Downpayments of long term liabilities (419) (67) (91)
Net change in short term interest bearing liabilities (58) (22) 68
Share issues, incl. premium 15 18 11
Cash payment from merger 0 (50) 0
Dividends paid (58) (46) (35)
Net change in cash from financing (73) (36) (71)
Net change in cash position 35 (31) (58)
Cash position – 01.01. 161 192 250
Cash position – 31.12. 196 161 192
* Note 19.
19
GENERALThe Financial Statements are presented in accordance with theLimited Liability Company’s Actand Norwegian GenerallyAccepted Accounting Principles.Valuation and Classification principles below apply both toUnitor ASA and the Group accounts.
CONSOLIDATIONGroup companies
The consolidated accounts includes companies where UnitorASA has a direct or indirect ownership of more than 50% ofthe voting shares, or otherwise hasdirect control. Companies acquired during the year are consolidated from the time of the acquisition. Companies sold during the period are decon-solidated at the time of the sale.Accumulated equity in subsidiariesafter acquisition is classified asGroup reserve. Reference is madeto note 30 for subsidiaries consoli-dated in the Group accounts.Intercompany receivables and liabilities and all material trans-actions between Group companies,as well as internal profit in inventories, have been eliminated. Unitor ASA’s shares in subsidiariesare eliminated against the equity atthe time of acquisition of the subsidiary (the purchase method).Excess values in connection withaquisitions are allocated to the assets to which they are related andsubsequently depreciated. Excessvalues which cannot be allocated toany specific item are classified asgoodwill. In accordance with
regulations in the LimitedLiability Company’s Act, deprec-iation is performed on a straightline basis over the estimated economic life of the goodwill,limited to a maximum of 20 years.For purposes of consolidation, theProfit and Loss statements of foreign subsidiaries are convertedto Norwegian kroner at the annualaverage exchange rate, while assetsand liabilities are converted at theyear end rate. All foreign subsid-iaries are considered to be integrated entities with the parent company, and exchange differences arising from consolidation are therefore presented as part of other financial expenses in theProfit and Loss statements.Gain or loss from sales of shares insubsidiaries is calculated as the difference between the sales priceand the equity at the time of divesture, reduced with the bookvalue of any excess values includedin the consolidation.
Shares in limited partnerships
Shares in the limited partnershipKS Team Heina where UnitorASA has an ownership of 90%, isin the parent company’s FinancialStatements valued by applying theequity method. The limited partnership's assets at year endconsist of bank deposits only, these are included in the Groupaccounts exclusive of the minorityinterests’ share.
Affiliated companies
Investments in companies whereUnitor has an ownership of 20%to 50% of the share capital and atthe same time significant influence,are considered as affiliated companies. The investment is initially recorded at cost price.The Group’s share of result aftertaxes, as well as received dividendsand depreciation of goodwill arerecorded as adjustments to the initial cost price. The Group’s share of the entity’s result after taxes is reported as financial income.
EVALUATION AND CLASSIFICATION PRINCIPLESOperating revenues
Sales of goods and services are reported as operating revenues atdelivery. Long term contracts arerecorded as income based on thePercentage of Completion method. According to the prudence concept, a relative shareof total contract amount and expenses, equal to the projectscompletion at the time of closingthe accounts, is included in theProfit and Loss statements.Projects that, at the time of evaluation, are expected to give aloss, are accrued for directly, with the total expected loss.
Accounting Principles
Unitor 1995
20
Accountingprinciples
Cost of goods sold
Cost of goods sold includes, in addition to cost of goods for resale,also direct and indirect operatingexpenses related to the Contract-ing and Production activity.
Cash and bank deposits
Cash and bank deposits includescash, bank deposits.
Accounts receivable
Accounts receivable include grossinvoiced accounts receivable lessprovision for potential loss on receivables. Accounts receivablealso include accrued revenues fromapplying the Percentage ofCompletion method less corresponding prepayments.
Inventories
Inventories are stated at the lowestof cost, based on the FIFO principle, and the market value.Purchased goods are priced at historical cost. Cost price for workin progress and manufactured goods are direct cost plus a proportion of indirect cost of production. Inventories are reduced for estimated obsolescence.
Fixed assets
Fixed assets are stated at the original cost price reduced with accumulated ordinary depreciation. Ordinary depreciations are recorded on astraight line basis over the estimated economic life of the assets. Gains or losses from sale offixed assets are recorded as operating revenues and other operating expenses respectively.
Taxes
The tax expenses and liabilities arepresented in the accounts by usingthe liability method for calculationof deferred tax. The Profit andLoss statements include the annualchange in deferred tax in additionto current payable tax. The deferred tax liability in the balancesheet is based on positive and negative timing differences between values for accounting purposes and taxation purposes respectively. There are specific regulations for offsetting positiveand negative timing differences aswell as for reporting deferred taxbenefits.
Receivables and liabilities in
foreign currencies
Short term receivables and liabilities are converted intoNorwegian kroner at the year-endexchange rates. Realised and unrealised gains and losses are recorded in the Profit and Loss statements.Long term receivables and liabilities are converted at the lower and higher of the historicaland year-end exchange rates respectively. Unrealised exchangelosses are recorded in the Profitand Loss statements except loss onlong term receivables or long termliabilities that may be offset againstunrealised gain in the same currency. Long term liabilitiesconnected to long term invest-ments that through fixed contractswill generate income in the samecurrency, are reported at historicalexchange rate.
Unitor 1995
21
Accountingprinciples
Pension liabilities
The Group’s Norwegian subsidi-aries operate with defined benefitpension plans, giving the employ-ees right to an agreed upon futurepension benefit. The benefit is based on years of service and salarylevel at retirement. Actuarial computed pension liabilities lessthe market value of any plan assetsare from 1994 included in the accounts. Estimated pension expenses and net pension liabilitiesare based on assumptions as regards interest rates, expected future growth in wages and pension regulations and return on plan assets. The Group’s Foreign subsidiariesmainly have defined contributionplans, where the employers obliga-tion is to contribute a specificamount, percentage of wages, etc.to the individual employee’s pension plan. The employer doesnot undertake any obligationsregarding changes in the return onplan assets, growth in salaries, etc.Total pension expenses in theProfit and Loss statements are thusnormally limited to the actual contribution and no assets or liabilities are recorded in theBalance Sheet.The accrual for early retirementpension expenses is based on thenet present value of agreed pension compensation, includingexpected adjustments until retire-ment. Expenses related to com-pensation for a lower contributionfrom the National Insurance andfor continued mem-bership in thedefined benefit pension plans areequally accrued for.
Research and development costs
Expenses related to product developement and reaserch are recorded directly in the Profit andLoss statements.
Financial instruments
Forward contractsForward sale of a conservative estimate of the next year’s expectednet cash inflow in USD is consid-ered as a hedging transaction foraccounting purposes. Any un-realised profit/loss from such contracts is recorded together withthe underlying net currency inflow.Unrealised loss from hedging ofother expected inflow of foreigncurrency is charged directly.Unrealised gains are recorded atrealisation. Unrealised gains/losseson forward contracts are valued atthe closing exchange rate at year-end.
OptionsOptions are in the same way asforward contracts sold/bought to hedge the exchange rate related tonext year’s net inflow of USD andthese two instruments are treatedsimilarly in the FinancialStatements. The option premiumpaid at time of the agreement is recorded at expiration of the underlying contracts.
Forward rate agreementsForward rate agreements are valued at market price at year end.Net gains/losses are recorded as financial income/expenses over theterm of the contracts.
Segment information
Operating revenues are distributedon major geographical areas andthe Group’s segments; Productsand Services, and Projects andProduction. As most subsidiarieshave activities within both segments without a full allocationof expenses, operating result perbusiness areas have little relevanceand are therefore not reported.
Unitor 1995
22 Unitor ASA
Profit and Loss Statement01.01.-31.12
Balance Sheetas per 31.12
Unitor 1995
NOK mill. 1995 1994 Note
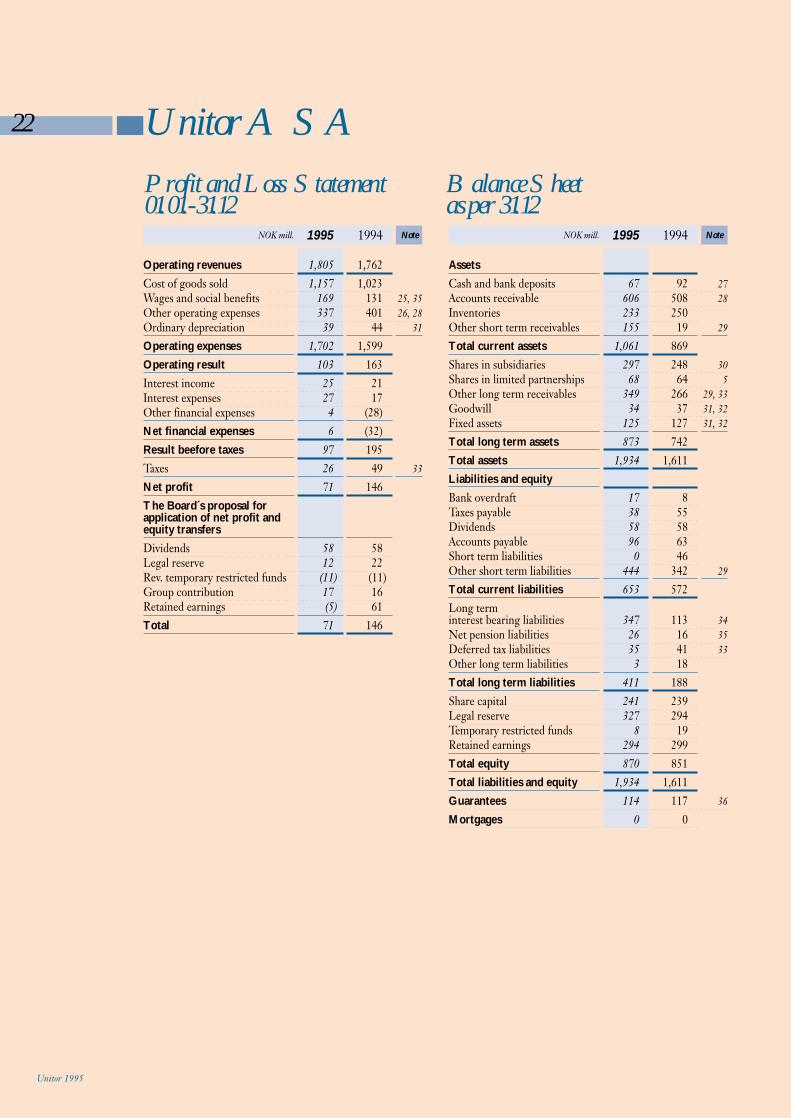
Operating revenues 1,805 1,762Cost of goods sold 1,157 1,023Wages and social benefits 169 131 25, 35Other operating expenses 337 401 26, 28Ordinary depreciation 39 44 31
Operating expenses 1,702 1,599Operating result 103 163Interest income 25 21Interest expenses 27 17Other financial expenses 4 (28)Net financial expenses 6 (32)Result beefore taxes 97 195Taxes 26 49 33
Net profit 71 146The Board´s proposal forapplication of net profit and equity transfersDividends 58 58Legal reserve 12 22Rev. temporary restricted funds (11) (11)Group contribution 17 16Retained earnings (5) 61Total 71 146
NOK mill. 1995 1994 Note
AssetsCash and bank deposits 67 92 27Accounts receivable 606 508 28Inventories 233 250Other short term receivables 155 19 29
Total current assets 1,061 869Shares in subsidiaries 297 248 30Shares in limited partnerships 68 64 5Other long term receivables 349 266 29, 33Goodwill 34 37 31, 32Fixed assets 125 127 31, 32
Total long term assets 873 742Total assets 1,934 1,611Liabilities and equityBank overdraft 17 8Taxes payable 38 55Dividends 58 58Accounts payable 96 63Short term liabilities 0 46Other short term liabilities 444 342 29
Total current liabilities 653 572Long term interest bearing liabilities 347 113 34Net pension liabilities 26 16 35Deferred tax liabilities 35 41 33Other long term liabilities 3 18Total long term liabilities 411 188Share capital 241 239Legal reserve 327 294Temporary restricted funds 8 19Retained earnings 294 299Total equity 870 851Total liabilities and equity 1,934 1,611Guarantees 114 117 36
Mortgages 0 0
23
Unitor 1995
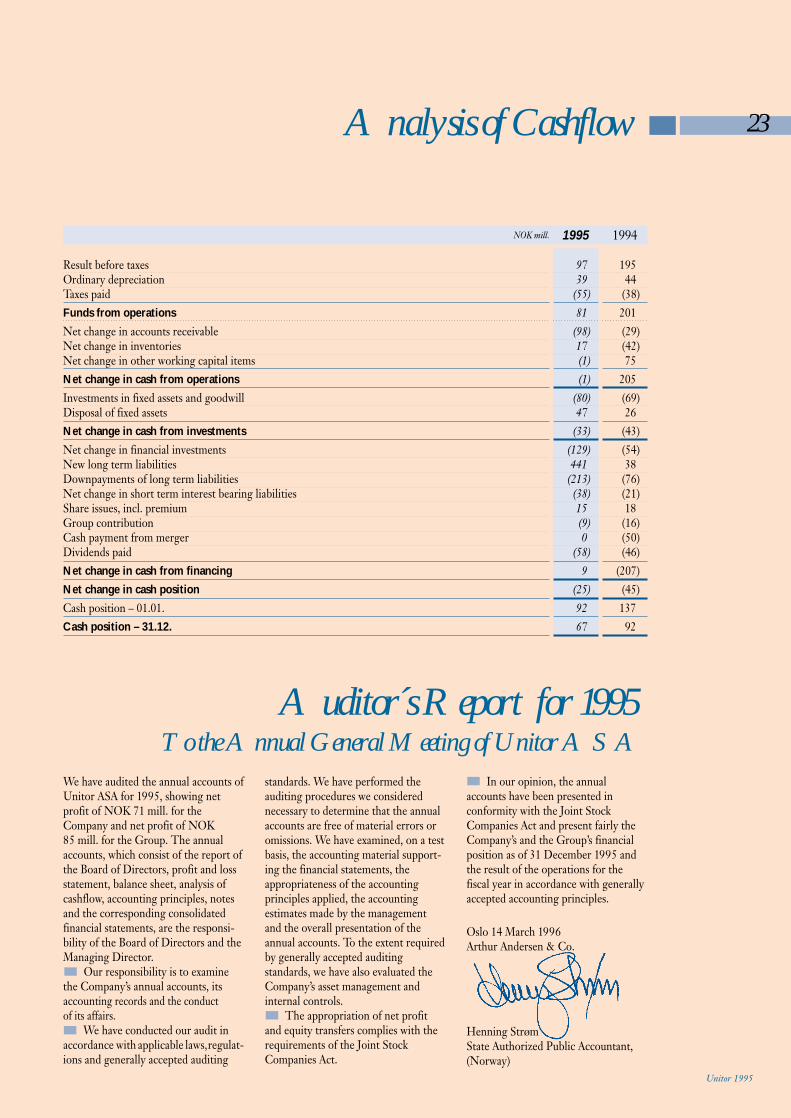
We have audited the annual accounts ofUnitor ASA for 1995, showing net profit of NOK 71 mill. for theCompany and net profit of NOK 85 mill. for the Group. The annual accounts, which consist of the report ofthe Board of Directors, profit and lossstatement, balance sheet, analysis ofcashflow, accounting principles, notesand the corresponding consolidated financial statements, are the responsi-bility of the Board of Directors and theManaging Director.
Our responsibility is to examinethe Company’s annual accounts, its accounting records and the conduct of its affairs.
We have conducted our audit inaccordance with applicable laws,regulat-ions and generally accepted auditing
standards. We have performed the auditing procedures we considered necessary to determine that the annualaccounts are free of material errors oromissions. We have examined, on a testbasis, the accounting material support-ing the financial statements, the appropriateness of the accounting principles applied, the accounting estimates made by the managementand the overall presentation of the annual accounts. To the extent requiredby generally accepted auditing standards, we have also evaluated theCompany’s asset management and internal controls.
The appropriation of net profitand equity transfers complies with the requirements of the Joint StockCompanies Act.
In our opinion, the annual accounts have been presented in conformity with the Joint StockCompanies Act and present fairly theCompany’s and the Group’s financialposition as of 31 December 1995 andthe result of the operations for the fiscal year in accordance with generallyaccepted accounting principles.
Oslo 14 March 1996Arthur Andersen & Co.
Henning StrømState Authorized Public Accountant,(Norway)
Analysis of Cashflow
Auditor´s Report for 1995To the Annual General Meeting of Unitor ASA
NOK mill. 1995 1994
Result before taxes 97 195Ordinary depreciation 39 44Taxes paid (55) (38)Funds from operations 81 201Net change in accounts receivable (98) (29)Net change in inventories 17 (42)Net change in other working capital items (1) 75Net change in cash from operations (1) 205Investments in fixed assets and goodwill (80) (69)Disposal of fixed assets 47 26Net change in cash from investments (33) (43)Net change in financial investments (129) (54)New long term liabilities 441 38Downpayments of long term liabilities (213) (76)Net change in short term interest bearing liabilities (38) (21)Share issues, incl. premium 15 18Group contribution (9) (16)Cash payment from merger 0 (50)Dividends paid (58) (46)Net change in cash from financing 9 (207)Net change in cash position (25) (45)Cash position – 01.01. 92 137Cash position – 31.12. 67 92
24
Unitor regularly issues informat-
ion to shareholders, brokers and
others on the development of the
company, the company's activities,
significant events, etc. By follow-
ing this policy, we seek to ensure
that the share price reflects the
underlying value of the company
and the expected future develop-
ment of profits. In addition to the
annual report, information is
distributed through presentations,
comprehensive interim reports
and frequent press releases.
In view of the ownership structure
in Unitor, most presentations are
held abroad.
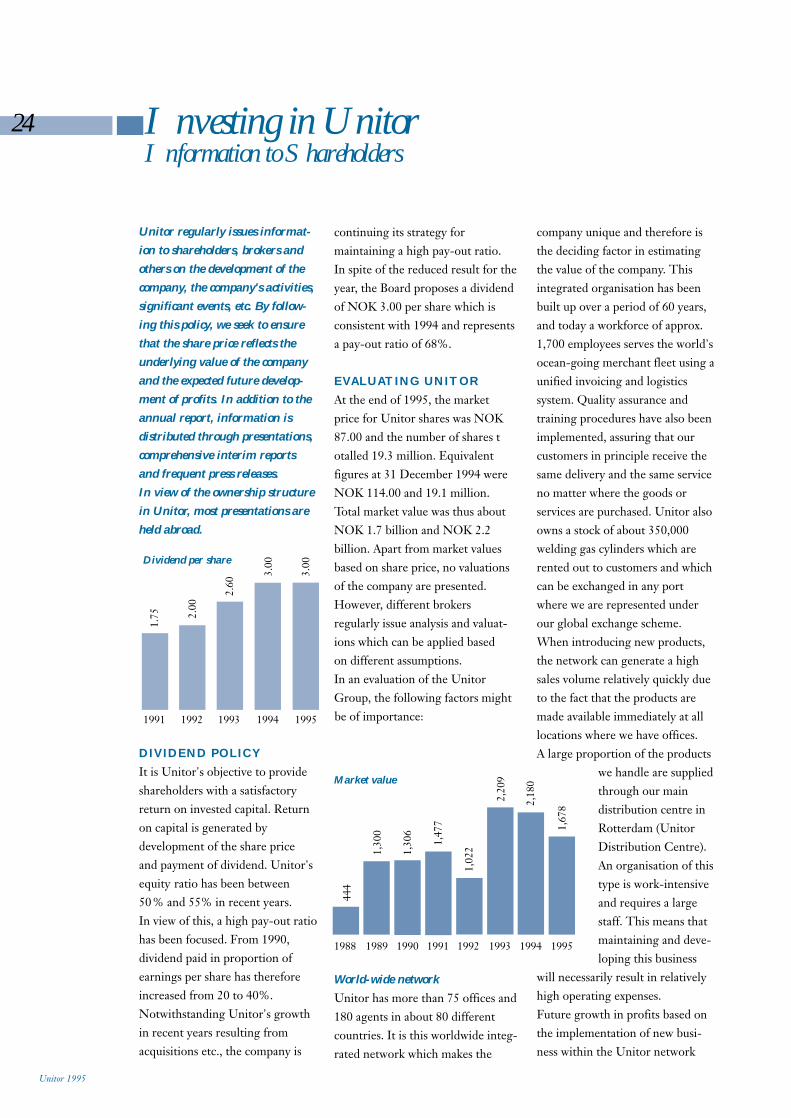
DIVIDEND POLICYIt is Unitor's objective to provideshareholders with a satisfactory return on invested capital. Returnon capital is generated by development of the share price and payment of dividend. Unitor'sequity ratio has been between50% and 55% in recent years. In view of this, a high pay-out ratiohas been focused. From 1990, dividend paid in proportion of earnings per share has thereforeincreased from 20 to 40%. Notwithstanding Unitor's growthin recent years resulting from acquisitions etc., the company is
company unique and therefore isthe deciding factor in estimatingthe value of the company. This integrated organisation has beenbuilt up over a period of 60 years,and today a workforce of approx.1,700 employees serves the world'socean-going merchant fleet using aunified invoicing and logistics system. Quality assurance and training procedures have also beenimplemented, assuring that ourcustomers in principle receive thesame delivery and the same serviceno matter where the goods or services are purchased. Unitor alsoowns a stock of about 350,000 welding gas cylinders which are rented out to customers and whichcan be exchanged in any port where we are represented underour global exchange scheme.When introducing new products,the network can generate a highsales volume relatively quickly dueto the fact that the products aremade available immediately at alllocations where we have offices. A large proportion of the products
we handle are suppliedthrough our main distribution centre inRotterdam (UnitorDistribution Centre).An organisation of thistype is work-intensiveand requires a largestaff. This means thatmaintaining and deve-loping this business
will necessarily result in relativelyhigh operating expenses.Future growth in profits based onthe implementation of new busi-ness within the Unitor network
Investing in UnitorInformation to Shareholders
continuing its strategy for maintaining a high pay-out ratio.In spite of the reduced result for theyear, the Board proposes a dividendof NOK 3.00 per share which isconsistent with 1994 and representsa pay-out ratio of 68%.
EVALUATING UNITORAt the end of 1995, the market price for Unitor shares was NOK87.00 and the number of shares totalled 19.3 million. Equivalent figures at 31 December 1994 wereNOK 114.00 and 19.1 million.Total market value was thus aboutNOK 1.7 billion and NOK 2.2 billion. Apart from market valuesbased on share price, no valuationsof the company are presented.However, different brokers regularly issue analysis and valuat-ions which can be applied based on different assumptions.In an evaluation of the UnitorGroup, the following factors mightbe of importance:1991 1992 1993 1994 1995
1988 1989 1990 1991 1992 1993 1994 1995
Dividend per share
Market value
1.75 2.
00
2.60
3.00
3.00
444
1,30
0
1,30
6
1,47
7
1,02
2
2,20
9
2,18
0
1,67
8
Unitor 1995
World-wide network
Unitor has more than 75 offices and180 agents in about 80 differentcountries. It is this worldwide integ-rated network which makes the
25
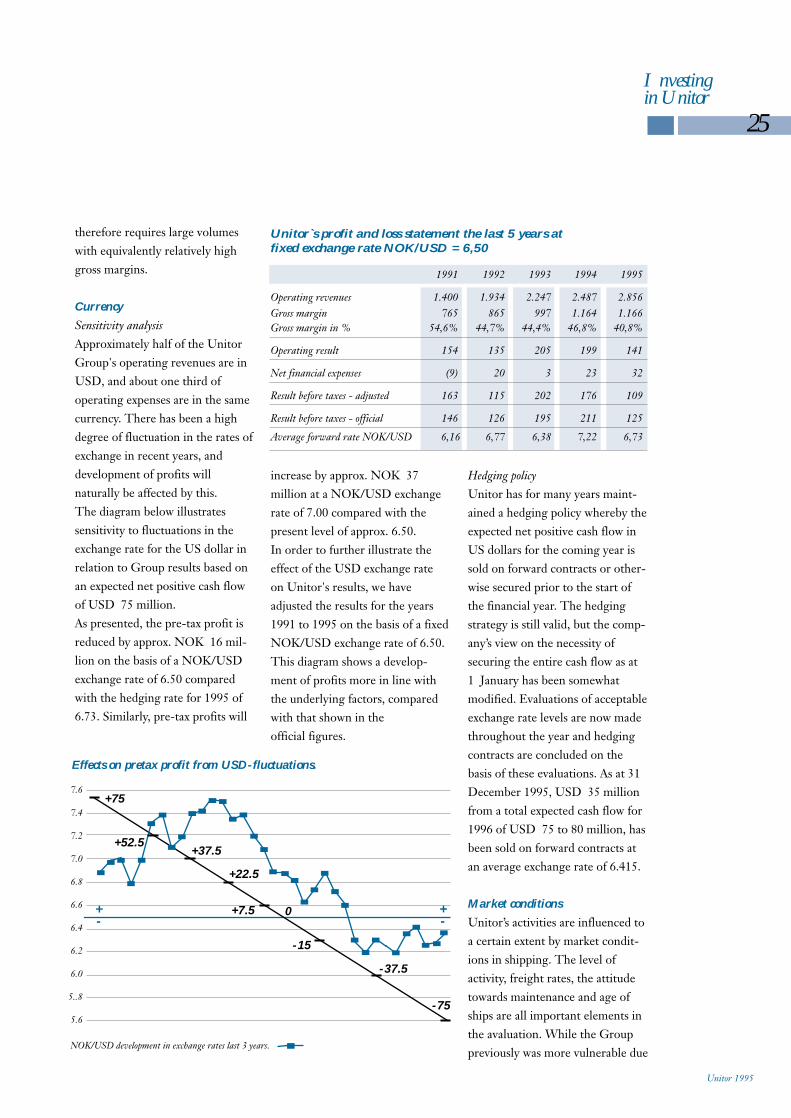
increase by approx. NOK 37 million at a NOK/USD exchangerate of 7.00 compared with thepresent level of approx. 6.50.In order to further illustrate the effect of the USD exchange rateon Unitor's results, we have adjusted the results for the years1991 to 1995 on the basis of a fixedNOK/USD exchange rate of 6.50.This diagram shows a develop-ment of profits more in line withthe underlying factors, comparedwith that shown in the official figures.
Hedging policyUnitor has for many years maint-ained a hedging policy whereby theexpected net positive cash flow inUS dollars for the coming year issold on forward contracts or other-wise secured prior to the start ofthe financial year. The hedgingstrategy is still valid, but the comp-any’s view on the necessity of securing the entire cash flow as at 1 January has been somewhat modified. Evaluations of acceptableexchange rate levels are now madethroughout the year and hedgingcontracts are concluded on the basis of these evaluations. As at 31December 1995, USD 35 millionfrom a total expected cash flow for1996 of USD 75 to 80 million, hasbeen sold on forward contracts atan average exchange rate of 6.415.
Market conditions
Unitor’s activities are influenced toa certain extent by market condit-ions in shipping. The level of activity, freight rates, the attitudetowards maintenance and age ofships are all important elements inthe avaluation. While the Grouppreviously was more vulnerable due
1991 1992 1993 1994 1995
Operating revenues 1.400 1.934 2.247 2.487 2.856Gross margin 765 865 997 1.164 1.166Gross margin in % 54,6% 44,7% 44,4% 46,8% 40,8%
Operating result 154 135 205 199 141
Net financial expenses (9) 20 3 23 32
Result before taxes - adjusted 163 115 202 176 109
Result before taxes - official 146 126 195 211 125
Average forward rate NOK/USD 6,16 6,77 6,38 7,22 6,73
Investingin Unitor
therefore requires large volumeswith equivalently relatively highgross margins.
Currency
Sensitivity analysisApproximately half of the UnitorGroup's operating revenues are inUSD, and about one third of operating expenses are in the samecurrency. There has been a highdegree of fluctuation in the rates ofexchange in recent years, and development of profits will naturally be affected by this. The diagram below illustrates sensitivity to fluctuations in the exchange rate for the US dollar inrelation to Group results based onan expected net positive cash flowof USD 75 million.As presented, the pre-tax profit isreduced by approx. NOK 16 mil-lion on the basis of a NOK/USDexchange rate of 6.50 comparedwith the hedging rate for 1995 of6.73. Similarly, pre-tax profits will
Effects on pretax profit from USD-fluctuations.
NOK/USD development in exchange rates last 3 years.
7.6
7.4
7.2
7.0
6.8
6.6
6.4
6.2
6.0
5..8
5.6
+-
+-
Unitor`s profit and loss statement the last 5 years at fixed exchange rate NOK/USD = 6,50
Unitor 1995
+37.5
+22.5
+7.5
-15
0
-75
-37.5
+75
+52.5
26
Investing in Unitor
to the shift from maintenance tonewbuilding, the acquisitions inrecent years have contributed towards a possibility of maintain-ing profits even when there is alarger increase in newbuilding activity. The maintenance pro-gramme for the world’s shippingfleet will of course retain its im-portance for Unitor. In this conn-ection, we have registered the increase in insurance premiumsand the drop in second-hand values for ships in poor technicalcondition in addition to the general tightening up of safety demands. In this situation we expect continued growth in theconsumption of maintenance products.
Project activity
Up to and including 1993, practic-ally all Unitor’s business was conn-ected with the delivery of productsand services to the oceangoing
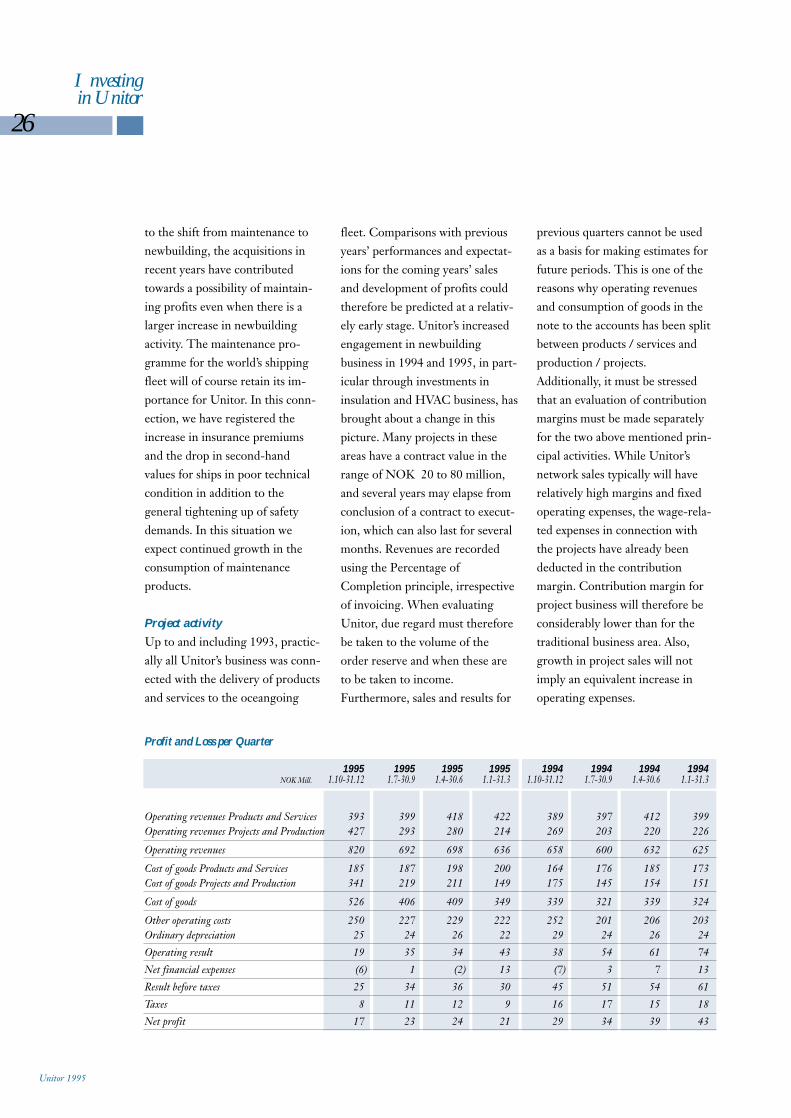
Profit and Loss per Quarter
1995 1995 1995 1995 1994 1994 1994 1994NOK Mill. 1.10-31.12 1.7-30.9 1.4-30.6 1.1-31.3 1.10-31.12 1.7-30.9 1.4-30.6 1.1-31.3
Operating revenues Products and Services 393 399 418 422 389 397 412 399Operating revenues Projects and Production 427 293 280 214 269 203 220 226
Operating revenues 820 692 698 636 658 600 632 625
Cost of goods Products and Services 185 187 198 200 164 176 185 173Cost of goods Projects and Production 341 219 211 149 175 145 154 151
Cost of goods 526 406 409 349 339 321 339 324
Other operating costs 250 227 229 222 252 201 206 203Ordinary depreciation 25 24 26 22 29 24 26 24
Operating result 19 35 34 43 38 54 61 74
Net financial expenses (6) 1 (2) 13 (7) 3 7 13
Result before taxes 25 34 36 30 45 51 54 61
Taxes 8 11 12 9 16 17 15 18
Net profit 17 23 24 21 29 34 39 43
Unitor 1995
previous quarters cannot be usedas a basis for making estimates forfuture periods. This is one of thereasons why operating revenuesand consumption of goods in thenote to the accounts has been splitbetween products / services and production / projects.Additionally, it must be stressedthat an evaluation of contributionmargins must be made separatelyfor the two above mentioned prin-cipal activities. While Unitor’s network sales typically will haverelatively high margins and fixedoperating expenses, the wage-rela-ted expenses in connection withthe projects have already been deducted in the contribution margin. Contribution margin forproject business will therefore beconsiderably lower than for thetraditional business area. Also,growth in project sales will not imply an equivalent increase inoperating expenses.
fleet. Comparisons with previousyears’ performances and expectat-ions for the coming years’ salesand development of profits couldtherefore be predicted at a relativ-ely early stage. Unitor’s increasedengagement in newbuilding business in 1994 and 1995, in part-icular through investments in insulation and HVAC business, hasbrought about a change in this picture. Many projects in theseareas have a contract value in therange of NOK 20 to 80 million,and several years may elapse fromconclusion of a contract to execut-ion, which can also last for severalmonths. Revenues are recordedusing the Percentage ofCompletion principle, irrespectiveof invoicing. When evaluatingUnitor, due regard must thereforebe taken to the volume of the order reserve and when these areto be taken to income.Furthermore, sales and results for
27
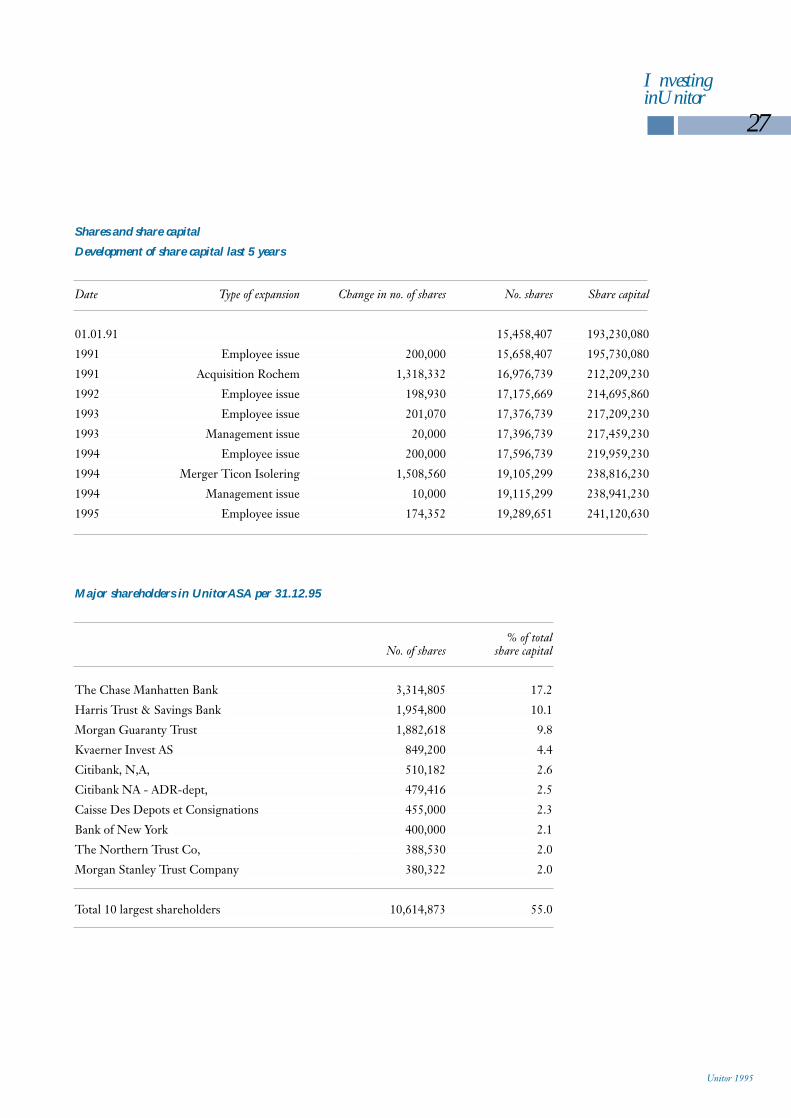
Shares and share capital
Development of share capital last 5 years
Date Type of expansion Change in no. of shares No. shares Share capital
01.01.91 15,458,407 193,230,080
1991 Employee issue 200,000 15,658,407 195,730,080
1991 Acquisition Rochem 1,318,332 16,976,739 212,209,230
1992 Employee issue 198,930 17,175,669 214,695,860
1993 Employee issue 201,070 17,376,739 217,209,230
1993 Management issue 20,000 17,396,739 217,459,230
1994 Employee issue 200,000 17,596,739 219,959,230
1994 Merger Ticon Isolering 1,508,560 19,105,299 238,816,230
1994 Management issue 10,000 19,115,299 238,941,230
1995 Employee issue 174,352 19,289,651 241,120,630
Major shareholders in UnitorASA per 31.12.95
% of totalNo. of shares share capital
The Chase Manhatten Bank 3,314,805 17.2
Harris Trust & Savings Bank 1,954,800 10.1
Morgan Guaranty Trust 1,882,618 9.8
Kvaerner Invest AS 849,200 4.4
Citibank, N,A, 510,182 2.6
Citibank NA - ADR-dept, 479,416 2.5
Caisse Des Depots et Consignations 455,000 2.3
Bank of New York 400,000 2.1
The Northern Trust Co, 388,530 2.0
Morgan Stanley Trust Company 380,322 2.0
Total 10 largest shareholders 10,614,873 55.0
InvestinginUnitor
Unitor 1995

28
Distribution of shares in Unitor ASA as per 31.12.95 per geographical area
No. of % of % shareArea shareholders shareholders capital
United Kingdom 101 4.4 28.7
U.S.A. 138 6.0 27.2
Norway 1,733 75.2 23.6
Belgium 11 0.5 9.9
France 12 0.5 2.9
Canada 13 0.6 2.7
Luxemburg 13 0.6 2.1
Other countries 283 12.2 2.9
Total 2,304 100.0 100.0
Foreign shareholder holdings 571 24.8 76.4
Distribution of shares in Unitor ASA as per 31.12.95 per shareholder group
No. of % of % shareNo. shares per shareholder shareholders shareholders capital
1–100 979 42.5 0.2
101–1,000 911 39.5 1.9
1,001–10,000 280 12.2 5.3
10,001–100,000 107 4.6 19.4
Over 100,000 27 1.2 73.2
Total 2,304 100.0 100.0
Investingin Unitor
SALES OF UNITOR SHARESUnitor has been listed on the OsloStock Exchange since 1968. In1995 41,005,308 shares were traded, giving a liquidity ratio of213%. The equivalent figures for1994 were 45,946,969 shares and a liquidity ratio of 241%.
In May 1991, Unitor launched anADR programme (AmericanDepository Receipts) in New York.As at 31.12.95 a total of 479,416ADRs have been issued. EachADR represents an underlying
share in Unitor. The objective ofthe ADR programme is to increasethe liquidity of the Unitor share onthe American market.
Unitor 1995

employees. A similar resolutionwas passed in 1990 covering theperiod 1991 to 1994. The objectiveof this prog-ramme is to encourageinterest among the employees inthe business and profits of Unitor. In consideration of the relativelyweak result for the Unitor Groupin 1995, it has been decided not tocarry out a share issue to the emp-loyees for 1996, but to assess thesituation at the end of the year.As at 31 December 1995, Unitoremployees held a total of 232,907
DEVELOPMENT OF MARKET PRICE
1995 1994 1993Highest price 113.0 150.0 127.0Lowest price 76.0 102.0 62.0Share price31.12 87.0 114.0 127.0
Tax adjustment of purchase price
changes in taxed equity
These regulations apply to Nor-wegian shareholders only, and thetax adjustment takes place as at 1 January. Shareholders registeredat this date are entitled to an ad-justment of purchase price for taxpurposes by amount of taxed equity.Adjustment amount per share forthe years 1992–1995 (in NOK):
1992 1993 1994 1995* 2.77 1.01 4.71 2.21
* Estimated
INCENTIVE SHARES TO EMPLOYEESAt the Annual General Meetingheld on 19 May 1994, the Boardwas authorised to increase the share capital by NOK 10 mill.through the issue of up to 800,000new shares over a four-year periodas a private issue to Group
29
Investingin Unitor
shares in the company representing 1.2 per cent of totalshareholdings.
AUTHORISATION TO INCREASE SHARE CAPITALAt the Annual General Meetingheld on 4 May 1993, the Boardwas authorised to increase the sharecapital by up to NOK 3,375,000through the issue of up to 270,000shares over a three-year period.This authority related to the imp-lementation of a share option programme for Unitor's manage-ment group which can be declaredover a three-year period. The option premium and subscriptionprice was fixed at NOK 3 andNOK 77 respectively. As at 31December 1995, the number ofshares in the company has increased by 10,000 as a result ofthis scheme.At the Annual General Meetingheld on 19 May 1994, a resolutionwas passed to grant the Boardauthority to increase the share capital by up to NOK 5 mill. bythe issue of up to 400,000 shares.The capital extension is to be employed in whole or part as payment in connection with poss-ible future acquisitions. This authority, which has not yet beenapplied, is valid until the AnnualGeneral Meeting in 1999.
GENERAL INFORMATIONThe Annual General Meeting inUnitor ASA for 1995 will be heldin Oslo on 9 May 1996. Unitor issues interim reports every quarter. For 1996, the interim results will be published on 2 May,19 August, and 31 October,respectively.
Shares owned by members of the
Board, Managing Director and
Accountant
Name: No. of shares
The Board:Stein H. Annexstad 0Eivind Astrup* 25.000Carsten Ellertsen 1.000Christian Falck-Pedersen* 362.954B.G.Nilson* 129.781Terje Rabben 1.588Hans Petter Rolfheim 0Managing Director,Karsten Houm 30.803
Accountant:Arthur Andersen & Co’s Partners and employees 0
* Includes shares, owned by companies controlled by the Board member.
Unitor 1995
Share price development at Oslo Stock Exchange (1991–1995)
200
150
100
50
001.91 07.91 01.92 07.92 01.93 07.93 01.94 07.94 01.95 07.95 12.95
UNITOR RELATIVE TOTALINDEX RELATIVE SHIPPINGINDEX
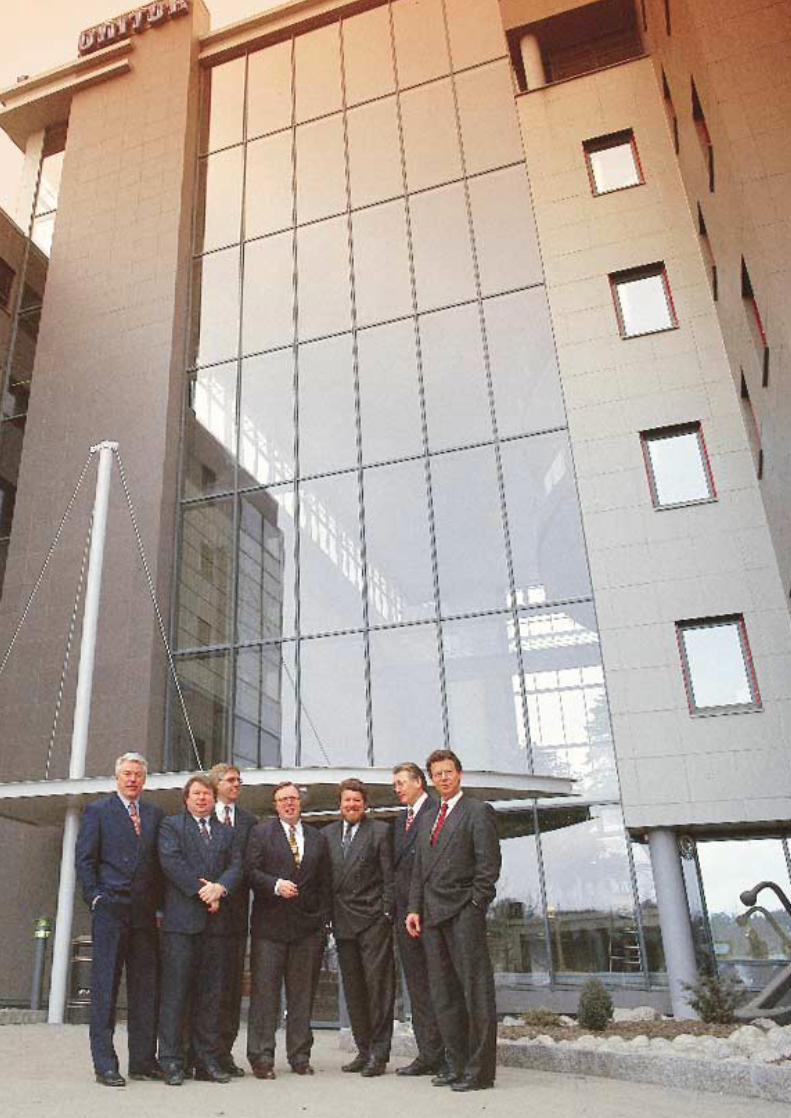
30 The Management Group
Unitor 1995
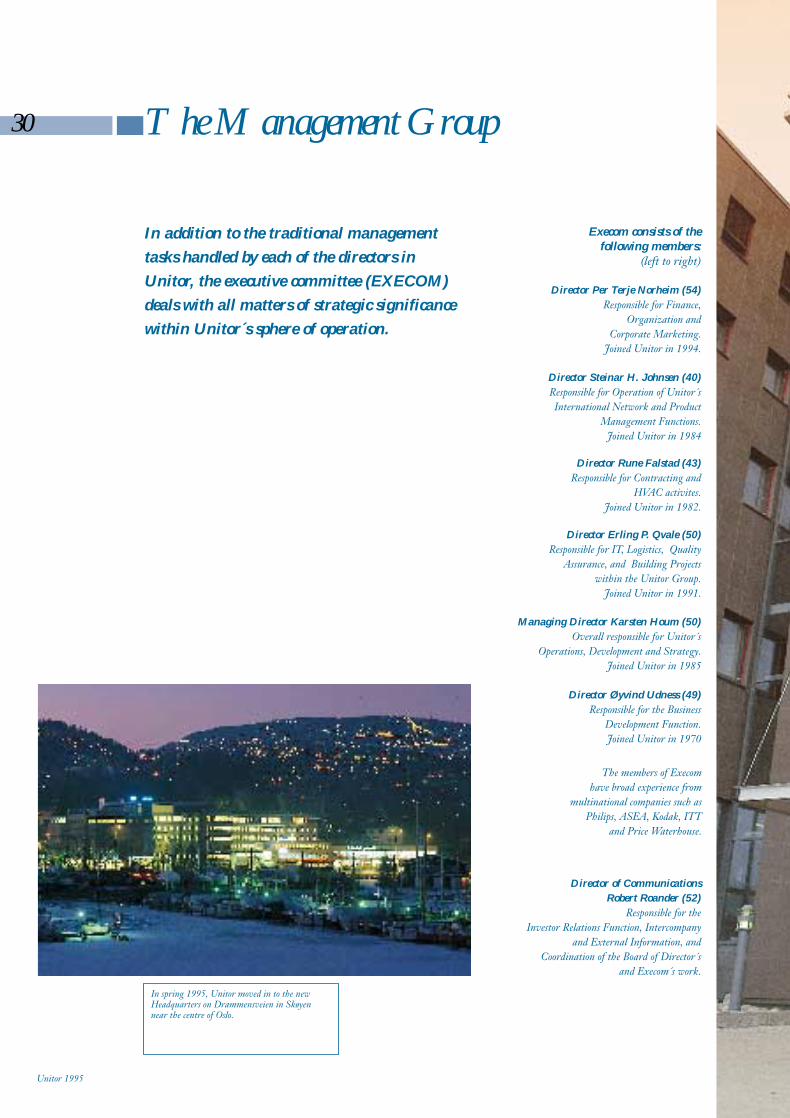
In addition to the traditional management
tasks handled by each of the directors in
Unitor, the executive committee (EXECOM)
deals with all matters of strategic significance
within Unitor´s sphere of operation.
Execom consists of the following members:
(left to right)
Director of Communications
Robert Roander (52)
Responsible for the Investor Relations Function, Intercompany
and External Information, andCoordination of the Board of Director´s
and Execom´s work.
The members of Execomhave broad experience from
multinational companies such asPhilips, ASEA, Kodak, ITT
and Price Waterhouse.
Director Erling P. Qvale (50)
Responsible for IT, Logistics, QualityAssurance, and Building Projects
within the Unitor Group.Joined Unitor in 1991.
Director Rune Falstad (43)
Responsible for Contracting and HVAC activites.
Joined Unitor in 1982.
Director Per Terje Norheim (54)
Responsible for Finance, Organization and
Corporate Marketing.Joined Unitor in 1994.
Director Øyvind Udness (49)
Responsible for the BusinessDevelopment Function.Joined Unitor in 1970
Director Steinar H. Johnsen (40)
Responsible for Operation of Unitor´s International Network and Product
Management Functions.Joined Unitor in 1984
Managing Director Karsten Houm (50)
Overall responsible for Unitor´s Operations, Development and Strategy.
Joined Unitor in 1985
In spring 1995, Unitor moved in to the newHeadquarters on Drammensveien in Skøyennear the centre of Oslo.
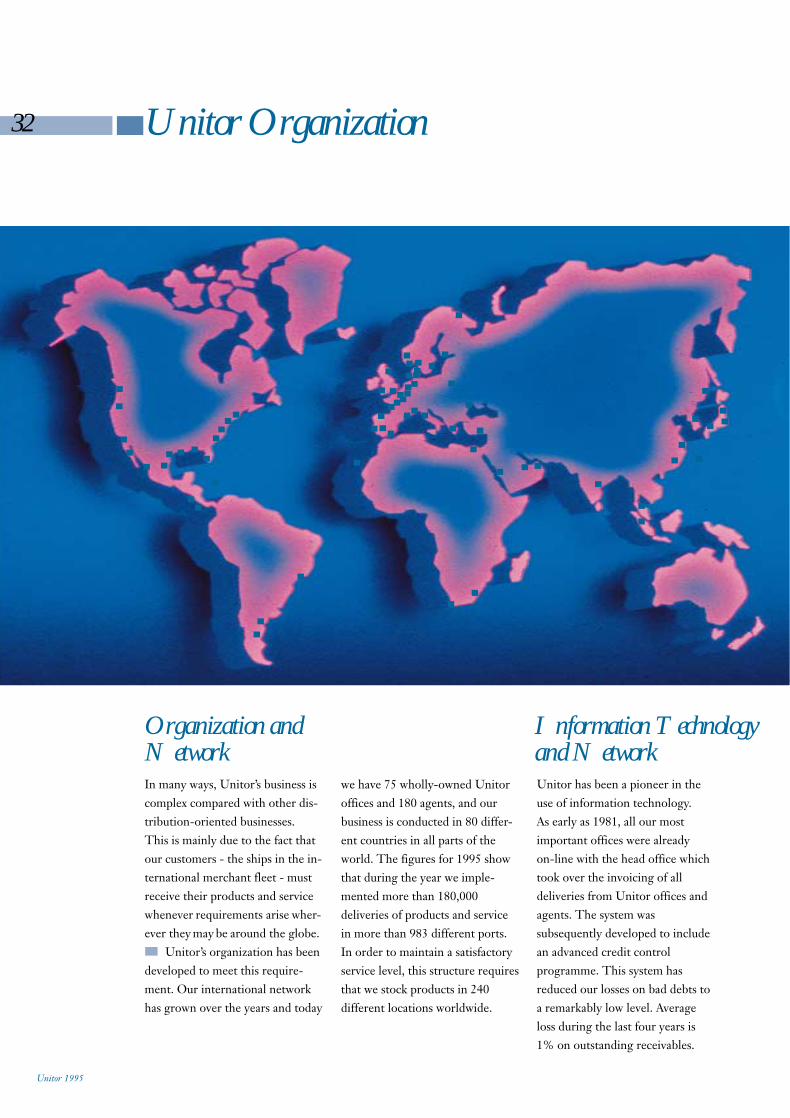
Unitor has been a pioneer in theuse of information technology. As early as 1981, all our most important offices were already on-line with the head office whichtook over the invoicing of all deliveries from Unitor offices andagents. The system was subsequently developed to includean advanced credit control programme. This system has reduced our losses on bad debts toa remarkably low level. Averageloss during the last four years is1% on outstanding receivables.
32 Unitor Organization
Organization andNetwork
Information Technologyand Network
In many ways, Unitor’s business iscomplex compared with other dis-tribution-oriented businesses. This is mainly due to the fact thatour customers - the ships in the in-ternational merchant fleet - mustreceive their products and servicewhenever requirements arise wher-ever they may be around the globe.
Unitor’s organization has beendeveloped to meet this require-ment. Our international networkhas grown over the years and today
we have 75 wholly-owned Unitoroffices and 180 agents, and our business is conducted in 80 differ-ent countries in all parts of theworld. The figures for 1995 showthat during the year we imple-mented more than 180,000 deliveries of products and servicein more than 983 different ports.In order to maintain a satisfactoryservice level, this structure requiresthat we stock products in 240 different locations worldwide.
Unitor 1995
33Organization
In order to reduce our vulner-ability in relation to foreign exchange, we introduced a foreigncurrency invoicing programme in1989 which provides us with revenues in the same currencies asour incurred costs. This has reduced our exposure to currencyfluctuat- ion appreciably, and ofthe total of 18 different currencieswhich are included in Unitor’s balance sheet, only the US dollarrepresents foreign exchange exposure of significance.
The daily flow of informationto head office also provides a highdegree of operative control.Profitability is measured continu-ously in relation to customer, product group and office. Everymorning, Unitor management cancheck the amount invoiced on thepreceding day and at which mar-gin, in comparison with the equivalent figures for the three preceding months. In this way, management is able to review thedevelopment of operations at all times and make comparisons withbudgets and plans.
Unitor’s organization is comp-rised of a total of 52 legal entities.Each of these entities has severaloffices and/or agents within its administrative responsibility. In order to ensure best possibleon-going control of these units,the accounts for each legal entityare closed every single month, including depreciations and alloca-tions which are normally only dealt with on an annual basis.
Used sensibly, informationtechnology can also provide a goodcompetitive edge. Direct comm-
unication with Lloyds means thatwe always have an updated overviewof all ships built, where they are located and who their owners are.
Databases containing inform-ation on the safety equipment ofthe ships, when the next service is required, and which componentsare to be replaced or upgraded,make it possible for us to carry outour “fire and refrigeration service”better and faster than our localcompetitors.
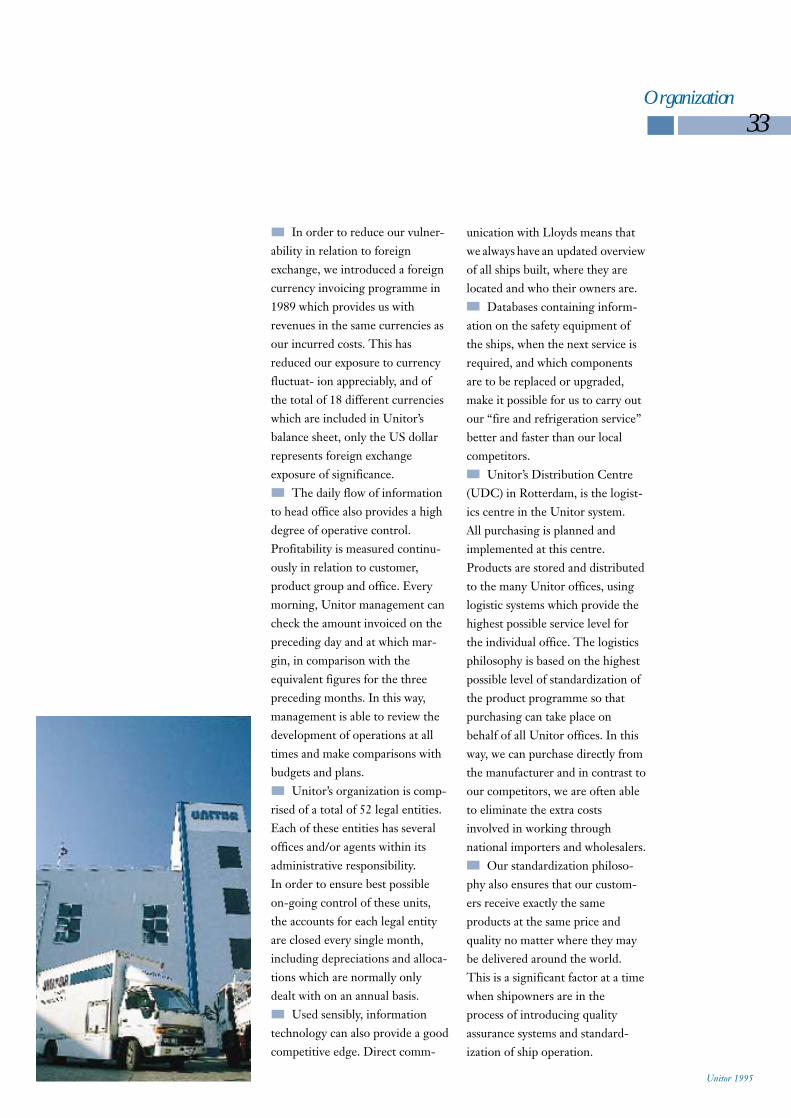
Unitor’s Distribution Centre(UDC) in Rotterdam, is the logist-ics centre in the Unitor system. All purchasing is planned and implemented at this centre.Products are stored and distributedto the many Unitor offices, usinglogistic systems which provide thehighest possible service level forthe individual office. The logisticsphilosophy is based on the highestpossible level of standardization ofthe product programme so thatpurchasing can take place on behalf of all Unitor offices. In thisway, we can purchase directly fromthe manufacturer and in contrast toour competitors, we are often ableto eliminate the extra costs involved in working through national importers and wholesalers.
Our standardization philoso-phy also ensures that our custom-ers receive exactly the same products at the same price andquality no matter where they maybe delivered around the world. This is a significant factor at a timewhen shipowners are in the process of introducing quality assurance systems and standard-ization of ship operation.
Unitor 1995
34Organization
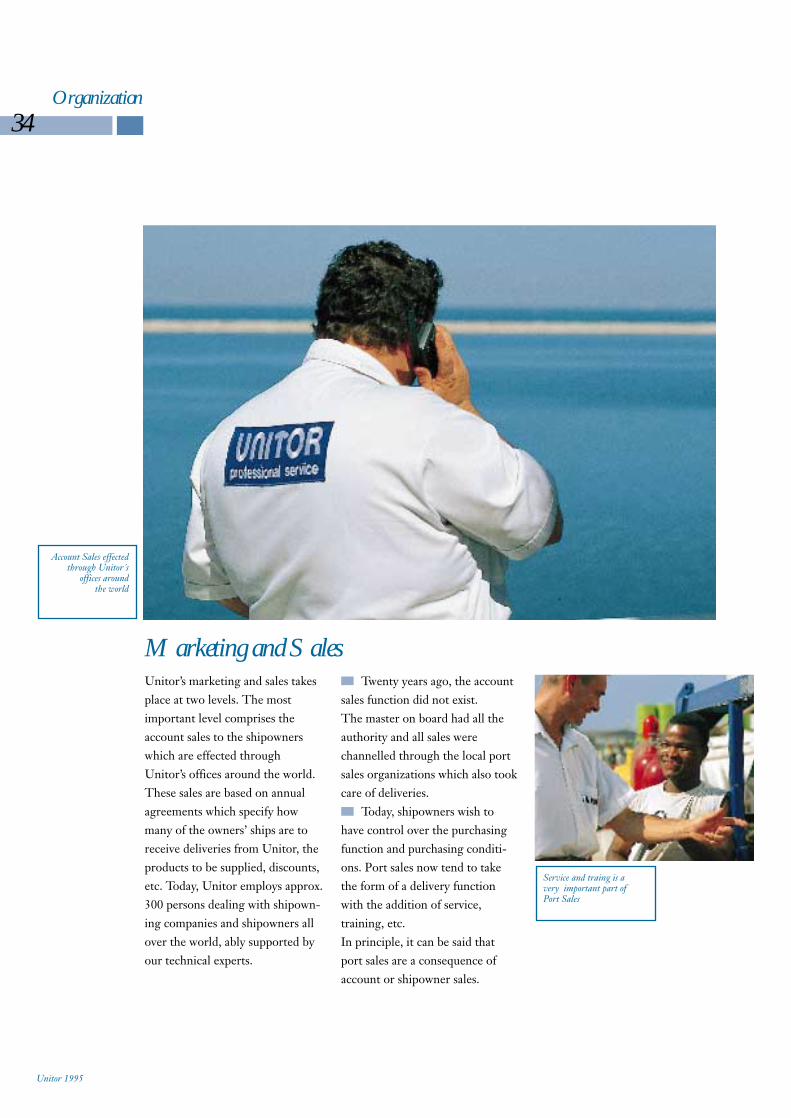
Marketing and SalesUnitor’s marketing and sales takesplace at two levels. The most important level comprises the account sales to the shipownerswhich are effected throughUnitor’s offices around the world.These sales are based on annualagreements which specify howmany of the owners’ ships are toreceive deliveries from Unitor, theproducts to be supplied, discounts,etc. Today, Unitor employs approx.300 persons dealing with shipown-ing companies and shipowners allover the world, ably supported byour technical experts.
Twenty years ago, the accountsales function did not exist. The master on board had all theauthority and all sales were channelled through the local portsales organizations which also tookcare of deliveries.
Today, shipowners wish tohave control over the purchasingfunction and purchasing conditi-ons. Port sales now tend to takethe form of a delivery functionwith the addition of service, training, etc. In principle, it can be said thatport sales are a consequence of account or shipowner sales.
Unitor 1995
Service and traing is avery important part ofPort Sales
Account Sales effectedthrough Unitor´s
offices around the world
35Organization
The Structure of the Competition
Since Unitor was established 60years ago, several competitors haveestablished similar internationalnetworks to serve the internationalmerchant fleet. Most of these havebeen removed from the marketthrough acquisitions or mergers,and the market is today dominatedby Unitor and Drew AmeroidMarine which is about one-third ofthe size of Unitor. The largest section of the market, however, iscontrolled by several thousand shipchandlers who to a large extentsupply similar products.
In contrast to this group, it isUnitor’s philosophy to regard theentire marine market as an intern-ational market where prices andconditions should be identical - no matter where the products aresupplied. We maintain fixed pricesthroughout the year and our pricelists can therefore be used as a basis for preparing budgets and forinvoice control. At a time when financial control is receiving increasingly high priority, and standardization of products has become an important tool in cus-tomers’ quality assurance systems,we know that Unitor’s operatingconcept is future-oriented.Budgeting and control are simplif-ied as all invoices are issued in theagreed currency, no matter wherethe products are delivered.
The Unitor Corporate Culture
A distinguishing feature ofUnitor’s corporate culture is thatthe employees give priority to assignments which benefit Unitorfrom an overall viewpoint to a greater extent than in other multi-national corporations. This is related to the fact that all offices depend on the efforts of the otheroffices to reach their objective. An active shipowner sale in e.g.Piraeus or London will in the firstinstance benefit the offices locatedat the regular ports of call for theships involved.
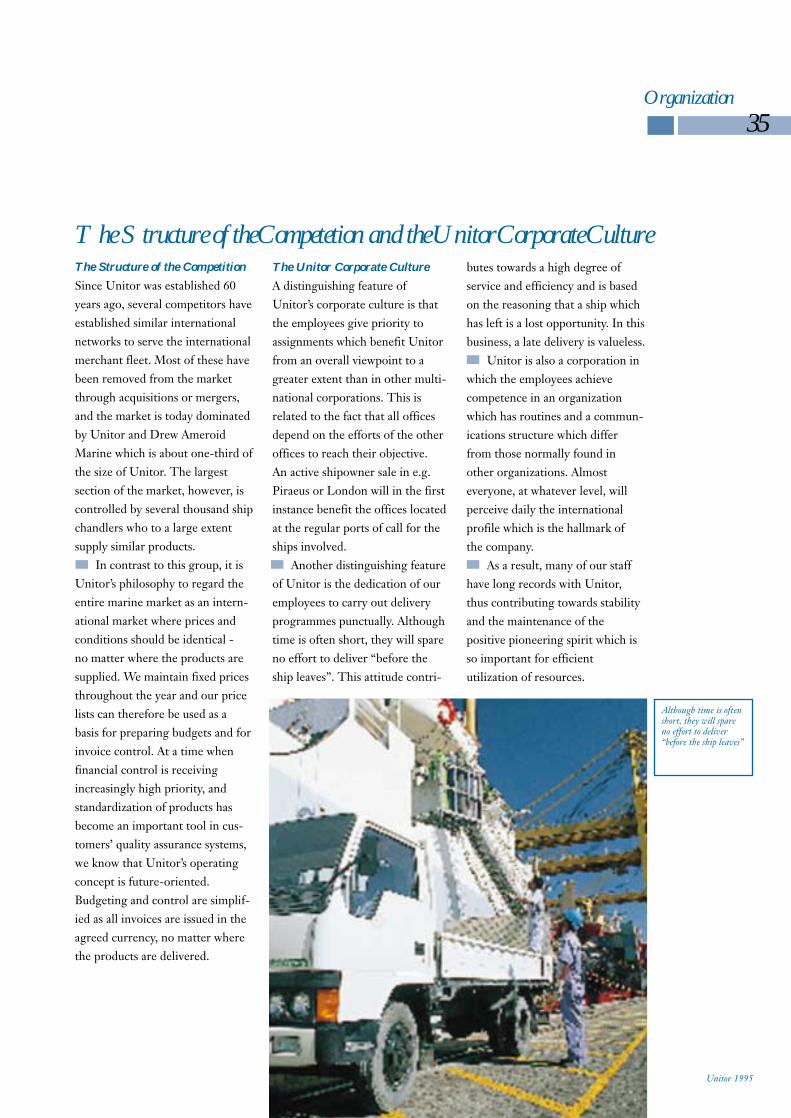
Another distinguishing featureof Unitor is the dedication of ouremployees to carry out deliveryprogrammes punctually. Althoughtime is often short, they will spareno effort to deliver “before theship leaves”. This attitude contri-
butes towards a high degree of service and efficiency and is basedon the reasoning that a ship whichhas left is a lost opportunity. In thisbusiness, a late delivery is valueless.
Unitor is also a corporation inwhich the employees achieve competence in an organizationwhich has routines and a commun-ications structure which differ from those normally found in other organizations. Almost everyone, at whatever level, willperceive daily the internationalprofile which is the hallmark of the company.
As a result, many of our staffhave long records with Unitor,thus contributing towards stabilityand the maintenance of the positive pioneering spirit which isso important for efficient utilization of resources.
The Structure of theCompetetion and theUnitorCorporate Culture
Unitor 1995
Although time is oftenshort, they will spareno effort to deliver “before the ship leaves”
37Marine Products and Service
Unitor 1995
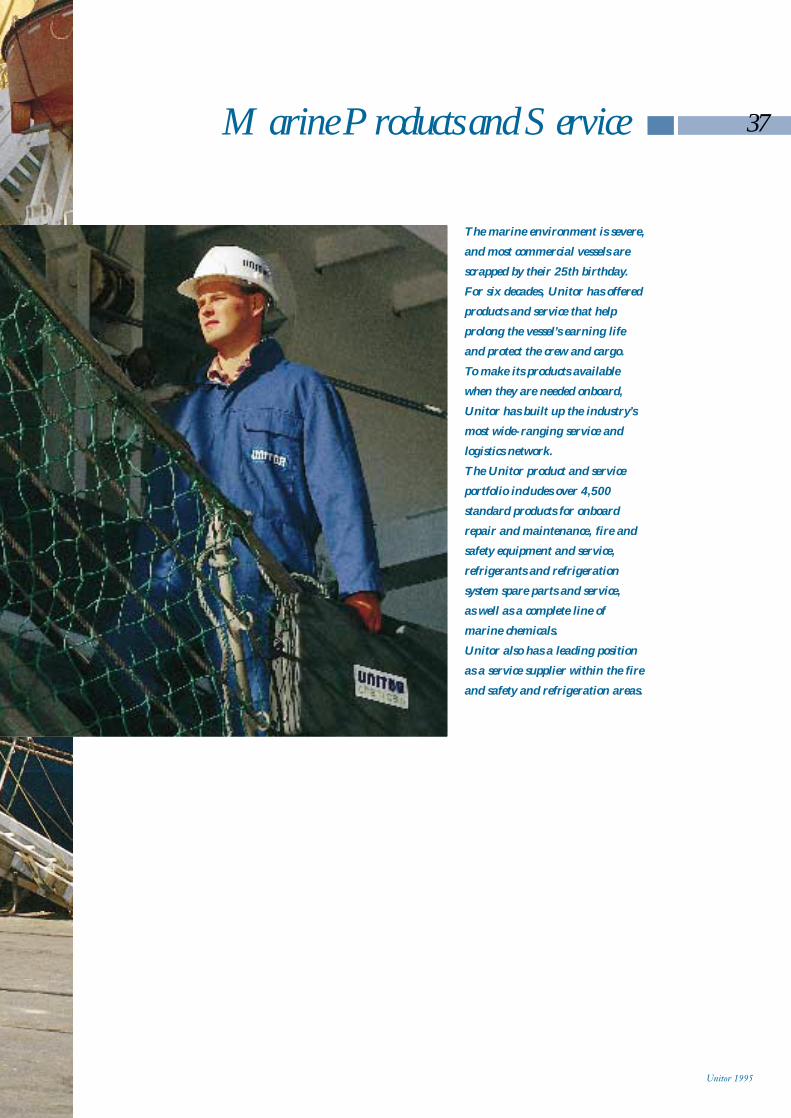
The marine environment is severe,
and most commercial vessels are
scrapped by their 25th birthday.
For six decades, Unitor has offered
products and service that help
prolong the vessel’s earning life
and protect the crew and cargo.
To make its products available
when they are needed onboard,
Unitor has built up the industry’s
most wide-ranging service and
logistics network.
The Unitor product and service
portfolio includes over 4,500
standard products for onboard
repair and maintenance, fire and
safety equipment and service,
refrigerants and refrigeration
system spare parts and service,
as well as a complete line of
marine chemicals.
Unitor also has a leading position
as a service supplier within the fire
and safety and refrigeration areas.

The market is characterised byan increasing number of operativevessels and stronger focus onmaintenance. Total expendituresfor maintenance should thus growin the years ahead. With thisbackground, together with plansfor intensified product introduct-ions, Unitor should be able to achieve a growth rate which is somewhat stronger than in the period 1987-1995.
Sales DevelopmentRepair and MaintenanceNOK mill.
Unitor built its´ original businessconcept on the sale of welding gases to the international merchantfleet though a system of exchang-ing empty gas cylinders for fullones. With this system, any vesselcan purchase full cylinders as needed and return them when they are empty.
In addition to welding gases,the product range has been widen-
ed over the years, and today covers most products and tools needed to maintain the hull and superstructure.
Unitor’s product philosophy isto use products as building blocksto build total concepts that solvethe customer’s maintenance problems. Welding is a goodexample of this. Unitor not onlysells welding gases, equipment andconsumables; but also trains seamen in welding techniques attraining centres in Manila, Piraeusand Oslo. Once certified, these seamen can carry out their workonboard using equipment theyknow and trust.
The average age of the worldfleet has risen steadily from 12.8years in 1980 to 18.2 years at theend of 1995. With growing press-ure for safer vessels and increas-ingly prohibitive insurance ratesfor poorly maintained vessels,good ships maintenance is nowequated with good economy.Many owners are thus systematis-ing their maintenance programsand phasing in quality assurancesystems for ship operations. The advantages of systematicmaintenance programs are several:increased usable life; better safetyfor the crew and passengers; lessthreat to the environment, moreattractive for carrying freight, andlower insurance costs.
Through a combination of organic growth and phasing in new products, the repair and mainten-ance area has had an even yearlygrowth, going from NOK 160mill. in 1987 to NOK 503 mill. in 1995.
38
Products andService
Repair and Maintenance
Unitor 1995
1991 1992 1993 1994 1995
324 341 39
7 440 462
Unitor´s internationalsystem of exchanging
empty gas cylinders forfull ones.
Maintenance has long traditions in Unitor
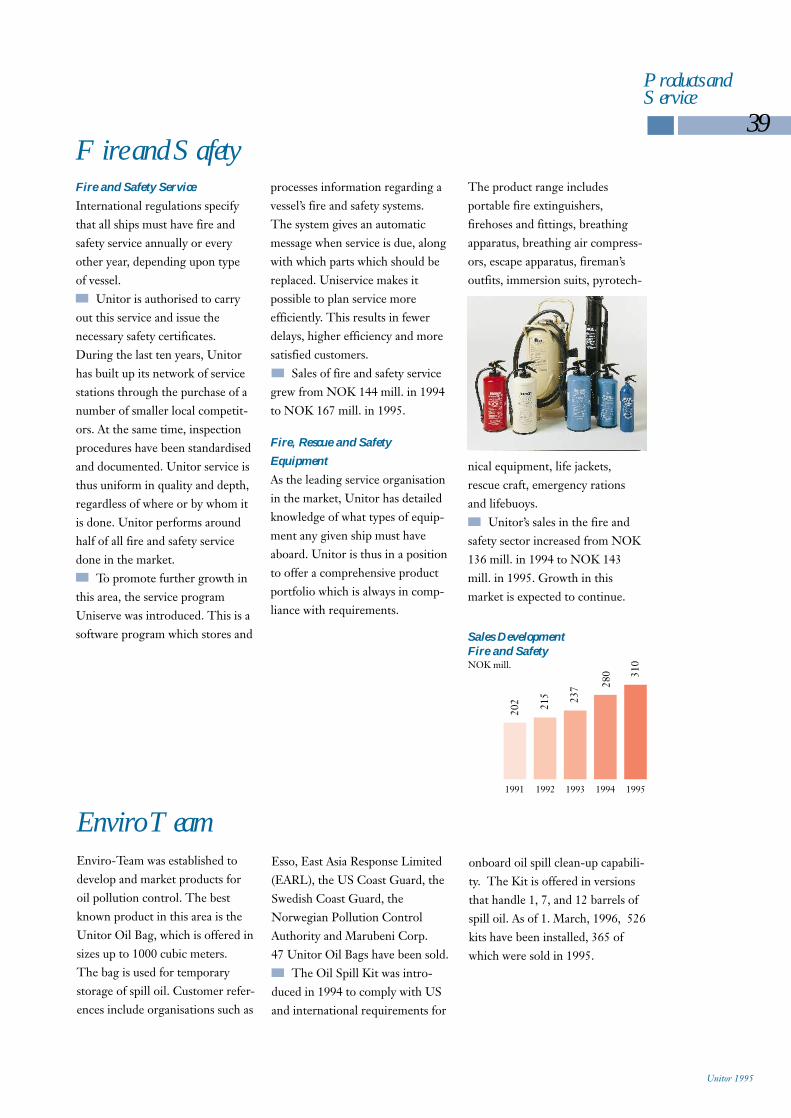
Sales DevelopmentFire and SafetyNOK mill.
Esso, East Asia Response Limited(EARL), the US Coast Guard, theSwedish Coast Guard, theNorwegian Pollution ControlAuthority and Marubeni Corp. 47 Unitor Oil Bags have been sold.
The Oil Spill Kit was intro-duced in 1994 to comply with USand international requirements for
The product range includes portable fire extinguishers, firehoses and fittings, breathing apparatus, breathing air compress-ors, escape apparatus, fireman’soutfits, immersion suits, pyrotech-
nical equipment, life jackets, rescue craft, emergency rationsand lifebuoys.
Unitor’s sales in the fire andsafety sector increased from NOK136 mill. in 1994 to NOK 143mill. in 1995. Growth in this market is expected to continue.
processes information regarding avessel’s fire and safety systems. The system gives an automaticmessage when service is due, alongwith which parts which should be replaced. Uniservice makes it possible to plan service more efficiently. This results in fewer delays, higher efficiency and moresatisfied customers.
Sales of fire and safety servicegrew from NOK 144 mill. in 1994to NOK 167 mill. in 1995.
Fire, Rescue and Safety
Equipment
As the leading service organisationin the market, Unitor has detailedknowledge of what types of equip-ment any given ship must haveaboard. Unitor is thus in a positionto offer a comprehensive productportfolio which is always in comp-liance with requirements.
Fire and Safety Service
International regulations specifythat all ships must have fire and safety service annually or every other year, depending upon type of vessel.
Unitor is authorised to carryout this service and issue the necessary safety certificates.During the last ten years, Unitorhas built up its network of servicestations through the purchase of anumber of smaller local competit-ors. At the same time, inspectionprocedures have been standardisedand documented. Unitor service isthus uniform in quality and depth,regardless of where or by whom itis done. Unitor performs aroundhalf of all fire and safety servicedone in the market.
To promote further growth inthis area, the service programUniserve was introduced. This is asoftware program which stores and
39
Products andService
Fire and Safety
Enviro Team
Unitor 1995
Enviro-Team was established todevelop and market products foroil pollution control. The bestknown product in this area is theUnitor Oil Bag, which is offered insizes up to 1000 cubic meters.The bag is used for temporarystorage of spill oil. Customer refer-ences include organisations such as
onboard oil spill clean-up capabili-ty. The Kit is offered in versionsthat handle 1, 7, and 12 barrels ofspill oil. As of 1. March, 1996, 526kits have been installed, 365 ofwhich were sold in 1995.
1991 1992 1993 1994 1995
202 21
5 237 28
0 310
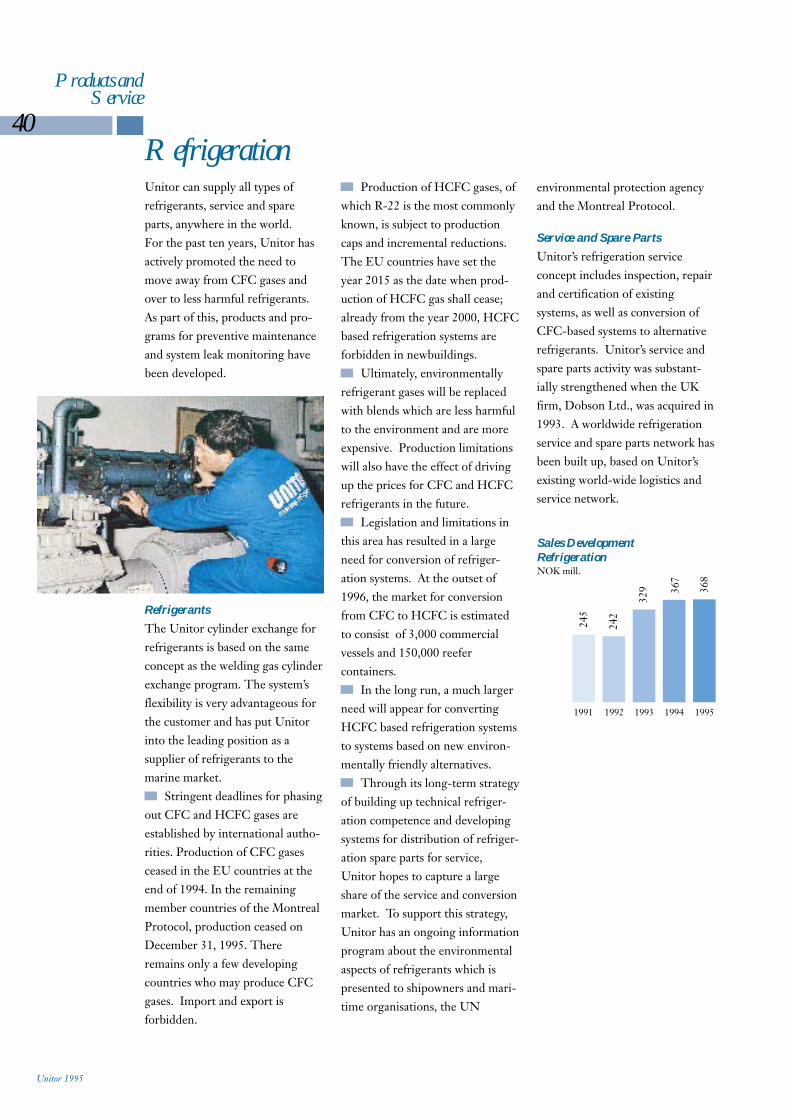
Sales Development RefrigerationNOK mill.
Products andService
Unitor can supply all types of refrigerants, service and spareparts, anywhere in the world. For the past ten years, Unitor hasactively promoted the need tomove away from CFC gases andover to less harmful refrigerants.As part of this, products and pro-grams for preventive maintenanceand system leak monitoring havebeen developed.
Refrigerants
The Unitor cylinder exchange forrefrigerants is based on the sameconcept as the welding gas cylinderexchange program. The system’sflexibility is very advantageous forthe customer and has put Unitorinto the leading position as a supplier of refrigerants to the marine market.
Stringent deadlines for phasingout CFC and HCFC gases are established by international autho-rities. Production of CFC gases ceased in the EU countries at theend of 1994. In the remainingmember countries of the MontrealProtocol, production ceased onDecember 31, 1995. There remains only a few developingcountries who may produce CFCgases. Import and export is forbidden.
Production of HCFC gases, ofwhich R-22 is the most commonlyknown, is subject to productioncaps and incremental reductions.The EU countries have set theyear 2015 as the date when prod-uction of HCFC gas shall cease;already from the year 2000, HCFCbased refrigeration systems are forbidden in newbuildings.
Ultimately, environmentallyrefrigerant gases will be replacedwith blends which are less harmfulto the environment and are more expensive. Production limitationswill also have the effect of drivingup the prices for CFC and HCFCrefrigerants in the future.
Legislation and limitations inthis area has resulted in a largeneed for conversion of refriger-ation systems. At the outset of1996, the market for conversionfrom CFC to HCFC is estimatedto consist of 3,000 commercialvessels and 150,000 reefer containers.
In the long run, a much largerneed will appear for convertingHCFC based refrigeration systemsto systems based on new environ-mentally friendly alternatives.
Through its long-term strategyof building up technical refriger-ation competence and developingsystems for distribution of refriger-ation spare parts for service,Unitor hopes to capture a largeshare of the service and conversionmarket. To support this strategy,Unitor has an ongoing informationprogram about the environmentalaspects of refrigerants which ispresented to shipowners and mari-time organisations, the UN
environmental protection agencyand the Montreal Protocol.
Service and Spare Parts
Unitor’s refrigeration service concept includes inspection, repairand certification of existing systems, as well as conversion ofCFC-based systems to alternativerefrigerants. Unitor’s service andspare parts activity was substant-ially strengthened when the UKfirm, Dobson Ltd., was acquired in1993. A worldwide refrigerationservice and spare parts network hasbeen built up, based on Unitor’sexisting world-wide logistics andservice network.
40Refrigeration
Unitor 1995
1991 1992 1993 1994 1995
245
242
329 36
7
368
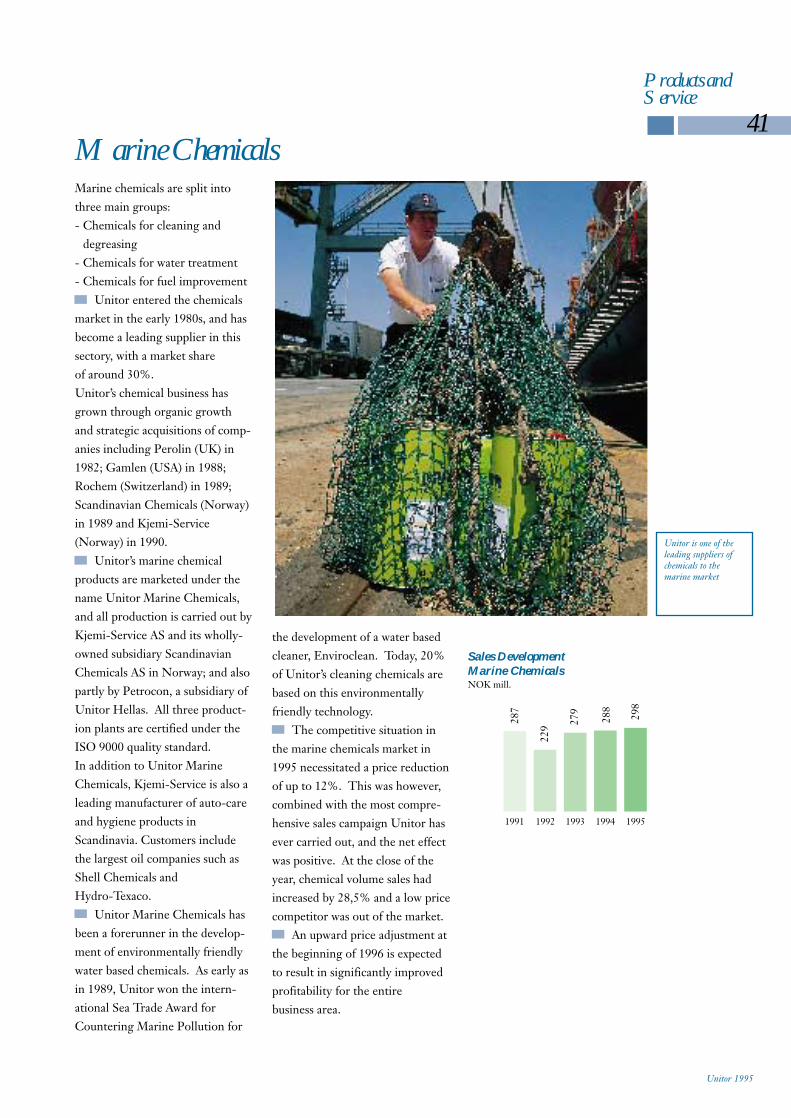
Sales DevelopmentMarine ChemicalsNOK mill.
41
Products andService
Marine chemicals are split intothree main groups: - Chemicals for cleaning and
degreasing- Chemicals for water treatment- Chemicals for fuel improvement
Unitor entered the chemicalsmarket in the early 1980s, and hasbecome a leading supplier in thissectory, with a market share of around 30%. Unitor’s chemical business hasgrown through organic growthand strategic acquisitions of comp-anies including Perolin (UK) in1982; Gamlen (USA) in 1988;Rochem (Switzerland) in 1989;Scandinavian Chemicals (Norway)in 1989 and Kjemi-Service(Norway) in 1990.
Unitor’s marine chemical products are marketed under thename Unitor Marine Chemicals,and all production is carried out byKjemi-Service AS and its wholly-owned subsidiary ScandinavianChemicals AS in Norway; and alsopartly by Petrocon, a subsidiary ofUnitor Hellas. All three product-ion plants are certified under theISO 9000 quality standard. In addition to Unitor MarineChemicals, Kjemi-Service is also aleading manufacturer of auto-careand hygiene products inScandinavia. Customers includethe largest oil companies such asShell Chemicals and Hydro-Texaco.
Unitor Marine Chemicals hasbeen a forerunner in the develop-ment of environmentally friendlywater based chemicals. As early asin 1989, Unitor won the intern-ational Sea Trade Award forCountering Marine Pollution for
the development of a water basedcleaner, Enviroclean. Today, 20%of Unitor’s cleaning chemicals arebased on this environmentally friendly technology.
The competitive situation inthe marine chemicals market in1995 necessitated a price reductionof up to 12%. This was however,combined with the most compre-hensive sales campaign Unitor hasever carried out, and the net effectwas positive. At the close of theyear, chemical volume sales had increased by 28,5% and a low pricecompetitor was out of the market.
An upward price adjustment atthe beginning of 1996 is expectedto result in significantly improvedprofitability for the entire business area.
Marine Chemicals
Unitor 1995
1991 1992 1993 1994 1995
287
229 27
9
288
298
Unitor is one of theleading suppliers ofchemicals to the marine market
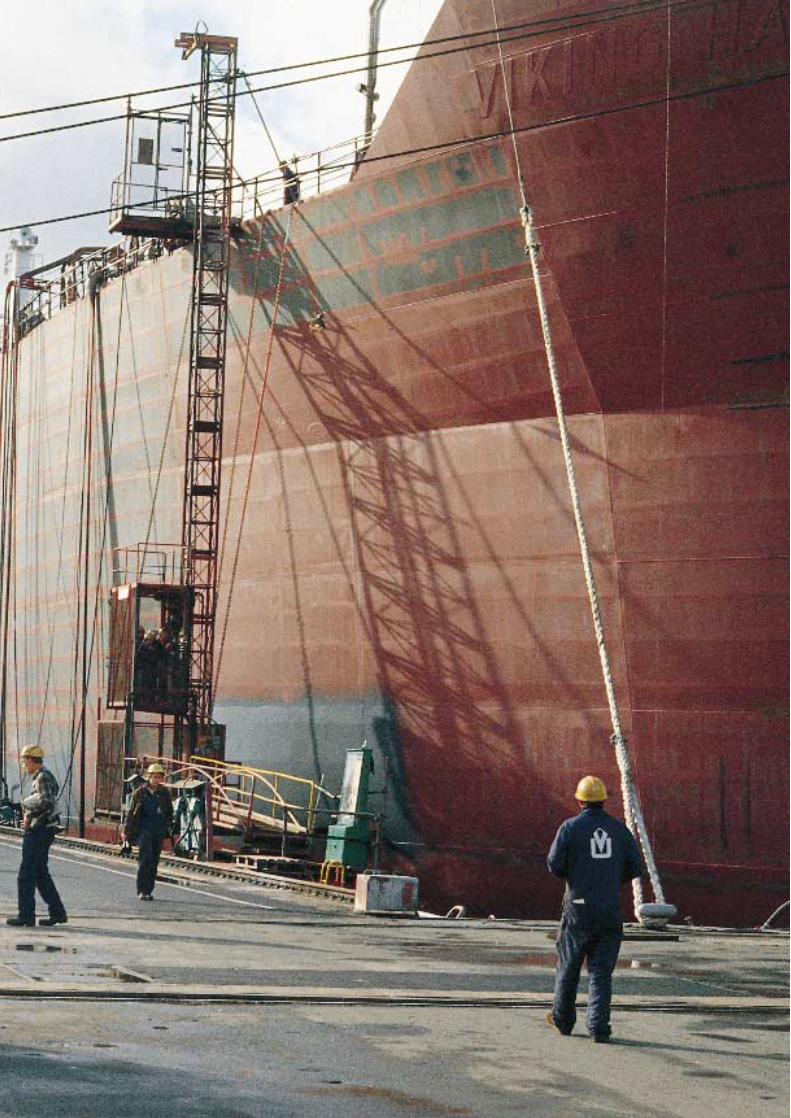
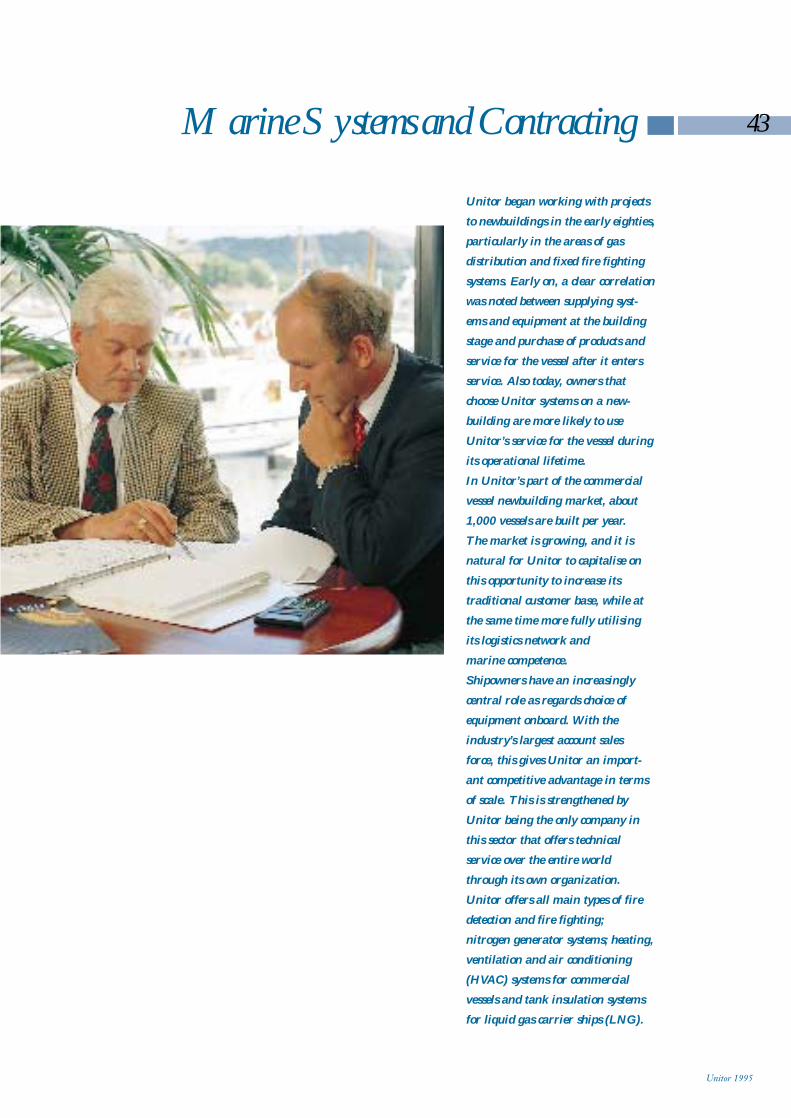
43Marine Systems and Contracting
Unitor began working with projects
to newbuildings in the early eighties,
particularly in the areas of gas
distribution and fixed fire fighting
systems. Early on, a clear correlation
was noted between supplying syst-
ems and equipment at the building
stage and purchase of products and
service for the vessel after it enters
service. Also today, owners that
choose Unitor systems on a new-
building are more likely to use
Unitor’s service for the vessel during
its operational lifetime.
In Unitor’s part of the commercial
vessel newbuilding market, about
1,000 vessels are built per year.
The market is growing, and it is
natural for Unitor to capitalise on
this opportunity to increase its
traditional customer base, while at
the same time more fully utilising
its logistics network and
marine competence.
Shipowners have an increasingly
central role as regards choice of
equipment onboard. With the
industry’s largest account sales
force, this gives Unitor an import-
ant competitive advantage in terms
of scale. This is strengthened by
Unitor being the only company in
this sector that offers technical
service over the entire world
through its own organization.
Unitor offers all main types of fire
detection and fire fighting;
nitrogen generator systems; heating,
ventilation and air conditioning
(HVAC) systems for commercial
vessels and tank insulation systems
for liquid gas carrier ships (LNG).
Unitor 1995
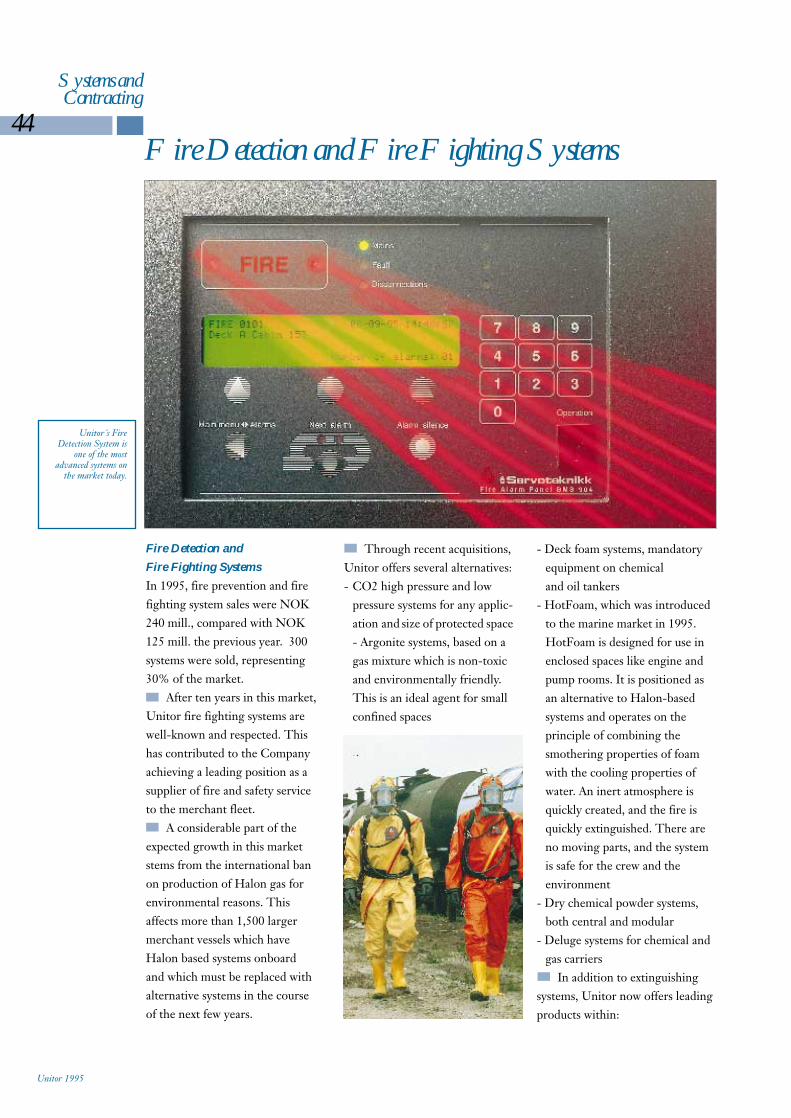
44
Systems andContracting
Fire Detection and
Fire Fighting Systems
In 1995, fire prevention and firefighting system sales were NOK240 mill., compared with NOK125 mill. the previous year. 300systems were sold, representing30% of the market.
After ten years in this market,Unitor fire fighting systems arewell-known and respected. Thishas contributed to the Companyachieving a leading position as asupplier of fire and safety serviceto the merchant fleet.
A considerable part of the expected growth in this marketstems from the international banon production of Halon gas for environmental reasons. This affects more than 1,500 largermerchant vessels which haveHalon based systems onboard and which must be replaced with alternative systems in the course of the next few years.
Through recent acquisitions,Unitor offers several alternatives:- CO2 high pressure and low
pressure systems for any applic-ation and size of protected space- Argonite systems, based on a gas mixture which is non-toxic and environmentally friendly. This is an ideal agent for small confined spaces
- Deck foam systems, mandatory equipment on chemical and oil tankers
- HotFoam, which was introduced to the marine market in 1995. HotFoam is designed for use in enclosed spaces like engine and pump rooms. It is positioned as an alternative to Halon-based systems and operates on theprinciple of combining the smothering properties of foam with the cooling properties of water. An inert atmosphere is quickly created, and the fire is quickly extinguished. There are no moving parts, and the system is safe for the crew and the environment
- Dry chemical powder systems, both central and modular
- Deluge systems for chemical and gas carriers
In addition to extinguishing systems, Unitor now offers leadingproducts within:
Fire Detection and Fire Fighting Systems
Unitor 1995
Unitor´s FireDetection System is
one of the most advanced systems on
the market today.
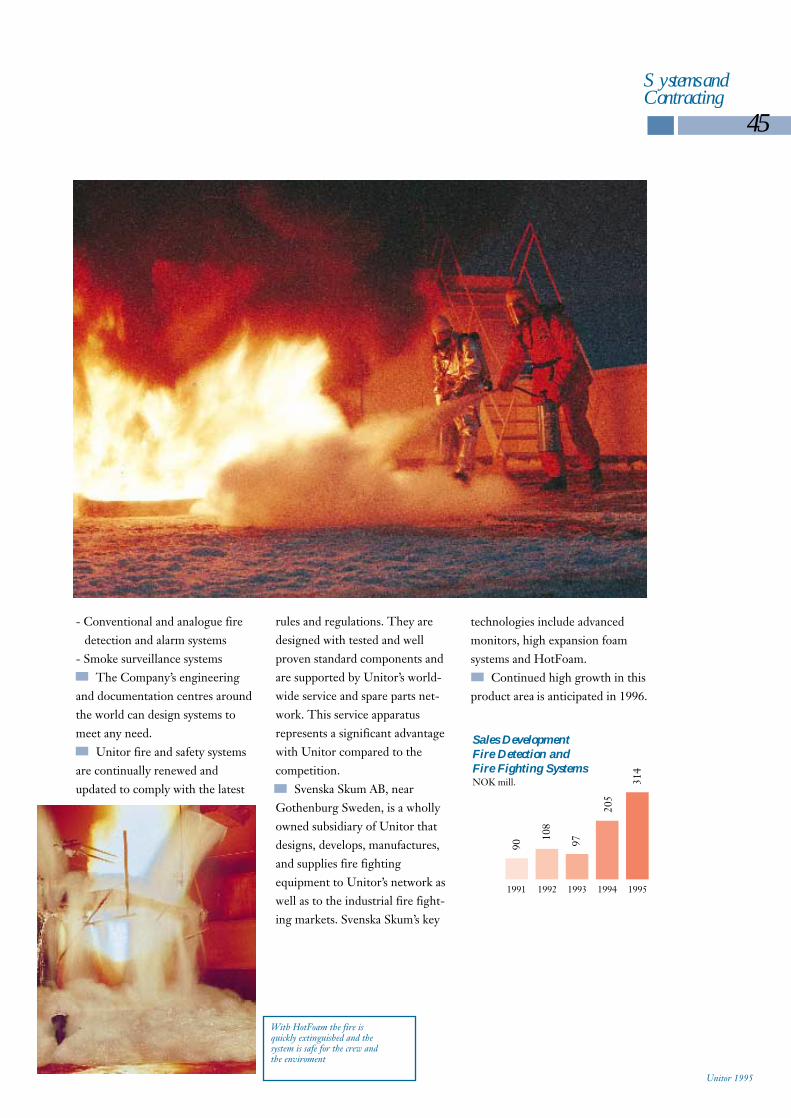
Sales DevelopmentFire Detection and Fire Fighting SystemsNOK mill.
rules and regulations. They aredesigned with tested and well proven standard components andare supported by Unitor’s world-wide service and spare parts net-work. This service apparatus represents a significant advantagewith Unitor compared to the competition.
Svenska Skum AB, nearGothenburg Sweden, is a whollyowned subsidiary of Unitor thatdesigns, develops, manufactures,and supplies fire fighting equipment to Unitor’s network aswell as to the industrial fire fight-ing markets. Svenska Skum’s key
- Conventional and analogue fire detection and alarm systems
- Smoke surveillance systemsThe Company’s engineering
and documentation centres around the world can design systems tomeet any need.
Unitor fire and safety systemsare continually renewed and updated to comply with the latest
45
Systems andContracting
Unitor 1995
technologies include advancedmonitors, high expansion foamsystems and HotFoam.
Continued high growth in thisproduct area is anticipated in 1996.
1991 1992 1993 1994 1995
90
108
97
205
314
With HotFoam the fire is quickly extinguished and the system is safe for the crew andthe enviroment
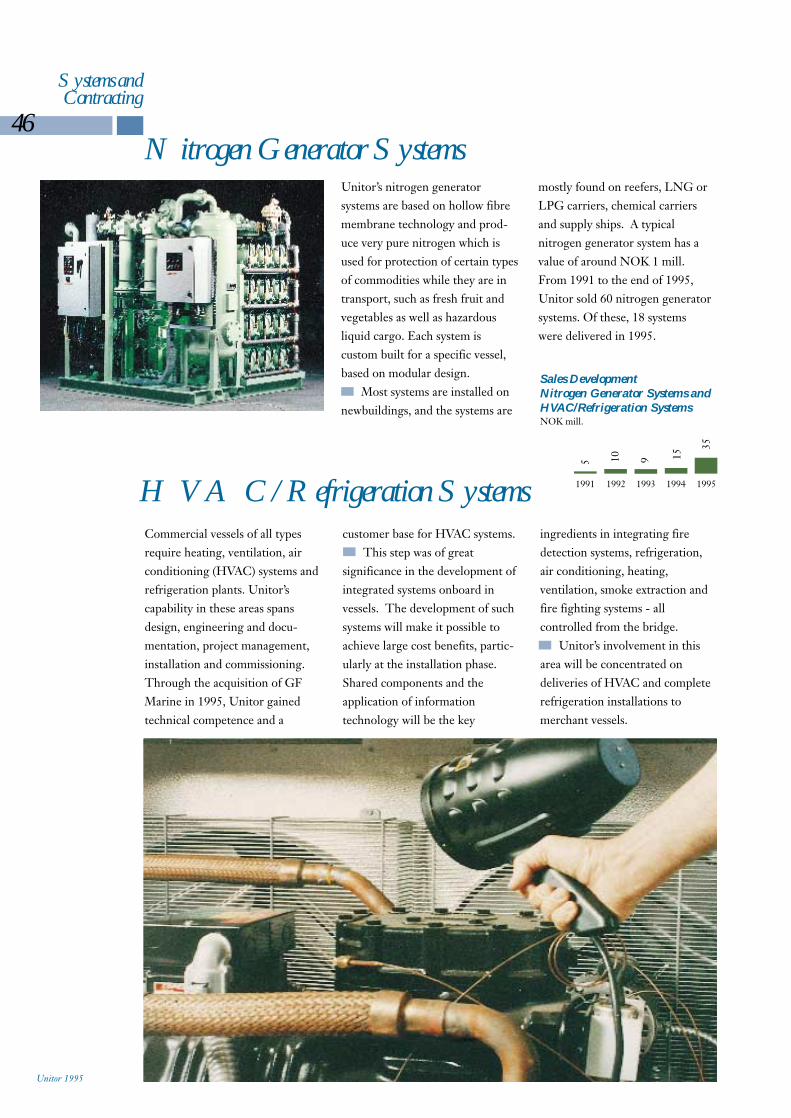
Sales DevelopmentNitrogen Generator Systems andHVAC/Refrigeration SystemsNOK mill.
ingredients in integrating fire detection systems, refrigeration,air conditioning, heating, ventilation, smoke extraction andfire fighting systems - all controlled from the bridge.
Unitor’s involvement in thisarea will be concentrated on deliveries of HVAC and complete refrigeration installations to merchant vessels.
46
Systems andContracting
Unitor’s nitrogen generator systems are based on hollow fibremembrane technology and prod-uce very pure nitrogen which isused for protection of certain typesof commodities while they are intransport, such as fresh fruit andvegetables as well as hazardous liquid cargo. Each system is custom built for a specific vessel, based on modular design.
Most systems are installed onnewbuildings, and the systems are
Commercial vessels of all types require heating, ventilation, airconditioning (HVAC) systems andrefrigeration plants. Unitor’s capability in these areas spans design, engineering and docu-mentation, project management, installation and commissioning.Through the acquisition of GFMarine in 1995, Unitor gainedtechnical competence and a
customer base for HVAC systems. This step was of great
significance in the development ofintegrated systems onboard in vessels. The development of suchsystems will make it possible toachieve large cost benefits, partic-ularly at the installation phase.Shared components and the application of information technology will be the key
Nitrogen Generator Systems
H VA C / Refrigeration Systems
Unitor 1995
mostly found on reefers, LNG orLPG carriers, chemical carriersand supply ships. A typical nitrogen generator system has avalue of around NOK 1 mill.From 1991 to the end of 1995,Unitor sold 60 nitrogen generator systems. Of these, 18 systems were delivered in 1995.
1991 1992 1993 1994 1995
5 10 9 15
35
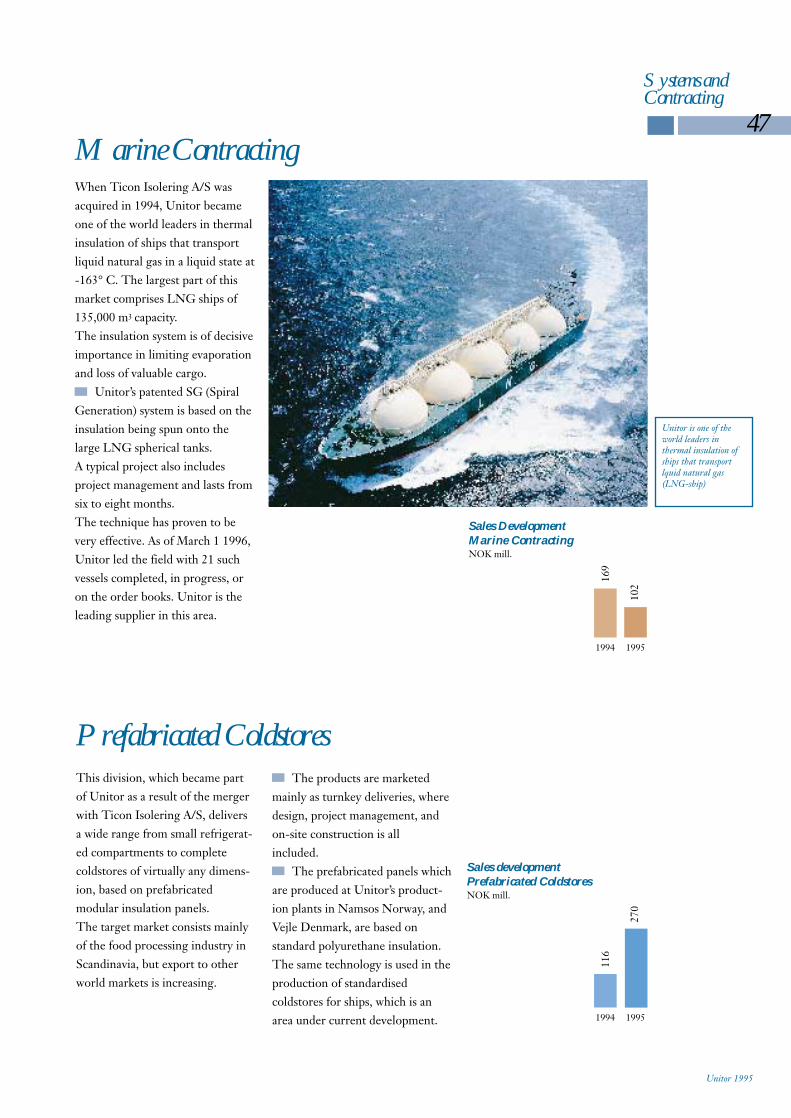
The products are marketedmainly as turnkey deliveries, wheredesign, project management, andon-site construction is all included.
The prefabricated panels whichare produced at Unitor’s product-ion plants in Namsos Norway, andVejle Denmark, are based on standard polyurethane insulation. The same technology is used in theproduction of standardised coldstores for ships, which is anarea under current development.
Sales DevelopmentMarine ContractingNOK mill.
3
47
Systems andContracting
When Ticon Isolering A/S was acquired in 1994, Unitor becameone of the world leaders in thermalinsulation of ships that transport liquid natural gas in a liquid state at-163° C. The largest part of thismarket comprises LNG ships of135,000 m capacity. The insulation system is of decisiveimportance in limiting evaporationand loss of valuable cargo.
Unitor’s patented SG (SpiralGeneration) system is based on theinsulation being spun onto the large LNG spherical tanks. A typical project also includes project management and lasts fromsix to eight months. The technique has proven to bevery effective. As of March 1 1996,Unitor led the field with 21 suchvessels completed, in progress, oron the order books. Unitor is theleading supplier in this area.
This division, which became partof Unitor as a result of the mergerwith Ticon Isolering A/S, deliversa wide range from small refrigerat-ed compartments to complete coldstores of virtually any dimens-ion, based on prefabricated modular insulation panels. The target market consists mainlyof the food processing industry inScandinavia, but export to otherworld markets is increasing.
Marine Contracting
Prefabricated Coldstores
Unitor 1995
1994 1995
169
102
1994 1995
116
270
Sales developmentPrefabricated ColdstoresNOK mill.
Unitor is one of theworld leaders in thermal insulation ofships that transportlquid natural gas(LNG-ship)


49
Unitor is convinced that safer
products and products that are less
harmful to the environment are
sensible strategies for a responsible
corporate citizen in today’s world.
Information is a key element in
product safety. For each of its´
chemical products, Unitor
publishes a Material and Safety
Data Sheet in 12 languages to
reflect the cultural diversity
of the user group.
An innovative product labelling
system has been developed for
chemicals. Each label includes a
product data sheet, material
safety data sheet and all other
information that might be
necessary in case of emergency.
A Dangerous Goods Journal has
been developed and distributed to
the marine community. It is used
to log use of dangerous substances
onboard a vessel and has been
widely hailed as a model for
future regulatory measures.
Safety and the Environment
Unitor 1995
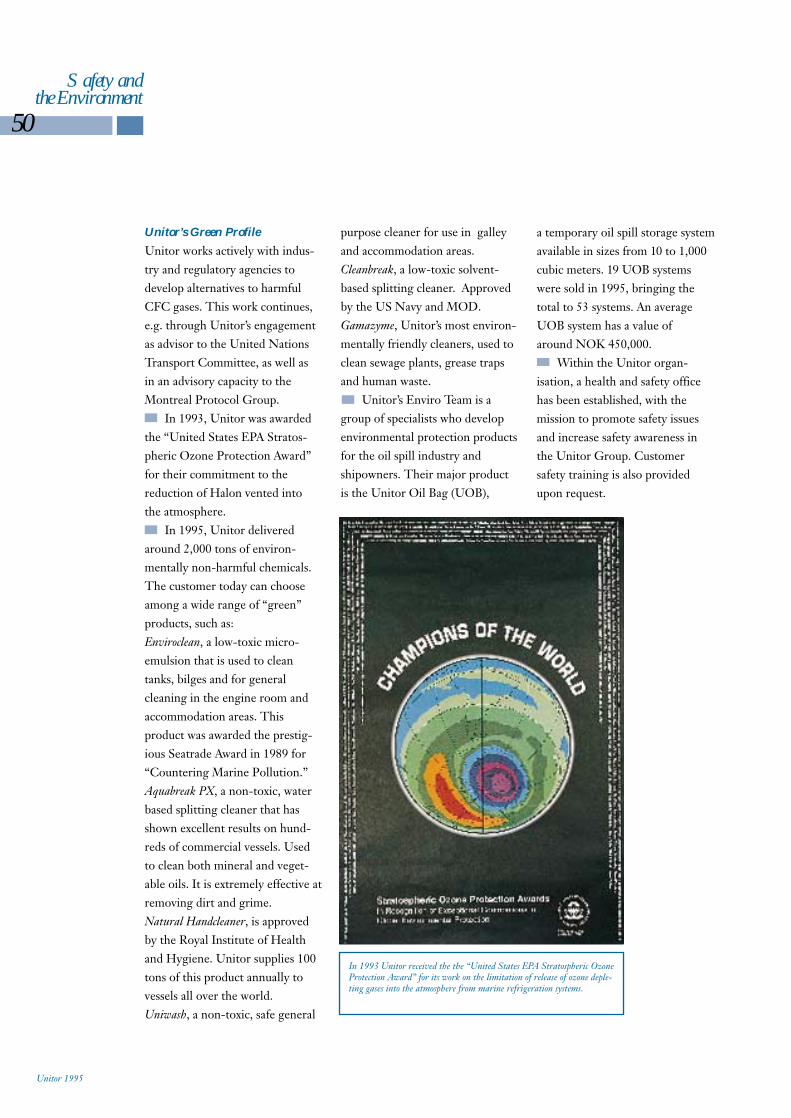
purpose cleaner for use in galleyand accommodation areas. Cleanbreak, a low-toxic solvent-based splitting cleaner. Approvedby the US Navy and MOD.Gamazyme, Unitor’s most environ-mentally friendly cleaners, used toclean sewage plants, grease trapsand human waste.
Unitor’s Enviro Team is agroup of specialists who developenvironmental protection productsfor the oil spill industry and shipowners. Their major productis the Unitor Oil Bag (UOB),
50
Safety and the Environment
Unitor’s Green Profile
Unitor works actively with indus-try and regulatory agencies to develop alternatives to harmfulCFC gases. This work continues,e.g. through Unitor’s engagementas advisor to the United NationsTransport Committee, as well as in an advisory capacity to theMontreal Protocol Group.
In 1993, Unitor was awardedthe “United States EPA Stratos-pheric Ozone Protection Award”for their commitment to the reduction of Halon vented into the atmosphere.
In 1995, Unitor deliveredaround 2,000 tons of environ-mentally non-harmful chemicals.The customer today can chooseamong a wide range of “green”products, such as:Enviroclean, a low-toxic micro-emulsion that is used to cleantanks, bilges and for general cleaning in the engine room andaccommodation areas. This product was awarded the prestig-ious Seatrade Award in 1989 for“Countering Marine Pollution.”Aquabreak PX, a non-toxic, waterbased splitting cleaner that hasshown excellent results on hund-reds of commercial vessels. Usedto clean both mineral and veget-able oils. It is extremely effective atremoving dirt and grime.Natural Handcleaner, is approvedby the Royal Institute of Healthand Hygiene. Unitor supplies 100tons of this product annually tovessels all over the world.Uniwash, a non-toxic, safe general
a temporary oil spill storage system available in sizes from 10 to 1,000 cubic meters. 19 UOB systemswere sold in 1995, bringing the total to 53 systems. An averageUOB system has a value of around NOK 450,000.
Within the Unitor organ-isation, a health and safety officehas been established, with the mission to promote safety issuesand increase safety awareness inthe Unitor Group. Customer safety training is also providedupon request.
Unitor 1995
In 1993 Unitor received the the “United States EPA Stratospheric OzoneProtection Award” for its work on the limitation of release of ozone deple-ting gases into the atmosphere from marine refrigeration systems.
NotesUnitor Group 1995
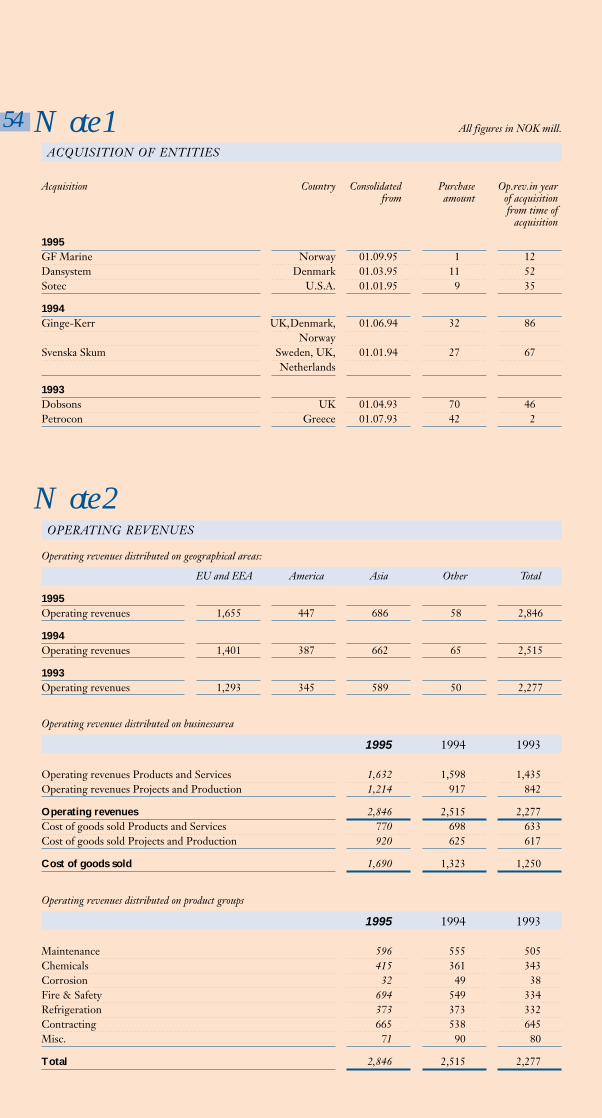
54 Note 1 All figures in NOK mill.
1995 1994 1993
Operating revenues Products and Services 1,632 1,598 1,435Operating revenues Projects and Production 1,214 917 842
Operating revenues 2,846 2,515 2,277Cost of goods sold Products and Services 770 698 633Cost of goods sold Projects and Production 920 625 617
Cost of goods sold 1,690 1,323 1,250
Operating revenues distributed on businessarea
1995 1994 1993
Maintenance 596 555 505Chemicals 415 361 343Corrosion 32 49 38Fire & Safety 694 549 334Refrigeration 373 373 332Contracting 665 538 645Misc. 71 90 80
Total 2,846 2,515 2,277
Operating revenues distributed on product groups
Note 2OPERATING REVENUES
Operating revenues distributed on geographical areas:
EU and EEA America Asia Other Total
1995Operating revenues 1,655 447 686 58 2,846
1994Operating revenues 1,401 387 662 65 2,515
1993Operating revenues 1,293 345 589 50 2,277
ACQUISITION OF ENTITIES
Acquisition Country Consolidated Purchase Op.rev.in yearfrom amount of acquisition
from time ofacquisition
1995GF Marine Norway 01.09.95 1 12Dansystem Denmark 01.03.95 11 52Sotec U.S.A. 01.01.95 9 35
1994Ginge-Kerr UK,Denmark, 01.06.94 32 86
NorwaySvenska Skum Sweden, UK, 01.01.94 27 67
Netherlands
1993Dobsons UK 01.04.93 70 46Petrocon Greece 01.07.93 42 2

55
Note 4
Note 3
Cost of goods sold includes wages and other direct production costs with respectively 175 and 67 for 1995, 173 and 106 for 1994 and 183 and 58 for 1993.
OTHER FINANCIAL EXPENCES 1995 1994 1993
Net realised foreign exchange (gain)/loss (17.9) (23.5) 25.0Net unrealised foreign exchange (gain)/loss 20.7 21.9 (24.3)(Gain)/loss on pricelist hedging (25.9) (7.0) 28.4Other expenses 5.1 6.0 3.8
Total other financial expenses (18.0) (2.6) 32.9
Note 5
Note 6TAXES 1995 1994 1993
TAX PAYABLE:Norway 46.1 57.4 41.2Abroad 16.8 14.6 9.6
Total tax payable 62.9 72.0 50.8
Change in deferred tax:Norway (28.6) (3.6) 10.3Abroad 5.4 (2.5) (3.6)
Total changes in deferred tax (23.2) (6.1) 6.7
Taxes 39.7 65.9 57.5
COST OF GOODS SOLD
SHARES IN LIMITED PARTNERSHIPS (KS)
The result for KS Team Heina is included in the Group accounts with the following items: 1995 1994 1993
Operating revenues 21.5 28.0Other operating expenses (3.0) 0.4 0.5Ordinary depreciation 9.6 9.6
Operating result 3.0 11.5 17.9Net financial expenses 8.9 9.0
Result before taxes 3.0 2.6 8.9Minority interest 0.3 0.9
Net profit 3.0 2.3 8.0
Commited capital not paid 39.4 39.4 39.4
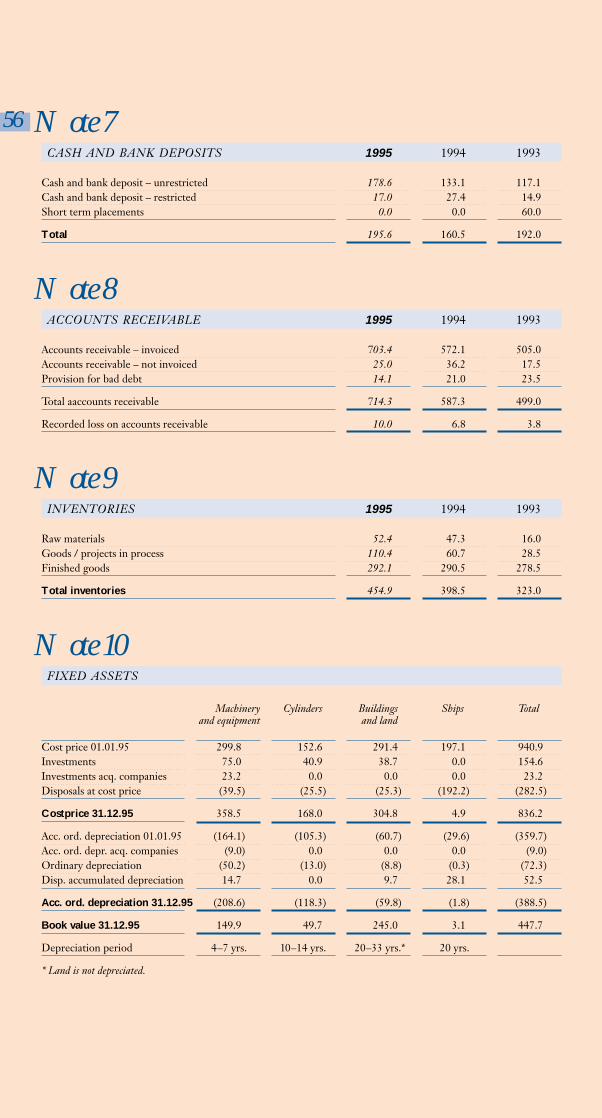
CASH AND BANK DEPOSITS 1995 1994 1993
Cash and bank deposit – unrestricted 178.6 133.1 117.1Cash and bank deposit – restricted 17.0 27.4 14.9Short term placements 0.0 0.0 60.0
Total 195.6 160.5 192.0
56 Note 7
ACCOUNTS RECEIVABLE 1995 1994 1993
Accounts receivable – invoiced 703.4 572.1 505.0Accounts receivable – not invoiced 25.0 36.2 17.5Provision for bad debt 14.1 21.0 23.5
Total aaccounts receivable 714.3 587.3 499.0
Recorded loss on accounts receivable 10.0 6.8 3.8
Note 8
INVENTORIES 1995 1994 1993
Raw materials 52.4 47.3 16.0Goods / projects in process 110.4 60.7 28.5Finished goods 292.1 290.5 278.5
Total inventories 454.9 398.5 323.0
Note 9
FIXED ASSETS
Machinery Cylinders Buildings Ships Totaland equipment and land
Cost price 01.01.95 299.8 152.6 291.4 197.1 940.9Investments 75.0 40.9 38.7 0.0 154.6Investments acq. companies 23.2 0.0 0.0 0.0 23.2Disposals at cost price (39.5) (25.5) (25.3) (192.2) (282.5)
Costprice 31.12.95 358.5 168.0 304.8 4.9 836.2
Acc. ord. depreciation 01.01.95 (164.1) (105.3) (60.7) (29.6) (359.7)Acc. ord. depr. acq. companies (9.0) 0.0 0.0 0.0 (9.0)Ordinary depreciation (50.2) (13.0) (8.8) (0.3) (72.3)Disp. accumulated depreciation 14.7 0.0 9.7 28.1 52.5
Acc. ord. depreciation 31.12.95 (208.6) (118.3) (59.8) (1.8) (388.5)
Book value 31.12.95 149.9 49.7 245.0 3.1 447.7
Depreciation period 4–7 yrs. 10–14 yrs. 20–33 yrs.* 20 yrs.
* Land is not depreciated.
Note 10
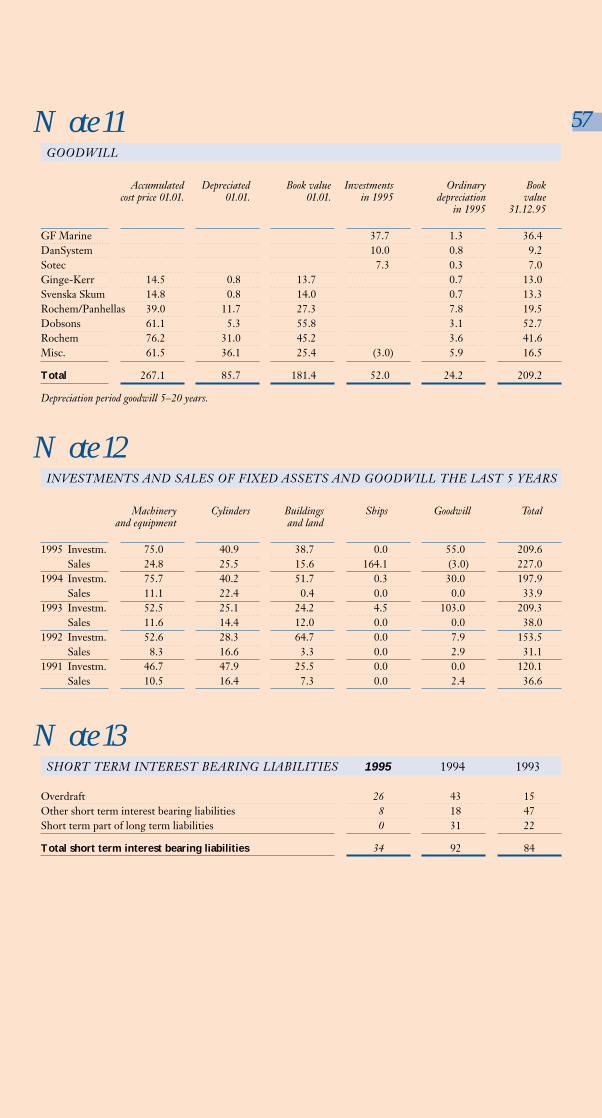
GOODWILL
Accumulated Depreciated Book value Investments Ordinary Bookcost price 01.01. 01.01. 01.01. in 1995 depreciation value
in 1995 31.12.95
GF Marine 37.7 1.3 36.4DanSystem 10.0 0.8 9.2Sotec 7.3 0.3 7.0Ginge-Kerr 14.5 0.8 13.7 0.7 13.0Svenska Skum 14.8 0.8 14.0 0.7 13.3Rochem/Panhellas 39.0 11.7 27.3 7.8 19.5Dobsons 61.1 5.3 55.8 3.1 52.7Rochem 76.2 31.0 45.2 3.6 41.6Misc. 61.5 36.1 25.4 (3.0) 5.9 16.5
Total 267.1 85.7 181.4 52.0 24.2 209.2
Depreciation period goodwill 5–20 years.
57
SHORT TERM INTEREST BEARING LIABILITIES 1995 1994 1993
Overdraft 26 43 15Other short term interest bearing liabilities 8 18 47Short term part of long term liabilities 0 31 22
Total short term interest bearing liabilities 34 92 84
Note 13
Note 11
INVESTMENTS AND SALES OF FIXED ASSETS AND GOODWILL THE LAST 5 YEARS
Machinery Cylinders Buildings Ships Goodwill Totaland equipment and land
1995 Investm. 75.0 40.9 38.7 0.0 55.0 209.6Sales 24.8 25.5 15.6 164.1 (3.0) 227.0
1994 Investm. 75.7 40.2 51.7 0.3 30.0 197.9Sales 11.1 22.4 0.4 0.0 0.0 33.9
1993 Investm. 52.5 25.1 24.2 4.5 103.0 209.3Sales 11.6 14.4 12.0 0.0 0.0 38.0
1992 Investm. 52.6 28.3 64.7 0.0 7.9 153.5Sales 8.3 16.6 3.3 0.0 2.9 31.1
1991 Investm. 46.7 47.9 25.5 0.0 0.0 120.1Sales 10.5 16.4 7.3 0.0 2.4 36.6
Note 12
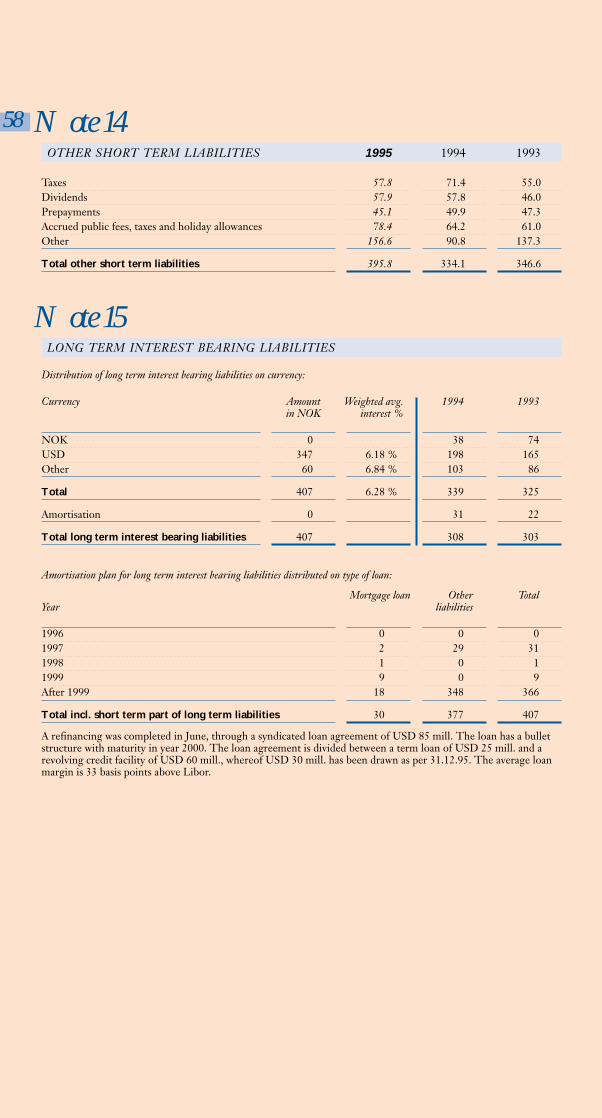
LONG TERM INTEREST BEARING LIABILITIES
Distribution of long term interest bearing liabilities on currency:
Currency Amount Weighted avg. 1994 1993in NOK interest %
NOK 0 38 74USD 347 6.18 % 198 165Other 60 6.84 % 103 86
Total 407 6.28 % 339 325
Amortisation 0 31 22
Total long term interest bearing liabilities 407 308 303
58
Note 15
Mortgage loan Other TotalYear liabilities
1996 0 0 01997 2 29 311998 1 0 11999 9 0 9After 1999 18 348 366
Total incl. short term part of long term liabilities 30 377 407
A refinancing was completed in June, through a syndicated loan agreement of USD 85 mill. The loan has a bulletstructure with maturity in year 2000. The loan agreement is divided between a term loan of USD 25 mill. and a revolving credit facility of USD 60 mill., whereof USD 30 mill. has been drawn as per 31.12.95. The average loanmargin is 33 basis points above Libor.
Amortisation plan for long term interest bearing liabilities distributed on type of loan:
OTHER SHORT TERM LIABILITIES 1995 1994 1993
Taxes 57.8 71.4 55.0Dividends 57.9 57.8 46.0Prepayments 45.1 49.9 47.3Accrued public fees, taxes and holiday allowances 78.4 64.2 61.0Other 156.6 90.8 137.3
Total other short term liabilities 395.8 334.1 346.6
Note 14
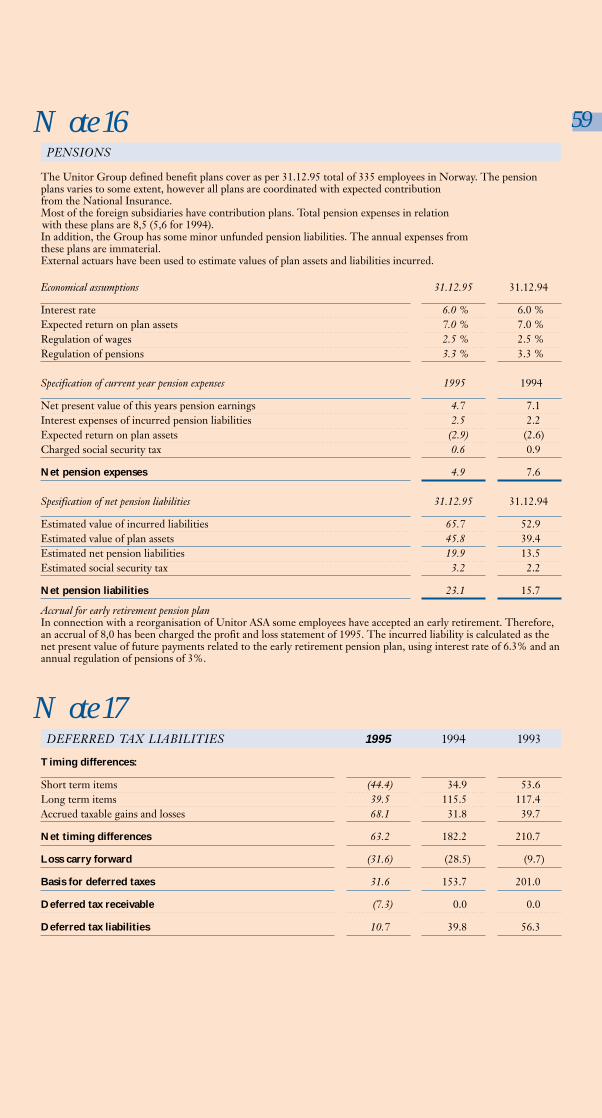
59Note 16
Note 17
PENSIONS
The Unitor Group defined benefit plans cover as per 31.12.95 total of 335 employees in Norway. The pensionplans varies to some extent, however all plans are coordinated with expected contribution from the National Insurance.Most of the foreign subsidiaries have contribution plans. Total pension expenses in relationwith these plans are 8,5 (5,6 for 1994).In addition, the Group has some minor unfunded pension liabilities. The annual expenses from these plans are immaterial.External actuars have been used to estimate values of plan assets and liabilities incurred.
Economical assumptions 31.12.95 31.12.94
Interest rate 6.0 % 6.0 %Expected return on plan assets 7.0 % 7.0 %Regulation of wages 2.5 % 2.5 %Regulation of pensions 3.3 % 3.3 %
Specification of current year pension expenses 1995 1994
Net present value of this years pension earnings 4.7 7.1Interest expenses of incurred pension liabilities 2.5 2.2Expected return on plan assets (2.9) (2.6)Charged social security tax 0.6 0.9
Net pension expenses 4.9 7.6
Spesification of net pension liabilities 31.12.95 31.12.94
Estimated value of incurred liabilities 65.7 52.9Estimated value of plan assets 45.8 39.4Estimated net pension liabilities 19.9 13.5Estimated social security tax 3.2 2.2
Net pension liabilities 23.1 15.7
Accrual for early retirement pension planIn connection with a reorganisation of Unitor ASA some employees have accepted an early retirement. Therefore,an accrual of 8,0 has been charged the profit and loss statement of 1995. The incurred liability is calculated as thenet present value of future payments related to the early retirement pension plan, using interest rate of 6.3% and an annual regulation of pensions of 3%.
DEFERRED TAX LIABILITIES 1995 1994 1993
Timing differences:
Short term items (44.4) 34.9 53.6Long term items 39.5 115.5 117.4Accrued taxable gains and losses 68.1 31.8 39.7
Net timing differences 63.2 182.2 210.7
Loss carry forward (31.6) (28.5) (9.7)
Basis for deferred taxes 31.6 153.7 201.0
Deferred tax receivable (7.3) 0.0 0.0
Deferred tax liabilities 10.7 39.8 56.3

60
EQUITY
Share- Restr. funds Ret. earnings Group Totalcapital in Unitor ASA Unitor ASA Reserve
Equity per 31.12.92 214.7 323.8 196.8 70.9 806.2
Net profit 100.7 12.5 113.2Dividends (NOK 2.60 per share) (45.8) (45.8)Share issue empl., incl. premium 2.8 8.0 10.8Group contribution (1.9) 1.9 0.0Rev. temporary restricted funds (11.1) 11.1 0.0Equity Ticon Isolering* 23.7 0.2 23.9
Equity per 31.12.93 217.5 320.7 284.6 85.5 908.3
Net profit 21.7 123.8 (0.4) 145.1Dividends (NOK 3.00 per share) (57.8) (57.8)Merger Ticon Isolering 18.9 (32.6) (36.3) (50.0)Share issue empl., incl. premium 2.6 15.0 17.6Group contribution (16.0) 16.0 0.0Implem. of new pension stand. (10.9) 0.3 (10.6)Rev. temporary restricted funds (11.2) 11.2 0.0
Equity per 31.12.94 239.0 313.6 298.6 101.4 952.6
Net profit 11.7 59.5 14.1 85.3Dividends (NOK 3.00 per share) (57.9) (57.9)Merger Ginge-Kerr AS. Norway 8.1 (8.1) 0.0Share issue empl., incl. premium 2.1 13.1 15.2Group contribution (17.0) 17.0 0.0Reversed temporary restricted funds (11.2) 11.2 0.0
Equity per 31.12.95 241.1 335.3 294.4 124.4 995.2
* Included in retained earnings for 1994 as a consequence of Ticon Isolering being consolidated into the group accounts for 1994.
Note 18
Note 19CASHFLOW
From 1995 the net effect on cash position from purchase and sale of activity will be shown separately in the analysisof cashflow, and is not reflected in other items of the analysis related to increases or reductions in balance sheetitems. The analysis of cashflow for the years 1994 and 1993 has been changed accordingly.Disposal of fixed assets is mainly related to the sale of product tanker M/T Team Heina and of the head office offormer Ticon Isolering.The increase in new long term liabilities and downpayments of long term liabilities is related to the refinancing ofthe Unitor Group, completed in June 1995.
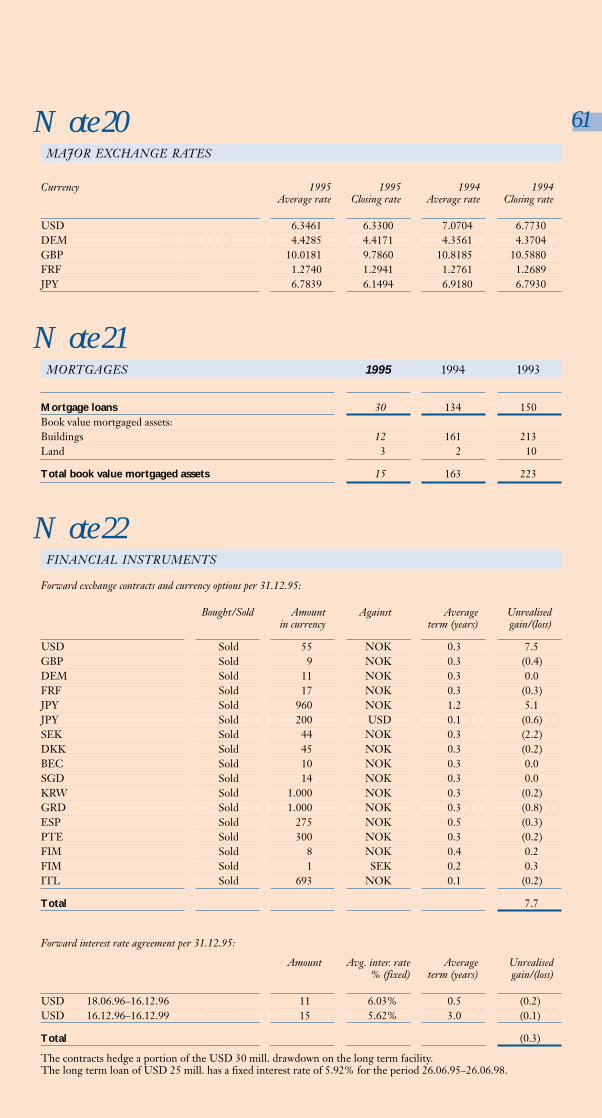
61
MAJOR EXCHANGE RATES
Currency 1995 1995 1994 1994Average rate Closing rate Average rate Closing rate
USD 6.3461 6.3300 7.0704 6.7730DEM 4.4285 4.4171 4.3561 4.3704GBP 10.0181 9.7860 10.8185 10.5880FRF 1.2740 1.2941 1.2761 1.2689JPY 6.7839 6.1494 6.9180 6.7930
Note 20
Note 21
Note 22
Amount Avg. inter. rate Average Unrealised% (fixed) term (years) gain/(loss)
USD 18.06.96–16.12.96 11 6.03% 0.5 (0.2)USD 16.12.96–16.12.99 15 5.62% 3.0 (0.1)
Total (0.3)
The contracts hedge a portion of the USD 30 mill. drawdown on the long term facility.The long term loan of USD 25 mill. has a fixed interest rate of 5.92% for the period 26.06.95–26.06.98.
Forward interest rate agreement per 31.12.95:
MORTGAGES 1995 1994 1993
Mortgage loans 30 134 150Book value mortgaged assets:Buildings 12 161 213Land 3 2 10
Total book value mortgaged assets 15 163 223
FINANCIAL INSTRUMENTS
Forward exchange contracts and currency options per 31.12.95:
Bought/Sold Amount Against Average Unrealisedin currency term (years) gain/(loss)
USD Sold 55 NOK 0.3 7.5GBP Sold 9 NOK 0.3 (0.4)DEM Sold 11 NOK 0.3 0.0FRF Sold 17 NOK 0.3 (0.3)JPY Sold 960 NOK 1.2 5.1JPY Sold 200 USD 0.1 (0.6)SEK Sold 44 NOK 0.3 (2.2)DKK Sold 45 NOK 0.3 (0.2)BEC Sold 10 NOK 0.3 0.0SGD Sold 14 NOK 0.3 0.0KRW Sold 1.000 NOK 0.3 (0.2)GRD Sold 1.000 NOK 0.3 (0.8)ESP Sold 275 NOK 0.5 (0.3)PTE Sold 300 NOK 0.3 (0.2)FIM Sold 8 NOK 0.4 0.2FIM Sold 1 SEK 0.2 0.3ITL Sold 693 NOK 0.1 (0.2)
Total 7.7
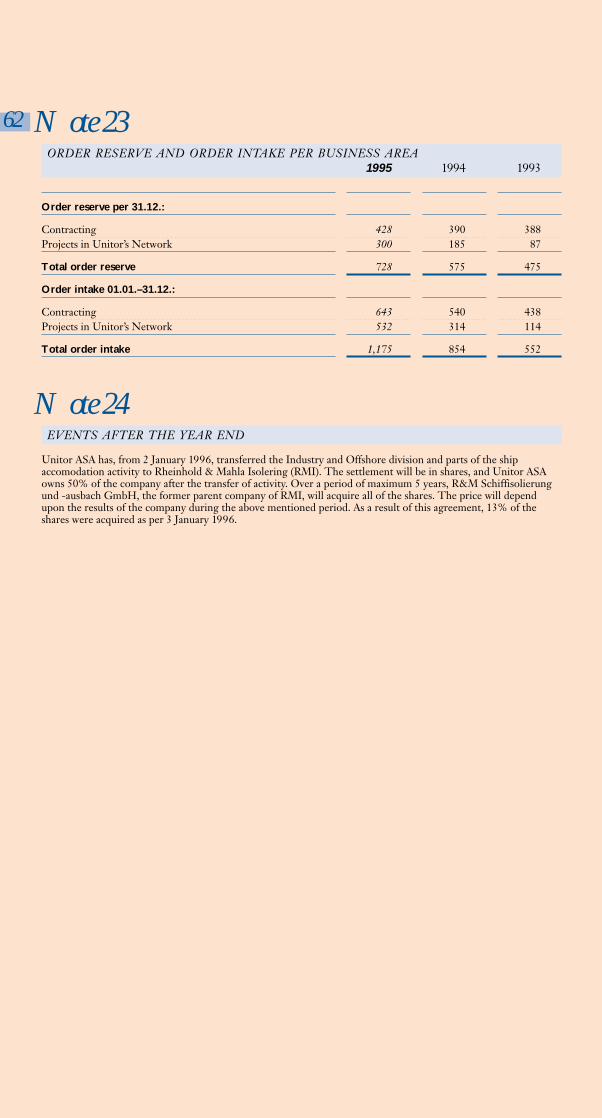
62 Note 23
EVENTS AFTER THE YEAR END
Unitor ASA has, from 2 January 1996, transferred the Industry and Offshore division and parts of the ship accomodation activity to Rheinhold & Mahla Isolering (RMI). The settlement will be in shares, and Unitor ASAowns 50% of the company after the transfer of activity. Over a period of maximum 5 years, R&M Schiffisolierungund -ausbach GmbH, the former parent company of RMI, will acquire all of the shares. The price will dependupon the results of the company during the above mentioned period. As a result of this agreement, 13% of the shares were acquired as per 3 January 1996.
Note 24
ORDER RESERVE AND ORDER INTAKE PER BUSINESS AREA1995 1994 1993
Order reserve per 31.12.:
Contracting 428 390 388Projects in Unitor’s Network 300 185 87
Total order reserve 728 575 475
Order intake 01.01.–31.12.:
Contracting 643 540 438Projects in Unitor’s Network 532 314 114
Total order intake 1,175 854 552

NotesUnitor ASA 1995
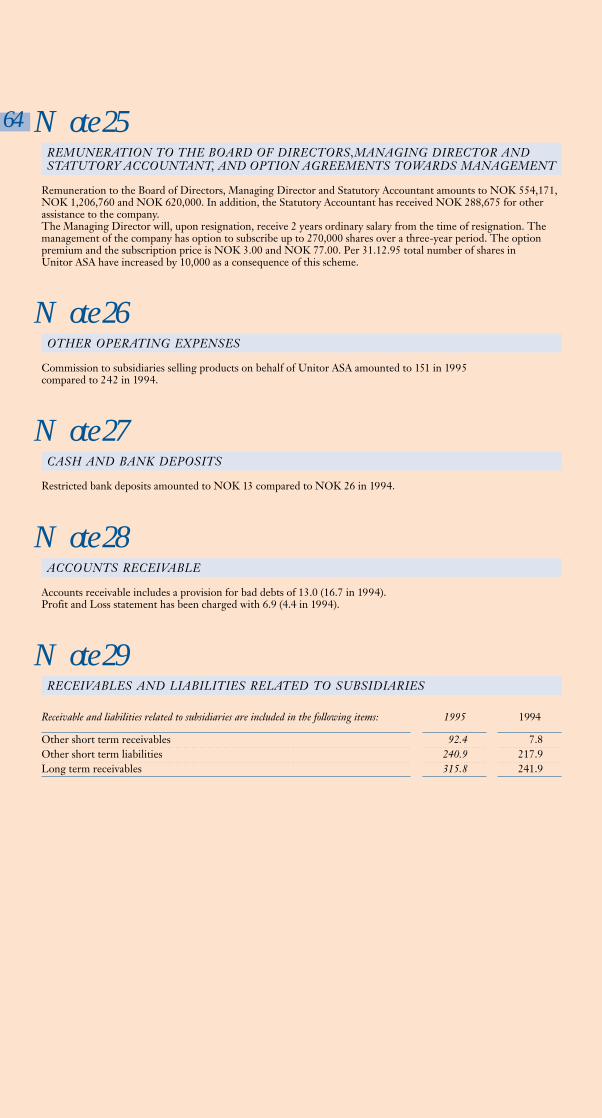
64
REMUNERATION TO THE BOARD OF DIRECTORS,MANAGING DIRECTOR AND STATUTORY ACCOUNTANT, AND OPTION AGREEMENTS TOWARDS MANAGEMENT
Note 25
Remuneration to the Board of Directors, Managing Director and Statutory Accountant amounts to NOK 554,171,NOK 1,206,760 and NOK 620,000. In addition, the Statutory Accountant has received NOK 288,675 for otherassistance to the company.The Managing Director will, upon resignation, receive 2 years ordinary salary from the time of resignation. Themanagement of the company has option to subscribe up to 270,000 shares over a three-year period. The optionpremium and the subscription price is NOK 3.00 and NOK 77.00. Per 31.12.95 total number of shares in Unitor ASA have increased by 10,000 as a consequence of this scheme.
OTHER OPERATING EXPENSES
Note 26
Commission to subsidiaries selling products on behalf of Unitor ASA amounted to 151 in 1995 compared to 242 in 1994.
CASH AND BANK DEPOSITS
Note 27
Restricted bank deposits amounted to NOK 13 compared to NOK 26 in 1994.
ACCOUNTS RECEIVABLE
Note 28
Accounts receivable includes a provision for bad debts of 13.0 (16.7 in 1994).Profit and Loss statement has been charged with 6.9 (4.4 in 1994).
Note 29RECEIVABLES AND LIABILITIES RELATED TO SUBSIDIARIES
Receivable and liabilities related to subsidiaries are included in the following items: 1995 1994
Other short term receivables 92.4 7.8Other short term liabilities 240.9 217.9Long term receivables 315.8 241.9

65Note 30SHARES IN SUBSIDIARIES AND AFFILIATED COMPANIES
Country of companies Ownership Book valueregistration share capital 31.12.95
NOK 1,000
Subsidiary:Unitor Pty. Ltd. South-Africa ZAR 910 100% 1,656Corroless Anti-Corrosive Pty. Ltd. South-Africa ZAR 100 100% 261Unitor Ships Service Equipam. Maritimos Ltda. Brazil BRR 275 100% 974Unitor Ships Service Ltd. Canada CAD 1 100% 5Unitor Ships Service Ltd. Canada CAD 0 100% 0Perolin Tecknik NV Netherl. Ant. USD 6 100% 38Unitor Ships Service NV Netherl. Ant. ANG 10 100% 43Unitor Panama SA Panama USD 25 100% 148Unitor Holding Inc. U.S.A. USD 1,772 100% 10,800Corroless International (SEA) Ltd. Hong Kong GBP 5 100% 1,569Unitor Ships Service Ltd. Hong Kong HKD 0 100% 1Unitor Ships Service Co. Ltd. Japan JPY 5,000 100% 103Unitor Korea Ltd. Korea KRW 290,000 100% 2,831Unitor Ships Service Pte. Ltd. Singapore SGD 100 100% 220Unitor Ships Service Ltd. Arab. Emirat. AED 200 49 % 166Unitor Ships Service NV Belgium BEF 1,250 100% 174Optima Sekur NV Belgium BEF 1,250 100% 5,152Unitor Ships Service AS Denmark DKK 300 100% 240Ginge-Kerr AS Denmark DKK 2,000 100% 17,779DanHVAC AS Denmark DKK 500 100% 3,318DanSystem Unitor AS Denmark DKK 6,000 100% 16,017Unitor Ships Service OY AB Finland FIM 50 100% 81Unitor Ships Service SA France FRF 250 100% 232Unitor Trading France SA France FRF 250 100% 313Uniref SA Greece GRD 92,000 2% 27Unitor Trading SRL Italy ITL 205,000 100% 1,145Corroless Middle East Ltd. Cyprus GBP 1 100% 7Unitor Cyprus Ltd. Cyprus CYP 10 100% 146Perolin Holdings BV Netherland USD 683 100% 23,898Unitor Distribution Centre BV Netherland NLG 40 100% 137Unitor Ships Service BV Netherland NLG 40 100% 119Kjemi-Service AS Norway NOK 250 100% 21,050Ticon Isolering AS Norway NOK 100 100% 0Teknisk Isolering AS Norway NOK 50 100% 50GF Marine AS Norway NOK 700 100% 1,000GF Hydraulikkmontasje AS Norway NOK 50 100% 0Unitor Polzka SP z.o.o. Poland PLZ 453 100% 1,246Unitor Equipamentos Maritimos Ltda. Portugal PTE 500 100% 30Fritagus Refr. e Ar Cond. Naval e Industr. Ltda. Portugal PTE 400 100% 18Hexol Ltd. Great Britain GBP 0 100% 0Ticon Insulation UK Ltd. Great Britain GBP 1 100% 11Unitor UK Holding Ltd. Great Britain GBP 4,400 100% 46,315Rochem Holding AG Switzerland CHF 2,000 100% 89,394Unitor Ships Service AB Sweden SEK 50 100% 62Svenska Skum International AB Sweden SEK 240 100% 26,953Unitor Coldstore Contracting AB Sweden SEK 50 100% 137Unitor Ships Service GmbH Germany DEM 5,400 100% 23,507
Sum aksjer i datterselskap 297,369
Affiliated company:Scan-Isolering AS Norway NOK 879 40% 5,310
Cont. next page . . .
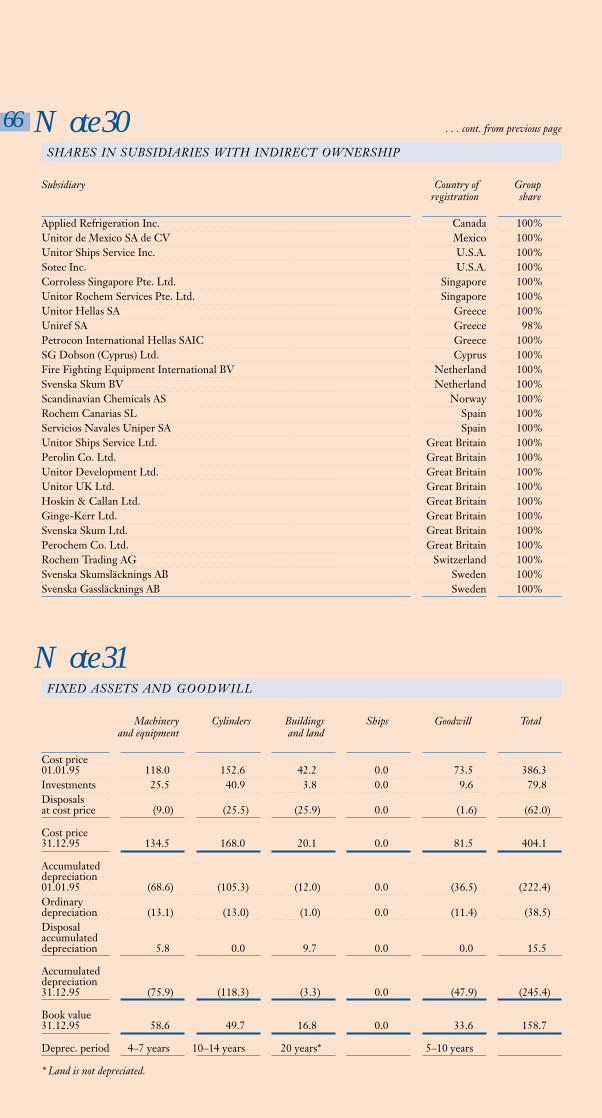
66
Subsidiary Country of Groupregistration share
Applied Refrigeration Inc. Canada 100%Unitor de Mexico SA de CV Mexico 100%Unitor Ships Service Inc. U.S.A. 100%Sotec Inc. U.S.A. 100%Corroless Singapore Pte. Ltd. Singapore 100%Unitor Rochem Services Pte. Ltd. Singapore 100%Unitor Hellas SA Greece 100%Uniref SA Greece 98%Petrocon International Hellas SAIC Greece 100%SG Dobson (Cyprus) Ltd. Cyprus 100%Fire Fighting Equipment International BV Netherland 100%Svenska Skum BV Netherland 100%Scandinavian Chemicals AS Norway 100%Rochem Canarias SL Spain 100%Servicios Navales Uniper SA Spain 100%Unitor Ships Service Ltd. Great Britain 100%Perolin Co. Ltd. Great Britain 100%Unitor Development Ltd. Great Britain 100%Unitor UK Ltd. Great Britain 100%Hoskin & Callan Ltd. Great Britain 100%Ginge-Kerr Ltd. Great Britain 100%Svenska Skum Ltd. Great Britain 100%Perochem Co. Ltd. Great Britain 100%Rochem Trading AG Switzerland 100%Svenska Skumsläcknings AB Sweden 100%Svenska Gassläcknings AB Sweden 100%
FIXED ASSETS AND GOODWILL
Machinery Cylinders Buildings Ships Goodwill Totaland equipment and land
Cost price 01.01.95 118.0 152.6 42.2 0.0 73.5 386.3Investments 25.5 40.9 3.8 0.0 9.6 79.8Disposals at cost price (9.0) (25.5) (25.9) 0.0 (1.6) (62.0)
Cost price 31.12.95 134.5 168.0 20.1 0.0 81.5 404.1
Accumulateddepreciation 01.01.95 (68.6) (105.3) (12.0) 0.0 (36.5) (222.4)Ordinarydepreciation (13.1) (13.0) (1.0) 0.0 (11.4) (38.5)Disposalaccumulateddepreciation 5.8 0.0 9.7 0.0 0.0 15.5
Accumulateddepreciation31.12.95 (75.9) (118.3) (3.3) 0.0 (47.9) (245.4)
Book value31.12.95 58.6 49.7 16.8 0.0 33.6 158.7
Deprec. period 4–7 years 10–14 years 20 years* 5–10 years
* Land is not depreciated.
Note 31
Note 30 . . . cont. from previous page
SHARES IN SUBSIDIARIES WITH INDIRECT OWNERSHIP
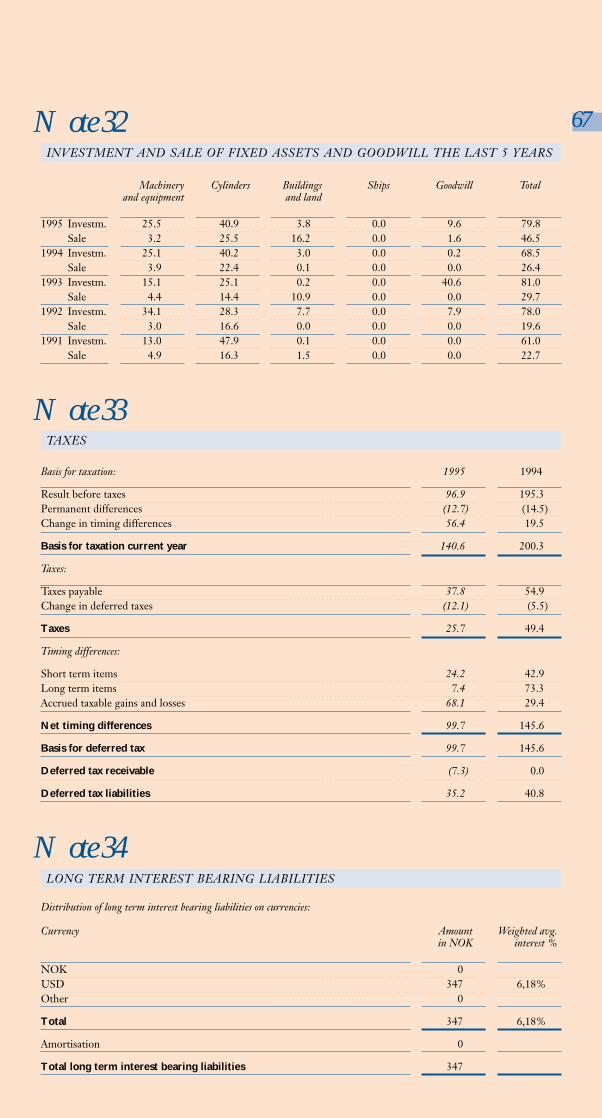
67
Note 33
Note 34
INVESTMENT AND SALE OF FIXED ASSETS AND GOODWILL THE LAST 5 YEARS
Machinery Cylinders Buildings Ships Goodwill Totaland equipment and land
1995 Investm. 25.5 40.9 3.8 0.0 9.6 79.8Sale 3.2 25.5 16.2 0.0 1.6 46.5
1994 Investm. 25.1 40.2 3.0 0.0 0.2 68.5Sale 3.9 22.4 0.1 0.0 0.0 26.4
1993 Investm. 15.1 25.1 0.2 0.0 40.6 81.0Sale 4.4 14.4 10.9 0.0 0.0 29.7
1992 Investm. 34.1 28.3 7.7 0.0 7.9 78.0Sale 3.0 16.6 0.0 0.0 0.0 19.6
1991 Investm. 13.0 47.9 0.1 0.0 0.0 61.0Sale 4.9 16.3 1.5 0.0 0.0 22.7
Note 32
LONG TERM INTEREST BEARING LIABILITIES
Distribution of long term interest bearing liabilities on currencies:
Currency Amount Weighted avg.in NOK interest %
NOK 0USD 347 6,18%Other 0
Total 347 6,18%
Amortisation 0
Total long term interest bearing liabilities 347
TAXES
Basis for taxation: 1995 1994
Result before taxes 96.9 195.3Permanent differences (12.7) (14.5)Change in timing differences 56.4 19.5
Basis for taxation current year 140.6 200.3
Taxes:
Taxes payable 37.8 54.9Change in deferred taxes (12.1) (5.5)
Taxes 25.7 49.4
Timing differences:
Short term items 24.2 42.9Long term items 7.4 73.3Accrued taxable gains and losses 68.1 29.4
Net timing differences 99.7 145.6
Basis for deferred tax 99.7 145.6
Deferred tax receivable (7.3) 0.0
Deferred tax liabilities 35.2 40.8
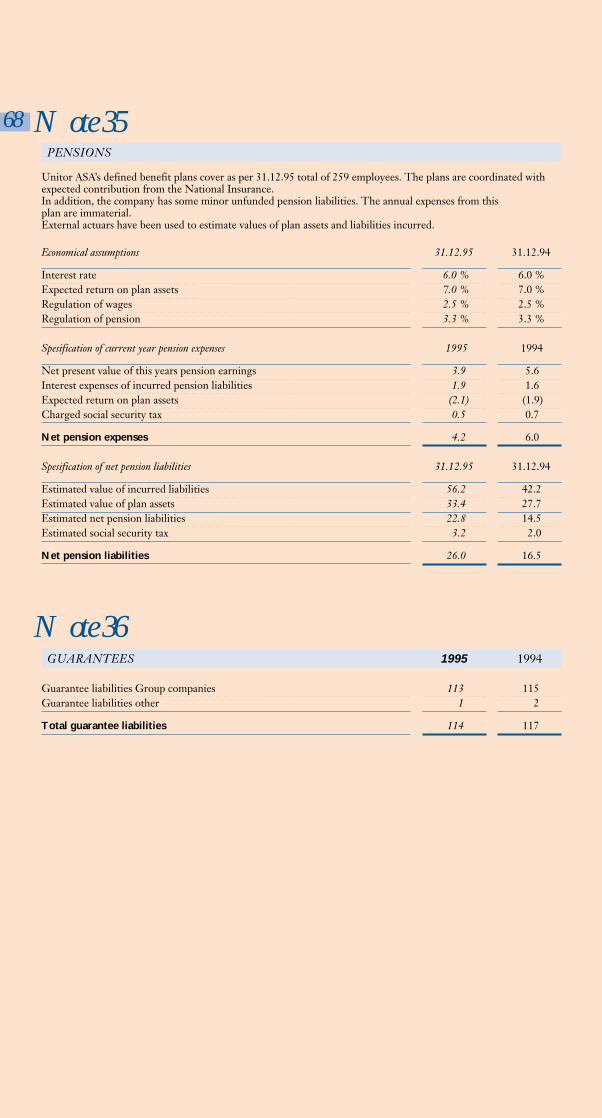
68
PENSIONS
Note 35
Unitor ASA’s defined benefit plans cover as per 31.12.95 total of 259 employees. The plans are coordinated with expected contribution from the National Insurance.In addition, the company has some minor unfunded pension liabilities. The annual expenses from this plan are immaterial.External actuars have been used to estimate values of plan assets and liabilities incurred.
Note 36GUARANTEES 1995 1994
Guarantee liabilities Group companies 113 115Guarantee liabilities other 1 2
Total guarantee liabilities 114 117
Economical assumptions 31.12.95 31.12.94
Interest rate 6.0 % 6.0 %Expected return on plan assets 7.0 % 7.0 %Regulation of wages 2.5 % 2.5 %Regulation of pension 3.3 % 3.3 %
Spesification of current year pension expenses 1995 1994
Net present value of this years pension earnings 3.9 5.6Interest expenses of incurred pension liabilities 1.9 1.6Expected return on plan assets (2.1) (1.9)Charged social security tax 0.5 0.7
Net pension expenses 4.2 6.0
Spesification of net pension liabilities 31.12.95 31.12.94
Estimated value of incurred liabilities 56.2 42.2Estimated value of plan assets 33.4 27.7Estimated net pension liabilities 22.8 14.5Estimated social security tax 3.2 2.0
Net pension liabilities 26.0 16.5
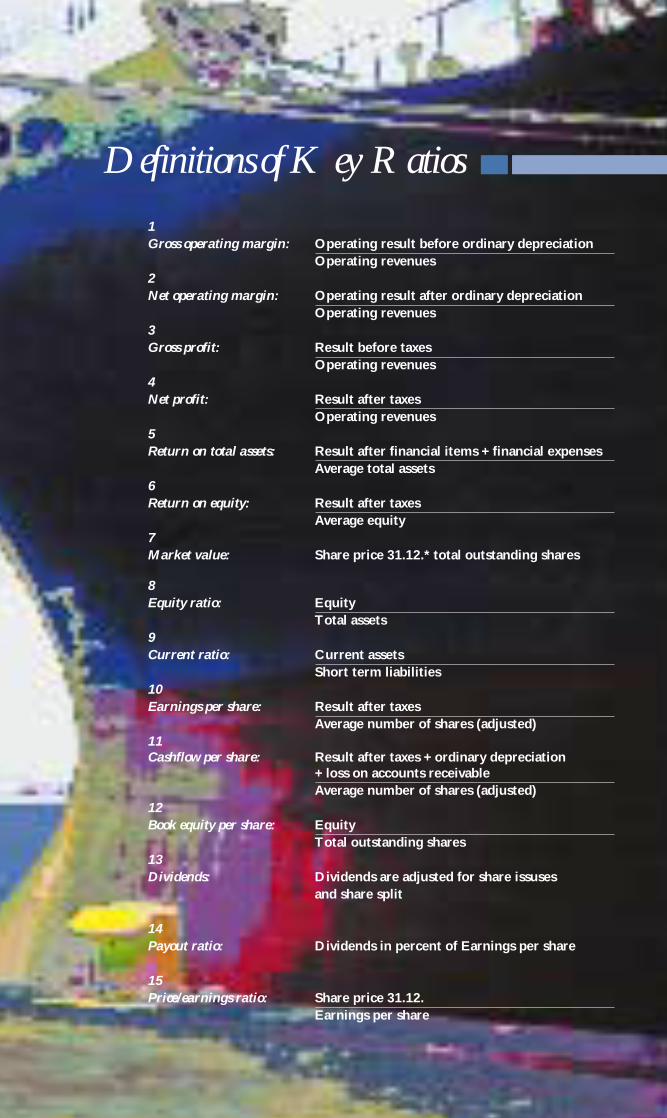
1
Gross operating margin: Operating result before ordinary depreciationOperating revenues
2
Net operating margin: Operating result after ordinary depreciationOperating revenues
3
Gross profit: Result before taxesOperating revenues
4
Net profit: Result after taxesOperating revenues
5
Return on total assets: Result after financial items + financial expensesAverage total assets
6
Return on equity: Result after taxesAverage equity
7
Market value: Share price 31.12.* total outstanding shares
8
Equity ratio: EquityTotal assets
9
Current ratio: Current assetsShort term liabilities
10
Earnings per share: Result after taxesAverage number of shares (adjusted)
11Cashflow per share: Result after taxes + ordinary depreciation
+ loss on accounts receivableAverage number of shares (adjusted)
12
Book equity per share: EquityTotal outstanding shares
13
Dividends: Dividends are adjusted for share issuses and share split
14
Payout ratio: Dividends in percent of Earnings per share
15
Price/earnings ratio: Share price 31.12.Earnings per share
Production: Unitor Corporate MarketingGraphic design: AD Svein O.Thunæs, UnitorPhotos: David MackieTypography: JansonPapir, cover: 250 gr. Multi ArtPapir, inside: 150 gr. Multi ArtRepro: ABC repro ASPrinting: Grafia Fargetrykk ASRun: 7,000I.D. nr: 14 025
Definitions of Key Ratios
U N I T O R A S AP.O.Box 300 Skøyen, N-0212 Oslo, NorwayVisiting adress: Drammensveien 211, OsloTel: + 47 22 13 14 15 - Fax: + 47 22 13 45 00
Tlx: 76004 UNTOR N
Table of ContentsOverviewSummary 1995Key figuresReport of the Board of DirectorsIncome StatementBalance SheetCash Flow AnalysisNotesShareholders Policy
••••••••••
••••••••••
´95Unitor Annual Report 1995
´95
1995
UNITORUNITOR