univar inc
TRANSCRIPT

UNITED STATESSECURITIES AND EXCHANGE COMMISSION
Washington, D.C. 20549
FORM 8-K
CURRENT REPORTPURSUANT TO SECTION 13 OR 15(d)
OF THE SECURITIES EXCHANGE ACT OF 1934
Date of Report (Date of earliest event reported): May 5, 2017
Univar Inc.(Exact name of registrant as specified in its charter)
Delaware 001-37443 26-1251958
(State or other jurisdictionof incorporation)
(CommissionFile Number)
(I.R.S EmployerIdentification No.)
3075 Highland Parkway, Suite 200
Downers Grove, IL 60515(Address of principal executive offices, including zip code)
Registrant’s telephone number, including area code: (331) 777-6000
Not Applicable(Former name or former address, if changed since last report.)
Check the appropriate box below if the Form 8-K filing is intended to simultaneously satisfy the filing obligation of the registrant under any of the following provisions:
¨Written communications pursuant to Rule 425 under the Securities Act (17 CFR 230.425)
¨Soliciting material pursuant to Rule 14a-12 under the Exchange Act (17 CFR 240.14a-12)
¨Pre-commencement communications pursuant to Rule 14d-2(b) under the Exchange Act (17 CFR 240.14d-2(b))
¨Pre-commencement communications pursuant to Rule 13e-4(c) under the Exchange Act (17 CFR 240.13e-4(c))
¨Indicate by check mark whether the registrant is an emerging growth company as defined in as defined in Rule 405 of the Securities Act of 1933 (§230.405 of this chapter) orRule 12b-2 of the Securities Exchange Act of 1934 (§240.12b-2 of this chapter).
Emerging growth company ¨
If an emerging growth company, indicate by check mark if the registrant has elected not to use the extended transition period for complying with any new or revised financialaccounting standards provided pursuant to Section 13(a) of the Exchange Act. ¨

Item 2.02 Results of Operations and Financial Condition
On May 5, 2017, Univar Inc. (the “Company”) announced its consolidated financial results for the quarter ended March 31, 2017. A copy of the Company’s press release andrelated presentation are furnished herewith on Form 8-K as Exhibits 99.1 and 99.2, respectively. The information contained in Item 2.02, including Exhibit 99.1 and Exhibit 99.2, ofthis report on Form 8-K shall not be deemed “filed” for purposes of Section 18 of the Securities Exchange Act of 1934, as amended (the “Exchange Act”), or otherwise subject tothe liability of that section, and it will not be incorporated by reference into any registration statement or other document filed by the Company under the Securities Act of 1933, asamended, or the Exchange Act except as expressly set forth by specific reference in such a filing.
Item 9.01Financial Statements and Exhibits
(d) Exhibits
Exhibit Number Description 99.1 Univar Inc. Press Release dated May 5, 201799.2 Univar Inc. Fiscal First Quarter 2017 Earnings Presentation dated May 5, 2017

SIGNATURE
Pursuant to the requirements of the Securities Exchange Act of 1934, as amended, the registrant has duly caused this report to be signed on its behalf by the undersignedhereunto duly authorized.
Date: May 5, 2017 Univar Inc.
By: /s/ Stephen N. Landsman Name: Stephen N. Landsman Title: Executive Vice President, General Counsel and Secretary

PRESS RELEASE
FOR ADDITIONAL INFORMATION:Investor Relations
David Lim+1 844-632-1060
Media RelationsMichele Mazur
Univar Reports 2017 First Quarter Financial Results
First Quarter 2017 Highlights
• Reported net income of $22.6 million , or $0.16 per share, compared to net income of $14.0 million , or $0.10 per share reported in the prior year first quarter.Net income for the first quarter 2017 included revaluation losses of $4.1 million, or $0.03 per share, for movements in the U.S. dollar value of foreign currencydenominated loans and monetary balances.
• Adjusted EBITDA grew 6.1 percent to $142.3 million compared to $134.1 million in the prior year first quarter. Canada, EMEA, and Rest of World segments inaggregate increased Adjusted EBITDA 16.4 percent (19.7 percent on a currency neutral basis), and USA segment reported modest Adjusted EBITDA growthafter eight consecutive quarters of declines.
• Gross margin expanded 50 basis points to 22.0 percent and Adjusted EBITDA margin increased 40 basis points to 7.1 percent.
• Warehouse, selling, and administrative expenses of $226.1 million were essentially equal to the prior year as investments in sales force, digital tools, andtraining costs were offset by productivity gains.
• Company raises full year outlook.
DOWNERS GROVE, Ill. – May 5, 2017 – Univar Inc. (NYSE: UNVR) (“Univar”), a global chemical and ingredient distributor and provider of value-added services,announced today its financial results for the first quarter ended March 31, 2017 .
Univar reported net income of $22.6 million , or $0.16 per share, compared to net income of $14.0 million , or $0.10 per share in the first quarter of 2016. Netincome for the first quarter 2017 included revaluation losses of $4.1 million, or $0.03 per share, for movements in the U.S. dollar value of foreign currencydenominated loans and monetary balances.
Net sales of $2.0 billion equaled the prior year, despite 3 percent lower volumes. Higher average selling prices offset the lower volumes and were driven by modestchemical price inflation, margin management initiatives, and the Company's efforts to improve its sales force effectiveness. Outside the U.S., gross profit grew 5.4percent, while in the U.S., gross profit equaled the prior year after seven quarters of decline. Gross profit of $439.4 million increased

2.1 percent, and gross margin increased 50 basis points to 22.0 percent, largely due to favorable product and market mix, as well as margin managementinitiatives. First quarter Adjusted EBITDA increased 6.1 percent to $142.3 million from $134.1 million reported in the first quarter last year, and Adjusted EBITDAmargin increased 40 basis points to 7.1 percent.
“We are pleased with our improving profitability and second consecutive quarter of growth in Adjusted EBITDA,” said Steve Newlin, chairman, president and chiefexecutive officer. “Our initiatives are taking hold, and we have created positive momentum. We reported another quarter of double digit EBITDA growth outside theU.S., and, within the U.S., turned the corner to EBITDA growth after eight consecutive quarters of decline. The U.S. results mark a key inflection point for us to buildupon."
Company Performance
The results of Univar’s operating performance are described below and, unless otherwise indicated, are a comparison of first quarter 2017 results with first quarter2016 results, including Adjusted EBITDA, which is reconciled to reported net income in the accompanying supplemental financial information.
(Unaudited) Three months ended March 31, % change(in millions) 2017 2016 $ change % change excl. currency
External Net Sales
USA $ 1,150.9 $ 1,187.5 $ (36.6) (3.1)% (3.1)%Canada 307.3 272.7 34.6 12.7 % 8.6 %EMEA 439.7 437.4 2.3 0.5 % 6.2 %Rest of World 100.9 101.4 (0.5) (0.5)% 1.6 %
Total Consolidated Net Sales $ 1,998.8 $ 1,999.0 $ (0.2) — % 0.8 %
Gross Profit USA $ 262.9 $ 262.9 $ — — % — %Canada 55.8 50.6 5.2 10.3 % 6.3 %EMEA 101.8 96.2 5.6 5.8 % 11.5 %Rest of World 18.9 20.6 (1.7) (8.3)% (9.3)%
Total Consolidated Gross Profit $ 439.4 $ 430.3 $ 9.1 2.1 % 2.9 %
Adjusted EBITDA USA $ 81.7 $ 80.8 $ 0.9 1.1 % 1.1 %Canada 24.8 21.7 3.1 14.3 % 10.1 %EMEA 35.9 28.3 7.6 26.9 % 37.1 %Rest of World 6.7 7.9 (1.2) (15.2)% (16.5)%Other* (6.8) (4.6) (2.2) (47.8)% (47.8)%
Total Consolidated Adjusted EBITDA $ 142.3 $ 134.1 $ 8.2 6.1 % 7.5 %
* Other represents unallocated corporate costs that do not directly benefit segments.
Segment Highlights
USA – Net sales for the USA segment decreased 3.1 percent to $1.2 billion , due to lower volumes. Higher average selling prices partially offset the decline involume and resulted from modest chemical price inflation and the Company's efforts to improve its sales force effectiveness. Gross profit of $262.9 million equaledthe prior year, but
gross margin increased 70 basis points to 22.8 percent due to margin enhancement efforts and higher average selling prices. Adjusted EBITDA increased 1.1percent from $80.8 million to $81.7 million and Adjusted EBITDA margin expanded 30 basis points to 7.1 percent.
Canada – Net sales for the Canada segment increased 12.7 percent from $272.7 million to $307.3 million , primarily driven by higher sales in the Western Canadaoil and gas market. Gross profit increased 10.3 percent from $50.6 million to $55.8 million from the rise in sales, but gross margin decreased 40 basis to 18.2percent reflecting the change in product mix. Adjusted EBITDA increased 14.3 percent from $21.7 million to $24.8 million . Despite the decline in gross margin,Adjusted EBITDA margin increased 10 basis points to 8.1 percent due to lower operating expenses as a percent of sales.
EMEA – Net sales for the EMEA segment increased 0.5 percent from $437.4 million to $439.7 million , primarily due to higher average selling prices driven by miximprovement, margin management initiatives, and chemical price inflation. Gross profit increased 5.8 percent from $96.2 million to $101.8 million , and grossmargin increased 120 basis points to 23.2 percent, reflecting comparative strength in pharmaceutical finished goods and favorable market mix. Adjusted EBITDAincreased 26.9 percent from $28.3 million to $35.9 million , and Adjusted EBITDA margin increased 170 basis points to 8.2 percent, due to higher gross profit andmodestly lower operating expenses.
Rest of World – Net sales for the Rest of World segment decreased 0.5 percent from $101.4 million to $100.9 million as higher average selling prices were morethan offset by weaker demand in Mexico and continued sluggish economic conditions in Brazil. Gross profit decreased 8.3 percent from $20.6 million to $18.9million , and gross margin decreased 160 basis points to 18.7 percent, primarily due to soft economic conditions in Mexico, particularly in the oil and gas market.Adjusted EBITDA decreased 15.2 percent from $7.9 million to $6.7 million , and Adjusted EBITDA margin decreased 120 basis points to 6.6 percent as lower grossmargin was partially offset by cost initiatives that lowered operating expenses as a percent of sales.
Outlook
"In the first quarter we made meaningful progress against our improvement programs, as evidenced by the increase in our margins," said Carl Lukach, executivevice president and chief financial officer. "We remain focused on successfully executing our growth and productivity plans."
As a result, the Company is raising its guidance for the full year, to deliver mid-to-high single digit Adjusted EBITDA growth. Univar is now expecting mid-single digitEBITDA growth in the first half of this year, accelerating in the second half to near double-digit growth by year end.
For the second quarter of 2017, the Company expects Adjusted EBITDA growth of mid single digits from last year’s $148.2 million.
"Our teams are energized by early signs of success from our Commercial Greatness and Operational Excellence initiatives," said Steve Newlin, chairman,president and chief executive officer. "We have the right plans in place and have made a solid start towards achieving our goals for this year and beyond."

Univar to Host Webcast on May 5, 2017 at 9:00 a.m. EDT
The Company will host a webcast with investors to discuss the first quarter results at 9:00 a.m. EDT on May 5, which can be accessed on the Investor Relationssection of its website at http://investor.univar.com . Following the event, an archived version of the webcast and supporting materials will be available on the samewebsite.
Adjusted EBITDA, Adjusted EBITDA margin
The Company monitors the results of its operating segments separately for the purposes of making decisions about resource allocation and performanceassessment. The Company evaluates performance on the basis of Adjusted EBITDA, which it defines as its consolidated net income (loss), plus the sum of interestexpense, net of interest income, income tax expense (benefit), depreciation, amortization, other operating expenses, net (which primarily consists of pension markto market adjustments, acquisition and integration related expenses, employee stock-based compensation expense, restructuring charges, business optimization,and other unusual or non-recurring expenses), impairment charges, loss on extinguishment of debt and other income (expense), net (which consists of gains andlosses on foreign currency transactions and undesignated derivative instruments, debt refinancing costs, and other non-operating activity). Adjusted EBITDAmargin is Adjusted EBITDA as a percentage of net sales. The Company believes that Adjusted EBITDA is an important indicator of operating performancebecause:
• The Company reports Adjusted EBITDA to its lenders as required under the covenants of its credit agreements;• Adjusted EBITDA excludes the effects of income taxes, as well as the effects of financing and investing activities by eliminating the effects of interest,
depreciation and amortization expenses;• The Company uses Adjusted EBITDA in setting performance incentive targets;• The Company considers gains (losses) on the acquisition, disposal and impairment of assets as resulting from investing decisions rather than ongoing
operations; and• Other significant items, while periodically affecting the Company’s results, may vary significantly from period to period and have a disproportionate effect in
a given period, which affects comparability of its results.
Use of Non-GAAP Measures
The Company’s management believes that certain financial measures that do not comply with accounting principles generally accepted in the United States(“GAAP”) provide relevant and meaningful information concerning the ongoing operating results of the Company. Such non-GAAP financial measures are usedfrom time to time herein but should not be viewed as a substitute for GAAP measures of performance. Reconciliations of non-GAAP measures to GAAP areprovided in Schedule A.
About Univar Founded in 1924, Univar (NYSE: UNVR) is a global chemical and ingredients distributor and provider of value-added services, working with leading suppliersworldwide. Supported by a comprehensive team of sales and technical professionals with deep specialty and market expertise, Univar operates hundreds ofdistribution facilities throughout North America, Western Europe, Asia-Pacific and Latin America. Univar delivers tailored customer solutions through a broadproduct and services portfolio sustained by one of the most extensive industry distribution networks in the world. For more information, visit www.univar.com.

Forward-Looking Statements This press release includes certain statements relating to future events and our intentions, beliefs, expectations, and predictions for the future which are “forward-looking statements” within the meaning of Section 27A of the Securities Act of 1933 and Section 21E of the Securities Exchange Act of 1934, as amended.Forward-looking statements are subject to known and unknown risks and uncertainties, many of which may be beyond our control. We caution you that the forward-looking information presented in this press release is not a guarantee of future events or results, and that actual events or results may differ materially from thosemade in or suggested by the forward-looking information contained in this press release. In addition, forward-looking statements generally can be identified by theuse of forward-looking terminology such as “may,” “plan,” “seek,” “comfortable with,” “will,” “expect,” “intend,” “estimate,” “anticipate,” “believe” or “continue” or thenegative thereof or variations thereon or similar terminology. Any forward-looking information presented herein is made only as of the date of this press release,and we do not undertake any obligation to update or revise any forward-looking information to reflect changes in assumptions, the occurrence of unanticipatedevents, or otherwise.
###

Univar Inc.Condensed Consolidated Statements of Operations
(Unaudited)
Three months ended
March 31,
(in millions, except per share data) 2017 2016
Net sales $ 1,998.8 $ 1,999.0Cost of goods sold 1,559.4 1,568.7Gross profit 439.4 430.3Operating expenses:
Outbound freight and handling 71.0 71.3Warehousing, selling and administrative 226.1 224.9Other operating expenses, net 19.8 5.5Depreciation 35.9 33.5Amortization 16.7 22.0
Total operating expenses $ 369.5 $ 357.2Operating income $ 69.9 $ 73.1Other (expense) income:
Interest income 0.9 0.9Interest expense (36.7) (41.5)Loss on extinguishment of debt (0.8) —Other expense, net (9.1) (13.4)
Total other expense $ (45.7) $ (54.0)Income before income taxes 24.2 19.1Income tax expense 1.6 5.1
Net income $ 22.6 $ 14.0
Income per common share: Basic $ 0.16 $ 0.10Diluted 0.16 0.10
Weighted average common shares outstanding: Basic 139.4 137.6Diluted 140.8 137.8

Univar Inc.Condensed Consolidated Balance Sheets
(Unaudited)
(in millions, except per share data) March 31,
2017 December 31,
2016
Assets Current assets:
Cash and cash equivalents $ 300.6 $ 336.4Trade accounts receivable, net 1,102.1 950.3Inventories 829.9 756.6Prepaid expenses and other current assets 155.8 134.8
Total current assets $ 2,388.4 $ 2,178.1Property, plant and equipment, net 1,011.2 1,019.5Goodwill 1,789.4 1,784.4Intangible assets, net 325.0 339.2Deferred tax assets 29.1 18.2Other assets 52.9 50.5
Total assets $ 5,596.0 $ 5,389.9Liabilities and stockholders’ equity Current liabilities:
Short-term financing $ 21.3 $ 25.3Trade accounts payable 931.6 852.3Current portion of long-term debt 116.1 109.0Accrued compensation 79.8 65.6Other accrued expenses 272.1 287.3
Total current liabilities $ 1,420.9 $ 1,339.5Long-term debt 2,905.7 2,845.0Pension and other postretirement benefit liabilities 266.8 268.6Deferred tax liabilities 24.9 17.2Other long-term liabilities 102.6 109.7
Total liabilities $ 4,720.9 $ 4,580.0Stockholders’ equity:
Preferred stock, 200.0 million shares authorized at $0.01 par value with no shares issued or outstanding as of March 31, 2017 andDecember 31, 2016 — —Common stock, 2.0 billion shares authorized at $0.01 par value with 140.2 million and 138.8 million shares issued and outstandingat March 31, 2017 and December 31, 2016, respectively 1.4 1.4Additional paid-in capital 2,276.7 2,251.8Accumulated deficit (1,031.3) (1,053.4)Accumulated other comprehensive loss (371.7) (389.9)
Total stockholders’ equity $ 875.1 $ 809.9Total liabilities and stockholders’ equity $ 5,596.0 $ 5,389.9

Univar Inc.Condensed Consolidated Statements of Cash Flows
(Unaudited)
Three months ended
March 31,
(in millions) 2017 2016
Operating activities: Net income $ 22.6 $ 14.0Adjustments to reconcile net income to net cash provided by operating activities:
Depreciation and amortization 52.6 55.5Amortization of deferred financing fees and debt discount 2.0 2.0Amortization of pension credit from accumulated other comprehensive loss — (3.0)Loss on extinguishment of debt 0.8 —Deferred income taxes (3.3) (6.9)Stock-based compensation expense 6.4 2.2Other 0.5 (0.3)Changes in operating assets and liabilities:
Trade accounts receivable, net (142.4) (84.8)Inventories (66.4) (95.1)Prepaid expenses and other current assets (18.9) 19.9Trade accounts payable 79.9 181.0Pensions and other postretirement benefit liabilities (9.0) (10.0)Other, net (5.1) (9.8)
Net cash (used) provided by operating activities $ (80.3) $ 64.7Investing activities:
Purchases of property, plant and equipment (20.9) (23.5)Purchases of businesses, net of cash acquired (0.5) (53.3)Other (0.3) (0.4)
Net cash used by investing activities $ (21.7) $ (77.2)Financing activities:
Proceeds from issuance of long-term debt 2,264.0 37.5Payments on long-term debt and capital lease obligations (2,211.5) (9.4)Short-term financing, net (5.2) (10.4)Financing fees paid (4.4) —Shares repurchased (6.0) —Stock option exercises 23.8 0.1
Net cash provided by financing activities $ 60.7 $ 17.8Effect of exchange rate changes on cash and cash equivalents $ 5.5 $ 28.7Net (decrease) increase in cash and cash equivalents (35.8) 34.0Cash and cash equivalents at beginning of period 336.4 188.1
Cash and cash equivalents at end of period $ 300.6 $ 222.1

Schedule A
Univar Inc.Reconciliation of Adjusted EBIDTA to Reported Net Income
(Unaudited)
(in millions) USA Canada EMEA Rest of World
Other/ Eliminations Consolidated
Three Months Ended March 31, 2017 Net sales:
External customers $ 1,150.9 $ 307.3 $ 439.7 $ 100.9 $ — $ 1,998.8
Inter-segment 31.2 1.8 1.3 0.1 (34.4) —
Total net sales 1,182.1 309.1 441.0 101.0 (34.4) 1,998.8
Cost of goods sold 919.2 253.3 339.2 82.1 (34.4) 1,559.4
Gross profit 262.9 55.8 101.8 18.9 — 439.4
Outbound freight and handling 46.8 9.2 13.4 1.6 — 71.0
Warehousing, selling and administrative 134.4 21.8 52.5 10.6 6.8 226.1
Adjusted EBITDA $ 81.7 $ 24.8 $ 35.9 $ 6.7 $ (6.8) $ 142.3
Other operating expenses, net 19.8
Depreciation 35.9
Amortization 16.7
Interest expense, net 35.8
Loss on extinguishment of debt 0.8
Other expense, net 9.1
Income tax expense 1.6
Net income $ 22.6
Total assets $ 3,640.2 $ 1,975.5 $ 908.2 $ 227.9 $ (1,155.8) $ 5,596.0
(in millions) USA Canada EMEA Rest of World
Other/ Eliminations Consolidated
Three Months Ended March 31, 2016 Net sales:
External customers $ 1,187.5 $ 272.7 $ 437.4 $ 101.4 $ — $ 1,999.0
Inter-segment 26.9 2.3 1.4 — (30.6) —
Total net sales 1,214.4 275.0 438.8 101.4 (30.6) 1,999.0
Cost of goods sold 951.5 224.4 342.6 80.8 (30.6) 1,568.7
Gross profit 262.9 50.6 96.2 20.6 — 430.3
Outbound freight and handling 47.7 7.8 14.0 1.8 — 71.3
Warehousing, selling and administrative 134.4 21.1 53.9 10.9 4.6 224.9
Adjusted EBITDA $ 80.8 $ 21.7 $ 28.3 $ 7.9 $ (4.6) $ 134.1
Other operating expenses, net 5.5
Depreciation 33.5
Amortization 22.0
Interest expense, net 40.6
Other expense, net 13.4
Income tax expense 5.1
Net income $ 14.0
Total assets $ 4,038.3 $ 1,942.5 $ 1,011.6 $ 243.4 $ (1,300.4) $ 5,935.4
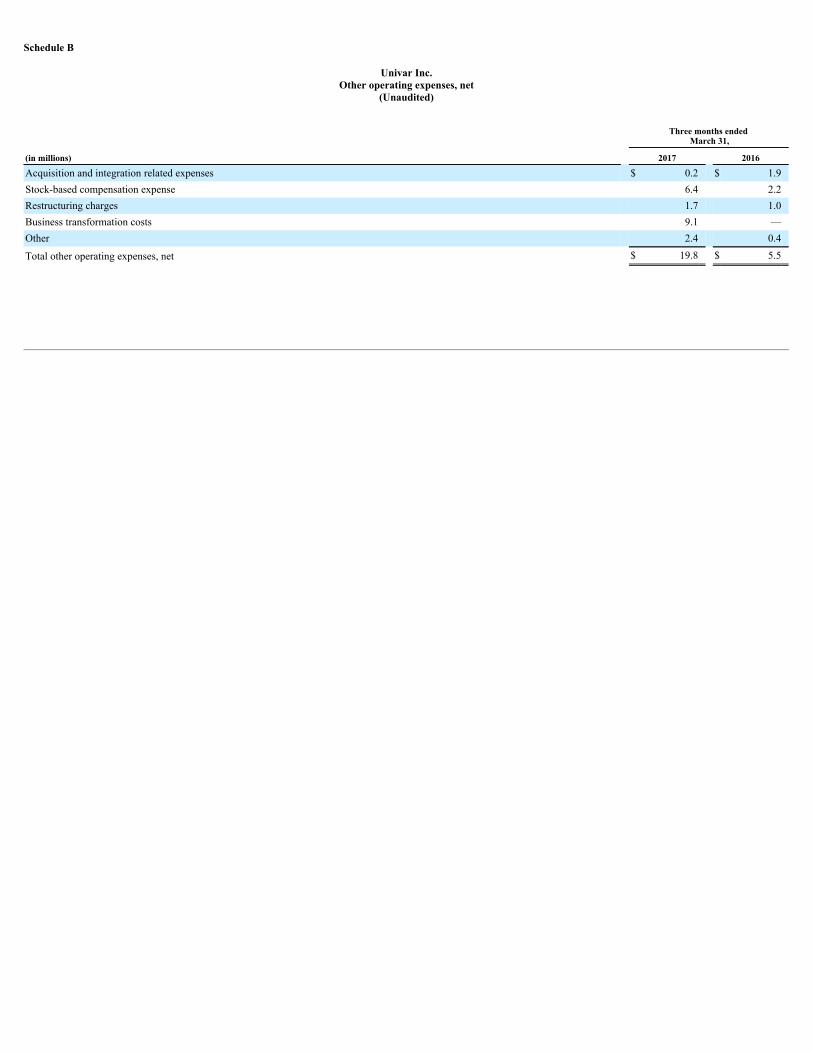
Schedule B
Univar Inc.Other operating expenses, net
(Unaudited)
Three months ended
March 31,
(in millions) 2017 2016
Acquisition and integration related expenses $ 0.2 $ 1.9Stock-based compensation expense 6.4 2.2Restructuring charges 1.7 1.0Business transformation costs 9.1 —Other 2.4 0.4
Total other operating expenses, net $ 19.8 $ 5.5

Schedule C
Univar Inc.Other expenses, net
(Unaudited)
Three months ended
March 31,
(in millions) 2017 2016
Foreign currency transactions $ (2.1) $ (2.7)Foreign currency denominated loans revaluation (3.0) (14.7)Undesignated foreign currency derivative instruments 1.0 1.9Undesignated interest rate swap contracts — 0.7Debt amendment costs (4.2) —Other (0.8) 1.4
Total other expense, net $ (9.1) $ (13.4)

Fiscal First Quarter 2017 Earnings Conference Call May 5, 2017

Forward-Looking Statements This presentation includes certain statements relating to future events and our intentions, beliefs, expectations, and predictions for the future which are “forward-looking statements” within the meaning of Section 27A of the Securities Act of 1933 and Section 21E of the Securities Exchange Act of 1934, as amended. Forward-looking statements are subject to known and unknown risks and uncertainties, many of which may be beyond our control. We caution you that the forward-looking information presented in this presentation is not a guarantee of future events or results, and that actual events or results may differ materially from those made in or suggested by the forward-looking information contained in this presentation. In addition, forward-looking statements generally can be identified by the use of forward-looking terminology such as “may,” “plan,” “seek,” “comfortable with,” “will,” “expect,” “intend,” “estimate,” “anticipate,” “believe” or “continue” or the negative thereof or variations thereon or similar terminology. Any forward-looking information presented herein is made only as of the date of this presentation, and we do not undertake any obligation to update or revise any forward-looking information to reflect changes in assumptions, the occurrence of unanticipated events, or otherwise. Regulation G: Non-GAAP Measures The information presented herein regarding certain unaudited non-GAAP measures does not conform to generally accepted accounting principles in the United States (U.S. GAAP) and should not be construed as an alternative to the reported results determined in accordance with U.S. GAAP. Univar has included this non- GAAP information to assist in understanding the operating performance of the company and its operating segments. The non-GAAP information provided may not be consistent with the methodologies used by other companies. All non-GAAP information related to previous Univar filings with the SEC has been reconciled with reported U.S. GAAP results. 2

First Quarter 2017 Highlights Improvement actions underway Q1 GAAP EPS(1) $0.16 vs. $0.10 prior year Ÿ Reported net income of $22.6 million vs. $14.0 million in the prior year Ÿ Net income included $4.1 million ($0.03 per share) of revaluation losses related to foreign currency denominated loans and monetary balances Q1 Adjusted EBITDA(1) $142.3 million vs. $134.1 million in 2016 Ÿ 16% growth outside of the USA led by EMEA and Canada Ÿ First quarter of EBITDA growth in USA after eight consecutive quarters of declines Adjusted Operating Cash Flow(2) ($7.5) million vs. $111.7 million in 2016 Ÿ Seasonal build in working capital Ÿ Cash conversion ratio of (5.3%) (3) Ÿ Cash operating margin of (0.4%) (4) (1) Variances to Q1 2016. (2) Adjusted EBITDA plus cash flows from changes in AR, Inventory, and AP, less cash used to purchase PP&E. (3) Adjusted Operating Cash Flow / Adjusted EBITDA. (4) Adjusted Operating Cash Flow / Sales. 3
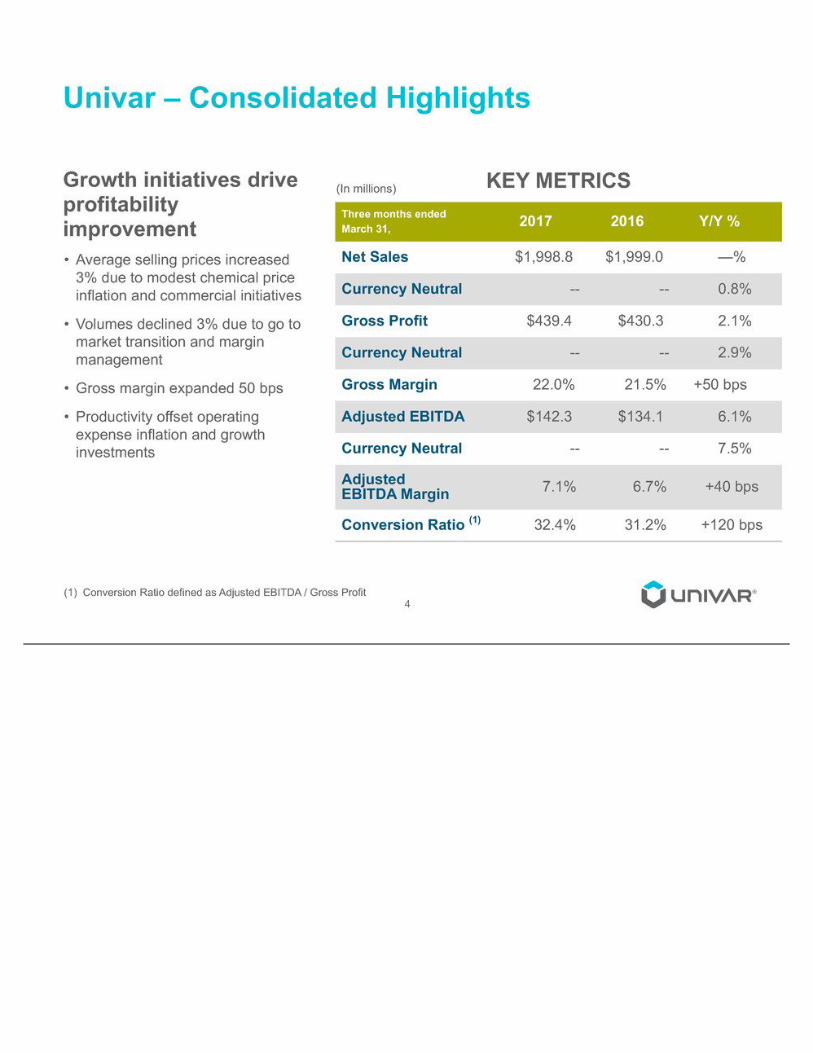
Univar – Consolidated Highlights Growth initiatives drive profitability improvement • Average selling prices increased 3% due to modest chemical price inflation and commercial initiatives • Volumes declined 3% due to go to market transition and margin management • Gross margin expanded 50 bps • Productivity offset operating expense inflation and growth investments KEY METRICS(In millions) (1) Conversion Ratio defined as Adjusted EBITDA / Gross Profit Three months ended March 31, 2017 2016 Y/Y % Net Sales $1,998.8 $1,999.0 —% Currency Neutral -- -- 0.8% Gross Profit $439.4 $430.3 2.1% Currency Neutral -- -- 2.9% Gross Margin 22.0% 21.5% +50 bps Adjusted EBITDA $142.3 $134.1 6.1% Currency Neutral -- -- 7.5% Adjusted EBITDA Margin 7.1% 6.7% +40 bps Conversion Ratio (1) 32.4% 31.2% +120 bps 4

USA – Highlights Commercial initiatives drive return to growth • Average selling prices increased 2% due to chemical price inflation and sales initiatives • Volume declines driven by go to market transition, margin management, and soft demand • Gross profit per lb. increased 6% • Delivery expense decreased 2%; WS&A(1) flat to prior year • Adjusted EBITDA grew 1% 5 Three months ended March 31, 2017 2016 Y/Y % Net Sales $1,150.9 $1,187.5 (3.1)% Gross Profit $262.9 $262.9 —% Gross Margin 22.8% 22.1% +70 bps Adjusted EBITDA $81.7 $80.8 1.1% Adjusted EBITDA Margin 7.1% 6.8% +30 bps (In millions) KEY METRICS (1) Warehousing, selling and administrative

CANADA – Highlights Strength in western Canada energy markets drives growth • Volumes increased 8% due to higher methanol sales into energy markets • Win/loss ratio improving • Gross margin decreased 40 bps due to product mix • Adjusted EBITDA margin increased due to strong expense control 6 Three months ended March 31, 2017 2016 Y/Y % Net Sales $307.3 $272.7 12.7% Currency Neutral -- -- 8.7% Gross Profit $55.8 $50.6 10.3% Currency Neutral -- -- 6.3% Gross Margin 18.2% 18.6% -40 bps Adjusted EBITDA $24.8 $21.7 14.3% Currency Neutral -- -- 10.1% Adjusted EBITDA Margin 8.1% 8.0% +10 bps (In millions) KEY METRICS

EMEA – Highlights Mix enrichment and margin management boost profits • Volumes declined 2% due to a temporary solvent shortage • Win/loss ratio improving • Gross margin increased 120 bps from mix enrichment and margin management • Operating expense declined 3% 7 Three months ended March 31, 2017 2016 Y/Y % Net Sales $439.7 $437.4 0.5% Currency Neutral -- -- 6.2% Gross Profit $101.8 $96.2 5.8% Currency Neutral -- -- 11.5% Gross Margin 23.2% 22.0% +120 bps Adjusted EBITDA $35.9 $28.3 26.9% Currency Neutral -- -- 37.1% Adjusted EBITDA Margin 8.2% 6.5% +170 bps (In millions) KEY METRICS

REST OF WORLD – Highlights Executing well in a soft economy • Soft economy and lower oil & gas demand in Mexico pressured margins • Brazil performed well, despite a sluggish economy, due to higher mix of specialty products • Taking cost actions to respond to the economic conditions 8 Three months ended March 31, 2017 2016 Y/Y % Net Sales $100.9 $101.4 (0.5)% Currency Neutral -- -- 1.6% Gross Profit $18.9 $20.6 (8.3)% Currency Neutral -- -- (9.2)% Gross Margin 18.7% 20.3% -160 bps Adjusted EBITDA $6.7 $7.9 (15.2)% Currency Neutral -- -- (16.5)% Adjusted EBITDA Margin 6.6% 7.8% -120 bps (In millions) KEY METRICS

Cash Flow Highlights 9 (1) Adjusted Operating Cash Flow equals Adjusted EBITDA plus cash flows from changes in AR, inventory, and AP, less cash used to purchase PP&E. (2) Excludes additions from capital leases. Three months ended March 31, 2017 2016 Y/Y % Adjusted Operating Cash Flow (1) ($7.5) $111.7 (106.7)% Net Working Capital ($128.9) $1.1 NM CapEx (2) ($20.9) ($23.5) (11.1)% Cash Taxes ($12.1) $7.4 (263.5)% Cash Interest (net) ($44.3) ($44.1) 0.5% Pension Contribution ($7.2) ($7.9) (8.9)% Other ($12.9) ($3.7) 248.6% (In millions)

Balance Sheet Highlights 10 (1) Net Debt defined as Total Debt (Long term debt, inclusive of debt discount and unamortized debt issuance costs, plus short term financing) less cash and cash equivalents. (2) Net Debt divided by trailing 12 month Adjusted EBITDA. (3) Interest coverage defined as LTM Adjusted EBITDA / LTM Cash Interest (net of interest income). (4) LTM Earnings before Interest, Taxes and Amortization (EBITA) divided by trailing 13 month average of net PP&E plus net working capital (accounts receivable plus inventory less accounts payable). LTM ended March 31, 2017 2016 Y/Y% Net Debt (1) $2,742.5 $2,968.8 (7.6)% Leverage (2) 4.8x 5.0x (4.8)% Interest Coverage (3) 3.9x 4.0x (2.0)% Return on Assets Deployed (4) 20.4% 21.0% -60 bps (In millions)

11 Full Year Adjusted EBITDA mid-to-high single digit growth Q2 2017 Adjusted EBITDA mid-single digit growth versus Q2 2016 Continue to advance our Commercial Greatness and Operational Excellence initiatives Selective commercial and technology investments FX translation headwinds Mid-to-high single digit EBITDA growth in the first half year Accelerating Adjusted EBITDA growth in the second half approaching double digits by year end Q2 2017 & Full Year 2017 OUTLOOK 2017 EXPECTATIONS

Full Year 2017 Guidance 12 Year ended December 31, 2016 2017 Adjusted EBITDA $562.7 mid-to-high singledigit growth Cash Interest (net) ($145.2) ~($134) Cash Tax (net) ($0.8) ~($25) Effective Tax Rate 14.0% ~20-25% Pension Contribution ($31.6) ~($35) Change in Net Working Capital $124.2 ~($50-100) Capital Expenditures ($90.1) ~($110) Debt Amortization ($39.9) ~($90) (In millions)

Appendix A Q1 2017 Adjusted EBITDA Reconciliation 13 Three months ended March 31, 2017 2016 Adjusted EBITDA $142.3 $134.1 Other operating expenses, net $19.8 $5.5 Depreciation $35.9 $33.5 Amortization $16.7 $22.0 Interest expense, net $35.8 $40.6 Loss on extinguishment of debt $0.8 — Other expense, net $9.1 $13.4 Income tax expense $1.6 $5.1 Net income $22.6 $14.0 (In millions)

Appendix B Adjusted Operating Cash Flow 14 Three months ended March 31, (In millions) 2017 2016 Adjusted EBITDA $142.3 $134.1 Change in: Trade accounts receivable, net ($142.4 ) ($84.8) Inventories ($66.4) ($95.1) Trade accounts payable $79.9 $181.0 Purchase of PP&E ($20.9) ($23.5) Adjusted operating cash flow ($7.5 ) $111.7

