unive a anchorage fact book 2019-20
TRANSCRIPT

University of Alaska Anchorage
FACT BOOK 2019-20

November 2020
TO: UAA Community
FROM: Erin J. Holmes, PhD Associate Vice Provost, Institutional Research
SUBJECT: 2019-20 Fact Book
This is the 2019-20 Fact Book for your use. An electronic version of the Fact Book is available at Institutional Research’s public website (www.uaa.alaska.edu/ir) and its IR-Reports site on SharePoint. Also available at the site are detailed electronic reports on a range of topics. Please feel free to contact the Office of Institutional Research with any questions, comments or suggestions you may have. Additionally, if you see items that need correction or would like to see other information, please let us know. Your feedback helps Institutional Research provide the information you need for your decision-making and planning.


OFFICE OF INSTITUTIONAL RESEARCH 3211 Providence Drive, BOC3 - Suite 340
Anchorage, AK 99508Phone: 907.786.1493
Fax: 907.786.1499
November 2020
FACT BOOK 2019-20
Dr. Erin Holmes, Associate Vice Provost Yuan-Fang Dong, Senior Research Associate Coy Gullett, Director of Business IntelligenceGinger Mongeau, Research AssociateJohn Zetterman, System ArchitectSara Juday, Writer/Editor/Graphic Designer Ester Bayne, Research Assistant

Unless otherwise noted, all numbers included in this Fact Book were compiled and produced by UAA’s Office of Institutional Research using official closing freeze data in the UA Decision Support Database (DSD) data system, and are reported for University of Alaska. For data reported at the statewide system level (University of Alaska), please see UA in Review, pro-duced by the University of Alaska Data Strategy and Institutional Research. This report can be viewed at the following link: http://www.alaska.edu/swbir/ir/reports/ua-in-review/
Special Thanks for Contributions
Ryan BuchholdtAaron Dotson
Lauren Hartman Chris McConnell
Cover photos by James R. Evans, UAA Advancement
Front Cover: Top: UAA’s 2019 Fall Commencement at the Alaska Airlines Center. Lower left: Biological Sciences Sophomore Michael Martinez studies ways to isolate rare earth metals from Alaskan coal in UAA’s ConocoPhillips Integrated Science Building lab. Lower middle: Physical Therapy Assistant program students in a small group lab, one of a handful of UAA courses that continued in-person delivery in summer 2020 with smaller-than usual groups and health screenings before each class.
Lower right: Alaska Native Studies Professor Maria Williams delivers the Native land acknowledgement at UAA’s 2019 Faculty and Staff Welcome at Cuddy Hall.
Back Cover: The Balancing Arcs statue, also known as “Happy Man.”
The University of Alaska is an affirmative action/equal opportunity employer and educational institution. The University of Alaska does not discriminate on the basis of race, religion, color, national origin, citizenship, age, sex, physical or mental disability, status as a protected veteran, marital status, changes in marital status, pregnancy, childbirth or related medical conditions, parenthood, sexual orientation, gender identity, political affiliation or belief, genetic information, or other legally protected status. The University’s commitment to nondiscrimination, including against sex discrimination, applies to students, employees, and applicants for admission and employment. Contact information, applicable laws, and complaint procedures are included on UA’s statement of nondiscrimination available at www.alaska.edu/nondiscrimination.

Table of Contents
Introduction University of Alaska Anchorage Locations 2Introduction to the 2019-20 UAA Fact Book 3University of Alaska Anchorage Leadership 4Organizational Structure 5Fast Facts About UAA Campuses 6Fall 2019 Enrollment Summary 7UAA Peer Institutions 8
Students STUDENT HEADCOUNT, FALL CLOSING 2019
By Characteristics and Campus 10By Graduate/Undergraduate Level and Characteristics - UAA Total 12
STUDENT HEADCOUNT BY CHARACTERISTICS, FALL 2015-2019University of Alaska Anchorage Total 14First-time Freshman 16
STUDENT HEADCOUNT BY DECLARED PROGRAMS OF STUDY, FALL 2015-2019By Major, Degree Type, and Campus/College 20
LONG TERM TRENDS OF STUDENT HEADCOUNT, ACADEMIC YEARS 2011-2020By Campus and Term 37
APPLIED, ACCEPTED, AND ENROLLED AT UAA, FALL 2015-2019Undergraduate Students 38Graduate Students 40
Enrollment STUDENT CREDIT HOURS
By Discipline, Five-Year Trend: Fall Semesters 2015-2019 43By Semester and Campus, Long-Term Trend, Academic Years 2001-2020 56
e-LEARNING Headcount, Seat Count & SCH by Origin of Courses vs. Origin of Students Admitted, Academic Years 2016-2020 58
Awards DEGREE AND CERTIFICATE AWARDS CONFERRED
By Campus Summary, Academic Years 2016-2020 63By Award Type, Academic Years 2016-2020 64Degree and Certificate Awards by Classification of Instructional Program (CIP), Academic Years 2016-2020 65Long-Term Trends, Academic Years 1989-2020 66

Faculty and Staff EMPLOYEES
Employee Headcount Trends by UAA Administrative Unit, Fall 2015-2019 (All Employees) 68Employee Headcount Trends by UAA Administrative Unit, Fall 2015-2019 (Regular and Term) 69Employee Headcount Trends by UAA Administrative Unit, Fall 2015-2019 (Temporary) 70Employee Characteristics by Campus, Fall 2019 (All Employees) 71Employee Characteristics by Campus, Fall 2019 (Regular and Term) 72Employee Characteristics by Campus, Fall 2019 (Temporary) 73
FACULTYRegular and Term Faculty Characteristics by Campus, Fall 2019 74Student Credit Hours Generated by Faculty Type, Fall 2019 76Number of Course Sections Taught by Faculty Type, Fall 2019 77
Finance, Grants and Giving BUDGET
Authorized State Appropriation Budget, Fiscal Years 2016-2020 80Total Authorized Budget, Fiscal Years 2016-2020 80Actual State Appropriation Expenditures, Fiscal Years 2015-2019 81Total Actual Expenditures, Fiscal Years 2015-2019 81Summary of UAA Expenditures by Functional Categories, Fiscal Years 2016-2020 82Authorized UAA Expenditure Budget (Unrestricted) Instruction Component Only, Fiscal Years 2016-2020 84Summary of UAA Revenue Received, Fiscal Years 2016-2020 85
RESEARCH GRANTSAwards by University Units and Fund Agencies, Fiscal Year 2020 86Awards by University Units and Functional Categories, Fiscal Years 2016-2020 89Proposal Submissions by University Units and Fund Agencies, Fiscal Year 2020 92Proposal Submissions by University Units and Functional Categories, Fiscal Years 2016-2020 95
ALUMNI GIVINGAverage Dollars Contributed per Alumni Donor, Fiscal Years 1999-2020 98Donations by Amount and Donor Type, Fiscal Years 2018-2020 99
TUITION UAA Tuition Rate History, Fiscal Years 2017-2021 100
Definition of Terms Definitions 102

Intro
duct
ion

2
Anchorage Campus
Kodiak College
Kenai Peninsula College
Prince William Sound College
Matanuska-Susitna College
Locations

3
Major Campuses and Academic Units
Anchorage Campus College of Arts & Sciences College of Business & Public Policy College of Engineering College of Health Community & Technical College University Honors College Graduate School* Kenai Peninsula College Kodiak College
Matanuska-Susitna College
Prince William Sound College
Introduction The University of Alaska Anchorage (UAA) is a multi-campus university that serves nearly 21,000 students each year and has a service area as expansive as the state of Montana. UAA is the largest university in the state and one of three separately accredited universities in the University of Alaska Statewide System.
For a young institution, UAA has an extremely complex history. The present university was created in 1987 following a statewide reorganization that merged a university with several community colleges. In one form or another, these institutions have offered educational opportunities to the communities of southcentral Alaska since the 1950s.
Partly due to this unique history, UAA today is an open access university with one of the broadest missions in higher education. UAA offers instruction ranging from Adult Basic Education to graduate and professional education, serves both traditional and non-traditional students, and confers awards ranging from occupational endorsements to associate, baccalaureate, master’s, and doctoral degrees. Through partnerships and affiliate programs, UAA also offers instruction leading to medical and other professional degrees. Through its centers and institutes, the university’s research helps Alaskans to improve their health, public policy, education, training, economic development, and quality of life.
UAA is accredited by the Northwest Commission of Colleges and Universities (NWCCU). Many individual academic programs have additional specialized accreditation from professional associations and other external entities.
UAA is classified by the Carnegie Foundation for the Advancement of Teaching as a public Master’s Colleges & Universities: Larger Programs, with a special classification for Community Engagement. Distinctive educational opportunities include undergraduate research, national and international exchanges, and study abroad programs. UAA has been named to the 2020-21 Military Friendly Schools list, the 12th consecutive year by Victory Media.
* Supports the graduate curriculum and research offered through all Colleges and Schools.

4
The mission of the University of Alaska Anchorage is to discover and disseminate knowledge through teaching, research, engagement, and creative expression.
Located in Anchorage and on community campuses in Southcentral Alaska, UAA is committed to serving the higher education needs of the state, its communities, and its diverse peoples.
The University of Alaska Anchorage is an open-access university with academic programs leading to occupational endorsements; undergraduate and graduate certificates; and associate, baccalaureate, and graduate degrees in a rich, diverse, and inclusive environment.
CATHY SANDEEN, Chancellor DENISE RUNGE, Provost and Executive Vice Chancellor, Academic Affairs (effective 7/2020) JOHN STALVEY, Interim Provost and Executive Vice Chancellor, Academic Affairs (7/2018 to 6/2020) BILL JACOB, Interim Vice Chancellor, Administrative Services (effective 6/2020) BEVERLY COTTON SHUFORD, Vice Chancellor, Administrative Services (5/2018 to 5/2020) BRUCE SCHULTZ, Vice Chancellor, Student Affairs MEGAN OLSON, Vice Chancellor, University Advancement CHRISTI BELL, Associate Vice Chancellor & Director, Business Enterprise Institute AARON DOTSON, Associate Vice Chancellor, Office of Research JENNIFER BOOZ, Chief Diversity Officer (effective 7/2020) RENEE CARTER-CHAPMAN, Senior Vice Provost, Academic Affairs SARA CHILDRESS, Director & Title IX Coordinator, Office of Equity & Compliance
ANCHORAGE COLLEGES
College of Arts & Sciences John Petraitis, Interim Dean
College of Business & Public PolicyJohn Nofsinger, Interim Dean (effective 3/2020)Karen Markel, Dean (6/2018 to 6/2020)
College of Engineering Kenrick Mock, Interim Dean
College of Health Jeff Jessee, Dean & Vice Provost of Health Programs Community & Technical College Raymond Weber, Interim Dean (effective 7/2020) Denise Runge, Dean (7/2016 to 6/2020) Consortium Library Steve Rollins, Dean
University Honors College Claudia Lampman, Dean (effective 7/2020)John Mouracade, Dean (8/2014 to 6/2020)
COMMUNITY CAMPUSES
Kenai Peninsula College Gary Turner, Director
Kodiak College Jacelyn Keys, Director (effective 8/2020)Betty Walters, Interim Director (10/2018 to 7/2020)
Matanuska-Susitna College Talis Colberg, Director
Prince William Sound College J. Dan O’Connor, Director
UNIVERSITY GOVERNANCE
Faculty Senate Kelly Smith, President, 2020-21 Scott Downing, President, 2019-20 Staff Council Dawn Humenik, Co-President, 2020-21 Tania Rowe, Co-President, 2019-21 John Moore, Past Co-President, 2020-21 USUAA Student Government Brooke Hansen, President, 2020-21 Jamie Bagley, President, Spring 2020 Clare Baldwin, President, Fall 2019
Leadership

5
Organizational Structure
Legend:
Cabinet Members
Community Campuses
ChancellorCathy Sandeen
Equity & Compliance Sara Childress
Director & Title IX Coordinator
University AdvancementMegan Olson
Vice Chancellor
Administrative ServicesBill Jacob
Interim Vice Chancellor
Student AffairsBruce Schultz
Vice Chancellor
Public RelationsKirstin Olmstead
Director
Alumni EngagementTanya Pont
Director
DevelopmentBobi Rinehart
Assoc Vice Chancellor
BudgetRyan BuchholdtInterim Director
Facilities & Campus Services
Kim MahoneyAssoc Vice Chancellor
AthleticsGreg Myford
Director
University Police Department
Jeff EarleChief of Police
Information TechnologyServicesBen Shier
Interim CIO
Dean of StudentsBenjamin Morton
Enrollment ServicesLora Volden
Assoc Vice Chancellor
ResearchAaron Dotson
Assoc Vice Chancellor
Kenai Peninsula College
Gary TurnerDirector
Kodiak CollegeJacelyn Keys
Director
Mat-Su CollegeTalis Colberg
Director
Prince William Sound College
J. Daniel O'ConnorDirector
Financial ServicesBrian deZeeuw
Director
Chief Diversity OfficerJennifer Booz
Campus ServicesDavid Weaver
Executive Director
Student Life &LeadershipKim Morton
Director
Special Assistant to the ChancellorJohn Stalvey
Business Enterprise InstituteChristi Bell
Assoc Vice Chancellor& Director
Alaska Native Education& Engagement
VacantSpecial Advisor to the Chancellor
Governance Heidi Tilicki
Faculty Senate, Staff Council,University Assembly Coordinator
Academic AffairsDenise Runge
Provost & Executive Vice Chancellor
Faculty Development & Instructional Support
Shawnalee WhitneyAssociate Vice Provost
Academic AffairsSusan KalinaVice Provost
College of Arts & Sciences
John PetraitisInterim Dean
Alaska Native Science & Engineering Program
Herb SchroederVice Provost
College of Business & Public PolicyJohn NofsingerInterim Dean
Consortium LibrarySteve Rollins
Dean
College of EngineeringKenrick MockInterim Dean
College of HealthJeff Jessee
Dean & Vice Provost of Health Programs
Community & Technical CollegeRaymond Weber
Interim Dean
Student SuccessClaudia Lampman
Vice Provost &Dean of Honors College
Institutional ResearchErin Holmes
Associate Vice Provost
Graduate SchoolMary Jo Finney
Dean

6
Fast Facts
Kodiak College
Anchorage Campus
Matanuska-Susitna College
UAA TOTAL Kenai Peninsula College
Prince William Sound College
212,76317,1727,276 2,09711,8795,1056,774
483281945
2,894,400
$145,294.0$19,652.1
$251,260.5 $55,419.7 $1,932.9
22,8863,579
760 85
2,142702
1,440
328391
183,214
$7,544.3$0.0
$14,723.7 $5,064.1
$189.5
266,47320,9749,062 2,33914,9895,6799,310
557465
1,151
3,342,007
$162,205.6$19,652.1
$287,884.7 $66,779.3$2,465.4
19,6912,150
655 114
1,409577832
225947
152,145
$5,176.7$0.0
$11,147.5 $4,252.3
$193.1
5,2641,229
176 16821130691
72642
67,267
$2,532.8
$0.0 $5,421.9
$813.1 $79.5
5,8691,204
196 27641202439
131626
44,981
$1,657.7$0.0
$5,331.1 $1,230.1
$70.4
StudentsAY 19-20 Student Credit Hours Headcount Full-time Equivalent Awards Granted Fall 2019 Headcount Full-time Part-time
Faculty and Staff - Fall 2019Regular Faculty Adjunct Faculty Staff
FacilitiesSquare Feet
Finance - FY 2020 (in $000)Univ. Generated Revenue Research Focus Expenditure Total Budget Authority Gross Tuition TVEP Awards
StudentsAY 19-20 Student Credit Hours Headcount Full-time Equivalent Awards Granted Fall 2019 Headcount Full-time Part-time
Faculty and Staff - Fall 2019Regular Faculty Adjunct Faculty Staff
FacilitiesSquare Feet
Finance - FY 2020 (in $000)Univ. Generated Revenue Research Focus Expenditure Total Budget Authority GrossTuition TVEP Awards
Students
AY 19-20 Student Credit Hours Headcount Full-time Equivalent Awards Granted Fall 2019 Headcount Full-time Part-time
Faculty and Staff - Fall 2019Regular Faculty Adjunct Faculty Staff
FacilitiesSquare Feet
Finance - FY 2020 (in $000) Univ. Generated Revenue Research Focus Expenditure Total Budget Authority GrossTuition TVEP Awards
Sources and Notes: Students: UA Data Strategy and Institutional Research (DSIR) Decision Support Database (DSD) data at semester closing. Student Credit Hours include auditors. Awards Granted include: Undergraduate Certificates, Associate, Bachelor, Master, Doctorate, Endorsements, Licensure, Post Graduate, Post Baccalaureate, and Graduate Certificates. Headcount is for credit students only; students who enrolled in multiple campuses have been counted only once in the UAA total.
Faculty & Staff: UA Data Strategy and Institutional Research DSD data at Fall Freeze. Staff includes full-time & part-time employees but does not include graduate or student assistants. Facilities: UAA Facilities and Campus Services. Finance: UAA Office of Budget. Research Focus Expenditure is defined by UA Statewide as Basic Research. TVEP stands for Technical/ Vocational Education Program.

7
Fall 2019 Enrollment Summary
Source: UA Data Strategy and Institutional Research (DSIR) Decision Support Database (DSD) data system at semester closing freeze.
Notes: 1. Headcount is unduplicated and includes auditors. 2. Student credit hours do not include audited hours. 3. Total Course Sections do not include canceled sections. 4. Canceled sections are those canceled after students enrolled.
Course UAA Anchorage Kenai Kodiak Mat-Su PW Sound Level Total Campus Peninsula College College College
Student Headcount Total Credit Headcount 14,989.0 11,879.0 2,142.0 641.0 1,409.0 821.0 Full-time 5,679.0 5,105.0 702.0 202.0 577.0 130.0 Part-time 9,310.0 6,774.0 1,440.0 439.0 832.0 691.0 Full-time as a % of Total 37.9% 43.0% 32.8% 31.5% 41.0% 15.8% All Students 15,174.0 11,905.0 2,259.0 683.0 1,409.0 821.0 (includes credit and non-credit students) Credit Hours Developmental (050-099) 2,789.0 1,825.0 537.0 88.0 333.0 6.0 Lower Division (100-299) 86,265.5 61,886.0 9,722.0 2,726.0 9,313.0 2,618.5 Upper Division (300-499) 26,628.0 26,078.0 496.0 54.0 Professional (500-599) 4,431.0 4,389.0 42.0 Graduate (600-699) 4,527.0 4,527.0 Credit Hours Total 124,640.5 98,705.0 10,797.0 2,814.0 9,700.0 2,624.5 Audited Hours 169.0 95.0 54.0 3.0 13.0 4.0 Enrollment (Seat Count) Developmental (050-099) 890.0 568.0 180.0 33.0 106.0 3.0 Lower Division (100-299) 31,177.0 22,490.0 3,370.0 984.0 3,198.0 1,135.0 Upper Division (300-499) 9,266.0 9,065.0 183.0 18.0 Professional (500-599) 2,610.0 2,568.0 42.0 Graduate (600-699) 1,478.0 1,478.0 Enrollment Total 45,421.0 36,169.0 3,775.0 1,017.0 3,322.0 1,138.0 Student FTE Developmental (050-099) 185.9 121.7 35.8 5.9 22.2 0.4 Lower Division (100-299) 5,751.0 4,125.7 648.1 181.7 620.9 174.6 Upper Division (300-499) 1,775.2 1,738.5 33.1 3.6 Professional (500-599) 369.3 365.8 3.5 Graduate (600-699) 377.3 377.3 Student FTE Total 8,458.7 6,728.9 720.5 187.6 646.7 175.0 Course Sections Developmental (050-099) 45.0 24.0 10.0 4.0 6.0 1.0 Lower Division (100-299) 1,675.0 1,082.0 237.0 87.0 197.0 72.0 Upper Division (300-499) 632.0 606.0 23.0 3.0 Professional (500-599) 240.0 237.0 3.0 Graduate (600-699) 240.0 240.0 Course Sections Total 2,832.0 2,189.0 273.0 91.0 206.0 73.0 Canceled Credit Sections 312.0 199.0 45.0 16.0 42.0 10.0

8
Peer Institutions
Arkansas Tech University
Boise State University
CUNY College of Staten Island
Ferris State University
Florida Gulf Coast University
Idaho State University
Indiana University-Purdue University - Fort Wayne
McNeese State University
Northern Kentucky University
Northwestern State University of Louisiana
Purdue University - Calumet Campus
The University of Texas at Brownsville
Troy University
University of Arkansas at Little Rock
University of West Florida
Weber State University
Western Kentucky University
Youngstown State University

Stud
ents

Students - 2020 Fact Book
10
Headcount by Characteristics and CampusUAA - Fall Closing 2019
Table 1.01
UAA % of Anchorage Kenai Kodiak Mat-Su PW Sound Total Total Campus Peninsula College College College
UAA Total 14,989 100.0% 11,879 2,142 641 1,409 821
Admission Type New 2,010 13.4% 1,368 301 72 373 66 Continue 9,213 61.5% 7,876 1,304 406 791 270 Returned 3,720 24.8% 2,608 515 158 242 484 Transfer 46 0.3% 27 22 5 3 1
Class Standing First-time Freshman 1,376 9.2% 1,119 145 30 205 33 Freshman 1,798 12.0% 1,323 363 127 245 72 Sophomore 1,921 12.8% 1,589 407 150 246 64 Junior 1,619 10.8% 1,437 281 81 140 41 Senior 2,696 18.0% 2,517 303 78 109 40 Graduate 652 4.3% 651 1 1 Non-Degree/Other UA Prog 4,927 32.9% 3,243 642 175 463 571
Full-time Graduate 156 1.0% 156 1 Undergraduate 5,523 36.8% 4,949 701 202 577 130
Total 5,679 37.9% 5,105 702 202 577 130
Part-time Graduate 562 3.7% 555 3 1 2 2 Undergraduate 8,748 58.4% 6,219 1,437 438 830 689
Total 9,310 62.1% 6,774 1,440 439 832 691
Gender Female 8,959 59.8% 7,265 1,316 436 851 352 Male 5,840 39.0% 4,536 737 202 539 456 Not Reported 190 1.3% 78 89 3 19 13
Race/Ethnicity African American 391 2.6% 359 42 15 24 9 Alaska Native 687 4.6% 500 120 53 66 48 Alaska Native Multirace 764 5.1% 647 91 39 74 31 American Indian 85 0.6% 63 13 1 11 12 Asian 866 5.8% 785 82 60 27 15 Hispanic 979 6.5% 828 139 46 78 35 Hispanic Multirace 85 0.6% 76 11 3 9 1 Native Hawaiian/Pacifi c Island 359 2.4% 301 47 39 15 16 White 8,159 54.4% 6,432 1,136 299 931 426 Non Hispanic Multirace 801 5.3% 688 86 27 76 21 Non Resident Alien 251 1.7% 230 25 10 2 9 Not Reported 1,562 10.4% 970 350 49 96 198

2020 Fact Book - Students
11
Headcount by Characteristics and CampusUAA - Fall Closing 2019
Table 1.01
UAA % of Anchorage Kenai Kodiak Mat-Su PW Sound Total Total Campus Peninsula College College College
Source: UA Data Strategy and Institutional Research (DSIR) Decision Support Database (DSD) data system at semester closing.
Notes: 1. UAA Total includes Anchorage, Kenai, Kodiak, Matanuska-Susitna, and Prince William Sound College. Headcount is unduplicated and includes only
credit students. Students who enrolled in multiple campuses have been counted only once in UAA Total. 2. Included are students enrolled in credit courses at the 050 level and above, including auditors. 3. Percentages may not add to 100% due to rounding.4. See Defi nition of Terms for meaning of First-time Freshman.5. Non-Degree/Other UA Programs = Non-Degree seeking students or other University of Alaska program degree seekers.6. New transfer code added to Admission Type was not captured in freeze data resulting in an under count of Transfer and an over count of Continue
starting in fall 2018.
Age 0 - 17 1,189 7.9% 439 246 84 330 126 18 - 18 1,132 7.6% 857 158 29 176 30 19 - 19 1,099 7.3% 894 156 60 146 33 20 - 24 4,046 27.0% 3,523 600 172 332 109 25 - 29 2,129 14.2% 1,785 340 99 135 107 30 - 39 2,571 17.2% 2,108 367 120 160 180 40 - 49 1,471 9.8% 1,231 158 45 79 77 50 - 59 910 6.1% 759 64 21 35 69 60 & Over 440 2.9% 282 53 11 16 89 Not Reported 2 0.0% 1 1
Residency Origin In State 13,602 90.7% 10,688 1,979 599 1,356 733 Out of State 1,106 7.4% 933 135 31 50 79 International 251 1.7% 230 25 10 2 9 Not Reported 30 0.2% 28 3 1 1
Degree Level Certifi cate 189 1.3% 132 25 13 25 9 Associate 2,402 16.0% 1,529 625 225 432 131 Bachelor 6,797 45.3% 6,303 846 228 488 110 Master’s 573 3.8% 572 1 1 Doctorate 37 0.2% 37 Graduate Certifi cate 42 0.3% 42 Post Baccalaureate Certifi cate 22 0.1% 21 3 Non-Degree/Other UA Prog 4,927 32.9% 3,243 642 175 463 571
Attempted Credit Hours 0 - 2.9 2,156 14.4% 1,661 116 27 27 438 3 - 5.9 2,697 18.0% 2,286 1,237 459 568 272 6 - 8.9 2,500 16.7% 1,839 461 96 267 55 9 - 11.9 2,068 13.8% 1,713 154 33 284 15 12 - 14.9 3,688 24.6% 2,810 144 20 236 27 15 & Over 1,880 12.5% 1,570 30 6 27 14

Students - 2020 Fact Book
12
Headcount by Graduate/Undergraduate Level and CharacteristicsUAA - Fall Closing 2019
Table 1.02 Graduate Undergraduate
UAA % of UAA Other UA % of % of Total Total Programs Prog Total Total Total Total
UAA Total 14,989 100.0% 652 66 718 100.0% 14,271 100.0%
Admission Type New 2,010 13.4% 7 7 1.0% 2,003 14.0% Continue 9,213 61.5% 620 27 647 90.1% 8,566 60.0% Returned 3,720 24.8% 32 32 64 8.9% 3,656 25.6% Transfer 46 0.3% 46 0.3%
Class Standing First-time Freshman 1,376 9.2% 1,376 9.6% Freshman 1,798 12.0% 1,798 12.6% Sophomore 1,921 12.8% 1,921 13.5% Junior 1,619 10.8% 1,619 11.3% Senior 2,696 18.0% 2,696 18.9% Graduate 652 4.3% 652 652 90.8% Non-Degree/Other UA Prog 4,927 32.9% 66 66 9.2% 4,861 34.1%
Full-time Graduate 156 1.0% 155 1 156 21.7% Undergraduate 5,523 36.8% 5,523 38.7%
Total 5,679 37.9% 155 1 156 21.7% 5,523 38.7%
Part-time Graduate 562 3.7% 497 65 562 78.3% Undergraduate 8,748 58.4% 8,748 61.3%
Total 9,310 62.1% 497 65 562 78.3% 8,748 61.3%
Gender Female 8,959 59.8% 432 51 483 67.3% 8,476 59.4% Male 5,840 39.0% 219 15 234 32.6% 5,606 39.3% Not Reported 190 1.3% 1 1 0.1% 189 1.3%
Race/Ethnicity African American 391 2.6% 17 1 18 2.5% 373 2.6% Alaska Native 687 4.6% 28 6 34 4.7% 653 4.6% Alaska Native Multirace 764 5.1% 39 4 43 6.0% 721 5.1% American Indian 85 0.6% 3 3 0.4% 82 0.6% Asian 866 5.8% 24 24 3.3% 842 5.9% Hispanic 979 6.5% 28 2 30 4.2% 949 6.6% Hispanic Multirace 85 0.6% 3 3 0.4% 82 0.6% Native Hawaiian/Pacifi c Island 359 2.4% 7 1 8 1.1% 351 2.5% White 8,159 54.4% 430 47 477 66.4% 7,682 53.8% Non Hispanic Multirace 801 5.3% 24 1 25 3.5% 776 5.4% Non Resident Alien 251 1.7% 21 2 23 3.2% 228 1.6% Not Reported 1,562 10.4% 28 2 30 4.2% 1,532 10.7%

2020 Fact Book - Students
13
Headcount by Graduate/Undergraduate Level and CharacteristicsUAA - Fall Closing 2019
Table 1.02
Age 0 - 17 1,189 7.9% 1,189 8.3% 18 - 18 1,132 7.6% 1,132 7.9% 19 - 19 1,099 7.3% 1,099 7.7% 20 - 24 4,046 27.0% 58 3 61 8.5% 3,985 27.9% 25 - 29 2,129 14.2% 157 16 173 24.1% 1,956 13.7% 30 - 39 2,571 17.2% 270 18 288 40.1% 2,283 16.0% 40 - 49 1,471 9.8% 109 11 120 16.7% 1,351 9.5% 50 - 59 910 6.1% 44 16 60 8.4% 850 6.0% 60 & Over 440 2.9% 14 2 16 2.2% 424 3.0% Not Reported 2 0.0% 2 0.0%
Residency Origin In State 13,602 90.7% 516 60 576 80.2% 13,026 91.3% Out of State 1,106 7.4% 110 3 113 15.7% 993 7.0% International 251 1.7% 21 2 23 3.2% 228 1.6% Not Reported 30 0.2% 5 1 6 0.8% 24 0.2%
Degree Level Certifi cate 189 1.3% 189 1.3% Associate 2,402 16.0% 2,402 16.8% Bachelor 6,797 45.3% 6,797 47.6% Master’s 573 3.8% 573 573 79.8% Doctorate 37 0.2% 37 37 5.2% Graduate Certifi cate 42 0.3% 42 42 5.8% Post Baccalaureate Certifi cate 22 0.1% 22 0.2% Non-Degree/Other UA Prog 4,927 32.9% 66 66 9.2% 4,861 34.1%
Attempted Credit Hours 0 - 2.9 2,156 14.4% 100 32 132 18.4% 2,024 14.2% 3 - 5.9 2,697 18.0% 168 28 196 27.3% 2,501 17.5% 6 - 8.9 2,500 16.7% 229 5 234 32.6% 2,266 15.9% 9 - 11.9 2,068 13.8% 110 1 111 15.5% 1,957 13.7% 12 - 14.9 3,688 24.6% 38 38 5.3% 3,650 25.6% 15 & Over 1,880 12.5% 7 7 1.0% 1,873 13.1%
Source: UA Data Strategy and Institutional Research (DSIR) Decision Support Database (DSD) data system at semester closing.
Notes: 1. UAA Total includes Anchorage, Kenai, Kodiak, Matanuska-Susitna, and Prince William Sound College. Headcount is unduplicated and includes
only credit students. Students who enrolled in multiple campuses have been counted only once in UAA Total. 2. Included are students enrolled in credit courses at the 050 level and above, including auditors. 3. Percentages may not add to 100% due to rounding. 4. See Defi nition of Terms for meaning of First-time Freshman.5. Non-Degree/Other UA Programs = Non-Degree seeking students or other University of Alaska program degree seekers.6. New transfer code added to Admission Type was not captured in freeze data resulting in an under count of Transfer and an over count of Continue
starting in fall 2018.
Graduate Undergraduate UAA % of UAA Other UA % of % of Total Total Programs Prog Total Total Total Total

Students - 2020 Fact Book
14
Percent Change 2015 2016 2017 2018 2019 2015-19 2018-19
Headcount by Student CharacteristicsUAA Total - Fall Semester Trends
Table 1.03
UAA Total 18,116 17,962 17,267 16,530 14,989 -17.3% -9.3% Anchorage Campus 14,357 14,308 13,702 13,158 11,879 -17.3% -9.7% Kenai Peninsula College 2,485 2,596 2,596 2,476 2,142 -13.8% -13.5% Kodiak College 804 767 762 721 641 -20.3% -11.1% Matanuska-Susitna College 1,899 1,775 1,682 1,559 1,409 -25.8% -9.6% Prince William Sound College 779 743 860 895 821 5.4% -8.3%
Admission Type New 2,805 2,616 2,760 2,353 2,010 -28.3% -14.6% Continue 10,580 10,320 9,863 10,217 9,213 -12.9% -9.8% Returned 3,893 4,293 3,932 3,919 3,720 -4.4% -5.1% Transfer 838 733 712 41 46 -94.5% 12.2%
Class Standing First-time Freshman 1,982 1,900 1,930 1,672 1,376 -30.6% -17.7% Freshman 2,275 2,186 1,958 1,849 1,798 -21.0% -2.8% Sophomore 2,480 2,422 2,320 2,172 1,921 -22.5% -11.6% Junior 2,228 2,030 2,000 1,841 1,619 -27.3% -12.1% Senior 3,589 3,473 3,238 3,105 2,696 -24.9% -13.2% Graduate 872 772 764 762 652 -25.2% -14.4% Licensure 1 Non-Degree/Other UA Prog 4,690 5,178 5,057 5,129 4,927 5.1% -3.9%
Full-time Graduate 245 200 190 199 156 -36.3% -21.6% Undergraduate 7,324 7,078 6,966 6,452 5,523 -24.6% -14.4%
Total 7,569 7,278 7,156 6,651 5,679 -25.0% -14.6%
Part-time Graduate 678 641 650 626 562 -17.1% -10.2% Undergraduate 9,869 10,043 9,461 9,253 8,748 -11.4% -5.5%
Total 10,547 10,684 10,111 9,879 9,310 -11.7% -5.8%
Gender Female 10,607 10,558 9,992 9,783 8,959 -15.5% -8.4% Male 7,509 7,331 7,082 6,562 5,840 -22.2% -11.0% Not Reported 73 193 185 190 2.7%
Race/Ethnicity African American 582 590 480 469 391 -32.8% -16.6% Alaska Native 924 846 816 773 687 -25.6% -11.1% Alaska Native Multirace 879 896 888 848 764 -13.1% -9.9% American Indian 109 113 121 111 85 -22.0% -23.4% Asian 1,254 1,216 1,232 1,011 866 -30.9% -14.3% Hispanic 1,145 1,193 1,164 1,079 979 -14.5% -9.3% Hispanic Multirace 79 88 87 110 85 7.6% -22.7% Native Hawaiian/Pacifi c Island 138 116 136 265 359 160.1% 35.5%
White 10,512 10,489 9,952 9,208 8,159 -22.4% -11.4% Non Hispanic Multirace 951 943 959 890 801 -15.8% -10.0% Non Resident Alien 292 312 329 295 251 -14.0% -14.9% Not Reported 1,251 1,160 1,103 1,471 1,562 24.9% 6.2%

2020 Fact Book - Students
15
Percent Change 2015 2016 2017 2018 2019 2015-19 2018-19
Source: UA Data Strategy and Institutional Research (DSIR) Decision Support Database (DSD) data system at semester closing. Notes: 1. UAA Total includes Anchorage, Kenai, Kodiak, Matanuska-Susitna, and Prince William Sound College. Headcount is unduplicated and includes only
credit students. Students who enrolled in multiple campuses have been counted only once in UAA Total.2. Included are students enrolled in credit courses at the 050 level and above, including auditors.3. See Defi nition of Terms for meaning of First-time Freshman.4. Non-Degree/Other UA Programs = Non-Degree seeking students or other University of Alaska program degree seekers.5. Changes in race defi nition resulted in a shift from Asian to the Native Hawaiian/Pacifi c Island group in fall 2018.6. New transfer code added to Admission Type was not captured in freeze data resulting in an under count of Transfer and an over count of Continue
starting in fall 2018.
Headcount by Student CharacteristicsUAA Total - Fall Semester Trends
Table 1.03
Age 0 - 17 732 993 1,198 1,253 1,189 62.4% -5.1% 18 - 18 1,425 1,334 1,350 1,236 1,132 -20.6% -8.4% 19 - 19 1,476 1,425 1,342 1,268 1,099 -25.5% -13.3% 20 - 24 5,680 5,397 5,034 4,609 4,046 -28.8% -12.2% 25 - 29 3,015 2,823 2,719 2,482 2,129 -29.4% -14.2% 30 - 39 2,979 3,013 2,846 2,819 2,571 -13.7% -8.8% 40 - 49 1,444 1,502 1,469 1,493 1,471 1.9% -1.5% 50 - 59 944 1,037 881 943 910 -3.6% -3.5% 60 & Over 419 434 428 427 440 5.0% 3.0% Not Reported 2 4 2 0.0%
Residency Origin In State 16,425 16,348 15,604 15,002 13,602 -17.2% -9.3% Out of State 1,357 1,267 1,280 1,192 1,106 -18.5% -7.2% International 292 313 329 295 251 -14.0% -14.9% Not Reported 42 34 54 41 30 -28.6% -26.8%
Degree Level Certifi cate 220 201 170 199 189 -14.1% -5.0% Associate 3,773 3,474 3,197 2,742 2,402 -36.3% -12.4% Bachelor 8,531 8,295 8,045 7,659 6,797 -20.3% -11.3% Master’s 729 653 631 663 573 -21.4% -13.6% Doctorate 37 37 30 41 37 0.0% -9.8% Graduate Certifi cate 106 82 103 58 42 -60.4% -27.6% Post Baccalaureate Certifi cate 30 41 34 39 22 -26.7% -43.6% Teaching Licensure 1 Non-Degree/Other UA Prog 4,690 5,178 5,057 5,129 4,927 5.1% -3.9%
Attempted Credit Hours 0 - 2.9 1,837 1,945 2,038 2,052 2,156 17.4% 5.1% 3 - 5.9 3,177 3,412 3,063 2,956 2,697 -15.1% -8.8% 6 - 8.9 3,135 3,026 2,776 2,701 2,500 -20.3% -7.4% 9 - 11.9 2,554 2,430 2,362 2,284 2,068 -19.0% -9.5% 12 - 14.9 4,820 4,543 4,417 4,249 3,688 -23.5% -13.2% 15 & Over 2,593 2,606 2,611 2,288 1,880 -27.5% -17.8%

Students - 2020 Fact Book
16
First-Time Freshman by Student CharacteristicsUAA - Fall Closing 2015-2019
Table 1.04
Percent Change 2015 2016 2017 2018 2019 2015-19 2018-19
First-Time Freshman Total 1,982 1,900 1,930 1,672 1,376 -30.6% -17.7%
Degree Level Certifi cate 33 21 23 28 17 -48.5% -39.3% Associate 688 633 654 465 331 -51.9% -28.8% Bachelor 1,250 1,225 1,223 1,141 993 -20.6% -13.0% Occupational Endorsement 11 21 30 38 35 218.2% -7.9%
Course Load Full-time 1,395 1,364 1,382 1,201 1,027 -26.4% -14.5% Part-time 587 536 548 471 349 -40.5% -25.9%
Attempted Credit Hours 0 - 2.9 2 5 3 1 -50.0% -66.7% 3 - 5.9 89 63 79 57 39 -56.2% -31.6% 6 - 8.9 201 204 205 193 139 -30.8% -28.0% 9 - 11.9 295 269 259 218 170 -42.4% -22.0% 12 - 14.9 1,045 941 952 873 775 -25.8% -11.2% 15 & Over 350 423 430 328 252 -28.0% -23.2%
Gender Female 1,077 1,056 1,052 916 753 -30.1% -17.8% Male 905 837 864 746 619 -31.6% -17.0% Not Reported 7 14 10 4 -60.0%
Age 0 - 17 51 62 56 56 43 -15.7% -23.2% 18 - 18 1,139 1,041 1,092 989 865 -24.1% -12.5% 19 - 19 378 355 346 286 235 -37.8% -17.8% 20 - 24 253 246 256 197 152 -39.9% -22.8% 25 - 29 85 101 95 70 35 -58.8% -50.0% 30 - 39 48 69 63 50 35 -27.1% -30.0% 40 - 49 20 19 18 17 5 -75.0% -70.6% 50 - 59 8 6 4 6 6 -25.0% 0.0% 60 & Over 1 1 -100.0%
Race/Ethnicity African American 68 65 57 57 35 -48.5% -38.6% Alaska Native 148 134 125 127 92 -37.8% -27.6% Alaska Native Multirace 138 141 150 167 109 -21.0% -34.7% American Indian 8 17 6 5 5 -37.5% 0.0% Asian 211 187 207 121 115 -45.5% -5.0% Hispanic 125 143 156 130 109 -12.8% -16.2% Hispanic Multirace 10 14 12 23 9 -10.0% -60.9% Native Hawaiian/Pacifi c Island 24 19 29 92 93 287.5% 1.1% White 981 912 931 714 628 -36.0% -12.0% Non Hispanic Multirace 147 140 149 134 101 -31.3% -24.6% Non Resident Alien 29 43 59 30 23 -20.7% -23.3% Not Reported 93 85 49 72 57 -38.7% -20.8%

2020 Fact Book - Students
17
First-Time Freshman by Student CharacteristicsUAA - Fall Closing 2015-2019
Table 1.04
Percent Change 2015 2016 2017 2018 2019 2015-19 2018-19
High School Percentile Top 10 211 85 192 163 112 -46.9% -31.3%
75 - 89th 317 140 284 234 211 -33.4% -9.8% 50 - 74th 461 197 387 376 283 -38.6% -24.7% 25 - 49th 374 167 297 293 195 -47.9% -33.4% Bottom 25 215 110 211 167 130 -39.5% -22.2% Unknown 404 1,201 559 439 445 10.1% 1.4%
High School GPA 4.0 + 37 54 50 64 37 0.0% -42.2%
3.5 - 3.9 491 461 434 376 339 -31.0% -9.8% 3.0 - 3.4 564 492 480 450 366 -35.1% -18.7% 2.5 - 2.9 535 536 426 362 246 -54.0% -32.0% 2.0 - 2.4 256 230 210 172 117 -54.3% -32.0% 1.5 - 1.9 57 62 62 33 27 -52.6% -18.2% 1.4 & Less 4 4 6 5 1 -75.0% -80.0% Unknown 38 61 262 210 243 539.5% 15.7%
Residency Origin In State 1,858 1,775 1,778 1,565 1,284 -30.9% -18.0%
Out of State 95 80 87 76 68 -28.4% -10.5% International 29 44 59 30 23 -20.7% -23.3% Not Reported 1 6 1 1 0.0%

Students - 2020 Fact Book
18
First-Time Freshman by Student CharacteristicsUAA - Fall Closing 2015-2019
Table 1.04
Percent Change 2015 2016 2017 2018 2019 2015-19 2018-19
High School Region Alaska Anchorage High Schools
Alaska Adult Learning Center 2 6 6 2 4 100.0% 100.0%
Alaska Middle College School 3 17 466.7%
Alaska Military Youth Academy 3 2 2 2 -33.3% 0.0%
Anchorage Christian Academy 1 -100.0%
Anchorage Christian Schools 7 12 6 8 12 71.4% 50.0%
Avail School 4 9 3 6 1 -75.0% -83.3%
Bartlett High School 100 98 81 63 57 -43.0% -9.5%
Benny Benson Secondary School 10 9 12 10 5 -50.0% -50.0%
Birchwood Christian School 2 5 1 1 2 0.0% 100.0%
Chugach Extension Corresp School 1 1 2 4 100.0%
Chugiak High School 77 66 81 41 47 -39.0% 14.6%
Crossroads High School 1 1 -100.0%
Dimond High School 115 113 117 112 86 -25.2% -23.2%
Eagle River Christian High School 3 1 2 2 1 -66.7% -50.0%
Eagle River High School 61 52 48 54 41 -32.8% -24.1%
East Anchorage High School 145 156 154 141 106 -26.9% -24.8%
Family Partnership Charter 14 17 17 17 8 -42.9% -52.9%
Focus Homeschool 2
Frontier Charter School 12 8 7 10 1 -91.7% -90.0%
Grace Christian School 16 9 9 9 6 -62.5% -33.3%
Highland Tech Charter School 7 8 5 6 3 -57.1% -50.0%
Holy Rosary Academy 1 3 1 3 2 100.0% -33.3%
Lumen Christi High School 9 5 9 4 4 -55.6% 0.0%
Martin Luther King Career Center 12
McLaughlin Secondary 1 2 1 -100.0% -100.0%
McLaughlin Youth Center 2 1 2 0.0% 100.0%
Paideia Cooperative School 1 2 3 50.0%
Polaris K-12 School 11 12 6 9 4 -63.6% -55.6%
SAVE High School 8 11 9 10 -100.0% -100.0%
Save I Program 1 1 1 1 -100.0% -100.0%
Service High School 123 124 121 112 89 -27.6% -20.5%
South Anchorage High School 95 92 104 71 89 -6.3% 25.4%
Steller Secondary Alternative 17 8 17 9 7 -58.8% -22.2%
Univ of AK Anchorage-High School 1
West High School Anchorage 98 96 117 106 74 -24.5% -30.2%
Whaley High School 1
World Harvest Christian School 1 1

2020 Fact Book - Students
19
First-Time Freshman by Student CharacteristicsUAA - Fall Closing 2015-2019
Table 1.04
Percent Change 2015 2016 2017 2018 2019 2015-19 2018-19
Source: UA Data Strategy and Institutional Research (DSIR) Decision Support Database (DSD) data system at semester closing. Notes: 1. First-time Freshman is a degree-seeking student who enrolls in an institution with no prior postsecondary experience. Includes students enrolled in
academic or occupational programs. Also includes students enrolled in the fall term who attended college for the fi rst time in the prior summer term, or students who entered with advanced standing (college credits earned before graduation from high school).
2. Changes in race defi nition resulted in a shift from Asian to the Native Hawaiian/Pacifi c Island group in fall 2018.
High School Region (continued)
Alaska Gulf Coast High Schools 178 178 169 131 89 -50.0% -32.1%
Alaska Interior High Schools 83 91 74 76 59 -28.9% -22.4%
Alaska Mat-Su High Schools 285 269 275 274 235 -17.5% -14.2%
Alaska Northern High Schools 49 40 31 34 29 -40.8% -14.7%
Alaska Other High Schools 9 6 8 13 16 77.8% 23.1%
Alaska Southeast High Schools 64 41 60 44 36 -43.8% -18.2%
Alaska Southwest High Schools 67 49 40 54 35 -47.8% -35.2%
American Military High School 5 5 1 4 -20.0% 300.0%
American Possessions 2 1 1 1 -50.0% 0.0%
East North Central States 19 9 12 12 10 -47.4% -16.7%
East South Central States 12 7 9 2 4 -66.7% 100.0%
GED (Alaska) 64 63 59 48 44 -31.3% -8.3%
GED (Outside Alaska) 18 17 17 19 6 -66.7% -68.4%
Home School 8 11 4 3 11 37.5% 266.7%
International High Schools 16 21 13 4 5 -68.8% 25.0%
Mid-Atlantic States 11 10 8 7 4 -63.6% -42.9%
Mountain States 29 30 28 18 21 -27.6% 16.7%
New England States 8 5 7 3 3 -62.5% 0.0%
No High School 1
Pacifi c States 51 61 47 42 28 -45.1% -33.3%
South Atlantic States 27 20 23 19 12 -55.6% -36.8%
Unknown High School 4 9 72 30 23 475.0% -23.3%
West North Central States 9 16 13 4 5 -44.4% 25.0%
West South Central States 19 15 18 14 6 -68.4% -57.1%

Anchorage Campus College of Arts & Sciences Anthropology Bachelor of Arts 79 88 62 57 49 Bachelor of Science 19 20 25 19 19 Master of Arts 30 26 28 23 19
Total 128 134 115 99 87 Applied Ethics One Year Certifi cate 2 1 Applied Geological Sciences Master of Science 15 20 Art Bachelor of Arts 136 129 127 132 114 Bachelor of Fine Arts 7 12 14 11 6
Total 143 141 141 143 120 Biological Sciences Bachelor of Arts 69 60 39 29 26 Bachelor of Science 398 402 405 361 320 Master of Science 28 24 26 26 35
Total 495 486 470 416 381 Chemistry Bachelor of Science 38 19 18 46 55 Children’s Mental Health Graduate Certifi cate 1 1 1 Clinical Psychology Master of Science 19 20 16 19 19 Clinical-Community Psychology Ph.D. 31 28 23 30 29 Creative Writing & Literary Arts Master of Fine Arts 45 43 46 39 35 Dual Language Bachelor of Arts 19 14 9 4 English Bachelor of Arts 178 178 163 163 142 Master of Arts 12 15 12 13 8 Total 190 193 175 176 150 Environment & Society Bachelor of Arts 20 9 1 Bachelor of Science 57 59 71 66 65 Total 77 68 72 66 65
Students - 2020 Fact Book
20
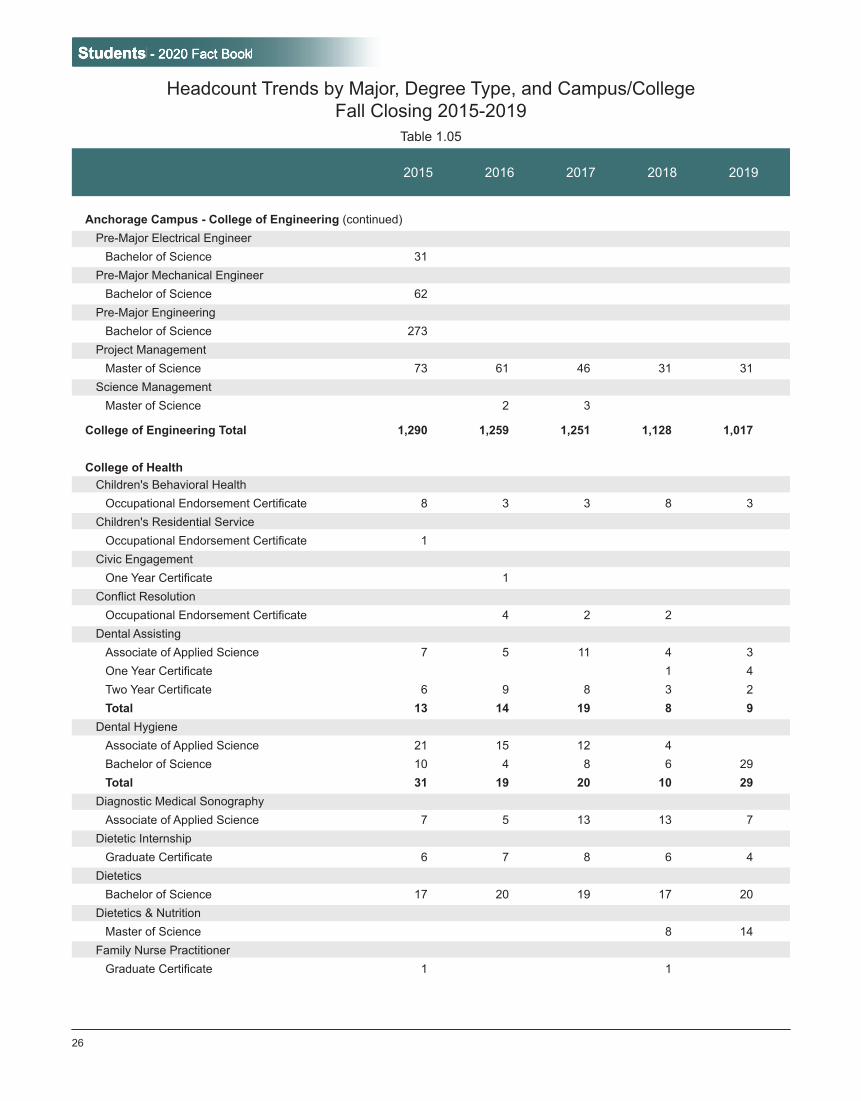
Headcount Trends by Major, Degree Type, and Campus/CollegeFall Closing 2015-2019
Table 1.05
2015 2016 2017 2018 2019

General Program Associate of Arts 455 385 317 251 196 Geological Science Bachelor of Science 85 88 77 70 49 History Bachelor of Arts 138 135 123 120 109 Interdisciplinary Studies Bachelor of Arts 1 1 2 Bachelor of Science 1 1 1 Master of Science 10 14 14 12 11
Total 12 14 15 14 13 International Studies Bachelor of Arts 69 76 85 64 48 Journalism & Public Communications Bachelor of Arts 119 118 119 100 81 Languages Bachelor of Arts 99 69 73 61 77 Liberal Studies Bachelor of Liberal Studies 7 6 2 Mathematics Bachelor of Arts 16 13 11 7 10 Bachelor of Science 68 60 58 57 37
Total 84 73 69 64 47 Music Bachelor of Arts 24 25 27 14 15 Bachelor of Music 16 30 33 35 Total 24 41 57 47 50 Music Education Bachelor of Music 44 35 25 18 8 Music Performance Bachelor of Music 21 13 3 1 Natural Sciences Bachelor of Science 215 240 240 217 203 Philosophy Bachelor of Arts 31 24 20 25 15 Political Science Bachelor of Arts 65 59 64 73 65 Pre-Major Fine Arts Bachelor of Fine Arts 57 48 43 49 50
2020 Fact Book - Students
21
Headcount Trends by Major, Degree Type, and Campus/CollegeFall Closing 2015-2019
Table 1.05
2015 2016 2017 2018 2019

Students - 2020 Fact Book
22
Headcount Trends by Major, Degree Type, and Campus/CollegeFall Closing 2015-2019
Table 1.05
2015 2016 2017 2018 2019
Anchorage Campus - College of Arts & Sciences (continued) Pre-Major Music Education Bachelor of Music 1 Pre-Major Music Performance Bachelor of Music 1 Psychology Bachelor of Arts 338 278 242 233 226 Bachelor of Science 105 125 149 156 163
Total 443 403 391 389 389 Sociology Bachelor of Arts 43 42 36 30 31 Bachelor of Science 8 5 10 12 7 Total 51 47 46 42 38 Theatre Bachelor of Arts 49 41 40 49 43
School of Education (SOE) SOE: Counselor Education Graduate Certifi cate 3 1 Master of Education 37 18 6
Total 40 18 7 SOE: Early Childhood Post-Bachelor Certifi cate 5 6 1 4 SOE: Early Childhood Development Associate of Applied Science 40 40 41 31 41 One Year Certifi cate 3 1 Total 43 41 41 31 41 SOE: Early Childhood Education Bachelor of Arts 193 161 146 117 2 SOE: Early Childhood Special Education Master of Education 8 9 9 13 5 SOE: Education Master of Arts in Teaching 20 28 31 36 SOE: Educational Leadership Master of Education 37 34 36 30 23 SOE: Elementary Education Bachelor of Arts 234 269 284 267 1 SOE: Elementary Education (K-6) Post-Bachelor Certifi cate 10 10 12 16 SOE: Language Education Graduate Certifi cate 29 29 40 3 6

2020 Fact Book - Students
23
Headcount Trends by Major, Degree Type, and Campus/CollegeFall Closing 2015-2019
Table 1.05
2015 2016 2017 2018 2019
SOE: Principal Graduate Certifi cate 29 19 31 28 24 SOE: Reading Specialist Educational Endorsement 2 SOE: Special Education Graduate Certifi cate 21 21 21 21 8 Master of Education 12 7 6 5 5
Total 33 28 27 26 13 SOE: Speech Language Pathology Post-Bachelor Certifi cate 12 21 11 12 18 SOE: Superintendent Educational Endorsement 1 Graduate Certifi cate 3 1 Total 4 1 SOE: Teaching Credential-Special Education Licensure Program 1 SOE: Teaching and Learning Master of Education 28 24 29 35 19
School of Education Total 728 699 705 618 152
College of Arts & Sciences Total 3,985 3,762 3,600 3,325 2,594
College of Business & Public Policy Accounting Associate of Applied Science 85 93 88 82 85 Bachelor of Business Administration 362 333 326 291 289
Total 447 426 414 373 374 Business Computer Information Systems Associate of Applied Science 17 15 18 13 13 Economics Bachelor of Arts 43 57 54 49 39 Bachelor of Business Administration 41 49 54 47 38
Total 84 106 108 96 77 Finance Bachelor of Business Administration 131 119 118 107 87 General Business Associate of Applied Science 34 General Management Master of Business Administration 77 70 72 74 82

Students - 2020 Fact Book
24
Headcount Trends by Major, Degree Type, and Campus/CollegeFall Closing 2015-2019
Table 1.05
2015 2016 2017 2018 2019
Anchorage Campus - College of Business & Public Policy (continued) Global Logistics Supply Chain Management Bachelor of Business Administration 74 69 53 60 47 Global Supply Chain Management Master of Science 21 10 1 13 17 Logistics & Supply Chain Operations Associate of Applied Science 24 21 15 10 15 One Year Certifi cate 6 4 2 2 3 Occupational Endorsement Certifi cate 5 1
Total 30 30 17 12 19 Management Bachelor of Business Administration 430 420 446 414 378 Management Information Systems Bachelor of Business Administration 57 63 47 50 41 Marketing Bachelor of Business Administration 100 118 114 92 106 Pre-Global Logistics Supply Chain Management Bachelor of Business Administration 1 4 2 Pre-Major Accounting Bachelor of Business Administration 6 5 1 1 1 Pre-Major Finance Bachelor of Business Administration 2 1 3 1 1 Pre-Major Management Bachelor of Business Administration 9 8 9 2 2 Pre-Major Management Information System Bachelor of Business Administration 1 1 1 Pre-Major Marketing Bachelor of Business Administration 1 2 1 2 3 Pre-Major Global Logistics Management Bachelor of Business Administration 1 Pre-Major Economics Bachelor of Business Administration 1 2 1 Public Administration Master of Public Administration 36 33 32 36 24 Retail Management One Year Certifi cate 8 4 Small Business Administration Associate of Applied Science 85 87 81 74 43
College of Business & Public Policy Total 1,615 1,588 1,538 1,427 1,352

2020 Fact Book - Students
25
Headcount Trends by Major, Degree Type, and Campus/CollegeFall Closing 2015-2019
Table 1.05
2015 2016 2017 2018 2019
College of Engineering Applied Environmental Science & Technology Masters - Other 5 2 Master of Science 6 3 2 Total 11 5 2 Arctic Engineering Master of Science 7 4 2 2 1 Civil Engineering Bachelor of Science 94 220 219 222 206 Masters of Civil Engineering 8 7 3 Master of Science 19 30 36 33 23 Total 121 257 258 255 229 Computer Science Bachelor of Arts 55 48 47 39 31 Bachelor of Science 174 171 205 213 201 Total 229 219 252 252 232 Computer Systems Engineering Bachelor of Science 12 50 69 52 63 Electrical Engineering Bachelor of Science 15 95 124 118 123 Engineering Bachelor of Science 161 191 71 32 9 Engineering Management Master of Science 12 10 7 4 Environmental Regulation & Permitting Graduate Certifi cate 5 2 Geographic Information Systems One Year Certifi cate 5 1 Geomatics Associate of Applied Science 9 10 14 12 6 Bachelor of Science 69 77 69 61 47 Total 78 87 83 73 53 Mechanical Engineering Bachelor of Science 50 270 327 299 268 Master of Science 4 5 7 10 8 Total 54 275 334 309 276 Pre-Major Civil Engineering Bachelor of Science 127 Pre-Major Computer Systems Engineering Bachelor of Science 14
Students - 2020 Fact Book
26
Headcount Trends by Major, Degree Type, and Campus/CollegeFall Closing 2015-2019
Table 1.05
2015 2016 2017 2018 2019
Anchorage Campus - College of Engineering (continued) Pre-Major Electrical Engineer Bachelor of Science 31 Pre-Major Mechanical Engineer Bachelor of Science 62 Pre-Major Engineering Bachelor of Science 273 Project Management Master of Science 73 61 46 31 31 Science Management Master of Science 2 3
College of Engineering Total 1,290 1,259 1,251 1,128 1,017
College of Health Children's Behavioral Health Occupational Endorsement Certifi cate 8 3 3 8 3 Children's Residential Service Occupational Endorsement Certifi cate 1 Civic Engagement One Year Certifi cate 1 Confl ict Resolution Occupational Endorsement Certifi cate 4 2 2 Dental Assisting Associate of Applied Science 7 5 11 4 3 One Year Certifi cate 1 4 Two Year Certifi cate 6 9 8 3 2
Total 13 14 19 8 9 Dental Hygiene Associate of Applied Science 21 15 12 4 Bachelor of Science 10 4 8 6 29 Total 31 19 20 10 29 Diagnostic Medical Sonography Associate of Applied Science 7 5 13 13 7 Dietetic Internship Graduate Certifi cate 6 7 8 6 4 Dietetics Bachelor of Science 17 20 19 17 20 Dietetics & Nutrition Master of Science 8 14 Family Nurse Practitioner Graduate Certifi cate 1 1

2020 Fact Book - Students
27
Headcount Trends by Major, Degree Type, and Campus/CollegeFall Closing 2015-2019
Table 1.05
2015 2016 2017 2018 2019
Fire & Emergency Services Technology Associate of Applied Science 66 44 50 41 25 Health Sciences Bachelor of Science 23 50 74 61 97 Human Services Associate of Applied Science 117 105 84 64 56 Bachelor of Human Services 54 41 35 36 34
Total 171 146 119 100 90 Justice Bachelor of Arts 96 75 55 42 46 Legal Nurse Consultant Paralegal One Year Certifi cate 2 Legal Studies Bachelor of Arts 14 24 27 30 45 Limited Radiography Occupational Endorsement Certifi cate 4 4 1 Medical Assisting Associate of Applied Science 23 19 20 15 9 Medical Laboratory Science Bachelor of Science 104 120 118 87 76 Medical Laboratory Technology Associate of Applied Science 4 5 9 1 1 Medical Offi ce Coding Occupational Endorsement Certifi cate 22 25 21 23 24 Medical Offi ce Supply Occupational Endorsement Certifi cate 2 Nursing Associate of Applied Science 185 174 165 192 174 Nursing Education Graduate Certifi cate 1 Nursing Science Bachelor of Science 186 176 219 276 291 Doctorate Nursing Practitioner 6 9 7 11 8 Master of Science 43 34 35 49 44
Total 235 219 261 336 343 Nutrition Bachelor of Science 10 7 6 Paralegal Studies Associate of Applied Science 5 7 6 7 7 Post-Bachelor Certifi cate 1 2 4 4 3
Total 6 9 10 11 10

Students - 2020 Fact Book
28
Headcount Trends by Major, Degree Type, and Campus/CollegeFall Closing 2015-2019
Table 1.05
2015 2016 2017 2018 2019
Anchorage Campus - College of Health (continued)Pharmacy Technology
Occupational Endorsement Certifi cate 15 13 18 16 23 Phlebotomist Occupational Endorsement Certifi cate 3 6 2 6 7 Physical Education Bachelor of Science 120 104 101 102 76 Physical Therapist Assistant Associate of Applied Science 14 14 11 11 13 Pre-Major Dental Assisting Associate of Applied Science 10 8 4 6 6 One Year Certifi cate 2 1 Two Year Certifi cate 2 2 9 4 2
Total 12 10 13 12 9 Pre-Major Dental Hygiene Associate of Applied Science 58 56 53 Bachelor of Science 50 69 70 122 101 Total 108 125 123 122 101 Pre-Major Diagnostic Medical Sonography Associate of Applied Science 15 13 26 30 53 Pre-Major Dietetics Bachelor of Science 63 51 53 59 57 Pre-Major Health Science Bachelor of Science 219 259 240 298 259 Pre-Major Human Services Bachelor of Human Services 1 Pre-Major Justice Bachelor of Arts 122 130 104 117 79 Pre-Major Legal Studies Bachelor of Arts 42 27 30 25 22 Pre-Major Medical Assisting Associate of Applied Science 61 45 36 28 32 Pre-Major Medical Laboratory Science Bachelor of Science 3 9 3 Pre-Major Medical Laboratory Technology Associate of Applied Science 23 20 11 10 7 Pre-Major Nursing Associate of Applied Science 335 339 349 304 275 Pre-Major Nursing Science Bachelor of Science 756 759 698 663 657

2020 Fact Book - Students
29
Headcount Trends by Major, Degree Type, and Campus/CollegeFall Closing 2015-2019
Table 1.05
2015 2016 2017 2018 2019
Pre-Major Paralegal Studies Associate of Applied Science 13 13 8 11 11 Two Year Certifi cate 1 1 Post-Bachelor Certifi cate 2 2 6 3 1
Total 16 16 14 14 12 Pre-Major Physical Therapist Assisting Associate of Applied Science 39 52 56 66 45 Pre-Major Social Work Bachelor of Social Work 111 102 97 85 100 Pre-Major Legal Nurse Consulting Paralegal One Year Certifi cate 1 1 Pre-Major Radiologic Technology Associate of Applied Science 111 102 94 92 74 Pre-Major Surgical Technology Associate of Applied Science 13 21 33 Psychiatric & Mental Health Nurse Practitioner Graduate Certifi cate 3 3 Public Health Practice Master of Public Health 75 67 75 68 64 Radiologic Technology Associate of Applied Science 11 24 35 36 17 Social Work Bachelor of Social Work 35 33 32 29 24 Master of Social Work 54 53 51 69 66 Total 89 86 83 98 90 Social Work Management Graduate Certifi cate 2 Surgical Technology Associate of Applied Science 11 11
College of Health Total 3,415 3,363 3,318 3,316 3,134 Community & Technical College Advanced Welding Occupational Endorsement Certifi cate 1 5 2 3 Air Traffi c Control Associate of Applied Science 24 28 17 10 16 Applied Technologies Leadership Bachelor of Science 19 47 46 42 Apprenticeship Technology Associate of Applied Science 1

Students - 2020 Fact Book
30
Headcount Trends by Major, Degree Type, and Campus/CollegeFall Closing 2015-2019
Table 1.05
2015 2016 2017 2018 2019
Anchorage Campus - Community & Technical College (continued) Architectural & Engineering Technology Associate of Applied Science 38 29 18 12 10 Architectural Drafting One Year Certifi cate 2 Architectural Technology One Year Certifi cate 2 1 Automotive Technology Associate of Applied Science 25 32 52 47 46 Two Year Certifi cate 10 7 3 10 9
Total 35 39 55 57 55 Automotive - Electrical Occupational Endorsement Certifi cate 1 Aviation Administration Associate of Applied Science 42 23 19 20 5 Aviation Maintenance - Airframe Two Year Certifi cate 30 28 26 20 22 Aviation Maintenance - Powerplant Two Year Certifi cate 6 7 12 13 16 Aviation Maintenance Technology Associate of Applied Science 34 22 20 27 31 Aviation Technology Bachelor of Science 188 194 196 210 196 Brakes, Suspension, Alignment Occupational Endorsement Certifi cate 2 1 CAD for Building Construction Occupational Endorsement Certifi cate 3 1 Career & Technical Education Master of Science 3 Cisco Certifi cate Network Associate Occupational Endorsement Certifi cate 1 1 3 Civil Drafting One Year Certifi cate 2 Civil Technology One Year Certifi cate 1 Computer & Networking Technology Associate of Applied Science 105 100 74 64 56 Two Year Certifi cate 8 4 1 Total 113 104 75 64 56

2020 Fact Book - Students
31
Headcount Trends by Major, Degree Type, and Campus/CollegeFall Closing 2015-2019
Table 1.05
2015 2016 2017 2018 2019
Computer Information Offi ce Systems Associate of Applied Science 7 3 1 Construction Management Associate of Applied Science 26 27 18 20 18 Bachelor of Science 121 111 100 87 82
Total 147 138 118 107 100 Culinary Arts Associate of Applied Science 74 65 68 54 43 Diesel Power Technology Associate of Applied Science 12 30 35 22 One Year Certifi cate 3 2 8 11 Total 15 32 43 33 Heavy Duty Transportation & Equipment Associate of Applied Science 20 15 5 2 Two Year Certifi cate 12 2 2 Total 32 17 7 2 Hospitality Administration Bachelor of Arts 19 30 Hospitality Restaurant Management Bachelor of Arts 82 62 63 30 12 Mechanical & Electrical Technology One Year Certifi cate 1 Mechanical & Electrical Drafting One Year Certifi cate 1 Medical Technology Bachelor of Science 7 4 1 1 Nondestructive Testing Technology Occupational Endorsement Certifi cate 3 3 1 1 3 Occupational Safety & Health Associate of Applied Science 85 52 46 37 32 Bachelor of Science 19 34 35 Total 85 52 65 71 67 Offi ce Foundations Occupational Endorsement Certifi cate 1 Offi ce Support Occupational Endorsement Certifi cate 1 Pre-Major Technology Bachelor of Science 42 21 4 1 1 Professional Piloting Associate of Applied Science 46 37 58 36 41

Students - 2020 Fact Book
32
Headcount Trends by Major, Degree Type, and Campus/CollegeFall Closing 2015-2019
Table 1.05
2015 2016 2017 2018 2019
Anchorage Campus - Community & Technical College (continued) Structural Drafting One Year Certifi cate 1 Technology Bachelor of Science 45 37 10 3 1 Welding & Non-Destructive Testing Technology Associate of Applied Science 55 57 43 24 30 Welding Occupational Endorsement Certifi cate 2 4 6 12 6
Community & Technical College Total 1,157 1,019 965 887 819
Anchorage Campus Non-Degree Exploratory Major/Undeclared Bachelor of Arts 569 492 414 341 326 Non-Degree Seeking Non-Degree Seeking 2,572 2,711 2,657 2,732 2,557 Pending Degree Seeking 1
Total 2,573 2,711 2,657 2,732 2,557 Pending Degree Seeking Graduate 18 17 21 18 13 Undergraduate 121 92 80 83 69 Total 139 109 101 101 82 Other Exchange Student 13 11 3 4 5 Inactivated Program 25 22 25 4 7 Total 38 33 28 8 12 Pre-Graduate Non-Degree Seeking 1 1 1 1
Anchorage Campus Non-Degree Total 3,319 3,346 3,201 3,183 2,978
Anchorage Campus Total 14,781 14,337 13,873 13,266 11,894

2020 Fact Book - Students
33
Headcount Trends by Major, Degree Type, and Campus/CollegeFall Closing 2015-2019
Table 1.05
2015 2016 2017 2018 2019
Kenai Peninsula College Computer Electronics Associate of Applied Science 3 2 Computer Information Offi ce Systems Associate of Applied Science 2 Corrections One Year Certifi cate 5 2 2 2 Occupational Endorsement Certifi cate 1 1 1
Total 6 1 2 2 3 Digital Art Associate of Applied Science 8 2 1 General Business Associate of Applied Science 44 52 43 49 37 General Program Associate of Arts 153 163 141 143 114 Industrial Process Instrumentation Associate of Applied Science 55 48 38 20 18 Non-Degree Seeking Non-Degree Seeking 456 408 440 406 447 Occupational Safety & Health Associate of Applied Science 1 1 1 Paramedical Technology Associate of Applied Science 13 6 5 9 14 Pending Degree Seeking Pending Degree Seeking 7 9 4 4 7 Petroleum Technology One Year Certifi cate 3 4 7 3 9 Two Year Certifi cate 1 Total 4 4 7 3 9 Pre-Major Paramedical Technology Associate of Applied Science 15 25 23 22 8 Pre-Major Process Technology Associate of Applied Science 69 69 62 79 33 Process Technology Associate of Applied Science 158 89 71 46 78 Small Business Administration Associate of Applied Science 1 Welding Technology One Year Certifi cate 12 18 13 15 8 Two Year Certifi cate 1
Total 13 18 13 15 8
Kenai Peninsula College Total 1,008 897 851 798 776

Students - 2020 Fact Book
34
Headcount Trends by Major, Degree Type, and Campus/CollegeFall Closing 2015-2019
Table 1.05
2015 2016 2017 2018 2019
Kodiak College Accounting Associate of Applied Science 20 21 14 10 10 Alutiiq Language Occupational Endorsement Certifi cate 3 1 2 1 Computer Information Offi ce Systems Associate of Applied Science 5 1 General Business Associate of Applied Science 12 14 11 13 13 General Program Associate of Arts 102 118 101 70 69 Non-Degree Seeking Non-Degree Seeking 146 173 167 124 120 Offi ce Support Occupational Endorsement Certifi cate 1 1 2 Pending Degree Seeking Pending Degree Seeking 11 11 6 7 1 Technology Associate of Applied Science 8 8 8 6 8 Welding One Year Certifi cate 2 1 1 1
Kodiak College Total 307 350 309 233 225
Matanuska-Susitna College Accounting Associate of Applied Science 38 34 25 32 36 Cisco Certifi cate Network Associate Occupational Endorsement Certifi cate 2 1 Commercial HVAC Systems Occupational Endorsement Certifi cate 1 1 Commercial Refrigeration Occupational Endorsement Certifi cate 1 1 Computer Information Offi ce Systems Associate of Applied Science 13 8 4 1 Computer Systems Technology Associate of Applied Science 11 27 36 30 26 General Business Associate of Applied Science 35 45 46 42 36 General Program Associate of Arts 372 344 275 213 149

2020 Fact Book - Students
35
Headcount Trends by Major, Degree Type, and Campus/CollegeFall Closing 2015-2019
Table 1.05
2015 2016 2017 2018 2019
Human Services Associate of Applied Science 57 48 52 41 38 Non-Degree Seeking Non-Degree Seeking 238 265 280 402 386 Offi ce Foundations Occupational Endorsement Certifi cate 1 8 3 2 Paramedical Technology Associate of Applied Science 12 7 16 14 14 Pending Degree Seeking Pending Degree Seeking 5 3 1 Pre-Major Paramedical Technology Associate of Applied Science 24 33 24 16 15 Refrigeration & Heating Technology Associate of Applied Science 13 13 17 10 8 Two Year Certifi cate 3 5 2 5 2
Total 16 18 19 15 10 Residential Heat/Vent Occupational Endorsement Certifi cate 1 Small Business Administration Associate of Applied Science 16 15 15 13 3 Sustainable Energy Occupational Endorsement Certifi cate 4 1 Veterinary Assisting Occupational Endorsement Certifi cate 4 8 10 23 13
Matanuska-Susitna College Total 848 855 813 848 730
Prince William Sound College Computer Information Offi ce Systems Associate of Applied Science 3 Direct Services Specialist Occupational Endorsement Certifi cate 3 Disability Services Associate of Applied Science 19 7 4 1 General Program Associate of Arts 48 38 29 26 32 Industrial Technology Associate of Applied Science 12 8 5 Two Year Certifi cate 1
Total 13 8 5

Students - 2020 Fact Book
36
Headcount Trends by Major, Degree Type, and Campus/CollegeFall Closing 2015-2019
Table 1.05
2015 2016 2017 2018 2019
Prince William Sound College (continued)Millwright
Occupational Endorsement Certifi cate 3 3 8 6 Non-Degree Seeking Non-Degree Seeking 531 462 550 545 523 Outdoor Leadership Associate of Applied Science 9 10 10 8 12
Prince William Sound Total 626 528 601 588 573
Other UA Programs UAF Programs 312 540 468 419 449 UAS Programs 234 455 352 378 342
UAA Total 18,116 17,962 17,267 16,530 14,989
Source: UA Data Strategy and Institutional Research (DSIR) Decision Support Database (DSD) data system at semester closing.
Notes:1. Student distribution in this report is based on primary/home campus where students are offi cially admitted.2. Headcount is unduplicated. 3. Students who enrolled in multiple campuses have been counted only once in UAA Total.

2020 Fact Book - Students
37
2010 - 11 390 1,950 1,840 311 952 1,615 8,374 20,559 20,630
2011 - 12 441 2,134 1,944 518 957 1,731 8,642 20,699 20,879
2012 - 13 419 1,990 1,825 214 753 1,712 8,042 19,825 20,354
2013 - 14 473 1,914 1,822 175 834 1,328 7,711 19,629 19,205
2014 - 15 464 1,844 1,731 199 681 1,809 7,678 18,649 19,064
2015 - 16 506 1,899 1,726 92 779 1,628 7,330 18,116 17,911
2016 - 17 547 1,775 1,547 89 743 1,357 7,135 17,962 16,888
2017 - 17 453 1,682 1,571 98 860 1,453 7,070 17,267 16,362
2018 - 19 393 1,559 1,549 92 895 1,463 6,820 16,530 15,660
2019 - 20 310 1,409 1,354 143 821 472 6,391 14,989 13,463
2010 - 11 7,295 16,129 15,488 560 2,194 2,427 144 614 806
2011 - 12 7,273 16,205 5,537 807 2,784 2,702 217 755 940
2012 - 13 6,931 15,718 15,268 832 2,550 2,574 232 841 925
2013 - 14 6,682 15,640 14,573 747 2,523 2,613 263 796 968
2014 - 15 6,601 14,754 14,152 800 2,716 2,641 223 793 992
2015 - 16 6,286 14,357 13,576 876 2,485 2,336 250 804 804
2016 - 17 6,092 14,308 12,954 838 2,596 2,565 246 767 777
2017 - 18 6,097 13,702 12,518 898 2,596 2,400 242 762 738
2018 - 19 5,836 13,158 11,928 915 2,476 2,287 265 721 689
2019 - 20 5,550 11,879 11,062 745 2,142 1,883 208 641 596
Closing Headcount Trend by Campus and TermTable 1.06
Anchorage Campus Kenai Peninsula College Kodiak College
Summer Fall Spring Summer Fall Spring Summer Fall Spring
Source: UA Data Strategy and Institutional Research (DSIR) Decision Support Database (DSD) data system at semester closing.
Notes:1. Included are students enrolled in credit courses at the 050 level and above, including auditors. 2. Each campus refl ects unduplicated student headcount. 3. Students who enrolled in multiple campuses have been counted only once in UAA total.
Matanuska-Susitna College Prince William Sound College Total UAA
Summer Fall Spring Summer Fall Spring Summer Fall Spring

Students - 2020 Fact Book
Fall 2015 Fall 2016 Fall 2017 Fall 2018 Fall 2019
Undergraduate Applied, Accepted, and Enrolled Students at UAATable 1.07
38
College of Arts & Sciences Applied 2,055 1,874 1,717 1,721 1,610 Accepted 1,492 1,625 1,301 1,461 1,372 Enrolled 1,087 973 941 844 694 Selectivity 71.7% 86.7% 75.8% 84.9% 85.2% Yield 72.9% 59.9% 72.3% 57.8% 50.6%
School of Education Applied 210 217 193 190 29 Accepted 158 188 149 157 21 Enrolled 117 105 103 84 12 Selectivity 75.2% 86.6% 77.2% 82.6% 72.4% Yield 74.1% 55.9% 69.1% 53.5% 57.1%
College of Business & Public Policy Applied 641 618 541 554 528 Accepted 475 500 419 452 446 Enrolled 344 308 295 271 256 Selectivity 74.1% 80.9% 77.4% 81.6% 84.5% Yield 72.4% 61.6% 70.4% 60.0% 57.4%
College of Engineering Applied 597 546 565 543 504 Accepted 448 460 422 456 443 Enrolled 325 280 316 291 231 Selectivity 75.0% 84.2% 74.7% 84.0% 87.9% Yield 72.5% 60.9% 74.9% 63.8% 52.1%
College of Health Applied 1,700 1,677 1,578 1,646 1,586 Accepted 1,274 1,429 1,207 1,377 1,337 Enrolled 833 849 821 808 708 Selectivity 74.9% 85.2% 76.5% 83.7% 84.3% Yield 65.4% 59.4% 68.0% 58.7% 53.0%
Community & Technical College Applied 635 545 478 477 485 Accepted 461 429 377 394 408 Enrolled 318 261 254 226 208 Selectivity 72.6% 78.7% 78.9% 82.6% 84.1% Yield 69.0% 60.8% 67.4% 57.4% 51.0%
Anchorage Campus Total Applied 5,838 5,477 5,072 5,131 4,742 Accepted 4,308 4,631 3,875 4,297 4,027 Enrolled 3,024 2,776 2,730 2,524 2,109 Selectivity 73.8% 84.6% 76.4% 83.7% 84.9% Yield 70.2% 59.9% 70.5% 58.7% 52.4%

2020 Fact Book - Students
39
Undergraduate Applied, Accepted, and Enrolled Students at UAATable 1.07
Fall 2015 Fall 2016 Fall 2017 Fall 2018 Fall 2019
Source: UA Data Strategy and Institutional Research (DSIR) Decision Support Database (DSD) data system at semester closing.
Notes: 1. Included are applicants to Associate and Baccalaureate degree programs only. 2. An applicant may be counted more than once in the report due to application submissions to multiple programs in a given fall semester.3. Selectivity = Accepted/Applicants; it shows the percentage of total applications that were accepted into programs. 4. Yield = Enrolled/Accepted; it refers to the percentage of total accepted that enrolled in the same fall semester.
Kenai Peninsula College Applied 237 211 239 243 238 Accepted 224 199 198 212 151 Enrolled 168 162 139 157 100 Selectivity 94.5% 94.3% 82.8% 87.2% 63.4% Yield 75.0% 81.4% 70.2% 74.1% 66.2%
Kodiak College Applied 103 105 86 76 72 Accepted 78 75 54 36 15 Enrolled 73 64 42 28 10 Selectivity 75.7% 71.4% 62.8% 47.4% 20.8% Yield 93.6% 85.3% 77.8% 77.8% 66.7%
Matanuska-Susitna College Applied 369 340 289 287 197 Accepted 277 289 232 244 167 Enrolled 221 228 183 169 117 Selectivity 75.1% 85.0% 80.3% 85.0% 84.8% Yield 79.8% 78.9% 78.9% 69.3% 70.1%
Prince William Sound College Applied 72 37 35 35 48 Accepted 63 37 19 27 32 Enrolled 31 26 13 19 21 Selectivity 87.5% 100.0% 54.3% 77.1% 66.7% Yield 49.2% 70.3% 68.4% 70.4% 65.6%
UAA Total Applied 6,619 6,170 5,721 5,772 5,297 Accepted 4,950 5,231 4,378 4,816 4,392 Enrolled 3,517 3,256 3,107 2,897 2,357 Selectivity 74.8% 84.8% 76.5% 83.4% 82.9% Yield 71.1% 62.2% 71.0% 60.2% 53.7%

Students - 2020 Fact Book
Fall 2015 Fall 2016 Fall 2017 Fall 2018 Fall 2019
Graduate Applied, Accepted, and Enrolled Students at UAATable 1.08
40
Source: UA Data Strategy and Institutional Research (DSIR) Decision Support Database (DSD) data system at semester closing.
Notes: 1. Included are applicants to Master’s and PhD degree programs only. 2. An applicant may be counted more than once in the report due to application submissions to multiple programs in a given fall semester.3. Selectivity = Accepted/Applicants; it shows the percentage of total applications that were accepted into programs. 4. Yield = Enrolled/Accepted; it refers to the percentage of total accepted that enrolled in the same fall semester.
College of Arts & Sciences Applied 141 127 100 114 102 Accepted 53 37 32 45 36 Enrolled 38 31 28 40 26 Selectivity 37.6% 29.1% 32.0% 39.5% 35.3% Yield 71.7% 83.8% 87.5% 88.9% 72.2%
School of Education Applied 52 41 43 33 15 Accepted 31 22 25 16 8 Enrolled 29 18 21 14 8 Selectivity 59.6% 53.7% 58.1% 48.5% 53.3% Yield 93.5% 81.8% 84.0% 87.5% 100.0%
College of Business & Public Policy Applied 95 70 91 88 70 Accepted 54 38 51 53 42 Enrolled 40 28 33 44 29 Selectivity 56.8% 54.3% 56.0% 60.2% 60.0% Yield 74.1% 73.7% 64.7% 83.0% 69.0%
College of Engineering Applied 61 61 48 33 34 Accepted 33 46 33 23 26 Enrolled 17 32 22 20 17 Selectivity 54.1% 75.4% 68.8% 69.7% 76.5% Yield 51.5% 69.6% 66.7% 87.0% 65.4%
College of Health Applied 77 76 51 69 60 Accepted 27 24 8 37 20 Enrolled 19 16 8 27 13 Selectivity 35.1% 31.6% 15.7% 53.6% 33.3%
Yield 70.4% 66.7% 100.0% 73.0% 65.0%
UAA Total Applied 426 375 333 337 281
Accepted 198 167 149 174 132 Enrolled 143 125 112 145 93 Selectivity 46.5% 44.5% 44.7% 51.6% 47.0% Yield 72.2% 74.9% 75.2% 83.3% 70.5%

Enro
llmen
t


2020 Fact Book - Enrollment
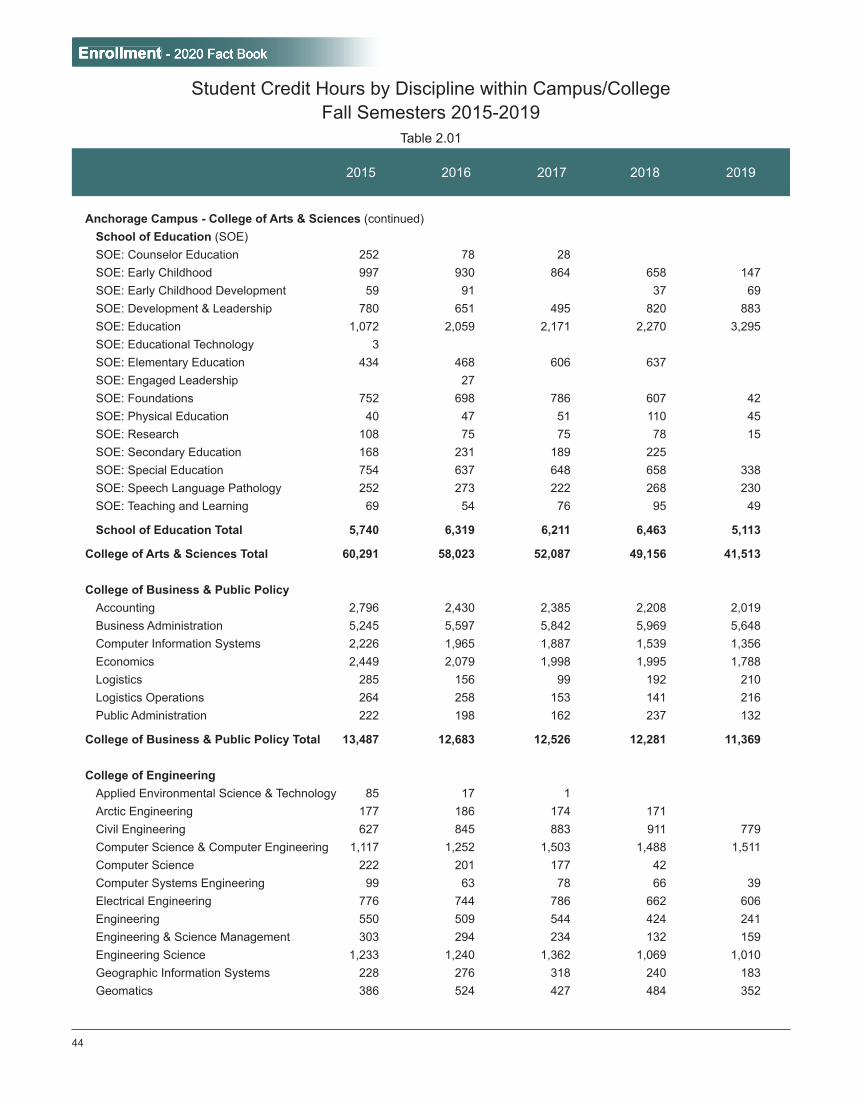
Student Credit Hours by Discipline within Campus/CollegeFall Semesters 2015-2019
Table 2.01
2015 2016 2017 2018 2019
43
Anchorage Campus College of Arts & Sciences
Alaska Native Studies 373 552 591 628 845 American Sign Language 620 516 576 604 516 Anthropology 2,143 2,138 1,854 1,299 1,429 Art 2,490 2,236 2,431 2,301 1,859 Astronomy 471 474 451 467 320 Biology 7,569 7,288 7,375 6,710 5,656 Chemistry 3,547 3,531 3,336 3,034 2,411 Chinese 200 180 152 100 87 Creative Writing & Literary Arts 195 188 160 140 137 Dance 555 483 473 301 265 English 6,834 6,751 1,609 1,522 1,199 Environmental Studies 296 365 405 397 330 French 534 468 398 386 298 Geography 429 381 342 324 321 Geology 1,765 1,710 1,811 1,703 1,388 German 441 442 360 382 307 History 2,781 3,000 3,058 2,508 2,261 Interdisciplinary Studies 132 132 96 192 108 International Studies 63 60 36 48 12 Japanese 698 516 588 494 457 Journalism & Public Communications 784 694 676 757 672 Linguistics 207 189 174 135 198 Mathematics 3,270 2,754 2,750 2,600 2,281 Microbiology 33 27 33 Music 2,619 2,255 2,274 2,140 1,491 National Student Exchange 217 172 138 40 116 Philosophy 2,160 2,145 1,914 1,869 1,569 Physics 2,337 1,774 1,747 1,551 1,244 Political Science 873 873 891 1,032 693 Psychology 5,899 5,518 5,121 5,138 4,954 Russian 180 196 212 112 100 Sociology 1,288 1,179 1,350 1,263 1,122 Spanish 1,216 1,199 1,102 943 730 Statistics 528 442 467 503 377 Theater 636 783 784 878 485 Women’s Studies 201 120 141 165 129
Enrollment - 2020 Fact Book
Student Credit Hours by Discipline within Campus/CollegeFall Semesters 2015-2019
Table 2.01
2015 2016 2017 2018 2019
44
Anchorage Campus - College of Arts & Sciences (continued) School of Education (SOE)
SOE: Counselor Education 252 78 28 SOE: Early Childhood 997 930 864 658 147 SOE: Early Childhood Development 59 91 37 69 SOE: Development & Leadership 780 651 495 820 883 SOE: Education 1,072 2,059 2,171 2,270 3,295 SOE: Educational Technology 3 SOE: Elementary Education 434 468 606 637 SOE: Engaged Leadership 27 SOE: Foundations 752 698 786 607 42 SOE: Physical Education 40 47 51 110 45 SOE: Research 108 75 75 78 15 SOE: Secondary Education 168 231 189 225 SOE: Special Education 754 637 648 658 338 SOE: Speech Language Pathology 252 273 222 268 230 SOE: Teaching and Learning 69 54 76 95 49
School of Education Total 5,740 6,319 6,211 6,463 5,113
College of Arts & Sciences Total 60,291 58,023 52,087 49,156 41,513
College of Business & Public Policy Accounting 2,796 2,430 2,385 2,208 2,019
Business Administration 5,245 5,597 5,842 5,969 5,648 Computer Information Systems 2,226 1,965 1,887 1,539 1,356 Economics 2,449 2,079 1,998 1,995 1,788 Logistics 285 156 99 192 210 Logistics Operations 264 258 153 141 216 Public Administration 222 198 162 237 132
College of Business & Public Policy Total 13,487 12,683 12,526 12,281 11,369
College of Engineering Applied Environmental Science & Technology 85 17 1
Arctic Engineering 177 186 174 171 Civil Engineering 627 845 883 911 779 Computer Science & Computer Engineering 1,117 1,252 1,503 1,488 1,511 Computer Science 222 201 177 42 Computer Systems Engineering 99 63 78 66 39 Electrical Engineering 776 744 786 662 606 Engineering 550 509 544 424 241 Engineering & Science Management 303 294 234 132 159 Engineering Science 1,233 1,240 1,362 1,069 1,010 Geographic Information Systems 228 276 318 240 183 Geomatics 386 524 427 484 352

2020 Fact Book - Enrollment
Student Credit Hours by Discipline within Campus/CollegeFall Semesters 2015-2019
Table 2.01
2015 2016 2017 2018 2019
45
Mechanical Engineering 917 982 1,164 1,264 921 Project Management 411 336 240 171 213
College of Engineering Total 7,131 7,469 7,891 7,124 6,014
College of Health Biomedical Program - WWAMI 36 39 5 5 4 COH Interprofessional 21 21 9 39 Civic Engagement & Learning 153 153 180 147 93 Dental Assisting 308 313 312 185 220 Dental Hygiene 375 422 392 212 193 Diagnostic Medical Sonography 106 99 126 129 162 Dietetics & Nutrition 1,119 1,022 1,000 1,090 1,031 Disability & Long-Term Support 43 6 9 57 30 Emergency Medical Technology 366 294 315 242 141 Fire Science 366 329 295 249 165 Health 36 183 Health Care Assisting 152 184 176 60 Health Science 721 1,011 1,278 1,603 1,490 Human Services 1,261 945 810 738 633 Justice 1,568 1,323 1,281 1,305 765 Legal Nurse Consultant 2 5 Legal Studies 561 525 687 570 732 Medical Assisting 887 952 787 702 509 Medical Laboratory Technology 658 780 705 685 702 Medicine Doctorate 357 718 700 700 738 Nursing 2,201 2,145 2,014 2,131 2,271 Nursing Doctorate 96 178 169 38 Nursing Science 2,708 2,772 3,024 3,203 3,367 Nursing Science Graduate 262 296 Pharmacy Technology 201 171 168 159 246 Physical Education & Recreation 604 495 442 463 388 Physical Education Professional 884 969 1,054 938 672 Physical Education 9 16 Physical Therapist Assistant 127 135 144 144 134 Radiologic Technology 454 555 552 535 484 Social Work 1,609 1,424 1,232 1,375 1,289 Surgical Technology 144 144 144
College of Health Total 17,988 17,985 18,026 18,050 17,142 Community & Technical College Aerospace Science ROTC 74 107 137 136 123 Air Traffi c Control 275 291 320 211 248 Architect Engineering Technology 425 573 500 388 341

Enrollment - 2020 Fact Book
Student Credit Hours by Discipline within Campus/CollegeFall Semesters 2015-2019
Table 2.01
2015 2016 2017 2018 2019
46
Anchorage Campus - Community & Technical College (continued) Auto/Diesel Technology 706 705 834 891 794
Aviation Maintenance Technology 1,204 1,004 980 1,037 1,136 Aviation Tech/Admin/Mgmt 1,056 1,023 1,143 1,047 795 Aviation Tech/Professional Piloting 444 453 607 396 467 Career & Technical Education 32 36 16 9 Communication 2,337 2,469 2,403 1,914 2,418 Computer & Networking Technology 1,000 852 728 617 508 Computer Information & Offi ce Systems 126 68 Construction Management 691 450 417 366 393 Counseling 53 148 20 81 126 Culinary Arts 545 643 544 426 515 English as a Second Language 393 324 Guidance 834 699 576 Hospitality Administration 54 150 Library Science 21 23 11 1 15 Mathematics 6,492 6,506 5,746 5,326 4,728 Military Science 87 95 76 77 88 Occupational Safety & Health 634 493 430 411 318 Preparatory English 2,003 1,924 241 48 56 Statistics 489 399 426 477 585 Technology 179 177 144 201 171 University Studies 510 1,016 Welding Technology 650 708 577 350 358 Writing 6,180 6,179 5,847
Community & Technical College Total 20,750 20,170 23,056 21,153 21,196
Honors College Complex Systems 9 18 15
Honors 274 334 213 168 227 Undergrad Research & Scholarship 36
Honors College Total 283 388 228 168 227
Chugiak-Eagle River Accounting 69 51 81
American Sign Language 64 132 116 104 60 Anthropology 234 177 135 108 Art 147 255 132 120 45 Biology 180 201 159 114 57 Business Administration 261 267 240 171 Chemistry 177 105 75 45 Communication 444 375 393 381 111 Computer Information & Offi ce Systems 7

2020 Fact Book - Enrollment
Student Credit Hours by Discipline within Campus/CollegeFall Semesters 2015-2019
Table 2.01
2015 2016 2017 2018 2019
47
Computer Information Systems 96 66 36 51 Dietetics & Nutrition 66 Economics 186 189 231 195 120 English 771 993 72 57 Environmental Studies 69 Geography 117 117 90 66 Geology 265 186 106 96 Guidance 231 303 438 219 History 249 327 333 336 69 Human Services 27 Justice 42 9 6 6 Mathematics 969 1,109 1,030 625 123 Medical Assisting 45 57 48 39 42 Music 63 36 51 84 Philosophy 339 324 129 168 69 Political Science 93 120 135 111 Psychology 243 264 219 216 75 Spanish 100 96 88 Statistics 207 168 183 243 99 Writing 951 585 222
Chugiak-Eagle River Total 5,692 5,927 5,308 4,378 1,092
Military Programs Anthropology 96 93
Art 123 84 Biology 36 128 52 Chemistry 33 24 45 27 Communication 144 90 60 24 English 450 309 History 297 171 54 54 Mathematics 261 168 169 93 40 Music 27 18 24 Philosophy 135 192 Political Science 45 Preparatory English 33 Psychology 132 99 69 45 30 Spanish 52 32 Technology 51 Writing 33 30
Military Programs Total 1,915 1,408 421 276 152
Anchorage Campus Total 127,536 124,052 119,543 112,586 98,705

Enrollment - 2020 Fact Book
Student Credit Hours by Discipline within Campus/CollegeFall Semesters 2015-2019
Table 2.01
2015 2016 2017 2018 2019
48
Kenai Peninsula College Anchorage Extension Site
Electronics Technology 60 45 Petroleum Technology 39 Physics 15 Process Technology 624 410 227 Technology 3 3
Anchorage Extension Site Total 687 509 230
Kachemak Bay Campus American Sign Language 16 Anthropology 105 Art 241 89 72 137 99 Astronomy 24 Biology 221 268 313 463 509 Business Administration 84 123 90 102 99 Chemistry 116 130 114 105 207 Communication 99 93 102 57 51 Community Education 12 Computer Science 39 Creative Writing & Literary Arts 27 Dietetics & Nutrition 141 165 222 273 195 Economics 21 Education 8 7 Education: Early Childhood 48 Emergency Medical Technology 45 English 263 380 215 177 204 Fire Science 24 12 French 12 Geology 4 10 39 49 8 Health Care Assisting 42 60 60 60 60 Health Science 75 90 93 30 24 History 126 213 360 387 303 Human Services 159 186 162 138 117 Humanities 93 87 93 39 Justice 111 150 99 69 87 Mathematics 241 332 388 403 332 Medical Assisting 15 18

2020 Fact Book - Enrollment
Student Credit Hours by Discipline within Campus/CollegeFall Semesters 2015-2019
Table 2.01
2015 2016 2017 2018 2019
49
Physical Education & Recreation 3 10 Physics 15 6 6 18 Political Science 36 69 36 30 42 Preparatory English 30 Process Technology 6 3 Psychology 255 208 378 261 291 Social Work 27 Statistics 28 28 76 Theater 54 30 Welding Technology 40 36 44 28 Writing 252 201 126
Kachemak Bay Campus Total 2,659 2,811 3,187 3,160 2,887 Kenai River Campus Accounting 177 204 252 306 210 Alaska Native Studies 97 116 124 85 192 American Sign Language 32 Anthropology 216 158 194 273 159 Art 288 270 264 228 246 Astronomy 50 40 Biology 385 406 571 421 452 Business Administration 210 321 258 231 249 Chemistry 626 639 544 595 312 Communication 486 465 378 426 261 Community Education 4 9 Computer Information & Offi ce Systems 8 2 2 Computer Information Systems 240 225 141 126 87 Computer Science 117 51 9 Dietetics & Nutrition 78 63 Economics 42 48 Education 174 46 370 123 42 Education: Early Childhood 134 122 125 90 60 Education: Elementary Education 15 10 29 Education: Foundations 78 87 111 Electronics Technology 206 280 171 61 68 Emergency Medical Technology 78 168 82 120 83 English 909 1,056 195 81 15 Environmental Studies 85 58 35 25 30 Fire Science 153 75 French 40 28 36 Geology 90 87 93 98 Guidance 27 51 36

Enrollment - 2020 Fact Book
Student Credit Hours by Discipline within Campus/CollegeFall Semesters 2015-2019
Table 2.01
2015 2016 2017 2018 2019
50
Kenai Peninsula College - Kenai River Campus (continued) Health Care Assisting 60 60 48 60 History 162 156 201 117 63 Human Services 15 18 63 54 86 Japanese 28 72 40 44 28 Justice 66 60 63 51 66 Library Science 14 10 5 9 2 Linguistics 9 Logistics Operations 39 48 24 33 27 Mathematics 2,051 2,583 2,173 2,146 1,557 Medical Assisting 30 30 Music 93 105 81 102 51 Occupational Safety & Health 36 Paramedical Technology 168 108 144 144 228 Petroleum Technology 166 126 108 69 36 Philosophy 51 129 93 Physical Education & Recreation 10 21 Physics 357 194 183 157 180 Political Science 9 3 30 30 30 Preparatory English 210 240 Process Technology 959 768 698 868 739 Psychology 397 317 295 279 368 Social Work 6 Sociology 72 114 114 72 72 Spanish 52 44 56 32 36 Statistics 341 263 297 318 171 University Studies 21 Welding Technology 128 180 148 176 148 Writing 939 1,074 1,059
Kenai River Campus Total 10,292 10,395 9,721 9,467 7,814
Resurrection Bay Extension Site Biology 36 English 21 15 Mathematics 27 27 30 Philosophy 21 Physical Education & Recreation 9 Political Science 36 54 18 27 Writing 21 18 33
Resurrection Bay Extension Site Total 93 63 105 36 96
Kenai Peninsula College Total 13,731 13,778 13,243 12,663 10,797

2020 Fact Book - Enrollment
Student Credit Hours by Discipline within Campus/CollegeFall Semesters 2015-2019
Table 2.01
2015 2016 2017 2018 2019
51
Kodiak College Accounting 189 255 180 216 204 Alaska Native Studies 56 188 108 109 99 Anthropology 114 132 183 123 90 Architectural & Engineering Technology 54 54 18 18 Art 59 36 102 105 93 Auto/Diesel Technology 54 Aviation Tech/Professional Piloting 42 27 Biology 397 353 450 467 376 Business Administration 261 228 258 282 306 Chemistry 67 95 70 65 Civic Engagement & Learning 45 12 Communication 69 69 60 48 24 Computer Information & Offi ce Systems 105 35 33 19 32 Computer Information Systems 96 78 69 60 39 Construction Management 32 Dietetics & Nutrition 105 Economics 54 51 57 66 63 Education 13 29 Education: Early Childhood 102 75 51 102 57 Education: Elementary Education 38 41 36 51 Education: Foundations 51 27 24 Education: Special Education 96 51 48 45 Electronics Technology 44 28 English 423 360 117 30 21 Environmental Studies 41 Guidance 39 27 History 54 18 48 36 9 Humanities 45 45 39 24 24 Justice 42 21 Liberal Studies: Integrated Core 27 Liberal Studies: Integrated Science 45 Mathematics 246 261 159 93 60 Medical Assisting 92 94 102 114 99 Music 39 12 Occupational Safety & Health 59 3 Philosophy 21 36 30 18 3 Physical Education & Recreation 14 15 8 12 19

Enrollment - 2020 Fact Book
Student Credit Hours by Discipline within Campus/CollegeFall Semesters 2015-2019
Table 2.01
2015 2016 2017 2018 2019
52
Kodiak College (continued) Preparatory English 114 114 Psychology 100 96 154 111 115 Russian 56 Sociology 153 162 147 108 99 Spanish 12 32 56 108 Statistics 30 18 15 30 36 Technology 4 4 University Studies 24 Welding Technology 66 342 279 177 239 Writing 300 330 358
Kodiak College Total 3,328 3,460 3,400 3,044 2,814
Matanuska-Susitna College Accounting 294 276 285 252 258 American Sign Language 184 184 64 184 136 Anthropology 585 546 417 411 414 Art 561 564 474 417 417 Auto/Diesel Technology 3 Biology 983 980 1,018 910 740 Business Administration 657 675 600 423 540 Chemistry 424 435 446 436 390 Communication 342 339 345 261 342 Computer & Networking Technology 349 352 307 345 288 Computer Information & Offi ce Systems 245 173 207 114 18 Computer Information Systems 105 135 153 120 129 Computer Science 12 Culinary Arts 2 Dance 14 Dental Assisting 9 Dietetics & Nutrition 42 57 33 18 Economics 270 177 261 150 159 Education: Early Childhood 54 48 Education: Elementary Education 122 48 Education: Foundations 51 42 Emergency Medical Technology 180 286 184 198 128 Engineering 53 59 Engineering Science 45 30

2020 Fact Book - Enrollment
Student Credit Hours by Discipline within Campus/CollegeFall Semesters 2015-2019
Table 2.01
2015 2016 2017 2018 2019
53
English 1,050 855 72 Environmental Studies 67 48 39 Fire Science 12 9 French 48 24 40 32 36 Geography 78 150 123 123 Geology 71 Health 51 Health Care Assisting 102 120 Health Science 72 45 63 63 History 870 717 807 678 492 Human Services 279 201 165 126 99 Humanities 54 International Studies 15 12 6 3 Japanese 100 64 72 76 84 Justice 81 69 84 99 27 Liberal Studies: Social Science 12 Logistics Operations 24 54 39 Mathematics 1,605 1,636 1,891 1,560 1,324 Medical Assisting 99 147 135 192 231 Music 144 138 162 186 129 Paramedical Technology 180 108 204 180 204 Pharmacy Technology 54 63 Philosophy 255 219 336 282 144 Physical Education & Recreation 18 19 14 Physics 176 205 92 159 210 Political Science 45 21 234 216 213 Preparatory English 396 381 57 Psychology 498 450 510 360 282 Refrigeration & Heating 319 320 291 224 205 Renewable Energy 53 32 Russian 52 28 28 32 Social Work 15 Sociology 198 186 147 120 126 Spanish 124 112 204 180 96 Statistics 93 141 177 156 132 Theater 102 69 63 60 21 University Studies 66 Veterinary Assisting 50 137 151 250 163 Women’s Studies 39 12 Writing 1,389 1,251 924
Matanuska-Susitna College Total 12,494 11,902 12,436 11,156 9,700

Enrollment - 2020 Fact Book
Student Credit Hours by Discipline within Campus/CollegeFall Semesters 2015-2019
Table 2.01
2015 2016 2017 2018 2019
54
Prince William Sound College Anthropology 42 87 69
Art 15 7 4 Astronomy 77 86 80 96 Biology 48 78 64 25 36 Business Administration 15 27 39 Chemistry 5 Communication 57 69 54 63 78 Computer Information & Offi ce Systems 52 6 6 3 Computer Information Systems 30 18 9 6 Computer Science 24 24 Dietetics & Nutrition 39 Education 21 14 23 1 Education: Development & Leadership 24 Emergency Medical Technology 84 48 15 9 English 162 171 18 52 Environmental Studies 28 19 Film 15 18 18 18 Geology 109 113 90 85 111 Guidance 27 24 21 History 57 90 132 72 Human Services 64 12 Humanities 42 30 48 39 30 Industrial Technology 249 613 660 723 755 Justice 21 30 45 Marine Technology 493 Mathematics 152 161 159 326 371 Medical Assisting 63 102 117 111 102 Music 36 21 30 36 Occupational Safety & Health 15 147 96 168 Outdoor Studies 102 Physical Education & Recreation 19 87 84 74 77 Physical Education Professional 21 41 64 83 Physics 18 27 Political Science 75 39 42 24 Psychology 33 126 66 30 Sociology 36
Spanish 44 Statistics 30 Technology 33 Theater 30 12 24 27 University Studies 21 18 Writing 153 228 99
Total 2,190 2,015 2,105 2,421 2,350

2020 Fact Book - Enrollment
Student Credit Hours by Discipline within Campus/CollegeFall Semesters 2015-2019
Table 2.01
2015 2016 2017 2018 2019
55
Source: UA Data Strategy and Institutional Research (DSIR) Decision Support Database (DSD) data system at semester closing freeze.
Notes: 1. Student credit hours are based on course level, representing credit courses at the 050 level and above, and do not include auditors. 2. Totals may not equal the sum of all categories due to rounding. 3. A restructuring of English and Math GER courses, starting fall 2017, have shifted their credit hours from College of Arts & Sciences to Community & Technical College. Additionally, English GER courses have been renamed to Writing.
Copper Basin Extension Center Art 54 42 72 45 18
Biology 56 Computer Information & Offi ce Systems 15 Education 28 18 Emergency Medical Technology 21 English 15 Health Care Assisting 36 History 21 Mathematics 33 44 Music 54 39 27 48 42 Political Science 33 33 Sociology 69 51 60 15 48 Spanish 84 64 56 36 84
Copper Basin Extension Center Total 309 358 263 239 192
Cordova Extension Center Biology 8
Computer Information & Offi ce Systems 12 Education 36 English 45 33 History 33 6 57 36 Mathematics 28 20 32 32 40 Physical Education Professional 7 Political Science 15 45 Writing 30
Cordova Extension Center Total 162 74 119 77 83
Prince William Sound College Total 2,660 2,447 2,487 2,737 2,625
UAA Total 159,749 155,639 151,109 142,186 124,641

Enrollment - 2020 Fact Book
56
Student Credit Hour Trend by Semester and Campus, Academic Years 2001-2020Table 2.02
Anchorage Campus Kenai Peninsula College Kodiak College
Year Summer Fall Spring Annual % +/- over Summer Fall Spring Annual % +/- over Summer Fall Spring Annual % +/- over Prev Year Prev Year Prev Year
2000 - 01 22,478 103,783 98,054 224,315 607 8,602 9,084 18,293 65 2,909 2,862 5,836
2001 - 02 23,762 106,149 102,242 232,153 4% 760 9,712 9,362 19,834 8% 153 2,998 3,095 6,246 7%
2002 - 03 23,133 112,999 109,799 245,930 6% 359 9,274 9,065 18,698 -6% 115 3,080 3,622 6,817 9%
2003 - 04 27,493 119,871 116,406 263,769 7% 727 9,509 8,396 18,632 0% 137 2,935 3,120 6,192 -9%
2004 - 05 29,718 124,891 117,540 272,148 3% 489 8,958 8,904 18,351 -2% 101 2,406 2,529 5,036 -19%
2005 - 06 29,397 127,294 120,947 277,638 2% 567 9,277 8,972 18,816 3% 157 2,215 2,639 5,011 -1%
2006 - 07 29,102 129,625 120,528 279,254 1% 782 9,883 9,230 19,895 6% 37 2,220 2,442 4,699 -6%
2007 - 08 28,575 129,803 121,429 279,807 0% 885 9,567 9,708 20,160 1% 141 2,345 2,957 5,443 16%
2008 - 09 30,409 131,305 123,090 284,803 2% 1,228 10,137 10,707 22,072 10% 188 2,387 2,696 5,271 -3%
2009 - 10 31,438 135,284 128,769 295,490 4% 1,326 12,270 12,901 26,497 20% 466 2,027 3,000 5,493 4%
2010 - 11 33,916 138,504 130,713 303,132 3% 2,116 13,141 13,815 29,072 10% 400 2,555 3,652 6,607 20%
2011 - 12 33,418 139,882 132,334 305,633 1% 3,040 15,403 15,301 33,744 16% 648 3,276 4,134 8,058 22%
2012 - 13 32,196 137,666 130,075 299,937 -2% 3,237 14,859 14,755 32,851 -3% 733 3,653 3,876 8,262 3%
2013 - 14 31,078 135,749 124,372 291,199 -3% 2,792 14,695 14,840 32,327 -2% 784 3,533 4,293 8,610 4%
2014 - 15 29,491 130,469 122,128 282,088 -3% 3,030 15,734 14,823 33,587 4% 699 3,415 4,201 8,315 -3%
2015 - 16 28,408 127,536 118,447 274,390 -3% 3,417 13,731 12,487 29,635 -12% 794 3,328 3,471 7,593 -9%
2016 - 17 27,244 124,052 112,844 264,140 -4% 3,164 13,778 12,937 29,879 1% 799 3,460 3,412 7,671 1%
2017 - 18 26,710 119,543 107,312 253,565 -4% 3,220 13,243 11,937 28,400 -5% 844 3,400 3,146 7,390 -4%
2018 - 19 26,249 112,586 100,971 239,805 -5% 3,386 12,663 11,157 27,206 -4% 806 3,044 2,770 6,620 -10%
2019 - 20 25,080 98,705 88,747 212,532 -11% 2,804 10,797 9,172 22,773 -16% 629 2,814 2.398 5,841 -12%

2020 Fact Book - Enrollment
57
Student Credit Hour Trend by Semester and Campus, Academic Years 2001-2020Table 2.02
Matanuska-Susitna College Prince William Sound College Total UAA
Year Summer Fall Spring Annual % +/- over Summer Fall Spring Annual % +/- over Summer Fall Spring Annual % +/- over Prev Year Prev Year Prev Year
2000 - 01 1,024 9,102 8,735 18,861 935 3,887 4,355 9,177 25,559 130,199 124,875 280,633
2001 - 02 920 9,614 10,033 20,567 9% 897 3,785 4,472 9,153 0% 27,183 133,997 130,946 292,125 4%
2002 - 03 1,541 10,445 11,036 23,022 12% 988 4,709 4,766 10,463 14% 26,651 142,393 140,069 309,113 6%
2003 - 04 1,395 11,335 10,696 23,426 2% 1,132 4,417 5,736 11,284 8% 31,545 149,632 145,849 327,026 6%
2004 - 05 690 10,099 9,379 20,168 -14% 657 4,384 5,112 10,153 -10% 32,020 152,121 144,454 328,596 1%
2005 - 06 569 10,579 9,493 20,641 2% 913 3,911 4,719 9,542 -6% 32,056 153,276 146,770 332,101 1%
2006 - 07 592 10,323 9,246 20,161 -2% 937 4,454 4,986 10,378 9% 31,450 156,505 146,432 334,386 1%
2007 - 08 567 10,461 9,870 20,898 4% 1,258 3,805 4,324 9,388 -10% 31,426 155,981 148,288 335,695 0%
2008 - 09 841 10,699 9,936 21,476 3% 418 3,696 3,050 7,164 -24% 33,083 158,224 149,478 340,786 2%
2009 - 10 977 12,271 11,985 25,233 18% 484 4,187 3,757 8,428 18% 34,691 166,038 160,412 361,141 6%
2010 - 11 1,778 13,609 12,751 28,138 12% 642 3,441 4,441 8,524 1% 38,852 171,249 165,372 375,473 4%
2011 - 12 1,847 14,711 13,421 29,979 7% 1,091 3,754 4,279 9,122 7% 40,043 177,025 169,469 386,536 3%
2012 - 13 1,912 14,228 12,361 28,501 -5% 552 3,340 4,270 8,162 -11% 38,630 173,746 165,337 377,712 -2%
2013 - 14 2,084 13,366 12,407 27,857 -2% 345 2,993 3,839 7,177 -12% 37,083 170,336 159,751 367,170 -3%
2014 - 15 2,112 12,643 11,225 25,980 -7% 434 2,703 4,293 7,430 4% 35,766 164,964 156,670 357,400 -3%
2015 - 16 2,122 12,494 11,358 25,974 0% 273 2,660 3,591 6,524 -12% 35,014 159,749 149,354 344,116 -4%
2016 - 17 2,455 11,902 10,222 24,579 -5% 238 2,447 3,428 6,113 -6% 33,900 155,639 142,843 332,382 -3%
2017 - 18 2,010 12,436 10,673 25,119 2% 328 2,487 3,569 6,384 4% 33,112 151,109 136,637 320,857 -3%
2018 - 19 1,741 11,156 10,652 23,549 -6% 261 2,737 3,681 6,679 5% 32,443 142,186 129,231 303,859 -5%
2019 - 20 1,329 9,700 8,623 19,652 -17% 455 2,625 2,170 5,250 -21% 30,297 124,641 111,109 266,047 -12%
Source: UA Data Strategy and Institutional Research (DSIR) Decision Support Database (DSD) data system at semester closing freeze.
Notes: 1. Student Credit Hours are based on credit courses at the 050 course level and above, and do not include auditors. 2. Prior to AY 2005, Total UAA includes SCH generated by Northern Military Programs.

Enrollment - 2020 Fact Book
Matriculation Campus
Headcount Enrollment (Seat Count) Student Credit Hours
Anc
hora
ge
Ken
ai
Kod
iak
Mat
-Su
PW
SC
Non
UAA
TO
TAL
58
e-Learning: Origin of Courses vs. Origin of Students Admitted, Academic Years 2016-2020Table 2.03
Anc
hora
ge
Ken
ai
Kod
iak
Mat
-Su
PW
SC
Non
UAA
TO
TAL
Campus that
Provides DistanceCourses
Anc
hora
ge
Ken
ai
Kod
iak
Mat
-Su
PW
SC
Non
UAA
TO
TAL
Anchorage Campus 2015 - 2016 8,661 109 34 172 12 336 9,287 17,900 129 46 258 20 424 18,777 52,286 386 136 763 58 1,151 54,7802016 - 2017 8,737 117 37 167 14 380 9,418 19,420 168 42 254 19 465 20,368 57,027 502 116 751 57 1,216 59,6692017 - 2018 9,483 154 39 158 23 594 10,418 21,513 226 53 270 33 704 22,799 62,665 498 141 805 80 1,609 65,7982018 - 2019 10,144 134 44 169 24 618 11,105 23,488 194 75 282 31 798 24,868 68,501 526 216 836 88 1,839 72,0062019 - 2020 9,919 190 40 155 27 771 11,065 23,303 306 60 254 36 1,071 25,030 66,703 623 172 745 83 2,298 70,624
Kenai Peninsula College 2015 - 2016 2,300 757 46 131 12 191 3,385 3,755 1,712 77 200 17 226 5,987 11,310 4,941 227 605 51 745 17,8792016 - 2017 2,437 656 51 178 15 398 3,690 3,996 1,561 78 279 18 513 6,445 11,889 4,503 231 821 56 1,765 19,2652017 - 2018 2,644 616 39 149 17 247 3,679 4,436 1,516 79 246 33 326 6,636 13,118 4,362 239 726 91 1,065 19,6012018 - 2019 2,582 658 36 143 15 268 3,673 4,455 1,564 61 221 22 356 6,679 13,013 4,517 170 653 66 1,067 19,4862019 - 2020 2,129 593 57 129 19 230 3,129 3,678 1,568 87 201 29 293 5,856 10,624 4,507 264 593 84 930 17,002
Kodiak College 2015 - 2016 848 32 214 46 9 57 1,202 1,269 41 424 69 10 72 1,885 3,447 118 1,113 189 24 189 5,080 2016 - 2017 808 38 216 94 8 63 1,215 1,171 50 450 127 10 81 1,889 3,189 143 1,302 327 32 219 5,2122017 - 2018 850 35 208 61 4 63 1,214 1,259 49 467 85 6 100 1,966 3,399 133 1,329 227 18 243 5,3492018 - 2019 868 46 137 68 7 58 1,170 1,241 70 289 86 7 93 1,786 3,350 186 799 249 19 224 4,8272019 - 2020 725 37 161 51 10 38 1,016 1,079 49 303 66 17 62 1,576 2,899 133 863 194 42 156 4,287
Matanuska-Susitna College 2015 - 2016 911 24 9 358 3 39 1,331 1,216 41 15 588 3 49 1,912 3,585 102 40 1,621 9 131 5,4882016 - 2017 789 18 8 360 7 34 1,211 991 21 12 614 7 42 1,687 2,892 55 29 1,606 21 109 4,7122017 - 2018 722 11 5 374 2 29 1,141 935 14 5 670 2 32 1,658 2,757 42 13 1,721 6 101 4,6402018 - 2019 656 13 4 352 1 22 1,037 809 17 6 544 2 27 1,405 2,424 49 17 1,587 6 74 4,1572019 - 2020 623 14 4 235 2 25 894 779 15 6 344 2 26 1,172 2,338 45 17 1,081 6 78 3,565

2020 Fact Book - Enrollment
59
e-Learning: Origin of Courses vs. Origin of Students Admitted, Academic Years 2016-2020Table 2.03
Matriculation Campus
Headcount Enrollment (Seat Count) Student Credit Hours
A
ncho
rage
Ken
ai
Kod
iak
Mat
-Su
PW
SC
Non
UAA
TO
TAL
Anc
hora
ge
Ken
ai
Kod
iak
Mat
-Su
PW
SC
Non
UAA
TO
TAL
Anc
hora
ge
Ken
ai
Kod
iak
Mat
-Su
PW
SC
Non
UAA
TO
TAL
Campus that
Provides DistanceCourses
Source: UA Data Strategy and Institutional Research (DSIR) Decision Support Database (DSD) data system at semester closing freeze.
Notes:1. Enrollment includes auditors. Student credit hours include audit hours. 2. An Academic Year (AY) includes summer, fall and spring semesters, starting with summer as the fi rst term counted.3. Totals may not equal the sum of all categories due to rounding.4. Distance courses are 0% to 50% location based using specifi c Banner codes 0, 1, 2 where: 0 = 0% location based; 1 = 1-20% location based; 2 = 21-50% location based. Courses included in this
report are session codes 0, 1, and 2.
Prince William Sound College 2015 - 2016 125 10 7 3 131 41 315 167 10 10 3 323 54 567 460 32 24 9 923 153 1,6012016 - 2017 296 21 3 27 136 52 534 404 24 3 37 290 68 826 1,049 70 9 99 831 183 2,2412017 - 2018 408 20 12 20 86 36 580 550 21 14 25 193 47 850 1,463 61 40 71 525 122 2,2822018 - 2019 494 38 9 45 91 39 715 617 44 11 52 244 47 1,015 1,675 128 31 149 695 140 2,8182019 - 2020 394 27 16 28 96 34 595 506 35 24 43 190 43 841 1,402 96 67 114 549 120 2,348
UAA Total 2015 - 2016 10,008 808 247 521 145 606 12,198 24,307 1,933 572 1,118 373 825 29,128 71,088 5,579 1,540 3,187 1,065 2,369 84,8282016 - 2017 10,041 712 247 536 150 830 12,402 25,982 1,824 585 1,311 344 1,169 31,215 76,046 5,273 1,687 3,604 997 3,492 91,0992017 - 2018 10,765 708 238 545 109 901 13,177 28,693 1,826 618 1,296 267 1,209 33,909 83,402 5,096 1,762 3,550 720 3,140 97,6702018 - 2019 11,329 720 160 524 114 911 13,657 30,610 1,889 442 1,185 306 1,321 35,753 88,963 5,406 1,233 3,474 874 3,344 103,2942019 - 2020 10,933 716 189 391 122 1,027 13,292 29,345 1,973 480 908 274 1,495 34,475 83,966 5,404 1,383 2,727 764 3,582 97,826


Awar
ds


2020 Fact Book - Awards
63
Academic Year Total % Change Degree Type 2016 2017 2018 2019 2020 2016-2020 2016-2020
Degree and Certifi cate Awards Conferred by Type and CampusAcademic Years 2016-2020
Table 3.01
Anchorage Campus Licensure/Post Certifi cate 88 80 89 41 43 341 -51.1% Occupational Endorsement 94 66 40 41 47 288 -50.0% Certifi cate 59 45 44 44 41 233 -30.5% Associate 577 583 521 559 643 2,883 11.4% Baccalaureate 1,177 1,175 1,209 1,148 1,112 5,821 -5.5% Master 251 220 247 219 203 1,140 -19.1% Doctorate 1 7 2 6 8 24 700.0%
Total 2,247 2,176 2,152 2,058 2,097 10,730 -6.7%
Kenai Peninsula College Certifi cate 7 5 18 11 10 51 42.9% Associate 118 109 109 76 75 487 -36.4%
Total 125 114 127 87 85 538 -32.0%
Kodiak College Occupational Endorsement 1 7 4 1 13 0.0% Associate 22 21 26 24 26 119 18.2%
Total 23 28 30 24 27 132 17.4%
Matanuska-Susitna College Occupational Endorsement 11 8 14 13 16 62 45.5% Certifi cate 1 2 2 3 8 -100.0% Associate 118 113 101 111 98 541 -16.9%
Total 130 123 117 127 114 611 -12.3%
Prince William Sound College Occupational Endorsement 5 1 2 9 1 18 -80.0% Associate 23 18 16 12 15 84 -34.8%
Total 28 19 18 21 16 102 -42.9%
UAA Total Licensure/Post Certifi cate 88 80 89 41 43 341 -51.1% Occupational Endorsement 111 82 60 63 65 381 -41.4% Certifi cate 67 52 64 58 51 292 -23.9% Associate 858 844 773 782 857 4,114 -0.1% Baccalaureate 1,177 1,175 1,209 1,148 1,112 5,821 -5.5% Master 251 220 247 219 203 1,140 -19.1% Doctorate 1 7 2 6 8 24 700.0%
Total 2,553 2,460 2,444 2,317 2,339 12,113 -8.4%

Awards - 2020 Fact Book
64
Academic Year Total % Change Degree Type 2016 2017 2018 2019 2020 2016-2020 2016-2020
Degree and Certifi cate Awards Conferred by Award TypeAcademic Years 2016-2020
Table 3.02
Associate of Applied Science 587 564 523 482 483 2,639 -17.7%
Associate of Arts 271 280 250 300 374 1,475 38.0%
Bachelor of Arts 414 386 373 317 289 1,779 -30.2%
Bachelor of Business Administration 219 206 168 219 181 993 -17.4%
Bachelor of Fine Arts 3 6 7 6 4 26 33.3%
Bachelor of Human Services 13 16 15 17 10 71 -23.1%
Bachelor of Liberal Studies 1 3 4 -100.0%
Bachelor of Music 9 8 10 9 5 41 -44.4%
Bachelor of Science 488 524 600 554 605 2,771 24.0%
Bachelor of Social Work 30 29 33 26 18 136 -40.0%
Certifi cate 67 52 64 58 51 292 -23.9%
Doctor of Nursing Practice 4 3 4 11
Doctor of Philosophy 1 3 2 3 4 13 300.0%
Graduate Certifi cate 85 55 73 32 30 275 -64.7%
Master - Other 1 1 2 -100.0%
Master of Arts 12 3 13 7 9 44 -25.0%
Master of Arts in Teaching 15 19 25 20 79 -100.0%
Master of Business Administration 36 27 26 28 33 150 -8.3%
Master of Civil Engineering 3 1 2 6 -100.0%
Master of Education 47 55 45 40 34 221 -27.7%
Master of Fine Arts 9 8 13 11 9 50 0.0%
Master of Public Administration 10 9 6 9 7 41 -30.0%
Master of Public Health 17 5 12 10 7 51 -58.8%
Master of Science 85 72 86 61 74 378 -12.9%
Master of Social Work 16 20 19 33 30 118 87.5%
Occupational Endorsement Cert. 111 82 60 63 65 381 -41.4%
Post Baccalaureate Certifi cate 3 25 16 9 13 66 333.3%
Total 2,553 2,460 2,444 2,317 2,339 12,113 -8.4%
Source: UA Data Strategy and Institutional Research (DSIR) Decision Support Database (DSD) Degrees data table compiled by UAA IR.

2020 Fact Book - Awards
65
Degree and Certifi cate Awards by Classifi cation of Instructional Program (CIP) Academic Years 2016-2020
Table 3.03
CIP Type 2016 2017 2018 2019 2020
Area, Ethnic, Cultural, Gender, and Group Studies 6 4 3 1
Biological and Biomedical Sciences 51 45 48 36 36
Business, Management, Marketing, and Related Support Services 426 382 322 351 338
Communication, Journalism, and Related Programs 19 19 26 27 13
Computer and Information Sciences and Support Services 51 48 47 45 41
Education 207 199 203 129 78
Engineering Technologies And Engineering-Related Fields 139 116 132 97 90
Engineering 101 122 138 132 113
English Language and Literature/Letters 53 42 53 43 52
Family and Consumer Sciences/Human Sciences 18 14 9 29 23
Foreign Languages, Literatures, and Linguistics 21 15 19 10 20
Health Professions and Related Programs 523 495 544 509 562
History 32 37 23 25 30
Homeland Security, Law Enforcement, Firefi ghting & Related Services 56 61 49 41 35
Legal Professions and Studies 9 20 24 13 21
Liberal Arts and Sciences, General Studies and Humanities 272 280 253 300 374
Mathematics and Statistics 16 7 14 10 10
Mechanic and Repair Technologies/Technicians 52 64 50 71 66
Multi/Interdisciplinary Studies 53 61 59 56 44
Natural Resources and Conservation 14 9 16 6 10
Parks, Recreation, Leisure, and Fitness Studies 12 13 21 20 22
Personal and Culinary Services 24 15 17 16 12
Philosophy and Religious Studies 6 7 9 4 1
Physical Sciences 22 21 20 10 19
Precision Production 35 39 25 25 26
Psychology 96 79 78 60 74
Public Administration and Social Service Professions 67 66 66 70 59
Science Technologies/Technicians 25 23 16 26 26
Social Sciences 66 77 72 58 55
Transportation and Materials Moving 43 43 53 52 42
Visual and Performing Arts 38 37 35 45 47
Total 2,553 2,460 2,444 2,317 2,339
Source: UA Data Strategy and Institutional Research (DSIR) Decision Support Database (DSD) Degrees data table compiled by UAA IR.
Note: The Classifi cation of Instructional Programs (CIP) Code is a taxonomy defi ned by the National Center for Education Statistics (NCES) of the U.S. Department of Education.

Awards - 2020 Fact Book
66
Degree and Certifi cate Awards Conferred UAA Academic Years 1988-2020
Table 3.04
1988 - 1995 805 4,260 4,670 1,144 10,879 805 4,260 4,670 1,144 10,879 1995 - 96 110 679 833 180 1,802 915 4,939 5,503 1,324 12,681 1996 - 97 89 629 749 235 1,702 1,004 5,568 6,252 1,559 14,383 1997 - 98 86 603 770 222 1,681 1,090 6,171 7,022 1,781 16,064 1998 - 99 91 563 708 263 1,625 1,181 6,734 7,730 2,044 17,689 1999 - 00 71 478 724 203 1,476 1,252 7,212 8,454 2,247 19,165 2000 - 01 61 515 705 178 1,459 1,313 7,727 9,159 2,425 20,624 2001 - 02 74 547 766 159 1,546 1,387 8,274 9,925 2,584 22,170 2002 - 03 88 530 770 204 1,592 1,475 8,804 10,695 2,788 23,762 2003 - 04 91 601 785 241 1,718 1,566 9,405 11,480 3,029 25,480 2004 - 05 16 107 523 778 263 1,687 16 1,673 9,928 12,258 3,292 27,167 2005 - 06 22 108 634 841 238 1,843 38 1,781 10,562 13,099 3,530 29,010 2006 - 07 44 99 676 847 356 2,022 82 1,880 11,238 13,946 3,886 31,032 2007 - 08 50 47 85 679 871 289 2,021 132 47 1,965 11,917 14,817 4,175 33,053 2008 - 09 38 49 74 684 956 270 2,071 170 96 2,039 12,601 15,773 4,445 35,124 2009 - 10 60 116 60 719 920 296 2,171 230 212 2,099 13,320 16,693 4,741 37,295 2010 - 11 63 123 78 756 1,001 305 2,326 293 335 2,177 14,076 17,694 5,046 39,621 2011 - 12 66 153 67 774 971 276 2,307 359 488 2,244 14,850 18,665 5,322 41,928 2012 - 13 64 136 57 854 1,064 312 2 2,489 423 624 2,301 15,704 19,729 5,634 2 44,417 2013 - 14 98 162 66 905 1,131 268 3 2,633 521 786 2,367 16,609 20,860 5,902 5 47,050 2014 - 15 93 132 75 873 1,094 293 1 2,561 614 918 2,442 17,482 21,954 6,195 6 49,611 2015 - 16 88 111 67 858 1,177 251 1 2,553 702 1,029 2,509 18,340 23,131 6,446 7 52,164 2016 - 17 80 82 52 844 1,175 220 7 2,460 782 1,111 2,561 19,184 24,306 6,666 14 54,624 2017 - 18 89 60 64 773 1,209 247 2 2,444 871 1,171 2,625 19,957 25,515 6,913 16 57,068 2018 - 19 41 63 58 782 1,148 219 6 2,317 912 1,234 2,683 20,739 26,663 7,132 22 59,385 2019 - 20 43 65 51 857 1,112 203 8 2,339 955 1,299 2,734 21,596 27,775 7,335 30 61,724
Source: UA Data Strategy and Institutional Research (DSIR) Decision Support Database (DSD) Degrees data table is collected in UAA Semester Report by UAA IR.
Conferred Cumulative Year Post Cert Occupat’l Cert Assoc Bachelor Master’s Doctorate Total Post Cert Occupat’l Cert Assoc Bachelor Master’s Doctorate Total

Facu
lty a
nd S
taff

Faculty & Staff - 2020 Fact Book
68
2015 2016 2017 2018 2019 2015-2019
Non Non Non Non Non % Change Faculty Fac Total Faculty Fac Total Faculty Fac Total Faculty Fac Total Faculty Fac Total in Total
Anchorage Campus
College of Arts & Sciences 377 244 621 360 252 612 332 219 551 312 217 529 242 211 453 -27%
College of Business & Public Policy 83 77 160 78 70 148 84 75 159 77 72 149 73 60 133 -17%
College of Engineering 51 75 126 51 92 143 49 99 148 49 89 138 40 74 114 -10%
College of Health 228 180 408 222 182 404 226 190 416 235 197 432 233 183 416 2%
Community & Technical College 103 129 232 103 119 222 104 125 229 122 117 239 105 120 225 -3%
Consortium Library 27 73 100 27 61 88 26 56 82 27 52 79 24 54 78 -22%
Chancellor’s Offi ce 1 51 52 1 48 49 1 49 50 54 54 51 51 -2%
Provost Operations 89 134 223 89 136 225 74 155 229 62 157 219 44 156 200 -10%
VC, Administrative Operation 2 545 547 441 441 395 395 4 388 392 334 334 -39%
VC, Student Aff airs 275 275 327 327 331 331 320 320 260 260 -5%
VC, University Advancement 37 37 34 34 20 20 24 24 18 18 -51%
Anchorage Campus Total 961 1,820 2,781 931 1,762 2,693 896 1,714 2,610 888 1,687 2,575 761 1,521 2,282 -18%
Kenai Peninsula College 127 137 264 119 120 239 122 121 243 114 120 234 115 111 226 -14%
Kodiak College 37 37 74 32 31 63 39 32 71 36 31 67 29 26 55 -26%
Matanuska-Susitna College 110 79 189 111 58 169 107 59 166 97 64 161 81 58 139 -26%
Prince William Sound College 38 50 88 29 45 74 29 49 78 31 48 79 33 47 80 -9%
UAA Total 1,273 2,123 3,396 1,222 2,016 3,238 1,193 1,975 3,168 1,166 1,950 3,116 1,019 1,763 2,782 -18%
Employee Headcount Trends by UAA Administrative Unit, Fall 2015-2019All Employees
Table 4.01

2020 Fact Book - Faculty & Staff 69
2015 2016 2017 2018 2019 2015-2019
Non Non Non Non Non % Change Faculty Fac Total Faculty Fac Total Faculty Fac Total Faculty Fac Total Faculty Fac Total in Total
Anchorage Campus
College of Arts & Sciences 223 95 318 221 102 323 209 99 308 190 94 284 164 71 235 -26%
College of Business & Public Policy 59 37 96 57 36 93 57 39 96 56 39 95 52 28 80 -17%
College of Engineering 39 15 54 34 16 50 37 20 57 39 20 59 34 16 50 -7%
College of Health 138 122 260 135 120 255 135 117 252 133 122 255 128 121 249 -4%
Community & Technical College 47 43 90 49 36 85 48 33 81 60 35 95 60 39 99 10%
Consortium Library 27 27 54 27 28 55 26 25 51 27 25 52 24 24 48 -11%
Chancellor’s Offi ce 1 44 45 1 43 44 1 45 46 50 50 45 45 0%
Provost Operations 23 72 95 21 82 103 20 82 102 20 100 120 19 108 127 34%
VC, Administrative Operation 2 325 327 283 283 263 263 258 258 212 212 -35%
VC, Student Aff airs 123 123 148 148 144 144 146 146 121 121 -2%
VC, University Advancement 23 23 22 22 20 20 22 22 18 18 -22%
Anchorage Campus Total 559 926 1,485 545 916 1,461 533 887 1,420 525 911 1,436 481 803 1,284 -14%
Kenai Peninsula College 39 69 108 37 66 103 35 63 98 33 66 99 32 65 97 -10%
Kodiak College 13 28 41 13 21 34 13 20 33 13 17 30 13 17 30 -27%
Matanuska-Susitna College 30 43 73 29 42 71 26 39 65 25 41 66 22 35 57 -22%
Prince William Sound College 7 32 39 6 31 37 7 30 37 6 33 39 7 30 37 -5%
UAA Total 648 1,098 1,746 630 1,076 1,706 614 1,039 1,653 602 1,068 1,670 555 950 1,505 -14%
Employee Headcount Trends by UAA Administrative Unit, Fall 2015-2019Regular and Term Employees
Table 4.01a

Faculty & Staff - 2020 Fact Book
70
2015 2016 2017 2018 2019 2015-2019
Non Non Non Non Non % Change Faculty Fac Total Faculty Fac Total Faculty Fac Total Faculty Fac Total Faculty Fac Total in Total
Anchorage Campus
College of Arts & Sciences 154 149 303 139 150 289 123 120 243 122 123 245 78 140 218 -28%
College of Business & Public Policy 24 40 64 21 34 55 27 36 63 21 33 54 21 32 53 -17%
College of Engineering 12 60 72 17 76 93 12 79 91 10 69 79 6 58 64 -11%
College of Health 90 58 148 87 62 149 91 73 164 102 75 177 105 62 167 13%
Community & Technical College 56 86 142 54 83 137 56 92 148 62 82 144 45 81 126 -11%
Consortium Library 46 46 33 33 31 31 27 27 30 30 -35%
Chancellor’s Offi ce 7 7 5 5 4 4 4 4 6 6 -14%
Provost Operations 66 62 128 68 54 122 54 73 127 42 57 99 25 48 73 -43%
VC, Administrative Operation 220 220 158 158 132 132 4 130 134 122 122 -45%
VC, Student Aff airs 152 152 179 179 187 187 174 174 139 139 -9%
VC, University Advancement 14 14 12 12 2 2 -100%
Anchorage Campus Total 402 894 1,296 386 846 1,232 363 827 1,190 363 776 1,139 280 718 998 -23%
Kenai Peninsula College 88 68 156 82 54 136 87 58 145 81 54 135 83 46 129 -17%
Kodiak College 24 9 33 19 10 29 26 12 38 23 14 37 16 9 25 -24%
Matanuska-Susitna College 80 36 116 82 16 98 81 20 101 72 23 95 59 23 82 -29%
Prince William Sound College 31 18 49 23 14 37 22 19 41 25 15 40 26 17 43 -12%
UAA Total 625 1,025 1,650 592 940 1,532 579 936 1,515 564 882 1,446 464 813 1,277 -23%
Source: The data in this section (Tables 4.01 - 4.07) is extracted from Banner Statewide H Tables at fall freeze.
Note: Faculty members in this report are based on Human Resources EEO classifi cation.
Employee Headcount Trends by UAA Administrative Unit, Fall 2015-2019Temporary Employees
Table 4.01b

2020 Fact Book - Faculty & Staff
71
Anchorage Kenai Kodiak Mat-Su PW Sound UAA Total
Total 2,282 226 55 139 80 2,782
Job Classifi cation Executive 13 1 1 1 1 17
Faculty 762 115 29 81 33 1,020 Professional 461 34 5 7 14 521 Paraprofessional 239 27 15 22 10 313 Clerical 124 15 2 11 3 155 Skilled 38 3 1 3 1 46 Maintenance 72 11 2 3 13 101 Graduate Assistant 38 38 Student Assistant 535 20 11 5 571 Gender Female 1,329 131 38 83 37 1,618 Male 953 95 17 56 43 1,164
Race/Ethnicity African American 73 2 75
AK Native & Am Indian 84 11 1 2 1 99 AK Native & Am Indian Multirace 113 8 2 5 4 132 Asian 109 5 2 1 1 118 Hispanic 111 12 1 7 2 133 Hispanic Multirace 13 13 Native Hawaiian/Pacifi c Island 39 1 1 1 42 White 1,558 180 45 116 69 1,968 Multirace 70 1 3 1 75 Non Resident Alien 54 54 Not Reported 58 9 2 3 1 73
Workload Full-time 1,220 80 28 56 32 1,416
Part-time 1,062 146 27 83 48 1,366 Administrative Unit College of Arts & Sciences 453 453 College of Business & Public Policy 133 133 College of Engineering 114 114 College of Health 416 416 Community & Technical College 225 225 Consortium Library 78 78 Chancellor’s Offi ce 51 51 Provost Operations 200 200 VC, Administrative Operation 334 334 VC, Student Aff airs 260 260 VC, University Advancement 18 18 Community Campus’ Total 226 55 139 80 500
Employee Characteristics by Campus, Fall 2019Table 4.02

Faculty & Staff - 2020 Fact Book
72
Anchorage Kenai Kodiak Mat-Su PW Sound UAA Total
Total 1,284 97 30 57 37 1,505
Job Classifi cation Executive 13 1 1 1 1 17
Faculty 481 32 13 22 7 555 Professional 438 28 5 7 13 491 Paraprofessional 219 20 6 14 10 269 Clerical 66 9 2 8 2 87 Skilled 38 3 1 3 1 46 Maintenance 29 4 2 2 3 40
Gender Female 740 57 19 32 19 867
Male 544 40 11 25 18 638 Race/Ethnicity African American 41 41 AK Native & Am Indian 47 4 1 1 53 AK Native & Am Indian Multirace 50 4 1 3 1 59 Asian 59 3 1 63 Hispanic 56 3 1 3 1 64 Hispanic Multirace 3 3 Native Hawaiian/Pacifi c Island 10 1 1 12 White 935 76 24 46 32 1,113 Multirace 24 1 2 1 28 Non Resident Alien 19 19 Not Reported 40 6 1 3 50 Workload Full-time 1,213 80 28 56 32 1,409 Part-time 71 17 2 1 5 96 Administrative Unit College of Arts & Sciences 235 235 College of Business & Public Policy 80 80 College of Engineering 50 50 College of Health 249 249 Community & Technical College 99 99 Consortium Library 48 48 Chancellor’s Offi ce 45 45 Provost Operations 127 127 VC, Administrative Operation 212 212 VC, Student Aff airs 121 121 VC, University Advancement 18 18 Community Campus’ Total 97 30 57 37 221
Regular and Term Employee Characteristics by Campus, Fall 2019Table 4.02a

2020 Fact Book - Faculty & Staff
73
Anchorage Kenai Kodiak Mat-Su PW Sound UAA Total
Total 998 129 25 82 43 1,277
Job Classifi cation Faculty 281 83 16 59 26 465
Professional 23 6 1 30 Paraprofessional 20 7 9 8 44 Clerical 58 6 3 1 68 Maintenance 43 7 1 10 61 Graduate Assistant 38 38 Student Assistant 535 20 11 5 571
Gender Female 589 74 19 51 18 751
Male 409 55 6 31 25 526
Race/Ethnicity African American 32 2 34
AK Native & Am Indian 37 7 2 46 AK Native & Am Indian Multirace 63 4 1 2 3 73 Asian 50 2 2 1 55 Hispanic 55 9 4 1 69 Hispanic Multirace 10 10 Native Hawaiian/Pacifi c Island 29 1 30 White 623 104 21 70 37 855 Multirace 46 1 47 Non Resident Alien 35 35 Not Reported 18 3 1 1 23
Workload Full-time 7 7
Part-time 991 129 25 82 43 1,270
Administrative Unit College of Arts & Sciences 218 218
College of Business & Public Policy 53 53 College of Engineering 64 64 College of Health 167 167 Community & Technical College 126 126 Consortium Library 30 30 Chancellor’s Offi ce 6 6 Provost Operations 73 73 VC, Administrative Operation 122 122 VC, Student Aff airs 139 139 Community Campus’ Total 129 25 82 43 279
Temporary Employee Characteristics by Campus, Fall 2019Table 4.02b

Faculty & Staff - 2020 Fact Book
74
Anchorage Kenai Kodiak Mat-Su PW Sound UAA Total
Total 481 32 13 22 7 555
Faculty Classifi cation ACCFT and UACAD Faculty 420 31 13 20 7 491
Non Rep Faculty 12 Month 42 1 43 Non Rep Faculty Less 12 Month 19 1 1 21
Academic Rank Professor 129 5 1 3 138
Associate Professor 128 11 6 6 2 153 Assistant Professor 174 16 6 12 4 212 Instructor 50 1 1 52
Tenure Status Tenured 254 17 7 9 287
Non-Tenure Track 227 15 6 13 7 268
Contract Type Bipartite 226 31 13 21 7 298
Tripartite 226 1 227 Not Assigned 29 1 30
Workload Full-time 460 31 13 22 7 533
Part-time 21 1 22
Gender Female 253 13 9 10 285
Male 228 19 4 12 7 270
Race African American 10 10
AK Native & Am Indian 20 20 AK Native & Am Indian Multirace 13 1 1 15 Asian 30 2 32 Hispanic 12 12 Native Hawaiian/Pacifi c Island 2 2 White 362 27 12 21 7 429 Multirace 3 3 Non Resident Alien 15 15 Not Reported 14 2 1 17
Highest Degree Doctorate 285 11 5 13 2 316
Master’s 143 17 8 6 2 176 Bachelor 22 1 1 24 Associate 7 2 9 Licensure/Endorsement 1 1 Unknown 23 3 3 29
Regular and Term Faculty Characteristics by Campus, Fall 2019Table 4.03

2020 Fact Book - Faculty & Staff
75
Anchorage Kenai Kodiak Mat-Su PW Sound UAA Total
Administrative Unit College of Arts & Sciences 164 164
College of Business & Public Policy 52 52 College of Engineering 34 34 College of Health 128 128 Community & Technical College 60 60 Consortium Library 24 24 Provost Operations 19 19 Community Campus’ Total 32 13 22 7 74
Regular and Term Faculty Characteristics by Campus, Fall 2019Table 4.03

Faculty & Staff - 2020 Fact Book
76
050-099 100-299 300-499 500-599 600-699 Developmental Lower Division Upper Division Professional Graduate TOTAL
Anchorage Campus Arts & Sciences 3,479 271 4,183 244 8,177
Business & Public Policy 880 844 144 1,868 Engineering 81 216 15 312 Health 1,265 375 146 1,786 Community & Technical 490 4,688 538 126 5,842 University Honors College 66 30 96 Anchorage, Other 48 1,196 1,244
Anchorage Campus Total 538 11,655 2,274 4,309 549 19,325
Kenai Peninsula College 537 4,718 226 42 5,523
Kodiak College 55 1,066 1,121
Matanuska-Susitna College 273 5,822 6,095
Prince William Sound College 1,826 1,826
UAA Total 1,403 25,087 2,500 4,351 549 33,890
Anchorage Campus Arts & Sciences 159 22,666 9,310 68 1,133 33,336
Business & Public Policy 4,890 3,990 621 9,501 Engineering 2,021 3,374 307 5,702 Health 7,439 5,988 12 1,917 15,356 Community & Technical 1,128 13,104 1,122 15,354 University Honors College 111 20 131
Anchorage Campus Total 1,287 50,231 23,804 80 3,978 79,380
Kenai Peninsula College 5,004 270 5,274
Kodiak College 33 1,660 1,693
Matanuska-Susitna College 60 3,491 54 3,605
Prince William Sound College 6 793 799
UAA Total 1,386 61,179 24,128 80 3,978 90,751
050-099 100-299 300-499 500-599 600-699 Developmental Lower Division Upper Division Professional Graduate TOTAL
Student Credit Hours Generated by Adjunct Faculty, Fall 2019Table 4.05
Source: The data regarding student information is extracted from Banner Statewide DSD data system at fall semester closing freeze and the data for faculty information is from Banner Statewide H Tables at fall freeze.
Note: Student Credit Hours are based on course level, representing credit courses at the 050 level and above, and do not include auditors.
Student Credit Hours Generated by Regular and Term Faculty, Fall 2019Table 4.04

2020 Fact Book - Faculty & Staff
77
050-099 100-299 300-499 500-599 600-699 Developmental Lower Division Upper Division Professional Graduate TOTAL
Anchorage Campus Arts & Sciences 1 251 233 3 99 587
Business & Public Policy 41 53 15 109 Engineering 49 87 33 169 Health 219 142 1 60 422 Community & Technical 16 225 32 273 University Honors College 3 3 6
Anchorage Campus Total 17 788 550 4 207 1,566
Kenai Peninsula College 113 15 128
Kodiak College 2 53 55
Matanuska-Susitna College 1 77 3 81
Prince William Sound College 1 27 28
UAA Total 21 1,058 568 4 207 1,858
Anchorage Campus Arts & Sciences 134 15 225 18 392
Business & Public Policy 11 11 4 26 Engineering 5 3 2 10 Health 49 8 9 66 Community & Technical 6 69 18 8 101 University Honors College 2 1 3 Anchorage, Other 1 24 25
Anchorage Campus Total 7 294 56 233 33 623
Kenai Peninsula College 10 124 8 3 145
Kodiak College 2 34 36
Matanuska-Susitna College 5 120 125
Prince William Sound College 45 45
UAA Total 24 617 64 236 33 974
050-099 100-299 300-499 500-599 600-699 Developmental Lower Division Upper Division Professional Graduate TOTAL
Number of Course Sections Taught by Regular and Term Faculty, Fall 2019Table 4.06
Number of Course Sections Taught by Adjunct Faculty, Fall 2019Table 4.07
Source: The data regarding student information is extracted from Banner Statewide DSD data system at Fall semester closing freeze and the data for faculty information is from Banner Statewide H Tables at fall freeze.
Note: Number of Course Sections includes credit course sections at the 050 level and above.


Fina
nce,
Gra
nts,
and
Giv
ing

80
Finance, etc. - 2020 Fact Book
FY2016 FY2017 FY2018 FY2019 FY2020 % Change (in Thousands of $) FY16-FY20 FY19-FY20
FY2016 FY2017 FY2018 FY2019 FY2020 % Change (in Thousands of $) FY16-FY20 FY19-FY20
Anchorage Campus 107,884 100,166 98,523 103,085 92,595 -14.2% -10.2%
Small Business Dev. Center 1,032 985 960 960 960 -7.0% 0.0%
Kenai Peninsula College 7,250 6,636 6,455 6,289 6,289 -13.2% 0.0%
Kodiak College 2,717 2,435 2,359 2,303 2,303 -15.2% 0.0%
Matanuska-Susitna College 5,204 4,869 4,708 4,569 4,569 -12.2% 0.0%
Prince William Sound College 3,298 2,787 2,760 2,667 2,667 -19.1% 0.0%
UAA Total 127,385 117,877 115,765 119,872 109,383 -14.1% -8.8%
Anchorage Campus 273,622 268,603 267,117 265,992 255,926 -6.5% -3.8%
Small Business Dev. Center 3,178 3,010 3,685 3,685 3,685 15.9% 0.0%
Kenai Peninsula College 16,898 16,653 16,440 16,302 16,208 -4.1% -0.6%
Kodiak College 6,134 5,921 5,839 5,600 5,564 -9.3% -0.6%
Matanuska-Susitna College 11,525 12,291 13,340 13,315 13,381 16.1% 0.5%
Prince William Sound College 7,602 7,164 7,209 6,277 6,252 -17.8% -0.4%
UAA Total 318,959 313,642 313,629 311,171 301,016 -5.6% -3.3%
Authorized State Appropriation BudgetFiscal Years 2016-2020
Table 5.01
Total Authorized BudgetFiscal Years 2016-2020
Table 5.02
Source: UA Approved Operating and Capital Budgets (Yellowbook).

81
2020 Fact Book - Finance, etc.
FY2015 FY2016 FY2017 FY2018 FY2019 % Change (in Thousands of $) FY15-FY19 FY18-FY19
FY2015 FY2016 FY2017 FY2018 FY2019 % Change (in Thousands of $) FY15-FY19 FY18-FY19
Anchorage Campus 113,901 108,421 100,738 98,445 102,729 -9.8% 4.4%
Small Business Dev. Center 1,056 965 941 960 960 -9.1% 0.0%
Kenai Peninsula College 7,708 7,256 6,635 6,462 6,309 -18.1% -2.4%
Kodiak College 2,856 2,722 2,423 2,366 2,420 -15.3% 2.3%
Matanuska-Susitna College 5,464 5,211 4,877 4,714 4,652 -14.9% -1.3%
Prince William Sound College 3,380 3,300 2,835 2,762 2,693 -20.3% -2.5%
UAA Total 134,365 127,875 118,449 115,709 119,763 -10.9% 3.5%
Anchorage Campus 266,438 263,392 259,434 259,930 257,853 -3.2% -0.8%
Small Business Dev. Center 2,420 2,289 3,035 3,005 2,511 3.8% -16.4%
Kenai Peninsula College 15,727 13,914 15,393 13,838 13,621 -13.4% -1.6%
Kodiak College 5,380 4,963 4,409 4,285 4,192 -22.1% -2.2%
Matanuska-Susitna College 10,752 10,500 11,008 10,071 9,309 -13.4% -7.6%
Prince William Sound College 5,798 5,442 5,831 5,277 5,245 -9.5% -0.6%
UAA Total 306,516 300,500 299,110 296,405 292,732 -4.5% -1.2%
Actual State Appropriation ExpendituresFiscal Years 2015-2019
Table 5.03
Total Actual ExpendituresFiscal Years 2015-2019
Table 5.04
Source: UA Approved Operating and Capital Budgets (Yellowbook).

(in Thousands of $) % ChangeExpenditures FY16 % Total FY17 % Total FY18 % Total FY19 % Total FY20 % Total FY16-FY20 FY19-FY20
8282 Finance, etc. Finance, etc. Finance, etc. - 2020 Fact Book
- 2020 Fact Book- 2020 Fact Book
Summary of UAA Expenditures by Functional CategoriesFiscal Years 2016-2020
Table 5.05
Unrestricted
Instruction 102,765 34% 103,067 34% 100,587 34% 99,395 34% 89,028 33% -13% -10%
Research 4,559 2% 4,861 2% 4,326 1% 3,687 1% 3,370 1% -26% -9%
Public Service 5,844 2% 5,518 2% 4,962 2% 4,993 2% 4,925 2% -16% -1%
Academic Support 18,279 6% 16,887 6% 16,517 6% 18,260 6% 17,363 6% -5% -5%
Library 7,560 3% 6,981 2% 6,994 2% 6,781 2% 6,182 2% -18% -9%
Student Services 17,371 6% 17,143 6% 17,188 6% 17,478 6% 17,023 6% -2% -3%
Athletics 9,149 3% 7,782 3% 8,356 3% 8,029 3% 6,971 3% -24% -13%
Institutional Support 30,384 10% 32,498 11% 30,878 10% 30,908 11% 27,616 10% -9% -11%
Physical Plant 31,951 11% 33,395 11% 33,432 11% 30,455 10% 29,773 11% -7% -2%
Scholarships -1,858 -1% -1,474 0% -2,249 -1% -1,657 -1% -1,917 -1% 3% 16%
Auxiliary -96 0% 2 0% 1 0% 28 0% 2,467%
Unrestricted Total 226,004 75% 226,561 76% 220,994 75% 218,330 75% 200,363 74% -11% -8% Match
Instruction 226 0% 246 0% 333 0% 250 0% -25%
Research 356 0% 307 0% 244 0% 450 0% 85%
Public Service 912 0% 918 0% 1,024 0% 1,206 0% 18%
Academic Support 96 0% 109 0% 172 0% 260 0% 51%
Scholarships 48 0% 66 0% 136 0% 140 0% 3%
Student Services 27 0% -7 0%
Institutional Support 722 0%
Match Total 1,665 1% 1,639 1% 1,909 1% 3,029 1% 59%

(in Thousands of $) % ChangeExpenditures FY16 % Total FY17 % Total FY18 % Total FY19 % Total FY20 % Total FY16-FY20 FY19-FY20
838383
2020 Fact Book - Finance, etc.
Summary of UAA Expenditures by Functional CategoriesFiscal Years 2016-2020
Table 5.05
Restricted Instruction 6,485 2% 7,468 2% 6,941 2% 7,068 2% 5,175 2% -20% -27%
Research 11,187 4% 11,567 4% 12,808 4% 14,899 5% 15,778 6% 41% 6%
Public Service 10,806 4% 9,645 3% 10,261 3% 9,057 3% 9,244 3% -14% 2%
Academic Support 958 0% 947 0% 763 0% 802 0% 818 0% -15% 2%
Library 34 0% 104 0% 118 0% 131 0% 166 0% 389% 27%
Student Services 1,416 0% 1,195 0% 1,222 0% 1,403 0% 1,340 0% -5% -5%
Athletics 42 0% 52 0% 19 0% 23 0% 10 0% -75% -54%
Institutional Support 101 0% 32 0% 30 0% 87 0% 1,276 0% 1169% 1361%
Physical Plant 167 0% 92 0% 431 0% 13 0% -92% -97%
Scholarships 15,975 5% 14,943 5% 16,198 5% 15,618 5% 16,122 6% 1% 3%
Total Restricted 47,169 16% 45,952 15% 48,452 16% 49,519 17% 49,942 18% 6% 1% Auxiliary Total 25,432 8% 22,745 8% 22,817 8% 19,967 7% 15,592 6% -39% -22% Designated Instruction 24 0%
Research 32 0% 82 0% 162%
Physical Plant 56 0% 65 0% 4 0% -94%
Scholarships 2,113 1% 2,186 1% 2,128 1% 2,076 1% 1,834 1% -13% -12%
Designated Total 2,113 1% 2,186 1% 2,183 1% 2,173 1% 1,945 1% -8% -10%
UAA TOTAL 300,719 100% 299,110 100% 296,085 100% 291,898 100% 270,870 100% -10% -7%
Source: University of Alaska ‘S’ reports.
Note: Match funds were separated out of the unrestricted funds and into their own category in FY17.

84
Finance, etc. - 2020 Fact Book
Authorized UAA Expenditure Budget (Unrestricted) Instruction Component Only, Fiscal Years 2016-2020
Table 5.06
Source: UAA Budget Offi ce.
Notes: 1. Includes Academic Units only and does not include central administration, Chancellor, or information technology services units.2. Updated using FY19 Revenue and Expense TOAD Report sorted by Instruction NACUBO for Accepted Budget for Expense.
Anchorage Campus
College of Arts & Sciences 33,497 32,140 33,641 24,763 21,791 -35% -12%
College of Business & Public Policy 9,985 10,091 9,832 9,618 9,062 -9% -6%
College of Engineering 6,921 7,448 8,296 7,707 5,853 -15% -24%
College of Health 20,664 22,395 20,845 20,676 21,685 5% 5%
Community & Technical College 15,129 14,750 11,365 11,834 11,699 -23% -1%
Provost Operations 1,808 3,212 5,637 6,742 5,728 217% -15%
Anchorage Campus Total 88,005 90,036 89,617 81,339 75,818 -14% -7%
Kenai Peninsula College 8,009 7,974 7,910 7,749 8,299 4% 7%
Kodiak College 2,276 2,145 1,986 2,037 1,876 -18% -8%
Matanuska-Susitna College 5,886 5,776 5,430 5,666 5,768 -2% 2%
Prince William Sound College 1,615 1,305 1,392 1,589 1,690 5% 6%
UAA Total 105,792 107,236 106,334 98,380 93,451 -12% -5%
(in Thousands of $) % Change FY2016 FY2017 FY2018 FY2019 FY2020 FY16-FY20 FY19-FY20

85
2020 Fact Book - Finance, etc.
Summary of UAA Revenue ReceivedFiscal Years 2016-2020
Table 5.07
Unrestricted General Funds 131,898 43% 123,134 42% 119,933 41% 123,555 42% 113,094 42% -14% -8% Net Tuition/Fees 76,662 25% 76,727 26% 78,575 27% 76,566 26% 70,093 26% -9% -8% UA Intra-Agency Rcpt. 9,772 3% 7,292 2% 7,114 2% 6,647 2% 6,250 2% -36% -6% UA Receipts 9,206 3% 9,404 3% 10,209 3% 8,425 3% 7,399 3% -20% -12% Indirect Cost Recov. 4,376 1% 3,994 1% 4,381 1% 4,572 2% 4,664 2% 7% 2% CIP Receipts 439 0% 442 0% -100%
Unrestricted Total 232,352 76% 220,993 75% 220,212 75% 219,764 75% 201,500 74% -13% -8%
Match Total 1,777 1% 1,500 1% 2,442 1% 3,455 1% 41%
Restricted Federal Receipts 29,487 10% 27,808 9% 29,872 10% 30,653 10% 34,535 13% 17% 13%
UA Intra-Agency Rcpt. 1 0% State Intra-Agency Rcpt. 7,247 2% 6,309 2% 6,193 2% 6,478 2% 5,863 2% -19% -9% Interest Income 1 0% 1 0% 2 0% 3 0% 1 0% 0% -75% UA Receipts 10,439 3% 11,838 4% 12,310 4% 12,420 4% 9,676 4% -7% -22%
Restricted Total 47,174 15% 45,957 16% 48,377 16% 49,554 17% 50,076 18% 6% 1%
Auxiliary Dorm, Food 25,751 8% 21,959 7% 22,340 8% 20,998 7% 14,967 6% -42% -29% Indirect Cost Recov. 3 0% 1 0% -76% UA Receipts 136 0% 96 0% 67 0% 19 0% 18 0% -87% -7% Intra-Agency Rcpts. -403 0% 9 0% 15 0% 9 0% 7 0% -102% -23%
Auxiliary Total 25,484 8% 22,064 8% 22,422 8% 21,029 7% 14,992 6% -41% -29%
Designated Total 2,113 1% 2,186 1% 2,183 1% 2,173 1% 1,945 1% -8% -11%
UAA TOTAL 307,124 100% 292,977 100% 294,694 100% 294,962 100% 271,968 100% -11% -8%
Source: University of Alaska “S” reports for UAA Appropriation.
Notes:1. Auxiliary enterprises include Anchorage Campus Bookstore, Anchorage Housing & Dining Services, Anchorage Health Center, AK Airlines Arena, Anchorage Parking, Kenai Bookstore, Kodiak
Bookstore, Kenai Health Center, Kenai Housing, Mat-Su Bookstore, PWSC Housing, and PWSC Fitness Center. 2. Unrestricted UA Receipts balance is after reversal of FY18 Unreserved Fund Balance $16.4M. 3. Match funds were separated out of the unrestricted funds and into their own category in FY17.
(in Thousands of $) % ChangeRevenue FY16 % Total FY17 % Total FY18 % Total FY19 % Total FY20 % Total FY16-FY20 FY19-FY20

86 Finance, etc. - 2020 Fact Book
Academic Institutional Public Scholarship/ Student Support Support Instruction Service Research Fellowship Services TOTAL N $ N $ N $ N $ N $ N $ N $ N $
Research Grant Awards by UAA Units and Fund AgenciesFiscal Year 2020
Table 5.08
College of Arts & Sciences Federal Agencies 30 4,073,586 1 46,000 31 4,119,586
Private Funding Sources 2 26,200 2 196,600 2 13,700 15 736,440 21 972,940 Alaska State Agencies 8 506,067 8 506,067
Total 2 26,200 2 196,600 2 13,700 53 5,316,093 1 46,000 60 5,598,593
College of Business & Public Policy
Federal Agencies 2 650,000 4 1,651,130 6 2,301,130 Local Government 1 4,071 1 4,962 2 9,033 Private Funding Sources 2 224,312 1 1,850 2 39,537 2 34,637 18 1,132,239 25 1,432,575 Alaska State Agencies 5 270,360 5 270,360
Total 2 224,312 1 1,850 2 39,537 5 688,708 28 3,058,691 38 4,013,098
College of Engineering Private Funding Sources 1 1,000 2 6,375 4 168,700 3 126,014 7 404,396 17 706,485 Alaska State Agencies 3 377,051 3 377,051
Total 1 1,000 2 6,375 4 168,700 3 126,014 10 781,447 20 1,083,536
College of Health Federal Agencies 2 613,070 3 283,000 3 389,190 8 1,285,260
Private Funding Sources 2 3,630 4 255,318 13 1,995,666 10 390,133 1 11,400 2 5,830 32 2,661,977 Alaska State Agencies 4 295,662 30 4,393,153 10 788,202 44 5,477,017
Total 2 3,630 10 1,164,050 46 6,671,819 23 1,567,525 1 11,400 2 5,830 84 9,424,254
Community & Technical College Private Funding Sources 1 140,000 1 45,500 1 15,187 3 200,687
Consortium Library Federal Agencies 1 474,908 1 1,320,359 2 1,795,267
Private Funding Sources 2 100,801 1 40,433 3 141,234
Total 1 474,908 2 100,801 2 1,360,792 5 1,936,501

87
2020 Fact Book - Finance, etc. Research Grant Awards by UAA Units and Fund Agencies
Fiscal Year 2020Table 5.08
Academic Institutional Public Scholarship/ Student Support Support Instruction Service Research Fellowship Services TOTAL N $ N $ N $ N $ N $ N $ N $ N $
Chancellor Operation Federal Agencies 7 2,775,933 8 1,471,981 15 4,247,914 Local Government 2 128,500 2 128,500 Private Funding Sources 6 256,498 6 256,498 Alaska State Agencies 2 74,817 2 74,817
Total 17 3,235,748 8 1,471,981 25 4,707,729 Provost Operations Federal Agencies 1 899,981 1 600,000 2 333,915 3 200,015 7 2,033,911 Local Government 7 602,000 7 602,000 Private Funding Sources 2 20,000 2 200,000 3 45,000 1 10,000 8 275,000
Total 1 899,981 3 620,000 9 802,000 2 333,915 6 245,015 1 10,000 22 2,910,911 Student Aff airs Federal Agencies 2 575,074 2 575,074 Private Funding Sources 1 28,500 1 28,500 Alaska State Agencies 1 20,252 1 20,252
Total 1 28,500 3 595,326 4 623,826 University Advancement Private Funding Sources 1 17,091 1 17,091 VCAS Athletics/Sport Center Private Funding Sources 1 40,560 1 40,560 Central Managed Accounts Private Funding Sources 1 1,500 1 2,500 2 4,000 Alaska State Agencies 1 186,086 1 186,086
Total 2 187,586 1 2,500 3 190,086

88 Finance, etc. - 2020 Fact Book
Academic Institutional Public Scholarship/ Student Support Support Instruction Service Research Fellowship Services TOTAL N $ N $ N $ N $ N $ N $ N $ N $
Research Grant Awards by UAA Units and Fund AgenciesFiscal Year 2020
Table 5.08
VCAS Operations Federal Agencies 1 2,722,592 1 2,722,592
Alaska State Agencies 1 248,883 1 248,883
Total 2 2,971,475 2 2,971,475
Kenai Peninsula College Local Government 1 847,186 1 847,186
Private Funding Sources 1 274 2 66,552 3 66,825 Alaska State Agencies 1 194,544 1 194,544
Total 2 847,460 3 261,095 5 1,108,555
Kodiak College Alaska State Agencies 1 115,145 1 115,145
Prince William Sound College Federal Agencies 1 11,188 1 11,188
Alaska State Agencies 4 208,930 4 208,930
Total 4 208,930 1 11,188 5 220,118
UAA Total Federal Agencies 2 1,374,889 1 2,722,592 3 1,213,070 13 5,029,292 47 7,919,802 4 246,015 3 586,262 73 19,091,921
Local Government 1 847,186 10 734,571 1 4,962 12 1,586,719 Private Funding Sources 6 292,072 8 129,747 16 820,430 34 2,809,000 51 2,665,708 4 56,400 4 31,017 123 6,804,374 Alaska State Agencies 1 248,883 9 619,737 34 4,848,600 26 1,941,680 1 20,252 71 7,679,152
Total 8 1,666,961 10 3,101,222 29 3,500,423 91 13,421,462 125 12,532,152 8 302,415 8 637,531 279 35,162,165
Source: UAA Offi ce of Sponsored Programs compiled by UAA Offi ce of Institutional Research.
Notes: 1. Provost Operations awards are from the Alaska Native Science and Engineering Program and the Business Enterprise Institute which report directly to the Chancellor.2. Signifi cant staffi ng changes may have led to potential data inconsistencies during FY20.3. N = number of grants awarded.4. $ = amount awarded.

89
2020 Fact Book - Finance, etc.
Grant Awards by UAA Units and Functional CategoriesFiscal Years 2016-2020
Table 5.09
FY2016 FY2017 FY2018 FY2019 FY2020
N $ N $ N $ N $ N $
College of Arts & Sciences Academic Support 4 302,091 1 22,000 2 19,080 2 26,200 Institutional Support 3 133,920 4 156,230 1 124,000 2 755,000 Instruction 5 671,158 6 801,416 6 187,841 3 182,212 2 196,600 Public Service 8 152,109 8 484,824 7 303,049 3 215,500 2 13,700 Research 61 6,365,619 45 6,140,876 60 5,644,270 63 7,183,601 53 5,316,093 Scholarship/Fellowship 1 6,200 1 46,000 Student Services 1 10,000
Total 83 7,641,097 64 7,605,346 76 6,278,240 71 8,336,313 60 5,598,593
College of Business & Public Policy Academic Support 3 451,501 1 229,974 3 48,549 1 218,000 2 224,312 Institutional Support 2 594,829 1 618 1 1,850 Instruction 7 1,138,184 4 75,714 4 289,690 4 53,465 2 39,537 Public Service 8 879,826 5 357,152 5 146,320 9 768,941 5 688,708 Research 34 2,365,141 34 2,708,158 31 3,004,052 31 2,262,485 28 3,058,691
Total 52 4,834,653 46 3,965,827 43 3,488,611 46 3,303,508 38 4,013,098
College of Engineering Academic Support 2 11,258 1 6,500 1 1,000 Institutional Support 3 105,640 3 71,770 4 6,257 7 331,661 2 6,375 Instruction 1 877,404 1 655,140 1 30,000 4 168,700 Public Service 2 15,099 5 333,583 3 84,000 4 130,140 3 126,014 Research 15 3,209,818 10 558,251 16 1,111,571 11 864,260 10 781,447 Student Services 2 10,466 1 9,800
Total 21 4,207,961 18 963,604 28 1,878,692 25 1,372,361 20 1,083,536
College of Health Academic Support 3 112,500 4 235,606 3 81,945 3 110,866 Institutional Support 5 70,650 4 75,476 4 102,964 4 149,511 2 3,630 Instruction 12 2,311,879 10 1,895,613 9 2,672,566 15 2,968,780 10 1,164,050 Public Service 45 5,634,978 41 5,508,053 37 5,463,205 43 6,376,822 46 6,671,819 Research 16 775,906 26 2,621,164 20 1,308,688 20 2,039,561 23 1,567,525 Scholarship/Fellowship 1 2,600 1 2,600 1 10,000 1 11,400 Student Services 2 5,830
Total 82 8,908,513 86 10,338,511 74 9,639,367 85 11,645,539 84 9,424,254
Community & Technical College Academic Support 1 50,000 Institutional Support 2 24,794 4 85,078 2 38,384 Instruction 3 221,902 1 15,920 1 15 1 140,000 Public Service 3 154,000 2 214,164 1 58,800 1 50,000 1 45,500 Student Services 1 5,966 1 15,187
Total 8 400,696 7 315,162 5 153,150 2 50,015 3 200,687

90
Finance, etc. - 2020 Fact Book
Consortium Library Academic Support 1 474,908 Institutional Support 2 100,801 2 100,858 2 100,860 2 103,875 2 100,801 Public Service 5 1,226,291 3 626,052 3 567,946 1 956,796 2 1,360,792 Research 1 37,174 2 689,845 1 185,574
Total 7 1,327,092 6 764,084 7 1,358,651 4 1,246,245 5 1,936,501
Athletics/Sport Center Academic Support 1 46,905 1 51,300 1 50,034 1 40,560
Central Managed Accts. Public Service 2 187,586 Research 1 2,500
Total 3 190,086
VCAS Operations Institutional Support 1 250,000 2 2,971,475
Chancellor Operation Public Service 17 2,087,891 17 1,963,525 21 3,177,527 23 3,080,505 17 3,235,748 Research 5 1,250,532 5 803,019 11 2,512,200 9 2,700,944 8 1,471,981
Total 22 3,338,423 22 2,766,544 32 5,689,727 32 5,781,449 25 4,707,729
Provost Operations Academic Support 3 670,000 1 449,999 1 449,999 1 12,002 1 899,981 Institutional Support 1 20,691 1 700 1 10,000 Instruction 5 2,511,600 6 3,266,483 6 1,279,000 8 5,415,000 3 620,000 Public Service 14 903,200 10 1,294,205 19 1,447,635 15 1,063,500 9 802,000 Research 2 1,288,481 3 2,530,046 5 4,157,674 4 3,626,777 2 333,915 Scholarship/Fellowship 5 1,457,000 6 503,000 6 289,000 6 429,985 6 245,015 Student Services 1 5,000 1 10,000
Total 30 6,850,972 27 8,044,433 38 7,633,308 35 10,552,264 22 2,910,911
Senior Vice Provost Academic Support 1 6,000 Public Service 2 6,683 1 5,099 1 4,900 1 3,325 Research 1 2,000 1 5,000 1 5,800 1 5,000
Total 4 14,683 2 10,099 2 10,700 2 8,325
Student Aff airs Academic Support 1 20,500 Institutional Support 2 67,783 Public Service 2 52,695 1 66,795 1 20,000 1 28,500 Student Services 3 578,186 2 595,032 5 873,682 5 870,812 3 595,326
Total 5 630,881 6 750,110 6 893,682 5 870,812 4 623,826
University Advancement Institutional Support 1 30,000 1 40,000 3 242,641 1 17,091
Grant Awards by UAA Units and Functional CategoriesFiscal Years 2016-2020
Table 5.09
FY2016 FY2017 FY2018 FY2019 FY2020
N $ N $ N $ N $ N $

91
2020 Fact Book - Finance, etc.
FY2016 FY2017 FY2018 FY2019 FY2020
N $ N $ N $ N $ N $
Kenai Peninsula College Academic Support 1 1,380 1 1,050 1 2,409 Institutional Support 1 10,000 1 15,000 1 40,453 Instruction 4 993,176 2 175,803 2 987,901 2 984,952 2 847,460 Public Service 3 29,534 2 38,284 2 43,548 2 9,451 3 261,095 Research 1 174,336 Student Services 1 779,958
Total 10 1,208,427 7 1,010,095 6 1,074,311 4 994,403 5 1,108,555
Kodiak College Academic Support 1 399,877 Institutional Support 1 9,614 1 5,164 Instruction 2 296,902 1 97,557 2 448,909 1 98,804 1 115,145 Student Services 1 10,000
Total 4 706,393 1 97,557 4 464,073 1 98,804 1 115,145
Matanuska-Susitna College Instruction 1 59,051 1 77,294 Student Services 2 200,333
Total 3 259,384 1 77,294
Prince William Sound College Academic Support 1 14,850 Institutional Support 2 11,316 2 89,300 2 30,959 1 14,250 Instruction 3 165,065 2 139,755 5 182,284 6 733,215 4 208,930 Public Service 2 38,425 1 11,400 Student Services 1 17,000 1 80,000 1 30,000 1 11,188
Total 9 246,656 5 309,055 7 213,243 9 788,865 5 220,118
UAA Total Academic Support 18 2,005,104 10 1,010,429 14 713,274 6 347,368 8 1,666,961 Institutional Support 21 517,426 26 1,297,023 19 709,042 20 1,597,555 10 3,101,222 Instruction 43 9,246,322 33 6,545,555 35 6,703,331 41 10,466,443 29 3,500,423 Public Service 111 11,180,732 95 10,891,735 100 11,316,929 103 12,666,380 91 13,421,462 Research 135 15,431,833 125 15,403,689 146 18,434,100 140 18,868,202 125 12,532,152 Scholarship/Fellowship 7 1,465,800 7 505,600 7 299,000 6 429,985 8 302,415 Student Services 7 805,519 4 1,454,990 9 900,114 8 915,612 8 637,531
Total 342 40,652,736 300 37,109,020 330 39,075,789 324 45,291,544 279 35,162,165
Grant Awards by UAA Units and Functional CategoriesFiscal Years 2016-2020
Table 5.09
Source: UAA Offi ce of Sponsored Programs compiled by UAA Offi ce of Institutional Research.
Notes: 1. Signifi cant staffi ng changes may have led to potential data inconsistencies during FY20.2. N = number of grants awarded.3. $ = amount awarded.

92 Finance, etc. - 2020 Fact Book
Institutional Public Scholarship/ Student Support Instruction Service Research Fellowship Services TOTAL N $ N $ N $ N $ N $ N $ N $
Research Grant Proposal Submissions by UAA Units and Fund AgenciesFiscal Year 2020
Table 5.10
College of Arts & Sciences Federal Agencies 1 972,983 2 589,899 33 18,302,760 4 497,257 40 20,362,899 Local Government 1 900 1 900 Private Funding Sources 3 67,206 2 63,944 26 5,633,165 1 50,000 32 5,814,315 Alaska State Agencies 7 406,460 7 406,460
Total 4 1,040,189 4 653,843 67 24,343,285 5 547,257 80 26,584,574 College of Business & Public Policy Federal Agencies 13 4,816,477 13 4,816,477 Local Government 1 3,499 1 3,499 Private Funding Sources 1 2,887 4 195,255 7 647,384 12 845,526 Alaska State Agencies 4 352,903 4 352,903
Total 1 2,887 5 198,754 24 5,816,764 30 6,018,405 College of Engineering Federal Agencies 2 81,731 4 2,281,183 6 2,362,914 Private Funding Sources 3 151,200 1 2,014 11 1,860,362 1 1,911 16 2,015,488 Alaska State Agencies 3 465,416 3 465,416
Total 3 151,200 3 83,745 18 4,606,961 1 1,911 25 4,843,818 College of Health Federal Agencies 2 295,449 2 180,000 8 4,537,483 12 5,012,932 Local Government 1 24,124 3 292,878 4 317,002 Private Funding Sources 1 996 2 14,628 14 4,242,984 19 977,275 1 13,300 1 38 5,249,183 Alaska State Agencies 1 136,559 3 211,707 29 6,681,471 8 572,678 41 7,602,415
Total 2 137,555 7 521,784 46 11,128,579 38 6,380,314 1 13,300 1 95 18,181,532

93
2020 Fact Book - Finance, etc. Research Grant Proposal Submissions by UAA Units and Fund Agencies
Fiscal Year 2020Table 5.10
Institutional Public Scholarship/ Student Support Instruction Service Research Fellowship Services TOTAL N $ N $ N $ N $ N $ N $ N $
Community & Technical College Private Funding Sources 1 45,500 1 45,500 VCAS Operations Federal Agencies 1 2,722,592 1 2,722,592 Alaska State Agencies 1 248,883 1 232,822 2 481,705
Total 2 2,971,475 1 232,822 3 3,204,297
Chancellor Operation Federal Agencies 8 3,246,933 8 892,496 16 4,139,429 Local Government 1 125,000 1 125,000 Private Funding Sources 4 117,015 4 117,015 Alaska State Agencies 2 131,765 1 49,832 3 181,597
Total 15 3,620,713 9 942,328 24 4,563,041 Provost Operations Federal Agencies 2 3,236,099 2 143,255 4 3,379,354 Local Government 6 584,000 6 584,000 Private Funding Sources 4 524,083 2 68,000 1 5,000 7 597,083 Alaska State Agencies 1 83,915 1 83,915
Total 2 3,236,099 4 524,083 8 652,000 3 227,170 1 5,000 18 4,644,352 Student Aff airs Private Funding Sources 1 28,500 1 28,500
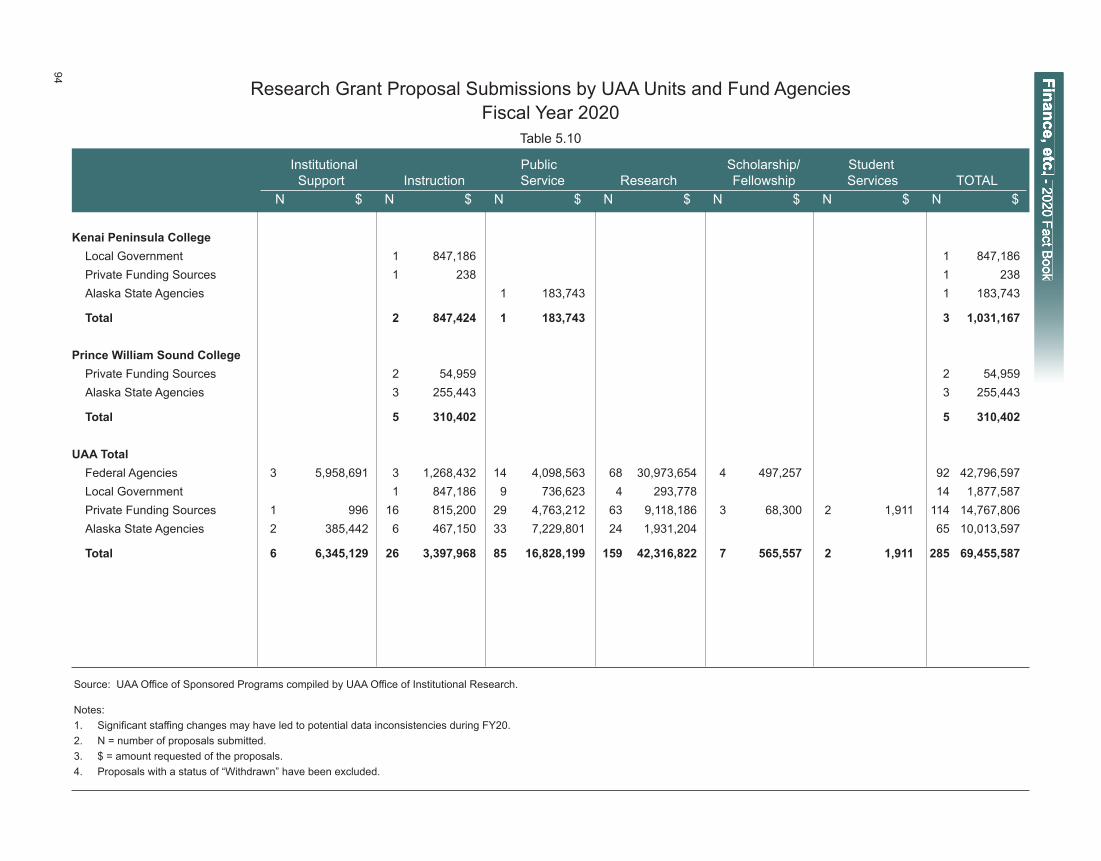
94 Finance, etc. - 2020 Fact Book
Institutional Public Scholarship/ Student Support Instruction Service Research Fellowship Services TOTAL N $ N $ N $ N $ N $ N $ N $
Research Grant Proposal Submissions by UAA Units and Fund AgenciesFiscal Year 2020
Table 5.10
Kenai Peninsula College Local Government 1 847,186 1 847,186 Private Funding Sources 1 238 1 238 Alaska State Agencies 1 183,743 1 183,743
Total 2 847,424 1 183,743 3 1,031,167 Prince William Sound College Private Funding Sources 2 54,959 2 54,959 Alaska State Agencies 3 255,443 3 255,443
Total 5 310,402 5 310,402 UAA Total Federal Agencies 3 5,958,691 3 1,268,432 14 4,098,563 68 30,973,654 4 497,257 92 42,796,597 Local Government 1 847,186 9 736,623 4 293,778 14 1,877,587 Private Funding Sources 1 996 16 815,200 29 4,763,212 63 9,118,186 3 68,300 2 1,911 114 14,767,806 Alaska State Agencies 2 385,442 6 467,150 33 7,229,801 24 1,931,204 65 10,013,597
Total 6 6,345,129 26 3,397,968 85 16,828,199 159 42,316,822 7 565,557 2 1,911 285 69,455,587
Source: UAA Offi ce of Sponsored Programs compiled by UAA Offi ce of Institutional Research. Notes: 1. Signifi cant staffi ng changes may have led to potential data inconsistencies during FY20.2. N = number of proposals submitted.3. $ = amount requested of the proposals.4. Proposals with a status of “Withdrawn” have been excluded.

95
2020 Fact Book - Finance, etc.
Grant Proposal Submissions by UAA Units and Functional CategoriesFiscal Years 2016-2020
Table 5.11
FY2016 FY2017 FY2018 FY2019 FY2020 N $ N $ N $ N $ N $
College of Arts & Sciences Academic Support 2 274,636 Institutional Support 4 134,910 3 151,500 2 814,000 1 65,000 Instruction 5 3,491,006 5 2,905,493 5 2,548,782 4 217,007 4 1,040,189 Public Service 10 1,306,756 15 1,104,415 11 762,112 6 526,211 4 653,843 Research 98 24,057,499 133 30,960,327 122 23,015,847 105 19,864,337 67 24,343,285 Scholarship/Fellowship 1 17,540 1 75,969 1 113,388 1 96,161 5 547,257 Student Services 2 2,732,591
Total 122 32,014,938 157 35,197,704 141 27,254,129 117 20,768,716 80 26,584,574
College of Business & Public Policy Academic Support 1 20,000 1 20,000 Institutional Support 2 594,829 Instruction 1 1,016 1 2,887 Public Service 5 402,689 5 250,371 9 2,819,556 6 442,038 5 198,754 Research 53 9,997,063 45 5,168,002 53 7,222,079 52 10,169,373 24 5,816,764
Total 59 10,419,752 53 6,014,218 63 10,061,635 58 10,611,411 30 6,018,405 College of Engineering Academic Support 1 10,536 Institutional Support 3 105,640 1 89,100 2 3,742 6 272,980 Instruction 1 31,887 2 56,756 3 151,200 Public Service 4 141,395 1 7,000 2 7,496 3 83,745 Research 31 7,121,451 23 3,630,511 26 6,323,217 28 12,610,516 18 4,606,961 Student Services 1 42,000 1 42,000 2 10,466 1 42,000 1 1,911
Total 35 7,269,091 29 3,903,006 33 6,386,848 39 12,989,748 25 4,843,818 College of Health Academic Support 1 30,000 3 584,207 1 49,512 Institutional Support 1 10,000 2 39,393 1 80,000 2 137,555 Instruction 6 5,371,232 7 1,296,450 12 2,935,988 16 3,041,792 7 521,784 Public Service 43 3,985,779 45 5,209,576 42 8,655,882 54 8,096,383 46 11,128,579 Research 33 10,102,100 33 6,780,596 42 5,097,856 46 6,281,950 38 6,380,314 Scholarship/Fellowship 1 2,600 2 12,600 1 13,300 Student Services 1 -
Total 85 19,501,711 90 13,883,429 99 16,778,631 117 17,500,125 95 18,181,532 Community & Technical College Academic Support 1 50,000 Institutional Support 1 2,744 1 112,000 1 30,000 Instruction 4 263,442 1 140,000 Public Service 2 88,999 1 9,900 1 45,500 Student Services 1 877
Total 7 355,185 2 121,900 3 80,877 1 140,000 1 45,500

96
Finance, etc. - 2020 Fact Book
FY2016 FY2017 FY2018 FY2019 FY2020 N $ N $ N $ N $ N $
Consortium Library Public Service 3 438,996 5 597,453 3 6,122,102 1 5,661,381 Research 1 37,174 2 689,906
Total 3 438,996 6 634,627 5 6,812,008 1 5,661,381
VCAS Operations Institutional Support 1 15,000 1 250,000 2 2,971,475 Public Service 1 232,822 Research 1 514,305
Total 1 15,000 1 250,000 1 514,305 3 3,204,297
Chancellor Operation Public Service 23 2,551,964 16 2,201,326 26 4,363,559 28 8,850,051 15 3,620,713 Research 7 831,000 22 7,911,734 17 4,052,116 15 4,807,575 9 942,328
Total 30 3,382,964 38 10,113,060 43 8,415,675 43 13,657,626 24 4,563,041
Provost Operations Academic Support 1 60,000 1 474,908 Institutional Support 1 20,691 1 707 1 10,000 2 3,236,099 Instruction 5 2,340,200 6 5,247,430 4 890,000 8 8,382,002 4 524,083 Public Service 11 1,870,200 13 1,605,091 15 1,273,500 18 1,414,213 8 652,000 Research 4 3,538,481 2 59,391 5 2,255,994 3 196,295 3 227,170 Scholarship/Fellowship 6 1,060,000 4 703,000 3 44,000 5 667,000 1 5,000
Total 28 8,889,572 26 7,615,619 28 4,473,494 35 11,134,418 18 4,644,352
Senior Vice Provost Public Service 1 1,980
Student Aff airs Institutional Support 2 67,783 Public Service 1 65,994 1 28,500 Student Services 3 4,306,533 4 3,900,050 1 67,034
Total 3 4,306,533 7 4,033,827 1 67,034 1 28,500
University Advancement Institutional Support 3 242,641
Grant Proposal Submissions by UAA Units and Functional CategoriesFiscal Years 2016-2020
Table 5.11

97
2020 Fact Book - Finance, etc.
FY2016 FY2017 FY2018 FY2019 FY2020 N $ N $ N $ N $ N $
Kenai Peninsula College Institutional Support 1 10,000 Instruction 3 957,248 4 1,162,110 1 163,253 3 1,247,772 2 847,424 Public Service 3 14,000 1 2,034 1 5,000 2 9,000 1 183,743 Student Services 1 779,958
Total 7 981,248 6 1,944,102 2 168,253 5 1,256,772 3 1,031,167
Kodiak College Institutional Support 1 9,614 Instruction 2 291,287 1 97,557 2 446,581 1 98,804 Student Services 1 10,000
Total 3 300,901 1 97,557 3 456,581 1 98,804
Matanuska-Susitna College Instruction 1 77,294 Student Services 2 196,972
Total 2 196,972 1 77,294
Prince William Sound College Academic Support 2 19,775 Institutional Support 4 71,517 1 64,195 Instruction 2 90,169 3 8,431,577 9 2,873,036 5 577,131 5 310,402 Public Service 3 49,225 1 15,533 Research 1 984,142 1 998,000 Student Services 1 17,000 2 80,000 2 89,694
Total 12 247,686 7 8,591,305 10 3,857,178 8 1,664,825 5 310,402
UAA Total Academic Support 7 404,411 3 584,207 4 130,048 1 474,908 Institutional Support 17 380,116 11 1,080,114 9 1,147,135 11 660,621 6 6,345,129 Instruction 27 12,804,584 28 19,218,927 34 9,889,526 40 13,761,264 26 3,397,968 Public Service 104 10,710,588 107 11,203,088 108 24,008,711 118 25,006,773 85 16,828,199 Research 226 55,647,594 259 54,547,735 268 49,641,157 251 55,442,351 159 42,316,822 Scholarship/Fellowship 8 1,080,140 7 791,569 4 157,388 6 763,161 7 565,557 Student Services 9 7,295,096 8 4,802,008 5 88,377 3 131,694 2 1,911
Total 398 88,322,529 423 92,227,648 432 85,062,342 429 96,240,772 285 69,455,587
Grant Proposal Submissions by UAA Units and Functional CategoriesFiscal Years 2016-2020
Table 5.11
Source: UAA Offi ce of Sponsored Programs compiled by UAA Offi ce of Institutional Research.
Notes: 1. Signifi cant staffi ng changes may have led to potential data inconsistencies during FY20. 2. N = number of proposals submitted. 3. $ = amount requested of the proposals. 4. Proposals with a status of “Withdrawn” have been excluded.

98 Finance, etc. - 2020 Fact Book
Average Dollars Contributed per Alumni DonorUniversity of Alaska Anchorage
Table 5.12
Undergraduate # of Alumni % Total Dollars $ per Donor Minimum Maximum Fiscal Year Alumni Donors Alumni Donors Contributed (Ave. Gift Amount) Donation Donation
1997 - 98 13,633 28 0.2% $3,358 $120 $15 $501 1998 - 99 14,175 25 0.2% $5,887 $235 $10 $1,750 1999 - 00 15,000 38 0.3% $5,671 $149 $6 $2,100 2000 - 01 15,800 24 0.2% $4,048 $169 $25 $650 2001 - 02 17,375 24 0.1% $20,619 $859 $20 $2,250 2002 - 03 15,586 171 1.1% $43,701 $256 $5 $15,000 2003 - 04 16,080 541 3.4% $62,233 $115 $5 $5,000 2004 - 05 24,510 937 3.8% $178,672 $191 $2 $50,000 2005 - 06 27,854 671 2.4% $83,781 $125 $2 $6,000 2006 - 07 28,264 1,471 5.2% $220,529 $150 $1 $26,995 2007 - 08 30,789 1,864 6.1% $247,620 $133 $1 $8,666 2008 - 09 33,314 1,632 4.9% $202,138 $124 $1 $72,000 2009 - 10 35,839 2,132 5.9% $290,036 $136 $1 $32,323 2010 - 11 39,289 2,036 5.2% $272,889 $134 $1 $12,906 2011 - 12 41,211 2,042 5.0% $374,992 $184 $5 $50,960 2012 - 13 40,083 2,144 5.3% $356,601 $166 $1 $25,000 2013 - 14 45,524 1,815 4.0% $303,111 $167 $1 $12,630 2014 - 15 46,202 1,627 3.5% $394,072 $242 $1 $75,000 2015 - 16 42,603 1,627 3.8% $454,491 $279 $1 $75,000 2016 - 17 48,887 1,209 2.5% $321,664 $266 $1 $100,000 2017 - 18 54,941 1,182 2.2% $460,098 $389 $1 $71,045 2018 - 19 51,600 1,047 2.0% $259,802 $248 $1 $20,565 2019 - 20 45,864 790 1.7% $221,646 $281 $1 $25,253
Source: University Advancement Offi ce.
Notes: 1. Results do not include trusts and estates.2. Alumni undergraduate total refl ects people with current addresses.3. Alumni defi ned as individuals with conferred UAA degrees/certifi cates.4. In 2004, Advancement upgraded their historical database which accounts for the dramatic alumni increase.5. In 2014, Advancement researched lost alumni in database which accounts for the alumni increase.6. In FY16, alumni with bad addresses and no solicit requests reduced total alumni count.

99
2020 Fact Book - Finance, etc.
Donations by Amount and Donor TypeUniversity of Alaska Anchorage
Table 5.13
FY2017-18 FY2018-19 FY2019-20 FY19-FY20 Donors Total $ Avg $ Donors Total $ Avg $ Donors Total $ Avg $ Avg $ % Change
$1 - $25 Individual 306 6,603 22 403 6,040 15 200 4,235 21 41.3%
Group 3 50 17 4 70 18 4 77 19 10.0% Total 309 6,653 22 407 6,110 15 204 4,312 21 40.8%$26 - $50
Individual 443 21,048 48 450 21,232 47 269 12,770 47 0.6% Group 13 633 49 8 370 46 3 150 50 8.1% Total 456 21,681 48 458 21,602 47 272 12,920 47 0.7%$51 - $100
Individual 504 47,973 95 493 45,859 93 376 35,596 95 1.8% Group 31 2,904 94 23 2,244 98 15 1,441 96 -1.6% Total 535 50,876 95 516 48,103 93 391 37,037 95 1.6%$101 - $500
Individual 467 130,749 280 548 146,382 267 358 102,808 287 7.5% Group 63 21,169 336 76 25,153 331 43 13,527 315 -5.0% Total 530 151,917 287 624 171,535 275 401 116,335 290 5.5%$501 - $1,000
Individual 105 96,368 918 97 86,795 895 81 73,627 909 1.6% Group 19 16,495 868 37 33,497 905 23 20,429 888 -1.9% Total 124 112,863 910 134 120,292 898 104 94,056 904 0.7%$1,001 - $10,000
Individual 105 310,770 2,960 108 335,251 3,104 79 225,620 2,856 -8.0% Group 60 207,251 3,454 52 189,737 3,649 64 256,941 4,015 10.0% Total 165 518,021 3,140 160 524,988 3,281 143 482,562 3,375 2.8%$10,001 - $50,000
Individual 8 163,653 20,457 13 276,392 21,261 7 145,552 20,793 -2.2% Group 28 728,519 26,019 29 685,576 23,641 24 636,624 26,526 12.2% Total 36 892,172 24,783 42 961,968 22,904 31 782,175 25,231 10.2%$50,001 - $100,000
Individual 4 283,345 70,836 Group 6 382,139 63,690 7 445,448 63,635 2 159,564 79,782 25.4% Total 10 665,484 66,548 7 445,448 63,635 2 159,564 79,782 25.4%$100,001 - $500,000
Individual 1 108,000 108,000 Group 8 1,537,568 192,196 6 1,432,195 238,699 7 1,296,189 185,170 -22.4% Total 8 1,537,568 192,196 6 1,432,195 238,699 8 1,404,189 175,524 -26.5%$500,001+ Group 1 1,760,000 1,760,000 2 6,625,647 3,312,824 1 1,770,200 1,770,200 -46.6%
Total UAA Individual 1,942 1,060,508 546 2,112 917,952 435 1,371 708,208 517 18.8%
Group 232 4,656,727 20,072 244 9,439,937 38,688 186 4,155,141 22,339 -42.3% Total 2,174 5,717,236 2,630 2,356 10,357,889 4,396 1,557 4,863,348 3,124 -29.0%
Source: University Advancement Offi ce.
Notes: 1. Donors are unduplicated. 2. Total $ = contributions made by the donors. 3. Individuals or groups who contributed multiple times within a fi scal year are reported only once in a donor range based on their total amount of donation.

100
Finance, etc. - 2020 Fact Book
UAA Tuition Rate HistoryFiscal Years 2017-2021
Table 5.14
Anchorage Campus, Kenai Peninsula College, and Matanuska-Susitna College* Resident Undergraduate Lower Division Courses 192 202 212 223 234 21.9% 4.9% Upper Division Courses 232 244 256 269 282 21.6% 4.8%
Graduate 444 466 489 513 513 15.5% 0.0%
Non-Resident Undergraduate Lower Division Courses 681 715 751 789 800 17.5% 1.4% Upper Division Courses 721 757 795 835 848 17.6% 1.6% Surcharge 489 513 539 566 566 15.7% 0.0%
Graduate 907 979 1028 1,079 1,079 19.0% 0.0% Surcharge 463 513 539 566 566 22.2% 0.0%
Kodiak College Resident Undergraduate Lower Division Courses 169 185 204 223 234 38.5% 4.9%
Prince William Sound College Resident Undergraduate Lower Division Courses 168 185 204 223 234 39.3% 4.9%
Source: Institutions’ websites.
* Anchorage Campus, Kenai Peninsula College, and Matanuska-Susitna College share the same lower division course tuition rates.
(in $ per credit) % Change FY2017 FY2018 FY2019 FY2020 FY2021 FY17-FY21 FY20-FY21

Defi
nitio
n of
Ter
ms

102
Defi nition of Terms Defi nition of Terms - 2020 Fact Book- 2020 Fact Book
Academic Rank: The rank held by persons having the title of professor, associate professor, and assistant professor; title denotes academic rank exclusively; the title of instructor may also be a title of academic rank at the discretion of the policies and procedures approved for each university.
Academic Year (AY): At UAA and UA, is a 3-term, 12-month period beginning with Summer opening and ending with Spring closing commonly identifi ed by reference to the calendar year in which it ends; e.g. AY 2019 (Also known as AY 18-19) includes Summer 2018, Fall 2018, and Spring 2019. (IPEDS, UA, and UAA IR)
Adjunct Faculty: Faculty with temporary assignments.
Adjusted Cohort: The result of removing any allowable exclusions from a cohort (or sub-cohort). For the Graduation Rates component, this is the cohort from which graduation and transfer-out rates are calculated; for the Fall Enrollment component, it is the cohort for calculating retention rate. Allowable exclusions are students who have died or were permanently disabled, left to serve in the armed forces, left to serve with a foreign aid service of the federal government (e.g. Peace Corp), or left to serve on offi cial church mission.
Admitted Student: Applicant who has been granted an offi cial off er to enroll in a postsecondary institution.
Applied Student: An individual who has fulfi lled the institution’s requirements to be considered for admission (including payment or waiving of the application fee, if any) and who has been notifi ed of one of the following actions: admission, non-admission, placement on waiting list, or application withdrawn by applicant or institution.
Assistant Professor: At UAA, an appointment criteria for persons who meet the minimum criteria for initial appointment to this rank as follows: Tripartite Academic = Terminal degree in the discipline or appropriate fi eld and evidence of a potential for successful teaching, service, and research/creative activity; Bipartite Academic = Master’s degree in the discipline or appropriate fi eld and two years documented successful teaching and service; and Bipartite Vocational Education = Bachelor’s degree in the discipline or appropriate fi eld and two years documented successful teaching and/or related work experience beyond the apprentice level in an area directly related to the faculty appointment.
Associate Degree: An award conferred by the Alaska Board of Regents that signifi es successful completion of a defi ned program of study. Note: At UAA, all associate degrees require a minimum of 60 semester hours but no more than 75 semester hours.
Associate Professor: At UAA, criteria for persons who meet the minimum criteria for initial appointment to this rank are as follows: Tripartite Academic = Terminal degree in the discipline or appropriate fi eld and fi ve years successful performance at the rank of assistant professor, including evidence of accomplishment in the area of research/creative activity; Bipartite Academic = Master’s degree in the discipline or appropriate fi eld and eight years successful teaching and service in an appropriate institution of higher education and evidence of professional development in the area of teaching or pedagogically related activities or creativity; and Bipartite Vocational Education = Master’s degree in the discipline or appropriate fi eld and three years documented successful teaching or Bachelor’s degree plus 30 semester hours of systematic study in a closely related discipline.
Auxiliary Enterprises Expenditures: Expenditures for self-supporting operations of the institution that exist to furnish a service to students, faculty, or staff , and that charge a fee that is directly related to, although not necessarily equal to, the cost of the service. Examples include residence halls, food services, student health services, intercollegiate athletics (if self-supporting), college stores, parking.
Auxiliary Services Revenue: Revenues generated by or collected from the auxiliary enterprise operations of the institution that exist to furnish a service to students, faculty, or staff , and that charge a fee that is directly related to, although not necessarily equal to, the cost of the service. Auxiliary enterprises are managed as essentially self-supporting activities.
Baccalaureate Degree: An award conferred by the Alaska Board of Regents that signifi es successful completion of a defi ned program of study that consists of both lower- and upper-division coursework. Traditionally known as a four-year degree. At UAA, all Baccalaureate degrees require a minimum of 120 to 132 semester credits.
Budget: An estimate, often itemized, of expected income and expense for a given period in the future.
Calendar Year: A 12-month time period commencing January 1 and ending December 31.

103
2020 Fact Book -2020 Fact Book - Defi nition of Terms Defi nition of Terms
Campus: A location of an institution that is geographically apart; and is permanent in nature; off ers at least 50% of the courses of an educational program leading to a degree, certifi cate, or other educational credential; has its own faculty and administrative organization; and has its own budgetary and hiring authority. Examples: Anchorage, Mat-Su, Kenai Peninsula, Kodiak, and Prince William Sound.
Certifi cation: A process by which an agency or association grants recognition to an individual who has met certain predetermined qualifi cations specifi ed by that agency or association.
Capital Improvement Program (CIP) Receipts: CIP receipts are generated by chargeback to capital improvement projects to support CIP personnel service administrative costs.
Class Standing: Class standing is an administrative classifi cation and does not necessarily refl ect progress toward completion of a degree. Class standing is based on total credits earned and is used for determining priority registration. (UAA catalog)
Clerical and Secretarial: A primary function or occupational activity category used to classify persons whose assignments typically are associated with clerical activities or are specifi cally of a secretarial nature. Includes personnel who are responsible for internal and external communications, recording and retrieving of data (other than computer programmer) and/or information and other paperwork required in an offi ce. (IPEDS)
Cohort: A specifi c group of students established for tracking purposes. (IPEDS)
College: An aggregation of two or more academic departments into a major academic organizational unit. Its primary purposes are to provide governance, resource management and planning support for carrying out instruction, research and public service functions, and off ering programs. A college is typically supervised by a dean who exercises authority and responsibility over all permanent and temporary faculty and staff assigned to departments under the college’s jurisdiction. At UAA, there are fi ve academic colleges. (UAA, UAA IR)
Community Campus: A location of an institution that is geographically apart and independent of the main campus and (1) is permanent in nature; (2) off ers at least 50% of the courses of an educational program leading to a degree, certifi cate, or other educational credential; (3) has its own faculty and administrative organization; and (4) has its own budgetary and hiring authority. Within UAA, a community campus is supervised by a Director with emphasis on administrative and academic functions although also has responsibility for site and facilities. At UAA, campuses also off er programs of study leading to certifi cates and associate degrees. (UAA, UAA IR)
Course: A defi ned subset of instructional activity in which students enroll to acquire knowledge and/or complete graduation requirements. Each course is identifi ed by a unique combination of two fi elds: Discipline (or its course prefi x equivalent) and course number (an indicator of subject matter level). (UAA IR)
Course Level: The course number indicates the course level. Developmental courses are typically numbered 050 to 099, lower division courses are numbered 100 to 299, upper division courses are numbered 300 to 499, professional courses are numbered 500 to 599, and graduate courses are numbered 600 and above.
Credit Hour: A unit of measure representing an equivalent of an hour (50 minutes) of instruction per week over the entire term. It is applied toward the total number of credit hours needed for completing the requirements of a degree, diploma, certifi cate or other formal award. (IPEDS)
Degree: An award conferred by the Alaska Board of Regents as offi cial recognition for the successful completion of a program of study.
Degree Seeking: At UAA, a student declares a degree-seeking intent by applying for and meeting university admission requirements to a degree or certifi cate program. They may apply for admission as undeclared majors and still be considered as degree seeking.
Department: A university-defi ned administrative organizational unit that organizes resources for creation and dissemination of knowledge within associated disciplines. Academic departments are responsible for creating, off ering, and evaluating courses, and providing instructional and research support to faculty who work in the disciplines.
Developmental Course: Course that provides basic or supplemental preparation for introductory college courses. This type of course is not applicable to certifi cate, associate, baccalaureate or graduate degrees, even by petition. Courses are numbered from 050 to 099.

104
Defi nition of Terms Defi nition of Terms - 2020 Fact Book- 2020 Fact Book
Discipline: A defi ned subset of knowledge and inquiry within the universe of knowledge as classifi ed by the National Classifi cation of Instructional Program (CIP). (UAA IR)
Doctoral Degree: The highest award a student can earn for graduate study. The Doctoral degree includes such degrees as Doctor of Education and the Doctor of Philosophy in many fi elds of study. (IPEDS)
Enrollment: A duplicate count of students enrolled (“seats occupied”) in all course section off erings (credit or non-credit) on the offi cial census date of each term. The same student is counted in each section of offi cial enrollment; e.g. a student enrolled in 3 class sections is counted as 3 enrollees. (UAA IR)
Executive, Administrative, and Managerial: Professional staff whose assignments require primary (and major) responsibility for management of the institution or a customarily recognized department or subdivision thereof. Assignments require the performance of work directly related to management policies or general business operations of the institution. It is assumed that assignments in this category customarily and regularly require the incumbent to exercise discretion and independent judgment and to direct the work of others. (IPEDS)
Extended Site: A site or center outside the confi nes of the parent institution where courses are off ered that are part of an organized program at the parent institution. The site is not considered to be temporary, but may be rented or made available to the institution at no cost by another institution or an organization, agency, or fi rm. Traditionally, a physical site located away from the main campus, e.g., Chugiak/Eagle River, military education centers, etc. where students gather to receive instruction from university-affi liated faculty. (UAA, IPEDS)
Faculty Workload: Permanent and term faculty are awarded a workload with fi ve (5) part assignments. Tripartite faculty assignments are generally three parts instructional (0.6 FTE), one part research (0.2 FTE), and one part service (0.2 FTE). Bipartitie assignments are four parts instructional (0.8 FTE) and one part service (0.2 FTE).
Federal Receipts: All revenue received from the federal government. These include restricted federal grants from such agencies as the National Science Foundation, Department of Health and Human Services, National Institutes of Health, and other federal agencies, as well as additional federal funding for student fi nancial aid and work-study programs.
Financial Aid: Federal Work Study, grants, loans to students (government and/or private), assistantships, scholarships, fellowships, tuition waivers, tuition discounts, employer aid (tuition reimbursement) and other monies provided to students to meet expenses (excluding gifts and loans from parents/relatives/friends).
First-Time Freshman: A degree-seeking student who enrolls in an institution with no prior postsecondary experience. Includes students enrolled in academic or occupational programs. Also includes students enrolled in the fall term who attended college for the fi rst time in the prior summer term, or students who entered with advanced standing (college credits earned before graduation from high school), or Middle College School. (UAA IR)
Fiscal Year (FY): A 12-month period for maintaining fi nancial records. Generally, the State of Alaska FY begins on July 1 and ends the following June 30. The federal fi scal year starts October 1 and ends September 30. (UAA IR)
Freshman: Admitted, fi rst-time, continuing or returning fi rst-year undergraduate student who has successfully completed, either at this university or approved credit from another college/university, a total of 29 credit hours or less. Excludes audit credit. (UAA IR)
Full-Time Equivalent Students (FTES): A single value providing a meaningful combination of full-time and part-time students. The convention used for calculation is annual Student Credit Hours (SCH) divided by 30 or 24 credit hours for undergraduate and graduate students respectively. If FTES is calculated for a single semester, then the divisor used is 15 or 12 credit hours for undergraduate and graduate students respectively. An additional convention sometimes used by UAA IR is total full-time students plus one-third part-time students. (IPEDS) This calculation is used where SCH are not available.
Full-Time Student: An undergraduate student who is enrolled at UAA for 12 or more credits or a graduate student enrolled at UAA for 9 or more 600 level credits is classifi ed as full-time. Audited courses, credit-by-examination courses, continuing education units (CEUs) and professional development courses (500 level) are not included in the computation for full-time status.

105
2020 Fact Book -2020 Fact Book - Defi nition of Terms Defi nition of Terms
General Fund Appropriations: Legal authority to expend resources received by an institution through acts of a legislative body, except grants and contracts. These funds are for meeting current operating expenses and not for specifi c projects or programs. The most common example is a state’s general appropriation. For UAA, this is the State of Alaska’s appropriation to the university system.
Grade: A university-recognized symbol used to signify a student’s academic performance and/or document actions taken by the university relative to a student in a particular class section. See UAA catalog for specifi c grading information. (UAA IR)
Graduate Certifi cate: A graduate-level certifi cate program is a coherent sequence of related graduate courses between 12 to 19 credit hours. These programs are designed to provide graduate education past the baccalaureate level and/or to enhance the education of students who already have a master’s degree. (UAA Catalog)
Graduate Level Courses: Graduate-level courses require a background in the discipline and an ability to contribute to written and oral discourse on advanced topics in the fi eld at a level beyond that required by a bachelor’s degree. Graduate courses have course numbers of 600-699.
Graduate Student: A student who holds a baccalaureate degree and is admitted/accepted to a graduate program at UAA and enrolled in graduate level (600+) courses.
Graduation Rate: The percentage of fi rst-time, full-time undergraduate certifi cate- and degree-seeking students enrolled in a given fall semester who earn a degree within six years (150% of the time to complete a four-year degree) or three years (150% of the time to complete a two-year degree). This rate is required for disclosure and/or reporting purposes under the Student Right-To-Know Act and is defi ned by the U.S. Department of Education. (IPEDS)
Grants and Contracts: Revenues from governmental agencies and nongovernmental parties that are for specifi c research projects, other types of programs, or for general institutional operations (if not governmental appropriations). Examples include research programs, training programs, student fi nancial assistance, Pell Grants, etc. for which amounts are received or expenses are reimbursable under the terms of a grant or contract. (IPEDS)
Headcount: An unduplicated count of unique individuals (in total or in a cohort) who are enrolled at UAA in credit courses on the offi cial semester/term census date. The unduplicated count can be for a single semester or an academic year.
Institutional Support: A functional expense category that includes expenses for the day-to-day operational support of the institution. Includes expenses for general administrative services, central executive-level activities concerned with management and long range planning, legal and fi scal operations, space management, employee personnel and records, logistical services such as purchasing and printing, and public relations and development. Also includes information technology expenses related to institutional support activities. If an institution does not separately budget and expense information technology resources, the IT costs associated with student services and operation and maintenance of plant will also be applied to this function. (IPEDS)
Instructional Expenditure: A functional expenditure category that includes expenditures of the colleges, schools, departments, and other instructional divisions of the institution and expenditures for departmental research and public service that are not separately budgeted. Includes expenditures for both credit and non-credit activities.
Instructor: Initial appointment criteria for persons who meet the minimum criteria to this rank are as follows: Tripartite Academic = competence in the profession or discipline and ability to eff ectively communicate training and subject matter to others. Appointees will hold minimal credentials; Bipartite Academic = competence in the profession or discipline and ability to eff ectively communicate training and subject matter to others. Appointees will hold minimal credentials; Bipartite Vocational Education = competence in the profession or discipline and ability to eff ectively communicate training and subject matter to others. Appointees will hold credentials. (Faculty Services)
Junior: An admitted undergraduate student who has successfully completed, either at this university or approved credit from another college/university, a total of 60-89 credit hours. Excludes audit credit. (UAA IR)
Lower Division Course: This type of course is usually a foundation course which introduces a fi eld of knowledge or connects the foundation with advanced work in a given fi eld. Courses are typically numbered between 100 and 299. Lower division courses are usually taken by freshmen and sophomores.

106
Defi nition of Terms Defi nition of Terms - 2020 Fact Book- 2020 Fact Book
Major: A fi eld of knowledge and inquiry a student may pursue as a primary interest focus. Although non-admitted students may take coursework associated with a major, only admitted students may formally declare a major. (UAA, UAA IR)
Master’s Degree: An award conferred by the Alaska Board of Regents that signifi es successful completion of a program of study consisting of courses/experiences above the baccalaureate degree of at least 30 semester credits beyond the baccalaureate degree and at least 21 of those credits must be at the graduate course level. (UAA, UAA IR)
Minor: A fi eld of knowledge and inquiry a student may pursue as a secondary interest focus. Minors are usually not required elements in a program of study, no degrees are awarded in a minor, and it must be earned in conjunction with a baccalaureate. (UAA)
Non-Credit Course: Courses off ered as career development, adult basic education, continuing education or community interest instruction. Not applicable to any degree or certifi cate requirements (even by petition). They have no regular tuition but do have other special fees. These courses are number from 001 to 049.
Non-Degree Seeking (NDS): A student enrolled in courses for credit who is not recognized by the institution as seeking a degree or formal award. A student who has not formally declared intention of earning a degree from this university. A NDS student may be concurrently enrolled in high school, or be NDS at one campus and degree seeking at another. (IPEDS, UAA IR)
Occupational Endorsement Certifi cate (OEC): Certifi cate requiring 9 to 29 hours to complete. This certifi cate provides specialized knowledge and skills needed in specifi c employment sectors.
Opening/Closing Freeze: The offi cial dates set by the university state system each Fall, Spring and Summer terms when the university extracts (“freezes”) data elements from UA system source data fi les for use in preparing offi cial comparable management information for internal and external use. Opening/closing freeze dates vary by type of data fi le, e.g. student, fi nance, human resources. (UAA IR)
Origin at Entry: Origin at entry is the location of a student when fi rst enrolling at the university: city for students from Alaska, state for students from outside Alaska, and country for international students. (UA, UAA IR)
Part-Time Student: An undergraduate student with a term credit load of 1-11 semester credits or a graduate student with a term credit load of 1-8 semester credit hours of 600 level courses during a particular semester. (IPEDS, UAA IR)
Post-Baccalaureate Student: A student with a bachelor’s degree admitted to and enrolled in a post-baccalaureate certifi cate program.
Post-Baccalaureate Certifi cate: An award that requires completion of an organized program of study beyond the bachelor’s. It is designed for persons who have completed a baccalaureate degree, but does not meet the requirements of a master’s degree. (IPEDS)
Pre-Major: Assigned to students who have been accepted for general admission to the degree level of their desired program but have not yet been formally accepted to a specifi c program. Usually they remain in this status while completing program prerequisites and/or department-level admission processes. Pre-majors have class standing and may be eligible for fi nancial aid and international student visas. (UAA, UAA IR)
Professor: At UAA, an appointment criteria (an extraordinary event) for persons who meet the minimum criteria for initial appointment to this rank are as follows: Tripartite Academic and Bipartite Academic = May be appointed based on exemplary academic performance. Terminal degree in the discipline or appropriate fi eld and national or international reputation for excellence. Bipartite Vocational Education = May be appointed based on exemplary academic performance and Master’s degree in vocational education and six years outstanding documented teaching and/or professional experience beyond the apprentice level or a national or international reputation for excellence in the discipline. Promotion criteria are as follows: Tripartite Academic = Terminal degree in the discipline or appropriate fi eld and evidence of exemplary teaching, service and research/creative activity and fi ve years at the rank of associate professor, of which three must be at this university; Bipartite Academic = Terminal degree in the discipline or appropriate fi eld and evidence of exemplary teaching and service and fi ve years at the rank of associate professor of which three must be at this university. Note: Master’s degree shall be considered the terminal degree for former community college faculty who transferred to this university under 1987 BOR policy. (Faculty Services)

107
2020 Fact Book -2020 Fact Book - Defi nition of Terms Defi nition of Terms
Program: Requires three components: a discipline or major (e.g., Psychology, Mathematics, International Studies); a degree or certifi cate level (e.g. Associate, Bachelors, Masters); and degree type (e.g. Associate of Applied Science, Bachelor of Arts).
Race/Ethnicity: Categories developed by the U.S. Offi ce of Management and Budget (OMB) that are used to describe groups to which individuals belong, identify with, or belong in the eyes of the community. The designations are used to categorize U.S. citizens, resident aliens, and other eligible non-citizens. Individuals are asked to fi rst designate ethnicity as: Hispanic or Latino or Not Hispanic or Latino. Second, individuals are asked to indicate one or more races that apply among the following: American Indian or Alaska Native, Asian, Black or African American, Native Hawaiian/Pacifi c Islander, White. (IPEDS) Where an individual chooses more than one race and it includes Alaska Native, that individual is included in an Alaska Native Multirace at UAA.
Regular/Term Assignment: Individuals who are hired as permanent employees of the university and are eligible to receive salary and all benefi ts to perform their designated job duties. Term-funded employees can be regular employees. Their appointment is typically to an academic unit for an academic year. They are generally regarded as having a continuing appointment. (HRS)
Revenue: The infl ow of resources or other enhancement of net assets of an institution or settlements of its liabilities from delivering or producing goods, rendering services, or other activities that constitute the institution’s ongoing major or central operations. Includes revenues from fees and charges, auxiliary enterprises, and contributions and other non-exchange transactions. (IPEDS)
Semester: A calendar system that consists of two sessions called semesters during the academic year with about 15 weeks of instruction. (IPEDS)
Senior: An admitted undergraduate student who has successfully completed, either at this university or approved credit from another college/university, a total of 90+ credit hours. Excludes audit credit. (UAA IR)
Sophomore: An admitted undergraduate student who has successfully completed, either at this university or approved credit from another college/university, a total of 30-59 credit hours. Excludes audit credit. (UAA IR)
Student: Any person for whom the university maintains an educational record and meets one or more of the following criteria: (1) offi cially enrolled in a course (credit or non-credit) off ered under university authority, (2) is on an approved student exchange, internship, or other program of study. (UAA IR)
Student Assistant: Student who is employed by this university, predominantly through Work Study funds, to perform a variety of non-professional assignments in support of the university. (UAA IR)
Student Credit Hour (SCH): The total credit hours awarded to students during a given period. In fi xed credit courses, it is the sum of the product of course section credit times the course section enrollment.
Student Fee: Amounts charged to students for items or services not covered by tuition or course fees; e.g. Student Health Center fee, application fee. (UAA IR)
Student Services Expenditure: A functional expenditure category that includes expenditures for admissions, registrar activities, and activities whose primary purpose is to contribute to students’ emotional and physical well-being and to their intellectual, cultural, and social development outside the context of their formal instructional program; e.g. student activities, student newspaper, intramural athletics, student organizations and student records. (IPEDS)
Summer Session: A summer session is shorter than a regular semester. The institution may have two or more sessions occurring in the summer months.
Technical/Paraprofessional: A primary function or occupational activity category used to classify persons whose assignments require specialized knowledge or skills which may be acquired through experience, apprenticeship, on-the-job-training, or academic work in occupationally specifi c programs that result in a 2-year degree or other certifi cate or diploma. Includes persons who perform some of the duties of a professional in a supportive role, which usually requires less formal training and/or experience than normally required for professional status.

108
Defi nition of Terms Defi nition of Terms - 2020 Fact Book- 2020 Fact Book
Temporary Employee: Casual labor, adjunct faculty, and employees who do not work in a budgeted position.
Tenure: Status of a personnel position with respect to permanence of the position according to the terms of Alaska Regents Policy 04.04.040(B). Its purpose is to assure an environment that will nurture academic freedom by providing employment security. At UAA, qualitative criteria for tenure are determined by individual schools and colleges. Faculty with initial appointment to full professor are awarded tenure at the time of appointment. Initial appointments to associate professor may be made with/without tenure but the latter must be reviewed for tenure no later than the 4th consecutive year of service. All non-tenured assistant professor appointees must be reviewed for tenure no later than the 7th consecutive year of service. Tenure may be awarded to faculty holding the rank of instructor, and time in the rank of instructor shall count toward tenure. Faculty who are not awarded tenure by the end of their mandatory year of review shall be off ered a terminal appointment for one additional year of service. (BOR, IPEDS, Faculty Services)
Tenure Track: Faculty who are eligible to apply for tenure.
Tuition: The amount of money charged to students for instructional services. Tuition may be charged per semester or session, per course, or per credit and may vary.
UA Receipts: Private unrestricted gifts, grants, contracts, endowment revenue, sales and services of educational activities, vending machine revenue, rent, athletic ticket sales, etc. (UAA IR)
UA Scholar: A resident student attending an Alaska high school who is recruited by the UA system and off ered a scholarship for placing in the top ten percent of his/her graduating class, regardless of graduating class size, based on GPA at the end of their junior year. The number of UA Scholars in a reported term is defi ned as the sum of the following three internal classifi cation levels: (1) Paid UA Scholar - all enrolled students receiving a UA Scholar distribution in the reported term; (2) Non-Paid UA Scholar - paid in past term but not in reported term; and (3) Non-Paid Eligible Scholar - never paid but eligible in reported term. (UAA IR)
Undergraduate Certifi cate: A formal award certifying the satisfactory completion of a postsecondary education program as approved by the Alaska Board of Regents. Requires a minimum of 30 and a maximum of 60 semester credit hours.
Undergraduate Student: A student enrolled in a bachelor’s degree program, an associate’s degree program, or certifi cate program below the baccalaureate.
University of Alaska Anchorage (UAA): One of the post-secondary institutions of the University of Alaska statewide system of public higher education. It is accredited by the Northwest Commission on Colleges and Universities, which is recognized by the U.S. Department of Education.
Upper Division Course: Upper division courses require a background in the discipline recognized through course prerequisites, junior or senior standing, or competency based requirements. Course with numbers between 300 to 499. Upper division courses are usually taken by juniors and seniors.
Workforce Credentials: A non-credit credential (or certifi cation) that is aligned with national standards or with a recognized certifi cation/license or meets an industry-specifi c employment standard.

UA is an AA/EO employer and educational institution and prohibits illegal discrimination against any individual: www.alaska.edu/nondiscrimination