universal robina corporation and · pdf fileuniversal robina corporation and subsidiaries ......
TRANSCRIPT

SEC Number 9170____ File Number ____________
________________________________________________
UNIVERSAL ROBINA CORPORATION
AND SUBSIDIARIES _________________________________________________
(Company’s Full Name)
110 E. Rodriguez Avenue, Bagumbayan, Quezon City _________________________________________________
(Company’s Address)
671-2935; 635-0751; 671-3954 ______________________________________
(Telephone Number)
September 30 _______________________________________
(Fiscal Year Ending) (month & day)
FORM 17-Q _________________________________________
(Form Type)
____________________________________________
(Amendment Designation if applicable)
For the Three Months Ended December 31, 2005 ____________________________________________
(Period Ended Date)
__________________________________________________
(Secondary License Type and File Number)

TABLE OF CONTENTS
FORM 17-Q
Page No. 1
PART I – FINANCIAL INFORMATION
Management’s Discussion and Analysis of Financial Condition and Results of Operations
2
PART II – OTHER INFORMATION
Signatures
9
CONSOLIDATED FINANCIAL STATEMENTS
Consolidated Balance Sheets
10
Unaudited Consolidated Statements of Income
11
Unaudited Consolidated Statements of Changes in Stockholders’ Equity
12
Unaudited Consolidated Statements of Cash Flows
13
Notes to Unaudited Consolidated Financial Statements
15

SECURITIES AND EXCHANGE COMMISSION
SEC FORM 17-Q
QUARTERLY REPORT PURSUANT TO SECTION 17 OF THE SECURITIES
REGULATION CODE AND SRC RULE 17(2)(b) THEREUNDER 1. For the quarterly period ended December 31, 2005 2. Commission identification number 9170 3. BIR Tax Identification No. 000-400-016-000 4. Universal Robina Corporation Exact name of issuer as specified in its charter 5. Quezon City, Philippines Province, country or other jurisdiction of incorporation or organization 6. Industry Classification Code: __________ (SEC Use Only) 7. 110 E. Rodriguez Ave., Bagumbayan, Quezon City 1110 Address of issuer’s principal office Postal Code 8. 671-2935; 635-0751; 671-3954 Issuer’s telephone number, including area code
9. Not applicable Former name, former address and former fiscal year, if changed since last report 1. Securities registered pursuant to Sections 8 and 12 of the Code, or Sections 4 and 8
of the RSA
Title of Each Class
Common stock, P1.00
Par value
Number of Shares of
Common Stock Outstanding and
Amount of Debt Outstanding
1,686,479,549 shares
11. Are any or all of the securities listed on the Philippine Stock Exchange?
Yes [ / ] No [ ]

- 2 -
If yes, state the name of such Stock Exchange and the class/es of securities listed therein Philippine Stock Exchange Common stock 12. Indicate by check mark whether the registrant:
(a) has filed all reports required to be filed by Section 17 of the Code and SRC Rule
17 thereunder or Sections 11 of the RSA and RSA Rule 11(a)-1 thereunder, and Sections 26 and 141 of the Corporation Code of the Philippines, during the preceding twelve (12) months (or for such shorter period the registrant was required to file such reports)
Yes [ / ] No [ ]
(b) has been subject to such filing requirements for the past ninety (90) days. Yes [ / ] No [ ]
PART I - FINANCIAL INFORMATION Item 1. Financial Statements. The unaudited consolidated financial statements are filed as part of this Form 17-Q (pages 10 to 20). Item 2. Management's Discussion and Analysis of Financial Condition and Results of
Operations. Business Overview
URC is one of the largest branded food product companies in the Philippines and has a growing presence in other markets in Asia.
The branded consumer food group consists of three main divisions: snack foods, beverage and grocery products. Grocery included joint venture Hunt-URC and Nissin URC and Exports. The group distributes a diverse mix of salty snacks, chocolates, candies, biscuits, bakery products, beverages, noodles and tomato based products in the Philippines and other countries in Asia: URC has leading market shares in salty snacks, chocolates, candies and biscuits in the Philippines, as well as in some products produced in its other markets.
The agro- industrial group operates three divisions engaged in hog and poultry farming, the production and distribution of animal health products and the manufacture and distribution of animal feeds, glucose and soya bean products, respectively. URC is one of the biggest

- 3 -
players in hogs and poultry raising in the Philippines. URC supplies to both internal and commercial markets. The commodity food group engages in sugar milling and refining, flour milling and the manufacture and the marketing of pasta. The group supplies all the flour and sugar needs of the branded consumer foods group.
The following table summarizes the net sales for the three months ended December 31,2005 and December 31, 2004:
URC CONSOLIDATED SALES
(PhP millions) Q1 2006 Q1 2005
Branded Consumer Food Group
Domestic 4,538 3,851
International 2,106 1,719 6,644 5,570
Packaging 322 377
BCFG Total 6,966 5,947
Agro-Industrial Group 1,124 830
Commodity Food Group 1,063 747
URC Total 9,153 7,524
Recent Developments On December 19, 2005, the SEC issued a pre-effective order approving the registration statement of URC for its follow on offering of primary and secondary shares. The rationale for the offer is to unlock the value of URC stock (or share) by increasing its free float from 3.5% to approximately 40.7% and to widen its shareholder base. JG Summit, a selling shareholder will own 59.3% of URC after the offers. URC will get approximately P4.8 B from the primary proceeds which it will use to partly fund capital expenditures.
Results of Operations Three Months Ended December 31, 2005 versus December 31, 2004 Universal Robina Corporation (URC) posted a consolidated net sales and services of P=9.153 billion for the three months ended December 31, 2005, a 21.7% increase over the same period last year. The principal reasons for this increase were as follows:
• Net sales in URC’s branded consumer foods segment (excluding packaging) increased by P1.074 billion, or 19.3%, to P6.644 billion in the first quarter of fiscal 2006 from P5.570 billion recorded in the first quarter of fiscal 2005. This increase was primarily due to a 17.9% increase in net sales from URC’s domestic operations to P4.538 billion. The increase was driven by higher sales of snacks, beverage and grocery, on a 21% volume increase for the period. Beverage, accounting for 10% of BCFG sales, is still growing exponentially in sales and volume.

- 4 -
URC’s international operations also reported an increase of 22.5% to P2.106 billion due to sales increases from Vietnam, Thailand, Malaysia and China. In particular, China/HK grew sales 245% year on year on hefty 114% volume growth. URC international’s volume growth was 19% in the period.
• Net sales in URC’s agro-industrial segment amounted to P1.124 billion in the first
quarter of fiscal 2006, an increase of 35.4%. This was due primarily to a 58.5% increase in net sales of URC’s animal feeds business as a result of higher sales volume and 21.3% increase in net sales of the farm business, buoyed by higher hogs and poultry volumes. The agro-industrial group’s volumes increased by 54% for the first quarter of the fiscal year.
• Net sales in URC’s commodity foods segment increased by P316 million to
P1.063 billion in the first quarter of fiscal 2006. Flour and sugar net sales were reported at P688 million and P375 million, up by 9% and 221%, respectively. Increased net sales of both URC’s sugar and flour businesses were the results of higher sales volume of both flour and sugar and selling prices of sugar. Flour volumes increased by 15%, while sugar volumes without molasses and tolling grew 425.4% for the period.
• Net sales in URC’s packaging division for the first quarter of fiscal 2006 amounted
to P322 million, or 14.6% lower than P377 million reported in the same period last year as a result of a decrease in sales volume and selling prices.
URC’s cost of sales and services consist primarily of raw and packaging materials costs (53.6% of sales), manufacturing costs (18.1% of sales) and direct labor costs (3.7% of sales). Cost of sales and services increased by P1.265 billion, or 22.4%, to P6.901 billion in the first quarter of fiscal 2006 from P5.636 billion recorded in the first quarter of fiscal 2005. This cost increase was due to higher sales and generally higher costs for many major raw materials such as coffee, wheat and potatoes and packaging materials. Major raw materials for animal feeds such as soya and for BOPP films such as resin also increased. The increased cost of raw materials reflected the general increase in many commodity prices during this period while the increased cost of packaging materials reflected the increased price of many oil-based products during this period. URC’s gross profit increased by P364 million, or 19.3%, to P2.252 billion in the first quarter of fiscal 2006 from P1.888 billion recorded in the same period last year. URC’s gross profit as a percentage of net sales was slightly down to 24.6% in the first quarter of fiscal 2006 from 25.1% last year. URC’s operating expenses consist primarily of salaries, wages and other staff costs (3.1% to sales), advertising and promotion costs (6.3% to sales), freight and other selling expenses (3.2% to sales), depreciation (0.5% to sales), repairs and maintenance expenses (0.2% to sales) and other administrative expenses (3.7% to sales). Operating expenses increased P279 million, or 22.0%, to P1.546 billion in the first quarter of fiscal 2006 from P1.267 billion recorded in the same period last year. This increase resulted primarily from an increase in freight and other selling expenses due to higher volume of exports and increased freight rate charges associated with higher fuel prices, increase in salaries, wages and other staff costs due to hiring of new employees in connection with domestic and international expansions, and higher advertising and promotion costs both from

- 5 -
domestic and international operations. Said increases were partially offset by a decrease in depreciation expense. Other income (charges) - net consists primarily of investment income, interest and other financing charges, equity in net earnings of associate companies, as well as other miscellaneous income and expenses. URC recorded other income of P192 million in the first quarter of fiscal 2006 compared to other charges of P76 million in the same period of fiscal 2005. The principal reasons for this shift from a net charge position to a net income position were an increase in investment income, equity in net earnings of unconsolidated associate companies, increase in value of temporary investments and other net income, offset by higher interest and finance charges. Net income increased by P159 million, or 28.8%, to P709 million in the first quarter of fiscal 2006 from P550 million in the same period last year as a result of the factors discussed above. The Company will continue to expand its regional operations and domestically firm up its leadership in its core categories and has again set an aggressive target this year to maintain its dominance in the Philippine market as well as in the ASEAN regional market. The Company is not aware of any material off-balance sheet transactions, arrangements, and obligations (including contingent obligations), and other relationship of the Company with unconsolidated entities or other persons created during the reporting period that would have a significant impact on the Company’s operations and/or financial condition.
Financial Position December 31, 2005 vs. September 30, 2005 The Company remains to be strong with a current ratio of 3.89:1 as of December 31, 2005. Financial debt to equity ratio of 0.98:1 for the period is within comfortable level. Book value per share increased to P=14.60 as at December 31, 2005 from P=14.30 as at September 30, 2005.
The Company’s fund requirements have been sourced through cash flow from operations and borrowings. URC’s EBITDA (earnings before interest, taxes, depreciation and amortization) amounted to P=1.962 billion for the three months ended December 31, 2005, 36.5% more than P=1.437 billion it had in the same period of last year. The net cash provided by operating activities for the three months ended December 31, 2005 was P1.904 billion. Net cash provided by investing activities for the period amounted to P95 million. While cash was used for acquisition of property and equipment, some temporary investments were sold. Net cash used in financing activities amounted to P1.869 billion, mainly for the payments of long-term debts. As of December 31, 2005, the Company is not aware of any events that will trigger direct or contingent financial obligation that is material to the Company, including any default or acceleration of an obligation.

- 6 -
Material Changes in Fiscal Year 2006 Financial Statements
(Increase/Decrease of 5% or more versus FY 2005) Income Statements Three months ended December 31, 2005 versus same period in Fiscal Year 2005. 21.7% increase in net sales and services Principally due to increase in net sales and services of all business units, with BCF business unit contributing 65.9% to the said increase. 22.4% increase in cost of sales and services Primarily due to higher sales volume and costs of major raw materials used particularly for the BCF, flour and feed products, and BOPP films of the packaging division, and cost of packaging materials used by BCF business unit. 22.0% increase in operating expenses This was accounted for by higher spending for advertising and promotions, freight charges and payroll cost. Extensive advertising and promotion activities by BCF business unit pushed up the expenses. Moreover, higher volume of sales, upward adjustment in freight rates and strong exports have increased freight charges. Higher payroll cost was due to expansion in both domestic and international operations. Increase in other income (charges) -net Due to higher equity share in net earnings of affiliates and increase in market value of bonds investments. Increase in provision for income tax Due to higher taxable income. Balance Sheets December 31, 2005 versus September 30, 2005 13.8% increase in cash and cash equivalents Due to higher money market placement. 20.4% increase in receivables – net Due to higher trade receivables as a result of increase in sales and accrued interest receivables on temporary investments. 5.6% increase in due from affiliated companies Due to advances to affiliates arising from the normal course of business. 21.5% decrease in other current assets Due to amortization of deferred off-milling cost of the sugar business. 11.8% increase in other assets Due to acquisition of trademark for China operations.

- 7 -
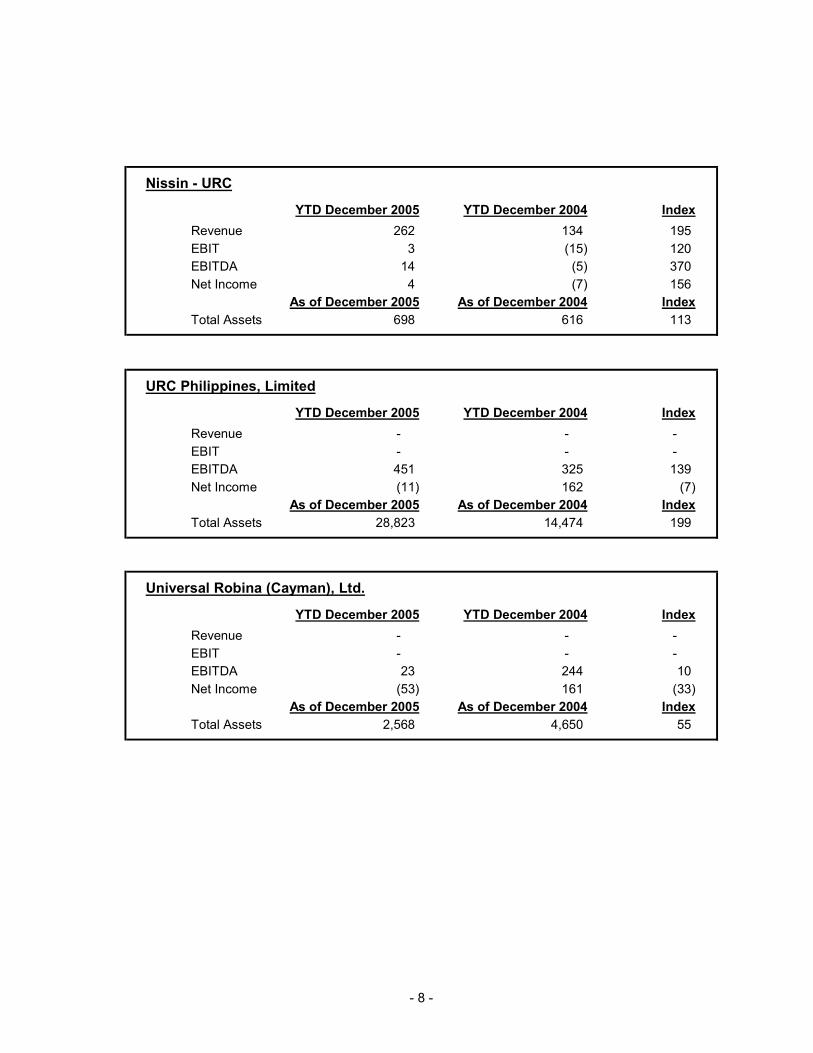
10.5% increase in loans payable Due to additional loan availments. 23.7% increase in accounts payable and accrued expenses Due to higher amount of interest payable on loans, income tax payable, accrual for advertising and promotion, advances from stockholders and trade payables. 14.7% increase in trust receipts and acceptances payable Due to availment of additional trust receipt facility from local banks to finance importations. 37.4% increase in due to affiliated companies Due to additional charges and advances from affiliates. 52.3% increase in deferred income tax liability Due to recognition of deferred tax liability on unrealized foreign exchange gain. 9.1% decrease in long-term debt Due to payment of debts amortizations. 17.7% decrease in cumulative translation adjustments Due to increase in value of Philippine Peso against foreign currencies. The Company’s key performance indicators are employed across all businesses. Comparisons are then made against internal target and previous period’s performance. The Company and its significant subsidiaries’ top five (5) key performance indicators are as follows: (in Million PhPs)
Universal Robina Corporation (Consolidated)
YTD December 2005 YTD December 2004 Index
Revenue 9,153 7,524 122
EBIT 706 621 114
EBITDA 1,962 1,437 136
Net Income 709 550 129
As of December 2005 As of December 2004 Index
Total Assets 54,553 45,177 121
URC INT'L
YTD December 2005 YTD December 2004 Index
Revenue 2,106 1,719 123
EBIT 54 (58) 193
EBITDA 295 3 9,809
Net Income 132 (129) 202
As of December 2005 As of December 2004 Index
Total Assets 8,860 8,320 106
- 8 -
Nissin - URC
YTD December 2005 YTD December 2004 Index
Revenue 262 134 195
EBIT 3 (15) 120
EBITDA 14 (5) 370
Net Income 4 (7) 156
As of December 2005 As of December 2004 Index
Total Assets 698 616 113
URC Philippines, Limited
YTD December 2005 YTD December 2004 Index
Revenue - - -
EBIT - - -
EBITDA 451 325 139
Net Income (11) 162 (7)
As of December 2005 As of December 2004 Index
Total Assets 28,823 14,474 199
Universal Robina (Cayman), Ltd.
YTD December 2005 YTD December 2004 Index
Revenue - - -
EBIT - - -
EBITDA 23 244 10
Net Income (53) 161 (33)
As of December 2005 As of December 2004 Index
Total Assets 2,568 4,650 55

- 10 -
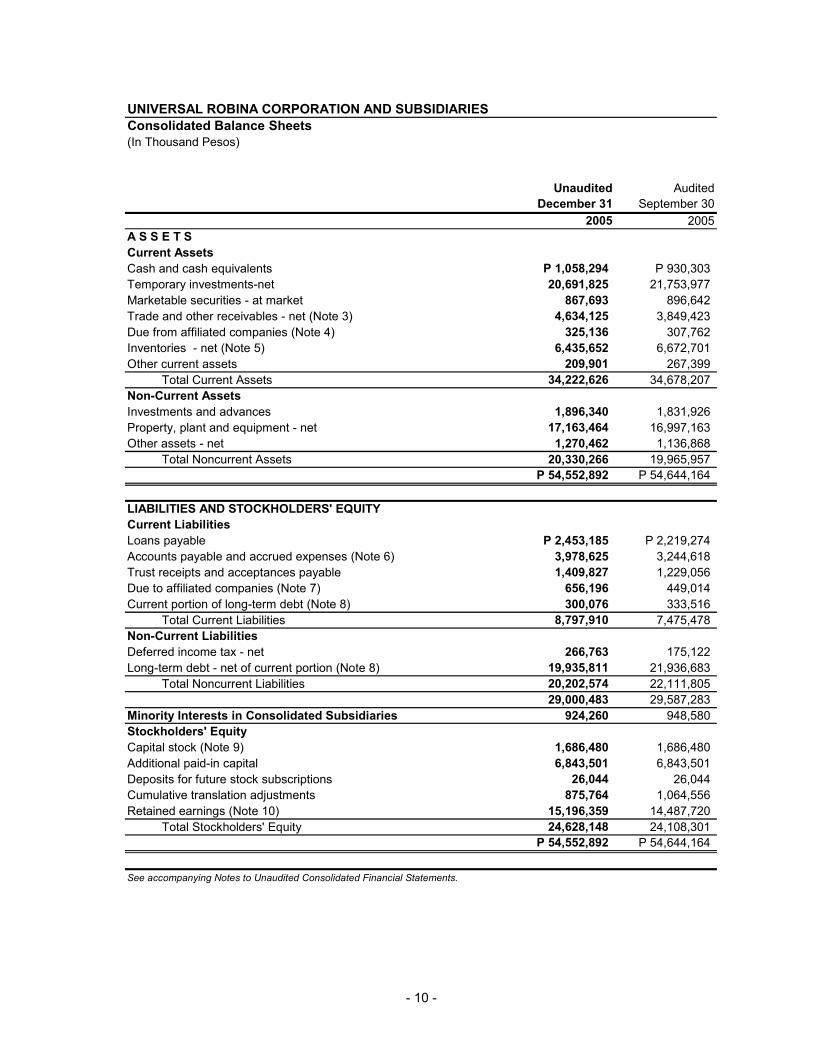
UNIVERSAL ROBINA CORPORATION AND SUBSIDIARIES
Consolidated Balance Sheets
(In Thousand Pesos)
Unaudited Audited
December 31 September 30
2005 2005
A S S E T S
Current Assets
Cash and cash equivalents P 1,058,294 P 930,303
Temporary investments-net 20,691,825 21,753,977
Marketable securities - at market 867,693 896,642
Trade and other receivables - net (Note 3) 4,634,125 3,849,423
Due from affiliated companies (Note 4) 325,136 307,762
Inventories - net (Note 5) 6,435,652 6,672,701
Other current assets 209,901 267,399
Total Current Assets 34,222,626 34,678,207
Non-Current Assets
Investments and advances 1,896,340 1,831,926
Property, plant and equipment - net 17,163,464 16,997,163
Other assets - net 1,270,462 1,136,868
Total Noncurrent Assets 20,330,266 19,965,957
P 54,552,892 P 54,644,164
LIABILITIES AND STOCKHOLDERS' EQUITY
Current Liabilities
Loans payable P 2,453,185 P 2,219,274
Accounts payable and accrued expenses (Note 6) 3,978,625 3,244,618
Trust receipts and acceptances payable 1,409,827 1,229,056
Due to affiliated companies (Note 7) 656,196 449,014
Current portion of long-term debt (Note 8) 300,076 333,516
Total Current Liabilities 8,797,910 7,475,478
Non-Current Liabilities
Deferred income tax - net 266,763 175,122
Long-term debt - net of current portion (Note 8) 19,935,811 21,936,683
Total Noncurrent Liabilities 20,202,574 22,111,805
29,000,483 29,587,283
Minority Interests in Consolidated Subsidiaries 924,260 948,580
Stockholders' Equity
Capital stock (Note 9) 1,686,480 1,686,480
Additional paid-in capital 6,843,501 6,843,501
Deposits for future stock subscriptions 26,044 26,044
Cumulative translation adjustments 875,764 1,064,556
Retained earnings (Note 10) 15,196,359 14,487,720
Total Stockholders' Equity 24,628,148 24,108,301
P 54,552,892 P 54,644,164
See accompanying Notes to Unaudited Consolidated Financial Statements.

- 11 -
UNIVERSAL ROBINA CORPORATION AND SUBSIDIARIES
Unaudited Consolidated Statements of Income
(In Thousand Pesos, Except Per Share Amounts)
2005 2004
NET SALES AND SERVICES P 9,153,252 P 7,523,740
COST OF SALES AND SERVICES 6,900,791 5,635,640
GROSS PROFIT 2,252,461 1,888,100
OPERATING EXPENSES (Note 1) 1,546,238 1,267,141
INCOME FROM OPERATIONS 706,223 620,959
OTHER INCOME (CHARGES) - NET 192,124 (75,923)
INCOME BEFORE INCOME TAX AND
MINORITY INTEREST 898,348 545,036
PROVISION FOR (BENEFIT FROM) INCOME TAX
Current 103,605 64,501
Deferred 55,964 (18,274)
159,569 46,227
INCOME BEFORE MINORITY INTERESTS
IN NET INCOME (LOSS) OF SUBSIDIARIES 738,778 498,809
MINORITY INTEREST IN NET INCOME (LOSS)
OF SUBSIDIARIES 30,138 (51,197)
NET INCOME P 708,640 P 550,006
Earnings Per Share (Note 11) P 0.42 P 0.33
See accompanying Notes to Unaudited Consolidated Financial Statements.
Three Months Ended
December 31

- 12 -
UNIVERSAL ROBINA CORPORATION AND SUBSIDIARIES
Unaudited Consolidated Statements of Changes in Stockholders' Equity
(In Thousand Pesos, except Number of Shares)
Three Months Ended December 31
2005 2004
CAPITAL STOCK - P1 par value (Note 9)
Preferred stock
Authorized - 2,000,000 shares
Issued - none
Common stock
Authorized - 2,998,000,000 shares
Issued - 1,686,479,549 shares
Balance at beginning of year P 1,686,480 P 1,686,480
Additional issuance - -
Balance at end of period 1,686,480 1,686,480
ADDITIONAL PAID-IN CAPITAL
Balance at beginning of year 6,843,501 6,843,501
Additional issuance - -
Balance at end of period 6,843,501 6,843,501
PAID-UP CAPITAL 8,529,981 8,529,981
DEPOSITS FOR FUTURE STOCK SUBSCRIPTIONS
Balance at beginning of year 26,044 26,044
Application of deposit - -
Balance at end of period 26,044 26,044
CUMULATIVE TRANSLATION ADJUSTMENTS
Balance at beginning of year 1,064,556 1,062,297
Adjustments (188,792) 82,040
Balance at end of period 875,764 1,144,337
RETAINED EARNINGS (Note 10)
Appropriated
Balance at beginning of year 3,000,000 3,000,000
Balance at end of period 3,000,000 3,000,000
Unappropriated
Balance at beginning of year
As previously reported 11,506,934 9,608,439
Effect of changes in accounting policies (19,216) (194,178)
As restated 11,487,718 9,414,261
Net income
As previously reported 708,640 542,881
Effect of changes in accounting policies - 7,125
708,640 550,006
Balance at end of period 12,196,358 9,964,267
15,196,358 12,964,267
P 24,628,148 P 22,851,682
See accompanying Notes to Unaudited Consolidated Financial Statements.

- 13 -
UNIVERSAL ROBINA CORPORATION AND SUBSIDIARIES
CONSOLIDATED STATEMENTS OF CASH FLOWS
(In Thousand Pesos)
Three Months Ended
December 31
2005 2004
CASH FLOWS FROM OPERATING ACTIVITIES
Income before income tax and minority interest P898,348 P545,036
Adjustments for:
Depreciation 491,192 462,370
Net unrealized foreign exchange loss 68,105 36,978
Investment income (600,521) (333,073)
Interest expense 602,390 378,705
Equity in net earnings of investees (86,464) (50,866)
Decline (recovery) in value of marketable securities 28,949 (15,534)
Increase in value of temporary investments (116,167) (59,176)
Loss on sale of property and equipment - 127
Operating income before changes in working capital 1,285,832 980,101
Decrease (increase) in:
Receivables (634,917) (140,860)
Inventories 237,049 (680,146)
Other current assets 57,498 33,972
Increase (decrease) in:
Accounts payable and accrued expenses 519,980 470,204
Trust receipts and acceptances payable 180,771 499,617
Due to affiliated companies 207,182 108,524
Cash generated from operations 1,853,394 1,271,412
Interest received 450,736 336,634
Income taxes paid (53,201) (52,796)
Interest paid (347,127) (316,348)
Net cash provided by operating activities 1,903,803 1,238,902
CASH FLOWS FROM INVESTING ACTIVITIES
Acquisiitons of property, plant and equipment (843,643) (1,008,975)
Proceeds from sale of property, plant and equipment - 208
Decrease (increase) in:
Temporary investments 1,178,319 (43,890)
Investments and advances 22,050 77,706
Due from affiliated companies (17,374) (22,157)
Other assets (189,558) (28,449)
Increase (decrease) in minority interest in consolidated subsidiaries (54,458) 15,085
Net cash provided by (used in) investing activities 95,337 (1,026,006)
(Forward)

- 14 -
Three Months EndedDecember 31
2005 2004
CASH FLOWS FROM FINANCING ACTIVITIES
Net Availments (payments) of:
Short-term borrowings 233,911 193,300
Long - term debt (2,102,417) (76,792)
Net cash provided by financing activities (1,868,506) 116,508
NET INCREASE IN CASH AND CASH EQUIVALENTS 130,633 329,404
EFFECT OF EXCHANGE RATE CHANGES ON
CASH AND CASH EQUIVALENTS (2,642) 2,017
CASH AND CASH EQUIVALENTS AT BEGINNING
OF YEAR 930,303 2,237,279
CASH AND CASH EQUIVALENTS AT END OF YEAR P1,058,295 P2,568,700
See accompanying Notes to Unaudited Consolidated Financial Statements.

- 15 -
UNIVERSAL ROBINA CORPORATION AND SUBSIDIARIES
Notes to Unaudited Consolidated Financial Statements (In Thousand Pesos, Except Per Share Amounts)
1. Basis of Preparation The unaudited consolidated financial statements of Universal Robina Corporation and Subsidiaries (the Group) have been prepared in accordance with accounting principles generally accepted in the Philippines (Philippine GAAP). These interim financial statements followed the same accounting policies and methods of computation by which the most recent annual audited financial statements have been prepared except for the following new accounting standards which have been adopted beginning October 1, 2005:
• PAS 21, The Effects of Changes in Foreign Exchange Rates, eliminates the capitalization of foreign exchange differentials related to the acquisition of property and equipment.
As of October 1, 2005, the undepreciated foreign exchange losses included in the property and equipment amounted to P179.9 million. The adoption of PAS 21 decreased the retained earnings as of October 1, 2005. As of October 1, 2004, the undepreciated foreign exchange losses included in the property and equipment amounted to P187.1 million. This decreased the retained earnings as of October 1, 2004.
• PFRS 3, Business Combinations, PAS 36, Impairment of Assets and PAS 38, Intangible
Assets Under PFRS, 3 the amortization of goodwill acquired in a business combination is prohibited. Instead, goodwill is to be tested annually, or more frequently, if events or changes in circumstances indicate that the asset might be impaired.
Goodwill amortization amounting to P167.8 million for the year ended September 30, 2005 which was previously charged to operations was added back to beginning retained earnings.
Adoption of the above new accounting standards involved changes in accounting policies and the Group has accordingly restated the comparative interim financial statements retroactively. Following is the reconciliation of the effects of these new and revised accounting standards on the stockholders’ equity and net income: Stockholders’ Equity
30-Sept-05
As previously reported 24,127,515 PAS 21 (187,052) PFRS 3/ PAS 36 / PAS 38 167,838 24,108,301
Net Income
31-Dec-04
As previously reported 542,881 PAS 21 7,125 550,006
The comparative figures in 2005 were restated to reflect the adjustments resulting from the adoption of PAS 21 and PFRS 3/ PAS 36 / PAS 38.

- 16 -
The following are the other new and revised accounting standards which became effective beginning January 1, 2005 which the Group will adopt on the Group’s financial statements for the year ending September 30, 2006: New Accounting Standards • PFRS 1, First Time Adoption of PFRS • PFRS 5, Noncurrent Assets Held for Sale and Discontinued Operations • PAS 19, Employee Benefits • PAS 32, Financial Instruments: Disclosure and Presentation • PAS 39, Financial Instruments: Recognition and Measurement • PAS 41, Agriculture
2. Principles of Consolidation The unaudited consolidated financial statements for the three (3) months ended December 31, 2005 and 2004 represent the consolidation of the financial statements of Universal Robina Corporation (the Parent Company) and the following subsidiaries directly and indirectly owned by the Parent Company:
Percentage of Ownership
Companies Direct Indirect CFC Corporation 100.0 - Universal Robina (Cayman), Ltd. 100.0 - Universal Robina Sugar Milling Corporation 100.0 - URC Philippines, Limited 100.0 - CFC Clubhouse, Inc. (formerly CFC Keebler, Inc.) 100.0 - CFC Clubhouse Property, Inc. (formerly CFC Keebler Property, Inc.) 100.0 - URC Confectionery Corp. 100.0 - URC International Company Limited 77.0 - Hongkong China Foods Co. Ltd. - 77.0 URC Asean Brands Co. Ltd. - 77.0 Nissin-Universal Robina Corporation 65.0 - Southern Negros Development Corporation - 94.0
The investments in associates include the 50% and 19% equity in Hunt-Universal Robina Corporation (HUR), and Robinsons Land Corporation (RLC), respectively. The financial information of these associates is summarized as follows:
RLC HUR
Unaudited December 31
2005 2004 2005 2004
Revenue P 1,655,221 P 1,262,766 P 181,096 P 152,271 Costs and Expenses 1,102,189 842,303 172,268 130,812 Income (Loss) from Operations 553,032 420,463 8,828 21,459 Net Income (Loss) P 438,510 P 302,069 P 6,557 P 15,382

- 17 -
3. Receivables - net This account consists of: Unaudited December 31, 2005
Up to Six
Months
Over Six
Months to
One Year Total
Audited September 30, 2005
Trade receivables – net P 2,744,542 P 229,945 P 2,974,487 P 2,344,290 Other receivables 866,926 792,712 1,659,638 1,505,133 P 3,611,468 P 1,022,657 P 4,634,125 P 3,849,423
4. Due from Affiliated Companies This account consists of: Unaudited
December 31,
2005
Audited September 30,
2005
Hongkong Peggy Foods P 58,031 P 58,031 Digital Telecommunications Philippines, Inc. 162,472 161,655 Hunt - Universal Robina Corporation 27,773 30,420 Cebu Air, Inc. 24,945 26,644 Others 51,915 31,012 P 325,136 P 307,762
5. Inventories This account consists of:
Unaudited
December 31,
2005
Audited September 30,
2005
Finished goods – net P 1,424,513 P 1,193,201 Goods in process 113,566 94,167 Poultry stock 79,197 69,099 Hog market stock and by-products 707,075 745,589 Raw materials 1,584,957 2,006,916 Containers and packaging materials 838,141 775,114 Spare parts and supplies 670,749 659,644 Materials in transit 1,017,453 1,128,971 P 6,435,652 P 6,672,701
6. Accounts Payable and Accrued Expenses This account consists of: Unaudited
December 31,
2005
Audited September 30,
2005
Accounts payable –trade P 1,921,473 P 1,510,800 Accrued advertising and promotion 638,156 482,512 Accrued interest expense 718,163 462,900 Advances from stockholders and officers 468,549 269,078 Utility, contract services, SSS and other accrued expenses 232,284 519,328 P 3,978,625 P 3,244,618
- 18 -
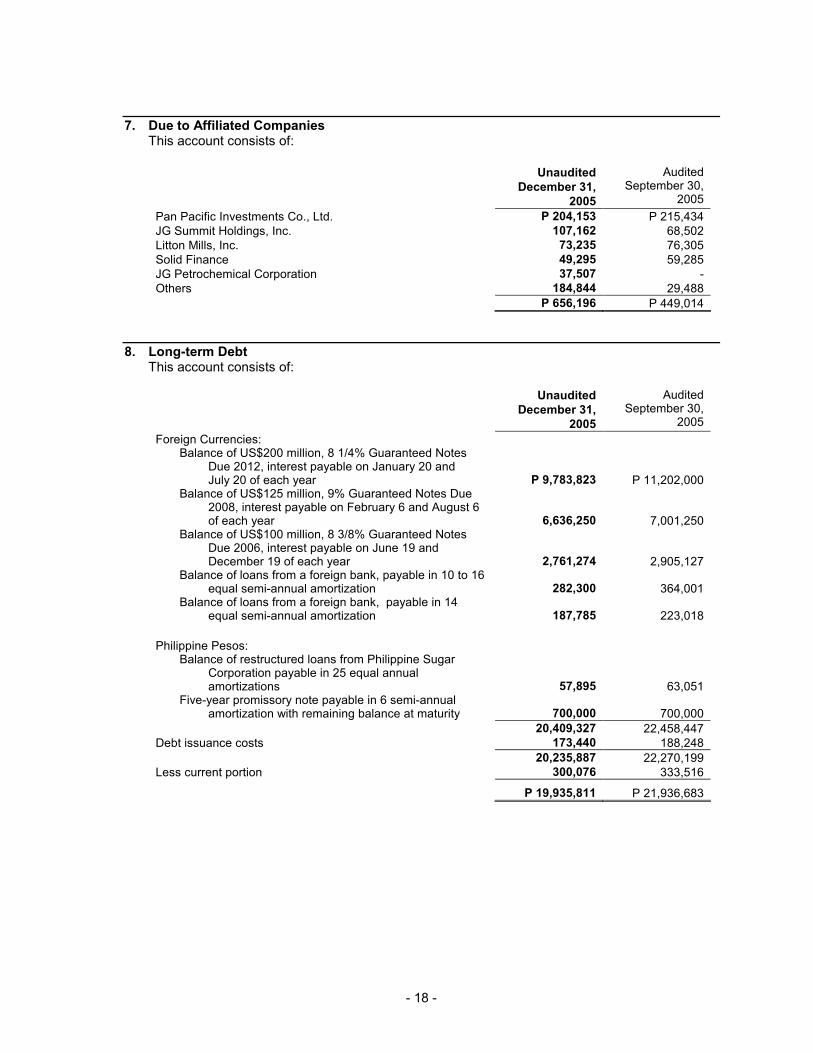
7. Due to Affiliated Companies This account consists of:
Unaudited
December 31,
2005
Audited September 30,
2005
Pan Pacific Investments Co., Ltd. P 204,153 P 215,434 JG Summit Holdings, Inc. 107,162 68,502 Litton Mills, Inc. 73,235 76,305 Solid Finance 49,295 59,285 JG Petrochemical Corporation 37,507 - Others 184,844 29,488
P 656,196 P 449,014
8. Long-term Debt This account consists of: Unaudited
December 31,
2005
Audited September 30,
2005
Foreign Currencies: Balance of US$200 million, 8 1/4% Guaranteed Notes
Due 2012, interest payable on January 20 and July 20 of each year P 9,783,823 P 11,202,000
Balance of US$125 million, 9% Guaranteed Notes Due 2008, interest payable on February 6 and August 6 of each year 6,636,250 7,001,250
Balance of US$100 million, 8 3/8% Guaranteed Notes Due 2006, interest payable on June 19 and December 19 of each year 2,761,274 2,905,127
Balance of loans from a foreign bank, payable in 10 to 16 equal semi-annual amortization 282,300 364,001
Balance of loans from a foreign bank, payable in 14 equal semi-annual amortization 187,785 223,018
Philippine Pesos: Balance of restructured loans from Philippine Sugar
Corporation payable in 25 equal annual amortizations 57,895 63,051
Five-year promissory note payable in 6 semi-annual amortization with remaining balance at maturity 700,000 700,000
20,409,327 22,458,447 Debt issuance costs 173,440 188,248
20,235,887 22,270,199 Less current portion 300,076 333,516
P 19,935,811 P 21,936,683

- 19 -
9. Capital Stock
Unaudited
December 31,
2005
Audited September 30,
2005
Preferred stock – P1 par value Authorized – 2,000,000 shares Issued – none
Common stock – P1 par value Authorized – 2,998,000,000 shares Issued - 1,686,479,549 shares P 1,686,480 P 1,686,480
The preferred stock is 12% cumulative, nonparticipating, nonvoting, and redeemable at par upon dissolution and liquidation of the Company. On October 7, 2005, the BOD approved the increase in the authorized capital stock from 2,000,000,000 divided into 1,998,000,000 common shares and 2,000,000 preferred shares both at 1 par value per share to 3,000,000,000 divided into 2,998,000,000 common shares and 2,000,000 preferred shares both at 1 par value per share. On a special meeting of the stockholders held on November 22, 2005, the stockholders also approved the above increase in the authorized capital stock and the 15% stock dividends to all stockholders of record as of January 14, 2006, which was subsequently approved by the SEC on December 16, 2005. On December 19, 2005, the SEC authorized the issuance of 252,971,932 common shares with 1 par value per share or P252,971,932 to cover the 15% stock dividends declared by the BOD and ratified by the stockholders.
10. Retained Earnings A portion of the unappropriated retained earnings representing the undistributed earnings of the investee companies is not available for dividend declaration until received in the form of dividends.
11. Earnings Per Share Earnings per share amounts were computed as follows:
Unaudited December 31 2005 2004
Net income P 708,640 P 550,006
Divide by the number of shares issued 1,686,480 1,686,480
P 0.42 P 0.33
12. Business Segment Information The industry segments where the Group operates are as follows:
a. Branded consumer food products - manufactures and distributes a diverse mix of snack
foods, instant coffee products, instant noodles, chocolates, soft and hard candies, biscuits, pasta, tomato-based products and ready-to-drink beverages. Its revenues are in their peak during the opening of classes in June and Christmas season.

- 20 -
b. Agro-industrial products - engages in hog and poultry farming, manufactures and distributes
animal feeds and soya products and manufactures and distributes animal health products. Its peak season is during summer.
c. Commodity food products - engages in sugar milling and refining, and flour milling. The peak
season for sugar is during its crop season, which normally starts in September and ends in May of the following year.
d. Packaging - engages in manufacture of polypropylene films for packaging companies. e. Corporate businesses - engages in bonds and securities investment and fund sourcing
activities. Financial information about the operations of these business segments is summarized as follows:
Revenue Total Assets Total Liabilities
Unaudited December 31
2005 2004 2005 2004 2005 2004
Branded Consumer Food Products P 6,644,644 P 5,570,180 P 19,866,812 P 18,319,463 P 5,729,603 P 4,316,976
Agro-Industrial
Products 1,123,868 829,778
3,267,530
2,732,506
1,035,726
722,193 Commodity Food
Products 1,062,729 746,548
4,439,254
4,288,090
2,103,763
2,154,108 Packaging 322,011 377,234
1,736,228
2,000,224
374,803
718,159
Corporate Businesses - -
25,243,068 17,837,171
19,756,588
13,356,799
P 9,153,252 P 7,523,740 P 54,552,892 P 45,177,454 P 29,000,483 P 21,268,235
13. Contingencies The Group has various contingent liabilities arising in the ordinary conduct of business which are either pending decision by the courts or are being contested, the outcome of which are not presently determinable. In the opinion of management and its legal counsel, the eventual liability under these claims, if any, will not have a material or adverse effect on the Group's financial position and results of operations. There were no significant changes in the contingent liabilities as of to date.
14. Subsequent Events There were no material events that occurred subsequent to December 31, 2005 that were not reflected in the financial statements for the period.