universities of leeds, sheffield and york...
TRANSCRIPT
promoting access to White Rose research papers
White Rose Research [email protected]
Universities of Leeds, Sheffield and Yorkhttp://eprints.whiterose.ac.uk/
This is an author produced version of a paper published in Journal of theEnergy Institute
White Rose Research Online URL for this paper:
http://eprints.whiterose.ac.uk/id/eprint/77991
Paper:Illingworth, J, Williams, PT and Rand, B (2013) Characterisation of biocharporosity from pyrolysis of biomass flax fibre. Journal of the Energy Institute, 86(2). 63 - 70. ISSN 1743-9671
http://dx.doi.org/10.1179/1743967112Z.00000000046

1
Characterisation of Biochar Porosity from the Pyrolysis of Biomass Flax Fibre
James Illingworth#, Paul T. Williams#* and Brian Rand+
Energy Research Institute# and Institute for Materials Research+,
University of Leeds, Leeds LS2 9JT, UK
Abstract
Low grade biomass fibre produced as a by-product from the flax industry was manufactured
into a non-woven fabric. This material was then pyrolysed in a fixed bed reactor to produce
biochar. The resulting biochars were characterised using a variety of techniques including gas
adsorption, scanning electron microscopy, pychnometry and elemental and proximate
analyses. The fibrous morphology of the precursor was retained during pyrolysis. The
temperature of pyrolysis had a significant influence on the biochar properties, with higher
temperatures causing an increase in surface area and density along with a decrease in
volatile/disorganised carbon. All of the biochars were microporous, with the majority in the
ultramicropore size range. Activated diffusion effects were observed during nitrogen
adsorption measurements at 77K. The experimental data show that the flax biochars exhibit
properties typical of biochars produced from other lignocellulosic precursors.
Key Words: Biomass; waste; pyrolysis; carbon
*Corresponding author; [email protected]
2
Introduction
Historically, the most common applications for biomass fibres such as flax were in the
production of yarns and rope, which were used for fishing, construction, clothing and
binding.1 Throughout the 20th Century however, the use of natural fibres has declined due to
the availability of a wide range of synthetic fibres produced from petrochemical precursors.2
However, more recently, concern over the extensive consumption of finite resources has
prompted greater interest in the use of renewable biomass materials. This is expected to
provide a positive stimulus to the natural fibre market, with respect to traditional end-uses
such as textile production, and also in the development of new technologies to replace
synthetic fibres in reinforced composites, packaging materials, thermal insulation, filters and
absorbents.2 Textile materials derived from natural biomass fibres can utilise less than 50%
by weight of such fibres in production, thereby producing a high proportion of waste.
A particular advantage of such fibrous textile waste is that the biomass material has a
fibrous characteristic enabling the fibres to be processed to produce a fabric non-woven
matting material. Because of the strength of the flax fibres, they can easily undergo the
entanglement, layering and needling which produces a non-woven matting product.
Biomass fibres are classified as lignocellulosic materials, consisting predominantly of
cellulose, hemi-cellulose and lignin. A wide variety of other lignocellulosic materials have
been pyrolysed to produce end-product char, oil or gas including various nutshells, wood, rice
straws and fruit stones.3-10 However, the morphology of biomass fibre potentially offers
significant advantages over other lignocellulosic materials.
Biochar is a recent term used to describe the chars produced from biomass but with
the particular end-use of a soil enhancer. Biochar also improves water quality and quantity

3
by increasing soil retention of nutrients and agrochemicals for plant and crop utilization.
More nutrients stay in the soil instead of leaching into groundwater and causing pollution.
The biochars for such applications tend to be fine grained and are added to soil to hold the
carbon from the original biomass in the soil and therefore act as a carbon sequestration
process. The processing of biomass waste into a non-woven fabric matting material which is
then pyrolysed to produce a carbonaceous biochar matting represents a novel form of biochar
for different potential applications.
This paper investigates the influence of pyrolysis temperature on the yield and
composition of the products of pyrolysis of non-woven flax fibre material. The yield of
biochar, liquid and gas in relation to temperature are reported and the detailed
characterization of the product biochars in terms of their structural characteristics, surface
area and porosity are described.
Materials and Methods
Flax Fibre Precursor Material
The precursor material consisted of low-grade flax fibre obtained from British Fibres
Limited, a company funded by the Engineering and Physical Sciences Research Council
(EPSRC) and the UK Ministry of Agriculture, Fisheries and Food (now the Department of
the Environment, Food and Rural Affairs). The characteristics of the raw fibre are reported in
Table 1. The ‘as-received’ raw fibre was then converted into a non-woven fabric (Figure 1)
involving a sequential process consisting of a dry laid carded method, needle punch bonding
and calender bonding. The process of dry laid carding involves the use of rotating cylinders

4
covered in wires or teeth that arrange the fibres into parallel arrays of up to 150 mm fibre
length and a thickness of 8 mm. The fibre material is then needle punched which involves
punching of barbed needles through the material, hooking tufts of fibre together, this process
bonds the fibres together and gives extra strength to the non-woven matting. The final
process step of calender bonding involves stabilisation of the non-woven matting via heat and
pressure where the fibres tend to fuse together producing a more stable structure. The final
product was a roll of biomass natural fibre matting from which samples were cut for the
pyrolysis experiments.
Thermogravimetric Analysis of Flax Fibre
Initial characterization of the flax fibre non-woven fabric material was investigation using a
thermogravimetric analyser to determine the weight loss characteristics of the sample in
relation to increasing temperature and hence the appropriate pyrolysis temperatures for the
subsequent pyrolysis experiments. The weight loss behaviour of the flax fibre was studied
using a Stanton-Redcroft thermogravimetric analyser (TG 760 series). Approximately 20mg
of sample was used for the analysis with a heating rate of 10oC min-1. The TGA furnace was
purged with an atmosphere of nitrogen throughout the analysis.
Pyrolysis of Flax Fibre
The non-woven fibrous material was pyrolysed in a vertical-tube fixed bed reactor, a
schematic diagram of which is shown in Figure 2. The tube was constructed of stainless steel
of 65 mm diameter and 200 mm length, and was heated by an electrical ring furnace. The
reactor was continuously purged with nitrogen at a metered flow rate of 300ml min-1. A
sample of 60g of biomass material was placed on a support in the centre of the hot-zone of
5
the reactor and was heated at a controlled rate of 2oC min-1 to the desired final temperature
with a hold time at each temperature of 60 minutes. The resulting biochar was then weighed
and stored under nitrogen prior to further analysis. The liquid fraction produced during the
pyrolysis experiments was collected in a series of dry-ice cooled condensers and the yield
determined gravimetrically. The yield of gaseous products was calculated by difference.
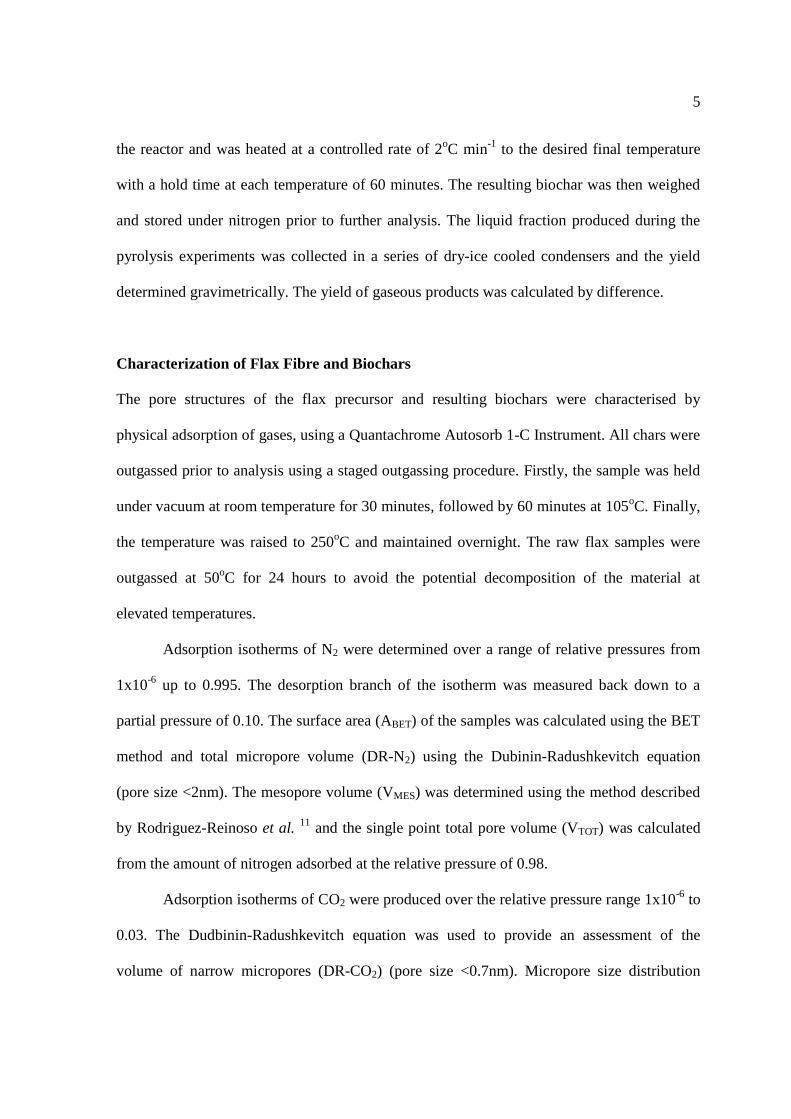
Characterization of Flax Fibre and Biochars
The pore structures of the flax precursor and resulting biochars were characterised by
physical adsorption of gases, using a Quantachrome Autosorb 1-C Instrument. All chars were
outgassed prior to analysis using a staged outgassing procedure. Firstly, the sample was held
under vacuum at room temperature for 30 minutes, followed by 60 minutes at 105oC. Finally,
the temperature was raised to 250oC and maintained overnight. The raw flax samples were
outgassed at 50oC for 24 hours to avoid the potential decomposition of the material at
elevated temperatures.
Adsorption isotherms of N2 were determined over a range of relative pressures from
1x10⁻⁶ up to 0.995. The desorption branch of the isotherm was measured back down to a
partial pressure of 0.10. The surface area (ABET) of the samples was calculated using the BET
method and total micropore volume (DR-N2) using the Dubinin-Radushkevitch equation
(pore size <2nm). The mesopore volume (VMES) was determined using the method described
by Rodriguez-Reinoso et al. 11 and the single point total pore volume (VTOT) was calculated
from the amount of nitrogen adsorbed at the relative pressure of 0.98.
Adsorption isotherms of CO2 were produced over the relative pressure range 1x10⁻⁶ to
0.03. The Dudbinin-Radushkevitch equation was used to provide an assessment of the
volume of narrow micropores (DR-CO2) (pore size <0.7nm). Micropore size distribution
6
plots were constructed using the Density Functional Theory (DFT) software supplied by
Quantachrome.
The moisture, ash and volatile matter content of the raw flax fibre and resulting
biochars was determined according to the solid fuel proximate analysis (BS1016 part 3) with
the result given as the mean of three determinations. A Carbolite nitrogen-purged moisture
oven and three Carbolite muffle furnaces were used for the analysis. The fixed carbon content
was determined by difference from the moisture, ash and volatile matter tests.
Elemental analysis (C, H, N, S, O) of the samples was carried out using an elemental
analyser (CE Instruments Flash EA 1112). Sample sizes were in the range 3-5mg. As for the
proximate analysis, the result was taken as the mean of three determinations.
The true density of the samples was determined by helium displacement
(Micromeritics Accupyc 1330) and the bulk and apparent densities by mercury intrusion
porosimetry (Micromeritics Poresizer 9320).
The surface morphology of the biochars was investigated using a LEO 1530 Field
Emission Gun, High Resolution SEM. The instrument was operated with a working distance
of 6 to 8mm and an accelerating voltage of 2 to 3kV using the in-lens detector. Specimens
were coated with a 3nm layer of platinum using an Agar High Resolution Sputter Coater and
stored in a dessicator prior to analysis.
The repeatability of the experimental and analytical procedures was verified by repeat
experiments of pyrolysis through to the characterisation of the resulting biochars. The
reproducibility of the work was found to be excellent. In addition, the accuracy of the
analytical techniques was determined using standard materials.

7
Results and Discussion
Thermogravimetric Analysis of Flax Fibre
The pyrolytic decomposition of the flax fibre in the thermogravimetric analyser began at
about 250oC and rapid weight loss was observed up to around 450oC. The mass of char at this
stage constituted around 29% of the original biomass. There was then a steady, more gradual
decline in mass up to the final temperature with a final char yield of just below 20% of the
original dry biomass. The carbonisation process is a complex reaction system involving the
elimination of volatile products and structural re-organisations within the remaining solid
phase. For cellulose 12 (the major constituent of natural fibres), the first stages involve the
elimination of physically held water at <300oC, with some re-arrangement of structure within
the cellulose. Later, structural water is evolved from hydrogen and hydroxyl groupings in the
cellulose lattice. Between 240 and 400oC, splitting of C-O and C-C bonds occurs with
production of tars, water, carbon monoxide and carbon dioxide. It is these reactions which
result in the rapid weight loss observed between 250 and 450oC for the flax fibre.
The weight loss behaviour of flax fibre during pyrolysis appears to be similar to other
lignocellulosic materials. Byrne and Nagle 13 pyrolysed red oak in a TGA and found the
majority of the weight loss had occurred prior to 450oC. Williams and Besler 14 pyrolysed
rice husks and found similar results, with the main weight loss complete by 500oC.
Pyrolysis Product Yield
As a consequence of the TGA data, final pyrolysis temperatures of 500, 650, 800 and 950oC
were used to investigate the influence of pyrolysis temperature on biochar characteristics.
Figure 3 shows the pyrolysis mass balance for the carbonisation of flax at different

8
temperatures. The product mass balances for the samples can be considered to be fairly
similar over the studied range of temperature. The liquid fraction was the largest product,
although similar in yield there was an indication of increasing liquid yield from 53.6 wt% at
500oC up to 55.6 wt% at 950oC. The liquid consisted of an oil and an aqueous phase. The
yield of gaseous products also increased slightly between 500 and 950oC. The trends
observed for the liquid and gaseous fractions have been observed in other studies of biomass
pyrolysis.4,14 Conversely, other workers have observed an initial increase in the liquid product
with temperature, followed by a decline as the temperature was further increased. Maschio et
al. 15 noted a decrease in oil yield above 400oC accompanied by a large increase in the
gaseous fraction, whereas Figuieredo et al. 16 observed similar results at temperatures in
excess of 500oC. Maschio et al. 15 suggested that the enrichment of the gaseous phase due to
the breakdown of larger molecules in the liquid fraction was responsible for this
phenomenon.
In contrast to the gas and liquid fractions, the biochar yield declined with increasing
temperature, with 25.1wt% at 500oC falling to 21.5wt% at 950oC. The biochar yields
observed from the fixed bed reactor are somewhat higher than those indicated by the TGA
analysis (~20 wt% after 1 hour), despite the inclusion of a hold period in the fixed bed
experiments. This is likely to be a feature of the lower heating rates used in the fixed bed
reactor as it is recognised that lower heating rates lead to an increase in the yield of char
during pyrolysis.12, 17-18 The reported char yield values are within the range reported by other
studies in the literature.4, 12, 15
Morphology of Flax and Flax Biochars
9
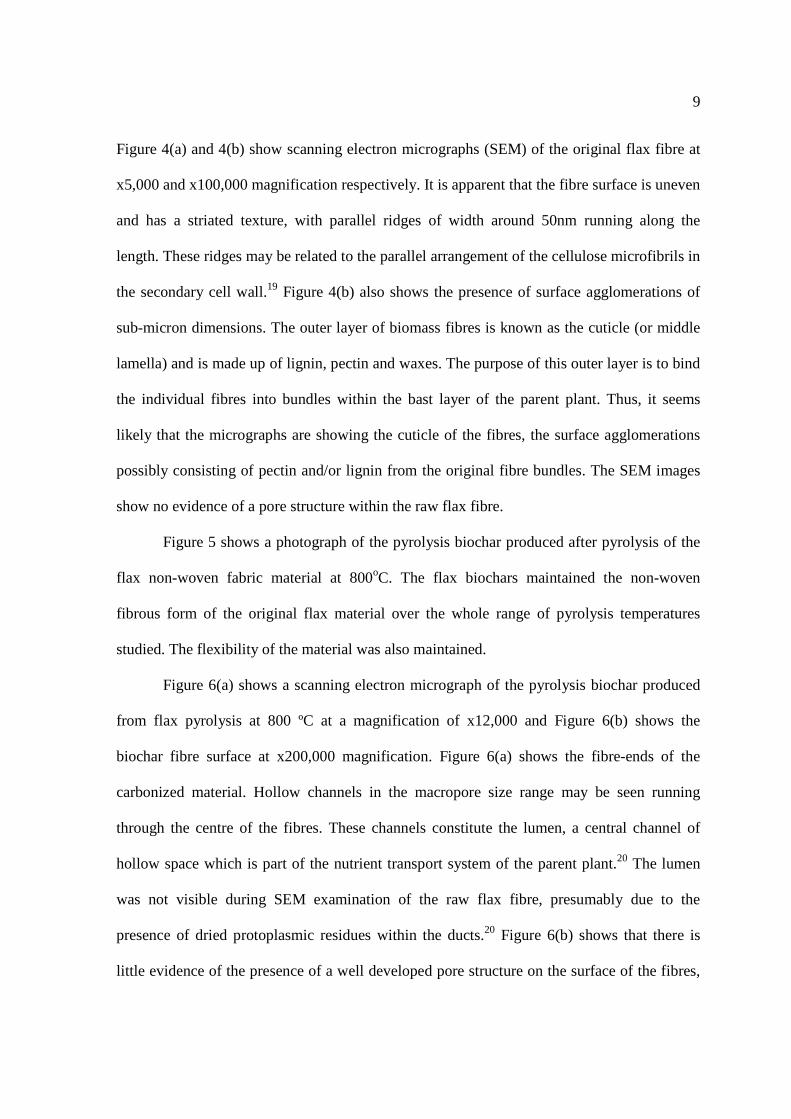
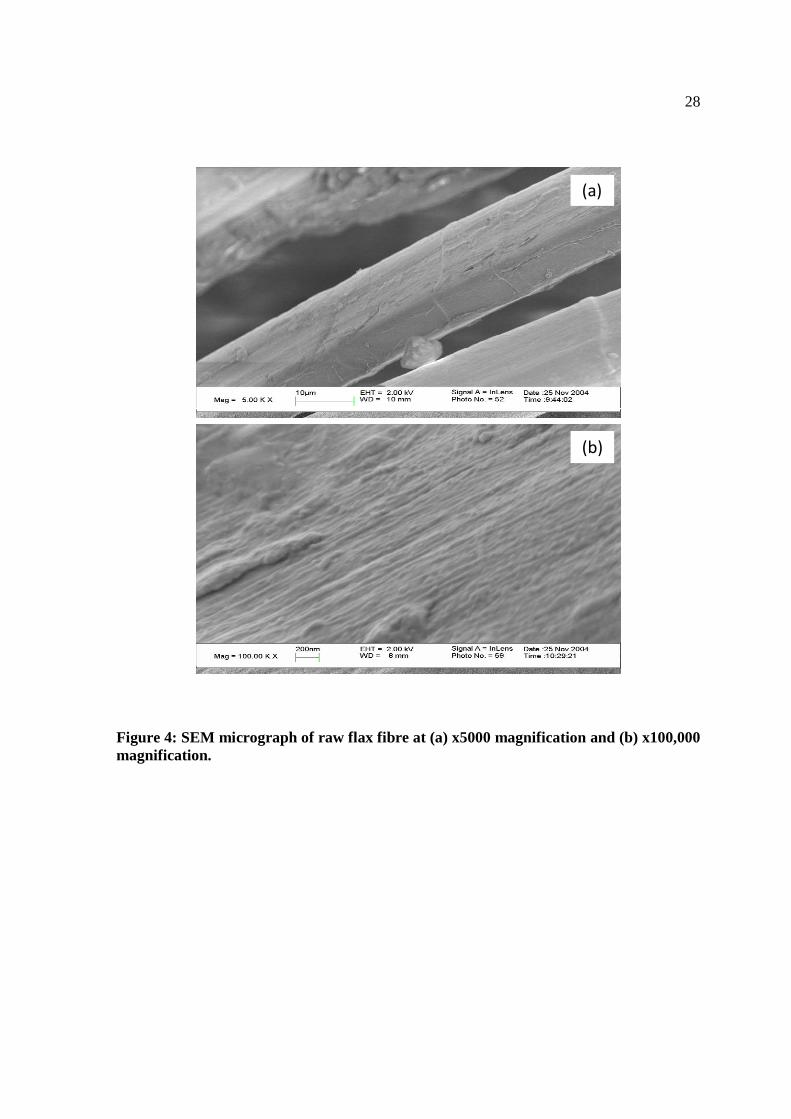
Figure 4(a) and 4(b) show scanning electron micrographs (SEM) of the original flax fibre at
x5,000 and x100,000 magnification respectively. It is apparent that the fibre surface is uneven
and has a striated texture, with parallel ridges of width around 50nm running along the
length. These ridges may be related to the parallel arrangement of the cellulose microfibrils in
the secondary cell wall.19 Figure 4(b) also shows the presence of surface agglomerations of
sub-micron dimensions. The outer layer of biomass fibres is known as the cuticle (or middle
lamella) and is made up of lignin, pectin and waxes. The purpose of this outer layer is to bind
the individual fibres into bundles within the bast layer of the parent plant. Thus, it seems
likely that the micrographs are showing the cuticle of the fibres, the surface agglomerations
possibly consisting of pectin and/or lignin from the original fibre bundles. The SEM images
show no evidence of a pore structure within the raw flax fibre.
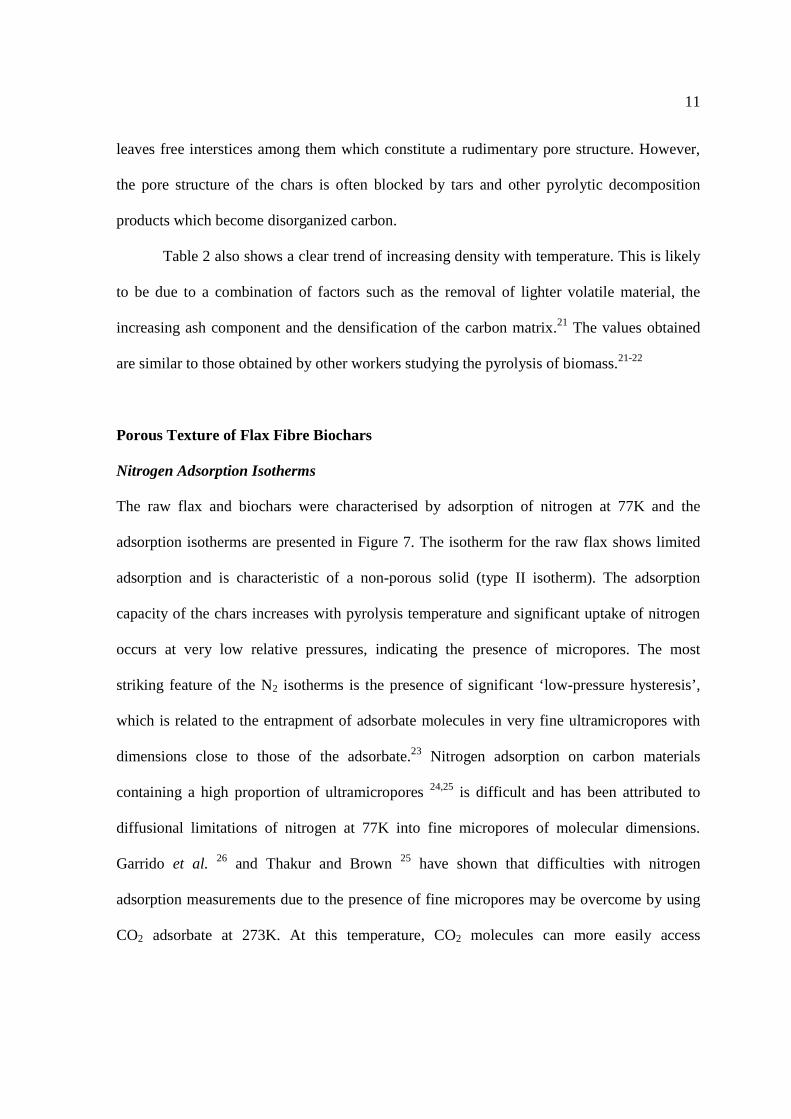
Figure 5 shows a photograph of the pyrolysis biochar produced after pyrolysis of the
flax non-woven fabric material at 800oC. The flax biochars maintained the non-woven
fibrous form of the original flax material over the whole range of pyrolysis temperatures
studied. The flexibility of the material was also maintained.
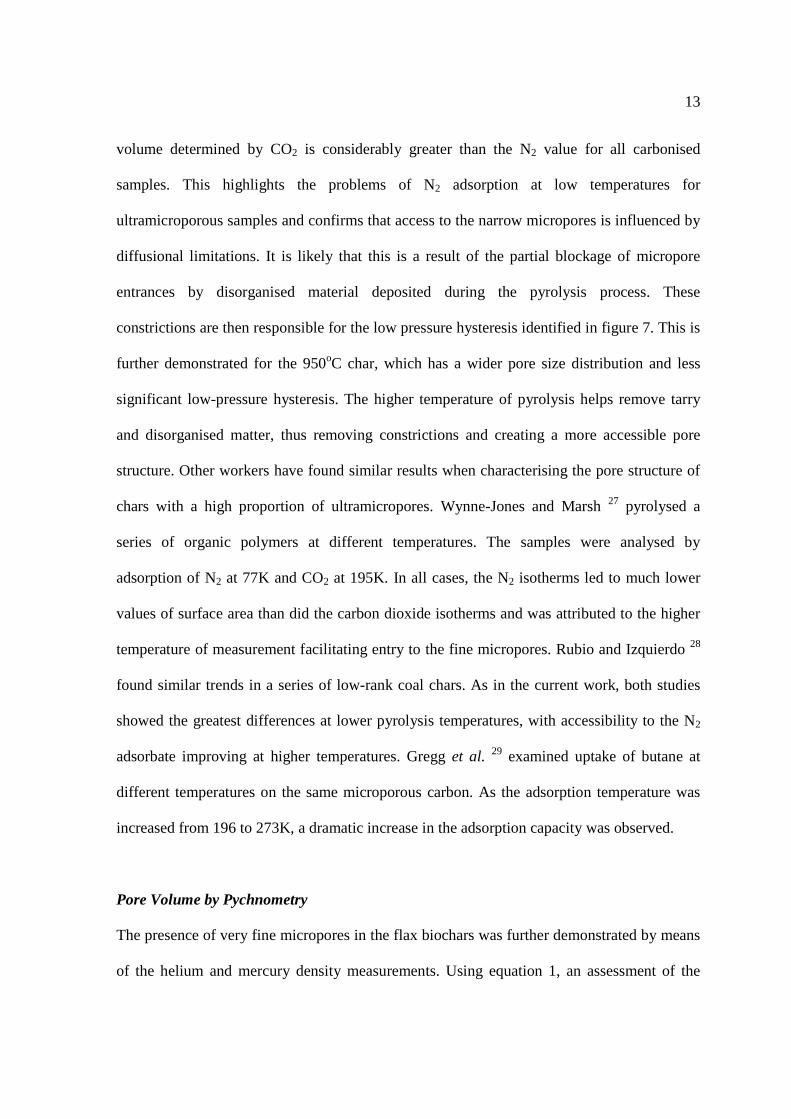
Figure 6(a) shows a scanning electron micrograph of the pyrolysis biochar produced
from flax pyrolysis at 800 ºC at a magnification of x12,000 and Figure 6(b) shows the
biochar fibre surface at x200,000 magnification. Figure 6(a) shows the fibre-ends of the
carbonized material. Hollow channels in the macropore size range may be seen running
through the centre of the fibres. These channels constitute the lumen, a central channel of
hollow space which is part of the nutrient transport system of the parent plant.20 The lumen
was not visible during SEM examination of the raw flax fibre, presumably due to the
presence of dried protoplasmic residues within the ducts.20 Figure 6(b) shows that there is
little evidence of the presence of a well developed pore structure on the surface of the fibres,

10
although a small number of slit shaped cracks in the mesopore size range are visible. This
agreed with the gas adsorption data (later) which indicated that the pore structure of the
biochars consists mainly of ultramicropores with little in the way of larger porosity. Such tiny
pores (<10Å) are beyond the resolution of the SEM.
Physical and Chemical Properties of Flax Biochars
The biochars derived from the pyrolysis of flax fibre were analysed for a range of properties,
including the elemental and proximate analysis, bulk, apparent and true density. The results
are shown in Table 2. The main feature of the proximate analysis data was the reduction in
volatile matter content and increase in fixed carbon as the temperature of pyrolysis was
increased. This was particularly marked between the raw flax and the 500oC biochar with the
volatile matter reducing from 75.6wt% to 25.7wt% and fixed carbon increasing from 15.2 to
65.8wt%. This is due to the devolatalisation of the flax during the main period of weight loss
between 275 and 450oC, where the majority of the volatile matter is released in the tar and
gaseous fractions. As the pyrolysis temperature was increased further, the volatile matter
content reduced more steadily. The ash content of the biochars also increased with increasing
temperature, indicating that the majority of the inorganic components present in the original
fibre remain in the biochar structure and are not released during pyrolysis.
The elemental analysis shows that the carbon content of the samples increased with
temperature whereas the proportion of hydrogen and oxygen was considerably reduced,
indicating a more aromatic carbon structure. In each case, the main changes take place up to
500oC. The solid biochar is rich in carbon due to the elimination of heteroatoms via the
gaseous and liquid fractions. The carbon atoms are grouped into stacks of aromatic sheets and
strips cross-linked in a random manner. Since the arrangement of these sheets is irregular, it
11
leaves free interstices among them which constitute a rudimentary pore structure. However,
the pore structure of the chars is often blocked by tars and other pyrolytic decomposition
products which become disorganized carbon.
Table 2 also shows a clear trend of increasing density with temperature. This is likely
to be due to a combination of factors such as the removal of lighter volatile material, the
increasing ash component and the densification of the carbon matrix.21 The values obtained
are similar to those obtained by other workers studying the pyrolysis of biomass.21-22
Porous Texture of Flax Fibre Biochars
Nitrogen Adsorption Isotherms
The raw flax and biochars were characterised by adsorption of nitrogen at 77K and the
adsorption isotherms are presented in Figure 7. The isotherm for the raw flax shows limited
adsorption and is characteristic of a non-porous solid (type II isotherm). The adsorption
capacity of the chars increases with pyrolysis temperature and significant uptake of nitrogen
occurs at very low relative pressures, indicating the presence of micropores. The most
striking feature of the N2 isotherms is the presence of significant ‘low-pressure hysteresis’,
which is related to the entrapment of adsorbate molecules in very fine ultramicropores with
dimensions close to those of the adsorbate.23 Nitrogen adsorption on carbon materials
containing a high proportion of ultramicropores 24,25 is difficult and has been attributed to
diffusional limitations of nitrogen at 77K into fine micropores of molecular dimensions.
Garrido et al. 26 and Thakur and Brown 25 have shown that difficulties with nitrogen
adsorption measurements due to the presence of fine micropores may be overcome by using
CO2 adsorbate at 273K. At this temperature, CO2 molecules can more easily access

12
ultramicropores than N2 at 77K in spite of the fact that the critical molecular dimensions of
both gases are similar.26
Carbon Dioxide Adsorption Isotherms
The porous structure of the raw flax and biochars was studied by adsorption of carbon
dioxide at 273K. It was hoped to remove the problems associated with the adsorption of
nitrogen at 77K and more accurately assess the presence of ultramicropores in the samples.
The adsorption isotherms and the DFT micropore size distributions are presented in figure 8
and figure 9 respectively. Porous texture data for both CO2 and N2 adsorbates are presented in
table 3.
The CO2 isotherms and corresponding DFT plots show the presence of considerable
microporosity in the flax chars. This is present in the form of ultramicropores, predominantly
with width less than 6Å. These pores appear to be formed during the carbonisation process as
they are absent in the raw flax precursor, which shows little adsorption of CO2. As the
carbonisation temperature is increased from 500 to 800oC, the narrow micropore volume
(DR-CO2) increases slightly before showing a slight decline between 800 and 950oC. The
overall shape of the DFT plots remains similar between 500 and 800oC, with the creation of
narrow micropores a feature. The peak at 3-4Å increases considerably, with a smaller
increase in the peak between 4 and 7Å also noted. At 950oC, considerable widening of the
narrow micropores has occurred with the 3-4Å peak much reduced but an increase and
broadening of the 4-7Å peak. The contribution of pores in excess of 8Å has also increased
considerably.
This is reinforced by the DR values and isotherms for the two adsorbates which also
indicate a widening of the micropores with increasing temperature. However, the micropore
13
volume determined by CO2 is considerably greater than the N2 value for all carbonised
samples. This highlights the problems of N2 adsorption at low temperatures for
ultramicroporous samples and confirms that access to the narrow micropores is influenced by
diffusional limitations. It is likely that this is a result of the partial blockage of micropore
entrances by disorganised material deposited during the pyrolysis process. These
constrictions are then responsible for the low pressure hysteresis identified in figure 7. This is
further demonstrated for the 950oC char, which has a wider pore size distribution and less
significant low-pressure hysteresis. The higher temperature of pyrolysis helps remove tarry
and disorganised matter, thus removing constrictions and creating a more accessible pore
structure. Other workers have found similar results when characterising the pore structure of
chars with a high proportion of ultramicropores. Wynne-Jones and Marsh 27 pyrolysed a
series of organic polymers at different temperatures. The samples were analysed by
adsorption of N2 at 77K and CO2 at 195K. In all cases, the N2 isotherms led to much lower
values of surface area than did the carbon dioxide isotherms and was attributed to the higher
temperature of measurement facilitating entry to the fine micropores. Rubio and Izquierdo 28
found similar trends in a series of low-rank coal chars. As in the current work, both studies
showed the greatest differences at lower pyrolysis temperatures, with accessibility to the N2
adsorbate improving at higher temperatures. Gregg et al. 29 examined uptake of butane at
different temperatures on the same microporous carbon. As the adsorption temperature was
increased from 196 to 273K, a dramatic increase in the adsorption capacity was observed.
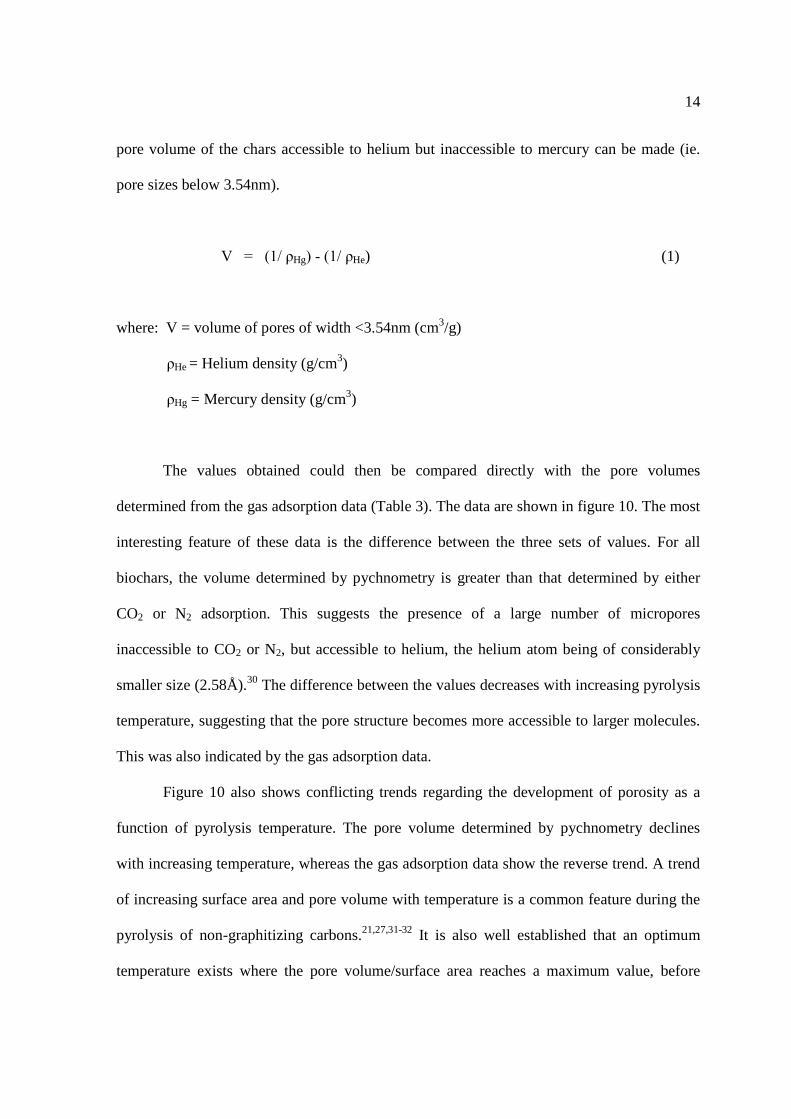
Pore Volume by Pychnometry
The presence of very fine micropores in the flax biochars was further demonstrated by means
of the helium and mercury density measurements. Using equation 1, an assessment of the
14
pore volume of the chars accessible to helium but inaccessible to mercury can be made (ie.
pore sizes below 3.54nm).
V = (1/ ρHg) - (1/ ρHe) (1)
where: V = volume of pores of width <3.54nm (cm3/g)
ρHe = Helium density (g/cm3)
ρHg = Mercury density (g/cm3)
The values obtained could then be compared directly with the pore volumes
determined from the gas adsorption data (Table 3). The data are shown in figure 10. The most
interesting feature of these data is the difference between the three sets of values. For all
biochars, the volume determined by pychnometry is greater than that determined by either
CO2 or N2 adsorption. This suggests the presence of a large number of micropores
inaccessible to CO2 or N2, but accessible to helium, the helium atom being of considerably
smaller size (2.58Å).30 The difference between the values decreases with increasing pyrolysis
temperature, suggesting that the pore structure becomes more accessible to larger molecules.
This was also indicated by the gas adsorption data.
Figure 10 also shows conflicting trends regarding the development of porosity as a
function of pyrolysis temperature. The pore volume determined by pychnometry declines
with increasing temperature, whereas the gas adsorption data show the reverse trend. A trend
of increasing surface area and pore volume with temperature is a common feature during the
pyrolysis of non-graphitizing carbons.21,27,31-32 It is also well established that an optimum
temperature exists where the pore volume/surface area reaches a maximum value, before

15
declining with further increases in temperature. However, the temperature at which the
maximum is observed varies widely and is dependant on the initial precursor. Wynne-Jones
and Marsh 27 studied the pyrolysis of organic polymers at temperatures up to 1000oC. Gas
adsorption data from the resulting biochars showed a wide variation in the temperature at
which the maximum surface area was obtained. For example, dibenzanthrone carbons
showed a maximum at <600oC, whereas for polyfurfuryl chars the maximum occurred at
800oC. Masters and McEnaney 31 pyrolysed cellulose pellets and found the micropore volume
of the chars increased steadily up to 1000oC, followed by a rapid decline thereafter. The same
paper attributed the decline in porosity to shrinkage of the char structure and the ‘conversion
of open micropores to closed micropores via the progressive narrowing of ultramicroporous
layer spacings’. It seems probable that the increased aromatic nature of the chars, together
with structural shrinkage, is responsible for the conflicting trends in figure 10.
Conclusions
A non-woven fabric was produced from biomass fibre obtained as a waste product from the
flax industry. The material was pyrolysed in a fixed bed reactor at various temperatures. The
fibrous morphology and flexibility of the precursor material was retained during pyrolysis.
Increasing temperature of pyrolysis from 500 ºC to 950 ºC showed that the main product was
liquid with a yield of ~54 wt% and the biochar ranged from 25.1 wt% at 500 ºC to 21.5 wt%
at 950 ºC. The biochars were characterized using a range of analytical techniques and were
found to exhibit properties typical of those obtained from other lignocellulosic materials.
Scanning electron microscope analysis of the biochars showed the presence of the original
16
structure of the flax. Detailed characterization of the biochars showed that they were mainly
microporous with the majority being in the range of ultramicropores.

17
References
[1] S.K. Batra, ‘Other Long Vegetable Fibres’. In: Lewin, M. and Pearce, E.M. (eds)
Handbook of Fibre Chemistry, 1998, Marcel Dekker, New York.
[2] P.O. Olesen and D.V. Plackett, Perspectives on the performance of natural plant fibres.
Report of the Plant Fibre Laboratory, 1998, Royal Veterinary and Agricultural University,
Copenhagen, Denmark.
[3] P.T. Williams and A.R. Reed. J. Anal. Appl. Pyrol., 2003, 70, 563-577.
[4] A.R. Reed and P.T. Williams, Int. J. Energ. Res., 2004, 28, 131-145.
[5] R. Isha and P.T. Williams, J. Energ. Inst. 2011, 84, 80-87.
[6] W.K. Buah, A.M. Cunliffe and P.T. Williams, Proc. Saf. Environ, 2007, 85, 450-457.
[7] P.T. Williams and N. Nugranad N. Energy, 2000, 25, 493-513.
[8] G. Oh and C.R. Park, Fuel, 2002, 81, 327-336.
[9] P.T. Williams and S. Besler, Renew. Energ., 1996, 7, 233-250.
18
[10] H. Marsh, M. Iley, J, Berger and T. Siemiensiewska, Carbon, 1975, 13, 103-109.
[11] F. Rodriguez-Reinoso, M. Molina-Sabio and M.T. Gonzalez, Carbon, 1995, 33, 15-23.
[12] A.C. Pastor, F. Rodriguez-Reinoso, H. Marsh and M.A. Martinez, Carbon, 1999, 37,
1275-1283.
[13] C.E. Byrne and D.C. Nagle, Carbon, 1997 35, 259-266.
[14] P.T. Williams and S. Besler, Fuel, 1993, 72, 151-159.
[15] G. Maschio, C. Koufopanos and A. Lucchesi, Biores. Technol., 1992, 42, 219-231.
[16] J.L. Figueiredo, C. Valenzuela, A. Bernalte, and J.M. Encinaar, Fuel, 1989, 68, 1012-
1016.
[17] P.H. Brunner and P.V. Roberts, Carbon, 1980, 18, 217-224.
[18] P.T. Williams and S. Besler, Energy, 1996, 7, p.233-250.
[19] P.T. Williams and A.R. Reed, Biomass Bioenerg., 2006, 30, 144-152.

19
[20] T.P Nevell and S.H. Zeronian, Cellulose chemistry and its applications, 30-41, 1985,
Ellis Harwood Ltd., Chichester.
[21] T.K. Gale, T.H. Fletcher, and C.H. Bartholomeus, Energ. Fuel., 1995, 9, 513-524.
[22] J. Guo and A.C. Lua, J. Anal. Appl. Pyrol., 1998, 46, 113-125.
[23] S.J. Gregg and K.S.W. Sing, Adsorption, Surface Area and Porosity. 1982, Academic
Press, London.
[24] F. Rodriguez-Reinoso and A. Linares-Solano, In: Thrower, P.A. (Ed) Chemistry and
Physics of Carbon, Vol. 21. 1998, Marcel Dekker, New York.
[25] S.C. Thakur and L.F. Brown, Carbon, 1982, 20, 17-24.
[26] J. Garrido, A. Linares-Solano, J.M. Martin-Martinez, M. Molina-Sabio, F. Rodriguez-
Reinoso and R. Torregosa, Langmuir, 1987, 3, 76-81.
[27] W.F.K. Wynne-Jones and H. Marsh, Carbon, 1964, 1, 269-279.
[28] B. Rubio and M.T. Izquierdo Carbon, 1997, 35, 1005-1011.
[29] S.J. Gregg, R.M. Olds and R.F.S. Tyson, In: Third Conference on Industrial Carbon and
Graphite, p.184. 1970, Academic Press, London and New York.
20
[30] R.D. Harrison, Nuffield Advanced Science Book of Data, 1977, Longman Group,
London.
[31] K.J. Masters and B. McEnaney, Carbon, 1984, 22, 595-601.
[32] P.A. Della-Rocca, E.G. Carrella, P.R. Bonelli and A.L. Lukierman, Biomass Bioenerg.,
1999, 16, 79-88.

21
Table 1: Characteristics of the ‘as-received’ flax fibre
Wt. %
Ultimate AnalysisCarbon 43.5Hydrogen 6.7Nitrogen 1.3Oxygen (by difference) 48.5
Proximate AnalysisMoisture 7.5Volatiles 75.6Fixed Carbon 15.2Ash 1.7
Major ComponentsCellulosea 64.1Hemi-cellulosea 16.1Lignina 2.0Calorific value (MJ kg-1) 17.2
Density (g cm-3)Bulk 0.442Apparent (Hg) 1.359True (He) 1.369
a data from reference 1

22
Table 2: Characteristics of flax biochars pyrolysed at different temperatures
Wt. % Pyrolysis Temperature (oC)
500 650 800 950
Ultimate AnalysisCarbon 81.2 88.6 90.3 92.6Hydrogen 2.3 1.6 1.1 0.8Nitrogen 2.0 1.7 0.9 0.8Oxygen (by difference) 14.5 8.1 7.7 5.8
Proximate AnalysisMoisture 2.0 1.8 1.6 2.1Volatiles 25.2 15.8 10.4 6.7Fixed Carbon 65.8 75.0 80.0 81.8Ash 7.0 7.4 8.0 9.4
Density (g cm-3)Bulk 0.449 0.528 0.587 0.613Apparent (Hg) 1.021 1.102 1.245 1.401True (He) 1.472 1.580 1.861 1.975

23
Table 3: Porous texture data for raw flax and flax biochars
Sample ABET
[m2/g]VMIC
DR-N2
[cm3/g]
VMIC
DR-CO2
[cm3/g]
VMES
[cm3/g]VTOT
N2
[cm3/g]
Flax
500oC
650oC
800oC
950oC
1.8
5.9
13.1
30.1
45.6
0.000
0.002
0.009
0.012
0.019
0.003
0.138
0.143
0.151
0.149
0.001
0.006
0.012
0.011
0.008
0.004
0.013
0.029
0.028
0.033

24
Figure Captions
Figure 1. The non-woven flax fibre precursor material
Figure 2: Schematic diagram of the pyrolysis reactor
Figure 3: Pyrolysis mass balance for flax at different final temperatures
Figure 4: SEM micrograph of raw flax fibre at (a) x5000 magnification and (b) x100,000.
Figure 5: Flax non-woven fabric biochar produced at a pyrolysis temperature of 800oC
Figure 6: SEM micrograph of flax biochar fibre surface (a) x 12000 magnification and (b)
x200,000 magnification
Figure 7: N2 adsorption isotherms at 77K for raw flax and biochars
Figure 8: CO2 adsorption isotherms at 273K for raw flax and biochars
Figure 9: CO2 DFT micropore size distributions for raw flax and biochars
Figure 10: Comparison of pore volumes. Pychnometry vs gas adsorption

25
Figure 1. The non-woven flax fibre precursor material

26
Temperaturecontrolled
furnace
N2
Flax Sample
GauzeGas sampling
point
CO2/acetonecondensors
Glasswooltrap
Thermocouple
Water/Icecondensor
Figure 2: Schematic diagram of the pyrolysis reactor

27
0%
10%
20%
30%
40%
50%
60%
70%
80%
90%
100%
500 C 650 C 800 C 950 C
Char
Liquid
Gas
Pro
du
ctYi
eld
(wt%
)
Pyrolysis Temperature (⁰C)
Figure 3: Pyrolysis mass balance for flax at different final temperatures
28
(a)
(b)
Figure 4: SEM micrograph of raw flax fibre at (a) x5000 magnification and (b) x100,000magnification.

29
Figure 5: Flax non-woven fabric biochar produced at a pyrolysis temperature of 800oC

30
(a)
(b)
Figure 6: SEM micrograph of flax biochar fibre surface (a) x 12000 magnification and(b) x200,000 magnification

31
0
5
10
15
20
25
0.0 0.1 0.2 0.3 0.4 0.5 0.6 0.7 0.8 0.9 1.0
P/Po
VA
DS
/c
m3
(ST
P)
g-1
950
800
650
500
Flax
Figure 7: N2 adsorption isotherms at 77K for raw flax and biochars

32
0
10
20
30
40
50
60
0.000 0.005 0.010 0.015 0.020 0.025 0.030
P/Po
VA
DS
/cm
3(S
TP
)g
-1
Raw Flax
500C
650C
800C
950C
Figure 8: CO2 adsorption isotherms at 273K for raw flax and biochars

33
0
0.01
0.02
0.03
0.04
0.05
0.06
0.07
2 3 4 5 6 7 8 9 10 11 12 13 14 15
Pore Width [A]
dV
(w)
[cm
3/A
/g] Raw Flax
500C
650C
800C
950C
Figure 9: CO2 DFT micropore size distributions for raw flax and biochars

34
0.00
0.05
0.10
0.15
0.20
0.25
0.30
Flax 500 650 800 950
Pyrolysis Temperature [oC]
Po
reV
olu
me
[cm
3/g
]
Pychnom etry
CO2 micropore vol
N2 total pore vol
Figure 10: Comparison of pore volumes. Pychnometry vs gas adsorption