university of kalyani · 2010-03-26 · ... an introduction to probability theory & its...
TRANSCRIPT

UNIVERSITY OF KALYANI
SYLLABUS
FOR THREE YEARS B.Sc. DEGREE COURSE
(HONOURS)
IN
STATISTICSAccording to the New Examination Pattern
Part – I, Part- II & Part- III
WITH EFFECT FROM THE SESSION
2008 - 2009

University of KalyaniSyllabus of Statistics
w.e.f. the session 2008-2009
Contents
Paper Topic Page No.
Distribution of Marks and Question Pattern (i & ii)
Part-IPaper-I Prob I
Mathematical Methods I (H-2) (H-3)
Paper-II Descriptive Statistics (H-4)Paper-III Practical (H-4)
Part-IIPaper- IV Prob II
Mathematical Methods II (H-6)
(H-7)Paper- V Sampling Distributions
Estimation and Testing (H-8) (H-9)
Paper-VI Practical (H-9)
Part-IIIPaper- VII Economic Statistics
DemographyIndian Statistical System
(H-11) (H-12) (H-12)
Paper- VIII Analysis of Variance & Design of ExperimentsSampling Techniques
(H-13) (H-14)
Paper- IX Sequential Analysis and Non-parametric inferenceLarge Sample MethodsStatistical Quality Control
(H-15) (H-15) (H-16)
Paper- X Practical (H-17)Paper- XI Practical (H-17)
Honours Course

University of KalyaniSyllabus of Statistics (Honours)
w.e.f. the session 2008-2009
Part - I : (Theo. 150+ Prac. 50) No. of Periods .
Marks Gross Net(for course preparation)
Paper – I: Prob I (3) 45 6 x 4 x 3 = 72 60
Mathematical Methods I (2) 30 6 x 4 x 2 = 48 40 (Linear Alg.+ Real Ana. I )
Paper- II: Descriptive Statistics (4) 75 6 x 4 x 4 = 96 80 _____
150 Paper- III (Prac.): Based on Linear Alg.
& Descriptive Statistics (2+2 =4) 50 6 x 4 x 4 = 96 80
____________________________________ ___________13 200 6 x 4 x 13 = 312 260
Part – II : (Theo. 150 + Prac. 50)
Paper – IV : Prob II (2) 30 6 x 4 x 2 = 48 40
Mathematical Methods II. (3) 45 6 x 4 x 3 = 72 60(Numerical Ana. + Real Ana. II)
Paper – V : Sampling distribution (2) 30 6 x 4 x 2 = 48 40
Statistical Inference : ParametricEstimation & Testing (3) 45 6 x 4 x 3 = 72 60
---------- 150
Paper – VI (Prac.) :Numerical Ana. & Estimation and Testing(4) 50 6 x 4 x 4 = 96 80
___________________________________________ 14 200 6 x 4 x 14 = 336 280
(i)

Part – III (Theo. 240 + Prac. 160)
No. of Periods .
Marks Gross Net (for coursePaper – VII : Appl. Statistics : preparation)
Economic Statistics (2) 40 6 x 4 x 2 = 48 40
Demography (1 ½) 30 6 x 4 x 1½ = 36 30
Indian Statistical System (½) 10 6 x 4 x ½ = 12 10
Paper –VIII : Design of Expts. & ANOVA (3) 50 6 x 4 x 3 = 72 60
Sampling Techniques (2) 30 6 x 4 x 2 = 48 40
Paper IX : Sequential Analysis & Non-parametric Inference (2) 30 6 x 4 x 2 = 48 40
Large Sample Methods (2) 30 6 x 4 x 2 = 48 40
SQC (1) 20 6 x 4 x 1 = 24 20
Paper X (Prac.) : Gr. A : Econ. + Demo. +SQC (2) 40 6 x 4 x 2 = 48 40
Gr. B : ANOVA + Design +Sample Survey + Non-Para (2) 40 6 x 4 x 2 = 48 40
Paper XI (Prac.) : Computer Application : 80 6 x 4 x 4 = 96 80C Programming & Statistical Softwares. (4)
__________________________________________________
22 400 6 x 4 x 22 = 528 440
(ii)
University of KalyaniHonours Course in Statist ics
Honours Course in Statistics
Part I
Paper I , II & III
University of KalyaniHonours Course in Statistics
H - 1

Part - I
Paper I
Prob I ( 45 marks) Max : 60 L
Random Experiment, sample point, sample space, event, classical definition of prob. and limit ations,Statistical regularity and meaning of probability, prob. by rel. freq., geometric prob., related exercises. (11)
Operation on events, field of events, Kolmogor ov’s axiomatic definition of prob. ( detailed discussion ondiscrete space only ). (6) Results on prob. of union and intersection of events, conditional prob., independence, Bayes’theo. and itsapplications. Related exercises. (10) Random variable,(Cumulative )distribution function ( c.d.f.) of a r.v. and its properties , p.m.f. and p.d.f.,expectation, variance, moments, quantiles with their properties, p.g.f. and m.g.f. with their properties (8) Standard univariate discrete distributions : degenerate, discrete uniform, Bernoulli, binomial, hyper -geometric, Poisson, geometric, negative binomial with their possible reproductive properties. (8) Standard univariate continuous distributions : Rectangular, Normal, Cauchy, gamma, beta, exponential,Laplace , logistic, Pareto, log – normal distributions and their properties. (12)
Geometric probability. (3) Truncated distribution – both discrete and cont. cases involving binomial and normal distributions with one sided truncation only. (2)
------------ 60
References :1) Feller W. (1968) ; An Introduction to probability Theory & its Applications, John Willy2) Goon,A.M., Gupta, M.K. & Dasgupta, B : Fundamentals of Statistics, Vol. 1 – World Press.3) Rohatgi, V.K.(1984) : An Intro. to Prob. Theory and Mathematical Statistics, John Wiley.4) Hoel, P.J., Port, S.C. & Stone, C.J. ( ) : Introduction to Probability Theory (Vol -1)
Houghton Mifflin & UBS.5) Prazen, E. (1972) : Modern Probability Theory and its Applications, John Wiley6) Uspensky, J.V. (19370 : Introduction to Mathematical Probability, Mc Graw Hill7) Cacoullos, T. (1973) : Exercises in Probability, Narosa8) Pitman, J. (1993) : Probability , Narosa9) Chandra, T.K. & Chatterjee, D. (2001) : A First Course In Probability, Narosa10) Mukhopadhyay, P. (1996) : Mathematical Statistics11) Mukhopadhyay, P. ( ) : Theory of Probability12) Wilks, S.S. (1962) : Mathematical Statistics , Wiley.
13) Bhat, B.R. ( ) : Modern Probability Theory
Honours Course in StatisticsUniversity of Kalyani
H - 2

Mathematical Methods I (Marks : 30 ) Max. 60 L
Linear Algebra :
Vector : Vector space with a f ield of real numbers, addition and scalar multiplication of vectors, linearcombination and linear independence, basis, dimension, subspace, inner product, orthogonality and Gram -Schmidt process. (10)
Matrix : Definition, various types of mat rices, matrix operations, Elementary matrices, rank of a matrix andrelated results, inverse of a matrix , determinants, cofactors, properties of determinants, Laplace expansion,determinant and inverse of a partitied matrix, reduction of matrix to a norma l form, sweep-out and pivotalcondensation methods, triangular reduction. (23)
Homogeneous and non-homogeneous system of a linear equation, consistency. (6)
Characteristic equation , eigenvalues and eigenvectors and simple related results r egarding real symmetricmatrix. (5)
Quadratic forms : Classification, Canonical reductio n, spectral decomposition (6)
Real Analysis I :
Function of one variable : Limits, continuity and differentiability. Mean value theorems, maxima, minima. (10)
----------------References : 60 L
1. Shanti Narayan : A text book on Matrices.2. Hadley, G.(1995) : Linear Algebra Addision Wisley, Narosa3. Rao, A.R. & Bhimasankaram, P. (1996) : Linear Algebra4. Goldberg, R.R. (1970) : Methods of Real Analysis, Oxford & IBH5. Apostle (1968) : Vol I & II, Calculus and Mathematical Analysis6. Biswas, S. : A text book on Matrix algebra7. Rao, C.R. (1973) : Linear Statistical Inference8. Lay, David , C. : Linear Algebra and its application, Addison and Wesley.
Honours Course in StatisticsUniversity of Kalyani
H - 3

Paper II
Descriptive Statistics ( 75 marks ) Max. : 80 L
Types of data : Basic concepts , individual, population sample, qualitative and quantitative data, nominal andordinal data, cross sectional and time series data, discrete and continuous data, frequency and non -frequencydata. (3)Collection and Scrutiny of data : Primary and secondary data, method of collection, scrutiny of data forinternal Consistency and detection of errors. (1)Presentation of data : Compilation ,tabulation, diagrammatic representation, frequency distribution , stem - and–leaf displays , column or bar diagram , pie diagram , divided bar diagram , histogram , frequency polygon andogives , Box Plot. (6)Descriptive Measure on Quantitative data : Univariate data : Measures of location , dispersion , relativedispersion , moments , quantiles , skewness and kurtosis , statement of Sheppard’s correction for moments ,moment inequalities , Gini’s coefficient , Lorenze curves , related problems. (16)
Bivariate data : Scatter diagram , correlation coefficient and its properties , intra - classcorrelation with equal and unequal group sizes , concept of regression , Principle of least squares , regressioncurves and related results , correlation index , correlation ratio and related inequalities , fitting of curvesreducible to polynomials by transformation e.g. log , in verse etc. Fitting by the method of group averages, rankcorrelation – Spearman’s and Kendall’s measures including tie cases. (26)
Descriptive Measure on multivariate data : Data mean vector and covar iance matrix, multipleregression, multiple correlation, partial correlation and related results. (15)
Categorical data analysis : Consistency of categorical data, independence and association of attribu tes,various measures of association for two -way and three-way classified data, odds ratio. (6)Scaling of data : Motivation of scaling, types of scales ------ nominal, ordinal, ratio and interval scales.Measurement of psychological traits, scaling of items according to difficulty. Scaling of test scores, scaling ofrates and ranks, scaling of judgments. (7)
---------------80 L
References :
1) Goon,A.M., Gupta, M.K. & Dasgupta, B : Fundamentals of Statistics, Vol. 1 – World Press, Kolkata2) Agresti, a. (1984) : Analysis of Ordinal Categorical data3) ____ (1996) : An Introduction t o Categorical Data Analysis. John Wiley & Sons4) Guilford, J.P. and Fruchter, B. (1980) : Fundamental Statistics in Psychology and Education, Mc
Graw Hill.5) Yule, G.U. & Kendall, M.G. ; An Introduction to the Theory of Statistics. C. Griffin6) Kendall, M.G. and Stuart, A. : Advanced Theory of Statistics, Vol -I & Vol-II
Paper- III (Prac.) Based on Linear Alg.& Descriptive Statistics
Honours Course in StatisticsUniversity of Kalyani
H - 4H - 4
Honours Course in Statistics
Part II
Paper IV , V & VI
Honours Course in StatisticsUniversity of Kalyani
H- 5

Part – II
Paper IV
Prob II (30 marks) Max : 40 L
Bivariate case : cdf, pmf and pdf, marginal and conditional distributions, independence, conditionalexpectation, conditional variance, correlation and regression, mgf, bivariate normal distribution with itsproperties and related exercises. (12)
Probability inequalities : Markov’s and Chebyshev’s inequalities, limit theorems : Convergence in prob., weaklaw large numbers and its applications, convergence in distribution, convergence of binomial to Poisson,Poisson to normal, central limit theorem(statement of i.i.d. case only) and its application (including De Moivre -Laplace limit theorem). (12)
Multivariate case : Random vector, mean vector, dispersion, matrix, marginal and conditional distributions,ellipsoid of concentration , multiple regression, multiple correlation, Partial correlation. (11)
Multivariate distributions : Multinomial, Multivariate normal and their properties. (5)
------------------- 40 L
References :
1) Feller, W. (1968) ; An Introduction to probability Theory & its Applications, John Willy2) Goon,A.M., Gupta, M.K. & Dasgupta, B : An Outline of Statistics theory , Vol. 1 – World
Press.Roatgi, V.K.(1984) : An Intro. To Prob. Theory and Mathematical Statistics, John Wiley
3) Hoel, P.J., Port, S.C. & Stone, C.J. ( ) : Introduction to Probability Theory (Vol -1) Houghton Mifflin & UBS.
4) Cacoullos, T. (1973) : Exercises in Probability. Narosa5) Pitman, J. (1993) : Probabil ity , Narosa6) Chandra, T.K. & Chatterjee, D. (2001) : A First Course in Probability, Narosa7) Bhat, B.R. (1999 ) : Modern Probability Theory, New Age International8) Mukhopadhyay, P. (1996) : Mathematical Statistics9) Mukhopadhyay, P. (1996) : Theory of Probability10) Cramer, H. (1962) : Mathematical Statistics11) Wilks, S.S. : Mathematical Statistics
H - 6
Honours Course in StatisticsUniversity of Kalyani

Mathematical Methods II (45 marks ) Max. 60 LNumerical Analysis : (20 marks)
1. Approximation of numbers and functions, Absolute and relative errors, Δ and E operators, separation of symbols using Δ and E operators. (3)2. Difference table, Interpolation by Newton’s forward, backward formula with error terms, Lagrange’s formula, Divid ed difference table, Newton’s divided diff. formula, Stirling’s and Bessel’s Central interpolation formulae. (10)
3. Numerical differentiation and its application. (1)4. Numerical Intergration : Quadrature Formula ; Trapizoidal, Simpson 1/3 rd and 3/8th rules. (2)5. Numerical solution of equations : Bisection ; iterative and Newton - Raphson methods in one unknown. Conditions of convergence, Extension to two unknowns. (4)6. Euler- Maclaurin’s sum formula, Stirling’s approximation to factorial. (2)
_______ 22 L
Real Analysis II (25 Marks)
Sequences and Series of real numbers, convergence, Cauchy criterion and simple test for conv ergence,power series. (10 L)Reimann Intergral; Integration by parts, change of variables, Improper Integral; beta and gammaintegrals. (10 L)Sequences and series of functions, pointwise convergence, uniform convergence and absoluteconvergence, simple tests of convergence. (6 L)Function of several variables , partial derives, maxima and minima, applications of Lagrangianmultiplies, multiple integrals, transformations and Jacobians (Statement and examples), Polar andOrthogonal transformations, Dirichlet integral. (12L)
______________ 38 L
______________60 L
References:
1. Goldberg, R.R. (1970) : Methods of Real Analysis, Oxford & IBH2. Shanti Narayan (1993) : Mathematical Analysis, S. Chand and co.3. J.B. Scarborough : Numerical Analysis4. Jain, M.K., Iyenger, S.R.K. & Jain, R.K. : Numerical Methods for Scientific and Engineering
Computation. New Age international.Apostle5. Saxena , H.C. : The Calculus of Finite Differences. S.Chand & Comp., New Delhi.6. Goon,A.M., Gupta, M.K. & Dasgupta, B : Fundamenta ls of Statistics, Vol. 1 – World Press7. Freeman , H. (1962) : Finite Differences for Actuarial Students, Cambridge University Press.8. Malik and Arora9. Aitkinson, K. : Elementary Numerical Analysis, Wiley
Honours Course in StatisticsUniversity of Kalyani
H - 7

Paper V
Sampling Distributions ( 30 marks) Max. 40 L
Concept of Random sampling, Statistics and sampling distribution of statistics. Different methods forfinding sampling distributions of statistics. Derivation of the distribution of the sample total of binomialand Poisson variables and related conditional distributions of a single observation given the sum.
(5)
Distributions of the sum of two iid rectangular and sum & ratio of two independent Gamma variables andsum of two independent beta variables. (3)
Distribution of linear function of independent normal variables, ratio of two independent normal variables;centralx2 , t & F distributions. (7)
Sampling distributions of mean and variance of a random sample from a normal population. (3)Sampling distribution of the Statistics related to testing the equality of means of K homoscedastic normalpopulations. (5)
Sampling distributions of means, variances and correlation co -efficient of a random sample from abivariate normal distribution. Distribution of sample regression co -efficient for both stochastic and non -stochastic independent variable cases. (8)
Distribution of sample order statistics from continuous populations, sample range and coverage. (8)
--------------- 39 L
References:
1. Hogg, R.V. & Craig, A.T. ( 1978): Introduction to Mathematical Statistics, Collier Macmillan Pub.2. Goon,A.M., Gupta, M.K. & Dasgupta, B : An Outline of Statistical Theory, Vol.2, world Press, Kolkata
3. Rao, C.R.: Linear Statistical Inference and Its applications, Wiley Eastern..4. Rohatgi, V.K.(1986) : An Introduction to Probability Theory and Mathematical Statisti cs, Wiley Eastern5. Mukhopadhyay, P. ( ) : Theory of Probability6. Mukhopadhyay, P. : Mathematical Statistics.7. David and Nadaraja : Order Statistics
Honours Course in StatisticsUniversity of Kalyani
H - 8
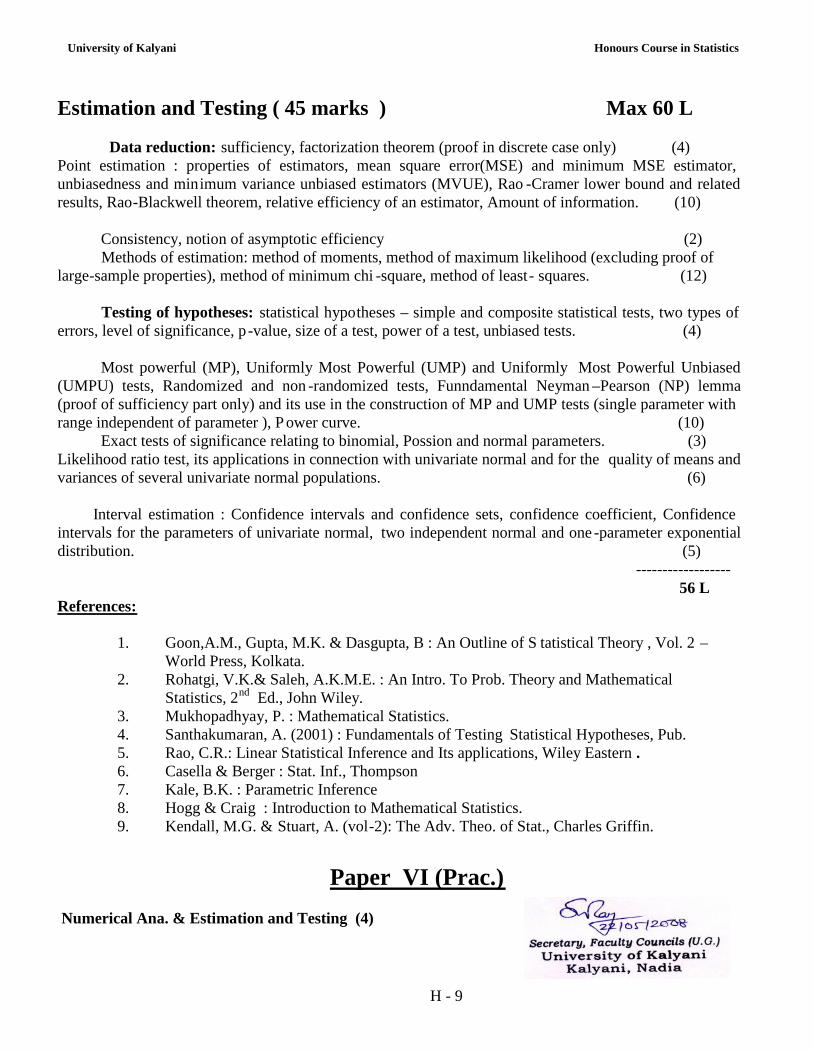
Estimation and Testing ( 45 marks ) Max 60 L
Data reduction: sufficiency, factorization theorem (proof in discrete case only) (4)Point estimation : properties of estimators, mean square error(MSE) and minimum MSE estimator,unbiasedness and minimum variance unbiased estimators (MVUE), Rao -Cramer lower bound and relatedresults, Rao-Blackwell theorem, relative efficiency of an estimator, Amount of information. (10)
Consistency, notion of asymptotic efficiency (2) Methods of estimation: method of moments, method of maximum likelihood (excluding proof of
large-sample properties), method of minimum chi -square, method of least- squares. (12)
Testing of hypotheses: statistical hypotheses – simple and composite statistical tests, two types oferrors, level of significance, p-value, size of a test, power of a test, unbiased tests. (4)
Most powerful (MP), Uniformly Most Powerful (UMP) and Uniformly Most Powerful Unbiased(UMPU) tests, Randomized and non -randomized tests, Funndamental Neyman –Pearson (NP) lemma(proof of sufficiency part only) and its use in the construction of MP and UMP tests (single parameter withrange independent of parameter ), P ower curve. (10) Exact tests of significance relating to binomial, Possion and normal parameters. (3)Likelihood ratio test, its applications in connection with univariate normal and for the quality of means andvariances of several univariate normal populations. (6)
Interval estimation : Confidence intervals and confidence sets, confidence coefficient, Confidenceintervals for the parameters of univariate normal, two independent normal and one -parameter exponentialdistribution. (5)
------------------ 56 L
References:
1. Goon,A.M., Gupta, M.K. & Dasgupta, B : An Outline of S tatistical Theory , Vol. 2 –World Press, Kolkata.
2. Rohatgi, V.K.& Saleh, A.K.M.E. : An Intro. To Prob. Theory and MathematicalStatistics, 2nd Ed., John Wiley.
3. Mukhopadhyay, P. : Mathematical Statistics.4. Santhakumaran, A. (2001) : Fundamentals of Testing Statistical Hypotheses, Pub.5. Rao, C.R.: Linear Statistical Inference and Its applications, Wiley Eastern .6. Casella & Berger : Stat. Inf., Thompson7. Kale, B.K. : Parametric Inference8. Hogg & Craig : Introduction to Mathematical Statistics.9. Kendall, M.G. & Stuart, A. (vol-2): The Adv. Theo. of Stat., Charles Griffin.
Paper VI (Prac.)
Numerical Ana. & Estimation and Testing (4)
Honours Course in StatisticsUniversity of Kalyani
H - 9

Honours Course in Statistics
Part III
Paper VII, VIII, IX & X
H - 10
University of Kalyani Honours Course in Statistics

Part – III
Paper VII
Economic Statistics: (40 marks) Max 40L
Index Numbers ( 10L)Price, Quantity and value indices, Problem of Construction of index numbers: Laspeyre’s, Paasche’s,Edgeworth-Marshal’s, Fisher’s ideal formulae, chain base index number, Test for index numbers: Timeand Factor reversal tests, Circular test. (8L)Some important indices: consumer prices index, wholesale price index- methods of construction and uses. (2L)
----------------Total (10L)
Time Series (22L)Economic Time series, different components, additive and multiplicative models, determination of trend,by moving average and mathematical curve fitting, Slutsky-Yule effect, analysis of seasonal fluctuation,construction of seasonal indices. (11L)
Stationary Time Series - Weak stationary, definition of Auto Regression (AR), Moving Average (MA)processes ; Discrimination between AR(1) AR(2), MA(1), and MA(2) processes by Correlogram analysis.Sample autocorrelation, Estimation of parameters of AR(1) and AR(2) processes. (8L)
Forecasting : Exponential smoothing and Holt -Winter’s method. (3L)
Demand Analysis (10L)Theory and analysis of consumer’s demand : Law of demand, price elasticity of demand, Engelcurve – its different forms and properties. Income elasticity of demand. Estimation of Engel curvesfrom family budget data by Weighted Least Squares method. (10L)
References:1. Goon,A.M., Gupta, M.K. & Dasgupta, B : Fundamentals of Statistics, Vol. II – World Press,
Kolkata.2. Parimal Mukhopadhyay : Applied Statistics.3. Prais & Houthakker – Analysis of family budget data.4. Kendall, M.G. & Stuart, A : The Advanced Theory of Statistics, Vol. III.5. Chatfield, C. (1980) : The Analysis of Time Series – An Introduction , Chapman & Hall.6. Allen, R.G.D. : Index Numbers in Theory and Practice, Mc. Millon Press Ltd.7. Brokwell, P.J. & Davis R.A. : Intro. To Time Series and Forecasting, Springer -Verlag.8. Nagar & Das.
Honours Course in StatisticsUniversity of Kalyani
H - 11

Demography (30 marks ) Max : 30 L
Sources of demographic data, errors in census and registration data and their adjustment. (2L)Measurement of morbidity and mortality , standardization of death rates, cause of death rate, infantmortality rate, maternal mortality rate. Birth rates : CBR, GFR, Age -sp. birth rates, TFR, GRR and NRR.
(10)Complete life table – description, Cohort stable population and stationary population .Notion of abridged life table and construction by Chiang’s method (12L)
Graduation of mortality rates by Gompertz and Makeham’s laws. Logistic curve and itsfitting by Rhode’s method for population forecasting. (5L)
----------29 L
References:
1. Bhaskar D. Misra : An Intro. to the study of populati on , South Asian Publishers Pvt. Ltd.,New Delhi.
2. Mukhopadhyay, P. : Applied Statistics.3. Goon,A.M., Gupta, M.K. & Dasgupta, B : Fundamentals of Statistics, Vol. 2 – World Press, Kolkata.4. Biseas, S. : Demography
INDIAN STATISTICAL SYSTEM (10 marks) Max. 10 L
The Statistical system in India : The Central and State Govt. Organizations, the functions of the CentralStatistical Organization (CSO), the National Sample Survey Organization (NSSO) and West Bengal Bureau ofApplied Economics and Statistics. (6L)Sources of official Statistics in India and West Bengal relating to : Population, agriculture, industry, trade, priceand employment. (2L)
Brief ideas of National Income Statistics. (2L)--------------
10 LReferences:
1. Saluja, M.P. : Indian Official Systems, Statist ical Publishing Society, Kolkata2. Goon,A.M., Gupta, M.K. & Dasgupta, B : Fundamentals of Statistics, Vol. 2 – World Press,
Kolkata3. Statistical system in India (1984) – C.S.O.
Honours Course in StatisticsUniversity of Kalyani
H - 12

Paper VIII
Analysis of Variance & Design of Experiments (50 marks) Max. 60 L
Linear models, Linear parametric function, Method of Least squares, statement of Gauss -Markov theorem, s.s. due to linear function of observations, test of general linear hypothesis. (4L)
Analysis of variance (ANOVA) :Application of the ANOVA technique to : one-way classified data, two-way classified data with equalnumber of observations per cell (fixed, random and mixed), testing simple regression coefficients,correlation ratio, linearity of simple regression, multiple correlation and par tial correlation coefficients.
(10 L)Design of Experiments :
Principles of experimental design : Randomization, Replication and Local Control,Uniformity Trials (4L)
Standard Designs and their Analyses : Completely randomized Design (CRD), Randomized Block Design(RBD), Latin Square Design (LSD), Split Plot Design and Strip arrangements, comparison of efficiencies.Application of the techniques of analysis of variance for the analysis of the above designs.
(16 L)Group of Experiments using RBD and LSD. (3L)
Factorial Experiments : Advantages, 2n – experiments, Total and Partial Confounding analysis; andconstruction. (10L)
Analysis of covariance (ANCOVA) : Application of the ANCOVA technique to one -way classified dataand to two-way classified data with equal number of observations per cell, use of ANCOVA to control theerror in LSD. (5L)Missing Plot Technique : Analysis with one missing plot in a RBD and in a LSD. (4L)
-------------- 56 L
References:
1. Scheffe, H.(1959) : The analysis of Variance, John Wiley.2. Kempthorn, O. (1965) : The Design and Analysis of Experiments, Wiley Eastern.3. Das, M.N. & Giri, N.C. (1986) : Design and Analysis of Experiments, Wiley Eastern.4. Montgomery, D.C. (1976) : Design and Analysis of Experiments, Wiley Eastern.5. Cochran, W.G. & Cox, G.M. (1957) : Experimental Designs , John Wiley.6. Federer, W.T. (1975) : Experimental Designs -Theory and Application, Oxford & IBH.7. Goon,A.M., Gupta, M.K. & Dasgupta, B(2001) : Fundamentals of Statistics, Vol. 2 – World
Press.8. Mukhopadhyay, P.(1999) : Applied Statistics.
Honours Course in StatisticsUniversity of Kalyani
H - 13

Sampling Techniques (30 marks) Max. 40 L
Introduction : Concepts of a Finite Population and a Sample , Need for Sampling, Complete Enumeration andSample Surveys. (3 L)
General Ideas : Planning and execution of sample surveys, analysis of data and reporting, Biases andErrors. Judgment and probability sampling. Tables of Random N umbers and their uses. (5L)
Basic Sampling and estimation procedures : Simple Random Sampling with and without replacement, Stratifiedrandom sampling, Linear and circular Systematic Sampling, Cluster sampling, Two -stage (with equal-sized firststage units ) sampling with equal selection probabilities at each stages. Associated unbiased estimators ofpopulation total, mean and proportion, their variances and unbiased variance estimators. Determination ofsample size in simple random sampling. A llocation problem in stratified random sampling and optimum choiceof sampling and sub-sampling fractions in two stage sampling. (21L)
Ratio and Regression method of estimation in simple random sampling. (5L)Double sampling for ratio and regression estimators. PPSWR sampling. (2L)
Interpenetrating sub-sampling technique for unbiased variance estimation and its application. (2L)
Randomized Response Technique : Warner’s Model (2L)
________________ 40 L
References:
1. Goon,A.M., Gupta, M.K. & Dasgupta, B(2001) : Fundamentals of Statistics, Vol. 2 – WorldPress.
2. Murthy, M.N. (1977) : Sampling T heory and Methods, Statistical Pub. Soc., Calcutta.3. Des Raj & Chandhok, P. (1988) : Sample survey Theory, Narosa publishing House.4. Cochran, W.G.(1984) : Sampling Techniques(3 rd Ed.), Wiley Eastern.5. Mukhopadhyay, P. (1998) : Theory and Methods of survey Sa mpling, Prentice Hall.6. Sukhatme, P.V. & Sukhatme, B.V. (1970) : Sampling Theory of surveys with applications.
Honours Course in StatisticsUniversity of Kalyani
H - 14

Paper IX
Sequential Analysis and Non-parametric inference (30 marks) Max. 40 L
Sequential Analysis : Need for Sequential inference, Wald’s SPRT with illustrations. Approximatedetermination of boundaries. Expression for OC and ASN functions (without proof) of tests regardingparameters of binomial, Poisson and normal distributions. (12L)
Non parametric inference : Need for non- parametric inference, sample median and inter -quartile range aspoint estimates of location and dispersion, distribution – free interval estimation of population quantile,tolerance interval, sign, Run test, Median test, and test based on Kendall’s T Test of randomness. (20L)
--------------- 32 L
References:
1. Gibbons, J.D. ; Non-Parametric Statistical Inference, Mc Graw Hill2. Goon, A.M., Gupta, M.K. & Dasgupta, B : An Outline of Statistical Theory , Vol. 2 – World Press, Kolkata .3. Goon, A.M., Gupta, M.K. & Dasgupta, B : Fundamentals of Statistical Theory , Vol. 1 – World Press, Kolkata.4. Rohatgi, V.K. : An Intro. to Prob. Theory and Mathematical Statistics, John Wiley.5. Rohatgi, V.K. :Statistical Inference.6. Rao, C.R.: Linear Statistical Inference.
Large Sample Methods (30 marks) Max. : 40 L
Large Sample Methods : Use of CLT for deriving large sample tests for binomial proportions, differenceof two binomial proportions, mean of a population and difference of means of two independentpopulations. Related confidence inter. (5 L)Large sample standard error ;derivation of large sample standard error of an estimator (T 1, T2 …. , TK ) off( Ө1, Ө2 ,… , ӨK ), sample moments, standard deviation, coefficient of variation, b 1 and b2 measures andcorrelation coefficient. Uses of these standard errors in large sample tests and interval estimation, test ofnormality. (12L)
Transformation of statistics to stabilize variance : derivations of sin -1, square-root, logarithmic and z –transformation and their uses in large sample tests and interval estimation. (8L)Derivation of the large sample distribution of Pearsonian X 2 – statistic and its uses in test of independence,homogeneity and goodness of fit. (8L)
---------------------- 33 L
Honours Course in StatisticsUniversity of Kalyani
H - 15

References:
1. Cramer, H. : Mathematical Methods of Statistics, Prince ton University Press.2. Goon,A.M., Gupta, M.K. & Dasgupta, B : An Outline of Statistical Theory , Vol. 2 –
World Press, Kolkata . 3. Goon,A.M., Gupta, M.K. & Dasgupta, B(2001) : Fundamentals of Statistic s, Vol. 1– World Press.
4. Rao, C.R. : Advanced Statistical Methods for Biometric Research. 5. Rao, C.R.: Linear Statistical Inference and its application.
6. Kendall, M.G. & Stuart, A. (Vol. 1)
Statistical Quality Control (20 marks ) Max. : 20 L
Concepts of quality and quality control, process control and product control. (3L)
Process control : Charts and their uses, choice of subgroup sizes, construction and interpretation of x, R, s.d.,p, np and c charts with fixed and variable subgroup sizes. Modified control charts. (6L)
Product Control : Acceptance sampling plan, single and double sampling plans b y attributes, OC, ASN (andATI), AOQ curves, LTPD and AOQL Plans for single and double sampling by attributes, single sampling planfor inspection by variables (one–sided specification, known and unknown cases). Use of IS Plans and tables.
(11L) ____________
20 LReferences:
1. Goon,A.M., Gupta, M.K. & Dasgupta, B(2001) : Fundamentals of Statistics, Vol. II – WorldPress, Kolkata.
2. Duncan, A.J. : Quality Control and Industrial Statistics. 4 th edition, Taraporewale & sons.3. Montgomery, D.C. : Introduction to the Statistical quality cont rol. 2nd edition. John Wiley &
Sons.
Honours Course in StatisticsUniversity of Kalyani
H - 16

Paper X (Prac.)
Gr. A : Econ. + Demo. +SQC
Gr. B : ANOVA + Design + Sample Survey + Non -Para
Paper XI(Prac.)
Computer Application
A: C – Programming :
Programming preliminaries in C : Structure of the language, lexical elements of C,Programming environment in C, operators and modes of arithmetic expressions.
Input-Output in C : Input – output functions and their format specifica tions,C control structure : unconditional (go to) control, conditional (if else) control, loop control for loop, while loop,do-while loop.
C functions ; library functions, user -defined functions, functions declaration.
Problems by C-Programming i) Interpolation by Newton’s forward and Lagrange’s formula. ii) Numerical integration by Trapezoidal and Simpson’s 1/3 rd rule.
iii) Solution of transcendental equations by bisection, iteration and New ton- Raphson methods.iv) Factorial of a positive integer.v) Ordering of a given set of numbers.vi) Mean, variance and quantiles for ungrouped data.vii) Correlation coefficient for ungrouped data.viii) Fitting of straight line and exponential curve to given data.ix) Fitting of binomial and Poisson distributions.x) Calculating correlation coefficient for grouped data.xi) Inverting non-singular matrices (upto order 4).
Honours Course in StatisticsUniversity of Kalyani
H - 17

B : Use of Statistical Software : Max. 20 L
1. MS- Excel
i) Use of Spreadsheet.ii) Drawing of diagrams – bar, columns, line, pie, scatter.iii) Use of function : Mathematical , Statistical and logical.iv) Line diagrams showing different types of time series data, determination of trend by moving averages and curve fitting methods, plot ting fitted values.v) Exponential smoothing of a time series.
2. MINITAB
Use of MINITAB package using the option under ‘CALCULATION’ and ‘STATISTICS’Some Suggested problems :
i) Basic statistics – Display, descriptive measures (univariate only), one sample Z and t tests, two sampleand paired t tests for proportion, tests for one and two variances and correlations.
ii) Regression : Linear & Multiple regression – fitted and residual plots.iii) ANOVA – one- way and two-way classified data.iv) Control charts – Mean- Range, Mean –SD, proportion, no. of defectives, number of defects charts.
References:
1. E.Balagurusamy: Programming in ANSI C , 3 rd Ed., Tata Mc Graw Hill Publishing Co.2. Gottfried : Programming with C3. Jayasri ; The C language trainer with C graphi cs and C++.4. Kernighan and Ritchie : The C programming language.
Honours Course in StatisticsUniversity of Kalyani
H - 18