university of nairobimechanical.uonbi.ac.ke/sites/default/files/cae/engineering...i am also grateful...
TRANSCRIPT

University of Nairobi
School of Engineering
A STUDY OF FATIGUE AND FRACTURE CHARACTERISTICS IN THE
HAZ OF AA7075 ALLOY
BY
Rotich Kiplangat Sammy
F56/75499/2014
A Thesis submitted in partial fulfillment of the requirements for the degree of Master of Science
in Mechanical Engineering, in the Department of Mechanical and Manufacturing Engineering of
the University of Nairobi
February 2017

ii
DECLARATION

iii
DEDICATION
This thesis is dedicated to my family for their support, patience and love during the entire period
of this study. This thesis is also dedicated to Prof. Rading who has been a great source of
inspiration and motivation.

iv
ACKNOWLEDGEMENTS
I would like to thank the following people who played a pivotal role to the success of this
research. They contributed and extended their valuable assistance at one point or another during
the course of this study. First, I would like to offer my profound gratitude to Prof. G .O. Rading
for his unrelenting support, guidance and patience throughout the course of this study. I am also
grateful to Prof. F.P.L. Kavishe for his guidance and offering valuable insights to the project. I
also acknowledge with gratitude the guidance and effort of Dr. L. Chown who was instrumental
in this project.
I would also like to acknowledge the African Materials Science Engineering Network (AMSEN,
A Carnegie-RISE Network) under the coordination of Prof. Rading for the financial support
during the entire period of this course.
I am also grateful to the support offered by the technical staff at the University of Nairobi,
Mechanical engineering workshop in many ways during the experimentation and setting up stage
of the various tests. My deep gratitude goes to Mr. Njue for his assistance during the polishing of
the specimens.
Finally, I thank my family for their love, patience and encouragement.

v
Anti-Plagiarism Statement

vi
ABSTRACT
The fatigue and fracture characteristics of the heat affected zone (HAZ) of AA7075 have been
studied comprehensively. To determine the effects of the thermal peak temperature on the fatigue
and fracture characteristics of AA7075 in T651 temper condition, a number of tests were carried
out. Both experimental and theoretical work was carried out in this study. The HAZ was
simulated by subjecting the specimens to predetermined thermal cycles in a muffle furnace. This
enabled an effective approach in studying the specimen as a whole and also gave a thorough
understanding of the fatigue crack growth (FCG), fatigue strength and impact toughness
properties in relation to the microstructure of the different parts of the HAZ. This enabled the
weakest region of the HAZ to be identified. In this study, the HAZ was divided into five regions.
The muffle furnace was heated up to the peak temperature and the specimens inserted for 60
seconds as earlier determined in actual welding. Since the specimens have thin cross-sections of
1.6 mm in addition to high conductivity of aluminium metal, the specimen were assumed to have
reached the peak temperature after 60 seconds. The specimens were then removed and left to
cool in open air. The emphasis was placed on the effects of the HAZ peak temperature on the
fatigue and fracture characteristics.
The optical micrographs of the base metal (BM) and the five regions of the HAZ were studied
using a universal optical microscope (OPTIKA B-353 MET) and the micrographs were taken at a
magnification of X200. The fatigue crack growth (FCG) characteristics of the BM and the five
regions of the HAZ were obtained through cyclic loading at an R-ratio of 0.2. The fatigue crack
growth threshold, test was obtained by successive reduction of the by no more than
10% for every three successive readings. High cycle fatigue test was carried out in a rotating
fatigue machine (SM1090) to determine the fatigue strength across the HAZ. The fatigue

vii
strength was approximated at 107
cycles. A linear interpolation scheme was used in
approximating the stress level between a specimen that failed and one run-out specimen. The
hardness profiles across the base metal and the HAZ regions were carried out using a digital
Vickers macrohardness tester, LV 800. The impact toughness properties were determined using
the Izod impact machine. The Hounsfield tensometer was used to carry out tensile tests. The
tensile tests were carried out to determine tensile properties in the longitudinal direction of the
BM and five parts of the HAZ. The impact toughness data and the (0.2%) yield strength from
tensile test were used to calculate the approximate plane strain fracture toughness of the BM
and five regions of the HAZ.
The properties of region „E‟ were found to be consistently lower in the major tests that were
carried out. Region „E‟ was 5 mm from the weld centerline and received a peak temperature of
590◦C. It had the lowest FCG resistance and also exhibited low fatigue strength properties. These
were consistent with the low hardness and coarse microstructure found in this region. It had the
lowest hardness of 112 HV and ASTM Grain Size Number of 10.420 (48µm). There was drastic
drop in tensile properties from towards the weld centerline. The proof stress dropped from 380
MPa at a distance of 11 mm from the weld centerline to 185 MPa at a distance of 5 mm to the
weld centerline.
In this study, region „E‟ was confirmed to be the weakest link in the HAZ which is significantly
affected by the thermal cycle. The weakness is caused by dissolution of strengthening phases.
The degradation of the strengthening phases occurs severely at 590◦C due to dissolution of the
major strengthening phase, . There is evidence of high grain growth in this region as evidenced
by the optical micrographs and the average grain size number. The hardness in the HAZ of
AA7075-T651 depends on the interplay between precipitate dissolution and reprecipitation.

viii
NOMENCLATURE
a Half crack length for central crack
d Distance from the crack tip
da/dN Crack growth rate(length per cycle)
K Stress intensity factor (MPa√m)
KIC Plane strain fracture toughness
KC Fracture toughness
Range of stress intensity factor
Effective range of stress intensity factor
η
η‟ Semi coherent
N Number of cycles
R Stress ratio
T‟ ( ( ) )
T6 Solution heat treated and then artificially aged

ix
ABBREVIATIONS
ASTM American Society for Testing and Materials
BM Base Metal
FCG Fatigue Crack Growth
FL Fusion Line
FSW Friction Stir welding
GP Guinier Preston
GMAW Gas Metal Arc Welding
GTAW Gas Tungsten Arc Welding
HAZ Heat Affected Zone
LEFM Linear Elastic Fracture Mechanics
SEM Scanning Electron Microscope
SSS Supersaturated Solid Solution
TMAZ Thermo-Mechanically Affected Zone
WM Weld Metal
WN Weld Nugget
WRS Weld Residual Stresses

x
TABLE OF CONTENTS
DECLARATION ...................................................................................................................... ii
DEDICATION ........................................................................................................................ iii
ACKNOWLEDGEMENTS .................................................................................................... iv
Anti-Plagiarism Statement........................................................................................................v
ABSTRACT............................................................................................................................. vi
NOMENCLATURE .............................................................................................................. viii
ABBREVIATIONS ................................................................................................................. ix
TABLE OF CONTENTS ..........................................................................................................x
LIST OF TABLES .................................................................................................................xiv
LIST OF FIGURES ................................................................................................................ xv
CHAPTER ONE: INTRODUCTION ......................................................................................1
1.1 Background .......................................................................................................................1
1.2 Statement of the Problem ...................................................................................................3
1.3 Objectives of the Study ......................................................................................................4
1.4 Limitations of the Study .....................................................................................................5
CHAPTER TWO: LITERATURE REVIEW ..........................................................................6
2.1 The Hardening and Precipitation Sequence of AA 7xxx .....................................................6
2.2 Welding of 7xxx Aluminium Alloys ..................................................................................7
2.3 Microstructural Evolution During Welding ........................................................................9
xi
2.4 HAZ Strength and Hardness ............................................................................................ 10
2.5 Fatigue Crack Growth Characteristics .............................................................................. 12
2.6 Crack Closure .................................................................................................................. 15
2.7 Effect of Welding on Fatigue Crack Growth (FCG) Characteristics ................................. 16
2.8 High Cycle Fatigue .......................................................................................................... 18
2.9 Effect of Welding on the Fatigue Strength ....................................................................... 19
2.10 Effect of Welding on Impact Properties ......................................................................... 21
2.11 Summary of Literature Review ...................................................................................... 23
CHAPTER THREE: EXPERIMENTAL TECHNIQUES .................................................... 25
3.1 Introduction ..................................................................................................................... 25
3.2 The Materials and Preparation of Specimens .................................................................... 25
3.3 Fatigue Crack Growth Testing. ........................................................................................ 28
3.3.1 Fatigue Crack Growth Testing Method ...................................................................... 28
3.3.2 Fatigue Crack Growth Test Rig ................................................................................. 30
3.4 Fatigue Strength Testing .................................................................................................. 32
3.4.1 Fatigue Strength Testing Method ............................................................................... 32
3.4.2 Fatigue Strength Testing Machine ............................................................................. 33
3.5 Microstructure Characterization ....................................................................................... 34
3.5.1 Optical Microscopy ................................................................................................... 34
3.5.2 Average ASTM Grain Size Number .......................................................................... 35

xii
3.6 Hardness Testing ............................................................................................................. 36
3.7 Tensile Testing ................................................................................................................ 37
3.8 Impact Testing ................................................................................................................. 38
CHAPTER FOUR: RESULTS ............................................................................................... 39
4.1 Introduction ..................................................................................................................... 39
4.2 Optical Microscopy.......................................................................................................... 39
4.3 Fatigue Crack Growth (FCG). .......................................................................................... 43
4.4 Hardness Profile .............................................................................................................. 53
4.5 Tensile Properties ............................................................................................................ 54
4.6 Impact Test ...................................................................................................................... 55
4.6.1 Izod Impact Energy ................................................................................................... 55
4.6.2 Plane Strain Fracture Toughness KIC ......................................................................... 56
4.7 Fatigue Strength ............................................................................................................... 58
CHAPTER FIVE: DISCUSSION ........................................................................................... 60
5.1 Introduction ..................................................................................................................... 60
5.2 Thermal Cycle Simulation ............................................................................................... 60
5.3 Microstructural Characterization ...................................................................................... 62
5.4 Hardness Profile .............................................................................................................. 63
5.5 Fatigue Properties ............................................................................................................ 64
5.5.1 Fatigue Crack Growth ............................................................................................... 64

xiii
5.5.2 Fatigue Strength ........................................................................................................ 67
5.6 Impact Strength ............................................................................................................... 68
5.7 Tensile Properties ............................................................................................................ 69
CHAPTER SIX: CONCLUSIONS AND RECOMMENDATIONS ..................................... 70
6.1 Conclusions ..................................................................................................................... 70
6.2 Recommendations............................................................................................................ 71
REFERENCES ........................................................................................................................ 72
APPENDICES ......................................................................................................................... 86
Appendix A: ASTM Grain Size Number Data ....................................................................... 86
Appendix B: Hardness Values ............................................................................................... 86
Appendix C: Impact Toughness ............................................................................................. 86
Appendix D: Fatigue Crack Growth Data for the BM and the HAZ of AA 7075-T651 ........... 87
Appendix E: Published Paper From This Work ...................................................................... 99

xiv
LIST OF TABLES
Table 3.1: Chemical composition of the tested material (wt %) ................................................. 25
Table 4.1: FCG Parameters ∆K TH, C and m for the BM and the different regions of the HAZ. .. 52
Table 4.2: Longitudinal tensile properties of the base metal and five regions in the HAZ of
AA7075-T651. .......................................................................................................................... 54
Table 4.3: Izod impact test data, proof stress and calculated KIC for the base metal and the five
regions in the HAZ of AA7075-T651. ....................................................................................... 57
Table 4.4: Fatigue strength of the base metal and various parts of the HAZ of AA7075- T651. . 58

xv
LIST OF FIGURES
Figure 2.1: Typical fatigue crack propagation Curve [53] .......................................................... 15
Figure 3.1: Thermal simulations cycles obtained by Sakwa [21] ................................................ 26
Figure 3. 2: Welding arrangement showing position of the thermocouples from the weld
centerline. ................................................................................................................................. 27
Figure 3. 3: Peak temperature vs distance from the weld centerline ........................................... 28
Figure 3. 4: Center Cracked Tension specimen for fatigue crack growth tests (dimensions in
mm.) ......................................................................................................................................... 30
Figure 3.5: Fatigue crack growth test rig ................................................................................... 31
Figure 3.6: Cantilever specimen for fatigue testing (Dimensions in mm) ................................... 32
Figure 3.7: Rotating bending fatigue testing machine (SM1090). .............................................. 34
Figure 3.8: The Optical microscope connected to a computer [100]. .......................................... 35
Figure 3.9: Vickers Macro hardness tester LV 800. .................................................................. 37
Figure 3.10: Tensile test specimen (Dimensions in mm) ............................................................ 38
Figure 4.1: Microstructure of the base metal .............................................................................. 40
Figure 4.2: Microstructure for region „B‟.................................................................................. 40
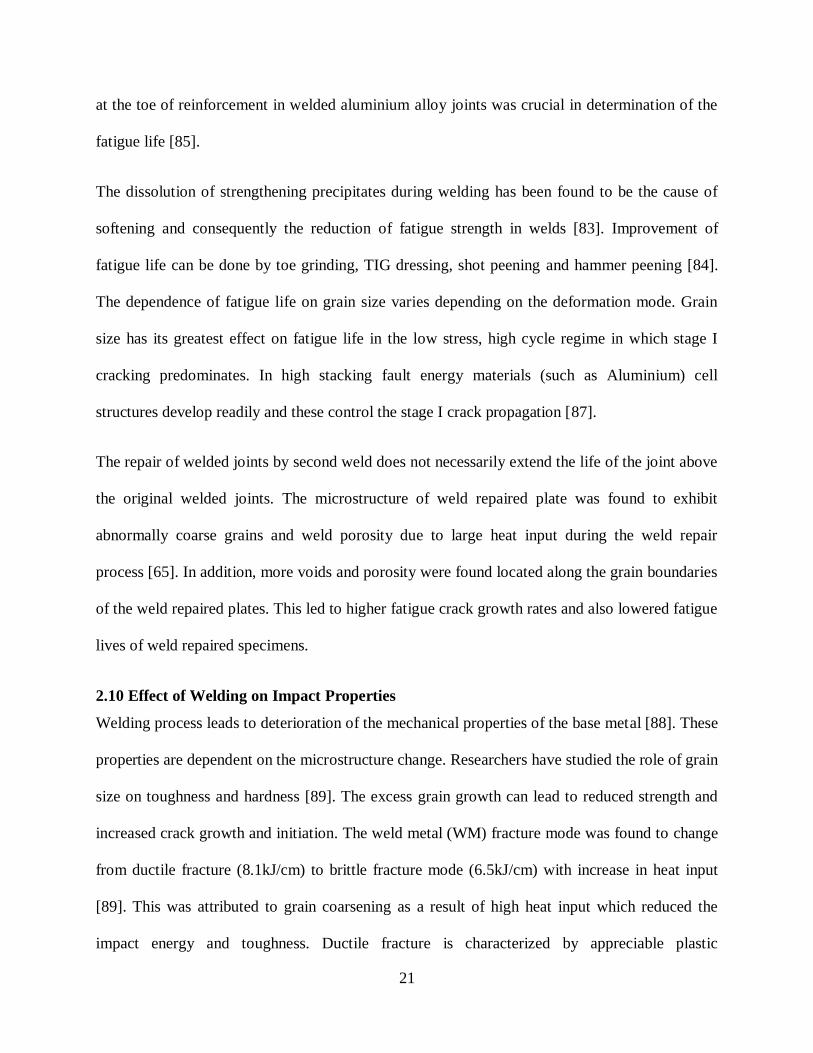
Figure 4.3: Microstructure for region „C‟. ................................................................................. 41
Figure 4.4: Microstructure for region „D‟. ................................................................................. 41
Figure 4.5: Microstructure for region „E‟. .................................................................................. 42
Figure 4.6: Microstructure of region „F‟. ................................................................................... 42

xvi
Figure 4.7: Average ASTM grain size number of the base metal and the five regions of the HAZ.
................................................................................................................................................. 43
Figure 4.8: Fatigue crack growth curve for the base metal ........................................................ 44
Figure 4.9: Fatigue crack growth in region „B‟. ......................................................................... 45
Figure 4.10: Fatigue crack growth curve for region „C‟. ............................................................ 46
Figure 4.11: Fatigue crack growth curve for region „D‟ ............................................................. 47
Figure 4.12: Fatigue crack growth curve for region „E‟. ............................................................ 48
Figure 4.13: Fatigue crack growth for region „F‟. ...................................................................... 49
Figure 4.14: Comparison of the FCG curve for the base metal and region „F‟ of the HAZ ......... 50
Figure 4.15: FCG curves for the base metal and various regions of the HAZ. ........................... 51
Figure 4.16: Graphical representation of Vickers Hardness Numbers across the HAZ of AA7075-
T651. ........................................................................................................................................ 53
Figure 4.17: Proof stress of the base metal and five regions of the HAZ in the longitudinal
direction .................................................................................................................................... 55
Figure 4.18: Representative graph of impact energy across the HAZ of AA 7075-T651. ........... 56
Figure 4.19: The fatigue strength of the base metal and the five regions of the HAZ.................. 59

1
CHAPTER ONE
INTRODUCTION
1.1 Background
High strength lightweight aluminium alloys especially 7xxx series are used in construction of
aircraft, automobiles, armoured fighting vehicles and high speed trains and boats due to their low
density, high specific strength and excellent corrosion resistance [1]. Due to the lightweight
nature of aluminium alloys, they offer economies in transport and increased mobility in light
armoured vehicles [2]. The main alloying elements in 7xxx aluminium alloys are zinc and
magnesium. A range of intermetallic compounds may form during solidification depending on
alloy composition and solidification conditions. Mechanical properties, formability and fracture
behaviour of polycrystalline materials such as aluminium alloys are influenced by the presence
of intermetallic compounds and whether they are precipitated at the grain boundaries or within
the grain [3, 4].
For some applications, 7xxx aluminium alloys are joined by welding [5]. The use of welding
offers the additional benefit of mass saving and elimination of fastening techniques such as
riveting. However during welding, a heat affected zone (HAZ) is created adjacent to the fusion
zone in the weldment. This zone experiences high temperatures but does not melt [6]. Due to
varying temperatures experienced in this zone, microstructures of varying properties are
generated. The strength in the HAZ is reduced due to dissolution of the hardening precipitates
[7]. Research has shown that heat treatable aluminium alloys such as 7xxx gain their strength by
precipitation hardening which is sensitive to thermal influences [8, 9]. The precipitation of
( ) from solution heat treatment during cooling may lower the strength if a large number
of coarse precipitate particles are formed. Two types of Guinier-Preston (GP) zones, considered

2
to be the precursor to the phase, form in different preferential planes of the Al matrix and at
different rates of quenching and aging. In the early stages of solution treatment, and GP zones
are formed [10]. The control of the size and volume fraction of these phases during early stages
of treatment is critical in obtaining optimised properties in 7xxx aluminium alloys. Researchers
have shown that damage during extrusion begins by fracture or decohesion of the inclusions. The
resistance to damage and fracture of aluminium alloys may be strongly influenced by the volume
fraction, shape and distribution of second phase particles [8-11].
The variation of physical and mechanical properties is attributed to various precipitation stages
during multi-stage heat treatment. For AA 7xxx aluminium alloys, the precipitation sequence
from supersaturated solid solution (SSS) may be represented as [2]:
SSS GP zones (semi coherent MgZn2) (incoherent MgZn2)
Rangantha et al. [10] investigating the microstructure of AA 7049 observed fine precipitates of
GP zones distributed homogenously inside the grains of coarse grain boundary precipitates.
The strengthening of the alloy was attributed to the presence of GP zones and metastable phase
Quantitative analysis and thorough understanding of crack initiation and propagation behaviour
is crucial in determining fatigue life of aluminium alloys. During cyclic loading, multiple crack
nucleation sites occur in aluminium alloys [12, 13]. In 2xxx and 7xxx series, multiple fatigue
cracks initiate in the coarse Fe-containing particles or pores due to stress/strain concentration in
these particles. The Fe- and Si-containing particles are the coarse constituent particles in high
strength aluminium alloys [14]. Fe- containing precipitates such as Al7Cu2Fe are relatively

3
brittle. During extrusion and rolling the precipitates fracture resulting in pre-cracks which act as
crack initiation sites in the material [15-17].
The HAZ is a region adjacent to the weld metal zone composed of the base metal that did not
melt but was exposed to high temperatures for a sufficient period so that grain growth and other
microstructural changes occurred. The heat of welding affects the mechanical properties and
microstructure of the HAZ [4, 18-23]. Formation of a broad HAZ during welding causes a coarse
grain structure which has unfavourable mechanical properties. The hardness profile through the
HAZ provides a simple and convenient method for studying the effect of heat during welding
[24]. The weld bead geometry is considered critical in determining the mechanical properties of
the weld [25]. Research has revealed that during welding, bead geometry, microstructure and
chemistry are affected by metal transfer [26].
Several crack initiation processes occur within the welds and the HAZ with separately distinct
implications on the fatigue performance of welded structures [27]. Researchers [27] investigating
the effect of residual stress on fatigue performance of welded aircraft structures reported
although crack initiation was found in the fusion zone, cracks forming at the peak of residual
stresses was located in the HAZ. The low hardness in the HAZ and highest residual stress of 264
MPa in the longitudinal direction was found to be detrimental to fatigue performance in AA
2024-T351 aluminium alloy joints [28].
1.2 Statement of the Problem
It is well known that the welding process negatively affects the grain structure and precipitate
formation and distribution in the microstructure of the heat affected zone in precipitation
hardened aluminium alloys [18-20, 29-31]. Although several studies such as that by Sakwa [21]
characterised the HAZ as a single zone, due to the different temperatures experienced in the

4
HAZ, the affected region consists of graded zones which have different microstructures and
mechanical properties. There are three metallurgically distinct regions in the HAZ: the grain
growth region, the grain refined region and the transition region [32].
This is due to the complex thermal cycle, since all temperatures from the melting range of the
alloy down to much lower temperatures are experienced by the metal. Steep property gradients in
the HAZ make it extremely difficult to study the fatigue properties from an actual weld. The
behaviour of the HAZ with regard to fatigue crack growth characteristics and fatigue endurance
in 7xxx aluminium alloy has not been investigated exhaustively since the HAZ has been treated
as one region during the analysis of fatigue properties in most studies. This study proposes to
address this problem by finding the endurance limit, the fracture properties and the fatigue crack
growth characteristics of the throughout the HAZ regions of aluminium alloy AA 7075- T651.
1.3 Objectives of the Study
The aim of this study was to link the microstructural changes in the heat affected zone to the
fatigue, fracture and hardness characteristics of welded AA 7075 based on the principle that the
heat affected zone (HAZ) is composed of different microstructural regions.
The following specific objectives were identified to achieve this aim.
a) Simulation of five different regions of the HAZ by subjecting five different specimens to
thermal histories as close as possible to thermal histories experienced in actual welding
by the five different regions.
b) Characterization of the microstructure of the base metal (BM) and different regions of the
HAZ in the five simulated specimens using optical microscopy.

5
c) Determination of the fatigue characteristics (i.e fatigue strength and fatigue crack growth)
of the BM and different regions of the HAZ in the five simulated specimens.
d) Characterization of the hardness profiles of the HAZ in order to find the weakest region
of the HAZ.
e) Determination of the fracture energy from impact test results of various parts of the HAZ.
1.4 Limitations of the Study
Fractography studies on the fractured specimen from the impact and fatigue tests were
not conducted due to lack of functioning scanning electron microscope (SEM) locally.
Comparison between simulation done in the muffle furnace and the gleeble simulator (the
gleeble simulator purposely designed for process simulation such as weld HAZ cycles)
would have greatly contributed to the quality of this work. The gleeble simulator could
not be found locally. Moreover the gleeble simulator had the limitation of not being able
to accommodate FCG specimens.

6
CHAPTER TWO
LITERATURE REVIEW
2.1 The Hardening and Precipitation Sequence of AA 7xxx
The 7xxx series aluminium alloys are age-hardenable. Precipitates form during age hardening of
the supersaturated solid solution and as the number and size of precipitates increase, the strength
increases. Overaging will result in reduction of mechanical properties such as toughness, tensile
strength and hardness [3].
Afify et al. [29] reported that the GP zones, and (Mg32 (Al, Zn)49) phases are the most
effective hardening phases in Al-Mg-Zn alloys. The increased density of precipitates was
observed to be responsible for high hardness. The basal planes of the hexagonal precipitates
are partially coherent with the {111} matrix planes but the interface between the matrix and the
c-direction of the precipitate is incoherent [11]. This is responsible for the high hardness. It was
further observed that increasing the aging temperature enhances the precipitates nucleation
process. In 7xxx aluminium alloys, the GP zones and phase form early during the precipitation
process. To obtain optimum properties in these alloys, control of the volume fraction and size of
these phases is critical [21, 22]. Strengthening is attributed to the presence of GP zones and the
metastable in AA7049 [10]. The hardening phase results from GP zones that form on
vacancy-rich clusters from the supersaturated solution [9, 33]. It was observed that for AA 7049
in the T6 tempered condition, a high density of fine precipitates were homogenously
distributed in the aluminium matrix together with small amounts of GP zones and [10]. The
reversion of GP zones during rapid heating, e.g. during welding, makes precipitation of
difficult [34]. Researchers have found that and phases have compositions similar to the
7
MgZn2 and have a hexagonal plate-like structure which grows preferentially on the {111} planes
of the Al matrix [35, 36].
Zinc is the strengthening component in 7xxx series alloys. If the alloy contains more than 3 wt%
Zn with a Zn: Mg ratio > 2, the hardening phase is MgZn2 [37]. Copper increases the quench
sensitivity while a high Zn: Mg ratio allows for homogenous nucleation and decreases the
quench sensitivity [38]. A high Zn: Mg ratio also decreases the size and increases the density of
the precipitates.
2.2 Welding of 7xxx Aluminium Alloys
Welding of 7xxx aluminium alloys such as AA 7075 is difficult due to solidification and
liquation cracking, poor weld zone ductility and susceptibility of the joint to stress corrosion
cracking [2]. Gas metal arc welding (GMAW) and Gas tungsten arc welding (GTAW) are
commonly used. The loss of strength in the weld metal and HAZ is due to dissolution of
strengthening precipitates during welding, while the high cooling rates after the weld cycles do
not favour reprecipitation [37]. In 7xxx aluminium alloys, zinc rapidly forms an oxide during
welding, which affects the surface tension of the weld pool and increases the risk of defects due
to lack of fusion[2]. This can be solved by using a current which is ~10-15% higher than that
used in welding 5xxx alloys [2].
The hot cracking susceptibility of high strength 7xxx series aluminium alloys is strongly affected
by the chemical composition of the weld metal. The crack susceptibility increases with
increasing copper content up to 3 wt % Cu and then decreases with increasing copper content for
copper content higher than 3 wt%. The resistance to cracking is enhanced by grain refining
agents such as Zr [38].

8
As previously mentioned, aluminium alloys such as 7xxx are normally welded by GMAW or by
GTAW. High deposition rates, high welding speeds and deeper penetration are achieved in
GMAW due to the high heat input. However, a high heat input is detrimental to welding of thin
aluminium sheets since it causes distortion and increases the width of the heat affected zone [15].
Alloying elements such as magnesium or zinc may be oxidised during welding and the loss of
magnesium is worst during GMAW [38]. Grain refinement in GTAW increases the resistance to
fatigue crack growth [18]. The heat input can be controlled precisely during the pulsed GTAW
process. GTAW is therefore preferred over GMAW as it produces good quality welds [10, 18,
20]. The pulsing of welding current leads to grain refinement in the fusion zone, HAZ width
reduction, reduction of residual stresses and hot cracking sensitivity [18, 24].
Solid-state welding processes such as friction stir welding (FSW) offers an alternative welding
method for AA 7075. FSW is a fairly new technique developed by The Welding Institute (TWI)
in Cambridge, UK in 1991 [40]. The technique is widely used in joining light metals since it has
improved weld properties, reducing solidification cracking and porosity in the weld metal [19]. It
achieves the solid phase joining by locally introducing frictional heat due to tool rotation and
plastic flow which causes a change in the local microstructure [41]. The welding temperature
does not cause melting but it is high enough to cause dissolution and overaging of strengthening
precipitates. The FSW technique has been successfully used to weld dissimilar alloys such as AA
6061 and AA 7075 [42].

9
2.3 Microstructural Evolution During Welding
Reduction in mechanical properties such as hardness, tensile strength and fatigue strength in the
HAZ of weldments is associated with microstructural evolution during welding [2, 15, 16, 30,
31]. The heat input in arc welding is proportional to the welding voltage and current and
inversely proportional to welding speed. With high heat input, a wider HAZ is generated due to
the high conductivity of the base metal. The increased number of coarse grains in the wider HAZ
is detrimental to mechanical properties [5]. The temperature variation in pulse welding leads to a
continuous change in the weld pool size and shape, which favours growth of new grains [20]. At
a given frequency, long pulse duration produces a coarser grain structure than shorter pulse
duration [22]. With increased heat input, the grains in both the fusion zone and HAZ were
reported to coarsen, and the HAZ width increased [22].
In welding of heat treatable aluminium alloys such as 7xxx, there is a significant change in
micro-hardness in the weld zone, fusion boundary and the HAZ compared to the base metal.
Researchers [5, 16] have reported low hardness in the weld zone. The hardness increases in the
fusion boundary due to finer grains and subsequently decreases in the HAZ due to coarser
elongated grains, segregation of intermetallics to dendrite boundaries and dissolution of
strengthening precipitates [43]. Mechanical properties in the weld zone depend on the grain size
and the unfavourable mechanical properties of the weld zone are due to the coarse grain sizes. In
FSW, the weld zone is stirred and therefore has finer grains but generally the hardness is lower
than that of the base metal [23]. Therefore welding of Al alloys should be done by using
minimum heat input which can be controlled by optimum process parameters.

10
A study of AA7039 heated in the 204-315°C temperature range showed a drop in hardness which
could not be restored by natural or artificial post-weld aging. The reduction of mechanical
properties was due to loss of coherency between the precipitate and the matrix [5].
The weld nugget (WN), thermo-mechanically affected zone (TMAZ), heat affected zone and the
flow arm zone have been observed in friction stir welds [39]. The flow arm zone at the top of the
weld has fine grains. The WN consists of fine equiaxed grains which indicated that
recrystallisation and limited grain growth had taken place [44]. Researchers investigating the
stability of nugget zone in high strength aluminium friction stir welds reported that the weld
nugget zone grain structures are inherently unstable and abnormal grain growth occurred in the
entire weld nugget [45]. Although friction stir welded joints are free of solidification-related
defects since no melting takes place, they are prone to defects such as pin hole tunnel, piping
defect, zig-zag line cracks and kissing bond defects [46]. Kissing bond defect are defects in solid
state bonding in which two solid materials are in contact but with little or no metallurgical
bonding present. This is attributed to improper flow of the metal and insufficient consolidation in
the weld nugget region [46].
2.4 HAZ Strength and Hardness
Metallurgical transformations in the HAZ are affected by welding temperature, the type of
welding process and associated parameters which determine the final microstructure. High heat
input and preheating leads to deterioration of strength and increase in HAZ width [9]. The HAZ
loses its strength due to either precipitate growth or transformation when the alloy is at high
temperature. The width of the HAZ was found to decrease with decrease in heat input [4]. The
behaviour of Al-Mg-Zn alloys such as AA7075 is different, as age hardening occurs at room
temperature and there is no over-ageing effect. Properties of the HAZ can almost be recovered

11
by natural ageing or artificial ageing of the joint. High strength alloys such as AA 7075, AA7079
and AA7178 suffer from liquation cracking and reduction of strength in the HAZ [16]. Low
micro-hardness has been found in the HAZ of AA 7039 [5]. The hardness increases towards the
fusion boundary due to finer grains and decreases in the HAZ due to coarse grains [37]. The
degree of hardening depends on the number, size and distribution of the precipitates. The sudden
high heat input is detrimental to the strengthening precipitates of the alloy, which results in
softening in the HAZ [5, 15, 31].
In the base metal adjacent to the fusion zone line, coarse and intermediate sized second phase
particles segregate to the grain boundaries. The slow dissipation of heat generated during
welding can result in grain coarsening. The fusion zone of a hybrid laser/GMA welded AA 7075
had the lowest microhardness in the weldment [4]. This was attributed to alloying elements
segregating in the dendritic phase rather than forming precipitates during solidification. The
alloying elements then concentrate along the dendrite grain boundaries, forming secondary
phases, whereas depletion of the alloying elements occurs inside the dendrite branches. The
micro-segregation cannot be modified by ageing treatments and therefore softening dominates in
the weld fusion zone [4].
Tensile fracture was found to occur at the retreating side of the TMAZ, which coincided with
minimum hardness and maximum tensile residual stress [44]. The thermal history, superplastic
deformation and microstructural changes, such as grain refinement and dissolution/coarsening of
precipitates, govern the microhardness and strength across the weld in friction stir welds [46].
Friction stir welding generates a region of low hardness in the weld centre which extends to the
transition zone of the TMAZ and the HAZ. The decrease in HAZ hardness was ascribed to the
coarsening and dissolution of the strengthening precipitates [47]. Hardness can be used as a

12
reliable method of estimating the yield and tensile strength of the HAZ [48]. Both tensile
strength and hardness reduce to a minimum at a distance from the fusion line in the HAZ due to
overaging consequent to the transformation of the strengthening metastable precipitates [49].
2.5 Fatigue Crack Growth Characteristics
Some welded components are subjected to cyclic loading in service. Therefore a thorough
understanding of the underlying mechanisms of fatigue failure is critical for the safe design of
structures and components. In engineering components, fatigue crack nucleation occurs
predominantly from inclusions, dents or voids [50]. Constituent particles in Al alloys provide
sites for fatigue crack nucleation. In high strength Al alloys such as AA 7075, there are mainly
two forms of coarse constituent particles i.e. the Fe- or Si- containing particles. The Fe-
containing particles are brittle and can be fractured during rolling or extrusion processes, forming
initiation sites for fatigue cracks [5, 12-14, 31, 43, 44, 46, 50]. Research has shown that fatigue
cracks can also be initiated from non-fractured particles in high strength Al alloys [50].
Researchers investigating an AA 7475 thermo-mechanically processed aluminium alloy found
that crack initiation occurred in surface grains which are characteristic of high purity metals and
alloys where there is a low concentration of impurities for crack nucleation [51].
The fatigue crack growth rate of a component subjected to constant amplitude stress reversal is
expressed in terms of the crack length increment per cycle, ⁄ [52]. When the applied stress
is held constant, the rate of growth of a fatigue crack increases with increasing number of cycles.
Linear elastic fracture mechanics is used for small applied cyclic stresses and a small plastic
zone formed ahead of the crack is in an otherwise elastic field [53].

13
Welding affects the microstructure of the material which in turn influences the fatigue properties
of the material [43]. The crack initiation stage is absent in welded structures due to micro-
imperfections such as voids, cracks, impurities and inclusions [38, 53]. For cyclic variation of the
imposed stress field, the LEFM characterization of the rate of fatigue should be based on the
stress intensity factor range, [53]:
where Kmax and Kmin are the maximum and minimum values of the stress intensity factor. The
most accepted approach to fatigue crack propagation by use of linear elastic fracture mechanics
is the semi-empirical Paris power law [54]:
⁄ ( )
where C and m are the material parameters. The values of m are between 2 and 10 for most
metals. These constants are influenced by material microstructure, the environment, temperature
and the load ratio. The stress ratio is defined as the minimum stress intensity factor ( )
divided by the maximum stress intensity factor ( ) [53]:
Equation 2.3 is applicable for single mode of far field loading and fixed loading and fixed values
of R.
The fatigue failure normally involves two major stages. The first stage is the crack initiation,
which involves microstructure growth based on persistent slip band mechanism whereas the
second stage is crack propagation where LEFM principles can be applied [53]. The sum of the

14
cycles spent in these two stages constitutes the total fatigue life. A typical fatigue crack
propagation curve is shown in Figure 2.1 [55] where three regions are distinct. In Region I there
is a threshold stress intensity factor below which there is no crack growth or the crack growth is
too small to be measured. The fatigue threshold also depends on the frequency of loading and
environmental conditions and decreases with an increase in stress ratio R [56]. It has been
postulated that the fatigue cracks cease to propagate when the extent of the plastic zone becomes
comparable to some characteristic microstructural dimension [57].
Region II is linear in the log-log scale and the LEFM condition deals with crack propagation in
this region by the Paris law. The fracture surface in this region is normally characterised by
ripples or striations whose spacing may be correlated to average crack growth rates [53]. Fatigue
crack growth becomes faster than predicted by the Paris law in Region III as the stress intensity
factor range increases, approaching the value of fracture toughness (Kc). Forman et al. [58]
proposed the following relationship to describe fatigue in regions I and III:
⁄
( )
( )
where R is the stress ratio. The above relationship accounts for stress ratio effects, while the Paris
law assumes that ⁄ is dependent on only.

15
Figure 2.1: Typical fatigue crack propagation Curve [53]
2.6 Crack Closure
Critical links have been sought between fatigue, fracture mechanics and crack closure mechanics
[59, 60]. Elber proposed that premature contact between the crack faces can occur even during
the tensile portion of the fatigue cycle because of a zone of residual plastic deformation left in
the wake of the crack tip arising from prior plastic zones [60]. Crack closure and opening has
been attributed to crack tip blunting and strain hardening. Elber postulated that crack closure
decreased the fatigue crack growth rate by reducing the effective stress intensity range. He
introduced a new stress intensity range, the effective intensity range to be used in the Paris
equation:
...................................................... [2.5]
where is the maximum stress intensity, is the stress intensity at which the crack
opens, U is the empirical relationship between and
16
The corresponding characterisation of fatigue crack growth rates can then be obtained by
adjusting the Paris-Erdogan equation to [54]:
⁄ ( )
( ) ....................................... [2.6]
Under plane strain conditions obtained at near threshold stress intensities, plasticity induced
crack closure (PICC) plays a less significant role [61]. Other than PICC, roughness induced
crack closure, viscosity induced crack closure, oxide induced crack closure and transformation
induced crack closure have been researched and documented [62]
2.7 Effect of Welding on Fatigue Crack Growth (FCG) Characteristics
Welded components and machine parts find applications in areas where the stress is constantly
varying in magnitude and direction. Research has shown that welding has a substantial effect on
the microstructure of the base metal which in turn affects the fatigue properties [40]. Fatigue
damage is generally described as the growth and nucleation of the small cracks to the final
failure [53]. It is widely accepted and proven in research that the initiation stage is absent in
welded structures generally due to micro-imperfections in welds [63, 64].
Research has shown that constant amplitude FCG properties in high strength aluminium alloys
such as the AA 7075 is determined by the microstructure, composition, stress intensity ratio, the
environment, grain size and yield stress [64]. Friction stir welding was found to impart inferior
tensile properties which lowered the elongation of the welded joint and in turn imparts lower
resistance to FCG [52]. The microstructure of the weld region plays a critical role in determining
the mechanical properties of the joint. Mechanical properties of the FSW joints depend on the
structural characteristics of the weld region which in turn depends on the specific thermal
/mechanical cycles imposed during friction stir welding [40]. The crack like defects in weldment

17
begin to grow immediately when subjected to external cyclic fatigue loads, so that, for welded
specimens the total fatigue life is dominated by crack propagation phase [65]. Slight diversity in
microstructure around the notch tip is associated with the difference in fatigue crack initiation
lives [66].
In friction stir welding, fatigue failures have been observed to initiate from surface roughness,
tool marks, flash on the surface of the joint or typical defects such as lack of root penetration
[67]. Studies have established that fatigue failure in friction stir welds occur in the HAZ or at the
weld nugget in discontinuities in material flow pattern [68]. Low cyclic strength and an
elongated grain structure coupled with coarse intermetallic particle distribution, favour crack
propagation in the TMAZ [69].
Researchers investigating effects of weld geometry on fatigue properties of T-weld and
cruciform joints showed that the ratio of the thickness of the main plate and the radius of weld
toe are the critical parameters in fatigue behaviour of such welded joints [70]. Investigations
done on the fatigue crack initiation and propagation behaviours of welded steel tubular structures
reported the crack growth life of 75% to 89% of the total life for all the welded joints tested [71].
Residual stresses are inevitable in the welding process. They have two effects; firstly they
produce distortions and secondly they can be the cause of premature fatigue failure [72]. Weld
residual stresses, (WRS) are quite large and tensile in nature in the vicinity of the weld, where
their magnitude is approximately equal to the yield strength of the weld metal [73].
Investigations have shown that effective stress intensity factor and the effective stress ratio can
be applied to predict fatigue crack growth rate in both tensile and compressive stress field by
using base material‟s crack growth rate data with different stress ratio [74]. During crack growth

18
opening, the crack opening load is required to offset compression at the crack tip caused by the
superposition of clamping force attributed to the residual stress and crack closure [73].
In a review of residual stress and its effect on the fatigue behaviour of Al-5083 and Al-7020
welded components, it was reported that the magnitude of WRS reached up to 0.2 times the yield
limit in the HAZ of as welded joints [75]. Hole drilling method was applied with strain gauge
rosettes to measure WRS in a position approximately 1.0 mm from the weld toe. The stresses
were found to be between 120 MPa and 140MPa [75]. Researchers investigating Al-5456-H117
butt welded plate reported that the difference in the FCG properties of the base metal, the HAZ
and the weld metal was as a result of the difference in the WRS [76].
2.8 High Cycle Fatigue
The methods for characterising high cycle fatigue in terms of nominal stress amplitude emerged
from the works of Woehler (1860) while working on fatigue of alloys in railroad bogey axles, as
reported by Suresh [53]. Fatigue data is usually conveniently presented in the classical form of
stress-life(S-N) or strain life curves as first adopted by Woehler. The graphical S-N curve is a
plot of the number of loading cycles that a specimen can withstand before failure. The test
specimens are machined to provide a waisted (hour glass) cylindrical gauge length which is
tested in rotating bending mode.
Some materials such as mild steels exhibit a „knee‟ in the S-N plot below which the specimen is
assumed to have infinite life(i.e the curve decreases asymptotically to a horizontal constant
amplitude stress value ) [77]. The endurance limit is ~35% to 50% of the tensile strength for
most steels and copper alloys [53]. Many high strength steels and aluminium alloys do not
exhibit a fatigue endurance limit. The endurance limit is therefore defined as the stress amplitude
which the specimen can support for at least 107
fatigue cycles [53]. In most engineering designs

19
the assumption was made that any cyclic stress below the fatigue limit does not affect the
component. Recent studies [78] have, however, indicated that fatigue failure in aluminium alloys
can occur at 109 fatigue cycles, which contradicts the work of Woehler. High strength aluminium
alloys such as AA7075 used in the aircraft or automotive industry are subjected to high cyclic
loading in service, involving high frequency vibrations. Whereas it is time consuming and
impractical to carry out fatigue tests to the gigacycle regime, most components and structures in
service are often loaded beyond 108 cycles [79].
The fatigue strength of AA 7075, which was found to be superior among the high strength
aluminium alloys, was attributed to the higher tensile strength [78]. An analysis of the fractured
surface of AA7075 fatigued at 225 MPa to 7.6 x 10⁶ cycles revealed micro-voids which
coalesced to form macroscopic cracks [57]. For high cycle fatigue, Wang et al. [80] found the
crack initiation sites in ferrous alloys were located at a porosity or inclusion in the interior of the
specimen.
There are two design philosophies applied by aerospace engineers in order to determine the
operating lives for aluminium based aerospace alloys: damage tolerance and safe life approach.
In damage tolerance approach, the S-N fatigue performance dictates initial inspection intervals.
For repeat inspections, however, fatigue crack growth and fracture toughness properties are the
primary factors taken into consideration [53, 81].
2.9 Effect of Welding on the Fatigue Strength
Although tensile tests are the most popular type of material test, fatigue strength is very
important from the viewpoint of strength design because most of the fracture is due to fatigue
failure. Welding introduces the presence of porosity and reduced mechanical properties in the
weld metal [49]. The weld imperfections reduce the fatigue crack propagation life and fatigue
20
strength in welded components. Research has shown that undercuts and solidification cracks are
more damaging than embedded porosity [65]. It was further demonstrated that decreasing the
stress concentration and increase in fatigue strength could be achieved by improving the weld
geometry. The residual stress, bending stress and dissimilar mechanical properties of weld metal
and the HAZ decreases the fatigue strength of the welded structures. The effect of plate thickness
on stress intensity factor and fatigue strength is less significant compared to that of weld flank
angle and weld toe radius [82].
The fatigue strength at 107 cycles of FSW butt joints were about 40% of the ultimate tensile
strength (UTS). Improved fatigue strength was obtained at a welding rotation speed of 1000
r/min and travel speed of 80 mm/min indicating that the energy input has a significant effect on
fatigue behaviour of welds [83]. Some researchers have reported that high temperature cycle in
welding process and the discontinuous microstructure between the base metal and weld area
weakens the fatigue strength of the welded structure significantly [84]. The fatigue cracks were
found to propagate directly from the welding defects for welded specimen compared to the
parent metal [83]. In AA 7075 researchers have found that dissolution of strengthening
precipitates ( ) in the HAZ lead to reduction in hardness [47].
Researchers investigating the effect of distributed porosity on the fatigue resistance of Al-5083
double V-groove butt weld joints found that welds with their reinforcement removed were more
sensitive to porosity compared with the weld with weld reinforcement intact. When relatively
higher level of weld inner defects such as inclusions, porosity, lack of penetration and fusion
exist, welds with bead reinforcement removed exhibit shorter fatigue life than those with beads
on. Biaxial loading and the combined effect of a solidification crack and a circular porosity was
reported to reduce the fatigue crack propagation life [65]. Some studies concluded that the angle
21
at the toe of reinforcement in welded aluminium alloy joints was crucial in determination of the
fatigue life [85].
The dissolution of strengthening precipitates during welding has been found to be the cause of
softening and consequently the reduction of fatigue strength in welds [83]. Improvement of
fatigue life can be done by toe grinding, TIG dressing, shot peening and hammer peening [84].
The dependence of fatigue life on grain size varies depending on the deformation mode. Grain
size has its greatest effect on fatigue life in the low stress, high cycle regime in which stage I
cracking predominates. In high stacking fault energy materials (such as Aluminium) cell
structures develop readily and these control the stage I crack propagation [87].
The repair of welded joints by second weld does not necessarily extend the life of the joint above
the original welded joints. The microstructure of weld repaired plate was found to exhibit
abnormally coarse grains and weld porosity due to large heat input during the weld repair
process [65]. In addition, more voids and porosity were found located along the grain boundaries
of the weld repaired plates. This led to higher fatigue crack growth rates and also lowered fatigue
lives of weld repaired specimens.
2.10 Effect of Welding on Impact Properties
Welding process leads to deterioration of the mechanical properties of the base metal [88]. These
properties are dependent on the microstructure change. Researchers have studied the role of grain
size on toughness and hardness [89]. The excess grain growth can lead to reduced strength and
increased crack growth and initiation. The weld metal (WM) fracture mode was found to change
from ductile fracture (8.1kJ/cm) to brittle fracture mode (6.5kJ/cm) with increase in heat input
[89]. This was attributed to grain coarsening as a result of high heat input which reduced the
impact energy and toughness. Ductile fracture is characterized by appreciable plastic

22
deformation prior to and during the propagation of the crack whereas brittle fracture is
characterized by rapid crack propagation with no gross deformation and very little
microdeformation. The fracture stress of a material that undergoes plastic deformation before
fracture is greater than that of a brittle material [87]. The impact energy decreases with increase
in heat input in both the weld metal (WM) and the HAZ [90, 91]. However, the impact energy of
the WM is lower compared to HAZ. This is caused by the defects in the weld metal that cause
stress concentrations inducing cracks near defects at the time of impact tests. Charpy impact tests
on the welded AA 6082 aluminium alloy showed that the weld metal had low impact energy of
6.9 J while the HAZ had 13 J [49]. Defects such as porosity in the weld metal caused lower and
scattered impact properties than those of the HAZ [49].
Researchers studying the impact toughness of butt welded joints in a titanium alloy, found the
WM to have the highest impact energy followed by the HAZ and the base metal [92]. The
fractographic observation was found to concur with the findings. The weld metal had a tortuous
appearance. The high energy absorbed by the weld metal was due to the long distance covered
by the crack before fracture. The small dimples were observed in the WM compared to the HAZ
and the BM. The WM exhibited a ductile fracture surface which was attributed to large grains.
For a given metallurgical condition, the impact toughness is inversely related to the grain size
[91]. The post weld heat treatment improves the impact properties. The toughness of the HAZ
was found to increase with PWHT duration in P-91 steel welds [93].

23
2.11 Summary of Literature Review
In the utilization of aluminium alloys such as AA7075 in structural and components application,
one difficulty to be overcome is the deterioration of the mechanical properties in the HAZ and
the weldment compared to the base metal. The mechanical properties of the HAZ deteriorate due
to welding thermal cycles. The resulting microstructure in the HAZ is heterogeneous and the
properties differ too. The weakest region in a weldment has been found to be in the HAZ in most
of the research that has been carried out. The thermal conditions and the peak temperature
experienced govern and play a role in the resulting metallurgical structure, mechanical
properties, residual stresses and distortion. Regulating heat input during welding is critical for
the optimization of the HAZ strength.
The hardness in the HAZ decreases as the fusion zone is approached. This is due to the
coarsening of the microstructure, segregation of the strengthening precipitates into the grain
boundaries and the dissolution of strengthening precipitates. The region with the lowest hardness
is also found to be consistent with the lowest FCG resistance and also the fatigue strength.
Welded components and structures experience cyclic loads in service and fail due to fatigue. A
substantial part of the fatigue life may be taken up during the propagation of a crack under cyclic
loading. The crack initiation stage is absent in welded structures due to micro-imperfections. The
LEFM characterisation of the rate of fatigue is based on the stress intensity factor, . Paris Law
is the most widely used and accepted approach to fatigue crack propagation analysis by use of
LEFM. The applied stress ratio can have a significant effect on the crack growth rate. The Paris
law can be modified to include the dependence on the crack growth rate of the stress ratio by
using Elber‟s crack closure technique.

24
It has been demonstrated that the fatigue crack growth, fatigue strength, hardness and impact
properties are governed by the microstructure. Whereas coarse microstructure has low hardness
and yield strength, the ductility is increased which in turn improves the impact properties.
The review reveals that welding affects the microstructure, mechanical properties and fatigue
properties of the HAZ. Moreover, it is clear that the heat experienced by the HAZ is responsible
for the observed changes. Since different parts of the HAZ attain different peak temperatures, it
should be expected that the effects (on microstructure and properties) will be different in
different regions of the HAZ. These differences have not been adequately addressed in the
literature. It was the purpose of this study to address this shortcoming.

25
CHAPTER THREE
EXPERIMENTAL TECHNIQUES
3.1 Introduction
The experimental work that was undertaken involved: thermal heat treatment simulating heat
flow condition during welding, microstructural characterization (Optical), and mechanical tests
(fatigue crack growth, fatigue strength, Impact tests and hardness). The main aim of this work
was to establish the fatigue and fracture properties across the HAZ of AA7075 in T651 temper
condition.
3.2 The Materials and Preparation of Specimens
The material used for this experiment was AA7075-T651.The material was purchased from the
Good Fellow Cambridge Ltd in the UK and was supplied in form of plates and rods. The plates
were supplied in 1/16-inch thick Alcad sheet of 250 mm by 100 mm. The rods had 12.7 mm
diameter and a length of 500 mm. The material was supplied in T651 temper condition from the
manufacturer. T651 temper condition is obtained by solution heat treatment at 510-515 ◦C for
2hrs followed by 525-530◦C for 14 to 20hrs and then water quenching. Aging treatment is done
at room temperature for 12 to 24 hrs or at 150-155◦C for 20 hrs. The chemical composition of the
materials in weight percent as provided by the supplier is given in Table 3.1.
Table 3.1: Chemical composition of the tested material (wt %)
Mtl Al Si Fe Cu Mg Mn Cr Ti Zn
AA7075 Bal 0.09% 0.28% 1.4% 2.7% 0.03% 0.19% 0.03% 5.9%
Since the whole specimen was inserted in the muffle furnace, the residual stresses were assumed
to be negligible. The specimens‟ heating cycles were simulated in a muffle furnace with a peak

26
temperature of 1300oC. The simulations were done after machining of the specimens. The
furnace was very accurate and could be programmed to attain different temperatures in a short
time. The muffle furnace was heated up to the peak temperature and the specimens inserted for
60 seconds. It was then removed and left to cool at room temperature. The simulation done was
one that resulted in as close as possible to the thermal cycle histories in Figure 3.1. The thermal
histories had been obtained in an earlier study by Sakwa [21] by actual welding obtained using
alternating current gas tungsten arc welding (GTAW) with the torch mounted on a carriage.
Welding was done using a 2.6mm 2 percent thoriated tungsten electrode with a 50-degree tip
with the arc gap preset to 2mm. Welding was done parallel to the rolling direction.
Thermocouples were mounted at different distances from the weld centerline as shown in Figure
3.2.
Figure 3.1: Thermal simulations cycles obtained by Sakwa [21]

27
Figure 3.2: Welding arrangement showing position of the thermocouples from the weld
centerline.
The regions of the HAZ were denoted with alphabetical letters „A‟ to ‟F‟; ‟A‟ was the base
metal, „B‟ represented a distance of 15mm from the weld centerline with the peak temperatures
of 250 C during the welding process (TC#6), „C‟ represented a distance of 11mm from the weld
centerline with a peak temperature of 325 C during welding process (TC#5), „D‟ represented a
distance of 6 mm from the weld centerline with a peak temperature of 498 C during the welding
process (TC#3), ‟E‟ represented a distance of 5mm from the weld centerline with a peak
temperature of 590 C during the welding process (TC#2) and „F‟ represented a distance of 4mm
from the weld centerline with peak temperature of 650 C during the welding process (TC#1).
Figure 3.3 shows the variation of the peak temperature with distance from the weld centerline.

28
Figure 3.3: Peak temperature vs distance from the weld centerline
3.3 Fatigue Crack Growth Testing.
3.3.1 Fatigue Crack Growth Testing Method
Center cracked specimens were used for the BM and the five regions of the HAZ. The specimen
dimensions are as shown in Figure 3.4. The specimens were prepared according to the ASTM
E647 procedure [94]. The edges of the pre-crack were then polished to have a smooth scratch
free surface so as to enable the viewing and measurement of the crack as it progressed during the
fatigue test. Three specimens were prepared for each region of the HAZ and the BM. The fatigue
crack growth test for this experiment was set to give a small stress ratio R, equal to 0.2. Two
experiments were carried out during the fatigue crack growth test; constant load test and the

29
decreasing load test. The constant load test was carried out to determine values of C and m while
the load shedding test was done to determine the threshold value of the stress intensity factor,
∆Kth. The load shedding test was carried out by decreasing ∆P by not more than 10% after every
three successive readings according to the ASTM E-647 standard [94].
The crack growth rate da/dN, in mm/cycle was obtained by the secant method as outlined in
ASTM E-647 standard [92]. The corresponding stress intensity factor, ∆K, was calculated from
the average crack length during the interval ai-ai-1 (where ai is the final crack length and ai-1is the
initial crack length) according to the equation below [94].
⁄ √
(3.1)
where is the difference between the maximum and minimum force in the cycle, B is the
specimen thickness (1.6mm), a is the half crack length and W is the width of the specimen which
is 100 mm.

30
Figure 3.4: Center Cracked Tension specimen for fatigue crack growth tests (dimensions in mm.)
3.3.2 Fatigue Crack Growth Test Rig
Fatigue crack growth test rig designed and constructed at the University of Nairobi mechanical
engineering workshop by Rading [99] was used. The details of the crack growth test rig and
assembly drawing are documented in the reference [99]. The crack growth test rig as shown in
Figure 3.5 was used for FCG testing. The test rig is a cam operated eccentric arm machine. It
comprises of load arms like those commonly used in tensile testing machines. One of the load
arms is connected to a 5,000 N capacity load cell while the second load arm is connected to the
cam mechanism for holding the specimen. The cam is driven by a 4 kW, 1,498 rpm motor. The
eccentric arm connected to the cam converts the rotary motion of the motor into oscillatory
motion of the driving force. The load was applied by tightening the nut located on one of the
load arms. The load applied was displayed on a control panel fitted to the machine. The crack
growth was measured using a travelling microscope accurate to 0.1 mm.

31
Figure 3.5: Fatigue crack growth test rig

32
3.4 Fatigue Strength Testing
3.4.1 Fatigue Strength Testing Method
High cycle fatigue was carried out to determine the approximate fatigue strength in the HAZ of
AA7075. Step loading method was used to approximate the fatigue strength [95]. For purposes
of this study, the fatigue strength was defined as the alternating stress that causes the material to
fail in 107
cycles. At least 3 specimens were used for each case. The first was tested at a stress
level estimated to cause failure at a value of stress close to 107 cycles. The second specimen was
tested at a stress approximately 7% lower than the first. If the second specimen had a run-out (i.e
did not fail after more than 107
cycles), the fatigue strength was determined by interpolation
between the two results. The third specimen was then used to confirm the result. If the second
specimen failed, the stress was reduced by a further 7%, and the process repeated until a run-out
occurred. The 7% step was chosen due to the stepwise nature of the testing machine. The
specimen used for fatigue strength testing is as shown in Figure 3.6.
Figure 3.6: Cantilever specimen for fatigue testing (Dimensions in mm)

33
The specimen was machined at the Numerical Machining Complex Centre Ltd, Nairobi. CNC
machines were used in turning the rod from 12.7 mm to 8.95 mm and consequently in reducing
the neck to 4.05 mm.
3.4.2 Fatigue Strength Testing Machine
Rotating bending fatigue testing machine (SM1090) supplied by TecQuipment Ltd in the UK
and shown in Figure 3.7 was used to test the fatigue limit. It has two main parts: a main unit and
a separate control and instrumentation unit. The main unit has a motor that rotates the test
specimen under constant load (stress). The motor turns a coupling and a short driveshaft. The
driveshaft turns the collet type chuck that grips the „driven end‟ of the test specimen with
uniform pressure around its circumference. This is important because it gives an even stress
distribution on the specimen and grips it with minimum eccentricity. At the „loading end‟ of the
specimen, an adjustable „dead weight‟ applies a vertical (downwards) load on the specimen. It
does this through a self-aligning bearing inside a gimbal.
A sensor counts the rotations (cycles) of the specimen and a load cell measures the force that is
applied to the specimen. A display panel shows the load, speed of rotations (cycle rate) and the
cycle count.

34
Figure 3.7: Rotating bending fatigue testing machine (SM1090).
3.5 Microstructure Characterization
3.5.1 Optical Microscopy
The metallographic specimens were prepared from cut out pieces of the material from the BM
and the five parts of the simulated HAZ. The preparation of the specimens involved sectioning,
mounting, grinding, polishing and etching. The specimens for hardness were similarly prepared.
The specimens were embedded in resin for ease of handling. The specimens were ground starting
with coarse grinding and ending up with the fine grinding using a series of silicon-Carbide (SiC)
papers of increasing fineness (grades 240, 320, 400, 600) under a flow of running water. The
specimen was cleaned in between each paper finish to remove any grit and ground in a different
direction in the next. The samples were then successively polished on a rotating wheel covered
with a suitable cloth impregnated with a polishing diamond paste of 6µm, 1µm and alumina

35
(Al2O3 slurry) of 1/4µm. The specimens were then etched in proprietary etchant patented at the
University of Nairobi and optical micrographs taken with the optical microscope.
3.5.2 Average ASTM Grain Size Number
The optical micrographs of the BM and the five regions were obtained. The grain size was
obtained using commercial software, Microstructure characterization software 3.0 (MIC 3.0).
The software uses the ASTM E-112 linear intercept method [96] which is inbuilt in it.
Universal Microscope (OPTIKA B-353 MET) with a maximum magnification of X500 (Figure
3.8) was used to obtain the optical micrographs. A digital camera of resolution 2592 x 1944
pixels connected with USB cable to the computer was used to take the micrographs.
Figure 3.8: The Optical microscope connected to a computer [100].
Microstructural analysis was done using a microstructural characterizer 3.0 (MIC 3.0) software
developed by TCR Advanced Engineering (P) LTD, India. The software has a micrographic

36
image solarizer for identification of phases and grain boundaries. The images can be taken
directly from an attached camera or the images stored in the computer can be used. The MIC 3.0
then creates reports in specified layouts such as „Joint photographic Experts Group (jpeg)‟
format. It also has a file format saving system for all custom reports with Microsoft (MS-Word)
document interface.
3.6 Hardness Testing
The hardness profile was carried out using the Vickers macro hardness tester LV 800 with a test
load of 10 kgf and a dwell time of 15 seconds. The test specimens were placed on the stage and
focusing done to bring images to clear focus using the X20 objective. The hardness values were
read directly from the LCD panel attached to the machine. The indentations were done at
intervals of 1 mm apart and ten indentations were carried out on every specimen. Ten readings
were taken for each sample to get the representative reading and an average was done to get the
hardness value.
The hardness test was conducted on a LV800 digital Macro Vickers Hardness Tester (Figure 3.9)
with a pyramid indenter supplied by LECO Corporation in St. Joseph, Michigan, USA. The
tester has a load capacity of 0.3 kgf to 10 kgf. It is fitted with 10x and 20x objectives and built
with a video adapter. The hardness tester has an inbuilt conversion scale and hence the Vickers
hardness number is directly read from its display panel. The test method is ASTM E92 [101].

37
Figure 3.9: Vickers Macro hardness tester LV 800.
3.7 Tensile Testing
The tensile specimens for the BM and the five regions of the HAZ were machined according to
ASTM E8M standard [97]. The specimens were cut in the longitudinal direction. Figure 3.10
shows the tensile specimen which was used. The Hounsfield tensometer was used for tensile
testing. The equipment was manufactured by Hounsfield Test equipment Ltd in England, UK.
The tensometer has a capacity of 20 kN. The sample is loaded between two grips which are
operated manually.

38
Figure 3.10: Tensile test specimen (Dimensions in mm)
3.8 Impact Testing
The impact toughness test samples were machined and prepared from the AA7075 T651 rods
according to the ASTM E23 [98]. The surfaces of the specimen were polished to eliminate any
surface irregularities that could have affected the results. The impact energy was measured using
Izod impact test machine. The readings were taken directly from the scale attached on the
machine. Three readings were taken for each specimen and the average value calculated.
The Izod impact tester was used to carry out the impact test. The equipment was supplied by
Avery Birmingham Ltd, in UK. The total pendulum weight was 120 ft-lb. The distance between
the impact centre to pendulum revolving center is 0.65 metres and a maximum lift angle of the
machine is 142.5 degrees. The impact energy data was taken by recording the lift and swing
angles of the striking hammer during testing.

39
CHAPTER FOUR
RESULTS
4.1 Introduction
Thermal simulation of the different regions of the HAZ based on peak temperature made it
possible to characterize the HAZ. The mechanical properties deteriorated closer to the weld
centreline as a result of microstructural coarsening. The regions which had the lowest properties
were 4 mm and 5 mm from the weld centreline. However slight improvement in mechanical
properties was experienced closer to weld centreline at 4 mm from weld centreline.
4.2 Optical Microscopy
Optical microscopy was carried out on the BM and the five regions of the HAZ of AA7075
which had been simulated and the results are as shown in Figures 4.1 to 4.6. The orientation of
the specimen was in the longitudinal transverse direction (L-T). The grains were found to have
an orientation parallel to the rolling direction. The process of rolling stretching to relieve stresses
gives the material pan shaped grains as evident in the micrographs.
The optical microstructure of the base metal (Figure 4.1) consists of fine insoluble second phase
precipitates dispersed in various locations of the elongated grain. The insoluble precipitates have
been identified in literature as the and the strengthening precipitate [40].
There is evidence of microstructural evolution for the regions „B‟ to „F‟ (Figures 4.2 to 4.6)
which have more distinct grain boundaries compared to the base metal. Regions „B‟ to „F‟ show
that the grain boundaries are enlarged as a consequence of the precipitation along the grain
boundary.

40
Figure 4.1: Microstructure of the base metal
Figure 4.2: Microstructure for region ‘B’.
50 µ
50 µ
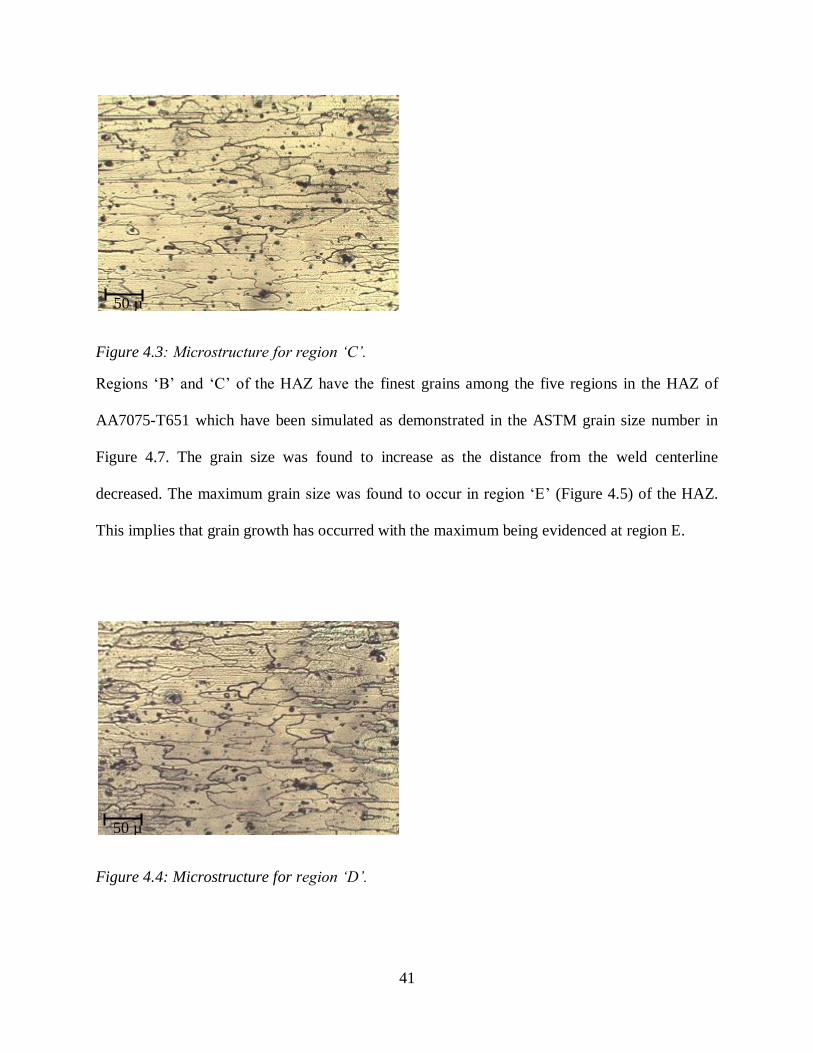
41
Figure 4.3: Microstructure for region ‘C’.
Regions „B‟ and „C‟ of the HAZ have the finest grains among the five regions in the HAZ of
AA7075-T651 which have been simulated as demonstrated in the ASTM grain size number in
Figure 4.7. The grain size was found to increase as the distance from the weld centerline
decreased. The maximum grain size was found to occur in region „E‟ (Figure 4.5) of the HAZ.
This implies that grain growth has occurred with the maximum being evidenced at region E.
Figure 4.4: Microstructure for region ‘D’.
50 µ
50 µ

42
Figure 4.5: Microstructure for region ‘E’.
Figure 4.6: Microstructure of region ‘F’.
50 µ
50 µ
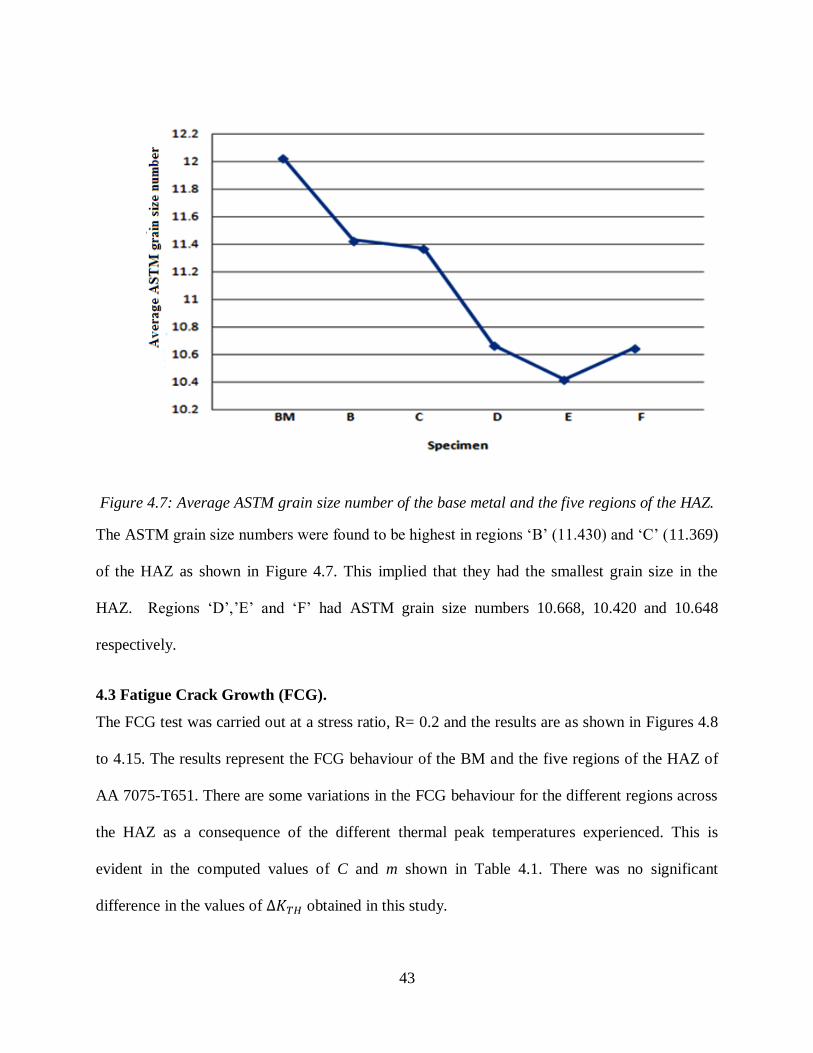
43
Figure 4.7: Average ASTM grain size number of the base metal and the five regions of the HAZ.
The ASTM grain size numbers were found to be highest in regions „B‟ (11.430) and „C‟ (11.369)
of the HAZ as shown in Figure 4.7. This implied that they had the smallest grain size in the
HAZ. Regions „D‟,‟E‟ and „F‟ had ASTM grain size numbers 10.668, 10.420 and 10.648
respectively.
4.3 Fatigue Crack Growth (FCG).
The FCG test was carried out at a stress ratio, R= 0.2 and the results are as shown in Figures 4.8
to 4.15. The results represent the FCG behaviour of the BM and the five regions of the HAZ of
AA 7075-T651. There are some variations in the FCG behaviour for the different regions across
the HAZ as a consequence of the different thermal peak temperatures experienced. This is
evident in the computed values of C and m shown in Table 4.1. There was no significant
difference in the values of obtained in this study.

44
Figure 4.8: Fatigue crack growth curve for the base metal

45
Figure 4.9: Fatigue crack growth in region ‘B’.

46
Figure 4.10: Fatigue crack growth curve for region ‘C’.

47
Figure 4.11: Fatigue crack growth curve for region ‘D’
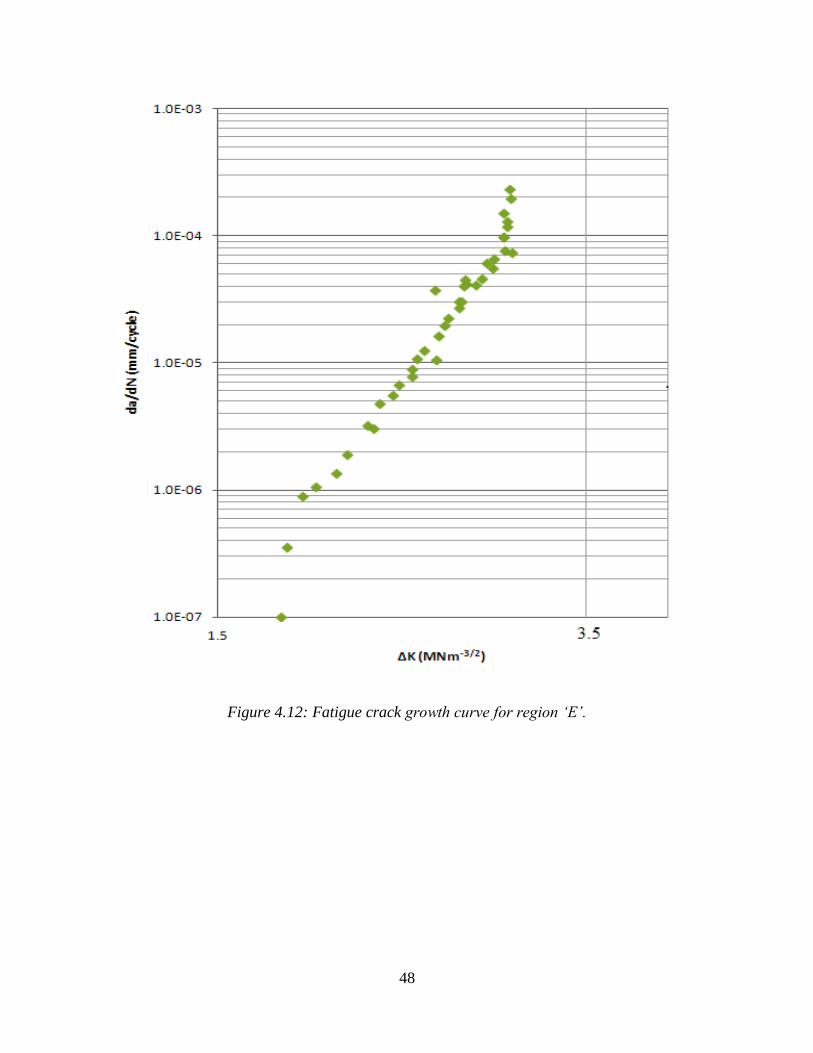
48
Figure 4.12: Fatigue crack growth curve for region ‘E’.

49
Figure 4.13: Fatigue crack growth for region ‘F’.

50
Figure 4.14: Comparison of the FCG curve for the base metal and region ‘F’ of the HAZ

51
Figure 4.15: FCG curves for the base metal and various regions of the HAZ.

52
Table 4.1: FCG Parameters ∆K TH, C and m for the BM and the different regions of the HAZ.
Specimen ∆K TH (MPa√ ) C (with da/dN in mm/cycle
and ∆K in MPa√ )
m
BM 1.7 2.41E-7 4.97
B 1.7 1.32E-7 5.3
C 1.7 3.45E-7 5.12
D 1.7 2.27E-7 5.45
E 1.7 2.10E-7 6.81
F 1.7 1.64E-7 6.56
The FCG graphs of the base metal and the HAZ in Figure 4.15 clearly demonstrates that the
HAZ has varying resistance to crack growth propagation and region „F‟ has the least resistance
to FCG. There is no significant difference in the fatigue threshold, in the HAZ as shown in
Table 4.1.

53
4.4 Hardness Profile
Hardness profile results across the selected regions of the HAZ and the BM of AA7075-T651 are
as shown in Figure 4.16. The general trend in the hardness profile shows that the base metal and
region „B‟ have the highest hardness. Regions „E‟ and F which are close to the weld centerline
exhibit low hardness values. These regions have coarse grained microstructure as is evident from
the grain size number shown in Figure 4.7.
The base metal had a hardness value of 192 HV while region „B‟, „C‟, ‟D‟,‟E‟ and „F‟ had
hardness values of 191 HV, 186 HV, 131 HV, 112 HV and 123 HV respectively. The hardness
slightly rises at region F.
Figure 4.16: Graphical representation of Vickers Hardness Numbers across the HAZ of
AA7075-T651.

54
4.5 Tensile Properties
The results of the longitudinal tensile tests carried out on the base metal and the five regions of
the HAZ are as shown in Table 4.2. Three specimens were tested for each region and the average
value presented. Region B of the HAZ showed a significantly higher proof stress compared to
region E and F which are closer to the fusion line.
Table 4.2: Longitudinal tensile properties of the base metal and five regions in the HAZ of
AA7075-T651.
Region 0.2% Proof stress (MPa) Elongation in 25 mm gauge
length (%)
BM 496 16
B 460 14
C 395 13
D 205 11
E 180 12
F 195 11
Figure 4.17 shows that there is steep decline in the proof stress from region „B‟ of the HAZ to
regions „D‟, „E‟ and‟ F‟. The high temperatures experienced in regions close to the weld
centerline negatively affect the tensile properties.

55
Figure 4.17: Proof stress of the base metal and five regions of the HAZ in the longitudinal
direction
4.6 Impact Test
4.6.1 Izod Impact Energy
The base metal had impact energy of 16 J which was close to that of region „B‟. The results in
Figure 4.18 show that the toughness across the HAZ varies with region „B‟ of the HAZ depicting
higher toughness among the five regions of the HAZ selected for this study. The impact energy
of this region was 15 J. Region ‟D‟ of the HAZ had the lowest toughness as indicated by the
impact energy graph in Figure 4.18. The toughness in region „E‟ and „F‟ were 12 J and 13 J
respectively.
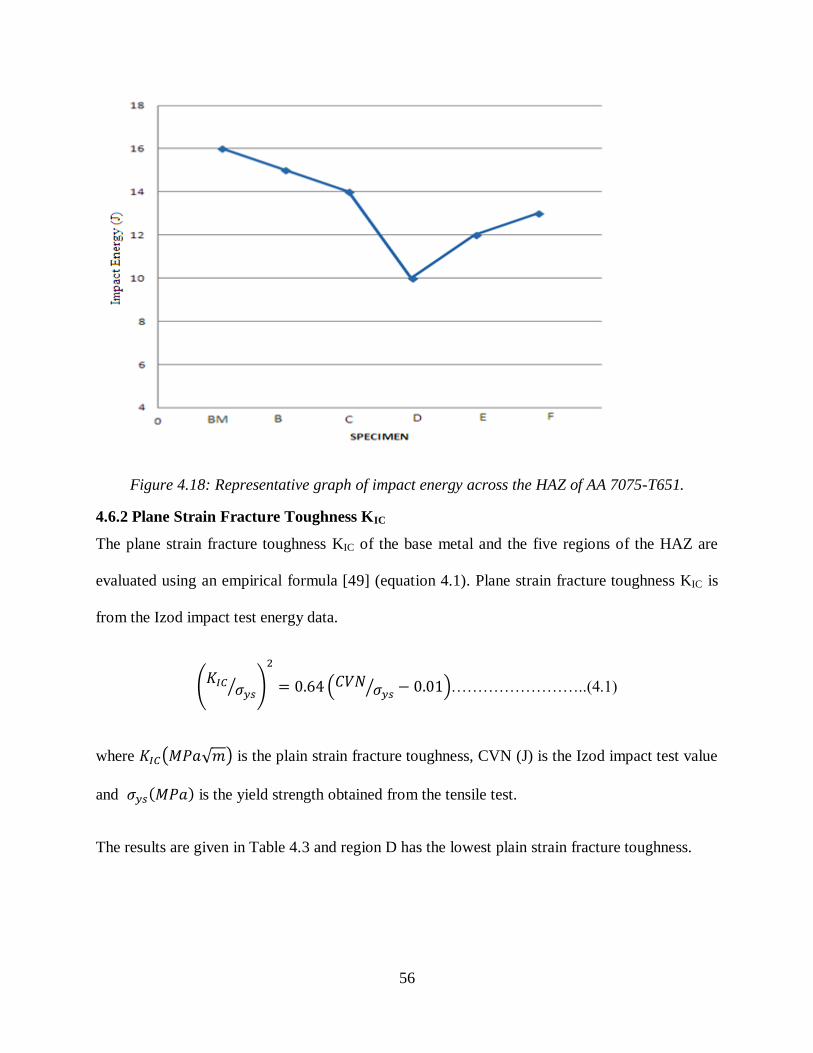
56
Figure 4.18: Representative graph of impact energy across the HAZ of AA 7075-T651.
4.6.2 Plane Strain Fracture Toughness KIC
The plane strain fracture toughness KIC of the base metal and the five regions of the HAZ are
evaluated using an empirical formula [49] (equation 4.1). Plane strain fracture toughness KIC is
from the Izod impact test energy data.
(
⁄ )
(
⁄ )……………………..(4.1)
where ( √ ) is the plain strain fracture toughness, CVN (J) is the Izod impact test value
and ( ) is the yield strength obtained from the tensile test.
The results are given in Table 4.3 and region D has the lowest plain strain fracture toughness.

57
Table 4.3: Izod impact test data, proof stress and calculated KIC for the base metal and the five
regions in the HAZ of AA7075-T651.
Region Izod Impact data (J) (%0.2) Proof stress
(MPa)
Estimated plane strain fracture
toughness KIC ( √ )
BM 16 496 70
B 15 460 65
C 14 395 57
D 10 205 36
E 12 180 37
F 13 195 40

58
4.7 Fatigue Strength
The fatigue strength of the base metal and the various parts of the HAZ are as shown in Table
4.4.The approximate fatigue strength was calculated using linear regression method as already
discussed in section 3.4.1.
Table 4.4: Fatigue strength of the base metal and various parts of the HAZ of AA7075- T651.
Region Stress
(MPa)
Cycles To Failure (x107)
Approximate Fatigue
Strength (MPa)
BM
169 0.973 165
158 1.045 run out
B 164 0.986 163
156 1.12 run out
C 152 1.01 151
140 1.19 run out
D 138 0.9907 134
129 1.012 run out
E 106 1.053 run out 109
115 1.0234
F 120 0.9236 117
112 1.143 run out
The base metal was found to have the highest fatigue strength which varied slightly in region
„B‟. A drastic drop in fatigue strength was experienced in region „E‟ which slightly improved in
region „F‟ as shown in Figure 4.19.

59
Figure 4.19: The fatigue strength of the base metal and the five regions of the HAZ.

60
CHAPTER FIVE
DISCUSSION
5.1 Introduction
Slight differences could occur between actual thermal cycles experienced during actual welding
and thermal cycles experienced in a muffle furnace. The heating rate of the thermal simulator
affects the rate of dissolution and coarsening of precipitates which in turn affect the mechanical
properties. The maximum grain size in this study was encountered in region closer to fusion line
which is attributed to most constituent phases precipitating at the grain boundaries as well as
coarsening due to segregation of second phase particles to the grain boundary. Coarsening causes
the reduction in mechanical properties such as FCG, fatigue strength as well as hardness.
Dissolution of strengthening precipitates influences FCG properties negatively. Precipitate
dissolution occurs as temperatures are exposed to temperatures higher than 400°C.
5.2 Thermal Cycle Simulation
The attempt to replicate near exact thermal history temperatures experienced during welding to a
metallic specimen in a simulator is termed as thermal simulation. During actual welding different
parts of the HAZ experience unique thermal peak temperatures that change with time and the
distance from the weld centerline. The regions closer to the weld centerline experience high
temperatures which significantly drop as the distance increases further away from the weld
centerline. Closer to the base metal, the temperatures are low.
Research efforts have been directed towards modeling of non-isothermal processes such as those
encountered in welding [101]. The application of thermal profiles to simulate actual welding so
as to estimate the properties of the weldment and the HAZ has been investigated by several
researchers [104, 105]. Such studies have given rise to the possibility of replicating similar

61
welding conditions through the use of thermal cycle simulations. A good comparison has been
reported between actual welding and thermal cycle simulation [100].
Thermal cycles occurring during the welding process deviate significantly from equilibrium
processes. The size of the HAZ will be affected by the welding heat input [5]. During actual
welding process, there could be differences between actual thermal cycles and thermal cycles
used in this study. However this is not expected to affect the pattern of HAZ properties since it is
the peak temperature and the time experienced by the specimens at the peak temperature that
play a critical role during precipitate coarsening and grain growth [100].
To obtain good thermal cycle simulations, the rate of heating in the thermal cycle simulator
(muffle furnace) was critical. The heating process in the thermal cycle simulator was selected
such that the simulation effect was as close as possible to the actual welding process. The
specimens were taken through the thermal cycles shown in Figure 3.1 as obtained by Sakwa
[21]. The steepness values of the temperature time curves are as a result of the heating rate of the
thermal cycle simulator. Akhusama [100] reported that the higher the heating rate, the steeper the
gradient and the lower the heating rate the lower the gradient. This is however, in contradiction
to work by other researchers who reported that lower heat input resulted in a steeper thermal
cycle [8]. The crucial parameters characterizing the thermal cycles in the HAZ regions has been
attributed to the peak temperature, the cycle duration as well as the heating and cooling rates
respectively [8].
The rate of dissolution and coarsening of the precipitates which affects the mechanical properties
is greatly influenced by the heating rate of the thermal simulator. The rate of cooling is also
critical as it determines the final microstructure. The specimens were left to cool to room
62
temperature just like in the case of the actual welding process. In thermal cycle simulation, heat
energy is used just like in actual welding. Comparing the actual welding process to thermal cycle
simulation makes the choice of simulation parameters critical. The efficiency of heat transfer,
energy level and energy intensity influences welding speed and the size of the HAZ [21].
Heating rates are crucial due to their effect on the rate of dissolution and coarsening of
precipitates and grain growth.
5.3 Microstructural Characterization
The optical micrographs obtained depict a trend where the grains get coarser as the weld
centerline is approached. The grains are observed to be larger closer to the weld centerline as
shown in Figures 4.5 and 4.6 (which are 4 and 5 mm respectively from weld centerline) as
compared to those which are closer to the base metal. This is supported by the average nominal
grain size numbers of 10.668, 10.420 and 10.648 for regions „D‟, „E‟ and „F‟ respectively
(Figure 4.7). Therefore, the maximum grain size in these regions closer to the weld centerline
could be due to most constituent phases precipitating at the grain boundaries causing grain
growth. Some researchers have found that the coarsening of the microstructure could be due to
segregation of second phase particles to the grain boundary [40]. Most grain growth occurs in the
vicinity of peak temperatures, which fully supports the fact that grain growth is a heat activated
process [21]. Just like in welding process, the thermally simulated specimens with peak
temperatures closer to the weld centerline experience high peak temperatures and thus will be
expected to generate the coarse grain in the HAZ.
The optical micrographs were taken in the L-T direction. The AA7075-T651 is observed to have
elongated pancake-type morphology in the longitudinal direction which could be the result of the
forming process and rolling to obtain the plate shape. Other studies have found a similar

63
microstructure [105]. There are dark etching effects observed on this material which vary in
appearance from one specimen to the other. This is evident from Figures 4.1 to 4.6. The varying
nature of the dark etching effects could be due to dissolution of some phases during the thermal
cycle simulation process.
The thermally simulated temperature closer to the weld centerline, range between the solidus and
the liquidus temperature. The phases with low melting temperatures which had melted may
undergo resolidification while some of the phases may have undergone reversion (coherent
precipitates dissolving as a result of high temperatures) as well [100].
5.4 Hardness Profile
The hardness profile across the HAZ of thermally simulated AA7075-T651 reflects the local
strength of individual regions. The hardness varies across the different regions of the HAZ due to
difference in the thermal peak temperature experienced in each region. There is a gradual
decrease in hardness across the HAZ towards the weld centerline as shown in Figure 4.16.
Region „E‟ was found to have the minimum hardness of 112 HV. Similar observations have been
made in the HAZ by several researchers [4, 5, 21, 100].
In high strength aluminium alloys such AA 7075-T651, the strengthening mechanism is through
the precipitation hardening of metastable constituents. The reduction of the hardness is attributed
to the dissolution of precipitates that were in the parent metal. The hardness in the HAZ has been
reported to be due to interplay between dissolution and reprecipitation which are competing
processes [106]. Precipitate coarsening which is severe in region „E‟ leads to loss of coherency
between the precipitates and its matrix and ultimately the reduction in the mechanical properties.
The high temperatures close to the weld centerline are sufficient to dissolve all the precipitates
and cooling rates are sufficiently rapid to retain alloying elements in the saturated solid solution.

64
Madhusan et al [105] found that the softening in the HAZ was caused by the coarsening of the
metastable phases during welding. The results are similar to those reported by other researchers
investigating AA7039 [5].
There is slight improvement in region „F‟ in hardness and also in other mechanical properties.
Other researchers found a similar trend but no attempts have been made to explain this
phenomenon so far [21, 100]. Some researchers are however convinced that the improved
hardness is due to re-precipitation and age hardening of the strengthening precipitates [20]. In
addition, they also attribute the rise in hardness to low segregation of strengthening phases and
the large fraction of alloying elements remaining in solid solution at the end of the thermal cycle.
The slight improvement observed in region „F‟ of the HAZ in AA 7075-T651 in this study could
be as a result of re-precipitation and age hardening. Detailed investigations using transmission
electron microscopy (TEM) are required to verify this.
5.5 Fatigue Properties
5.5.1 Fatigue Crack Growth
The general trend in the fatigue crack growth shows that different regions of the HAZ exhibit
slightly different resistance to FCG. This is evident from Figure 4.14 which compares the FCG
in the base metal to that of region F. The two regions show the most divergent FCG behaviour.
The base metal had a higher resistance to FCG which can be ascribed to thermomechanical
processing. Table 4.1 shows that the fatigue crack growth exponent m, obtained from the slope of
the FCG curve was smaller in the base metal and regions „B‟ and „C‟ compared to regions „E‟
and „F‟. This clearly indicates that crack growth rate in the region „E‟ and „F‟ is higher compared
to other regions (Figure 4.15).

65
An appropriate thermomechanical treatment results in the precipitates being uniformly dispersed
and finer and the stresses will therefore be uniformly distributed across the specimen, and hence
reduce the stress concentration on insoluble particles. This delays the crack initiation [51].
Region „E‟ and „F‟ had the least resistance to FCG (Figure 4.15). The optical micrographs in
Figures 4.1 to 4.6 revealed that regions „E‟ and „F‟ had coarse grained microstructure. The coarse
grains therefore might have contributed to the weakness in these two regions. Some researchers
[51] have pointed out that coarse columnar grains are more susceptible to solidification cracking
than fine equiaxed grains. This has been attributed to the equiaxed grains being able to deform to
accommodate contraction strains more easily [51]. The relative probability of crack initiation
increases with particle thickness [53].
Researchers have found that the crack growth conditions are directly influenced by the thermal
cycle obtained in the HAZ [23]. The thermal cycle greatly influences the final microstructure
depending on the peak temperature the region received [21]. Other than regions „B‟ and „C‟, the
other regions had decreased hardness which was as a result of the coarsening of the
strengthening precipitates. The dislocation cell structures mask the influence of grain size in high
stacking fault energy materials (such as aluminium) [87]. The dissolution of strengthening
precipitates such as has been reported to greatly influence the FCG negatively [40]. The
size and distribution of precipitates play a critical role in deciding the tensile and
microhardness properties and consequently the FCG properties [38]. Precipitate dissolution
occurs as the particles are exposed to thermal cycle temperatures higher than 400◦C [52]. In this
study regions „D‟ ,‟E‟ and „F‟ were thermally simulated at temperatures above 400◦C. Therefore
the FCG behaviour of regions especially in regions „E‟ and „F‟ was due precipitate dissolution.

66
Although the FCG curve in Figure 4.15 is evidently smooth, regions „B‟ and „F‟ show evidence
of minimal scatter. The slight fluctuation in FCG curves in the HAZ is due to the inhomogeneous
microstructure which results from the welding thermal cycle [66]. During the rolling process, the
intermetallic particles can be crashed in the process, which forms minor cracks. These minor
cracks lead to major cracks during the fatigue cyclic loading and they are more favoured at the
interface between aluminium matrix and the intermetallics such as . It has been
reported elsewhere that constituent particles lead to shorter fatigue life than
since the former are more brittle in nature whereas the latter exhibit more ductility [81].
Generally it is accepted that fatigue crack growth in the Paris regime is weakly dependent on the
materials microstructure. In this study, the microstructure played a key role in the different
properties of the regions of the HAZ. Borrego et al. [110] also found strong material dependence
effects on the fatigue crack growth observed which were related to different closure levels. Some
researchers also found that the crack growth rates varied by a factor of more than 20 at some
values of ∆K. These discrepancies can be attributed to material dependent effects of crack
closure and environment. The crack growth behaviour depends on whether an alloy presents
plasticity induced crack closure only or additionally other retarding mechanisms such as
roughness induced closure [111].
The optimization of microstructural dimensions for improved resistance to crack initiation and
crack growth requires a trade-off in the choice of the grain structure or an appropriate
distribution of the grain structure. Though not significant, an increase in the grain size was found
to coincide with the decrease in FCG resistance as evidenced in region „E‟ and „F‟ of the HAZ.
The coarsening and dissolution of strengthening precipitates are possibly responsible for the
reduced hardness as well as the decrease in FCG resistance in regions „E‟ and „F‟. Some

67
researchers investigating electron beam welded aluminium alloys made a similar conclusion
[113].
5.5.2 Fatigue Strength
High strength aluminium alloys such as AA7075-T651 do not exhibit any kind of an endurance
limit in the S-N curves at 107 cycles. Limited studies on the long life fatigue and near threshold
fatigue crack growth behaviour have been done due to time constraints associated with
conventional testing procedure [78]. It therefore becomes critical to determine the fatigue
strength of the high strength aluminium alloys such as AA7075-T651 in the vicinity of the 107
cycles.
There is significant difference in the fatigue strength across the HAZ of AA7075-T651 as
demonstrated in section 4.5. Research has shown that differences in fatigue strength could be
attributed to microstructure which produces different conditions for crack initiation and
propagation within each specimen [9]. In the regions close to the base metal, the thermal heat
slightly affected the material properties in terms of fatigue strength. The base metal had the
highest fatigue strength of 165 MPa as shown in Figure 4.19 which was estimated using linear
interpolation method. Regions „B‟ and „C‟ had fatigue strength of 163 MPa and 151 MPa
respectively. There was a gradual decrease in fatigue strength towards the weld centerline
showing that the thermal cycle significantly affected the material properties in these regions.
Regions „E‟ and „F‟ exhibited the lowest fatigue strength in the HAZ. This can be attributed to
the precipitate dissolution due to the thermal cycle peak temperatures experienced in this region.
These two regions also had the lowest hardness (Figure 4.16). Some researchers found that the
fatigue failure was caused by formation of a number of voids, their growth and coalescence and
the eventual formation and propagation of macroscopic cracks [78]. The metallurgical

68
transformations in the HAZ of heat treatable aluminium alloys such as AA7075-T651 are
temperature dependent. The welding process and the associated parameters determine the metal
degradation; high heat input and pre-heating deteriorate the fatigue strength and increase the size
of the HAZ [49]. The thermal effects in the HAZ have been demonstrated to induce
microstructural transformation in heat treated aluminium alloys, modifying the mechanical
properties [49].
Formation of low melting intermetallic compounds which segregate along the coarse grain
boundary in the HAZ close to the fusion line could be the cause for the drastic decrease in the
fatigue strength in the regions close to the weld centerline. Lower fatigue lives have been found
to be associated with the Si-bearing particles whereas the Fe-bearing particles were found to
result in longer fatigue lifetimes in Al-Zn-Mg-Cu aluminium alloys [81]. Similar findings have
been reported which showed that when a tensile stress is applied, the grain boundaries could not
resist the stress and tearing occurred [9].
5.6 Impact Strength
The Izod impact test showed that there was gradual decrease in the impact properties from region
„B‟ to region „D‟ as shown in Figure 4.18. The lowest impact toughness was observed in region
„D‟. There was slight improvement in the impact toughness properties in region „E‟ and „F‟. This
can be attributed to the coarse grains which results in improved ductility. The ASTM grain size
number in this region showed they have the coarsest grain size in the HAZ as shown in Figure
4.7.
The microstructural evolution in the HAZ regions closer to the FL gives rise to a structure with
reduced strength but more ductile. Similar findings have been reported by other researchers [49].

69
The reason for the low toughness in region „D‟ can be ascribed to low ductility compared to
region „E‟ and „F‟. The welding process significantly reduces the impact strength as a result of
microstructural changes in the aluminium alloy [88].
5.7 Tensile Properties
Tensile tests were conducted on the base metal and the five regions of the HAZ and the results
were presented in Table 4.2. The results show that the base metal and region „B‟ of the HAZ had
the highest and also the highest % elongation. This shows that the thermal simulation
temperature as outlined in section 3.2 had a slight effect on the mechanical properties of region
„B‟ of the HAZ. Region „E‟ and „F‟ of the HAZ had the lowest compared to the base metal
and other regions in the HAZ. The % elongation also drastically dipped in region „E‟ and „F‟.
This is not a common phenomenon. In most reported results, an increase in proof stress is
accompanied by a decrease in % elongation. The reasons for this phenomenon need to be
investigated. However, Missori et al. [49] reported a similar observation (i.e decrease in both the
proof stress and the % elongation) in the HAZ of AA 6082-T6 which they attributed to overaging
of metastable precipitates in the HAZ.

70
CHAPTER SIX
CONCLUSIONS AND RECOMMENDATIONS
6.1 Conclusions
The following conclusion may be drawn from this study concerning the effects of thermal cycle
simulation on the microstructure, hardness profiles, impact strength, fatigue strength and the
fatigue crack growth resistance in the HAZ of AA 7075-T651.
I. During thermal simulation, the HAZ undergo softening. The minimum hardness
was found in the region 5 mm from the weld centerline which recovered slightly
at 4 mm to the weld centerline. The region which was 15 mm away from the weld
centerline had the highest hardness in the HAZ.
II. Impact toughness was found to be lowest at 6 mm from the weld centerline of the
HAZ. This region receives high temperatures which lead to microstructural
coarsening as evidenced from the ASTM Grain size number.
III. The weakest link in the HAZ was the region which was 5 mm from the weld
centerline since it had the minimum hardness, the coarsest microstructure, low
fatigue crack growth resistance, low fatigue strength and low tensile strength.

71
6.2 Recommendations.
I. This study, through the hardness test, the fatigue strength and the FCG test has
shown that the weakest region in the HAZ is 5 mm from the weld centerline. It
would be interesting to carry out further studies to establish the reason behind this
and also find a suitable joining process or post weld treatment that can eliminate
the weakness in this region.
II. The region which was 6 mm from the weld centerline in the HAZ was found to
have lowest impact toughness and fracture toughness properties. Further studies
need to be carried out to establish the reason behind this phenomenon.
III. Further thermal simulation work should be done and compared between the
simulations done in the muffle furnace and the Gleeble simulator. Although the
main challenge would be fitting the FCG test specimen, other tests such as
hardness, fatigue strength, impact toughness and microstructure characterisation
would bring out the difference if any.
IV. Conduct electron microscopy studies to establish if indeed there is precipitate
dissolution/reprecipitation. Fractography studies may as well be conducted to
establish the fracture mode and the effect of intermetallics and/or precipitates
involved on fatigue failure.
V. Further investigation should be conducted to determine the reason for the
decrease in % elongation as proof stress decreases as the opposite is normally the
case.
72
REFERENCES
1. J. Hirsch, B. Skrotzki and G. Gott, Aluminium alloys; Their Physical and
Mechanical Properties, Wiley-VCH Gmbh & Co. KGaA, Weinheim (2008).
2. A. Romeyn, Welding of Al-Zn-Mg (7xxx) Alloys, Department of Defence,
Materials Research Laboratories Report, (1983).
3. J. E. Hatch, Aluminium: Properties and Physical Metallurgy, American Society
for Metals, Materials Park, OH (1984).
4. B. Hu and I. M. Richardson, Microstructure and Mechanical Properties of
AA7075 (T6) Hybrid Laser/ GMA Welds, Materials Science and Engineering,
459(2007) 94-100.
5. P. Kumar, C. A. Anoop, S. Kumar, Study of Heat Input for GTA Welded
Aluminium Alloy 7039, International Journal of Engineering and Innovative
Technology (IJESIT), 2(2013) 2319-5967.
6. P. Kumar, K. P. Kolhe, M. J Sashikanta and D. Shashal., Process Parameters
Optimization of an Aluminium Alloy with Pulsed Gas Tungsten Arc Welding
(GTAW) Using Gas Mixtures, Materials Sciences and Applications, 2 (2011)
251-257.
7. O. R. Myhr, H. J. Grong, H. G. Fjaer, C. D. Marioara, Modelling of the
Microstructure and Strength Evolution in Al–Mg–Si Alloys during Multistage
Thermal Processing, Acta Materialia, 17(2004) 4999–5008.
8. D. Zervaki and G. N. Haidemennopoulos, Computational Kinetics Simulation of
the Dissolution and Coarsening in the HAZ during Laser Welding of AA 6061-
T6, Welding Journal, 86 (2007) 211s-221s.

73
9. G. M. Dominguez, J. C. Juarez, R.G. Bernal, J. L. Ambriz and E. C. Gomez,
Fatigue Endurance of Welded (GMAW-MIG) Aluminium Alloy 6061-T6 under
Rotating, Int. J. of Emerging Technology and Advanced Engineering, 4(2014)
583-593.
10. R. Ranganatha, V. A. Kumar, V. S. Nandi, R. R. Bhat, B. K. Muralidhara,
Multistage Heat Treatment of Aluminium Alloy AA 7049, Transactions of
Nonferrous Metals Society of China, 23(2013) 1570-1575.
11. S. K. Maloney, K. Hono, I. J. Polmear and S. P. Ringer, The Chemistry of
Precipitates in an Aged Al-2.1Zn-1.7Mg at% Alloy, Scripta Materialia, 41(10),
(1999) 1031-1038.
12. A. Zabett, A. Plumtree, Microstructural Effects on the Small Fatigue Crack
Behaviour of an Aluminium Alloy Plate, Fatigue and Fracture of Engineering
Materials and Structures, 18(1995) 801-809.
13. A. Merati, A Study of Nucleation and Fatigue Behaviour of an Aerospace
Aluminium Alloy 2024-T3, Int. Journal of Fatigue, 27(2005) 33-44.
14. R. Gurbuz, S. P. Alpay, The Effect of Coarse Second Phase Particles on Fatigue
Crack Propagation of an Al-Zn-Mg-Cu alloy, Metallurgical Transactions,
30(1994) 1373-1376.
15. M. Dong, J. Shen, S. Lai and J. Chen, Effect of Heat Input on the Microstructure
and Mechanical Properties of TIG Arc Butt-Welded AZ61 Magnesium Alloy
Plates, Materials Characterization, 60(2009) 1583-1590.
16. T. Kawana and H. Kokawa, A Physical Metallurgy and Materials Science,
Quarterly Journal of the Japanese Welding Society, 1(1983) 392-398.
74
17. J. F. Lancaster, Metallurgy of Welding, 6th Edition. Wood Head Publishing Ltd.
(1999).
18. T. Senthilkumar, V. B. Subramanian and M. S. Babu, Effect of Pulsed Current
GTAW Parameters on Fusion Zone Microstructure of AA6061, Int. J. of Metals
and Materials, 13 (4),(2007) 345-351.
19. W. M. Thomas, E. D. Nicholas, Friction Stir Welding for the Transportation
Industries, Materials and Design. 18(1997) 269-273.
20. G. M. Reddy, A. A. Gokhale and K. P. Rao, Optimization of Pulse Frequency in
Pulsed Current Gas Tungsten Arc Welding of Aluminium Lithium Alloy Sheets,
Material science and technology, 14(1998) 61-66.
21. M. W. Sakwa, An Investigation of Heat Flow, Precipitate Formation and Grain
Growth in the HAZ of Aluminium Alloy Weldment, MSc Thesis, University of
Nairobi, (2000).
22. D. Min, J. Shen, S. Lai and J. Chen, Effect of Heat Input on the Microstructure
and Mechanical Properties of TIG arc Butt-Welded AZ61 Magnesium Alloy
Plates, Materials Characterization, 60 (2009) 1583-1590.
23. B. Parida, M. Mohapatra, P. Biswas and N. Mandal, Study of Mechanical and
Microstructural Properties of Friction Stir Welded Al Alloy, International Journal
of Engineering Technology and Advanced Technology, 2(10), (2012) 2250-2459.
24. M. Chemingui, M. Khitouni, K. Jozwiak, G. Mesmacque and A. Kolsi,
Characterization of the Mechanical Properties Changes in an Al-Zn-Mg Alloy
after a Two-Step Aging Treatment at 70° and 135°C, Materials and Design, 31(
6), (2010) 3134-3139.

75
25. S. C. Juang and Y.S. Tang, Process Parameter Selection for Optimizing the Weld
Pool Geometry in the TIG Welding of Stainless Steel, Journal of Material
Process Technology, 122(1), (2002) 33-37.
26. M. Balasubramanian and V. Balasubramanian, Process Parameter Optimization
of the Pulsed GTAW of Titanium Alloy, Journal of Materials Science and
Technology, 24(3), (2008) 423-426.
27. L. Edwards, M. E. Fitzpatrick, P. E. Irving, I. Sinclair, X. Zhang and D. Yapp,
An Integrated Approach to the Determination and Consequences of Residual
Stress on the Fatigue Performance of Welded Aircraft Structures, Journal of
ASTM International 3(2) (2006) 1-17.
28. G. Bussu and P. E. Irving, The Role of Residual Stress and Heat Affected Zone
Properties on Fatigue Crack Propagation in Friction Stir Welded 2024-T351
Aluminium Joints, International Journal of Fatigue 25(2003) 77-88.
29. N. Afify, A. F. Gaber and G. Abbady, Fine Scale Precipitates in Al-Mg-Zn alloys
After Various Aging Temperature, Material Sciences and Applications, 2(2011)
427-434.
30. J. A. Vergas, J. E. Torres, J. A. Pacheco and R. J. Hernandez, Analysis of Heat
Input Effect on the Mechanical Properties of Al-6061-T6 Alloy Weld Joints, J. of
Materials and Design, 52(2013) 556-564.
31. R. Manti, D. Dwivedi and A. Agrawal, Microstructure and Hardness of Al-Mg-Si
Weldment Produced by Pulsed GTA Welding, International Journal of Advanced
Manufacturing Technology, 36(2008) 263-269.

76
32. G.O. Rading and J.T. Berry, A Model for the Heat Affected Zone Hardness
Profiles in Al-Li-X Alloys, Welding Journal, 77(9), (1998) 383s-387s.
33. L. Katergerman and D. Eskin, Hardening, Annealing and Aging Handbook of
Aluminium, 1, Marcel-Dekkar, Inc, New York, (2003) 881-970.
34. A. Deschamps, Y. Brechet, Influence of Predeformation and Ageing of an Al-Zn-
Mg alloy-II. Modelling of Precipitation Kinetics and Yield Stress, Acta
Materialia, 47 (1), (1999) 293-305.
35. G. Sha, and A. Cerezo, Early-Stage Precipitation in Al-Zn-Mg-Cu alloy (7050),
Acta Materialia, 52 (2004) 4503-4516.
36. A. Bigot, F. Danoix, P. Auger, D. Blarette and A. Reeves, Tomographic Atoms
Probe Study of Age Hardening Precipitation in Industrial AlZnMgCu (7050)
Alloy, Materials Science, 217-222 (1996) 695-700.
37. G. Mathers Welding of Aluminium and Its Alloys. Woodhead Publishing
Limited Cambridge, England (2002).
38. W. Zhou, Problems in Welding of High Strength Aluminium Alloys, Singapore
Welding Society Newsletter, September (1999).
39. M. Sivashanmugam, N. Manaharan, D. Ananthapadmanaban and S. R. Kumar.,
Investigation of Microstructure and Mechanical Properties of GTAW and
GMAW Joints of AA 7075 Aluminium Alloy. International Journal of Design
and Manufacturing Technologies, 3(2) (2009) 536-543.
40. P. Sivaraj, D. Kanagarajan and V. Balasubramanian., Fatigue Crack Growth
Behaviour of Friction Stir Welded AA7075-T651 Aluminium Alloy Joints,
Trans. Nonferous Met. Soc. China, 24(2014) 2459-2467.

77
41. T. Venugopal, K.S. Rao, and K. Prasad Rao, Studies on Friction Stir welded
AA7075 aluminium alloy. Transactions of Indian Institute of Metals, 57(6)
(2004) 659-663.
42. S. Ravikumar, V. Seshagiri and P. V. Pranesh, Effect of Process Parameters on
Mechanical Properties of Friction Stir welded dissimilar materials between
AA6061-T651 and AA 7075-T651 Alloys, International Journal of advanced
Mechanical Engineering, 4(1) (2014) 101-114.
43. A. J. Sunwoo, E. L. Bradley III and J. W. Morris Jr, Effects of Heat-Affected
Zone Peak Temperatures on the Microstructure and Properties of 2090 Al Alloy,
Metallurgical Transactions, 21A (1990) 2795-2804.
44. O. J. Dada, Characterization of Innovative Friction Stir Welding (FSW) Joints for
Aeronautical Structures, MSc Thesis, University of Witwatersrand, (2012).
45. A. A. Hassan, A. F. Norma, D. A. Price and P. B. Prangnell, Stability of Nugget
Zone Grain Structures in High Strength Al-Alloy Friction Stir Welds during
Solution Treatment, Acta Materialia, 51(7) (2003) 1923-1936.
46. S. Rajakumar, C. Muralidharan and V. Balasubramanian, Influence of Friction
Stir Welding Process and Tool Parameters on Strength Properties of AA7075-T6
Aluminium Alloy Joints, Materials and Design ,32(2) (2011) 535-549.
47. P. V. Kumar, G. R. Madhusudhan, and K. S. Rao, Microstructure, Mechanical
and Corrosion Behaviour of High Strength AA7075 Aluminium Alloy Friction
Stir Welds-Effect of Post Weld Heat Treatment, Defence Technology, 11(2015)
362-369.

78
48. P. A. Stathers, A. K. Hellier, R. P. Harrison, M. I. Ripley and J. Norrish,
Hardness-Tensile Property Relationships for HAZ in 6061-T651 Aluminium
Alloy, Welding Journal, 93(2014) 301s-311s.
49. S. Missori and A. Sili, Mechanical Behaviour of 6082-T6 Aluminium Alloy
Welds, Materials Science and Technology, 18(1), (2000) 12-18.
50. D. Zigler, M. C. Montpetit, and W. L. Haworth, Metallography of Fatigue Crack
Initiation in an Overaged High Strength Aluminium Alloy, Metallurgical
Transactions, A 14(1983) 931-938.
51. B. B. Verma, J. D. Atkinson and M. Kumar, Study of Fatigue Behaviour of 7475
Aluminium Alloy, Bulletin of Material Science, 24(2), (2001) 231-236.
52. V. Balasubramanian ,V. Ravisankar, and G. Madhusudhan, Influences of Pulsed
Current Welding and Post Weld Aging Treatment on Fatigue Crack Growth
Behaviour of AA7075 aluminium alloy Joints, International Journal of Fatigue,
15(1) (2007) 315-327.
53. S. Suresh, Fatigue of Materials, 2nd
Edition (1998), Cambridge University Press,
Cambridge, UK.
54. P. C. Paris, M. Gomez and W. E. Anderson, A Critical Analysis of Crack
Propagation Laws in Fracture Toughness and Slow Stable Cracking, ASME
Transactions. J. Basic Engineering 85, (1963) 528-534.
55. ETBX Engineers Toolbox (2015-05-10). Retrieved from www.fea-
optimization.com/ETBX/paris.

79
56. M. Czechowski, Fatigue Life of Friction Stir Welded Al-Mg Alloys, Proceeding
of the 13th International Scientific Conference “Achivements in Mechanical and
Materials Engineering” AMME(2005) Gliwice-Wisla, (2005) 83-86.
57. F. A. McClintock, “On the Plasticity of the Growth of Fatigue Cracks in Fracture
of Solids”, Fracture of Solids, John Wiley & Sons, Inc., New York, 1963.
58. R. G. Forman, V.E. Kearney and R.M. Engle, Numerical Analysis of Crack
Propagation in a Cyclically Loaded Structure, ASME Transactions Journal of
Basic Engineering, 89D (1967) 459.
59. J. Z. Liu and X. R. Wu, Study on fatigue Crack Closure Behavior for Various
Cracked Geometries, Engineering Fracture Mechanics, 57(1997) 475-491.
60. W. Elber, The Significance of fatigue Crack Closure, ASTM STP 486, American
Society of Testing and Materials (Philadelphia), (1971) 230-242.
61. T.C. Lindley and C.E. Richards, The Relevance of Crack Closure to Fatigue
Crack Propagation, Materials Science and Engineering, 14(3) (1974) 281-293.
62. S. Suresh and R.O. Ritchie, Near-Threshold Fatigue Crack Propagation. A
perspective on the Role of a Crack Closure. In Fatigue Crack Growth Threshold
Concepts, The Metallurgical Society of AIME, (1983) 227-261.
63. S. Kou, Welding Metallurgy, John Wiley& Sons (1987).
64. A. O. Kluken and B. Bj Rneklett, A Study of the Mechanical Properties for
Aluminium GMA Weldments, Welding Journal, 76(2), (1997) 39-44.
65. M. S. Alam, Structural Integrity and Fatigue Crack Propagation Life Assessment
of Welded and Weld Repaired Structures, PhD Thesis, Louisiana State
University, (2005).

80
66. L. Zhang, X. Liu, L. Wang , P. Wang and H. Fang, Fatigue Crack Initiation for
Al-Zn-Mg Alloy Welded Joint, Acta Metallurgica, 25(3), (2012) 235-240.
67. S. Lomolino, R. Tovo and J. Dossantos, On the Fatigue Behaviour and Design
Curves of Friction Stir Butt-Welded Al Alloys, International Journal of Fatigue
27(3) (2005) 305–316.
68. D. Booth and I. Sinclair, Fatigue of Friction Stir Welded 2024-T351 Aluminium
Alloy, Materials Science Forum, 396 (4) (2002) 1671–1676.
69. Ali, M. W. Brown, C. A. Rodopoulos and S. Gardiner, Characterization of 2024-
T351 Friction Stir Welding Joints, Journal of Failure Analysis and Prevention
6(4) (2006) 83–96.
70. J. A. Ferrica, and C. M. Branco, Fatigue Analysis and Prediction in Filled
Welded Joints in the Low Thickness Range, Fatigue & Fracture of Eng Materials
and Structures, 13(3), (1990) 201-212.
71. R. D. S. Murthy, P. Gandhi and A. G. M. Rao, A Model for Fatigue Prediction of
Offshore Welded Stiffened Steel Tubular Joints Using FM Approach,
International Journal of Offshore and Polar Engineering, 4(3), (1994) 241-247.
72. C. Weisman, Welding Handbook. Fundamental of Welding, 7th Ed, American
Welding Society, Miami, Florida, 1(1976).
73. R. J. Bucci, Effect of Residual Stress on fatigue Crack Growth Rate
Measurement, Fracture Mechanics, ASTM ASTP 743(1981) 28-47.
74. K. J. Kang, H. Song and Y. Young, Fatigue Crack Growth and Closure
Behaviour Through a Compressive Residual Stress Field, Fatigue and Fracture of
Engineering Materials and Structures, 13(1) (1990) 1-13.

81
75. D. Kosteas, Estimating Residual Stress and Their Effect in Welded Aluminium
Components in Fatigue, ASTM STP 1004 (1988) 122-130.
76. G. E. Nordmark, W. C. Herbein and P. B. Dickerson, Effect of Weld
Discontinuities on Fatigue of Aluminium Butt Joints, Journal of Welding, 66(6),
(1987)162-173.
77. R. L. Carlson and G.A. Kardomateas, An Introduction to Fatigue in Metals and
Composite, Chapman and Hall, London (1996).
78. Q. Y. Wang, T. Li, and X. G. Zeng, Gigacycle Fatigue Behaviour of High
Strength aluminium alloys, Procedia Engineering, 2(2010) 65-70.
79. T. O. Mbuya, Analysis of Microstructure and Fatigue Micromechanisms in Cast
Aluminium Piston Alloys, PhD Thesis, University of Southampton (2011).
80. Q. Y. Wang, J. Y. Berard, A. Dubarre, G. Baudry, S. Rathery and C. Bathias,
Gigacycle Fatigue Of Ferrous Alloys, Fatigue Fracture Engineering and
Materials Structures, 22(1999) 667–672.
81. L. E. Oswald, Effects of Microstructure on High–Cycle Fatigue of an Al-Zn-Mg-
Cu Alloy (Al-7055), MS Thesis, University of Pittsburgh (2003).
82. N. T. Nguyen and M. A. Wahab, The Effect of Residual Stresses and Weld
Geometry on the Improvement of Fatigue Life, Journal of Materials and
Processing Technology, 48(1995) 583-588.
83. H. Das, D. Chakraborty and T. Kumar, High Cycle Fatigue Behaviour of Friction
Stir Butt Welded 6061 Aluminium Alloy, Trans. Nonferrous Met. Soc. China,
24(2014) 648-656.

82
84. H. Chao, Y. Liu, R. Tian and Q. Wang, Gigacycle Fatigue Behaviour in Fusion
Zone and Heat Affected Zone of Q345LA Steel Welded Joints, 13th
International
Conference on Fracture, June 16-21, 2013 Beijing China.
85. W. W. Sanders and F. V. Lawrence, Fatigue Behaviour of Aluminium Alloy
Weldments, Fatigue Testing of Weldments, ASTM STP 648 (1978) 22-34.
86. J. E. Braid, R. Bell and D. V. Milirau, Fatigue Life of As Welded, Repaired and
Hammer Peened Joints in High Strength Structural Steel, Welding in the World,
39(5) 248-261.
87. G. E. Dieter, Mechanical Metallurgy, McGraw-Hill Inc, 3(1986) 417-419.
88. O. Oluwole and O. J. Ajibade, Effect of Welding Current and Voltage on the
Mechanical Properties of Wrought (6063) Aluminium Alloy, Materials Research,
13(2) (2010) 125-128.
89. E. Gharibshahiyan, A. Honarbaksh, N. Parvin and M. Rahimian, The Effect of
Microstructure on Hardness and Toughness of Low Carbon Welded Steel Using
Inert Gas Welding, Materials and Design, 32(2011)2042-2048.
90. J. Wang, Y. Li and P. Liu, Effect of Weld Heat Input on Toughness and Structure
of HAZ of New Super High Strength Steel, Materials Science, 26(3) (2003) 301-
305.
91. W. Shitong, L. Shanping, L. Dianzhoug and L. Yiyi, Impact Property Analysis of
Weld Metal and HAZ for Low Alloy Carbon Steel Multi-Pass Welded Joint,
China welding, 19(1) (2010) 22-28.
92. W. Zhou, and K. G. Chew, Effect of Welding on Impact toughness of Butt Joints
in Titanium Alloy, Materials Science and Engineering, A347 (2003) 180-185.

83
93. D. P. Singh, M. Sharma and J. S. Gill, Effect of Post weld Heat treatment on the
Impact Toughness and Microstructural Property of P-91 Steel Weldment, Journal
of Research in Mechanical Engineering and Technology, 3(2) (2013) 315-321.
94. ASTM E647, Standard Test Method for Measurement of Fatigue Crack Growth
Rates, Annual Book of ASTM Standards, 0.3.01(2006).
95. R. D. Pollak, Analysis of Methods for Determining High Cycle Fatigue Strength
of a Material with Investigation of Ti-6Al-4V Gigacycle Behaviour, PhD Thesis,
Air Force Institute of Technology, Ohio (2005).
96. ASTM E112, Standard Test Method for Determining the Average Grain Size,
Annual Book of ASTM Standards 03.01(1990).
97. ASTM E8-04, Standard Test Method for Tension Testing of Metallic Materials,
ASTM International, West Conshohocken, PA, 2004. www.astm.org
98. ASTM E23, Standard Test Method For Notched Bar Impact Testing of Metallic
Materials, Annual Book of ASTM Standards, 03.01 (2007).
99. G. O. Rading, Fatigue Crack Propagation in a Structural Steel, Applications of
Fracture Mechanics, MSc Thesis, University of Nairobi, 1983.
100. E. N. Akhusama, Microstructural Evolution and Fatigue Crack Growth
Characteristics Through the HAZ of Welded AA 6061, MSc Thesis, University
of Nairobi, (2012).
101. ASTM E92, Standard Test Method for Vickers Hardness of Metallic Materials,
ASTM International, 82(2003).

84
102. G. T. Zeru, Development of Recycle Friendly Secondary Cast Aluminium alloy
for Cylinder Head applications, MSc. Thesis, Jomo Kenyatta University of
Science and Technology (2014).
103. D. Rosenthal, Mathematical Theory of Heat Distribution during Welding and
Cutting, Welding Journal, 21(5) (1941) 220s-234s.
104. S. I. Swapnil, and S. R. Dalu, Thermomechanical Analysis in TIG Welding of
Aluminium Alloy 6082, International Journal of Science and Research, 4(4)
(2013) 1396-1399.
105. J. Gorka, An Influence of Welding Thermal Cycles on Properties and HAZ
Structure of S700MC Steel Treated Using Thermomechanical Method, PhD
Thesis, Silesian University of Technology, Poland, (2011).
106. R. Nadish, S. Keshavan, A. Chandrasekhar, B. S. Kumar and M. Chowdegowda,
Metal Inert Gas Welding Behaviour in Al-Zn Based Alloy 7075, International
Journal of Engineering and Manufacturing Science, 2 (2012), 23-30.
107. O. R. Myrh and O. Grong, Process Modelling Applied to 6082-T6 Aluminium
Weldments-1: Reaction Kinetics, Acta Materialia. 39(11) (1991) 2693-2702.
108. G. Madhusudhan, P. Mastaniah, C. V. S. Murthy, T. Morhandas and N.
Viswanathan, Microstructure, Residual Stress Distribution and Mechanical
Properties of Friction Stir AA 6061 Aluminium Alloy Weldments, Proceedings
of National Seminar On Non-Destructive Evaluation, Dec 7-9 2006, Hyderabad.
109. R. R. Ambriz and A. Ruiz, Fatigue Crack Growth under Constant Amplitude
Loading of Al-6061-T6 Welds Obtained by Modified Indirect Electric Welding

85
Arc Technique, Science and Technology of welding and Joining, 15(6) (2010)
514-521.
110. L. P. Borrego, J. M. Costa, S. Silva, J. M. Ferreira, Microstructure Dependent
Crack Growth in Age Hardened Aluminium Alloys, International Journal of
Fatigue 26(2004) 1321-1331.
111. F. Bergner, G. Zouhar, and G. Tempus, The Material Dependent Variability of
Fatigue Crack Growth Rates of Aluminium Alloys in the Paris Regime,
International Journal of Fatigue, 23(2001) 283-294
112. O. R. Myrh and O. Grong, Process Modelling Applied to 6082-T6 Aluminium
Weldments-II. Applications of Model, Acta Materialia, 39(1991) 2703-2708.
113. G. Cam, V. Ventzke, J. F. Dos Santes, M. Kocak, G. Jennequin and P. Gonthier
– Maurin, Characterization of Electron beam welded Aluminium alloys, Science
and Technology of Welding and Joining, 4(5) (1999) 317 – 323.

86
APPENDICES
Appendix A: ASTM Grain Size Number Data
Specimen/Region Distance from Weld
centerline(mm)
ASTM Grain Size Number Grain size
(µm)
Base Metal >15 12.024 27
B 15 11.430 33
C 11 11.369 35
D 6 10.668 44
E 5 10.420 48
F 4 10.648 44
Appendix B: Hardness Values
Specimen/Region Distance from the weld
centerline (mm)
Vickers Hardness (HV)
BM >15 192
B 15 191
C 11 186
D 6 131
E 5 112
F 4 123
Appendix C: Impact Toughness
Specimen/Region Distance from weld
centerline (mm)
Impact Energy (J)
BM >15 16
B 15 15
C 11 14
D 6 10
E 5 12
F 4 13

87
Appendix D: Fatigue Crack Growth Data for the BM and the HAZ of AA 7075-T651
K-decreasing test data for the base metal
N ΔP (N) 2a (mm) da/dN (mm/cycle) ΔK (MNm-3/2)
22470 1648 52.2 3.17E-04 2.62
43442 1648 53 1.76E-04 2.26
56924 1648 53.5 1.62E-04 2.57
91378 1496 54.1 9.18E-05 2.59
121338 1496 54.8 4.34E-05 2.53
157290 1496 56 3.38E-05 2.47
209720 1362 56.9 1.83E-05 2.38
259154 1362 58 1.79E-05 2.33
313082 1362 58.8 1.32E-05 2.31
384986 1238 60 1.21E-05 2.28
468874 1238 60.8 9.73E-06 2.23
545272 1238 61.7 6.14E-06 2.19
654626 1125 63 4.91E-06 2.16
768474 1125 63.9 5.69E-06 2.13
891310 1125 64.5 3.71E-06 2.10
1062082 1019 65.4 3.32E-06 2.05
1243340 1019 66.2 2.38E-06 2.15
1420104 1019 67.3 1.07E-06 1.85
1788612 917 68.2 9.82E-07 1.84
2150190 917 69 9.02E-07 1.82
3148870 825 69.1 1.10E-07 1.68
3216280 1023 70 1.41E-06 1.93
3271706 1023 71.2 4.48E-06 2.12
3309156 1023 72.1 1.47E-05 2.30
3336120 1023 73 5.12E-05 2.54
3351100 1023 73.9 9.18E-05 2.59
3360088 1023 74.8 2.15E-04 2.62
3365082 1023 75.6 6.03E-04 2.60

88
Constant amplitude test data for the base metal
N ΔP (N) 2a (mm) da/dN (mm/cycle) ΔK (MNm-3/2)
479360 1023 50.6 1.90E-06 1.97
663614 1023 51.4 2.37E-06 1.99
820904 1023 52.3 2.80E-06 2.01
954226 1023 53.2 2.61E-06 2.04
1084552 1023 54 3.32E-06 2.09
1202894 1023 54.8 3.36E-06 2.09
1316742 1023 55.6 4.44E-06 2.10
1412614 1023 56.3 6.18E-06 2.21
1503992 1023 57.1 7.90E-06 2.20
1589378 1023 58 8.44E-06 2.22
1668772 1023 58.7 8.97E-06 2.25
1740676 1023 59.3 9.35E-06 2.26
1805090 1023 60.2 9.84E-06 2.28
1865010 1023 61.1 1.32E-05 2.31
1918938 1023 62.2 1.48E-05 2.30
1966874 1023 63.4 1.97E-05 2.39
2007320 1023 64.3 2.21E-05 2.39
2043272 1023 65.4 2.78E-05 2.43
2074730 1023 66.3 4.02E-05 2.48
2101694 1023 67.1 5.08E-05 2.30
2125662 1023 68 6.15E-05 2.54
2148132 1023 69.1 7.02E-05 2.54
2167606 1023 70 7.14E-05 2.51
2191574 1023 70.8 7.69E-05 2.53
2209550 1023 71.9 7.72E-05 2.49
2224530 1023 72.8 8.35E-05 2.55
2238012 1023 73 9.02E-05 2.58
2249996 1023 74.1 1.04E-04 2.58
2258984 1023 75 1.35E-04 2.61
2266474 1023 75.9 1.60E-04 2.62
2270968 1023 76.7 6.03E-04 2.61
2273964 1023 77.9 6.09E-04 2.63

89
K-decreasing test data for the region B of the HAZ
N ΔP (N) 2a (mm) da/dN (mm/cycle) ΔK (MNm-3/2)
59920 1391 50.4 1.50E-04 2.60
65912 1391 51.2 1.35E-04 2.61
70406 1270 52 9.18E-05 2.60
74900 1270 53.4 2.87E-05 2.41
127330 1270 54 1.28E-05 2.31
187250 1146 54.8 9.84E-06 2.24
259154 1146 56 9.73E-06 2.15
275632 1146 57.1 6.07E-06 2.13
367010 1041 57.9 4.80E-06 2.13
488348 1041 58.6 1.91E-06 1.99
591710 1041 59.3 1.41E-06 1.91
763980 946 60.4 1.07E-06 1.85
1132488 946 61.1 9.70E-07 1.82
1776628 946 62.3 7.08E-07 1.79
2625994 860 62.5 5.22E-07 1.74
3614674 783 62.6 1.10E-07 1.68
3697064 950 64 1.33E-06 2.34
3767470 950 65.1 1.54E-06 2.35
3815406 950 66.2 1.51E-05 2.36
3851358 950 67.6 1.97E-05 2.39
3881318 950 69 3.01E-05 2.40
3908282 950 70.3 3.85E-05 2.43
3930752 950 71.4 4.78E-05 2.50
3950226 950 72.3 6.35E-05 2.56
3965206 950 73.1 1.35E-04 2.61
3977190 950 74.2 1.76E-04 2.62
3986178 950 75.1 2.04E-04 2.54
3992170 950 76.5 3.17E-04 2.56
3995166 950 78.1 6.00E-04 2.60

90
Constant amplitude test data for region „B‟ of the HAZ
N ΔP (N) 2a (mm) da/dN (mm/cycle ΔK (MNm-3/2)
489846 950 50.4 1.29E-06 1.91
662116 950 51.2 1.60E-06 1.97
807422 950 52 1.90E-06 1.98
942242 950 53.4 2.51E-06 1.99
1059086 950 54 3.25E-06 2.01
1151962 950 54.8 3.94E-06 2.10
1237348 950 56 4.81E-06 2.13
1313746 950 57.1 5.73E-06 2.13
1382654 950 57.9 5.94E-06 2.17
1442574 950 58.6 6.44E-06 2.17
1500996 950 59.3 9.45E-06 2.21
1556422 950 60.4 7.40E-06 2.23
1608852 950 61.1 9.73E-06 2.24
1656788 950 62.3 9.84E-06 2.28
1700230 950 62.5 9.75E-06 2.30
1742174 950 62.6 9.83E-06 2.31
1781122 950 64 9.84E-06 2.28
1815576 950 65.1 1.21E-05 2.32
1848532 950 66.2 1.52E-05 2.35
1878492 950 67.6 1.47E-05 2.40
1905456 950 69 1.83E-05 2.39
1929424 950 70.3 1.97E-05 2.40
1951894 950 71.4 2.90E-05 2.41
1974364 950 72.3 4.34E-05 2.53
1992340 950 73.1 9.18E-05 2.59
2010316 950 74.2 1.35E-04 2.61
2025296 950 75.1 1.61E-04 2.62
2035782 950 76.5 2.45E-04 2.53
2044770 950 78.1 2.04E-04 2.54
2049264 950 79.2 1.61E-04 2.62
2052260 950 80.1 3.17E-04 2.60

91
K-decreasing test data for region „C‟ of the HAZ
N ΔP (N) 2a (mm) da/dN (mm/cycle) ΔK (MNm-3/2)
52430 1383 50.5 8.89E-04 2.53
89880 1383 51.2 2.03E-04 2.54
163282 1383 52 1.30E-04 2.53
265146 1242 52.9 2.69E-05 2.44
383488 1242 53.6 2.53E-05 2.39
507822 1242 54.2 1.25E-05 2.31
633654 1129 55 2.80E-06 2.01
768474 1129 55.6 2.35E-06 2.00
912282 1027 56.2 1.90E-06 1.98
1090544 1027 56.6 1.60E-06 1.97
1274798 1027 57.4 1.37E-06 1.88
1598366 928 58.1 9.79E-07 1.83
1927926 928 59.2 3.20E-07 1.72
2536114 928 60 2.36E-07 1.70
3153290 838 60.9 1.65E-07 1.70
4040106 838 61.7 1.10E-07 1.68
5028786 756 61.8 1.01E-07 1.68
5124658 934 62.7 1.93E-06 1.84
5210044 934 63.1 1.89E-06 1.90
5286442 934 63.8 2.35E-06 2.00
5359844 934 64.6 4.79E-06 2.15
5431748 934 65.3 6.77E-06 2.11
5500656 934 66.1 7.11E-06 2.12
5565070 934 67 7.40E-06 2.21
5621994 934 67.6 8.71E-06 2.19
5677420 934 68.6 1.07E-05 2.18
5731348 934 69.5 1.25E-05 2.27
5782280 934 70 2.05E-05 2.35
5827220 934 71 2.75E-05 2.35
5858678 934 71.9 4.21E-05 2.44
5885642 934 72.7 5.27E-05 2.43
5905116 934 73.9 6.11E-05 2.46
5920096 934 75.2 1.05E-04 2.51
5932080 934 76.3 2.04E-04 2.54
5941068 934 77.6 2.57E-04 2.57
5947060 934 79.3 3.17E-04 2.57
5950056 934 81.1 4.87E-04 2.53
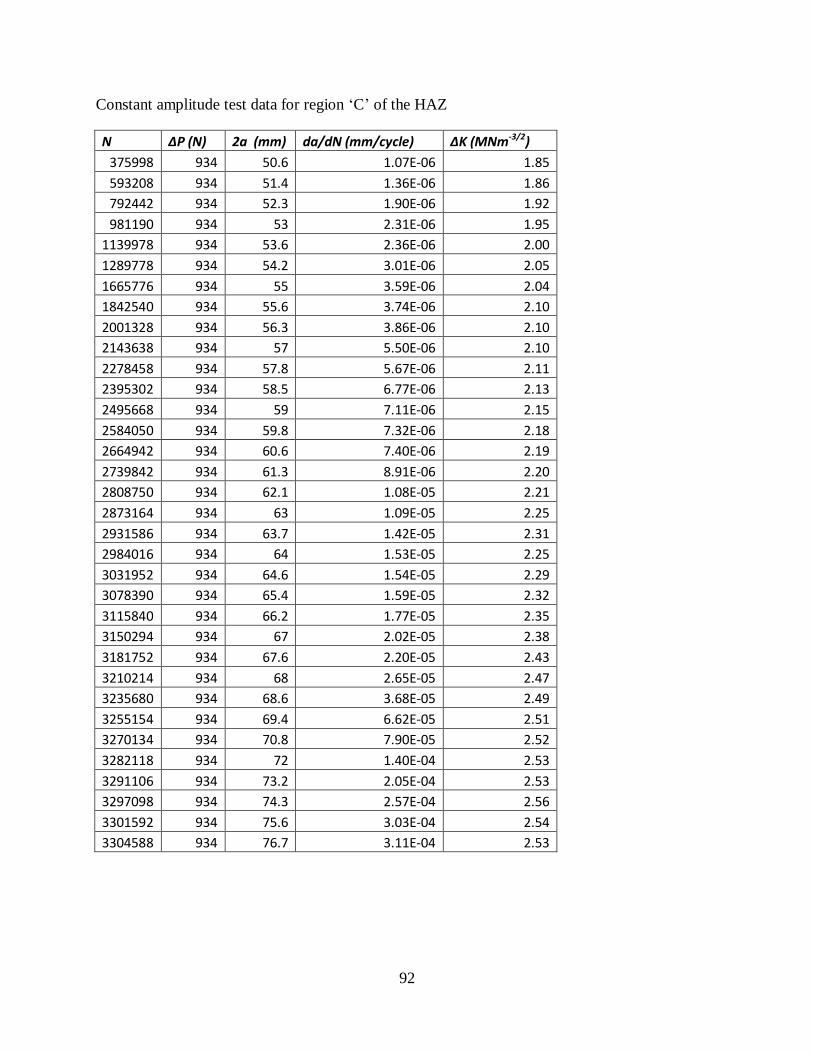
92
Constant amplitude test data for region „C‟ of the HAZ
N ΔP (N) 2a (mm) da/dN (mm/cycle) ΔK (MNm-3/2)
375998 934 50.6 1.07E-06 1.85
593208 934 51.4 1.36E-06 1.86
792442 934 52.3 1.90E-06 1.92
981190 934 53 2.31E-06 1.95
1139978 934 53.6 2.36E-06 2.00
1289778 934 54.2 3.01E-06 2.05
1665776 934 55 3.59E-06 2.04
1842540 934 55.6 3.74E-06 2.10
2001328 934 56.3 3.86E-06 2.10
2143638 934 57 5.50E-06 2.10
2278458 934 57.8 5.67E-06 2.11
2395302 934 58.5 6.77E-06 2.13
2495668 934 59 7.11E-06 2.15
2584050 934 59.8 7.32E-06 2.18
2664942 934 60.6 7.40E-06 2.19
2739842 934 61.3 8.91E-06 2.20
2808750 934 62.1 1.08E-05 2.21
2873164 934 63 1.09E-05 2.25
2931586 934 63.7 1.42E-05 2.31
2984016 934 64 1.53E-05 2.25
3031952 934 64.6 1.54E-05 2.29
3078390 934 65.4 1.59E-05 2.32
3115840 934 66.2 1.77E-05 2.35
3150294 934 67 2.02E-05 2.38
3181752 934 67.6 2.20E-05 2.43
3210214 934 68 2.65E-05 2.47
3235680 934 68.6 3.68E-05 2.49
3255154 934 69.4 6.62E-05 2.51
3270134 934 70.8 7.90E-05 2.52
3282118 934 72 1.40E-04 2.53
3291106 934 73.2 2.05E-04 2.53
3297098 934 74.3 2.57E-04 2.56
3301592 934 75.6 3.03E-04 2.54
3304588 934 76.7 3.11E-04 2.53

93
K-decreasing test data for region „D‟ of the HAZ.
N ∆P (N) 2a (mm) da/dN (mm/cycle) ∆K (MNm-3/2)
61418 1472 50.4 8.21E-04 2.51
83888 1472 51.2 9.62E-05 2.51
107856 1321 52 7.12E-05 2.53
157290 1321 52.6 6.09E-05 2.46
215712 1321 53.4 9.54E-06 2.15
290612 1179 54.3 5.36E-06 2.11
384986 1179 55 2.10E-06 2.10
509320 1179 55.7 3.46E-06 2.05
650132 1072 56.4 2.30E-06 1.99
811916 1072 57.3 1.41E-06 1.81
996170 1072 58 1.23E-06 1.83
1232854 956 58.9 1.07E-06 1.82
1492008 956 59.8 1.04E-06 1.86
1827560 956 60.7 6.05E-07 1.75
2197566 863 61.5 3.21E-07 1.72
2819236 863 62.2 3.20E-07 1.72
3807916 760 63.3 1.00E-07 1.67
3905286 925 64.4 1.24E-06 1.83
3995166 925 65.3 1.38E-06 1.85
4074560 925 66.2 1.79E-06 1.92
4146464 925 67.3 2.06E-06 1.96
4207882 925 68.4 3.69E-06 2.03
4261810 925 69.4 5.36E-06 2.10
4306750 925 70.3 6.32E-06 2.06
4341204 925 71.2 8.71E-06 2.25
4369666 925 72.1 1.15E-05 2.19
4393634 925 73.2 2.05E-05 2.35
4411610 925 74.1 2.43E-05 2.38
4423594 925 75 6.09E-05 2.46
4432582 925 75.9 9.62E-05 2.51
4438574 925 76.8 2.05E-04 2.51
4441570 925 78.2 3.18E-04 2.53

94
Constant amplitude test data for region „D‟ of the HAZ
N ∆P (N) 2a (mm) da/dN (mm/cycle) ∆K (MNm-3/2)
449400 925 50.5 1.39E-06 1.87
693574 925 50.9 1.70E-06 1.90
910784 925 51.8 2.46E-06 1.96
1113014 925 52.3 2.87E-06 2.02
1307754 925 53.1 3.49E-06 2.03
1495004 925 53.5 5.16E-06 2.09
1676262 925 54 6.32E-06 2.09
1853026 925 54.7 5.83E-06 2.10
2017806 925 55.5 6.93E-06 2.13
2175096 925 56.3 8.71E-06 2.17
2324896 925 57.2 9.75E-06 2.16
2471700 925 58.1 9.48E-06 2.17
2614010 925 59 1.11E-05 2.21
2747332 925 59.8 1.23E-05 2.27
2870168 925 60.7 1.43E-05 2.26
2988510 925 61.6 1.49E-05 2.29
3097864 925 62.6 1.77E-05 2.30
3201226 925 63.5 2.02E-05 2.32
3297098 925 64.6 2.44E-05 2.34
3386978 925 65.6 2.44E-05 2.38
3470866 925 66.5 3.10E-05 2.40
3548762 925 67.7 3.39E-05 2.42
3619168 925 68.8 4.17E-05 2.46
3686578 925 69.8 4.25E-05 2.46
3746498 925 70.8 4.29E-05 2.50
3803422 925 72 4.85E-05 2.52
3848362 925 73.2 5.09E-05 2.46
3888808 925 74.1 7.13E-05 2.52
3918768 925 75 9.62E-05 2.51
3945732 925 76 1.04E-04 2.52
3968202 925 77.2 1.94E-04 2.53
3986178 925 78.6 2.06E-04 2.53
3998162 925 79.4 2.81E-04 2.54
4007150 925 80.3 2.86E-04 2.54
4013142 925 82.9 2.89E-04 2.53
4016138 925 84.5 3.02E-04 2.53
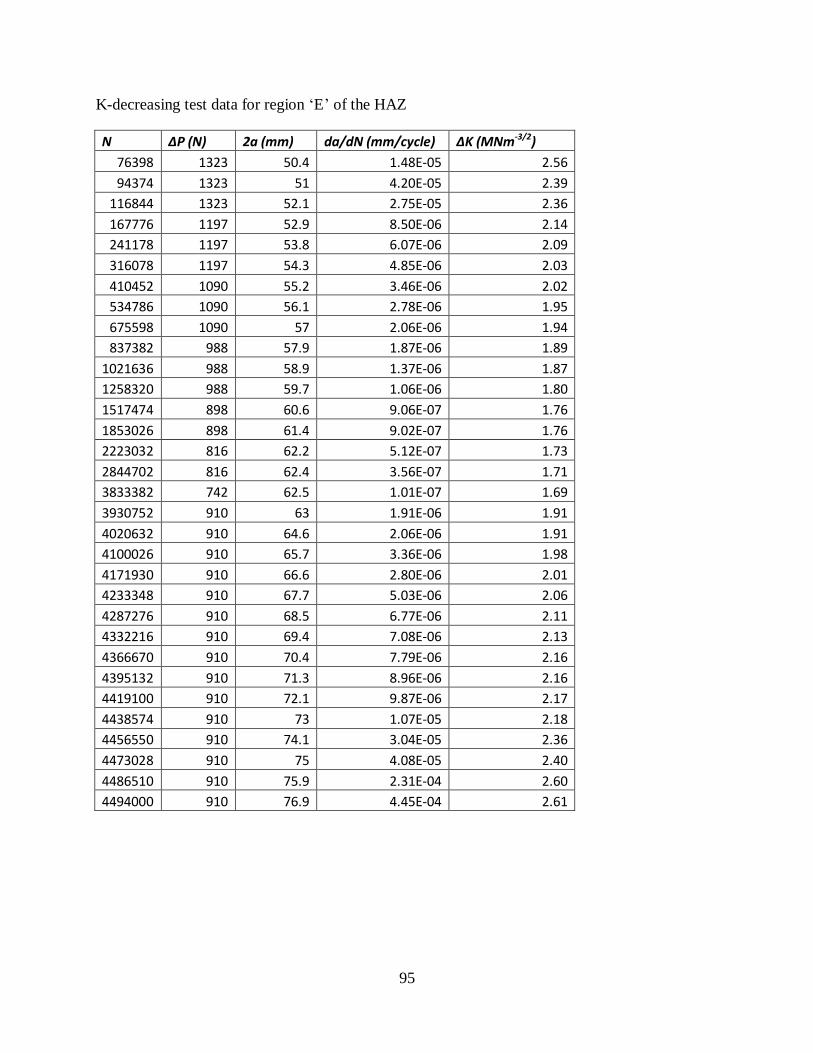
95
K-decreasing test data for region „E‟ of the HAZ
N ΔP (N) 2a (mm) da/dN (mm/cycle) ΔK (MNm-3/2)
76398 1323 50.4 1.48E-05 2.56
94374 1323 51 4.20E-05 2.39
116844 1323 52.1 2.75E-05 2.36
167776 1197 52.9 8.50E-06 2.14
241178 1197 53.8 6.07E-06 2.09
316078 1197 54.3 4.85E-06 2.03
410452 1090 55.2 3.46E-06 2.02
534786 1090 56.1 2.78E-06 1.95
675598 1090 57 2.06E-06 1.94
837382 988 57.9 1.87E-06 1.89
1021636 988 58.9 1.37E-06 1.87
1258320 988 59.7 1.06E-06 1.80
1517474 898 60.6 9.06E-07 1.76
1853026 898 61.4 9.02E-07 1.76
2223032 816 62.2 5.12E-07 1.73
2844702 816 62.4 3.56E-07 1.71
3833382 742 62.5 1.01E-07 1.69
3930752 910 63 1.91E-06 1.91
4020632 910 64.6 2.06E-06 1.91
4100026 910 65.7 3.36E-06 1.98
4171930 910 66.6 2.80E-06 2.01
4233348 910 67.7 5.03E-06 2.06
4287276 910 68.5 6.77E-06 2.11
4332216 910 69.4 7.08E-06 2.13
4366670 910 70.4 7.79E-06 2.16
4395132 910 71.3 8.96E-06 2.16
4419100 910 72.1 9.87E-06 2.17
4438574 910 73 1.07E-05 2.18
4456550 910 74.1 3.04E-05 2.36
4473028 910 75 4.08E-05 2.40
4486510 910 75.9 2.31E-04 2.60
4494000 910 76.9 4.45E-04 2.61

96
Constant amplitude test data for region „E‟ of the HAZ
N ΔP (N) 2a (mm) da/dN (mm/cycle) ΔK (MNm-3/2)
399966 910 50.5 1.91E-06 1.91
636650 910 51.1 2.06E-06 1.92
823900 910 52 3.36E-06 2.00
997668 910 53.1 2.80E-06 2.01
1162448 910 54 5.04E-06 2.06
1319738 910 54.8 5.82E-06 2.15
1465044 910 55.5 7.99E-06 2.15
1596868 910 56.3 9.36E-06 2.16
1716708 910 57.1 1.26E-05 2.18
1827560 910 58 1.25E-05 2.21
1924930 910 58.9 1.63E-05 2.27
2013312 910 59.8 2.23E-05 2.32
2080722 910 60.6 2.46E-05 2.34
2142140 910 61.6 3.04E-05 2.36
2194570 910 62.4 3.73E-05 2.25
2239510 910 63.5 3.85E-05 2.39
2279956 910 64.3 3.87E-05 2.39
2315908 910 65.4 4.02E-05 2.39
2347366 910 66.3 4.86E-05 2.50
2374330 910 67.2 6.09E-05 2.52
2402792 910 68.1 7.34E-05 2.53
2426760 910 69.1 8.62E-05 2.51
2447732 910 70 1.04E-04 2.58
2468704 910 70.9 1.32E-04 2.58
2485182 910 71.9 1.64E-04 2.57
2498664 910 72.8 1.71E-04 2.59
2510648 910 73.7 3.22E-04 2.62
2519636 910 74.6 6.03E-04 2.60
2525628 910 75.8 6.09E-04 2.62

97
K-decreasing test data for region „F‟ of the HAZ
N ∆P (N) 2a (mm) da/dN (mm/cycle) ∆K (MNm-3/2)
41944 1400 50.9 2.16E-05 2.23
64414 1400 51.5 2.67E-05 2.26
85386 1400 52 2.38E-05 2.29
122836 1295 52.8 2.14E-05 2.25
167776 1295 53.6 1.90E-05 2.26
211218 1295 54.4 1.42E-05 2.25
278628 1175 55.3 1.35E-05 2.20
344540 1175 56.3 1.08E-05 2.18
417942 1175 57.1 9.53E-06 2.20
545272 1067 58 7.89E-06 2.05
681590 1067 58.7 7.11E-06 2.19
825398 1067 59.4 6.79E-06 2.18
1060584 968 60.3 5.08E-06 2.10
1315244 968 61 3.69E-06 2.02
1566908 968 61.8 3.34E-06 1.91
1956388 880 62.4 1.91E-06 1.81
2293438 880 63 1.93E-06 1.89
2620002 880 63.5 1.11E-06 1.78
3174262 795 64 8.07E-07 1.73
3920266 795 64.4 5.36E-07 1.70
4908946 715 64.5 1.01E-07 1.69
5013806 885 65 4.68E-06 1.99
5108180 885 65.8 5.47E-06 2.03
5192068 885 66.7 5.91E-06 2.09
5259478 885 67.5 6.79E-06 2.11
5319398 885 68.3 7.10E-06 2.13
5383812 885 69 7.90E-06 2.15
5442234 885 69.5 8.56E-06 2.17
5497660 885 70.2 9.45E-05 2.11
5551588 885 70.8 1.48E-06 2.12
5596528 885 71.3 1.11E-05 2.17
5638472 885 72 1.70E-05 2.17
5675922 885 72.8 2.14E-05 2.24
5710376 885 74 4.06E-05 2.40
5731348 885 75 4.77E-05 2.50
5744830 885 75.6 8.16E-05 2.51
5753818 885 76.7 1.11E-04 2.45
5759810 885 77.9 2.00E-04 2.58
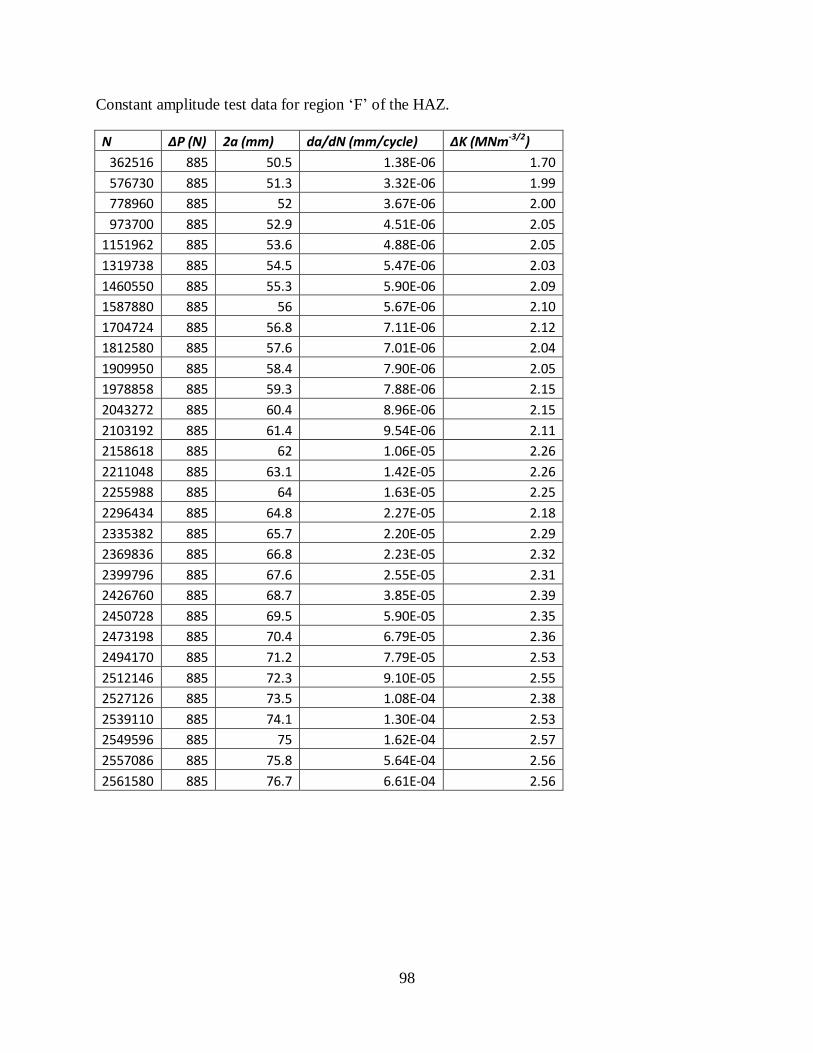
98
Constant amplitude test data for region „F‟ of the HAZ.
N ∆P (N) 2a (mm) da/dN (mm/cycle) ∆K (MNm-3/2)
362516 885 50.5 1.38E-06 1.70
576730 885 51.3 3.32E-06 1.99
778960 885 52 3.67E-06 2.00
973700 885 52.9 4.51E-06 2.05
1151962 885 53.6 4.88E-06 2.05
1319738 885 54.5 5.47E-06 2.03
1460550 885 55.3 5.90E-06 2.09
1587880 885 56 5.67E-06 2.10
1704724 885 56.8 7.11E-06 2.12
1812580 885 57.6 7.01E-06 2.04
1909950 885 58.4 7.90E-06 2.05
1978858 885 59.3 7.88E-06 2.15
2043272 885 60.4 8.96E-06 2.15
2103192 885 61.4 9.54E-06 2.11
2158618 885 62 1.06E-05 2.26
2211048 885 63.1 1.42E-05 2.26
2255988 885 64 1.63E-05 2.25
2296434 885 64.8 2.27E-05 2.18
2335382 885 65.7 2.20E-05 2.29
2369836 885 66.8 2.23E-05 2.32
2399796 885 67.6 2.55E-05 2.31
2426760 885 68.7 3.85E-05 2.39
2450728 885 69.5 5.90E-05 2.35
2473198 885 70.4 6.79E-05 2.36
2494170 885 71.2 7.79E-05 2.53
2512146 885 72.3 9.10E-05 2.55
2527126 885 73.5 1.08E-04 2.38
2539110 885 74.1 1.30E-04 2.53
2549596 885 75 1.62E-04 2.57
2557086 885 75.8 5.64E-04 2.56
2561580 885 76.7 6.61E-04 2.56

99
Appendix E: Published Paper From This Work
Rotich, S. K., Rading, G. O., Kavishe, F. P. L and Chown, L. Fatigue Crack Growth and Fatigue
Strength Characteristics in the HAZ of AA 7075-T651, African Journal of Science and
Technology, 13 (2) (2016) 1-14.