university of birmingham the effects of induced emotions
TRANSCRIPT

University of Birmingham
The effects of induced emotions on pro-socialbehaviourDrouvelis, Michalis; Grosskopf, Brit
DOI:10.1016/j.jpubeco.2015.12.012
License:Creative Commons: Attribution-NonCommercial-NoDerivs (CC BY-NC-ND)
Document VersionPeer reviewed version
Citation for published version (Harvard):Drouvelis, M & Grosskopf, B 2016, 'The effects of induced emotions on pro-social behaviour', Journal of PublicEconomics, vol. 134, pp. 1-8. https://doi.org/10.1016/j.jpubeco.2015.12.012
Link to publication on Research at Birmingham portal
Publisher Rights Statement:After an embargo period this document is subject to a Creative Commons Attribution Non-Commercial No Derivatives license
Checked Jan 2016
General rightsUnless a licence is specified above, all rights (including copyright and moral rights) in this document are retained by the authors and/or thecopyright holders. The express permission of the copyright holder must be obtained for any use of this material other than for purposespermitted by law.
•Users may freely distribute the URL that is used to identify this publication.•Users may download and/or print one copy of the publication from the University of Birmingham research portal for the purpose of privatestudy or non-commercial research.•User may use extracts from the document in line with the concept of ‘fair dealing’ under the Copyright, Designs and Patents Act 1988 (?)•Users may not further distribute the material nor use it for the purposes of commercial gain.
Where a licence is displayed above, please note the terms and conditions of the licence govern your use of this document.
When citing, please reference the published version.
Take down policyWhile the University of Birmingham exercises care and attention in making items available there are rare occasions when an item has beenuploaded in error or has been deemed to be commercially or otherwise sensitive.
If you believe that this is the case for this document, please contact [email protected] providing details and we will remove access tothe work immediately and investigate.
Download date: 24. Mar. 2022

1
The Effects of Induced Emotions on Pro-Social Behaviour
Michalis Drouvelis*
University of Birmingham
Brit Grosskopf§
University of Exeter
13 October 2015
Abstract
Emotions are commonly experienced and expressed in human societies; however, their consequences on economic behaviour have received only limited attention. This paper investigates the effects of induced positive and negative emotions on cooperation and sanctioning behaviour in a one-shot voluntary contributions mechanism game, where personal and social interests are at odds. We concentrate on two specific emotions: anger and happiness. Our findings provide clear evidence that measures of social preferences are sensitive to subjects’ current emotional states. Specifically, angry subjects contribute, on average, less than happy subjects and overall welfare as measured by average net earnings is lower when subjects are in an angry mood. We also find that how punishment is used is affected by moods: angry subjects punish harsher than happy subjects, ceteris paribus. These findings suggest that anger, when induced, can have a negative impact on economic behaviour. Keywords: Induced emotions, anger, happiness, contribution, punishment, public goods experiments. JEL codes: C92, D07, H41. Acknowledgements: We thank Simon Gächter, Eddie Harmon-Jones, participants at the 2013 North-American ESA Conference in Santa Cruz, the 4th Southern European Experimentalists Meeting in Tenerife, the CAGE/CMPO Multidisciplinary Workshop on “Generosity and Well-Being” in Warwick, the 2013 Workshop on Behavioural and Experimental Economics in Florence, the First Birmingham-CUFE Experimental and Behavioural Economics and Finance Workshop in Beijing, the 2012 ESRC Festival of Social Sciences on “Emotions and Charitable Giving” in Birmingham and seminar audiences at the University of East Anglia, the handling editor and two anonymous referees for useful comments. Financial support from the British Academy/Leverhulme Small Research Grant is gratefully acknowledged. * Department of Economics, University of Birmingham, Edgbaston, Birmingham, B15 2TT, UK. Email: [email protected] § Department of Economics, University of Exeter, Exeter, EX4 4PU, UK. Email: [email protected]

2
1. Introduction
Emotions are pervasive in many social environments and interactions, characterising
key aspects of our everyday relations. For instance, the experience and display of
emotions play an important role in fostering and maintaining cooperative
relationships, even when contracting is not complete or even absent (Fessler and
Haley, 2003 and Bowles and Gintis, 2005). In psychology, there is a long tradition of
investigating moods and emotions1 suggesting that humans often make different
decisions depending on their current feeling states due to the use of different
processing strategies (Bless et al. 1996; Schwarz and Clore, 1996), cognitive
capacities (Isen, 1987; Mackie and Worth, 1989) or mood maintenance motivations
(Isen, 1987; Wegener et al., 1995). Previous psychological research also reveals an
association between emotions and normative judgments and decisions (for reviews,
see Forgas, 1995; Schwarz, 1990 and Loewenstein and Lerner, 2002). The relevance
of emotions has been emphasised from an evolutionary perspective as well. For
example, Frank (1988) argues that natural selection has favoured those whose
decisions are influenced by emotions. Relatedly, it has been suggested that individuals
displaying positive emotions increase their reproductive success, as they are more
attractive to other members of the society (see Fredrickson, 2005). By contrast, the
role of emotions has been largely neglected in traditional economic decision-making
theories. Mostly, these theories assume economic agents to be fully–rational, self–
interested, emotionless maximizers of expected utility. This consequentialist
framework does not need to be devoid of emotions as one could incorporate expected
emotions that are anticipated to occur as the result of the outcomes of different
choices into a theoretical model. However, expected emotions are not the only
channel through which emotions can affect choices (see Rick and Loewenstein,
2008). Immediate emotions, experienced at the moment of choice, are a bigger
challenge to the consequentialist framework and have received less attention.
This paper uses experimental methods and techniques from social psychology to
shed light on our understanding of the causal link between immediate emotions and
behavioural outcomes in public good games with and without punishment. Public 1 Psychologists usually make a distinction between moods (which are typically long-lasting states) and emotions (which are typically short-lived states). They also used the term “affect” which normally encapsulates both emotions and moods (Forgas, 1992). Yet, in this paper, we are not concerned with making such a distinction and therefore use these terms interchangeably. It is also worth noting that the procedures used to induce moods and emotions are practically the same (for a brief discussion, see Fredrickson, 2005).

3
good games have long been studied in the social science literature (e.g. Andreoni,
1988; Ostrom et al., 1992; Isaac et al., 1994; Brandts and Schram, 2001; Coats et al.,
2009; and Ostrom and Vollan, 2010) as they capture the tension between personal
interest and social benefit which characterises many real life social dilemmas. In their
very nature, dilemmas are loaded with emotions. The most effective way of analyzing
the causal effect of immediate emotions is to experimentally manipulate emotions by
inducing them.
In this paper, we design an experiment to investigate the impact of induced
emotions on two behavioural measures of social preferences: cooperation and
sanctioning behaviour. We examine the issue of how induced emotions affect
behaviour in a game that has played a major role in the social preference literature:
the voluntary contributions mechanism (VCM) with punishment.2 In our
implementation of this game, individuals randomly form groups of 3 members and
decide how much of their initial endowment to voluntarily contribute to a common
resource. The setup is parameterised such that selfish and rational individuals would
contribute nothing and keep their whole endowment for themselves; whereas social
efficiency is achieved when all individuals contribute their total endowment to the
common good. The game is completed with the addition of a second stage in which
individuals are informed about the contributions of the other group members and are
given the opportunity to reduce the income of their counterparts by assigning costly
sanctioning points to other group members.3 The game is played only once providing
us with a cleaner test for the initial existence of the effects of induced emotions on
behaviour. We concentrate on two emotional states: anger and happiness, which are
two of the six so-called “primary or universal” emotions (see Damasio, 1994).4 We
induce these emotions by showing short video clips to participants before they make
their contribution decision.
2 In the past, psychological experiments have explored the impact of induced emotions on cooperation (e.g., Hertel and Fiedler, 1994; Hertel et al., 2000). However, to the best of our knowledge, no previous experiment explores the behavioural consequences of induced emotions on cooperation in an incentive compatible environment. Additionally, we extend the literature by assessing the extent to which negative reciprocity (as measured by individuals’ willingness to punish) is sensitive to subjects’ current affective states. 3 The voluntary contribution mechanism with punishment we examine was first introduced by Fehr and Gächter (2000) and since then, a growing body of experimental literature has emerged investigating the ability of punishment to sustain high cooperation levels and to regulate self-interested behaviour (for reviews, see Gächter and Herrmann, 2009; Chaudhuri, 2011). 4 The other four such emotions are sadness, fear, surprise and disgust.
4
Our main findings suggest that induced emotions play a significant role in
shaping behaviour in the voluntary contribution mechanism with and without
punishment. In particular, angry subjects contribute significantly less than happy
subjects. They also tend to punish their counterparts harsher (when we control for
deviations from the punisher’s contribution behaviour) compared to subjects in a
happy mood. Overall welfare is also affected by induced emotions: average earnings
are significantly lower for angry subjects than for happy subjects. To this extent, we
provide evidence that anger, when induced, causes a negative impact on economic
behaviour and reduces efficiency at least in the very short run.
This paper contributes to the emerging literature that sheds empirical light on
the forces that determine the content of acceptable standards of behaviour. Most
studies have focused on whether and how self-reported emotions are correlated with a
broad range of economic behaviours (see, e.g., Charness and Grosskopf, 2001; Sanfey
et al., 2003; Xiao and Houser, 2005; Meshulam et al., 2011; Bolle et al., 2014;
Stanton et al., 2014). Related to this paper, there exists evidence based on correlations
for the role played by emotions in both cooperation and punishment decisions. For
instance, Hopfensitz and Reuben (2009) have shown the importance of emotions in
the decision to cooperate in a two-period game involving two players. Other studies
have shown that positive (negative) emotional states are associated with higher
(lower) contributions in a VCM context (Joffily et al., 2014). As for the decision to
punish, some studies have suggested that negative emotions such as anger predict the
application of costly punishment (Pillutla and Murnighan, 1996; Fehr and Gächter,
2000; Bosman and van Winden, 2002; Sanfey et al., 2003; Ben Shakhar et al., 2007;
Andrade and Ariely, 2009; Hopfensitz and Reuben, 2009; Cubitt et al., 2011; Joffily
et al. 2014; Dickinson and Masclet, 2015). However, the emotions studied in these
papers are coming about endogenously either through initial dispositions or through
the observation of choices made in the experiment. The originality of this paper is that
emotions are induced exogenously using video clips. This allows for a causal
attribution that is lacking in previous studies.5
5 There are a few notable exceptions that report causal effects of induced emotions. These include effects on altruistic behaviour in dictator games (Capra, 2004), overbidding in an auction environment (Capra et al., 2010), labour productivity (Oswald et al., 2015), generosity in a gift-exchange game (Kirchsteiger et al., 2006) and time preferences (Ifcher and Zarghamee, 2011).

5
Our paper is organised as follows. Section 2 outlines the experimental design
and procedures. Section 3 states the hypotheses and Section 4 presents the
experimental results. Section 5 discusses the findings and concludes.
2. Experimental design and procedures
2.1 Voluntary contributions mechanism with punishment
Our experimental design centres on a game with two stages. In the first stage subjects
are randomly assigned to a three-person group. Each subject is endowed with 20
tokens and has to decide how many of them to keep and how many to contribute to
the public good (described as a “project” to subjects). Each token kept increases the
own monetary payoff by one experimental currency unit (ECU). Each token
contributed to the public good increases the payoff of every group member by 0.5
ECUs. The payoff function from the first stage is given by equation (1).
𝜋𝑖1 = 20 − 𝑔𝑖 + 0.5 ⋅ �𝑔𝑖 + ∑ 𝑔𝑗≠𝑖2𝑗=1 �, (1)
where 𝑔𝑖 (0 ≤ 𝑔𝑖 ≤ 20) denotes the number of tokens contributed to the public good
by group member 𝑖.
In the second stage subjects can see the profile of contributions of the other two
group members and are given the opportunity to assign costly punishment points to
each of the other two group members. Subjects could assign up to 5 punishment
points. Each punishment point costs the punisher 1 ECU and the recipient of the
punishment 3 ECUs. Thus, the cost-to-impact ratio is 1:3. The total payoff from both
stages is computed as follows:
𝜋𝑖 = 𝜋𝑖1 − ∑ 𝑝𝑖𝑗𝑗≠𝑖 − 3 ⋅ ∑ 𝑝𝑗𝑖𝑗≠𝑖 , (2)
where 𝜋𝑖1 denotes group member 𝑖’s payoff from the first (contribution) stage and 𝑝𝑖𝑗
the punishment points group member 𝑖 assigns to group member 𝑗.
Conditional on each subject i being motivated to maximise equation (2), the
unique subgame perfect equilibrium requires that subjects free-ride completely in the
first stage and refrain from punishing in the second stage.

6
2.2 Design and procedures
We implement a 2x2 factorial between-subject design. One factor that we manipulate
is subjects’ emotions; we either induce them to be positive or negative. The other one
is the announcement of a second stage punishment phase, which is either announced
or not at the beginning of the experiment. Table 1 summarizes the experimental
treatments.
Table 1. Experimental treatments
Without Announcement
With Announcement
Positive emotions 111 48
Negative emotions 117 54 Note: Numbers in the cells indicate the number of subjects who participated in each treatment.
We induce positive and negative emotions by exposing subjects to scenes from
short video clips. There is a large body of literature in psychology on mood induction
procedures. These, for example, include the imagination of emotionally driven events,
the use of emotional statements whereby subjects are asked to try and feel the
associated mood, the presentation of mood-suggestive stories, video clips and music,
the receipt of positive/negative feedback on task performance, the exposition of
certain social interactions, the exchange of gifts and the use of different facial
expressions.6 The motivation for using video clips as our mood-generating process
stems from psychological studies suggesting that short films have one of the highest
success rates in inducing moods in laboratory experiments and that they minimise
experimenter demand effects (e.g. Clark, 1983; Martin, 1990).7
For the “Positive emotions” treatment, our aim was to induce the emotion of
happiness. For this purpose, we showed subjects a short video clip from the movie
“Mr. Bean’s holiday” (filmed in 2007) where the main character of the movie is street
dancing in order to earn some money to continue his vacations. For the “Negative
emotions” treatment, our aim was to induce the emotion of anger. In this case, we
showed subjects a short video from the movie “My Bodyguard” (filmed in 1980)
6 For a meta-analysis of these procedures, see Westermann et al. (1996). 7 To reduce the presence of potential demand characteristics, we also avoided the use of accompanying instructions and cover stories for the video clips.
7
where a young boy comes to a new school and gets harassed by a bully.8 After mood
induction had taken place, subjects were given a list of thirteen emotions. They were
asked to indicate the intensity with which they felt each emotion. The intensity for
each emotion was recorded on a 9-point scale (1 = “not at all”, …, 9 = “very much”).
All subjects in an experimental session watched the same video clip (individually on
their computers with headphones on) and all were informed that everybody watched
the same video.
We additionally manipulate whether the content of the second (punishment)
stage is announced to subjects at the beginning of the experiment. Previous literature
(e.g. Gächter and Hermann, 2009) has shown that announcing punishment increases
contributions even in a one-shot VCM game. However, we do not know whether this
effect is the same (in direction or magnitude) in situations when positive or negative
emotions are induced. Therefore, comparing contributions when a punishment stage is
announced with contributions when such a stage is not announced allows us to isolate
the effect that induced emotions have on contributions. We refer to the resulting
treatments as “Without Announcement” and “With Announcement.” In the “Without
Announcement” treatment, subjects were informed that the experiment consists of
two stages, but they were not told what will happen in the second stage. In the “With
Announcement” treatment, subjects participated in a standard VCM game with
punishment as they were informed from the beginning of the experiment about the
content of both the first and the second stage.9 This design allows us to test whether
contribution and punishment behaviour are affected by induced emotions of happiness
and anger (controlling for the announcement of the punishment stage) which is the
main research question of this paper.
8 Previous research has established the emotional effects of this video clip. For a classification of movies which induce particular emotions, see Gross and Levenson (1995). 9 In order to eliminate the potential effect of the announcement of a punishment stage on contributions, one could either eliminate the second stage altogether or inform subjects about the fact that there will be a second stage without informing them about the content of that stage. We are not aware of any study that compares behaviour in these two situations and therefore conduct both, one which consists of one stage only (120 subjects in total, with 60 induced to be happy and 60 induced to be angry) and one which consists of two stages where participants know that there will be two stages but the content of the second stage is only announced at the beginning of the second stage (108 subjects in total, with 51 induced to be happy and 57 induced to be angry). As we do not find differences in contributions between such one stage and two stage VCM games, for a given mood induction, we pool the data from these games and refer to them as “Without Announcement.” This leads to the higher numbers for this treatment seen in Table 1.

8
Each subject was assigned at random to a group of three members and sessions
were randomly allocated to treatments. Subjects played a one-shot voluntary
contributions game under one of these treatments.
Procedures: All subjects were recruited at the University of Birmingham, using the
ORSEE software (Greiner, 2015) and the experiment was computerized and
programmed with the software z-Tree (Fischbacher, 2007). At the end of each
session, subjects were privately paid according to their total amount of experimental
currency units (ECUs), using an exchange rate of £0.35 per ECU. Average earnings
(excluding a show-up fee of £2.50) were £7.38. Sessions lasted 70 minutes, on
average. Before subjects played the game, they received the instructions reproduced
in Appendix A. As we wanted to ensure that subjects understood the decision
situation and the mechanics of payoff calculations, all participants answered several
control questions. The experiment did not proceed until every subject had answered
these questions correctly.
3. Hypotheses
The following hypotheses address the impact of induced anger and happiness on
contribution and punishment behaviour. Starting with contribution behaviour, the null
hypothesis is that our mood manipulation has no effect on contribution levels.
However, existing laboratory evidence (e.g., Capra, 2004; Kirchsteiger et al., 2006;
Capra et al., 2010) suggests that subjects who are in a negative mood exhibit less
altruistic or helpful behaviour. Motivated by this evidence, our alternative hypothesis
is that subjects’ contribution behaviour is affected by induced emotions.
Hypothesis 1: Induced emotions affect subjects’ contribution behaviour.
Looking at punishment behaviour, we use the notion of the “punishment function”
which gives the punishment points assigned by the punisher as a function of the
recipient’s deviation from the punisher’s contribution. Previous evidence (e.g. Fehr
and Gӓchter, 2000; 2002) suggests that the punishment function is downward sloping
for the negative part of the deviation (horizontal) axis, implying that a subject
punishes her co-player more, the more he negatively deviates from the punisher’s
9
contribution. Regarding how the punishment function changes with respect to moods,
our null hypothesis predicts that the punishment function does not depend on subjects’
moods, ceteris paribus. In principle, the punishment function for the “Negative
emotions” treatment can be shifted either upwards or downwards relative to the
“Positive emotions” treatment.10 However, guided by evidence from psychology (for
a survey, see Zizzo, 2004) suggesting that anger can translate itself into aggressive
behaviour, we anticipate that the “punishment function” exhibits differences in
intercept and/or slope across different moods.
Hypothesis 2: Induced emotions affect subjects’ punishment behaviour.
4. Results
4.1 Mood induction
This section presents the findings from the mood induction procedure. Recall that in
the “Positive emotions” treatment, we wanted to induce the emotion of happiness;
whereas, in the “Negative emotions” treatment, we wanted to induce the emotion of
anger. Our analysis is therefore centred on the examination of these two emotions.11
We record intensities of emotions on a scale from 1 (“no intensity at all”) – 9
(“highest possible intensity”). Table 2 reports the average happiness and anger in the
different treatments.
We observe that the highest (lowest) levels of happiness are recorded in the
“Positive (Negative) emotions” treatment. The mirror image of this observation is
portrayed when we examine the emotion of anger. Specifically, the emotion of anger
takes the lowest values in the “Positive emotions” treatment and the highest values in
the “Negative emotions” treatment. When we perform non-parametric Wilcoxon rank-
sum tests, we find that the differences in emotions across treatments are statistically
10 Note that we consider the punishment function for the “Positive emotions” treatment as the baseline in relation to which the punishment function for the “Negative emotions” treatment shifts. The reason for doing so is that the former punishment function is not statistically significantly different from a comparable punishment function (in which no emotions were induced) estimated in a paper by Cubitt et al. (2011) who used a UK subject pool and implemented similar parameters for the VCM games to the ones we use here. We formally compare these two punishment functions in Section 4.3. 11 Figure B.1 and Table B.1 in Appendix B summarize the intensity of all thirteen emotions that we elicit after subjects watched the movie clip. As is common in studies of induced emotions, inducing a single emotional feeling is virtually impossible as several emotional responses are correlated with one another (for example happiness and joy, sadness and anger).

10
significant. Namely, happiness (anger) is significantly higher (lower) in the “Positive
emotions” treatment relative to the “Negative emotions” treatment, regardless of the
treatment (for all pairwise comparisons, p=0.000).12 Our conclusion is that our mood
induction technique was successful in making subjects happier or angrier in the
respective treatments.
Table 2. Average self-reported happiness and anger
Average happiness
Average anger
Without Announcement
Positive emotions
6.97 (1.44)
1.59 (1.49)
Negative emotions
1.97 (1.55)
6.62 (1.94)
With Announcement
Positive emotions
6.69 (1.99)
1.40 (0.92)
Negative emotions
1.91 (1.43)
6.09 (1.99)
Note: Standard deviations in parentheses. The intensity of emotions was recorded on a 9-point scale (1 = “not at all”, …, 9 = “very much”).
We next explore whether these temporary changes in subjects’ moods bring
about differences in their contribution and punishment behaviour.
4.2 Contribution behaviour
Table 3 shows the average contribution levels disaggregated by treatment.13,14 Using a
Wilcoxon rank-sum test, we find that subjects contribute less in the “Negative
emotions” treatments both in the “Without Announcement” (p=0.091) and in the
“With Announcement” treatment (p=0.098). We also find that, for a given mood
treatment, whether the content of the second stage is announced or not makes a 12 All tests reported in the paper are two-sided. 13 The distribution of individual contributions in each of the four treatments is shown in Figure B.2 in Appendix B. 14 It is worth noting that when happy emotions are induced, we observe similar contribution levels to those recorded in one-shot public good games where no particular emotion is induced. For example, our mean contribution rates in the “Without Announcement / Positive emotions” treatment are similar to those reported in comparable treatments by Gächter and Hermann (2009) who used a Russian subject pool, Dufwenberg et al., (2011) who used a German subject pool and Cubitt et al. (2011) who used a UK subject pool. More specifically, comparing contributions in our “Without Announcement / Positive emotions” treatment (average 6.19) with those observed in the one-shot VCM without punishment of Cubitt et al. (average 5.88) shows no significant difference (Wilcoxon rank-sum test; p=0.705). The same holds when we compare contributions in our “With Announcement / Positive emotions” treatment (average 9.81) with those observed in the comparable one-shot VCM with punishment of Cubitt et al. (average 7.21, Wilcoxon rank-sum test; p=0.134).

11
significant difference in subjects’ contribution behaviour. Specifically, subjects
contribute more in the treatments where the punishment stage is pre-announced both
in “Positive emotions” treatment (p=0.004) as well as in the “Negative emotions”
treatment (p=0.008). This is in line with earlier findings showing that punishment is
an effective tool of social sanctioning capable of inducing higher cooperation (e.g.,
Fehr and Gächter, 2000; 2002).
Table 3. Average contribution levels for each treatment
Without Announcement
With Announcement
Positive emotions 6.19 (6.06)
9.81 (7.20)
Negative emotions 4.91 (5.79)
7.41 (6.10)
Note: Standard deviations in parentheses.
We further explore the determinants of contribution behaviour by performing
Tobit regressions as contributions are restricted to take on values between 0 and 20.
We report the results of three models in Table 4. In all models, the dependent variable
is the amount of tokens a subject contributes to the public good. Model (1) directly
tests for treatment differences by including as explanatory variables the two treatment
variables: “Negative emotions” and “With Announcement.” In addition, we control
for gender. Models (2) and (3) are based on the directly elicited emotions, which take
into account the fact that individuals may respond differently to the mood induction.
By including elicited emotions, we capture the behaviour of the “less happy” subjects
in the “Positive emotions” treatment and the “happier” subjects in the “Negative
emotions” treatment in addition to the induced “happy” and “less happy” subjects in
the respective treatments. This allows us to draw a more general conclusion that is not
dependent on a specific movie. As can be seen in Figure B.1 and is usually observed
in studies that employ the induction of emotions, more than one emotion is triggered.
In order to allow for the effects of a more complex index, we construct two mood
indices: “positive index” and “negative index.” These indices are derived using factor
analysis on all thirteen elicited emotions.15 This enables us to construct indices with
variables that measure similar things, thereby reducing the large set of variables (most
15 We conduct the factor analysis separately for the “Positive emotions” and “Negative emotions” treatment since different emotions are triggered in each treatment.
12
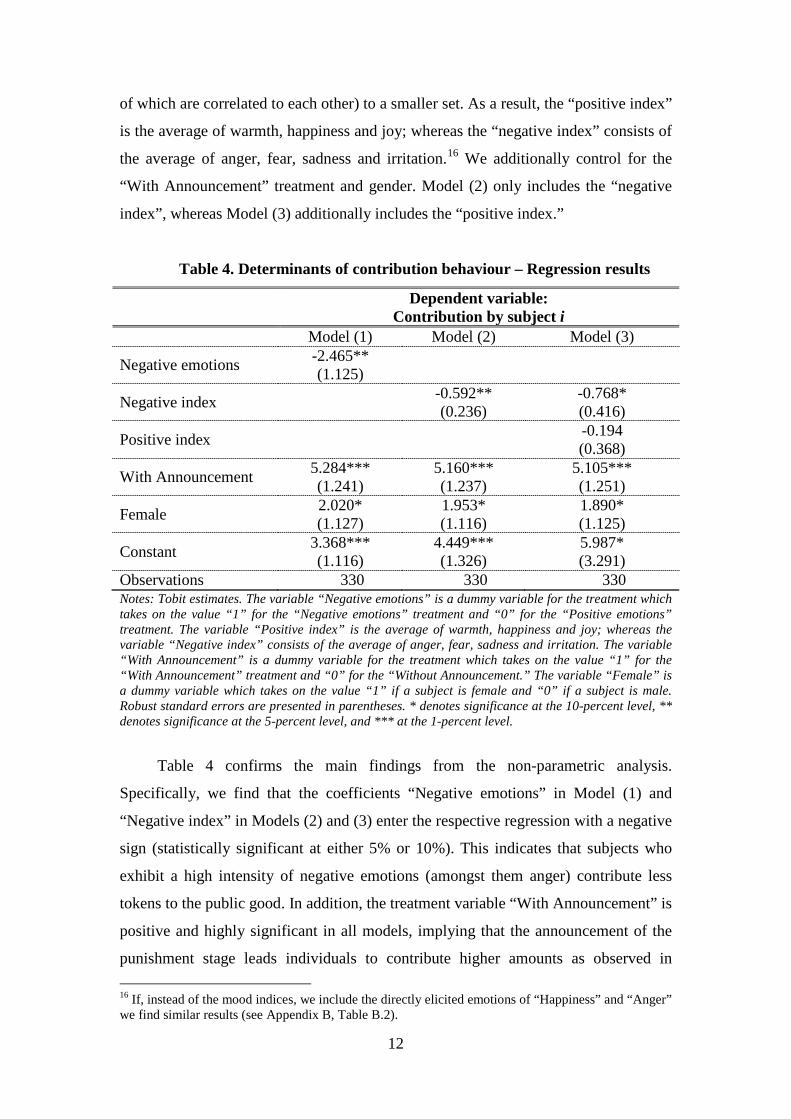
of which are correlated to each other) to a smaller set. As a result, the “positive index”
is the average of warmth, happiness and joy; whereas the “negative index” consists of
the average of anger, fear, sadness and irritation.16 We additionally control for the
“With Announcement” treatment and gender. Model (2) only includes the “negative
index”, whereas Model (3) additionally includes the “positive index.”
Table 4. Determinants of contribution behaviour – Regression results
Dependent variable: Contribution by subject i
Model (1) Model (2) Model (3)
Negative emotions -2.465** (1.125)
Negative index -0.592** (0.236)
-0.768* (0.416)
Positive index -0.194 (0.368)
With Announcement 5.284*** (1.241)
5.160*** (1.237)
5.105*** (1.251)
Female 2.020* (1.127)
1.953* (1.116)
1.890* (1.125)
Constant 3.368*** (1.116)
4.449*** (1.326)
5.987* (3.291)
Observations 330 330 330 Notes: Tobit estimates. The variable “Negative emotions” is a dummy variable for the treatment which takes on the value “1” for the “Negative emotions” treatment and “0” for the “Positive emotions” treatment. The variable “Positive index” is the average of warmth, happiness and joy; whereas the variable “Negative index” consists of the average of anger, fear, sadness and irritation. The variable “With Announcement” is a dummy variable for the treatment which takes on the value “1” for the “With Announcement” treatment and “0” for the “Without Announcement.” The variable “Female” is a dummy variable which takes on the value “1” if a subject is female and “0” if a subject is male. Robust standard errors are presented in parentheses. * denotes significance at the 10-percent level, ** denotes significance at the 5-percent level, and *** at the 1-percent level.
Table 4 confirms the main findings from the non-parametric analysis.
Specifically, we find that the coefficients “Negative emotions” in Model (1) and
“Negative index” in Models (2) and (3) enter the respective regression with a negative
sign (statistically significant at either 5% or 10%). This indicates that subjects who
exhibit a high intensity of negative emotions (amongst them anger) contribute less
tokens to the public good. In addition, the treatment variable “With Announcement” is
positive and highly significant in all models, implying that the announcement of the
punishment stage leads individuals to contribute higher amounts as observed in 16 If, instead of the mood indices, we include the directly elicited emotions of “Happiness” and “Anger” we find similar results (see Appendix B, Table B.2).

13
previous experiments (e.g. Fehr and Gӓchter, 2000). We additionally find that women
marginally contribute more. This adds to the mixed previous findings of women
contributing more (e.g. Seguino et al., 1996) as opposed to men contributing more
(e.g. Brown-Kruse and Hummels, 1993, Sell and Wilson, 1991).
RESULT 1. Average contributions are affected by moods: subjects contribute
significantly less in the “Negative emotions” treatment than in “Positive emotions”
treatment. Subjects also contribute significantly higher amounts when the punishment
stage has been announced irrespective of induced emotions.
4.3 Punishment behaviour
We start our analysis by examining subjects’ punishment behaviour for each
treatment. Figure 2 shows the punishment points assigned by the punisher to another
player 𝑗 as a function of j’s deviation from the punisher’s contribution.17 The
punishment function is given by the solid line, which indicates the fitted line of the
locally weighted regression of punishment assigned to the deviation from the
punisher’s contribution.
A visual inspection of Figure 2 suggests that subjects punish negative
deviations from the punisher’s contributions harsher than non-negative deviations as
has been found in previous studies (e.g. Fehr and Gӓchter, 2000). We also observe
that subjects typically do not punish those who have contributed more than the
punisher. However, Figure 2 shows that such anti-social punishment happens
sometimes, especially in the “Negative emotions” treatments. The average
punishment points assigned in each treatment are reported in Table 5.18
The main message from Table 5 confirms our observation that negative
deviations are punished more harshly than positive deviations.19 There seems to be an
increase in assigned punishment points in the “Negative emotions” treatments.
However, this increase is only statistically significant for anti-social punishment (i.e.
17 We refer to the punisher as player 𝑖 and the recipient of punishment as player 𝑗. 18 The data reported in Table 5 is “clustered” at the individual level since each subject makes two punishment decisions. In the case that the two punishment decisions are both based on the same direction of deviation (i.e. both deviations are either non-negative or both are negative), we use the average of the two as the unit of observation; otherwise, we use the individual decisions. 19 Pairwise comparisons of assigned punishment points for negative vs. non-negative deviations for a given emotions treatment using Wilcoxon rank-sum tests confirm statistical significance in all treatments at p<0.005.

14
non-negative deviations) in the “With Announcement” treatment (Wilcoxon rank-sum
test; p=0.089). It has to be noted that observed relative frequencies of anti-social
punishment are very low. Only 3.4% of non-negative deviations are punished in the
“With Announcement / Positive emotions” treatment. When negative emotions are
induced and punishment has been announced, this anti-social punishment increases to
12.5% (Test of Equality of Proportions, p=0.073).20
Figure 2. Punishment as a function of deviation from punisher’s contribution
Table 5. Average punishment points for each treatment
Negative Deviations Non-negative deviations Without
Announcement With
Announcement Without
Announcement With
Announcement Positive emotions
0.54 (0.88)
0.87 (1.13)
0.04 (0.19)
0.03 (0.16)
Negative emotions
0.89 (1.20)
1.14 (1.63)
0.20 (0.93)
0.16 (0.44)
Note: Standard deviations in parentheses. Our analysis so far does not control for the magnitude of deviations which is
likely to be a determinant of how punishment is assigned (as suggested by previous
20 The specific test statistic is Z = (p1−p2)/Spc, where pi is the proportion of zero choices in subsample i. Spc is an estimate of the standard error of p1 − p2, Spc = {pc(1 − pc)[(1/N1) + (1/N2)]}^0.5. pc is an estimate of population proportion under the null hypothesis of equal proportions, pc = (p1N1 + p2N2)/(N1 + N2), where Ni is the total number of all choices in subsample i.
01
23
45
01
23
45
-20 -15 -10 -5 0 5 10 15 20 -20 -15 -10 -5 0 5 10 15 20
Negative, With Announcement Negative, Without Announcement
Positive, With Announcement Positive, Without Announcement
Pun
ishm
ent P
oint
s A
ssig
ned
Deviation from player i's contribution

15
public goods experiments with punishment). To test econometrically whether (a) the
intercept of the punishment function and (b) the slope of the punishment function are
different across mood treatments, we estimate Tobit regression models. The reason
for performing a Tobit analysis is that our dependent variable, which is “punishment
assigned by player i to player j,” exhibits censoring at 0 and 5. In our regression
models, we cluster at the individual level and include as independent variables:
“Player j’s absolute negative deviation,” “Player j’s positive deviation,” and the
dummy variables “Negative emotions,” “With Announcement” and “Female.” In
Model (1), we do not include interaction terms for the most conservative estimation of
the model. In Model (2), we include two interaction terms, which indicate whether the
slope of the punishment function differs with respect to negative and positive
deviations across mood treatments. Note that all deviations are calculated with respect
to the punisher’s contribution. We include “absolute negative deviation” and “positive
deviation” as separate regressors, since these two different sorts of deviation elicit
different punishment responses as shown in Figure 2 and Table 5. The variable
“absolute negative deviation” is the absolute value of the actual deviation of subject
j’s contribution from the punisher’s contribution, when subject j’s contribution is
below the punisher’s contribution; and zero otherwise. The variable “positive
deviation” is constructed in an analogous way. The variable “Group average
contribution” indicates the average contribution of all three members in a group. Note
that we do not include the directly elicited emotions or the constructed mood indices
because the decision to punish can be affected by two sources of emotions: (1) the
experimentally induced emotions prior to the contribution decision, and (2) the
emotions experienced after observing the contributions of the other two group
members. The directly elicited emotions only account for the first source of emotion
as emotions are elicited before contributions are made. The regression results are
given in Table 6.
Table 6 reveals two important observations. First, as anticipated, we find that
negative deviations from the punisher’s contribution are a significant determinant of
how punishment is used: a subject punishes another group member more, the less this
group member contributes relative to the punisher. By contrast, positive deviations are
not punished significantly as the coefficient of the respective variable is insignificant
at conventional levels. Second, the coefficient of the dummy variable “Negative
emotions” has a positive sign and is statistically significant at the 5% level in Model

16
(2). This implies that the intercept of the punishment function is different across our
mood treatments if we simultaneously allow for the possibility of a slope difference.
Table 6. The punishment function – Regression results
Dependent variable: Punishment assigned by
player i to player j Model (1) Model (2)
Group average contribution 0.011 (0.087)
0.022 (0.092)
Player j’s absolute negative deviation from punisher’s contribution
0.240*** (0.060)
0.333*** (0.098)
Player j’s positive deviation from punisher’s contribution
-0.094 (0.076)
-0.043 (0.138)
Negative emotions 0.885 (0.659)
1.930** (0.983)
Negative emotions × Player j’s absolute negative deviation from punisher’s contribution
-0.158 (0.122)
Negative emotions treatment × Player j’s positive deviation from punisher’s contribution
-0.092 (0.160)
With Announcement 0.777 (0.666)
0.730 (0.670)
Female -0.272 (0.622)
-0.307 (0.617)
Constant -4.574*** (1.064)
-5.191*** (1.279)
Observations 420 420 Notes: Tobit estimates. The variable “Group average contribution” indicates the average contribution of all three members in a group. The variable “Absolute negative deviation” is the absolute value of the actual deviation of subject j’s contribution from the punisher’s contribution, when subject j’s contribution falls below the punisher’s contribution; and zero otherwise. The variable “positive deviation” is constructed analogously. The variable “Negative emotions” is a dummy variable which takes on the value “1” for the “Negative emotions” treatment and “0” for the “Positive emotions” treatment. The variable “With Announcement” is a dummy variable which takes on the value “1” for the “With Announcement” treatment and “0” for the “Without Announcement.” The variable “Female” is a dummy variable which takes on the value “1” if a subject is female and “0” if a subject is male. Robust standard errors (clustered at the individual level) are presented in parentheses. ** denotes significance at the 5-percent level, and *** at the 1-percent level.
In addition, the coefficients of the interaction terms between positive/absolute
negative deviations and the dummy variable “Negative emotions” are statistically
insignificant suggesting that the slope of the punishment function across our emotions
treatments does not differ. Therefore, the observed difference in how subjects assign

17
punishment points is due to a level difference of the punishment function between the
“Negative emotions” and the “Positive emotions” treatment.21
RESULT 2. The assignment of punishment is affected by moods: subjects punish
harsher in the “Negative emotions” treatment than in the “Positive emotions”
treatment, for given deviations from the punisher’s contribution.
4.4 Average earnings
Our findings from the previous section suggest that when subjects are in a negative
mood, they punish more harshly compared to those subjects in a positive mood. We
therefore examine whether being in a negative mood is detrimental for subjects’
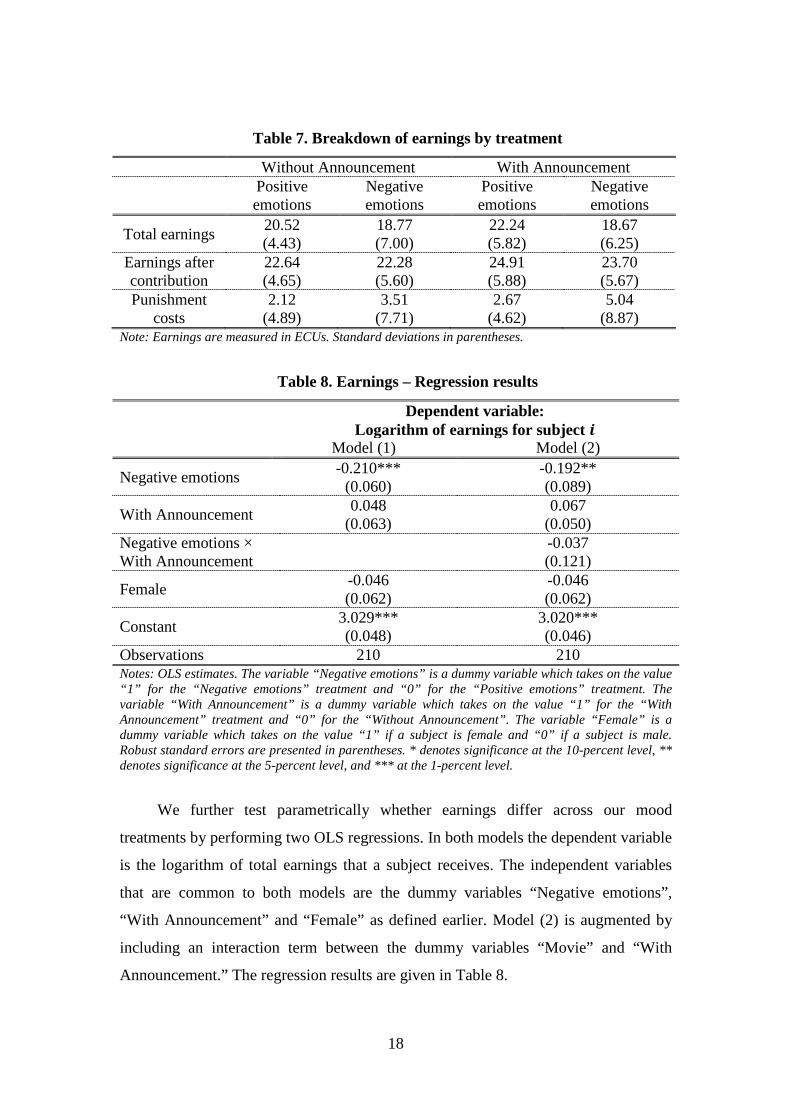
overall welfare as measured by subjects’ net earnings. Table 7 gives a breakdown of
the earnings by treatment.22 We separate total earnings (i.e. earnings from both
stages) into earnings after contribution (i.e. earnings from the first contribution stage
only) and punishment costs (i.e. costs associated with assigning and receiving
punishment).
By performing non-parametric Wilcoxon rank-sum tests, we find that subjects’
earnings after the contribution stage do not differ significantly between the “Positive
emotions” treatment and the “Negative emotions” treatment (Without Announcement:
p=0.760; With Announcement: p=0.317). However, total earnings are significantly
lower in the “Negative emotions” treatment relative to the “Positive emotions”
treatment when the content of the second stage is announced ex ante (p=0.005). This
is not the case otherwise (p=0.262). The significant difference is due to the fact that
subjects punish more heavily in the “Negative emotions” treatment than in the
“Positive emotions” treatment when the content of the second stage is announced as
can be seen in the higher associated punishment costs.
21 Notice that, as stated in Section 3, we take as our baseline category the punishment function of the “Positive emotions” treatment to which the punishment function of the “Negative emotions” treatment is compared. Comparisons between our data and the data from the Cubitt et al. (2011) do not indicate significant differences between our “Positive emotions” punishment function and their punishment function when no emotions are induced. Our regression analysis from this comparison is reported in Appendix B (see Table B.3). Using a Wilcoxon rank-sum test, we also do not find statistically significant differences in average punishment points assigned, in total, (p=0.712) as well as with respect to negative (p=0.866) and non-negative deviations (p=0.485). 22 Note that, for our analysis on earnings, we only consider the treatments which have a second punishment stage.
18
Table 7. Breakdown of earnings by treatment
Without Announcement With Announcement Positive
emotions Negative emotions
Positive emotions
Negative emotions
Total earnings 20.52 (4.43)
18.77 (7.00)
22.24 (5.82)
18.67 (6.25)
Earnings after contribution
22.64 (4.65)
22.28 (5.60)
24.91 (5.88)
23.70 (5.67)
Punishment costs
2.12 (4.89)
3.51 (7.71)
2.67 (4.62)
5.04 (8.87)
Note: Earnings are measured in ECUs. Standard deviations in parentheses.
Table 8. Earnings – Regression results
Dependent variable: Logarithm of earnings for subject 𝒊
Model (1) Model (2)
Negative emotions -0.210*** (0.060)
-0.192** (0.089)
With Announcement 0.048 (0.063)
0.067 (0.050)
Negative emotions × With Announcement -0.037
(0.121)
Female -0.046 (0.062)
-0.046 (0.062)
Constant 3.029*** (0.048)
3.020*** (0.046)
Observations 210 210 Notes: OLS estimates. The variable “Negative emotions” is a dummy variable which takes on the value “1” for the “Negative emotions” treatment and “0” for the “Positive emotions” treatment. The variable “With Announcement” is a dummy variable which takes on the value “1” for the “With Announcement” treatment and “0” for the “Without Announcement”. The variable “Female” is a dummy variable which takes on the value “1” if a subject is female and “0” if a subject is male. Robust standard errors are presented in parentheses. * denotes significance at the 10-percent level, ** denotes significance at the 5-percent level, and *** at the 1-percent level.
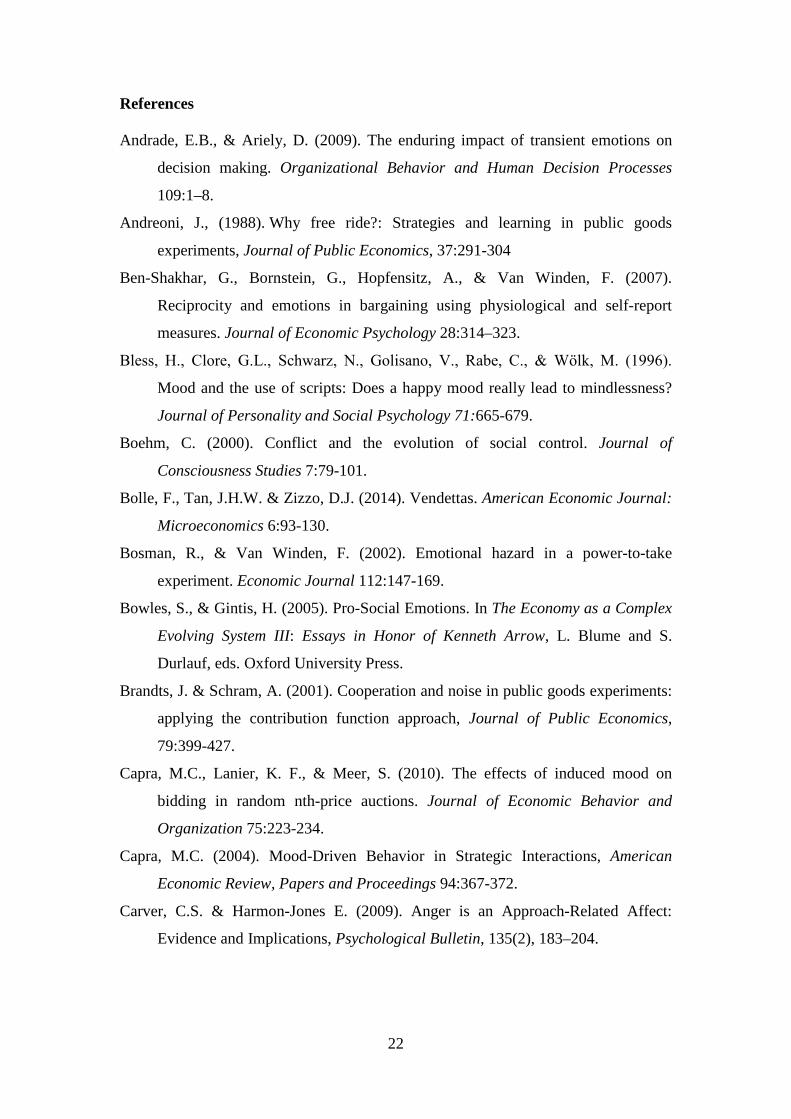
We further test parametrically whether earnings differ across our mood
treatments by performing two OLS regressions. In both models the dependent variable
is the logarithm of total earnings that a subject receives. The independent variables
that are common to both models are the dummy variables “Negative emotions”,
“With Announcement” and “Female” as defined earlier. Model (2) is augmented by
including an interaction term between the dummy variables “Movie” and “With
Announcement.” The regression results are given in Table 8.

19
The regression results from Table 8 suggest that subjects in the “Negative
emotions” treatment earn significantly less than those in the “Positive emotions”
treatment. Taken together, our findings indicate that induced anger is detrimental and
reduces efficiency at least in the very short run. A similar observation of the short run
detrimental effect of punishment without induced emotions has been made by Gӓchter
et al. (2008) who compare the effects of punishment in a ten period public good game
with those in a fifty period public good game.
RESULT 3. Average earnings (when there is a punishment stage) are affected by
moods: subjects earn significantly less in the “Negative emotions” treatment than in
“Positive emotions” treatment.
5. Discussion and Conclusions
This paper presents an experimental investigation of the impact of induced anger and
happiness on shaping economic behaviour in relation to human cooperation. Our
framework is a standard voluntary contributions mechanism with punishment, which
has played a key role in the social preference literature. This set-up encompasses a
broad range of real-world contexts and situations that epitomize the conflict of
interests between personal and collective goals. Its study is therefore of great
importance as it enables us to understand the proximate sources behind human
cooperation. Our interest is on two behavioural measures of social preferences:
contribution and sanctioning behaviour. Our main findings show that both of our
measures are affected by individuals’ emotional states. Specifically, induced anger
leads individuals to be less pro-social by contributing on average lower amounts to
the common resource. In addition, controlling for deviations from the punisher’s
contributions, we find that average punishment is harsher when subjects are in an
angry emotional state. On average, total efficiency as measured by average net
earnings is also lower for angry subjects compared to happy ones.
We contribute to the literature in at least two important ways. First, from a
theoretical perspective, we show that aspects of the environment such as induced
emotions affect economic behaviour. Our findings, hence, provide further evidence
for inspiring theory development that can account for mood effects.

20
Second, from an empirical perspective, it is already well-understood that
sanctioning and emotions are associated in social environments similar to the one we
examine: negative emotions are triggered when fairness norms are violated. Namely,
in public good games with punishment, negative deviations from the punisher’s
contributions cause strong negative emotions such as anger which serves as a
motivating factor that increases the willingness of subjects to punish norm violators.
As a result, sanctioning (albeit costly) leads to higher contribution levels even in one-
shot contexts or in situations where reputation gains have been removed (e.g., Fehr
and Gächter, 2002; Gächter and Hermann, 2009; Cubitt et al., 2011). In other words,
acting on feelings of anger has a positive impact on fostering cooperation. In this
paper, we provide evidence that anger when induced can have detrimental effects on
economic outcomes: angry subjects contribute lower amounts to the public good and
earn less. Negative reciprocity is also sensitive to the feeling of anger as it affects
how subjects perceive a given contribution level. Specifically, punishment is harsher
when subjects are in an angry mood, for given deviations from the punisher’s
contribution level. Overall, we find that the immediate impact of induced anger on
behaviour is harmful at least in the very short run.
Our study gives rise to a number of different future research avenues. The role
of emotions needs to receive more attention in economic analysis as their effects
remain to be a challenge to rational decision-making theories. In particular, more
empirical evidence is necessary to better understand the channels through which
induced emotions affect behaviour. Our observation that angry subjects contribute
less could be the result of a change in social preferences or a change in beliefs about
the behaviour of others. In our study, we collect non-incentivised data on beliefs
about others’ contributions. Preliminary analysis of these data suggests that beliefs
about others’ contributions are not affected by moods.23 Given that contributions are
affected by moods, this makes angry subjects appear as if they are not best-responding
to their beliefs. This seeming disconnect between beliefs and reality might be because
of an approach motivated wish/desire “I hope the other people give more (perhaps) I
23 After subjects had made their own contribution decision, we asked them to state their beliefs about contributions of the other group members. We did not want these belief elicitations to interfere with the incentive structure of the voluntary contribution mechanism by creating income effects and opted to not pay for correct beliefs. We also wanted to avoid punishment being motivated by disappointment about low payoffs resulting from inaccurate beliefs.

21
deserve it.”24 This conjecture needs to be further investigated in a more systematic
way.
It would also be interesting to isolate the effects induced emotions have on the
punishment decision per se. It has to be noted that the reduction in contributions can
be directly attributed to the induced emotions. However, the resulting punishment
decisions could have two emotional sources: an exogenous one through the mood
induction procedure and an endogenous one through observing other participants’
choices. Disentangling these mood effects and measuring their respective weight
would aid in understanding the behavioural consequences of induced emotions
relative to the causes of emotions which are a central theme in psychology.
Finally, we focus on the effects of induced emotions in a one-shot interaction
game. Yet, the persistence of this effect is of great relevance, especially in the light of
our evidence that the fitness of human societies is sensitive to specific emotions such
as anger. The long-run impact of emotions on economic behaviour is important to be
quantified as it will improve our understanding of the survival and success of human
societies.
24 For evidence of anger being an approach motivated affect see the survey of Carver and Harmon-Jones (2009).
22
References Andrade, E.B., & Ariely, D. (2009). The enduring impact of transient emotions on
decision making. Organizational Behavior and Human Decision Processes
109:1–8.
Andreoni, J., (1988). Why free ride?: Strategies and learning in public goods
experiments, Journal of Public Economics, 37:291-304
Ben-Shakhar, G., Bornstein, G., Hopfensitz, A., & Van Winden, F. (2007).
Reciprocity and emotions in bargaining using physiological and self-report
measures. Journal of Economic Psychology 28:314–323.
Bless, H., Clore, G.L., Schwarz, N., Golisano, V., Rabe, C., & Wӧlk, M. (1996).
Mood and the use of scripts: Does a happy mood really lead to mindlessness?
Journal of Personality and Social Psychology 71:665-679.
Boehm, C. (2000). Conflict and the evolution of social control. Journal of
Consciousness Studies 7:79-101.
Bolle, F., Tan, J.H.W. & Zizzo, D.J. (2014). Vendettas. American Economic Journal:
Microeconomics 6:93-130.
Bosman, R., & Van Winden, F. (2002). Emotional hazard in a power-to-take
experiment. Economic Journal 112:147-169.
Bowles, S., & Gintis, H. (2005). Pro-Social Emotions. In The Economy as a Complex
Evolving System III: Essays in Honor of Kenneth Arrow, L. Blume and S.
Durlauf, eds. Oxford University Press.
Brandts, J. & Schram, A. (2001). Cooperation and noise in public goods experiments:
applying the contribution function approach, Journal of Public Economics,
79:399-427.
Capra, M.C., Lanier, K. F., & Meer, S. (2010). The effects of induced mood on
bidding in random nth-price auctions. Journal of Economic Behavior and
Organization 75:223-234.
Capra, M.C. (2004). Mood-Driven Behavior in Strategic Interactions, American
Economic Review, Papers and Proceedings 94:367-372.
Carver, C.S. & Harmon-Jones E. (2009). Anger is an Approach-Related Affect:
Evidence and Implications, Psychological Bulletin, 135(2), 183–204.

23
Charness, G., & Grosskopf, B. (2001). Relative payoffs and happiness: an
experimental study. Journal of Economic Behavior and Organization 45:301-
328.
Chaudhuri, A. (2011). Sustaining cooperation in laboratory public goods experiments:
a selective survey of the literature. Experimental Economics 14:47-83.
Clark, D.M. (1983). On the induction of depressed mood in the laboratory: Evaluation
and comparison of the Velten and musical procedures. Advanced Behavior
Research and Therapy 5:27-49.
Coats, J., Gronberg, T. & Grosskopf, B. (2009), Simultaneous versus Sequential
Public Good Provision and the Role of Refunds - An Experimental Study,
Journal of Public Economics, 93, 326-335.
Cubitt, R.P., Drouvelis, M., & Gächter, S. (2011). Framing and free riding: emotional
responses and punishment in social dilemma games. Experimental Economics
14:254–272.
Damasio, A.R. (1994). The Feeling of What Happens: Body and Emotion in the
Making of Consciousness NY: Harcourt Brace.
Dickinson, D.L., Masclet, D. (2015). Emotion venting and punishment in public good
experiments, Journal of Public Economics 122:55-67.
Dufwenberg, M., Gächter, S. & Hennig-Schmidt, H. (2011). The Framing of Games
and the Psychology of Play. Games and Economic Behavior 73:459-478.
Fehr, E., & Gächter, S. (2000). Cooperation and Punishment in Public Goods
Experiments. American Economic Review 90:980–994.
Fehr, E., & Gächter, S. (2002). Altruistic Punishment in Humans. Nature 415:137–
140.
Fessler, D.M.T. & Haley, K.J. (2003). The strategy of affect: Emotions in human
cooperation. In The Genetic and Cultural Evolution of Cooperation, P.
Hammerstein, eds. Dahlem Workshop Report. MIT Press.
Fischbacher, U. (2007). z-Tree: Zurich Toolbox for Ready-made Economic
Experiments. Experimental Economics 10:171-178.
Forgas, J.P. (1992). Affect in social judgments and decisions: A multiprocess model.
In Advances in Experimental Social Psychology M.P. Zanna ed. San Diego, CA:
Academic Press.
Forgas, J.P. (1995). Mood and judgment: The Affect Infusion Model (AIM).
Psychological Bulletin 116:39–66.

24
Frank, R.H. (1988). Passions Within Reason: The Strategic Role of the Emotions.
W.W. Norton & Company.
Fredrickson, B.L. (2005). The broaden-and-build theory of positive emotions. In The
Science of Well-being FA Huppert, N Baylis & B Keverne eds. Oxford: Oxford.
Gächter, S., Renner, E. & Sefton, M. (2008). The long-run benefits of punishment,
Science 322:1510.
Gächter, S. & Herrmann, B. (2009). Reciprocity, culture and human cooperation:
Previous insights and a new cultural experiment. Philosophical Transactions of
the Royal Society B – Biological Sciences 364:761-806.
Greiner, B. (2015). Subject pool recruitment procedures: organizing experiments with
ORSEE. Journal of the Economic Science Association 1:114-125.
Gross, J.J., & Levenson, R.W. (1995). Emotion elicitation using film. Cognition and
Emotion 9:87-105.
Hertel, G., Neuhof, J., Theuer, T., & Kerr, N.L. (2000). Mood effects on cooperation
in small groups: Does positive mood simply lead to more cooperation?
Cognition and Emotion 14:441-472.
Hertel, G., & Fiedler, K. (1994). Affective and cognitive influences in a social
dilemma game. European Journal of Social Psychology 24:131-145.
Hopfensitz, A., & Reuben, E. (2009). The importance of emotions for the
effectiveness of social punishment. Economic Journal 119:1534–1559.
Ifcher, J., & Zarghamee, H. (2011). Happiness and Time Preference: The Effect of
Positive Affect in a Random-Assignment Experiment. American Economic
Review 101:3109-3129.
Isaac, R.M., Walker, J.M & Williams, A.W. (1994). Group-size and the voluntary
provision of public goods - Experimental evidence utilizing large groups.
Journal of Public Economics, 54:1–36.
Isen, A.M. (1987). Positive affect, cognitive processes, and social behavior. In,
Advances in experimental social psychology, L. Berkowitz ed. San Diego, CA:
Academic Press.
Joffily, M., Masclet, D., Noussair, C. N. & Villeval, M. C. (2014). Emotions,
sanctions, and cooperation. Southern Economic Journal 80:1002-1027.
Kirchsteiger, G., Rigotti, L., & Rustichini, A. (2006). Your morals might be your
moods. Journal of Economic Behavior and Organization 59:155-172.

25
Loewenstein, G., & Lerner, J.S. (2002). The role of affect in decision making. In
Handbook of affective science R. Davidson, K. Scherer, & H. Goldsmith (Eds.).
New York: Oxford University Press.
Mackie, D.M., & Worth, L.T. (1989). Cognitive deficits and the mediation of positive
affect in persuasion. Journal of Personality and Social Psychology 66:37-47.
Martin, M. (1990). On the induction of mood. Clinical Psychology Review 10:669-
697.
Meshulam, M., Winter, E. Ben-Shakhar, G., & Aharon, Y. (2011). Rational Emotions
in the Lab. Social Neuroscience, 7:11-17.
Ostrom, E., Walker, J., & Gardner, R. (1992). Covenants with and without a sword:
self governance is possible. American Political Science Review 86:404–417.
Ostrom, E. and Vollan, B. (2010), Cooperation and the Commons, Science 330: 923–
24.
Oswald, A.J., & Proto, E., & Sgroi, D. (2015). Happiness and Productivity,
forthcoming in the Journal of Labor Economics, 33.
Pillutla, M.M. & Murnighan, J.K. (1996). Unfairness, anger, and spite: Emotional
rejections of ultimatum offers. Organizational Behavior and Human Decision
Processes 68: 208-224.
Reuben, E., & F. van Winden (2010). Fairness perceptions and prosocial emotions in
the power to take. Journal of Economic Psychology 31: 908–922.
Rick, S., and Loewenstein, G. (2008). The Role of Emotion in Economic Behavior.
Chapter 9 (pp. 138-156) in the Handbook of Emotions, edited by M. Lewis, J.M.
Haviland-Jones, and L. Feldman Barrett, The Guildford Press.
Sanfey, A., Rilling, J., Aronson, J., Nystrom, L., & Cohen, J. (2003). The Neural
Basis of Economic Decision-Making in the Ultimatum Game. Science
300:1755-1758.
Schwarz, N. (1990). Feelings as information: Informational and motivational
functions of affective states. In Handbook of motivation and cognition:
Foundations of social behaviour E.T. Higgins & R.M. Sorrentino eds. New
York: Guilford Press.
Schwarz, N., & Clore, G.L. (1996). Feelings and phenomenal experiences. In Social
psychology: A handbook of basic principles, E.T. Higgins & A. Kruglanski eds.
New York: Guilford Press.

26
Stanton, S.J., Reeck, C., Huettel, S.A., and LaBar, K.S., (2014). Effects of induced
moods on economic choices, Judgment and decision making 9:167-175.
Wegener, D.T., Petty, R.E., & Smith, S.M. (1995). Positive mood can increase or
decrease message scrutinity: The hedonic contingency view of mood and
message processing. Journal of Personality and Social Psychology 69:5-15.
Westermann, R., Spies, K., Stahl, G., & Hesses, F.W. (1996). Relative effectiveness
and validity of mood induction procedures: a meta-analysis. European Journal
of Social Psychology 26:557-580.
Xiao, E., & Houser, D. (2005). Emotion expression in human punishment behavior.
Proceedings of the National Academy of Sciences 102:7398-7401.
Zizzo, D.J., (2004). The Neuroeconomics of Anger, Homo Oeconomicus 21:495-508.
27
Appendix A. Experimental Instructions
[Note: These are the written instructions as presented to subjects facing the “With Announcement” treatments. Amendments to the “Without Announcement” treatments are given in square brackets.]
Instructions Welcome to the Birmingham Experimental Economics Laboratory. This is an experiment in decision making. The University of Birmingham has provided funds for this research. Just for showing up you have already earned £2.50. You can earn additional money depending on the decisions made by you and other participants. It is therefore very important that you read these instructions with care. It is important that you remain silent and do not look at other people’s work. If you have any questions, or need assistance of any kind, please raise your hand and an experimenter will come to you. If you talk, laugh, exclaim out loud, etc., you will be asked to leave and you will not be paid. We expect and appreciate your following of these rules. We will first jointly go over the instructions. After we have read the instructions, you will have time to ask clarifying questions. Each of you will then need to answer a few brief questions to ensure everybody understands. We would like to stress that any choices you make in this experiment are entirely anonymous. Please do not touch the computer or its mouse until you are instructed to do so. Thank you. In the instructions, unless otherwise stated, we will not speak in terms of Pounds, but in terms of Experimental Currency Units (ECUs). Your entire earnings will, thus, be calculated in ECUs. At the end of the session the total amount of ECUs you have earned will be converted to Pounds at the following rate: 1 ECU = 0.35 Pounds. The converted amount will privately be paid to you in cash. The experiment consists of two parts. At the beginning of the experiment, participants are divided into groups of three. You will therefore be in a group with 2 other participants. At no point during the experiment, nor afterwards will you be informed about the identity of the other participants in your group and the other participants will never be informed about your identity. [“Without Announcement” treatments: The experiment consists of two parts. Below we will detail the instructions for Part 1. You will receive new instructions for Part 2 once everyone in the room has completed Part 1. At the beginning of the experiment, participants are divided into groups of three. You will therefore be in a group with 2 other participants. At no point during the experiment, nor afterwards will you be informed about the identity of the other participants in your group and the other participants will never be informed about your identity.]
Detailed Information about the Experiment
Part 1 At the beginning of the experiment each of you receives 20 tokens. We call this your endowment. Your task is to decide how to use your endowment. You have to decide

28
how many of the 20 tokens you want to contribute to a project and how many of them to keep for yourself. The two other members of your group have to make the same decision. Every token that you do not contribute to the project automatically belongs to you and earns you one ECU. For the tokens contributed to the project the following happens: The total contributions to the project will be calculated by adding up all individual contributions of the group members. This total will then be multiplied by 1.5 and this amount will be divided equally among all three members of the group. For example, if 1 token is contributed to the project, the project’s value increases to 1.5 ECUs. This amount is divided equally among all three members of the group. Thus every group member receives 0.5 ECUs. Your income therefore consists of two parts: (1) The tokens which you have kept for yourself (“Income from retained tokens”) whereby 1 token = 1 ECU. (2) The “Income from the project”. This income is calculated as follows: Your income from the project = 0.5 times the total contributions to the project. The income of each group member from the project is calculated in the same way, i.e., each group member receives the same income from the project.
Your total income in ECUs is therefore:
(20 – tokens contributed to the project by you) + 0.5*(sum of all tokens contributed to the project by all members of your group)
When making your decision, the following input-screen will appear:

29
As mentioned above, your endowment in the experiment is 20 tokens. You have to decide how many tokens you contribute to the project by typing a number between 0 and 20 in the input field. This field can be reached by clicking it with the mouse. By deciding how many tokens to contribute to the project, you automatically decide how many tokens you keep for yourself. After entering the amount of tokens you contribute you must press the O.K. button using the mouse. Once you have done this, your decision can no longer be revised. After that, you will be informed about the amount of tokens you contributed to the project, the individual amount of tokens each member of your group contributed, the sum of tokens contributed to the project, your total income and the income of the other group members. [“Without Announcement” treatments: Do you have any questions? Please raise your hand and an experimenter will come to your desk. Please do not ask any question out loud. Once everybody has correctly answered the control questionnaire, we would like you to watch a short video clip, which will be the same for all participants in this session. After the end of the video clip, you will be asked to fill out a short questionnaire and then be asked to make the decisions for the experiment.]
Part 2 During this part, after seeing how many tokens each of the other two group members has contributed to the project and his or her corresponding income from Part 1, you can either decrease or leave unchanged the income of each other group member by assigning negative points to them. The other group members can also decrease your income, by assigning negative points to you, if they wish to do so. You will see the following input screen in Part 2:

30
You must decide how many negative points to assign to each of the other two group members. In the second row you can see your contribution and your income from Part 1. In the other two rows, you can see the same information for each of the two other members of the group. If you do not wish to change the income of a specific group member then enter 0 in the box for that group member. If you do wish to decrease a group member’s income, enter instead the number of negative points that you wish to assign to them, preceded by a minus sign (without spaces between them). For example, to assign 2 negative points to a group member, type -2 in the relevant box. You can move from one input field to the other by pressing the tab -key (→) or by using the mouse. You must enter a response in each box. You can assign between 0 and 5 negative points to each one of the two other group members. Assigning negative points is costly. Each negative point that you assign costs you one ECU. Thus, the total cost to you in ECUs of assigning negative points to other group members is given by the total number of negative points that you assign. Until you press the OK-button, you can still change your decision. The effects of assigning negative points to other group members are as follows: If you give 0 points to a particular group member, you will not have any effect on his or her income. However, for each negative point that you assign to a particular group member, you will decrease their income by 3 ECUs (unless their income is already exhausted). For example, if you give a group member 2 negative points (i.e., enter –2), you will decrease their income by 6 ECUs. And so on. Your own income will be decreased by 3 ECUs for each negative point that is assigned to you by the other two group members, except that, if all of your income from the first part is exhausted as a result of negative points assigned to you, your income cannot be reduced any further by other group members. Therefore, your total income from the two parts is calculated as follows:
Total income (in ECUs) after part 2
= income from Part 1 (1) – 3*(sum of negative points assigned to you) (2)
– costs of negative points assigned by you
if (1) + (2) is greater than or equal to 0;
= 0 – costs of negative points assigned by you
if (1) + (2) is less than 0
31
Please note that your income in ECUs after Part 2 can be negative, if the cost of negative points assigned by you exceeds your income from Part 1 less any reduction in your income caused by negative points assigned to you by other group members. If this is the case, your show-up fee of £2.50 will be used to cover the losses. Do you have any questions? Please raise your hand and an experimenter will come to your desk. Please do not ask any question out loud. Once everybody has correctly answered the control questionnaire, we would like you to watch a short video clip, which will be the same for all participants in this session. After the end of the video clip, you will be asked to fill out a short questionnaire and then be asked to make the decisions for the experiment.
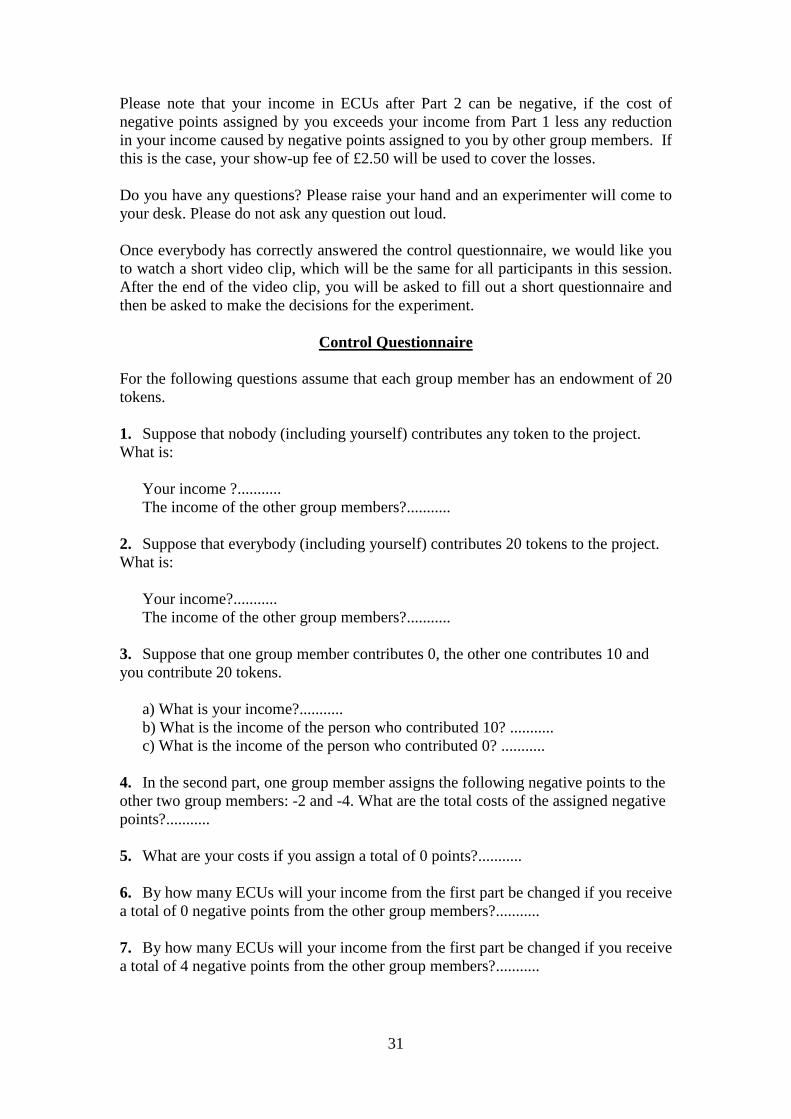
Control Questionnaire
For the following questions assume that each group member has an endowment of 20 tokens. 1. Suppose that nobody (including yourself) contributes any token to the project. What is: Your income ?........... The income of the other group members?........... 2. Suppose that everybody (including yourself) contributes 20 tokens to the project. What is: Your income?........... The income of the other group members?........... 3. Suppose that one group member contributes 0, the other one contributes 10 and you contribute 20 tokens. a) What is your income?........... b) What is the income of the person who contributed 10? ........... c) What is the income of the person who contributed 0? ........... 4. In the second part, one group member assigns the following negative points to the other two group members: -2 and -4. What are the total costs of the assigned negative points?........... 5. What are your costs if you assign a total of 0 points?........... 6. By how many ECUs will your income from the first part be changed if you receive a total of 0 negative points from the other group members?........... 7. By how many ECUs will your income from the first part be changed if you receive a total of 4 negative points from the other group members?...........

32
Appendix B. Additional data illustrations and analyses
Figure B.1. Mean intensities for all emotions
Note: Data presented for “Without Announcement” include observations for the “1 stage” as well as the “2 stage” treatments.
02
46
8
Without Announcement With AnnouncementNegative Positive Negative Positive
warmth angerfear envysadness happinessshame irritationcontempt guiltjoy jealousysurprise

33
Table B.1. Mean intensities for all emotions Without Announcement With Announcement Positive
emotions treatment
Negative emotions treatment
Positive emotions treatment
Negative emotions treatment
Warmth 6.54 (1.65)
2.07 (1.45)
6.60 (1.82)
2.44 (1.82)
Anger 1.59 (1.49)
6.62 (1.94)
1.40 (0.92)
6.09 (1.99)
Fear 1.54 (1.37)
3.54 (2.28)
1.17 (0.63)
3.26 (1.89)
Envy 2.11 (1.70)
1.79 (1.55)
1.77 (1.56)
1.69 (1.13)
Sadness 2.40 (1.64)
6.15 (2.21)
2.31 (1.84)
6.30 (2.03)
Happiness 6.97 (1.44)
1.97 (1.55)
6.69 (1.99)
1.91 (1.43)
Shame 1.71 (1.18)
4.25 (2.56)
1.44 (1.22)
4.04 (2.21)
Irritation 2.44 (1.91)
6.59 (2.23)
2.21 (1.69)
6.46 (2.24)
Contempt 3.19 (2.45)
4.38 (2.64)
3.04 (2.64)
3.85 (2.60)
Guilt 1.68 (1.38)
2.83 (2.27)
1.56 (1.25)
3.04 (2.08)
Joy 6.32 (1.91)
1.62 (1.19)
5.98 (2.34)
1.69 (1.24)
Jealousy 1.81 (1.47)
1.50 (1.23)
1.58 (1.44)
1.5 (1.04)
Surprise 5.28 (2.49)
4.13 (2.35)
4.38 (2.79)
4.63 (2.32)
Note: Data presented for “Without Announcement” include observations for the “1 stage” as well as the “2 stage” treatments. Standard deviations in parentheses.

34
Figure B.2. Distribution of contribution levelsB1,B2
B1 Free-riders: The percentage of free-riders does not significantly differ across the emotions treatments (“Without Announcement” treatments: “Negative emotions” 42.74% vs. “Positive emotions” 35.14%, Test of Equality of Proportions, z=1.18, p=0.238; “With Announcement” treatment: “Negative emotions” 22.22% vs. “Positive emotions” 16.67%, Test of Equality of Proportions, z=0.71, p=0.478). B2 Full contributors: The percentage of full contributors is significantly lower in the “Negative emotions” treatment (9.26%) than in “Positive emotions” treatment (22.92%) (Test of Equality of Proportions, z=-1.89, p=0.059). For the “Without Announcement” treatments, the percentage of full contributors does not vary substantially (“Negative emotions” 4.27% and “Positive emotions” 5.41%, respectively, Test of Equality of Proportions, z=-0.40, p=0.689).
010
2030
4050
010
2030
4050
0 2 4 6 8 10 12 14 16 18 20 0 2 4 6 8 10 12 14 16 18 20
Without Announcement, Positive Without Announcement, Negative
With Announcement, Positive With Announcement, Negative
Perc
ent
Contributions

35
Table B.2. Determinants of contribution behaviour – Regression results
Dependent variable: Contribution by subject i
Happiness -0.299 (0.327)
Anger -0.578* (0.318)
With Announcement 4.968*** (1.276)
Female 1.848 (1.138)
Constant 5.937** (2.958)
Observations 330 Notes: Tobit estimates. The variables “Happiness” and “Anger” are the directly elicited emotions of happiness and anger, respectively, recorded on a 9-point scale (1 = “not at all”, …, 9 = “very much”). The variable “With Announcement” is a dummy variable which takes on the value “1” for the “With Announcement” treatment and “0” for the “Without Announcement”. The variable “Female” is a dummy variable which takes on the value “1” if a subject is female and “0” if a subject is male. Robust standard errors are presented in parentheses. * denotes significance at the 10-percent level, ** denotes significance at the 5-percent level, and *** at the 1-percent level.

36
Table B.3. Differences between our “Positive emotions” and Cubitt et al.’s punishment function – Regression results
Dependent variable: Punishment assigned by player i to
player j Group average contribution 0.006
(0.066) Player j ’s absolute negative deviation from punisher’s contribution
0.408*** (0.145)
Player j ’s positive deviation from punisher’s contribution
-0.020 (0.157)
Treatment -0.285 (1.016)
Treatment × Player j ’s absolute negative deviation from punisher’s contribution
-0.099 (0.155)
Treatment × Player j ’s positive deviation from punisher’s contribution
-0.005 (0.182)
Constant -4.023*** (1.101)
Observations 282 Notes: Tobit estimates. The variable “Group average contribution” indicates the average contribution of all three members in a group. The variable “Absolute negative deviation” is the absolute value of the actual deviation of subject j’s contribution from the punisher’s contribution, when subject j’s contribution falls below the punisher’s contribution; and zero otherwise. The variable “positive deviation” is constructed analogously. The variable “Treatment” equals 1 for the data used from our “Positive emotions” treatment and 0 for the data used from the corresponding Give-P treatment of the Cubitt et al. paper. Robust standard errors are presented in parentheses. * denotes significance at the 10-percent level, ** denotes significance at the 5-percent level, and *** at the 1-percent level.