university of california retiree health benefit...
TRANSCRIPT
University of California Retiree Health Benefit Program Actuarial Valuation as of July 1, 2012
ATTACHMENT
UNIVERSITY OF CALIFORNIA Retiree Health Benefit Actuarial Valuation Table of Contents
i
Table of Contents Section Description Page
Actuarial Valuation Certification ................................................................................................................................................ ii
I. Executive Summary ...................................................................................................................................................................... 1
II. Background and Comments ......................................................................................................................................................... 3
III. Summary of Actuarial Valuation Results ................................................................................................................................... 8
IV. Development of Unfunded Actuarial Accrued Liability.......................................................................................................... 14
V. Summary of Assets ...................................................................................................................................................................... 17
VI. Determination of Annual Required Contribution ................................................................................................................... 19
VII. Actuarial Experience .................................................................................................................................................................. 26
VIII. GASB Statement No. 45 Notes to the Financial Statements and RSI .................................................................................... 29
IX. 10-Year Projection of Employer Benefit Payments ................................................................................................................. 39
X. Summary of Plan Provisions ...................................................................................................................................................... 42
XI. Summary of Actuarial Methods and Assumptions .................................................................................................................. 55
XII. Summary of Demographic Information.................................................................................................................................... 75
XIII. Assumption Sensitivity ............................................................................................................................................................... 78
XIV. Glossary ........................................................................................................................................................................................ 80
UNIVERSITY OF CALIFORNIA Retiree Health Benefit Actuarial Valuation Actuarial Valuation Certification
ii
Actuarial Valuation Certification This report presents results of the actuarial valuation of the University of California Retiree Health Benefit Program (“the Plan”) as of July 1, 2012.
The University of California provided the participant data, financial information and plan descriptions used in this valuation. The actuary has checked the data for reasonableness, but has not independently audited the data. The actuary has no reason to believe the data is not complete and accurate, and knows of no further information that is essential to the preparation of the actuarial valuation. Actuarial information under Government Accounting Standards Board Statement No. 45 (GASB 45) is for purposes of fulfilling employer financial accounting requirements. The results have been made on a basis consistent with GASB 45 and are based upon assumptions prescribed by the University of California. Determinations for purposes other than meeting employer financial accounting requirements may be significantly different from the results reported herein. In our opinion, all costs, liabilities, rates of interest, and other factors under the Plan have been determined on the basis of actuarial assumptions and methods that are each reasonable (or consistent with authoritative guidance), taking into account the experience of the Plan and future expectations and that, when combined, represent our best estimate of anticipated experience under the Plan. Future actuarial measurements may differ significantly from the current measurements presented in this report due to such factors as the following: plan experience differing from that anticipated by the economic or demographic assumptions; changes in economic or demographic assumptions; increases or decreases expected as part of the natural operations of the methodology used for these measurements (such as the end of an amortization period or additional cost or contribution requirements based on the plan's funded status); and changes in plan provisions or applicable law. Our scope for this actuarial valuation did not include analyzing the potential range of such future measurements, and we did not perform that analysis.
UNIVERSITY OF CALIFORNIA Retiree Health Benefit Actuarial Valuation Actuarial Valuation Certification
iii
The undersigned with actuarial credentials collectively meet the Qualification Standards of the American Academy of Actuaries to render the actuarial opinions contained herein. Any tax advice included in this written communication was not intended or written to be used, and it cannot be used by the taxpayer, for the purpose of avoiding any penalties that may be imposed by any governmental taxing authority or agency.
Deloitte Consulting LLP
Michael de Leon, FCA, ASA, EA, MAAA Senior Manager
Will Eichman, FSA, MAAA Senior Manager
UNIVERSITY OF CALIFORNIA Section I Retiree Health Benefit Actuarial Valuation Executive Summary
Page 1
Executive Summary Governmental Accounting Requirements and Report Purposes
The Governmental Accounting Standards Board released the Statement of Governmental Accounting Standards No. 43 (“GASB 43”) and No. 45 (“GASB 45”) in 2004. These statements require trusts (GASB 43) and employers (GASB 45) to accrue the cost of post-employment benefits other than pensions while eligible employees are providing services to the employer. The University of California (“the University” or “UC”) adopted GASB 45 for the fiscal year beginning July 1, 2007.
The purposes of this actuarial valuation report are to: 1) measure the retiree health benefit plan’s accrued liabilities and normal cost, 2) provide GASB 45 disclosure information for the University’s financial reporting, and 3) project expected cash flows (pay-as-you-go costs).
Summary of Results
For the Campuses, Medical Centers, and Hastings, the key measures for the July 1, 2012 retiree health actuarial valuation are:
• The July 1, 2012 Unfunded Actuarial Accrued Liability (UAAL) is $14.5 billion.
• The Annual Required Contribution (ARC) for Fiscal Year 2012/2013 is $1.75 billion, consisting of:
• A normal cost of $0.55 billion, approximately 6.6% of University of California Retirement Plan (“UCRP”) covered payroll, and
• An amortization cost of $1.20 billion, approximately 14.4% of UCRP covered payroll.
Under governmental accounting rules, the ARC is not required to be funded but will be a component of the retiree health benefit expense recorded in the University’s financial statements.
• As of July 1, 2012, the funded ratio for retiree health benefits was 0.7%, given the University’s current policy of funding only projected pay-as-you-go cash costs (as described on the following page).
• Projected cash contributions for 2012/2013 are $261 million. This represents the projected pay-as-you-go cash costs of the retiree benefits funded by a systemwide retiree health assessment.
UNIVERSITY OF CALIFORNIA Section I Retiree Health Benefit Actuarial Valuation Executive Summary
Page 2
Executive Summary (cont.) Funding Policy
On July 1, 2007, the University of California Retiree Health Benefit Trust (“UCRHBT”) was created. The UCRHBT was established to allow certain University locations and affiliates (primarily Campuses, Medical Centers, and Hastings) that share the risks, rewards, and costs of providing for retiree health benefits to fund such benefits on a cost-sharing basis and accumulate funds on a tax-exempt basis under an arrangement segregated from University assets.
Currently, the University does not pre-fund retiree health benefits and instead provides for benefits on a pay-as-you-go basis. If pre-funding occurs in the future, the UCRHBT will be used as the vehicle for those assets. There is a balance in the UCRHBT as of July 1, 2012 of $97 million. This balance was created by a combination of one-time initial funding for cash flow purposes to facilitate administration and the timing of contributions and payments in and out of the trust. Minor differences between the amount collected from locations via the retiree health assessment and the actual pay-as-you-go benefit plan costs also affects the annual balance.
The retiree health assessment for the fiscal year ending June 30, 2013 was set at 3.72% of UCRP covered payroll (3.51% for the fiscal year ending June 30, 2012).
UNIVERSITY OF CALIFORNIA Section III Retiree Health Benefit Actuarial Valuation Summary of Actuarial Valuation Results
Page 3
Background and Comments Overview of Plans
The University of California’s current policy is to provide a continuation of the active health benefit program for eligible retirees, including a choice of medical, dental and wellness benefits. Depending on an employee’s service at retirement, the University of California will pay up to 100% of the maximum University contribution determined for each year. The contribution will not exceed the gross premium for selected coverage; however, the contribution can be used to reimburse all or a portion of an eligible member’s standard Medicare Part B premiums (up to $99.90 in 2013). Spouses/eligible domestic partners and dependents of retirees are also eligible for post-employment health coverage. A summary of the current substantive plan benefits are described in Section X of this report.
Changes from the Previous Actuarial Valuation
For the July 1, 2012 valuation, there was a significant gain due to actual experience of the program over the past year being different than expected. The overall experience of the program resulted in a decrease in the Actuarial Accrued Liability of $1,757 million (12.1%) and the ARC of $249 million (14.3%).
This experience gain was caused primarily by decreases or lower than expected increases in health care premium rates. The most significant changes were calendar year 2013 Medicare premium rates, which decreased for all plans except Health Net. As part of health care reform, a discount program became effective January 1, 2011, making manufacturer discounts available to certain Medicare beneficiaries receiving applicable covered Part D drugs (mostly brand) while in the coverage gap. The Employer Group Waiver Plan (EGWP) plus wrap program (or equivalent) was developed by each of the health plans providing Medicare coverage to the University’s retirees in accordance with guidance set by the Centers for Medicare & Medicaid Services (CMS), which allows all of the savings realized under this program to accrue to University and its retirees through wrap-around commercial coverage. Health Net implemented its EGWP plus wrap program effective January 1, 2012; so the savings are reflected in its 2012 rates. Anthem implemented its EGWP plus wrap programs effective during 2012. Kaiser implemented its equivalent to the EGWP plus wrap programs to be effective January 1, 2013.
UNIVERSITY OF CALIFORNIA Section III Retiree Health Benefit Actuarial Valuation Summary of Actuarial Valuation Results
Page 4
Background and Comments (cont.)
For the July 1, 2012 valuation, the medical trend rates were updated to incorporate an additional year of the University’s historic trend rates experience for HMO, PPO, and indemnity plans. The period from the initial trend rate to the ultimate trend rate was also extended to 11 years to reflect industry expectations of an increasing length of time until health care costs are brought under control.
For the Campuses, Medical Centers, and Hastings, this assumption change resulted in an increase in the actuarial accrued liability of $392 million (2.7%) and the ARC of $44 million (2.5%).
For the July 1, 2012 valuation, the assumed aging factors underlying the per capita costs were updated based on recent national age-specific healthcare claims data. This update was part of a periodic review of retiree health specific assumptions that are not part of the quadrennial experience study performed for UCRP. This recent data showed that claims have increased over the past several years at a faster rate for non-Medicare retirees than for employees. As a result, the actuarial accrued liability for the implicit subsidy related to non-Medicare retirees increased. As part of this update, it was recognized that age-graded rates are not necessary for employees/retirees and spouses/eligible domestic partners who will be/are eligible for Medicare. The University’s Medicare plans develop rates based on a population of only Medicare retirees. Since there is no group that is affected by higher premiums due to these retirees (i.e., there are no active employees in these plans), there is no implicit subsidy. The higher claims expected of Medicare retirees as their average ages increase are built into the Medicare trend rates and are considered part of the explicit subsidy.
For the Campuses, Medical Centers, and Hastings, this assumption change resulted in an increase in the actuarial accrued liability of $165 million (1.1%) and the ARC of $24 million (1.4%).
Health Care Reform
The Patient Protection and Affordable Care Act (“PPACA”) was signed into law on March 23, 2010. The primary objective of the act is to increase the number of Americans with health insurance coverage. There are several provisions within PPACA with potentially significant short- and long-term cost implications for employers. The applicable provisions of PPACA were first accounted for in the July 1, 2010 valuation. There have been no changes to the provisions determined to be applicable to this valuation; however, some assumptions have changed that were used to value these provisions. In future years, there may continue to be increased cost impact to the extent the health & welfare program experiences increased utilization due to these changes, all of which are assumed to be in place indefinitely.
UNIVERSITY OF CALIFORNIA Section III Retiree Health Benefit Actuarial Valuation Summary of Actuarial Valuation Results
Page 5
Background and Comments (cont.)
The provisions of PPACA considered are as follows: • Prohibiting lifetime and annual limits on the dollar value of coverage for “essential health benefits” • Increasing the dependent child age limit to age 26 • Elimination of cost sharing for in-network preventive services • Reflecting manufacturer discounts available to certain Medicare beneficiaries receiving applicable covered Part D drugs (mostly brand)
while in the coverage gap • Early Retirement Reinsurance Program • Excise tax on “Cadillac Plans” effective in 2018
No other changes were made to the valuation results to reflect other provisions of PPACA. These other provisions of PPACA have no impact on the plan, are not measurable at this time, or are immaterial. Additional details about these provisions and the reasons they were not measured are provided below.
• The cost sharing requirements included in PHS Act Section 2707 may apply to the University in the future. Additional guidance from the Secretary is required before the cost impact (if any) can be determined. Regardless, this section does not apply until 2014.
University Reporting Entities
For financial reporting purposes, the associated liabilities, expenses and other disclosure items are reported for different covered populations:
• The primary results are presented for the Campuses and Medical Centers of the University, which also includes the Office of the President, Agricultural & Natural Resources, the Associated Students of UCLA, and UC Hastings College of the Law. This combined entity is referred to as “Campus/Medical Center/Hastings/Other (CMCHO)”.
• In addition, results are presented separately for Lawrence Berkeley National Laboratory (LBNL), a Department of Energy (DOE) laboratory managed and operated by the University.
• This report includes the combined results for both entities.
UNIVERSITY OF CALIFORNIA Section III Retiree Health Benefit Actuarial Valuation Summary of Actuarial Valuation Results
Page 6
Background and Comments (cont.) Actuarial Methods and Assumptions
The University of California Retirement Plan performs experience studies periodically to determine reasonable and appropriate economic and demographic assumptions for purposes of valuing the defined benefit pension plan. The most recent UCRP experience study covered the four-year period ending June 30, 2010 and was presented by the Regents in July 2011. The approved recommendations from that study were used to determine the assumptions for this valuation, where applicable. In addition, Deloitte periodically reviews actuarial assumptions only applicable to the retiree health benefit plan outside of the experience study, such as medical trend rates and age-graded medical rates.
One significant assumption where the recommendation of the experience study is not applicable to this retiree health benefit valuation is the discount rate. Since the University’s retiree health benefits are effectively funded on only a pay-as-you-go cash cost basis, GASB 45 requires that the discount rate be based on the estimated long-term investment yield on the general assets. The University of California elected to use a discount rate of 5.5%. As of June 30, 2011, approximately 73% of general assets remained in the Short Term Investment Pool (“STIP”) and 27% were held in the Total Returns Investment Pool (“TRIP”). The combination of assets held in the STIP and TRIP are generally more liquid and risk averse than the assets of UCRP; therefore, the expected long-term investment yield is lower for the STIP/TRIP than that for the assets of UCRP.
The actuarial methods and assumptions are described in Section XI of this report. Additionally, Section XIII illustrates the impact that changes to the discount and benefit cost trend rate assumptions would have on the Actuarial Accrued Liability and Normal Cost. This is not part of GASB 45 disclosure requirements, but it is provided for the University’s information.
UNIVERSITY OF CALIFORNIA Section III Retiree Health Benefit Actuarial Valuation Summary of Actuarial Valuation Results
Page 7
Background and Comments (cont.) Cash Costs vs. Implicit Rate Subsidy GASB Statement Nos. 43 and 45 require that trusts and employers recognize the expected claims of the retiree population less the expected contributions by those retirees. This is not necessarily the same determination as the expected cash payments of the employer for retiree health benefits. The difference is that many post-employment health plans (including the University’s Retiree Health Benefit Program) charge the same premium rates for all participants in a non-Medicare plan regardless of their age. This single premium rate is called a blended premium rate because it blends the expected claims of both active and retired participants. Retirees are generally older than the average participant in a non-Medicare plan, which means they are expected to generate higher claims than the average participant of the plan; therefore, they are receiving a subsidy even if they pay 100% of the blended premium rate because they would be paying less in premiums than their claims costs. This subsidy is referred to as the “Implicit Rate Subsidy”.
Another way of considering the Implicit Rate Subsidy is to assume the retirees were removed from a blended plan and, instead, separately rated. In this scenario, the premium rate for the remaining active population would be lower; therefore, the retirees’ premium rate is being subsidized by the premiums for active employees. Since the employer generally pays a portion of the premiums for the active employees, this subsidy creates a liability for the employer.
By comparison, the cash costs are the actual dollars paid by the employer to cover a portion or all of the retirees’ premium rates. This is sometimes referred to as the “Explicit Rate Subsidy”. This is the benefit that is explicitly stated by the University that will be paid on behalf of retirees. Before implementing GASB 45, the University accounted for the annual costs of retiree health benefits solely based on these cash costs.
The Implicit Rate Subsidy for the Campuses, Medical Centers, and Hastings creates a liability of $2.69 billion as of July 1, 2012 and benefit payments of $86 million for fiscal year 2012/2013. This is approximately 18% of the total actuarial accrued liability and 25% of the total benefit payments for the Campuses, Medical Centers, and Hastings.
Final Disclosures
Most values reported here are final amounts for disclosures in the University’s financial statements; however, amounts related to the University cash benefit payments for Fiscal Year 2012/2013 are currently based on estimated benefit payments. The University’s final disclosures will be updated to reflect the actual benefit payments during the fiscal year.
UNIVERSITY OF CALIFORNIA Section III Retiree Health Benefit Actuarial Valuation Summary of Actuarial Valuation Results
Page 8
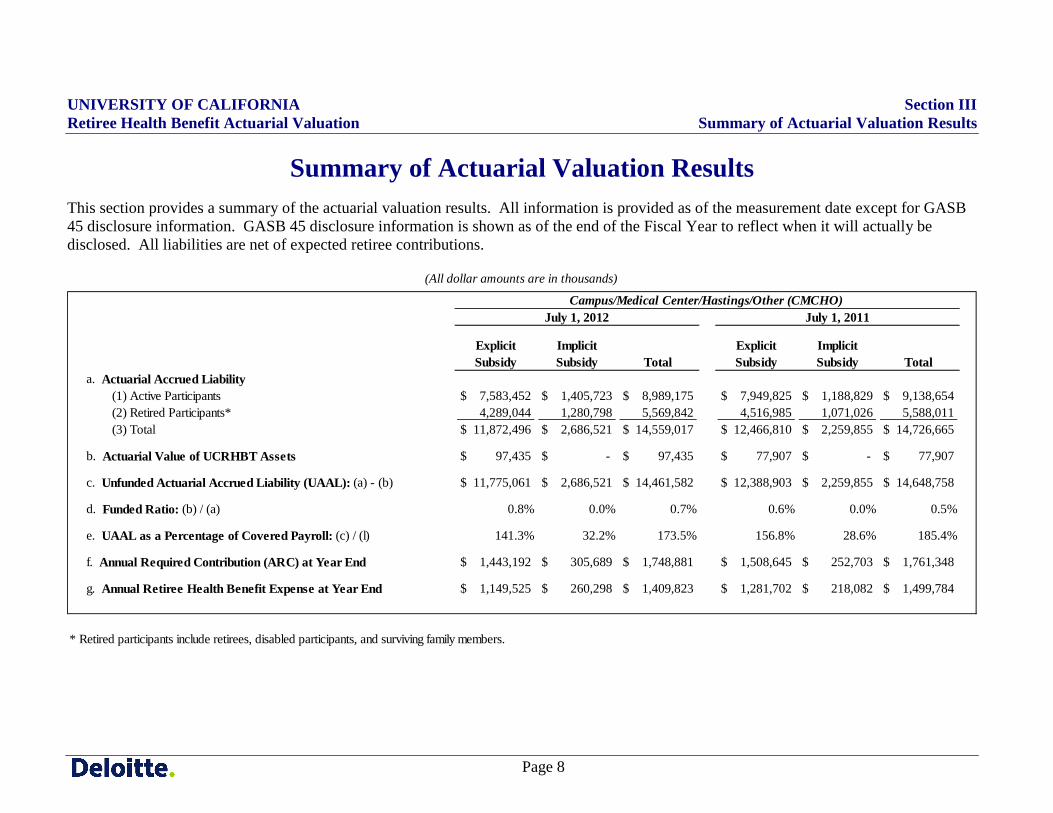
Summary of Actuarial Valuation Results This section provides a summary of the actuarial valuation results. All information is provided as of the measurement date except for GASB 45 disclosure information. GASB 45 disclosure information is shown as of the end of the Fiscal Year to reflect when it will actually be disclosed. All liabilities are net of expected retiree contributions.
ExplicitSubsidy
ImplicitSubsidy Total
ExplicitSubsidy
ImplicitSubsidy Total
a. Actuarial Accrued Liability (1) Active Participants $ 7,583,452 $ 1,405,723 $ 8,989,175 $ 7,949,825 $ 1,188,829 $ 9,138,654 (2) Retired Participants* 4,289,044 1,280,798 5,569,842 4,516,985 1,071,026 5,588,011 (3) Total $ 11,872,496 $ 2,686,521 $ 14,559,017 $ 12,466,810 $ 2,259,855 $ 14,726,665
b. Actuarial Value of UCRHBT Assets $ 97,435 $ - $ 97,435 $ 77,907 $ - $ 77,907
c. Unfunded Actuarial Accrued Liability (UAAL): (a) - (b) $ 11,775,061 $ 2,686,521 $ 14,461,582 $ 12,388,903 $ 2,259,855 $ 14,648,758
d. Funded Ratio: (b) / (a) 0.8% 0.0% 0.7% 0.6% 0.0% 0.5%
e. UAAL as a Percentage of Covered Payroll: (c) / (l) 141.3% 32.2% 173.5% 156.8% 28.6% 185.4%
f. Annual Required Contribution (ARC) at Year End $ 1,443,192 $ 305,689 $ 1,748,881 $ 1,508,645 $ 252,703 $ 1,761,348
g. Annual Retiree Health Benefit Expense at Year End $ 1,149,525 $ 260,298 $ 1,409,823 $ 1,281,702 $ 218,082 $ 1,499,784
(All dollar amounts are in thousands)
July 1, 2012 July 1, 2011Campus/Medical Center/Hastings/Other (CMCHO)
* Retired participants include retirees, disabled participants, and surviving family members.
UNIVERSITY OF CALIFORNIA Section III Retiree Health Benefit Actuarial Valuation Summary of Actuarial Valuation Results
Page 9
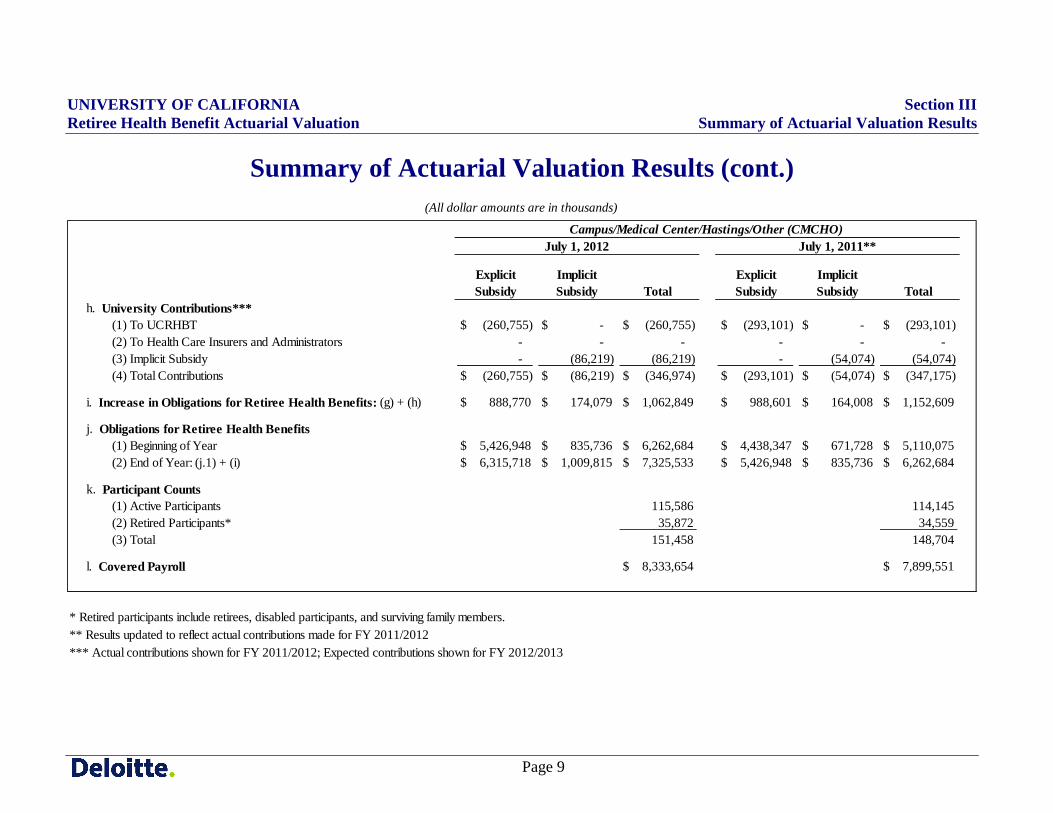
Summary of Actuarial Valuation Results (cont.)
ExplicitSubsidy
ImplicitSubsidy Total
ExplicitSubsidy
ImplicitSubsidy Total
h. University Contributions*** (1) To UCRHBT $ (260,755) $ - $ (260,755) $ (293,101) $ - $ (293,101) (2) To Health Care Insurers and Administrators - - - - - - (3) Implicit Subsidy - (86,219) (86,219) - (54,074) (54,074) (4) Total Contributions $ (260,755) $ (86,219) $ (346,974) $ (293,101) $ (54,074) $ (347,175)
i. Increase in Obligations for Retiree Health Benefits: (g) + (h) $ 888,770 $ 174,079 $ 1,062,849 $ 988,601 $ 164,008 $ 1,152,609
j. Obligations for Retiree Health Benefits (1) Beginning of Year $ 5,426,948 $ 835,736 $ 6,262,684 $ 4,438,347 $ 671,728 $ 5,110,075 (2) End of Year: (j.1) + (i) $ 6,315,718 $ 1,009,815 $ 7,325,533 $ 5,426,948 $ 835,736 $ 6,262,684
k. Participant Counts (1) Active Participants 115,586 114,145 (2) Retired Participants* 35,872 34,559 (3) Total 151,458 148,704
l. Covered Payroll $ 8,333,654 $ 7,899,551
*** Actual contributions shown for FY 2011/2012; Expected contributions shown for FY 2012/2013
July 1, 2012
(All dollar amounts are in thousands)
** Results updated to reflect actual contributions made for FY 2011/2012
Campus/Medical Center/Hastings/Other (CMCHO)July 1, 2011**
* Retired participants include retirees, disabled participants, and surviving family members.
UNIVERSITY OF CALIFORNIA Section III Retiree Health Benefit Actuarial Valuation Summary of Actuarial Valuation Results
Page 10
Summary of Actuarial Valuation Results (cont.)
Explicit Subsidy
Implicit Subsidy Total
Explicit Subsidy
Implicit Subsidy Total
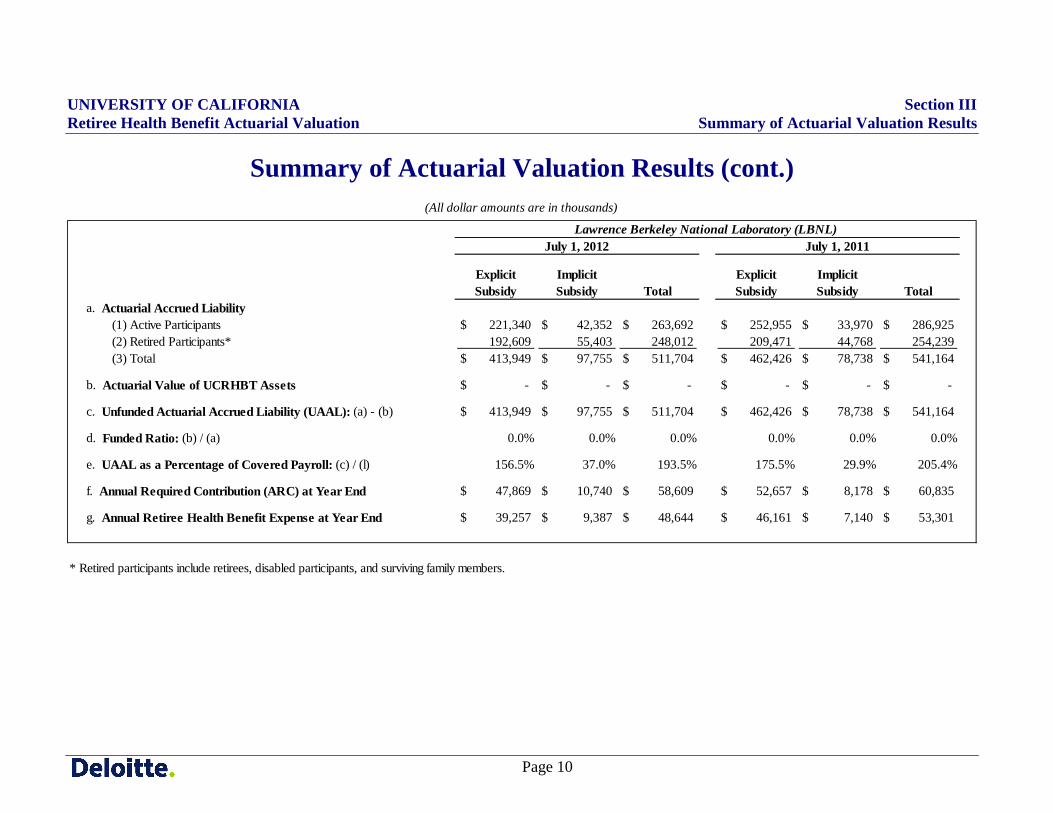
a. Actuarial Accrued Liability (1) Active Participants $ 221,340 $ 42,352 $ 263,692 $ 252,955 $ 33,970 $ 286,925 (2) Retired Participants* 192,609 55,403 248,012 209,471 44,768 254,239 (3) Total $ 413,949 $ 97,755 $ 511,704 $ 462,426 $ 78,738 $ 541,164
b. Actuarial Value of UCRHBT Assets $ - $ - $ - $ - $ - $ -
c. Unfunded Actuarial Accrued Liability (UAAL): (a) - (b) $ 413,949 $ 97,755 $ 511,704 $ 462,426 $ 78,738 $ 541,164
d. Funded Ratio: (b) / (a) 0.0% 0.0% 0.0% 0.0% 0.0% 0.0%
e. UAAL as a Percentage of Covered Payroll: (c) / (l) 156.5% 37.0% 193.5% 175.5% 29.9% 205.4%
f. Annual Required Contribution (ARC) at Year End $ 47,869 $ 10,740 $ 58,609 $ 52,657 $ 8,178 $ 60,835
g. Annual Retiree Health Benefit Expense at Year End $ 39,257 $ 9,387 $ 48,644 $ 46,161 $ 7,140 $ 53,301
July 1, 2012
(All dollar amounts are in thousands)
Lawrence Berkeley National Laboratory (LBNL)July 1, 2011
* Retired participants include retirees, disabled participants, and surviving family members.
UNIVERSITY OF CALIFORNIA Section III Retiree Health Benefit Actuarial Valuation Summary of Actuarial Valuation Results
Page 11
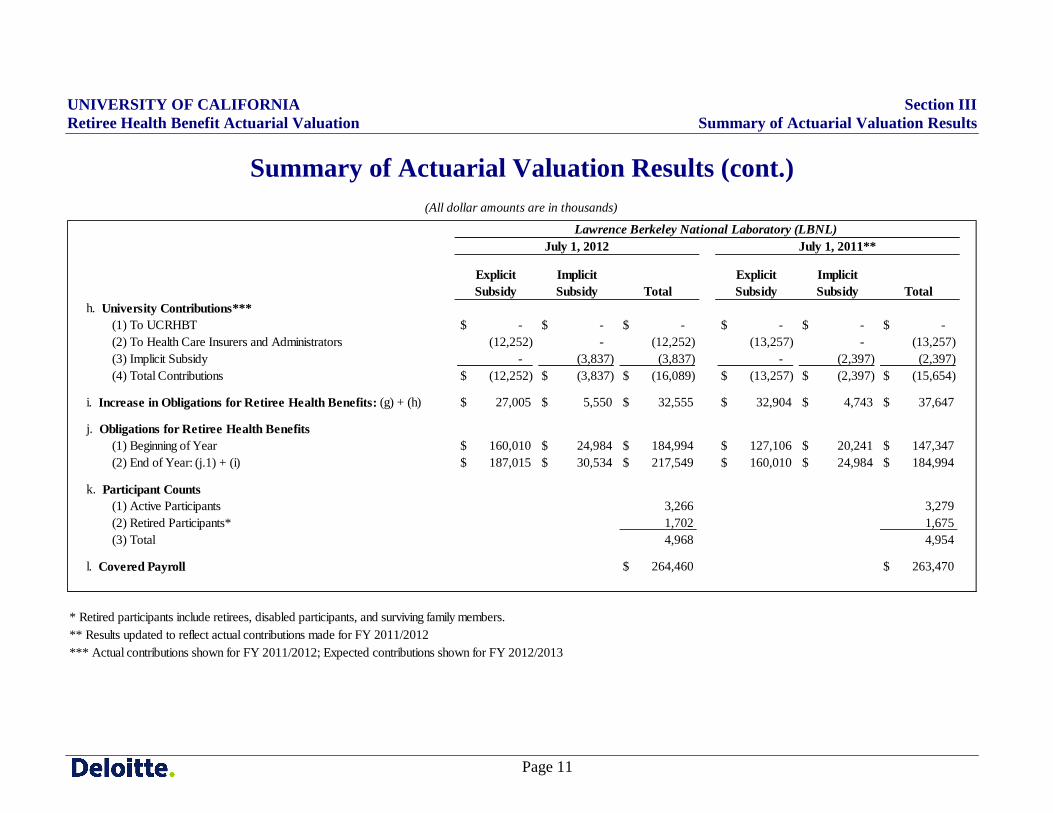
Summary of Actuarial Valuation Results (cont.)
Explicit Subsidy
Implicit Subsidy Total
Explicit Subsidy
Implicit Subsidy Total
h. University Contributions*** (1) To UCRHBT $ - $ - $ - $ - $ - $ - (2) To Health Care Insurers and Administrators (12,252) - (12,252) (13,257) - (13,257) (3) Implicit Subsidy - (3,837) (3,837) - (2,397) (2,397) (4) Total Contributions $ (12,252) $ (3,837) $ (16,089) $ (13,257) $ (2,397) $ (15,654)
i. Increase in Obligations for Retiree Health Benefits: (g) + (h) $ 27,005 $ 5,550 $ 32,555 $ 32,904 $ 4,743 $ 37,647
j. Obligations for Retiree Health Benefits (1) Beginning of Year $ 160,010 $ 24,984 $ 184,994 $ 127,106 $ 20,241 $ 147,347 (2) End of Year: (j.1) + (i) $ 187,015 $ 30,534 $ 217,549 $ 160,010 $ 24,984 $ 184,994
k. Participant Counts (1) Active Participants 3,266 3,279 (2) Retired Participants* 1,702 1,675 (3) Total 4,968 4,954
l. Covered Payroll $ 264,460 $ 263,470
*** Actual contributions shown for FY 2011/2012; Expected contributions shown for FY 2012/2013** Results updated to reflect actual contributions made for FY 2011/2012
(All dollar amounts are in thousands)
* Retired participants include retirees, disabled participants, and surviving family members.
July 1, 2011**July 1, 2012Lawrence Berkeley National Laboratory (LBNL)

UNIVERSITY OF CALIFORNIA Section III Retiree Health Benefit Actuarial Valuation Summary of Actuarial Valuation Results
Page 12
Summary of Actuarial Valuation Results (cont.)
ExplicitSubsidy
ImplicitSubsidy Total
ExplicitSubsidy
ImplicitSubsidy Total
a. Actuarial Accrued Liability (1) Active Participants $ 7,804,792 $ 1,448,075 $ 9,252,867 $ 8,202,780 $ 1,222,799 $ 9,425,579 (2) Retired Participants* 4,481,653 1,336,201 5,817,854 4,726,456 1,115,794 5,842,250 (3) Total $ 12,286,445 $ 2,784,276 $ 15,070,721 $ 12,929,236 $ 2,338,593 $ 15,267,829
b. Actuarial Value of UCRHBT Assets $ 97,435 $ - $ 97,435 $ 77,907 $ - $ 77,907
c. Unfunded Actuarial Accrued Liability (UAAL): (a) - (b) $ 12,189,010 $ 2,784,276 $ 14,973,286 $ 12,851,329 $ 2,338,593 $ 15,189,922
d. Funded Ratio: (b) / (a) 0.8% 0.0% 0.6% 0.6% 0.0% 0.5%
e. UAAL as a Percentage of Covered Payroll: (c) / (l) 141.8% 32.4% 174.1% 157.4% 28.6% 186.1%
f. Annual Required Contribution (ARC) at Year End $ 1,491,061 $ 316,429 $ 1,807,490 $ 1,561,302 $ 260,881 $ 1,822,183
g. Annual Retiree Health Benefit Expense at Year End $ 1,188,782 $ 269,685 $ 1,458,467 $ 1,327,863 $ 225,222 $ 1,553,085
* Retired participants include retirees, disabled participants, and surviving family members.
Combined - All Locations
(All dollar amounts are in thousands)
July 1, 2012 July 1, 2011
UNIVERSITY OF CALIFORNIA Section III Retiree Health Benefit Actuarial Valuation Summary of Actuarial Valuation Results
Page 13
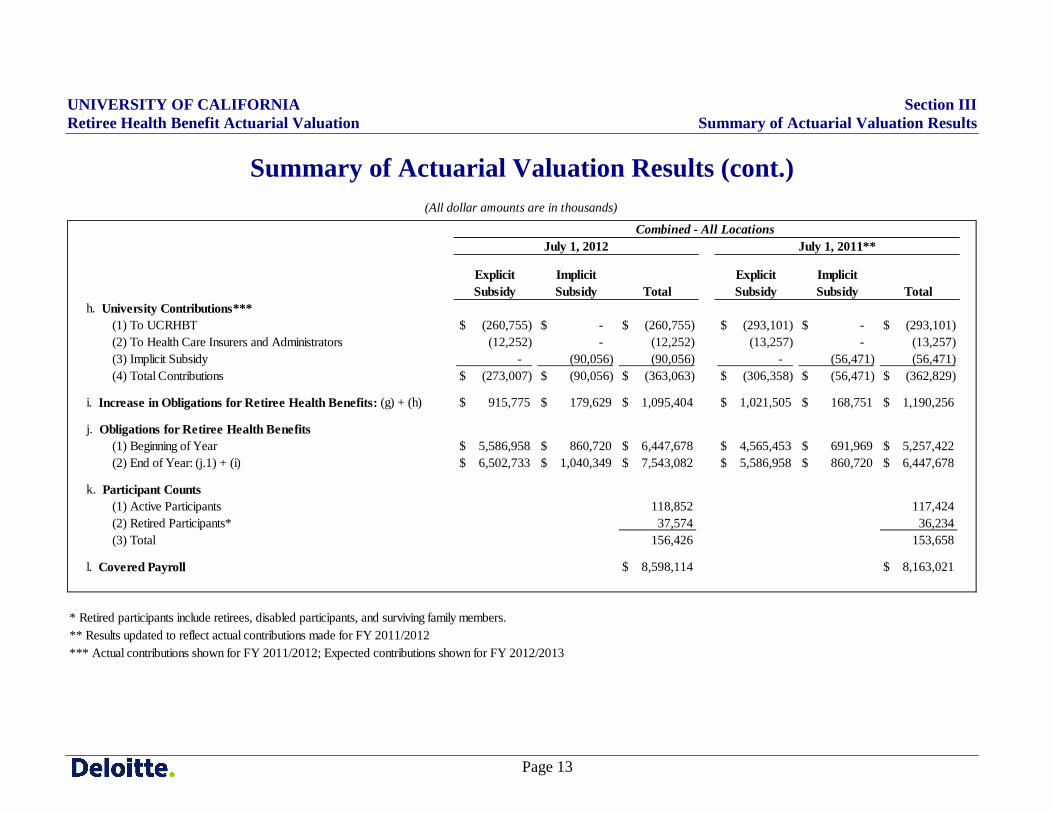
Summary of Actuarial Valuation Results (cont.)
ExplicitSubsidy
ImplicitSubsidy Total
ExplicitSubsidy
ImplicitSubsidy Total
h. University Contributions*** (1) To UCRHBT $ (260,755) $ - $ (260,755) $ (293,101) $ - $ (293,101) (2) To Health Care Insurers and Administrators (12,252) - (12,252) (13,257) - (13,257) (3) Implicit Subsidy - (90,056) (90,056) - (56,471) (56,471) (4) Total Contributions $ (273,007) $ (90,056) $ (363,063) $ (306,358) $ (56,471) $ (362,829)
i. Increase in Obligations for Retiree Health Benefits: (g) + (h) $ 915,775 $ 179,629 $ 1,095,404 $ 1,021,505 $ 168,751 $ 1,190,256
j. Obligations for Retiree Health Benefits (1) Beginning of Year $ 5,586,958 $ 860,720 $ 6,447,678 $ 4,565,453 $ 691,969 $ 5,257,422 (2) End of Year: (j.1) + (i) $ 6,502,733 $ 1,040,349 $ 7,543,082 $ 5,586,958 $ 860,720 $ 6,447,678
k. Participant Counts (1) Active Participants 118,852 117,424 (2) Retired Participants* 37,574 36,234 (3) Total 156,426 153,658
l. Covered Payroll $ 8,598,114 $ 8,163,021
July 1, 2011**
** Results updated to reflect actual contributions made for FY 2011/2012*** Actual contributions shown for FY 2011/2012; Expected contributions shown for FY 2012/2013
Combined - All Locations
(All dollar amounts are in thousands)
* Retired participants include retirees, disabled participants, and surviving family members.
July 1, 2012
UNIVERSITY OF CALIFORNIA Section IV Retiree Health Benefit Actuarial Valuation Development of Unfunded Actuarial Accrued Liability
Page 14
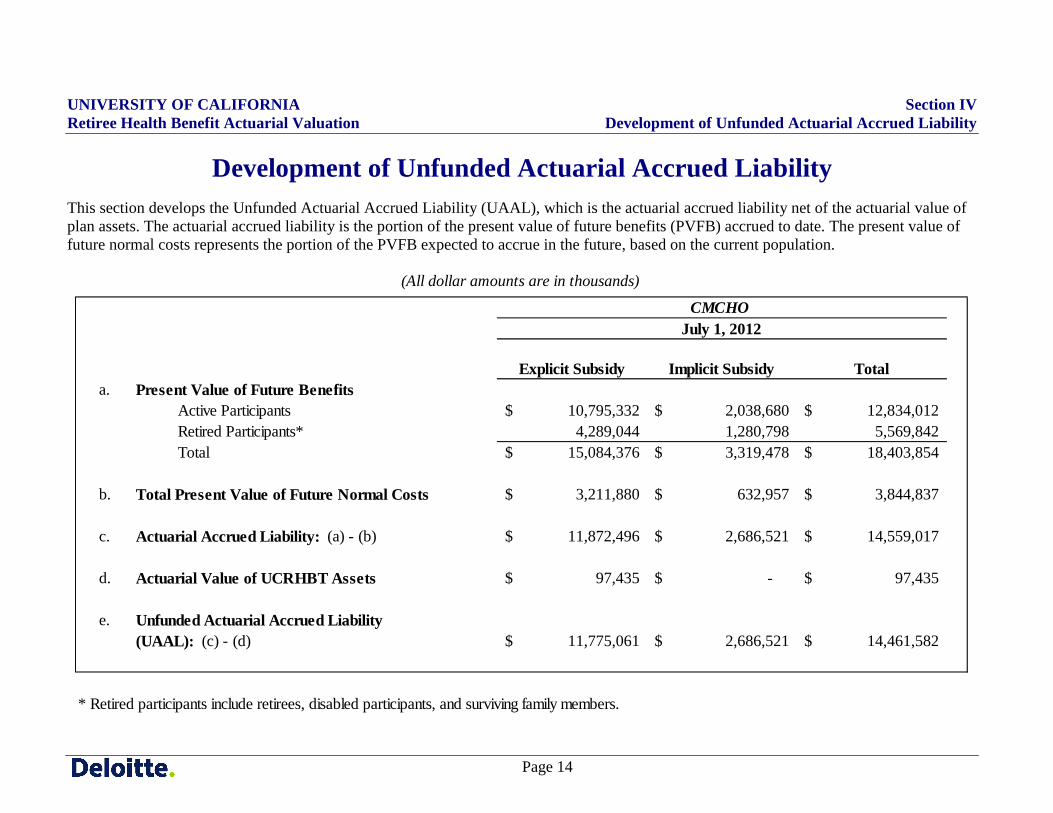
Development of Unfunded Actuarial Accrued Liability This section develops the Unfunded Actuarial Accrued Liability (UAAL), which is the actuarial accrued liability net of the actuarial value of plan assets. The actuarial accrued liability is the portion of the present value of future benefits (PVFB) accrued to date. The present value of future normal costs represents the portion of the PVFB expected to accrue in the future, based on the current population.
Explicit Subsidy Implicit Subsidy Totala. Present Value of Future Benefits
Active Participants 10,795,332$ 2,038,680$ 12,834,012$ Retired Participants* 4,289,044 1,280,798 5,569,842Total 15,084,376$ 3,319,478$ 18,403,854$
b. Total Present Value of Future Normal Costs 3,211,880$ 632,957$ 3,844,837$
c. Actuarial Accrued Liability: (a) - (b) 11,872,496$ 2,686,521$ 14,559,017$
d. Actuarial Value of UCRHBT Assets 97,435$ -$ 97,435$
e. Unfunded Actuarial Accrued Liability(UAAL): (c) - (d) 11,775,061$ 2,686,521$ 14,461,582$
* Retired participants include retirees, disabled participants, and surviving family members.
July 1, 2012
(All dollar amounts are in thousands)
CMCHO
UNIVERSITY OF CALIFORNIA Section IV Retiree Health Benefit Actuarial Valuation Development of Unfunded Actuarial Accrued Liability
Page 15
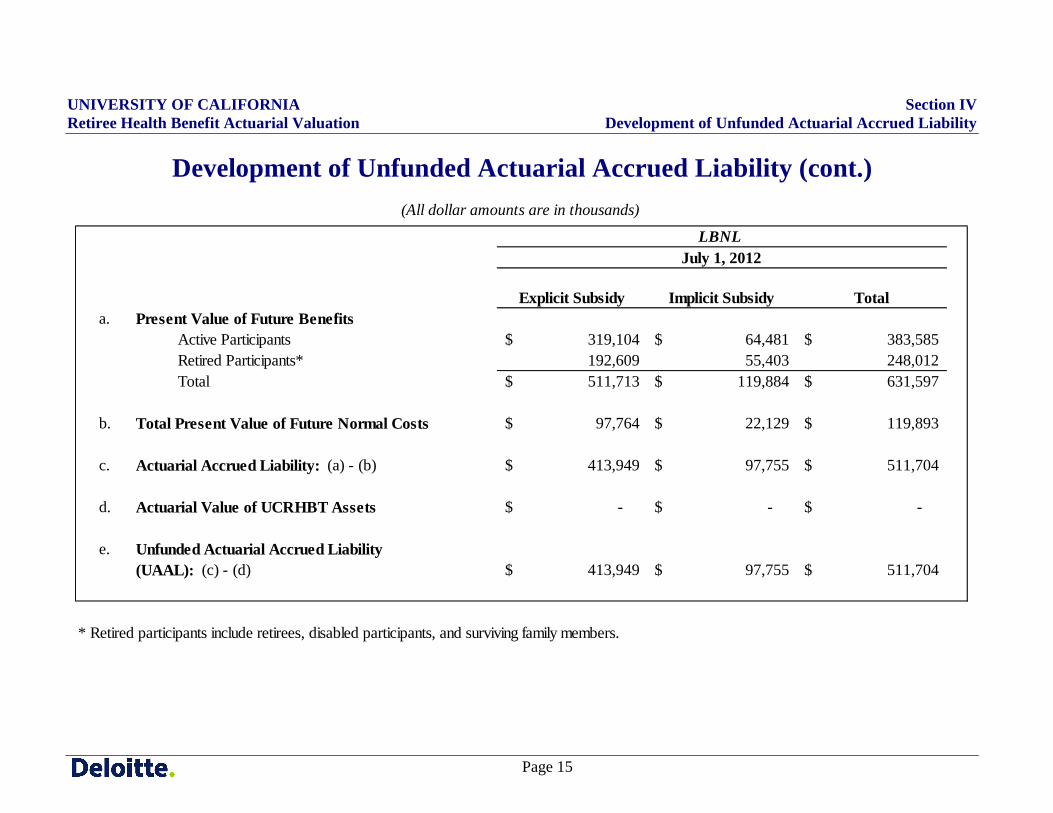
Development of Unfunded Actuarial Accrued Liability (cont.)
Explicit Subsidy Implicit Subsidy Totala. Present Value of Future Benefits
Active Participants 319,104$ 64,481$ 383,585$ Retired Participants* 192,609 55,403 248,012Total 511,713$ 119,884$ 631,597$
b. Total Present Value of Future Normal Costs 97,764$ 22,129$ 119,893$
c. Actuarial Accrued Liability: (a) - (b) 413,949$ 97,755$ 511,704$
d. Actuarial Value of UCRHBT Assets -$ -$ -$
e. Unfunded Actuarial Accrued Liability(UAAL): (c) - (d) 413,949$ 97,755$ 511,704$
* Retired participants include retirees, disabled participants, and surviving family members.
July 1, 2012
(All dollar amounts are in thousands)
LBNL
UNIVERSITY OF CALIFORNIA Section IV Retiree Health Benefit Actuarial Valuation Development of Unfunded Actuarial Accrued Liability
Page 16
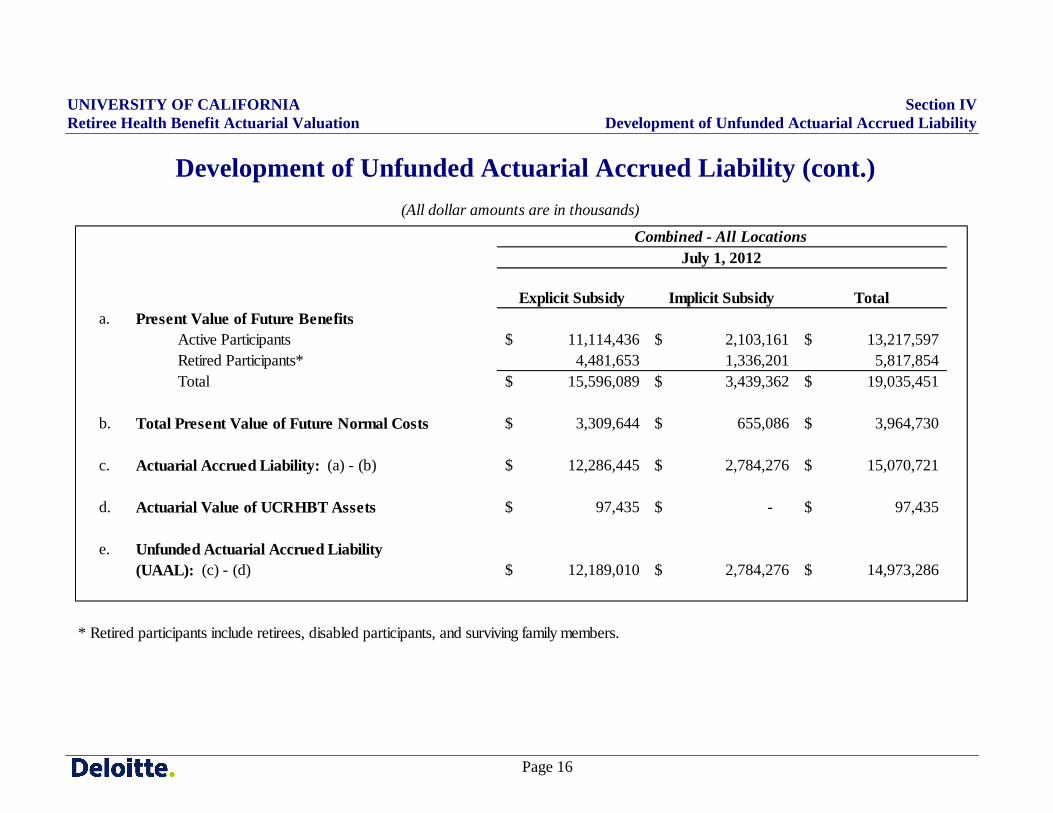
Development of Unfunded Actuarial Accrued Liability (cont.)
Explicit Subsidy Implicit Subsidy Totala. Present Value of Future Benefits
Active Participants 11,114,436$ 2,103,161$ 13,217,597$ Retired Participants* 4,481,653 1,336,201 5,817,854Total 15,596,089$ 3,439,362$ 19,035,451$
b. Total Present Value of Future Normal Costs 3,309,644$ 655,086$ 3,964,730$
c. Actuarial Accrued Liability: (a) - (b) 12,286,445$ 2,784,276$ 15,070,721$
d. Actuarial Value of UCRHBT Assets 97,435$ -$ 97,435$
e. Unfunded Actuarial Accrued Liability(UAAL): (c) - (d) 12,189,010$ 2,784,276$ 14,973,286$
* Retired participants include retirees, disabled participants, and surviving family members.
July 1, 2012
(All dollar amounts are in thousands)
Combined - All Locations
UNIVERSITY OF CALIFORNIA Section V Retiree Health Benefit Actuarial Valuation Summary of Assets
Page 17
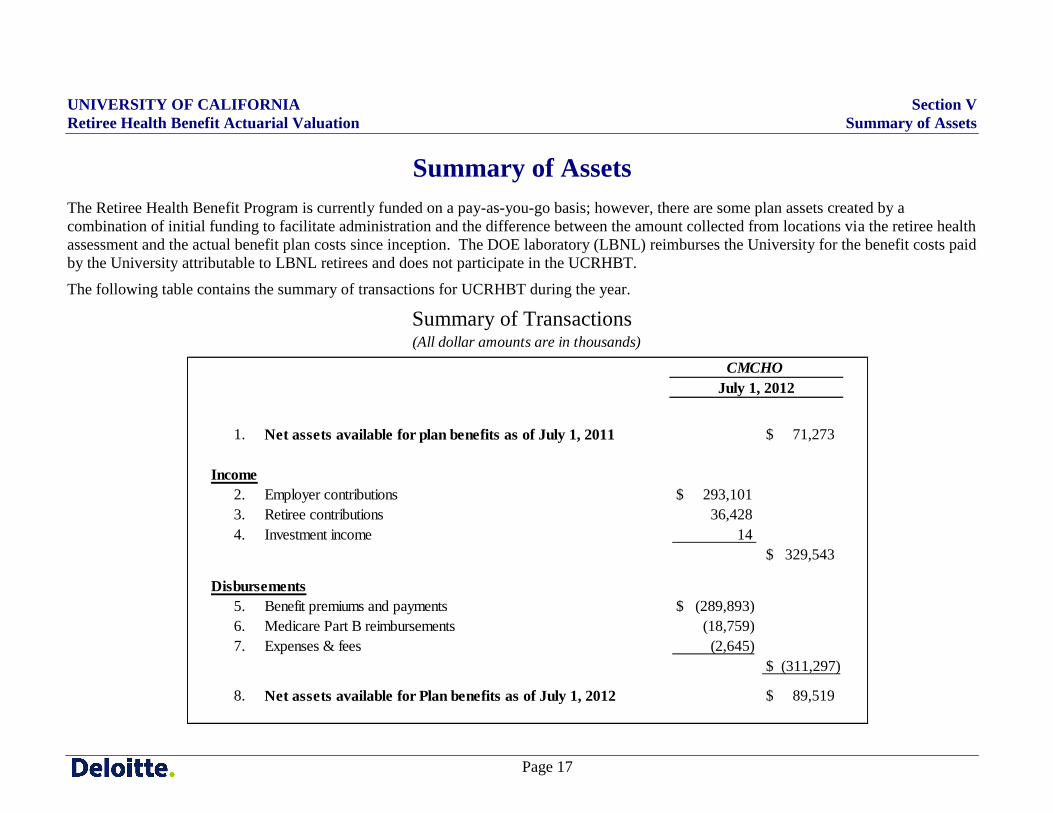
Summary of Assets The Retiree Health Benefit Program is currently funded on a pay-as-you-go basis; however, there are some plan assets created by a combination of initial funding to facilitate administration and the difference between the amount collected from locations via the retiree health assessment and the actual benefit plan costs since inception. The DOE laboratory (LBNL) reimburses the University for the benefit costs paid by the University attributable to LBNL retirees and does not participate in the UCRHBT.
The following table contains the summary of transactions for UCRHBT during the year.
Summary of Transactions
1. Net assets available for plan benefits as of July 1, 2011 $ 71,273
Income2. Employer contributions $ 293,101 3. Retiree contributions 36,428 4. Investment income 14
$ 329,543
Disbursements5. Benefit premiums and payments $ (289,893)6. Medicare Part B reimbursements (18,759)7. Expenses & fees (2,645)
$ (311,297)
8. Net assets available for Plan benefits as of July 1, 2012 $ 89,519
(All dollar amounts are in thousands)
CMCHOJuly 1, 2012
UNIVERSITY OF CALIFORNIA Section V Retiree Health Benefit Actuarial Valuation Summary of Assets
Page 18
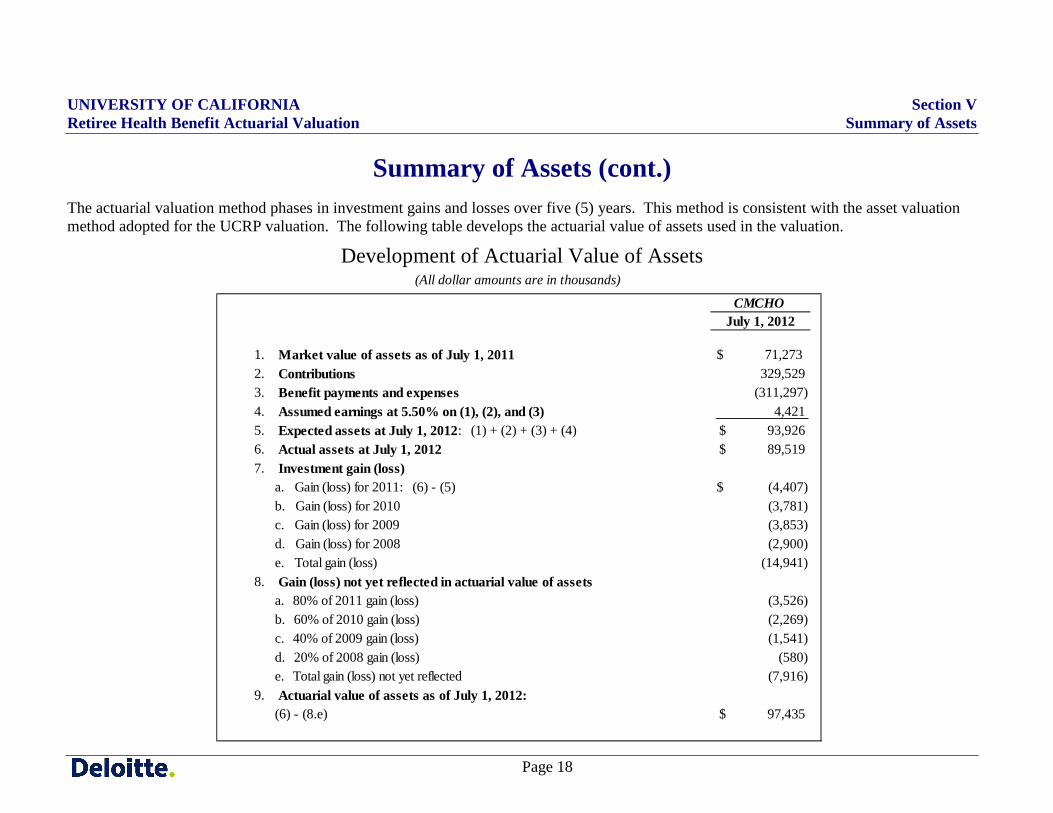
Summary of Assets (cont.) The actuarial valuation method phases in investment gains and losses over five (5) years. This method is consistent with the asset valuation method adopted for the UCRP valuation. The following table develops the actuarial value of assets used in the valuation.
Development of Actuarial Value of Assets
CMCHOJuly 1, 2012
1. Market value of assets as of July 1, 2011 $ 71,273 2. Contributions 329,529 3. Benefit payments and expenses (311,297)4. Assumed earnings at 5.50% on (1), (2), and (3) 4,421 5. Expected assets at July 1, 2012: (1) + (2) + (3) + (4) $ 93,926 6. Actual assets at July 1, 2012 $ 89,519 7. Investment gain (loss)
a. Gain (loss) for 2011: (6) - (5) $ (4,407)b. Gain (loss) for 2010 (3,781)c. Gain (loss) for 2009 (3,853)d. Gain (loss) for 2008 (2,900)e. Total gain (loss) (14,941)
8. Gain (loss) not yet reflected in actuarial value of assetsa. 80% of 2011 gain (loss) (3,526)b. 60% of 2010 gain (loss) (2,269)c. 40% of 2009 gain (loss) (1,541)d. 20% of 2008 gain (loss) (580)e. Total gain (loss) not yet reflected (7,916)
9. Actuarial value of assets as of July 1, 2012:(6) - (8.e) $ 97,435
(All dollar amounts are in thousands)
UNIVERSITY OF CALIFORNIA Section VI Retiree Health Benefit Actuarial Valuation Determination of Annual Required Contribution
Page 19
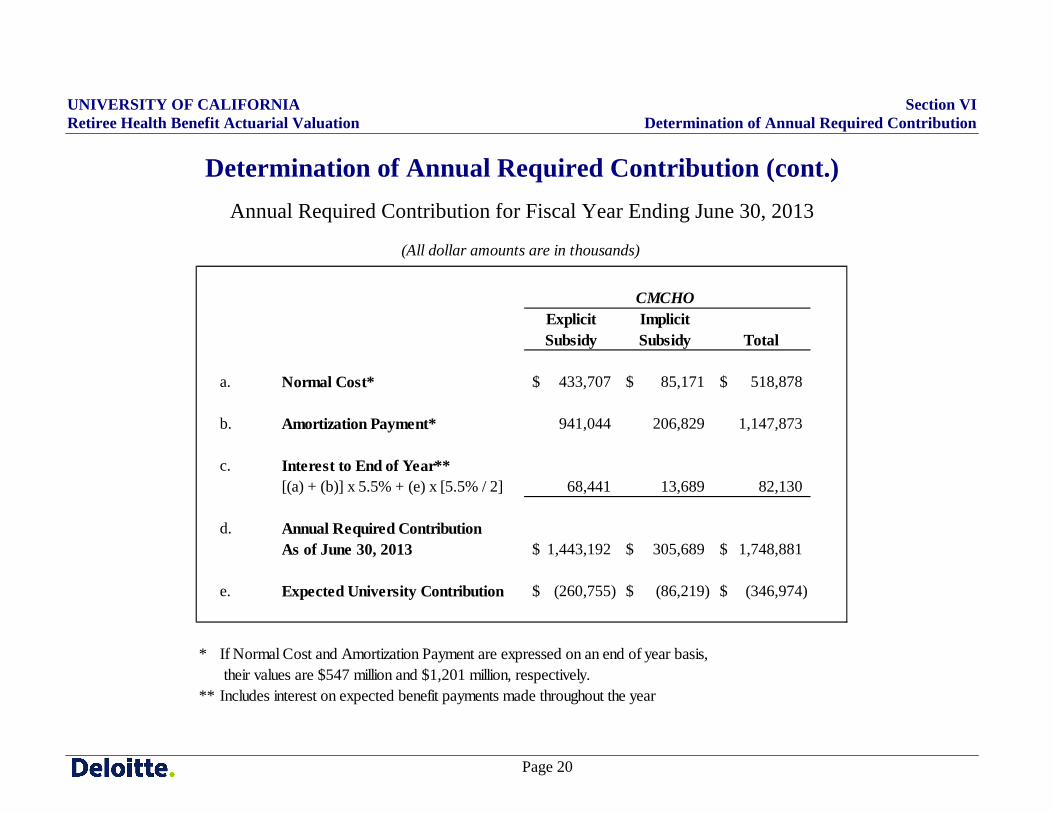
Determination of Annual Required Contribution GASB 45 requires the disclosure of the annual post-employment benefits other than pensions (“OPEB”) cost. A component of the annual OPEB cost is the Annual Required Contribution. The following is a brief explanation of the components of the Annual Required Contribution:
• Normal Cost: The portion of the Total Present Value of Future Benefits attributed to employee service during the current fiscal year by the actuarial cost method.
• Amortization Payments: Closed, 30-year, level dollar amortization of the initial Unfunded Actuarial Accrued Liability; closed, 15-year, level dollar amortizations of any future experience gains and losses; and closed, 30-year, level dollar amortization of any gains and losses due to assumption changes or changes in plan provisions.
• Interest to End of Year: The Annual Required Contribution is determined as a year-end value. The Normal Cost and Amortization Payments are determined at the valuation date and have a full year of interest applied to determine the end of year value. The Annual Required Contribution is compared to the plan contributions (with interest) made during the year to determine the increase in the Net OPEB Obligation. Since the University uses a pay-as-you-go funding policy, the benefit payments with interest should be used to determine contributions. To simplify the determination of year-end plan contributions, the benefit payments will be determined without interest. Instead, the interest on expected benefit payments will be used to offset the determination of the Annual Required Contribution.
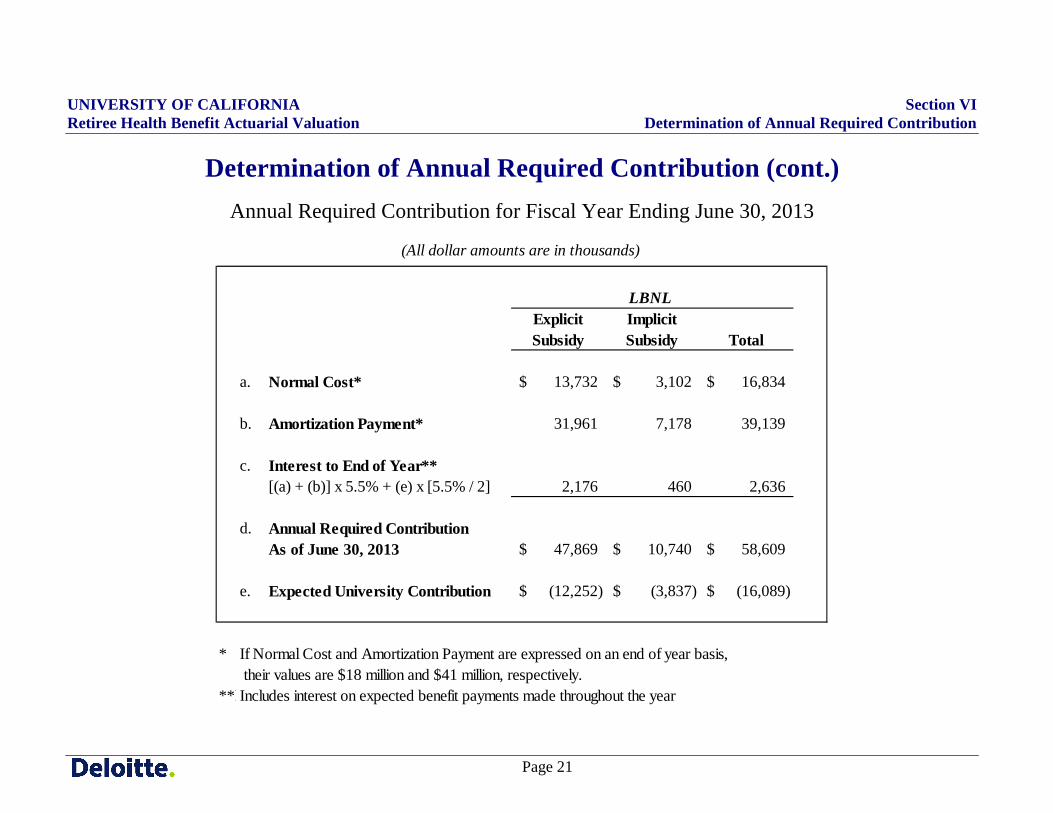
The next three pages present the Annual Required Contribution development for the fiscal year ending June 30, 2013. The development of amortization payments for each location follows the Annual Required Contribution development exhibits.
UNIVERSITY OF CALIFORNIA Section VI Retiree Health Benefit Actuarial Valuation Determination of Annual Required Contribution
Page 20
Determination of Annual Required Contribution (cont.) Annual Required Contribution for Fiscal Year Ending June 30, 2013
Explicit Subsidy
Implicit Subsidy Total
a. Normal Cost* 433,707$ 85,171$ 518,878$
b. Amortization Payment* 941,044 206,829 1,147,873
c. Interest to End of Year**[(a) + (b)] x 5.5% + (e) x [5.5% / 2] 68,441 13,689 82,130
d. Annual Required ContributionAs of June 30, 2013 1,443,192$ 305,689$ 1,748,881$
e. Expected University Contribution (260,755)$ (86,219)$ (346,974)$
* If Normal Cost and Amortization Payment are expressed on an end of year basis, their values are $547 million and $1,201 million, respectively.
** Includes interest on expected benefit payments made throughout the year
(All dollar amounts are in thousands)
CMCHO
UNIVERSITY OF CALIFORNIA Section VI Retiree Health Benefit Actuarial Valuation Determination of Annual Required Contribution
Page 21
Determination of Annual Required Contribution (cont.) Annual Required Contribution for Fiscal Year Ending June 30, 2013
Explicit Subsidy
Implicit Subsidy Total
a. Normal Cost* 13,732$ 3,102$ 16,834$
b. Amortization Payment* 31,961 7,178 39,139
c. Interest to End of Year**[(a) + (b)] x 5.5% + (e) x [5.5% / 2] 2,176 460 2,636
d. Annual Required ContributionAs of June 30, 2013 47,869$ 10,740$ 58,609$
e. Expected University Contribution (12,252)$ (3,837)$ (16,089)$
* If Normal Cost and Amortization Payment are expressed on an end of year basis, their values are $18 million and $41 million, respectively.
**Results shown are preliminary. Final results will be provided in October 2012.Includes interest on expected benefit payments made throughout the year
(All dollar amounts are in thousands)
LBNL
UNIVERSITY OF CALIFORNIA Section VI Retiree Health Benefit Actuarial Valuation Determination of Annual Required Contribution
Page 22
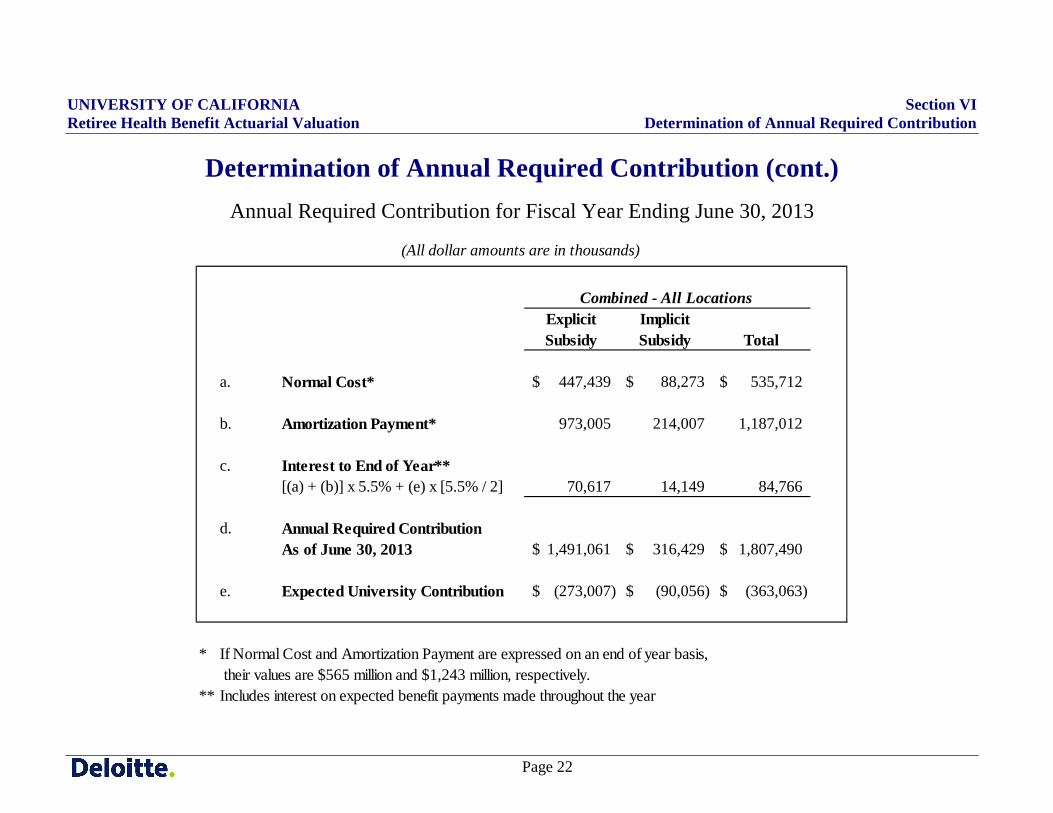
Determination of Annual Required Contribution (cont.) Annual Required Contribution for Fiscal Year Ending June 30, 2013
Explicit Subsidy
Implicit Subsidy Total
a. Normal Cost* 447,439$ 88,273$ 535,712$
b. Amortization Payment* 973,005 214,007 1,187,012
c. Interest to End of Year**[(a) + (b)] x 5.5% + (e) x [5.5% / 2] 70,617 14,149 84,766
d. Annual Required ContributionAs of June 30, 2013 1,491,061$ 316,429$ 1,807,490$
e. Expected University Contribution (273,007)$ (90,056)$ (363,063)$
* If Normal Cost and Amortization Payment are expressed on an end of year basis, their values are $565 million and $1,243 million, respectively.
** Includes interest on expected benefit payments made throughout the year
(All dollar amounts are in thousands)
Combined - All Locations
UNIVERSITY OF CALIFORNIA Section VI Retiree Health Benefit Actuarial Valuation Determination of Annual Required Contribution
Page 23
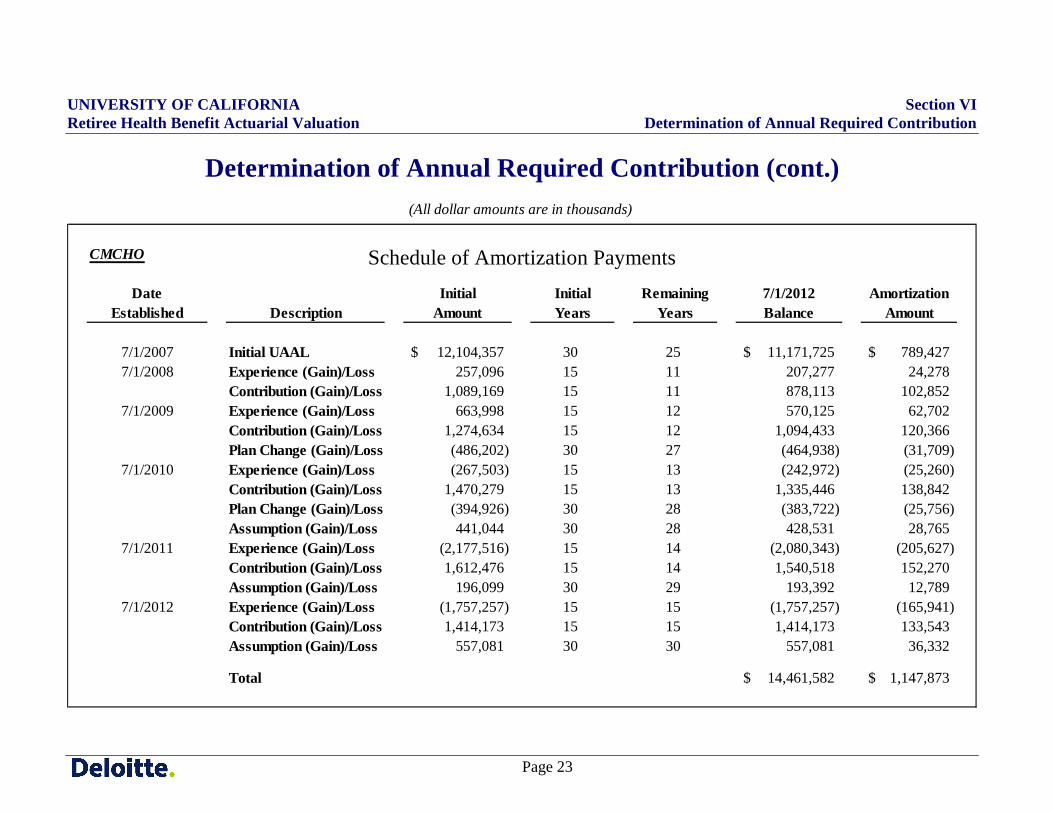
Determination of Annual Required Contribution (cont.)
Schedule of Amortization Payments
CMCHO
Date Initial Initial Remaining 7/1/2012 AmortizationEstablished Description Amount Years Years Balance Amount
7/1/2007 Initial UAAL 12,104,357$ 30 25 11,171,725$ 789,427$ 7/1/2008 Experience (Gain)/Loss 257,096 15 11 207,277 24,278
Contribution (Gain)/Loss 1,089,169 15 11 878,113 102,852 7/1/2009 Experience (Gain)/Loss 663,998 15 12 570,125 62,702
Contribution (Gain)/Loss 1,274,634 15 12 1,094,433 120,366 Plan Change (Gain)/Loss (486,202) 30 27 (464,938) (31,709)
7/1/2010 Experience (Gain)/Loss (267,503) 15 13 (242,972) (25,260) Contribution (Gain)/Loss 1,470,279 15 13 1,335,446 138,842 Plan Change (Gain)/Loss (394,926) 30 28 (383,722) (25,756) Assumption (Gain)/Loss 441,044 30 28 428,531 28,765
7/1/2011 Experience (Gain)/Loss (2,177,516) 15 14 (2,080,343) (205,627) Contribution (Gain)/Loss 1,612,476 15 14 1,540,518 152,270 Assumption (Gain)/Loss 196,099 30 29 193,392 12,789
7/1/2012 Experience (Gain)/Loss (1,757,257) 15 15 (1,757,257) (165,941) Contribution (Gain)/Loss 1,414,173 15 15 1,414,173 133,543 Assumption (Gain)/Loss 557,081 30 30 557,081 36,332
Total 14,461,582$ 1,147,873$
(All dollar amounts are in thousands)
UNIVERSITY OF CALIFORNIA Section VI Retiree Health Benefit Actuarial Valuation Determination of Annual Required Contribution
Page 24
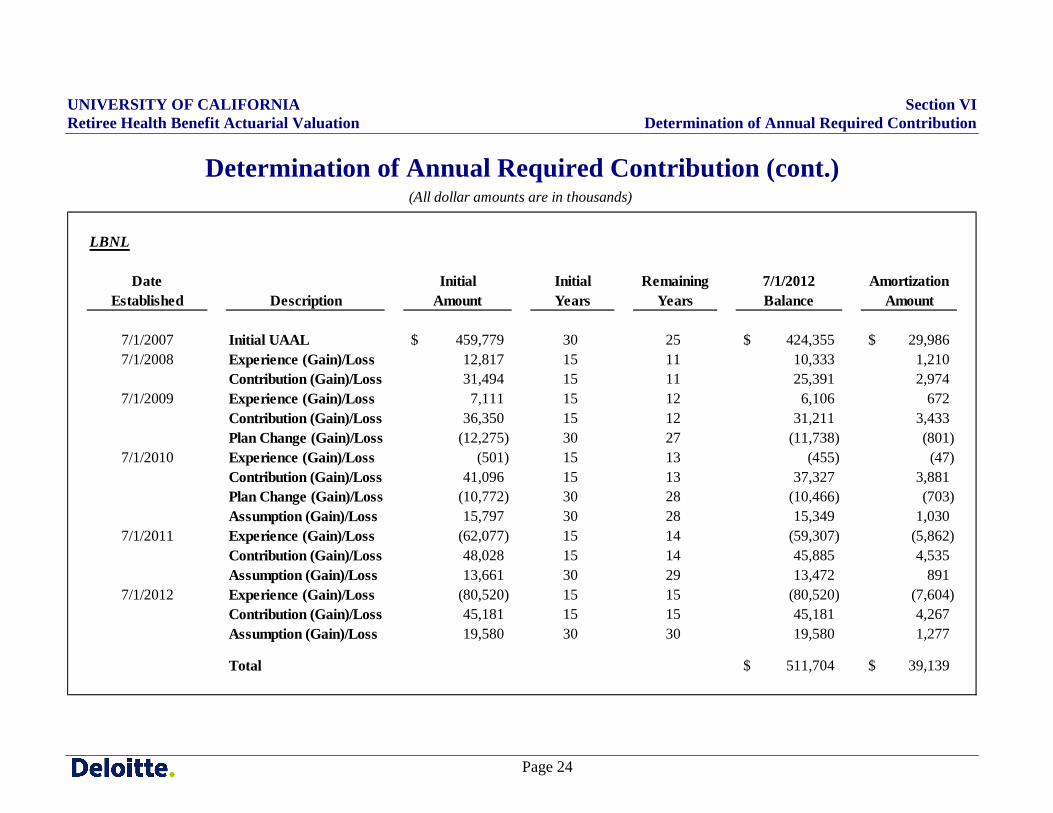
Determination of Annual Required Contribution (cont.)
Schedule of Amortization Payments
LBNL
Date Initial Initial Remaining 7/1/2012 AmortizationEstablished Description Amount Years Years Balance Amount
7/1/2007 Initial UAAL 459,779$ 30 25 424,355$ 29,986$ 7/1/2008 Experience (Gain)/Loss 12,817 15 11 10,333 1,210
Contribution (Gain)/Loss 31,494 15 11 25,391 2,974 7/1/2009 Experience (Gain)/Loss 7,111 15 12 6,106 672
Contribution (Gain)/Loss 36,350 15 12 31,211 3,433 Plan Change (Gain)/Loss (12,275) 30 27 (11,738) (801)
7/1/2010 Experience (Gain)/Loss (501) 15 13 (455) (47) Contribution (Gain)/Loss 41,096 15 13 37,327 3,881 Plan Change (Gain)/Loss (10,772) 30 28 (10,466) (703) Assumption (Gain)/Loss 15,797 30 28 15,349 1,030
7/1/2011 Experience (Gain)/Loss (62,077) 15 14 (59,307) (5,862) Contribution (Gain)/Loss 48,028 15 14 45,885 4,535 Assumption (Gain)/Loss 13,661 30 29 13,472 891
7/1/2012 Experience (Gain)/Loss (80,520) 15 15 (80,520) (7,604) Contribution (Gain)/Loss 45,181 15 15 45,181 4,267 Assumption (Gain)/Loss 19,580 30 30 19,580 1,277
Total 511,704$ 39,139$
(All dollar amounts are in thousands)
UNIVERSITY OF CALIFORNIA Section VI Retiree Health Benefit Actuarial Valuation Determination of Annual Required Contribution
Page 25
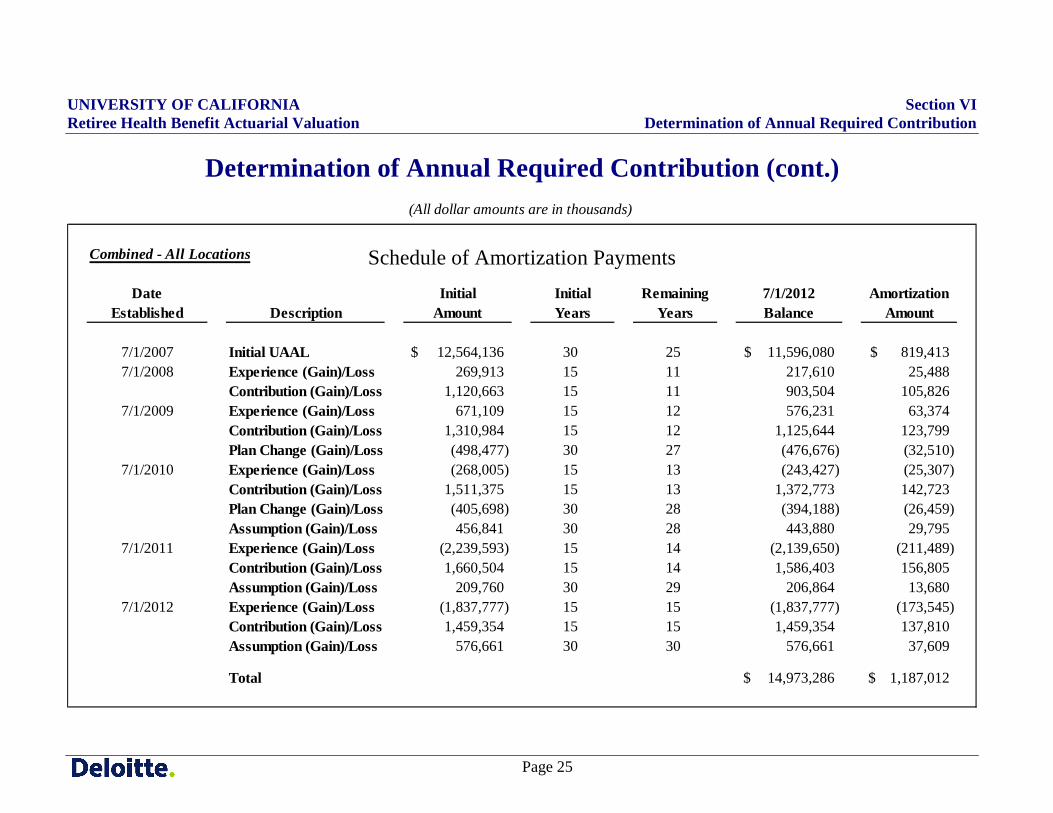
Determination of Annual Required Contribution (cont.)
Schedule of Amortization Payments
Combined - All Locations
Date Initial Initial Remaining 7/1/2012 AmortizationEstablished Description Amount Years Years Balance Amount
7/1/2007 Initial UAAL 12,564,136$ 30 25 11,596,080$ 819,413$ 7/1/2008 Experience (Gain)/Loss 269,913 15 11 217,610 25,488
Contribution (Gain)/Loss 1,120,663 15 11 903,504 105,826 7/1/2009 Experience (Gain)/Loss 671,109 15 12 576,231 63,374
Contribution (Gain)/Loss 1,310,984 15 12 1,125,644 123,799 Plan Change (Gain)/Loss (498,477) 30 27 (476,676) (32,510)
7/1/2010 Experience (Gain)/Loss (268,005) 15 13 (243,427) (25,307) Contribution (Gain)/Loss 1,511,375 15 13 1,372,773 142,723 Plan Change (Gain)/Loss (405,698) 30 28 (394,188) (26,459) Assumption (Gain)/Loss 456,841 30 28 443,880 29,795
7/1/2011 Experience (Gain)/Loss (2,239,593) 15 14 (2,139,650) (211,489) Contribution (Gain)/Loss 1,660,504 15 14 1,586,403 156,805 Assumption (Gain)/Loss 209,760 30 29 206,864 13,680
7/1/2012 Experience (Gain)/Loss (1,837,777) 15 15 (1,837,777) (173,545) Contribution (Gain)/Loss 1,459,354 15 15 1,459,354 137,810 Assumption (Gain)/Loss 576,661 30 30 576,661 37,609
Total 14,973,286$ 1,187,012$
(All dollar amounts are in thousands)
UNIVERSITY OF CALIFORNIA Section VII Retiree Health Benefit Actuarial Valuation Actuarial Experience
Page 26
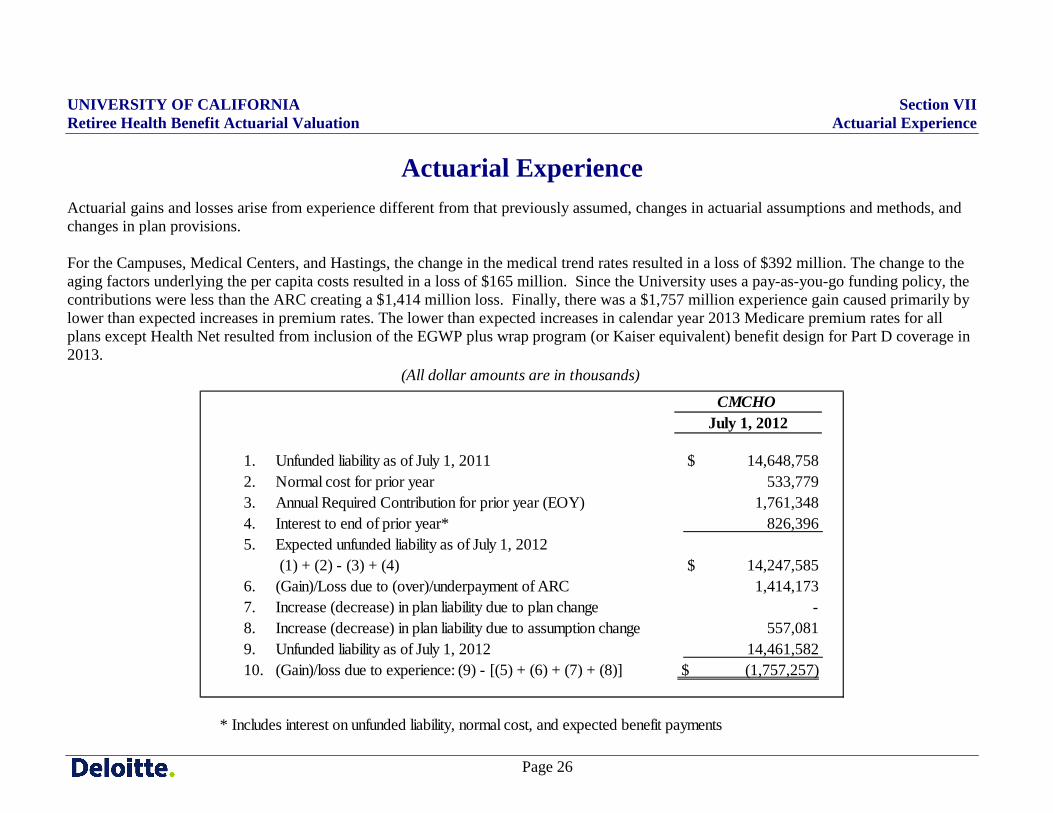
Actuarial Experience Actuarial gains and losses arise from experience different from that previously assumed, changes in actuarial assumptions and methods, and changes in plan provisions. For the Campuses, Medical Centers, and Hastings, the change in the medical trend rates resulted in a loss of $392 million. The change to the aging factors underlying the per capita costs resulted in a loss of $165 million. Since the University uses a pay-as-you-go funding policy, the contributions were less than the ARC creating a $1,414 million loss. Finally, there was a $1,757 million experience gain caused primarily by lower than expected increases in premium rates. The lower than expected increases in calendar year 2013 Medicare premium rates for all plans except Health Net resulted from inclusion of the EGWP plus wrap program (or Kaiser equivalent) benefit design for Part D coverage in 2013.
CMCHOJuly 1, 2012
1. Unfunded liability as of July 1, 2011 $ 14,648,758 2. Normal cost for prior year 533,779 3. Annual Required Contribution for prior year (EOY) 1,761,348 4. Interest to end of prior year* 826,396 5. Expected unfunded liability as of July 1, 2012
(1) + (2) - (3) + (4) $ 14,247,585 6. (Gain)/Loss due to (over)/underpayment of ARC 1,414,173 7. Increase (decrease) in plan liability due to plan change - 8. Increase (decrease) in plan liability due to assumption change 557,081 9. Unfunded liability as of July 1, 2012 14,461,582 10. (Gain)/loss due to experience: (9) - [(5) + (6) + (7) + (8)] $ (1,757,257)
* Includes interest on unfunded liability, normal cost, and expected benefit payments
(All dollar amounts are in thousands)
UNIVERSITY OF CALIFORNIA Section VII Retiree Health Benefit Actuarial Valuation Actuarial Experience
Page 27
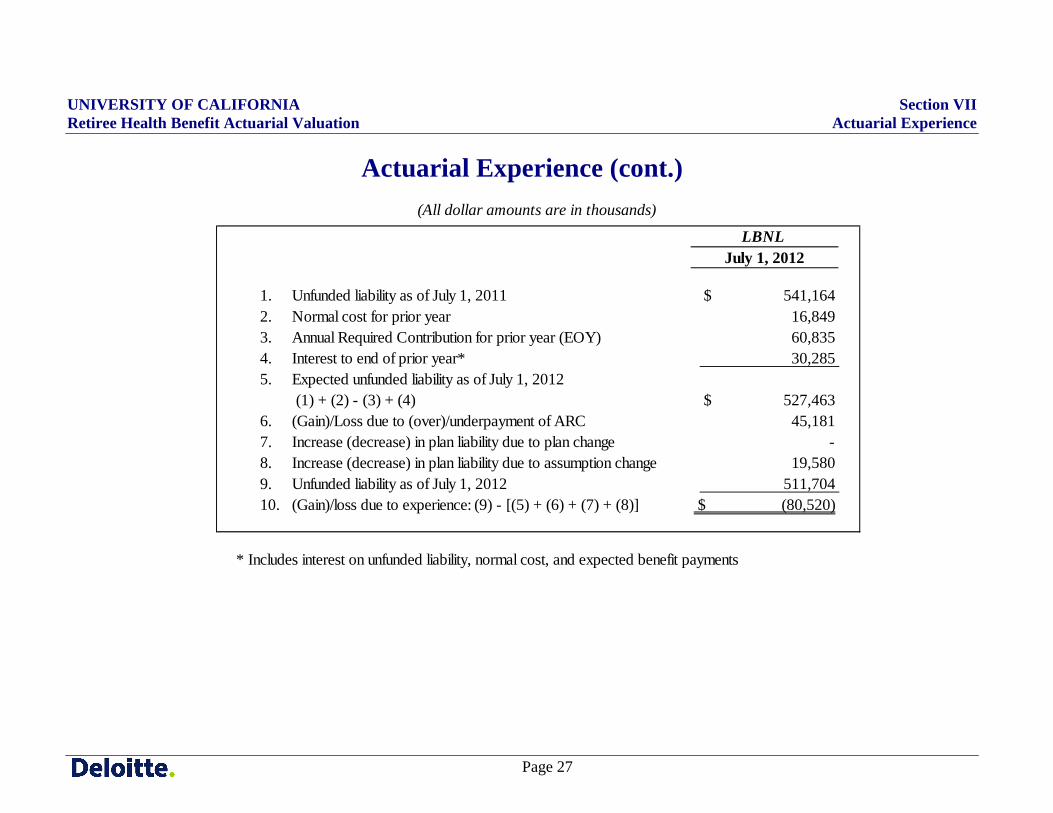
Actuarial Experience (cont.)
LBNLJuly 1, 2012
1. Unfunded liability as of July 1, 2011 $ 541,164 2. Normal cost for prior year 16,849 3. Annual Required Contribution for prior year (EOY) 60,835 4. Interest to end of prior year* 30,285 5. Expected unfunded liability as of July 1, 2012
(1) + (2) - (3) + (4) $ 527,463 6. (Gain)/Loss due to (over)/underpayment of ARC 45,181 7. Increase (decrease) in plan liability due to plan change - 8. Increase (decrease) in plan liability due to assumption change 19,580 9. Unfunded liability as of July 1, 2012 511,704 10. (Gain)/loss due to experience: (9) - [(5) + (6) + (7) + (8)] $ (80,520)
* Includes interest on unfunded liability, normal cost, and expected benefit payments
(All dollar amounts are in thousands)
UNIVERSITY OF CALIFORNIA Section VII Retiree Health Benefit Actuarial Valuation Actuarial Experience
Page 28
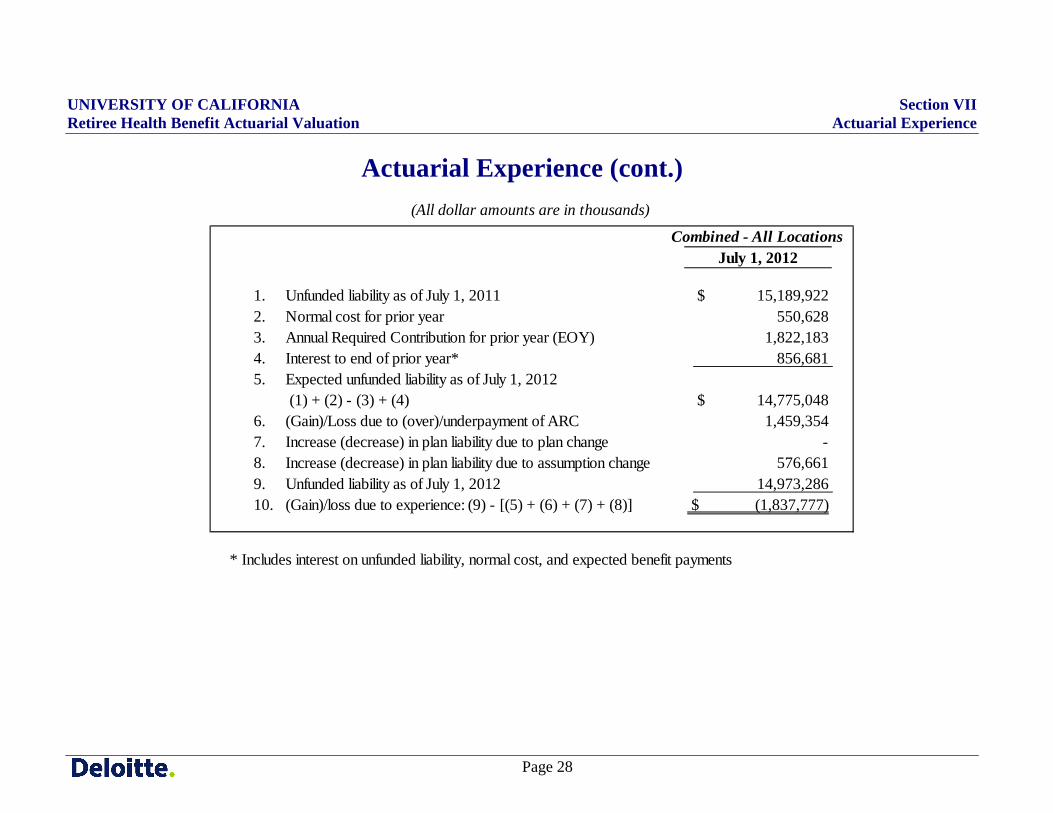
Actuarial Experience (cont.)
Combined - All LocationsJuly 1, 2012
1. Unfunded liability as of July 1, 2011 $ 15,189,922 2. Normal cost for prior year 550,628 3. Annual Required Contribution for prior year (EOY) 1,822,183 4. Interest to end of prior year* 856,681 5. Expected unfunded liability as of July 1, 2012
(1) + (2) - (3) + (4) $ 14,775,048 6. (Gain)/Loss due to (over)/underpayment of ARC 1,459,354 7. Increase (decrease) in plan liability due to plan change - 8. Increase (decrease) in plan liability due to assumption change 576,661 9. Unfunded liability as of July 1, 2012 14,973,286 10. (Gain)/loss due to experience: (9) - [(5) + (6) + (7) + (8)] $ (1,837,777)
* Includes interest on unfunded liability, normal cost, and expected benefit payments
(All dollar amounts are in thousands)
UNIVERSITY OF CALIFORNIA Section VIII Retiree Health Benefit Actuarial Valuation GASB Statement No. 45 Notes to the Financial Statements and RSI
Page 29
GASB Statement No. 45 Notes to the Financial Statements and Required Supplementary Information (RSI)
GASB Statement No. 45 requires disclosure of notes to the financial statements and required supplementary information that includes information shown in three schedules: the Schedule of Funding Progress (Table A), the Schedule of Employer Contributions (Table B), and the Development of Net OPEB Obligation (NOO) and Annual OPEB Cost (Table C).
The values shown in Table A are the final amounts for disclosure. Selected values in Tables B and C related to the University’s contribution (specifically, the employer cash benefit costs) are estimated and will change in the financial disclosures to reflect actual University cash costs.
UNIVERSITY OF CALIFORNIA Section VIII Retiree Health Benefit Actuarial Valuation GASB Statement No. 45 Notes to the Financial Statements and RSI
Page 30
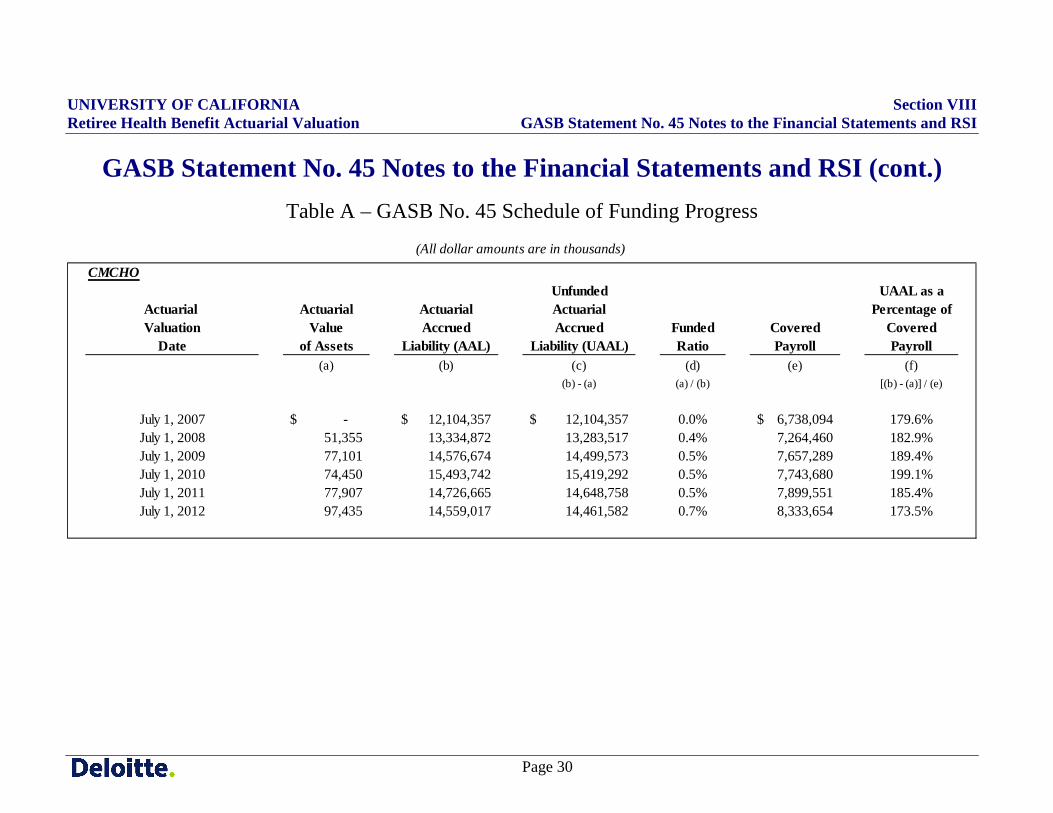
GASB Statement No. 45 Notes to the Financial Statements and RSI (cont.) Table A – GASB No. 45 Schedule of Funding Progress
CMCHOUnfunded UAAL as a
Actuarial Actuarial Actuarial Actuarial Percentage ofValuation Value Accrued Accrued Funded Covered Covered
Date of Assets Liability (AAL) Liability (UAAL) Ratio Payroll Payroll(a) (b) (c) (d) (e) (f)
(b) - (a) (a) / (b) [(b) - (a)] / (e)
July 1, 2007 -$ 12,104,357$ 12,104,357$ 0.0% 6,738,094$ 179.6%July 1, 2008 51,355 13,334,872 13,283,517 0.4% 7,264,460 182.9%July 1, 2009 77,101 14,576,674 14,499,573 0.5% 7,657,289 189.4%July 1, 2010 74,450 15,493,742 15,419,292 0.5% 7,743,680 199.1%July 1, 2011 77,907 14,726,665 14,648,758 0.5% 7,899,551 185.4%July 1, 2012 97,435 14,559,017 14,461,582 0.7% 8,333,654 173.5%
(All dollar amounts are in thousands)
UNIVERSITY OF CALIFORNIA Section VIII Retiree Health Benefit Actuarial Valuation GASB Statement No. 45 Notes to the Financial Statements and RSI
Page 31
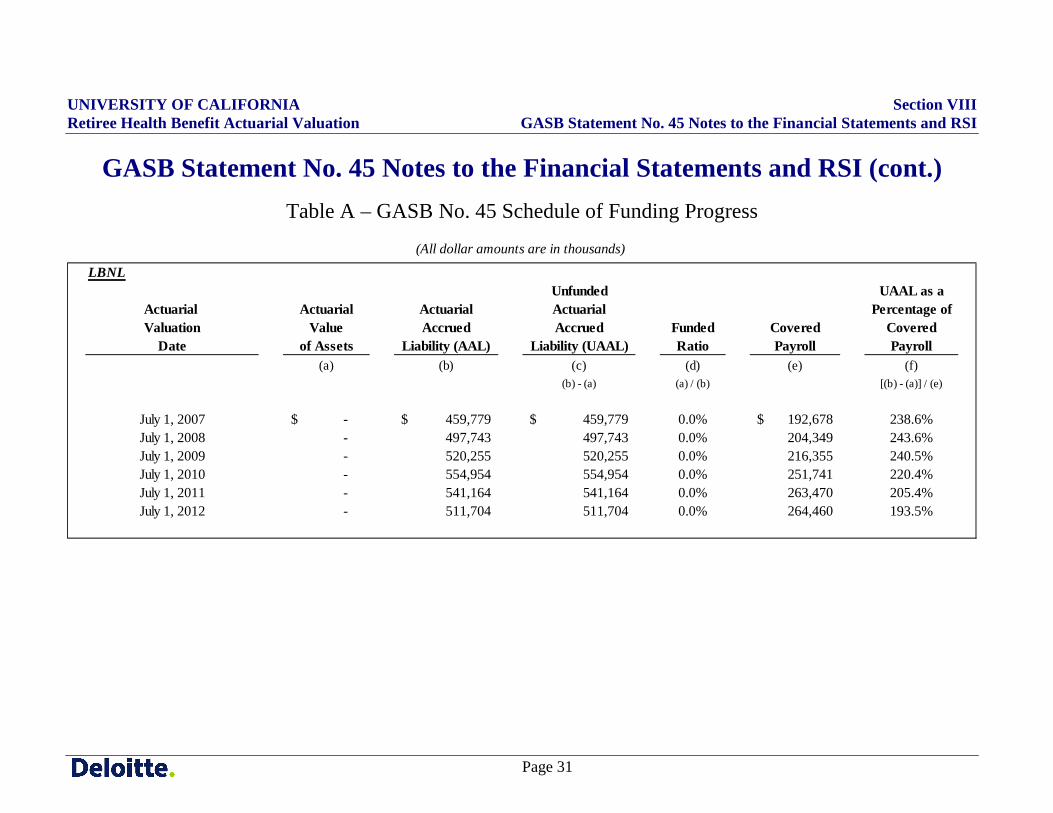
GASB Statement No. 45 Notes to the Financial Statements and RSI (cont.) Table A – GASB No. 45 Schedule of Funding Progress
LBNLUnfunded UAAL as a
Actuarial Actuarial Actuarial Actuarial Percentage ofValuation Value Accrued Accrued Funded Covered Covered
Date of Assets Liability (AAL) Liability (UAAL) Ratio Payroll Payroll(a) (b) (c) (d) (e) (f)
(b) - (a) (a) / (b) [(b) - (a)] / (e)
July 1, 2007 -$ 459,779$ 459,779$ 0.0% 192,678$ 238.6%July 1, 2008 - 497,743 497,743 0.0% 204,349 243.6%July 1, 2009 - 520,255 520,255 0.0% 216,355 240.5%July 1, 2010 - 554,954 554,954 0.0% 251,741 220.4%July 1, 2011 - 541,164 541,164 0.0% 263,470 205.4%July 1, 2012 - 511,704 511,704 0.0% 264,460 193.5%
(All dollar amounts are in thousands)
UNIVERSITY OF CALIFORNIA Section VIII Retiree Health Benefit Actuarial Valuation GASB Statement No. 45 Notes to the Financial Statements and RSI
Page 32
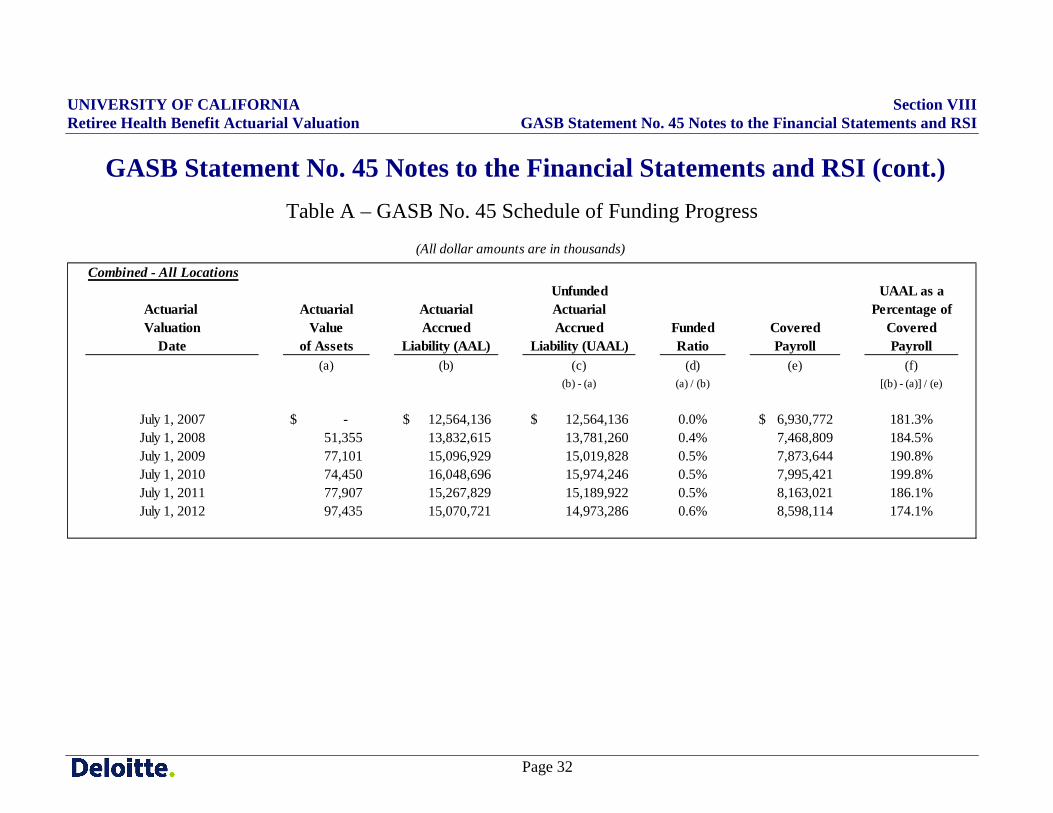
GASB Statement No. 45 Notes to the Financial Statements and RSI (cont.) Table A – GASB No. 45 Schedule of Funding Progress
Combined - All LocationsUnfunded UAAL as a
Actuarial Actuarial Actuarial Actuarial Percentage ofValuation Value Accrued Accrued Funded Covered Covered
Date of Assets Liability (AAL) Liability (UAAL) Ratio Payroll Payroll(a) (b) (c) (d) (e) (f)
(b) - (a) (a) / (b) [(b) - (a)] / (e)
July 1, 2007 -$ 12,564,136$ 12,564,136$ 0.0% 6,930,772$ 181.3%July 1, 2008 51,355 13,832,615 13,781,260 0.4% 7,468,809 184.5%July 1, 2009 77,101 15,096,929 15,019,828 0.5% 7,873,644 190.8%July 1, 2010 74,450 16,048,696 15,974,246 0.5% 7,995,421 199.8%July 1, 2011 77,907 15,267,829 15,189,922 0.5% 8,163,021 186.1%July 1, 2012 97,435 15,070,721 14,973,286 0.6% 8,598,114 174.1%
(All dollar amounts are in thousands)
UNIVERSITY OF CALIFORNIA Section VIII Retiree Health Benefit Actuarial Valuation GASB Statement No. 45 Notes to the Financial Statements and RSI
Page 33
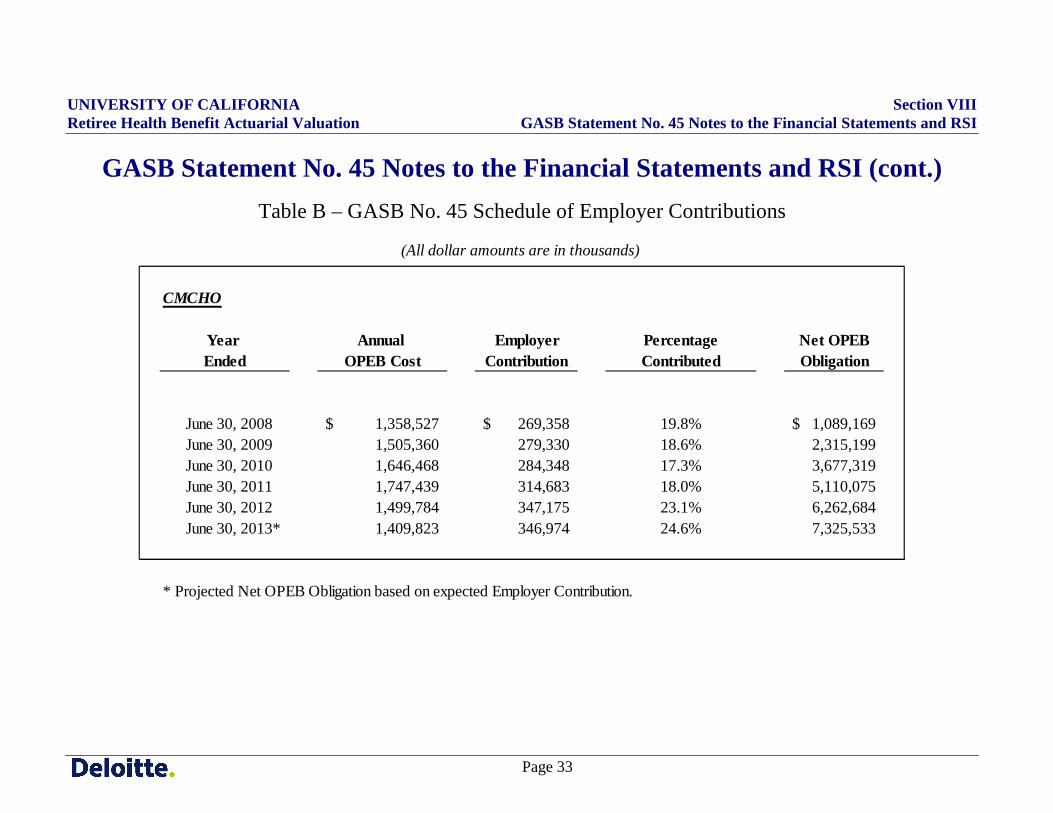
GASB Statement No. 45 Notes to the Financial Statements and RSI (cont.) Table B – GASB No. 45 Schedule of Employer Contributions
CMCHO
Year Annual Employer Percentage Net OPEBEnded OPEB Cost Contribution Contributed Obligation
June 30, 2008 1,358,527$ 269,358$ 19.8% 1,089,169$ June 30, 2009 1,505,360 279,330 18.6% 2,315,199 June 30, 2010 1,646,468 284,348 17.3% 3,677,319 June 30, 2011 1,747,439 314,683 18.0% 5,110,075 June 30, 2012 1,499,784 347,175 23.1% 6,262,684
June 30, 2013* 1,409,823 346,974 24.6% 7,325,533
* Projected Net OPEB Obligation based on expected Employer Contribution.
(All dollar amounts are in thousands)
UNIVERSITY OF CALIFORNIA Section VIII Retiree Health Benefit Actuarial Valuation GASB Statement No. 45 Notes to the Financial Statements and RSI
Page 34
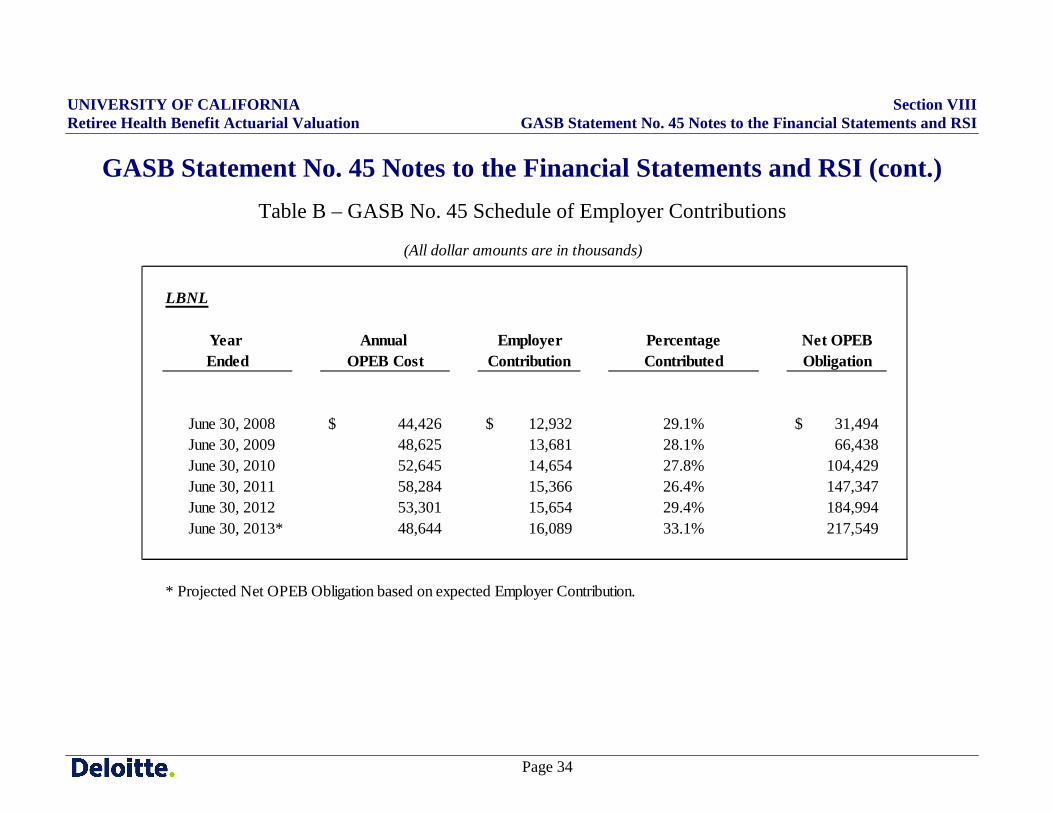
GASB Statement No. 45 Notes to the Financial Statements and RSI (cont.) Table B – GASB No. 45 Schedule of Employer Contributions
LBNL
Year Annual Employer Percentage Net OPEBEnded OPEB Cost Contribution Contributed Obligation
June 30, 2008 44,426$ 12,932$ 29.1% 31,494$ June 30, 2009 48,625 13,681 28.1% 66,438 June 30, 2010 52,645 14,654 27.8% 104,429 June 30, 2011 58,284 15,366 26.4% 147,347 June 30, 2012 53,301 15,654 29.4% 184,994
June 30, 2013* 48,644 16,089 33.1% 217,549
* Projected Net OPEB Obligation based on expected Employer Contribution.
(All dollar amounts are in thousands)
UNIVERSITY OF CALIFORNIA Section VIII Retiree Health Benefit Actuarial Valuation GASB Statement No. 45 Notes to the Financial Statements and RSI
Page 35
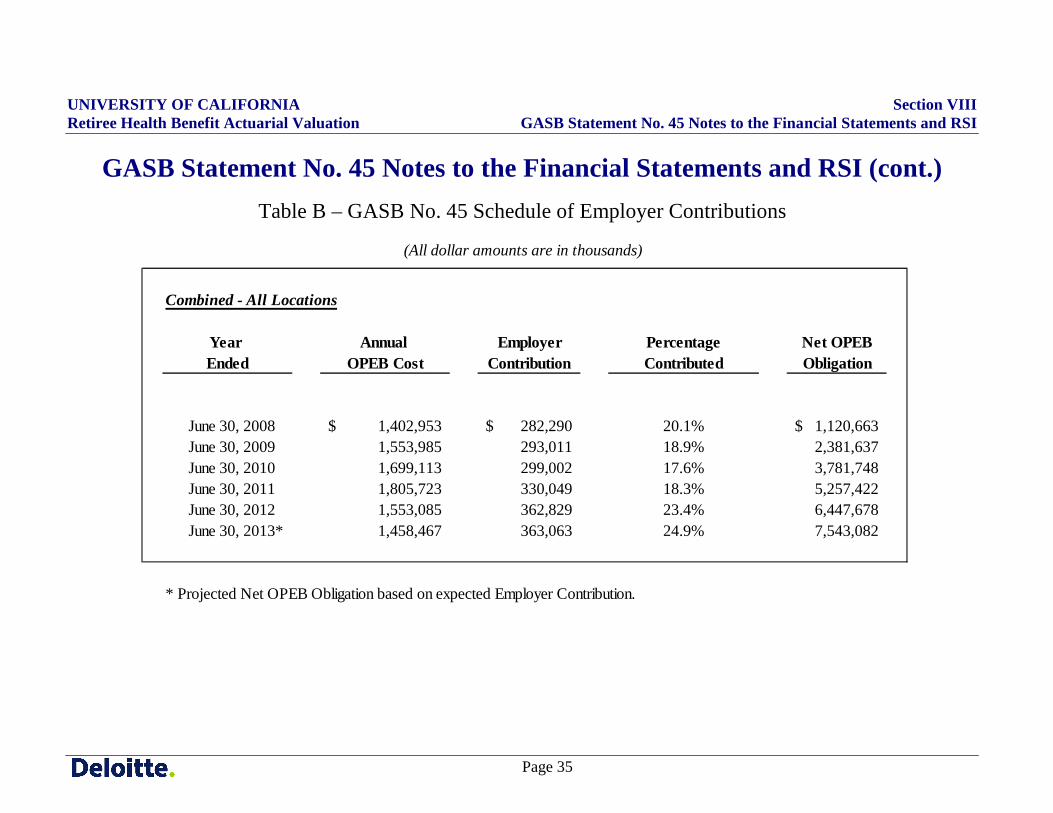
GASB Statement No. 45 Notes to the Financial Statements and RSI (cont.) Table B – GASB No. 45 Schedule of Employer Contributions
Combined - All Locations
Year Annual Employer Percentage Net OPEBEnded OPEB Cost Contribution Contributed Obligation
June 30, 2008 1,402,953$ 282,290$ 20.1% 1,120,663$ June 30, 2009 1,553,985 293,011 18.9% 2,381,637 June 30, 2010 1,699,113 299,002 17.6% 3,781,748 June 30, 2011 1,805,723 330,049 18.3% 5,257,422 June 30, 2012 1,553,085 362,829 23.4% 6,447,678
June 30, 2013* 1,458,467 363,063 24.9% 7,543,082
* Projected Net OPEB Obligation based on expected Employer Contribution.
(All dollar amounts are in thousands)
UNIVERSITY OF CALIFORNIA Section VIII Retiree Health Benefit Actuarial Valuation GASB Statement No. 45 Notes to the Financial Statements and RSI
Page 36
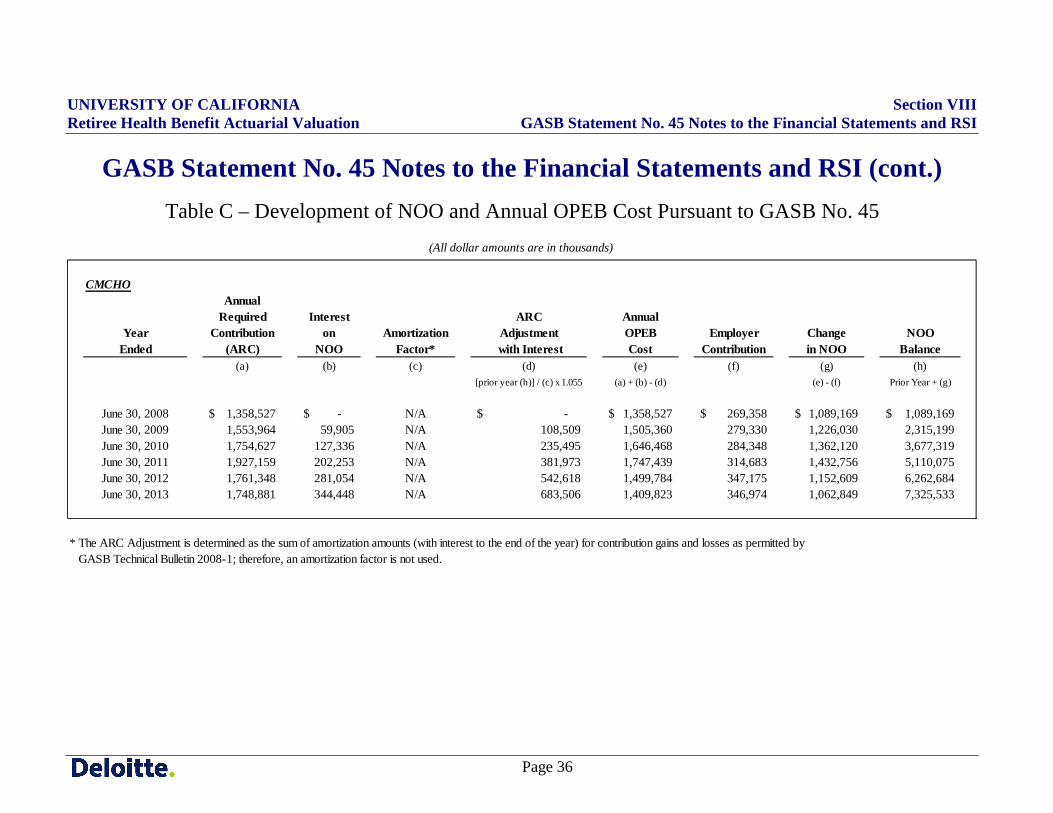
GASB Statement No. 45 Notes to the Financial Statements and RSI (cont.) Table C – Development of NOO and Annual OPEB Cost Pursuant to GASB No. 45
CMCHOAnnual
Required Interest ARC AnnualYear Contribution on Amortization Adjustment OPEB Employer Change NOO
Ended (ARC) NOO Factor* with Interest Cost Contribution in NOO Balance(a) (b) (c) (d) (e) (f) (g) (h)
[prior year (h)] / (c) x 1.055 (a) + (b) - (d) (e) - (f) Prior Year + (g)
June 30, 2008 1,358,527$ -$ N/A -$ 1,358,527$ 269,358$ 1,089,169$ 1,089,169$ June 30, 2009 1,553,964 59,905 N/A 108,509 1,505,360 279,330 1,226,030 2,315,199 June 30, 2010 1,754,627 127,336 N/A 235,495 1,646,468 284,348 1,362,120 3,677,319 June 30, 2011 1,927,159 202,253 N/A 381,973 1,747,439 314,683 1,432,756 5,110,075 June 30, 2012 1,761,348 281,054 N/A 542,618 1,499,784 347,175 1,152,609 6,262,684 June 30, 2013 1,748,881 344,448 N/A 683,506 1,409,823 346,974 1,062,849 7,325,533
* The ARC Adjustment is determined as the sum of amortization amounts (with interest to the end of the year) for contribution gains and losses as permitted by GASB Technical Bulletin 2008-1; therefore, an amortization factor is not used.
(All dollar amounts are in thousands)
UNIVERSITY OF CALIFORNIA Section VIII Retiree Health Benefit Actuarial Valuation GASB Statement No. 45 Notes to the Financial Statements and RSI
Page 37
GASB Statement No. 45 Notes to the Financial Statements and RSI (cont.)
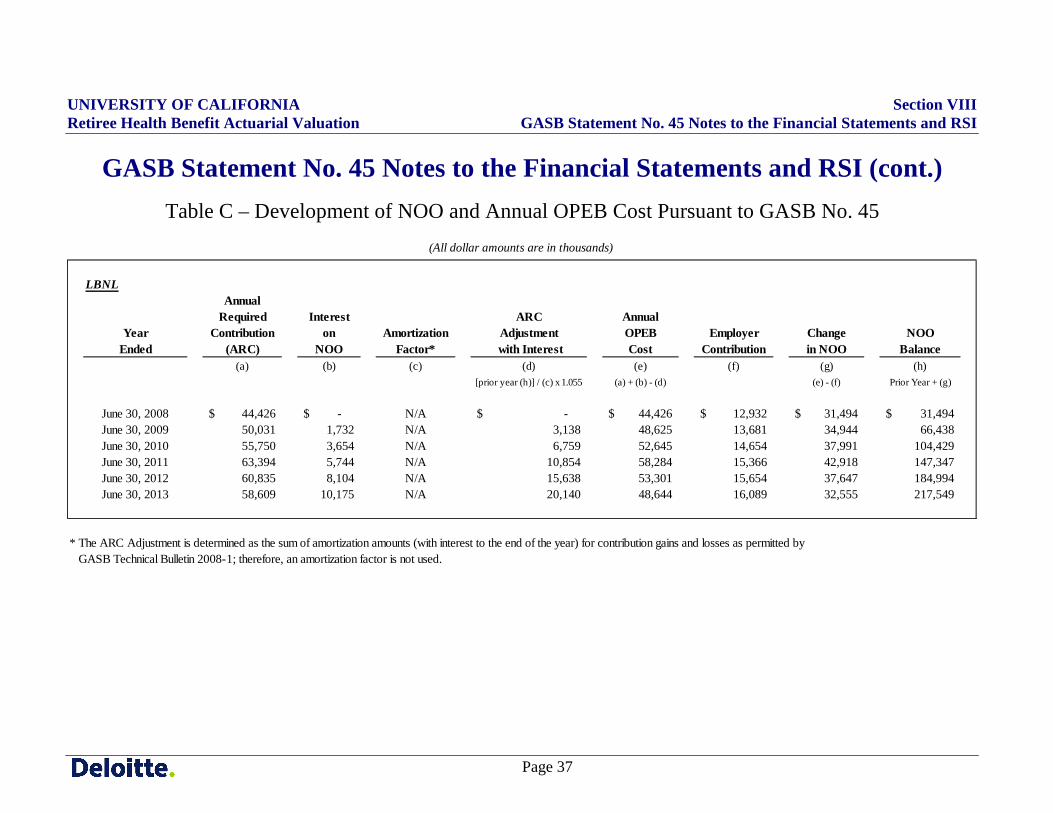
Table C – Development of NOO and Annual OPEB Cost Pursuant to GASB No. 45
LBNLAnnual
Required Interest ARC AnnualYear Contribution on Amortization Adjustment OPEB Employer Change NOO
Ended (ARC) NOO Factor* with Interest Cost Contribution in NOO Balance(a) (b) (c) (d) (e) (f) (g) (h)
[prior year (h)] / (c) x 1.055 (a) + (b) - (d) (e) - (f) Prior Year + (g)
June 30, 2008 44,426$ -$ N/A -$ 44,426$ 12,932$ 31,494$ 31,494$ June 30, 2009 50,031 1,732 N/A 3,138 48,625 13,681 34,944 66,438 June 30, 2010 55,750 3,654 N/A 6,759 52,645 14,654 37,991 104,429 June 30, 2011 63,394 5,744 N/A 10,854 58,284 15,366 42,918 147,347 June 30, 2012 60,835 8,104 N/A 15,638 53,301 15,654 37,647 184,994 June 30, 2013 58,609 10,175 N/A 20,140 48,644 16,089 32,555 217,549
* The ARC Adjustment is determined as the sum of amortization amounts (with interest to the end of the year) for contribution gains and losses as permitted by GASB Technical Bulletin 2008-1; therefore, an amortization factor is not used.
(All dollar amounts are in thousands)
UNIVERSITY OF CALIFORNIA Section VIII Retiree Health Benefit Actuarial Valuation GASB Statement No. 45 Notes to the Financial Statements and RSI
Page 38
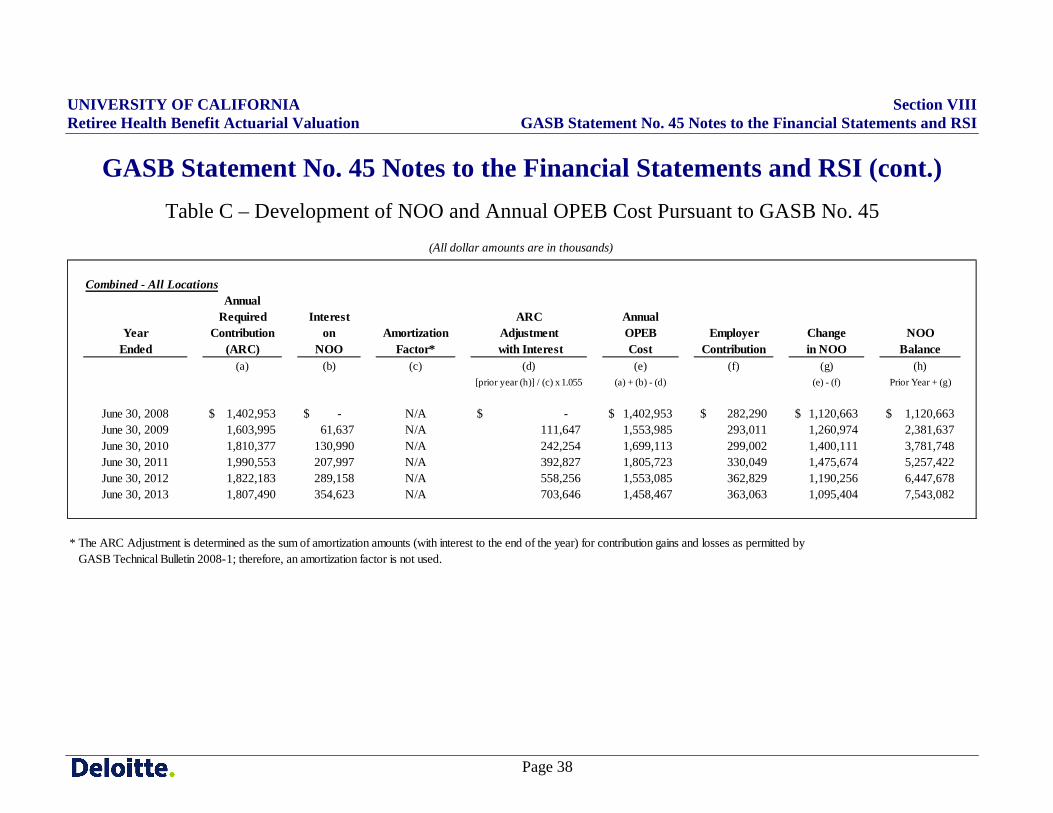
GASB Statement No. 45 Notes to the Financial Statements and RSI (cont.) Table C – Development of NOO and Annual OPEB Cost Pursuant to GASB No. 45
Combined - All LocationsAnnual
Required Interest ARC AnnualYear Contribution on Amortization Adjustment OPEB Employer Change NOO
Ended (ARC) NOO Factor* with Interest Cost Contribution in NOO Balance(a) (b) (c) (d) (e) (f) (g) (h)
[prior year (h)] / (c) x 1.055 (a) + (b) - (d) (e) - (f) Prior Year + (g)
June 30, 2008 1,402,953$ -$ N/A -$ 1,402,953$ 282,290$ 1,120,663$ 1,120,663$ June 30, 2009 1,603,995 61,637 N/A 111,647 1,553,985 293,011 1,260,974 2,381,637 June 30, 2010 1,810,377 130,990 N/A 242,254 1,699,113 299,002 1,400,111 3,781,748 June 30, 2011 1,990,553 207,997 N/A 392,827 1,805,723 330,049 1,475,674 5,257,422 June 30, 2012 1,822,183 289,158 N/A 558,256 1,553,085 362,829 1,190,256 6,447,678 June 30, 2013 1,807,490 354,623 N/A 703,646 1,458,467 363,063 1,095,404 7,543,082
* The ARC Adjustment is determined as the sum of amortization amounts (with interest to the end of the year) for contribution gains and losses as permitted by GASB Technical Bulletin 2008-1; therefore, an amortization factor is not used.
(All dollar amounts are in thousands)
UNIVERSITY OF CALIFORNIA Section IX Retiree Health Benefit Actuarial Valuation 10-Year Projection of Employer Benefit Payments
Page 39
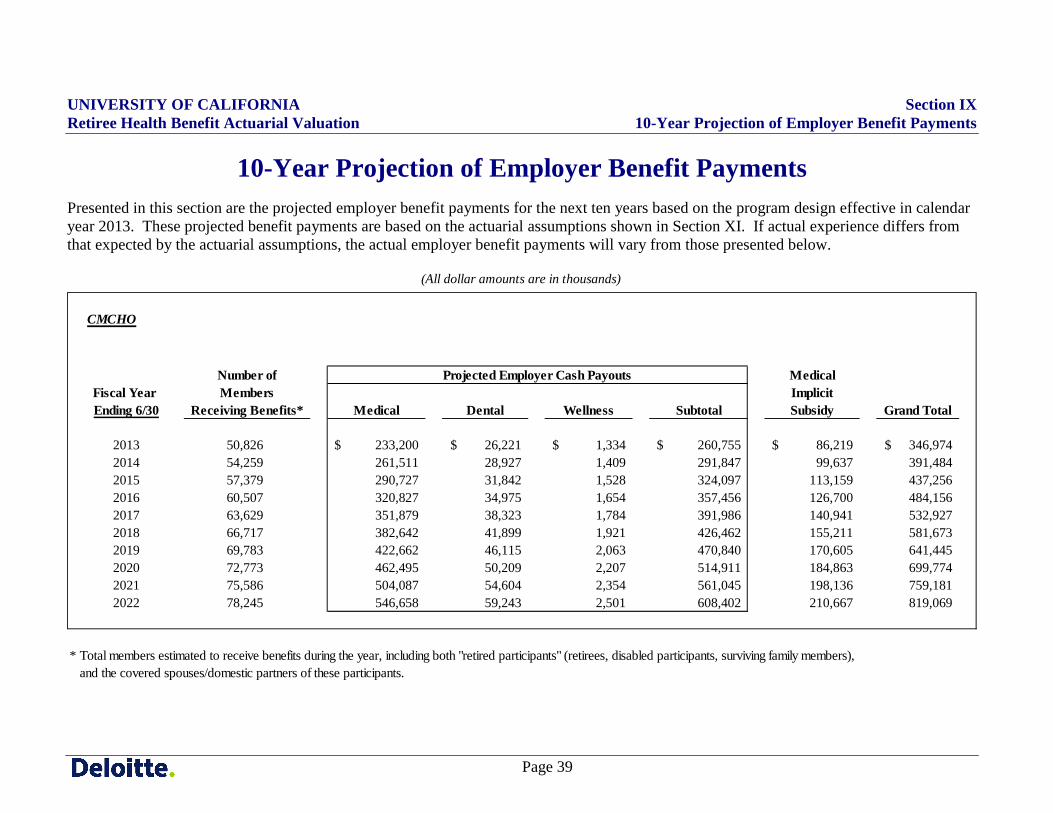
10-Year Projection of Employer Benefit Payments Presented in this section are the projected employer benefit payments for the next ten years based on the program design effective in calendar year 2013. These projected benefit payments are based on the actuarial assumptions shown in Section XI. If actual experience differs from that expected by the actuarial assumptions, the actual employer benefit payments will vary from those presented below.
CMCHO
Number of MedicalFiscal Year Members ImplicitEnding 6/30 Receiving Benefits* Medical Dental Wellness Subtotal Subsidy Grand Total
2013 50,826 233,200$ 26,221$ 1,334$ 260,755$ 86,219$ 346,974$ 2014 54,259 261,511 28,927 1,409 291,847 99,637 391,4842015 57,379 290,727 31,842 1,528 324,097 113,159 437,2562016 60,507 320,827 34,975 1,654 357,456 126,700 484,1562017 63,629 351,879 38,323 1,784 391,986 140,941 532,9272018 66,717 382,642 41,899 1,921 426,462 155,211 581,6732019 69,783 422,662 46,115 2,063 470,840 170,605 641,4452020 72,773 462,495 50,209 2,207 514,911 184,863 699,7742021 75,586 504,087 54,604 2,354 561,045 198,136 759,1812022 78,245 546,658 59,243 2,501 608,402 210,667 819,069
* Total members estimated to receive benefits during the year, including both "retired participants" (retirees, disabled participants, surviving family members), and the covered spouses/domestic partners of these participants.
(All dollar amounts are in thousands)
Projected Employer Cash Payouts
UNIVERSITY OF CALIFORNIA Section IX Retiree Health Benefit Actuarial Valuation 10-Year Projection of Employer Benefit Payments
Page 40
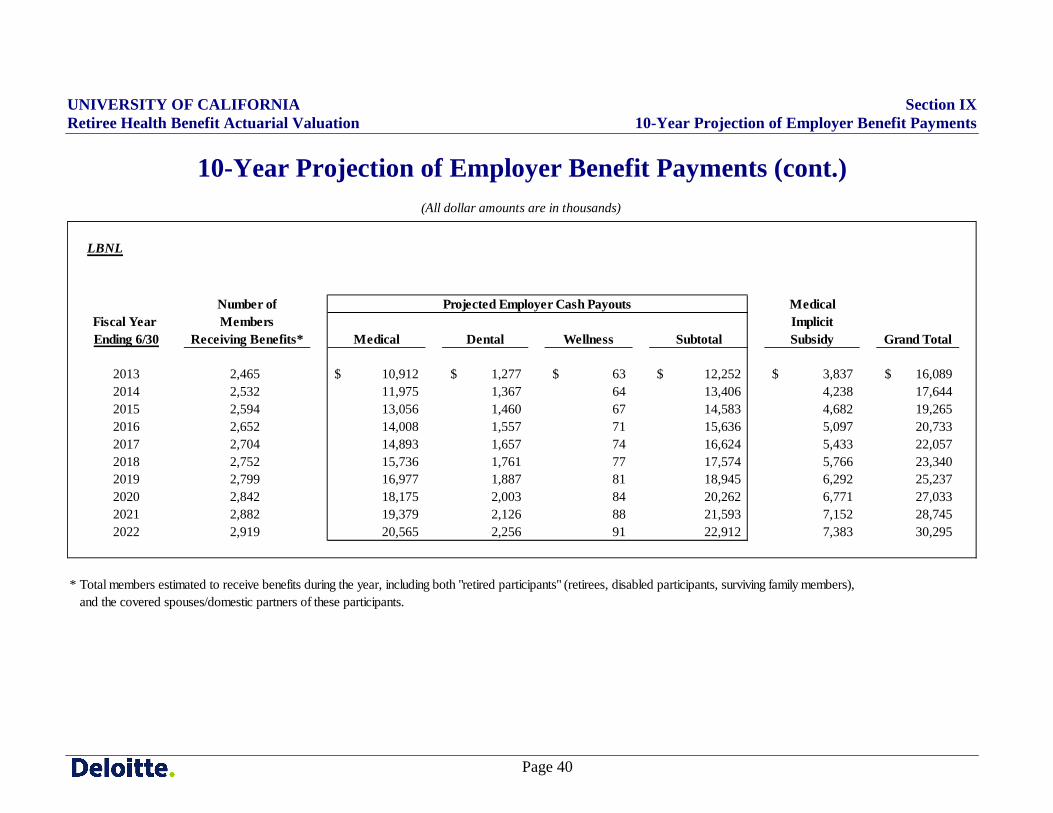
10-Year Projection of Employer Benefit Payments (cont.)
LBNL
Number of MedicalFiscal Year Members ImplicitEnding 6/30 Receiving Benefits* Medical Dental Wellness Subtotal Subsidy Grand Total
2013 2,465 10,912$ 1,277$ 63$ 12,252$ 3,837$ 16,089$ 2014 2,532 11,975 1,367 64 13,406 4,238 17,6442015 2,594 13,056 1,460 67 14,583 4,682 19,2652016 2,652 14,008 1,557 71 15,636 5,097 20,7332017 2,704 14,893 1,657 74 16,624 5,433 22,0572018 2,752 15,736 1,761 77 17,574 5,766 23,3402019 2,799 16,977 1,887 81 18,945 6,292 25,2372020 2,842 18,175 2,003 84 20,262 6,771 27,0332021 2,882 19,379 2,126 88 21,593 7,152 28,7452022 2,919 20,565 2,256 91 22,912 7,383 30,295
* Total members estimated to receive benefits during the year, including both "retired participants" (retirees, disabled participants, surviving family members), and the covered spouses/domestic partners of these participants.
(All dollar amounts are in thousands)
Projected Employer Cash Payouts
UNIVERSITY OF CALIFORNIA Section IX Retiree Health Benefit Actuarial Valuation 10-Year Projection of Employer Benefit Payments
Page 41
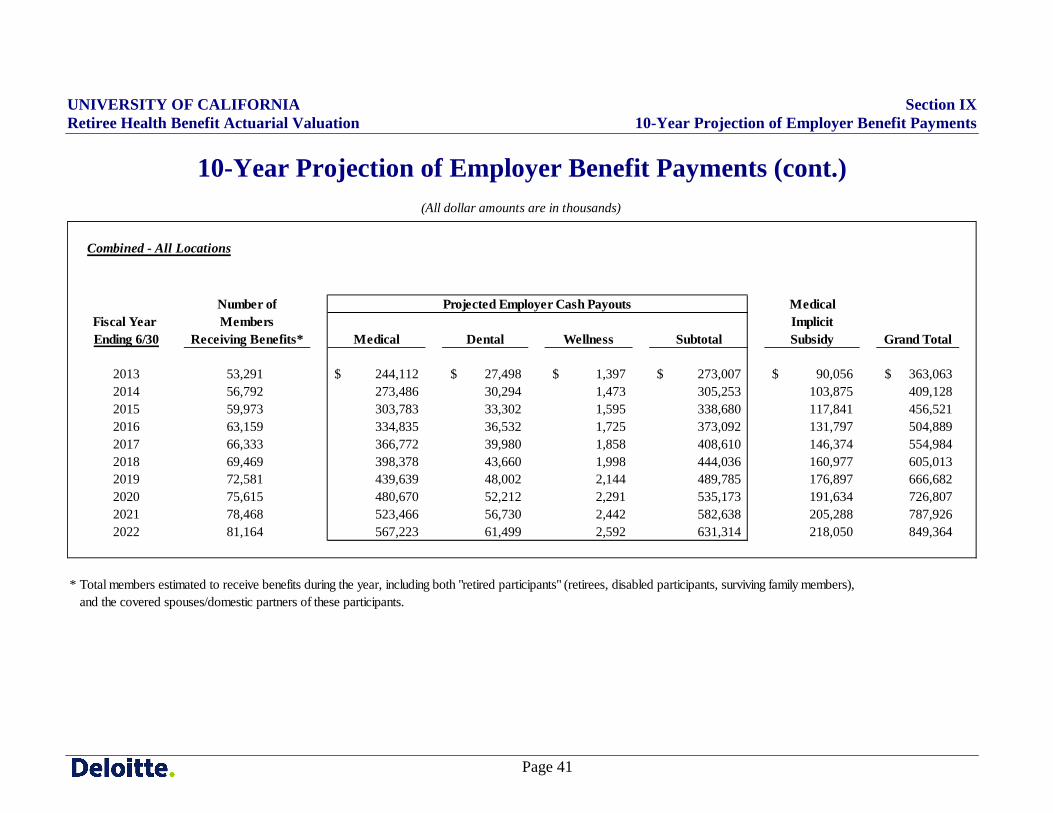
10-Year Projection of Employer Benefit Payments (cont.)
Combined - All Locations
Number of MedicalFiscal Year Members ImplicitEnding 6/30 Receiving Benefits* Medical Dental Wellness Subtotal Subsidy Grand Total
2013 53,291 244,112$ 27,498$ 1,397$ 273,007$ 90,056$ 363,063$ 2014 56,792 273,486 30,294 1,473 305,253 103,875 409,1282015 59,973 303,783 33,302 1,595 338,680 117,841 456,5212016 63,159 334,835 36,532 1,725 373,092 131,797 504,8892017 66,333 366,772 39,980 1,858 408,610 146,374 554,9842018 69,469 398,378 43,660 1,998 444,036 160,977 605,0132019 72,581 439,639 48,002 2,144 489,785 176,897 666,6822020 75,615 480,670 52,212 2,291 535,173 191,634 726,8072021 78,468 523,466 56,730 2,442 582,638 205,288 787,9262022 81,164 567,223 61,499 2,592 631,314 218,050 849,364
* Total members estimated to receive benefits during the year, including both "retired participants" (retirees, disabled participants, surviving family members), and the covered spouses/domestic partners of these participants.
(All dollar amounts are in thousands)
Projected Employer Cash Payouts

UNIVERSITY OF CALIFORNIA Section X Retiree Health Benefit Actuarial Valuation Summary of Plan Provisions
Page 42
Summary of Plan Provisions This section summarizes overall eligibility provisions for retiree health coverage, graduated eligibility provisions, the various plans offered by the University, and Medicare integration methods by plan. Unless otherwise stated, the plan designs are the same for both non-Medicare and Medicare members. Covered Employees: University of California employees who are eligible for retirement under a University-sponsored defined benefit
plan and elect monthly retirement income are eligible for retiree health coverage offered by the University if:
• At the time of separation, the employee was enrolled in medical and dental insurance coverage or was eligible but had “suspended” coverage;
• The employee’s retirement date is within 120 days of his or her separation from UC employment; and
• The employee meets the University’s service credit requirements (see “Graduated Eligibility” below) at the time of retirement.
The retiree health benefits are not accrued or vested benefit entitlements. Only the University’s service credit counts toward eligibility for retiree health benefits.
Once retired, eligible retirees may “suspend” or continue to suspend their health coverage and retain the right to become covered under the University’s retiree health plans in the future. If the University’s coverage is suspended and a retiree’s other health coverage has been continuous, the retiree may enroll:
• During any future open enrollment period; • Following a qualifying life event; or • When a retiree’s other health coverage is lost.
UNIVERSITY OF CALIFORNIA Section X Retiree Health Benefit Actuarial Valuation Summary of Plan Provisions
Page 43
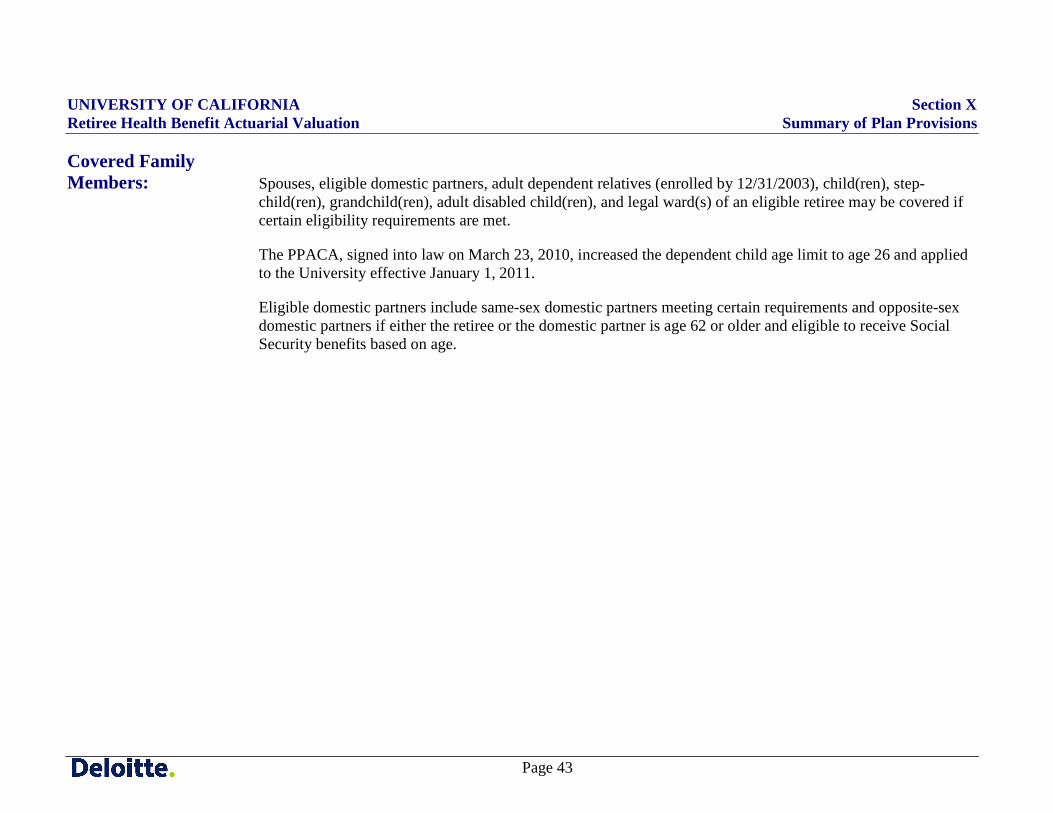
Covered Family Members: Spouses, eligible domestic partners, adult dependent relatives (enrolled by 12/31/2003), child(ren), step-
child(ren), grandchild(ren), adult disabled child(ren), and legal ward(s) of an eligible retiree may be covered if certain eligibility requirements are met.
The PPACA, signed into law on March 23, 2010, increased the dependent child age limit to age 26 and applied to the University effective January 1, 2011.
Eligible domestic partners include same-sex domestic partners meeting certain requirements and opposite-sex domestic partners if either the retiree or the domestic partner is age 62 or older and eligible to receive Social Security benefits based on age.
UNIVERSITY OF CALIFORNIA Section X Retiree Health Benefit Actuarial Valuation Summary of Plan Provisions
Page 44
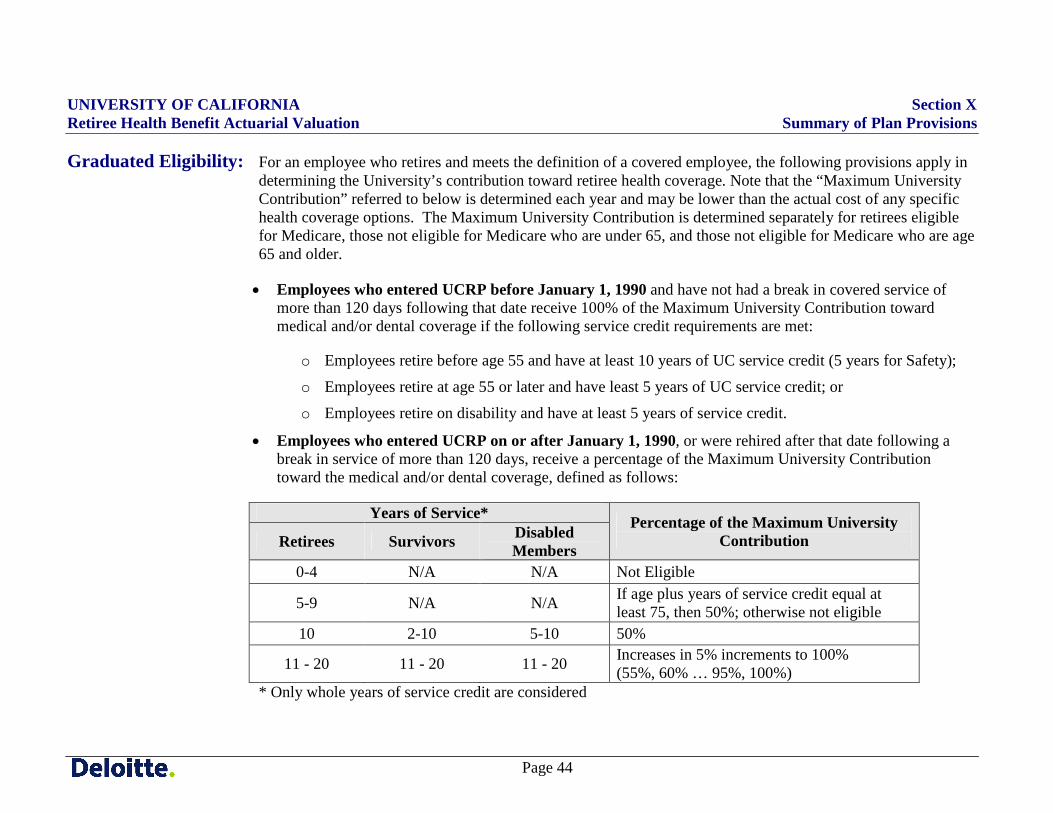
Graduated Eligibility: For an employee who retires and meets the definition of a covered employee, the following provisions apply in determining the University’s contribution toward retiree health coverage. Note that the “Maximum University Contribution” referred to below is determined each year and may be lower than the actual cost of any specific health coverage options. The Maximum University Contribution is determined separately for retirees eligible for Medicare, those not eligible for Medicare who are under 65, and those not eligible for Medicare who are age 65 and older.
• Employees who entered UCRP before January 1, 1990 and have not had a break in covered service of more than 120 days following that date receive 100% of the Maximum University Contribution toward medical and/or dental coverage if the following service credit requirements are met:
o Employees retire before age 55 and have at least 10 years of UC service credit (5 years for Safety);
o Employees retire at age 55 or later and have least 5 years of UC service credit; or
o Employees retire on disability and have at least 5 years of service credit.
• Employees who entered UCRP on or after January 1, 1990, or were rehired after that date following a break in service of more than 120 days, receive a percentage of the Maximum University Contribution toward the medical and/or dental coverage, defined as follows:
Years of Service* Percentage of the Maximum University Contribution Retirees Survivors Disabled
Members 0-4 N/A N/A Not Eligible
5-9 N/A N/A If age plus years of service credit equal at least 75, then 50%; otherwise not eligible
10 2-10 5-10 50%
11 - 20 11 - 20 11 - 20 Increases in 5% increments to 100% (55%, 60% … 95%, 100%)
* Only whole years of service credit are considered
UNIVERSITY OF CALIFORNIA Section X Retiree Health Benefit Actuarial Valuation Summary of Plan Provisions
Page 45
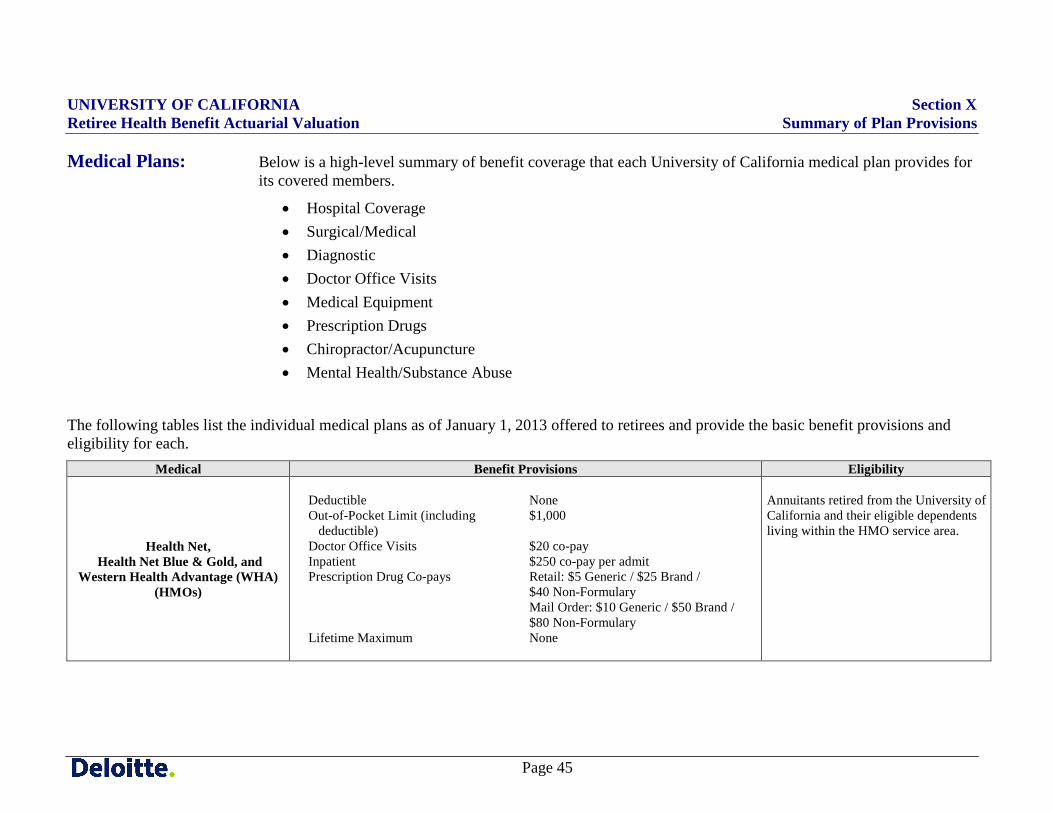
Medical Plans: Below is a high-level summary of benefit coverage that each University of California medical plan provides for its covered members.
• Hospital Coverage • Surgical/Medical • Diagnostic • Doctor Office Visits • Medical Equipment • Prescription Drugs • Chiropractor/Acupuncture • Mental Health/Substance Abuse
The following tables list the individual medical plans as of January 1, 2013 offered to retirees and provide the basic benefit provisions and eligibility for each.
Medical Benefit Provisions Eligibility
Health Net, Health Net Blue & Gold, and
Western Health Advantage (WHA) (HMOs)
Deductible None Out-of-Pocket Limit (including deductible)
$1,000
Doctor Office Visits $20 co-pay Inpatient $250 co-pay per admit Prescription Drug Co-pays Retail: $5 Generic / $25 Brand /
$40 Non-Formulary Mail Order: $10 Generic / $50 Brand / $80 Non-Formulary
Lifetime Maximum None
Annuitants retired from the University of California and their eligible dependents living within the HMO service area.
UNIVERSITY OF CALIFORNIA Section X Retiree Health Benefit Actuarial Valuation Summary of Plan Provisions
Page 46
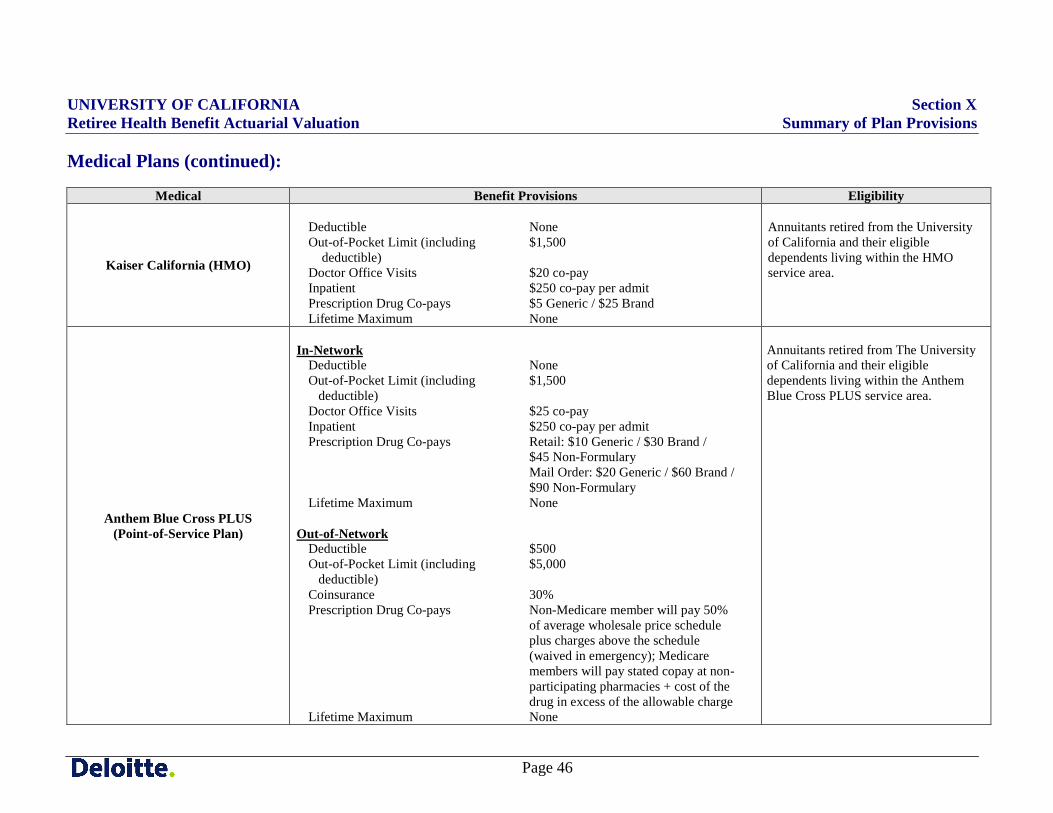
Medical Plans (continued):
Medical Benefit Provisions Eligibility
Kaiser California (HMO)
Deductible None Out-of-Pocket Limit (including deductible)
$1,500
Doctor Office Visits $20 co-pay Inpatient $250 co-pay per admit Prescription Drug Co-pays $5 Generic / $25 Brand Lifetime Maximum None
Annuitants retired from the University of California and their eligible dependents living within the HMO service area.
Anthem Blue Cross PLUS (Point-of-Service Plan)
In-Network
Deductible None Out-of-Pocket Limit (including deductible)
$1,500
Doctor Office Visits $25 co-pay Inpatient $250 co-pay per admit Prescription Drug Co-pays Retail: $10 Generic / $30 Brand /
$45 Non-Formulary Mail Order: $20 Generic / $60 Brand / $90 Non-Formulary
Lifetime Maximum None Out-of-Network
Deductible $500 Out-of-Pocket Limit (including deductible)
$5,000
Coinsurance 30% Prescription Drug Co-pays Non-Medicare member will pay 50%
of average wholesale price schedule plus charges above the schedule (waived in emergency); Medicare members will pay stated copay at non-participating pharmacies + cost of the drug in excess of the allowable charge
Lifetime Maximum None
Annuitants retired from The University of California and their eligible dependents living within the Anthem Blue Cross PLUS service area.
UNIVERSITY OF CALIFORNIA Section X Retiree Health Benefit Actuarial Valuation Summary of Plan Provisions
Page 47
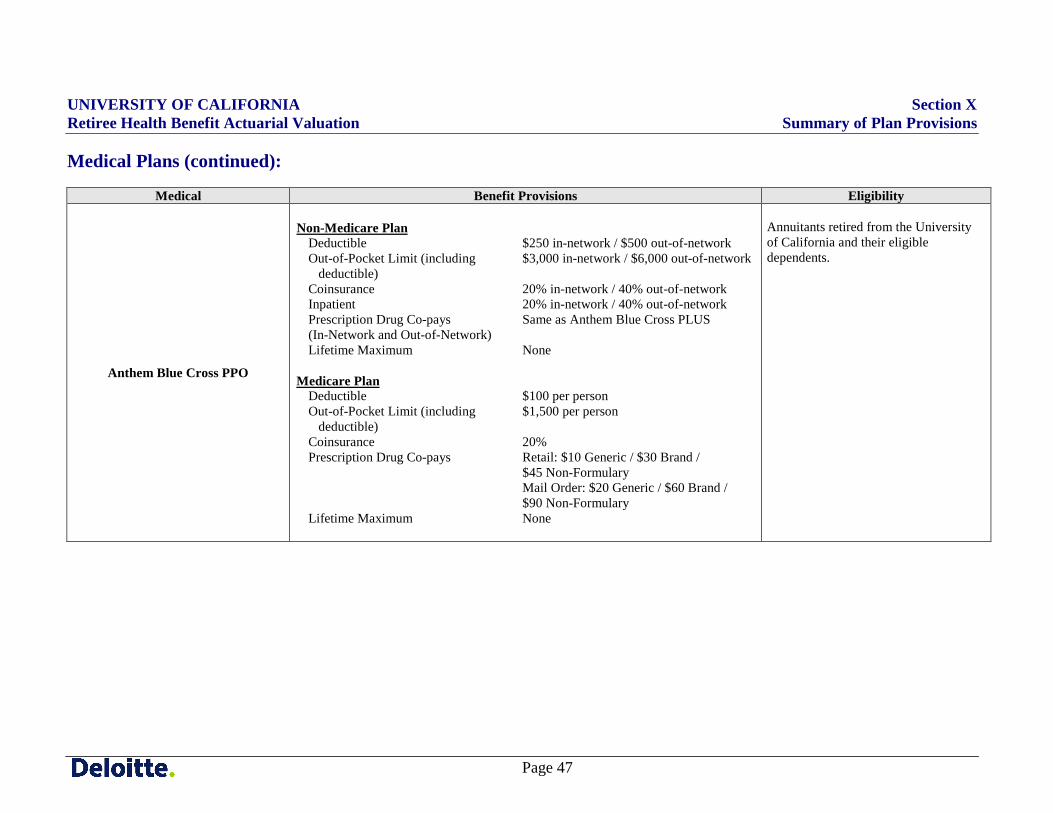
Medical Plans (continued):
Medical Benefit Provisions Eligibility
Anthem Blue Cross PPO
Non-Medicare Plan
Deductible $250 in-network / $500 out-of-network Out-of-Pocket Limit (including deductible)
$3,000 in-network / $6,000 out-of-network
Coinsurance 20% in-network / 40% out-of-network Inpatient 20% in-network / 40% out-of-network Prescription Drug Co-pays (In-Network and Out-of-Network)
Same as Anthem Blue Cross PLUS
Lifetime Maximum None Medicare Plan
Deductible $100 per person Out-of-Pocket Limit (including deductible)
$1,500 per person
Coinsurance 20% Prescription Drug Co-pays Retail: $10 Generic / $30 Brand /
$45 Non-Formulary Mail Order: $20 Generic / $60 Brand / $90 Non-Formulary
Lifetime Maximum None
Annuitants retired from the University of California and their eligible dependents.
UNIVERSITY OF CALIFORNIA Section X Retiree Health Benefit Actuarial Valuation Summary of Plan Provisions
Page 48
Medical Plans (continued):
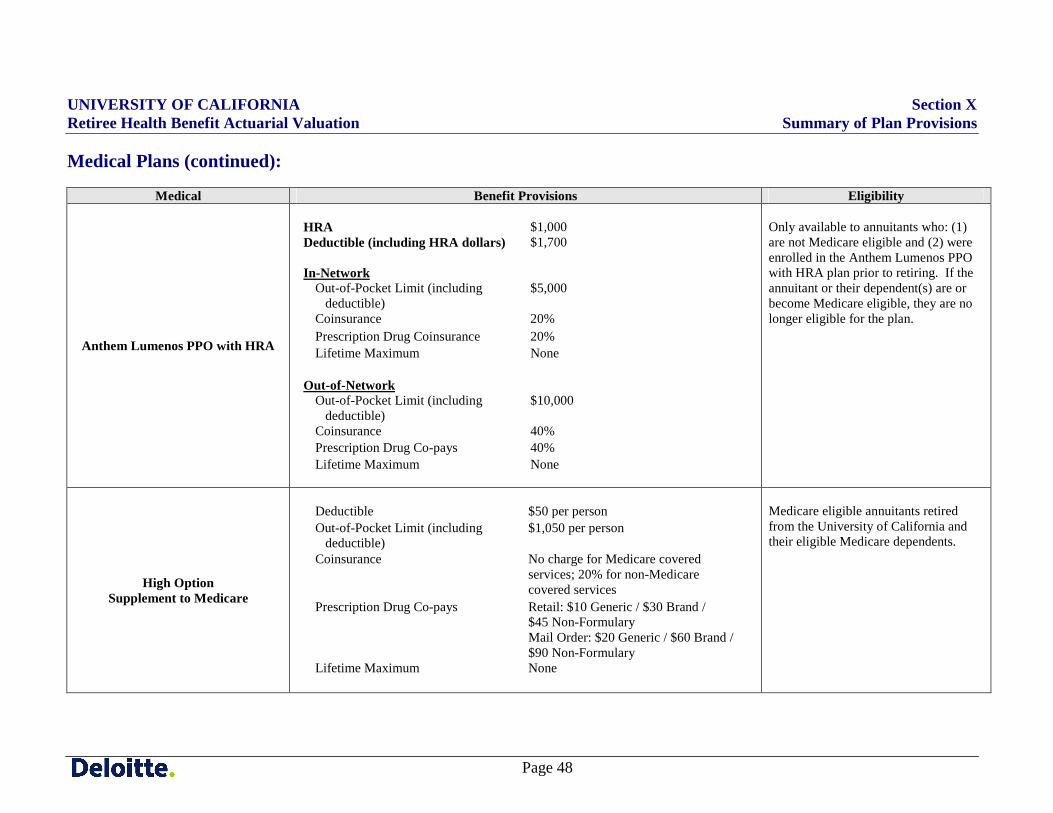
Medical Benefit Provisions Eligibility
Anthem Lumenos PPO with HRA
HRA Deductible (including HRA dollars) In-Network
$1,000 $1,700
Out-of-Pocket Limit (including deductible)
$5,000
Coinsurance 20% Prescription Drug Coinsurance 20% Lifetime Maximum None
Out-of-Network
Out-of-Pocket Limit (including deductible)
$10,000
Coinsurance 40% Prescription Drug Co-pays 40% Lifetime Maximum None
Only available to annuitants who: (1) are not Medicare eligible and (2) were enrolled in the Anthem Lumenos PPO with HRA plan prior to retiring. If the annuitant or their dependent(s) are or become Medicare eligible, they are no longer eligible for the plan.
High Option Supplement to Medicare
Deductible $50 per person Out-of-Pocket Limit (including deductible)
$1,050 per person
Coinsurance No charge for Medicare covered services; 20% for non-Medicare covered services
Prescription Drug Co-pays Retail: $10 Generic / $30 Brand / $45 Non-Formulary Mail Order: $20 Generic / $60 Brand / $90 Non-Formulary
Lifetime Maximum None
Medicare eligible annuitants retired from the University of California and their eligible Medicare dependents.
UNIVERSITY OF CALIFORNIA Section X Retiree Health Benefit Actuarial Valuation Summary of Plan Provisions
Page 49
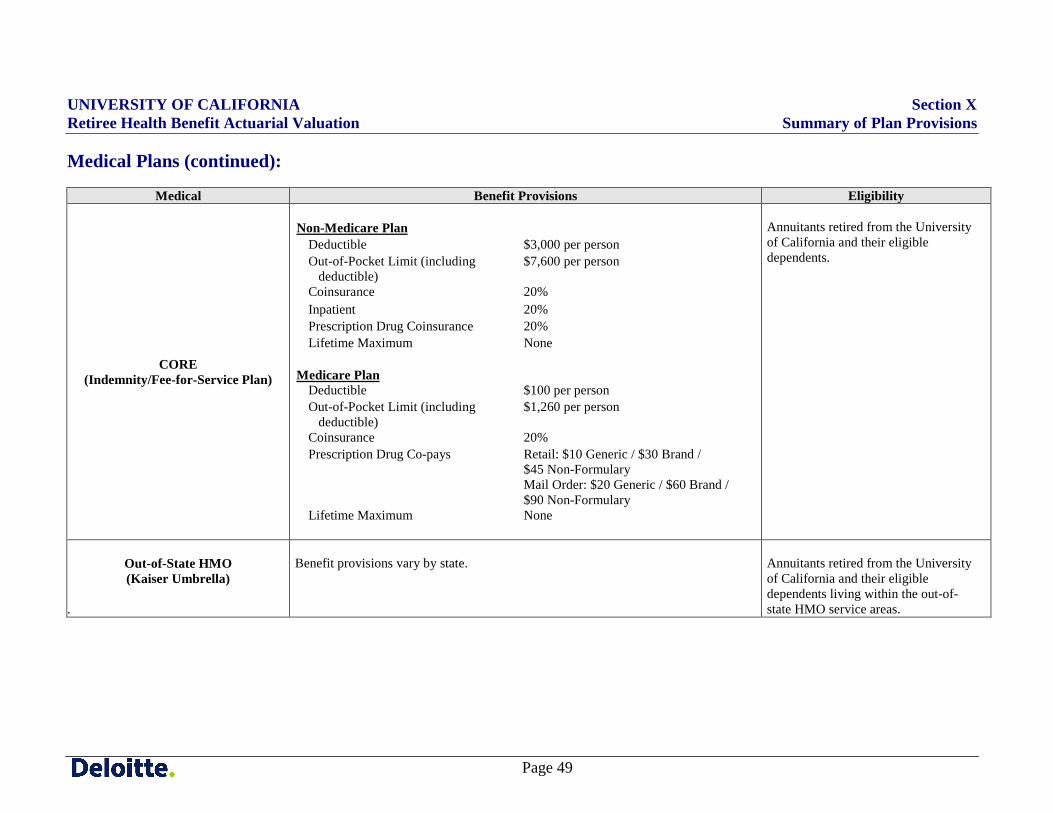
Medical Plans (continued):
Medical Benefit Provisions Eligibility
CORE (Indemnity/Fee-for-Service Plan)
Non-Medicare Plan
Deductible $3,000 per person Out-of-Pocket Limit (including deductible)
$7,600 per person
Coinsurance 20% Inpatient 20% Prescription Drug Coinsurance 20% Lifetime Maximum None
Medicare Plan
Deductible $100 per person Out-of-Pocket Limit (including deductible)
$1,260 per person
Coinsurance 20% Prescription Drug Co-pays Retail: $10 Generic / $30 Brand /
$45 Non-Formulary Mail Order: $20 Generic / $60 Brand / $90 Non-Formulary
Lifetime Maximum None
Annuitants retired from the University of California and their eligible dependents.
Out-of-State HMO (Kaiser Umbrella)
.
Benefit provisions vary by state.
Annuitants retired from the University of California and their eligible dependents living within the out-of-state HMO service areas.
UNIVERSITY OF CALIFORNIA Section X Retiree Health Benefit Actuarial Valuation Summary of Plan Provisions
Page 50
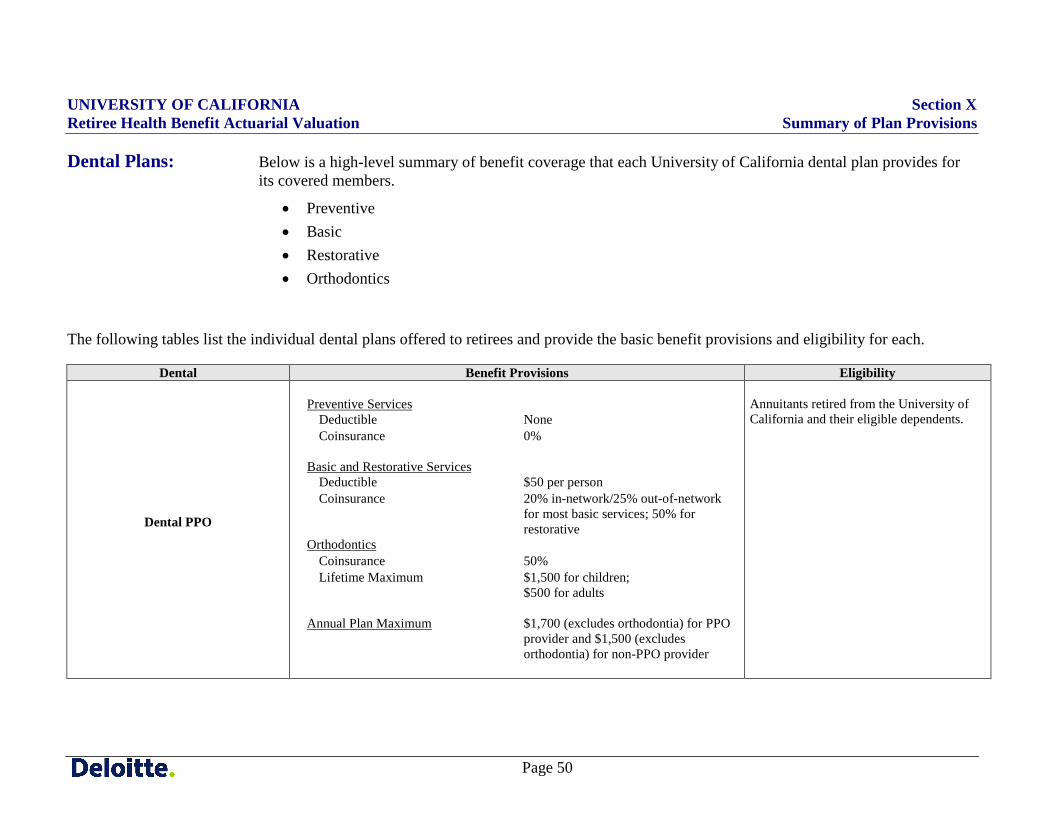
Dental Plans: Below is a high-level summary of benefit coverage that each University of California dental plan provides for its covered members.
• Preventive • Basic • Restorative • Orthodontics
The following tables list the individual dental plans offered to retirees and provide the basic benefit provisions and eligibility for each.
Dental Benefit Provisions Eligibility
Dental PPO
Preventive Services
Deductible None Coinsurance 0%
Basic and Restorative Services
Deductible $50 per person Coinsurance 20% in-network/25% out-of-network
for most basic services; 50% for restorative
Orthodontics Coinsurance 50% Lifetime Maximum $1,500 for children;
$500 for adults Annual Plan Maximum
$1,700 (excludes orthodontia) for PPO provider and $1,500 (excludes orthodontia) for non-PPO provider
Annuitants retired from the University of California and their eligible dependents.
UNIVERSITY OF CALIFORNIA Section X Retiree Health Benefit Actuarial Valuation Summary of Plan Provisions
Page 51
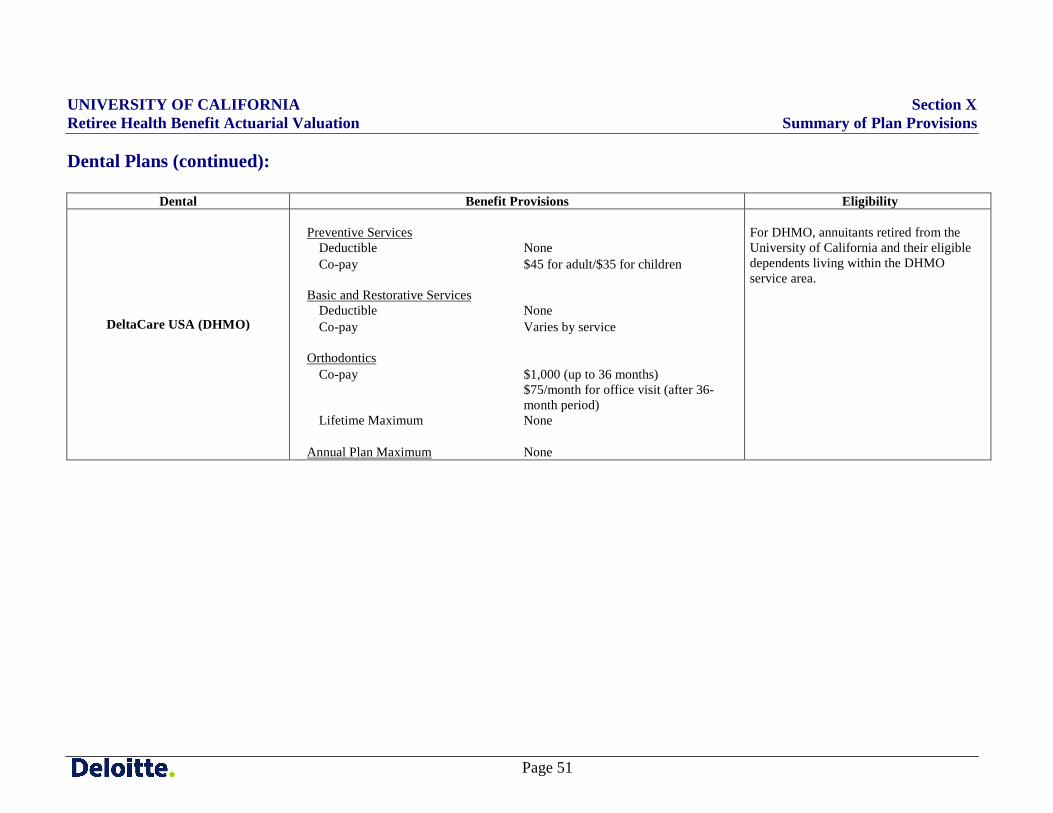
Dental Plans (continued):
Dental Benefit Provisions Eligibility
DeltaCare USA (DHMO)
Preventive Services
Deductible None Co-pay $45 for adult/$35 for children
Basic and Restorative Services
Deductible None Co-pay Varies by service
Orthodontics Co-pay $1,000 (up to 36 months)
$75/month for office visit (after 36-month period)
Lifetime Maximum None Annual Plan Maximum
None
For DHMO, annuitants retired from the University of California and their eligible dependents living within the DHMO service area.
UNIVERSITY OF CALIFORNIA Section X Retiree Health Benefit Actuarial Valuation Summary of Plan Provisions
Page 52
Wellness Benefits and Incentives: Beginning in calendar year 2008, the University offers wellness benefits, administered by StayWell, and
provides an incentive for eligible members completing a health assessment through StayWell.
All actives and retirees, as well as their spouses/domestic partners age 18 or older are eligible to participate in this program, if they are enrolled in any UC-sponsored medical plan other than Kaiser and if they do not belong to bargaining units that opted out of the wellness program.
Starting in 2013, members accumulate points in PointsBank for completing different wellness activities. The incentive for completing a number of wellness activities (resulting in 100 total points) in 2013 will be a gift card valued at $100 for employees and retirees, and a gift card valued at $50 for eligible adult dependent spouses and/or eligible domestic partners.
Medicare Part B Reimbursement: If the Maximum University Contribution (after any reduction for graduated eligibility, if applicable) is greater
than the rate for the plan chosen by a Medicare-eligible retiree, then the difference will be used to reimburse the retiree for all or a portion of the standard Medicare Part B premium. The standard is the premium that most retirees pay. It is not based on the higher premium rates that apply to late entrants or high income individuals. This premium reimbursement is applicable only for Medicare-eligible retirees or other Medicare-eligible covered members.
The University has decided to cap the Medicare Part B premium reimbursement at $99.90 per month in 2013, which is consistent with the standard 2012 Medicare Part B premium. Each year the administration should reassess the basis for determining Medicare Part B reimbursements. This assessment is typically done during the annual health plan renewal process, taking into consideration overall budget resources, salary adjustments for active employees, and COLAs for retirees.
UNIVERSITY OF CALIFORNIA Section X Retiree Health Benefit Actuarial Valuation Summary of Plan Provisions
Page 53
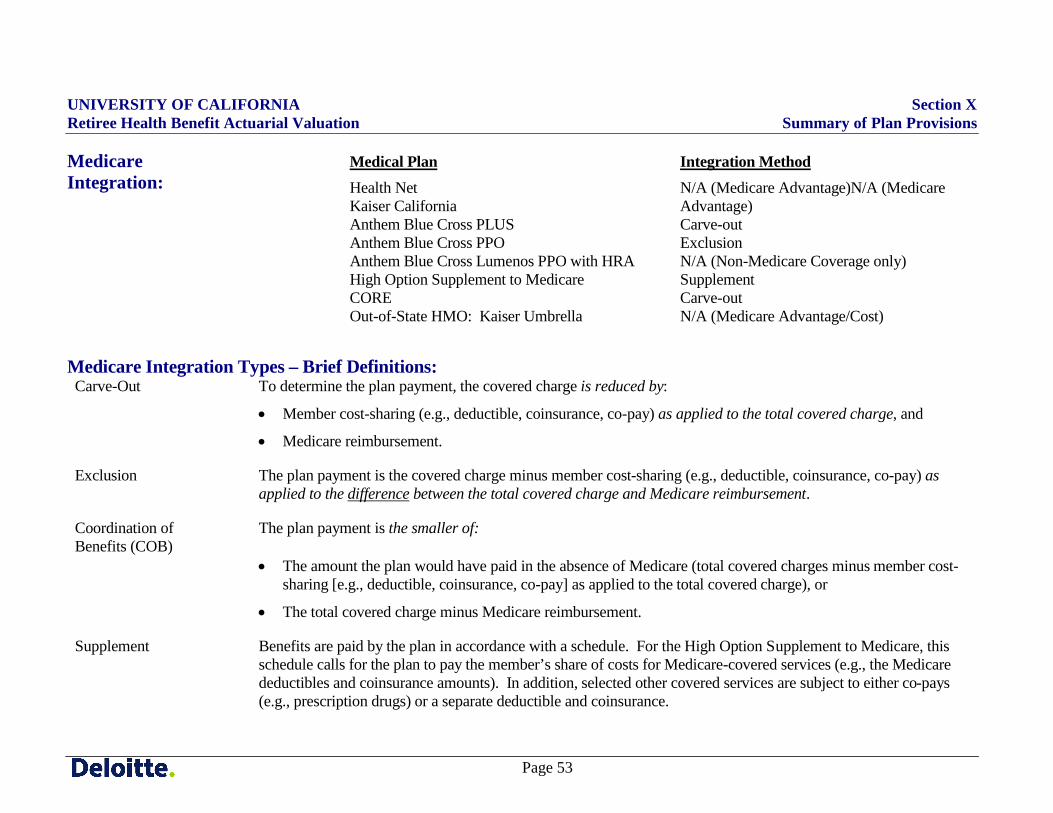
Medicare Integration:
Medicare Integration Types – Brief Definitions: Carve-Out To determine the plan payment, the covered charge is reduced by:
• Member cost-sharing (e.g., deductible, coinsurance, co-pay) as applied to the total covered charge, and
• Medicare reimbursement.
Exclusion The plan payment is the covered charge minus member cost-sharing (e.g., deductible, coinsurance, co-pay) as applied to the difference between the total covered charge and Medicare reimbursement.
Coordination of The plan payment is the smaller of: Benefits (COB)
• The amount the plan would have paid in the absence of Medicare (total covered charges minus member cost-sharing [e.g., deductible, coinsurance, co-pay] as applied to the total covered charge), or
• The total covered charge minus Medicare reimbursement.
Supplement Benefits are paid by the plan in accordance with a schedule. For the High Option Supplement to Medicare, this schedule calls for the plan to pay the member’s share of costs for Medicare-covered services (e.g., the Medicare deductibles and coinsurance amounts). In addition, selected other covered services are subject to either co-pays (e.g., prescription drugs) or a separate deductible and coinsurance.
Medical Plan Integration Method Health Net Kaiser California Anthem Blue Cross PLUS Anthem Blue Cross PPO Anthem Blue Cross Lumenos PPO with HRA High Option Supplement to Medicare CORE Out-of-State HMO: Kaiser Umbrella
N/A (Medicare Advantage)N/A (Medicare Advantage) Carve-out Exclusion N/A (Non-Medicare Coverage only) Supplement Carve-out N/A (Medicare Advantage/Cost)
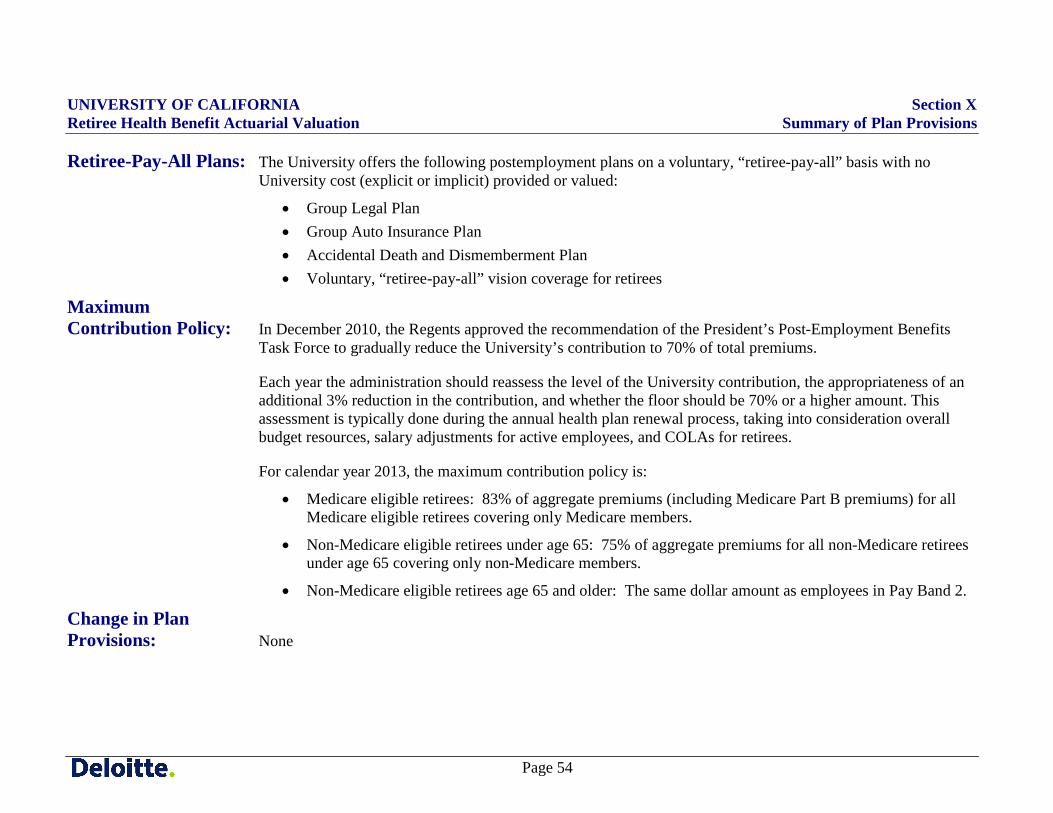
UNIVERSITY OF CALIFORNIA Section X Retiree Health Benefit Actuarial Valuation Summary of Plan Provisions
Page 54
Retiree-Pay-All Plans: The University offers the following postemployment plans on a voluntary, “retiree-pay-all” basis with no University cost (explicit or implicit) provided or valued:
• Group Legal Plan • Group Auto Insurance Plan • Accidental Death and Dismemberment Plan • Voluntary, “retiree-pay-all” vision coverage for retirees
Maximum Contribution Policy: In December 2010, the Regents approved the recommendation of the President’s Post-Employment Benefits
Task Force to gradually reduce the University’s contribution to 70% of total premiums.
Each year the administration should reassess the level of the University contribution, the appropriateness of an additional 3% reduction in the contribution, and whether the floor should be 70% or a higher amount. This assessment is typically done during the annual health plan renewal process, taking into consideration overall budget resources, salary adjustments for active employees, and COLAs for retirees.
For calendar year 2013, the maximum contribution policy is:
• Medicare eligible retirees: 83% of aggregate premiums (including Medicare Part B premiums) for all Medicare eligible retirees covering only Medicare members.
• Non-Medicare eligible retirees under age 65: 75% of aggregate premiums for all non-Medicare retirees under age 65 covering only non-Medicare members.
• Non-Medicare eligible retirees age 65 and older: The same dollar amount as employees in Pay Band 2.
Change in Plan Provisions: None
UNIVERSITY OF CALIFORNIA Section XI Retiree Health Benefit Actuarial Valuation Summary of Actuarial Methods and Assumptions
Page 55
Summary of Actuarial Methods and Assumptions Actuarial Methods
Actuarial Cost Method: The Actuarial Cost Method used to determine the Actuarial Accrued Liability and the Annual Required
Contribution is the Entry Age Normal (EAN) method. This actuarial cost method is one of the GASB 45 approved methods. This method is in the family of future benefit cost methods, which requires an estimate of the projected benefit payable at retirement to determine costs and liabilities.
The Normal Cost (NC) is the annual allocation required for each participant from entry date to the assumed retirement date so that the accumulated allocation at retirement is equal to the liability for the projected benefit. The projected benefits are based on estimates of future years of service and projected health benefit costs. The normal cost is developed as a level dollar allocation.
The Present Value of Future Benefits is equal to the value of the projected benefit payable at retirement discounted back to the participant’s current age. Discounts include such items as interest and mortality. The present value of future normal cost allocations is equal to the discounted value of the normal costs allocated from the member’s current age to retirement age.
The difference between the Present Value of Future Benefits and the present value of future normal cost allocations represents the Actuarial Liability at the participant’s current age.
The Actuarial Accrued Liability for participants currently receiving payments is calculated as the actuarial present value of future benefits expected to be paid. No normal cost is allocated for these participants.
UNIVERSITY OF CALIFORNIA Section XI Retiree Health Benefit Actuarial Valuation Summary of Actuarial Methods and Assumptions
Page 56
Amortization of Unfunded Liabilities: The Unfunded Actuarial Accrued Liability is the excess of the Actuarial Accrued Liability over the Assets.
This excess will be amortized in the following ways:
• For the initial UAAL: 30-year, level dollar amount, closed amortization period; and
• For experience gains/losses: 15-year, level dollar amount, closed amortization periods. Annual gains/losses include changes due to contributions different from the ARC and experience different from expected.
• For assumption changes: 30-year, level dollar amount, closed amortization periods.
• For plan provision changes: 30-year, level dollar amount, closed amortization periods.
The total amortization of the UAAL, determined by the preceding method, will not be less than the amount necessary to create an equivalent single amortization period of 30 years (consistent with GASB 45 requirements for disclosure). This may occur, for example, if a large gain occurs in the near future. Since the gain would be amortized over a shorter period than the initial UAAL, the resulting total amortization amount may be smaller than the amount necessary to amortize the remaining UAAL over 30 years.
Actuarial Value of Assets: The actuarial value of assets on the valuation date is the market value of assets less 80%, 60%, 40% and 20% of
the investment gains and losses during the four fiscal years preceding the valuation date. Investment gains and losses are determined as the difference between the actual market value of assets on the valuation date and the expected market value of assets on the valuation date based on the assumed rate of return on investments (discount rate). There were no investment gains or losses prior to fiscal year ending 2008 because the trust did not exist.
UNIVERSITY OF CALIFORNIA Section XI Retiree Health Benefit Actuarial Valuation Summary of Actuarial Methods and Assumptions
Page 57
Economic Assumptions
Discount Rate: 5.50% annually
Payroll Growth: Not applicable
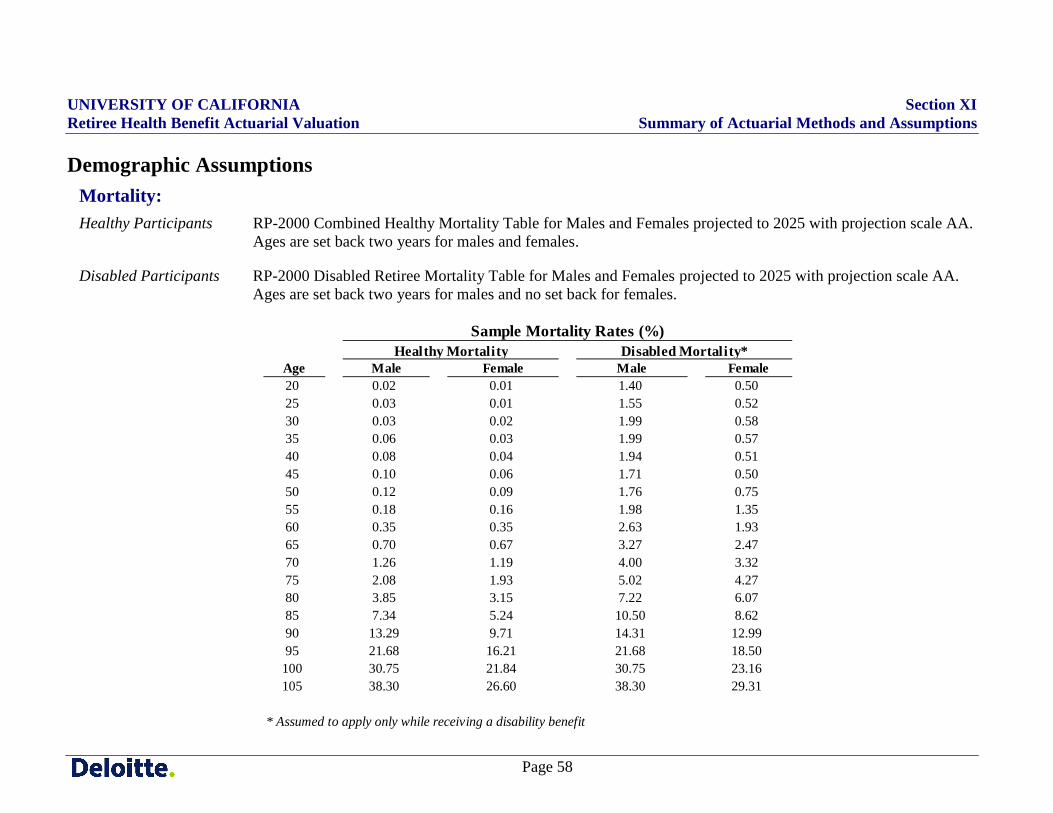
UNIVERSITY OF CALIFORNIA Section XI Retiree Health Benefit Actuarial Valuation Summary of Actuarial Methods and Assumptions
Page 58
Demographic Assumptions
Mortality: Healthy Participants RP-2000 Combined Healthy Mortality Table for Males and Females projected to 2025 with projection scale AA.
Ages are set back two years for males and females.
Disabled Participants RP-2000 Disabled Retiree Mortality Table for Males and Females projected to 2025 with projection scale AA. Ages are set back two years for males and no set back for females.
Age Male Female Male Female20 0.02 0.01 1.40 0.5025 0.03 0.01 1.55 0.5230 0.03 0.02 1.99 0.5835 0.06 0.03 1.99 0.5740 0.08 0.04 1.94 0.5145 0.10 0.06 1.71 0.5050 0.12 0.09 1.76 0.7555 0.18 0.16 1.98 1.3560 0.35 0.35 2.63 1.9365 0.70 0.67 3.27 2.4770 1.26 1.19 4.00 3.3275 2.08 1.93 5.02 4.2780 3.85 3.15 7.22 6.0785 7.34 5.24 10.50 8.6290 13.29 9.71 14.31 12.9995 21.68 16.21 21.68 18.50100 30.75 21.84 30.75 23.16105 38.30 26.60 38.30 29.31
* Assumed to apply only while receiving a disability benefit
Healthy Mortality Disabled Mortality*Sample Mortality Rates (%)
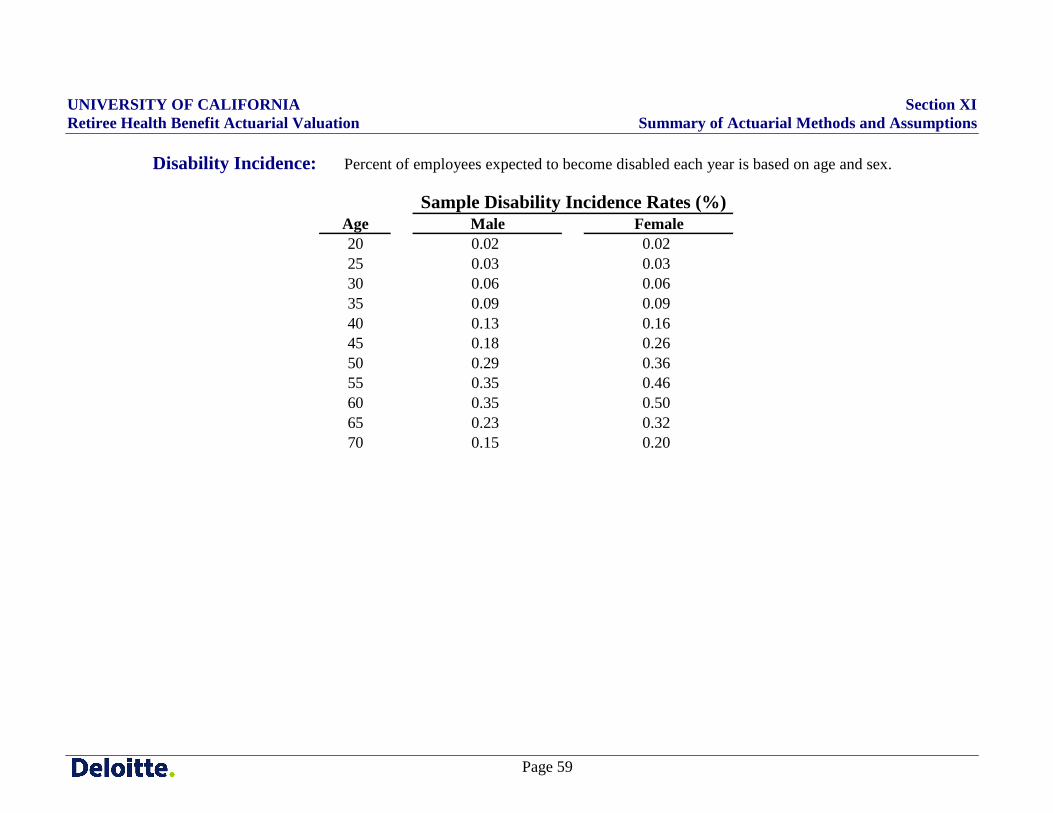
UNIVERSITY OF CALIFORNIA Section XI Retiree Health Benefit Actuarial Valuation Summary of Actuarial Methods and Assumptions
Page 59
Disability Incidence: Percent of employees expected to become disabled each year is based on age and sex.
Age Male Female20 0.02 0.0225 0.03 0.0330 0.06 0.0635 0.09 0.0940 0.13 0.1645 0.18 0.2650 0.29 0.3655 0.35 0.4660 0.35 0.5065 0.23 0.3270 0.15 0.20
Sample Disability Incidence Rates (%)
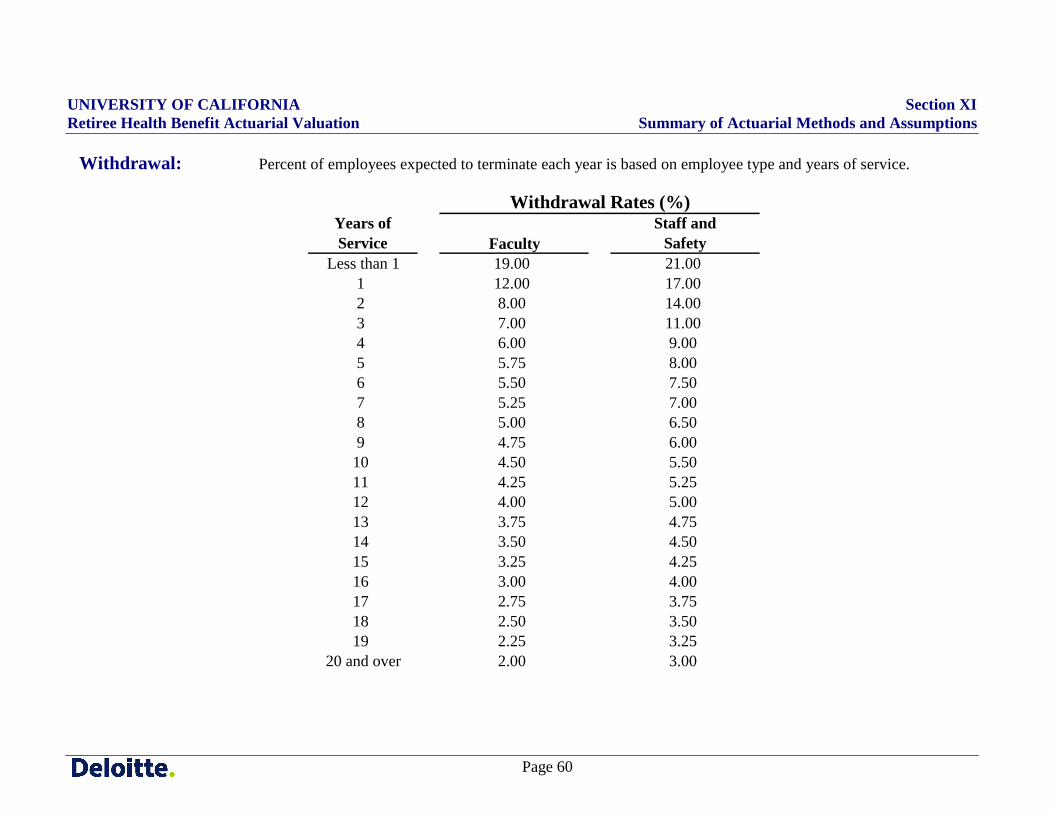
UNIVERSITY OF CALIFORNIA Section XI Retiree Health Benefit Actuarial Valuation Summary of Actuarial Methods and Assumptions
Page 60
Withdrawal: Percent of employees expected to terminate each year is based on employee type and years of service.
Years of Service Faculty
Staff and Safety
Less than 1 19.00 21.001 12.00 17.002 8.00 14.003 7.00 11.004 6.00 9.005 5.75 8.006 5.50 7.507 5.25 7.008 5.00 6.509 4.75 6.00
10 4.50 5.5011 4.25 5.2512 4.00 5.0013 3.75 4.7514 3.50 4.5015 3.25 4.2516 3.00 4.0017 2.75 3.7518 2.50 3.5019 2.25 3.25
20 and over 2.00 3.00
Withdrawal Rates (%)
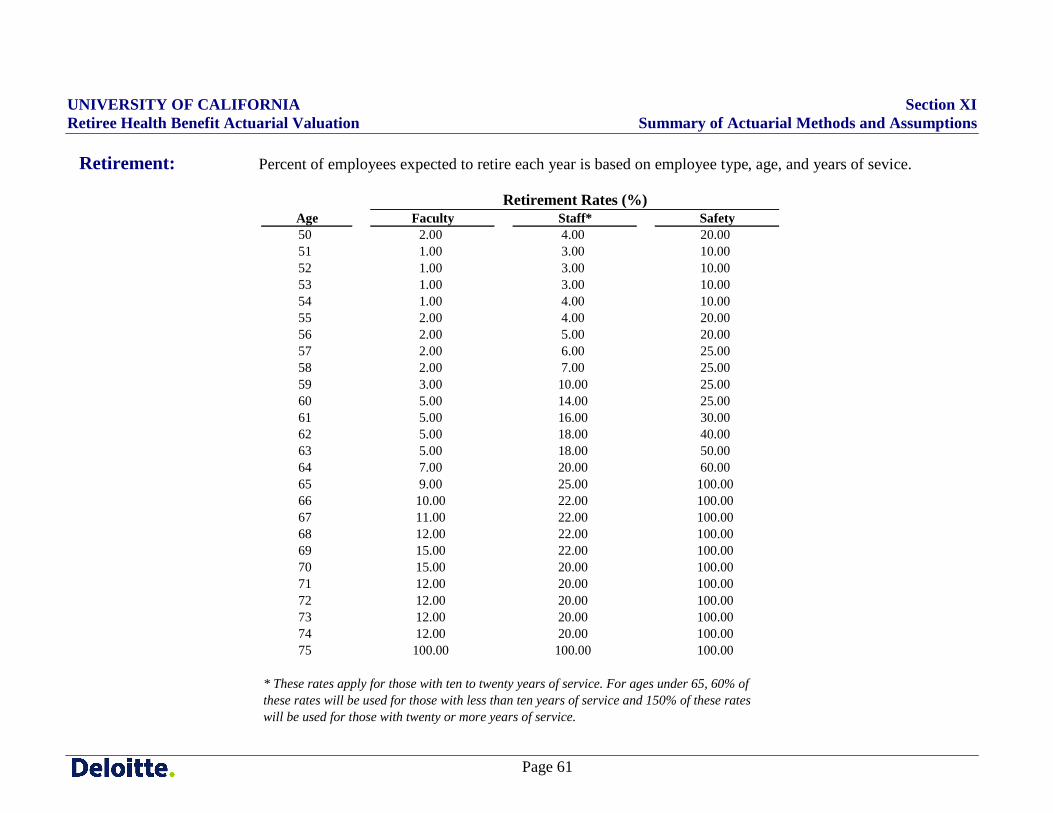
UNIVERSITY OF CALIFORNIA Section XI Retiree Health Benefit Actuarial Valuation Summary of Actuarial Methods and Assumptions
Page 61
Retirement: Percent of employees expected to retire each year is based on employee type, age, and years of sevice.
Age Faculty Staff* Safety50 2.00 4.00 20.0051 1.00 3.00 10.0052 1.00 3.00 10.0053 1.00 3.00 10.0054 1.00 4.00 10.0055 2.00 4.00 20.0056 2.00 5.00 20.0057 2.00 6.00 25.0058 2.00 7.00 25.0059 3.00 10.00 25.0060 5.00 14.00 25.0061 5.00 16.00 30.0062 5.00 18.00 40.0063 5.00 18.00 50.0064 7.00 20.00 60.0065 9.00 25.00 100.0066 10.00 22.00 100.0067 11.00 22.00 100.0068 12.00 22.00 100.0069 15.00 22.00 100.0070 15.00 20.00 100.0071 12.00 20.00 100.0072 12.00 20.00 100.0073 12.00 20.00 100.0074 12.00 20.00 100.0075 100.00 100.00 100.00
* These rates apply for those with ten to twenty years of service. For ages under 65, 60% ofthese rates will be used for those with less than ten years of service and 150% of these rateswill be used for those with twenty or more years of service.
Retirement Rates (%)
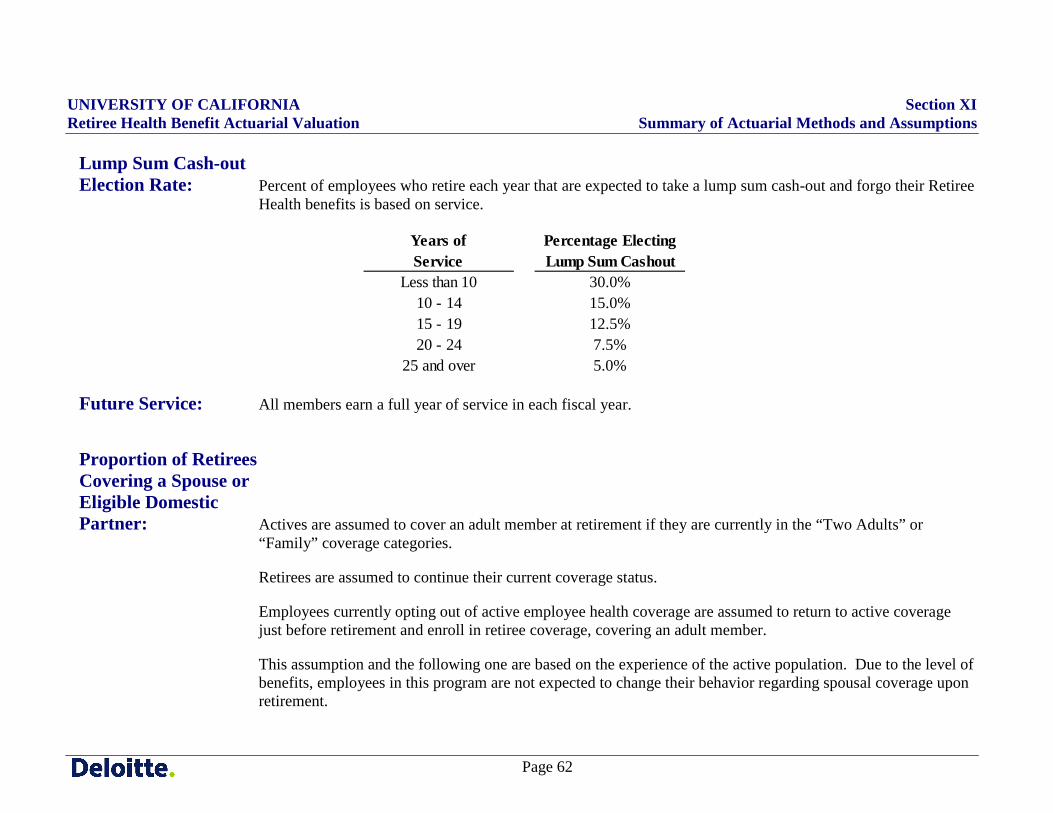
UNIVERSITY OF CALIFORNIA Section XI Retiree Health Benefit Actuarial Valuation Summary of Actuarial Methods and Assumptions
Page 62
Lump Sum Cash-out Election Rate: Percent of employees who retire each year that are expected to take a lump sum cash-out and forgo their Retiree
Health benefits is based on service.
Future Service: All members earn a full year of service in each fiscal year.
Proportion of Retirees Covering a Spouse or Eligible Domestic Partner: Actives are assumed to cover an adult member at retirement if they are currently in the “Two Adults” or
“Family” coverage categories.
Retirees are assumed to continue their current coverage status.
Employees currently opting out of active employee health coverage are assumed to return to active coverage just before retirement and enroll in retiree coverage, covering an adult member.
This assumption and the following one are based on the experience of the active population. Due to the level of benefits, employees in this program are not expected to change their behavior regarding spousal coverage upon retirement.
Years of Service
Percentage Electing Lump Sum Cashout
Less than 10 30.0%10 - 14 15.0%15 - 19 12.5%20 - 24 7.5%
25 and over 5.0%
UNIVERSITY OF CALIFORNIA Section XI Retiree Health Benefit Actuarial Valuation Summary of Actuarial Methods and Assumptions
Page 63
Age of Spouse or Eligible Domestic Partner: For current retirees, the age of the spouse or eligible domestic partner is based on actual dates of birth. For
current active employees, male employees are assumed to be three years older than the covered adult member and female employees are assumed to be three years younger than the covered adult member.
Benefit Assumptions
Plan Costs: The valuation of future benefit costs are based on the plans currently offered to University retirees, as described earlier in the “Summary of Plan Provisions” section. These plans include: medical benefits (including behavioral health, prescription drugs, and potential reimbursement for Medicare Part B premiums); dental benefits; and wellness benefits/incentives.
The following postemployment plans are offered on a voluntary, “retiree-pay-all” basis and are not valued: Group Legal Plan, Group Auto Insurance Plan, Accidental Death and Dismemberment Plan, and Voluntary “Retiree-Pay-All” Vision Plan.
Per Capita Costs
The per capita costs used in the valuation were developed from insured premiums (HMOs, POS, PPO, Dental), projected self-funded accrual rates reflecting estimated claim and administrative costs (High Option Supplement to Medicare, CORE), and projected administrative costs and other assumptions (Wellness fees and incentives). These data and assumptions were provided by the University of California and plan insurers/administrators.
For the July 1, 2012 valuation, the first fiscal year (7/1/2012 – 6/30/2013) costs are based on adjustments to the 2013 insured premiums and self-funded accrual rates for all plans. The 2013 rates were finalized in September during the annual renewal process. The calendar year 2013 rates were reduced by one-half of the appropriate first-year trend assumption to reflect the costs for the first fiscal year as a basis for trending costs to future years. The first fiscal year costs were then adjusted further to reflect actual costs for the first half of this fiscal year (July – December 2012).
UNIVERSITY OF CALIFORNIA Section XI Retiree Health Benefit Actuarial Valuation Summary of Actuarial Methods and Assumptions
Page 64
Plan Costs (cont.): These first-year rates are on a “net basis” – they reflect plan costs after reduction of total benefit costs for member cost-sharing (deductibles, coinsurance, co-pays, provider savings, Medicare, etc.). Future year per capita costs were projected by applying trend assumptions to the first year costs.
Medical Plan Costs Medical net rates for covered adults have been developed and expressed in two ways for the valuation:
• Age-Graded Rates.
o Non-Medicare. For employees/retirees and spouses/eligible domestic partners who will not be/are not eligible for Medicare, the 2013 rates (by plan and coverage category) and the current enrollment mix by plan and age were used to develop net rates by age band. Rates were age-graded using the total (active employee and retiree) non-Medicare covered population for each plan, so that the age-graded rates for a retiree-only group would composite to a higher cost appropriate for that group. For Kaiser Umbrella, the rates are not age-graded because it is a community-rated plan.
These age-graded rates are the basis for projecting the gross cost for each individual, before member contributions for coverage.
As described under “Medicare Assumptions” later in this section, some current retirees age 65 and older are not eligible for Medicare, and some future retirees age 65 and older will not be eligible for Medicare. Net rates for non-Medicare coverage reflect this, with premiums extending to the 84 & over age band.
o Medicare. Age-graded rates are not necessary for employees/retirees and spouses/eligible domestic partners who will be/are eligible for Medicare. These Medicare plans develop rates based on a population of only Medicare retirees. Since there is no group that is affected by higher premiums due to these retirees (i.e., there are no active employees in these plans), there is no implicit subsidy. The higher claims expected of these retirees as their average ages increase are built into the Medicare trend rates and are considered part of the explicit subsidy.
• “Flat” Rates. These rates, referred to as ‘flat” because they are not age-graded, are used in combination with the maximum University contribution levels to project future retiree contributions for health coverage.
UNIVERSITY OF CALIFORNIA Section XI Retiree Health Benefit Actuarial Valuation Summary of Actuarial Methods and Assumptions
Page 65
Plan Costs (cont.): Age-graded and “flat” rates were developed separately for retirees and spouses/eligible domestic partners, reflecting the relationship between the coverage categories “Single” and “Two Adults” used by the University for both gross premiums and the University contributions by coverage category.
Costs for child coverage were developed for all members based on the proportion of child coverage by current retirees. The non-Medicare spouse/eligible domestic partner age-graded and “flat” rates were loaded to reflect this child coverage.
For Medicare-eligible retirees, “flat” net rates include the Medicare Part B premium. This reflects that the University will reimburse all or a portion of this premium if the maximum University contribution for that retiree is below the medical rate.
University Share of Medical Costs
Maximum University contributions are also developed separately by plan for retirees and spouses/eligible domestic partners.
• For retirees with graduated eligibility of 100%, these projected University contributions are subtracted from the projected “flat” rates to determine the retiree contributions in each year. These retiree contributions are then subtracted from the age-based cost for a member to determine the University cost in each year.
• If a retiree’s graduated eligibility is less than 100%, this maximum University contribution is first prorated before determining the projected retiree contribution in future years.
For purposes of this valuation, it has been assumed that the pattern of three percentage points annual decreases in the contribution percentage will continue until the floor of 70% is reached (separately for Medicare eligible retirees and non-Medicare eligible retirees under 65).
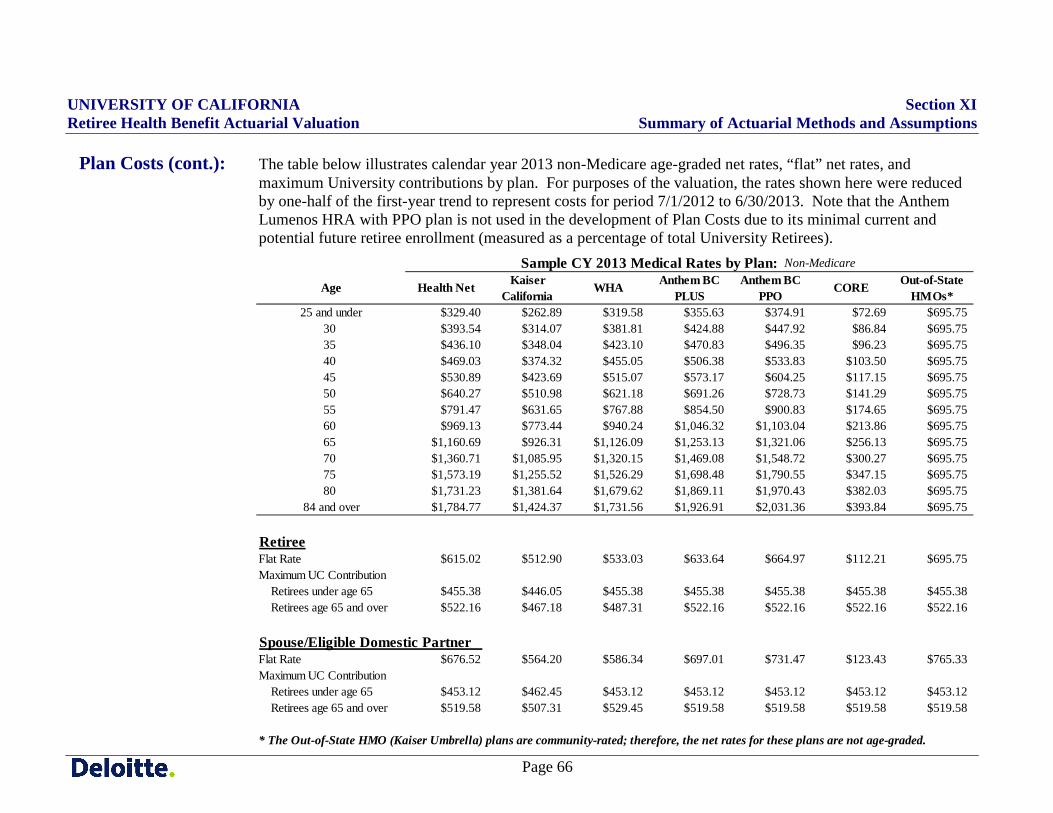
UNIVERSITY OF CALIFORNIA Section XI Retiree Health Benefit Actuarial Valuation Summary of Actuarial Methods and Assumptions
Page 66
Plan Costs (cont.): The table below illustrates calendar year 2013 non-Medicare age-graded net rates, “flat” net rates, and maximum University contributions by plan. For purposes of the valuation, the rates shown here were reduced by one-half of the first-year trend to represent costs for period 7/1/2012 to 6/30/2013. Note that the Anthem Lumenos HRA with PPO plan is not used in the development of Plan Costs due to its minimal current and potential future retiree enrollment (measured as a percentage of total University Retirees).
Age Health Net Kaiser California
WHA Anthem BC PLUS
Anthem BC PPO
CORE Out-of-State HMOs*
25 and under $329.40 $262.89 $319.58 $355.63 $374.91 $72.69 $695.7530 $393.54 $314.07 $381.81 $424.88 $447.92 $86.84 $695.7535 $436.10 $348.04 $423.10 $470.83 $496.35 $96.23 $695.7540 $469.03 $374.32 $455.05 $506.38 $533.83 $103.50 $695.7545 $530.89 $423.69 $515.07 $573.17 $604.25 $117.15 $695.7550 $640.27 $510.98 $621.18 $691.26 $728.73 $141.29 $695.7555 $791.47 $631.65 $767.88 $854.50 $900.83 $174.65 $695.7560 $969.13 $773.44 $940.24 $1,046.32 $1,103.04 $213.86 $695.7565 $1,160.69 $926.31 $1,126.09 $1,253.13 $1,321.06 $256.13 $695.7570 $1,360.71 $1,085.95 $1,320.15 $1,469.08 $1,548.72 $300.27 $695.7575 $1,573.19 $1,255.52 $1,526.29 $1,698.48 $1,790.55 $347.15 $695.7580 $1,731.23 $1,381.64 $1,679.62 $1,869.11 $1,970.43 $382.03 $695.75
84 and over $1,784.77 $1,424.37 $1,731.56 $1,926.91 $2,031.36 $393.84 $695.75
RetireeFlat Rate $615.02 $512.90 $533.03 $633.64 $664.97 $112.21 $695.75Maximum UC Contribution Retirees under age 65 $455.38 $446.05 $455.38 $455.38 $455.38 $455.38 $455.38 Retirees age 65 and over $522.16 $467.18 $487.31 $522.16 $522.16 $522.16 $522.16
Spouse/Eligible Domestic PartnerFlat Rate $676.52 $564.20 $586.34 $697.01 $731.47 $123.43 $765.33Maximum UC Contribution Retirees under age 65 $453.12 $462.45 $453.12 $453.12 $453.12 $453.12 $453.12 Retirees age 65 and over $519.58 $507.31 $529.45 $519.58 $519.58 $519.58 $519.58
* The Out-of-State HMO (Kaiser Umbrella) plans are community-rated; therefore, the net rates for these plans are not age-graded.
Sample CY 2013 Medical Rates by Plan: Non-Medicare
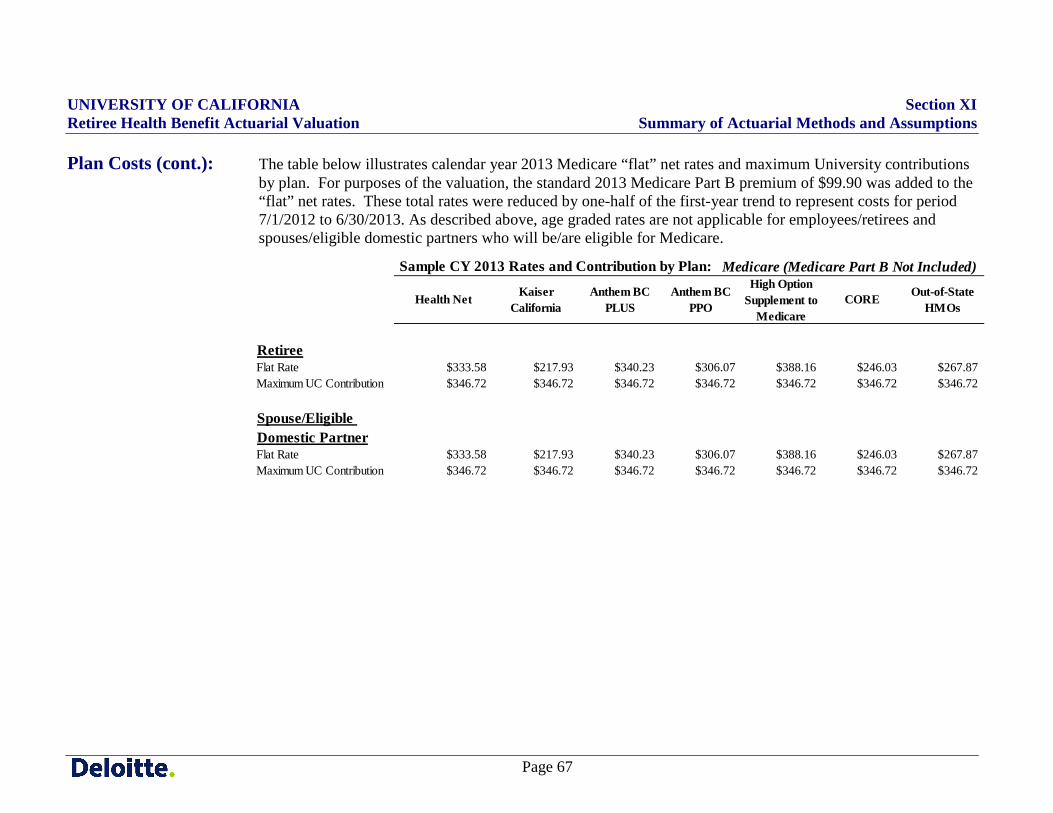
UNIVERSITY OF CALIFORNIA Section XI Retiree Health Benefit Actuarial Valuation Summary of Actuarial Methods and Assumptions
Page 67
Plan Costs (cont.): The table below illustrates calendar year 2013 Medicare “flat” net rates and maximum University contributions by plan. For purposes of the valuation, the standard 2013 Medicare Part B premium of $99.90 was added to the “flat” net rates. These total rates were reduced by one-half of the first-year trend to represent costs for period 7/1/2012 to 6/30/2013. As described above, age graded rates are not applicable for employees/retirees and spouses/eligible domestic partners who will be/are eligible for Medicare.
Health Net Kaiser California
Anthem BC PLUS
Anthem BC PPO
High Option Supplement to
MedicareCORE Out-of-State
HMOs
RetireeFlat Rate $333.58 $217.93 $340.23 $306.07 $388.16 $246.03 $267.87Maximum UC Contribution $346.72 $346.72 $346.72 $346.72 $346.72 $346.72 $346.72
Spouse/Eligible Domestic PartnerFlat Rate $333.58 $217.93 $340.23 $306.07 $388.16 $246.03 $267.87Maximum UC Contribution $346.72 $346.72 $346.72 $346.72 $346.72 $346.72 $346.72
Sample CY 2013 Rates and Contribution by Plan: Medicare (Medicare Part B Not Included)
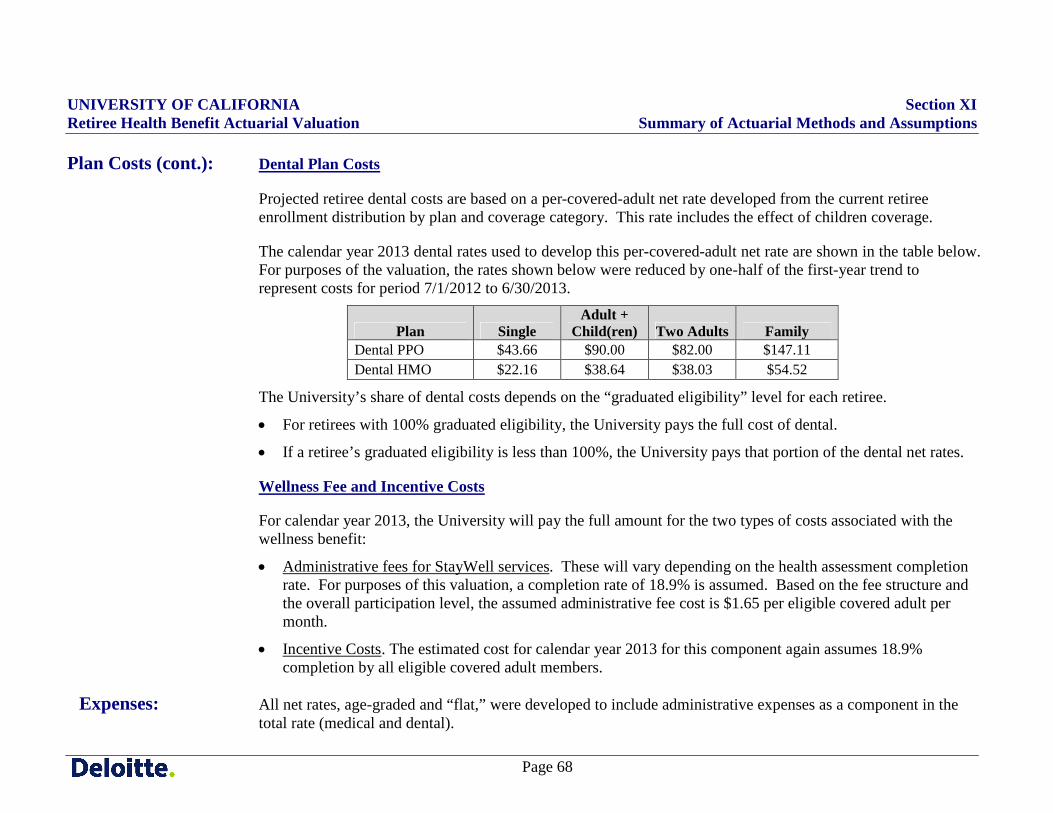
UNIVERSITY OF CALIFORNIA Section XI Retiree Health Benefit Actuarial Valuation Summary of Actuarial Methods and Assumptions
Page 68
Plan Costs (cont.): Dental Plan Costs
Projected retiree dental costs are based on a per-covered-adult net rate developed from the current retiree enrollment distribution by plan and coverage category. This rate includes the effect of children coverage.
The calendar year 2013 dental rates used to develop this per-covered-adult net rate are shown in the table below. For purposes of the valuation, the rates shown below were reduced by one-half of the first-year trend to represent costs for period 7/1/2012 to 6/30/2013.
Plan Single Adult +
Child(ren) Two Adults Family Dental PPO $43.66 $90.00 $82.00 $147.11 Dental HMO $22.16 $38.64 $38.03 $54.52
The University’s share of dental costs depends on the “graduated eligibility” level for each retiree.
• For retirees with 100% graduated eligibility, the University pays the full cost of dental.
• If a retiree’s graduated eligibility is less than 100%, the University pays that portion of the dental net rates.
Wellness Fee and Incentive Costs
For calendar year 2013, the University will pay the full amount for the two types of costs associated with the wellness benefit:
• Administrative fees for StayWell services. These will vary depending on the health assessment completion rate. For purposes of this valuation, a completion rate of 18.9% is assumed. Based on the fee structure and the overall participation level, the assumed administrative fee cost is $1.65 per eligible covered adult per month.
• Incentive Costs. The estimated cost for calendar year 2013 for this component again assumes 18.9% completion by all eligible covered adult members.
Expenses: All net rates, age-graded and “flat,” were developed to include administrative expenses as a component in the total rate (medical and dental).
UNIVERSITY OF CALIFORNIA Section XI Retiree Health Benefit Actuarial Valuation Summary of Actuarial Methods and Assumptions
Page 69
Medical Trend
(Net Rates): The trend rates illustrated on the next page are used to project the net medical rates (age-graded and “flat”) shown above into future years. • The initial trend assumptions are based on a review of the University’s historic trend rates for HMO, PPO
and Indemnity plans during the years 2005 through 2011. This review was done separately for non-Medicare and Medicare plans. Regression curves were fit to the data to help predict short-term future per capita cost increases. The final estimates for initial trend were based on this information adjusted for the expected impact of health care reform due to industry pass-through costs. Under health reform, various industry fees will be imposed on health insurance providers, pharmaceutical manufacturers, and medical device manufacturers. In addition, much investment will be necessary by insurers, hospitals, and other providers to fund required infrastructure and technology enhancements in order to comply with the requirements of the Act. The short-term rates were graded steadily to a level of 5% annually after 11 years. This grade down period is consistent with industry expectations of an increasing length of time until health care costs are brought under control.
• The University considered using the SOA-Getzen Long Term Healthcare Cost Trend Resource Model to set these rates, which would have resulted in a longer period from the initial trend rates to the ultimate trend rate; however, the University decided that an 11 year reduction period was appropriate because they expect their medical costs will level off more quickly than the general population upon which the SOA-Getzen model is based. The basis for this opinion is that the University’s effort to guide employees to lower cost (aka “Value Tier”) plans, which will encourage lower overall utilization of medical benefits over time.
• Separate trend projections are used to reflect the differences in benefit design of each plan type. The Medicare Advantage plans are assumed to have much higher initial trend due to the assumption that reimbursements from Medicare will continue to increase more slowly than overall medical trend until the costs of these plans to the Medicare program are consistent with fee-for-service plans. The resulting pass through costs of these lower reimbursements is expected to significantly increase the premiums for Medicare Advantage plans.
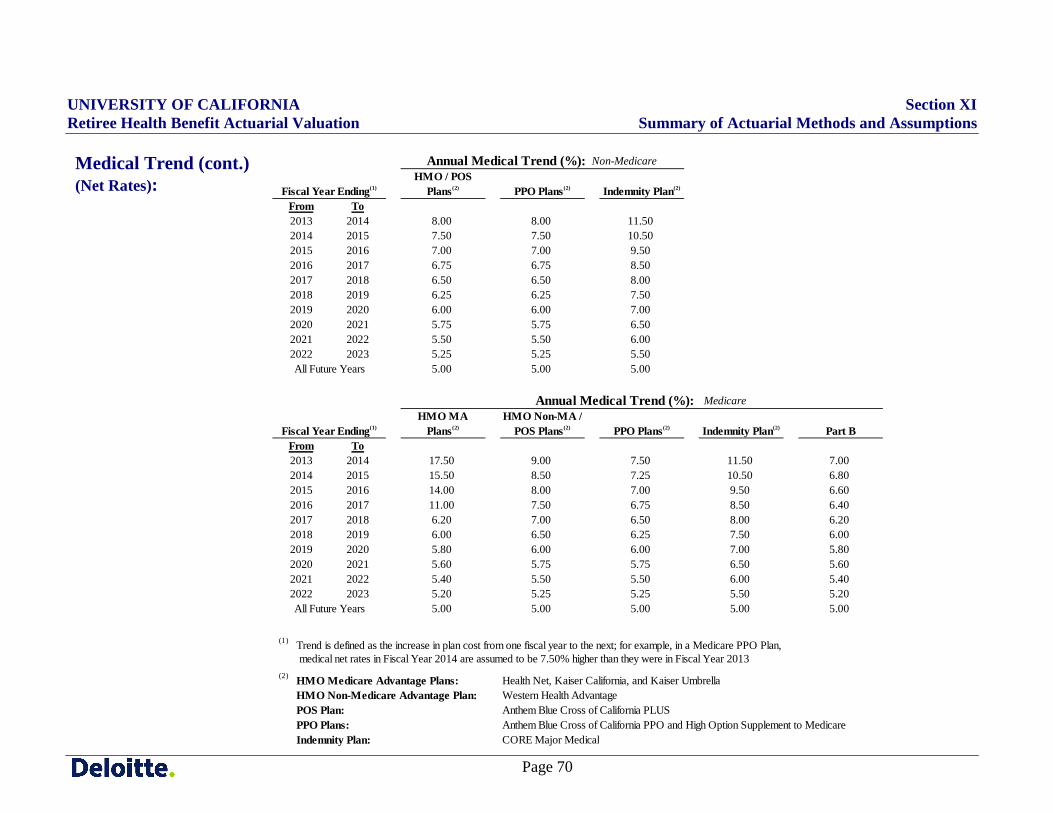
UNIVERSITY OF CALIFORNIA Section XI Retiree Health Benefit Actuarial Valuation Summary of Actuarial Methods and Assumptions
Page 70
Medical Trend (cont.) (Net Rates):
HMO / POS Plans(2) PPO Plans(2) Indemnity Plan(2)
To2014 8.00 8.00 11.502015 7.50 7.50 10.502016 7.00 7.00 9.502017 6.75 6.75 8.502018 6.50 6.50 8.002019 6.25 6.25 7.502020 6.00 6.00 7.002021 5.75 5.75 6.502022 5.50 5.50 6.002023 5.25 5.25 5.50
5.00 5.00 5.00
HMO MA Plans(2)
HMO Non-MA / POS Plans(2) PPO Plans(2) Indemnity Plan(2) Part B
To2014 17.50 9.00 7.50 11.50 7.002015 15.50 8.50 7.25 10.50 6.802016 14.00 8.00 7.00 9.50 6.602017 11.00 7.50 6.75 8.50 6.402018 6.20 7.00 6.50 8.00 6.202019 6.00 6.50 6.25 7.50 6.002020 5.80 6.00 6.00 7.00 5.802021 5.60 5.75 5.75 6.50 5.602022 5.40 5.50 5.50 6.00 5.402023 5.20 5.25 5.25 5.50 5.20
5.00 5.00 5.00 5.00 5.00
(1) Trend is defined as the increase in plan cost from one fiscal year to the next; for example, in a Medicare PPO Plan, medical net rates in Fiscal Year 2014 are assumed to be 7.50% higher than they were in Fiscal Year 2013
(2) HMO Medicare Advantage Plans: Health Net, Kaiser California, and Kaiser UmbrellaHMO Non-Medicare Advantage Plan: Western Health AdvantagePOS Plan: Anthem Blue Cross of California PLUSPPO Plans: Anthem Blue Cross of California PPO and High Option Supplement to MedicareIndemnity Plan: CORE Major Medical
All Future Years
Annual Medical Trend (%): Non-Medicare
Fiscal Year Ending(1)
From2013201420152016201720182019202020212022
All Future Years
Annual Medical Trend (%): Medicare
Fiscal Year Ending(1)
From2013201420152016201720182019202020212022
UNIVERSITY OF CALIFORNIA Section XI Retiree Health Benefit Actuarial Valuation Summary of Actuarial Methods and Assumptions
Page 71
Maximum University Contribution Trend: The maximum University contributions shown earlier, reflecting the University’s 2013 contribution policy, are
projected using the same medical trends for net rates (included in the tables on the preceding page). This approach assumes that the University contribution level will increase by the same percentage as the net rates increase (before adjusting for assumed changes in the contribution policy).
Dental Trend: Dental rates are assumed to increase by 5% each year.
Wellness Trend: Both administrative fees and incentives costs are assumed to stay at current levels for one year then increase at 3% per year thereafter.
Plan Participation: 100% of future retirees (regardless of current University health coverage) who become eligible for a benefit are assumed to elect retiree coverage. This includes employees who are eligible for but currently opt out of active health coverage. Retirees who are currently electing to suspend their coverage are assumed to remain uncovered in the future.
Excise Tax: Effective in the 2018 calendar year, an excise tax on “Cadillac Plans” will apply as a result of PPACA. HMOs and other healthcare insurers, who offer plans with a higher cost than the excise tax threshold, will be charged a 40% tax on the costs exceeding the threshold. It is assumed that these insurers will pass this additional cost onto the plan sponsors through an increase in premiums. Based on the trend rates on the preceding page, it is projected that the University of California will become subject to the excise tax due to “Cadillac Plan” status in the year 2018.
Coverage: Current retirees are assumed to remain in their currently elected plan. Future retirees are assumed to enroll in the existing plans in the same proportion as the current retiree mix. These proportions are established separately for non-Medicare and Medicare coverage for each plan.
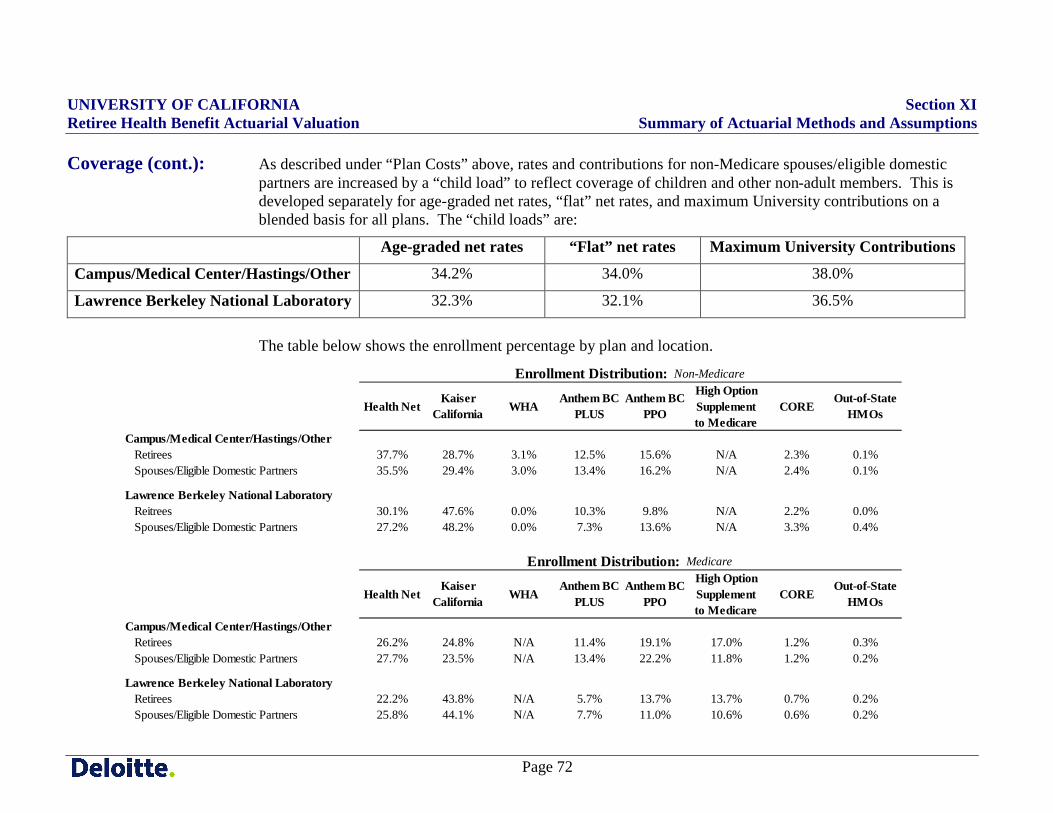
UNIVERSITY OF CALIFORNIA Section XI Retiree Health Benefit Actuarial Valuation Summary of Actuarial Methods and Assumptions
Page 72
Coverage (cont.): As described under “Plan Costs” above, rates and contributions for non-Medicare spouses/eligible domestic partners are increased by a “child load” to reflect coverage of children and other non-adult members. This is developed separately for age-graded net rates, “flat” net rates, and maximum University contributions on a blended basis for all plans. The “child loads” are:
Age-graded net rates “Flat” net rates Maximum University Contributions
Campus/Medical Center/Hastings/Other 34.2% 34.0% 38.0%
Lawrence Berkeley National Laboratory 32.3% 32.1% 36.5%
The table below shows the enrollment percentage by plan and location.
Health NetKaiser
California WHAAnthem BC
PLUSAnthem BC
PPO
High Option Supplement to Medicare
COREOut-of-State
HMOs
Campus/Medical Center/Hastings/OtherRetirees 37.7% 28.7% 3.1% 12.5% 15.6% N/A 2.3% 0.1%Spouses/Eligible Domestic Partners 35.5% 29.4% 3.0% 13.4% 16.2% N/A 2.4% 0.1%
Lawrence Berkeley National LaboratoryReitrees 30.1% 47.6% 0.0% 10.3% 9.8% N/A 2.2% 0.0%Spouses/Eligible Domestic Partners 27.2% 48.2% 0.0% 7.3% 13.6% N/A 3.3% 0.4%
Health NetKaiser
California WHAAnthem BC
PLUSAnthem BC
PPO
High Option Supplement to Medicare
COREOut-of-State
HMOs
Campus/Medical Center/Hastings/OtherRetirees 26.2% 24.8% N/A 11.4% 19.1% 17.0% 1.2% 0.3%Spouses/Eligible Domestic Partners 27.7% 23.5% N/A 13.4% 22.2% 11.8% 1.2% 0.2%
Lawrence Berkeley National LaboratoryRetirees 22.2% 43.8% N/A 5.7% 13.7% 13.7% 0.7% 0.2%Spouses/Eligible Domestic Partners 25.8% 44.1% N/A 7.7% 11.0% 10.6% 0.6% 0.2%
Enrollment Distribution: Non-Medicare
Enrollment Distribution: Medicare
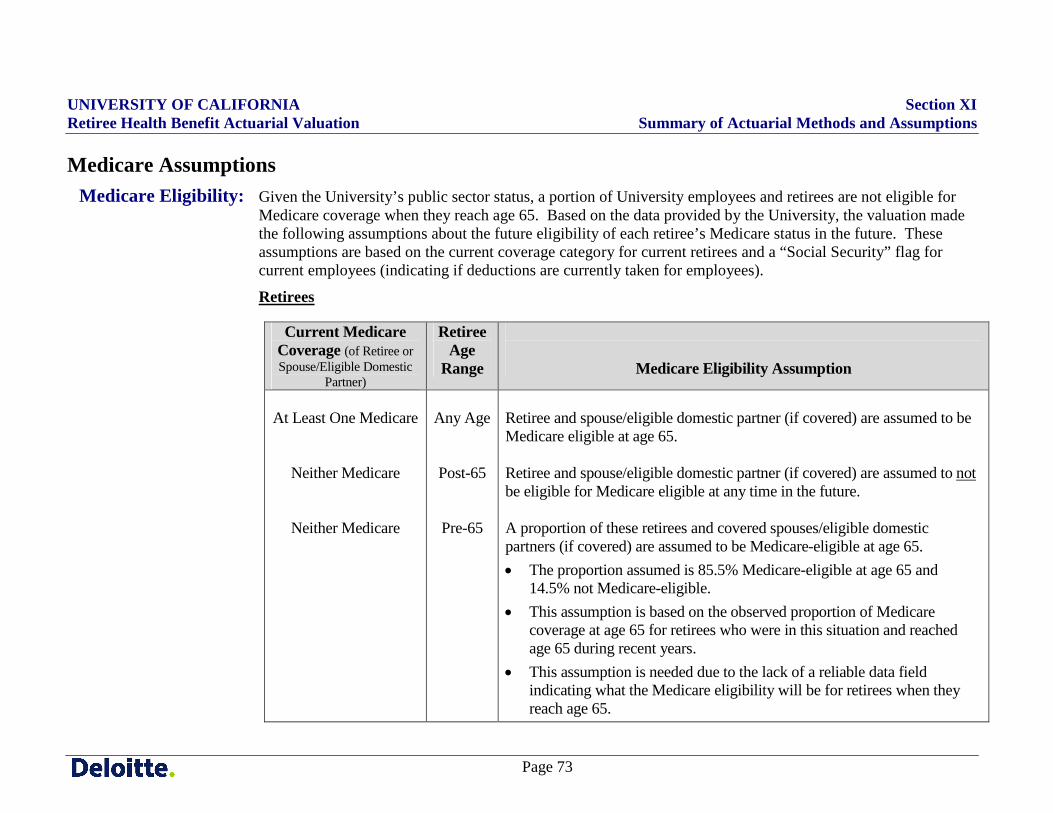
UNIVERSITY OF CALIFORNIA Section XI Retiree Health Benefit Actuarial Valuation Summary of Actuarial Methods and Assumptions
Page 73
Medicare Assumptions
Medicare Eligibility: Given the University’s public sector status, a portion of University employees and retirees are not eligible for Medicare coverage when they reach age 65. Based on the data provided by the University, the valuation made the following assumptions about the future eligibility of each retiree’s Medicare status in the future. These assumptions are based on the current coverage category for current retirees and a “Social Security” flag for current employees (indicating if deductions are currently taken for employees).
Retirees
Current Medicare Coverage (of Retiree or Spouse/Eligible Domestic
Partner)
Retiree Age
Range
Medicare Eligibility Assumption
At Least One Medicare
Neither Medicare
Neither Medicare
Any Age
Post-65
Pre-65
Retiree and spouse/eligible domestic partner (if covered) are assumed to be Medicare eligible at age 65. Retiree and spouse/eligible domestic partner (if covered) are assumed to not be eligible for Medicare eligible at any time in the future. A proportion of these retirees and covered spouses/eligible domestic partners (if covered) are assumed to be Medicare-eligible at age 65. • The proportion assumed is 85.5% Medicare-eligible at age 65 and
14.5% not Medicare-eligible. • This assumption is based on the observed proportion of Medicare
coverage at age 65 for retirees who were in this situation and reached age 65 during recent years.
• This assumption is needed due to the lack of a reliable data field indicating what the Medicare eligibility will be for retirees when they reach age 65.
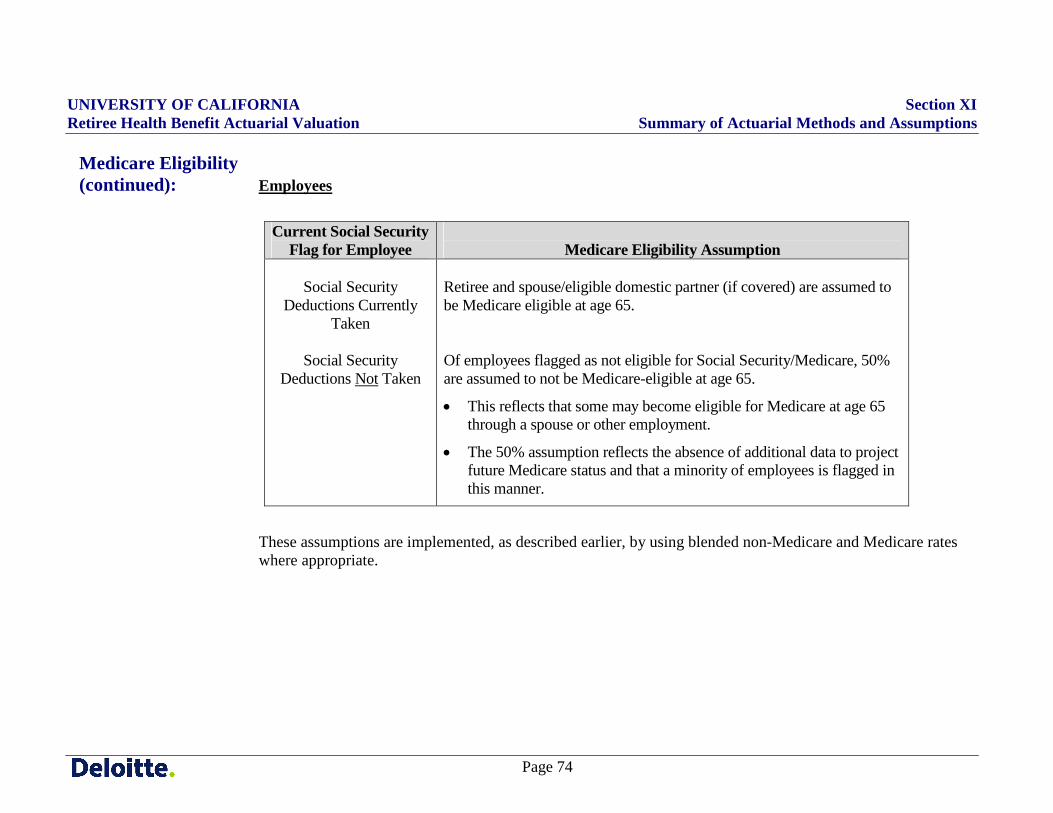
UNIVERSITY OF CALIFORNIA Section XI Retiree Health Benefit Actuarial Valuation Summary of Actuarial Methods and Assumptions
Page 74
Medicare Eligibility (continued): Employees
Current Social Security Flag for Employee
Medicare Eligibility Assumption
Social Security
Deductions Currently Taken
Social Security
Deductions Not Taken
Retiree and spouse/eligible domestic partner (if covered) are assumed to be Medicare eligible at age 65. Of employees flagged as not eligible for Social Security/Medicare, 50% are assumed to not be Medicare-eligible at age 65.
• This reflects that some may become eligible for Medicare at age 65 through a spouse or other employment.
• The 50% assumption reflects the absence of additional data to project future Medicare status and that a minority of employees is flagged in this manner.
These assumptions are implemented, as described earlier, by using blended non-Medicare and Medicare rates where appropriate.
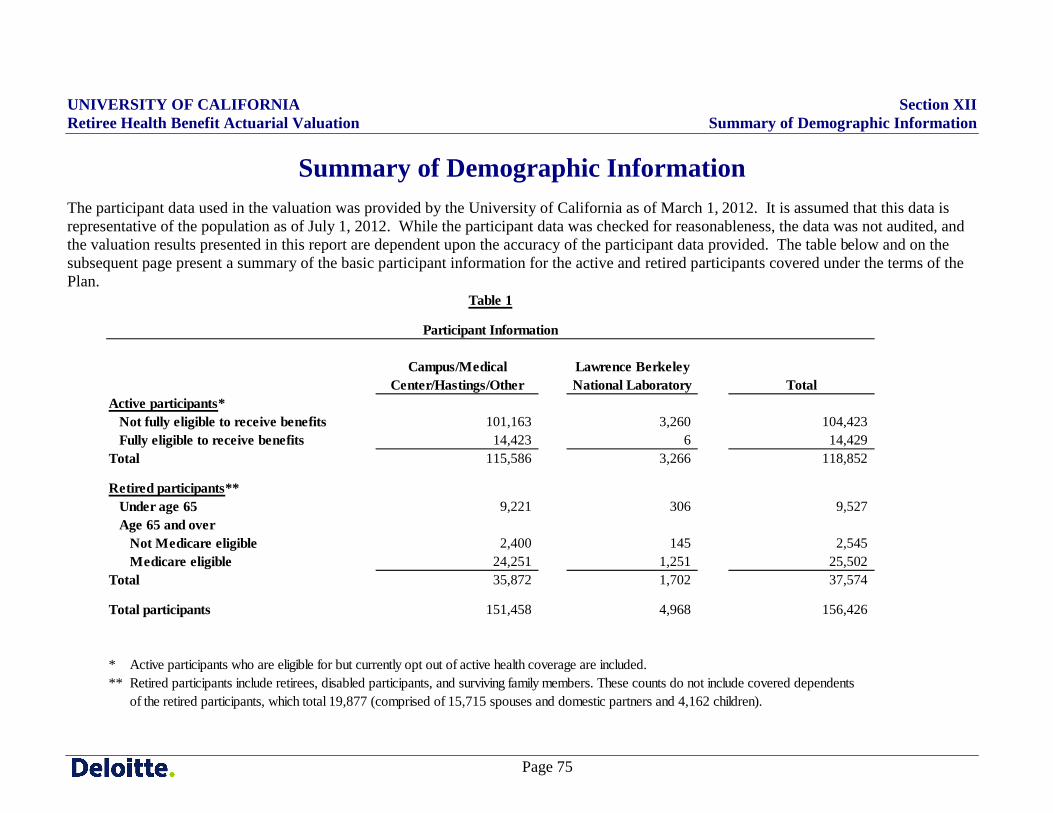
UNIVERSITY OF CALIFORNIA Section XII Retiree Health Benefit Actuarial Valuation Summary of Demographic Information
Page 75
Summary of Demographic Information The participant data used in the valuation was provided by the University of California as of March 1, 2012. It is assumed that this data is representative of the population as of July 1, 2012. While the participant data was checked for reasonableness, the data was not audited, and the valuation results presented in this report are dependent upon the accuracy of the participant data provided. The table below and on the subsequent page present a summary of the basic participant information for the active and retired participants covered under the terms of the Plan.
Campus/Medical Center/Hastings/Other
Lawrence Berkeley National Laboratory Total
Active participants*Not fully eligible to receive benefits 101,163 3,260 104,423Fully eligible to receive benefits 14,423 6 14,429
Total 115,586 3,266 118,852
Retired participants**Under age 65 9,221 306 9,527Age 65 and over
Not Medicare eligible 2,400 145 2,545Medicare eligible 24,251 1,251 25,502
Total 35,872 1,702 37,574
Total participants 151,458 4,968 156,426
* Active participants who are eligible for but currently opt out of active health coverage are included.** Retired participants include retirees, disabled participants, and surviving family members. These counts do not include covered dependents of the retired participants, which total 19,877 (comprised of 15,715 spouses and domestic partners and 4,162 children).
Participant Information
Table 1
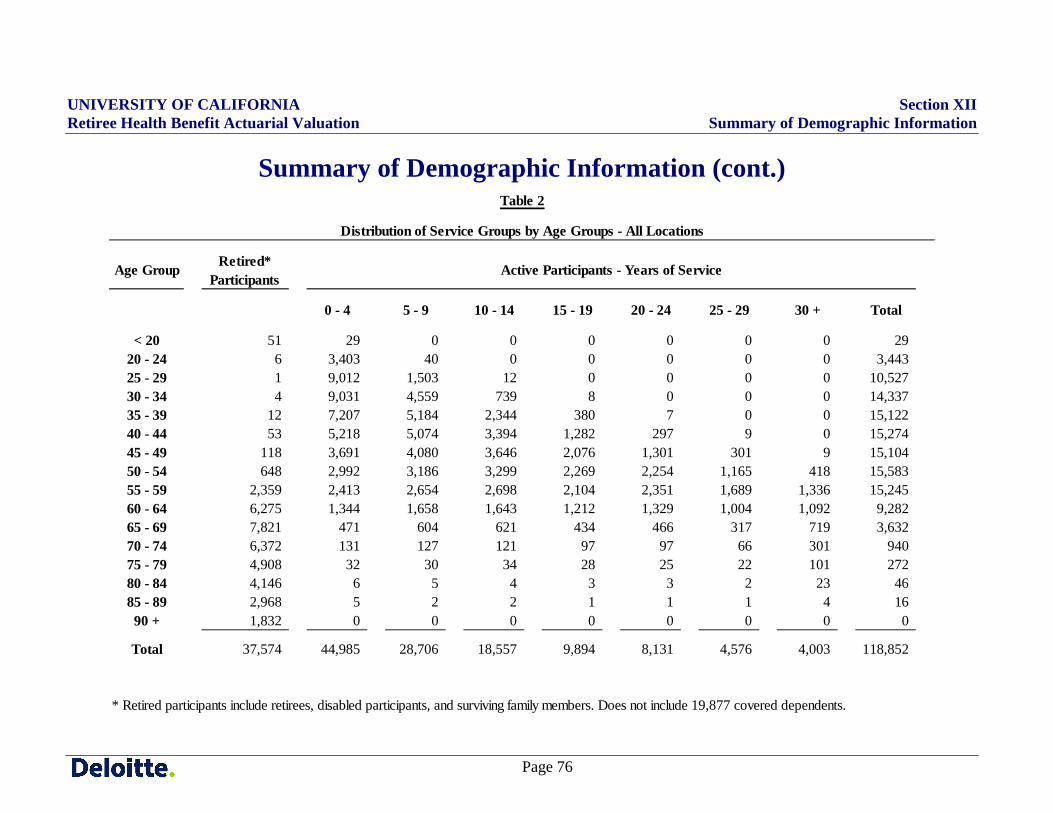
UNIVERSITY OF CALIFORNIA Section XII Retiree Health Benefit Actuarial Valuation Summary of Demographic Information
Page 76
Summary of Demographic Information (cont.)
0 - 4 5 - 9 10 - 14 15 - 19 20 - 24 25 - 29 30 + Total
< 20 51 29 0 0 0 0 0 0 2920 - 24 6 3,403 40 0 0 0 0 0 3,44325 - 29 1 9,012 1,503 12 0 0 0 0 10,52730 - 34 4 9,031 4,559 739 8 0 0 0 14,33735 - 39 12 7,207 5,184 2,344 380 7 0 0 15,12240 - 44 53 5,218 5,074 3,394 1,282 297 9 0 15,27445 - 49 118 3,691 4,080 3,646 2,076 1,301 301 9 15,10450 - 54 648 2,992 3,186 3,299 2,269 2,254 1,165 418 15,58355 - 59 2,359 2,413 2,654 2,698 2,104 2,351 1,689 1,336 15,24560 - 64 6,275 1,344 1,658 1,643 1,212 1,329 1,004 1,092 9,28265 - 69 7,821 471 604 621 434 466 317 719 3,63270 - 74 6,372 131 127 121 97 97 66 301 94075 - 79 4,908 32 30 34 28 25 22 101 27280 - 84 4,146 6 5 4 3 3 2 23 4685 - 89 2,968 5 2 2 1 1 1 4 1690 + 1,832 0 0 0 0 0 0 0 0
Total 37,574 44,985 28,706 18,557 9,894 8,131 4,576 4,003 118,852
* Retired participants include retirees, disabled participants, and surviving family members. Does not include 19,877 covered dependents.
Age Group Retired*Participants
Active Participants - Years of Service
Table 2
Distribution of Service Groups by Age Groups - All Locations
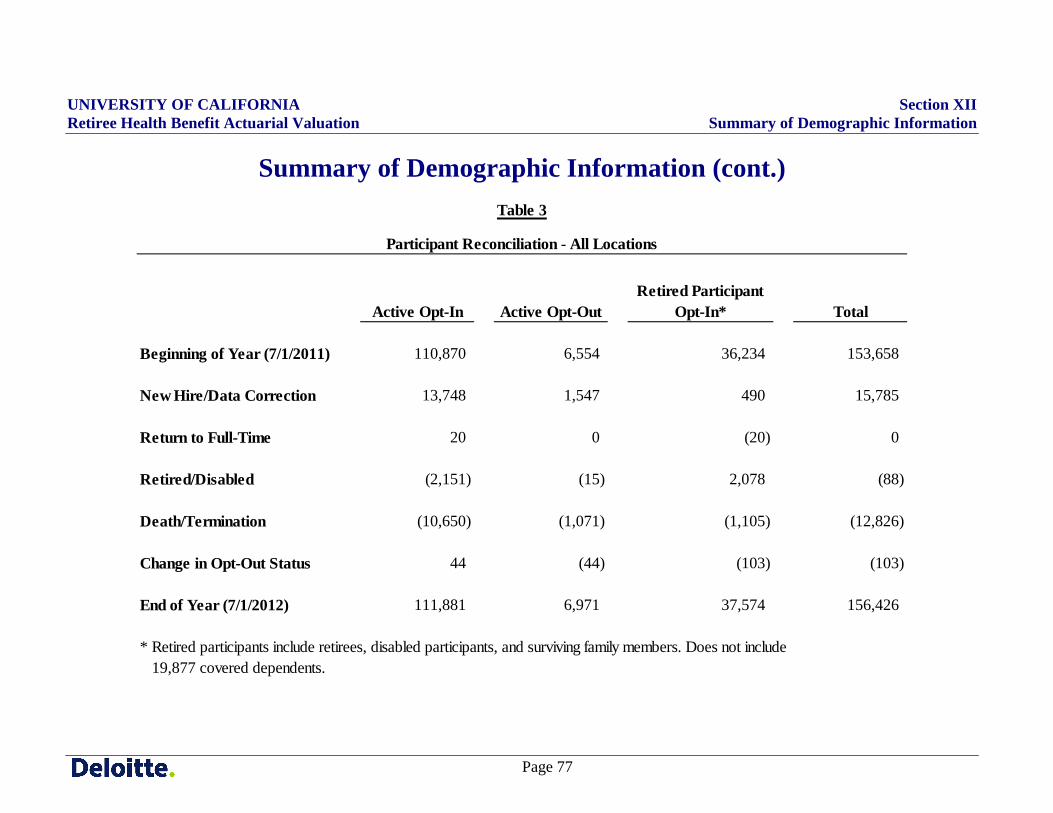
UNIVERSITY OF CALIFORNIA Section XII Retiree Health Benefit Actuarial Valuation Summary of Demographic Information
Page 77
Summary of Demographic Information (cont.)
Active Opt-In Active Opt-OutRetired Participant
Opt-In* Total
Beginning of Year (7/1/2011) 110,870 6,554 36,234 153,658
New Hire/Data Correction 13,748 1,547 490 15,785
Return to Full-Time 20 0 (20) 0
Retired/Disabled (2,151) (15) 2,078 (88)
Death/Termination (10,650) (1,071) (1,105) (12,826)
Change in Opt-Out Status 44 (44) (103) (103)
End of Year (7/1/2012) 111,881 6,971 37,574 156,426
* Retired participants include retirees, disabled participants, and surviving family members. Does not include 19,877 covered dependents.
Table 3
Participant Reconciliation - All Locations
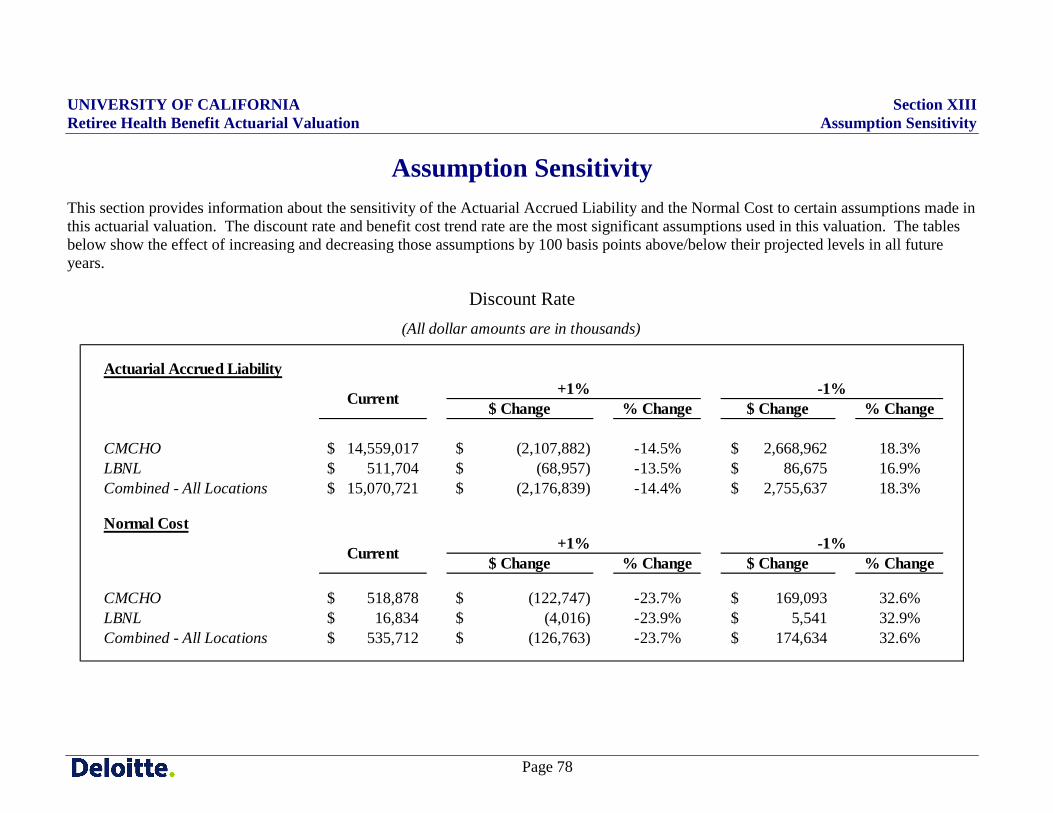
UNIVERSITY OF CALIFORNIA Section XIII Retiree Health Benefit Actuarial Valuation Assumption Sensitivity
Page 78
Assumption Sensitivity This section provides information about the sensitivity of the Actuarial Accrued Liability and the Normal Cost to certain assumptions made in this actuarial valuation. The discount rate and benefit cost trend rate are the most significant assumptions used in this valuation. The tables below show the effect of increasing and decreasing those assumptions by 100 basis points above/below their projected levels in all future years.
Discount Rate
Actuarial Accrued Liability
$ Change % Change $ Change % Change
CMCHO 14,559,017$ (2,107,882)$ -14.5% 2,668,962$ 18.3%LBNL 511,704$ (68,957)$ -13.5% 86,675$ 16.9%Combined - All Locations 15,070,721$ (2,176,839)$ -14.4% 2,755,637$ 18.3%
Normal Cost
$ Change % Change $ Change % Change
CMCHO 518,878$ (122,747)$ -23.7% 169,093$ 32.6%LBNL 16,834$ (4,016)$ -23.9% 5,541$ 32.9%Combined - All Locations 535,712$ (126,763)$ -23.7% 174,634$ 32.6%
Current +1%
(All dollar amounts are in thousands)
Current +1% -1%
-1%
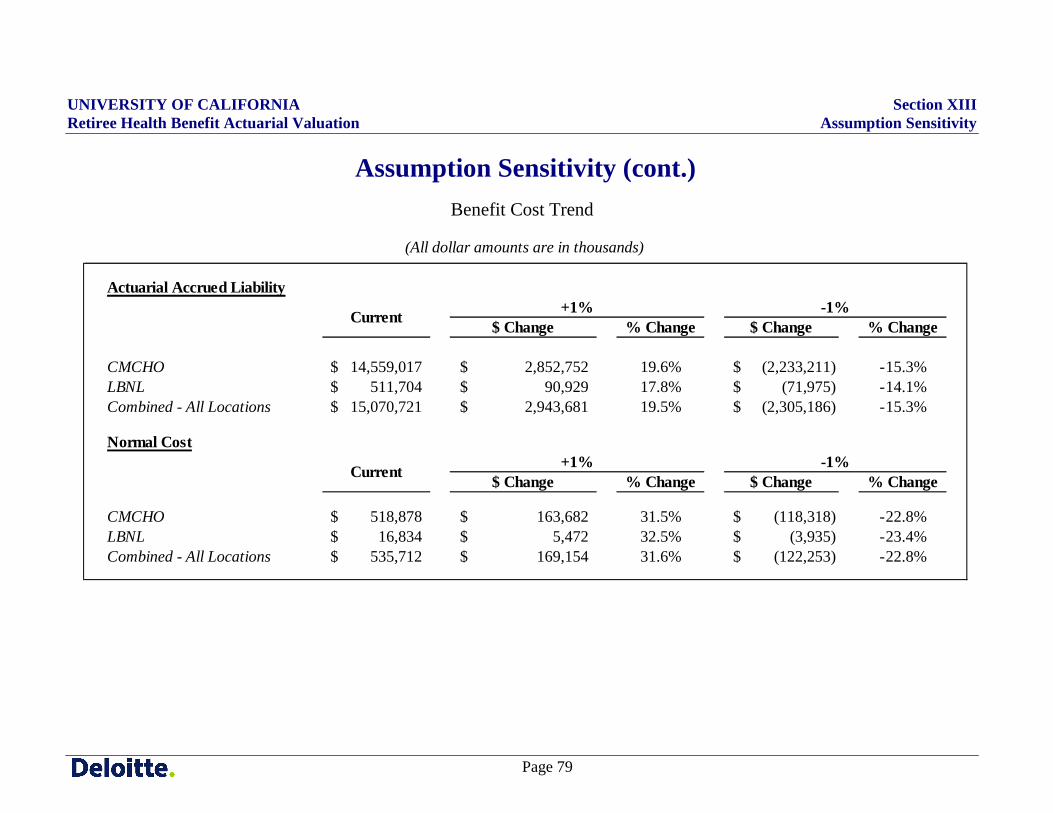
UNIVERSITY OF CALIFORNIA Section XIII Retiree Health Benefit Actuarial Valuation Assumption Sensitivity
Page 79
Assumption Sensitivity (cont.) Benefit Cost Trend
Actuarial Accrued Liability
$ Change % Change $ Change % Change
CMCHO 14,559,017$ 2,852,752$ 19.6% (2,233,211)$ -15.3%LBNL 511,704$ 90,929$ 17.8% (71,975)$ -14.1%Combined - All Locations 15,070,721$ 2,943,681$ 19.5% (2,305,186)$ -15.3%
Normal Cost
$ Change % Change $ Change % Change
CMCHO 518,878$ 163,682$ 31.5% (118,318)$ -22.8%LBNL 16,834$ 5,472$ 32.5% (3,935)$ -23.4%Combined - All Locations 535,712$ 169,154$ 31.6% (122,253)$ -22.8%
(All dollar amounts are in thousands)
Current -1%+1%
Current -1%+1%
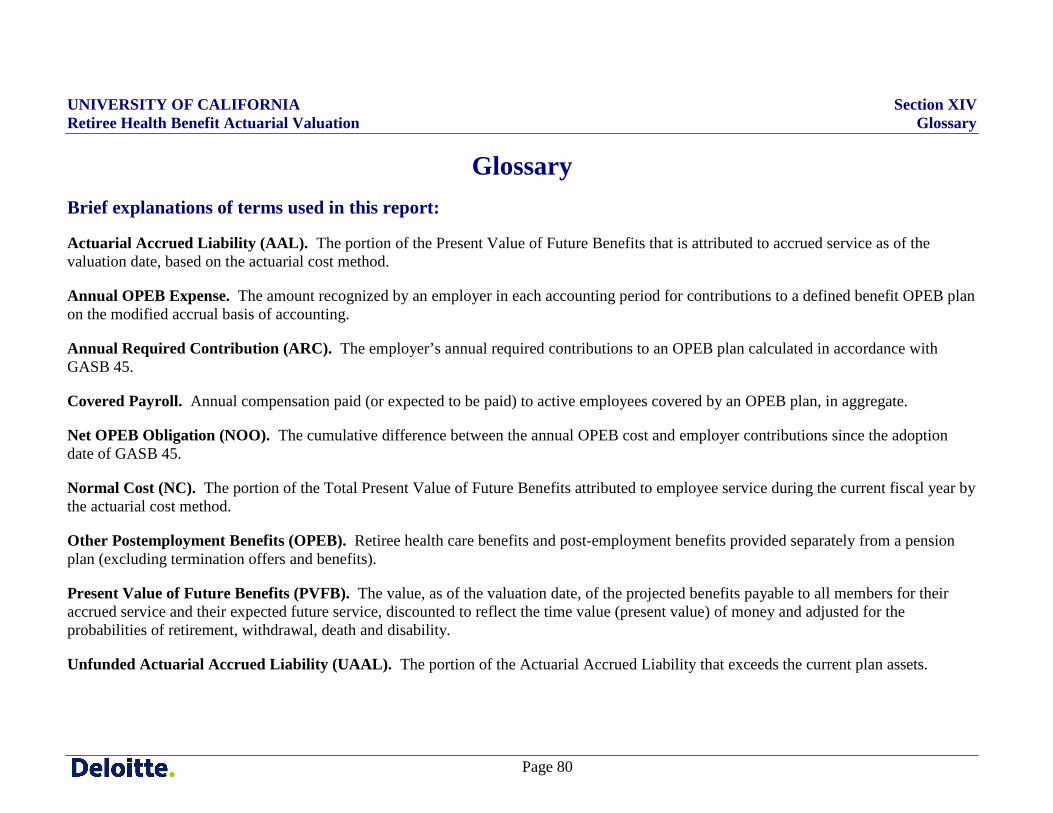
UNIVERSITY OF CALIFORNIA Section XIV Retiree Health Benefit Actuarial Valuation Glossary
Page 80
Glossary Brief explanations of terms used in this report:
Actuarial Accrued Liability (AAL). The portion of the Present Value of Future Benefits that is attributed to accrued service as of the valuation date, based on the actuarial cost method.
Annual OPEB Expense. The amount recognized by an employer in each accounting period for contributions to a defined benefit OPEB plan on the modified accrual basis of accounting.
Annual Required Contribution (ARC). The employer’s annual required contributions to an OPEB plan calculated in accordance with GASB 45.
Covered Payroll. Annual compensation paid (or expected to be paid) to active employees covered by an OPEB plan, in aggregate.
Net OPEB Obligation (NOO). The cumulative difference between the annual OPEB cost and employer contributions since the adoption date of GASB 45.
Normal Cost (NC). The portion of the Total Present Value of Future Benefits attributed to employee service during the current fiscal year by the actuarial cost method.
Other Postemployment Benefits (OPEB). Retiree health care benefits and post-employment benefits provided separately from a pension plan (excluding termination offers and benefits).
Present Value of Future Benefits (PVFB). The value, as of the valuation date, of the projected benefits payable to all members for their accrued service and their expected future service, discounted to reflect the time value (present value) of money and adjusted for the probabilities of retirement, withdrawal, death and disability.
Unfunded Actuarial Accrued Liability (UAAL). The portion of the Actuarial Accrued Liability that exceeds the current plan assets.

Copyright © 2008 Deloitte Development LLC. All rights reserved.