university of dundee doctor of philosophy alternative
TRANSCRIPT

University of Dundee
DOCTOR OF PHILOSOPHY
Alternative splicing in the regulation of the barley circadian clock
Calixto, Cristiane P. G.
Award date:2013
Link to publication
General rightsCopyright and moral rights for the publications made accessible in the public portal are retained by the authors and/or other copyright ownersand it is a condition of accessing publications that users recognise and abide by the legal requirements associated with these rights.
• Users may download and print one copy of any publication from the public portal for the purpose of private study or research. • You may not further distribute the material or use it for any profit-making activity or commercial gain • You may freely distribute the URL identifying the publication in the public portal
Take down policyIf you believe that this document breaches copyright please contact us providing details, and we will remove access to the work immediatelyand investigate your claim.
Download date: 14. Dec. 2021

DOCTOR OF PHILOSOPHY
Alternative splicing in the regulation of thebarley circadian clock
Cristiane P. G. Calixto
2013
University of Dundee
Conditions for Use and DuplicationCopyright of this work belongs to the author unless otherwise identified in the body of the thesis. It is permittedto use and duplicate this work only for personal and non-commercial research, study or criticism/review. Youmust obtain prior written consent from the author for any other use. Any quotation from this thesis must beacknowledged using the normal academic conventions. It is not permitted to supply the whole or part of thisthesis to any other person or to post the same on any website or other online location without the prior writtenconsent of the author. Contact the Discovery team ([email protected]) with any queries about the useor acknowledgement of this work.

Alternative splicing in the regulation
of the barley circadian clock
Cristiane P. G. Calixto BSc, MSc
A thesis submitted for the degree of Doctor of Philosophy in the College of Life Sciences in The University of Dundee
January 2014

ii
Table of contents
Acknowledgements ....................................................................................................... vi
Declaration ................................................................................................................. viii
Abstract ........................................................................................................................ ix
List of abbreviations ...................................................................................................... xi
List of Figures ............................................................................................................. xiii
List of Tables ............................................................................................................... xv
Title Page
Chapter 1. Introduction and review of literature ....................................................... 1 1.1 – Eukaryotic gene expression ................................................................................. 1
1.1.1 - Epigenetic regulation of expression ................................................................ 1 1.1.2 - Transcription ................................................................................................ 3 1.1.3 – Precursor messenger RNA (pre-mRNA) processing ....................................... 5 1.1.4 - Nuclear export .............................................................................................. 7 1.1.5 – Translation .................................................................................................. 8 1.1.6 – mRNA turnover/degradation ....................................................................... 9 1.1.7 – Protein modification ................................................................................... 10
1.2 – Pre-mRNA splicing ........................................................................................... 10 1.2.1 - Components of the spliceosome machinery ................................................... 12 1.2.2 – Basic cis-acting elements .............................................................................. 12 1.2.3 – Splicing cycle .............................................................................................. 14
1.3 – Alternative pre-mRNA splicing .......................................................................... 16 1.3.1 – Types of AS events ...................................................................................... 17 1.3.2 – Additional cis-acting elements: splicing enhancers and silencers .................... 19 1.3.3 – Additional trans-acting elements: regulatory proteins .................................... 21 1.3.4 – Epigenetic and transcriptional control of alternative splicing ......................... 23 1.3.5 – The splicing code ........................................................................................ 25 1.3.6 – The evolution of alternative splicing............................................................. 25
1.4 – Functions and roles of alternative splicing .......................................................... 27 1.4.1 – Function of AS: increased proteome diversity ............................................... 27 1.4.2 – Function of AS: regulation of mRNA and protein levels ............................... 30 1.4.3 – Alternative splicing in diseases..................................................................... 33 1.4.4 – Alternative splicing in developmental control ............................................... 36
1.5 – Alternative splicing in plants .............................................................................. 37 1.5.1 - Characteristics of AS in plants compared to animals ...................................... 37 1.5.2 - Function of AS in plants .............................................................................. 39
1.6 – The circadian clock ........................................................................................... 43 1.6.1 – Evolution of the circadian clock ................................................................... 44 1.6.2 – The cyanobacterial clock ............................................................................. 46 1.6.3 – The Neurospora crassa clock .......................................................................... 46 1.6.4 – The Drosophila melanogaster clock ................................................................. 48 1.6.5 – The mammalian clock ................................................................................. 50
1.7 – The plant (Arabidopsis) clock ............................................................................ 52 1.7.1 - The framework of the Arabidopsis clock ....................................................... 52 1.7.2 – Plant clock entrainment ............................................................................... 55

iii
1.8 – Cross-talk between AS and the Arabidopsis clock ............................................... 57 1.8.1 – Clock control over AS ................................................................................. 57 1.8.2 – AS regulation of clock genes ........................................................................ 58 1.8.3 – Regulators of clock AS ................................................................................ 59
1.9 – Knowledge translation: from Arabidopsis to barley ............................................. 61 1.9.1 – Barley (Hordeum vulgare L.) .......................................................................... 62
1.9.1.1 – Barley genetics and AS ......................................................................... 62 1.9.1.2 – Barley clock genes and flowering ........................................................... 63
1.10 – Objective and aims of this work ....................................................................... 64 Chapter 2. General materials and methods ............................................................... 66
2.1 – Plant growth conditions ..................................................................................... 66 2.1.1 – Plant material ............................................................................................. 66 2.1.2 – Growth cabinet: environment and treatment ................................................ 67
2.2 – RNA extraction ................................................................................................ 67 2.2.1 – RNA clean-up using phenol extraction ......................................................... 68 2.2.2 – Additional DNase treatment ........................................................................ 69
2.3 – DNA preparation .............................................................................................. 69 2.3.1 – Complementary DNA (cDNA) synthesis ..................................................... 69 2.3.2 – Genomic DNA (gDNA) preparation ........................................................... 69
2.4 – Polymerase Chain Reaction (PCR) .................................................................... 70 2.4.1 – Primer design.............................................................................................. 70 2.4.2 – Primers used in expression and alternative splicing analysis .......................... 70 2.4.3 – High Resolution (HR) RT-PCR ................................................................... 71
Chapter 3. In silico identification of barley orthologues of Arabidopsis genes involved in the circadian clock ................................................................................................... 74
3.1 – Introduction ...................................................................................................... 74 3.1.1 – Gene discovery ........................................................................................... 74 3.1.2 – Comparative studies .................................................................................... 75 3.1.3 – A sequence-enriched barley genomic framework .......................................... 76
3.2 – Materials and methods ...................................................................................... 77 3.2.1 – Cross-species reciprocal BLAST .................................................................. 77 3.2.2 – Miscellaneous bioinformatic analyses .......................................................... 80 3.2.3 – Phylogenetic analysis .................................................................................. 80
3.3 – Results .............................................................................................................. 81 3.3.1 – BLAST searches for core clock and clock-associated genes ............................ 82 3.3.2 – Definition of genomic structure of clock genes .............................................. 89 3.3.3 – Phylogeny of clock genes ............................................................................. 91 3.3.4 – Reference genes ........................................................................................ 102
3.4 – Discussion ...................................................................................................... 103 3.4.1 – In silico identification of clock homologues ................................................. 103 3.4.2 – Barley core clock and clock-associated genes .............................................. 106 3.4.3 – Dicot-specific clock genes .......................................................................... 110
3.4.3.1 – ELF4 .................................................................................................. 110 3.4.3.2 – CAB2 .................................................................................................. 111 3.4.3.3 – CHE ................................................................................................... 112 3.4.3.4 – CCA1 ................................................................................................. 112
3.4.4 – Reference genes ........................................................................................ 113 Chapter 4. Functional and expression analyses of putative barley clock genes ........ 115
4.1 – Introduction .................................................................................................... 115 4.1.1 – Timing of flowering .................................................................................. 115 4.1.2 – Photoperiod pathway ................................................................................ 116 4.1.3 – Barley clock mutants ................................................................................. 119
4.2 – Material and methods ...................................................................................... 121 4.2.1 – Plant growth conditions ............................................................................ 121 4.2.2 – Phenotyping ............................................................................................. 122 4.2.3 – Plant material for light/dark and free-running conditions (constant light) .... 123

iv
4.2.4 – Statistical tests on gene expression data ...................................................... 124 4.3 – Results ............................................................................................................ 125
4.3.1 – Phenotype of barley clock mutants ............................................................. 127 4.3.2 – Expression analysis of barley circadian clock genes ..................................... 131
4.3.2.1 – Flowering activators CO and FT .......................................................... 143 4.4 – Discussion ...................................................................................................... 145
4.4.1 – Growth conditions and clock experiments .................................................. 145 4.4.2 – Morphological effects of mutations on barley genes PPDH1 and ELF3 ......... 146 4.4.3 – Expression of barley clock genes ................................................................ 149
4.4.3.1 – LHY ................................................................................................... 152 4.4.3.2 – CAB ................................................................................................... 154 4.4.3.3 – FKF1 .................................................................................................. 154 4.4.3.4 – ELF4-like ............................................................................................ 155 4.4.3.5 – LUX ................................................................................................... 155 4.4.3.6 – ZTL ................................................................................................... 156 4.4.3.7 – TOC1 ................................................................................................. 156 4.4.3.8 – PPDH1 and PRR73.............................................................................. 156 4.4.3.9 – PRR59 and PRR95 .............................................................................. 157
4.4.4 – Photoperiodic flowering in barley .............................................................. 158 4.4.4.1 – ELF3 .................................................................................................. 158 4.4.4.2 – GI ...................................................................................................... 159 4.4.4.3 – CO ..................................................................................................... 160 4.4.4.4 – FT...................................................................................................... 162
Chapter 5. Alternative splicing regulation of barley clock-related genes ................. 164 5.1 – Introduction .................................................................................................... 164
5.1.1 – Temperature effects on plants .................................................................... 164 5.1.2 – Clock temperature entrainment and compensation ..................................... 166
5.2 – Material and methods ...................................................................................... 168 5.2.1 – AS discovery in barley clock genes ............................................................. 168
5.2.1.1 – Search for AS in transcript databases ................................................... 168 5.2.1.2 – RT-PCR and cloning of AS transcripts ................................................. 169
5.2.2 – Analyses of AS in regulating mRNA expression of clock genes in response to temperature changes ............................................................................................ 170
5.3 – Results ............................................................................................................ 172 5.3.1 – Identification of AS isoforms of barley clock genes ..................................... 172 5.3.2 – Arabidopsis vs. barley AS in plant core clock genes .................................... 189
5.3.2.1 – LHY and CCA1 ................................................................................... 189 5.3.2.2 – GI ...................................................................................................... 190 5.3.2.3 – TOC1 ................................................................................................. 190 5.3.2.4 – PRR5(9)/PRR9(5) ................................................................................ 191 5.3.2.5 – PRR3(7)/PRR7(3) ................................................................................ 192
5.3.3 – Effect of low temperature on expression and AS of barley clock genes ......... 193 5.3.3.1 – HvLHY ............................................................................................... 194 5.3.3.2 – HvPPDH1 (HvPRR37) .......................................................................... 203 5.3.3.3 – HvPRR73 ............................................................................................ 209
5.4 – Discussion ...................................................................................................... 211 5.4.1 – Effect of temperature regulation of the expression of clock genes ................. 211 5.4.2 – AS regulation of LHY and PPDH1 in response to temperature ..................... 213 5.4.3 – AS regulation of the barley clock ............................................................... 216
Chapter 6. General discussion and future work ...................................................... 219 6.1 – Evolution of clock genes .................................................................................. 219 6.2 – The framework of plant circadian clocks .......................................................... 223 6.3 – Why temperature-dependent alternative splicing (AS) of plant clock genes? ....... 229 6.4 – Conclusions .................................................................................................... 232 6.5 – Future work .................................................................................................... 233
Chapter 7. References ............................................................................................ 236

v Appendix A. Material and Methods ........................................................................... 256
A1 - Cereal Compost ............................................................................................... 256 A2 - Diethyl pyro carbonate (DEPC)-treated solutions .............................................. 256 A3 - Stock solutions ................................................................................................. 256
A3.1 3 M Sodium acetate (NaOAc) pH 5.5 ......................................................... 256 A3.2 1 M Tris-HCl pH 7.5 ................................................................................ 256 A3.3 5 M NaCl ................................................................................................. 256 A3.4 500 mM Ethylenediaminetetraacetic acid (EDTA) pH 8.0 ........................... 257 A3.5 10 % Sodium dodecyl sulphate (SDS) ......................................................... 257 A3.6 Tris-Borate-EDTA (TBE) Buffer (10X) ....................................................... 257
A4 - gDNA extraction buffer .................................................................................... 257 A5 - Gene-specific primers used in clock and AS analyses ......................................... 257 A6 - Glasshouse: environment and treatment ............................................................ 259 A7 - Experiments to detect novel AS events .............................................................. 259
A7.1 Growth conditions .................................................................................... 259 A7.2 PCR conditions ......................................................................................... 259
A8 - Luria-Bertani (LB) liquid broth and solid agar ................................................... 260 A9 - Ampicillin ....................................................................................................... 260 A10 - Blue-white screening ...................................................................................... 260
Appendix B. Results .................................................................................................. 261 B1 - Barley clock mutants ........................................................................................ 261 B2 - Awn length of barley clock mutants ................................................................... 261 B3 - Array design for clock experiments .................................................................... 262 B4 - Barley plants from clock experiments ................................................................ 263 B5 - Clock gene expression ...................................................................................... 264 B6 - Phase differences in clock gene expression ......................................................... 265 B7 - Temperature-dependent AS of barley clock genes ............................................... 265 B8 - Analysis of publicly available transcript data for AS discovery ............................ 269 B9 - Rhythmic AS in barley clock genes .................................................................... 270 B10 - Genomic structure and AS events of core clock homologues in Arabidopsis and barley ..................................................................................................................... 271 B11 - AS analyses of HvPPDH1 ................................................................................ 276 B12 - AS analyses of HvPRR73 ................................................................................. 278

vi
Acknowledgements
Firstly, I would like to thank my supervisor Professor John Brown for accepting
me in his lab and for his prime guidance and support throughout my PhD. Secondly, I
wish to greatly acknowledge the University of Dundee, the James Hutton Institute
(JHI, Dundee) and the Coordenação de Aperfeiçoamento de Pessoal de Nível Superior
(CAPES, Brazil) for the financial support and facilities to carry out my PhD.
I would also like to thank all of those within the JHI involved in this project,
who gave me valuable guidance, support and advice. A special thanks to Professor
Robbie Waugh and Dr Arnis Druka for providing the barley Bowman NILs; Dr
Helena Oakey and Jim McNicol (BioSS, Dundee) for guidance on statistical analyses;
Dr Gordon Simpson and Dr Edgar Huitema for support as members of my thesis
committee; Dr David Marshall, Dr Frank Wright (BioSS, Dundee) and Professor Todd
Barkman (Western Michigan University) for guidance on phylogenetic analysis; Dr
Craig Simpson, Gillian Clark, Dominika, Nikoleta and other lab members (current and
past) for their guidance, patience and technical support; Dr Christopher McClellan, Dr
Clément Gravouil (SRUC, Edinburgh) and Philip Smith for helping with the proof-
reading of this PhD thesis; Professor Maria Helena Goldman for her support as my
CAPES tutor; and Dr Allan James and Gillian Nimmo (both from the University of
Glasgow) for their advice on clock gene experiments.
The acknowledgement list would not be complete without the friends I made
during my time here. Friends from all over the world, from different cultures and for all
kinds of fun. We laughed together, worked together, climbed, and travelled to discover
the world outside Dundee together. Thank you Alper, Benjamin (and his parents),
Christopher, Eleni, Emily, Jaleh, Karolina, Matthieu, Monika, Nish, Orsi, Pedro,

vii Ross, Sabine, Samir, Sandra, Vinciane and many more... for making my time here
easier, happier, more interesting and unforgettable!
Finally, many thanks to my family, for understanding and coping with the
distance, for their positive encouragements and for always believing in me. Last but
definitely not least, thanks mon ange Clément for always standing by me and for all the
enjoyable moments we have together.
My PhD would not have been possible without the support from all of you, so
obrigada!

viii
Declaration
I am the author of this PhD thesis and the results presented here are of
investigations conducted by myself. Work other than my own have been consulted by
me and is clearly identified with references to relevant researchers and their
publications. I hereby declare that the work presented here is my own and has not been
submitted in any form of any degree at this or other university.
Cristiane P. G. Calixto
I certify that Cristiane P. G. Calixto has fulfilled the conditions of the relevant
Ordinance and Regulations of the University Court and is qualified to submit this
thesis for the degree of Doctor of Philosophy.
Professor John W. S. Brown
College of Life Sciences
University of Dundee

ix
Abstract
In the first year and a half of my PhD (October 2009 to March 2011) I studied
the putative involvement of orphan snoRNAs in the regulation of alternative splicing
(AS) in Arabidopsis. This project was very attractive but ran into serious and
unforeseen problems with the genetic background of mutants used in the project.
Despite deciding to terminate the project, it gave me more experience of molecular
techniques and analysing RNA and expression. The novel work on AS in Arabidopsis
clock genes coincided with availability of the barley genome sequence and the rest of
my PhD was spent in examining AS in the circadian clock of barley.
Prior to this thesis, extensive alternative splicing (AS) was shown to regulate
clock genes in Arabidopsis through dynamic changes in AS transcripts, some of which
are temperature-dependent and altered levels of productive mRNAs through alternative
splicing/Nonsense-Mediated Decay (AS/NMD). An objective of this thesis was to
determine whether clock genes and their modes of regulation are conserved in other
higher plants, such as barley. By use of a robust in silico analysis and nucleotide
sequence of 27 Arabidopsis core clock/clock-associated genes, 21 barley genes were
identified, 60% of which are true Arabidopsis orthologues. Most of the barley clock
genes have a clear daily rhythm which is maintained in constant light conditions.
Mutations of the barley clock genes HvPPDH1 (orthologue of AtPRR7) and HvELF3
strongly affect flowering time and have extended the geographic range where barley is
grown. We show that both mutations affect expression of clock genes: the Hvppdh1
mutation moderately affects expression levels and phase while the Hvelf3 mutation
causes arrhythmicity of most of these genes, which helps to explain the early flowering
phenotype. Temperature-dependent AS was identified in some of the barley core clock
orthologues. The focus of this part of the analysis was HvLHY and HvPPDH1. Although

x specific AS events were poorly conserved, similar behaviour in terms of decreased
functional mRNA was observed. This novel layer of fine clock control observed in two
different species, a model plant and a crop species, might help our understanding of
plant adaptation in different environments and ultimately may offer a new range of
targets for plant improvement.

xi
List of abbreviations
ABI Applied Biosystems Incorporated (now Life Technologies) Alt 3’ ss alternative 3’ (acceptor) splice site Alt 5’ ss alternative 5’ (donor) splice site ANOVA Analysis of Variance AS alternative splicing BEP Bambusoideae, Pooideae and Ehrhartoideae subfamilies BLAST Basic Local Alignment Search Tool bp base pair BP Branch point adenosine cDNA complementary Deoxyribonucleic Acid CDS coding sequence CrIn cryptic intron CTD RNA pol II carboxyl terminal domain DNA Deoxyribonucleic Acid dNTP Deoxyribonucleotide triphosphates DTT Dithiothreitol eIF eukaryotic Initiation Factor EJC Exon Junction Complex ER Endoplasmic Reticulum eRF eukaryotic release factor ESE exonic splicing enhancer ESS exonic splicing silencer EST Expressed Sequence Tag FAM 6-carboxyfluorescein FS fully spliced g gravitational force Gb gigabases gDNA genomic Deoxyribonucleic Acid GS growth stage GTF general transcription factor HKG housekeeping gene hnRNP heterogeneous nuclear ribonucleoprotein HR High Resolution IPTG isopropyl β-D-1-thiogalactopyranoside IR intron retention ISE intronic splicing enhancer ISS intronic splicing silencer LB Luria-Bertani LD long day LT low-temperature miRNA micro Ribonucleic Acid mRNA messenger Ribonucleic Acid mRNP complex of mRNA and ribonucleoprotein particles Mya million years ago ncRNA non-coding Ribonucleic Acid NIL near isogenic line NJ neighbour-joining NMD Nonsense-Mediated Decay

xii nt nucleotide ORF open reading frame PCR Polymerase Chain Reaction PG pseudogene PIC Pre-initiation complex pre-mRNA precursor messenger Ribonucleic Acid PTC premature termination codon PTM co- and post-translational modification PUT PlantGDB-assembled Unique Transcript qPCR quantitative PCR RBP RNA-binding proteins RFU Relative Fluorescent Unit RNA pol RNA polymerase RNA Ribonucleic Acid RNAi Ribonucleic Acid interference RNase ribonuclease RNA-seq RNA-sequence RRM RNA Recognition Motif rRNA ribosomal Ribonucleic Acid RT Reverse Transcription SCN suprachiasmatic nucleus SD short day SDW sterile distilled water SEM Standard Error of the Mean snoRNA small nucleolar Ribonucleic Acid SNP Single Nucleotide Polymorphism snRNA small nuclear Ribonucleic Acid ss splice site TBE Tris-Borate-EDTA tRNA transfer Ribonucleic Acid uAUG upstream translation initiation codon uORF upstream open reading frame UTR untranslated region WT wild-type X-gal 5-bromo-4-chloro-3-indolyl-β-D-galactopyranoside

xiii
List of Figures
Figure 1.1: Schematic representation of the cis-acting splicing elements and the two-step
mechanism of pre-mRNA splicing. .............................................................. 13 Figure 1.2: The splicing cycle. ....................................................................................... 16 Figure 1.3: Types of alternative splicing events.. ............................................................. 19 Figure 1.4: Simplified schematic diagram of some cis- and trans-acting regulatory sequences in the pre-mRNA. ....................................................................... 20 Figure 1.5: Putative clock gene expression in light/dark cycles (entraining conditions) and constant light (free-running conditions). ................................................ 44 Figure 1.6: Neurospora growth assay for clock studies. ..................................................... 47 Figure 1.7: Simplified diagrams of the D. melanogaster clock. ........................................... 49 Figure 1.8: Simplified schematic diagram of the 24-hour Arabidopsis clock.. ................... 54 Figure 3.1: Diagram of a cross-species reciprocal BLAST analysis.. ................................. 78 Figure 3.2: Cross-species reciprocal BLAST diagram of A) LHY and B) ELF4 genes.. ....... 83 Figure 3.3: Co-linear segments of Arabidopsis chromosome 2, and potato and tomato
chromosome 10, containing PRR9 and CCA1/LHY.. .................................... 90 Figure 3.4: Expected tree of life of the 10 land plant species used in this study.. ................ 92 Figure 3.5: Phylogenetic trees of LHY, CCA1, LUX, ZTL and FKF1 genes.. ...................... 94 Figure 3.6: Phylogenetic tree of PRR genes identified by cross-species reciprocal BLAST. 95 Figure 3.7: Phylogenetic trees of CO, FT, ELF3 and GI genes.. ........................................ 98 Figure 3.8: Phylogenetic trees of ELF4-related, GRP7 and GRP8 genes. ......................... 101 Figure 3.9: Phylogenetic tree of A) PP2AA2 and B) UBC21 orthologous genes. ............... 103 Figure 4.1: A hypothetical and simplified diagram of the photoperiod pathway in
Arabidopsis leaves under LD conditions.. .................................................. 118 Figure 4.2: Schematic representation of cereals at GS59 and GS11 of the Zadoks code.. . 122 Figure 4.3: Sampling regime of light/dark and constant light experiments. .................... 124 Figure 4.4: Genomic structure of Hvelf3 in the eam8.w Bowman (ppdh1) NIL. ................ 127 Figure 4.5: Phenotypes of Bowman (ppdh1), WT and Hvelf3 plants in LD.. .................... 129 Figure 4.6: Phenotype of Bowman (ppdh1), WT and Hvelf3 plants under SD conditions
(n=10). ..................................................................................................... 130 Figure 4.7: Transcript levels of HvLHY, HvCABa and HvFKF1 from WT, Bowman (ppdh1)
and Hvelf3 plants.. ..................................................................................... 135 Figure 4.8: Transcript levels of HvGI, HvTOC1 and HvELF3 from WT, Bowman (ppdh1)
and Hvelf3 plants.. ..................................................................................... 137 Figure 4.9: Transcript levels of HvPPDH1 and HvPRR73 genes from WT, Bowman (ppdh1)
and Hvelf3 plants. ...................................................................................... 140 Figure 4.10: Transcript levels of HvPRR95 and HvPRR59 genes from WT, Bowman (ppdh1)
and Hvelf3 plants. ...................................................................................... 142 Figure 4.11: Transcript levels of HvCO1, HvCO2 and HvFT1 genes from WT, Bowman
(ppdh1) and Hvelf3 plants.. ......................................................................... 144 Figure 4.12: Proposed schematic diagram of the barley circadian clock system
superimposed on the model from Arabidopsis. ........................................... 150 Figure 5.1: Sampling and temperature regime used in analyses of AS in regulating mRNA
expression of clock genes........................................................................... 171 Figure 5.2: Genomic structure and AS events of HvLHY. .............................................. 180 Figure 5.3: Genomic structure and AS events of GI barley core clock gene..................... 181 Figure 5.4: Genomic structure and AS events of HvTOC1.. ........................................... 182

xiv Figure 5.5: Genomic structure and AS event of ELF3 barley core clock gene. ................. 183 Figure 5.6: Genomic structure and AS events of CO2 barley clock output gene. .............. 184 Figure 5.7: Genomic structure and AS events of HvPRR95 and HvPRR59. ..................... 185 Figure 5.8: Genomic structure and AS events of HvPRR37 and HvPRR73 barley core clock genes.. ............................................................................................. 187 Figure 5.9: HvPRR37 (HvPPDH1) genomic structure of 5’ terminus-coding region and
focus on I1R event. ................................................................................... 188 Figure 5.10: Total LHY transcript levels in the morning (2.5 h after dawn) under six
conditions: 20 °C (Day 7), Day 1 at 4 °C, Day 2 at 4 °C, 4 °C (Day 4), Day 1 at 20 °C and 20 °C (Day 2).. ................................................................... 195 Figure 5.11: HR RT-PCR analysis of AS in the 5’ UTR of HvLHY. .............................. 197 Figure 5.12: Relative abundance of LHY FS and AS transcripts in the 5’ UTR region
containing additional uORFs, AS events I1R, I2R, I3R and alt3’ ss I1.. ....... 198 Figure 5.13: HR RT-PCR analysis of AS in the MYB-coding domain region of HvLHY.. 200 Figure 5.14: Relative abundances of LHY FS and AS transcripts. .................................. 201 Figure 5.15: Cold-dependent LHY AS E6a transcripts detected by RT-PCR using primers
located in E6 (forward) and E6a (reverse)................................................... 203 Figure 5.16: Total PPDH1 transcript levels in the morning (2.5 h after dawn) under six
conditions: 20 °C (Day 7), Day 1 at 4 °C, Day 2 at 4 °C, 4 °C (Day 4), Day 1 at 20 °C and 20 °C (Day 2).. ................................................................... 205 Figure 5.17: HvPRR37 genomic structure and in-frame transcript isoforms from exons 5, 6 and 7. ................................................................................................ 206 Figure 5.18: Relative abundances of PPDH1 FS and AS transcripts. .............................. 208 Figure 5.19: Total PRR73 transcript levels in the morning (2.5 h after dawn) under six
conditions: 20 °C (Day 7), Day 1 at 4 °C, Day 2 at 4 °C, 4 °C (Day 4), Day 1 at 20 °C and 20 °C (Day 2).. ................................................................... 210 Figure 6.1: Schematic diagram of the proposed evolutionary history of circadian clock
components of barley (yellow background), Arabidopsis (green background) and their putative common ancestor (red background). ............................... 221
Figure 6.2: Schematic diagram of the 24-hour clock in A) Arabidopsis (12 h light and 12 h dark, natural conditions) and B) barley (LDs). .................................... 227

xv
List of Tables
Table 1.1: Extent of alternative splicing in plants and animals. ........................................ 38 Table 2.1: List of barley gene-specific primers and their sequences used for expression and AS analyses. ........................................................................................... 71 Table 3.1: The database resources of 10 plant genome sequences analysed in this work. ... 79 Table 3.2: Homologues of LHY and CCA1, LUX, ELF3, and GI in different land plant
species.. ........................................................................................................ 84 Table 3.3: Homologues of the pseudo-response regulator genes TOC1, PRR5(9) and
PRR9(5), PRR7(3) and PRR3(7) in different land plant species. ......................... 85 Table 3.4: Homologues of ZTL, FKF1, GRP7 and GRP8 genes in different land plant
species. ......................................................................................................... 86 Table 3.5: Dicot-specific homologues of ELF4 and EEC in three dicotyledonous plant
species and the Arabidopsis-specific CHE and TSF. ........................................ 87 Table 3.6: Homologues of FT, ELF4-like and CO genes in different land plant species. ...... 88 Table 3.7: Orthologues and paralogues of the control genes AtPP2AA2 and AtUBC21 in
different land plant species. .......................................................................... 103 Table 4.1: Barley plants and alleles present, along with flowering phenotypes.. .............. 131 Table 4.2: Approximate expression peak or, in a few cases, trough of barley clock genes in different lines and conditions.. ................................................................. 132 Table 5.1: Information of AS events in barley LHY detected by RT-PCR experiments.. .. 175 Table 5.2: Information of AS events in barley GI, TOC1 and ELF3 detected by RT-PCR
experiments. ............................................................................................... 176 Table 5.3: Information of AS events in barley CO2, PRR59, PRR95 and PRR37 detected by RT-PCR experiments.. ............................................................................ 177 Table 5.4: Information of AS events in barley PRR37 and PRR73 detected by RT-PCR
experiments.. .............................................................................................. 178

1 Chapter 1
Chapter 1. Introduction and review of literature
1.1 – Eukaryotic gene expression
Current classification of the living world divides all organisms into two superking-
doms: eukaryotes and prokaryotes (Sapp, 2005). This division is based on profound differ-
ences between these two groups, the main example being eukaryotes having a nuclear en-
velope, which separates transcription from translation, whereas prokaryotes have no such
barrier, so transcription is coupled with translation (Philips, 2008). Interestingly, only nu-
cleated organisms can exist in complex multicellular forms, exhibiting large inter-species
differences in their morphology and behaviour (e.g. barley and humans). Such differences
are also observed within tissues of the same organism (e.g. roots and flowers), even though
the DNA sequence is the same in different tissues. The same exceptional complexity is not
found in prokaryotes. Why then, are eukaryotes more intricate than prokaryotes? First,
eukaryotes have bigger genomes with more complex sequences and organisation (Philips,
2008). Second, and most importantly, they are able to regulate gene expression in terms of
time, space, quantity and ‘quality’. Of course, regulation is not only a direct responses to
environmental change, but also to actively control the gene expression programme to pro-
vide continuous and increasing vitality. Below is a brief description of eukaryote’s rich cel-
lular portfolios of gene expression control.
1.1.1 – Epigenetic regulation of expression
The definition of ‘epigenetic’ is highly debated (Bird, 2007; Pearson, 2008). The
classical meaning defines it as “a change in the state of expression of a gene that does not

2 Chapter 1
involve a mutation, but that is nevertheless inherited in the absence of the signal or event
that initiated the change” (Pearson, 2008). In 2007, Bird suggested a much broader mean-
ing, which is hereafter adopted: “epigenetics is the structural adaptation of chromosomal
regions so as to register, signal or perpetuate altered activity states”.
One of the best studied epigenetic modifications is the methylation of a cytosine
residue, which is frequently followed by a guanine in the DNA molecule (known as CpG)
(Bird, 2002; He et al., 2011; Huidobro et al., 2013). This epigenetic mark is involved in the
regulation of several biological processes such as i) imprinting (a mechanism that controls
parent-of-origin-specific gene expression); ii) X chromosome inactivation (Feil and Berger,
2007; Law and Jacobsen, 2010); iii) silencing of transposable elements, retroviruses and
oncogenes (Stewart et al., 1982; Zhang et al., 2006; Huidobro et al., 2013); and iv) temporal
and spatial control of gene transcription (Bird, 2002; Zhang et al., 2006).
Usually acting in concert with DNA methylation, histone modifica-
tions/remodelling are also important epigenetic marks for gene regulation. Negatively
charged DNA molecules are associated with positively charged histones, which protect
and compact the DNA, forming the chromatin complex. Tightly packed DNA is inacces-
sible to the transcriptional machinery, so this chromatin must be altered if gene transcrip-
tion is to occur (Philips, 2008; Talbert and Henikoff, 2010). Chromatin unwinding is under
strict control, being involved in the regulation of DNA repair (Groth et al., 2007), DNA
replication (Giri and Prasanth, 2012) and gene regulation (Skene and Henikoff, 2013).
There are two main ways to alter chromatin state to control expression of a particu-
lar gene: changing the position and type of histones present and/or modifying the histones
themselves. As for the former, some histone subunits have evolved different variants,
which have distinct properties in dictating DNA accessibility. Eukaryotes are able to selec-
tively deposit or remove histone variants along particular regions of the DNA molecule
(Deal and Henikoff, 2011; Skene and Henikoff, 2013). As for the latter, histone residues

3 Chapter 1
can be subjected to acetylation, methylation, phosphorylation and ubiquitination, among
others (Li et al., 2007). These post-translational modifications loosen or tighten DNA-
histone bonds and/or alter interactions with proteins that influence downstream processes
in gene expression (Li et al., 2007; Palazzo and Akef, 2012; Skene and Henikoff, 2013).
1.1.2 – Transcription
Gene expression genuinely starts with transcription. In simple terms, this process is
the replication of information in the DNA into an RNA molecule. Up to 80% of all RNAs
transcribed in a growing eukaryotic cell are ribosomal RNAs (rRNAs) (Paule and
Lofquist, 1996). Such intense transcriptional activity in the nucleus is so prominent and
organised that it forms a sub-compartment easily seen in microscopy, termed the nucleolus
(Boisvert et al., 2007). A specialised type of RNA polymerase (RNA pol), type I, solely
transcribes these rRNAs (Nogi et al., 1991). Separately, 5S rRNA subunits are transcribed
elsewhere in the nucleus by a different type of polymerase, RNA pol III (Haeusler and
Engelke, 2006). RNA pol III also transcribes transfer RNAs (tRNAs) and some short non-
coding RNAs (ncRNAs) such as U6 small nuclear RNA (snRNA), H1 RNA (the RNA
component of RNase P), among others (White, 2011). Last, but not least, RNA pol II is
responsible for the synthesis of many types of ncRNAs, such as most snRNAs, mi-
croRNAs (miRNAs), small nucleolar RNAs (snoRNAs) and, most importantly, all mes-
senger RNAs (mRNAs). Therefore, all protein-coding genes depend on RNA pol II activi-
ty for expression.
A closer look into the typical RNA pol II activity reveals a very intricate system.
Transcription can be divided into a number of distinct steps and each of them is exploited
to regulate gene transcription (Svejstrup, 2004). From selecting the transcriptional start site
(Rojas-Duran and Gilbert, 2012) until the termination of transcription, there is tight regula-

4 Chapter 1
tion (Proudfoot, 2011). If the transcriptional machinery/complex is correct at each step
and repressors are not present, transcription goes to the next step (Singh, 1998; Svejstrup,
2004). Six major steps of the transcription process are detailed below.
1) Pre-initiation complex (PIC) assembly: Activators, co-activators and general
transcription factors (GTFs) bind to the promoter, including the TATA box and transcrip-
tional start site. RNA pol II is then positioned on the promoter to complete the PIC
(Singh, 1998; Li et al., 2007).
2) Open complex formation: 11–15 bp of DNA around the transcription start site is
unwound and the single-stranded template is positioned in the RNA pol II cleft (Li et al.,
2007).
3) Initiation: Complementary ribonucleotides are bound to the single-stranded
DNA template so the RNA polymerase can catalyse the first phosphodiester bond of the
nascent transcript.
4) Promoter escape: This phase is critically important in the transition to the elon-
gation phase, i.e. exiting (transcribing in the 5’3’ direction) the once ‘attractive’ promot-
er. The transcription complex becomes highly unstable from 2 bp until 15 bp of transcrip-
tion, with a propensity to abort transcription. At this stage there is strong dependence on
ATP, GTFs and downstream template to continue transcription (Dvir, 2002). Towards the
end of promoter escape, RNA pol II is phosphorylated at its carboxyl terminal domain
(CTD), losing contact with GTFs so it can proceed to the elongation phase (Li et al., 2007).
5) Elongation: Elongation factors and RNA processing factors (discussed in the
next Section, 1.1.3) are recruited to RNA pol II so that elongation can occur efficiently (Li
et al., 2007). At this step, there is also enhanced RNA pol II proof-reading activity (Libby
and Gallant, 1991). It is noteworthy that chromatin structure still plays an important role
at this step, controlling the speed of transcription (Svejstrup, 2004; Li et al., 2007).

5 Chapter 1
6) Termination: Although not much is known about RNA pol II termination, it is
likely that reduction of RNA pol II elongation speed after a poly(A) site and lower stability
of the RNA:DNA hybrid might contribute to destabilisation of the transcription complex
and termination of transcription (Proudfoot et al., 2002; Mischo and Proudfoot, 2013). An
additional contribution is likely provided by a mechanism called the torpedo model, which
occurs after poly(A) cleavage of the nascent mRNA and is acting in consort with RNA pol
II-recruited poly(A) factors. In this model, the uncapped residual RNA still attached to the
elongating polymerase is degraded by a 5’–3’ exonuclease. Such exonuclease is in kinetic
competition with the elongating RNA pol II and when they meet, this induces conforma-
tional changes in the polymerase to promote transcription termination (Proudfoot, 2011).
Correct termination is important not only for the gene being transcribed, but also for
downstream genes. After RNA pol II is released from the DNA template, it is recycled and
participates in a new round of transcription (Svejstrup, 2004).
1.1.3 – Precursor messenger RNA (pre-mRNA) processing
The nascent (immature) pre-messenger RNA (pre-mRNA) from the elongation
phase described above is processed into functional mRNA while and after it is transcribed,
before it can leave the nucleus (Proudfoot et al., 2002; Darnell, 2013). The majority of pre-
mRNA processing is thought to be co-transcriptional. To facilitate co-transcriptional pro-
cessing, most proteins and enzymes involved in RNA processing (e.g. capping, splicing
and polyadenylation) also bind to the phosphorylated CTD of RNA pol II, so transcription
influences a large part of mRNA processing (Darnell, 2013). There are four main pre-
mRNA processing reactions:
1) Capping: After about 20–30 nucleotides have been synthesised on the nascent
RNA, the 7-methylguanosine cap is linked to the first ribonucleotide of the transcript

6 Chapter 1
(5’ end) (Proudfoot et al., 2002). This three-step reaction forms an inverted 5'–5' triphos-
phate bridge and allows attachment of the cap binding complex. Capping is essential for
protecting the mRNA against 5’-3’ exonucleases and for mRNA export through the nucle-
ar pore complex (Proudfoot et al., 2002; Shuman, 2002).
2) Splicing: The majority of eukaryotic genes contain introns. Therefore, in order to
produce functional mRNAs, introns must be removed from the pre-mRNA and exons
joined in a very precise way. This excision and choice of exons is highly controlled and
can vary for several reasons (see Section 1.2.)
3) Editing: (pre-)mRNAs, mostly from animal cells and plant organelles, can un-
dergo editing. RNA editing involves covalent modification, the substitution or inser-
tion/deletion of a ribonucleotide residue in the RNA molecule (Gray, 2012). This process
can affect translation, splicing or mRNA localisation (DeCerbo and Carmichael, 2005).
4) Polyadenylation: This process is divided into two major steps. First, the nascent
mRNA is cleaved during RNA pol II elongation. Second, a poly(A) tail is synthesised at
the free 3’ end. The cleavage reaction is catalysed by factors that recognise particular
poly(A) signals in the nascent RNA (Darnell, 2013). The poly(A) cis signals are mostly
conserved elements/motifs rich in A and U (Li and Hunt, 1997; Sherstnev et al., 2012;
Darnell, 2013). Eukaryotic genes frequently have more than one poly(A) signal/site, and
polyadenylation is under tight regulation. Alternative polyadenylation can interfere with
the mRNA coding sequence, its stability and translatability (Di Giammartino et al., 2011;
Proudfoot, 2011). After RNA cleavage and consequent release from RNA pol II, a poly(A)
polymerase adds multiple adenines at the 3’ end of the mRNA. The length of the poly(A)
tail is under regulation, and can also affect mRNA stability and translatability (Weill et al.,
2012). Lastly, the poly(A) tail bound by poly(A)-binding proteins is recognised by several

7 Chapter 1
proteins, essential for the mRNA export through the nuclear pore complex (Proudfoot et
al., 2002).
1.1.4 - Nuclear export
The last level of gene expression control in the nucleus is the exit of an mRNA
through the nuclear pore. From the beginning of transcription to the end of pre-mRNA
processing, many proteins remain bound to the mRNA (Iglesias and Stutz, 2008). These
proteins are seen as marks of correctly transcribed and processed mRNAs. Thereafter,
these marker proteins recruit a number of other proteins which aid in the nuclear export
(Palazzo and Akef, 2012). The final mRNA and accompanying proteins form the messen-
ger ribonucleoprotein particle (mRNP) (Köhler and Hurt, 2007), which is then recognised
by the nuclear export machinery, which initiates mRNA exit to the cytoplasm (Palazzo
and Akef, 2012).
mRNA export is a tight quality control mechanism that keeps most products of
spurious transcription and processing in the nucleus, where they are directed to be degrad-
ed (Fasken and Corbett, 2005; Palazzo and Akef, 2012). For instance, transcripts with de-
fective poly(A) tails are degraded by the exosome complex (Fasken and Corbett, 2005).
The degradation of mis-processed mRNAs is particularly important to avoid translation of
aberrant transcripts, which could encode mutant or even toxic proteins (Fasken and
Corbett, 2005). The yeast Mlp1p protein (homologous to human Tpr), for example, partic-
ipates in a quality control step that prevents the export of intron-containing transcripts.
This protein interacts with the hnRNP-like protein Nab2p, present on spliced mRNAs, al-
lowing them to be exported (Galy et al., 2004). Once arriving in the cytoplasmic environ-
ment, the mRNP, still bound to the nuclear export machinery, is remodelled (Iglesias and

8 Chapter 1
Stutz, 2008). This prevents the mRNP from re-entering the nucleus and prepares the
mRNA for translation (Köhler and Hurt, 2007; Palazzo and Akef, 2012).
1.1.5 – Translation
Translation is a well-characterised process where the ribosome decodes the infor-
mation encoded by the mRNA to produce a linear polypeptide chain. There are three main
reactions in translation:
1) Initiation: Soon after leaving the nucleus, the mRNP cap associates with eukar-
yotic Initiation Factors (eIFs). This association improves recruitment of the small 40S ribo-
somal subunit to the 5’ end of the mRNA (Kozak, 2005; Horiguchi et al., 2012). Additional
eIFs bind to the initial complex, allowing the small ribosomal subunit to move along the
RNA molecule in the 5′ to 3′ direction, which is known as scanning. It pauses at an appro-
priate sequence context that (usually) contains the first AUG (Kozak, 2005). This is fol-
lowed by the dissociation of eIFs, allowing the large 60S ribosomal subunit to join with the
small 40S subunit and form the 80S ribosome (Horiguchi et al., 2012).
2) Elongation: This is when translation itself occurs. Surprisingly, few elongation
factors are required for this task (Groppo and Richter, 2009). Throughout the elongation
phase, the ribosome machinery continuously repeats the following cycle: 1) the aminoacyl-
tRNA (tRNA charged with the appropriate amino acid) is selected via the triplet code,
2) the associated amino acid is attached to the growing polypeptide chain by formation of
a peptide bond, catalysed by the ribosome and 3) the ribosome translocates to the next co-
don, faithfully maintaining the reading frame. The nascent polypeptide chain folds into its
tertiary conformation while still bound to the translation machinery. Diverse proteins and
molecular chaperones can aid protein folding (Groppo and Richter, 2009). Translation oc-
curs mainly in the cytoplasm, except when an Endoplasmic Reticulum (ER) localisation

9 Chapter 1
signal is present. In this case, the nascent polypeptide and the translation machinery are
targeted to the ER (Brodsky and Skach, 2011).
3) Termination: When the reading frame in use by the translation machinery ex-
poses a termination codon, the signal for translation to stop, a eukaryotic Release Factor
(eRF) will bind to this codon, instead of a tRNA. This event initiates the release of the pep-
tide chain, terminating translation. The ribosome is then recycled for new rounds of trans-
lation (Graille and Séraphin, 2012).
Gene regulatory mechanisms are also present during translation. First, ribosome
translation can be prevented or greatly affected by: i) complex mRNA secondary structure
(Mauger et al., 2013); ii) miRNAs (Iwasaki and Tomari, 2009; Huntzinger and Izaurralde,
2011); iii) proteins/repressors (Gallie, 2002; Kong and Lasko, 2012); and iv) the presence
of upstream AUG sequences (Kozak, 2005). Additionally, different surveillance pathways
are able to detect and degrade mRNAs with faulty translation, for instance Non-Stop de-
cay degrades mRNAs without stop codons (continuous ORF) (Vasudevan et al., 2002).
These surveillance mechanisms reduce accumulation of defective mRNAs and avoid the
production of mutant or even toxic proteins (Graille and Séraphin, 2012).
1.1.6 – mRNA turnover/degradation
In addition to mRNA surveillance, described in other Sections (1.1.3, 1.1.4, 1.1.5
and 1.4.2) as degradation of defective mRNAs, functional mRNAs are also subjected to
degradation. In fact, mRNA is an unstable molecule by nature, a situation aggravated by
the presence of ribonucleases (RNases) in the cytoplasm (Pérez-Ortín et al., 2012). Eukary-
otes are able to regulate mRNA stability, therefore controlling gene expression levels. Such
mRNA degradation control is particularly important in rapid responses to stress
(Ambrosone et al., 2012; Pérez-Ortín et al., 2012).

10 Chapter 1
The most common trans-acting factors controlling mRNA turnover are RNA-
binding proteins (RBP) (Ambrosone et al., 2012; Pérez-Ortín et al., 2012) and miRNAs
(Iwasaki and Tomari, 2009; Huntzinger and Izaurralde, 2011). These factors either protect
the mRNA or target it for degradation (Belostotsky and Sieburth, 2009; Wu and Brewer,
2012).
1.1.7 – Protein modification
Co- and post-translational modifications (PTMs) covalently change the primary
structure of nearly all proteins (Lothrop et al., 2013). The most common PTMs are phos-
phorylation, glycosylation, acetylation, protein cleavage and ubiquitination, among many
others (Khoury et al., 2011). They change many aspects of a protein, such as structural con-
formation, enzymatic activity, sub-cellular localisation, interactions with substrates or
binding partners (Kwon et al., 2006) and lastly, rate of degradation (Matyskiela and
Martin, 2013). Therefore, PTMs largely increase protein diversity and dynamics, including
proteins involved in epigenetics, translation, pre-mRNA processing, mRNA nuclear ex-
port, mRNA stability and translation. Consequently, PTMs pervade and link the whole
process of gene regulation in eukaryotes, with involvement from signal perception to cell
response.
1.2 – Pre-mRNA splicing
Intron splicing (removal) is essential for the great majority of eukaryotic genes. For
instance, 97% of protein-coding genes in humans have one or more introns. In plants the
scenario is similar: 80% of Arabidopsis thaliana (Arabidopsis subsequently) and 75% of rice
protein-coding genes have at least one intron (Alexandrov et al., 2006).

11 Chapter 1
Introns have been present since the earliest stages of eukaryotic evolution. There
are two highly debated theories for the origin of these intervening sequences. Either introns
appeared only in the eukaryote ancestor or they have always existed, since the beginning
of life, before the eukaryote/prokaryote divergence (reviewed in(Rogozin et al., 2012). In
the second case, prokaryotes saved more energy and space and produced proteins faster by
losing the introns, whereas eukaryotes expanded their proteome and their control over
gene expression by maintaining these introns. It is noteworthy that eukaryotes still main-
tain introns not only because of these advantages, but also because introns have become
intrinsic to the cellular system, with a selective pressure that maintains them (Alexandrov
et al., 2006; Grzybowska, 2012). This pressure can be explained by a few factors, for in-
stance nuclear export and mRNA surveillance control. These processes prevent transcripts
that have not been spliced to stay in the cytoplasm. Regardless of the debate concerning
intron evolution, there is no doubt that the existence of introns ultimately contributes to
the complexity of eukaryotes.
Splicing introns from the primary transcript allows production of translatable
mRNA. This process is catalysed by the (most?) complex ribonucleoprotein macromolecu-
lar machine, the spliceosome (Nilsen, 2003). Most of the splicing process occurs co-
transcriptionally and can be influenced by RNA pol II activity and epigenetic state, among
other factors (Darnell, 2013). In fact, the flexibility which pre-mRNA splicing provides in
terms of very refined regulation of expression and increased protein complexity has con-
tributed to the evolution of eukaryotes (Artamonova and Gelfand, 2007). Further infor-
mation on this matter is presented in Sections 1.3, 1.4 and 1.5, while details of the canoni-
cal process through which introns are efficiently recognised and removed by the splicing
machinery are described below.

12 Chapter 1
1.2.1 – Components of the spliceosome machinery
Systematic analysis to elucidate the compositional information of the spliceosome
has been performed in human and yeast spliceosomal complexes. Many orthologues of
human splicing factors have been found in the Arabidopsis genome (Barta et al., 2012),
which suggests that the basic mechanism of intron removal is the same in all phyla. Over-
all, the spliceosome contains five snRNAs and around three hundred proteins (Jurica and
Moore, 2003). Two types of spliceosome machinery coexist in the cell: the U2-type, which
recognises and removes U2-type introns, and the less abundant U12-type, for the rare U12-
type introns (Will and Lührmann, 2011).
The most common spliceosome, the U2-type, is composed of the U1, U2, U4, U5
and U6 uridine-rich snRNAs (Reddy et al., 2012a). With the exception of U6, the spliceo-
somal snRNAs are transcribed by RNA pol II, which dictates their downstream matura-
tion. These RNA pol II-specific primary snRNAs are exported to the cytoplasm for pro-
cessing and re-imported to the nucleus, where they complete maturation. Maturation of
the RNA pol III-specific U6 snRNA takes place solely in the nucleus (Kiss, 2004). The fi-
nal mature spliceosomal snRNAs are assembled with specific proteins, forming the snRNP
complexes. In addition to snRNPs, spliceosome activity also depends on the assembly of
several other non-snRNP proteins such as the SR proteins (see Section 1.3.3) and
DExH/D-box RNA ATPases/helicases (Long and Caceres, 2009; Staley and Woolford,
2009).
1.2.2 – Basic cis-acting elements
To carry out intron removal, the spliceosome must recognise the exact sites of the
exon/intron and intron/exon boundaries, known as the 5’ and 3’ splice sites (ss), respec-
tively (Figure 1.1). The pre-mRNA provides information to define these boundaries. Gen-

13 Chapter 1
erally, the 5’ ss has a conserved GU dinucleotide at the beginning of the intron, whereas
the 3’ ss has a conserved AG dinucleotide at the end of the intron (Reddy, 2007). Higher
eukaryotes have additional poorly conserved intrinsic intron sequences downstream within
the intron which help to define the splice sites. These are a branch site (containing a key
adenine) and a polypyrimidine tract (a sequence enriched for uracil and cytosine) between
the branch point and 3’ ss (Reddy, 2007; De Conti et al., 2013). The branch point is highly
conserved in yeast introns and less well conserved in mammals and plants; the polypyrim-
idine tract is essential for splicing in mammals but less well conserved in plants (Simpson et
al., 2004).
Figure 1.1: Schematic representation of the cis-acting splicing elements and the two-step
mechanism of pre-mRNA splicing. Boxes and solid lines represent the exons and the in-
tron, respectively. The branch point adenosine is indicated by the letter A in the CURAY
branch site and the phosphate groups (p) at the 5′ and 3′ splice sites are also shown. Con-
served sequences found at the 5′ and 3′ splice sites and branch site of U2-type pre-mRNA
introns in eukaryotes are shown (Reddy, 2007). Y = pyrimidine and R = purine. The
polypyrimidine tract is indicated by pY.

14 Chapter 1
General characteristics of exons and introns also seem to affect splice site recogni-
tion. For instance, an intron or exon which is too small (< 50 nt) can interfere with their
splicing because of splicing factors physically hindering each other and additional mecha-
nisms are required for mini-exon and mini-intron splicing (De Conti et al., 2013). In plants,
introns must be at least 70 nt in length with high UA content (around 15% more than ex-
ons) for efficient splicing (Goodall and Filipowicz, 1989; Luehrsen et al., 1994; Lorković et
al., 2000).
1.2.3 – Splicing cycle
The spliceosome assembly occurs in a stepwise manner, and can be grouped into
two major steps (Figure 1.1 and Figure 1.2):
1) 5’ ss cleavage/ligation: In the initial step, the U1 snRNP recognises and binds to the 5’
ss through base-pairing, thus defining the exact exon/intron boundary. The human
non-snRNP factor Sf1 (Bbp in yeast) interacts with the branch site, and the non-
snRNP U2AF (Mud2 in yeast) associates with the polypyrimidine tract and the 3’
ss. At this step, the spliceosome forms what is known as the E (early) complex
(Zhang et al., 2013b).
Subsequently, with the aid of DExD-H-box RNA ATPases/helicases, the
U2 snRNP displaces Sf1 and interacts with the branch site through base-pairing.
This forms what is known as the A (pre-spliceosome) complex (Figure 1.2) (Will
and Lührmann, 2011). The pre-assembled U4/U6.U5 tri-snRNP is then recruited
and integrated into the spliceosome. The conserved loop of U5 snRNA, in particu-
lar, base-pairs with exon sequences close to the 5’ ss. The tri-snRNP integration
forms the B (pre-catalytic spliceosome) complex (Will and Lührmann, 2011; Zhang
et al., 2013b).

15 Chapter 1
Integration of additional non-snRNP proteins initiates major structural rear-
rangements: i) the 5’ ss dissociates from the U1 snRNA and re-associates (base-
pairs) with the U6 snRNA instead; ii) the U1 snRNP is removed from the complex;
iii) the U4/U6 interaction is also disrupted followed by U4 removal; iv) the U2
snRNA forms new interactions with the U6 snRNA. These major rearrangements
bring key sequences involved in the splicing reaction into close proximity and allow
the spliceosome to become active (Bact complex, Figure 1.2) (Will and Lührmann,
2011). Subsequent catalytic activation of the spliceosome is achieved by the
DEAH-box RNA helicase Prp2, which generates the B* complex.
The spliceosome is now able to perform the first step of splicing. It starts
with a nucleophilic attack on the 5′ ss by the 2′ OH group of the branch point aden-
osine, present in the intron. This results in 5’ ss cleavage and subsequent ligation of
the 5′ end of the intron to the branch point adenosine, forming a lariat structure
(Figure 1.1). After this first reaction, the spliceosome repositions the mRNA sub-
strate to form the C complex (Will and Lührmann, 2011; Zhang et al., 2013b).
2) 3’ ss cleavage/ligation: The second catalytic reaction is performed by the C complex,
soon after the first reaction. First, the 3′ OH group of the 5′ exon attacks the 3′ ss
(Figure 1.1). This results in 3’ ss cleavage and subsequent ligation of the 5′ and 3′
exons to form the mRNA (Figure 1.2). The spliceosome then undergoes post-
catalytic rearrangements to release the intron lariat and the mRNA, and to dissoci-
ate the various spliceosomal components. Finally, the snRNPs are recycled for new
rounds of splicing, and the intron lariat is debranched and degraded (Will and
Lührmann, 2011; Zhang et al., 2013b).

16 Chapter 1
Figure 1.2: The splicing cycle (Figure from(Will and Lührmann, 2011). Spliceosomal as-
sembly complexes are named according to the metazoan nomenclature. Boxes and solid
lines represent exons and introns, respectively. The branch point adenosine (BP) is indicat-
ed by the letter A.
1.3 – Alternative pre-mRNA splicing
Alternative pre-mRNA splicing is a variation of splice site usage among pre-
mRNAs of the same gene. As a consequence, the same gene is able to produce different
mRNAs, which can impact protein production. Hence, alternative splicing (AS) provides
an excellent way to control gene expression.
AS events were uncovered soon after the discovery of pre-mRNA splicing in 1977
(Berget et al., 1977), with studies of the adenovirus 2 gene (Chow et al., 1977). Chow and

17 Chapter 1
colleagues found that the adenovirus 2 gene was not only spliced but also alternatively
spliced, giving rise to different mRNA isoforms (Chow et al., 1977). After this initial dis-
covery, additional studies, from individual gene analyses to genome-wide surveys, con-
cluded that alternative splicing is a widespread phenomenon in higher eukaryotes
(Kornblihtt et al., 2013). For instance, 95% of human multi-exon genes are alternatively
spliced (Pan et al., 2008). In Arabidopsis, more than 61% of intron-containing genes are
known to undergo AS, and this frequency is likely to increase, especially if more plant tis-
sues and variable growth conditions are studied (Marquez et al., 2012).
All in all, alternative splicing is essential and advantageous for eukaryotes
(Artamonova and Gelfand, 2007; Mastrangelo et al., 2012). Its control is considerably
complex and to understand it, it is important to have a closer look at how splice site selec-
tion occurs. In this section, the mechanisms and evolution of AS are reviewed, whereas
consequences and important advantages of AS are discussed in Section 1.4.
1.3.1 – Types of alternative splicing events
Exons that are always included and introns that are always removed from the final
mRNA are considered constitutive/canonical (Black, 2003). Pre-mRNAs can be alterna-
tively spliced through the selection of alternative splice sites to generate different mRNAs
from the pre-mRNAs of the same gene. There are five main types of alternative splicing
events (Figure 1.3):
A) Intron retention (Figure 1.3A). This splicing event refers to a ‘failure’ in remov-
ing an intron from the pre-mRNA.
B–C) Alternative splice-site usage. Exons and introns can also be lengthened or
shortened by selection of different 5’ (donor) or 3’ (acceptor) splice sites (ss). For example,
in a hypothetical exon (Figure 1.3B), the 5’ splice site ‘y’ is most commonly used and de-

18 Chapter 1
fines the 3’ boundary of such exon. Usage of an alternative 5’ ss that is 20 nt upstream
within that exon (splice site ‘x’) removes 20 nt of it (Figure 1.3B). This also applies to al-
ternative 3’ splice site selection (Figure 1.3C).
D–E) Alternative exon (Figure 1.3D and Figure 1.3E). Alternative or cassette ex-
ons are either included or skipped (Figure 1.3D) in different transcripts. A relatively rare
type of alternative splicing is mutually exclusive splicing (Figure 1.3E), which is the selec-
tion of only one exon from two or more adjacent cassette exons such that only one exon in
the group is included at a time.
F) Cryptic intron (Figure 1.3F). A sequence unusually removed from within an ex-
on is known as cryptic intron.
Figure 1.3: Types of AS events. Exons are open boxes and introns are straight fine black
lines. Diagonal fine lines represent splicing events, where AS events are shown in red.
A) Intron retention; B) and C) alternative 5’ and 3’ splice site usage, respectively; D) and
E) represent two types of AS events using cassette exons; F) cryptic intron.

19 Chapter 1
In cases when genes exhibit multiple alternative splicing sites within their sequenc-
es, these are generally used in a combinatorial manner to produce many different mRNAs
(Black, 2003). In addition to these normal (cis-) splicing events, genes can undergo an unu-
sual form of RNA splicing known as trans-splicing. This unusual mechanism, not neces-
sarily carried out by the spliceosome, is responsible for processing different pre-mRNA
molecules into one final mRNA (Bonen, 1993; Herai and Yamagishi, 2010). These hybrid
mRNAs are common and essential in nematodes and trypanosomes (Lücke et al., 1996;
Blumenthal, 2012) but rare in plants and humans, where they may impact upon human
health (Herai and Yamagishi, 2010).
1.3.2 – Additional cis-acting elements: splicing enhancers and silencers
Strong splice sites are those containing canonical cis-acting elements (mentioned in
Section 1.2.2), where, for example, there is a high degree of complementarity between the
5’ ss and U1 snRNA and the branch point and U2 snRNA. Weak splice sites contain se-
quence variations from the canonical cis elements, which result in less efficient recognition
by the spliceosome and decreased splicing. Although strong or weak splice sites can be
predicted by comparison to consensus sequences it is, however, generally not enough in-
formation to predict splicing activity in vivo. Additional cis- and trans-acting elements can
collaborate to enhance or repress splicing of a particular splice site (Black, 2003).
The additional cis regulatory elements affecting splicing are termed according to
their location (exon or intron) and function (enhancement or silencing usage of a site): ex-
onic splicing enhancers (ESEs), exonic splicing silencers (ESSs), intronic splicing enhanc-
ers (ISEs), and intronic splicing silencers (ISSs) (Figure 1.4). These elements are diverse in
sequence as they serve as binding sites for trans-acting factors, which then interact with the
spliceosome. The exonic elements are embedded within nucleotides that also code for pro-
20 Chapter 1
tein and affect splice sites over short distances. The intronic elements are usually present
near the polypyrimidine tract, branch point or 5’ splice site, and they can interfere with
splice site selection over much longer distances compared to exonic elements (Black,
2003).
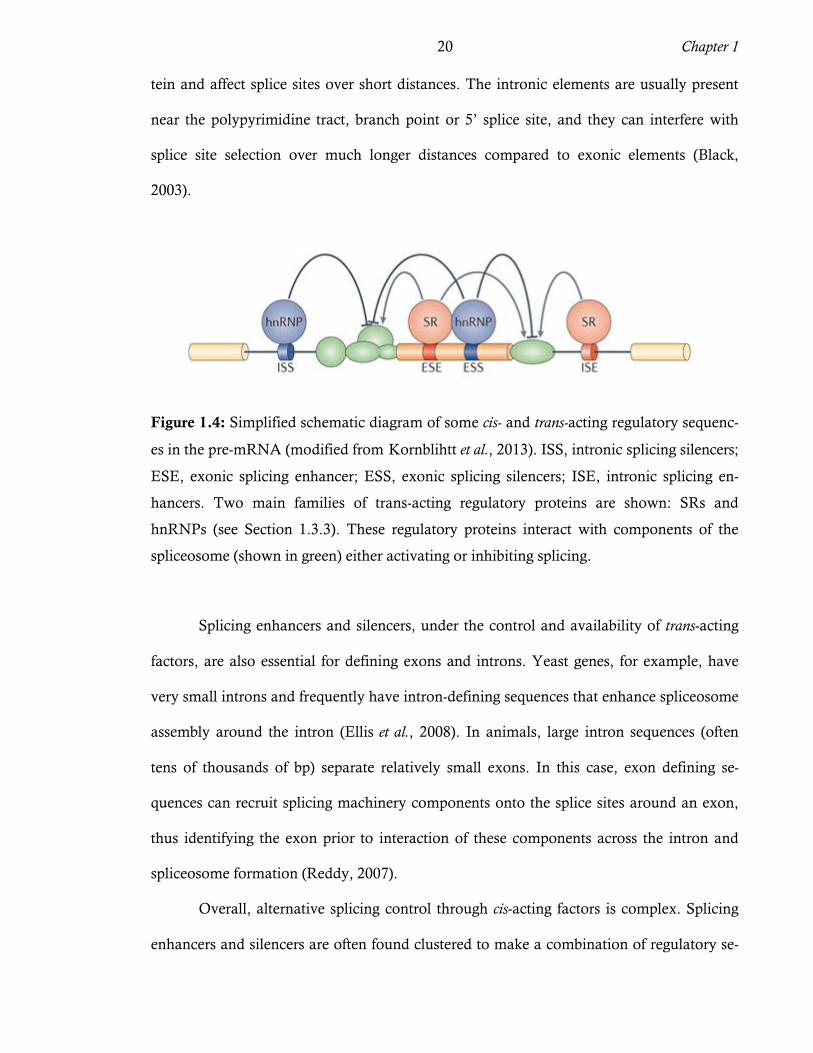
Figure 1.4: Simplified schematic diagram of some cis- and trans-acting regulatory sequenc-
es in the pre-mRNA (modified from(Kornblihtt et al., 2013). ISS, intronic splicing silencers;
ESE, exonic splicing enhancer; ESS, exonic splicing silencers; ISE, intronic splicing en-
hancers. Two main families of trans-acting regulatory proteins are shown: SRs and
hnRNPs (see Section 1.3.3). These regulatory proteins interact with components of the
spliceosome (shown in green) either activating or inhibiting splicing.
Splicing enhancers and silencers, under the control and availability of trans-acting
factors, are also essential for defining exons and introns. Yeast genes, for example, have
very small introns and frequently have intron-defining sequences that enhance spliceosome
assembly around the intron (Ellis et al., 2008). In animals, large intron sequences (often
tens of thousands of bp) separate relatively small exons. In this case, exon defining se-
quences can recruit splicing machinery components onto the splice sites around an exon,
thus identifying the exon prior to interaction of these components across the intron and
spliceosome formation (Reddy, 2007).
Overall, alternative splicing control through cis-acting factors is complex. Splicing
enhancers and silencers are often found clustered to make a combination of regulatory se-

21 Chapter 1
quences that mediate both positive and negative regulation (Black, 2003). To know if the
splicing regulation will be positive or negative, it will depend on a series of factors such as
the abundance and activity of the trans-acting population available (see below).
1.3.3 – Additional trans-acting splicing elements: regulatory proteins
Trans regulatory proteins bind to splicing enhancers and/or silencers to activate or
inhibit the use of splice sites, respectively. They mostly include serine/arginine-rich pro-
teins (SR) and heterogeneous nuclear ribonucleoproteins (hnRNP) (Schwartz et al., 2008).
The SR proteins are involved in both constitutive and alternative splicing of pre-
mRNAs. They also have additional roles in, for example, transcription, mRNA export and
translation (Long and Caceres, 2009). These proteins have one or two conserved domain
structure(s) at the N-terminus for interacting with specific (pre-)mRNA molecules, known
as RNA Recognition Motifs (RRMs). At the C-terminus, they have a domain for protein
interaction, which is variable in length and rich in serine/arginine dipeptide, termed the
RS domain (Black, 2003). The RS domain can be highly phosphorylated, which controls
protein localisation and activity. Other proteins containing RS-domains can also function
in pre-mRNA splicing, but because they lack a conserved RRM domain they are referred
to as SR-like or SR-related proteins (Long and Caceres, 2009).
Generally, SR proteins enhance splicing through binding to splicing enhancers
(ESEs and ISEs) (Black, 2003). When SR proteins bind to ESEs, they mostly trigger
spliceosome assembly and prevent exon skipping, thus providing a mechanism for defining
exons. ISEs are also recognised by SR proteins, a process which plays a role in intron defi-
nition (Ellis et al., 2008). A small subset of SR proteins can act as negative splicing regula-
tors, for instance when binding to ISSs (Black, 2003; Long and Caceres, 2009).

22 Chapter 1
The hnRNP proteins are also involved in both constitutive and alternative pre-
mRNA splicing, with additional roles, for instance in telomere maintenance and mRNA
export (He and Smith, 2009). They are a diverse group of regulators constituted of a num-
ber of proteins that bind RNAs via RNA binding domains which are usually RRM or K
Homology (KH) domains, while protein interaction domains are normally repeats of Arg-
Gly-Gly tripeptides (known as RGG boxes) but it can also contain auxiliary domains, such
as a glycine-, acidic- or proline-rich domain (Busch and Hertel, 2012).
In most cases, hnRNP proteins inhibit splicing through binding to splicing silencers
(ESS and ISS, Figure 1.4). The mechanisms by which hnRNPs repress splicing can differ
between transcripts and proteins (Black, 2003). The hnRNPs can: i) interfere with spliceo-
some assembly; ii) interfere with splicing activation by preventing SR proteins from bind-
ing to adjacent ESEs; or iii) interact with other hnRNPs through dimerisation, which can
create an isolating loop which keeps exons or splice sites away from the splicing apparatus.
In a few examples, hnRNPs act as positive splicing regulators, depending on their posi-
tions relative to the regulated splice site (Black, 2003; Xue et al., 2009; Busch and Hertel,
2012).
The polypyrimidine tract-binding (PTB) proteins are a class of hnRNP splicing fac-
tors, mainly involved in tissue-specific repression of exons, but also of polyadenylation and
mRNA stability (Sawicka et al., 2008). They contain four RRM domains that often bind to
the polypyrimidine tract of regulated 3’ splice sites. The mechanisms by which PTB pro-
teins repress splicing can be by looping out exon sequences or competing against U2AF for
binding to the polypyrimidine tract and thus, inhibiting splicing (Black, 2003). On rare oc-
casions, PTB proteins can also enhance splicing, depending on their position relative to the
target exons (Kafasla et al., 2012).
In addition to the complex combination of cis-acting factors mentioned previously
(Section 1.3.2), the intricate control of AS also depends on the combination of trans-acting

23 Chapter 1
factors. First, many trans-acting factors can act as both enhancers and suppressors of splic-
ing depending on their relative abundance, sequence and position of their target sites in the
pre-mRNA (Black, 2003). Second, expression and activity states (regulated by PTMs) of
many splicing regulators vary in different cells, tissues, developmental stages or under dif-
ferent conditions. Thus, the abundance and activity of splicing regulators affect splicing
outcomes. Thirdly, the expression of many splicing factor genes are also under tight regu-
lation, often by alternative splicing, pointing to networks of splicing factors and splicing
regulation (Black, 2003).
1.3.4 – Epigenetic and transcriptional control of alternative splicing
Recently, a new dimension in the regulation of alternative splicing was revealed
with the demonstration that splicing is not only regulated by splicing factors, but also by a
more complex process involving epigenetics and transcription (Luco and Misteli, 2011;
Kornblihtt et al., 2013). As mentioned previously (Section 1.1.3), most splicing events oc-
cur co-transcriptionally, through a physical link between elongating RNA pol II and splic-
ing factors. In such functional coupling, a key player is the RNA pol II CTD, as it is
known to recruit splicing factors, as well as poly(A) cleavage factors, to the sites of tran-
scription in a phosphorylation pattern-dependent manner (Gómez Acuña et al., 2013).
Moreover, RNA pol II is physically linked to the chromatin, which allows for a coupling
between splicing, transcription and epigenetic regulation. Two main models explain how
epigenetic chromatin marks and transcription can affect alternative splicing.
1) ‘Kinetic model’. In this model, RNA pol II elongation rate can affect splicing.
For example, a slow elongation rate or pausing of RNA pol II allows more time for a weak
upstream exon to recruit the splicing machinery before the splicing sites of a stronger com-
peting downstream exon are transcribed (Luco and Misteli, 2011). There are two main

24 Chapter 1
ways in which the RNA pol II elongation rate is affected: by modifying the phosphoryla-
tion state of RNA pol II CTD and/or through chromatin remodelling and modification
(Luco and Misteli, 2011). In the latter, histones can serve as a barrier, slowing down RNA
pol II elongation rate (Hodges et al., 2009). Interestingly, DNA sequences containing con-
stitutive exons have significantly higher histone density than sequences coding for alterna-
tive exons, contributing to exon definition (Schwartz et al., 2009). Additionally, constitu-
tive and alternative exons have different histone modification marks, which can result in
different chromatin unwinding patterns and consequently interfere with the accessibility
and rate of RNA pol II, once again affecting exon definition (Luco and Misteli, 2011).
2) ‘Recruitment model’. This model describes splicing factors as being recruited by
either the RNA pol II CTD, an example being the SR protein Srsf3 (Das et al., 2007), or
through epigenetic information. In the latter, histone marks are recognised and bound by
specific chromatin-binding proteins (adaptors), which in turn can influence the recruitment
of splicing regulators to the nascent RNA, thus driving the splicing outcome (Luco and
Misteli, 2011). The discovery of an ‘adaptor complex’ is based on analyses of several PTB-
dependent genes. The best example is the work carried out by Luco and colleagues in hu-
man cells. They discovered that the chromatin-binding adaptor protein Mrg15 reads his-
tone marks on different genes and recruits PTB proteins to bind ESSs on nascent pre-
mRNAs, resulting in exclusion of the corresponding exon (Luco et al., 2010).
To conclude, in addition to the complex combination of cis- and trans-acting splic-
ing factors, epigenetics and transcription contribute to a new level of alternative splicing
control. This new knowledge contributes to our understanding of the complexity in estab-
lishing and maintaining numerous alternative splicing programmes that are highly tissue-
specific and developmentally regulated (Luco and Misteli, 2011).

25 Chapter 1
1.3.5 – The splicing code
The ‘splicing code’ is the ultimate collection and integration of all information
about regulation of different splicing events that can then be used to predict splicing out-
comes in different tissues and developmental stages. Therefore, a splicing code must bring
together information such as i) the strength of splice sites; ii) intron and exon size and
presence of secondary structures; iii) splicing enhancers and silencers; iv) complex spatial
and temporal combinations of active trans-acting splicing factors; v) spatial and temporal
patterns of epigenetic marks and transcriptional effects on splicing.
Recent efforts to achieve a splicing code in mammals involved the analyses of al-
ternatively spliced exons across different tissues and developmental stages, which allowed
the characterisation of several splicing motifs and a splicing prediction with 65–90% accu-
racy (Barash et al., 2010). The splicing code, however, is far from being deciphered. Emerg-
ing experimental and computational tools should be able to gather more information of the
combinatorial features that control splicing, including relevant epigenetic and transcrip-
tional data, to finally permit a more comprehensive and systematic analysis to decipher the
code (Luco and Misteli, 2011). It is also important to carry out such studies in other organ-
isms, such as plants (Reddy et al., 2012b). Ultimately, the splicing code will allow for pre-
dictions of alternative splicing with high accuracy, as well as any effects from mutations
within regulatory elements (Barash et al., 2010).
1.3.6 – The evolution of alternative splicing
Before learning about the functions and roles of AS, it is essential to analyse why
AS evolved. The evolution of AS is an area which is subject to several controversies main-
ly because many observations of specific evolutionary events are taken out of a more gen-
eral context (Artamonova and Gelfand, 2007). For instance, point mutations in splice sites

26 Chapter 1
can weaken them, increasing the chances for alternative splicing to occur. However, this
situation is further complicated by cis- and trans-acting regulators, intron and exon size
constraints, and epigenetics and transcriptional effects, which add extra layers of complexi-
ty to alternative splicing evolution (Artamonova and Gelfand, 2007).
Alternative splicing was present in the common ancestor of eukaryotes and it is
currently prevalent in complex multicellular eukaryotes but rare in unicellular eukaryotes
(Keren et al., 2010), which suggests that AS is important in contributing to higher eukary-
ote complexity. This observation is corroborated by the considerable expansion of splicing
regulatory proteins in higher eukaryotes, such as SR proteins and hnRNPs (Busch and
Hertel, 2012). The functional relevance of widespread AS events in higher eukaryotes can
be confirmed by conservation analysis. However, a closer look at AS conservation among
eukaryotic species has not found high levels of conservation (Artamonova and Gelfand,
2007; Keren et al., 2010). For instance, a large-scale comparison of AS between humans
and mice suggests that alternative exons are less conserved than constitutive exons
(Takeda et al., 2008). Additionally, a wider analysis using multiple organs and different
vertebrate species identified that the AS profiles of equivalent interspecies organs have di-
verged to the extent that the alternative transcripts are significantly more species-specific
than organ-specific (Barbosa-Morais et al., 2012).
The low conservation of AS events can be explained by different theories. A radical
theory suggests that alternative regions are simply evolutionary intermediates that occur
during transition to constitutive states, either by intron/exon loss or gain. However, evolu-
tion is rarely explained by a simple and dogmatic theory (Artamonova and Gelfand, 2007).
Several lines of evidence suggest that AS is not a temporary remnant of evolution but ra-
ther an essential and actively regulated mechanism that provides a basis for selection to
improve eukaryotic complexity. First, the rapid evolution of alternative splicing can be an
advantage to speciation (Barbosa-Morais et al., 2012). Additionally, the faster creation of

27 Chapter 1
more AS isoforms provides more material for the selection of beneficial variants
(Artamonova and Gelfand, 2007). Of course, faster creation is inevitably followed by rapid
loss of AS isoforms, especially those that are not significantly beneficial to the species. This
new and frequent generation of AS isoforms could expand the coding capacity of the ge-
nome. Moreover, new AS events could also generate isoforms that are removed from the
cell by mRNA surveillance mechanisms, controlling mRNA levels. Taking all this ad-
vantages into account, cells have evolved mechanisms to control alternative splicing in a
spatial and temporal manner, providing an extra level of gene expression control.
1.4 – Functions and roles of alternative splicing
Briefly, the primary consequence and function of AS is to affect protein expression.
This can be achieved qualitatively and/or quantitatively. Regarding qualitative control, AS
increases the possible number of protein isoforms, which can have different functions.
Concerning quantitative control, AS can regulate protein expression levels by modifying
how well an mRNA is translated and/or decreasing mRNA stability and targeting it for
degradation (Black, 2003; Huang and Steitz, 2005; Stamm et al., 2005; Reddy, 2007).
The ultimate roles of AS for eukaryotes are diverse and can range from opposite
extremes such as causing disease to being used for gene therapy. AS can also be involved
in stress responses and developmental control. It has a tremendous impact on eukaryotes
and it contributes to their complexity, shaping their evolution (Rogozin et al., 2012).
1.4.1 – Function of AS: increased proteome diversity
Proteome diversity is considerably increased by AS through the production of
mRNA variants coding for proteins with different activity, localisation, stability and ability
to interact with other proteins and substrates. In order to achieve this, AS usually occurs in

28 Chapter 1
the coding sequence (CDS) and produces alternative mRNAs that are still translatable,
functional and able to reach the cytoplasm. Therefore, such AS should not be random but
tightly regulated (Stamm et al., 2005).
Overall, AS tends to maintain core protein structure, generating subtle protein
modifications (Stetefeld and Ruegg, 2005; Kelemen et al., 2013). Additionally, these modi-
fications tend to avoid disrupting sequences coding for protein domains; rather, they com-
pletely include or remove domains (Artamonova and Gelfand, 2007; Colantoni et al.,
2013). However, major changes can also occur, such as the extreme cases of 12 genes in
Drosophila melanogaster that are able to code for two (or more) proteins with no overlapping
residues, i.e. no coding exon is shared between the alternative mRNAs (Misra et al., 2002).
Another fascinating example of increased protein diversity through AS comes from
studies of the down syndrome cell adhesion molecule (DSCAM) gene in D. melanogaster, which
codes for protein receptors located on the surface of neurons. Extensive protein diversity is
crucial to nervous system development because it provides a unique signature that avoids
self-crossing of axons (Celotto and Graveley, 2001; Venables et al., 2012). DSCAM is able
to provide this protein diversity by virtue of AS. This gene has the potential to produce up
to 38,016 mRNA isoforms, each encoding a different protein (Schmucker et al., 2000). This
impressive number is nearly three times greater than the total number of protein coding
genes in D. melanogaster! The gene structure of DSCAM is a key element in contributing to
this stunning potential. It has 20 constitutive exons and groups of 12, 48, 33 and 2 mutual-
ly exclusive exons, allowing different combinations of exons in the final mRNA. In each
mutually exclusive group of exons, competing secondary structures allow only one exon to
be included at a time, which varies among tissues and developmental stages (Celotto and
Graveley, 2001; Graveley, 2005; Hemani and Soller, 2012).
29 Chapter 1
Protein sub-cellular localisation can also be modified by AS, which adds or re-
moves mRNA regions coding for localisation signals. As a result, different protein
isoforms can go to different cell compartments, where they may perform different activi-
ties. An example is the mammalian lipin 1 gene, involved in lipid metabolism. Lipin 1 is
alternatively spliced and produces cytoplasmic and nuclear proteins, known as lipin
1α and lipin 1β, respectively (Kelemen et al., 2013). Lipin 1α has a phosphatidate phospha-
tase activity, whereas nuclear lipin 1β co-activates transcription of genes that enhance lipid
storage (Reue and Brindley, 2008). The lipin 1β mRNA isoform has an alternative exon
(exon 6), absent on lipin 1α, that contributes to nuclear localisation of the protein. Since
lipin 1β protein amplifies lipid storage signals, regulating splicing of exon 6 on lipin 1 pre-
mRNA is crucial to lipid metabolism. This exon is controlled by the splicing regulator
SFRS10, which binds to the 5’ ss of exon 6 and represses splicing. This results in exon 6
skipping and consequently lower levels of lipin 1β (Pihlajamäki et al., 2011). Interestingly,
SFRS10 is down-regulated in obese patients, leading to an increase of lipin 1β and a subse-
quent increase in lipid storage (Pihlajamäki et al., 2011).
Finally, AS can change enzymatic activity and the best studied examples are pro-
tein kinases. Pre-mRNAs coding for these enzymes undergo AS that affect their active
sites, resulting in generation of proteins that are inactive, constitutively active or have re-
duced activity (Kelemen et al., 2013). Additionally, AS can modify protein sequences that
decrease protein stability, making them more susceptible to degradation. For example, ex-
on skipping in the migration and invasion inhibitory protein (MIIP) pre-mRNA changes the
coding region of the C-terminus, which codes for a protein that is degraded soon after
translation (Song et al., 2005).

30 Chapter 1
1.4.2 – Function of AS: regulation of mRNA and protein levels
In addition to increased proteome diversity, AS can fine-tune protein expression
levels. This quantitative control can be exerted due to AS events in either the coding or un-
translated regions of pre-mRNAs and hinders mRNA nuclear export, modifies mRNA
translatability and stability. In eukaryotes, this control of expression is essential, being in-
volved in several situations like stress and development (Staiger and Brown, 2013). Such
AS is especially crucial when altered protein levels are needed despite opposing transcrip-
tional behaviour (Dutertre et al., 2011).
The AS effect on mRNA translation usually occurs through inclusion of cis-
elements such as RNA secondary structures that increase or reduce translation efficiency
(Jacobs et al., 2012). One of the strongest effects on mRNA translatability is the removal or
insertion of an upstream translation initiation codon (uAUG), which creates an upstream
open reading frame (uORF) in the 5’ untranslated region (UTR). According to the ribo-
some scanning model, uAUGs interfere with or prevents translation initiation of down-
stream AUGs (Kozak, 2005). A genome-wide analysis in Saccharomyces cerevisiae showed
that transcripts with uORFs have significantly lower levels of their corresponding proteins
than transcripts without uORFs (Yun et al., 2012). Regulation of the inclusion of uORFs
through AS is crucial to regulating many eukaryotic mRNAs. Essentially, uORFs prevent
harmful overproduction of proteins with regulatory functions (Kochetov et al., 2008). For
example, in mammalian spermatogenic cells, almost all genes are overexpressed, which
would cause deleterious phenotypes if they were all efficiently translated (Kleene, 2001;
Kochetov et al., 2008). To avoid protein overexpression, pre-mRNAs of these genes under-
go AS that retain uAUGs (uORFs), which does not occur in somatic cells (Kleene, 2001).
This AS control reduces mRNA translation to healthy levels, relieving the consequences of
protein overexpression.

31 Chapter 1
Alternative uAUGs/uORFs can increase proteome diversity. In this case, uAUGs
in the same reading frame increase the number of translation start sites. Alternative trans-
lational start sites create protein isoforms that differ at their N-terminus, which can have
an impact on the function of the protein (Kochetov et al., 2008). Additionally, in some cas-
es the protein translated from a uORF can be functional, thereby further increasing the di-
versity of proteins from such genes (Calvo et al., 2009).
However, uORFs can also hinder translation of the functional ORF completely or
even cause the ribosome to stall on the mRNA. These mRNAs are considered ‘non-
functional’ because they cannot be translated into functional proteins. They are easily rec-
ognised and degraded by complexes such as the No-Go Decay, in the case of mRNAs with
stalled ribosomes, or Nonsense Mediate Decay (NMD) pathway, a system that degrades
most ‘non-functional’ mRNAs (McGlincy and Smith, 2008; Harigaya and Parker, 2010).
The most abundant class of ‘non-functional’ mRNAs which are subjected to degra-
dation through the NMD process are those containing premature termination codons
(PTCs) in the CDS. Such PTCs can arise from mutations in the DNA, errors of transcrip-
tion or splicing, RNA editing, or regulated AS. PTC-containing mRNAs can code for
truncated and potentially harmful proteins and are therefore mostly removed from the cell.
The precise and brilliant mechanism by which the NMD machinery discriminates between
functional mRNAs and most uORF- and PTC-containing mRNAs varies among eukary-
otes, but some of the core components are conserved (Conti and Izaurralde, 2005; Nyikó et
al., 2013). Higher eukaryotes have proteins bound to exon–exon junctions after splicing,
known collectively as the Exon Junction Complex (EJC). These EJCs are normally re-
moved by the first translating ribosome (Chang et al., 2007). In PTC-containing mRNAs,
EJCs > 50–55 nt downstream of the PTC enhance the activation of NMD (McGlincy and
Smith, 2008; Nyikó et al., 2013). In this EJC-dependent NMD pathway, up-frameshift
(UPF) proteins UPF2 and UPF3 are part of the EJC and interact with the ribosome which

32 Chapter 1
is paused at the PTC and recruits translation termination factors. UPF1 is then recruited as
the first step in degradation of the transcript (Chang et al., 2007). In yeast, the NMD pro-
tein UPF1 also promotes proteolysis of the nascent polypeptide, ensuring that the unsafe
protein fragment does not interfere in cellular processes (Kuroha et al., 2009).
Functional mRNAs are usually not recognised by the NMD machinery because
their stop codons are frequently present in the last exon (Nagy and Maquat, 1998). A sec-
ond mechanism to trigger NMD is now recognised in a wide range of species, which is
NMD due to long 3’ UTRs (Kalyna et al., 2012). In normal mRNAs, the ribosome reaches
the authentic translation stop codon where it recruits the translation release factors and an
interaction occurs between the ribosome, eRF and poly(A) binding proteins (PABP) bound
to the poly(A) region. This interaction is the signal to tell the ribosome that it has reached
the end of the mRNA and to release the mRNA and polypeptide chain. If a PTC occurs in
the transcript, depending on where this occurs, the interaction with PABP proteins will be
prevented or impaired (e.g. by an unusually long 3’ UTR), leading to recruitment of UPF
proteins and NMD (Rebbapragada and Lykke-Andersen, 2009). Additionally, an mRNA
that contains uORF can also be subject to NMD (Nyikó et al., 2009). The ribosome can
begin translation at a uAUG and when it reaches the uORF stop codon it can trigger
NMD by the long 3’ UTR or EJC-dependent mechanism. Finally, functional or alterna-
tively spliced mRNAs with 3’ UTR introns can also be degraded by NMD if the splice site
junction/EJC is > 55 nt from the authentic stop codon (McGlincy and Smith, 2008).
Alternative splicing can generate PTC-containing transcripts which are targeted by
NMD. This process has been termed Regulated Unproductive Splicing and Translation
(RUST) (Lareau et al., 2007). One example is the SR and hnRNP proteins that can regulate
their own splicing so as to produce mRNAs targeted for NMD (McGlincy and Smith,
2008). This negative feedback control allows for crucial homeostatic or oscillatory levels of
these splicing factors (example in Section 1.8.1) (McGlincy and Smith, 2008).

33 Chapter 1
There are also ways by which AS can regulate mRNAs. For example, AS can regu-
late the presence of miRNA-binding sites on the mRNA, consequently affecting mRNA
stability (Kelemen et al., 2013). Additionally, AS can affect mRNA sub-cellular localisa-
tion, targeting it to different compartments, depending on the stimulus (Kelemen et al.,
2013).
In summary, transcript and protein levels can be altered co- or post-
transcriptionally through AS. This is most often achieved by inclusion of uORFs or PTCs
in the mRNA, which typically affects mRNA translation and stability, respectively. Re-
garding mRNA stability, NMD is the most common mechanism that degrades PTC-
containing transcripts, avoiding production of proteins with partially disrupted domains,
which could act as dominant negatives. Overall, quantitative control of gene expression
through AS is crucial to physiological and developmental processes. Therefore, several
mRNAs previously regarded as ‘non-functional’ or having ‘splicing errors’ actually have a
key role, for their regulated synthesis helps to control protein levels and, consequently, cell
responses.
1.4.3 –Alternative splicing in diseases
Pre-mRNA splicing must occur in a very precise and controlled way if a gene is to
be expressed correctly. In humans, most erroneously spliced transcripts are removed by the
cell but some remain, and can constitute either the cause or consequence of diseases (Tazi
et al., 2009). Disease-related AS events are mostly caused by point mutations and deletions,
but they also occur when there are changes in the cell microenvironment such as low pH
or hypoxia (Kelemen et al., 2013). For example, AS of Cyr61, coding for a matricellular
protein with proangiogenic capabilities, is induced under hypoxia, which has potential bio-
logical consequences in breast cancer progression (Hirschfeld et al., 2009). Interestingly, of

34 Chapter 1
all the mutations causing diseases in humans, 50% affect cis- and trans-acting splicing ele-
ments, affecting AS regulation (Wang and Cooper, 2007). Aberrant alternative transcripts
are more likely to cause diseases in tissues with a complex proteome, for instance neurons,
muscles and cells of the immune system (Barta and Schümperli, 2010).
In general, there are two main types of mutations that cause disease through effect
on the production of specific proteins. Firstly, some mutations introduce PTCs or affect cis
splicing signals, which can be either splice sites (15% of diseases) or binding sites for splic-
ing factors, altering splicing patterns. Examples of diseases caused by such mutations are
β-thalassemias and Duchenne muscular dystrophy (Tazi et al., 2009). The second main
group of mutations are mutations which affect splicing factor genes themselves. Such mu-
tations affect the abundance or activity of splicing factors which can affect the splicing/AS
of many downstream genes. Examples of diseases caused by such mutations are retinitis
pigmentosa (Wilkie et al., 2008), frontotemporal lobar dementias and spinal muscular atro-
phy (Tazi et al., 2009). In addition, some mutations affect intricate regulation of specific
genes. One such example is Prader–Willi syndrome where AS likely causing a disease in-
volves a snoRNA. The prevalent role of snoRNA is to guide rRNA processing but during
evolution some of them lost complementary sequence to rRNAs and developed comple-
mentarity to mRNAs instead (Kishore and Stamm, 2006; Bazeley et al., 2008; Ender et al.,
2008; Saraiya and Wang, 2008). The human snoRNA HBII52 has complementarity to ex-
on 5 of the brain-specific serotonin 2C receptor (5HT2CR) gene. This interaction, at the pre-
mRNA level, represses an internal 3’ ss of exon 5, which would otherwise be used to pro-
duce a non-functional receptor (Kishore and Stamm, 2006). Therefore, the presence of
HBII52 snoRNA is essential for expression of functional 5HT2CR. In Prader–Willi syn-
drome patients, most snoRNAs from the HBII family are not present due to a deletion, in-

35 Chapter 1
cluding HBII52. As a consequence, no functional receptor is expressed, which ultimately
causes the clinical features seen in patients with Prader–Willi syndrome (Tazi et al., 2009).
The involvement of AS in cancer is greatly studied. A large number of splicing al-
terations occur in tumourigenesis and despite most of them resulting from the malignant
phenotype, some AS events are required for cancer formation and development (Tazi et al.,
2009). In fact, all steps of cancer progression depend on AS, including cell cycle control,
survival, and metastasis (David and Manley, 2010). An interesting example is the AS of
apoptotic genes in cancer cells. AS of these genes often results in isoforms with opposing
roles that either promote or prevent cell death (Schwerk and Schulze-Osthoff, 2005). This
phenomenon was initially observed in the b-cell lymphoma x (BCLX) gene in humans. The
BCLX pre-mRNA can be alternatively spliced into BCLX long (BCLXL) or BCLX short
(BCLXS) transcripts, coding for proteins with anti- and pro-apoptotic activities, respective-
ly. The long isoform is obtained when the alternative 5’ ss of intron 2 is used, lengthening
exon 2 to encode an additional 63 amino acids (Boise et al., 1993). AS in cancer cells in-
creases production of the long isoform, subsequently increasing cell survival. This can be
used as a therapeutic target, as artificially synthesised oligonucleotides that bind to the al-
ternative 5’ ss used in BCLXL blocks splicing cleavage at this site (David and Manley,
2010). As a consequence, splicing of the upstream 5’ ss (used in the BCLXS transcripts) is
enhanced, inducing apoptosis (Mercatante et al., 2002).
Individual and genome-wide studies of disease-related AS have assisted in deci-
phering the splicing code. This knowledge allows the development of splicing-based thera-
peutic approaches. These therapies can be achieved by using small-molecules, antisense
oligonucleotides, or introducing trans-splicing events that reverse splicing of target genes or
create new splicing patterns to treat genetic disorders and alleviate symptoms (Wang and

36 Chapter 1
Cooper, 2007). Therefore, AS is not only the cause or consequence of many diseases, but
also a solution.
1.4.4 – Alternative splicing in developmental control
AS has a crucial role in the development of multicellular eukaryotes. In fact, almost
all genes involved in metazoan development are alternatively spliced (Lopez, 1998). These
alternatively spliced forms are expressed at particular times and in specific tissues, and they
either have significant differences in function that control major developmental decisions
or provide subtle but selectively advantageous fine-tuning roles in developmental control
(Lopez, 1998).
AS controls genes in eukaryote development from before birth/germination until
after death (Kelemen et al., 2013), but the majority of AS changes occur when there is a
pronounced change in morphology, for instance the transition from embryo to larva
(Irimia et al., 2009). In humans, AS is especially crucial to genes that contribute to neu-
ronal differentiation (Grabowski, 2011) and testis development (Yeo et al., 2004), but it al-
so plays a significant role in the epithelial-to-mesenchymal transition (Biamonti et al.,
2012) and heart development (Xu et al., 2005), among many others.
The best example of developmental control through AS comes from studies of the
sex determination pathway in D. melanogaster. In female flies, this pathway begins with the
presence of two X chromosomes that confer early expression of the active, full-length sex-
lethal (Sxl) protein (Black, 2003; Venables et al., 2012). Sxl is a transcription factor and
splicing regulator, which also regulates its own splicing in a positive feedback loop. It binds
near the alternative exon 3 of the SXL pre-mRNA, which contains a premature stop co-
don. This binding leads to exon 3 skipping, which allows the full-length Sxl protein to be
expressed (Black, 2003). Subsequently, active Sxl represses genes of male organ develop-

37 Chapter 1
ment and activates genes dictating female organ development. Conversely, males are not
able to produce early active Sxl nor skip exon 3 of the same gene, so that only truncated
and inactive Sxl protein is present (Black, 2003; Venables et al., 2012). In the absence of
active Sxl, the gene expression cascade for male development is initiated. The continuation
of the sex determination pathway in both males and females has more examples of gene
AS control, for instances transformer and doublesex (Black, 2003; Venables et al., 2012).
1.5 – Alternative splicing in plants
Although current AS knowledge indicates that AS is essential for higher eukaryotes
in general, most of this knowledge comes from studies in metazoans. In fact, plant AS was
considered rare until a decade ago (Reddy, 2007). Recent work confirms that it is also
common and essential in plant gene expression, generating complex transcriptome and
proteome diversity (Reddy, 2007; Syed et al., 2012). However, the magnitude of the latter
role in the plant genome remains to be uncovered (Severing et al., 2009; Severing et al.,
2011). The recently discovered high frequency of AS in Arabidopsis (Marquez et al., 2012)
has also been described in other plant species, including crops (Staiger and Brown, 2013).
1.5.1 – Characteristics of AS in plants compared to animals
A number of AS differences are observed between plants and animals and the larg-
est difference is related to the frequency of different AS types (Table 1.1). The most com-
mon type of AS event in plants is intron retention, which is rare in animals. In contrast,
alternative exons are relatively rare in plants, but the most common type of AS in animals.
Accordingly, intron-definition is significantly more common in plants (Xiao et al., 2007),
whereas exon-definition is more prevalent in animals (McGuire et al., 2008), thus elucidat-
ing their preference for type of AS. The evolutionary reason for these differences are poorly

38 Chapter 1
understood but may reflect both differences in gene structure and technical consequences.
For example, the majority of plant introns are relatively short (e.g. 80% of Arabidopsis in-
trons are between 80 and 120 nt) and when RNA is extracted for cDNA synthesis, tran-
scripts which have not been completely spliced might enter EST databases as cases involv-
ing IRs. In animals, where many introns are thousands of nt in length, such transcripts are
not captured. In addition, it is reasonably clear that alternative exons allow for greater pro-
tein diversity than intron retention, like the example of alternative exons in the DSCAM
gene (detailed in Section 1.4.1) (McGuire et al., 2008). In plants, greater protein diversity is
easily achieved through whole or partial genome duplications, which are not common in
animals, as well as gene duplications and therefore reduce the need for a high frequency of
alternative exons in plants to increase protein diversity (Kim et al., 2008a).
Table 1.1: Extent of alternative splicing in plants and animals.
Organism AS Intron
retention c Alternative
exon c
Alt. 3’ and/or 5’ ss c
Adds PTC c
Reference
Arabidopsis 61% a 40% 3% 31% 50% (Reddy, 2007; Marquez et al.,
2012)
Rice 48% b 54% 14% 33% 48% (Reddy, 2007; Lu et al., 2010a;
Zhang et al., 2010)
Human 95% a 5% 58% 37% 46% (Reddy, 2007; Pan et al., 2008;
Saltzman et al., 2008)
Mouse 57% b 2% 16% 8% 43% (Pan et al., 2006; Chacko and
Ranganathan, 2009) a Approximate percentage relative to total number of intron-containing genes. b Approximate percentage relative to total number of genes. c Approximate percentage relative to total number of AS events.
Additionally, different cis- and trans-acting elements are likely to be involved in AS
variation between plants and animals. Some possible reasons are: i) plant introns are richer
in uracil (U) and are significantly smaller when compared to vertebrates (Reddy, 2007;
Rogozin et al., 2012); ii) the polypyrimidine tract is a strong splicing signal in animals but

39 Chapter 1
intermediate in plants (Schwartz et al., 2008); and iii) plants have a higher diversity of splic-
ing-related proteins compared to metazoans (Reddy and Shad, 2011). The presence of
more than one splicing-related homologue in the Arabidopsis genome is due to several du-
plication events. These close protein homologues might therefore have acquired different
regulatory splicing activities in evolution. This occurrence is particularly evident among
the SR proteins genes (Barta et al., 2012). For example, while there is a single ASF splicing
factor in humans, Arabidopsis has four members of the SF2/ASF-like splicing factor fami-
ly, with distinct expression patterns and activities (Barta et al., 2012).
There are also several AS similarities between plants and animals. For example, the
frequency of 5’ (GU) and 3’ (AG) ss usage and their consensus sequences are relatively
similar among higher eukaryotes (Reddy, 2007; McGuire et al., 2008). Additionally, alter-
native 3’ ss are used approximately two-fold more often than alternative 5’ ss in most
plants and animals (Marquez et al., 2012; Walters et al., 2013). Thirdly, plants and animal
genes have more AS events in the 5’ UTR than in the 3’ UTR, which can affect mRNA
transport, translation and stability (Reddy, 2007). Another example of AS similarity is re-
garding PTC-containing mRNAs. Lastly, about 50% of alternative splicing events in both
plants and animals introduce PTCs, which potentially target the mRNA to NMD or in-
crease protein diversity (Section 1.4.2) (Reddy, 2007).
1.5.2 – Function of AS in plants
AS was first described in plants many years ago but over the last 5 or so years there
has been an explosion of studies demonstrating the widespread natures of AS with in-
volvement in many aspects of physiology, development and stress responses (Reddy, 2007;
Syed et al., 2012; Staiger and Brown, 2013). The first AS event identified in plants was in
the RIBULOSE-1,5-BISPHOSPHATE CARBOXYLASE/OXYGENASE (RUBISCO) ACTI-

40 Chapter 1
VASE gene of spinach and Arabidopsis (Werneke et al., 1989). AS of RUBISCO ACTIVASE
pre-mRNA generates two mRNA isoforms that code for active protein isoforms differing
only at the carboxyl terminus. This difference allows only the large isoform to be redox
regulated (Zhang et al., 2002).
DNA mutations affecting AS can contribute to plant adaptation and evolution and
crop improvement. One well-known example is in the WAXY (WX) gene in rice, which
encodes a granule-bound starch synthase that increases amylose content in the endosperm
(Larkin and Park, 1999). Higher levels of amylose interfere with starch hydrolysis and im-
pair rice palatability, but have beneficial effects on human health because they prevent ex-
cessive sugar release (Reed et al., 2013). Some rice cultivars have a functional WX protein
and consequently high levels of amylose, whereas other rice cultivars have a mutation that
reduces the level of functional WX proteins, decreasing amylose content. This mutation is
a G-to-T polymorphism at the 5’ ss of intron 1 in the WX gene that reduces splicing effi-
ciency of this intron (Cai et al., 1998; Hirano et al., 1998). As a result, splicing errors occur,
including retention of intron 1, which introduces uORFs that reduce mRNA stability and
translatability (Cai et al., 1998; Isshiki et al., 1998; Larkin and Park, 1999). Therefore, a
single-nucleotide polymorphism in the WX gene allows for AS events that reduce WX pro-
tein levels, having a significant impact on rice grain traits.
As sessile organisms, plants are strongly influenced by environmental changes in
ambient light, temperature, water and salt content in the soil, among other abiotic stress
factors. AS plays an important role in plant resistance to abiotic stress. For example, low
temperature induces AS in many genes (Staiger and Brown, 2013), including the INDE-
TERMINATE DOMAIN 14 (IDD14) gene, a transcription factor in Arabidopsis. IDD14 un-
dergoes AS that potentially produce two protein isoforms: the functional IDD14α that ac-
tivates starch degradation, and IDD14β, which is expressed only in cold conditions (4 °C)

41 Chapter 1
and is a competitive inhibitor of the former (Seo et al., 2011). During cold nights, Ara-
bidopsis plants expressing both transcripts have lower rates of starch degradation and ac-
cumulate biomass. Contrastingly, during warmer nights (23 °C) plants do not express
enough IDD14β protein to inhibit active IDD14α, degrade starch during the night and fail
to accumulate biomass (Seo et al., 2011).
In addition to plant resistance to abiotic stress, AS plays an important role in plant
defence responses against pathogens. There is evidence of AS in several defence genes and
most research progress comes from studies of RESISTANCE (R) genes (Gassmann, 2008).
R genes are responsible for recognising pathogen avirulence factors and triggering defence
responses (Staiger et al., 2013). Most R genes encode a nucleotide binding site (NBS) in-
volved in signalling and a leucine-rich repeat (LRR) domain that controls protein–protein
interactions (Marone et al., 2013). A well-known example of an R gene regulated by AS is
the tobacco N gene, which is responsible for resistance against the viral pathogen tobacco
mosaic virus (TMV). In addition to NBS-LRR domains, the N protein has a
Toll/interleukin 1 receptor (TIR) domain involved in signal transduction (O'Neill, 2000).
The N gene produces two transcripts by means of AS, a short (NS) transcript that is more
prevalent in healthy plants and encodes the full-length protein, and a long (NL) transcript
that predominates 4–8 h after TMV infection and contains an alternative exon normally
within intron 3 (Dinesh-Kumar and Baker, 1999). This alternative exon shifts the protein
ORF, resulting in a truncated protein that lacks 13 of the 14 LRR domains (Reddy, 2007).
It is not known yet if NL is translated or not, but the AS that produces it is required to con-
fer complete resistance to TMV. Therefore, AS of the tobacco N gene is essential to disease
resistance because it regulates the correct ratio of NS and NL at the right time (Dinesh-
Kumar and Baker, 1999; Takabatake et al., 2006).

42 Chapter 1
There are several cases of AS affecting protein localisation in plants. One example
is the BWMK1 gene in rice, a member of the MITOGEN-ACTIVATED PROTEIN KI-
NASES (MAPK) family. OsBWMK1 pre-mRNA is alternatively spliced and produces tran-
scripts that code for proteins with different sub-cellular localisations (Koo et al., 2007). The
nuclear OsBWMK1 protein isoform is normally expressed at low levels but its expression
is induced under stress conditions. Moreover, defence signalling-related molecules induce
translocation of cytoplasmic OsBWMK1 isoforms to the nucleus (Koo et al., 2007). In the
nucleus, OsBWMK1 proteins mediate defence responses by activating expression of de-
fence genes (Koo et al., 2009).
AS controls spatial and temporal expression of numerous genes involved in plant
development (Iida et al., 2004; Staiger and Brown, 2013). In Arabidopsis, a recent tissue-
specific AS isoform was described for the YUCCA4 gene, which codes for a flavin-
dependent monooxygenase involved in auxin biosynthesis (Kriechbaumer et al., 2012).
YUCCA4 is expressed in all plant tissues and the fully spliced mRNA codes for a cytoplas-
mic protein. In flowers, however, a different AS event occurs, which produces mRNAs
coding for an additional C-terminal transmembrane domain (TMD) that enables the trans-
location of the alternative YUCCA4 protein to the Endoplasmic Reticulum membrane
(Kriechbaumer et al., 2012). Auxin is a major growth hormone in plants and compartmen-
talisation of auxin biosynthesis, by means of tissue-specific YUCCA4 tissue-specific AS is
crucial to plant development (Kriechbaumer et al., 2012). The above examples illustrate
some of the processes in which AS is involved and some of the functional consequences of
AS. For more comprehensive collection of AS in plants see Staiger and Brown (2013).

43 Chapter 1
1.6 – The circadian clock
Living organisms have had to cope with light/dark and warm/cold cycles every
day for the past 3.5–4 billion years (Nisbet and Sleep, 2001). The rhythm of these changes,
explained by the Earth’s rotation, allowed the development of a mechanism that antici-
pates such changes. This mechanism, known as the circadian clock (from Latin ‘circa diem’,
meaning: approximately a day), can organise the physiology and behaviour of most organ-
isms to optimise their fitness during both day and night (Green et al., 2002; Okamura,
2004; Chen and McKnight, 2007).
In eukaryotes, the circadian clock regulates diverse processes, from the cell cycle to
locomotor activity (Stoleru et al., 2004b; Chen and McKnight, 2007; Dibner et al., 2010),
and is so fundamental that disruptions in clock rhythm can cause cancer and various other
disorders (Dodd et al., 2005; Dubrovsky et al., 2010; Maury et al., 2010; Shi et al., 2013).
The diversity of processes controlled by the circadian clock further reflects the number of
genes under its control. Numerous genes have their expression clock-regulated (Hazen et
al., 2009; Hughes et al., 2012), but only a few genes actually establish and maintain the cir-
cadian clock. The core components of the circadian clock consist of a complex network of
genes, which are known as clock genes. They are mainly regulated by regulatory feedback
loops at the transcriptional, epigenetic, translational, post-translational, metabolic, and the
co- and post-transcriptional levels (Gallego and Virshup, 2007; Sanchez et al., 2011;
Hughes et al., 2012).
Circadian rhythm is generated endogenously and the expression of most clock
genes is not constant, but oscillates in a rhythmic fashion, generating a rhythm with a peri-
od of approximately 24 hours. This 24-hour period often persists even when the organisms
are subjected to special environmental conditions such as when seasons change or non-
oscillating (free-running) conditions (McClung, 2006). In these cases, clock genes modify

44 Chapter 1
their expression peak time (phase) and level (amplitude) (Figure 1.5), without severely dis-
turbing the period, to synchronise (match) their clock to that of the external cue, a process
called entrainment. Clock entrainment is optimised by the regulation of input genes that
sense environmental time cues (Zeitgebers). Common examples of zeitgebers are light,
temperature, DNA damage and food supply (Ashmore and Sehgal, 2003; Millar, 2004;
James et al., 2008; Oklejewicz et al., 2008; Challet, 2013). Clock input genes modify the
expression of core clock genes, resetting the clock to the new condition so that metabolic
output processes (e.g. gene expression, protein modification and changes in metabolite
levels) are adjusted accordingly. Therefore, the clock always ensures that the organism
profits optimally from environmental changes. More details of the clock mechanism, in-
cluding its evolution and the role of AS in clock regulation, are given below.
Figure 1.5: Putative clock gene expression in light/dark cycles (entraining conditions) and
constant light (free-running conditions) (Figure modified from(Harmer, 2009). Phase is the
time of the day when the gene expression reaches its maximum (expression peak). Ampli-
tude is half of the peak-to-trough distance. Period is the time to complete one full cycle.
1.6.1 – Evolution of the circadian clock
Around 2.5–5 billion years ago, extreme levels of ultraviolet irradiation were a se-
rious problem for primitive marine organisms and avoiding it was critical to survival. A
cyclic ‘escape from light’ mechanism was essential and it might have driven the origin and

45 Chapter 1
evolution of a ‘protoclock’ during the Precambrian era (Pittendrigh, 1965; Tauber et al.,
2004). Protection from sunlight was probably achieved by vertical migrations to lower
ocean depths and/or activation of light-sensing enzymes that repair UV-induced DNA
damage, such as photolyases (Tauber et al., 2004; Uchida et al., 2010). Additionally, it was
probably crucial to carry out certain steps of the cell cycle, mainly DNA synthesis, only
during the night (Hut and Beersma, 2011).
Two other factors might have contributed to the development and evolution of the
circadian clock: energy supply and oxygen levels. Regarding the former, photosynthetic
organisms developed a rhythmic energy-storage behaviour during the day, later used dur-
ing the night, allowing for increased fitness (Hut and Beersma, 2011). As for the latter,
with increasing oxygen levels, certain organisms, like yeast, developed both oxidative and
reductive respiratory cycles, which required cyclic DNA defence mechanisms against oxi-
dative damage (Tauber et al., 2004).
Therefore, organisms developed different circadian metabolic rhythms that fa-
voured their fitness during day and night. The circadian clock presumably originated,
through a succession of small evolutionary steps, because it efficiently organised these
chaotic combination of daily behaviours (Tauber et al., 2004). The centralised clock control
of most metabolic processes together with the clock’s ability to measure time, through a
self-sustained oscillation, have ultimately allowed for anticipation (planning) of environ-
mental changes (Hut and Beersma, 2011).
The low conservation of clock proteins among plants, fungi, metazoans, and some
prokaryotes suggests it originated independently in the ancestors of each one of these line-
ages (Young and Kay, 2001). Despite multiple clock origins, all organisms have adopted
an autoregulatory genetic network that maintains a self-sustained clock oscillation. This
network can be rather simple or extremely complex. Higher eukaryotes, in particular, have
46 Chapter 1
a highly complex clock regulation and function, driven by gene duplication events (Tauber
et al., 2004).
1.6.2 – The cyanobacterial clock
In the unicellular world, the most interesting organisms for studies of the clock
mechanism are cyanobacteria. They are among the oldest organisms on Earth and have
not changed much since their origin, possibly representing the only direct link with the an-
cient world (Tauber et al., 2004). The cyanobacteria Synechococcus elongatus is the prokaryot-
ic model system for clock studies and has provided great insights into the molecular func-
tion and components of the circadian clock (Mackey et al., 2011). The rather simple core
clock of Synechococcus is composed of three proteins: KaiA, KaiB, and KaiC (Ishiura et al.,
1998). KaiC, the oldest member (Tauber et al., 2004), has ATPase, autophosphatase and
autokinase activities (Dong et al., 2010). Autophosphorylation of KaiC is slow and temper-
ature-compensated, and it occurs upon stimulation by KaiA, but KaiC spontaneously
dephosphorylates when bound to KaiB (Villarreal et al., 2013). KaiC transcription, transla-
tion, and post-translational modifications are cyclic, repeating every 24 hours both in vivo.
Remarkably, KaiC post-translational modifications are also cyclic in vitro (Nakajima et al.,
2005; Kitayama et al., 2008). KaiABC interactions ultimately mediate rhythmic and topo-
logical changes in the status of the cyanobacterial chromosome, regulating the cell cycle
and transcription of all genes in S. elongatus (Woelfle and Johnson, 2006; Dong et al.,
2010).
1.6.3 – The Neurospora crassa clock
The filamentous fungus Neurospora crassa has an extensively analysed clock system
(Lakin-Thomas et al., 2011). It serves as an attractive model due to a visible manifestation

47 Chapter 1
of its internal clock: rhythmic production of alternating zones of mycelia and conidia every
24 hours, forming a linear pattern down a glass tube (Figure 1.6) (Baker et al., 2012). This
growth pattern, controlled by the circadian clock, allows for simple characterisation of core
clock mutants and identification of clock components.
Figure 1.6: Neurospora growth assay for clock studies (Figure modified from(Baker et al.,
2012). Glass tubes containing growth media are inoculated at one end and mycelia grow
down the tube in a linear fashion. Every 24 hours a developmental switch occurs: mycelia
growth alternates with the production of asexual conidia, a process controlled by the circa-
dian clock.
The first core clock gene discovered in Neurospora was frequency (FRQ) (Gardner
and Feldman, 1980; Baker et al., 2012). Transcription of FRQ is induced by the white collar
complex (WCC), which is formed by the transcription factors white collar 1 (WC1) and
white collar 2 (WC2) (Crosthwaite et al., 1997; Baker et al., 2012). Upon translation, FRQ
is stabilised by forming homodimers and binding to FRQ-interacting RNA helicase (FRH)
(Dunlap et al., 2007). This complex enters the nucleus, allowing FRQ to promote WCC
phosphorylation, which results in WCC removal from the FRQ promoter. FRQ transcrip-
tion, consequently, is decreased (Baker et al., 2012). At a later time, FRQ becomes hyper-
phosphorylated, which induces FRQ ubiquitination and degradation (He et al., 2003). The
cycle then reinitiates.
Regulated AS of FRQ is extremely important in the function of the Neurospora cir-
cadian clock. Temperature regulates AS of an intron located in the 5’ UTR, which con-

48 Chapter 1
tains an in-frame uORF that gives rise to a longer isoform (FRQL) (Colot et al., 2005). This
regulation is important for fine-tuning the circadian mechanism because it allows robust
oscillations under a wide range of temperatures. Furthermore, there is significant conserva-
tion of this AS event within the Sordariaceae family (including Neurospora), confirming the
importance of AS for the proper regulation of the circadian clock (Colot et al., 2005;
Sanchez et al., 2011).
1.6.4 – The Drosophila melanogaster clock
The D. melanogaster molecular clock is one of the best understood clock mecha-
nisms. Studies of this model have provided several ground-breaking discoveries. For ex-
ample, the first study of a clock mutant was for the period (PER) gene in D. melanogaster and
it led to the expansion of clock genetics research (Konopka and Benzer, 1971; Zhang and
Kay, 2010). Moreover, further analyses of the same gene allowed for the first identification
of AS in a clock gene, described below (Majercak et al., 1999; Sanchez et al., 2011).
The D. melanogaster clock has two interlocked feedback loops, which function in the
brain and a variety of peripheral tissues (Benito et al., 2007). The PER gene operates at the
core of a PER/TIM loop (Figure 1.7A). During the light period, PER is phosphorylated by
the double-time (DBT) kinase, which targets PER for degradation. During the night, phos-
phorylated PER is stabilised by forming a complex with timeless (TIM) (Yu and Hardin,
2006). Increased DBT-PER-TIM levels allows for TIM phosphorylation and entry of the
DBT-PER-TIM complex into the nucleus. Subsequently, this complex removes transcrip-
tion factors, mainly clock (CLK) and cycle (CYC) proteins, from per and tim promoters,
repressing their transcription. At dawn, the photoreceptor cryptochrome (CRY) binds to
TIM, resulting in their degradation, followed by degradation of PER (Hardin, 2005; Yu
and Hardin, 2006).

49 Chapter 1
A) PER/TIM loop
B) CLK loop
Figure 1.7: Simplified diagrams of the D. melanogaster clock (Figure modified from(Hardin,
2005). A) PER/TIM feedback loop. P- represents protein phosphorylation; dashed lines
and black X’s mean protein degradation. B) CLK loop. In both diagrams, solid and dashed
lines represent sequential steps in the feedback loops, which can be regulated by additional
proteins that are not shown; wavy lines show mRNA expression, whereas red X’s shows
absence of their transcription.

50 Chapter 1
The second feedback loop, known as the CLK loop (Figure 1.7B), is closely inter-
locked with the PER/TIM loop. CLK-CYC clusters activate the expression of vrille (VRI)
and par domain protein 1ε (PDP1ε) (Yu and Hardin, 2006). As VRI accumulates in the nu-
cleus during the mid to late day, it represses CLK and CRY transcription. Accumulation of
PDP1ε near the end of the night, when VRI levels decline, allows it to bind CLK and CRY
promoters and activate their expression, which closes the loop (Yu and Hardin, 2006).
Both CLK and TIM undergo AS at their 5′ UTRs, but their consequences are still
unknown (Hughes et al., 2012). The best example of AS in the D. melanogaster clock occurs
in the PER gene. It produces two mRNA isoforms, one that retains a 3’ UTR intron and
another one that removes it (Majercak et al., 1999). This AS is regulated by temperature,
photoperiod, and other clock genes, affecting PER mRNA and protein levels. Changes in
PER oscillations, by virtue of AS, improve seasonal adjustments in locomotor behaviour
(Majercak et al., 1999; Sanchez et al., 2011). Interestingly, PER loss-of-function affects AS
of several output genes, suggesting a key involvement of this circadian gene in regulating
AS in D. melanogaster (Hughes et al., 2012).
1.6.5 – The mammalian clock
The master mammalian circadian clock is located in the suprachiasmatic nucleus
(SCN) of the anterior hypothalamus. It resets the internal time of organisms with the ex-
ternal light/dark cycles, thus synchronising the physiology and behaviour with the envi-
ronment (Barclay et al., 2012). Additional and different circadian clocks are present in the
majority of peripheral tissues, e.g. liver clock (van den Pol and Dudek, 1993; Reppert and
Weaver, 2001). Close interaction must exist between different central and peripheral clocks
to maintain robust circadian rhythms of physiology and metabolism (Barclay et al., 2012).

51 Chapter 1
Mammalian circadian clock genes are generally conserved with those of D. melano-
gaster (Yu and Hardin, 2006). However, the mammalian clock is more complex and most
genes are different and/or present in multiple versions. For example, while D. melanogaster
has one CLK gene, mammals have both CLK and neuronal PAS domain protein 2 (NPAS2)
genes carrying out overlapping functions (Crumbley et al., 2010). Additionally, mammals
have two CYC genes, known as brain muscle ARNT (aryl hydrocarbon receptor nuclear transloca-
tor)-like protein 1 and 2 (BMAL1 and BMAL2), three PER genes, and two CRYs, which are
the most important co-regulators of PERs other than TIM (Wijnen and Young, 2006). The
function of D. melanogaster VRI and PDP1ε are carried out by different proteins in mam-
mals: the nuclear receptor proteins REV-ERBα and RORα, respectively (Wijnen and
Young, 2006; Yu and Hardin, 2006).
Regulation of mammalian core clock and output genes also involves AS. Several
splice variants of BMAL1 and BMAL2 have been identified in human, mouse, and rat, but
the functional consequences of these AS events are not fully understood (Schoenhard et al.,
2002). In particular, AS of BMAL2 pre-mRNA can modify the N-terminal region of its en-
coded protein, increasing protein diversity, or even cause frameshifts that introduce PTC.
BMAL2 splice variants differ among tissues, possibly allowing different tissues to regulate
CLK:BMAL2 heterodimer function (Schoenhard et al., 2002). Recent studies in rats and
mice revealed that the circadian clock further regulates AS of output genes in spatial- and
temporal-dependent manners (McGlincy et al., 2012; Shapiro-Reznik et al., 2012). Togeth-
er, AS studies of core clock and output genes add a novel dimension to the regulation of
mammalian AS and clock genes.

52 Chapter 1
1.7 – The plant (Arabidopsis) clock
As sessile organisms, plants rely on the circadian clock to match several physiolog-
ical processes, such as leaf movement, immune responses and stomatal aperture according
to the appropriate time of day (Harmer, 2009; Pruneda-Paz and Kay, 2010; Wang et al.,
2011a). As an example, just before dawn, there is a peak in the expression of transcripts
encoding for products that protect the plant from ultraviolet radiation, which could be a
great advantage to protect the cell from photo-damage during the impending daylight
(Harmer et al., 2000; Hotta et al., 2007). Additionally, the expression peak of chlorophyll
biosynthetic genes is organised to occur four hours after dawn by the circadian clock
(Harmer et al., 2000), optimising chlorophyll content and carbon fixation during the day
(Dodd et al., 2005). Defence responses are also stronger when the plant is most likely to be
attacked (Wang et al., 2011a; Goodspeed et al., 2012). For example, plants synchronised
with the feeding behaviour of herbivores are less susceptible to herbivore attack than out-
of-phase plants (Goodspeed et al., 2012).
1.7.1 - The framework of the Arabidopsis clock
All plant cells presumably contain a circadian clock, but this clock is not identical
in all organs. The master plant circadian clock is located in the shoots, which parallels to
the mammalian master clock SCN. The plant analogue of mammalian peripheral clocks,
such as liver clock, is the root clock. Only a restricted set of genes are rhythmic in roots,
where photosynthesis-related signals from the shoot can reset the root clock, but the re-
verse does not occur (James et al., 2008). The general framework of the Arabidopsis clock,
mostly based on experiments using whole seedlings, is comprised of several interlocking
gene expression feedback loops (Figure 1.8) (Locke et al., 2006; Zeilinger et al., 2006;
Harmer, 2010; Pokhilko et al., 2010). The central loop is formed by CIRCADIAN CLOCK

53 Chapter 1
ASSOCIATED 1 (CCA1), LATE ELONGATED HYPOCOTYL (LHY) and TIMING OF
CHLOROPHYLL A/B BINDING PROTEIN 1 (TOC1 - also known as PSEUDO RESPONSE
REGULATOR 1, PRR1) (Alabadí et al., 2001). CCA1 and LHY are closely related and par-
tially redundant myeloblastosis (MYB) transcription factors that accumulate at dawn and
bind to the promoter region of TOC1, inhibiting its expression. Recent studies suggest
TOC1 is also responsible for reducing CCA1 and LHY expression (Gendron et al., 2012;
Huang et al., 2012; Pokhilko et al., 2012).
During the morning, CCA1 and LHY play parallel roles in the central loop, further
fine-tuning the clock. These genes induce expression of the transcriptional repressors
PSEUDO RESPONSE REGULATOR 7 and 9 (PRR7 and PRR9), which along with
PSEUDO RESPONSE REGULATOR 5 (PRR5) inhibit expression of CCA1 and LHY
(Locke et al., 2006; Zeilinger et al., 2006; Nakamichi et al., 2010). This molecular link be-
tween CCA1/LHY and PRR7/9/5 during the morning constitutes a second feedback loop
called the ‘morning loop’. Further regulatory clock control is carried out by CCA1 and
LHY through transcriptional inhibition of EARLY FLOWERING 3 and 4 (ELF3 and ELF4),
LUX ARRHYTHMO (LUX, also known as PHYTOCLOCK 1, PCL1), and GIGANTEA (GI)
genes (Nagel and Kay, 2012). In the ‘evening loop’, TOC1 represses expression of PRR5,
PRR7, PRR9, LUX, GI, and ELF4 (Gendron et al., 2012; Huang et al., 2012). An important
component of the evening loop is the Evening Complex (EC). The EC is composed of
ELF3, ELF4, and LUX and it represses transcription of PRR9 (Chow et al., 2012). Interest-
ingly, LUX represses its own expression (Helfer et al., 2011). Further post-translational
regulation takes place in the evening, such as GI degradation by ELF3 (Yu et al., 2008) and
F-box protein ZEITLUPE (ZTL) stabilisation by GI, allowing ZTL to control TOC1 pro-
tein degradation (Kim et al., 2007).

54 Chapter 1
Figure 1.8: Simplified schematic diagram of the 24-hour Arabidopsis clock. Feedback
loops of the core clock genes are represented in the centre. Full lines represent transcrip-
tional feedback loops, whereas dashed lines represent post-translational regulations. Green
lines are for activation, while red lines are for repression. For simplicity, the PRR3 com-
ponent was not included in the above regulatory network. Expression peaks of clock genes
are represented at different times of the day (Nakamichi, 2011). Several physiological pro-
cesses, indicated on the periphery of the clock, are regulated by clock genes (in brackets),
allowing them to occur at the right time of the day.

55 Chapter 1
In addition to self-regulation, core clock genes regulate expression of output genes
which are involved in several physiological processes (Figure 1.8). About one third of the
genome expression in Arabidopsis is controlled by clock genes (Covington et al., 2008).
Some examples are: i) CCA1 and LHY repress transcription of chlorophyll-related genes
(Lu et al., 2009) and optimise immune responses (Zhang et al., 2013a); ii) GI and ELF4,
among other clock genes, regulate flowering time (Kim et al., 2012); iii) the EC complex is
crucial to controlling hypocotyl growth (Nusinow et al., 2011); iv) TOC1 protects the plant
against drought partially through regulation of stomata aperture (Legnaioli et al., 2009);
and v) PRR7 regulates several genes involved in abiotic stress responses (Liu et al., 2013).
1.7.2 – Plant clock entrainment
All transcriptional feedback loops occur within 24 h in the Arabidopsis clock.
However, in constant conditions, the circadian rhythm in Arabidopsis takes 22 to 29 h to
complete, depending on ecotype (Michael et al., 2003). The endogenous circadian rhythm
is synchronised with the 24-h geophysical period through clock entrainment, which refines
the phase of the clock after every cycle, adjusting it to a period close to 24 h (Hotta et al.,
2007). Therefore, in addition to anticipation of light and temperature changes, the circadi-
an clock also senses these cues through multiple pathways. Temperature cycles are able to
entrain the clock in constant light, however, there are significant differences between light
and temperature entrainment. A warm–cold temperature cycle in etiolated seedlings is on-
ly able to entrain a small proportion of the total transcripts entrained by light–dark cycles
(Wigge, 2013). Adding to the complexity, plant responses to light and thermal-cycles are
intimately connected and highly context dependent.
Clock entrainment from both light and temperature cues affects diverse physiologi-
cal processes, for example the transition from vegetative to reproductive phases (Hayama

56 Chapter 1
et al., 2003; Cao et al., 2005b; Mizoguchi et al., 2005; Kim et al., 2008b; Más and Yanovsky,
2009). Some plants have an efficient light and temperature resetting mechanism, so they
are better adapted to fluctuating photoperiods and temperatures, typical of seasons in high
latitudes (Pittendrigh and Takamura, 1989; Flood et al., 2000; Turner et al., 2005; Hotta et
al., 2007; Abbo et al., 2009). Other plants do not respond to photoperiod and can be sus-
ceptible to cold, decreasing fitness significantly when grown in regions or seasons beyond
their normal conditions (Turner et al., 2005; Cober and Morrison, 2010). Therefore, photo-
period and temperature responsiveness provides a selective advantage, raising the question
of which plant receptors transduce the light and temperature signals to the clock and how
the clock responds to the signals in order to control the overall biology of the plant.
For light signalling, photoreceptors such as phytochromes and cryptochromes are
the molecules responsible for transferring information on light phasing to the plant circadi-
an clock and changing the phase and period of clock gene expression (Hotta et al., 2007;
Kim et al., 2007; Wenden et al., 2011b). Direct light input on the expression of core clock
genes also occurs. For example, ZTL interactions with GI, and consequent stabilisation of
ZTL, is strongly enhanced by blue light (Kim et al., 2007). CCA1 post-transcriptional and
LHY translational regulation are also directly affected by light (Kim et al., 2003; Yakir et al.,
2007). Upon light entrainment, a number of circadian-regulated output processes are reor-
ganised at the molecular level, generating the appropriate biological responses (Harmer et
al., 2000; Hotta et al., 2007). As an example, shaded plants perceive decreased light
through photoreceptors, which in turn affect expression of circadian genes (e.g. PRR5),
leading to a series of gene activations responsible for stem and petiole elongation to max-
imise light incidence (Salter et al., 2003; Takase et al., 2013).
The link between the circadian clock and temperature is also of great interest. Cold
temperatures affect the biochemical properties of most enzymes, including those involved

57 Chapter 1
in the circadian clock. Slower enzymes could slow down the pace of the circadian rhythm
and affect anticipation responses. However, plants can entrain the temperature cue in the
clock to compensate for changes in reaction rates, and thus maintain the period (Hotta et
al., 2007) (see Section 5.1). In Arabidopsis, this ‘temperature compensation’ is poorly un-
derstood but it probably involves CCA1, LHY, GI, PRR7, PRR9, and ELF3 (Salomé and
McClung, 2005; Gould et al., 2006; Salomé et al., 2010; Thines and Harmon, 2010;
Boikoglou et al., 2011). More recently, it was discovered that temperature entrainment and
compensation could involve temperature-dependent alternative splicing of some clock
genes (James et al., 2012a, 2012b, see below).
1.8 – Cross-talk between AS and the Arabidopsis clock
AS affects many plant processes and functions and is a common co- and post-
transcriptional regulatory mechanism. The circadian clock also controls diverse genes and
processes in plants. Therefore, it is not surprising that cross-talk exists between AS and the
circadian clock in plants. Recently, numerous cases of clock control over AS, and AS regu-
lation of clock genes have been identified in Arabidopsis. This cross-talk, summarised be-
low, controls many aspects of the overall biology of the plant, being crucial for efficient
adjustment of biological responses to daily environmental changes.
1.8.1 – Clock control over AS
A two-day time course analysis of Arabidopsis plants under free-running conditions
and using genome tiling arrays detected almost 500 introns having rhythmic expression
(Hazen et al., 2009). About 43% occurred in genes that also showed oscillating expression,
but in 57% of the cases, the rhythmic intron occurred in a gene with arrhythmic expres-
sion, suggesting specific circadian control of AS. One explanation for this phenomenon is

58 Chapter 1
that the clock regulates key splicing factors, resulting in oscillating expression and a subse-
quent rhythmic effect on AS processes. A recent analysis has shown that the mRNA levels
of 83 out of 426 splicing-related Arabidopsis genes are regulated by the circadian clock,
constituting possible candidates that mediate circadian regulation of AS (Perez-Santángelo
et al., 2013).
The best studied examples of clock-regulated splicing factors are the hnRNP-like
proteins GLYCINE RICH RNA-BINDING PROTEIN 7 and 8 (GRP7 and GRP8). These
RNA-binding proteins regulate splicing of several genes (Streitner et al., 2012), and they
also negatively autoregulate and reciprocally cross-regulate their splicing (Schöning et al.,
2008). The proteins bind to their pre-mRNAs and promote the use of an alternative 5' ss
that causes part of an intron to be included in the mRNA transcript and introduces a PTC.
As a result, these alternative transcripts are subjected to degradation through the NMD
process, affecting their oscillatory expression.
1.8.2 – AS regulation of clock genes
Extensive AS has been identified in core clock genes. Genome-wide identification
of rhythmic introns, mentioned previously (Section 1.8.1), detected circadian AS of clock
genes such as intron 2 of ELF3, which creates a PTC (Hazen et al., 2009). This rhythmic
AS event could produce a truncated protein relatively similar to one expressed in the early
flowering and arrhythmic elf3-1 mutant (Hicks et al., 2001), suggesting crucial involvement
of this AS in flowering and clock control.
Alternatively spliced products have been identified in Arabidopsis clock genes in
response to temperature (Filichkin et al., 2010; James et al., 2012a). In addition to altered
transcript levels, temperature variation reduces or increases abundance of about 15 AS
events from different clock genes (LHY, CCA1, PRR9, PRR7, PRR5, PRR3 and TOC1). The

59 Chapter 1
majority of these events introduce uORFs or PTCs, which induce NMD and reduce levels
of functional protein. In some cases, AS events reach up to 10–50% of the total transcripts
or are virtually absent in some conditions (James et al., 2012a). These temperature-
dependent AS events may play a key role in clock temperature compensation.
For LHY, in particular, low temperature reduces the total transcript and protein
levels. This reduction is due to the increase of AS transcripts which retain a uORF-
containing intron and/or include a PTC-containing alternative exon (E5a) at the expense
of fully spliced mRNAs. It is noteworthy that reduced LHY mRNAs occur while transcrip-
tion rate remains the same (i.e. promoter strength is not affected). In this case, low LHY
expression is probably a result of the post-transcriptional control that generates NMD-
degraded mRNAs (James et al., 2012a).
Interestingly, LHY and CCA1 which are highly related, partially redundant genes,
show completely different AS behaviour under low temperatures. Total transcript and pro-
tein levels of CCA1 have a transient increase, while alternative retention of intron 4 de-
creases at low temperatures (Filichkin et al., 2010; James et al., 2012a). Interestingly, AS of
intron 4 of CCA1 is observed in different plant species (Brachypodium, Oryza, and Populus),
pointing to a functional importance (Filichkin et al., 2010). Similarly, the partially redun-
dant PRR7 and PRR9 genes have different AS behaviours under different temperatures,
implying functional differences between them (James et al., 2012a).
1.8.3 – Regulators of clock AS
The plant AS regulatory network controls core clock functions. Very little is known
about the factors which regulate AS in clock genes. Recent studies have found that the cir-
cadian-regulated type II PROTEIN ARGININE METHYLTRANSFERASE 5 (PRMT5)
protein, also known as SHK1 KINASE BINDING PROTEIN 1 (SKB1), regulates AS of

60 Chapter 1
several genes (Deng et al., 2010; Hong et al., 2010a). PRMT5 targets PRR9, which is essen-
tial for the normal operation of the Arabidopsis clock (Sanchez et al., 2010). The mecha-
nism by which PRMT5 controls splicing is still unknown, but it could be through histone
or spliceosomal protein methylation (Sm proteins of snRNPs), which affect 5’ splice site
recognition (Sanchez et al., 2010; Perez-Santángelo et al., 2013). Of the four different PRR9
mRNA isoforms, only one leads to production of the full-length protein, whereas the other
three contain PTCs (e.g. intron 3 retention), which controls levels of PRR9 functional
mRNAs. One AS event, in particular, is an alt 5’ ss and it is an NMD target, controlling
PRR9 mRNA levels. In the prmt5 mutant, there are increased levels of NMD-targeted
PRR9 mRNAs and a strong reduction of the mRNA encoding the full-length protein, thus
confirming PRMT5 involvement in the correct splicing of PRR9 (Sanchez et al., 2010). In-
terestingly, loss-of-function of the D. melanogaster PRMT5 homologue, DART5, alters splic-
ing of PER and several clock-associated genes, resulting in disrupted locomotor activity.
Therefore, a conserved role of PRMT5 in the AS regulation of clock genes confirms the
importance of AS and the circadian clock (Sanchez et al., 2010).
Another putative regulator of AS in clock genes is the SNW/SKI-INTERACTING
PROTEIN (SKIP) gene in Arabidopsis. SKIP codes for a splicing factor that physically in-
teracts with SR45 to control splicing of PRR7, PRR9, and possibly other clock pre-mRNAs
(Wang et al., 2012). In the skip-1 mutant, unproductive AS variants of PRR7 and PRR9 in-
crease, lengthening the circadian period in a temperature-dependent manner. AS of PRR7
and PRR9, among others, are important for proper temperature compensation of the Ara-
bidopsis circadian clock (James et al., 2012a). Therefore, the temperature-related SKIP
phenotype and its control over PRR7 and PRR9 AS suggests SKIP is an essential input
gene for the clock temperature compensation mechanism (James et al., 2012a; Wang et al.,
2012). Similarly, a mutation within the Arabidopsis gene RBP SPLICEOSOMAL TIME-

61 Chapter 1
KEEPER LOCUS1 (STIPL1) induces a long period (Jones et al., 2012). STIPL1 is a homo-
log of the human spliceosomal protein TFP11 (Ntr1p in yeast) involved in spliceosome
disassembly. The stipl1 mutation reduces the splicing efficiency of several introns and alters
the accumulation of circadian-associated transcripts including increased levels of the intron
3 retained variant of PRR9 (Jones et al., 2012; Staiger and Brown, 2013).
1.9 – Knowledge translation from Arabidopsis to barley
Since 1941, Arabidopsis has been used a model plant, accumulating a rich collec-
tion of genetic information, that exceeds any other plant species (Srikanth and Schmid,
2011). However, understanding biological processes in other species, in particular crops of
high economic interest, is of utmost importance and can be enhanced by transferring
knowledge from model species. For example, the knowledge transferred from one species
to another helps to confirm the importance of certain processes in the overall biology of the
plant. In addition, this knowledge may offer new targets for optimisation of crop yield and
quality. Therefore, it becomes an attractive strategy to translate knowledge from Arabidop-
sis to crops with the proviso that evolutionary distance is likely to be reflected in differ-
ences between species (Spannagl et al., 2011). An interesting example of crop improvement
through knowledge translation was discussed by Silverstone and Sun (2000). The discovery
of how gibberellin-related genes function in Arabidopsis and the identification of ortholo-
gous genes in wheat helped improve certain characteristics of wheat such as grain yield
and growth statures (Silverstone and Sun, 2000). Additional studies targeted genes that
confer tolerance to various abiotic stresses in crops, for instance, drought stress (Dubouzet
et al., 2003; Zhang et al., 2008; Spannagl et al., 2011).
The recently established link between AS and the circadian clock in Arabidopsis
(Section 1.8) has not been examined to any extent in crop plants, although individual

62 Chapter 1
events in specific genes have been recognised (e.g. I4R in CCA1)(Filichkin et al., 2010).
Therefore, taking similar approaches, the translation of knowledge from Arabidopsis is a
practical way to expand AS and clock information in crops. However, in order to carry out
AS studies in a crop, it is necessary to know the group of clock gene homologues, their
gene structures and, the precise location and size of introns, as well as the presence of gene
duplications in the genome. Therefore, access to genomic data of the candidate crop spe-
cies is essential. DNA sequence information from several plant genomes are publicly
available and could be used for AS studies, for instance rice (Ouyang et al., 2007), potato
(Consortium et al., 2011), and barley (Consortium, 2012a).
1.9.1 – Barley (Hordeum vulgare L.)
Barley, a member of the grass (Poaceae) family, has an important role in human
history. Its use dates back thousands of years, before the development of agriculture and it
is one of the earliest cultivated crops, alongside wheat (Puruggannan and Fuller, 2009).
Upon domestication, cultivated barley diversified into several elite varieties with world-
wide use. Around 75% of barley production is used for animal feed, and it is also the best-
suited grain for malting. Malt is a key element in the production of beer and whisky
(Newton et al., 2011). Barley represents the fourth most abundant cereal in the world, be-
hind wheat, rice and maize (FAOSTAT, 2011).
1.9.1.1 – Barley genetics and AS
Barley is considered a model for plant genetic research, especially within the Trit-
iceae tribe, which includes bread and durum wheats, barley and rye. Barley is a diploid
species, unlike its wheat relatives, which are tetraploid or hexaploid, and it is therefore

63 Chapter 1
more amenable for genetics studies. Additionally, barley is a self-fertilising crop, which
facilitates reproduction in glasshouses by eliminating the need for pollinators.
A large collection of barley germplasm containing diverse cultivars and mutants
provides an extensive resource for gene discovery and breeding programmes for crop im-
provement (Druka et al., 2011). To advance gene discovery and genome-assisted crop im-
provement, a barley genome gene space was recently published and provides access to the
majority of barley genes in a highly structured physical and genetic framework (see Section
3.1.3) (Consortium, 2012a). Moreover, this work has identified extensive post-
transcriptional control over barley genes. In particular, extensive transcriptomic NGS
analysis has revealed that 73% of intron-containing genes undergo AS, mostly in a spatial
and temporal manner. Interestingly, around 20% of alternative transcripts contained a
PTC (Consortium, 2012a). Despite such evidence of vast AS in barley, there are few well-
characterised examples of AS (Halterman et al., 2003), limiting a deeper understanding of
connections between barley AS and their functional biological roles (Consortium, 2012a).
1.9.1.2 – Barley clock genes and flowering
Barley shows a circadian rhythm at diverse levels such as at the transcript, protein
and physiological levels (Vallelian-Bindschedler et al., 1998; Martínez et al., 2003; Lillo,
2006; Nagasaka et al., 2009). However, the molecular mechanism underlying the estab-
lishment of these rhythms, i.e. the barley clock, is only beginning to be addressed. Only a
few putative barley clock genes have been identified and characterised well, such as GI,
PPDH1, ELF3 and LUX (Dunford et al., 2005; Turner et al., 2005; Faure et al., 2012;
Zakhrabekova et al., 2012; Campoli et al., 2013). Transcriptional analyses have also been
described for LHY (CCA1), PRR73, PRR59, and PRR95 (Higgins et al., 2010; Campoli et al.,
2012b; Faure et al., 2012).

64 Chapter 1
Flowering is a crucial developmental stage, and it is tightly regulated to optimise
reproductive success, which for the purposes of agricultural interest means seed production
or yield (further discussed in Chapter 4). Barley cultivars are divided into two major
groups depending on their flowering phenotype: namely winter and spring. Winter barley
plants have an efficient light response mechanism and/or promote early flowering, so they
are better suited to short growing seasons that are typical of high latitudes. Conversely,
spring barley varieties do not respond as well to photoperiod and are late flowering com-
pared to winter barley. As a result, spring barley plants have higher yield when grown in
long growing seasons (Flood et al., 2000; Turner et al., 2005).
Several genes control flowering time in plants, including several clock genes (de-
tailed information in Chapter 4). Natural and induced mutations in some barley clock
genes have considerably affected flowering time and extended the geographic range where
barley is grown (Turner et al., 2005; Jones et al., 2008; Faure et al., 2012; Zakhrabekova et
al., 2012). Additionally, there is evidence that the barley clock contributes to cold re-
sistance (discussed in Chapter 5) (Hemming et al., 2008). Therefore, the circadian clock has
a huge impact on barley traits and raises questions about its function and the molecular
basis which controls plant processes.
1.10 – Objective and aims of this work
The recent realisation that AS could be an important regulator of clock gene ex-
pression and function, particularly in response to low temperature, and the recent genera-
tion of the barley ‘gene-ome’, provided an ideal basis to undertake an analysis of the barley
clock and the impact of AS in this system. To address this overall objective, my key aims
were:

65 Chapter 1
1) To identify barley putative homologues of core circadian clock genes and select-
ed output genes using bioinformatic analysis;
2) To analyse core clock gene expression and clock outputs in circadian time cours-
es in light/dark and free-running light/light experiments to establish circadian behaviour
and provide evidence that they are, in fact, clock-related genes.
3) To examine the phenotypic effect of mutations in two core clock genes, ELF3
and PPDH1, and whether they affect the expression of other clock-related genes, thus
providing information that contributes to better understanding of the clock functions.
4) To define the AS events in barley clock genes and use this information to estab-
lish an RT-PCR panel for expression and AS studies of barley clock and clock-associated
genes; and
5) To perform temperature transition experiments to identify difference in expres-
sion and splicing of core clock genes and presence of productive/non-productive tran-
scripts, using the RT-PCR panel developed.

66 Chapter 2
Chapter 2. General materials and methods
Unless stated otherwise, all basic molecular biology procedures, for example, aga-
rose gel electrophoresis of DNA and DNA digestion with restriction enzymes, were car-
ried out according to Sambrook et al. (1989). Methods specific to each Results chapter are
presented in the corresponding Chapter. (Sambrook et al., 1989)
2.1 – Plant growth conditions
2.1.1 – Plant material
Seed of all of the genetic lines used in this study were kindly provided by Professor
Robbie Waugh and Dr. Arnis Druka, from the James Hutton Institute, Dundee, UK. It
consisted of three barley lines:
• the two-rowed wild-type spring barley cultivar Bowman (PI 483237) (Franckowiak
et al., 1985). This line contains the naturally occurring monofactorial recessive
Hvprr37_ppdh1 gene.
• the Bowman near isogenic line (NIL) eam1.d (line ID BW281) (Druka et al., 2011)
is homozygous for the monofactorial dominant HvPRR37_PPDH1 gene from
KT1031 (a winter barley from Bulgaria, GSHO 1568). This is a BC8 line (8th back-
cross with Bowman) with a small gene interval, < 1 cM, introgressed on chromo-
some 2H.
• the Bowman NIL eam8.w (line ID BW290) (Druka et al., 2011) is homozygous for
the monofactorial recessive early heading k/Hvelf3 gene from Early Russian (natural-

67 Chapter 2
ly occurring variant, Clho 13839) (Franckowiak and Lundqvist, 2007). This is a
BC6 line with 1.5 cM introgressed on chromosome 1H.
2.1.2 – Growth cabinet: environment and treatment
An environmentally controlled cabinet was used, the Microclima 1000 model
(Snijders Scientific, The Netherlands). The cabinet had 0.91 m2 of floor area and 1.2 m of
growth height. Illumination of 400 μmol m−2 s−1 was provided by 12 daylight fluorescent
tubes and 3 red/far red fluorescent tubes.
Barley plants were grown in cereal compost (Appendix A1) and watered frequently
(daily or every other day if the soil was still moist). Humidity was kept at 70%. Artificial
daylight did not include dimming typical of sunrise or sunset. No crop protection treat-
ment was applied.
2.2 – RNA extraction
First, frozen tissue was ground, using mortars and pestles (sterilised and RNase-
free) chilled with liquid nitrogen, until a fine talc-like powder was produced. RNA from up
to 100 mg of ground tissue was extracted with the RNAeasy Plant MiniKit (QIAGEN,
UK) following manufacturer’s instructions. RNA preparations were DNase-treated (on
columns) to remove DNA using the RNase-free DNase (QIAGEN, UK), again following
the manufacturer’s instructions. Each RNA sample was quantified and quality assessed by
measuring sample absorbance at 230, 260 and 280 nm using a Nanodrop® 1000 spectro-
photometer (Thermo Fisher Scientific, USA). Samples with a 260/280 ratio outside the
range of 1.7 – 2.3 and/or a 260/230 ratio outside the range of 1.4 – 2.8 were cleaned using
phenol extraction (see 2.2.1 below).

68 Chapter 2
To detect any possible genomic DNA contamination, each RNA sample was sub-
jected to PCR amplification, using primers for HvPRR59 (Table 2.1), as described in Sec-
tion 2.4. DNA-free RNA samples were stored at -80 °C. Any samples with persistent ge-
nomic DNA contamination were subjected to an additional DNase treatment (Section
2.2.2).
2.2.1 – RNA clean-up using phenol extraction
RNA samples were diluted to 200 µL using DEPC-treated water (Appendix A2).
The same volume (200 µL) of phenol solution saturated with 0.1 M citrate buffer, pH 4.3
(Sigma-Aldrich, UK), was added and the solutions were vortexed. Subsequently, samples
were centrifuged at 21,100 × g at 4 °C for 2 min (Heraeus Fresco 21, Thermo Fisher Scien-
tific, USA). The aqueous phases were transferred to fresh RNase-free microcentrifuge
tubes (1.5 mL, Ambion®, Life Technologies), where 200 µL of a 24:1 mixture of chloro-
form (Thermo Fisher Scientific, USA) and isoamyl alcohol (AnalaR NORMAPUR®,
VWR International, Belgium) was added and vortexed. Samples were centrifuged at
21,100 × g at 4 °C for 2 min. The aqueous phases were transferred to fresh RNase-free mi-
crocentrifuge tubes, where 5 µg of RNase-free glycogen (UltraPure™, Invitrogen, UK) was
added. Subsequently, 18 µL 3M sodium acetate (pH 5.5, DEPC-treated) (Appendices A2
and A3.1) and 500 µL ethanol absolute (Sigma-Aldrich, UK) were added. Samples were
placed in a freezer (-20 °C) overnight. The following day, samples were centrifuged at
21,100 × g at 4 °C for 30 min. After centrifugation, the supernatant was removed from
each sample with a glass Pasteur pipette (VWR International). Lastly, pellets were re-
suspended in 50 µL RNase-free water. RNA was quantified and quality assessed by meas-
uring absorbance, as mentioned previously (Section 2.2).

69 Chapter 2
2.2.2 – Additional DNase treatment
RNA samples were diluted to 76 µL using DEPC-treated water. The following com-
pounds from Promega (UK) were added to the RNA samples: 1 µL RNasin® Ribonucle-
ase Inhibitor (40 U), 10 µL RQ1 10X Reaction Buffer, 10 µL RQ1 DNase, 1 µL DTT. So-
lutions were incubated in a heating block (Grant, UK) at 37 °C for 30 min. RNA samples
were then cleaned up using phenol extraction, as described above (Section 2.2.1).
2.3 – DNA preparation
2.3.1 – Complementary DNA (cDNA) synthesis
cDNA was synthesised from 4 µg of total RNA (20 µL) using the Sprint RT Com-
plete – Double PrePrimed kit (Clontech Laboratories, Takara Bio Company, USA). In this
kit, both oligo (dT)18 and random hexamer primers are present. Reverse transcriptase reac-
tions were incubated in a thermal cycler (2720 Thermal Cycler, Applied Biosystems®, Life
Technologies, USA) for 1 h at 42 °C, followed by 10 min at 70 °C to terminate the reac-
tion. Subsequently, cDNA samples were diluted by adding 120 µL sterile distilled water
(SDW) and stored at -20 °C.
2.3.2 – Genomic DNA (gDNA) preparation
Leaf material (0.5 cm2) was ground in a microcentrifuge tube with a small plastic
pestle for about 15 seconds. Subsequently, 400 µL of gDNA extraction buffer (Appendix
A4) was added. Samples were vortexed for 5 seconds and centrifuged at 20,800 × g for
1 min (Microcentrifuge 5417C, Eppendorf, Germany). Supernatants (approximately
300 µL) were transferred to a fresh microcentrifuge tube, where 300 µL absolute isopropa-
nol (AnalaR NORMAPUR®, VWR International, Belgium) was added and mixed. After

70 Chapter 2
2 min, samples were centrifuged at 20,800 × g for 5 minutes to pellet the DNA. Superna-
tants were removed and pellets were dried by leaving tubes open for a few minutes. Then,
500 µL 10 mM Tris buffer (pH 7.5) was added to dissolve the DNA by gentle shaking (not
vortexed).
2.4 – Polymerase Chain Reaction (PCR)
2.4.1 – Primer design
Gene-specific primers were designed using the program PrimerQuest from IDT
(http://eu.idtdna.com/PrimerQuest/Home/Index) to amplify between 150–1200 bp of
genomic sequence. The following parameters were used: melting temperature, 59 °C to
65 °C; oligo length, 17 nt to 30 nt; GC content, 35% to 65%. Maximum self-
complementarity allowed was 4 nt and maximum primer dimer length was 5 nt. Suggested
primer pairs were aligned to paralogous barley genes using the ClustalW program (Larkin
et al., 2007; Tamura et al., 2011). No 3’ end complementarity to any paralogous gene was
allowed. This analysis was performed to ensure gene specificity of the primer pair. If a
primer suggestion from PrimerQuest was not possible, alternative gene-specific primers
were manually designed and quality assessed using the NetPrimer program
(www.premierbiosoft.com/netprimer/). In this alternative procedure, more relaxed pa-
rameters were used: melting temperature 50 °C to 70 °C; GC content: 30 to 70%.
2.4.2 – Primers used in expression and alternative splicing analysis
For each gene, one primer pair was designed to measure expression and AS. A rec-
ord of primers used can be seen in Table 2.1 and Appendix A5.

71 Chapter 2
Table 2.1: List of barley gene-specific primers and their sequences used for expression and
AS analyses. Primer name includes directions: Fw is Forward, whereas Rv is Reverse.
Genes Primer name Sequence (5’ 3’)
LHY HvLHY-Ex6Fw AACAAAGCGACCAGTTGTCAGCAC HvLHY-Ex8Rv TGAGCATGGCTTCTGATTTGCACG
TOC1 HvPRR1-Ex3Fw TCTGTTGTTGTCAAGTGCTTGCGG HvPRR1-Ex6Rv CAATGAGCTGTTTGCTGGAGTGCT
PPDH1 HvPpdH1-Ex1fw GGAGTTCCTACACAGGAAGACCAT HvPpdH1-Ex4Rv TCGTCGTTGCGATCATTGCTGTTG
PRR59 HvPRR59-Ex7Fw TGGACTGTGAGCGGTGAAACTGAT HvPRR59-3UTRv TCACCTGGGAAGGGAGGTATCAAA
PRR95 HvPRR95-Ex6FwB GCTGAACAACTCTGGCAACAGCAA HvPRR95-3UTRv TTCAAAGGACACACCAAATCGGCG
PRR73 HvPRR73-Ex3Fw TTAACTGAGGTCGCCATGCCTTGT HvPRR73-Ex5Rv TCATCATGACTGCCGCCACTGTTT
LUX HvLUXFw GGCTCCTTCCCGTCCTTCC HvLUXRv TTGACGTAGAGGCGGTACTTCTGGA
ELF3 HvELF3-Ex2Fw TCTCCAGATGATGTTGTCGGTGCT HvELF3-Ex4Rv TGAGATGGTGAAGCCTGGTTTCCT
ZTLa HvZTLa-5UTRFw AGGAGGAGGGATAGGAGGCG HvZTLa-Ex2Rv AGGGGTCAGATGCAACCTGT
ZTLb HvZTLb-5UTRFw TAGCGAGCGAGCGATGGGATA HvZTLb-Ex2RvB GGGCTTTAGTTGCAGACTCG
FKF1 HvFKF1-Ex1Fw CGGGGCTGGGGATGGCAGGC HvFKF1-Ex2Rv ATCGGTTGTTTACTGGAGCT
GI HvGI-Ex14Fw TCGTGCTACAGATGGGATGCTTGT HvGI-Ex16Rv GTCCACTGTTCAAGATGTCACGGA
CABa HvCABa-5UTRFw AACACACGACACACCTCTAGCCTT HvCABa-3UTRv TGTGCAGTTCACTGTAGTCGCCTT
GRP7a HvGRP7a-Ex1Fw GGGTTTAGCGGCGGGGAGAAGGAT HvGRP7a-3UTRv AACGGTAACAAGTAGCACGGAACG
GRP7b HvGRP7b-Ex1Fw GAGAAGGAGAGGAGGAGATCCATG HvGRP7b-3UTRv CGCGATCAAAAACACCACAGGACC
CO1 HvCO1-Ex1Fw TGTGAGAAGGCCACATCAGAGTGG HvCO1-Ex2Rv ATGTCTGGTCCACTTCCATTTCCGC
CO2 HvCO2-Ex1FwB GAGCAGCAAGGGAGCAATTA HvCO2-3UTRv TACGGTGCCCATCATTCCATGTGT
ELF4-like3 HvELF4-like3Fw TCAACAAGAGTTTGGAGAGGGA HvELF4-like3Rv ATGCTAGGAAACAGCAGGCACCAT
ELF4-likeA HvELF4likeAFw ATATCCATCTTCCTCCCGCACGCA HvELF4likeARv ATGGTCTGCCTCCTCTACTGTGT
FT1 HvFT1-5UTRFw ACAGCTTACATTGCTGCTCTCTGC HvFT1-3UTRv TGGATAATTTGGTGACTTGGCGGC
FT2 HvFT2-5UTRFw ACGCCTTCATTTCATCACACACCG HvFT2-Ex4Rv ACTACAAGGAGTCGATCATCACAT
2.4.3 – High Resolution (HR) RT-PCR
HR-PCR analysis, usually and hereafter referred to as HR RT-PCR, is based on
Simpson et al. (2008). For each primer pair, the forward primer was labelled with

72 Chapter 2
6-carboxyfluorescein (FAM). Each HR RT-PCR reaction was run in individual 0.2 mL
wells of a 96-well PCR plate (Thermo Fisher Scientific, UK) and usually contained 3 µL of
cDNA (template), 20 μM of each primer, 2 µL of 10 × PCR reaction buffer with MgCl2
(Roche, UK), 0.25 µL Taq DNA Polymerase (5 U/µL, Roche, UK), 1 µL dNTP (5 mM of
each dNTP, Invitrogen, Life Technologies, USA) and SDW up to a final volume of 20 μL.
The general PCR programme included an initial 2 min step at 94 °C, followed by 20–28
cycles of: 1) 15 sec at 94 °C; 2) 15 sec at 50 °C; and 3) 1 min and 30 sec at 70 °C (Simpson
et al., 2008). At the end of cycling, a final extension step of 5 min at 70 °C was performed.
For all experiments with a primer pair, negative controls containing RNA template and
one positive control containing gDNA were subjected to the same procedure to exclude
any possible contamination or detect PCR inhibitors. Subsequently, 1 μL of the resultant
PCR was mixed with 8.5 μL of Hi-DiTM formamide (Applied Biosystems, USA) and 0.05
μL of GeneScanTM 500 or 1200 LIZ® standard (Applied Biosystems®, Life Technologies,
UK) and loaded on the ABI 3730 automatic DNA sequencer (Applied Biosystems®, Life
Technologies, UK). PCR products were accurately sized, to single base pair resolution,
and quantified in Relative Fluorescent Units (RFU), which are the peak areas from spec-
tral data (proportional to amount of the product present), calculated by GeneMapper soft-
ware (version 3.7, Applied Biosystems®, Life Technologies, USA). To achieve meaningful
comparisons of transcript data, errors arising from unequal quantities of starting RNA
were removed by normalising clock transcript RFU to the mean RFU values of fully
spliced HvUBC21 and HvPP2AA2 transcripts (Equation 1).

73 Chapter 2
RFUclock
(RFUUBC+RFUPP2AA2)/2
Equation 1: Normalisation procedure for each HR RT-PCR. RFU: Relative Fluorescent
Units of a transcript calculated by the GeneMapper software. Clock: transcript of a candi-
date clock gene. UBC: fully spliced HvUBC21 transcript. PP2AA2: fully spliced HvPP2AA2
transcript.

74 Chapter 3
Chapter 3. In silico identification of barley homologues of
Arabidopsis genes involved in the circadian clock
3.1 – Introduction
3.1.1 – Gene discovery
Gene discovery is important to understanding biology and it forms the basis of mo-
lecular genetics. There are several methods and tools to discover new genes and determine
their function. Forward genetics, for example, seeks to identify the gene responsible for a
phenotype whereas reverse genetics starts with a putative gene and seeks to identify its
function.
The first gene to be sequenced and identified codes for the bacteriophage MS2 coat
protein (Jou et al., 1972). Since then, an overwhelming number of genes have been charac-
terised and sequenced with the greatest impact coming from sequencing of whole genomes
of prokaryotes and complex higher eukaryotes. In fact, since the establishment of massive-
ly parallel sequencing technologies it is no longer difficult to produce whole genome se-
quences and transcriptome data, providing a massive outpouring of gene and gene expres-
sion information. Nevertheless, it remains a challenge to identify genes within the billions
of nucleotides. The use of in silico analyses can greatly improve the detection of functional
and undefined genes, facilitating gene discovery (Yu and Hinchcliffe, 2011).
Common and useful in silico tools for gene identification include linkage analysis
(studies of segregating genetic markers), association mapping (for instance, examination of
single-nucleotide polymorphisms), and phenotype mining (for instance, experiments using
the RNA interference method). Moreover, there is an emerging, and possibly compulsory,
75 Chapter 3
research field that further facilitates gene discovery, ‘comparative studies’ (Yu and
Hinchcliffe, 2011; Yoon et al., 2012). In a comparative multi-genomic approach, candidate
genes with a crucial cellular function are compared (associated) across different genomes,
allowing for identification and prediction of function in other species. This is especially
useful in newly sequenced genomes or when original data are comparably sparse, as in the
case of uncharacterised human diseases (Prosdocimi et al., 2009; Yu and Hinchcliffe,
2011).
3.1.2 – Comparative studies
Comparative studies have rigorous guidelines in order to produce the correct inter-
pretation of results and avoid personal bias (Harvey and Pagel, 1991). First, input data
must have an evolutionary relationship, i.e. a common ancestor, to justify similarities.
Second, evolved entities must have a tree-like structure of relationships where nodes repre-
sent common ancestry. This makes phylogenetic trees essential for any robust comparative
analysis (Prosdocimi et al., 2009).
Phylogenetic studies frequently use terms to explain evolutionary relationships that
are also used in genome comparisons for gene discovery (Li et al., 2003). Homologues refer
to two major types of evolutionary relationships: orthologues and paralogues. The former
refers to genes evolved from a common ancestor by speciation, and the latter term applies
to genes that are related by duplication events (Fitch, 2000). A true orthologue is usually
under selective pressure to maintain function whereas paralogues accumulate mutations
that tend to alter the gene function. Conservation among orthologues facilitates their iden-
tification in comparative studies. Gene copies that accumulate mutations which eventually
disrupt gene function are considered pseudogenes. It is noteworthy that the precise defini-
tion of ‘pseudogene’ is highly debated (Balakirev and Ayala, 2003). The classical meaning

76 Chapter 3
defines it as a non-functional gene, with no expression or regulation (Pearson, 2008). In in
silico analyses, pseudogenes are easily detected by the loss of whole regions of genes or the
presence of PTCs or frameshift mutations that disrupt expression of a functional full-length
protein.
3.1.3 – A sequence-enriched barley genomic framework
An integrated and ordered physical, genetic and functional sequence database for
barley was recently released by the International Barley Genome Sequencing Consortium
(2012a). Barley is a diploid species (see Section 1.9.1) with a large haploid genome of
about 5.1 gigabases (Gb). The physical map developed by the Barley Consortium has
4.98 Gb of genome sequence from barley cultivar Morex (>50-fold haploid genome cover-
age). The gene-enriched genomic nucleotide information was contained within 9265
whole-genome shotgun sequence contigs. Alignment of the genomic contigs against deep
RNA sequence data (1.67 billion RNA-seq reads) obtained from eight stages of barley de-
velopment as well as 28,592 barley full-length cDNAs (Matsumoto et al., 2011) identified
more than 79 thousand transcript clusters. Of those, 26,159 were 'high-confidence' genes
with homology support to at least one plant reference genome (sorghum, rice, Brachypodi-
um and Arabidopsis).
The availability of the barley genomic framework allows the discovery of barley ge-
nomic sequences using bioinformatic analysis. As mentioned previously (Sections 1.7–1.9),
the molecular components of the plant clock have been extensively identified in Arabidop-
sis and rice (Murakami et al., 2007), whereas the corresponding pathways in barley are be-
ginning to be studied. In silico gene discovery approaches have been carried out for rice
(Murakami et al., 2007), soybean (Quecini et al., 2007) and canola (Brassica rapa) (Lou et al.,
2012). The economic benefits of manipulating clock genes in barley and the facilitation of

77 Chapter 3
in silico approaches have motivated the discovery and confirmation of the molecular mech-
anism of the barley clock described in this Chapter. As a result, we have identified the ge-
nomic sequences of 21 putative barley homologues of Arabidopsis core circadian clock
genes and selected clock-associated genes.
3.2 – Materials and methods
3.2.1 – Cross-species reciprocal BLAST
To identify plant orthologues of the Arabidopsis clock genes, cross-species recipro-
cal BLAST searches were performed using default settings. First, a BLAST search
(Altschul et al., 1990) was carried out using Arabidopsis gene sequences against various
databases (Table 3.1) to identify putative orthologous sequences in plants (Figure 3.1A).
Next, reciprocal BLAST analysis was performed using the top hit from all species against
the Arabidopsis database (Figure 3.1B). Subsequently, cross-species reciprocal BLAST
analysis was performed using the top hit from all species against each species’ databases
(Figure 3.1C). When the top hit of a reciprocal BLAST successfully identified the original
Arabidopsis sequence and the top hits from all other databases, these were taken as
orthologues. Any additional hits with an E-value similar to the top hit were subjected to
reciprocal BLASTs as well. When the second/third/etc. best hits successfully identified
the original Arabidopsis sequence and their orthologues in all other species, these were
taken as paralogues.

78 Chapter 3
Figure 3.1: Diagram of a cross-species reciprocal BLAST analysis. For simplicity, only
four plant databases are shown. Red arrows indicate the direction of BLAST analysis, i.e.
a sequence from one database was used to identify orthologues in the database of another
species. A) Arabidopsis gene sequences were used in BLAST searches against various da-
tabases. B) Reciprocal BLAST analysis of sequences from all species against the Arabidop-
sis database. C) cross-species reciprocal BLAST within all other species.
However, when a reciprocal BLAST with the top hit identified a different Ara-
bidopsis gene from the original candidate sequence, 1) the newly identified Arabidopsis
gene was used in cross-species reciprocal BLAST analysis; and 2) all gene family members
of the new and original Arabidopsis candidate genes were also subjected to cross-species
reciprocal BLASTs. Similarly, in this analysis with ‘additional’ Arabidopsis sequences,
when the top hit of a cross-species BLAST reciprocally identified the top hit from another
species, these were taken as orthologues. This analysis identified genes in Arabidopsis
which were related to the initial candidate clock gene and their putative orthologues in
other species. These cross-species reciprocal BLAST analyses of ‘additional’ Arabidopsis
genes also considered any additional hits with E-value similar to the top hit, subjecting
them to cross-species reciprocal BLASTs. When the second/third/etc. best hits successful-
ly identified a gene family member from all species, these were taken as paralogues. Over-
all, these analyses identified true orthologues and duplicated genes in the tested species.

Table 3.1: The database resources of 10 plant genome sequences analysed in this work.
Species Common name
Label on genes
Genomic database Annotation Version a
Arabidopsis thaliana thale cress At The Arabidopsis Information Resource (www.arabidopsis.org) (Lamesch et al., 2011) TAIR10
Brachypodium distachyon purple false brome
Bd The Munich Information Center for Protein Sequences (http://mips.helmholtz-muenchen.de/plant/) (Initiative, 2010)
MIPS/JGI Bradi release 1.2
Hordeum vulgare cultivar Morex
barley Hv Barley Morex assembly3 (Consortium, 2012a). (http://penguin/ngs/cereals_blast_page.html)
N/A
Oryza sativa ssp. japonica rice Os MSU Rice Genome Annotation Project Database and Resource (http://rice.plantbiology.msu.edu) (Ouyang et al., 2007)
MSU RGAP Release 7.0
Physcomitrella patens ssp. patens
moss Pp Phytozome (http://www.phytozome.net/) (Rensing et al., 2008) JGI v1.6
Solanum lycopersicum tomato Sl The International Tomato Genome Sequencing Consortium (http://solgenomics.net). (Consortium, 2012b)
ITAG Release 2.3
Solanum tuberosum Group Phureja DM1-3 516 R44
potato St Potato Genome Sequencing Consortium (http://www.potatogenome.net) (Consortium et al., 2011)
PGSC_DM_v3.4_gene or PGSC_DM_v3_scaffolds *
Sorghum bicolor sorghum Sb The Munich Information Center for Protein Sequences (http://mips.helmholtz-muenchen.de/plant/) (Paterson et al., 2009)
MIPS/JGI Sbi release 1.4
Triticum aestivum bread wheat Ta TaGDB (http://www.plantgdb.org/TaGDB/) GenBank v175 or PlantGDB-assembled unique transcripts (PUTs) v163b
Zea mays ssp. mays maize Zm The Phytozome (http://www.phytozome.net/). Line Mo17. Unpublished data pro-duced by the Maize Genome Sequencing Project.
Zmb73 v2 release 5b.60,
a When necessary, (re)annotation of genomic sequences was performed (detailed in Section 3.2.2).
* A few genes of potato have not been annotated but their sequence is present in the DM scaffold data version 3.
N/A: Not available.
79
C
hapter 3

80 Chapter 3
3.2.2 – Miscellaneous bioinformatic analyses
Gene sequences and names/identifiers were taken from the databases described in
Table 3.1. Schematic diagrams of genomic structures were initially made using the Exon-
Intron Graphic Maker program (Bhatla, 2009). In some cases, the annotated exon/intron
gene structures did not generate full-length ORFs, when compared to homologous genes.
Therefore, when necessary, re-annotation of genomic sequences was performed based on:
1) cDNA, EST and PUT (PlantGDB-assembled Unique Transcripts) data available
for the related species;
2) Presence of GT and AG dinucleotides for intron boundaries (5’ and 3’ ss, respec-
tively);
3) ORF maintenance of each exon;
4) Annotation of homologous mRNA/protein sequences.
Nucleotide sequence alignments were performed and they preserved codon struc-
ture of putative coding sequences (CDS). For this, nucleotide alignments were based on
the alignments of their deduced protein sequence using the ClustalW program (Larkin et
al., 2007; Tamura et al., 2011).
3.2.3 – Phylogenetic analysis
Gene tree estimation was performed using the neighbour-joining (NJ) method
(Saitou and Nei, 1987) available on MEGA software version 5.05
(www.megasoftware.net) (Tamura et al., 2011). The moss Physcomitrella patens was consid-
ered the outgroup of angiosperm species and were used to place the root of phylogenetic
trees. Statistical support for each branch on phylogenetic trees was generated from the
bootstrap test (2000 replicates; values shown when > 50%) (Felsenstein, 1985). The evolu-
tionary distances and branch lengths were computed using the Maximum Composite Like-

81 Chapter 3
lihood method (Tamura et al., 2004). Pseudogenes were not analysed in order to prevent
poorly-supported topologies on reconstruction of phylogeny from gene families (as sug-
gested by(Zimmer et al., 2007).
3.3 – Results
Arabidopsis clock-related genes were selected for a comparative approach to identi-
fy and confirm the core clock genes and some clock-associated genes in barley. When
adopting a comparative analysis, special attention should be given to the evolutionary dis-
tance between the species selected because orthology determination becomes more difficult
when species are evolutionarily distant (Prosdocimi et al., 2009; Yu and Hinchcliffe, 2011).
Barley and Arabidopsis share a common ancestor, their separation occurred more than 140
million years ago (Mya) and they have diversified considerably since then (Chaw et al.,
2004; Moore et al., 2007). To resolve this issue, additional species with whole genome se-
quence information from both dicot and monocot groups were included in the comparative
analysis. These species were: tomato, potato, moss (P. patens) and another five grasses:
Brachypodium distachyon, sorghum, bread wheat, maize and rice (Table 3.1).
The comparative approach adopted comprised of initial cross-species reciprocal
BLASTs, followed by genomic structure and phylogenetic analyses. At least 165 homo-
logues were identified in all species mentioned. In order to avoid repetitive description of
results, a brief summary from the BLAST and genomic analyses are found in Sections
3.3.1 and 3.3.2, respectively. Further detailed information from each gene, after the final
phylogeny studies, are presented in Section 3.3.3.

82 Chapter 3
3.3.1 – BLAST searches for core clock and clock-associated genes
To identify barley orthologues of core clock and some clock-associated genes as de-
fined in Arabidopsis, a robust in silico analysis was initially performed. It comprised of
cross-species reciprocal BLASTs using databases from nine different species (Table 3.1).
Initially, all core clock and some clock-associated candidate sequences from Arabidopsis
were used in BLAST searches against various databases. Selection of Arabidopsis clock-
associated candidate sequences was based on their role in AS regulation or plant flowering.
The candidate genes analysed were CCA1, LHY, TOC1 (PRR1), GI, ELF3, ELF4, PRR7,
PRR3, PRR9, PRR5, LUX (PCL1), FKF1, ZTL, CHE (TCP21), GRP7 (CCR2), GRP8, CAB2,
CONSTANS (CO) and FT. Subsequently, cross-species reciprocal BLAST analysis was per-
formed using best hit sequences from all species against all other species’ databases, includ-
ing Arabidopsis. In the end, these systematic analyses identified the range of species which
contained true orthologues and a comprehensive list of the duplicated genes in the ana-
lysed species (Table 3.2 –Table 3.6).
The different Arabidopsis clock genes showed variation in their ability to identify
true orthologues, which provided some information on the clock gene components in dif-
ferent species and their evolution. This is illustrated by considering two extremes of analy-
sis of clock gene orthologues: LUX and CCA1. AtLUX identified true orthologues in all
nine species analysed by cross-species reciprocal BLAST, including another paralogue in
Arabidopsis (AtBOA) and four gene copies in P. patens (Table 3.2). The latter species has a
number of particular features regarding its clock genes. The clock and flowering-related
genes GI, FKFI, ZTL, CO, and FT are present in all flowering plants but absent in P. patens
(Table 3.2, Table 3.4 and Table 3.6). At the other extreme is AtCCA1. This gene identified
a gene in each of the nine species. However, it had no reciprocal hits with any species ana-
lysed. In fact, the reciprocal BLAST identified AtLHY instead. When this sequence was

83 Chapter 3
used, cross-species reciprocal BLASTs were successful with all ten species showing that
these species contained true orthologues of AtLHY but no orthologues of AtCCA1 (Figure
3.2A).
Figure 3.2: Cross-species reciprocal BLAST diagram of A) LHY and B) ELF4 genes. Ar-
rows indicate direction of BLAST analysis, i.e. a sequence from one database was used to
identify orthologous sequences in the database of another species.
Other genes, for instance ELF4, only had cross-species reciprocal hits with dicot
species suggesting that it is specific to dicots (Figure 3.2B and Table 3.5). In this analysis,
the initial BLAST using the AtELF4 sequence identified sequences in monocots that did
not identify AtELF4 reciprocally. Subsequently, a newly identified Arabidopsis gene from
this reciprocal BLAST was used in cross-species reciprocal BLAST analysis, as well as all
known AtELF4 gene family members. This analysis identified orthologues and paralogues
of ELF4-like3 genes in all species analysed (Table 3.6). Barley and bread wheat have two
genes in this family.

Table 3.2: Homologues of LHY and CCA1, LUX, ELF3, and GI in different land plant species. Work that has previously described these
genes is shown for each species and genes, except Arabidopsis.
LHY and CCA1 LUX ELF3 GI
Arabidopsis thaliana At1g01060 (LHY) At2g46830 (CCA1)
At3g46640 (LUX) At5g59570 (BOA)
At2g25930 At1g22770
Zea mays
GRMZM2G014902 (ZmCCA1) (Wang et al., 2011b)
GRMZM2G474769 (ZmLHY) a (Hayes et al., 2010)
GRMZM2G067702 (Khan et al., 2010)
GRMZM2G045275 (ZmELF3b) AC233870 (ZmELF3)
GRMZM2G107101 (GI1A) GRMZM5G844173 (GI1B)
(Hayes et al., 2010)
Brachypodium distachyon
Bradi3g16515 (Higgins et al., 2010)
Bradi2g62067 (Campoli et al., 2013)
Bradi2g14290 (Higgins et al., 2010)
Bradi2g05226 (BdGI) (Hong et al., 2010b)
Sorghum bicolor Sb7g003870
(Murphy et al., 2011) Sb03g047330
(Campoli et al., 2013)
Sb09g030700 (ELF3) (Zakhrabekova et al., 2012)
Sb03g025560 (ELF3b) (Higgins et al., 2010)
Sb03g003650 (GI) (Bhosale et al., 2012)
Oryza sativa LOC_Os8g06110 (Murakami et al., 2007)
LOC_Os01g74020 (Murakami et al., 2007)
LOC_Os01g38530 (OsEF3) (Fu et al., 2009)
LOC_Os06g05060 (EF7) (Murakami et al., 2007; Saito et al., 2012)
LOC_Os01g08700 (Hayama et al., 2002b)
Hordeum vulgare Hvcontig_51288/1567295 (HvCCA1 on(Faure et al., 2012) a
Hvcontig_2548416 (HvLUX1 on(Campoli et al., 2013)
Hvcontig_80895/67536 (Faure et al., 2012; Zakhrabekova et al., 2012)
Hvcontig_58270/1580005 (Dunford et al., 2005)
Triticum aestivum TAcdna_241985162
(Campoli et al., 2012b) Ta_PUT0106334 c TAcdna_118767202 (TaELF3) *
(Faure et al., 2012) TAcdna_241985055 (TaELF3b) *
TAcdna_33333146 (GI1) (Zhao et al., 2005) *
TAcdna_50593493 (GI2) * TAcdna_50593495 (GI3) *
Solanum tuberosum PGSC0003DMG400011294 a PGSC0003DMG400002144
(Campoli et al., 2013)
PGSC0003DMG400013826 (ELF3a)
PGSC0003DMG400029303 (ELF3b)
PGSC0003DMS000000006 (GI1) b
PGSC0003DMG400018791 (GI2) a
S. lycopersicum Solyc10g005080 Solyc06g005680
(Campoli et al., 2013) Solyc08g065870 (ELF3a) Solyc12g095900 (ELF3b)
Soly04g071990 (GI1) Soly12g056650 (GI2)
P. patens (Holm et al., 2010)
Pp1s325_68 (PpCCA1a) Pp1s96_165 (PpCCA1b)
(Okada et al., 2009a; Okada et al., 2009b)
Pp1s27_359 Pp1s104_175 Pp1s29_23 Pp1s29_32
Pp1s86_214 Pp1s11_285 Pp1s87_90
None
* Alleles, sequenced in hexaploid bread wheat, are a putative homoeoallelic series on the same group of chromosomes. a: re-annotated; b: annotated; c: partial sequence.
84
C
hapter 3

Table 3.3: Homologues of the pseudo-response regulator genes TOC1, PRR5(9) and PRR9(5), PRR3(7) and PRR7(3) in different land plant
species. Work that has previously described these genes is shown for each species and genes, except Arabidopsis.
TOC1 PRR5(9) and PRR9(5) PRR3(7) and PRR7(3)
Arabidopsis thaliana At5g61380 At5g24470 (PRR5) At2g46790 (PRR9)
At5g60100 (PRR3) At5g02810 (PRR7)
Zea mays
GRMZM2G020081 (TOC1) (Wang et al., 2011b)
GRMZM2G148453 a (TOC1b) (Hayes et al., 2010)
GRMZM2G135446 (PRR59) (Hayes et al., 2010)
GRMZM2G179024 (PRR95) (Campoli et al., 2012b)
GRMZM2G095727 (PRR73) (Hayes et al., 2010) GRMZM2G033962 (PRR37) (Hayes et al., 2010) a
GRMZM2G005732 (PG) a
Brachypodium distachyon (Higgins et al., 2010)
Bradi3g48880 Bradi4g24967 (PRR59) Bradi4g36077 (PRR95)
Bradi1g65910 (PRR73) Bradi1g16490 (PRR37)
Sorghum bicolor (Takata et al., 2010)
Sb4g026190 (Murphy et al., 2011)
Sb5g003660 (PRR59) Sb2g030870 (PRR95) a
Sb1g038820 (PRR73) Sb6g014570 (PRR37) (Murphy et al., 2011)
Oryza sativa (Murakami et al., 2007)
LOC_Os2g40510 LOC_Os11g05930 (PRR59) LOC_Os9g36220 (PRR95)
LOC_Os3g17570 (PRR73) LOC_Os7g49460 (PRR37)
Hordeum vulgare (Campoli et al., 2012b)
Hvcontig_37494 (HvTOC1) (Faure et al., 2012)
Hvcontig_46739 (PRR59) Hvcontig_41351 (PRR95)
(Higgins et al., 2010)
Hvcontig_1563982 (PRR73) (Higgins et al., 2010) Hvcontig_94710 (PPDH1/PRR37)
(Turner et al., 2005; Jones et al., 2008)
Triticum aestivum TAcdna_241985932 (Campoli et al., 2012b)
Ta_PUT2939165448 (PRR59) c TAcdna_241983556 (PRR95)
(Campoli et al., 2012b)
Ta_PUT18538 (PRR73) c PPDD1, PPDB1, PPDA1
(PRR37s) (Beales et al., 2007) *
Solanum tuberosum PGSC0003DMG400033048 (TOC1) a
PGSC0003DMG400019518 (TOC1-like) PGSC0003DMG400000584 (PRR5) PGSC0003DMG402011297 (PRR9)
PGSC0003DMS000000129 (PRR3) b PGSC0003DMS000000068 (PRR7) a
S. lycopersicum Solyc06g069690 (TOC1)
Solyc03g115770 (TOC1-like) Solyc03g081240 (PRR5) Solyc10g005030 (PRR9)
Solyc04g049670/80 (PRR3) a Solyc10g086000 (PRR7)
P. patens Pp1s412_23 (PpPRR1), Pp1s81_131 (PpPRR2), Pp1s412_35 (PpPRR3), Pp1s81_144 (PpPRR4) (Holm et al., 2010; Satbhai et al., 2010)
* Three alleles, sequenced in hexaploid bread wheat, are a homoeoallelic series on the group 2 chromosomes. Sequences retrieved from literature (Beales et al., 2007). a: re-annotated; b: annotated; c: partial sequence; PG: pseudo-gene. Phylogenetic tree is shown in Figure 3.6.
85
C
hapter 3

Table 3.4: Homologues of ZTL, FKF1, GRP7 and GRP8 genes in different land plant species.
ZTL FKF1 GRP7 and GRP8
Arabidopsis thaliana At5g57360 (ZTL) At2g18915 (LKP2)
At1g68050 At2g21660 (GRP7) At4g39260 (GRP8)
Zea mays GRMZM2G113244 (ZmZTLa) GRMZM2G147800 (ZmZTLb)
GRMZM2G115914 (PG)
GRMZM2G106363 (ZmFKF1a) GRMZM2G107945 (ZmFKF1b)
(Hayes et al., 2010)
GRMZM2G165901 (GRP7a) GRMZM2G080603 (GRP7b)
Brachypodium distachyon
Bradi1g33610 (BdZTLa) Bradi3g04040 (BdZTLb)
(Higgins et al., 2010)
Bradi4g16630 (Higgins et al., 2010)
Bradi1g12787 (GPR7a) Bradi4g00940 (GRP7b)
Sorghum bicolor Sb10g028340 (SbZTLa) Sb04g003660 (SbZTLb)
Sb05g021030 Sb08g022740 (GRP7a) Sb01g012300 (GRP7c)
Oryza sativa LOC_Os02g05700 (OsFBO08/ZTL1) LOC_Os06g47890 (OsFBO09/ZTL2)
(Murakami et al., 2007)
LOC_Os11g34460 (Murakami et al., 2007; Higgins
et al., 2010)
LOC_Os03g46770 (GRP3) LOC_Os12g43600 (GRP6)
(Kim et al., 2010)
Hordeum vulgare Hvcontig_273830 (HvZTLa) Hvcontig_158755 (HvZTLb)
Hvcontig_38586 Hvcontig_1578172 (GRP7a) a
(Campoli et al., 2012b) Hvcontig_43832/46175 (GRP7b) a
Triticum aestivum TAcdna_241984947 (TaZTLa)
Ta_PUT43520 (TaZTLb) c TAcdna_118767204
Tacdna_241988564 (GRP7a) and Tacdna_114145393 (GRP7a’) Tacdna_974604 (GRP7b) and Tacdna_241988180 (GRP7b’)
Solanum tuberosum PGSC0003DMS000000971 b PGSC0003DMG400019971 PGSC0003DMG400000708 (GRP7)
PGSC0003DMG400033902 (GRP7-like1) PGSC0003DMG400033903 (GRP7-like2)
S. lycopersicum Solyc07g017750 a Solyc01g005300 a Solyc01g109660 (GRP7)
Solyc10g051380 (GRP7-like1) Solyc10g051390 (GRP7-like2)
P. patens
None (Holm et al., 2010) None (Holm et al., 2010) Pp1s42_251 (GRP1), Pp1s123_58 (GRP2)
(Nomata et al., 2004) Pp1s136_70
a: re-annotated; b: annotated; c: partial sequence; PG: pseudo-genes.
86
C
hapter 3

Table 3.5: Dicot-specific homologues of ELF4 and EEC in three dicotyledonous plant species and the Arabidopsis-specific CHE and TSF.
ELF4 EEC CHE TSF
Arabidopsis thaliana At2g40080 (ELF4)
At2g29950 (ELF4-like1) At3g21320 At5g08330 At4g20370
Solanum tuberosum PGSC0003DMG400006624 (ELF4)
PGSC0003DMG400001221 (ELF4-like6) PGSC0003DMG400030357 (ELF4-like5)
PGSC0003DMG400004837 None None
S. lycopersicum
Solyc06g051660 (ELF4) Solyc11g028200 (ELF4-like5a) Solyc06g076960 (ELF4-like5b)
scf7180001945491 PG
Solyc06g062480 None None
PG: Tomato pseudogene: sequence present in the Tomato WGS Alternate Scaffolds cabog1.00.
87
C
hapter 3

Table 3.6: Homologues of CO, FT and ELF4-like genes in different land plant species.
CO FT ELF4-like2/3/4
Arabidopsis thaliana
At5g15840 (CO) At5g15850 (COL1) At3g02380 (COL2)
At1g65480 At2g06255 (ELF4-like3) At1g17455 (ELF4-like4) At1g72630 (ELF4-like2)
Zea mays GRMZM2G405368 (CONZ1)
(Miller et al., 2008) ZmCO2 PG
GRMZM2G373928 (ZNC14) GRMZM2G051338 (ZCN15)
(Danilevskaya et al., 2008)
GRMZM5G877647 (ELF4-like3) GRMZM2G382774 (ELF4-likeB1) GRMZM2G359322 (ELF4-likeB2)
GRMZM2G025646 (ELF4) (Zhang, 2011)
Brachypodium distachyon
Bradi1g43670 (CO1) Bradi3g56260 (CO2) (Higgins et al., 2010)
Bradi2g07070 (FTL1) Bradi1g48830 (FTL2) (Higgins et al., 2010)
Bradi4g13227 (ELF4-like3) Bradi4g29580 (ELF4-likeA) Bradi1g60090 (ELF4-likeB)
Sorghum bicolor
Sb10g010050 (CO1) (Murphy et al., 2011) Sb04g029180 (CO2) c
Sb10g003940 (FTL2) (Murphy et al., 2011) Sb03g001700 (FTL1)
Sb05g025110 (ELF4-like3) Sb02g023990 (ELF4-likeA) Sb01g032750 (ELF4-likeB)
Oryza sativa LOC_Os06g16370 (HD1 or OsA)
(Yano et al., 2000; Cockram et al., 2012)
LOC_Os06g06300 (FTL3_RFT1) LOC_Os06g06320 (FTL2_ Hd3a)
LOC_Os01g11940 (FTL1) (Faure et al., 2007)
LOC_Os11g40610 (ELF4-like3) LOC_Os03g29680 (ELF4-likeB)
LOC_Os08g27860 (ELF4-likeA1) LOC_Os08g27870 (ELF4-likeA2)
Hordeum vulgare
Hvcontig_138334 (CO1) (Campoli et al., 2012a) Hvcontig_6805 (CO2) (Griffiths et al., 2003)
Hvcontig_54983 (FT1 or VRN-H3) (Yan et al., 2006)
Hvcontig_1558556/136243 (FT2) (Faure et al., 2007)
Hvcontig_42805 (ELF4-likeA) (Kolmos et al., 2009)
Hvcontig_58806 (ELF4-like3)
Triticum aestivum
Tacdna_169807975 (WCO1) (Shimada et al., 2009) Tacdna_36789816 (HD1-3) *,
GenBank_AB094488 (HD1-2)* c and Tacdna_36789805 (HD1-1)* (Nemoto et al., 2003)
Tacdna_169807973 (FT1a)*, Tacdna_40644759 (FT1b) a *
and Tacdna_56694631 (FT1c) * Tacdna_ 32128602 (FT2) (Yan et al., 2006)
TaPUT_145474 (ELF4-like3) a TaPUT_3048165449 (ELF4-likeA)
Solanum tuberosum
PGSC0003DMG402010056 (COL1) PGSC0003DMG401010056 (COLa)
(González-Schain et al., 2012)
PGSC0003DMG400023365 (SP6A) (Initiative, 2010; Consortium et al., 2011) PGSC0003DMB000000142 (FT_SP3D)
(Navarro et al., 2011) PGSC0003DMB00512 (SP5Ga and SP5Gb) b
PGSC0003DMG400002144 (ELF4-like3) PGSC0003DMG400009846 (ELF4-like8) PGSC0003DMG400011596 (ELF4-like7)
S. lycopersicum Solyc02g089540 (TCOL2) Solyc02g089520 (TCOL3)
(Ben-Naim et al., 2006)
Solyc05g055660 (SP6A), Solyc03g063100 (FT_SP3D) Solyc05g053850 (SP5G)
(Carmel-Goren et al., 2003)
Solyc07g041340 (ELF4-like3) Solyc12g049290 (ELF4-like7)
P. patens None None (Hedman et al., 2009; Karlgren et al.,
2011) Pp1s180_31 (ELF4-like3)
* Three alleles, sequenced in hexaploid bread wheat, are derived from three homoeologous genomes. a: partial sequence; b: annotated; c: re-annotated; PG: pseudogene.
88
C
hapter 3

89 Chapter 3
3.3.2 – Definition of genomic structure of clock genes
From the cross-species reciprocal BLAST data, genomic sequences of genes related
to Arabidopsis clock genes were downloaded from the various plant databases for analysis.
In some cases, genome annotation is incomplete. Therefore, all genomic sequences select-
ed were controlled for quality by comparing gene structure (number of exons), open read-
ing frames (ORFs) and exon-intron junctions with available EST data. On this basis, gene
sequences were correctly annotated or re-annotated, giving a final set of genomic sequenc-
es for each clock gene in each species (data not shown). The 21 genes which were
(re)annotated are shown in Table 3.2, Table 3.3, Table 3.4, and Table 3.6. One example of
re-annotation occurred for the potato LHY gene. Approximately 96% of StLHY genomic
structure was not annotated in the potato database (shown in grey in Figure 3.3). Manual
re-annotation of StLHY was based on the annotation from the orthologous sequence,
Solyc10g005080 (SlLHY), while carefully observing the presence of GT and AG dinucleo-
tides for intron boundaries and ORF maintenance.
Detailed analysis of genomic segments uncovered a peculiar aspect regarding the
LHY and CCA1 genes in the dicot species analysed. The genomic segment where LHY is
located in the tomato and potato genomes is close to the PRR9 gene locus (Figure 3.3).
Close to AtPRR9 on chromosome 2 is AtCCA1, whereas AtLHY is on a different chromo-
some (chromosome 1). The genomic segment where AtLHY is located has no clear co-
linearity with tomato or potato, or with the segment of chromosome 2 where AtCCA1 is
located (data not shown). This suggests that selective pressure to maintain LHY in Ara-
bidopsis occurred on the duplicated gene copy (on chromosome 1), while the copy on
chromosome 2, next to PRR9, accumulated mutations and is now known as AtCCA1.

90 Chapter 3
Figure 3.3: Co-linear segments of Arabidopsis chromosome 2, and potato and tomato
chromosomes 10, containing PRR9 and CCA1/LHY. Boxes represent whole genes (ex-
on/intron structure is not illustrated) and their colours refer to sequence conservation:
black and grey mean conserved sequences, connected by dotted lines, whereas white are
non-conserved genes. In particular, grey also indicates non-annotated sequence in its data-
base.
Gene annotation within the barley genome gene space was hitherto not available.
Therefore, all barley genomic sequences retrieved were manually annotated. Annotation
was carried out by comparing genomic sequences with available transcript data for barley
and, in a few cases, bread wheat and Brachypodium. In this manner, a final set of genomic
structures for all barley clock orthologues and paralogues was defined.
It is worth mentioning a particular complication of some barley clock genes and
their genomic sequences. The genomic sequences of HvLHY, HvGI, HvELF3, HvGRP7b
and HvFT2 are found on two different contigs in the barley database for each gene (Table
3.2, Table 3.4 and Table 3.6). Additionally, the 5’ end sequence of HvPRR95 is not present
in the barley database. To identify the missing sequence linking both contigs and the 5’ end
sequence of HvPRR95, a search for genomic and transcript sequences was carried out in
the GenBank database. These analyses allowed the complete characterisation of the ge-
nomic sequence of HvELF3, HvGRP7b and HvFT2. Unfortunately, the sequence of intron 2

91 Chapter 3
from HvLHY and the 5’ end of HvPRR95 were not retrieved due to their unavailability in
barley and GenBank databases.
In comparison with Arabidopsis, the genomic structures of barley genes are consid-
erably conserved in regards to their exon/intron organisation, including the single exon
genes LUX and CAB. However, differences also occur. The gene structures of barley
orthologues differ from those of Arabidopsis mainly in the size of introns, which are gen-
erally larger in barley, and in the UTR sequences. A clear example is the 5’ UTR of LHY in
barley, which is considerably longer and has a complex multi-exon structure, while AtLHY
only has two small 5’ UTR introns. However, the unavailability of a complete HvLHY in-
tron 2 sequence, present in the 5’ UTR, compromises robust comparison with the 5’ UTR
of AtLHY. Therefore, further assumptions regarding HvLHY 5’ UTR must be treated care-
fully. More information and figures of genomic structures from barley and Arabidopsis
clock genes are found in Chapter 5.
3.3.3 – Phylogeny of clock genes
To demonstrate and confirm the degree of relatedness of identified orthologous
genes, phylogenetic trees were generated using the neighbour-joining method (Saitou and
Nei, 1987) with MEGA software version 5.05 (Tamura et al., 2011). For true gene homol-
ogy, phylogenetic trees should reflect evolution of the species analysed (Figure 3.4). This is
observed for the majority of cases, confirming that the sequences identified are homo-
logues of the Arabidopsis genes. However, a few rice genes do not display the expected
topology, and they are represented in grey on the respective gene trees. Detailed analyses
for each gene are described below:

92 Chapter 3
Figure 3.4: Expected tree of life of the 10 land plant species used in this study. Labelling of
each node was based on the lowest rank of the common ancestor (according to(Benson et
al., 2009). Blue square: BEP clade; red circle: core eudicots; green grass: grass family;
flower: flowering plants.
LHY and CCA1 (Table 3.2 and Figure 3.5A). True orthologues of AtLHY were identi-
fied in all species analysed. Barley and six other plants have a single LHY counterpart,
whereas LHY gene duplications possibly occurred independently in maize, P. patens
and Arabidopsis, which gave rise to AtCCA1.
LUX (Table 3.2 and Figure 3.5B). True orthologues of the AtLUX gene were identified
in all species analysed, including four copies in P. patens. In this case, complex results
from BLAST and phylogenetic analysis made the identification of the true P. patens
orthologue difficult. Arabidopsis has a recently duplicated LUX paralogue, known as
AtBOA.
ZTL and FKF1 (Table 3.4 and Figure 3.5C). Gene members of the LOV (light, oxygen
or voltage) blue light receptor subfamily were identified in all flowering plants ana-
lysed and mostly have a single exon. In silico analyses suggest that the ancestor of

93 Chapter 3
flowering plants carried both ZTL and FKF1 genes. A single copy of FKF1 is main-
tained for both monocots and dicots, except for maize, which has two copies due to a
recent duplication. The ZTL gene has been duplicated in both the ancestor of mono-
cots and in Arabidopsis. As a result, monocots have ZTLa and ZTLb genes, while Ar-
abidopsis has ZTL and the recent copy, LPK2. The exact relationships between both
monocot ZTL genes and the dicot ZTL could not be determined, i.e. the true
orthologue of AtZTL in monocots is either ZTLa or ZTLb.
PRRs (Table 3.3 and Figure 3.6). Most flowering plants analysed have five PRR genes.
The TOC1 gene is duplicated in maize and both Solanum species. P. patens has four
PRRs, which are very closely related to the PRRs of angiosperms. It was not possible
to determine PRR orthologues due to very complex results from BLAST and phyloge-
netic analysis. The only evidence observed is that the ancestor of flowering plants had
TOC1, PRR3/7 and PRR9/5 genes. After the divergence of monocots and dicots, both
ancestors independently duplicated PRR3/7 and PRR9/5 genes. The monocot paralo-
gous genes PRR73 and PRR37 are highly similar to the protein and gene structure of
AtPRR7, as opposed to AtPRR3. However, this similarity could not be observed on the
PRR gene tree (Figure 3.6).

94 Chapter 3
Figure 3.5: Phylogenetic trees of LHY, CCA1, LUX, ZTL and FKF1 genes. A) LHY and
CCA1 tree. B) Phylogenetic tree of LUX genes. Due to the lack of complete CDS data for
the TaLUX gene, the partial related CDS from PUT0106334 was used to represent bread
wheat LUX. C) Phylogenetic tree of ZTL and FKF1 genes. Due to the lack of complete se-
quence information for the TaZTLb gene, the partial bread wheat ZTLb CDS from
PUT43520 was used to represent bread wheat. Since P. patens does not contain a true
orthologue of ZTL or FKF1, the root was placed on the FKF1 family branch. Evolutionary
distances are presented in number of base substitutions per site. In constructing the trees,
all gaps and missing data were eliminated from sequence alignments. Genes that do not
follow expected topology are found in grey. Labelling of each node was based on Figure
3.4. Barley genes are boxed.

95 Chapter 3
Figure 3.6: Phylogenetic tree of PRR genes identified by cross-species reciprocal BLAST.
For simplicity, TOC1-like sequences from tomato and potato were not included in the anal-
ysis. Alignment is based on putative mRNA sequences. Due to the lack of complete CDS
data for the TaPRR73 and TaPRR59 genes, the partial related cDNAs from PUT18538 and
PUT2939165448, respectively, were used to represent these bread wheat branches. The
evolutionary distances are presented in number of base substitutions per site. In construct-
ing the tree, all gaps and missing data were eliminated from the sequence alignment.
Genes that do not follow expected topology are found in grey. Labelling of each node was
based on Figure 3.4. Barley genes are boxed.

96 Chapter 3
CO (Table 3.6 and Figure 3.7A). Homologous members of the AtCO subfamily were
identified in all flowering plants analysed, including barley. Protein alignment and
BLAST analyses suggest that the ancestor of flowering plants contained one copy of a
CO-related gene, which is the orthologue of AtCO or AtCOL1. Results from cross-
species reciprocal BLAST analysis were very complex and made the identification of
true CO-related orthologues very difficult. Two independent duplication events have
occurred within the Arabidopsis branch, which currently has AtCOL1, AtCO and
AtCOL2. Monocots have one duplication event of the original CO-related gene, giving
rise to both CO1 and CO2. Rice and maize have lost their CO2 gene copy. The exact re-
lationship between both CO1 and CO2 genes in monocots and the dicot CO-related
genes could not be determined, but homologues are clearly present. Exon numbers for
homologous genes commonly varied between one and two among the species ana-
lysed (Figure 5.6).
FT (Table 3.6 and Figure 3.7B). The true orthologue of AtFT in monocots could not
be determined, but at least two homologues (FT1 and FT2) are present in all monocots
analysed. Rice in particular has two copies of the FT1 gene (OsFTL2 and OsFTL3).
Exon numbers for homologous genes varied between three and four among the species
analysed.
ELF3(-like) (Table 3.2 and Figure 3.7C). Homologues of AtELF3 were identified in all
species analysed. Paralogues were also observed and are probably due to a series of
duplication events of the ELF3 gene. All in silico analyses suggest that the ancestor of
land plants contained one copy of the ELF3 gene. Two independent duplication events
occurred within the P. patens branch, which has three homologues of ELF3. The origi-
nal ELF3 gene was also duplicated in the ancestor of flowering plants, which then con-
tained both the ELF3 gene and the new copy, ESSENCE OF ELF3 CONSENSUS (EEC)

97 Chapter 3
gene. However, this hypothesis for the origin of EEC has low support from phyloge-
netic analysis (59% likelihood, Figure 3.7) and must be treated with care. Monocots
have lost the EEC gene and duplicated ELF3, creating the ELF3a and ELF3b genes.
Temperate grasses (Pooideae) lost the ELF3b gene, whereas rice lost ELF3a. Interest-
ingly, the ELF3b copy present in the rice genome has undergone a recent event of du-
plication. The exact relationships between both ELF3 alleles in monocots and the di-
cot ELF3 could not be determined, i.e. the true orthologue of AtELF3 was not identi-
fied but homologues are clearly present.
GI (Table 3.2 and Figure 3.7D). True orthologues of GI were identified in all flowering
plants analysed. One duplication event occurred in both maize and the Solanum ances-
tor.

98 Chapter 3
Figure 3.7: Phylogenetic trees of CO, FT, ELF3 and GI genes. A) Subfamily of COL genes
from Group Ia, which includes AtCO. B) Genes of the FT subgroup. C) ELF3 and EEC
genes. In constructing the tree, all gaps and missing data were eliminated from the CO, FT
and ELF3 sequence alignments. D) GI genes. In constructing the tree, all gaps and missing
data were eliminated from each pairwise sequence alignment. P. patens does not contain a
true orthologue of FT, CO, or GI and therefore the root was placed on the dicot FT, CO,
and GI branches, respectively. The evolutionary distances are presented in number of base
differences per site. Genes that do not follow expected topology are found in grey. Label-
ling of each node was based on Figure 3.4. Barley genes are boxed.

99 Chapter 3
ELF4(-like) (Table 3.5, Table 3.6 and Figure 3.8A). Gene orthologues of AtELF4 could
not be identified in any monocot species analysed, including barley. The whole set of
in silico analyses suggests two subgroups for the ELF4-like family: ELF4, which in-
cludes AtELF4 and AtELF4-like1 (Table 3.5), and ELF4-like2/3/4 (Table 3.6). ELF4
family members are found only in dicot species and they are single exon genes. On the
other hand, ELF4-like2/3/4 family members are found in all plants analysed and most
of them have a 5’ UTR intron. Analysis at the protein sequence level suggests that the
ancestor of land plants contained one copy of the ELF4-like gene, most likely an
orthologue of AtELF4-like3. This gene was duplicated in the ancestor of flowering
plants, which then contained both ELF4-like3 and the new copy, ELF4. Monocots lost
the ELF4 gene while dicot species duplicated this gene multiple times. The ELF4-like3
gene was duplicated twice in monocots, but barley and bread wheat may have lost one
of the copies. Dicots also had one or two duplication events from the ELF4-like3 gene
and its subsequent copies. In summary, orthologues of AtELF4 were identified only in
dicot species (tomato and potato). On the other hand, AtELF4-like3 orthologues are
present in all land plant species.
GRP7 and GRP8 (Table 3.4 and Figure 3.8B). Single-intron homologues of AtGRP7
were identified in all species analysed. In silico analyses suggest that the ancestor of
land plants contained one copy of the GRP7 gene. Two independent duplication
events occurred within the P. patens branch, generating PpGRP1, PpGRP2 and
Pp1s136_70. The GRP7 gene has undergone a series of independent duplications with-
in dicots and once in monocots. In Arabidopsis, it is likely that this duplication gave
rise to AtGRP8, according to cross-species BLASTs. In monocots, there are two copies
of the GRP7 gene, which are hereafter called GRP7a and GRP7b. Rice has lost GRP7a
and duplicated GRP7b. Strangely, bread wheat seems to be the only species with a

100 Chapter 3
third copy, TaGRP7c, according to sequence analysis of PUT19138 (data not shown).
The putative GRP7c protein encoded by this contig is around half the size of the other
GRPs in monocots. Due to this unique feature, GRP7c might be a pseudogene or an
error from sequencing and alignment procedures, and it was eliminated from further
analyses.
CHE (Table 3.5). Cross-species reciprocal BLAST using the single exon gene AtCHE
could not identify any orthologue in any species analysed. Another Arabidopsis gene,
At5g23280 (AtTCP7), was identified by reciprocal BLAST. Subsequently, the newly
identified AtTCP7 was used in cross-species reciprocal BLAST. This analysis con-
firmed AtTCP7 orthologues in all species analysed, as well as several paralogues (data
not shown). AtCHE is likely one of its paralogues, present only in Arabidopsis (of all
species analysed here). Barley gene members of the TCP7/CHE subfamily were dis-
carded from further analysis for a number of reasons. Firstly, AtCHE is a transcrip-
tional repressor of AtCCA1. It is likely that both genes are not present in monocots
(discussed in Section 3.4.3). Secondly, there is hitherto no evidence of any involve-
ment of AtTCP7 in clock regulation. Lastly, HvTCP7 is a single-exon gene, and is
therefore unlikely to have AS.
CAB2 (data not shown). Orthologues of AtCAB2 could not be identified in any species
analysed. This gene belongs to a large family of single exon genes and other gene
members are found in dicots and monocots: Arabidopsis has 5 genes that belong to
this family, while Brachypodium has 4 genes, maize has 6 genes, sorghum has 5 genes
and rice has 3 genes (Plaza, 2011). Barley and bread wheat have at least 17 gene
members (data not shown). Complex results from cross-species reciprocal BLAST
analysis made the identification of a true CAB orthologue very difficult.

101 Chapter 3
Figure 3.8: Phylogenetic trees of ELF4-related, GRP7 and GRP8 genes. A) Genes of the
ELF4-like family. Due to the lack of complete CDS data for the TaELF3-like3 the partial
related cDNA from PUT145474 was used to represent this bread wheat branch. In con-
structing the tree, all gaps and missing data were eliminated from the sequence alignment.
B) GRP genes. In constructing the tree, all gaps and missing data were deleted from each
pairwise sequence alignment. Evolutionary distances are presented in number of base dif-
ferences per site. Genes that do not follow expected topology are shown in grey. Labelling
of each node was based on Figure 3.4. Barley genes are boxed.
102 Chapter 3
3.3.4 – Reference genes
In order to analyse the expression profiles of all clock genes (Chapter 4) reference
genes which have constant expression levels are required for normalising transcript levels.
Thus, reference genes were identified from the barley genome gene space (Table 3.7). Iden-
tification was carried out using a set of robust in silico analyses that was comprised of cross-
species reciprocal BLASTs, followed by genomic structure and phylogenetic analyses. Ini-
tially, two Arabidopsis candidate sequences were used in BLAST searches against various
databases. These candidates were: PROTEIN PHOSPHATASE 2AA3 (AtPP2AA3) and
POLYUBIQUITIN 21 (AtUBC21).
PP2AA3 is present only in Arabidopsis. Nonetheless, PP2AA2, another member of
the PP2A family, is present in all land plants, according to cross-species reciprocal BLASTs
(Figure 3.9A). Therefore, HvPP2AA2 was used as a control gene in barley studies. True
orthologues of UBC21 are present in all land plants and their sequences are highly con-
served and reconstructed the expected phylogeny (Figure 3.9B). The expression of
HvPP2AA2 and HvUBC21 was analysed under a wide range of developmental stages and
environmental conditions and they have shown very stable expression levels (see Section
3.4.4)

103 Chapter 3
Table 3.7: Homologues of AtPP2AA2 and AtUBC21 genes in different land plant species.
PP2AA2 UBC21
Arabidopsis thaliana AT3G25800 At5g25760
Zea mays GRMZM2G164352 (PP2AA2) GRMZM2G122135 (PP2AA2”)
GRMZM5G828302 (UBC21a) GRMZM2G161545 (UBC21b)
Brachypodium distachyon
Bradi4g08790 (PP2AA2) Bradi4g08720 (PP2AA2”)
Bradi3g49600 (UBC21) Bradi4g13871 (UBC21b)
Sorghum bicolor Sb10g001960 (PP2AA2) Sb04g026910 (UBC21) Sb09g007410 (UBCa)
Oryza sativa LOC_Os09g07510 LOC_Os02g42314
Hordeum vulgare Hvcontig_126673 Hvcontig_159435/46087
Hvcontig_137760 PG
Triticum aestivum Tacdna_241984800 (PP2AA2)
Tacdna_32129024 (PP2AA2’’) a Tacdna_241987785 a
Solanum tuberosum PGSC0003DMG400012971 PGSC0003DMG402018585
S. lycopersicum Solyc05g009600 Solyc11g071260
P. patens Pp1s214_34 Pp1s197_114 Pp1s117_137
Pp1s159_159
a: re-annotated. PG: Pseudogene with no expression data or detectable ORF.
A) B)
Figure 3.9: Phylogenetic tree of A) PP2AA2 and B) UBC21 orthologous genes. Symbols on
branch nodes represent common ancestors from Figure 3.4. Evolutionary distances are in
number of base substitutions per site. Barley genes are boxed.
3.4 – Discussion
3.4.1 – In silico identification of clock homologues
Genomic sequences of 21 putative barley homologues of Arabidopsis core circadi-
an clock genes and selected associated genes were identified. This analysis was carried out
carefully in order to identify homologous genes and to eliminate any similar unrelated se-

104 Chapter 3
quences, i.e. sequences that are not descended from a common ancestral sequence (Hall,
2008). For this, cross-species reciprocal BLAST searches were carried out on databases of
tomato, potato, moss (P. patens) and six other grasses: Brachypodium, sorghum, bread
wheat, maize, rice and barley. This procedure had already been used in other studies, for
instance on searches for clock genes in rice (Murakami et al., 2007) and a more extensive
identification of all homologous genes (in the whole genome) among photosynthetic eu-
karyotes (Zimmer et al., 2007). This method has proven to be a highly efficient method for
detection of orthologues. Parallel linkage analysis could not be performed because of rare
synteny between dicots and monocots, which reduces the number of orthologues detecta-
ble by positional conservation. This phenomenon is probably due to the frequent rear-
rangements, translocations and gene losses that occurred along the evolution and specia-
tion of dicots and monocots (Spannagl et al., 2011).
Subsequently, sequences retrieved from BLAST searches were used in phylogenetic
analysis as a test for homology, as it is expected that homologous clusters should recon-
struct the tree of life. However, in this study most of the annotated CDSs of putative clock
genes did not initially retrieve the expected topology and manual annotation and re-
annotation was necessary to obtain the correct phylogeny. Similar mis-annotation issues
have previously been described for eukaryotes, bacteria and archaeal genome databases
(Veloso et al., 2005; Mariotti and Guigó, 2010). These errors may be caused by automatic
gene finding programs that do not recognise uncommon or unique gene features, for in-
stance, long introns.
Even after (re)annotation, some rice genes did not follow the expected topology (in
grey in respective gene trees), where they frequently formed groups with sorghum and
maize. This phenomenon could have occurred with rice sequences for a few reasons. First,
rice (re)annotations might not represent a real full-length transcript. Second, other gene
members from the same family are missing, which could cause poorly supported topolo-

105 Chapter 3
gies upon reconstruction of phylogeny. Additionally, the alignment and tree construction
methods were not quite appropriate, for instance, NJ is a distance-based method and the
use of partial sequences from mis-annotations can result in incongruent results. Also, some
species have variable evolutionary rates, which might interfere with the phylogenetic re-
construction (Felsenstein, 1978; Mushegian et al., 1998). Lastly, rice, sorghum and maize
have been under a similar selective pressure during domestication, suggesting a convergent
evolution of their genes, as previously reported (Paterson et al., 1995; Hu et al., 2003). Re-
gardless of the reason for these rice genes presenting an unexpected topology, they do not
interfere with the confirmation that the barley sequences identified are homologues of the
Arabidopsis clock-related genes.
Finally, putative homologues of Arabidopsis circadian clock genes were identified
in tomato, potato, P. patens, Brachypodium, sorghum, bread wheat, maize, rice and barley.
40 genes in monocots, including six in barley, were hitherto unknown: for instance
HvZTLa, HvZTLb, HvGRP7b, HvELF4-like3, HvFKF1 and HvCABa. Most of the genes iden-
tified were already known and had previously been used in simple analyses or, less com-
monly, a fully characterised study. References for these genes are found in Table 3.2–Table
3.6. The identification of previously described genes confirms that the in silico method
adopted is appropriate for identifying homologues, as well as confirming the identity of the
previously described genes. Moreover, the comprehensive list of species with duplicated
gene copies is good evidence confirming the number of gene copies in barley. This infor-
mation, along with the genomic structure of barley genes, is essential for AS studies. Of the
21 genomic sequences identified in barley, thirteen were available or described previously:
LHY (CCA1), five PRRs, LUX, CO1, CO2, FT1, FT2, GI and ELF3 (discussed in the next
Section). HvLHY, in particular, was not correctly annotated and manual re-annotation was
performed.

106 Chapter 3
An important consideration remains that the barley gene space is not complete
(Consortium, 2012a). It is therefore possible that the extensive in silico analysis conducted
here may still have missed possible orthologues or parts of genes. This is clearly the case
for the sequences from intron 2 of HvLHY and the 5’ end of HvPRR95. Some barley introns
are relatively large with a high proportion of repetitive DNA sequence, which can be diffi-
cult to identify and analyse. Therefore, it is likely that technical constrains have caused
parts of the genomic sequences of HvLHY and HvPRR95 to be missed. This also helps to
explain why some barley genes are found in more than one genomic contig. To identify
the missing sequence linking both contigs, a search for additional genomic and transcript
sequences was carried out. Similarly, to overcome the absence of whole gene sequences
from the barley gene space, transcriptome data were also analysed, but retrieved only se-
quences already present in the barley gene space. Further and specific discussion of each
clock gene, including detailed information regarding the barley clock genes are found be-
low. The overall conclusion and proposed evolutionary history of clock genes are found in
Section 6.1 and Figure 6.1.
3.4.2 – Barley core clock and clock-associated genes
HvGI is present as a single copy in the barley genome and it is the true orthologue of
AtGI, also confirmed elsewhere (Dunford et al., 2005; Campoli et al., 2012b). Another sin-
gle copy gene in barley is HvELF3, which is the homologue of AtELF3. Recently, HvELF3
characterisation was concomitantly published by two independent labs (Faure et al., 2012;
Zakhrabekova et al., 2012). In fact, this gene is present as a single copy in Pooideae species
but in the work of Yang et al. (2013) it was suggested that Brachypodium, which belongs to
Pooideae (Figure 3.4), has two ELF3 homologues. Curiously, this information is not pre-
sent on their phylogenetic tree, which shows one single BdELF3 (Bradi2g14290), the one

107 Chapter 3
identified in cross-species reciprocal BLASTs (Table 3.2). In the work of Yang et al. (2013)
no further information is provided regarding the second ELF3 gene in Brachypodium.
Therefore, the determination of ELF3 gene copies in Pooideae could not be clarified.
One of the most important barley clock genes, characterised 8 years ago, is
HvPPDH1 (Turner et al., 2005). This major determinant of barley photoperiod response be-
longs to the PRR gene family, which has another four members in flowering plants, con-
firmed by in silico analysis. The PRR73 member is a paralogue of PRR37 (HvPPDH1) in
monocots (PRR3 and PRR7 in dicots), whereas the TOC1 member is a single copy gene in
most species. The monocot genes PRR59 and PRR95 (PRR5 and PRR9 in dicots) are the
other two members. The exact relationships of PRR3/7 and PRR5/9 genes between mono-
cots and dicots could not be determined on the basis of sequence divergence (and in the
absence of functional information), i.e. it is difficult to distinguish the true ancestral
orthologue from paralogues. Similar problems occur for both copies of ZTLs, GRP7s, COs
and ELF3s in monocots. It is likely that during monocot and dicot speciation both ances-
tors independently duplicated and maintained most of these genes for different reasons,
and it is now difficult to trace back the oldest allele (true orthologue). This hypothesis is
also supported by other studies in diverse plant species, including barley (Higgins et al.,
2010; Satbhai et al., 2010; Campoli et al., 2012b; Cockram et al., 2012). Despite these diffi-
culties, a few observations can be made regarding the evolution of these genes. The mono-
cot paralogous genes PRR73 and PRR37 are more similar to AtPRR7 as opposed to
AtPRR3, which is also confirmed by other studies (Turner et al., 2005; Higgins et al., 2010).
Regarding ZTL, the duplication in Arabidopsis generated LPK2 which is probably the
newest allele. This hypothesis is confirmed by recent work, which suggests that AtLPK2
arose from the α duplication event in the Brassicaceae lineage and thus confirms AtZTL as

108 Chapter 3
the oldest allele (Lou et al., 2012). AtELF3 and AtGRP7 might also be the oldest allele, as
opposed to AtEEC and AtGRP8, respectively.
For ZTL in particular, there is a peculiar study which found a ZTL-type gene in bar-
ley, called HvDRF, involved in disease resistance (Dagdas et al., 2009). The sequence avail-
able for this gene on GenBank (FJ913271) codes for a protein highly similar to AtZTL and
TaZTLa. Unexpectedly, phylogenetic analysis demonstrates that HvDRF forms a sister
branch with all monocots rather than TaZTLa (data not shown), which is incongruent with
phylogeny. Moreover, cross-species reciprocal BLASTs using this sequence did not re-
trieve any orthologue in any species. Additionally, the barley genomic sequence for this
gene is not available in any database. Therefore, the evolutionary history of HvDRF and its
relation with HvZTLa and HvZTLb could not be determined.
Another member of the LOV (light, oxygen or voltage) blue light receptor subfami-
ly, besides ZTL, is FKF1. Both members are functionally and evolutionary diverged,
which might have started sometime after euphyllophyte (ferns and seed plants) speciation
(Suetsugu and Wada, 2013). In contrast to ZTL, most monocots and dicots maintained a
single copy of FKF1, also confirmed elsewhere (Murakami et al., 2007; Higgins et al.,
2010), including the hitherto unknown single orthologue in barley.
The MYB-transcription factors LHY and CCA1 play an important role in the regula-
tion of the circadian rhythm in Arabidopsis. However, barley and another six plants ana-
lysed have only one counterpart, most likely the LHY gene. Detailed discussion of
LHY/CCA1 is found below (Section 3.4.3), which describes dicot-specific genes.
A single homologue of the Arabidopsis LUX is present in monocots, also suggested
elsewhere (Murakami et al., 2007; Higgins et al., 2010; Khan et al., 2010), while Arabidop-
sis has duplicated this gene (AtBOA, At5g59570). Regarding HvLUX in particular, there is
a conflicting study where two LUX genes were found in barley, called HvLUX1 and

109 Chapter 3
HvLUX2 (Campoli et al., 2013). In fact, they identified at least two LUX genes in other
monocot species and they propose that gene duplications occurred independently in the
evolution of monocots (LUX1 and LUX2) and Arabidopsis (LUX and BOA). The sequence
available for HvLUX1 on GenBank (BAJ88719) was identical to HvLUX identified by
cross-species reciprocal BLAST analysis using AtLUX (At3g46640) (Figure 3.5B and Table
3.2). On the other hand, reciprocal BLASTX using HvLUX2 cDNA against the Arabidop-
sis protein database identified different genes. The top 3 hits were the transcription factors
At3g10760, At2g40970 and At5g050090, which all identify HvLUX2 on GenBank. Moreo-
ver, phylogenetic analysis of the LUX superfamily on the Plaza database showed separate
clusters of LUX genes from land plants, indicating that their common ancestor had both
LUX1 and LUX2 genes. In this case, LUX2 in Arabidopsis was duplicated twice and it is
now the three transcription factors mentioned above (At3g10760, At2g40970 and
At5g050090). Therefore, it is likely that HvLUX2 belongs to a different subfamily of LUX-
related genes, which have evolutionary diverged from HvLUX1 since speciation in land
plants. This theory explains the extensive distance between LUX1 and LUX2 clades ob-
served on the phylogeny of Campoli et al. (2013), as well as their incongruences with phy-
logeny at the level of order and families.
Homologues of the clock-output gene AtCO, which is involved in flowering control,
were identified. AtCO, it is a member of a subfamily from Group Ia of the COL family
(Griffiths et al., 2003; Valverde, 2011). In silico analyses suggest Arabidopsis has three
members from this subfamily whereas barley has two: HvCO1 (Griffiths et al., 2003;
Campoli et al., 2012a) and HvCO2 genes (Griffiths et al., 2003). Other monocots also have
both gene copies, except rice (also suggested by(Cockram et al., 2012) and maize. These
species require short day photoperiods to flower while barley, wheat, Arabidopsis, and po-
tato, require long days. Therefore, the absence of the CO2 gene copy in rice and maize

110 Chapter 3
probably had a critical role in their domestication (Miller et al., 2008; Cockram et al., 2012).
Also, FT copy number variation plays an important role in the regulation of plant flower-
ing and development (Nitcher et al., 2013).
The central component in mediating the onset of flowering, the FT gene, has hom-
ologues in all flowering plants analysed. Additional phylogenetic studies confirm that a FT
gene was present in the angiosperm ancestor and contributed to the evolution of flowering
plants (Klintenäs et al., 2012; Pin and Nilsson, 2012). AtFT is a member of the phosphati-
dylethanolamine-binding protein (PEBP) FT-like family and it forms a subfamily with
TWIN SISTER OF FT (TSF) (Kobayashi et al., 1999; Faure et al., 2007). Barley has two
members from this subfamily: HvFT1 (Yan et al., 2006) and HvFT2 (Faure et al., 2007).
Other monocots also have both gene copies and rice has a tandem duplication of the FT1
copy (Chardon and Damerval, 2005). The monocot FT1/FT2 duplication occurred after
the divergence between the monocots and dicots. Therefore, this duplication is independ-
ent of the FT/TSF duplication in Arabidopsis, as suggested previously (Li and Dubcovsky,
2008).
3.4.3 – Dicot-specific clock genes
Orthologues of four Arabidopsis genes from the initial candidate list were not iden-
tified in barley and most other plant species: ELF4, CAB2, CHE and CCA1.
3.4.3.1 – ELF4
ELF4 is likely to be a dicot-specific gene in that it could not be identified in moss or
monocot species, but only in dicots (Arabidopsis, tomato and potato). In fact, only mem-
bers of the ELF4-like2/3/4 clade are found in monocots. This hypothesis is also supported

111 Chapter 3
by the Plaza database (Plaza, 2011) and other studies (Boxall et al., 2005; Murakami et al.,
2007; Higgins et al., 2010). However, in the work of Kolmos et al. (2009), a Bayesian con-
sensus tree suggested that AtELF4 and AtELF4-like1 are the closest homologues of ELF4-
like genes in monocots. It is noteworthy that in their study, some ELF4 family members
were missing from most monocot species analysed, which might have created the poorly-
supported topology that suggested such homology. (Kolmos et al., 2009)
3.4.3.2 – CAB2
CAB2 belongs to a large family of light-harvesting chlorophyll a/b-binding proteins
(CAB) whose evolution has been highly debated (Dittami et al., 2010). Nevertheless, sever-
al observations suggest that CAB2 is not present in monocots. Cross-species reciprocal
BLASTs did not identify CAB2 orthologues in any other plant species. AtCAB2 is likely to
be a tandem duplication of AtCAB1, which occurred during the evolution of the Arabidop-
sis ancestor (Plaza, 2011). Therefore, each taxon, moss, monocots and dicots, might have
evolved their own CAB genes independently during their evolution (Green, 2001; Umate,
2010).
CAB genes have proven roles in clock functions and barley has more than 17 family
members. In order to reduce the number of barley CAB genes for further analysis, a careful
selection took place. HvCABa was chosen because it is the closest to Bradi4g07380 on the
phylogenetic tree (data not shown). Bradi4g07380 is the top BLAST hit when any of the
five Arabidopsis CAB sequences are used. In addition, HvCABa is represented in the array
feature baak26h09, which was identified as being differentially expressed in the clock mu-
tant eam8 (elf3 loss-of-function), when compared with WT (Faure et al 2012). HvCABa is a
hitherto uncharacterised paralogue of the barley CAB family. Other HvCAB members have

112 Chapter 3
been identified and analysed elsewhere (Beator et al., 1992; Campoli et al., 2012b; Faure et
al., 2012).
3.4.3.3 – CHE
CHE (TCP21) was not identified in any other species, according to cross-species re-
ciprocal BLAST analysis, and is present only in Arabidopsis (of all species analysed). In
fact, CHE has a recent duplication (~50 Mya, from the α duplication event) from AtTCP7
(At5g23280) in Arabidopsis (Navaud et al., 2007) and thus, it is not expected to be present
in the other plant species analysed in this study. Higgins et al. (2010) describes a CHE gene
in Brachypodium, Bradi3g60350 (BdCHE), but cross-species reciprocal BLAST disproves
this inference. AtTCP7 belongs to an angiosperm-specific subfamily of TCPs (Navaud et al.,
2007) and is likely to be the real orthologue of BdCHE. This suggestion is also supported by
information in the Plaza database (Plaza, 2011).
3.4.3.4 – CCA1
CCA1, along with LHY, plays an important role in the regulation of the circadian
rhythm in Arabidopsis, but the presence of both counterparts in the genome of other plant
species does not seem to be common. Barley and six other plants analysed have only one
LHY/CCA1 gene, and this suggestion is also confirmed in studies of barley (Campoli et al.,
2012b), rice (Murakami et al., 2007) and Brachypodium (Higgins et al., 2010). This raises the
question of which gene most species contain an orthologue to: LHY or CCA1? Some anal-
yses indicate that LHY, as opposed to CCA1, is present in most plant species (Takata et al.,
2009; Lou et al., 2012; Yon et al., 2012). For instance: 1) cross-species reciprocal BLAST is
possible only for AtLHY, not AtCCA1; 2) Solanum species have only one gene, which is

113 Chapter 3
very similar in sequence to LHY (Figure 3.5); 3) CHE, the transcriptional repressor of CCA1
is also an Arabidopsis-specific gene (described above); 4) CCA1 is a casein kinase II (CK2)
target in Arabidopsis, whereas in rice the OsCK2 orthologue does not target OsCCA1,
probably because OsCCA1 does not contain the correct amino acid for interaction, suggest-
ing again that OsCCA1 is not a true orthologue of AtCCA1 (Ogiso et al., 2010).
Therefore, it can be suggested that for most plant species, both counterparts of
CCA1 and LHY are not present and only one, possibly LHY, is necessary for maintenance
of the circadian rhythm and plant survival. In some cases, a species has duplicated their
LHY gene copy, which likely occurred during the α or β duplication event in Arabidopsis
(Lou et al., 2012). It is important to consider that when the LHY gene duplication occurred,
possibly both copies shared their roles and they are now both important for the mainte-
nance of the circadian rhythm in species where duplication occurred.
3.4.4 – Reference genes
Previous studies on expression of clock genes in barley have used GAPDH
(Dunford et al., 2005), actin (Hemming et al., 2008) and 18S rRNA (Turner et al., 2005) for
normalising clock transcript levels. The reason why those genes were chosen is not well
explained, but may be due to the fact that those genes are housekeeping genes (HKG),
thought to have stable expression. However, it has been shown that HKG do not necessari-
ly have stable expression and choosing them to normalise other genes can compromise ex-
pression analysis (Czechowski et al., 2005; Patel and Jain, 2011). In order to carefully
choose barley reference genes for this study it was decided to base the choice on recent
studies developed in barley and other species (Czechowski et al., 2005; Patel and Jain,
2011; Dekkers et al., 2012). The expression of a large set of genes from a wide range of de-
velopmental stages and environmental conditions was analysed and the genes with the

114 Chapter 3
most stable expression were identified. For instance, genes from the PP2A and UBC fami-
lies have been shown to be considerably more stable in at least nine different species, in-
cluding barley, under various conditions. Additionally, in the work of James et al. (2012),
one member of each family (PP2AA3 and UBC21, respectively) was chosen as reference
gene for clock transcript analyses. Barley homologues of these genes, HvPP2AA2 and
HvUBC21, were identified and used as control in clock expression studies.
Microarray data of PP2AA2 genes in barley, Arabidopsis, tomato, maize, and
wheat show stable expression, suggesting it is a good candidate for normalising transcript
levels (Czechowski et al., 2005; Patel and Jain, 2011; Dekkers et al., 2012). Therefore,
HvPP2AA2 was used as a control gene in barley expression studies. In order to make these
studies more robust, the HvUBC21 gene was used as a second control. Regarding the barley
microarray data available on PLEXdb, there is no information for HvUBC21 because this
gene is not present on the Barley1 Affymetrix® Chip.

115 Chapter 4
Chapter 4. Functional and expression analysis of putative
barley clock genes
4.1 – Introduction
As mentioned previously (Section 1.7), the molecular components of the Arabidop-
sis clock are able to generate circadian rhythms during both day and night and over sea-
sons through complex autoregulatory interlocking positive and negative feedback loops.
These components are mostly transcription factors, but there are also components involved
in protein degradation and stability, among others (Kim et al., 2007; Perales and Más,
2007; Gendron et al., 2012). Clock genes have an endogenous rhythmic expression, main-
tained even in free-running conditions (McClung, 2006).
Input and, mostly, output genes from the core clock regulate various physiological
processes such as photosynthesis, hormone production, stress responses, organ movements
and transition to flowering (Harmer, 2009). These processes have agronomic importance,
and their regulators, clock genes, are key elements in crop improvement programmes.
Time to flowering, in particular, is one of the most important breeding targets.
4.1.1 – Timing of flowering
In all flowering plants, the major physiological change from vegetative growth to
reproductive development is rarely reversible. The correct timing of this event has adaptive
value and plants have evolved a complex regulatory system to control it. Flowering time
regulation is carried out by a complex system that integrates external cues (for instance,

116 Chapter 4
light and temperature) and endogenous signals, which vary with climate and species. Re-
garding endogenous signals, there are four main genetic pathways controlling flowering:
the gibberellin, photoperiod, autonomous and vernalisation pathways.
The gibberellin signalling pathway is tightly regulated by developmental and envi-
ronmental cues, and it assists with normal growth of almost all plant organs, including
flowering initiation in some species, such as Arabidopsis (Blázquez et al., 1998). In these
species, gibberellins are probably important to allow flowering only at the appropriate
growth stage for a given environmental condition (Mutasa-Göttgens and Hedden, 2009).
The photoperiod pathway refers to regulation of flowering in response to day
length and involves the circadian clock (further discussed below in Section 4.1.2). In the
autonomous (or constitutive) pathway, components of the pathway trigger plant flowering
by preventing expression of the flowering repressor FLOWERING LOCUS C (FLC). FLC
inhibits the expression of flowering genes that would otherwise be activated by the photo-
period and gibberellin pathways (Simpson, 2004). The autonomous pathway itself, howev-
er, is independent of day length or gibberellic acid, therefore the name ‘autonomous’
(Srikanth and Schmid, 2011).
The vernalisation pathway has evolved in plants exposed to seasonal cold envi-
ronments (Preston and Sandve, 2013). Upon chilling, genes from this pathway activate or
accelerate the plant’s ability to flower by gradually repressing FLC (Chouard, 1960;
Mouradov et al., 2002).
4.1.2 – Photoperiod pathway
The further from the equator, the more day length varies between summer and win-
ter. Plants have evolved a mechanism that ensures that reproduction occurs in the best-
suited season by sensing day length and coupling this information to the circadian clock.

117 Chapter 4
This allows the clock to efficiently control the appropriate flowering time. Clock control
over photoperiodic flowering has been studied in great detail in Arabidopsis, whose flower-
ing is induced in long day (LD) conditions. The components of the photoperiod pathway
responsible for perceiving light, i.e. daylight measurements, are input, core clock and out-
put genes, which result in synchronisation of clock function with the external photoperiod
and subsequent flowering control. Similar to the way that light controls clock function,
there is also evidence of clock control over light signal transduction, increasing the com-
plexity of the photoperiod pathway (Tóth et al., 2001). For example, to maintain self-
sustained oscillations, the light signal is uncoupled (removed) from the clock by the
AtELF3 gene. The evening-expressed AtELF3 gates light input to the clock, for instance by
suppressing CAB2 mRNA expression and PHYB protein levels (McWatters et al., 2000;
Liu et al., 2001). Ultimately, ELF3 controls photoperiodic flowering and shade avoidance
mechanisms (further information about elf3 mutants in Section 4.1.3) (Yu et al., 2008;
Yoshida et al., 2009; Jiménez-Gómez et al., 2010; Thines and Harmon, 2010).
In Arabidopsis, the genetic network that initiates photoperiodic flowering occurs
through expression of CONSTANS (CO) and FLOWERING LOCUS T (FT) in leaves (
Figure 4.1) (An et al., 2004). During light under LD conditions, FKF1 interacts
with GI and promotes degradation of CYCLING DOF FACTORS (CDFs), which are CO
repressors. Meanwhile, PRR9, PRR7 and PRR5 repress mRNA accumulation of CDFs
(Nakamichi et al., 2007; Liu et al., 2013). These result in daytime CO transcription and
translation. In daytime conditions, the CO protein is stabilised by several components, in-
cluding FKF1 (Song et al., 2012), which induces FT and, consequently, flowering
(Valverde et al., 2004; Sawa et al., 2007; Srikanth and Schmid, 2011). Additionally, GI di-
rectly activates the expression of FT (Sawa and Kay, 2011).

118 Chapter 4
In short day (SD) conditions, the photoperiod pathway behaves differently. Under
these conditions, FKF1 is mostly present during the early night, when there is no blue light
to allow interaction with GI and degradation of CDFs. As a result, CO transcription can-
not occur during the daytime and occurs at night time. In the dark, the CO protein is de-
graded by the proteasome. Without CO, FT and flowering are not induced (Valverde et al.,
2004; Sawa et al., 2007; Srikanth and Schmid, 2011). An alternative pathway to the classi-
cal GI-CO pathway is ELF3-mediated repression of FT expression through accumulation
of the flowering repressor SHORT VEGETATIVE PHASE (SVP) (Yoshida et al., 2009).
Figure 4.1: A schematic and simplified diagram of the photoperiod pathway in Arabidop-
sis leaves under LD conditions. Full lines represent transcriptional regulation, whereas
dashed lines represent regulation at the protein level. Green lines are for activation, while
red lines are for repression. Thick lines represent increased control under LD conditions,
while thin lines occur mostly under SD conditions. Clock-related genes are highlighted
with a box.

119 Chapter 4
4.1.3 – Barley clock mutants
Mutations in clock genes affect the circadian system and consequently cause aber-
rant regulation of the photoperiodic timing of flowering. These mutations have allowed the
identification of many clock components in Arabidopsis (forward genetics) and are par-
ticularly important in crop species, contributing to increased diversity of flowering time.
This diversity has an impact on yield and has been exploited to enable cultivation of crops
in environments with extreme photoperiods, as well as efficient use of the growing season
and the practice of crop rotation (Turner et al., 2005; Murphy et al., 2011; Zakhrabekova et
al., 2012). Naturally-occurring and induced mutations in clock genes have been key factors
to the success and spread of agriculture, including barley. There are three well-
characterised early maturity alleles of barley clock genes: eam1, eam8 and eam10. Regarding
the latter, the candidate gene underlying this locus in barley is the orthologue of AtLUX
(Campoli et al., 2013). Barley eam10 mutants are loss-of-function mutations of HvLUX,
which results in accelerated flowering under long and short days (Campoli et al., 2013).
Below, we will concentrate on the eam1 and eam8 plants.
Barley varieties are generally classified as winter or spring types. Winter (fall-sown)
barley varieties carry the eam1 allele and are early flowering under LD and late flowering
under SD, which is the wild-type phenotype and that which barley ancestors exhibited
(Jones et al., 2008). Spring (spring-sown) barley varieties have lower responsiveness to pho-
toperiodic changes, flowering later than winter barley under LD, but no difference is ob-
served under SD (Turner et al., 2005). This reduced responsiveness to LD photoperiodic
flowering of spring barley is caused by the presence of the Hvppdh1 (Hvprr37) mutant allele,
and it is advantageous in long growing seasons. In this case, late flowering allows an ex-
tended time in the vegetative growing stage and biomass accumulation, which consequent-
ly supports higher yields.

120 Chapter 4
In fact, eam1 plants carry the functional HvPPDH1 (HvPRR37) gene, which is the
major determinant of photoperiod response in barley and is the homologue of Arabidopsis
PRR7 (Turner et al., 2005). AtPRR7 undergoes AS in response to temperature, which sug-
gests its involvement in temperature compensation mechanisms (Salomé and McClung,
2005; Gould et al., 2006; Salomé et al., 2010; James et al., 2012a). The mutation of Hvppdh1
which explains the spring barley flowering phenotype under LD is not precisely known
because no robust biochemical or functional analysis was hitherto performed (e.g. com-
plementation tests), but there are some hypotheses formulated by sequence-based poly-
morphism studies. The causal Hvppdh1 mutation might lie either in the conserved ‘con-
stans, constans-like and TOC1’ (CCT) domain (involved in protein interactions and nucle-
ar localisation) (Turner et al., 2005) or the more recently suggested SNP48 (Figure 5.8)
(Jones et al., 2008). The Hvppdh1 alleles are likely to cause a reduction in gene function, as
opposed to complete loss-of-function or a gain-of-function because: i) they are recessive
alleles; ii) the ORF is maintained; iii) photoperiod response is reduced under LD, not elim-
inated; iv) photoperiod response is similar to PPDH1 under SD.
The eam8 mutants are knock-out mutants of the HvELF3 and are early flowering
due to an effect on photoperiod sensitivity (Zakhrabekova et al., 2012). The HvELF3 gene is
a homologue of AtELF3 and controls the mRNA levels of most core clock genes (Dixon et
al., 2011). It is involved in diverse mechanisms from temperature response to flowering
time (Yu et al., 2008; Yoshida et al., 2009; Jiménez-Gómez et al., 2010; Thines and
Harmon, 2010). In Arabidopsis and barley, mutations in the ELF3 gene disrupt plant sensi-
tivity to photoperiod and these mutants flower considerably early, even in non-inductive
SDs (Zagotta et al., 1996; Fu et al., 2009; Faure et al., 2012; Saito et al., 2012; Yang et al.,
2013; Zakhrabekova et al., 2012). Early flowering mutants are commercially important for

121 Chapter 4
environments with short growing seasons, like Scandinavia and Iceland (Faure et al., 2012;
Zakhrabekova et al., 2012).
Because ppdh1 and elf3 mutations affect photoperiod response and sensitivity to in-
duce flowering and both are in core clock genes, we studied the influence of these muta-
tions on the clock and expression of other clock genes to gain a better understanding of
clock functions. First, the influences of the ppdh1 and elf3 mutations on core clock genes
were analysed at the phenotypic level, which confirmed their roles in barley biology as de-
scribed previously (Turner et al., 2005; Faure et al., 2012). Second, the 21 barley homo-
logues of the Arabidopsis core clock and selected associated genes identified in silico (Chap-
ter 3) were examined in light/dark and free-running conditions to confirm that they were
clock genes. Lastly, we examined the effect of ppdh1 and elf3 mutations on clock gene ex-
pression.
4.2 – Materials and methods
4.2.1 – Plant growth conditions
Barley plants (see 2.1.1) grown in the glasshouse were placed in plastic cylinder
pots (20 cm height × 16 cm top diameter) filled with cereal compost (Appendix A1).
Growing conditions were 16 h daylight at approximately 20 °C and 8 h dark at approxi-
mately 16 °C (see Appendix A6). Plants were grown for two to three months, until seeds
were set and ready for harvest. For short days, plants were grown in a controlled environ-
ment (see 2.1.2). The light regime of SD was 8 h light and 16 h dark per day and tempera-
ture was maintained at 20 °C. SD plants were grown in medium square plastic pots (10
cm3).

122 Chapter 4
4.2.2 – Phenotyping
Plant phenotyping was carried out according to the Zadoks code, which is a deci-
mal code for the growth stages (GS) of cereals (Zadoks et al., 1974; Lancashire et al., 1991).
Flowering time was calculated from the day plants were transferred to soil until the day
they reached GS49. At this stage, the first awns are visible protruding from the flag leaf.
Additionally, the lengths of flag leaf -1 and spike were measured at GS59 (Figure 4.2A).
Data collection was carried out on the main stem, not side shoots. The final number of
grains harvested per plant was also counted. Phenotyping was carried out for both long
(LD) and short days (SD). For LD, 4 plants were grown in a glasshouse environment,
whereas for SD, 10 plants were grown in the controlled environment of a growth cabinet.
To compare phenotypes from different barley lines, sets of data were analysed using an
Analysis of Variance (ANOVA). The associated P values calculated in the ANOVA and
Mann-Whitney U tests were two-tailed and a significance level of 5% (α = 0.05) was
used. GenStat (15th Edition version 15.1.0.9425, VSN International LTD) was used for all
statistical analysis.
Figure 4.2: Schematic representation of cereals at GS59 and GS11 of the Zadoks code. A)
Inflorescence at GS59, when the lengths of flag leaf -1 and spike were measured (drawing
modified from(Rawson and Macpherson, 2010). B) Seedlings at GS11 were harvested in
light/dark and free-running experiments. At this stage, seedlings have one leaf (L) unfold-
ed and a second leaf present, not yet fully expanded (drawing modified from(Dow, 2010).
A) GS59 B) GS11

123 Chapter 4
4.2.3 – Plant material for light/dark and free-running conditions (constant
light)
Grains from each line were first germinated in the dark at 4 °C on sterile water-
soaked filter papers and transferred to small square plastic pots (5 cm3) filled with cereal
compost (Appendix A1). Each pot contained 5 grains from the same line. Plants were
grown in a controlled environment growth cabinet at 20 °C with 16 h light (400 μmol m−2
s−1) and 8 h dark (LD treatments). Temperature and humidity were monitored with a data
logger (EL-USP-2 from Lascar Electronics) that confirmed stable conditions at around
20 °C and 70%, respectively (data not shown). No crop protection treatment was applied.
To analyse plants at the same stage of development, the majority of the plants were har-
vested at GS11 of the Zadoks code, when the first leaf is unfolded (Figure 4.2B) (Zadoks et
al., 1974; Lancashire et al., 1991). Plants which were not at this stage at the start of harvest
were discarded. Plants were harvested at approximately 2 h 30 min intervals for a total of
48 hours from the start of an initial dark period (ZT0). For harvesting under dark condi-
tions, samples were quickly collected in low, indirect light. After LD sampling, barley
plants were subjected to continuous light (20 °C, LL treatments). Sampling started at ZT0
of continuous light, during the subjective night, and continued at approximately 2 h 30
min intervals for a total of 69.5 hours (Figure 4.3). A minimum of two biological replicates
were taken per time point, each comprising one or two leaves from at least four independ-
ent plants from one pot. Additionally, to avoid interference in the experiment coming from
a possible microclimate within the growth cabinet, pots with different barley lines and rep-
licates were placed in a randomised array. Plants for each time point were also previously
selected/determined in a random fashion from the array (Appendix B3). Furthermore, or-
der of sampling at each time point (9 samples) was random for the barley lines and repli-
cates and it was performed in less than 10 min. Leaf material for each time-point, line and

124 Chapter 4
replicate were collected and rapidly frozen in liquid nitrogen and stored at -80 °C until iso-
lation of RNA.
Figure 4.3: Sampling regime of light/dark and constant light experiments. Red arrows
represent time points when sampling occurred. Black boxes are for dark, white boxes are
for light and grey boxes represent subjective dark. ZT0 points are indicated at the start of
sampling and the start of free-running conditions.
4.2.4 – Statistical tests on gene expression data
Expression data were obtained from HR RT-PCR experiments, which involved an
initial RT reaction, carried out according to instructions in Section 2.3.1 and used RNA
samples (extracted according to Section 2.2) obtained from experiments described in Sec-
tion 4.2.3. Subsequently, PCR reactions and product analyses were carried out according
to instructions in Section 2.4.3. Once quantification of the PCR products had been
achieved, the normalised expression data were plotted using SigmaPlot software version
12.0 and edited using Adobe® Illustrator® CS5 software version 15.0.2. Data plotted on the
graphs were mean expression values of biological replicates calculated using Microsoft Ex-
cel 2010. For long-day (LD) conditions, expression data over the first two days of
light/dark were considered as replicates of a 24-hour day. Error bars are Standard Error of
the Mean (SEM) calculated from four (LD) or two (LL) biological replicates from a pool
of four plants in each replicate.

125 Chapter 4
Confirmation of rhythmic transcript expression was carried out using the Biological
Rhythms Analysis Software System (BRASS, available at www.amillar.org), running fast
Fourier transform nonlinear least-squares (FFT-NLLS) estimation. FFT-NLLS analysis
estimated the relative amplitude error (RAE, a measure of goodness of fit to a theoretical
sine wave), which was taken as an objective measure of rhythmic transcript expression.
Lines with RAE values were considered as significantly rhythmic. The number of tested
biological replicates is n=2. These were analysed within the circadian range of 15–35h with
a 90% confidence limit.
To compare expression values from different barley lines, sets of data were first
tested for normality using the Shapiro-Wilk test for Normality. Normally distributed data
sets were analysed using an Analysis of Variance (ANOVA) from the GenStat software.
Biological replicate and time point (when relevant) were defined as random effects in the
ANOVA in order to remove the residual errors resulting from these factors and giving
more appropriate testing for differences between barley lines. For LD data sets deviating
substantially from a normal distribution (p < 0.001), comparison analyses were performed
with the non-parametric Mann-Whitney U test using the GenStat statistical software. The
associated P values calculated in the ANOVA and Mann-Whitney U tests are two-tailed
and a significance level of 5% (α = 0.05) was used. GenStat (15th Edition version
15.1.0.9425, VSN International LTD) was used for all statistical analysis.
4.3 – Results
The 21 barley homologues of the Arabidopsis core clock and selected associated
genes identified in silico were tested for circadian expression. Firstly, the influence of the
two mutations in the core clock genes HvPPDH1 and HvELF3 were analysed at the pheno-
typic level, which allowed confirmation of their roles in the overall biology of the barley

126 Chapter 4
plant. Secondly, the expression behaviour of the putative barley clock genes was analysed
in light/dark and free-running conditions, which suggested functional conservation of
these genes. Lastly, the effect of ppdh1 and elf3 mutations on clock gene expression was ex-
amined.
Three barley lines were selected for the experiments described in this work: Bow-
man (ppdh1), eam1.d and eam8.w. Bowman (ppdh1) was selected for two main reasons:
1) its genome is one of the lines undergoing genome sequencing and 2) the availability of
two Bowman NILs containing different alleles of clock genes: eam1.d and eam8.w (Druka et
al., 2011). Bowman contains the naturally occurring recessive Hvprr37 (ppdh1) gene. The
functional HvPRR37 (HvPPDH1) allele is found in the eam1.d Bowman NIL. It is notewor-
thy that this line is a BC8 line (8th backcross with Bowman) with a small gene interval, < 1
cM, introgressed on chromosome 2H. This introgressed segment contains not only the
PPDH1 allele but also additional sequence from KT1031 barley cultivar, which was intro-
gressed because of its close proximity to the PPDH1 locus (Professor Robbie Waugh, per-
sonal communication). Genes contained on this additional sequence could potentially in-
terfere with our studies but, to date, there is no evidence for this region influencing pheno-
type and was therefore not taken into account in the analyses carried out here. Neverthe-
less, this line is the only one carrying the functional PPDH1 allele in the Bowman back-
ground and is, therefore, the effective ‘wild type’ (WT) for clock studies. A functional
clock is an important starting premise to investigate mutation in clock genes (such as
ppdh1), as well as for comparisons to results from clock research in the model plant Ara-
bidopsis (which are mostly reported for WT plants). For this reason, eam1.d Bowman NIL
hereafter represents the WT and was used in comparisons to Bowman (ppdh1) and eam8.w.
The eam8.w mutant carries a loss-of-function mutation of the ELF3 gene, which is a single
point mutation that introduces a PTC in exon 2 of HvELF3 (Figure 4.4). It is noteworthy

127 Chapter 4
that this line has 1.5 cM sequence from Early Russian barley cultivar introgressed into
chromosome 1H. As eam8.w is in the Bowman (ppdh1) background, it also carries the
Hvppdh1 allele and therefore represents a double mutant when compared to Bowman
(ppdh1) and the effective wild-type (eam1.d). For simplicity, the eam8.w NIL is hereafter
referred to as the Hvelf3 mutant.
Figure 4.4: Genomic structure of Hvelf3 in the eam8.w Bowman (ppdh1) NIL. The causal
Hvelf3 mutation is a PTC in the coding region (black boxes) (Zakhrabekova et al., 2012),
which is represented by a ‘STOP’ sign in the diagram.
4.3.1 – Phenotype of barley clock mutants
An initial group of seeds from the three barley lines, kindly provided by Dr Arnis
Druka, were individually and directly sown into pots for bulking seed in the glasshouse
(LD conditions). This procedure ensured a high enough number of seed sets from each line
for the expression analyses. At the same time, these lines were phenotyped. For this ap-
proach, a small number of biological replicates and physiological traits were analysed be-
cause plants carrying these mutations have been extensively characterised previously
(Campoli et al., 2012b; Faure et al., 2012). Therefore, the phenotyping approach adopted
here was mainly to confirm the genetic identity of these barley lines. Moreover, the num-
ber of replicates used was enough to confirm significant differences of phenotypes between
these lines.

128 Chapter 4
Significant morphological differences existed between Bowman (ppdh1), wild type
and the Hvelf3 mutant under LD conditions. Both NILs had smaller leaves and flowered
considerably early, especially WT (eam1.d), when compared to Bowman (ppdh1) (Figure
4.5A and B). A similar difference in phenotype was observed for spike length, which was
also reflected in the number of grains per plant (Figure 4.5C). In fact, many traits, includ-
ing height, number of tillers and stem diameter were smaller in WT and Hvelf3 plants when
compared to Bowman (ppdh1) (Appendix B1). This suggests a general reduction in bio-
mass for these early flowering plants. However, a unique exception was observed for awn
length, which was similar among the tested barley lines (Appendix B2). Grain size was
similar among the three barley lines (data not shown), but studies of this trait would re-
quire more robust analysis. Nevertheless, despite the small length of spikes and reduced
number of grains in early flowering plants, the similar size of other flowering structures
suggests that their inflorescence development was not affected by the early flowering phe-
notype and all structures were correctly formed.
To analyse phenotypes of plants in short day (SD) conditions, ten plants of each
line (Bowman, WT, and Hvelf3) were first germinated in sterile water-soaked filter papers
and transferred to soil in a controlled environment growth cabinet under SD conditions.
Cabinet conditions were monitored with a data logger (EL-USP-2 from Lascar Electronics)
that confirmed stable temperature and humidity, at around 20 °C and 70% respectively
(data not shown). The most striking difference observed was the flowering time of the
Hvelf3 mutants. These plants flowered around 100 days earlier than Bowman (ppdh1) and
WT plants. Additionally, Hvelf3 plants showed significantly smaller leaves and spikes, and
reduced number of grains per plant when compared to Bowman (ppdh1) (Figure 4.6). In
contrast, the WT plants flowered at the same time as Bowman (ppdh1), with similar leaf
and spike lengths. There was a tendency for WT plants to generate fewer grains per plant

129 Chapter 4
when compared to Bowman (ppdh1), but this was not statistically significant, probably due
to high variation of grain production per plant in both WT and Bowman (ppdh1).
Figure 4.5: Phenotypes of Bowman (ppdh1), WT and Hvelf3 plants in LD. A) Leaf size
phenotype. Photograph taken of detached leaves from 28-day old plants (n=4). The 31-cm
ruler at the bottom is to show scale. B) Flowering time phenotype. Photograph taken of
inflorescences from 28-day old plants (n=1). White bar at the bottom represents a 3 cm
scale. Variation in days to flowering among plants are represented by plus-minus sign (±).
C) Plotted data of spike and leaf length, and number of grains per plant (n=4). Mean val-
ues and standard deviations (error bars) shown are relative to Bowman (ppdh1). P values
represent statistical comparisons of Bowman (ppdh1) to equivalent values of WT and
Hvelf3. **, P < 0.01; ***, P < 0.001.

130 Chapter 4
Figure 4.6: Phenotype of Bowman (ppdh1), WT and Hvelf3 plants under SD conditions
(n=10). Plotted data of spike and leaf length, and number of grains per plant. Mean values
(in %) and standard deviations (error bars) shown are relative to Bowman (ppdh1). P values
represent statistical comparisons of Bowman (ppdh1) to equivalent values of WT and
Hvelf3. ***, P < 0.001. Flowering times are shown in days, below each barley line. Varia-
tion in days to flowering among plants are represented by plus-minus sign (±).
In summary, allelic differences in the barley clock genes found in Bowman (ppdh1),
WT and Hvelf3 plants have affected their response to photoperiodic flowering (Table 4.1).
The ppdh1 allele interfered with the flowering time only in LD, delaying flowering by
around 12 days when compared to WT plants. In contrast, the Hvelf3 mutation (elf3/ppdh1
double mutant) caused insensitivity to photoperiod and plants flowered considerably early
under SD and LD. In LD, in particular, the Hvelf3 mutation rescued the late flowering
phenotype caused by the ppdh1 allele. Moreover, biomass and yield were greatly affected in
early flowering plants under the conditions analysed.

131 Chapter 4
Table 4.1: Barley plants and alleles present, along with flowering phenotypes. PP: photo-
period. NIL allele in Bowman (ppdh1) background is shown in red.
Barley plant Putative
PRR7 allele ELF3 allele Phenotype for LD Phenotype for SD
Bowman ppdh1 HvELF3 Late flowering Late flowering WT (eam1.d) PPDH1
(PP responsive) HvELF3 Early flowering Late flowering
Hvelf3 (eam8.w)
ppdh1 Hvelf3-eam8.w (PP insensitive)
Early flowering Early flowering
4.3.2 – Expression analysis of barley circadian clock genes
The expression patterns of putative barley genes identified and confirmed in silico
(Chapter 3) were analysed. It is expected that clock genes have an endogenous rhythmic
expression, maintained even in free-running conditions (McClung, 2006). However, muta-
tions in core clock genes might influence the expression of other clock genes. Therefore,
the expression patterns of the 21 barley clock genes were analysed in Bowman (ppdh1) and
the two NILs (WT and Hvelf3). These plants (Appendix B4) were grown under 16 h light, 8
h dark conditions and then under constant light (Figure 4.3). cDNA templates were pre-
pared from two biological replicates of 45 different time points throughout two day/night
cycles and almost 70 h of constant light. A total of 272 samples were used for systematic
HR RT-PCR expression analysis using a pair of gene-specific primers for each clock gene
(Table 2.1). Expression data were plotted and peaks of expression determined and whether
expression was rhythmic or arrhythmic. The data are summarised in Table 4.2 and exam-
ples of the expression plots are shown for a small number of genes with the remaining plots
presented in Appendix B5. In addition, the results for each gene are described below. No
expression data were obtained for five genes, from the initial list of 21, despite multiple at-
tempts to design gene-specific primers that give reproducible results. These genes are
HvGRP7a, HvGRP7b, HvELF4-like3, HvFT2, and HvZTLb.

Table 4.2: Approximate expression peak or, in a few cases, trough of barley clock genes in different lines and conditions.
WT Hvelf3 Bowman (ppdh1) LD LL LD LL LD LL
LHY 2.5/5.5 h
after dawn ▼ 8 h after
subj. dawn ▼ 2.5/5.5 h
after dawn ▼ Ar
2.5/5.5 h after dawn ▼
8 h after subj. dawn ▼
CABa Day 22 h period ▼ Trough 2.5 h before dusk
Ar Day ▼ Ar
FKF1 5.5/2.5 h
before dusk ▼ Subj. dusk ▼
5.5/2.5 h before dusk ▼
5.5 h before subj. dusk
5.5/2.5 h before dusk
2.5 h before subj. dusk ▼
GI 5.5 h before dusk ▼ Around subjective dusk ▼ 2.5 after dawn & at
dusk Ar 5.5 h before dusk ▼
Around subjective dusk
TOC1 2.5 h before dusk ▼ 28 h period ▼ 2.5 h before dusk ▼ Ar 2.5 h before dusk ▼ 2.5 h before dusk ▼ ELF3 2.5 h after dusk Ar NMD Ar Ar Ar
ELF4-likeA 2.5 h before dusk Ar 2.5 h before dusk Ar 2.5 h before dusk Ar
LUX 2.5 h before dusk 2.5 h before subj. dusk ▼ Trough at 2.5 h
after dawn Ar 2.5 h before dusk 28h period ▼
ZTLa Ar Ar Ar Ar Ar Ar
Ppd-H1 Day 16 h period Day 8 h before subj. dusk Day ▼
8 h before subj. dusk
PRR73 Day ▼ 16 h period Day 8 h before subj. dusk Day ▼
8 h before subj. dusk
PRR95 5.5 h before dusk ▼ 5.5 h before subj. dusk ▼ 5.5 h before dusk ▼ 30 h period ▼ 5.5 h before dusk ▼ 5.5 h before subj.
dusk ▼
PRR59 5.5 h before dusk ▼ 5.5 h before subj. dusk Trough at 2.5 h
after dawn Ar 5.5 h before dusk ▼
5.5 h before subj. dusk
CO1 2.5 h before dusk ▼ 16 h period Dusk ▼ Ar Dusk ▼
Ar
CO2 2.5 h before dusk ▼ 16 h period Dusk ▼ Ar 2.5 h before dusk ▼ Ar
FT1 2.5 h before dusk 6h before
subjective dusk 2.5 h after dusk Ar 2.5 h after dawn 28 h period ▼
Day: expression over a large part of the day, i.e. 2.5 h after dawn until dusk. Ar, arrhythmic. NMD, mRNA likely degraded by NMD. ▼, Rhythmic 24-h (unless stated otherwise) expression profile confirmed by BRASS.
132
C
hapter 4
133 Chapter 4
It is noteworthy that expression graphs generated from expression analyses have
different scales for different reasons. First, barley clock-related genes are expressed in dif-
ferent levels. For example, CABa mRNAs were very abundant (5 times the control levels),
while ELF4-likeA were found in very low levels (15% of the control levels). However, these
differences are relative as they were minimised by measuring the abundance of FS tran-
scripts after 20 to 28 cycles of amplification, depending on the abundance from different
clock genes. Second, different primers may have different amplification efficiencies, ex-
plained, for example, by the GC content and size of primers or the regions being amplified.
LHY (Figure 4.7A,B). HvLHY was the only clock gene expressed exclusively in the
morning, with a peak of expression between 2.5 h and 5 h after dawn for WT, Bow-
man (ppdh1) and Hvelf3 plants under normal conditions. There was a significant differ-
ence in LHY expression between WT and the clock mutants (Bowman and Hvelf3). On
one hand, the peak of Bowman (ppdh1) LHY was higher than that of WT plants for
more than 5 h, returning to similar levels in the evening and night. On the other hand,
LHY levels of Hvelf3 plants were half of those found in WT plants during the day. In-
terestingly, Hvelf3 plants had significantly higher levels of LHY during the night, when
compared to WT plants. In constant light, LHY had lower amplitude and maintained
a rhythmic expression in WT and Bowman (ppdh1) plants, with the peak of expression
delayed by at least 3 hours. In Hvelf3 plants, LHY expression was considerably lower
and effectively lost rhythmicity on the second day under constant light.
CABa (Figure 4.7C,D). For both WT and Bowman (ppdh1) plants, HvCABa had a
broad expression peak in light/dark conditions, spanning the greater part of the day:
between 2.5 h after dawn and before dusk. In Hvelf3 plants, HvCABa expression de-
creased towards the end of the day (at around 2.5 h before dusk) but then increased in
the night, but no clear single peak was observed. In constant light conditions, WT

134 Chapter 4
plants maintained rhythmic expression with a 22 h period. In Bowman (ppdh1) and
Hvelf3 plants, although expression increased and decreased, it was sporadic with no
continuous rhythm or consistent difference for HvCABa expression among these barley
lines analysed.
FKF1 (Figure 4.7E,F). HvFKF1 had a peak of expression between 5.5 h and 2.5 h be-
fore dusk in WT, Bowman (ppdh1) and Hvelf3 plants. However, daily activation of ex-
pression of FKF1 occurred earlier in Bowman (ppdh1) and Hvelf3 plants when com-
pared to WT plants. When FKF1 expression profiles of these clock mutants were
manually delayed by 1.5 h in the Adobe Illustrator® program, they matched the WT
profile (Appendix B6) such that FKF1 expression in the mutants is advanced by 1.5 h.
In the first day under constant light conditions, the three barley lines had different
FKF1 expression behaviour, suggesting differential control over this gene during clock
entrainment. The Bowman mutant in days 1 and 2 of LL looks much like the WT in
LD – with the expression peaking later in the WT and earlier in Hvelf3.

135 Chapter 4
Figure 4.7: Transcript levels of HvLHY, HvCABa and HvFKF1 from WT, Bowman (ppdh1)
and Hvelf3 plants. A, dark/light conditions are shown for better representation of the start
of expression of LHY at the end of the night. Dark and light periods are shown with dark
grey and white backgrounds, respectively. C and E represent light/dark conditions. B, D
and F represent transfer to continuous light. Subjective nights are on light grey back-
grounds. Error bars: SEM. P values represent statistical comparisons of WT against each
mutant (colour coded). *, P ≤ 0.05; **, P ≤ 0.01; ***, P ≤ 0.001.

136 Chapter 4
GI (Figure 4.8A,B). In WT and Bowman (ppdh1) plants, HvGI was rhythmic in
light/dark cycles, with a peak of expression at around 5.5 h before dusk. There was no
significant difference in HvGI expression levels between WT and Bowman (ppdh1). In
Hvelf3 plants, HvGI expression peaked at 2.5 h after dawn and at dusk, having higher
expression in the morning and at night, when compared to WT. In constant light,
HvGI had lower amplitude and maintained a rhythmic expression in WT and Bow-
man (ppdh1) plants, with the peak of expression delayed by at least 2 hours. In Hvelf3
plants, HvGI expression showed no clear rhythm under constant light conditions but
has higher levels of expression.
TOC1 (Figure 4.8C,D). HvTOC1 was rhythmic in light/dark cycles with a peak of ex-
pression at around 2.5 h before dusk for the three barley lines analysed. Rhythmic ex-
pression was maintained in constant light conditions for WT and Bowman (ppdh1)
plants. There was no significant difference in HvTOC1 expression levels between WT
and Bowman (ppdh1). In Hvelf3 plants, HvTOC1 is arrhythmic and had significantly
higher expression levels during the morning and subjective morning.
ELF3 (Figure 4.8E,F). This gene was probably rhythmic in WT barley, with a peak at
2.5 h after dusk. In Bowman (ppdh1) plants, HvELF3 was arrhythmic, and it was sig-
nificantly expressed at higher levels in the morning, compared to WT. In contrast,
Hvelf3 mutants express the Hvelf3 gene 50% less of when compared to WT. This reduc-
tion is likely due to the nonsense mutation in the Hvelf3 gene which targets the tran-
scripts to NMD. No rhythmicity was observed for ELF3 in constant light conditions
for the three barley lines analysed.

137 Chapter 4
Figure 4.8: Transcript levels of HvGI, HvTOC1 and HvELF3 from WT, Bowman (ppdh1)
and Hvelf3 plants. A, C and E represent light/dark conditions. Light and dark periods are
shown with white and dark grey backgrounds, respectively. B, D and F represent transfer
to continuous light. Subjective nights are on light grey backgrounds. Error bars: SEM. P
values represent statistical comparisons of WT against each mutant (colour coded).
*, P ≤ 0.05; **, P ≤ 0.01; ***, P ≤ 0.001.

138 Chapter 4
ELF4-likeA (Appendix B5). This gene probably had a rhythmic expression in barley,
with a peak at 2.5 h before dusk and a secondary peak at dawn. No rhythm was ob-
served in constant light conditions. No significant or marked difference was observed
in the expression of ELF4-likeA in the three barley lines analysed.
LUX (Appendix B5). HvLUX was rhythmic in light/dark cycles with an abrupt peak of
expression at 2.5 h before dusk for WT and Bowman (ppdh1). There was no significant
difference in the HvLUX expression levels between WT and Bowman (ppdh1). In
Hvelf3 plants, this peak was significantly reduced and an increased expression of
HvLUX was seen in the morning. In constant light, Hvelf3 plants were arrhythmic,
while WT and Bowman (ppdh1) plants continued to be rhythmic. Interestingly, on the
first subjective night and morning, WT plants had significantly higher expression lev-
els of HvLUX when compared to Bowman (ppdh1).
ZTLa (Appendix B5). In barley, HvZTLa was arrhythmic. In Bowman (ppdh1) and
Hvelf3 plants, HvZTLa was expressed at higher levels in the morning, when compared
to WT plants. In constant light conditions, there were no consistent differences in
HvZTLa expression levels between WT, Bowman (ppdh1) and Hvelf3.
PPDH1 (PRR37) (Figure 4.9A,B). HvPPDH1 (WT) and Hvppdh1 (Bowman) alleles had
a broad expression peak in light/dark conditions, spanning the greater part of the day:
between 2.5 h after dawn and at dusk. Bowman (ppdh1) and Hvelf3 plants had signifi-
cantly higher levels of Hvppdh1, when compared to WT, which continues in constant
light. Hvelf3 mutants, in particular, had higher Hvppdh1 expression at most time points,
particularly during the morning and night. Expression of Hvppdh1 in Bowman (ppdh1)
and Hvelf3 (also ppdh1) plants might continue to be rhythmic in free running condi-
tions, whereas WT plants could have a shorter period, around 16 h (although not con-
firmed by BRASS).

139 Chapter 4
PRR73 (Figure 4.9C,D). In WT and Bowman (ppdh1) plants, HvPRR73 had a broad
expression peak in light/dark conditions, spanning the greater part of the day: be-
tween 2.5 h after dawn and declining before dusk. Bowman (ppdh1) and Hvelf3 plants
had significantly higher levels of HvPRR73 when compared to WT. Hvelf3 mutants, in
particular, had higher HvPRR73 expression at most time points, particularly during the
morning and night, which was less evident in continuous light. Expression of
HvPRR73 in Bowman (ppdh1) and Hvelf3 plants might continue to be rhythmic in free
running conditions, whereas WT plants could have a shorter period, around 16 h (alt-
hough not confirmed by BRASS).
Interestingly, both HvPPDH1 and HvPRR73 had very similar expression profiles in
LD and LL, suggesting their transcriptional control is similar. However in LD, HvPRR73
expression was reduced at night and in the morning, while expression of the paralogue
HvPPDH1 was reduced only between 2.5 h before dawn and at dawn.

140 Chapter 4
Figure 4.9: Transcript levels of HvPPDH1 and HvPRR73 genes from WT, Bowman (ppdh1)
and Hvelf3 plants. A and C represent light/dark conditions. Light and dark periods are
shown with white and dark grey backgrounds, respectively. B and D represent transfer to
continuous light. Subjective nights are on light grey backgrounds. Error bars: SEM. P val-
ues represent statistical comparisons of WT against each mutant (colour coded).
*, P ≤ 0.05; **, P ≤ 0.01; ***, P ≤ 0.001.

141 Chapter 4
PRR95 (Figure 4.10A,B). In the three barley lines analysed, HvPRR95 was rhythmic
with an expression peak at 5.5 h before dusk. Bowman (ppdh1) plants had significantly
higher transcript levels of this gene in the afternoon when compared to WT. In Hvelf3
plants, HvPRR95 was highly expressed in the morning and during evening and night
when compared to WT plants. In free running conditions, HvPRR95 was rhythmic for
the three barley lines analysed. Hvelf3 mutants, in particular, showed a 30 h period of
expression.
PRR59 (Figure 4.10C,D). In WT plants, HvPRR59 had a broad expression peak in
light/dark cycles, spanning the greater part of the evening: between 5.5 h before dusk
and at dusk. Daily activation of expression of HvPRR59 occurred around 1 h earlier in
Bowman (ppdh1) when compared to WT plants (Appendix B6). Expression of this
gene was probably rhythmic in free running conditions for WT and Bowman (ppdh1)
plants. In Hvelf3 mutants, HvPRR59 lost its peak in the evening and became highly ex-
pressed in the morning when compared to WT plants. This behaviour continued for
the first two days in constant light.
Both HvPRR95 and HvPRR59 had very similar expression profiles in LD and LL,
suggesting their transcriptional control is alike. However, in LD HvPRR95 expression was
reduced in the night and morning, while expression of the paralogue HvPRR59 was re-
duced only after dawn. Interestingly, such similarity with subtle expression differences was
also observed between paralogues HvPRR37 and HvPRR73, suggesting both pair of genes
conserved part of their transcriptional control after gene duplication event.
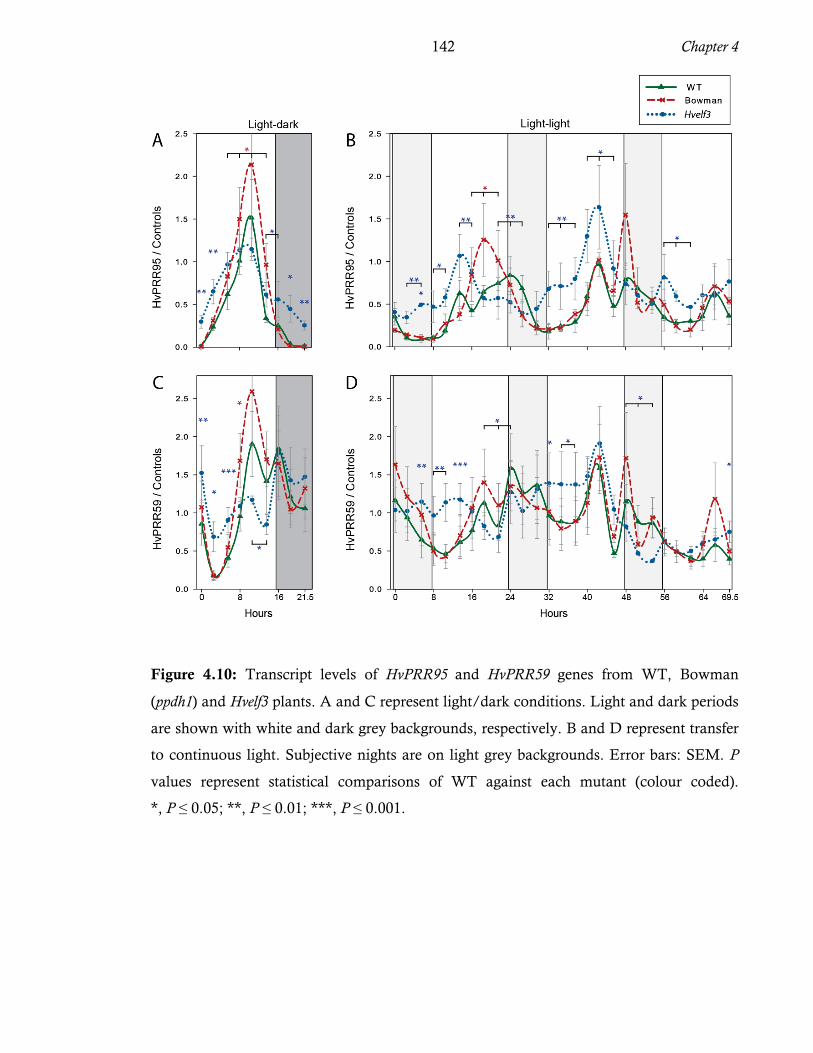
142 Chapter 4
Figure 4.10: Transcript levels of HvPRR95 and HvPRR59 genes from WT, Bowman
(ppdh1) and Hvelf3 plants. A and C represent light/dark conditions. Light and dark periods
are shown with white and dark grey backgrounds, respectively. B and D represent transfer
to continuous light. Subjective nights are on light grey backgrounds. Error bars: SEM. P
values represent statistical comparisons of WT against each mutant (colour coded).
*, P ≤ 0.05; **, P ≤ 0.01; ***, P ≤ 0.001.

143 Chapter 4
4.3.2.1 – Flowering activators CO and FT
CO1 (Figure 4.11A,B). HvCO1 was an evening-expressed gene in WT plants. Bowman
(ppdh1) and Hvelf3 mutants had a CO1 expression peak at dusk, which was delayed by
circa 2.5 h when compared to WT. Bowman (ppdh1) in particular had a delayed in-
crease of HvCO1 expression, when compared to WT. In free running conditions,
Bowman (ppdh1) and Hvelf3 plants had 50% less CO1 transcripts when compared to
WT plants. No clear 24-h rhythmic expression period was observed in free running
conditions for the three barley lines analysed. However, it might be possible that WT
plants have a shorter period of 16 h, which is very similar to the PPDH1 expression
rhythm (although not confirmed by BRASS).
CO2 (Figure 4.11C,D). Interestingly, fully spliced transcripts, antisense spliced tran-
scripts and unspliced mRNAs were detected from the HvCO2 locus. These were de-
tected and confirmed using the approach detailed in Chapter 5. In order to analyse on-
ly fully spliced transcripts, expression data from other mRNA isoforms were eliminat-
ed from the analysis. This elimination was possible when using the HR RT-PCR sys-
tem that distinguishes PCR products based on size. Subsequently, only fully spliced
HvCO2 mRNAs were taken into account. This gene was expressed in the evening in
WT plants. In Bowman (ppdh1) plants, CO2 expression was significantly reduced and
was induced much later in the evening when compared to WT plants. The same delay
in HvCO2 expression was observed in Hvelf3 plants, as well as faster reduction in tran-
script levels during the night. In constant light conditions, both Bowman (ppdh1) and
Hvelf3 plants had significantly lower HvCO2 transcript levels when compared to WT,
and these plants were probably arrhythmic for this gene. It might be possible that WT
plants have a shorter period of 16 h, which is very similar to the PPDH1 and CO1 ex-
pression rhythm (although not confirmed by BRASS).

144 Chapter 4
Figure 4.11: Transcript levels of HvCO1, HvCO2 and HvFT1 genes from WT, Bowman
(ppdh1) and Hvelf3 plants. A, C and E represent light/dark conditions. Light and dark peri-
ods are shown with white and dark grey backgrounds, respectively. B, D and F represent
transfer to continuous light. Subjective nights are light grey backgrounds. Error bars: SEM.
P values represent statistical comparisons of WT against each mutant (colour coded). *, P
≤ 0.05; **, P ≤ 0.01; ***, P ≤ 0.001.

145 Chapter 4
FT1 (Figure 4.11E,F). HvFT1 is an evening-expressed gene in WT plants, with a sec-
ondary expression peak in the morning. Rhythmic HvFT1 expression was probably
maintained in free running conditions in WT plants (although not confirmed by
BRASS). Bowman (ppdh1) and Hvelf3 mutants had very reduced FT1 expression when
compared to WT. FT1 expression in Bowman (ppdh1) was morning-specific, while in
Hvelf3 plants, it was delayed by circa 5.5 h when compared to WT plants (Appendix
B6). In free running conditions, Hvelf3 mutants had no clear rhythm.
4.4 – Discussion
Functional conservation of Arabidopsis clock homologues has been demonstrated
in many plants (Boxall et al., 2005; Murakami et al., 2007; McClung, 2013), from simple
monocotyledonous plants such as Lemna (Miwa et al., 2006; Serikawa et al., 2008), to more
complex models, like perennial trees (Ibáñez et al., 2010; Kozarewa et al., 2010) and crops,
for instance soybean (Quecini et al., 2007). Here, the putative barley clock genes identified
in silico have demonstrated some shared behaviour with the Arabidopsis homologues, sug-
gesting certain conservation of clock mechanisms. Conservation of phenotype and expres-
sion patterns of barley clock homologues, further discussed below, supports the suggestion
that the barley clock genes identified in silico function in the circadian clock.
4.4.1 – Growth conditions and clock experiments
A 16 h light and 8 h dark photoperiod was chosen for the LD analyses. However,
to define this photoperiod as an appropriate condition of a LD, a few facts were taken into
consideration. The major phenotypic difference among the three barley lines analysed in
clock experiments was flowering time. Regarding WT in particular, daylight length be-
tween 16 and 20 hours per 24 hour period causes small differences to flowering time, i.e.

146 Chapter 4
WT plants reach their maximum response to flowering from 16 hours of day-light (Faure et
al., 2012). Also, many barley cultivars have their maximum yield when grown with
16-hour day lengths, when compared to 20 and 24 hours (Borthwick et al., 1941). There-
fore, 16 hours of light and 8 hours of dark was chosen for LD experiments. An opposite
photoperiod was used for SD conditions, 16 hours of dark and 8 hours of light, which effi-
ciently delays flowering in WT plants when compared to other photoperiods (Figure 4.5,
Figure 4.6, and Faure et al., 2012).
In clock experiments, plants were analysed at the same stage of development, GS11
of the Zadoks code (Figure 4.2B) (Zadoks et al., 1974; Lancashire et al., 1991). This stage
was chosen for a few reasons. First, it avoided the juvenile phase of barley seedlings, dur-
ing which plants do not respond to photoperiods (Roberts et al., 1988; Ellis et al., 1989).
Second, after the juvenile phase, clock mutants and WT desynchronise their stages of de-
velopment. This is caused by early-flowering plants having a significantly higher develop-
ment rate than late-flowering plants. Comparing plants in different developmental stages
was avoided because it could produce contrasting results. Also, early-flowering plants be-
come insensitive to photoperiod once they reach anthesis (GS60), and their analyses
should also be avoided (Boyd et al., 2003). Therefore, the GS11 stage was preferable for the
clock experiments carried out here. Also related to the harvesting procedure, samples at
GS11 were quickly harvested at each time point. Quick sampling is important because in-
tervals as small as thirty min can result in differential expression analysis between samples
(Hsu and Harmer, 2012).
4.4.2 – Morphological effects of mutations on barley genes PPDH1 and ELF3
Allelic variations in the barley clock gene PPDH1 affect flowering time. The Bow-
man NIL (eam1.d) carrying the dominant PPDH1 allele activates flowering in LD. Con-

147 Chapter 4
versely, plants carrying the recessive ppdh1 allele (naturally occurring in the Bowman culti-
var) have lower photoperiod responsiveness and take longer to flower under LD. Interest-
ingly, no significant morphological or developmental differences were observed for PPDH1
allelic variants when plants were grown under SD conditions. These results are consistent
with previous findings (Turner et al., 2005; Faure et al., 2012).
The nucleotide difference between HvPPDH1 and Hvppdh1 alleles that explains the
reduced photoperiod responsiveness of Bowman (ppdh1) is not known, but it might lie in
the CCT domain (Turner et al., 2005) or in SNP48 (Jones et al., 2008). Other species also
have mutations within homologous PPDH1 genes. In wheat, a 2 kb deletion in the promot-
er region of TaPPDH1a leads to photoperiod insensitivity (Beales et al., 2007). Plants carry-
ing the Tappdh1a allele flower early in SD and LD. In sorghum, allelic variants of the
SbPRR37 gene affect flowering control. In this SD flowering plant, loss-of-function Sbprr37
alleles reduce photoperiod sensitivity and plants flower earlier in LD. The early-flowering
phenotype of mutations in the prr37 (ppdh1) genes of wheat and sorghum contrast with the
late flowering phenotype of Hvppdh1 in barley, probably because they have different muta-
tions or because their clock functions are to some degree different. In Arabidopsis, the
knock-out Atprr7 mutant, generated by a T-DNA insertion, was a late flowering plant in
LD conditions (Yamamoto et al., 2003; Nakamichi et al., 2005), similar to barley ppdh1.
This suggests a functional conservation between HvPPDH1 and its PRR7 homologue in
Arabidopsis, as suggested by in silico analysis (Figure 3.6 and Turner et al., 2005).
Regarding the ELF3 gene in barley, Bowman (ppdh1) plants carrying the loss-of-
function Hvelf3 allele (eam8.w) became early flowering in both LD and SD conditions,
when compared to Bowman (ppdh1). This NIL mutant has previously been characterised
for LD, also showing an early-flowering phenotype (Zakhrabekova et al., 2012). Moreover,
different loss-of-function alleles of Hvelf3 also generate early flowering in LD (16 h or 18 h

148 Chapter 4
light) and SD (10 h light), regardless of their PPDH1 allele (Faure et al., 2012;
Zakhrabekova et al., 2012). In Arabidopsis, elf3 knock-out mutants are also early-flowering
plants in SD when compared to WT plants (Zagotta et al., 1996; Yu et al., 2008). The con-
servation of phenotypes of barley and Arabidopsis elf3 plants suggests a functional conser-
vation of ELF3 in both species to repress flowering, as suggested by in silico analysis. How-
ever, the two paralogous rice ELF3 genes are involved in flowering activation: OsEF7 and,
to a lesser degree, OsEF3. In this SD flowering plant, gene silencing and a T-DNA inser-
tion targeting the OsEF7 (OsELF3-1) gene delay flowering in LD and SD when compared
to wild-type plants (Zhao et al., 2012).
In addition to flowering time effects, allelic variations of PPDH1 and ELF3 were
related to changes in size and/or numbers of many plant organs, including the number of
grains. In other words, early flowering of WT (PPDH1) and Hvelf3 plants was strongly cor-
related with small leaves and low yield. Plant yield is dependent upon biomass. Reduction
in plant biomass can be caused by a decrease in photosynthesis and/or increased energy
allocation to flowering at the expense of new vegetative structures. Regarding the former,
no analysis of photosynthetic rate has been performed, except for studies of HvCABa ex-
pression. When compared to WT plants grown in LD, late-flowering Bowman (ppdh1)
plants seemed to have higher mRNA levels of this chlorophyll-related gene, which could
explain the bigger leaves of Bowman (ppdh1). However, this difference in expression of
HvCABa was not statistically significant. Nevertheless, there is increasing evidence for cir-
cadian clock control over photosynthesis (Dodd et al., 2005; Noordally et al., 2013), and
further work will clarify any direct or indirect effects from ppdh1 and elf3 mutations on pho-
tosynthesis and, consequently, biomass.
An alternative explanation for the reduced size of leaves in early flowering plants,
mentioned previously, is the limitation of resources to carry out both flowering and vegeta-

149 Chapter 4
tive growth. Most grasses lose meristems when flowering occurs, resulting in decreased
biomass accumulation and, ultimately, plant death after reproduction (Lord, 1998). There-
fore, it is very likely that early flowering itself is involved in the reduced sizes and numbers
of different plant organs in barley carrying the HvPPDH1 and Hvelf3 alleles. Namely, small
leaves and small yield might be a result of short vegetative growth period caused by the
early activation of flowering by PPDH1 (in LD) and elf3 (in LD and SD). This hypothesis
has also been suggested in other plants and for other genes. Over-expression of the Os-
MADS45 gene in rice reduces heading date, which causes a reduction in plant height, bio-
mass and the number of spikelets per panicle (Wang et al., 2013). Another study in rice re-
vealed that enhanced expression of the flowering time regulator GHD7 under LD condi-
tions delays heading and increases both plant height and panicle size (Xue et al., 2008).
4.4.3 – Expression of barley clock genes
Expression profiles of 16 putative barley clock genes were analysed in the three bar-
ley lines using the HR RT-PCR approach and a putative framework of the barley clock in
WT plants is summarised in Figure 4.12. It is noteworthy that the HR RT-PCR approach
has been validated previously for mRNA quantitation, being in good agreement with data
from qPCR (James et al., 2012a). All barley clock genes, except HvZTLa, were rhythmic
under light/dark conditions, and most were rhythmic under free-running conditions, simi-
lar to those in Arabidopsis. This indicated that the mechanisms controlling clock gene ex-
pression are, at this level, conserved between these species. In the Hvppdh1 mutant (Bow-
man), most clock genes were expressed rhythmically, and some have a different expression
peak (phase) and/or level, when compared to WT. Regarding the Hvelf3 mutant (Bowman
NIL eam8.w), circadian rhythms of most clock genes were significantly altered and were
arrhythmic in free-running conditions.

150 Chapter 4
Figure 4.12: Proposed schematic diagram of the barley circadian clock system superim-
posed on the model from Arabidopsis. Feedback loops of the core clock genes are repre-
sented in the centre. Full lines represent transcriptional feedback loops, whereas dashed
lines represent post-translational regulations. Green lines are for activation, while red lines
are for repression. For simplicity, the CABa component was not included in the above reg-
ulatory network. Expression peaks of clock genes are represented at different times of the
day. Several physiological processes written on the periphery of the clock are possibly
regulated by clock genes (in brackets), allowing them to occur at the right time of the day.
Before discussing the expression data obtained here, a few facts must be taken into
consideration. To begin with, expression of genes without a clear rhythm must be treated
with caution. It is now known that after 48 hours in LL, leaves develop diversified waves

151 Chapter 4
of clock gene expression, observed only at the cellular level (Wenden et al., 2012). By using
the whole leaf, any alteration in expression in single cells would be averaged out and con-
sequently, some examples of arrhythmia could be ‘false negatives’, rather than complete
loss of rhythm. Additionally, it is not possible to strictly compare expression results with
those published previously. First, comparative analysis of barley Bowman (ppdh1) and
Hvelf3 (also carrying the ppdh1 allele) mutants with other species must be treated carefully
because the causal mutation of Hvppdh1 is not accurately known (see Sections 4.1.3 and
4.4.2), which makes it difficult to perform a confident comparative analysis. Additionally,
the experimental protocols for plant growth and sampling published previously were most-
ly different from the ones used here, for instance, the use of LD versus SD conditions, veg-
etative versus flowering growth stages, leaves versus whole plant samples. Nevertheless,
general comparisons are made and discussed cautiously.
Mutations in barley clock components affect the circadian system and flowering
time, which contributed to crop domestication and provided a template for elucidating the
barley photoperiod pathway. However, it is certainly a very difficult task to uncover the
overall operational mechanisms of photoperiodic flowering in barley from the experi-
mental results obtained here. The molecular clock (in the photoperiod pathway) operates
through complex autoregulatory feedback loops at different levels: transcriptional, post-
translational, spatial, temporal and quantitative, among others. Therefore, it is very ambi-
tious to interpret the underlying biochemical function of a barley clock component when
removing it from this complex integrated network. For example, the early flowering Hvelf3
loss-of-function mutant has higher levels of the flowering activator HvGI during the night
(Figure 4.8), even though its transcriptional night-repressor, HvTOC1 is also highly ex-
pressed at night. Such incongruences exist because the direct regulation of GI by TOC1
was analysed separately from the integrated clock picture that involves additional regula-

152 Chapter 4
tors of GI. To facilitate the task of a comprehensive analysis, differential equations have
been generated and applied in a number of organisms, including Arabidopsis (Locke et al.,
2006). These models have proven useful in uncovering the general mechanism of circadian
clocks, as well as providing a robust approach with which to interpret experimental results
(Akman et al., 2012; Pokhilko et al., 2012). As yet, a computational model of the barley cir-
cadian clock is not available to analyse the expression results obtained here and relate
these with the flowering phenotype. Nevertheless, further discussion of each clock gene
and their orthologues from other species are found below, while flowering-related clock
genes and their interactions and relationship with the flowering phenotype are discussed in
Section 4.4.4.
4.4.3.1 – LHY
The morning-exclusive HvLHY is rhythmic in light/dark and continuous light con-
ditions. Similar expression for LHY genes has been observed in Arabidopsis (Alabadí et al.,
2001), rice (Murakami et al., 2007), maize (Hayes et al., 2010), sorghum (Murphy et al.,
2011), and barley (Campoli et al., 2012b; Faure et al., 2012) confirming that there is func-
tional conservation between HvLHY and its orthologues in other species, as suggested by in
silico analysis. The data similarity with previously described barley LHY (Campoli et al.,
2012b; Faure et al., 2012) also confirms that the experimental procedure carried out was
appropriate to study clock genes.
In the barley clock mutants carrying the alleles ppdh1 (Bowman) and elf3/ppdh1
(double mutant named Hvelf3), there is an influence on LHY expression profiles. When
compared to WT plants, HvLHY expression is significantly higher in Bowman (ppdh1)
plants during three time points of the day. This effect was rejected or overlooked in the
work of Campoli et al. (2012b), probably because they analysed only one biological repli-

153 Chapter 4
cate, as opposed to the four replicates used here. In Arabidopsis, prr7 mutants have unaf-
fected expression of AtLHY, but AtLHY levels are considerably higher in prr7/prr9 and
prr7/prr5 double mutants, as well as prr7/prr5/prr9 triple mutants (Farré et al., 2005;
Nakamichi et al., 2005). As mentioned in the general introduction (Section 1.7), PRR7 is
the transcriptional repressor of CCA1 and LHY. Therefore, PRR7/PPDH1 loss-of-function
(as in the case of Atprr7) or ‘reduced-function’ (as in the case of barley Hvppdh1) mutations
can affect the rhythmic ‘shape’ of LHY/CCA1 expression (Nakamichi et al., 2010). This
suggests that AtPRR7 and HvPPDH1 have a conserved function. In constant light, LHY has
lower amplitude and maintains a rhythmic expression in Bowman (ppdh1) plants, confirm-
ing that the barley clock in this line is functional, consistent with other reports (Campoli et
al., 2012b; Faure et al., 2012). In Arabidopsis, prr7 mutants exhibit modest CCA1 and LHY
period lengthening after a few days in free running conditions (from former photocycles
and thermocycles), having an important function in clock entrainment to light and temper-
ature (Salomé and McClung, 2005). Such observation was not detected in our work due to
only examining three days of free running conditions.
Regarding the barley Hvelf3 mutant, LHY expression is lower than WT plants dur-
ing the day but higher during early night, which is consistent with previous work in barley
(Faure et al., 2012). In Arabidopsis and rice, elf3 knock-out plants also express lower levels
of LHY/CCA1 in light/dark conditions (Dixon et al., 2011; Yang et al., 2013). In constant
light, elf3 plants become arrhythmic for LHY/CCA1 expression in barley, rice (Zhao et al.,
2012; Yang et al., 2013) and Arabidopsis (Wenden et al., 2011a; Herrero et al., 2012). Faure
et al. (2012) suggested that LHY is still rhythmic in Hvelf3 mutants growing in constant light
conditions, but they have analysed only two days of continuous light, whereas HvLHY ar-
rhythmicity becomes obvious on the third day (Figure 4.7).

154 Chapter 4
4.4.3.2 – CAB
HvCABa is rhythmically expressed during a large part of the day, similar to the Ar-
abidopsis homologue AtCAB2 (Hicks et al., 1996). In Hvelf3 barley plants, HvCABa is also
expressed during the night, which was not observed in WT or Bowman (ppdh1) plants.
This aberrant expression of HvCABa has been previously noticed in a microarray analysis
using early night samples of another Hvelf3 mutant (Igri NIL eam8_ea8.k) and WT (Igri cul-
tivar) (Faure et al., 2012). In constant light conditions, HvCABa maintains a rhythmic 22 h
period in WT plants, whereas Bowman and Hvelf3 become arrhythmic. The Arabidopsis
homologue AtCAB2 was rhythmic in constant light conditions, except in elf3 mutants
(Hicks et al., 1996), which is similar to the results obtained in this study. Additional HvCAB
genes have been analysed in barley (Campoli et al., 2012b; Faure et al., 2012), but they are
not part of the CAB1/2/3 subfamily, to which AtCAB2 belongs.
4.4.3.3 – FKF1
Barley FKF1 is an evening-expressed gene, similar to the expression of its homo-
logues in maize (Hayes et al., 2010), rice (Murakami et al., 2007) and Arabidopsis
(Imaizumi et al., 2003). Interestingly, daily activation of expression of HvFKF1 occurs ear-
lier in Bowman (ppdh1) and Hvelf3 plants when compared to WT, which is similar to FKF1
expression in Arabidopsis elf3 mutants (Kim et al., 2005). This earlier FKF1 activation also
occurs during Bowman (ppdh1) and Hvelf3 entrainment in constant light conditions. In WT
barley, Bowman (ppdh1) and Hvelf3, FKF1 expression is still rhythmic in constant light,
similar to WT Arabidopsis (Nelson et al., 2000) and WT rice (Murakami et al., 2007).

155 Chapter 4
4.4.3.4 – ELF4-like
In the three barley lines analysed, HvELF4-likeA probably has a daily bimodal cy-
cling pattern (dawn and before dusk), but this rhythm does not continue in continuous
light conditions. The AtELF4 gene from the ELF4 family, to which the ELF4-like2/3/4 sub-
family belongs, peaks before dusk (LD) or during early night (SD) (Doyle et al., 2002). Ex-
pression of homologues from the ELF4-like2/3/4 subfamily from other species has not, to
my knowledge, been described so far. However, HvELF4-likeA can fully complement the
elf4 loss-of-function phenotype in Arabidopsis, suggesting conserved function (Kolmos et
al., 2009).
4.4.3.5 – LUX
HvLUX is rhythmically expressed near the end of the light period in LD. However,
in SD it is expressed during the dark period (Campoli et al., 2013). In Arabidopsis plants
grown in 12 h light and 12 h dark cycles, AtLUX is expressed around dusk (Helfer et al.,
2011). In constant light, WT and Bowman (ppdh1) plants maintained rhythmicity, as ob-
served in WT Arabidopsis (Helfer et al., 2011). In the work of Campoli et al. (2013), Bow-
man (ppdh1) plants transferred from SD to LL have a significant reduction in the expres-
sion of HvLUX, not observed here for LD-LL transitions or in Arabidopsis plants (Helfer et
al., 2011). Higher expression levels of HvLUX in WT plants on the first subjective night
and morning when compared to Bowman (ppdh1) suggests different mechanisms for clock
entrainment in these two plants. In Hvelf3 plants, HvLUX did not have a clear expression
peak and an increased expression was observed in the morning when compared to WT
plants.

156 Chapter 4
4.4.3.6 – ZTL
ZTL protein levels oscillate over a day, but their transcript levels are not oscillatory
in Arabidopsis (Schultz et al., 2001; Kim et al., 2007) or rice (Murakami et al., 2007). Simi-
larly, barley HvZTLa mRNAs were constitutively expressed throughout day and night. In
rice, transcript levels of OsZTL1 under LDs were largely increased in ef7 mutants (Yang et
al., 2013), which was not seen for Hvelf3 plants here.
4.4.3.7 – TOC1
HvTOC1 is rhythmically expressed in the evening of light/dark cycles and subjec-
tive evenings for up to two days in constant light for the three barley lines analysed. This
expression behaviour is similar to the expression of its homologues in maize (Hayes et al.,
2010), sorghum (Murphy et al., 2011), rice (Murakami et al., 2007; Zhao et al., 2012) and
barley (Campoli et al., 2012b; Faure et al., 2012). In constant light, HvTOC1 maintains
rhythmic expression in WT and Bowman plants. In rice, WT and Osef7 plants are also
rhythmic for TOC1 (Zhao et al., 2012). In Arabidopsis WT and prr7 plants, TOC1 evening
expression is maintained (Farré et al., 2005). These TOC1 results in rice and Arabidopsis
are similar to those observed in barley, confirming their orthology. In Hvelf3 plants,
HvTOC1 has significantly higher expression levels during morning and subjective morning,
also observed in barley (Faure et al., 2012), Arabidopsis (Dixon et al., 2011) and rice (Yang
et al., 2013).
4.4.3.8 – PPDH1 and PRR73
In barley, HvPPDH1(PRR37)/Hvppdh1 and HvPRR73, are co-expressed during the
greater part of the day and they reach very high levels by mid-day, similar to previous find-

157 Chapter 4
ings in barley (Campoli et al., 2012b; Faure et al., 2012; Campoli et al., 2013), rice
(Murakami et al., 2003; Zhao et al., 2012), and maize (Hayes et al., 2010). In Arabidopsis,
the orthologous gene PRR7 is expressed around mid-day, before the evening-expressed pa-
ralogue PRR3 (Matsushika et al., 2000). This differential expression between both pa-
ralogues was not observed in monocots, but similar expression behaviours of PRR7 and
PRR37/73 around mid-day suggests some functional conservation and possibly orthology
of these genes. Bowman (ppdh1) and Hvelf3 plants had significantly higher expression levels
of Hvppdh1, despite the intrinsic mutation, when compared to the WT HvPPDH1 allele,
which continued in constant light. This is in agreement with an earlier report (Faure et al.;
2012).
4.4.3.9 – PRR59 and PRR95
In barley, HvPRR59 and HvPRR95 are co-expressed in the afternoon, after expres-
sion peaks of HvPPDH1 and HvPRR73. These expression patterns are similar to previous
findings in barley (Campoli et al., 2012b; Campoli et al., 2013) and rice (Murakami et al.,
2003). In Arabidopsis, the homologous gene PRR9 is expressed in the morning, while
PRR5 is expressed in the afternoon (Matsushika et al., 2000). This differential expression
between both paralogues was not observed in monocots, but similar expression behaviours
of PRR5 and PRR95/59 in the afternoon suggests functional conservation and, possibly,
orthology of these genes.
Arabidopsis elf3 mutants display high levels of PRR9 and PRR7 in light/dark and
constant light conditions (Kolmos et al., 2011). Bowman (ppdh1) and Hvelf3 plants have
significantly higher levels of PRR37/73/95/59 transcripts when compared to WT. A simi-
lar expression increase was observed for OsPRR59 in rice ef7 mutants under LDs (Yang et

158 Chapter 4
al., 2013). These results suggest conserved function of homologous ELF3 genes in repress-
ing PRR7/PRR9 in Arabidopsis and PRR genes in monocots.
4.4.4 – Photoperiodic flowering in barley
4.4.4.1 – ELF3
WT barley probably has a rhythmic expression of HvELF3 during the night of LD,
also observed in SD (Faure et al., 2012; Zakhrabekova et al., 2012). In Arabidopsis, ELF3 is
expressed at night (12 h light and 12 h dark) (Dixon et al., 2011), similar to rice OsEF3
(Zhao et al., 2012). Additionally, rice paralogue OsEF7 is expressed at dawn in both LD
and SD conditions (Zhao et al., 2012). These night-related expression patterns of ELF3
homologues suggests that there is functional conservation of this gene among different spe-
cies.
In Bowman (ppdh1) plants, HvELF3 is expressed at significantly higher levels in the
morning, when compared to WT. Since ELF3 is a flowering repressor, higher levels of this
gene in the morning of Bowman (ppdh1) plants might explain their late-flowering pheno-
type. Hvelf3 mutants have lower levels of the elf3 transcript when compared to WT. A simi-
lar reduction was also observed in the same Hvelf3 NIL growing in SD conditions (Faure et
al., 2012). This reduction probably occurs due to the elf3 mutation that generates PTC-
containing transcripts, which are likely degraded by NMD. This loss-of-function in the
ELF3 gene is the cause of the early flowering phenotype (discussed previously in Section
4.4.2) (Faure et al., 2012; Zakhrabekova et al., 2012).
Unexpectedly, no clear rhythmicity was observed for the HvELF3 gene in constant
light conditions for the three barley lines analysed. In previous reports, HvELF3 main-
tained rhythm in Bowman (ppdh1) plants transferred from SD to constant light conditions

159 Chapter 4
(Faure et al., 2012) as well as in Arabidopsis (Hicks et al., 2001). These incongruent results
are probably due to different experimental procedures adopted here and by other labs, and
may be clarified when additional technical replicates are analysed here.
4.4.4.2 – GI
HvGI is rhythmic in WT and Bowman (ppdh1) under light/dark and continuous
light conditions. This expression profile is similar to the expression profiles of its homo-
logues in maize (Hayes et al., 2010), sorghum (Murphy et al., 2011), rice (Hayama et al.,
2002a), Arabidopsis (Park et al., 1999) and barley (Dunford et al., 2005; Turner et al., 2005;
Campoli et al., 2012b; Faure et al., 2012), confirming that there is functional conservation
between HvGI and its orthologues in other species.
Plants with both PPDH1 and ppdh1 alleles have identical GI mRNA levels, but
nothing is known about their GI protein levels. ELF3 negatively regulates GI protein levels
in Arabidopsis (Yu et al., 2008). Bowman (ppdh1) has higher levels of ELF3 mRNA during
the morning, mentioned above, which if translated might reduce HvGI protein levels. A
putative reduction of a flowering activator gene like GI might contribute to the Bowman
(ppdh1) late-flowering phenotype.
HvGI in Hvelf3 plants is expressed throughout the day, including early in the morn-
ing and late night. This GI expression behaviour has been described for elf3 mutants in bar-
ley (Faure et al., 2012), Arabidopsis (Kim et al., 2005; Dixon et al., 2011), and rice (Haya-
ma et al., 2002). In this case, higher expression levels of a flowering activator gene such as
GI might explain the early flowering phenotype of Hvelf3 mutants (Faure et al., 2012;
Zakhrabekova et al., 2012).

160 Chapter 4
4.4.4.3 – CO
HvCO1 and HvCO2 are both expressed before and after dusk in WT plants, which is
consistent with previously published data for barley (Turner et al., 2005; Campoli et al.,
2012a; Campoli et al., 2012b). Similarly, Arabidopsis CO is also expressed before and after
dusk in LD, resulting in flowering (Sawa et al., 2007). Expression of CO1 and CO2 in
Bowman (ppdh1) was delayed and reached maximum levels at dusk. Interestingly, expres-
sion of Arabidopsis CO under non-inductive SD conditions also peaks at/after dusk, which
delays flowering. Therefore, a significant reduction of CO1 and CO2 in Bowman (ppdh1)
plants during the day might help explain their late flowering phenotype. Moreover, since
AtPRR7 indirectly activates expression of CO (Nakamichi et al., 2007), it was expected that
the reduced function of the Hvppdh1 (PRR7 homologue) allele in Bowman would fail to
efficiently activate expression of the homologous HvCOs, therefore causing the late flower-
ing phenotype of Bowman (ppdh1). These results suggest the PPDH1/PRR37 gene controls
expression of CO1 and CO2, consistent with other reports in barley and sorghum (Murphy
et al., 2011; Turner et al., 2005; Faure et al., 2012). This hypothesis is further supported by
the putative similar expression patterns of HvPPDH1, HvCO1 and HvCO2 in free-running
conditions that supports their linked regulation, which is not seen in plants carrying the
Hvppdh1 allele. However, Campoli et al. (2012b) partially rejected this hypothesis because
the expression difference of HvCO1/CO2 between plants carrying ppdh1 or PPDH1 differed
only in LL, not LD. This is probably due to the difference in the experimental protocols
adopted here and by Campoli et al. (2012b). For instance, one-week old plants in the
Bowman (ppdh1) background were analysed here in four replicates per time point using the
HR RT-PCR approach, whereas in the work of Campoli et al. two-week old plants in the
Scarlett background, containing different PPDH1 alleles, were analysed in one replicate per
time point using the qPCR approach.

161 Chapter 4
In Arabidopsis elf3 mutants, CO expression had a moderate rise in LD conditions
(Kim et al., 2005). Contrastingly, Hvelf3 mutants carrying the ppdh1 allele had low and de-
layed expression of HvCO1 and HvCO2, respectively. This might be due to the ppdh1 allele,
which fails to activate expression of HvCOs efficiently. These results suggest that expres-
sion of HvCOs in the light is not required for the early-flowering phenotype of Hvelf3 mu-
tants, also suggested by Faure et al. (2012). It is possible that Hvelf3 early flowering occurs
via an alternative pathway to the classical GI-CO pathway. ELF3 possibly regulates FT via
stimulation of SHORT VEGETATIVE PHASE (SVP) protein accumulation, a flowering
repressor (Yoshida et al., 2009). In this case, loss-of-function Hvelf3 mutants might have
decreased levels of SVP protein, which permits FT expression.
Regarding HvCO2 in particular, antisense and unspliced transcripts generated from
the HvCO2 locus were detected. These additional transcripts do not code for the functional
CO2 protein. Previously published data of HvCO2 expression did not account for these
transcripts, and they show unclear and probably inaccurate HvCO2 rhythms in light/dark
cycles (Turner et al., 2005; Campoli et al., 2012a; Campoli et al., 2012b). Here, only tran-
scriptional data from the fully spliced HvCO2 transcript was used, which revealed a clear
and robust HvCO2 rhythm. Interestingly, AtCOL1 is within a potential natural antisense
gene that is also present in spliced and unspliced versions (At5g15845). The same was not
observed for the paralogous genes AtCO and AtCOL2. Therefore, this similarity of HvCO2
and AtCOL1 suggests conserved regulatory mechanisms of transcription. However, CO pa-
ralogues COL1 and COL2 do not interfere with the photoperiodic flowering pathway, sug-
gesting that the function of CO was not conserved by its paralogues during evolution
(Ledger et al., 2001).
Regarding continuous light conditions, no clear 24-hour rhythmic expression was
observed in free-running conditions for HvCO1 and HvCO2 in the three barley lines ana-

162 Chapter 4
lysed. However, it might be possible that WT plants have a shorter period (16 h) for these
genes. In the work of Campoli et al. (2012b), the HvCO genes have a 24 h rhythm in WT,
but not Bowman (ppdh1), plants under free-running conditions. Conversely, in the work of
Faure et al., (2012), HvCO1 was rhythmic in Bowman (ppdh1) plants transferred from SD to
LL conditions. These conflicting results illustrate once again the difficulties in detecting
rhythmic expression of clock-related genes in barley plants, as well as the diversity of re-
sults coming from different experimental procedures that compromise appropriate compar-
isons and data interpretation.
4.4.4.4 – FT
In LD, HvFT1 expression peaks at dusk, also observed in different barley cultivars
(Turner et al., 2005; Campoli et al. 2012a). In Arabidopsis, FT also has an expression peak
in LD at around dusk (Turck et al., 2008), suggesting that there is a conservation in the
regulation of barley HvFT1 and its Arabidopsis homologue. In Bowman (ppdh1) plants,
HvFT1 expression is barely detectable, similar to other barley cultivars carrying ppdh1 al-
leles, which is in accordance with the late flowering phenotype (Turner et al., 2005; Cam-
poli et al. 2012a; Faure et al., 2012).
In Arabidopsis elf3 mutants, FT expression was greatly elevated in LD conditions
(Kim et al., 2005). Surprisingly, the first leaf of one-week old Hvelf3 mutants have very re-
duced FT1 expression when compared to WT. It was previously shown that the second
youngest leaves of two-week old Hvelf3 mutants have increased expression of HvFT1 in
SD, which is related to their early-flowering phenotype (Faure et al., 2012). Therefore, it is
possible that the different experimental procedures of both studies helps to explain these
contrasting results.

163 Chapter 4
In summary, genetic analysis of circadian behaviour using the HR RT-PCR ap-
proach suggests that the circadian expression profiles of the putative barley clock-related
genes are similar with those of their Arabidopsis counterparts. Effects of ppdh1 and
elf3/ppdh1 mutations resemble prr7 and elf3, respectively, loss-of-function mutations in Ar-
abidopsis. However, some genes are not present in barley (e.g. CCA1) and there is variation
in the expression profiles of some clock genes (e.g. HvLHY is expressed later in the morn-
ing, while Arabidopsis LHY is expressed at dawn). Also, there is some variation in the ef-
fects of mutated Hvppdh1 and Hvelf3/Hvppdh1 when compared to Arabidopsis prr7 and elf3,
respectively. Such variations might be due to the fact that monocots and dicots have
evolved their clocks independently (see Chapter 6).

164 Chapter 5
Chapter 5. Alternative splicing regulation of barley
clock-related genes
5.1 – Introduction
The circadian clock controls many processes and regulation of more than one third
of genes in Arabidopsis (Covington et al., 2008). Regulation of the circadian clock is com-
plex, involving interlocked transcription feedback loops, control of protein phosphoryla-
tion and degradation, and chromatin remodelling (see Section 1.7). Recently, alternative
splicing (AS) was shown to be another mechanism by which clock functions could be con-
trolled. Extensive AS was shown to regulate Arabidopsis clock gene expression through
dynamic changes in alternative transcript levels, some of which altered the level of produc-
tive mRNA through AS/NMD of alternatively spliced transcripts (see Section 1.8). Inter-
estingly, AS regulation of the Arabidopsis, Drosophila and N. crassa clocks has been shown
to be temperature dependent. In fact, temperature greatly affects the overall biology of the
plant and this is an area of great interest (McClung and Davis, 2010).
5.1.1 – Temperature effects on plants
Other than the various aspects of light, temperature is probably the other most im-
portant external cue that affects the overall biology of the plant because plants need a con-
ducive temperature to survive and propagate (Srikanth and Schmid, 2011). Plants have
evolved mechanisms to endure temperatures extremes from -30 °C in arctic winter to al-
most 50 °C in African deserts (McClung and Davis, 2010). Furthermore, individual plants
may be subjected to ambient temperatures that vary in the short term by more than 30 °C

165 Chapter 5
as a result of the vagaries of radiation input caused by clouds, wind speed and angle of in-
cidence of sunlight (Helliker and Richter, 2008; McClung and Davis, 2010). Despite these
daily, latitudinal and seasonal variations of temperature, most plant cellular and physiolog-
ical processes (for instance, hormone signalling, flowering time, circadian clock and photo-
synthesis) have an optimal functional temperature and plants will work to maintain leaf
temperatures near that optimum value. Firstly, plants attempt to modulate their endoge-
nous temperature from ambient temperatures through morphological and physiological
modifications, for example controlling water loss and losing heat through convection and
reflectance (Helliker and Richter, 2008). Secondly, cellular processes have a functional
plasticity so they can acclimate their temperature optimum to the ambient temperature
(temperature acclimation) (Yamori et al., 2013).
The thermal perception system(s) responsible for transducing temperature infor-
mation to the plant cellular processes is one of the great unknowns in plant science. Two
events have been hypothesised as the primary temperature sensing events: alteration of
membrane fluidity and elevation of cytosolic free calcium levels ([Ca2+]cyt) (Penfield, 2008;
McClung and Davis, 2010). These are probably associated and are the earliest events that
occur upon temperature variation. Ca2+ is a secondary messenger used in the transduction
of numerous signal and is essential for initial response and subsequent temperature accli-
mation in plants (Hepler, 2005; McClung and Davis, 2010). Some responses to tempera-
ture may be initiated by Ca2+ signalling events, others initiated by the direct physical effects
of temperature on protein conformation and enzyme activity. Additionally, sensing and
signal transduction of non-stressful ambient temperature changes are partially different to
sensing extreme temperature changes (temperature stress) (McClung and Davis, 2010).
Several plant thermometers are hypothesised which might form the plant temperature sig-
nalling network (Penfield, 2008; McClung and Davis, 2010). Upon temperature percep-
tion, plants respond to temperature changes through many genetic, physiological and de-

166 Chapter 5
velopmental processes such as major chromatin reconfiguration, massive transcriptional
changes, increases in levels of cryoprotectants and heat-shock proteins, alterations in
membrane composition, changes in the hormone levels and flowering control (Penfield,
2008; McClung and Davis, 2010).
The predicted consequences of global climate change include increased fluctuation
of temperature with greater extremes and a trend to warmer mean temperatures. It is esti-
mated that around one-third of all European plant species may become extinct by 2080 in
response to predicted climate change (Thuiller et al., 2005). In addition to profound conse-
quences for wild species, agricultural plant communities and their yield are likely to be af-
fected by global climate change (McClung and Davis, 2010). To understand and possibly
cope with the consequences of such change, much more about the basic biology of the
plant and how plants sense and respond to temperature must be learned.
5.1.2 – Clock temperature entrainment and compensation
Two major influences of temperature on the circadian clock are entrainment and
compensation. In the former, temperature differences as small as 4 °C between subjective
night and day can entrain the Arabidopsis clock (McClung et al., 2002). Clock entrainment
to environmental temperature changes occurs through altered gene expression (Gould et
al., 2006; Bieniawska et al., 2008; James et al., 2012a) and at least three clock components
are essential for this process: PRR7, PRR9 and ELF3 (Salomé and McClung, 2005; Thines
and Harmon, 2010). Arabidopsis elf3 mutants are unable to entrain to thermocycles in
darkness (Thines and Harmon, 2010), whereas prr7/prr9 double mutants are unable to en-
train to thermocycles of 22°C/12°C, but are able to respond to cycles of 28°C/22°C
(Wigge, 2013). Upon temperature entrainment, the endogenous clock rhythm is synchro-
nised with external cues and a number of circadian-regulated output processes are reorgan-

167 Chapter 5
ised at the molecular level, generating the appropriate biological responses according to
temperature condition. Adding to the complexity of temperature entrainment and output
control, the clock can gate the low-temperature (LT) expression of the cold tolerance C-
REPEAT/DRE BINDING FACTOR genes during the evening and night and modulates
Ca2+ signals (Fowler et al., 2005; Dodd et al., 2006; Keily et al., 2013).
Another critical behaviour of the clock in regards to temperature is the process of
temperature compensation. In this process, the plant circadian clock is able to robustly per-
form an approximately daily cycle across a wide range of temperature regimes (for in-
stance, between 4 °C and 28 °C in Arabidopsis), beyond which the clock stalls and tran-
script levels of many clock genes become arrhythmic (Ramos et al., 2005; Gould et al.,
2006; Bieniawska et al., 2008; Ibañez et al., 2008; Penfield, 2008). The Arabidopsis genes
CCA1, LHY, PRR7, PRR9 and GI have an important role in this process (Gould et al., 2006;
Salomé et al., 2010). Analyses of transcript levels of core clock components within a physi-
cally relevant temperature range showed that LHY expression increases with temperature,
and this appears to be compensated for by increases in TOC1 and GI (Wigge, 2013). In an
Arabidopsis prr7/prr9 double mutant background, excessive LHY and CCA1 gene expres-
sion causes a significant temperature over-compensation phenotype, with circadian period
dramatically lengthening at warmer temperatures (Salomé et al., 2010). Interestingly, re-
duction in LHY and CCA1 activity is sufficient to restore the wild-type clock behaviour in
this background (Salomé et al., 2010). Furthermore, recent evidence suggests that tempera-
ture entrainment and compensation involve temperature-dependent alternative splicing of
some clock genes. For example, upon cold treatment, the expression levels of functional
REVEILLE8 (RVE8) transcripts, encoding a MYB-like transcription factor, are decreased
and this is probably due to an increase in non-functional AS isoforms at the expense of

168 Chapter 5
functional mRNAs (James et al., 2012b). For more information on temperature-dependent
alternative splicing of clock genes, please refer to Section 1.8.
Prediction and appropriate responses to temperature changes by the plant circadian
clock provides a fitness benefit to plants, which makes this area of interest in agriculture. In
barley, the correct molecular functioning of the barley clock in different temperatures im-
proves agronomic traits. In winter barley, for example, photoperiod sensitivity (as well as
vernalisation requirement) is an important adaptive feature that prevents flowering during
winter. Preventing flowering subsequently provides efficient LT tolerance through induc-
tion of LT genes (Fowler et al., 2001). However, future efforts are still required to under-
stand how the barley clock remains functional within a wide range of temperatures. The
close link of the circadian clock and AS in Arabidopsis raised the question as to whether
AS might be involved in the operation of the barley circadian clock or its response to al-
tered temperature conditions. Therefore, we investigated the expression levels and AS of
barley circadian clock genes in response to low temperature. Numerous AS events occur in
barley clock genes and particularly for LHY and PPDH1, many are temperature sensitive,
potentially having a major role in regulation of gene expression. Collectively, the data sug-
gests that AS is a novel mechanism involved in operation and regulation of the barley cir-
cadian clock.
5.2 – Materials and methods
5.2.1 – AS discovery in barley clock genes
5.2.1.1 – Search for AS in transcript databases
BLAST searches were performed using barley clock genomic sequences identified
previously (Chapter 3) against GenBank and barley RNA-seq (Consortium, 2012a) tran-

169 Chapter 5
script databases to identify AS isoforms. For the RNA-seq data set, AS discovery analyses
were carried out using Tablet program version 1.7.0_21 (Milne et al., 2013), which is a se-
quence visualisation tool that aligns barley genomic contigs against transcript reads pro-
duced from several barley developmental stages (Consortium, 2012a).
5.2.1.2 – RT-PCR and cloning of AS transcripts
To detect novel AS events and determine the sequences of unknown alternatively
spliced isoforms, systematic RT-PCR and cloning of amplified products was carried out.
These procedures, described below, followed the relevant manufacturers’ instructions. RT
reactions were carried out according to the protocol in Section 2.3.1 on RNA samples (ex-
tracted according to Section 2.2) from experiments described in 4.2.3, 5.2.2 and Appendix
A7.1. This was followed by PCR reactions to amplify the alternatively spliced products
(Appendix A7.2). PCR samples containing the putative AS products were purified using
the MinElute® PCR purification kit (QIAGEN, Germany). The resulting purified PCR
products were ligated into the pGEM-T easy vector (Promega, USA), and heat-shock
transformation of the ligation reactions was performed using high-efficiency JM109 com-
petent cells (Promega, USA). Transformation cultures were plated onto Luria-Bertani (LB,
Appendix A8) solid agar plates supplemented with ampicillin (50 μg/mL, Appendix A9),
IPTG (25 μg/mL) and X-Gal (25 μg/mL) and incubated overnight at 37 °C. Screening of
transformants for inserts of interest was performed by blue-white selection screening of
colonies from indicator plates (Appendix A10) and followed by colony PCR (Appendix
A7.2). Around 50 white and light blue colonies per transformation were used in PCR
screening with gene-specific primers. PCR samples were run on a 1.5% agarose (Ul-
traPure™, Invitrogen, Life Technologies, USA), 1 x TBE (Appendix A3.6) gel to detect
bands of the expected (FS) and unexpected sizes (AS isoforms). This enabled the identifi-

170 Chapter 5
cation of colonies with plasmids containing cloned AS isoforms with inserts of variant siz-
es. Selected colonies were grown further by inoculating in 5 mL liquid LB medium sup-
plemented with ampicillin and cultured overnight at 37°C with constant agitation. Over-
night cultures were used in plasmid preparations utilising the QIAprep® Spin miniprep kit
(QIAGEN, Germany). The identity of the purified plasmids and size of the insert was con-
firmed by EcoRI (Promega, UK) enzyme digestions, followed by analyses by electrophore-
sis using 1.5% agarose, 1 x TBE gels. Plasmids with unique inserts were Sanger sequenced
(service provided by the Sequencing facility at the James Hutton Institute, UK) using both
M13F and M13R primers. Where inserts were > 500 bp, one or two internal gene-specific
primers were also used to ensure sequencing over the full length of the cloned product.
Analysis of the sequence was conducted using Sequencher software version 4.9 (Gene
Codes Corporation), which allowed trimming and cleaning of the sequences before align-
ment on to genomic contigs to identify where splicing had occurred and which splice sites
had been used.
5.2.2 – Analyses of AS in regulating mRNA expression of clock genes in re-
sponse to temperature changes
To observe the responsiveness of clock gene expression and AS to changes in tem-
perature, grains from three barley lines (Section 2.1.1) were germinated in the dark at 4 °C
on sterile water-soaked filter papers and transferred to small square plastic pots (5 cm3)
filled with cereal compost (Appendix A1). Each pot contained 4 grains from the same line.
Plants were grown in a controlled-environment growth cabinet at 20 °C with LD treat-
ments for seven days. No crop protection treatment was applied. Leaf samples of one-
week old plants (GS11) were collected at 2.5 h after dawn. At dusk, 15.5 h after the first
harvesting, the temperature of the cabinet was reduced to 4 °C, and this temperature was

171 Chapter 5
maintained, along with LD condition, for four days. Additional leaf samples were harvest-
ed at 2.5 h after dawn on days 1, 2 and 4 after transfer to 4 °C (Figure 5.1). At dawn of the
12th day, the temperature was increased from 4 °C to 20 °C. Another two sampling points
took place at 2.5 h after dawn on days 1 and 2 after adjustment to 20 °C. Humidity and
temperature were monitored with a data logger (EL-USP-2 from Lascar Electronics) that
confirmed relative humidity at around 70% and efficient temperature transitions during the
experiment (Appendix B7.1). The cabinet took less than 90 min to decrease the tempera-
ture from 20 °C to 4 °C and vice-versa.
Figure 5.1: Sampling and temperature regime used in analyses of AS in regulating mRNA
expression of clock genes. Red arrows represent time points when sampling occurred (2.5
h after dawn). Black boxes are for dark, white boxes are for light.
It is noteworthy that over the total duration of the experiment, plants were kept in
the same growth cabinet to eliminate the potential effects of minor changes in light intensi-
ty and quality on gene expression. A minimum of three biological replicates were taken
per time point, each comprising of one or two leaves from at least three independent plants
from one pot. Additionally, pots were placed in a random array. Plants for each time point
were also selected in a random fashion from the array (data not shown). Leaf material was
pooled, rapidly frozen in liquid nitrogen and stored at -80 °C.
To compare AS data against FS values, the peak areas of RT-PCR products were
normalised to control gene values (Equation 1 in Chapter 2) and analysed using ANOVA.

172 Chapter 5
The associated P values calculated in the ANOVA were two-tailed, and a significance level
of 5% (α = 0.05) was used. GenStat (15th Edition version 15.1.0.9425, VSN International
LTD) was used for all statistical analyses.
5.3 – Results
5.3.1 – Identification of AS isoforms of barley clock genes
Recent reports of AS in Arabidopsis clock genes (Hazen et al., 2009; Filichkin et al.,
2010; Sanchez et al., 2010; James et al., 2012a) have motivated a systematic identification
of AS isoforms of barley core clock genes. Firstly, Arabidopsis clock homologues were
identified and confirmed in barley using an in silico approach (Chapter 3). This approach
identified both genomic and cDNA sequences of barley clock genes, which were used to
annotate and determine gene structure (intron/exon) and develop gene models for AS
studies. Secondly, barley clock homologues were confirmed as having rhythmic mRNA
expression profiles typical of clock genes, using the HR RT-PCR system and phenotyping
two barley clock mutants (Chapter 4). Finally, from this list of barley clock homologues,
the intron-containing genes HvFT1, HvFT2, HvLHY, HvCO1, HvCO2, HvTOC1, HvGI,
HvELF3, HvGRP7a, HvGRP7b, HvPRR37, HvPRR73, HvPRR59 and HvPRR95 were selected
for AS analyses in barley.
AS events in selected barley clock genes were identified using two different ap-
proaches. Firstly, publicly available ESTs, cDNA and RNA-seq data were aligned on to
barley genomic sequences and, secondly, systematic RT-PCR was carried out to detect al-
ternative transcripts. For the former, most AS information was obtained from the extensive
barley RNA-seq data, which provided independent confirmation of the existence of AS
events in barley clock genes, such as LHY Alt 3' ss I1 (Appendix B8). For systematic RT-
PCRs, plants were grown in environmentally controlled cabinets, maintaining constant

173 Chapter 5
temperatures and photoperiods (LD at 20 °C and SD at 4 °C; Appendix A7.1). Leaves of
one-week old seedlings were harvested at different time points over a 24 h period. RT-PCR
was performed on total RNA extracted from a mixture of plant material. The primers used
for AS discovery for the subset of genes chosen are shown in Table 2.1 and Appendix A5.
Alternative transcripts were cloned and sequenced (Sanger sequencing). In some cases, the
identity of a novel event was predicted (especially for IR events) based on expected product
size, intron sequence and presence of potential alternative splice sites in amplified regions.
This initial identification of AS events in barley clock genes allowed the establishment of
an RT-PCR panel for studies of barley clock and clock-associated genes.
Before learning about the different AS events in the barley clock, it is important to
bear in mind the possible effects of different AS events in gene expression. The primary
function of AS is to affect protein expression either quantitatively and/or qualitatively. In
order to achieve the latter, AS usually occurs in the CDS, maintaining the ORF to produce
alternative mRNAs that are still translatable, functional and able to reach the cytoplasm.
Another possibility is if the AS occurs at the 5’ UTR and adds an in-frame uAUG se-
quence, which modifies the N-terminus coding region. However, uORFs which are not in-
frame with the functional ORF can, depending on their length and position, affect transla-
tion, trigger NMD (for example when a uORF overlaps the main start codon;(Kalyna et
al., 2012) or produce micro-proteins. Additionally, when the AS event interrupts the func-
tional ORF and introduces a PTC (e.g. IR event), the mRNA can either: 1) become an
NMD target; 2) be unable to leave the nucleus (predicted for many IR-containing tran-
scripts;(Kalyna et al., 2012); 3) be translated into a truncated protein.
In all, 55 novel AS events were detected for the set of eleven clock genes
(Table 5.1–5.4). These AS events generated up to 69 total transcripts, including normally
spliced transcripts, but it is important to consider the transcript diversity of the alternatively
spliced clock genes in terms of how the 55 different AS events are distributed among dif-

174 Chapter 5
ferent transcripts. The AS events in each gene can be mutually exclusive, independent, or
interact such that one splicing event affects whether another occurs. For example,
HvPPDH1 has two significant mutually exclusive events, Alt 5’ ss I6 that adds 45 nt or 50
nt, both of which generated mRNAs with different outcomes: increase in proteome diversi-
ty or inclusion of a PTC, respectively. These events cannot occur in the same transcript.
Alternatively, events can be independent, particularly within different regions of the pre-
mRNA. Furthermore, AS transcript isoforms have also been identified containing combi-
nations of the individual AS events and this may occur over the whole pre-mRNA.
In WT plants grown under LD conditions and 20 °C, abundance analyses of alter-
native transcripts undergoing one or two of these AS events found 35 transcripts were very
low in abundance (< 1% of the total transcripts), 13 were between 1 and 2% of transcripts,
twelve were between 2 and 10%, and nine were between 10 and 50% (including one
PPDH1 FS isoform, Figure 5.18). Many of the AS events were IR events (29/55), of which,
20 were found in low abundance in all conditions analysed here (< 2% of total transcripts)
and probably represent partially spliced or unspliced transcripts. No alternative transcript
isoform were detected for HvFT1, HvFT2 or HvCO1. It should be noted that low abundance
AS events detected in the plant growth conditions here may be abundant under other envi-
ronmental conditions not tested in this work.

Table 5.1: Information of AS events in barley LHY detected by RT-PCR experiments. Transcript abundance information is relative to WT
plants grown under LD and 20 °C.
Gene Primer pair Primer
position Product size (bp)
AS event name Sequencing AS event Transcript abundance
LHY HvLHY-Ex3Fw 5’ UTR 278 FS NGS, Sanger FS **** HvLHY-Ex6Rv 268 Alt 3' ss E4 Sanger Alt 3' ss E4 (-10 nt) ** 294 Alt 3' ss I2 NGS, Sanger Alt3' ss I2 (+16 nt) * 358 Alt 3' ss I1 NGS, Sanger Alt 3' ss I1 (+80 nt) ** 393 I2R NGS, Sanger Intron 2 retained * 440 I1R Sanger Intron 1 retained - 555 I1R + I2R Sanger Introns 1 and 2 retained - 666 I3R Sanger Intron 3 retained - 746 Alt 3' ss I1+ I3R Predicted Alt 3' ss I1 (+80 nt) and I3 retained - 781 I2R + I3R Sanger Introns 2 and 3 retained - 943 I1R, I2R + I3R Sanger Introns 1, 2 and 3 retained, unspliced -
HvLHY-Ex6Fw MYB-coding 255 FS NGS, Sanger FS **** HvLHY-Ex8Rv domain 235 Alt 5’ ss E4 NGS Alt5’ ss E4 (-20 nt) - 325 I4R NGS Intron 4 retained * 490 I5R Predicted Intron 5 retained - 560 I4R + I5R Predicted Introns 4 and 5 retained, unspliced - HvLHY-Ex8Fw
Span long intron 6
188 FS NGS, Sanger FS **** HvLHY-Ex9Rv 938 Alt E6a NGS, Sanger Alt E6a from intron 6 (+756 nt) - 1833 I6R Unknown Intron 6 retained - HvLHY-Ex10FwB C-terminus
coding region 916 FS NGS FS ****
HvLHY-3UTRv 1005 I8R NGS Introns 8 retained, unspliced **
- Not visible or transcript level < 1% of total transcripts; * Transcript level between 1 and 2% of total transcripts; ** Transcript level between 2 and 10% of total transcripts; *** Transcript level between 10 and 50% of total transcripts; **** Transcript level equal or greater than 50% of total transcripts.
175
C
hapter 5

Table 5.2: Information of AS events in barley GI, TOC1 and ELF3 detected by RT-PCR experiments. Transcript abundance information is
relative to WT plants grown under LD and 20 °C.
Gene Primer pair Primer
position Product size (bp)
AS event name Sequencing AS event Transcript abundance
GI HvGI-5UTRFw 5’ UTR and N-terminus
391 FS NGS, Sanger FS **** HvGI-Ex4Rv 251 E2S NGS E2 skipping ** coding region 263 E2S + Alt 3’ ss I2 NGS, Sanger E2 skipping and Alt 3’ ss I2 (+12 nt) ***
395 alt 5’ ss E2 +
alt 3’ ss I2 NGS
alt 5’ ss E2 (-8 nt) and alt 3’ ss I2 (+12 nt)
**
403 alt 3’ ss I2 NGS Alt 3’ ss I2 (+12 nt) *** 540 I2R NGS, Sanger Intron 2 retained ** HvGI-Ex12FwB
Exons 12 - 14 402 FS NGS, Sanger FS ****
HvGI-Ex14Rv 549 I13R NGS Intron 13 retained - HvGI-Ex14Fw Exons 14 - 16 248 FS NGS, Sanger FS **** HvGI-Ex16Rv 336 I15R NGS Intron 15 retained - 407 I14R NGS Intron 14 retained - 495 I14R+I15R Predicted Introns 14 and 15 retained, unspliced -
TOC1 HvPRR1-5UTRFwB Exons 1 - 3 678 FS NGS, Sanger FS ****
HvPRR1-Ex3Rv 389 alt 5’ ss I1 + alt 3’
ss E2 Sanger
alt 5’ ss I1 (-189 nt) and alt 3’ ss E2 (-100 nt)
**
392 CrIn.E1 (-313) Sanger Cryptic intron in E1 (-313 nt) ** 568 Unknown Unknown Unknown *
619 CrIn.E1 (-221)
+ I1R Sanger Cryptic intron in E1 (-221 nt) and I1R *
840 I1R Sanger Intron 1 retained - HvPRR1-Ex3Fw Exons 3 - 6 463 FS NGS, Sanger FS **** HvPRR1-Ex6Rv 297 E4S NGS, Sanger E4 skipping - 593 I3R NGS, Sanger Intron 3 retained * 793 I3R+I4R NGS Introns 3 and 4 retained, unspliced -
ELF3 HvELF3-Ex2Fw Exons 2 - 4 338 FS NGS, Sanger FS **** HvELF3-Ex4Rv 468 I3R NGS, Sanger Intron 3 retained *
- Not visible or transcript level < 1% of total transcripts; * Transcript level between 1 and 2% of total transcripts; ** Transcript level between 2 and 10% of total transcripts; *** Transcript level between 10 and 50% of total transcripts; **** Transcript level equal or greater than 50% of total transcripts.
176
C
hapter 5

Table 5.3: Information of AS events in barley CO2, PRR59, PRR95 and PRR37 detected by RT-PCR experiments. Transcript abundance
information is relative to WT plants grown under LD and 20 °C.
Gene Primer pair Primer
position Product size (bp)
AS event name
Sequencing AS event Transcript abundance
CO2 HvCO2-Ex1FwB C-terminus 509 FS NGS, Sanger FS **** HvCO2-3UTRv coding region 579 Alt 3’ ss Sanger Alt 3’ ss (+68 nt, PTC) *** 1004 CrIn Sanger Cryptic intron antisense strand * 1094 IR NGS, Sanger Intron retained, unspliced ***
PRR59 HvPRR59-Ex3Fw Exons 3 - 5
309 FS NGS, Sanger FS **** HvPRR59-Ex5RvB 611 I4R NGS Intron 4 retained - 614 I3R NGS Intron 3 retained - HvPRR59-Ex5Fw Exons 5 - 7 673 FS NGS, Sanger FS **** HvPRR59-Ex7RvB 601 CrIn E6 NGS Cryptic intron E6 (-72 nt, same
-
866 I3R NGS Intron 7 retained - HvPRR59-Ex7Fw C-terminus
coding region 344 FS NGS, Sanger FS ****
HvPRR59-3UTRv 470 I7R NGS Intron 7 retained * PRR95 HvPRR95-5UTRFw N-terminus 610 FS NGS, Sanger FS ****
HvPRR95-Ex4Rv coding region 704 I2R NGS Intron 2 retained - HvPRR95-Ex4Fw Exons 4 - 6 612 FS NGS, Sanger FS **** HvPRR95-Ex6Rv 330 Unknown Unknown Unknown - 842 I4R Predicted Intron 4 retained - 932 I5R Predicted Intron 5 retained - 1171 I4R+I5R Predicted Introns 4 and 5 retained - HvPRR95-Ex6FwB C-terminus 363 FS NGS, Sanger FS **** HvPRR95-3UTRv coding region 450 I6R NGS Intron 6 retained -
PRR37 HvPpdH1-5UTRfw 5’ UTR and
250 FS NGS, Sanger FS **** HvPpdH1-Ex1Rv coding region 194 Unknown Unknown Unknown ** 230 Unknown Unknown Unknown * 246 Alt 3' ss E2 NGS Alt 3' ss E2 (-4 nt) - 362 I1R NGS, Sanger Intron 1 retained ***
- Not visible or transcript level < 1% of total transcripts; * Transcript level between 1 and 2% of total transcripts; ** Transcript level between 2 and 10% of total transcripts; *** Transcript level between 10 and 50% of total transcripts; **** Transcript level equal or greater than 50% of total transcripts.
177
C
hapter 5

Table 5.4: Information of AS events in barley PRR37 and PRR73 detected by RT-PCR experiments. Transcript abundance information is
relative to WT plants grown under LD and 20 °C.
Gene Primer pair Primer
position Product size (bp)
AS event name Sequencing AS event Transcript abundance
PRR37 HvPpdH1-Ex4Fw Exons 3 - 5 411 FS NGS, Sanger FS *** HvPpdH1-Ex6Rv 405 alt 3' ss E6 NGS, Sanger alt 3' ss E6 (-6 nt) ***
450 alt 5’ ss I6 (+45)
+ alt 3' ss E6 Sanger alt 5' ss I6 (+ 45 nt) and alt 3' ss E6 (-6 nt)
***
456 alt 5’ ss I6 (+45) NGS, Sanger alt 5' ss I6 (+ 45 nt) ***
461 alt 5’ ss I6 (+50) NGS, Sanger alt 5' ss I6 (+ 50 nt), adds PTC ** 547 alt 3' ss E6 + I6R Sanger alt 3' ss E6 (-6 nt) and I6R * 553 I6R Sanger Intron 6 retained - HvPpdH1-Ex6fwB C-terminus 902 FS NGS, Sanger FS **** HvPpdH1-3UTRv coding region 653 CrIn E8 Sanger Cryptic Intron E8 (-249 nt), in frame * 984 I7R NGS, Sanger Intron 7 retained **
PRR73 HvPRR73-5UTRFw HvPRR73-Ex3Rv
5’ UTR and N-terminus
coding region
606 FS NGS, Sanger FS ****
599 alt 3’ ss E2 Predicted alt 3’ ss E2 (-7 nt), uORF decreased
from 36 to 11 aa. -
861 alt 5’ ss I1 +
alt E1a NGS
alt 5’ ss Intron 1 and Alt E1a (+255 nt)
-
HvPRR73-Ex3Fw Exons 3 - 5 320 FS NGS, Sanger FS **** HvPRR73-Ex5Rv 439 I4R Predicted Intron 4 retained - 465 I5R NGS Intron 5 retained - 584 I4R+I5R Predicted Introns 4 and 5 retained - HvPRR73-Ex5Fw Exons 5 and 7 549 FS NGS, Sanger FS **** HvPRR73-Ex7Rv 632 I6R NGS, Sanger Intron 6 retained * HvPRR73-Ex7Fw Exons 7 and 8 319 FS NGS, Sanger FS **** HvPRR73-Ex8RvB 404 I7R NGS Intron 7 retained **
- Not visible or transcript level < 1% of total transcripts; * Transcript level between 1 and 2% of total transcripts; ** Transcript level between 2 and 10% of total transcripts; *** Transcript level between 10 and 50% of total transcripts; **** Transcript level equal or greater than 50% of total transcripts.
178
C
hapter 5

179 Chapter 5
HvLHY. The LHY gene is associated with two contigs. One contig contains the entire
coding sequence, while the other appears to contain part of the 5’ UTR. The two con-
tigs are not as yet connected in genomic databases. At least 20 AS events were ob-
served in barley LHY. However, AS events in contig_51288 (data not shown), contain-
ing part of the 5’ UTR of LHY (2 exons at 5’ end), should be treated with caution be-
cause the sequence linking both genomic contigs for LHY is missing from genomic da-
tabases. To avoid misinterpretation of results, contig _51288 is not considered in fur-
ther AS analyses and discussion. This leaves ten AS events in barley LHY from con-
tig_1567295 (Figure 5.2). HvLHY has six AS events within the 5’ UTR, four of which
add upstream AUGs/ORFs: alternative 3’ ss in intron 3 (adds one uORF) and reten-
tion of introns 1, 2 and 3 (adding 2, 3 and 7 uORFs, respectively). All uORFs code for
small peptides (< 32 amino acids) with no homologues in Arabidopsis and terminate
before the functional LHY ORF (Appendix B7.2). In the coding region, four AS events
add PTCs: alternative 5’ ss in exon 4 (removes 20 nt, which changes the ORF), intron
4 retention, alternative exon 6a and intron 8 retention. In light/dark and LL condi-
tions, these alternative LHY transcripts are found in low abundance and fully spliced
transcripts represent more than 90% of total transcripts.

180 Chapter 5
Figure 5.2: Genomic structure and AS events of HvLHY. Exons are numbered; 5’ and 3’
UTRs are open boxes; coding sequences are dark boxes, except MYB domain-encoding
exons, which are shaded grey. AS events are represented in red. Alt, alternative; ss, splice
site; I, intron; R, retention; E, exon. The approximate positions of most primer pairs used
in barley AS studies are shown by green arrows joined by a dotted line.
HvGI. HvGI contain ten exons that are constitutively spliced and six exons that show
AS. Three AS events occurred in the 5’ UTR (exons 2 and 3), and the other three are
intron retention events within the coding region, which add PTCs at I13R, I14R and
I15R (Figure 5.3). AS events in the 5’ UTR involve skipping exon 2, which removes
three uORFs, and retaining intron 2, which adds four uORFs. All of these uORFs
code for small peptides (< 26 amino acids) that terminate before the AUG of the func-
tional GI ORF. Such uORF-containing HvGI mRNAs may be translated less efficient-
ly or are less stable, when compared to uORF-free transcripts. No homologues or con-
served AS involved in the formation of uORFs was found in Arabidopsis. In
light/dark and LL conditions (20 °C), GI transcripts with alternative 5’ UTR are
rhythmic (Appendix B9.1) and uORF-containing transcripts represent 75% of total
transcripts. Intron retention (IR) events were found in low abundance (< 1% of total
transcripts) for the same conditions.

Figure 5.3: Genomic structure and AS events of GI barley core clock gene. Exons are numbered; 5’ and 3’ UTRs are open boxes; coding
sequences are dark boxes. AS events are represented in red. Alt, alternative; ss, splice site; I, intron; R, retention; E, exon; S, skipping. The
approximate positions of most primer pairs used in AS studies are shown by green arrows joined by a dotted line.
181
C
hapter 5

182 Chapter 5
HvTOC1. HvTOC1 contains six exons and has at least seven AS events (Figure 5.4).
Three AS events are IRs in the coding region (I1R, I3R and I3R+I4R), which add
PTCs. Another AS event skips exon 4, removing 168 nt of the protein coding sequence
which leads to an in-frame removal of 56 amino acids immediately after the PRR do-
main. Two cryptic introns and both alternative 5’ and 3’ ss were identified at the 5’
end. These remove the functional AUG, which may lead to the use of a downstream
in-frame AUG and may encode for a protein with a partial PRR domain. When plants
were grown in light/dark and LL 20 °C conditions, HvTOC1 AS events represented
less than 10% of total transcripts.
Figure 5.4: Genomic structure and AS events of HvTOC1. Exons are numbered; 5’ and 3’
UTRs are open boxes; coding sequences are dark boxes, except domain-encoding exons,
which are shaded grey (PRR domain) or green (CT domain). AS events are represented in
red. Alt, alternative; ss, splice site; I, intron; R, retention; E, exon; S, skipping. The ap-
proximate positions of most primer pairs used in barley AS studies are shown by green ar-
rows joined by a dotted line.
HvELF3. HvELF3 contains four exons and AS analyses identified retention of intron 3,
which disrupts the coding region by adding a PTC (Figure 5.5). In light/dark and LL
20 °C conditions, this AS event represents less than 2% of total transcripts.

183 Chapter 5
Figure 5.5: Genomic structure and AS event of ELF3 barley core clock gene. Exons are
numbered; 5’ and 3’ UTRs are open boxes; coding sequences are dark boxes. AS event is
represented in red. I, intron; R, retention. The approximate positions of two primer pairs
used in AS studies are shown by green arrows joined by a dotted line.
HvGRP7a/b. Both single intron genes undergo IR events, according to RNA-seq data
(data not shown). However, RT-PCR experiments with these genes were not success-
ful and so were not confirmed.
HvCO2. Three AS events were observed using HvCO2 specific primers in RT-PCR ex-
periments. This single intron gene shows evidence of IR, an alt 3’ ss and cryptic intron
(CrIn) removal (Figure 5.6). However, it is likely that unspliced (IR) and CrIn tran-
script isoforms are generated from a gene on the opposite strand, also seen for
AtCOL1. First, the CrIn has canonical splice sites (GT-AG) if spliced from the com-
plementary transcript but non-canonical splice sites if spliced from the sense (HvCO2)
transcript (GT-TC). Second, the expression of both IR and CrIn are rhythmically op-
posite to the HvCO2 transcripts (FS and alt 3’ ss) in light/dark conditions (Appendix
B9.2). TBLASTX analysis suggests that this barley antisense gene is similar to the lon-
gevity assurance (At1g13580) gene in Arabidopsis (similarity of 71% at the protein lev-
el). However, this BLAST search is not reciprocal, suggesting they are not
orthologues.

184 Chapter 5
Figure 5.6: Genomic structure and AS events in HvCO2 locus. Exons are numbered; 5’
and 3’ UTRs are open boxes; coding sequences are dark boxes. AS events are represented
in red. Alt, alternative; ss, splice site; I, intron; R, retention; CrIn, cryptic intron. The ap-
proximate positions of the primer pair used in AS studies is shown by green arrows joined
by a dotted line.
HvPRR95 and HvPRR59. Both of these genes have a highly conserved gene structure,
with the exception of an additional exon (exon 5) in the coding region of HvPRR59
(Figure 5.7). In each gene, five AS events were identified and four (HvPRR59) or all
five (HvPRR95) are IR events in the coding region, which add PTCs. Retention of both
of the 3’ most introns, I7R (HvPRR59) and I6R (HvPRR95) is conserved between these
paralogues. I7R from HvPRR59 is not susceptible to NMD degradation because intron
inclusion maintains the reading frame and may increase protein diversity. I6R from
HvPRR95 contains a PTC which is present in the last exon and, therefore, might not
be targeted to NMD, coding for a protein lacking a functional CT domain. In
light/dark and LL conditions (20 °C), all alternative transcripts identified are found in
low abundance (< 2% of total transcripts). AS events in the 5’ UTR could not be com-
prehensively assessed due to technical problems with the PCR and cloning procedure.

Figure 5.7: Genomic structure and AS events of HvPRR95 and HvPRR59. Exons are numbered; 5’ and 3’ UTRs are open boxes; coding se-
quences are dark boxes, except domain-encoding exons, which are shaded grey (PRR domain) or green (CT domain). AS events are repre-
sented in red. I, intron; R, retention; CrIn, cryptic intron; E, exon. The approximate positions of most primer pairs used in barley AS stud-
ies are shown by green arrows joined by a dotted line.
185
C
hapter 5

186 Chapter 5
HvPRR37 and HvPRR73. Alignment of PRR37 and PRR73 shows a very similar gene
model structure. The eight exons covering the protein coding region show identical intron
positions. However, the introns vary in sequence and length and this may help explain the
contrasting alternative splicing events. Of all AS events identified (nine and seven for
PRR37 and PRR73, respectively) only two were conserved, in introns 6 and 7 (I6R and
I7R) (Figure 5.8). Five AS events in PRR73 are IR events in the coding region that add
PTCs. In the 5’ UTR of PRR73, two events occur and may affect mRNA translation.
First, an alternative (alt) 5’ ss that removes seven nucleotides of exon 2 (E2) shortened the
length of the uORF from 36 to 11 amino acids, and second, an alt 5’ ss in intron 1 and the
addition of an alternative exon (E1a) add 255 nt to the 5’ UTR sequence (with no effect
on uORFs) (Figure 5.8). In the 5’ UTR of PRR37, two AS events were observed. First, a
CrIn event was observed in about 20% of the reads from the RNA-seq data, while the oth-
er 80% reads retained the CrIn. Removal of the CrIn results in the loss of an uORF coding
for 48 amino acids, which may affect translation of the functional ORF. Second, I1R
changes the N-terminus coding region and creates a uORF which codes for 45 amino ac-
ids that overlapped the functional ORF by 35 nt. As a result, the I1R event probably af-
fects mRNA stability, e.g. transcript targeted to NMD (Figure 5.9) (Kalyna et al., 2012).
BLAST analyses revealed no putative PRR37 uORF Arabidopsis homologues. In the
PRR37 coding region, seven AS events were detected, including four alternative ss, one
CrIn in E8 and two IR described earlier (I6R and I7R) (Figure 5.8). The CrIn in E8 and
two alternative splice sites increase the number of PRR37 protein-coding mRNA isoforms
by removing 249 nt (83 amino acids) from E8 and by removing 6 nt and/or adding 45 nt
to exon 6 (involving 2 and 15 amino acids, respectively).

Figure 5.8: Genomic structure and AS events of HvPRR37 and HvPRR73 barley core clock genes. Exons are numbered; 5’ and 3’ UTRs are
open boxes; coding sequences are dark boxes, except domain-encoding exons, which are shaded grey (PRR domain) or green (CT domain).
AS events are represented in red. Alt, alternative; ss, splice site; I, intron; R, retention; E, exon. The approximate positions of most primer
pairs used in barley AS studies are shown by green arrows joined by a dotted line. SNP48 of HvPRR37 is indicated.
187
C
hapter 5
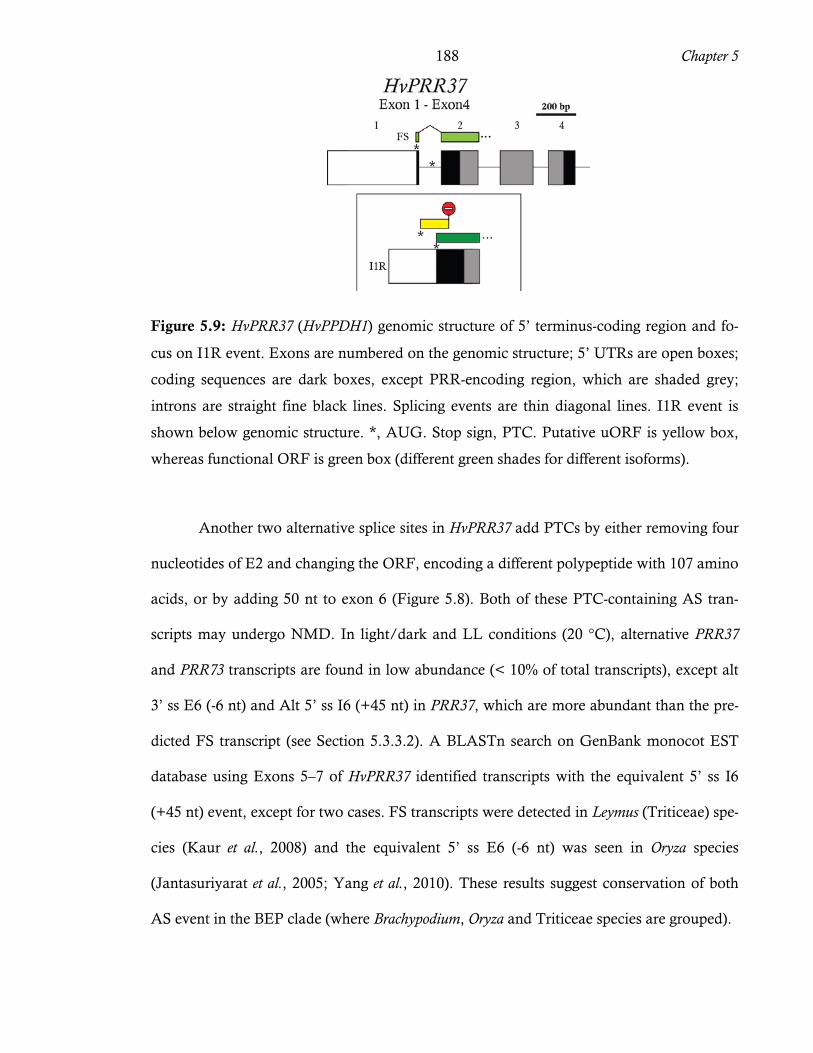
188 Chapter 5
Figure 5.9: HvPRR37 (HvPPDH1) genomic structure of 5’ terminus-coding region and fo-
cus on I1R event. Exons are numbered on the genomic structure; 5’ UTRs are open boxes;
coding sequences are dark boxes, except PRR-encoding region, which are shaded grey;
introns are straight fine black lines. Splicing events are thin diagonal lines. I1R event is
shown below genomic structure. *, AUG. Stop sign, PTC. Putative uORF is yellow box,
whereas functional ORF is green box (different green shades for different isoforms).
Another two alternative splice sites in HvPRR37 add PTCs by either removing four
nucleotides of E2 and changing the ORF, encoding a different polypeptide with 107 amino
acids, or by adding 50 nt to exon 6 (Figure 5.8). Both of these PTC-containing AS tran-
scripts may undergo NMD. In light/dark and LL conditions (20 °C), alternative PRR37
and PRR73 transcripts are found in low abundance (< 10% of total transcripts), except alt
3’ ss E6 (-6 nt) and Alt 5’ ss I6 (+45 nt) in PRR37, which are more abundant than the pre-
dicted FS transcript (see Section 5.3.3.2). A BLASTn search on GenBank monocot EST
database using Exons 5–7 of HvPRR37 identified transcripts with the equivalent 5’ ss I6
(+45 nt) event, except for two cases. FS transcripts were detected in Leymus (Triticeae) spe-
cies (Kaur et al., 2008) and the equivalent 5’ ss E6 (-6 nt) was seen in Oryza species
(Jantasuriyarat et al., 2005; Yang et al., 2010). These results suggest conservation of both
AS event in the BEP clade (where Brachypodium, Oryza and Triticeae species are grouped).

189 Chapter 5
5.3.2 – Arabidopsis vs. barley AS in plant core clock genes
In barley and Arabidopsis plants, abundance analyses of alternative transcripts found
several similarities. First, most transcripts (> 50%) were in low abundance (< 2% of the
total transcripts) in both species. Second, many of the AS events were IR events (> 50%),
of which mostly were found in low abundance in both barley and Arabidopsis. These low
abundant IR events probably represent partially or unspliced spliced transcripts in the
RNA samples.
5.3.2.1 – LHY and CCA1
AS studies of Arabidopsis clock genes described twelve putative AS events for
LHY, whereas its paralogue CCA1 probably undergoes eleven AS events (James et al.,
2012a). At least ten AS events were observed here in barley LHY. Comparison of the gene
structure and AS events of AtCCA1, AtLHY and HvLHY homologues identified their simi-
larities and differences (Appendix B10.1). These genes have a highly conserved gene struc-
ture, with the exception of one additional intron found in AtCCA1 and AtLHY (intron 5 or
6, respectively) when compared with HvLHY. Both LHY orthologues have several AS
events in their 5’ UTR. HvLHY had four exons contained within the 5’ UTR sequences.
However, another contig sequence (contig_51288) was discovered that may also contain
part of the 5’ UTR of HvLHY. This could potentially add a further two exons to the 5’ end
of the 5’ UTR sequence. Due to the complexity of the HvLHY 5’ UTR and low conserva-
tion between the 5’ UTR of HvLHY and its Arabidopsis homologues it was difficult to de-
termine whether there is any conservation of AS between the two species (data not
shown). In the coding region of AtLHY, AtCCA1 and HvLHY, the MYB domain is encoded
by two small exons. The three homologues have intron retention events at or near the
MYB-coding region, which introduce PTCs. Furthermore, the long intron 5 or 6 of AtLHY

190 Chapter 5
and HvLHY, respectively, contains a PTC-containing alternative exon (E5a and E6a for
AtLHY and HvLHY, respectively). The sizes of these alternative exons are significantly dif-
ferent but both PTC-containing alternative transcripts are unable to code for a functional
LHY protein and the Arabidopsis E5a-containing transcript, in particular, is degraded by
NMD (James et al., 2012a).
5.3.2.2 – GI
The genomic structure of the GI orthologues is highly conserved, except for two
additional introns (introns 2 and 3) in the 5’ end of HvGI when compared with AtGI (Ap-
pendix B10.2). Both GI orthologues have only a small number of AS events. AtGI has
three putative AS events (James et al., 2012a), whereas its barley orthologue undergoes six
AS events. Two intron retention events in the 3’ coding region are conserved between both
orthologues (introns 12 and 13 of AtGI and introns 14 and 15 of HvGI), which introduce
PTCs. However, these IR events are of low abundance in both barley and Arabidopsis
(James et al., 2012a). HvGI has three additional AS events in the 5’ UTR which are abun-
dant, and two of them result in uORFs.
5.3.2.3 – TOC1
The genomic structure of Arabidopsis and barley TOC1 orthologues are conserved.
AtTOC1 has eight putative AS events (James et al., 2012a), whereas its barley orthologue
undergoes seven AS events (Appendix B10.3). I1R, I3R and I3R+I4R events disrupt the
coding region of mRNAs from both orthologues. Furthermore, an exon skipping (ES)
event was identified for exons 5 and 4 in Arabidopsis and barley, respectively. Both IR and
ES events are of low abundance in barley and Arabidopsis plants grown at 20 °C (James et
191 Chapter 5
al., 2012a). Interestingly, levels of AtTOC1 transcripts retaining I4 transiently increase dur-
ing cold acclimation (James et al., 2012a). HvTOC1 has three additional AS events involv-
ing the 5’ end of the transcript, not observed in Arabidopsis, which are present in a moder-
ate amount (transcript levels between 2 and 10% of total transcripts). These AS events re-
move the functional AUG such that use of a downstream in-frame AUG potentially could
generate an N-terminal truncated form of the protein without a functional PRR domain.
Although it is not possible to predict how the function of a PRR protein would be affected
in the absence of a PRR domain, truncated proteins can have functions and may act as
dominant negatives.
5.3.2.4 – PRR5(9)/PRR9(5)
Six cases of AS have been described in PRR5 of Arabidopsis (James et al., 2012a),
while its paralogue PRR9 has five AS events. Both barley homologues, PRR59 and PRR95,
undergo five AS events. Comparison of gene structure and AS events of AtPRR5, AtPRR9,
HvPRR59 and HvPRR95 homologues show that these genes have a highly conserved gene
structure in the PRR (3 exons) and CT (2 exons) domain-coding exons (Appendix B10.4).
Both Arabidopsis paralogues have several AS events in their N-terminal coding regions,
but it was not possible to establish their conservation in barley. The C-terminal coding re-
gions in AtPRR9 and both barley homologues have conserved IR events which introduce
PTCs. These PTC-containing alternative transcripts are unable to code for the CT domain
in Arabidopsis or barley (James et al., 2012a). Interestingly, I2R (HvPRR95) and I3R
(HvPRR59) events are similar to the cold-dependent I3R AS events in PRR9 (James et al.,
2012a), which is also affected in prmt5 and stipl1 mutants (Sanchez et al., 2010; Jones et al.,
2012).

192 Chapter 5
5.3.2.5 – PRR3(7)/PRR7(3)
Arabidopsis PRR3 and its paralogue PRR7 undergo five AS events (James et al.,
2012a). Barley homologues PRR37 and PRR73 undergo nine and seven AS events, respec-
tively. Comparison of gene structures and AS events of AtPRR3, AtPRR7, HvPRR37 and
HvPRR73 homologues identified their similarities and differences (Appendix B10.5).
AtPRR3 has 11 exons, while AtPRR7, HvPRR37 and HvPRR73 have very conserved gene
structure with 9 exons, confirming the orthology, as suggested by in silico and mRNA ex-
pression analyses. Furthermore, AtPRR7 and HvPRR37 have a CrIn in E8 that removes 84
nt or 249 nt, respectively, both maintaining the ORF. Interestingly, AtPRR3 and HvPRR73
undergo two similar AS events, alt 5’ ss E2 and I4R, even though they are not orthologues.
Regarding the alt 5’ ss E2 (-7 nt) event, it has opposite results in both species: in barley the
length of a uORF is reduced from 36 to 11 amino acids, while in Arabidopsis it increases a
uORF from nine to 29 amino acids.
5.3.3 – Effect of low temperature on expression and AS of barley clock genes
The Arabidopsis clock genes mostly regulated by low temperature AS are AtLHY
and AtPRR7 (James et al., 2012a). Having defined the AS events of clock genes in barley, it
was investigated whether transient or longer term low temperature conditions influence AS
of HvLHY, HvPRR37 and HvPRR73. For this, the HR RT-PCR system was used to exam-
ine the relative levels of fully-spliced (FS) versus transcripts containing different AS events
identified for these genes (see above). Leaf samples of three barley lines grown in LD con-
ditions were collected at 2.5 h after dawn in different temperature conditions. This time
point was chosen because it is when HvLHY, HvPRR37 and PRR73 have their expression
peaks (identified previously in Chapter 4). However, results obtained from these analyses
must be interpreted carefully. Clock genes have a rhythmic expression, which might be al-

193 Chapter 5
tered as temperature changes, i.e. phase (time of the expression peak) might be shifted as
part of clock temperature entrainment and compensation. In this case, upon temperature
changes, 2.5 h after dawn may not be representative of the expression peak any more.
Plants were grown for one week at 20 °C and sampled. Subsequently, plants were
subjected to 4 °C for four days. Plants analysed on Day 4 at 4 °C were considered as ac-
climated to cold. After four days in the cold, the temperature was switched back to 20 °C,
as before the cold treatment. Unlike the temperature reduction regime, which was initiated
at dusk, temperature increase took place at dawn to avoid any conflict between clock-
entraining light/dark and warm/cool cycles. This approach tested whether AS events iden-
tified were temperature-dependent and reversible rather than age-dependent and perma-
nent. Plant material was collected at six time points: 1) 20 °C (Day 7); 2) Day 1 at 4 °C; 3)
Day 2 at 4 °C; 4) Day 4 at 4 °C; 5) Day 1 at 20 °C; 6) Day 2 at 20 °C. The primer strategies
and representative HR RT-PCR panel electropherograms produced by the ABI 3730 geno-
typing software are shown in Table 5.1–5.4, Figure 5.11 and Figure 5.13. The abundance
of several transcripts was measured after 20 to 28 cycles of amplification. Changes in tran-
script levels were observed and ten important temperature-related AS events in HvLHY and
HvPRR37 were detected. These were either virtually absent at 20 °C and only visible during
cold treatment (or vice-versa) or increased to between 10 and 50% of total transcripts dur-
ing at least one phase of the temperature transitions or acclimations. Furthermore, expres-
sion and AS changes were restored upon return to 20 °C conditions, i.e. the opposite was
seen during a temperature increase.
The design of the cold experiment mentioned above was carried out on the basis
that the barley clock is a homeostatic mechanism that maintains its 24-h period despite
rapid temperature switches. Hence, monitoring AS during the transitions between temper-
atures would be valuable to understand the role of splicing in the clock temperature en-
trainment process, while monitoring AS steady states would potentially give information

194 Chapter 5
about splicing in temperature compensation mechanisms of the clock. However, to test
whether sudden cold stress could change splicing patterns by inactivating or lowering effi-
ciency of splicing machinery, introns from control genes HvUBC21 and HvPPDAA2 were
also analysed. This was particularly important because several cold-dependent AS events
in LHY that were observed transiently upon cooling are IR events. For both control genes,
the relative abundance of transcripts containing IR events was not affected by cooling (data
not shown). In addition, in the clock genes themselves many introns are as efficiently re-
moved at 4 °C as at 20 °C. Therefore, transient AS events seen upon cooling are not
caused by a non-specific decline in the splicing activity under these conditions, but rather,
represent subtle and specific modulation of mRNA diversity and expression levels.
5.3.3.1 – HvLHY
The effects of temperature changes on HvLHY expression and splicing patterns
were tested in three barley lines using four different HR RT-PCR primer pairs (Table 5.1),
which spanned most of the gene sequence. This approach allowed for a quantitative analy-
sis in which total LHY transcript was assessed as the sum of all isoforms detected with
these primers (which were considered as technical replicates). Some changes in total LHY
transcript levels were clearly observed during temperature transition experiments (Figure
5.10). First, Hvelf3 plants grown at 20 °C have significantly lower levels of LHY when
compared to WT and Bowman (ppdh1) plants (P < 0.002). These results confirm the ex-
pression analysis described in Chapter 4. Second, at 4 °C (Days 1, 2 and 4) and Day 1 at
20 °C, no significant difference was observed in LHY levels among the three barley lines
analysed, which suggests that under low temperature conditions ppdh1 and elf3 mutations
have no effect on LHY expression. Third, LHY mRNA levels in WT and Bowman (ppdh1)
plants decreased from 100% at 20 °C to 52–55% on Day 1 at 4 °C, whereas Hvelf3 plants

195 Chapter 5
had increased levels of around 126% in a similar comparison. Lastly, on Day 2 at 20 °C,
LHY transcript levels in WT and Bowman (ppdh1) increased to four to six times over the 4
°C (Day 4) levels. The LHY levels on Day 1 at 20 °C were low and probably reflected that
this time point represents effectively one hour after switching to 20 °C from 4 °C, showing
that recovery of transcript levels takes longer than 2.5 h. In contrast, Hvelf3 plants main-
tained the same expression level in a similar comparison.
Figure 5.10: Total LHY transcript levels in the morning (2.5 h after dawn) under six condi-
tions: 20 °C (Day 7), Day 1 at 4 °C, Day 2 at 4 °C, 4 °C (Day 4), Day 1 at 20 °C and 20 °C
(Day 2). Results obtained with four different HR RT-PCR primer pairs (Table 5.1) were
considered as technical replicates. Error bars: SEM from three biological replicates. Com-
parison are of LHY levels between Hvelf3, WT and Bowman (ppdh1). P < 0.002, represent-
ed by **.
In addition to affecting expression levels, transient and long-term temperature
changes alter LHY splicing. Using HR RT-PCR primers spanning the 5’UTR, a significant
but transient retention of LHY introns 1, 2 and 3 (adding 2, 3 and 7 uORFs, respectively)
was detected on the first day during the transition from 20 °C to 4 °C (Figure 5.11, Figure
5.12 and Appendix B7.2), which roughly returned to original levels on the following days.

196 Chapter 5
The relative abundance (proportion of total LHY transcripts) of alt 3’ ss I1 (adding 1
uORF) also followed the same behaviour as IRs. These uORF-containing transcripts rep-
resent around 8% of total transcript levels at 20 °C, but on Day 1 at 4 °C they were signifi-
cantly different (P < 0.001), representing around 38.5% of total LHY transcripts. These re-
sults are virtually identical for the three barley lines analysed (data not shown), indicating
that the ppdh1 and elf3 mutations have no effect on LHY splicing. The levels of two
isoforms with alternative splice sites (alt 3’ ss E4 and alt 3’ ss I2) are low in all conditions
analysed (< 3% of total transcript) and show different behaviour from IRs and alt 3’ ss I1.
Alt 3’ ss E4 and I2 decreased on Day 1 at 4 °C and maintain low levels at 4 °C. These two
‘alt ss’ isoforms are not included in Figure 5.12 or further analysis because they may repre-
sent inherent splicing variation in this region of the transcript. This is suggested for the fol-
lowing reasons: First, they are related to the abundance of FS transcripts, i.e. their level
decreases when LHY FS levels decrease, and vice-versa. Second, they represent less than
3% of total transcript levels in all conditions analysed. Third, they have no known or pre-
dicted effect on the potential functions of the transcripts (such as altering uORFs). Lastly,
there is no conservation of alt 3’ ss E4 or alt 3’ ss I2 in AtLHY and AtCCA1 homologues.

Figure 5.11: HR RT-PCR analysis of AS in the 5’ UTR of HvLHY. Exons are numbered on the genomic structure; 5’ and 3’ UTRs are
open boxes; coding sequences are dark boxes. Diagonal lines represent splicing events. AS events are shown in red. Approximate positions
of primers are shown by arrowheads. Representative electropherograms of spectral data collected during the sample run and produced by
GeneMapper® show the size of detected peaks corresponding to RT-PCR products from LHY FS and AS transcripts. Individual LHY tran-
script isoforms are labelled.
197
C
hapter 5

198 Chapter 5
Figure 5.12: Relative abundance of LHY FS and AS transcripts in the 5’ UTR region con-
taining additional uORFs, AS events I1R, I2R, I3R and alt3’ ss I1. WT plants were as-
sessed using HR RT-PCR primers spanning the 5’ UTR (Table 5.1). Error bars are SEM of
three biological replicates. Significantly different AS/FS ratios when compared with 20 °C
data are shown in red (P < 0.001).
HR RT-PCR analysis of the region encoding the LHY MYB domain (Figure 5.13)
and the C-terminus coding region show a striking retention of LHY intron 4 (I4R) and 8
(I8R) during the transition from 20 °C to 4 °C (Figure 5.14A and B). I4R (P < 0.001) and
I8R (P < 0.01) significantly increased in both absolute terms and as a proportion of total
LHY transcripts, but they decreased considerably over the following days. I4R changed
from around 1% of total transcripts at 20 °C to 40% during the first day after reduction in
temperature and 14% after acclimation to 4 °C. I8R changed from around 10% of total
transcripts at 20 °C to 37% during the first day at 4 °C and 9% after acclimation to 4 °C.
These results were nearly identical for the three barley lines analysed (data not shown),
confirming once again that ppdh1 and elf3 mutations have no effect on LHY splicing. As

199 Chapter 5
mentioned previously (Section 5.3.1), the retention of LHY intron 4 and 8 create PTCs.
Analyses of NMD of transcripts with retained introns in Arabidopsis suggest that they are
not degraded by the NMD pathway (Kalyna et al., 2012). This may be explained if such
transcripts, for example, do not leave the nucleus. Transcripts with retained introns have
not yet been shown to be insensitive to NMD in barley and it is not currently possible to
predict the effects of I4R or I8R on translatability or stability of such mRNAs. However, it
is clear that I4R mRNAs cannot code for the full-length LHY protein. Were these tran-
scripts to be translated, they would encode an N-terminal truncated protein with no MYB
domain (I4R) or a protein with an altered C-terminus (I8R), which could interfere with
LHY protein function. Three additional transcript isoforms changes were observed at very
low levels around the MYB-encoding exons: alt 5’ ss E4, I5R and unspliced (I4R and I5R,
3.5% of total transcripts on Day 1 at 4 °C). Alt 5’ ss E4 and I5R, in particular, were not
included in Figure 5.14A or in further analyses because they represent less than 0.5% of
total transcript levels in all conditions analysed.

Figure 5.13: HR RT-PCR analysis of AS in the MYB-coding domain region of HvLHY. Exons are numbered on the genomic structure; 5’
UTR is the open box; coding sequences are dark boxes, except MYB-encoding exons, which are shaded grey. Diagonal lines represent
splicing events. AS events are shown in red. Approximate positions of primers are shown by arrowheads. Representative electrophero-
grams of spectral data collected during the sample run and produced by GeneMapper® show the size of detected peaks corresponding to
RT-PCR products from LHY FS and AS transcripts. Individual LHY transcript isoforms are labelled.
200
C
hapter 5

Figure 5.14: Relative abundances of LHY FS and AS transcripts. WT plants were assessed using HR RT-PCR primers (Appendix B7.1)
spanning A) the MYB-encoding region and B) the C-terminal coding region. Error bars are SEM of three biological replicates. Significantly
different AS/FS ratio compared with 20 °C data is shown in red (I4R: P < 0.001; I8R: P < 0.01).
201
C
hapter 5

202 Chapter 5
In Arabidopsis, an important low temperature-dependent AS event is the inclusion
of an alternative exon (E5a), in the long intron 5 (James et al., 2012a). The equivalent in-
tron in HvLHY is intron 6. At 20 °C, single products representing the fully spliced tran-
script (FS) were observed using HR RT-PCR primers spanning LHY exons 6 and 7 (Ap-
pendix B7.3). WT, Bowman (ppdh1) and Hvelf3 plants acclimated to 4 °C expressed very
low levels (< 0.7% of total transcripts) of an AS transcript with a cold-specific alternative
exon E6a (Appendix B7.3). To obtain a clearer indication of when alternative E6a is in-
cluded, an RT-PCR experiment was carried out using primers located in E6 (forward) and
E6a (reverse) (Figure 5.15). The proportion of LHY transcripts specifically containing E6a
increased upon cooling to 4 °C and continued to be detectable while the plants were main-
tained at 4 °C, but decreased when plants were returned to 20 °C. Analysis suggests that
there is some retention of intron 6, as well as E6a inclusion, but this information could not
be confirmed due to technical constrains in amplifying and cloning transcripts with this
long intron (1,657 bp). E6a- and putative I6-containing transcripts are probably non-
functional due to the presence of PTCs.
Collectively, the data indicate extensive AS of LHY transcripts, the levels of which
can change transiently or show gradual accumulation upon transfer to lower temperatures.
At low temperatures, the overall levels of LHY transcripts decrease and cold-dependent AS
isoforms contribute to a further reduction in LHY mRNA levels, which is likely to lead to a
decrease in functional LHY protein.

203 Chapter 5
Figure 5.15: Cold-dependent LHY AS E6a transcripts detected by RT-PCR using primers
located in E6 (forward) and E6a (reverse). WT samples were harvested in the morning (2.5
h after dawn) in six temperature conditions: 20 °C (Day 7), Day 1 at 4 °C, Day 2 at 4 °C, 4
°C (Day 4), Day 1 at 20 °C and 20 °C (Day 2). Amplification of UBC (HvUBC21) and
PP2A (HvPP2AA2) served as reference genes. Three biological replicates were analysed. 5’
and 3’ UTRs are open boxes; coding sequences are dark boxes, except E6a, which is shad-
ed yellow. 812, unspliced product; 640, E6a-containing product; -, negative control (RNA
template).
5.3.3.2 – HvPPDH1 (HvPRR37)
Since Arabidopsis PRR7 undergoes extensive cold-dependent AS and has been im-
plicated in responses to temperature (Salomé and McClung, 2005; James et al., 2012), the
effect of cold on expression and splicing of barley HvPRR37 and HvPRR73 were evaluated.
PRR37 and PRR73 are paralogues and show similar expression behaviours (Chapter 4).
However, they respond differently to a reduction in temperature from 20 °C to 4 °C.
The effects of temperature changes on HvPPDH1 expression and splicing patterns
were tested in the three barley lines using four different HR RT-PCR primer pairs, which
spanned most of the gene sequence (Figure 5.8). Primer pairs spanning the C-terminus re-

204 Chapter 5
gion did not efficiently amplify PPDH1 transcripts and no expression data were obtained.
Total PPDH1 transcript levels were calculated as the sum of all isoforms detected with
three different primer pairs (which were considered as technical replicates). Some changes
in total PPDH1 transcript levels were clearly observed (Figure 5.16). First, at 4 °C (Days 1,
2 and 4) and Day 1 at 20 °C, Hvelf3 plants had significantly higher levels of ppdh1 when
compared to WT PPDH1 expression, which suggests that under low temperature condi-
tions, the elf3 mutation has an effect on ppdh1 expression, which is similar to the effect un-
der 20 °C conditions, as mentioned in Chapter 4. In contrast, when plants are acclimated
to cold conditions, Bowman (ppdh1) plants have significantly (P < 0.05) lower levels of
ppdh1 when compared to WT PPDH1 allele. This suggests that different PPDH1 alleles
have different behaviours upon cold acclimation, which was also observed for 20 °C condi-
tions (Chapter 4). This may reflect differential stability of the PPDH1 and ppdh1 alleles, but
is difficult to predict, as the mutation in ppdh1 is not known. Additionally, PPDH1 mRNA
levels in WT and Bowman (ppdh1) plants decreased from 100% at 20 °C down to 45% and
75%, respectively, on Day 1 at 4 °C and 13% on Day 4 at 4 °C, whereas Hvelf3 plants
maintained the same levels on Day 1 at 4 °C and decreased down to 50% on Day 4 at 4
°C. Lastly, on Day 2 at 20 °C, PPDH1 transcript levels in the three analysed barley lines
increased around four-fold when compared to Day 1 at 20 °C (effectively 1 hour at 20 °C
after the former 4 °C conditions), and roughly returned to original levels, as detected be-
fore the cold treatment.

205 Chapter 5
Figure 5.16: Total PPDH1 transcript levels in the morning (2.5 h after dawn) under six
conditions: 20 °C (Day 7), Day 1 at 4 °C, Day 2 at 4 °C, 4 °C (Day 4), Day 1 at 20 °C and
20 °C (Day 2). Results obtained with three different HR RT-PCR primer pairs (Appendix
B7.3 and B7.4) were considered as technical replicates. Error bars: SEM from 3 biological
replicates. P values represent statistical comparisons of data from WT against each mutant.
*, P < 0.05; **, P ≤ 0.005; ***, P < 0.001.
Exposure of plants to cold temperatures alters PPDH1 splicing, according to HR
RT-PCR analyses using primers spanning PPDH1 exons 5 and 7. There are seven different
mRNA isoforms generated from this region, detectable at 20 °C. Of these, three contain
PTCs and therefore are likely to be non-functional: I6R, I6R + alt 3’ ss E6 (-6 nt) and alt 5’
ss I6 (+50 nt). The other four are all mRNA isoforms coding for slightly different proteins
and are due to transcripts containing four different combinations of two alternative splicing
events: an alt 3’ ss E6 which adds or removes 6 nt (two codons for two amino acids) and
an alt 5’ ss in I6 which adds or removes 45 nt (codons for 15 amino acids). The four tran-
scripts represent between 18 and 32% each and together a more than 90% of the total at 20
°C (Figure 5.17). No enzymatic domain has been described for this region in the PPDH1

206 Chapter 5
protein so it is not possible to predict any impact on the function of these AS events and
potentially they represent functional isoforms with or without subtle differences.
Figure 5.17: HvPRR37 genomic structure and in-frame transcript isoforms from exons 5, 6
and 7. Exons are numbered on the genomic structure; coding sequences are white boxes;
introns are straight black lines. Diagonal lines represent splicing events. AS events are
shown in red.
The gene model in the barley database and proposed by Turner et al., (2005) defines
the alt 5’ ss I6 (+45 nt) transcript as the FS version. Here, we suggest that this splicing
event is an alternative event because it is greatly reduced in low temperature conditions
(less than 6% of total transcripts). We propose instead that the transcript with removal of
the 45 nt is the FS version as it is the most abundant at 4 °C. Of the seven different AS
events in HvPPDH1, four were considered temperature-dependent: alt 5’ ss I6 adding 45 nt
or 50 nt, alt 3’ ss E6 (-6 nt) and I5R (Figure 5.18) and different transcripts were detected
undergoing one or a combination of two of these AS events. Transcripts involving the two
alternative splice sites (removing 6 nt of E6 and/or adding 45 nt from I6) were all signifi-

207 Chapter 5
cantly reduced in both relative and absolute terms upon cold acclimation. In particular, the
two in frame transcripts which contained alt 5’ ss I6 (+45 nt) were greatly reduced from
around 54.7% of total transcripts at 20 °C to 5.7% after acclimation to 4 °C. As a result, FS
transcripts changed from around 20.3% of total transcripts at 20 °C to 77% after acclima-
tion to 4 °C. Interestingly, on Day 1 at 20 °C, which is effectively 1 hour at 20 °C from
former 4 °C condition, alt 5’ ss I6 (+45 nt) event returned to original levels detected before
the cold treatment, suggesting an immediate response to increase in temperature. This
shows that the presence of products containing alt 5’ ss I6 (+45 nt) is very clearly related to
temperature rather than simply to the abundance of the transcript. Additionally, transient
and longer term changes in PPDH1 expression and AS pattern can be detected irrespective
of the direction of temperature change.
The rapid response of alt 5’ ss I6 (+45 nt) to temperature increase may reflect fea-
tures of I6 itself, for example, secondary structure. However, no strong secondary structure
was detected within the I6 sequence using RNAfold software (http://rna.tbi.univie.ac.at)
and other factors may be involved in the regulation of this AS event. Two additional AS
events, Alt 5’ ss I6 adding 50 nt and I5R, add PTCs and cannot code for full-length
PPDH1 protein. These PTC-containing transcripts represent around 7.7% of total tran-
scripts at 20 °C and become undetectable upon transfer and acclimation to 4 °C. The data
for Hvelf3 mutant, which expresses Hvppdh1 at higher levels than WT (PPDH1) and Bow-
man (ppdh1), show that the presence of these PTC-containing products is clearly related to
temperature rather than simply to the reduced levels of HvPRR37 transcripts at 4 °C (Day
1) (Appendix B11.1). This relationship is highlighted by the fact that the splicing of intron
5 is more efficient at 4 °C than 20 °C, which might not be expected if the spliceosome was
adversely affected at the lower temperature.

Figure 5.18: Relative abundances of PPDH1 FS and AS transcripts. WT plants were assessed using HR RT-PCR primers spanning ex-
ons 5 and 7 (Appendix B7.4). Error bars are SEM of three biological replicates. Significantly different AS/FS ratios when compared
with 20 °C data are shown in red (P < 0.001).
208
C
hapter 5

209 Chapter 5
Using HR RT-PCR primers spanning the 5’UTR or PPDH1 exons 2 through 5, no
cold-dependent AS events were detected (Appendix B11.2). In different temperatures ana-
lysed here, retention of PPDH1 intron 1 (adding 1 uORFs) was related to the abundance of
FS transcripts. I1R analyses for WT, Bowman (ppdh1) and Hvelf3 plants were very similar
(data not shown), indicating the ppdh1 and elf3 mutations may have no effect on PPDH1
splicing. When using primers spanning PPDH1 exons 2 and 5, only fully spliced transcripts
(FS) were detected.
In summary, the data indicate extensive AS of PPDH1 transcripts, the extent of
which changes both immediately on transfer to and following acclimation to lower tem-
peratures. Temperature-dependent AS clearly contributes to the diversity of PPDH1
isoforms and to control of PPDH1 mRNA levels but it is not possible to predict whether
the in frame isoforms are functionally different. Thus, temperature has a major effect on
the AS of PPDH1 transcripts, which is not affected by mutations in the clock genes PPDH1
and ELF3.
5.3.3.3 – HvPRR73
Effects of temperature changes in HvPRR73 expression and splicing patterns were
tested in the three barley lines using four different HR RT-PCR primer pairs, which
spanned most of the gene sequence (Figure 5.8). Quantitative analysis of total PRR73 tran-
script levels was calculated as mentioned for PRR37 above (Section 5.3.2.2). PRR73
mRNA levels in WT and Bowman (ppdh1) plants decreased from 100% at 20 °C down to
around 65% on Day 1 at 4 °C, whereas Hvelf3 plants maintained the same levels in a simi-
lar comparison. In fact, on Day 1 at 4 °C, Hvelf3 plants had significantly higher levels of
PRR73 when compared to WT and Bowman (ppdh1), which suggests that on transition to
colder conditions, the elf3 mutation has an effect on PRR73 expression. Upon cold acclima-

210 Chapter 5
tion, the three barley lines analysed return to original expression levels (detected at 20 °C),
suggesting that cold conditions affect PRR73 expression during temperature transitions ra-
ther than temperature acclimation.
Analysis of AS by HR RT-PCR, using primers spanning most of the PRR73 gene
sequence did not detect any highly significant cold-dependent AS events (Appendix
B10.2). In different temperatures analysed here, retention of PRR73 introns 3, 4, 5, 6 and 7
and alt 3’ ss E2 were related to the abundance of FS transcripts. AS analyses for WT,
Bowman (ppdh1) and Hvelf3 plants were very similar (data not shown), indicating ppdh1
and elf3 mutations have no effect on PRR73 splicing. Therefore, PPDH1 and PRR73 behave
very differently in their AS response to low temperature.
Figure 5.19: Total PRR73 transcript levels in the morning (2.5 h after dawn) under six
conditions: 20 °C (Day 7), Day 1 at 4 °C, Day 2 at 4 °C, 4 °C (Day 4), Day 1 at 20 °C and
20 °C (Day 2). Results obtained with four different HR RT-PCR primer pairs (Appendix
B7.4) were considered as technical replicates. Error bars: SEM from 3 biological replicates.
P values represent statistical comparison of data from WT, Bowman (ppdh1) and Hvelf3
plants. *, P < 0.02.

211 Chapter 5
5.4 – Discussion
As well as identifying the gene structure and confirming cyclic expression of barley
clock components (Chapters 3 and 4), it is also important to study the role of the clock
genes and how the clock integrates its timing information into signalling pathways, such as
cold response. Such understanding of the clock function would give further evidence that it
offers competitive advantages in a changing world. Temperature is an important external
cue that entrains plant clocks to local time and environmental conditions, contributing to
increased fitness. This work provides initial evidence that temperature-dependent AS has a
role in the operation and function of the barley circadian clock. We have identified 55 AS
events in barley clock-related genes at a system-wide level, ten of which are significantly
modulated by temperature and analysed in different clock mutant backgrounds. These
analyses also allowed a direct comparison to Arabidopsis clock AS data, and it was possi-
ble to identify conservation of some AS events or of cold-induced AS behaviour (e.g. in-
creased non-functional isoforms at the expense of functional mRNAs) even if specific AS
events are not conserved.
Under the conditions used here, more than half of the alternative transcripts are not
abundant (< 1% of total transcripts), and most of them were IR events. Low abundance of
transcripts with IR events most probably represent partially spliced transcripts in RNA
samples, or they may be abundant under other environmental conditions or tissues not
tested in this work (our analysis is also based on RNA extracted from whole shoots).
5.4.1 – Effect of temperature regulation on the expression of clock genes
Analyses of total HvLHY transcript levels in WT barley plants show a decreased
expression from 100% at 20 °C to 44–65% at 4 °C (Days 1, 2 and 4). In Arabidopsis, tem-
perature affects AtCCA1 and AtLHY expression. When temperature was reduced from 20 to

212 Chapter 5
4°C, CCA1 transcript abundance was higher or similar to that of 20 °C conditions at dawn.
By contrast, decreasing temperature causes a marked reduction in the expression peak of
LHY (Section 5.4.2) (Bieniawska et al., 2008; James et al., 2012a). The similar AtLHY and
HvLHY responses to lower temperature, as opposed to AtCCA1 behaviour, further support
their orthology, as suggested by in silico analyses (Chapter 3).
In Arabidopsis, temperature affects expression of paralogues AtPRR7 and AtPRR3
(James et al., 2012a). When temperature is reduced from 20 to 4°C, the AtPRR7 expression
peak decreases from 100% at 20 °C to 80% at 4 °C (Day 4). Temperature reduction causes
a marked decrease in the PRR3 expression peak from 100% at 20 °C to 35% at 4 °C (Day
4). Analyses of total transcript levels of the barley homologues HvPPDH1 and HvPRR73
carried out here confirm that although they show similar expression behaviour in light and
dark conditions at 20 °C, cold acclimation affected their expression in different ways.
HvPPDH1 expression gradually decreased from 100% at 20 °C to 13% at 4 °C (Day 4),
whereas PRR73 expression has a slight decrease on Day 1 at 4 °C but increased on Day 2
at 4 °C so that its expression is virtually identical between plants acclimated to 20 °C or
4 °C (Day 4) conditions. These results suggest that at the level of expression control upon
cold acclimation HvPPDH1, as opposed to HvPRR73, is similar to AtPRR7 and AtPRR3.
Mutation in the barley clock gene ELF3 affects clock entrainment. Hvelf3 plants are
non-responsive to cold temperature transition, as seen in HvLHY, HvPDH1 and HvPRR73
expression behaviours when plants are transferred from 20 °C to 4 °C. Upon cold acclima-
tion, significant differences were observed in PPDH1 levels among the three barley lines
analysed while LHY and PRR73 expression were unaffected by the elf3 allele. This suggests
that in cold acclimated plants, ELF3 strongly regulates PPDH1 but not LHY or PRR73 ex-
pression. In Arabidopsis, elf3 mutant seedlings are also unable to entrain to thermocycles.
For instance, PRR7 expression in this mutant shows no significant high-temperature induc-

213 Chapter 5
tion (Thines and Harmon, 2010). Therefore, results obtained here for elf3 mutants confirm
previous suggestions (Thines and Harmon, 2010) that the ELF3 clock component is in-
volved in temperature transition responses in plants.
The PPDH1 mutation has no effect on the cold responses of the clock genes LHY
and PRR73. However, significantly different expression between WT PPDH1 and Bowman
ppdh1 on Day 2 and 4 at 4 °C (Figure 5.16) might suggest they have different clock temper-
ature entrainment and compensation behaviours. Arabidopsis prr7 mutants exhibit modest
CCA1, LHY and TOC1 period lengthening under free-running conditions, failing to correct-
ly entrain light and temperature cues (Salomé and McClung, 2005). Therefore, it is likely
that the PPDH1 and PRR7 components are involved in clock temperature responses.
5.4.2 – AS regulation of LHY and PPDH1 in response to temperature
Temperature regulation of AS occurs in clock genes of Drosophila (see Section
1.6.4) and N. crassa (Colot et al., 2005). Additionally, AS of Arabidopsis clock genes CCA1,
LHY, TOC1, PRR3 and PRR7 is strongly affected when plants are transitioned or acclimat-
ed to lower temperatures (James et al., 2012a). Having defined the AS events of clock genes
in barley, this work has also shown that transient or long term low temperature conditions
influence AS of HvLHY and HvPRR37, which are orthologues of the Arabidopsis genes
mentioned above. In discussing the various AS events in clock genes and their response to
low temperature (below), it is important to note that most introns are spliced efficiently
such that the AS behaviour is not caused by a transient reduction in general splicing activi-
ty on cooling. Of all AS events described for the AtCCA1, AtLHY and HvLHY homologues,
some are significantly temperature dependent. Both LHY orthologues have AS events in
their 5’ UTR that add uORFs, which increase under cold conditions. In Arabidopsis LHY,
this AS event is I1R (James et al., 2012a), while in barley eight different transcript isoforms

214 Chapter 5
are observed (Figure 5.12). However, as mentioned previously, it is not possible to identify
a conservation of specific AS events in the 5’ UTR. Nevertheless, these 5’ UTR AS
isoforms increase considerably on Day 1 at 4 °C, representing 50% (AtLHY) (James et al.,
2012a) and 38.5% (HvLHY) of total transcripts.
Regarding the coding region at or near the MYB domain of AtLHY, AtCCA1 and
HvLHY, there are temperature-dependent AS events, but these do not always have a con-
served position within the gene structure or similar temperature responses among the
homologues. For example, I4R of AtCCA1, which occurs immediately after the MYB-
encoding region, decreases in cold conditions (Filichkin et al., 2010; James et al., 2012a). In
contrast, I4R of HvLHY, which is present immediately before the MYB-encoding region,
has a strong and transient increase in low temperature conditions. In an example where
there appears to be some conservation, both PTC-containing alternative exons E5a and
E6a of AtLHY and HvLHY, respectively (occurring in the long intron immediately after the
MYB-encoding region), are included in plants acclimated to cold. However, in plants ac-
climated to cold, AtLHY E5a is present at much higher levels (20% of total transcripts)
when compared to HvLHY E6a (0.7% of total transcripts).
The function of AS events in LHY regulation is particularly clear in Arabidopsis.
AtLHY transcripts and protein levels are reduced upon cooling, while the LHY promoter
strength is not affected on Day 1 at 4 °C. Therefore the mechanism by which LHY expres-
sion is reduced is not through transcriptional regulation. Interestingly, the proportion of
LHY AS transcripts that are non-functional (which mostly contain I1 and E5a) increased,
while functional mRNA and LHY protein levels decrease (James et al., 2012a). These tran-
scripts are NMD-sensitive, which explains the reduced LHY transcript levels upon cooling.
In summary, AtLHY expression is regulated in the cold post-transcriptionally by AS events
that produce non-functional transcripts that are degraded by NMD (James et al., 2012a). In

215 Chapter 5
barley, I4R and I8R increase substantially at 4 °C and are unable to code for full-length
LHY protein. The effects of AS in the 5’ UTR and whether they are also NMD-sensitive is
currently unknown.
Arabidopsis PRR7 and the barley orthologue HvPPDH1 (HvPRR37) undergo exten-
sive cold-dependent AS splicing (James et al., 2012a); this study) but the AS events are not
conserved. The abundance of AS PRR7 transcripts in which exon 4 is skipped (E4S) or in-
tron 3 is retained (both are mutually exclusive events) are substantially but transiently in-
creased on Day 1 at 4 °C, reaching more than 50% of total transcripts. These transcripts
introduce PTCs and E4S, in particular, is targeted for NMD (James et al., 2012a). In con-
trast, two barley alternative PTC-containing PPDH1 transcripts (alt 5’ ss I6 adding 50 nt
and I5R) are reduced from 7% of total transcripts at 20 °C to barely detectable levels on
Day 1 at 4 °C. Furthermore, HvPPDH1 had three abundant AS transcripts with one or both
of two in frame AS events: alt 5’ ss I6 adding 45 nt (coding for 15 amino acids) and alt 3’ ss
E6 (-6 nt, coding for 2 amino acids). All are significantly reduced upon cold acclimation,
and in particular, transcripts with alt 5’ ss I6 (+ 45 nt) is reduced almost ten times from 20
°C to 4 °C (Day 4), which affects the abundance of protein-coding PPDH1 isoforms. Alt-
hough is not possible to predict whether the presence or absence of these 15 amino acids
affects PPDH1 function, there is an overall reduction in PPDH1 transcripts. Therefore,
AtPRR7 AS events have a large effect on reducing the abundance of functional PRR7 in the
first day after transition to cold conditions, whereas HvPPDH1 AS has increased PPDH1
protein diversity at ambient temperatures, which is greatly reduced at 4 °C. The barley
HvPPDH1 paralogue, HvPRR73, had no significant AS events, while the Arabidopsis
AtPRR7 paralogue, AtPRR3, shows three AS events with modest effects on PRR3 gene ex-
pression (James et al., 2012a).

216 Chapter 5
5.4.3 – AS regulation of the barley clock
Recently, AS has been suggested to play a much more widespread, complex and
quantitatively important role in the plant clock than previously thought (James et al.,
2012a). Studies in barley carried out here and in Arabidopsis (Filichkin et al., 2010; James
et al., 2012a; Seo et al., 2012) suggest that AS of clock genes is sensitive to temperature in
the normal ambient range (between 20 °C and 4 °C), and plays a significant role in the en-
trainment of the plant circadian clock to temperature. This is shown in barley by the
marked transient and long-term accumulation of uORF-containing and non-productive
LHY transcripts and decrease in putative PPDH1 protein-coding isoforms following cold
treatment. These results were obtained by using the HR RT-PCR approach that analyses
dynamic changes in the ratio of FS and alternatively spliced transcripts during temperature
changes. This HR system is an efficient approach that compares AS events to the total lev-
el of mRNAs from many different samples (Simpson et al., 2008; James et al., 2012a).
The pattern of accumulation of HvLHY and HvPPDH1 AS transcripts varies, and
similar variation has been described for Arabidopsis clock genes (James et al., 2012a). As
mentioned above for HvLHY, some events become abundant only on Day 1 at 4 °C but are
barely detectable in plants acclimated to 20 °C or 4 °C. Other events, such as the alt 5’ ss I6
(+ 45 nt) in HvPPDH1, change when plants become acclimated to one temperature after
being shifted from another, while others, such as those in HvPRR73 and HvGI, do not
change in their relative abundance. Since some barley AS events comprise at least 10 to
70% of total transcripts, under some conditions, they are likely to be of physiological im-
portance. In fact, since alternative transcripts can represent more than 30% of the total for
some genes, conclusions based on measurements of total transcript by traditional microar-
rays or qPCR must be treated with caution (James et al., 2012a). Such abundant AS events
in barley clock genes involved IR and alternative splice sites, which are also found in Ara-

217 Chapter 5
bidopsis clock genes (James et al., 2012a). In Arabidopsis, the majority of AS events intro-
duce PTCs, leading to non-productive mRNAs (James et al., 2012a). In barley clock genes,
there are AS events introducing PTCs, as well as alteration of uORF (which may affect
translation or stability of the mRNA) and an increase in the mRNA protein-coding capaci-
ty (e.g. PRR37 in-frame alternative mRNAs).
uORF- and PTC-containing transcripts can trigger NMD, as has been described for
Arabidopsis clock gene LHY and PRR7 (James et al., 2012a) or can be immune to NMD,
which is the case for most IR transcripts (Kalyna et al., 2012). Although a great deal of
progress has been made on characterising the NMD system in Arabidopsis (Kalyna et al.,
2012) little is known about how NMD function in barley (Gadjieva et al., 2004). Neverthe-
less, the factors which determine the fate of different plant uORF- and PTC-containing
transcripts are complex and, particularly for uORFs, poorly understood and further re-
search is still needed to define this system. However, some rules have been established on
the impact of plant uORFs and PTCs based on the behaviour of a small number of Ara-
bidopsis genes or artificial constructs (Kalyna et al., 2012). For example, the NMD ma-
chinery has different efficiency rates in degrading uORFs and PTC-containing transcripts
depending on the features of the target.
Transcripts with long 3’ UTRs (> 350 nt) or with PTCs with downstream splice
junctions or with uORFs (coding for more than 30 amino acids or overlapping functional
ORF) are likely to be targets of NMD in Arabidopsis and they can be generated by AS
events that add PTC/uAUG. With regard to the detection and fate of the barley AS tran-
scripts identified here, some contain classic NMD features (PTC before splice junctions),
some are intron retentions (presumably immune to NMD) and others contain uORFs
whose function is difficult to predict. In many cases, the PTC-containing transcripts are in
low abundance at 20 °C and 4 °C. If such transcripts are efficiently degraded by NMD,

218 Chapter 5
they may, in fact, represent a significant proportion of transcripts which are under-
represented. In addition, transcripts containing introns or intron fragments are likely rec-
ognized as aberrant prior to nuclear export by virtue of proteins binding to the UA-rich
intron sequences and therefore do not connect with the NMD machinery (Kim et al.,
2009). This may explain the high abundance of IR events detected in HvLHY (e.g. I4R)
upon transition to cold. If we assume that intron retaining transcripts in barley are not de-
graded by the NMD pathway, the fate of cold-dependent non-functional IR AS transcripts
(e.g. HvLHY containing I4 and PRR37 containing I1), may be different from other PTC-
containing transcripts but, ultimately, they will all affect protein levels. Additional efforts
(e.g. analysis of barley UPF mutants or cycloheximide treatments) are necessary for com-
prehensive identification of all AS events in the barley circadian clock genes.
It is also possible that PTC-containing transcripts can produce truncated proteins,
as suggested for Arabidopsis CCA1 (Seo et al., 2012). However, this paper suggests the pro-
duction of a C-terminal peptide which would require the ribosome to ignore the authentic
translation start AUG and many other AUGs or reinitiate translation (e.g. through an in-
ternal ribosome entry site), which is unlikely (Meijer and Thomas, 2002; Kozak, 2005).
Lastly, alternative protein isoforms are particularly interesting for LHY and PPDH1, since
they can form homo- and hetero-dimers with different protein isoforms (Ito et al., 2003).
The different combinations are likely to have different properties, such as activity and sub-
strates, and it will be interesting to investigate the relative functions of the abundant in
frame isoforms of PPDH1. Overall, the data presented here cast additional light on the op-
eration of the barley circadian clock and strongly suggest that AS provides one mechanism
through which the barley clock is regulated. Transient and long-term AS events have been
observed during shifts from 20 to 4 °C. However, the extent and duration of temperature
changes required to trigger changes in AS need to be determined.

219 Chapter 6
Chapter 6. General discussion and future work
It is an interesting time in the study of plant clocks. A great deal of progress has
been made over the last 20 years in understanding Arabidopsis clock architecture and func-
tion. In recent years, some of this knowledge has been extended to other plant species such
as rice, moss, barley and canola (Murakami et al., 2007; Holm et al., 2010; Faure et al.,
2012; Lou et al., 2012). In particular, characterisation of the circadian clock in crop species
advances the understanding of clock control over many phenotypic traits, which is espe-
cially important in light of global climate change. The work reported here is an example of
how studies on different concepts in plant genetics and physiology in Arabidopsis can facil-
itate knowledge translation to barley, a crop plant of high economic value in Scotland.
Here, I have identified 21 clock-related homologues, determined their expression profiles
in diurnal and free-running conditions and examined the effects of mutations in HvPPDH1
and HvELF3 genes. Additionally, I have found evidence, for the first time, that AS has a
role in the operation and functions of the barley circadian clock, which ultimately may of-
fer new understanding of traits in barley, such as earliness, providing a new information
for barley improvement.
6.1 – Evolution of clock genes
“Nothing in biology makes sense except in the light of evolution” (Dobzhansky,
1973). This concept, alongside the ‘artificial’ selection of crop species since domestication,
motivates studies of the evolution of clock genes. Within angiosperms, in both monocots
and dicots, a strong similarity exists among their clock components, architecture, and func-

220 Chapter 6
tions (Song et al., 2010). Evolutionary theory dictates that if those similarities were due to a
process of descent, with modifications, from common ancestors then these clock systems
have evolutionary homology (Prosdocimi et al., 2009). To test this, several investigations
have used different approaches, such as phylogenetic analysis, studies of segmental dupli-
cation and functional gene assessments through gene expression studies and complementa-
tion tests (suggesting conserved biochemical function). For example, knockdown and
overexpression of LHY, ELF3 and GI genes from Lemna gibba plants indicated these genes
are functionally conserved with Arabidopsis and rice genes (Serikawa et al., 2008).
Here we propose a common evolutionary genetic history that gave rise to both bar-
ley and Arabidopsis clock genes from a common ancestor (Figure 6.1). This hypothesis is
based on experiments described in Chapters 3–5 (robust in silico searches, phylogenetic
analysis, gene expression studies under light/dark, LL, and different temperature condi-
tions and AS research of different barley clock genes), combined with careful comparisons
with related investigations published elsewhere. Homologues of the core clock components
LHY, TOC1, PRR7 (PRR37 in monocots), PRR9/5, GI, LUX, ELF3, FKF1 and ZTL and the
clock-related genes ELF4-like3, COL1, FT and GRP7 were present in the common ancestor
of monocots and dicots. Therefore, about 60% of barley clock genes are true orthologues of
the Arabidopsis clock genes. TOC1, FKF1, LUX and GI remain as a single copy for most
monocots and dicots. One exception is AtBOA, a duplicated copy of AtLUX. Of the core
Arabidopsis clock genes, CCA1, CHE and ELF4 are absent in barley. ELF4, in particular,
was present in the ancestor but has been lost in monocots. This particular observation rais-
es the question of a similar situation occurring in dicots, i.e. a clock component present in
monocots that does not exist in dicots. In this case, our analysis would not have identified
such components because it depends on previous knowledge from Arabidopsis. Therefore,
it is important to bear in mind that, although the approach carried out here is systematic,

221 Chapter 6
additional efforts (e.g. forward genetics) are necessary for comprehensive identification of
all circadian clock components in barley.
Figure 6.1: Schematic diagram of the proposed evolutionary history of circadian clock
components of barley (yellow background), Arabidopsis (green background) and their pu-
tative common ancestor (red background). Independent duplication events are represented
by fine diagonal lines. Diagram at the bottom right is related to the main diagram and it
refers to the numbers of genes from each group.
An additional interesting observation relating to clock genes in angiosperms is the
occurrence of multiple independent gene duplication events in both monocot and dicot
ancestors, generating paralogues. Paralogues could be functionally equivalent to missing
genes (e.g. ELF4-likeA commented in Section 4.4.3.4) or deviate in terms of func-

222 Chapter 6
tion/regulation. ELF3, ELF4-like3, FT, CO/COL1, GRP7, ZTL, PRR7 and PRR9/5 were
independently duplicated and maintained in both monocots and dicots, which is an inter-
esting example of convergent evolution. One exception of such maintenance which is
worth mentioning is that the ancestor of Pooideae species (Brachypodium and Triticeae,
Chapter 3) lost the duplicated copy of ELF3. Convergent evolution also interfered with our
phylogenetic analysis and the detection of one-to-one gene homology. For example it re-
mains unknown which monocot gene, PRR95 or PRR59, is the monocot orthologue of
PRR9/5 and vice-versa.
A large proportion of gene duplication events are generated by whole genome du-
plication (WGD) events (Paterson et al., 2010). The evolution of angiosperm genomes has
been characterised by WGD events, typically accompanied by considerable gene loss
(Paterson et al., 2010). However, plants have preferentially retained clock genes, which is
consistent with the gene dosage hypothesis (Lou et al., 2012). This hypothesis predicts that
genes encoding proteins engaged in dose-sensitive interactions, such as transcriptional or
signalling networks, cannot be reduced back to single copies once all interacting partners
are simultaneously duplicated in a WGD because the imbalance associated with this loss is
likely to decrease fitness (Schnable et al., 2012). Additionally, paralogues could also deviate
in terms of function or regulation. An example of this sub-functionalisation is the PRR3
gene in Arabidopsis, which is expressed in the vasculature (Para et al., 2007), while other
PRRs exhibit widespread expression. An excellent example of WGD coupled with reten-
tion of dose-sensitive duplicated clock genes has recently been reported for the evolution of
Brassica rapa (Lou et al., 2012). In their work, it is suggested that such phenomena have
permitted the evolution of increasingly complex circadian clock mechanisms (Lou et al.,
2012). Clock complexity probably allowed for increased entrainment efficiency and tem-

223 Chapter 6
poral regulation/anticipation of output pathways (Tauber et al., 2004), which has contrib-
uted to adaptation of plants to different environments.
6.2 – The framework of plant circadian clocks
Circadian clock components and their function between monocots and dicots start-
ed to diverge around 140 million years ago (Chaw et al., 2004; Moore et al., 2007). Addi-
tionally, certain species such as crops have been under ‘artificial’ selection during plant
domestication and breeding, which raises the question of whether crops have evolved clock
systems similar to Arabidopsis and how critical their circadian clock component are for
cultivation. As mentioned above, homologues of most Arabidopsis clock genes exist in
monocots, although not all components are present, for example, CCA1. Recent studies of
the function of some clock genes in monocots have provided us with some clues to help
understand the general roles of plant circadian clocks (Song et al., 2010).
The circadian clock is so fundamental to most organisms that disruptions in clock
rhythm can cause major disadvantages, such as cancer and reduced fitness (Dodd et al.,
2005; Dubrovsky et al., 2010; Maury et al., 2010; Shi et al., 2013). In contrast, mutations in
clock genes have been selected for during plant domestication and breeding because of the
phenotype which they generate. For example, mutations in barley PPDH1 and ELF3 affect
flowering time (Chapter 4) and have extended the geographic range where barley is grown
(Turner et al., 2005; Zakhrabekova et al., 2012). Winter barley plants, the ancestral pheno-
type, require vernalisation and show strong promotion of flowering in response to LDs. In
contrast, spring barley plants (ppdh1 reduced function) lack vernalisation requirements and
respond less to photoperiod, taking longer to flower under long-day condition (LD), which
is an advantage in long growing seasons, as in Western Europe and much of North Ameri-
ca. Such reduced response to photoperiod allows spring-sown plants to extend the period

224 Chapter 6
of vegetative growth and produce more biomass, and consequently, higher yields (Turner
et al., 2005). In another example, loss of HvELF3 function disrupts the barley clock but
provides advantages in other circumstances. Northern environments have short growing
seasons, and plants with early flowering behaviour, such as Hvelf3 plants, are better
adapted to these conditions. Additionally, these environments have long day lengths,
which can exceed 20 h light in one day. Hvelf3 plants have reduced gating of certain physi-
ological processes, such as the expression of HvCABa (Chapter 4), which could potentially
increase light harvesting and photosynthesis and increase biomass accumulation under
very long days. Therefore, these analyses of barley elf3 mutants show that in some circum-
stances, there are benefits from the severe loss of circadian clock function (Faure et al.,
2012; Zakhrabekova et al., 2012). This idea is corroborated by a parallel study on reindeer
(Rangifer tarandus) from Scandinavia, which do not show circadian organization of behav-
iour under constant conditions (van Oort et al., 2005). This ‘arrhythmic’ behaviour was
caused by reduced rhythmicity of two key clock genes (Bma1 and Per2) (Lu et al., 2010b).
Such results lead to the conclusion that both plants and animals from high latitudes are
better adapted by reducing their dependency on the rhythms of the circadian clock. This
raises the question of what other circadian clock mutations can improve crop yield even
further before plant performance is compromised? This will be an interesting area for fu-
ture research (Trevaskis, 2012).
Additional studies suggest that monocot crops have evolved clock systems that are
different from Arabidopsis in some respects. For example, PRR7 has a moderate contribu-
tion to the determination of flowering time in Arabidopsis and was not significantly asso-
ciated with flowering time in natural populations (Ehrenreich et al., 2009; Brachi et al.,
2010). In contrast, the monocot orthologue PRR37 is the major determinant of photoperi-
odic flowering (Turner et al., 2005; Murphy et al., 2011). Additionally, GI knockdowns in

225 Chapter 6
L. gibba almost completely abolish the circadian rhythm, whereas Arabidopsis gi loss-of-
function mutants have a much milder effect on the clock. Also, activation of expression of
homologous FT-like genes by day length (photoperiodic response) is reversed in long-day
plants compared with short-day plants (Andrés and Coupland, 2012). Therefore, some
homologues of Arabidopsis clock-related genes have (slightly) distinct roles in monocots.
Nevertheless, most clock orthologues identified in monocots and dicots have a
strong similarity in circadian behaviour, also evidenced by the work carried out here.
Analysis of circadian behaviour using the HR RT-PCR approach suggests that the circadi-
an expression profiles of barley clock-related genes are largely similar to those of their Ara-
bidopsis counterparts. Similar conclusions were obtained with expression analysis in rice
(Murakami et al., 2007). Furthermore, in their work, heterologous overexpression of both
OsTOC1 and OsZTL in Arabidopsis caused a similar arrhythmic clock phenotype to the
overexpression of AtTOC1 and AtZTL, respectively (Murakami et al., 2007). Moreover, Os-
PRR1 and OsPRR37 rescue the clock phenotypes of toc1 and prr7 mutants in Arabidopsis,
respectively (Murakami et al., 2007). Even the protein regulation of LHY is likely con-
served in rice, as OsLHY protein also accumulates under light (Ogiso et al., 2010). Similar
heterologous transfection analysis in L. gibba with overexpression and RNAi constructs of
LHYs and ELF3 revealed that these genes have functions similar to their Arabidopsis coun-
terparts (Serikawa et al., 2008). Additionally, the expression profiles of CO homologues are
similar in dicots and monocots, including barley (Chapter 4), suggesting that the molecular
mechanisms of transcriptional regulation of homologous COs may also be highly con-
served among plants (Song et al., 2010). Thus, the results obtained from studies using sev-
eral monocots suggest that both dicots and monocots possess, not surprisingly, molecular
circadian clocks with many similarities.

226 Chapter 6
An interesting question will be whether and how well the current Arabidopsis clock
computational model will be applicable to barley. Data like that generated here will be im-
portant in addressing this. As yet, there is no computational model for the barley clock, but
in an attempt to pull our observations together, we propose a framework of the barley
clock (Figure 6.2). This hypothesis is superimposed on the knowledge of the Arabidopsis
circadian clock and is based on experiments described in Chapters 3–5 combined with
careful comparisons with related investigations published elsewhere. In summary, our cur-
rent understanding of the circadian clock suggests considerable conservation in many plant
species. However, the function of clock genes and the molecular architecture of clocks in
barley and other plants other than Arabidopsis are just beginning to be understood. Further
work is needed to truly unravel the molecular clock systems in all plants.

Figure 6.2: Schematic diagram of the 24-hour clock in A) Arabidopsis (12 h light and 12 h dark, natural conditions) and B) barley (LDs).
Feedback loops of the core clock genes are represented in the centre. Full lines represent transcriptional feedback loops, whereas dashed
lines represent post-translational regulation. Green lines are for activation, while red lines are for repression. For simplicity, the AtPRR3
and AtFKF1 components were not included in the Arabidopsis regulatory network. Expression peaks of clock genes are represented at dif-
ferent times of the day (information taken from Nakamichi, 2011, for Arabidopsis and Chapter 4 for barley). Several physiological process-
es, indicated on the periphery of the clock, are regulated by clock genes (in brackets), allowing them to occur at the correct time of day.
A) B)
227
C
hapter 6

228 Chapter 6
Phenotypic studies and genetic analyses of circadian behaviour and cold responses
of plant clock genes, including the work described here, were mostly carried out under con-
trolled environmental conditions in growth chambers. However, plants have evolved to
survive in habitats with more complex environmental conditions. In nature, for example,
there is constant variation in temperature and day length, gradual light changes between
day and night, as well as differences in light intensity and humidity over a day, not to men-
tion biotic and abiotic stresses. Therefore, the artificial conditions used in most laboratory
experiments provide a less authentic interpretation of the adaptive significance of the re-
sults and are likely to produce data incongruent with those of natural environments. For
example, field experiments carried out with Arabidopsis mutants impaired in different sig-
nalling pathways demonstrated that their flowering time behaved differently from expected
under laboratory conditions, mostly because it depended strongly on germination time
(Donohue et al., 2005; Wilczek et al., 2009; Andrés and Coupland, 2012). Furthermore,
analyses of nearly 20,000 Arabidopsis plants in such field conditions using a genome-wide
association (GWA) study combined with traditional linkage mapping detected the genetic
bases underlying natural variation in flowering time. This study suggested that TWIN SIS-
TER OF FT (TSF) and COL1 contribute more strongly to flowering time variation than
could be predicted from experiments under greenhouse conditions (Brachi et al., 2010).
More recently, clock studies in Drosophila also revealed that several key laboratory-based
assumptions about Drosophila circadian behaviour are not supported by natural observa-
tions. Under laboratory light/dark conditions, flies show crepuscular locomotor activity in
anticipation to light on and off signals (Helfrich-Förster, 2001). This bimodal activity has
helped define the morning (M) and evening (E) oscillators in the Drosophila brain (Stoleru
et al., 2004a). However, analyses of fly locomotor rhythms in the wild have revealed they
are diurnal rather than crepuscular and pointed to a third major locomotor component in

229 Chapter 6
addition to M and E, termed ‘A’ (afternoon) (Vanin et al., 2012). This A locomotor com-
ponent is not observed in artificial laboratory conditions and characterises an afternoon
‘siesta’. This ‘siesta’ was associated with temperature-sensitive splicing of the per 3’ UTR
(mentioned in Section 1.6.4). In natural conditions, however, levels of per 3’ UTR splicing
have no significant association to locomotor behaviour or time of the day, arguing against
a significant role for per 3’ UTR splicing in this natural phenotype (Vanin et al., 2012). In-
terestingly, these natural conditions phenotypes can be observed in the laboratory by using
realistic temperature and light cycle simulations. Therefore, results of phenotypic and ge-
netic studies of barley clock genes, including those obtained here, should be confirmed un-
der simulated natural conditions or field conditions in order to clarify the underlying mo-
lecular functions of the plant clock under natural states.
6.3 – Why temperature-dependent alternative splicing (AS) of plant clock
genes?
As sessile organisms, plants depend on the perception and appropriate response to
external cues, both for their survival and for the regulation of key developmental events.
The ability to cope with extreme temperature conditions is particularly interesting in light
of the global climate change that is to affect both agricultural and non-agricultural plant
communities (Thuiller et al., 2005; McClung and Davis, 2010). However, there is little
knowledge on the mechanisms of how plants sense and adapt to temperature variations.
There is no doubt that plants rely on temperature to alter metabolic rates but they also ac-
tively respond to it (Penfield, 2008). Additionally, predicting changes in temperature pro-
vides increased fitness to plants, and the circadian clock is required for this process
(McClung and Davis, 2010). Several sources of evidence confirm that a mutual interaction
between temperature and the clock are important. For example, the clock is involved in

230 Chapter 6
gating the low-temperature (LT) induction of downstream ‘cold-response’ genes, thus con-
ferring rhythmic cold responses (Fowler et al., 2005). Furthermore, it has been shown that
GI mRNAs expression is elevated at low temperatures, and that gi mutants are defective in
freezing tolerance (Cao et al., 2005a). Studies in barley suggest that the expression of LT-
induced genes is optimised under SD conditions through regulation by the photoperiod
pathway (Fowler et al., 2001; Mahfoozi et al., 2006). Two additional examples of essential
temperature and clock interactions are temperature entrainment (resetting the clock to
temperature changes) and temperature compensation (ensuring robust clock rhythmicity)
(Section 5.1.2). A key aspect common to all situations mentioned above is that the temper-
ature must be perceived by the clock, but the identity of this initial mechanism, also known
as the plant thermometer, remains unknown. It is likely that there are several plant ther-
mometers transducing temperature signals to the circadian clock. Calcium oscillations, as
well as phytochromes themselves, may integrate temperature and circadian information
(Hotta et al., 2007; Penfield, 2008). Increasing evidence suggests that temperature-
associated AS is functionally important in the clock (Chapter 5 and James et al., 2012a).
Whether AS is another putative plant thermometer, or is downstream of it, is a subject for
further research. However, given the increasing association of AS to abiotic responses
(Kazan, 2003; Iida et al., 2004; Duque, 2011; James et al., 2012b; Mastrangelo et al., 2012),
it is likely that temperature-dependent AS is integrating temperature sensing with down-
stream processes (James et al., 2012b). In that event, AS in the clock may help to synchro-
nise temperature cues with downstream processes in both temperature entrainment and
temperature compensation mechanisms (James et al., 2012a; James et al., 2012b).
AS is the major mechanism generating structural and functional diversity of gene
products in higher eukaryotes. In plants, AS promotes plant genome plasticity and versatil-
ity through regulation of the expression of key multi-exon genes, such as clock genes

231 Chapter 6
(James et al., 2012a; Mastrangelo et al., 2012). The functional meaning of AS in response to
environmental changes has started to be defined for many clock genes. AS of clock genes
mostly modulates the levels of functional and translatable mRNAs (e.g. reduced LHY lev-
els upon transition to cold observed here and by James et al., 2012a). Additionally, here we
report AS events increasing protein-coding capacity of the core clock gene PPDH1 (Chap-
ter 5). It is noteworthy that it is not clear if splicing variants occur in the same cell or tissue
types, and further work is necessary to clarify this issue. Also, although many of the tem-
perature-dependent AS events in clock genes have been analysed at extreme temperatures,
changes as small as 4°C also have a significant effect on a range of AS events in Arabidop-
sis (James et al., 2012a; Staiger and Brown, 2013). Plants can experience a multitude of
temperature changes in 24 h period. We know that AS of clock genes can respond dynam-
ically (and with different dynamics) but do not know how multiple cues are integrated into
clock rhythm and downstream processes. Some AS regulation in core clock genes is con-
served between barley and Arabidopsis. Nevertheless, non-conserved events indicate that
AS likely represents an evolutionary strategy that rapidly increases genome plasticity and
develops new clock gene functions, in addition to other mechanisms like gene duplication
(Mastrangelo et al., 2012).
The changes in clock AS may reflect features of the pre-mRNAs themselves (e.g.
secondary structure) or temperature-dependent changes in levels and activity of trans-acting
splicing factors or other factors (James et al., 2012a). Our knowledge of the splicing factors
that control alternative splicing of circadian clock genes in a temperature-sensitive manner
is very poor and only a few studies have uncovered such links. Wang et al. (2012) suggest
the involvement of a splicing factor, named SKIP, in regulating the alternative splicing of
circadian clock genes in a temperature-sensitive manner. Additionally, the PRMT5 and
STIPL1 genes in Arabidopsis are involved in the correct splicing of PRR9 (Sanchez et al.,

232 Chapter 6
2010; Jones et al., 2012), and examination of all PRMT5 and STIPL1 targets will be need-
ed to assess whether they modulate any other AS events found in plant clocks or whether
they are involved in the modulation of AS during temperature changes. Knowledge of
splicing factors and their binding sites would be invaluable in deciphering the regulation of
LT AS and allow an assessment of variation in AS in different lines.
AS may fine-tune expression of genes in response to changing environmental cues.
Splicing and AS depends on sequence elements in the pre-mRNA and the interaction of
trans-acting factors which bind to these cis-elements to define where the spliceosome as-
sembles. Mutation and natural variation in gene sequences can affect splice site choice or
efficiency of splicing providing expression variation which can affect fitness. The wide-
spread nature of AS and the effect that subtle sequence changes can have in gene expres-
sion illustrates how AS is likely to have contributed significantly to plant adaptation. A
future challenge will be to link genomic SNPs to integrated transcription/AS data or pro-
tein isoform production to phenotypic variation. Quantitative RNA-seq combined with
genome-wide association mapping may identify key functional AS variation. The identifi-
cation of clock gene regulation through AS in plants, combined with future experiments in
natural conditions, may be used as candidates for plant improvement, which can be
achieved by, for example, selecting genotypes with superior performance under adverse
environmental conditions.
6.4 – Conclusions
Genomic sequences of 21 putative barley homologues of Arabidopsis core circadian
clock genes and selected associated genes were identified. 60% of barley clock genes
are true orthologues of Arabidopsis clock genes. Paralogues were generated by multi-
ple independent gene duplication events in both monocot and dicot ancestors.

233 Chapter 6
Circadian behaviour under light/dark and free-running conditions suggests that the
circadian expression profiles of the putative barley clock-related genes are largely simi-
lar to those of other plants.
Allelic differences in the barley PPDH1 and ELF3 clock genes affect plant responses to
photoperiodic flowering and, consequently, biomass and yield. The ppdh1 allele delays
flowering under LD. In contrast, the Hvelf3/ppdh1 double mutant is insensitive to pho-
toperiod and plants flower considerably earlier under SD and LD.
Mutations in barley clock genes PPDH1 and ELF3 affect the expression of other clock-
related genes under light/dark and free-running conditions; this effect was also ob-
served with mutations in homologues in other plant species. The elf3 loss-of-function
mutation, in particular, has severe effects on rhythmicity and expression levels of other
clock-related genes.
More than 55 different AS events were detected for a set of eleven barley clock genes.
This initial identification of AS events allowed the establishment of an RT-PCR panel
for studies of barley clock and clock-associated genes.
AS plays a significant role in the responses of the HvLHY and HvPPDH1 to changes in
temperature and is thus an additional mechanism involved in the operation and regu-
lation of the barley clock.
6.5 – Future work
The work carried out here has raised many important questions and new ideas.
There are also some questions that were not fully answered during the work and these
need further investigation. For example, it would be interesting to assess the AS profile of
additional clock genes (e.g. HvTOC1, HvPRR95 and HvPRR59) under LT conditions. Be-
low are more key questions and further experiments:

234 Chapter 6
To identify the functional differences between the putative HvPPDH1 and Hvppdh1
proteins, including the causal ppdh1 ‘reduced-function’ mutation, that affects photo-
period response, it will be necessary to carry out biochemical analysis and comple-
mentation tests. It will be also interesting to investigate the relative functions of the
abundant in-frame isoforms of PPDH1 (reported in Section 5.3.2.2).
It is important to determine whether PTC-containing alternative clock transcripts in
barley are targeted for NMD. In the absence of barley upf mutants, it will be necessary
to perform alternative experiments that prevent mRNA decay through the NMD
pathway, such as cycloheximide (CHX) treatments. We are currently carrying out ex-
periments to study the levels of HvLHY transcripts under LT conditions in CHX treat-
ed leaves.
An important aspect of the analysis of AS in AtLHY was the demonstration that the
LHY promoter strength was not affected by a night at 4 °C such that the decrease in
AtLHY transcripts is most likely due to AS/NMD. Production of promoter::luciferase
transgenics of barley clock and output genes would be very useful in clock and AS
studies.
Plants with both PPDH1 and ppdh1 alleles have identical GI mRNA levels but nothing
is known about GI protein levels, which could affect expression of the CO genes. Fur-
thermore, in the absence of antibodies for all of the barley clock proteins, we are cur-
rently only able to extrapolate effects on protein levels from the relative abundance of
the AS isoforms. Therefore, it would be important to carry out analysis of barley clock
genes at the protein level. In fact, I am currently performing Western blot analysis to
detect HvLHY levels in LT transition and acclimation conditions. This will reveal
whether AS in HvLHY contributes to further decrease in protein levels. However, im-
proving proteomics approaches may be one way to address dynamic expression of
clock genes.

235 Chapter 6
The Nordgen gene bank contains more than 1000 uncharacterised earliness (early
flowering) barley mutants. We would predict that some of these mutants are in other
clock genes. With our current knowledge of the genomic sequence of 21 barley clock-
related genes, we could characterise those early mutants simply by re-sequencing their
21 clock-related genes. This will identify which genes contain mutations in the lines
and will identify allelic variants for each gene. Additionally, expression data of clock
genes in different mutants could ultimately be integrated to generate a mathematical
model for the barley clock.
Circadian behaviour and cold-dependent AS studies of barley clock genes should be
carried out under field conditions in order to confirm the adaptive value of the results
obtained here. Additionally, to further contribute to our understanding of such adapta-
tion, it would be interesting to carry out expression and AS analyses of barley clock
genes (using the HR RT-PCR developed here) in locally adapted landraces and culti-
vars from across geographical clines. This will allow the establishment of a relation-
ship between variation in expression and AS of clock genes and different barley geno-
types. Ultimately, this information will allow us to determine which combinations of
different clock alleles contribute to improved niche adaptation to specific conditions.
The work carried out here can be easily translated to wheat. Therefore, we have facili-
tated putative further AS analyses in polyploid wheat, where there are homeologous
gene copies under differential control.

236 Appendix A
Chapter 7. References
Abbo, S.; Saranga, Y.; Peleq, Z.; Kerem, Z.; Lev-Yadun, S. and Gopher, A. (2009). "Reconsidering domestication
of legumes versus cereals in the ancient near east." The Quarterly Review of Biology 84 (1): 29-50. Akman, O. E.; Watterson, S.; Parton, A.; Binns, N.; Millar, A. J. and Ghazal, P. (2012). "Digital clocks: simple
Boolean models can quantitatively describe circadian systems." Journal of the Royal Society Interface 9 (74): 2365-2382.
Alabadí, D.; Oyama, T.; Yanovsky, M. J.; Harmon, F. G.; Más, P. and Kay, S. A. (2001). "Reciprocal regulation between TOC1 and LHY/CCA1 within the Arabidopsis circadian clock." Science 293 (5531): 880-883.
Alexandrov, N. N.; Troukhan, M. E.; Brover, W.; Tatarinova, T.; Flavell, R. B. and Feldmann, K. A. (2006). "Features of Arabidopsis genes and genome discovered using full-length cDNAs." Plant Molecular Biology 60 (1): 69-85.
Altschul, S. F.; Gish, W.; Miller, W.; Myers, E. W. and Lipman, D. J. (1990). "Basic local alignment search tool." Journal of Molecular Biology 215 (3): 403-410.
Ambrosone, A.; Costa, A.; Leone, A. and Grillo, S. (2012). "Beyond transcription: RNA-binding proteins as emerging regulators of plant response to environmental constraints." Plant Science 182: 12-18.
An, H.; Roussot, C.; Suárez-López, P.; Corbesier, L.; Vincent, C.; Piñeiro, M.; Hepworth, S.; Mouradov, A.; Justin, S., et al. (2004). "CONSTANS acts in the phloem to regulate a systemic signal that induces photoperiodic flowering of Arabidopsis." Development 131 (15): 3615-3626.
Andrés, F. and Coupland, G. (2012). "The genetic basis of flowering responses to seasonal cues." Nature Reviews Genetics 13 (9): 627-639.
Artamonova, I. I. and Gelfand, M. S. (2007). "Comparative genomics and evolution of alternative splicing: the pessimists’ science." Chemical Reviews 107 (8): 3407-3430.
Ashmore, L. J. and Sehgal, A. (2003). "A fly's eye view of circadian entrainment." Journal of Biological Rhythms 18 (3): 206-216.
Baker, C. L.; Loros, J. J. and Dunlap, J. C. (2012). "The circadian clock of Neurospora crassa." FEMS Microbiology Reviews 36 (1): 95-110.
Balakirev, E. S. and Ayala, F. J. (2003). "Pseudogenes: are they "junk" or functional DNA?" Annual Review of Genetics 37: 123-151.
Barash, Y.; Calarco, J. A.; Gao, W.; Pan, Q.; Wang, X.; Shai, O.; Blencowe, B. J. and Frey, B. J. (2010). "Deciphering the splicing code." Nature 465 (7294): 53-59.
Barbosa-Morais, N. L.; Irimia, M.; Pan, Q.; Xiong, H. Y.; Gueroussov, S.; Lee, L. J.; Slobodeniuc, V.; Kutter, C.; Watt, S., et al. (2012). "The evolutionary landscape of alternative splicing in vertebrate species." Science 338 (6114): 1587-1593.
Barclay, J. L.; Tsang, A. H. and Oster, H. (2012). "Interaction of central and peripheral clocks in physiological regulation." Progress in Brain Research 199: 163-181.
Barta, A.; Marquez, Y. and Brown, J. W. S. (2012). Challenges in Plant Alternative Splicing. Alternative pre-mRNA Splicing. S. Stamm, C. Smith and R. Lührmann. Weiheim, Germany, Wiley-Blackwell. 1: 79-91.
Barta, A. and Schümperli, D. (2010). "Editorial on alternative splicing and disease." RNA Biology 7 (4): 388-389. Bazeley, P. S.; Shepelev, V.; Talebizadeh, Z.; Butler, M. G.; Fedorova, L.; Filatov, V. and Fedorov, A. (2008).
"snoTARGET shows that human orphan snoRNA targets locate close to alternative splice junctions." Gene 408 (1-2): 172-179.
Beales, J.; Turner, A.; Griffiths, S.; Snape, J. W. and Laurie, D. A. (2007). "A pseudo-response regulator is misexpressed in the photoperiod insensitive Ppd-D1a mutant of wheat (Triticum aestivum L.)." Theoretical and Applied Genetics 115 (5): 721-733.
Beator, J.; Pötter, E. and Kloppstech, K. (1992). "The effect of heat shock on morphogenesis in barley : coordinated circadian regulation of mRNA levels for light-regulated genes and of the capacity for accumulation of chlorophyll protein complexes." Plant Physiology 100 (4): 1780-1786.
Belostotsky, D. A. and Sieburth, L. E. (2009). "Kill the messenger: mRNA decay and plant development." Current Opinion in Plant Biology 12 (1): 96-102.
Ben-Naim, O.; Eshed, R.; Parnis, A.; Teper-Bamnolker, P.; Shalit, A.; Coupland, G.; Samach, A. and Lifschitz, E. (2006). "The CCAAT binding factor can mediate interactions between CONSTANS-like proteins and DNA." The Plant Journal 46 (3): 462-476.
Benito, J.; Zheng, H.; Ng, F. S. and Hardin, P. E. (2007). "Transcriptional feedback loop regulation, function, and ontogeny in Drosophila." Cold Spring Harbor Symposia on Quantitative Biology 72: 437-444.
Benson, D. A.; Karsch-Mizrachi, I.; Lipman, D. J.; Ostell, J. and Sayers, E. W. (2009). "GenBank." Nucleic Acids Research 37 (Database issue): D26-31.

237 Appendix A Berget, S. M.; Moore, C. and Sharp, P. A. (1977). "Spliced segments at the 5' terminus of adenovirus 2 late mRNA."
Proceedings of the National Academy of Sciences USA 74 (8): 3171-3175. Bhatla, N. (2009, Nov 18, 2009). "Exon-Intron Graphic Maker." http://wormweb.org/exonintronfrom
http://wormweb.org/exonintron. Bhosale, S. U.; Stich, B.; Rattunde, H. F.; Weltzien, E.; Haussmann, B. I.; Hash, C. T.; Ramu, P.; Cuevas, H. E.;
Paterson, A. H., et al. (2012). "Association analysis of photoperiodic flowering time genes in West and Central African sorghum [Sorghum bicolor (L.) Moench]." BMC Plant Biology 12 (1): 32.
Biamonti, G.; Bonomi, S.; Gallo, S. and Ghigna, C. (2012). "Making alternative splicing decisions during epithelial-to-mesenchymal transition (EMT)." Cell and Molecular Life Sciences 69 (15): 2515-2526.
Bieniawska, Z.; Espinoza, C.; Schlereth, A.; Sulpice, R.; Hincha, D. K. and Hannah, M. A. (2008). "Disruption of the Arabidopsis circadian clock is responsible for extensive variation in the cold-responsive transcriptome." Plant Physiology 147 (1): 263-279.
Bird, A. (2002). "DNA methylation patterns and epigenetic memory." Genes & Development 16 (1): 6-21. Bird, A. (2007). "Perceptions of epigenetics." Nature 447 (7143): 396-398. Black, D. L. (2003). "Mechanisms of alternative pre-messenger RNA splicing." Annual Review of Biochemistry 72:
291-336. Blázquez, M. A.; Green, R.; Nilsson, O.; Sussman, M. R. and Weigel, D. (1998). "Gibberellins Promote Flowering
of Arabidopsis by Activating the LEAFY Promoter." The Plant Cell 10 (5): 791-800. Blumenthal, T. (2012). "Trans-splicing and operons in C. elegans." WormBook 20: 1-11. Boikoglou, E.; Ma, Z.; von Korff, M.; Davis, A. M.; Nagy, F. and Davis, S. J. (2011). "Environmental Memory
From a Circadian Oscillator: The Arabidopsis thaliana Clock Differentially Integrates Perception of Photic Versus Thermal Entrainment." Genetics 189 (2): 655-664.
Boise, L. H.; González-García, M.; Postema, C. E.; Ding, L.; Lindsten, T.; Turka, L. A.; Mao, X.; Nuñez, G. and Thompson, C. B. (1993). "bcl-x, a bcl-2-related gene that functions as a dominant regulator of apoptotic cell death." Cell 74 (4): 597-608.
Boisvert, F.-M.; Koningsbruggen, S.; Navascués, J. and Lamond, A. I. (2007). "The multifunctional nucleolus." Nature Reviews Molecular Cell Biology 8 (7): 574-585.
Bonen, L. (1993). "Trans-splicing of pre-mRNA in plants, animals, and protists." The FASEB Journal 7 (1): 40-46. Borthwick, H. A.; Parker, M. W. and Heinze, P. H. (1941). "Effect of photoperiod and temperature on development
of barley." Botanical Gazette 103 (2): 326-341. Boxall, S. F.; Foster, J. M.; Bohnert, H. J.; Cushman, J. C.; Nimmo, H. G. and Hartwell, J. (2005). "Conservation
and divergence of circadian clock operation in a stress-inducible Crassulacean acid metabolism species reveals clock compensation against stress." Plant Physiology 137 (3): 969-982.
Boyd, W. J.; Li, C. D.; Grime, C. R.; Cakir, M.; Potipibool, S.; Kaveeta, L.; Men, S.; Jalal Kamali, M. R.; Barr, A. R., et al. (2003). "Conventional and molecular genetic analysis of factors contributing to variation in the timing of heading among spring barley (Hordeum vulgare L.) genotypes grown over a mild winter growing season." Australian Journal of Agricultural Research 54: 1277-1301.
Brachi, B.; Faure, N.; Horton, M.; Flahauw, E.; Vazquez, A.; Nordborg, M.; Bergelson, J.; Cuquen, J. and Roux, F. (2010). "Linkage and association mapping of Arabidopsis thaliana flowering time in nature." PLoS Genetics 6 (5): e1000940.
Brodsky, J. L. and Skach, W. R. (2011). "Protein folding and quality control in the endoplasmic reticulum: Recent lessons from yeast and mammalian cell systems." Current Opinion in Cell Biology 23 (4): 464-475.
Busch, A. and Hertel, K. J. (2012). "Evolution of SR protein and hnRNP splicing regulatory factors." Wiley Interdisciplinary Reviews: RNA. 3 (1): 1-12.
Cai, X. L.; Wang, Z. Y.; Xing, Y. Y.; Zhang, J. L. and Hong, M. M. (1998). "Aberrant splicing of intron 1 leads to the heterogeneous 5' UTR and decreased expression of waxy gene in rice cultivars of intermediate amylose content." Plant Journal 14 (4): 459-465.
Calvo, S. E.; Pagliarini, D. J. and Mootha, V. K. (2009). "Upstream open reading frames cause widespread reduction of protein expression and are polymorphic among humans." Proceedings of the National Academy of Sciences USA 106 (18): 7507-7512.
Campoli, C.; Drosse, B.; Searle, I.; Coupland, G. and von Korff, M. (2012a). "Functional characterisation of HvCO1, the barley (Hordeum vulgare) flowering time ortholog of CONSTANS." The Plant Journal 69 (5): 868-880.
Campoli, C.; Pankin, A.; Drosse, B.; Casao, C. M.; Davis, S. J. and von Korff, M. (2013). "HvLUX1 is a candidate gene underlying the early maturity 10 locus in barley: phylogeny, diversity, and interactions with the circadian clock and photoperiodic pathways." New Phytologist 199: 1045-1059.
Campoli, C.; Shtaya, M.; Davis, S. J. and von Korff, M. (2012b). "Expression conservation within the circadian clock of a monocot: natural variation at barley Ppd-H1 affects circadian expression of flowering time genes, but not clock orthologs." BMC Plant Biology 12: 97.
Cao, S.; Ye, M. and Jiang, S. (2005a). "Involvement of GIGANTEA gene in the regulation of the cold stress response in Arabidopsis." Plant Cell Reports 24 (11): 683-690.
Cao, S.; Ye, M. and Jiang, S. (2005b). "Involvement of GIGANTEA gene in the regulation of the cold stress response in Arabidopsis." Plant Cell Reports 24: 683-690.

238 Appendix A Carmel-Goren, L.; Liu, Y. S.; Lifschitz, E. and Zamir, D. (2003). "The SELF-PRUNING gene family in tomato."
Plant Molecular Biology 52 (6): 1215-1222. Celotto, A. M. and Graveley, B. R. (2001). "Alternative splicing of the Drosophila Dscam pre-mRNA is both
temporally and spatially regulated." Genetics 159 (2): 599-608. Chacko, E. and Ranganathan, S. (2009). "Comprehensive splicing graph analysis of alternative splicing patterns in
chicken, compared to human and mouse." BMC Genomics 10 (1): S5. Challet, E. (2013). "Circadian clocks, food intake, and metabolism." Progress in Molecular Biology and Translational
Science 119 (105-135). Chang, Y. F.; Imam, J. S. and Wilkinson, M. F. (2007). "The Nonsense-Mediated Decay RNA Surveillance
Pathway." Annual Review of Biochemistry 76: 51-74. Chardon, F. and Damerval, C. (2005). "Phylogenomic analysis of the PEBP gene family in cereals." Journal of
Molecular Evolution 61 (5): 579-590. Chaw, S. M.; Chang, C. C.; Chen, H. L. and Li, W. H. (2004). "Dating the monocot-dicot divergence and the
origin of core eudicots using whole chloroplast genomes." Journal of Molecular Evolution 58 (4): 424-441. Chen, Z. and McKnight, S. L. (2007). "A Conserved DNA Damage Response Pathway Responsible for Coupling
the Cell Division Cycle to the Circadian and Metabolic Cycles." Cell Cycle 6 (23): 2906-2912. Chouard, P. (1960). "Vernalization and its Relations to Dormancy." Annual Review of Plant Physiology 11: 191-238. Chow, B. Y.; Helfer, A.; Nusinow, D. A. and Kay, S. A. (2012). "ELF3 recruitment to the PRR9 promoter requires
other Evening Complex members in the Arabidopsis circadian clock." Plant Signaling & Behaviour 7 (2): 170-173.
Chow, L. T.; Gelinas, R. E.; Broker, T. R. and Roberts, R. J. (1977). "An amazing sequence arrangement at the 5' ends of adenovirus 2 messenger RNA." Cell 12 (1): 1-8.
Cober, E. R. and Morrison, M. J. (2010). "Regulation of seed yield and agronomic characters by photoperiod sensitivity and growth habit genes in soybean." Theoretical and Applied Genetics 120 (5): 1005-1012.
Cockram, J.; Thiel, T.; Steuernagel, B.; Stein, N.; Taudien, S.; Bailey, P. C. and O'Sullivan, D. M. (2012). "Genome dynamics explain the evolution of flowering time CCT domain gene families in the Poaceae." PLoS One 7 (9): e45307.
Colantoni, A.; Bianchi, V.; Gherardini, P. F.; Scalia Tomba, G.; Ausiello, G.; Helmer-Citterich, M. and Ferrè, F. (2013). "Alternative splicing tends to avoid partial removals of protein-protein interaction sites." BMC Genomics 14: 379.
Colot, H. V.; Loros, J. J. and Dunlap, J. C. (2005). "Temperature-modulated alternative splicing and promoter use in the Circadian clock gene frequency." Molecular Biology of the Cell 16 (12): 5563-5571.
Consortium, Potato Genome Sequencing; Xu, X.; Pan, S.; Cheng, S.; Zhang, B.; Mu, D.; Ni, P.; Zhang, G.; Yang, S., et al. (2011). "Genome sequence and analysis of the tuber crop potato." Nature 10 (7355): 189-195.
Consortium, The International Barley Genome Sequencing (2012a). "A physical, genetic and functional sequence assembly of the barley genome." Nature 491: 711-716.
Consortium, The Tomato Genome (2012b). "The tomato genome sequence provides insights into fleshy fruit evolution." Nature 485 (635-641).
Conti, E. and Izaurralde, E. (2005). "Nonsense-mediated mRNA decay: molecular insights and mechanistic variations across species." Current Opinion in Cell Biology 17: 316-325.
Covington, M. F.; Maloof, J. N.; Straume, M.; Kay, S. A. and Harmer, S. L. (2008). "Global transcriptome analysis reveals circadian regulation of key pathways in plant growth and development." Genome Biology 9 (8): R130.
Crosthwaite, S. K.; Dunlap, J. C. and Loros, J. J. (1997). "Neurospora wc-1 and wc-2: Transcription, Photoresponses, and the Origins of Circadian Rhythmicity." Science 276 (5313): 763-769.
Crumbley, C.; Wang, Y.; Kojetin, D. J. and Burris, T. P. (2010). "Characterization of the core mammalian clock component, NPAS2, as a REV-ERBalpha/RORalpha target gene." Journal of Biological Chemistry 285 (46): 35386-35392.
Czechowski, T.; Stitt, M.; Altmann, T.; Udvardi, M. K. and Scheible, W.-R. (2005). "Genome-wide identification and testing of superior reference genes for transcript normalization in Arabidopsis." Plant Physiology 139 (1): 5-17.
Dagdas, Y. F.; Dagdas, G.; Unver, T. and Akkaya, M. S. (2009). "A new ZTL-type F-box functions as a positive regulator in disease resistance: VIGS analysis in barley against powdery mildew." Physiological and Molecular Plant Pathology 74 (1): 41-44.
Danilevskaya, O. N.; Meng, X.; Hou, Z.; Ananiev, E. V. and Simmons, C. R. (2008). "A genomic and expression compendium of the expanded PEBP gene family from maize." Plant Physiology 146 (1): 250-264.
Darnell, J. E. J. (2013). "Reflections on the history of pre-mRNA processing and highlights of current knowledge: a unified picture." RNA 19 (4): 443-460.
Das, R.; Yu, J.; Zhang, Z.; Gygi, M. P.; Krainer, A. R.; Gygi, S. P. and Reed, R. (2007). "SR proteins function in coupling RNAP II transcription to pre-mRNA splicing." Molecular Cell 26 (6): 867-881.
David, C. J. and Manley, J. L. (2010). "Alternative pre-mRNA splicing regulation in cancer: pathways and programs unhinged." Genes & Development 24: 2343-2364.

239 Appendix A De Conti, L.; Baralle, M. and Buratti, E. (2013). "Exon and intron definition in pre-mRNA splicing." WIREs RNA
4 (1): 49-60. Deal, R. B. and Henikoff, S. (2011). "Histone variants and modifications in plant gene regulation." Current Opinion
in Plant Biology 14 (2): 116-122. DeCerbo, J. and Carmichael, G. G. (2005). "SINEs point to abundant editing in the human genome." Genome
Biology 6 (4): 216. Dekkers, B. J. W.; Willems, L.; Bassel, G. W.; van Bolderen-Veldkamp, R. P. M.; Ligterink, W.; Hilhorst, H. W.
M. and Bentsink, L. (2012). "Identification of reference genes for RT-qPCR expression analysis in Arabidopsis and tomato seeds." Plant and Cell Physiology 53 (1): 28-37.
Deng, X.; Gu, L.; Liu, C.; Lu, T.; Lu, F.; Lu, Z.; Cui, P.; Pei, Y.; Wang, B., et al. (2010). "Arginine methylation mediated by the Arabidopsis homolog of PRMT5 is essential for proper pre-mRNA splicing." Proceedings of the National Academy of Sciences USA 107 (44): 19114-19119.
Di Giammartino, D. C.; Nishida, K. and Manley, J. L. (2011). "Mechanisms and consequences of alternative polyadenylation." Molecular Cell 43 (6): 853-866.
Dibner, C.; Schibler, U. and Albrecht, U. (2010). "The Mammalian Circadian Timing System: Organization and Coordination of Central and Peripheral Clocks." Annual Review of Physiology 72: 517-549.
Dinesh-Kumar, S. P. and Baker, B. J. (1999). "Alternatively spliced N resistance gene transcripts: Their possible role in tobacco mosaic virus resistance." Proceedings of the National Academy of Sciences USA 97 (4): 1908-1913.
Dittami, S. M.; Michel, G.; Collén, J.; Boyen, C. and Tonon, T. (2010). "Chlorophyll-binding proteins revisited – a multigenic family of light-harvesting and stress proteins from a brown algal perspective." BMC Evolutionary Biology 10: 365.
Dixon, L. E.; Knox, K.; Kozma-Bognár, L.; Southern, M. M.; Pokhilko, A. and Millar, A. J. (2011). "Temporal repression of core circadian genes is mediated through EARLY FLOWERING 3 in Arabidopsis." Current Biology 21 (2): 120-125.
Dobzhansky, T. (1973). "Nothing in biology makes sense except in the light of evolution." American Biology Teacher 35: 125-129.
Dodd, A. N.; Jakobsen, M. K.; Baker, A. J.; Telzerow, A.; Hou, S. W.; Laplaze, L.; Barrot, L.; Poethig, R. S.; Haseloff, J., et al. (2006). "Time of day modulates low-temperature Ca signals in Arabidopsis." Plant Journal 48 (6): 962-973.
Dodd, A. N.; Salathia, N.; Hall, A.; Kévei, E.; Tóth, R.; Nagy, F.; Hibberd, J. M.; Millar, A. J. and Webb, A. A. R. (2005). "Plant Circadian Clocks Increase Photosynthesis, Growth, Survival, and Competitive Advantage." Science 309 (5734): 630-633.
Dong, G.; Kim, Y.-I. and Golden, S. S. (2010). "Simplicity and complexity in the cyanobacterial circadian clock mechanism." Current Opinion in Genetics & Development 20 (6): 619-625.
Donohue, K.; Dorn, L.; Griffith, C.; Kim, E.; Aguilera, A.; Polisetty, C. R. and Schmitt, J. (2005). "Niche construction through germination cueing: life-history responses to timing of germination in Arabidopsis thaliana." Evolution 59 (4): 771-785.
Dow (2010). "Cereal Crops - Growth Stages For Sprayer Application." http://www.dowagro.com/cerealherbicideperformance/herbicide/growth.htm.
Doyle, M. R.; Davis, S. J.; Bastow, R. M.; McWatters, H. G.; Kozma-Bognár, L.; Nagy, F.; Millar, A. J. and Amasino, R. M. (2002). "The ELF4 gene controls circadian rhythms and flowering time in Arabidopsis thaliana." Nature 419 (6902): 74-77.
Druka, A.; Franckowiak, J.; Lundqvist, U.; Bonar, N.; Alexander, J.; Houston, K.; Radovic, S.; Shahinnia, F.; Vendramin, V., et al. (2011). "Genetic Dissection of Barley Morphology and Development." Plant Physiology 155: 617-627.
Dubouzet, J. G.; Sakuma, Y.; Ito, Y.; Kasuga, M.; Dubouzet, E. G.; Miura, S.; Seki, M.; Shinozaki, K. and Yamaguchi-Shinozaki, K. (2003). "OsDREB genes in rice, Oryza sativa L., encode transcription activators that function in drought-, high-salt- and cold-responsive gene expression." The Plant Journal 33 (4): 751-763.
Dubrovsky, Y. V.; Samsa, W. E. and Kondratov, R. V. (2010). "Deficiency of circadian protein CLOCK reduces lifespan and increases age-related cataract development in mice." Aging (Albany NY) 2 (12): 936-944.
Dunford, R. P.; Griffiths, S.; Christodoulou, V. and Laurie, D. A. (2005). "Characterisation of a barley (Hordeum vulgare L.) homologue of the Arabidopsis flowering time regulator GIGANTEA." Theoretical and Applied Genetics 110 (5): 925-931.
Dunlap, J. C.; Loros, J. J.; Colot, H. V.; Mehra, A.; Belden, W. J.; Shi, M.; Hong, C. I.; Larrondo, L. F.; Baker, C. L., et al. (2007). "A circadian clock in Neurospora: how genes and proteins cooperate to produce a sustained, entrainable, and compensated biological oscillator with a period of about a day." Cold Spring Harbor Symposia on Quantitative Biology 72: 57-68.
Duque, P. (2011). "A role for SR proteins in plant stress responses." Plant Signaling & Behaviour 6 (1): 49-54. Dutertre, M.; Sanchez, G.; Barbier, J.; Corcos, L. and Auboeuf, D. (2011). "The emerging role of pre-messenger
RNA splicing in stress responses: sending alternative messages and silent messengers." RNA Biology 8 (5): 740-747.
Dvir, A. (2002). "Promoter escape by RNA polymerase II." Biochimica et Biophysica Acta (BBA) - Gene Structure and Expression 1577 (2): 208-223.

240 Appendix A Ehrenreich, I. M.; Hanzawa, Y.; Chou, L.; Roe, J. L.; Kover, P. X. and Purugganan, M. D. (2009). "Candidate
gene association mapping of Arabidopsis flowering time." Genetics 183 (1): 325-335. Ellis, J. D.; Llères, D.; Denegri, M.; Lamond, A. I. and Cáceres, J. F. (2008). "Spatial mapping of splicing factor
complexes involved in exon and intron definition." The Journal of Cell Biology 181 (6): 921-934. Ellis, R. H.; Summerfield, R. J.; Roberts, E. H. and Cooper, J. P. (1989). "Environmental control of flowering in
barley (Hordeum vulgare). III. Analysis of potential vernalization responses, and methods of screening germplasm for sensitivity to photoperiod and temperature." Annals of Botany 63: 687-704.
Ender, C.; Krek, A.; Friedländer, M. R.; Beitzinger, M.; Weinmann, L.; Chen, W.; Pfeffer, S.; Rajewsky, N. and Meister, G. (2008). "A human snoRNA with micro-RNA like functions." Molecular Cell 32 (4): 519-528.
FAOSTAT (2011). "Food and Agricultural commodities production." Farré, E. M.; Harmer, S. L.; Harmon, F. G.; Yanovsky, M. J. and Kay, S. A. (2005). "Overlapping and distinct
roles of PRR7 and PRR9 in the Arabidopsis circadian clock." Current Biology 15 (1): 47-54. Fasken, M. B. and Corbett, A. H. (2005). "Process or perish: quality control in mRNA biogenesis." Nature Structural
& Molecular Biology 12 (6): 482-488. Faure, S.; Higgins, J.; Turner, A. and Laurie, D. A. (2007). "The FLOWERING LOCUS T-like gene family in
barley (Hordeum vulgare)." Genetics 176 (1): 599-609. Faure, S.; Turner, A. S.; Gruszka, D.; Christodoulou, V.; Davis, S. J.; von Korff, M. and Laurie, D. A. (2012).
"Mutation at the circadian clock gene EARLY MATURITY 8 adapts domesticated barley (Hordeum vulgare) to short growing seasons." Proceedings of the National Academy of Sciences USA 109 (21): 8328-8333.
Feil, R. and Berger, F. (2007). "Convergent evolution of genomic imprinting in plants and mammals." Trends in Genetics 23 (4): 192-199.
Felsenstein, J. (1978). "Cases in which parsimony and compatibility methods will be positively misleading." Systematic Zoology 27 (4): 401-410.
Felsenstein, J. (1985). "Confidence limits on phylogenies: An approach using the bootstrap." Evolution 39: 783-791. Filichkin, S. A.; Priest, H. D.; Givan, S. A.; Shen, R.; Bryant, D. W.; Fox, S. E.; Wong, W. K. and Mockler, T. C.
(2010). "Genome-wide mapping of alternative splicing in Arabidopsis thaliana." Genome Research 20 (1): 45-58.
Fitch, W. M. (2000). "Homology a personal view on some of the problems." Trends in Genetics 16 (5): 227-231. Flood, R. G.; Moody, D. B. and Cawood, R. J. (2000). "The influence of photoperiod on barley development."
Cereal Research Communications 28 (4): 371-378. Fowler, D. B.; Breton, G.; Limin, A. E.; Mahfoozi, S. and Sarhan, F. (2001). "Photoperiod and temperature
interactions regulate low-temperature-induced gene expression in barley." Plant Physiology 127 (4): 1676-1681.
Fowler, S. G.; Cook, D. and Thomashow, M. F. (2005). "Low temperature induction of Arabidopsis CBF1, 2, and 3 is gated by the circadian clock." Plant Physiology 137 (3): 961-968.
Franckowiak, J. D.; Foster, A. E.; Pederson, V. D. and Pyler, R. E. (1985). "Registration of 'Bowman' barley." Crop Sciences 25: 883.
Franckowiak, J. D. and Lundqvist, U. (2007). BGS 214, Early maturity 8, eam8. Barley Genetics Newsletter. P. Bregitzer, U. Lundqvist and V. C. Blake. 37: 247-250.
Fu, C.; Yang, X. O.; Chen, X.; Chen, W.; Ma, Y.; Hu, J. and Li, S. (2009). "OsEF3, a homologous gene of Arabidopsis ELF3, has pleiotropic effects in rice." Plant Biology 11 (5): 751-757.
Gadjieva, R.; Axelsson, E.; Olsson, U.; Vallon-Christersson, J. and Hansson, M. (2004). "Nonsense-mediated mRNA decay in barley mutants allows the cloning of mutated genes by a microarray approach." Plant Physiology and Biochemistry 42 (7-8): 681-685.
Gallego, M. and Virshup, D. M. (2007). "Post-translational modifications regulate the ticking of the circadian clock." Nature Reviews Molecular Cell Biology 8 (2): 139-148.
Gallie, D. R. (2002). "Protein-protein interactions required during translation." Plant Molecular Biology 50 (6): 949-970.
Galy, V.; Gadal, O.; Fromont-Racine, M.; Romano, A.; Jacquier, A. and Nehrbass, U. (2004). "Nuclear retention of unspliced mRNAs in yeast is mediated by perinuclear Mlp1." Cell 116: 63-73.
Gardner, G. F. and Feldman, J. F. (1980). "The frq locus in Neurospora crassa: a key element in circadian clock organization." Genetics 96 (4): 877-886.
Gassmann, W. (2008). "Alternative splicing in plant defense." Current Topics in Microbiology and Immunology 326: 219-233.
Gendron, J. M.; Pruneda-Paz, J. L.; Doherty, C. J.; Gross, A. M.; Kang, S. E. and Kay, S. A. (2012). "Arabidopsis circadian clock protein, TOC1, is a DNA-binding transcription factor." Proceedings of the National Academy of Sciences USA 109 (8): 3167-3172.
Giri, S. and Prasanth, S. G. (2012). "Replicating and transcribing on twisted roads of chromatin." Briefings in functional genomics 11 (3): 188-204.
Gómez Acuña, L. I.; Fiszbein, A.; Alló, M.; Schor, I. E. and Kornblihtt, A. R. (2013). "Connections between chromatin signatures and splicing." Wiley Interdisciplinary Reviews: RNA. 4 (1): 77-91.
González-Schain, N. D.; Díaz-Mendoza, M.; Zurczak, M. and Suárez-López (2012). "Potato CONSTANS is involved in photoperiodic tuberization in a graft-transmissible manner." The Plant Journal 70 (4): 678-690.

241 Appendix A Goodall, G. J. and Filipowicz, W. (1989). "The AU-rich sequences present in the introns of plant nuclear pre-
mRNAs are required for splicing." Cell 58 (473-483). Goodspeed, D.; Chehab, E. W.; Min-Venditti, A.; Braam, J. and Covington, M. F. (2012). "Arabidopsis
synchronizes jasmonate-mediated defense with insect circadian behaviour." Proceedings of the National Academy of Sciences USA 109 (12): 4674-4677.
Gould, P. D.; Locke, J. C.; Larue, C.; Southern, M. M.; Davis, S. J.; Hanano, S.; Moyle, R.; Milich, R.; Putterill, J., et al. (2006). "The molecular basis of temperature compensation in the Arabidopsis circadian clock." The Plant Cell 18 (5): 1177-1187.
Grabowski, P. (2011). "Alternative splicing takes shape during neuronal development." Current Opinion in Genetics & Development 21 (4): 388-394.
Graille, M. and Séraphin, B. (2012). "Surveillance pathways rescuing eukaryotic ribosomes lost in translation." Nature Reviews Molecular Cell Biology 13: 727-735.
Graveley, B. R. (2005). "Mutually exclusive splicing of the insect Dscam pre-mRNA directed by competing intronic RNA secondary structures." Cell 123: 65-73.
Gray, M. W. (2012). "Evolutionary Origin of RNA Editing." Biochemistry 51 (26): 5235−5242. Green, B. R. (2001). "Was "molecular opportunism" a factor in the evolution of different photosynthetic light-
harvesting pigment systems?" Proceedings of the National Academy of Sciences USA 98 (5): 2119-2121. Green, R. M.; Tingay, S.; Wang, Z. Y. and Tobin, E. M. (2002). "Circadian rhythms confer a higher level of fitness
to Arabidopsis plants." Plant Physiology 129 (2): 576-584. Griffiths, S.; Dunford, R. P.; Coupland, G. and Laurie, D. A. (2003). "The evolution of CONSTANS-like gene
families in barley, rice, and Arabidopsis." Plant Physiology 131 (4): 1855-1867. Groppo, R. and Richter, J. D. (2009). "Translational control from head to tail." Current Opinion in Cell Biology 21
(3): 444-451. Groth, A.; Rocha, W.; Verreault, A. and Almouzni, G. (2007). "Chromatin challenges during DNA replication and
repair." Cell 128 (4): 721-733. Grzybowska, E. A. (2012). "Human intronless genes: Functional groups, associated diseases, evolution, and mRNA
processing in absence of splicing." Biochemical and Biophysical Research Communications 424 (1): 1-6. Haeusler, R. A. and Engelke, D. R. (2006). "Spatial organization of transcription by RNA polymerase III." Nucleic
Acids Research 34 (17): 4826-4836. Hall, B. G. (2008). Phylogenetic trees made easy: a how-to manual. Sunderland, MA, Sinauer Associates. Halterman, D. A.; Wei, F. and Wise, R. P. (2003). "Powdery mildew-induced Mla mRNAs are alternatively spliced
and contain multiple upstream open reading frames." Plant Physiology 131 (2): 558-567. Hardin, P. E. (2005). "The Circadian Timekeeping System of Drosophila." Current Biology 15 (17): R714-R722. Harigaya, Y. and Parker, R. (2010). "No-go decay: a quality control mechanism for RNA in translation." Wiley
Interdisciplinary Reviews: RNA. 1 (1): 132-141. Harmer, S. L. (2009). "The circadian system in higher plants." Annual Review of Plant Biology 60: 357-377. Harmer, S. L. (2010). "Plant Biology in the Fourth Dimension." Plant Physiology 154 (2): 467-470. Harmer, S. L.; Hogenesch, L. B.; Straume, M.; Chang, H. S.; Han, B.; Zhu, T.; Wang, X.; Kreps, J. A. and Kay, S.
A. (2000). "Orchestrated transcription of key pathways in Arabidopsis by the circadian clock." Science 290 (5499): 2110-2113.
Harvey, P. H. and Pagel, M. D. (1991). The Comparative Method in Evolutionary Biology. Oxford, Oxford University Press.
Hayama, R.; Izawa, T. and Shimamoto, K. (2002a). "Isolation of rice genes possibly involved in the photoperiodic control of flowering by a fluorescent differential display method." Plant Cell Physiology 43 (5): 494-504.
Hayama, R.; Izawa, T. and Shimamoto, K. (2002b). "Isolation of rice genes possibly involved in the photoperiodic control of flowering by a fluorescent differential display method." Plant and Cell Physiology 43 (5): 494-504.
Hayama, R.; Yokoi, S.; Tamaki, S.; Yano, M. and Shimamoto, K. (2003). "Adaptation of photoperiodic control pathways produces short-day flowering in rice." Nature 422 (6933): 719-722.
Hayes, K. R.; Beatty, B.; Meng, X.; Simmons, C. R.; Habben, J. E. and Danilevskaya, O. N. (2010). "Maize global transcriptomics reveals pervasive leaf diurnal rhythms but rhythms in developing ears are largely limited to the core oscillator." PLoS One 5 (9): e12887.
Hazen, S. P.; Naef, F.; Quisel, T.; Gendron, J. M.; Chen, H.; Ecker, J. R.; Borevitz, J. O. and Kay, S. A. (2009). "Exploring the transcriptional landscape of plant circadian rhythms using genome tiling arrays." Genome Biology 10 (2): R7.
He, Q.; Cheng, P.; Yang, Y.; He, Q.; Yu, H. and Liu, Y. (2003). "FWD1-mediated degradation of FREQUENCY in Neurospora establishes a conserved mechanism for circadian clock regulation." EMBO Journal 22 (17): 4421-4430.
He, X.-J.; Chen, T. and Zhu, J.-K. (2011). "Regulation and function of DNA methylation in plants and animals." Cell Research 21 (3): 442-465.
He, Y. and Smith, R. (2009). "Nuclear functions of heterogeneous nuclear ribonucleoproteins A/B." Cellular and Molecular Life Sciences 66 (7): 1239-1256.
Hedman, H.; Källman, T. and Lagercrantz, U. (2009). "Early evolution of the MFT-like gene family in plants." Plant Molecular Biology 70 (4): 359-369.

242 Appendix A Helfer, A.; Nusinow, D. A.; Chow, B. Y.; Gehrke, A. R.; Bulyk, M. L. and Kay, S. A. (2011). "LUX
ARRHYTHMO encodes a nighttime repressor of circadian gene expression in the Arabidopsis core clock." Current Biology 21 (2): 126-133.
Helfrich-Förster, C. (2001). "The locomotor activity rhythm of Drosophila melanogaster is controlled by a dual oscillator system." Journal of Insect Physiology 47 (8): 877-887.
Helliker, B. R. and Richter, S. L. (2008). "Subtropical to boreal convergence of tree-leaf temperatures." Nature 454 (7203): 511-514.
Hemani, Y. and Soller, M. (2012). "Mechanisms of Drosophila Dscam mutually exclusive splicing regulation." Biochemical Society Transactions 40 (4): 804-809.
Hemming, M. N.; Peacock, W. J.; Dennis, E. S. and Trevaskis, B. (2008). "Low-temperature and daylength cues are integrated to regulate FLOWERING LOCUS T in barley." Plant Physiology 147 (1): 355-366.
Hepler, P. K. (2005). "Calcium: a central regulator of plant growth and development." The Plant Cell 17 (8): 2142-2155.
Herai, R. H. and Yamagishi, M. E. B. (2010). "Detection of human interchromosomal trans-splicing in sequence databanks." Briefings in Bioinformatics 11 (2): 198-209.
Herrero, E.; Kolmos, E.; Bujdoso, N.; Yuan, Y.; Wang, M.; Berns, M. C.; Uhlworm, H.; Coupland, G.; Saini, R., et al. (2012). "EARLY FLOWERING4 recruitment of EARLY FLOWERING3 in the nucleus sustains the Arabidopsis circadian clock." The Plant Cell 24 (2): 428-443.
Hicks, K. A.; Albertson, T. M. and Wagner, D. R. (2001). "EARLY FLOWERING3 encodes a novel protein that regulates circadian clock function and flowering in Arabidopsis." The Plant Cell 13 (6): 1281-1292.
Hicks, K. A.; Millar, A. J.; Carré, I. A.; Somers, D.; Straume, M.; Meeks-Wagner, D. R. and Kay, S. A. (1996). "Conditional circadian dysfunction of the Arabidopsis early-flowering 3 mutant." Science 274 (5288): 790-792.
Higgins, J. A.; Bailey, P. C. and Laurie, D. A. (2010). "Comparative genomics of flowering time pathways using Brachypodium distachyon as a model for the temperate grasses." PLoS One 5 (4): e10065.
Hirano, H. Y.; Eiguchi, M. and Sano, Y. (1998). "A single base change altered the regulation of the Waxy gene at the posttranscriptional level during the domestication of rice." Molecular Biology and Evolution 15 (8): 978-987.
Hirschfeld, M.; zur Hausen, A.; Bettendorf, H.; Jäger, M. and Stickeler, E. (2009). "Alternative splicing of Cyr61 is regulated by hypoxia and significantly changed in breast cancer." Cancer Research 69 (5): 2082-2090.
Hodges, C.; Bintu, L.; Lubkowska, L.; Kashlev, M. and Bustamante, C. (2009). "Nucleosomal fluctuations govern the transcription dynamics of RNA polymerase II." Science 325 (5940): 626-628.
Holm, K.; Källman, T.; Gyllenstrand, N.; Hedman, H. and Lagercrantz, U. (2010). "Does the core circadian clock in the moss Physcomitrella patens (Bryophyta) comprise a single loop?" BMC Plant Biology 10: 109.
Hong, S.; Song, H. R.; Lutz, K.; Kerstetter, R. A.; Michael, T. P. and McClung, C. R. (2010a). "Type II protein arginine methyltransferase 5 (PRMT5) is required for circadian period determination in Arabidopsis thaliana." Proceedings of the National Academy of Sciences USA 107 (49): 21211-21216.
Hong, S. Y.; Lee, S.; Seo, P. J.; Yang, M. S. and Park, C. M. (2010b). "Identification and molecular characterization of a Brachypodium distachyon GIGANTEA gene: functional conservation in monocot and dicot plants." Plant Molecular Biology 72 (4-5): 485-497.
Horiguchi, G.; Lijsebettens, M. V.; Candela, H.; Micol, J. L. and Tsukaya, H. (2012). "Ribosomes and translation in plant developmental control." Plant Science 191-192: 24-34.
Hotta, C. T.; Gardner, M. J.; Hubbard, K. E.; Baek, S. J.; Dalchau, N.; Suhita, D.; Dodd, A. N. and Webb, A. A. (2007). "Modulation of environmental responses of plants by circadian clocks." Plant, Cell and Environment 30 (3): 333-349.
Hsu, P. Y. and Harmer, S. L. (2012). "Circadian phase has profound effects on differential expression analysis." PLoS One 7 (11): e49853.
Hu, F. Y.; Tao, D. Y.; Sacks, E.; Fu, B. Y.; Xu, P.; Li, J.; Yang, Y.; McNally, K.; Khush, G. S., et al. (2003). "Convergent evolution of perenniality in rice and sorghum." Proceedings of the National Academy of Sciences USA 100 (7): 4050-4054.
Huang, W.; Pérez-García, P.; Pokhilko, A.; Millar, A. J.; Antoshechkin, I.; Riechmann, J. L. and Mas, P. (2012). "Mapping the core of the Arabidopsis circadian clock defines the network structure of the oscillator." Science 336 (6077): 75-79.
Huang, Y. and Steitz, J. A. (2005). "SRprises along a messenger's journey." Molecular Cell 17 (5): 613-615. Hughes, M. E.; Grant, G. R.; Paquin, C.; Qian, J. and Nitabach, M. N. (2012). "Deep sequencing the circadian and
diurnal transcriptome of Drosophila brain." Genome Research 22 (7): 1266-1281. Huidobro, C.; Fernandez, A. F. and Fraga, M. F. (2013). "The role of genetics in the establishment and
maintenance of the epigenome." Cell and Molecular Life Sciences 70 (9): 1543-1573. Huntzinger, E. and Izaurralde, E. (2011). "Gene silencing by microRNAs: contributions of translational repression
and mRNA decay." Nature Reviews Genetics 12 (2): 99-110. Hut, R. A. and Beersma, D. G. (2011). "Evolution of time-keeping mechanisms: early emergence and adaptation to
photoperiod." Philosophical Transactions of the Royal Society B 366 (1574): 2141-2154.

243 Appendix A Ibáñez, C.; Kozarewa, I.; Johansson, M.; Ögren, E.; Rohde, A. and Eriksson, M. E. (2010). "Circadian Clock
Components Regulate Entry and Affect Exit of Seasonal Dormancy as Well as Winter Hardiness in Populus Trees." Plant Physiology 153 (4): 1823-1833.
Ibañez, C.; Ramos, A.; Acebo, P.; Contreras, A.; Casado, R.; Allona, I. and Aragoncillo, C. (2008). "Overall alteration of circadian clock gene expression in the chestnut cold response." PLoS One 3 (10): e3567.
Iglesias, N. and Stutz, F. (2008). "Regulation of mRNP dynamics along the export pathway." FEBS Letters 582 (14): 1987-1996.
Iida, K.; Seki, M.; Sakurai, T.; Satou, M.; Akiyama, K.; Toyoda, T.; Konogaya, A. and Shinozaki, K. (2004). "Genome-wide analysis of alternative pre-mRNA splicing in Arabidopsis thaliana based on full-length cDNA sequences." Nucleic Acids Research 32 (17): 5096-5103.
Imaizumi, T.; Tran, H. G.; Swartz, T. E.; Briggs, W. R. and Kay, S. A. (2003). "FKF1 is essential for photoperiodic-specific light signalling in Arabidopsis." Nature 426 (6964): 302-306.
Initiative, I. B. (2010). "Genome sequencing and analysis of the model grass Brachypodium distachyon." Nature 463 (7282): 763-768.
Irimia, M.; Rukov, J. L.; Roy, S. W.; Vinther, J. and Garcia-Fernandez, J. (2009). "Quantitative regulation of alternative splicing in evolution and development." BioEssays 31 (1): 40-50.
Ishiura, M.; Kutsuna, S.; Aoki, S.; Iwasaki, H.; Andersson, C. R.; Tanabe, A.; Golden, S. S.; Johnson, C. H. and Kondo, T. (1998). "Expression of a Gene Cluster kaiABC as a Circadian Feedback Process in Cyanobacteria." Science 281 (5382): 1519-1523.
Isshiki, M.; Morino, K.; Nakajima, M.; Okagaki, R. J.; Wessler, S. R.; Izawa, T. and Shimamoto, K. (1998). "A naturally occurring functional allele of the rice waxy locus has a GT to TT mutation at the 5' splice site of the first intron." Plant Journal 15 (1): 133-138.
Ito, S.; Matsushika, A.; Yamada, H.; Sato, S.; Kato, T.; Tabata, S.; Yamashino, T. and Mizuno, T. (2003). "Characterization of the APRR9 pseudo-response regulator belonging to the APRR1/TOC1 quintet in Arabidopsis thaliana." Plant and Cell Physiology 44 (11): 1237-1245.
Iwasaki, S. and Tomari, Y. (2009). "Argonaute-mediated translational repression (and activation)." Fly 3 (3): 206-209.
Jacobs, E.; Mills, J. D. and Janitz, M. (2012). "The Role of RNA Structure in Posttranscriptional Regulation of Gene Expression." Journal of Genetics and Genomics 39 (10): 535-543.
James, A. B.; Monreal, J. A.; Nimmo, G. A.; Kelly, C. L.; Herzyk, P.; Jenkins, G. I. and Nimmo, H. G. (2008). "The circadian clock in Arabidopsis roots is a simplified slave version of the clock in shoots." Science 322 (5909): 1832-1835.
James, A. B.; Syed, N. H.; Bordage, S.; Marshall, J.; Nimmo, G. A.; Jenkins, G. I.; Herzyk, P.; Brown, J. W. S. and Nimmo, H. G. (2012a). "Alternative splicing mediates responses of the Arabidopsis circadian clock to temperature changes." The Plant Cell 24 (3): 961-981.
James, A. B.; Syed, N. H.; Brown, J. W. S. and Nimmo, H. G. (2012b). "Thermoplasticity in the plant circadian clock: how plants tell the time-perature." Plant Signaling & Behaviour 7 (10): 1219-1223.
Jantasuriyarat, C.; Gowda, M.; Haller, K.; Haltfield, J.; Lu, G.; Stahlberg, E.; Zhou, B.; Li, H.; Kim, H., et al. (2005). "Large-scale identification of expressed sequence tags involved in rice and rice blast fungus interaction." Plant Physiology 138 (1): 105-115.
Jiménez-Gómez, J. M.; Wallace, A. D. and Maloof, J. N. (2010). "Network analysis identifies ELF3 as a QTL for the shade avoidance response in Arabidopsis." PLoS Genetics 6 (9): pii: e1001100.
Jones, H.; Leigh, F. J.; Mackay, I.; Bower, M. A.; Smith, L. M.; Charles, M. P.; Jones, G.; Jones, M. K.; Brown, T. A., et al. (2008). "Population-based resequencing reveals that the flowering time adaptation of cultivated barley originated east of the Fertile Crescent." Molecular Biology and Evolution 25 (10): 2211-2219.
Jones, M. A.; Williams, B. A.; McNicol, J.; Simpson, C. G.; Brown, J. W. S. and Harmer, S. L. (2012). "Mutation of Arabidopsis spliceosomal timekeeper locus1 causes circadian clock defects." The Plant Cell 24 (10): 4066-4082.
Jou, W. M.; Haegeman, G.; Ysebaert, M. and Fiers, W. (1972). "Nucleotide Sequence of the Gene Coding for the Bacteriophage MS2 Coat Protein." Nature 237 (5350): 82-88.
Jurica, M. S. and Moore, M. J. (2003). "Pre-mRNA Splicing: Awash in a Sea of Proteins." Molecular Cell 12 (1): 5-14.
Kafasla, P.; Mickleburgh, I.; Llorian, M.; Coelho, M.; Gooding, C.; Cherny, D.; Joshi, A.; Kotik-Kogan, O.; Curry, S., et al. (2012). "Defining the roles and interactions of PTB." Biochemical Society Transactions 40 (4): 815-820.
Kalyna, M.; Simpson, C. G.; Syed, N. H.; Lewandowska, D.; Marquez, Y.; Kusenda, B.; Marshall, J.; Fuller, J.; Cardle, L., et al. (2012). "Alternative splicing and nonsense-mediated decay modulate expression of important regulatory genes in Arabidopsis." Nucleic Acids Research 40 (6): 2454-2469.
Karlgren, A.; Gyllenstrand, N.; Källman, T.; Sundström, J. F.; Moore, D.; Lascoux, M. and Lagercrantz, U. (2011). "Evolution of the PEBP Gene Family in Plants: Functional Diversification in Seed Plant Evolution." Plant Physiology 156 (4): 1967-1977.
Kaur, P.; Larson, S. R.; Bushman, B. S.; Wang, R. R.; Mott, I. W.; Hole, D.; Thimmapuram, J.; Gong, G. and Liu, L. (2008). "Genes controlling plant growth habit in Leymus (Triticeae): maize barren stalk1 (ba1), rice lax

244 Appendix A
panicle, and wheat tiller inhibition (tin3) genes as possible candidates." Functional and Integrative Genomics 8 (4): 375-386.
Kazan, K. (2003). "Alternative splicing and proteome diversity in plants: the tip of the iceberg has just emerged." Trends in Plant Science 8 (10): 468-471.
Keily, J.; Macgregor, D. R.; Smith, R. W.; Millar, A. J.; Halliday, K. J. and Penfield, S. (2013). "Model selection reveals control of cold signalling by evening-phased components of the plant circadian clock." Plant Journal 76 (2): 247-257.
Kelemen, O.; Convertini, P.; Zhang, Z.; Wen, Y.; Shen, M.; Falaleeva, M. and Stamm, S. (2013). "Function of alternative splicing." Gene 514 (1): 1-30.
Keren, H.; Lev-Maor, G. and Ast, G. (2010). "Alternative splicing and evolution: diversification, exon definition and function." Nature Reviews Genetics 11 (345-355).
Khan, S.; Rowe, S. C. and Harmon, F. G. (2010). "Coordination of the maize transcriptome by a conserved circadian clock." BMC Plant Biology 10: 126.
Khoury, G. A.; Baliban, R. C. and Floudas, C. A. (2011). "Proteome-wide post-translational modification statistics: frequency analysis and curation of the swiss-prot database." Scientific Reports 1: 90.
Kim, E.; Goren, A. and Ast, G. (2008a). "Alternative splicing: current perspectives." BioEssays 30 (1): 38-47. Kim, J. Y.; Kim, W. Y.; Kwak, K. J.; Oh, S. H.; Han, Y. S. and Kang, H. (2010). "Glycine-rich RNA-binding
proteins are functionally conserved in Arabidopsis thaliana and Oryza sativa during cold adaptation process." Journal of Experimental Botany 61 (9): 2317-2325.
Kim, J. Y.; Song, H. R.; Taylor, B. L. and Carré, I. A. (2003). "Light-regulated translation mediates gated induction of the Arabidopsis clock protein LHY." EMBO Journal 22 (4): 935-944.
Kim, S.; Koroleva, O. A.; Lewandowska, D.; Pendle, A. F.; Clark, G. P.; Simpson, C. G.; Shaw, P. J. and Brown, J. W. S. (2009). "Aberrant mRNA transcripts and the nonsense-mediated decay proteins UPF2 and UPF3 are enriched in the Arabidopsis nucleolus." The Plant Cell 21 (7): 2045-2057.
Kim, S. Y.; Yu, X. and Michaels, S. D. (2008b). "Regulation of CONSTANS and FLOWERING LOCUS T expression in response to changing light quality." Plant Physiology 148 (1): 269-279.
Kim, W.-Y.; Fujiwara, S.; Suh, S.-S.; Kim, J.; Kim, Y.; Han, L.; David, K.; Putterill, J.; Nam, H. G., et al. (2007). "ZEITLUPE is a circadian photoreceptor stabilized by GIGANTEA in blue light." Nature 449: 356-360.
Kim, W. Y.; Hicks, K. A. and Somers, D. E. (2005). "Independent roles for EARLY FLOWERING 3 and ZEITLUPE in the control of circadian timing, hypocotyl length, and flowering time." Plant Physiology 139 (3): 1557-1569.
Kim, Y.; Yeom, M.; Kim, H.; Lim, J.; Koo, H. J.; Hwang, D.; Somers, D. and Nam, H. G. (2012). "GIGANTEA and EARLY FLOWERING 4 in Arabidopsis exhibit differential phase-specific genetic influences over a diurnal cycle." Molecular Plant 5 (3): 678-687.
Kishore, S. and Stamm, S. (2006). "The snoRNA HBII-52 regulates alternative splicing of the serotonin receptor 2C." Science 311 (230): 230-311.
Kiss, T. (2004). "Biogenesis of small nuclear RNPs." Journal of Cell Science 117: 5949-5951. Kitayama, Y.; Nishiwaki, T.; Terauchi, K. and Kondo, T. (2008). "Dual KaiC-based oscillations constitute the
circadian system of cyanobacteria." Genes & Development 22: 1513-1521. Kleene, K. C. (2001). "A possible meiotic function of the peculiar patterns of gene expression in mammalian
spermatogenic cells." Mechanisms of Development 106 (1-2): 3-23. Klintenäs, M.; Pin, P. A.; Benlloch, R.; Ingvarsson, P. K. and Nilsson, O. (2012). "Analysis of conifer
FLOWERING LOCUS T/TERMINAL FLOWER1-like genes provides evidence for dramatic biochemical evolution in the angiosperm FT lineage." New Phytologist 196 (4): 1260-1273.
Kobayashi, Y.; Kaya, H.; Goto, K.; Iwabuchi, M. and Araki, T. (1999). "A pair of related genes with antagonistic roles in mediating flowering signals." Science 286 (5446): 1960-1962.
Kochetov, A. V.; Ahmad, S.; Ivanisenko, V.; Volkova, O. A.; Kolchanov, N. A. and Sarai, A. (2008). "uORFs, reinitiation and alternative translation start sites in human mRNAs." FEBS Letters 582 (9): 1293-1297.
Köhler, A. and Hurt, E. (2007). "Exporting RNA from the nucleus to the cytoplasm." Nature Reviews Molecular Cell Biology 8 (10): 761-773.
Kolmos, E.; Herrero, E.; Bujdoso, N.; Millar, A. J.; Tóth, R.; Gyula, P.; Nagy, F. and Davis, S. J. (2011). "A Reduced-Function Allele Reveals That EARLY FLOWERING3 Repressive Action on the Circadian Clock Is Modulated by Phytochrome Signals in Arabidopsis." The Plant Cell 23: 3230-3246.
Kolmos, E.; Nowak, M.; Werner, M.; Fischer, K.; Schwarz, G.; Mathews, S.; Schoof, H.; Nagy, F.; Bujnicki, J. M., et al. (2009). "Integrating ELF4 into the circadian system through combined structural and functional studies." HFSP Journal 3 (5): 350-366.
Kong, J. and Lasko, P. (2012). "Translational control in cellular and developmental processes." Nature Reviews Genetics 13 (6): 383-394.
Konopka, R. J. and Benzer, S. (1971). "Clock mutants of Drosophila melanogaster." Proceedings of the National Academy of Sciences USA 68 (9): 2112-2116.
Koo, S. C.; Moon, B. C.; Kim, J. K.; Kim, C. Y.; Sung, S. J.; Kim, M. C.; Cho, M. J. and Cheong, Y. H. (2009). "OsBWMK1 mediates SA-dependent defense responses by activating the transcription factor OsWRKY33." Biochemical and Biophysical Research Communications 387 (2): 365-370.

245 Appendix A Koo, S. C.; Yoon, H. W.; Kim, C. Y.; Moon, B. C.; Cheong, Y. H.; Han, H. J.; Lee, S. M.; Kang, K. Y.; Kim, M.
C., et al. (2007). "Alternative splicing of the OsBWMK1 gene generates three transcript variants showing differential subcellular localizations." Biochemical and Biophysical Research Communications 360 (1): 188-193.
Kornblihtt, A. R.; Schor, I. E.; Alló, M.; Dujardin, G.; Petrillo, E. and Muñoz, M. J. (2013). "Alternative splicing: a pivotal step between eukaryotic transcription and translation." Nature Reviews Molecular Cell Biology 14 (3): 153-165.
Kozak, M. (2005). "Regulation of translation via mRNA structure in prokaryotes and eukaryotes." Gene 361: 13-37. Kozarewa, I.; Ibáñez, C.; Johansson, M.; Ögren, E.; Mozley, D.; Nylander, E.; Chono, M.; Moritz, T. and
Eriksson, M. E. (2010). "Alteration of PHYA expression change circadian rhythms and timing of bud set in Populus." Plant Molecular Biology 73 (1-2): 143-156.
Kriechbaumer, V.; Wang, P.; Hawes, C. and Abell, B. M. (2012). "Alternative splicing of the auxin biosynthesis gene YUCCA4 determines its subcellular compartmentation." Plant Journal 70 (2): 292-302.
Kuroha, K.; Tatematsu, T. and Inada, T. (2009). "Upf1 stimulates degradation of the product derived from aberrant messenger RNA containing a specific nonsense mutation by the proteasome." EMBO Reports 10 (1265-1271).
Kwon, S. J.; Choi, E. Y.; Choi, Y. J.; Ahn, J. H. and Park, O. K. (2006). "Proteomics studies of post-translational modifications in plants." Journal of Experimental Botany 57 (7): 1547-1551.
Lakin-Thomas, P. L.; Bell-Pedersen, D. and Brody, S. (2011). "The genetics of circadian rhythms in Neurospora." Advances in Genetics 74: 55-103.
Lamesch, P.; Berardini, T. Z.; Li, D.; Swarbreck, D.; Wilks, C.; Sasidharan, R.; Muller, R.; Dreher, K.; Alexander, D. L., et al. (2011). "The Arabidopsis Information Resource (TAIR): improved gene annotation and new tools." Nucleic Acids Research 40 (Database issue): D1202-1210.
Lancashire, P. D.; Bleiholder, H.; Van den Boom, T.; Langeluddeke, P.; Stauss, R.; Weber, E. and Witzenberger, A. (1991). "A uniform decimal code for growth stages of crops and weeds." Annals of Applied Biology 119: 561-601.
Lareau, L. F.; Brooks, A. N.; Soergel, D. A.; Meng, Q. and Brenner, S. E. (2007). "The coupling of alternative splicing and nonsense-mediated mRNA decay." Advances in Experimental Medicine and Biology 623: 190-211.
Larkin, M. A.; Blackshields, G.; Brown, N. P.; Chenna, R.; McGettigan, P. A.; McWilliam, H.; Valentin, F.; Wallace, I. M.; Wilm, A., et al. (2007). "Clustal W and Clustal X version 2.0." Bioinformatics 23 (21): 2947-2948.
Larkin, P. D. and Park, W. D. (1999). "Transcript accumulation and utilization of alternate and non-consensus splice sites in rice granule-bound starch synthase are temperature-sensitive and controlled by a single-nucleotide polymorphism." Plant Molecular Biology 40 (4): 719-727.
Law, J. A. and Jacobsen, S. E. (2010). "Establishing, maintaining and modifying DNA methylation patterns in plants and animals." Nature Reviews Genetics 11 (3): 204-220.
Ledger, S.; Strayer, C.; Ashton, F.; Kay, S. A. and Putterill, J. (2001). "Analysis of the function of two circadian-regulated CONSTANS-LIKE genes." Plant Journal 26 (1): 15-22.
Legnaioli, T.; Cuevas, J. and Más, P. (2009). "TOC1 functions as a molecular switch connecting the circadian clock with plant responses to drought." EMBO Journal 28 (23): 3745-3757.
Li, B.; Carey, M. and Workman, J. L. (2007). "The role of chromatin during transcription." Cell 128 (4): 707-719. Li, C. and Dubcovsky, J. (2008). "Wheat FT protein regulates VRN1 transcription through interactions with
FDL2." Plant Journal 55 (4): 543-554. Li, L.; Stoeckert, C. J. J. and Roos, D. S. (2003). "OrthoMCL: Identification of Ortholog Groups for Eukaryotic
Genomes." Genome Research 13 (9): 2178-2189. Li, Q. and Hunt, A. G. (1997). "The Polyadenylation of RNA in Plants." Plant Physiology 115 (2): 321-325. Libby, R. T. and Gallant, J. A. (1991). "The role of RNA polymerase in transcriptional fidelity." Molecular
Microbiology 5 (5): 999-1004. Lillo, C. (2006). "Circadian rhythmicity of nitrate reductase activity in barley leaves." Physiologia Plantarum 61 (2):
219-223. Liu, T.; Carlsson, J.; Takeuchi, T.; Newton, L. and Farré, E. M. (2013). "Direct regulation of abiotic responses by
the Arabidopsis circadian clock component PRR7." Plant Journal 76: 101-114. Liu, X. L.; Covington, M. F.; Fankhauser, C.; Chory, J. and Wagner, D. R. (2001). "ELF3 encodes a circadian
clock-regulated nuclear protein that functions in an Arabidopsis PHYB signal transduction pathway." The Plant Cell 13 (6): 1293-1304.
Locke, J. C.; Kozma-Bognár, L.; Gould, P. D.; Fehér, B.; Kevei, E.; Nagy, F.; Turner, M. S.; Hall, A. and Millar, A. J. (2006). "Experimental validation of a predicted feedback loop in the multi-oscillator clock of Arabidopsis thaliana." Molecular Systems Biology 2: 59.
Long, J. C. and Caceres, J. F. (2009). "The SR protein family of splicing factors: master regulators of gene expression." Biochemical Journal 417: 15-27.
Lopez, A. J. (1998). "Alternative splicing of pre-mRNA: developmental consequences and mechanisms of regulation." Annual Review of Genetics 32: 279-305.

246 Appendix A Lord, J. (1998). "Effect of flowering on vegetative growth and further reproduction in Festuca novae-zelandiae." New
Zealand Journal of Ecology 22 (1): 25-31. Lorković, Z. J.; Kirk, D. A. W.; Lambermon, M. H. L. and Filipowicz, W. (2000). "Pre-mRNA splicing in higher
plants." Trends in Plant Science 5 (4): 160-167. Lothrop, A. P.; Torres, M. P. and Fuchs, S. M. (2013). "Deciphering post-translational modification codes." FEBS
Letters 587 (8): 1247-1257. Lou, P.; Wu, J.; Cheng, F.; Cressman, L. G.; Wang, X. and McClung, C. R. (2012). "Preferential Retention of
Circadian Clock Genes during Diploidization following Whole Genome Triplication in Brassica rapa." The Plant Cell 24 (6): 2415-2426.
Lu, S. X.; Knowles, S. M.; Andronis, C.; Ong, M. S. and Tobin, E. M. (2009). "CIRCADIAN CLOCK ASSOCIATED1 and LATE ELONGATED HYPOCOTYL function synergistically in the circadian clock of Arabidopsis." Plant Physiology 150 (2): 834-843.
Lu, T.; Lu, G.; Fan, D.; Zhu, C.; Li, W.; Zhao, Q.; Feng, Q.; Zhao, Y.; Guo, Y., et al. (2010a). "Function annotation of the rice transcriptome at single-nucleotide resolution by RNA-seq." Genome Research 20 (9): 1238-1249.
Lu, W.; Meng, Q. J.; Tyler, N. J.; Stokkan, K. A. and Loudon, A. S. (2010b). "A circadian clock is not required in an arctic mammal." Current Biology 20 (6): 533-537.
Lücke, S.; Xu, G. L.; Palfi, Z.; Cross, M.; Bellofatto, V. and Bindereif, A. (1996). "Spliced leader RNA of trypanosomes: in vivo mutational analysis reveals extensive and distinct requirements for trans splicing and cap4 formation." EMBO Journal 15 (16): 4380-4391.
Luco, R. F. and Misteli, T. (2011). "More than a splicing code: integrating the role of RNA, chromatin and non-coding RNA in alternative splicing regulation." Current Opinion in Genetics & Development 21 (4): 366-372.
Luco, R. F.; Pan, Q.; Tominaga, K.; Blencowe, B. J.; Pereira-Smith, O. M. and Misteli, T. (2010). "Regulation of alternative splicing by histone modifications." Science 327 (5968): 996-1000.
Luehrsen, K. R.; Taha, S. and Walbot, V. (1994). "Nuclear Pre-mRna Processing in Higher Plants." Progress in Nucleic Acid Research and Molecular Biology 47 (C): 149-193.
Mackey, S. R.; Golden, S. S. and Ditty, J. L. (2011). "The itty-bitty time machine genetics of the cyanobacterial circadian clock." Advances in Genetics 74 (13-53).
Mahfoozi, S.; Limin, A. E.; Farhad, A. and Fowler, D. B. (2006). "Phenological development and expression of freezing resistance in spring and winter wheat under field conditions in north-west Iran." Field Crops Research 97 (2-3): 182-187.
Majercak, J.; Sidote, D.; Hardin, P. E. and Edery, I. (1999). "How a circadian clock adapts to seasonal decreases in temperature and day length." Neuron 24 (1): 219-230.
Mariotti, M. and Guigó, R. (2010). "Selenoprofiles: profile-based scanning of eukaryotic genome sequences for selenoprotein genes." Bioinformatics 26 (21): 2656-2663.
Marone, D.; Russo, M. A.; Laidò, G.; De Leonardis, A. M. and Mastrangelo, A. M. (2013). "Plant Nucleotide Binding Site-Leucine-Rich Repeat (NBS-LRR) Genes: Active Guardians in Host Defense Responses." International Journal of Molecular Sciences 14 (4): 7302-7326.
Marquez, Y.; Brown, J. W.; Simpson, C. G.; Barta, A. and Kalyna, M. (2012). "Transcriptome survey reveals increased complexity of the alternative splicing landscape in Arabidopsis." Genome Research 22: 1184-1195.
Martínez, M.; Rubio-Somoza, I.; Carbonero, P. and Díaz, I. (2003). "A cathepsin B-like cysteine protease gene from Hordeum vulgare (gene CatB) induced by GA in aleurone cells is under circadian control in leaves." Journal of Experimental Botany 54 (384): 951-959.
Más, P. and Yanovsky, M. J. (2009). "Time for circadian rhythms: plants get synchronized." Current Opinion in Plant Biology 12 (5): 574-579.
Mastrangelo, A. M.; Marone, D.; Laidò, G.; De Leonardis, A. M. and De Vita, P. (2012). "Alternative splicing: Enhancing ability to cope with stress via transcriptome plasticity." Plant Science 185-186: 40-49.
Matsumoto, T.; Tanaka, T.; Sakai, H.; Amano, N.; Kanamori, H.; Kurita, K.; Kikuta, A.; Kamiya, K.; Yamamoto, M., et al. (2011). "Comprehensive Sequence Analysis of 24,783 Barley Full-Length cDNAs Derived from 12 Clone Libraries." Plant Physiology 156 (1): 20-28.
Matsushika, A.; Makino, S.; Kojima, M. and Mizuno, T. (2000). "Circadian waves of expression of the APRR1/TOC1 family of pseudo-response regulators in Arabidopsis thaliana: insight into the plant circadian clock." Plant and Cell Physiology 41 (9): 1002-1012.
Matyskiela, M. E. and Martin, A. (2013). "Design Principles of a Universal Protein Degradation Machine." Journal of Molecular Biology 425 (2): 199-213.
Mauger, D. M.; Siegfried, N. A. and Weeks, K. M. (2013). "The genetic code as expressed through relationships between mRNA structure and protein function." FEBS Letters 587 (8): 1180-1188.
Maury, E.; Ramsey, K. M. and Bass, J. (2010). "Circadian rhythms and metabolic syndrome: from experimental genetics to human disease." Circulation Research 106 (3): 447-462.
McClung, C. R. (2006). "Plant Circadian Rhythms." The Plant Cell 18 (4): 792-803. McClung, C. R. (2013). "Beyond Arabidopsis: The circadian clock in non-model plant species." Seminars in Cell &
Developmental Biology 24 (5): 430-436.

247 Appendix A McClung, C. R. and Davis, S. J. (2010). "Ambient thermometers in plants: from physiological outputs towards
mechanisms of thermal sensing." Current Biology 20 (24): R1086-1092. McClung, C. R.; Salomé, P. A. and Michael, T. P. (2002). The Arabidopsis circadian system. In: The Arabidopsis
book. C. R. Somerville and E. M. Meyerowitz. Rockville, MD: American Society of Plant Biologists. 1: e0044.
McGlincy, N. J. and Smith, C. W. (2008). "Alternative splicing resulting in nonsense-mediated mRNA decay: what is the meaning of nonsense?" Trends in Biochemical Sciences 33 (8): 385-393.
McGlincy, N. J.; Valomon, A.; Chesham, J. E.; Maywood, E. S.; Hastings, M. H. and Ule, J. (2012). "Regulation of alternative splicing by the circadian clock and food related cues." Genome Biology 13 (6): R54.
McGuire, A. M.; Pearson, M. D.; Neafsey, D. E. and Galagan, J. E. (2008). "Cross-kingdom patterns of alternative splicing and splice recognition." Genome Biology 9 (3): R50.
McWatters, H. G.; Bastow, R. M.; Hall, A. J. and Millar, A. J. (2000). "The ELF3zeitnehmer regulates light signalling to the circadian clock." Nature 408: 716-720.
Meijer, H. A. and Thomas, A. A. (2002). "Control of eukaryotic protein synthesis by upstream open reading frames in the 5'-untranslated region of an mRNA." Biochemical Journal 367 (Pt 1): 1-11.
Mercatante, D. R.; Mohler, J. L. and Kole, R. (2002). "Cellular Response to an Antisense-mediated Shift of Bcl-x Pre-mRNA Splicing and Antineoplastic Agents." The Journal of Biological Chemistry 277 (51): 49374-49382.
Michael, T. P.; Salomé, P. A.; Yu, H. J.; Spencer, T. R.; Sharp, E. L.; McPeek, M. A.; Alonso, J. M.; Ecker, J. R. and McClung, C. R. (2003). "Enhanced fitness conferred by naturally occurring variation in the circadian clock." Science 302 (5647): 1049-1053.
Millar, A. J. (2004). "Input signals to the plant circadian clock." Journal of Experimental Botany 55 (395): 277-283. Miller, T. A.; Muslin, E. H. and Dorweiler, J. E. (2008). "A maize CONSTANS-like gene, conz1, exhibits distinct
diurnal expression patterns in varied photoperiods." Planta 227 (6): 1377-1388. Milne, I.; Stephen, G.; Bayer, M.; Cock, P. J.; Pritchard, L.; Cardle, L.; Shaw, P. D. and Marshall, D. (2013).
"Using Tablet for visual exploration of second-generation sequencing data." Briefings in Bioinformatics 14 (2): 193-202.
Mischo, H. E. and Proudfoot, N. J. (2013). "Disengaging polymerase: Terminating RNA polymerase II transcription in budding yeast." Biochimica et Biophysica Acta (BBA) - Gene Regulatory Mechanisms 1829 (1): 174-185.
Misra, S.; Crosby, M. A.; Mungall, C. J.; Matthews, B. B.; Campbell, K. S.; Hradecky, P.; Huang, Y.; Kaminker, J. S.; Millburn, G. H., et al. (2002). "Annotation of the Drosophila melanogaster euchromatic genome: a systematic review." Genome Biology 3 (12): RESEARCH0083.
Miwa, K.; Serikawa, M.; Suzuki, S.; Kondo, T. and Oyama, T. (2006). "Conserved expression profiles of circadian clock-related genes in two Lemna species showing long-day and short-day photoperiodic flowering responses." Plant and Cell Physiology 47 (5): 601-6012.
Mizoguchi, T.; Wright, L.; Fujiwara, S.; Cremer, F.; Lee, K.; Onouchi, H.; Mouradov, A.; Fowler, S.; Kamada, H., et al. (2005). "Distinct roles of GIGANTEA in promoting flowering and regulating circadian rhythms in Arabidopsis." The Plant Cell 17 (8): 2255-2270.
Moore, M. J.; Bell, C. D.; Soltis, P. S. and Soltis, D. E. (2007). "Using plastid genome-scale data to resolve enigmatic relationships among basal angiosperms." Proceedings of the National Academy of Sciences USA 104 (49): 19363-19368.
Mouradov, A.; Cremer, F. and Coupland, G. (2002). "Control of Flowering Time: Interacting Pathways as a Basis for Diversity." The Plant Cell 14 (Suppl 1): S111-S130.
Murakami, M.; Ashikari, M.; Miura, K.; Yamashino, T. and Mizuno, T. (2003). "The Evolutionarily Conserved OsPRR Quintet: Rice Pseudo-Response Regulators Implicated in Circadian Rhythm." Plant and Cell Physiology 44 (11): 1229-1236.
Murakami, M.; Tago, Y.; Yamashino, T. and Mizuno, T. (2007). "Comparative overviews of clock-associated genes of Arabidopsis thaliana and Oryza sativa." Plant and Cell Physiology 48 (1): 110-121.
Murphy, R. L.; Klein, R. R.; Morishige, D. T.; Brady, J. A.; Rooney, W. L.; Miller, F. R.; Dugas, D. V.; Klein, P. E. and Mullet, J. E. (2011). "Coincident light and clock regulation of pseudoresponse regulator protein 37 (PRR37) controls photoperiodic flowering in sorghum." Proceedings of the National Academy of Sciences USA 108 (39): 16469-16474.
Mushegian, A. R.; Garey, J. R.; Martin, J. and Liu, L. X. (1998). "Large-Scale Taxonomic Profiling of Eukaryotic Model Organisms: A Comparison of Orthologous Proteins Encoded by the Human, Fly, Nematode, and Yeast Genomes " Genome Research 8: 590-598.
Mutasa-Göttgens, E. and Hedden, P. (2009). "Gibberellin as a factor in floral regulatory networks." Journal of Experimental Botany 60 (7): 1979-1989.
Nagasaka, S.; Takahashi, M.; Nakanishi-Itai, R.; Bashir, K.; Nakanishi, H.; Mori, S. and Nishizawa, N. K. (2009). "Time course analysis of gene expression over 24 hours in Fe-deficient barley roots." Plant Molecular Biology 69 (5): 621-631.
Nagel, D. H. and Kay, S. A. (2012). "Complexity in the wiring and regulation of plant circadian networks." Current Biology 22 (16): R648-657.
Nagy, E. and Maquat, L. E. (1998). "A rule for termination-codon position within intron-containing genes: when nonsense affects RNA abundance." Trends in Biochemical Sciences 23 (6): 198-199.

248 Appendix A Nakajima, M.; Imai, K.; Ito, H.; Nishiwaki, T.; Murayama, Y.; Iwasaki, H.; Oyama, T. and Kondo, T. (2005).
"Reconstitution of Circadian Oscillation of Cyanobacterial KaiC Phosphorylation in Vitro." Science 308 (5720): 414-415.
Nakamichi, N. (2011). "Molecular Mechanisms Underlying the Arabidopsis Circadian Clock." Plant and Cell Physiology 52 (10): 1709-0718.
Nakamichi, N.; Kiba, T.; Henriques, R.; Mizuno, T.; Chua, N. H. and Sakakibara, H. (2010). "PSEUDO-RESPONSE REGULATORS 9, 7, and 5 are transcriptional repressors in the Arabidopsis circadian clock." The Plant Cell 22 (3): 594-605.
Nakamichi, N.; Kita, M.; Ito, S.; Yamashino, T. and Mizuno, T. (2005). "PSEUDO-RESPONSE REGULATORS, PRR9, PRR7 and PRR5, together play essential roles close to the circadian clock of Arabidopsis thaliana." Plant and Cell Physiology 46 (5): 686-698.
Nakamichi, N.; Kita, M.; Niinuma, K.; Ito, S.; Yamashino, T.; Mizoguchi, T. and Mizuno, T. (2007). "Arabidopsis clock-associated pseudo-response regulators PRR9, PRR7 and PRR5 coordinately and positively regulate flowering time through the canonical CONSTANS-dependent photoperiodic pathway." Plant and Cell Physiology 48 (6): 822-832.
Navarro, C.; Abelenda, J. A.; Cruz-Oró, E.; Cuéllar, C. A.; Tamaki, S.; Silva, J.; Shimamoto, K. and Prat, S. (2011). "Control of flowering and storage organ formation in potato by FLOWERING LOCUS T." Nature 478 (7367): 119-122.
Navaud, O.; Dabos, P.; Carnus, E.; Tremousaygue, D. and Hervé, C. (2007). "TCP Transcription Factors Predate the Emergence of Land Plants." Journal of Molecular Evolution 65: 23-33.
Nelson, D. C.; Lasswell, J.; Rogg, L. E.; Cohen, M. A. and Bartel, B. (2000). "FKF1, a clock-controlled gene that regulates the transition to flowering in Arabidopsis." Cell 101 (3): 331-340.
Nemoto, Y.; Kisaka, M.; Fuse, T.; Yano, M. and Ogihara, Y. (2003). "Characterization and functional analysis of three wheat genes with homology to the CONSTANS flowering time gene in transgenic rice." The Plant Journal 36 (1): 82-93.
Newton, A. C.; Flavell, A. J.; George, T. S.; Leat, P.; Mullholland, B.; Ramsay, L.; Revoredo-Giha, C.; Russell, J. R.; Steffenson, B. J., et al. (2011). "Crops that feed the world 4. Barley: a resilient crop? Strengths and weaknesses in the context of food security." Food Security 3: 141-178.
Nilsen, T. W. (2003). "The spliceosome: the most complex macromolecular machine in the cell?" BioEssays 25 (12): 1147-1149.
Nisbet, E. G. and Sleep, N. H. (2001). "The habitat and nature of early life." Nature 409 (6823): 1083-1091. Nitcher, R.; Distelfeld, A.; Tan, C.; Yan, L. and Dubcovsky, J. (2013). "Increased copy number at the HvFT1 locus
is associated with accelerated flowering time in barley." Molecular Genetics and Genomics 288 (5-6): 261-275. Nogi, Y.; Yano, R. and Nomura, M. (1991). "Synthesis of larger rRNAs by RNA polymerase II in mutants of
Saccharomyces cerevisiae defective in RNA polymerase I." Proceedings of the National Academy of Sciences USA 88 (9): 3962-3966.
Nomata, T.; Kabeya, Y. and Sato, N. (2004). "Cloning and characterization of glycine-rich RNA-binding protein cDNAs in the moss Physcomitrella patens." Plant and Cell Physiology 45 (1): 48-56.
Noordally, Z. B.; Ishii, K.; Atkins, K. A.; Wetherill, S. J.; Kusakina, J.; Walton, E. J.; Kato, M.; Azuma, M.; Tanaka, K., et al. (2013). "Circadian control of chloroplast transcription by a nuclear-encoded timing signal." Science 339 (6125): 1316-1319.
Nusinow, D. A.; Helfer, A.; Hamilton, E. E.; King, J. J.; Imaizumi, T.; Schultz, T. F.; Farré, E. M. and Kay, S. A. (2011). "The ELF4-ELF3-LUX complex links the circadian clock to diurnal control of hypocotyl growth." Nature 475 (7356): 398-402.
Nyikó, T.; Kerényi, F.; Szabadkai, L.; Benkovics, A. H.; Major, P.; Sonkoly, B.; Mérai, Z.; Barta, E.; Niemiec, E., et al. (2013). "Plant nonsense-mediated mRNA decay is controlled by different autoregulatory circuits and can be induced by an EJC-like complex." Nucleic Acids Research 41 (13): 6715-6728.
Nyikó, T.; Sonkoly, B.; Mérai, Z.; Benkovics, A. H. and Silhavy, D. (2009). "Plant upstream ORFs can trigger nonsense-mediated mRNA decay in a size-dependent manner." Plant Molecular Biology 71 (4-5): 367-378.
O'Neill, L. (2000). "The Toll/interleukin-1 receptor domain: a molecular switch for inflammation and host defence." Biochemical Society Transactions 28 (5): 557-563.
Ogiso, E.; Takahashi, Y.; Sasaki, T.; Yano, M. and Izawa, T. (2010). "The role of casein kinase II in flowering time regulation has diversified during evolution." Plant Physiology 152 (2): 808-820.
Okada, R.; Kondo, S.; Satbhai, S. B.; Yamaguchi, N.; Tsukuda, M. and Aoki, S. (2009a). "Functional characterization of CCA1/LHY homolog genes, PpCCA1a and PpCCA1b, in the moss Physcomitrella patens." Plant Journal 60 (3): 551-563.
Okada, R.; Satbhai, S. B. and Aoki, S. (2009b). "Photoperiod-dependent regulation of cell growth by PpCCA1a and PpCCA1b genes encoding single-myb clock proteins in the moss Physcomitrella patens." Genes & Genetic Systems 84 (5): 379-384.
Okamura, H. (2004). "Clock genes in cell clocks: roles, actions, and mysteries." Journal of Biological Rhythms 19 (5): 388-399.
Oklejewicz, M.; Destici, E.; Tamanini, F.; Hut, R. A.; Janssens, R. and van der Horst, G. T. (2008). "Phase resetting of the mammalian circadian clock by DNA damage." Current Biology 18 (4): 286-291.

249 Appendix A Ouyang, S.; Zhu, W.; Hamilton, J.; Lin, H.; Campbell, M.; Childs, K.; Thibaud-Nissen, F.; Malek, R. L.; Lee, Y.,
et al. (2007). "The TIGR Rice Genome Annotation Resource: improvements and new features." Nucleic Acids Research 35 (Database issue): D883-887.
Palazzo, A. F. and Akef, A. (2012). "Nuclear export as a key arbiter of “mRNA identity” in eukaryotes." Biochimica et Biophysica Acta (BBA) - Gene Regulatory Mechanisms 1819 (6): 566-577.
Pan, Q.; Saltzman, A. L.; Kim, Y. K.; Misquitta, C.; Shai, O.; Maquat, L. E.; Frey, B. J. and Blencowe, B. J. (2006). "Quantitative microarray profiling provides evidence against widespread coupling of alternative splicing with nonsense-mediated mRNA decay to control gene expression." Genes & Development 20 (2): 153-158.
Pan, Q.; Shai, O.; Lee, L. J.; Frey, B. J. and Blencowe, B. J. (2008). "Deep surveying of alternative splicing complexity in the human transcriptome by high-throughput sequencing." Nature Genetics 40 (12): 1413-1415.
Para, A.; Farré, E. M.; Imaizumi, T.; Pruneda-Paz, J. L.; Harmon, F. G. and Kay, S. A. (2007). "PRR3 is a vascular regulator of TOC1 stability in the Arabidopsis circadian clock." The Plant Cell 19 (11): 3462-3473.
Park, D. H.; Somers, D. E.; Kim, Y. S.; Choy, Y. H.; Lim, H. K.; Soh, M. S.; Kim, H. J.; Kay, S. A. and Nam, H. G. (1999). "Control of Circadian Rhythms and Photoperiodic Flowering by the Arabidopsis GIGANTEA Gene." Science 285 (5433): 1579-1582.
Patel, R. K. and Jain, M. (2011). "PlantRGS: A Web Server for the Identification of Most Suitable Candidate Reference Genes for Quantitative Gene Expression Studies in Plants." DNA Research 18 (6): 463-470.
Paterson, A. H.; Bowers, J. E.; Bruggmann, R.; Dubchak, I.; Grimwood, J.; Gundlach, H.; Haberer, G.; Hellsten, U.; Mitros, T., et al. (2009). "The Sorghum bicolor genome and the diversification of grasses." Nature 457: 551-556.
Paterson, A. H.; Freeling, M.; Tang, H. and Wang, X. (2010). "Insights from the comparison of plant genome sequences." Annual Review of Plant Biology 61: 349-372.
Paterson, A. H.; Lin, Y. R.; Li, Z.; Schertz, K. F.; Doebley, J. F.; Pinson, S. R.; Liu, S. C.; Stansel, J. W. and Irvine, J. E. (1995). "Convergent domestication of cereal crops by independent mutations at corresponding genetic Loci." Science 269 (5231): 1714-1718.
Paule, M. R. and Lofquist, A. K. (1996). Organization and Expression of Eukaryotic Ribossomal RNA genes. Ribosomal RNA: structure, evolution, processing, and function in protein biosynthesis. R. A. Zimmermann and A. E. Dahlberg. Boca Raton, FL - USA, CRC Press - Inc.: 395-419.
Pearson, H. (2008). "Language: disputed definitions." Nature 455 (7216): 1023-1028. Penfield, S. (2008). "Temperature perception and signal transduction in plants." New Phytologist 179 (3): 615-628. Perales, M. and Más, P. (2007). "A Functional Link between Rhythmic Changes in Chromatin Structure and the
Arabidopsis Biological Clock." The Plant Cell 19 (7): 2111-2123. Pérez-Ortín, J. E.; Miguel-Jiménez, L. and Chávez, S. (2012). "Genome-wide studies of mRNA synthesis and
degradation in eukaryotes." Biochimica et Biophysica Acta 1819 (6): 604-615. Perez-Santángelo, S.; Schlaen, R. G. and Yanovsky, M. J. (2013). "Genomic analysis reveals novel connections
between alternative splicing and circadian regulatory networks." Briefings in functional genomics 12 (1): 13-24.
Philips, T. (2008). "Regulation of transcription and gene expression in eukaryotes." Nature Education 1 (1). Pihlajamäki, J.; Lerin, C.; Itkonen, P.; Boes, T.; Floss, T.; Schroeder, J.; Dearie, F.; Crunkhorn, S.; Burak, F., et al.
(2011). "Expression of the Splicing Factor Gene SFRS10 Is Reduced in Human Obesity and Contributes to Enhanced Lipogenesis." Cell Metabolism 14 (2): 208-218.
Pin, P. A. and Nilsson, O. (2012). "The multifaceted roles of FLOWERING LOCUS T in plant development." Plant, Cell & Environment 35 (10): 1742-1755.
Pittendrigh, C. S. (1965). Biological clocks: the functions, ancient and modern, of circadian oscillations. Science in the sixties. D. L. Arm. Albuquerque, University of New Mexico, Office of Publications, Air Force Office of Scientific Research. 10: 95-111.
Pittendrigh, C. S. and Takamura, T. (1989). "Latitudinal clines in the properties of a circadian pacemaker." Journal of Biological Rhythms 4 (2): 217-235.
Plaza (2011). A resource for plant comparative genomics. http://bioinformatics.psb.ugent.be/plaza/. Pokhilko, A.; Fernández, A. P.; Edwards, K. D.; Southern, M. M.; Halliday, K. J. and Millar, A. J. (2012). "The
clock gene circuit in Arabidopsis includes a repressilator with additional feedback loops." Molecular Systems Biology 8: 574.
Pokhilko, A.; Hodge, S. K.; Stratford, K.; Knox, K.; Edwards, K. D.; Thompson, A. W.; Mizuno, T. and Millar, A. J. (2010). "Data assimilation constrains new connections and components in a complex, eukaryotic circadian clock model." Molecular Systems Biology 6: 416.
Preston, J. C. and Sandve, S. R. (2013). "Adaptation to seasonality and the winter freeze." Frontiers in Plant Science 4: 167.
Prosdocimi, F.; Chisham, B.; Pontelli, E.; Thompson, J. D. and Stoltzfus, A. (2009). "Initial implementation of a comparative data analysis ontology." Evolutionary Bioinformatics Online 5: 47-66.
Proudfoot, N. J. (2011). "Ending the message: poly(A) signals then and now." Genes & Development 25 (17): 1770-1782.

250 Appendix A Proudfoot, N. J.; Furger, A. and Dye, M. J. (2002). "Integrating mRNA processing with transcription." Cell 108 (4):
501-512. Pruneda-Paz, J. L. and Kay, S. A. (2010). "An expanding universe of circadian networks in higher plants." Trends in
Plant Science 15 (5): 259-265. Puruggannan, M. D. and Fuller, D. Q. (2009). "The nature of selection during plant domestication." Nature 457:
843-848. Quecini, V.; Zucchi, M. I.; Baldin, J. and Vello, N. A. (2007). "Identification of Soybean Genes Involved in
Circadian Clock Mechanism and Photoperiodic Control of Flowering Time by In Silico Analyses." Journal of Integrative Plant Biology 49 (11): 1640-1653.
Ramos, A.; Pérez-Solís, E.; Ibáñez, C.; Casado, R.; Collada, C.; Gómez, L.; Aragoncillo, C. and Allona, I. (2005). "Winter disruption of the circadian clock in chestnut." Proceedings of the National Academy of Sciences USA 102 (19): 7037-7042.
Rawson, H. M. and Macpherson, H. G. (2010). Describing the growth of your crop as stages. During which stages is yield determined? Irrigated Wheat: Managing Your Crop, Food & Agriculture Organization of the United Nations (FAO).
Rebbapragada, I. and Lykke-Andersen, J. (2009). "Execution of nonsense-mediated mRNA decay: what defines a substrate?" Current Opinion in Cell Biology 21 (3): 394-402.
Reddy, A. S. (2007). "Alternative splicing of pre-messenger RNAs in plants in the genomic era." Annual Review of Plant Biology 58: 267-294.
Reddy, A. S.; Day, I. S.; Göhring, J. and Barta, A. (2012a). "Localization and Dynamics of Nuclear Speckles in Plants." Plant Physiology 158 (1): 67-77.
Reddy, A. S.; Rogers, M. F.; Richardson, D. N.; Hamilton, M. and Ben-Hur, A. (2012b). "Deciphering the plant splicing code: experimental and computational approaches for predicting alternative splicing and splicing regulatory elements." Frontiers in Plant Science 3: 18.
Reddy, A. S. and Shad, A. G. (2011). "Plant serine/arginine-rich proteins: roles in precursor messenger RNA splicing, plant development, and stress responses." Wiley Interdisciplinary Reviews: RNA. 2 (6): 875-889.
Reed, M. O.; Ai, Y.; Leutcher, J. L. and Jane, J. L. (2013). "Effects of cooking methods and starch structures on starch hydrolysis rates of rice." Journal of Food Science 78 (7): H1076-1081.
Rensing, S. A.; Lang, D.; Zimmer, A. D.; Terry, A.; Salamov, A.; Shapiro, H.; Nishiyama, T.; Perroud, P. F.; Lindquist, E. A., et al. (2008). "The Physcomitrella genome reveals evolutionary insights into the conquest of land by plants." Science 319 (5859): 64-69.
Reppert, S. M. and Weaver, D. R. (2001). "Molecular analysis of mammalian circadian rhythms." Annual Review of Physiology 63 (647-676).
Reue, K. and Brindley, D. N. (2008). "Glycerolipids. Multiple roles for lipins/phosphatidate phosphatase enzymes in lipid metabolism." Journal of Lipid Research 49 (12): 2493-2503.
Roberts, E. H.; Summerfield, R. J.; Cooper, J. P. and Ellis, R. H. (1988). "Environmental control of flowering in barley (Hordeum vulgare L.). I. Photoperiod limits to long-day responses, photoperiod-insensitive phases and effect of low temperature and short-day vernalization." Annals of Botany 62: 127-144.
Rogozin, I. B.; Carmel, L.; Csuros, M. and Koonin, E. V. (2012). "Origin and evolution of spliceosomal introns." Biology Direct 7: 11.
Rojas-Duran, M. F. and Gilbert, W. V. (2012). "Alternative transcription start site selection leads to large differences in translation activity in yeast." RNA 18: 2299-2305.
Saito, H.; Ogiso-Tanaka, E.; Okumoto, Y.; Yoshitake, Y.; Izumi, H.; Yokoo, T.; Matsubara, K.; Hori, K.; Yano, M., et al. (2012). "Ef7 Encodes an ELF3-like Protein and Promotes Rice Flowering by Negatively Regulating the Floral Repressor Gene Ghd7 under Both Short- and Long-Day Conditions." Plant and Cell Physiology 53 (4): 717-728.
Saitou, N. and Nei, M. (1987). "The Neighbor-joining Method: A new method for reconstructing phylogenetic trees." Molecular Biology and Evolution 4 (4): 406-425.
Salomé, P. A. and McClung, C. R. (2005). "PSEUDO-RESPONSE REGULATOR 7 and 9 are partially redundant genes essential for the temperature responsiveness of the Arabidopsis circadian clock." The Plant Cell 17 (3): 791-803.
Salomé, P. A.; Weigel, D. and McClung, C. R. (2010). "The role of the Arabidopsis morning loop components CCA1, LHY, PRR7, and PRR9 in temperature compensation." The Plant Cell 22 (11): 3650-3661.
Salter, M. G.; Franklin, K. A. and Whitelam, G. C. (2003). "Gating of the rapid shade-avoidance response by the circadian clock in plants." Nature 426: 680-683.
Saltzman, A. L.; Kim, Y. K. and Pan, Q. (2008). "Regulation of Multiple Core Spliceosomal Proteins by Alternative Splicing-Coupled Nonsense-Mediated mRNA Decay." Molecular and Cellular Biology 28 (13): 4320-4330.
Sambrook, J.; Fritsch, E. F. and Maniatis, T. (1989). Molecular Cloning. NY, United States, Cold Spring Harbor Laboratory Press.
Sanchez, S. E.; Petrillo, E.; Beckwith, E. J.; Zhang, X.; Rugnone, M. L.; Hernando, C. E.; Cuevas, J. C.; Godoy Herz, M. A.; Depetris-Chauvin, A., et al. (2010). "A methyl transferase links the circadian clock to the regulation of alternative splicing." Nature 468 (7320): 112-116.

251 Appendix A Sanchez, S. E.; Petrillo, E.; Kornblihtt, A. R. and Yanovsky, M. J. (2011). "Alternative splicing at the right time."
RNA Biology 8 (6): 954-959. Sapp, J. (2005). "The prokaryote-eukaryote dichotomy: meanings and mythology." Microbiology and Molecular
Biology Reviews 69 (2): 292-305. Saraiya, A. A. and Wang, C. C. (2008). "snoRNA, a novel precursor of microRNA in Giardia lamblia." PLoS
Pathogens 4 (11): e1000224. Satbhai, S. B.; Yamashino, T.; Okada, R.; Nomoto, Y.; Mizuno, T.; Tezuka, Y.; Itoh, T.; Tomita, M.; Otsuki, S., et
al. (2010). "Pseudo-response regulator (PRR) homologues of the moss Physcomitrella patens: insights into the evolution of the PRR family in land plants." DNA Research 18 (1): 39-52.
Sawa, M. and Kay, S. A. (2011). "GIGANTEA directly activates Flowering Locus T in Arabidopsis thaliana." Proceedings of the National Academy of Sciences USA 108 (28): 11698-11703.
Sawa, M.; Nusinow, D. A.; Kay, S. A. and Imaizumi, T. (2007). "FKF1 and GIGANTEA complex formation is required for day-length measurement in Arabidopsis." Science 318 (5848): 261-265.
Sawicka, K.; Bushell, M.; Spriggs, K. A. and Willis, A. E. (2008). "Polypyrimidine-tract-binding protein: a multifunctional RNA-binding protein." Biochemical Society Transactions 36 (4): 641-647.
Schmucker, K.; Clemens, J. C.; Shu, H.; Worby, C. A.; Xiao, J.; Muda, M.; Dixon, J. E. and Zipursky, S. L. (2000). "Drosophila Dscam is an axon guidance receptor exhibiting extraordinary molecular diversity." Cell 101 (6): 671-684.
Schnable, J. C.; Wang, X.; Pires, J. C. and Freeling, M. (2012). "Escape from preferential retention following repeated whole genome duplications in plants." Frontiers in Plant Science 3: 94.
Schoenhard, J. A.; Eren, M.; Johnson, C. H. and Vaughan, D. E. (2002). "Alternative splicing yields novel BMAL2 variants: tissue distribution and functional characterization." American Journal of Physiology. Cell Physiology 283 (1): C103-114.
Schöning, J. C.; Streitner, C.; Meyer, I. M.; Gao, Y. and Staiger, D. (2008). "Reciprocal regulation of glycine-rich RNA-binding proteins via an interlocked feedback loop coupling alternative splicing to nonsense-mediated decay in Arabidopsis." Nucleic Acids Research 36 (22): 6977-6987.
Schultz, T. F.; Kiyosue, T.; Yanovsky, M.; Wada, M. and Kay, S. A. (2001). "A role for LKP2 in the circadian clock of Arabidopsis." The Plant Cell 13 (12): 2659-2670.
Schwartz, S.; Meshorer, E. and Ast, G. (2009). "Chromatin organization marks exon–intron structure." Nature Structural & Molecular Biology 16 (9): 990-995.
Schwartz, S.; Silva, J.; Burstein, D.; Pupko, T.; Eyras, E. and Ast, G. (2008). "Large-scale comparative analysis of splicing signals and their corresponding splicing factors in eukaryotes." Genome Research 18 (1): 88-103.
Schwerk, C. and Schulze-Osthoff, K. (2005). "Regulation of apoptosis by alternative pre-mRNA splicing." Molecular Cell 19 (1): 1-13.
Seo, P. J.; Kim, M. J.; Ryu, J. Y.; Jeong, E. Y. and Park, C. M. (2011). "Two splice variants of the IDD14 transcription factor competitively form nonfunctional heterodimers which may regulate starch metabolism." Nature Communications 2: 303.
Seo, P. J.; Park, M. J.; Lim, M. H.; Kim, S. G.; Lee, M.; Baldwin, I. T. and Park, C. M. (2012). "A Self-Regulatory Circuit of CIRCADIAN CLOCK-ASSOCIATED1 Underlies the Circadian Clock Regulation of Temperature Responses in Arabidopsis." The Plant Cell 6: 2427-2442.
Serikawa, M.; Miwa, K.; Kondo, T. and Oyama, T. (2008). "Functional conservation of clock-related genes in flowering plants: overexpression and RNA interference analyses of the circadian rhythm in the monocotyledon Lemna gibba." Plant Physiology 146 (4): 1952-1963.
Severing, E. I.; van Dijk, A. D.; Stiekema, W. J. and van Ham, R. C. (2009). "Comparative analysis indicates that alternative splicing in plants has a limited role in functional expansion of the proteome." BMC Genomics 10: 154.
Severing, E. I.; van Dijk, A. D. and Van Ham, R. C. (2011). "Assessing the contribution of alternative splicing to proteome diversity in Arabidopsis thaliana using proteomics data." BMC Plant Biology 11 (1): 82.
Shapiro-Reznik, M.; Jilq, A.; Lerner, H.; Earnest, D. J. and Zisapel, N. (2012). "Diurnal rhythms in neurexins transcripts and inhibitory/excitatory synapse scaffold proteins in the biological clock." PLoS One 7 (5): e37894.
Sherstnev, A.; Duc, C.; Cole, C.; Zacharaki, V.; Hornyik, C.; Ozsolak, F.; Milos, P. M.; Barton, G. J. and Simpson, G. G. (2012). "Direct sequencing of Arabidopsis thaliana RNA reveals patterns of cleavage and polyadenylation." Nature Structural & Molecular Biology 19 (8): 845-852.
Shi, S. Q.; Ansari, T. S.; McGuinness, O. P.; Wasserman, D. H. and Johnson, C. H. (2013). "Circadian Disruption Leads to Insulin Resistance and Obesity." Current Biology 23: 372-381.
Shimada, S.; Ogawa, T.; Kitagawa, S.; Suzuki, T.; Ikari, C.; Shitsukawa, N.; Abe, T.; Kawahigashi, H.; Kikuchi, R., et al. (2009). "A genetic network of flowering-time genes in wheat leaves, in which an APETALA1/FRUITFULL-like gene, VRN1, is upstream of FLOWERING LOCUS T." The Plant Journal 58 (4): 668-681.
Shuman, S. (2002). "What messenger RNA capping tells us about eukaryotic evolution." Nature Reviews Molecular Cell Biology 3 (8): 619-625.
Silverstone, A. L. and Sun, T.-P. (2000). "Gibberellins and the green revolution." Trends in Plant Science 5 (1): 1-2.

252 Appendix A Simpson, C. G.; Fuller, J.; Maronova, M.; Kalyna, M.; Davidson, D.; McNicol, J.; Barta, A. and Brown, J. W. S.
(2008). "Monitoring changes in alternative precursor messenger RNA splicing in multiple gene transcripts." The Plant Journal 53 (6): 1035-1048.
Simpson, C. G.; Jennings, S. N.; Clark, G. P.; Thow, G. and Brown, J. W. S. (2004). "Dual functionality of a plant U-rich intronic sequence element." Plant Journal 37 (1): 82-91.
Simpson, G. G. (2004). "The autonomous pathway: epigenetic and post-transcriptional gene regulation in the control of Arabidopsis flowering time." Current Opinion in Plant Biology 7 (5): 570-574.
Singh, K. B. (1998). "Transcriptional regulation in plants: the importance of combinatorial control." Plant Physiology 118 (4): 1111-1120.
Skene, P. J. and Henikoff, S. (2013). "Histone variants in pluripotency and disease." Development 140: 2513-2524. Song, H. R.; Ito, S. and Imaizumi, T. (2010). "Similarities in the circadian clock and photoperiodism in plants."
Current Opinion in Plant Biology 13 (5): 594-603. Song, S. W.; Fuller, G. N.; Zheng, H. and Zhang, W. (2005). "Inactivation of the Invasion Inhibitory Gene IIp45 by
Alternative Splicing in Gliomas." Cancer Research 65 (9): 3562-3567. Song, Y. H.; Smith, R. W.; To, B. J.; Millar, A. J. and Imaizumi, T. (2012). "FKF1 conveys timing information for
CONSTANS stabilization in photoperiodic flowering." Science 336 (6084): 1045-1049. Spannagl, M.; Mayer, K.; Durner, J.; Haberer, G. and Fröhlich, A. (2011). "Exploring the genomes: from
Arabidopsis to crops." Journal of Plant Physiology 168 (1): 3-8. Srikanth, A. and Schmid, M. (2011). "Regulation of flowering time: all roads lead to Rome." Cell and Molecular Life
Sciences 68 (12): 2013-2037. Staiger, D. and Brown, J. W. S. (2013). Alternative splicing – a key regulator. Biological Timing, Development, and
Stress Responses. The Plant Cell. submitted. Staiger, D.; Korneli, C.; Lummer, M. and Navarro, L. (2013). "Emerging role for RNA-based regulation in plant
immunity." New Phytologist 197 (2): 394-404. Staley, J. P. and Woolford, J. L. J. (2009). "Assembly of ribosomes and spliceosomes: complex ribonucleoprotein
machines." Current Opinion in Cell Biology 21 (1): 109-118. Stamm, S.; Ben-Ari, S.; Rafalska, I.; Tang, Y.; Zhang, Z.; Toiber, D.; Thanaraj, T. A. and Soreq, H. (2005).
"Function of alternative splicing." Gene 344: 1-20. Stetefeld, J. and Ruegg, M. A. (2005). "Structural and functional diversity generated by alternative mRNA splicing."
Trends in Biochemical Sciences 30 (9): 515-521. Stewart, C. L.; Stuhlmann, H.; Jähner, D. and Jaenisch, R. (1982). "De novo methylation, expression, and
infectivity of retroviral genomes introduced into embryonal carcinoma cells." Proceedings of the National Academy of Sciences USA 79 (13): 4098-4102.
Stoleru, D.; Peng, Y.; Agosto, J. and Rosbash, M. (2004a). "Coupled oscillators control morning and evening locomotor behaviour of Drosophila." Nature 431 (7010): 862-868.
Stoleru, D.; Peng, Y.; Agosto, J. and Rosbash, M. (2004b). "Coupled oscillators control morning and evening locomotor behaviour of Drosophila." Nature 431 (7010): 862-868.
Streitner, C.; Köster, T.; Simpson, C. G.; Shaw, P.; Danisman, S.; Brown, J. W. S. and Staiger, D. (2012). "An hnRNP-like RNA-binding protein affects alternative splicing by in vivo interaction with transcripts in Arabidopsis thaliana." Nucleic Acids Research 40 (22): 11240-11255.
Suetsugu, N. and Wada, M. (2013). "Evolution of three LOV blue light receptor families in green plants and photosynthetic stramenopiles: phototropin, ZTL/FKF1/LKP2 and aureochrome." Plant and Cell Physiology 54 (1): 8-23.
Svejstrup, J. Q. (2004). "The RNA polymerase II transcription cycle: cycling through chromatin." Biochimica et Biophysica Acta (BBA) - Gene Structure and Expression 1677 (1-3): 64-73.
Syed, N. H.; Kalyna, M.; Marquez, Y.; Barta, A. and Brown, J. W. S. (2012). "Alternative splicing in plants – coming of age." Trends in Plant Science 17 (10): 616-623.
Takabatake, R.; Seo, S.; Mitsuhara, I.; Tsuda, S. and Ohashi, Y. (2006). "Accumulation of the two transcripts of the N gene, conferring resistance to tobacco mosaic virus, is probably important for N gene-dependent hypersensitive cell death." Plant and Cell Physiology 47 (2): 254-261.
Takase, M.; Mizoguchi, T.; Kozuka, T. and Tsukaya, H. (2013). "The unique function of the Arabidopsis circadian clock gene PRR5 in the regulation of shade avoidance response." Plant Signaling & Behaviour 8 (4): pii: e23534.
Takata, N.; Saito, S.; Saito, C. T.; Nanjo, T.; Shinohara, K. and Uemura, M. (2009). "Molecular phylogeny and expression of poplar circadian clock genes, LHY1 and LHY2." New Phytologist 181 (4): 808-819.
Takata, N.; Saito, S.; Saito, C. T. and Uemura, M. (2010). "Phylogenetic footprint of the plant clock system in angiosperms: evolutionary processes of Pseudo-Response Regulators." BMC Evolutionary Biology 10: 126.
Takeda, J. I.; Suzuki, Y.; Sakate, R.; Sato, Y.; Seki, M.; Irie, T.; Takeuchi, N.; Ueda, T.; Nakao, M., et al. (2008). "Low conservation and species-specific evolution of alternative splicing in humans and mice: comparative genomics analysis using well-annotated full-length cDNAs." Nucleic Acids Research 36 (20): 6386-6395.
Talbert, P. B. and Henikoff, S. (2010). "Histone variants — ancient wrap artists of the epigenome." Nature Reviews Molecular Cell Biology 11 (4): 264-275.

253 Appendix A Tamura, K.; Nei, M. and Kumar, S. (2004). "Prospects for inferring very large phylogenies by using the neighbor-
joining method. ." Proceedings of the National Academy of Sciences USA 101: 11030-11035. Tamura, K.; Peterson, D.; Peterson, N.; Stecher, G.; Nei, M. and Kumar, S. (2011). "MEGA5: Molecular
Evolutionary Genetics Analysis using Maximum Likelihood, Evolutionary Distance, and Maximum Parsimony Methods. Molecular Biology and Evolution." Molecular Biology and Evolution 28 (10): 2731-2739.
Tauber, E.; Last, K. S.; Olive, P. J. W. and Kyriacou, C. P. (2004). "Clock gene evolution and functional divergence." Journal of Biological Rhythms 19 (5): 445-458.
Tazi, J.; Bakkour, N. and Stamm, S. (2009). "Alternative splicing and disease." Biochimica et Biophysica Acta 1792 (1): 14-26.
Thines, B. and Harmon, F. G. (2010). "Ambient temperature response establishes ELF3 as a required component of the core Arabidopsis circadian clock." Proceedings of the National Academy of Sciences USA 107 (7): 3257-3262.
Thuiller, W.; Lavorel, S.; Araújo, M. B.; Sykes, M. T. and Prentice, I. C. (2005). "Climate change threats to plant diversity in Europe." Proceedings of the National Academy of Sciences USA 102 (23): 8245-8250.
Tóth, R.; Kevei, E.; Hall, A.; Millar, A. J.; Nagy, F. and Kozma-Bognár, L. (2001). "Circadian clock-regulated expression of phytochrome and cryptochrome genes in Arabidopsis." Plant Physiology 127 (4): 1607-1616.
Trevaskis, B. (2012) Mutations in a circadian regulator contribute to crop adaptation. Flowering Highlights http://floweringhighlights.org/,
Turck, F.; Fornara, F. and Coupland, G. (2008). "Regulation and Identity of Florigen: FLOWERING LOCUS T Moves Center Stage." Annual Review of Plant Biology 59: 573-594.
Turner, A.; Beales, J.; Faure, S.; Dunford, R. P. and Laurie, D. (2005). "The Pseudo-Response Regulator Ppd-H1 Provides Adaptation to Photoperiod in Barley." Science 310 (5750): 1031-1034.
Uchida, Y.; Hirayama, J. and Nishina, H. (2010). "A common origin: signaling similarities in the regulation of the circadian clock and DNA damage responses." Biological & Pharmaceutical Bulletin 33 (4): 535-544.
Umate, P. (2010). "Genome-wide analysis of the family of light-harvesting chlorophyll a/b-binding proteins in Arabidopsis and rice." Plant Signaling & Behavior 5 (12): 1537-1542.
Vallelian-Bindschedler, L.; Mösinger, E.; Métraux, J. P. and Schweizer, P. (1998). "Structure, expression and localization of a germin-like protein in barley (Hordeum vulgare L.) that is insolubilized in stressed leaves." Plant Molecular Biology 37 (2): 297-308.
Valverde, F. (2011). "CONSTANS and the evolutionary origin of photoperiodic timing of flowering." Journal of Experimental Botany 62 (8): 2453-2463.
Valverde, F.; Mouradov, A.; Soppe, W.; Ravenscroft, D.; Samach, A. and Coupland, G. (2004). "Photoreceptor Regulation of CONSTANS Protein in Photoperiodic Flowering." Science 303 (5660): 1003-1006.
van den Pol, A. N. and Dudek, F. E. (1993). "Cellular communication in the circadian clock, the suprachiasmatic nucleus." Neuroscience 56: 793-811.
van Oort, B. E.; Tyler, N. J.; Gerkema, M. P.; Folkow, L.; Blix, A. S. and Stokkan, K. A. (2005). "Circadian organization in reindeer." Nature 438 (7071): 1095-1096.
Vanin, S.; Bhutani, S.; Montelli, S.; Menegazzi, P.; Green, E. W.; Pegoraro, M.; Sandrelli, F.; Costa, R. and Kyriacou, C. P. (2012). "Unexpected features of Drosophila circadian behavioural rhythms under natural conditions." Nature 484 (7394): 371-375.
Vasudevan, S.; Peltz, S. W. and Wilusz, C. J. (2002). "Non-stop decay--a new mRNA surveillance pathway." BioEssays 24 (9): 785-788.
Veloso, F.; Riadi, G.; Aliaga, D.; Lieph, R. and Holmes, D. S. (2005). "Large-scale, multi-genome analysis of alternate open reading frames in bacteria and archaea." OMICS: A Journal of Integrative Biology 9 (1): 91-105.
Venables, J. P.; Tazi, J. and Juge, F. (2012). "Regulated functional alternative splicing in Drosophila." Nucleic Acids Research 40 (1): 1-10.
Villarreal, S. A.; Pattanayek, R.; Williams, D. R.; Mori, T.; Qin, X.; Johnson, C. H.; Egli, M. and Stewart, P. L. (2013). "CryoEM and Molecular Dynamics of the Circadian KaiB-KaiC Complex Indicates That KaiB Monomers Interact with KaiC and Block ATP Binding Clefts." Journal of Molecular Biology, 10.1016/j.jmb.2013.06.018.
Walters, B.; Lum, G.; Sablok, G. and Min, X. J. (2013). "Genome-wide landscape of alternative splicing events in Brachypodium distachyon." DNA Research 20 (2): 163-171.
Wang, G. S. and Cooper, T. A. (2007). "Splicing in disease: disruption of the splicing code and the decoding machinery." Nature Reviews Genetics 8 (10): 749-761.
Wang, J.-D.; Lo, S.-F.; Li, Y.-S.; Chen, P.-J.; Lin, S.-Y.; Ho, T.-Y.; Lin, J.-H. and CHen, L.-J. (2013). "Ectopic expression of OsMADS45 activates the upstream genes Hd3a and RFT1 at an early development stage causing early flowering in rice." Botanical Studies 54: 12.
Wang, W.; Barnaby, J. Y.; Tada, Y.; Li, H.; Tör, M.; Caldelari, D.; Lee, D. U.; Fu, X. D. and Dong, X. (2011a). "Timing of plant immune responses by a central circadian regulator." Nature 470 (7332): 110-114.
Wang, X.; Wu, F.; Xie, Q.; Wang, H.; Wang, Y.; Yue, Y.; Gahura, O.; Ma, S.; Liu, L., et al. (2012). "SKIP Is a Component of the Spliceosome Linking Alternative Splicing and the Circadian Clock in Arabidopsis." The Plant Cell 24: 3278-3295.

254 Appendix A Wang, X.; Wu, L.; Zhang, S.; Wu, L.; Ku, L.; Wei, X.; Xie, L. and Chen, Y. (2011b). "Robust expression and
association of ZmCCA1 with circadian rhythms in maize." Plant Cell Reports 30 (7): 1261-1272. Weill, L.; Belloc, E.; Bava, F.-A. and Méndez, R. (2012). "Translational control by changes in poly(A) tail length:
recycling mRNAs." Nature Structural & Molecular Biology 19 (6): 577-585. Wenden, B.; Kozma-Bognár, L.; Edwards, K. D.; Hall, A. J.; Locke, J. C. and Millar, A. J. (2011a). "Light inputs
shape the Arabidopsis circadian system." Plant Journal 66 (3): 480-491. Wenden, B.; Kozma-Bognár, L.; Edwards, K. D.; Hall, A. J.; Locke, J. C. and Millar, A. J. (2011b). "Light inputs
shape the Arabidopsis circadian system." The Plant Journal 66 (3): 480-491. Wenden, B.; Toner, D. L. K.; Hodge, S. K.; Grima, R. and Millar, A. J. (2012). "Spontaneous spatiotemporal
waves of gene expression from biological clocks in the leaf." Proceedings of the National Academy of Sciences USA 109 (17): 6757-6752.
Werneke, J. M.; Chatfield, J. H. and Ogren, W. L. (1989). "Alternative mRNA splicing generates the two ribulosebisphosphate carboxylase/oxygenase activase polypeptides in spinach and Arabidopsis." The Plant Cell 1 (8): 815-825.
White, R. J. (2011). "Transcription by RNA polymerase III: more complex than we thought." Nature Reviews Genetics 12 (7): 459-463.
Wigge, P. A. (2013). "Ambient temperature signalling in plants." Current Opinion in Plant Biology 16 (5): 661-666. Wijnen, H. and Young, M. W. (2006). "Interplay of circadian clocks and metabolic rhythms." Annual Review of
Genetics 40: 409-448. Wilczek, A. M.; Roe, J. L.; Knapp, M. C.; Cooper, M. D.; Lopez-Gallego, C.; Martin, L. J.; Muir, C. D.; Sim, S.;
Walker, A., et al. (2009). "Effects of genetic perturbation on seasonal life history plasticity." Science 323 (5916): 930-934.
Wilkie, S. E.; Vaclavik, V.; Wu, H.; Bujakowska, K.; Chakarova, C. F.; Bhattacharya, S. S.; Warren, M. J. and Hunt, D. M. (2008). "Disease mechanism for retinitis pigmentosa (RP11) caused by missense mutations in the splicing factor gene PRPF31." Molecular Vision 14: 683-690.
Will, C. L. and Lührmann, r. (2011). "Spliceosome structure and function." Cold Spring Harbor Perspectives in Biology 3 (7): pii: a003707.
Woelfle, M. A. and Johnson, C. H. (2006). "No Promoter Left Behind: Global Circadian Gene Expression in Cyanobacteria." Journal of Biological Rhythms 21 (6): 419-431.
Wu, X. and Brewer, G. (2012). "The regulation of mRNA stability in mammalian cells: 2.0." Gene 500 (1): 10-21. Xiao, X.; Wang, Z.; Jang, M. and Burge, C. B. (2007). "Coevolutionary networks of splicing cis-regulatory
elements." Proceedings of the National Academy of Sciences USA 104 (47): 18583-18588. Xu, X.; Yang, D.; Ding, J. H.; Wang, W.; Chu, P. H.; Dalton, N. D.; Wang, H. Y.; Bermingham, J. R. J.; Ye, Z., et
al. (2005). "ASF/SF2-regulated CaMKIIdelta alternative splicing temporally reprograms excitation-contraction coupling in cardiac muscle." Cell 120 (1): 59-72.
Xue, W.; Xing, Y. Y.; Weng, X.; Zhao, Y.; Tang, W.; Wang, L.; Zhou, H.; Yu, S.; Xu, C., et al. (2008). "Natural variation in Ghd7 is an important regulator of heading date and yield potential in rice." Nature 40 (6): 761-767.
Xue, Y.; Zhou, Y.; Wu, T.; Zhu, T.; Ji, X.; Kwon, Y. S.; Zhang, C.; Yeo, G.; Black, D. L., et al. (2009). "Genome-wide analysis of PTB-RNA interactions reveals a strategy used by the general splicing repressor to modulate exon inclusion or skipping." Molecular Cell 36 (6): 996-1006.
Yakir, E.; Hilman, D.; Hassidim, M. and Green, R. M. (2007). "CIRCADIAN CLOCK ASSOCIATED1 transcript stability and the entrainment of the circadian clock in Arabidopsis." Plant Physiology 145 (3): 925-932.
Yamamoto, Y.; Sato, E.; Shimizu, T.; Nakamich, N.; Sato, S.; Kato, T.; Tabata, S.; Nagatani, A.; Yamashino, T., et al. (2003). "Comparative genetic studies on the APRR5 and APRR7 genes belonging to the APRR1/TOC1 quintet implicated in circadian rhythm, control of flowering time, and early photomorphogenesis." Plant and Cell Physiology 44 (11): 1119-1130.
Yamori, W.; Hikosaka, K. and Way, D. A. (2013). "Temperature response of photosynthesis in C3, C 4, and CAM plants: temperature acclimation and temperature adaptation." Photosynthesis Research DOI 10.1007/s11120-013-9874-6.
Yan, L.; Fu, D.; Li, C.; Blechl, A.; Tranquilli, G.; Bonafede, M.; Sanchez, A.; Valarik, M.; Yasuda, S., et al. (2006). "The wheat and barley vernalization gene VRN3 is an orthologue of FT." Proceedings of the National Academy of Sciences USA 103 (51): 19581-19586.
Yang, H.; Hu, L.; Hurek, T. and Reinhold-Hurek, B. (2010). "Global characterization of the root transcriptome of a wild species of rice, Oryza longistaminata, by deep sequencing." BMC Genomics 11: 705.
Yang, Y.; Peng, Q.; Chen, G. X.; Li, X. H. and Wu, C. Y. (2013). "OsELF3 is Involved in Circadian Clock Regulation for Promoting Flowering under Long-Day Conditions in Rice." Molecular Plant 6 (1): 202-215.
Yano, M.; Katayose, Y.; Ashikari, M.; Yamanouchi, U.; Monna, L.; Fuse, T.; Baba, T.; Yamamoto, K.; Umehara, Y., et al. (2000). "Hd1, a major photoperiod sensitivity quantitative trait locus in rice, is closely related to the Arabidopsis flowering time gene CONSTANS." The Plant Cell 12 (12): 2473-2484.
Yeo, G.; Holste, D.; Kreiman, G. and Burge, C. B. (2004). "Variation in alternative splicing across human tissues." Genome Biology 5 (10): R74.

255 Appendix A Yon, F.; Seo, P. J.; Ryu, J. Y.; Park, C. M.; Baldwin, I. T. and Kim, S. G. (2012). "Identification and
characterization of circadian clock genes in a native tobacco, Nicotiana attenuata." BMC Plant Biology 12: 172.
Yoon, S. H.; Han, M.-J.; Jeong, H.; Lee, C. H.; Xia, X.-X.; Lee, D.-H.; Shim, J. H.; Lee, S. Y.; Oh, T. K., et al. (2012). "Comparative multi-omics systems analysis of Escherichia coli strains B and K-12." Genome Biology 13 (5): R37.
Yoshida, R.; Fekih, R.; Fujiwara, S.; Oda, A.; Miyata, K.; Tomozoe, Y.; Nakagawa, M.; Niinuma, K.; Hayashi, K., et al. (2009). "Possible role of early flowering 3 (ELF3) in clock-dependent floral regulation by short vegetative phase (SVP) in Arabidopsis thaliana." The New Phytologist 182 (4): 838-850.
Young, M. W. and Kay, S. A. (2001). "Time zones: a comparative genetics of circadian clocks." Nature Reviews Genetics 2 (9): 702-715.
Yu, B. and Hinchcliffe, M. (2011). In Silico Tools for Gene Discovery, Humana Press. Yu, J. W.; Rubio, V.; Lee, N. Y.; Bai, S.; Lee, S. Y.; Kim, S. S.; Liu, L.; Zhang, Y.; Irigoyen, M. L., et al. (2008).
"COP1 and ELF3 control circadian function and photoperiodic flowering by regulating GI stability." Mollecular Cell 32 (5): 617-630.
Yu, W. and Hardin, P. E. (2006). "Circadian oscillators of Drosophila and mammals." Journal of Cell Science 119 (23): 4793-4795.
Yun, Y.; Adesanya, T. M. and Miltra, R. D. (2012). "A systematic study of gene expression variation at single-nucleotide resolution reveals widespread regulatory roles for uAUGs." Genome Research 22 (6): 1089-1097.
Zadoks, J. C.; Chang, T. T. and Konzak, C. F. (1974). "A decimal code for the growth stages of cereals." Weed Research 14 (6): 415-421.
Zagotta, M. T.; Hicks, K. A.; Jacobs, C. I.; Young, J. C.; Hangarter, R. P. and Meeks-Wagner, D. R. (1996). "The Arabidopsis ELF3 gene regulates vegetative photomorphogenesis and the photoperiodic induction of flowering." Plant Journal 10 (4): 691-702.
Zakhrabekova, S.; Gough, S. P.; Braumann, I.; Müller, A. H.; Lundqvist, J.; Ahmann, K.; Dockter, C.; Matyszczak, I.; Kurowska, M., et al. (2012). "Induced mutations in circadian clock regulator Mat-a facilitated short-season adaptation and range extension in cultivated barley." Proceedings of the National Academy of Sciences USA 109 (11): 4326-4331.
Zeilinger, M. N.; Farré, E. M.; Taylor, S. R.; Kay, S. A. and Doyle, F. J. r. (2006). "A novel computational model of the circadian clock in Arabidopsis that incorporates PRR7 and PRR9." Molecular Systems Biology 2: 58.
Zhang, C.; Xie, Q.; Andersson, R. G.; Ng, G.; Seitz, N. C.; Peterson, T.; McClung, C. R.; McDowell, J. M.; Kong, D., et al. (2013a). "Crosstalk between the circadian clock and innate immunity in Arabidopsis." PLoS Pathologens 9 (6): e1003370.
Zhang, E. E. and Kay, S. A. (2010). "Clocks not winding down: unravelling circadian networks." Nature Reviews Molecular Cell Biology 11 (764-776).
Zhang, G.; Guo, G.; Hu, X.; Zhang, Y.; Li, Q.; Li, R.; Zhuang, R.; Lu, Z.; He, Z., et al. (2010). "Deep RNA sequencing at single base-pair resolution reveals high complexity of the rice transcriptome." Genome Research 20 (5): 646-654.
Zhang, L.; Li, X. and Zhao, R. (2013b). "Structural analyses of the pre-mRNA splicing machinery." Protein Science 22 (6): 677-692.
Zhang, N.; Kallis, R. P.; Ewy, R. G. and Portis, A. R. J. (2002). "Light modulation of Rubisco in Arabidopsis requires a capacity for redox regulation of the larger Rubisco activase isoform." Proceedings of the National Academy of Sciences USA 99 (5): 3330-3334.
Zhang, S. F. (2011). Cloning and Characterization of Photoperiod Sensitive Gene ZmELF4 in Maize. Crop Genetics and Breeding, Henan Agricultural University. MSc.
Zhang, X.; Yazaki, J.; Sundaresan, A.; Cokus, S.; Chan, S. W.-L.; Chen, H.; Henderson, I. R.; Shinn, P.; Pellegrini, M., et al. (2006). "Genome-wide High-Resolution Mapping and Functional Analysis of DNA Methylation in Arabidopsis." Cell 126 (6): 1189-1201.
Zhang, Y.-Y.; Li, Y.; Gao, T.; Zhu, H.; Wang, D.-J.; Zhang, H.-W.; Ning, Y.-S.; Liu, L.-J.; Wu, Y.-R., et al. (2008). "Arabidopsis SDIR1 Enhances Drought Tolerance in Crop Plants." Bioscience, Biotechnology, and Biochemistry 72 (8): 2251-2254.
Zhao, J.; Huang, X.; Ouyang, X.; Chen, W.; Du, A.; Zhu, L.; Wang, S.; Deng, X. W. and Li, S. (2012). "OsELF3-1, an ortholog of Arabidopsis early flowering 3, regulates rice circadian rhythm and photoperiodic flowering." PLoS One 7 (8): e43705.
Zhao, X. Y.; Liu, M. S.; Li, J. R.; Guan, C. M. and Zhang, X. S. (2005). "The wheat TaGI1, involved in photoperiodic flowering, encodes an Arabidopsis GI ortholog." Plant Molecular Biology 58 (1): 53-64.
Zimmer, A.; Lang, D.; Richardt, S.; Frank, W.; Reski, R. and Rensing, S. A. (2007). "Dating the early evolution of plants: detection and molecular clock analyses of orthologs." Molecular Genetics and Genomics 278 (4): 393-402.

256 Appendix A
Appendix A. Material and Methods
A1 - Cereal Compost 225 L Levingtons M2 225 L Perlite 0.5 kg Osmocote mini 2.5 kg Celcote
Levingtons M2 is a medium grade and strength peat mixture. Perlite is used as a soil amendment because it prevents soil compaction. Osmocote mini contains fertiliser (16% N + 8% P2O5 + 11% K2O) and micronutrients (2% MgO, 0.02% B, 0.05% Cu, 0.4%Fe, 0.06% Mn, 0.02% Mo and 0.015% Zu). Celcote is a compost additive that increases water holding capaci-ty.
A2 - Diethyl pyro carbonate (DEPC)-treated solutions To treat solutions with DEPC, 0.1% DEPC (Sigma-Aldrich, UK) was added and mixed. Solutions were incubated at room temperature overnight. On the following day, solu-tions were autoclaved (high pressure steam at 121°C for 30 min).
A3 - Stock solutions
For pH measurements, a Kent EIL 7020 pH meter was used. After preparation, all so-lutions were autoclaved and stored at room temperature.
A3.1 3 M Sodium acetate (NaOAc) pH 5.5
40.82 g NaOAc (AnalaR NORMAPUR®, VWR International, Belgium) 50 mL Sterile distilled water (SDW)
Compounds were dissolved and pH was adjusted to 5.5 using glacial acetic acid (>10 mL). SDW was added to a final volume of 100 mL.
A3.2 1 M Tris-HCl pH 7.5
121.14 g Tris (Bio-Rad Laboratories, USA) 600 mL SDW
Compounds were dissolved and pH was adjusted to 7.5 using 2.5 N HCl. Final volume was adjusted to 1 L with SDW.
A3.3 5 M NaCl
29.22 g NaCl (AnalaR NORMAPUR®, VWR International, Belgium) 100 mL SDW
Compounds were mixed by stirring until salt was dissolved.

257 Appendix A
A3.4 500 mM Ethylenediaminetetraacetic acid (EDTA) pH 8.0
186.1 g Na2.EDTA.2H2O (Sigma-Aldrich, UK)
600 mL SDW
Compounds were dissolved and pH was adjusted to 8.0 using NaOH pellets (AnalaR NORMAPUR®, VWR International, Belgium). Final volume was adjusted to 1 L with SDW.
A3.5 10 % Sodium dodecyl sulphate (SDS)
50 g SDS (Sigma-Aldrich, UK)
400 mL SDW
Compounds were dissolved by stirring on a magnetic heating block (Magnetic Stirrer SM1, Stuart Scientific, UK) at 70 °C until SDS was dissolved. Final volume was adjusted to 500 mL with SDW.
A3.6 Tris-Borate-EDTA (TBE) Buffer (10X)
108 g Tris 55.0 g Orthoboric acid (AnalaR NORMAPUR®, Belgium) 40 mL 0.5 M EDTA (pH 8.0) 900 mL SDW
Compounds were mixed until salts were dissolved. Final volume was adjusted to 1 L with SDW. All electrophoresis gels were stained with ethidium bromide (0.5 μg/mL final con-centration) and observed under a UV transilluminator (G:Box, Syngene, UK).
A4 - gDNA extraction buffer 40 mL 1 M Tris-HCl pH 7.5 10 mL 5 M NaCl 10 mL 500 mM EDTA pH 8 10 mL 10 % SDS
Mix all solutions and make up to 200 mL using SDW.
A5 - Gene-specific primers used in clock and AS analyses
Table A5.1: Gene-specific primers of barley reference genes used in clock and AS analyses and their sequences.
Genes Primer name Sequence (5’ 3’) PP2AA2 HvPP2AA2-Ex2Fw CCGCATTGGTGCACAGATGAAAGA
HvPP2AA2-Ex3Rv CCAAGATTTGATGCAGCTGCCCTT UBC21 HvUBC-Ex3Fw AGTACAAGGAGGTGCAGCGAGAAA
HvUBC-Ex4Rv CTGCTCGGGAATTGAGAATGCAAG

258 Appendix A
Table A5.2: List of barley clock gene-specific primers used in clock and AS analyses and their sequences.
Genes Primer name Sequence (5’ 3’) LHY HvLHY-Ex3Fw GCAAAGTACTGGAATTTCTGAGCCC
HvLHY-Ex8Fw CGTGCAAATCAGAAGCCATGCTCA LHY-Ex10FwC GCTAACGACAAGACACAGCAAGCA HvLHY-Ex6Rv GTGCTGACAACTGGTCGCTTTGTT LHY-Ex9Rv TTGGAACTTCTCTGGTGGGTGTCT HvLHY-Ex8aRv AGGACAAGCAGCAAAGAACAGAA LHY-3UTRv GGGCTCAGAAATTCCAGTACTTTGC
TOC1 HvPRR1-5UTRFwB GCCGGACTGCGACGGGCGG HvPRR1-Ex1Fw ATGTGCTTCGCCTCCTCTGTAACT HvPRR1-Ex6Fw CAAGCACTCCAGCAAACAGCTCAT HvPRR1-Ex1Rv AGTTACAGAGGAGGCGAAGCACAT HvPRR1-Ex3Rv CCGCAAGCACTTGACAACAACAGA HvPRR1-Ex6Rv CAATGAGCTGTTTGCTGGAGTGCT HvPRR1-3UTRv GGGTTGAGGATGTATTGTGTGAGC
ZTLb HvZTLb-Ex2RvA TTGGAGTTGGTCGGAGTGTG ELF3 HvELF3-Ex4Fw AGGAAACCAGGCTTCACCATCTCA
HvELF3UTRv TTTCTTTCTTTCTGCCGGCCAACC PP2AA2 HvPP2AA2-Ex2Fw CCGCATTGGTGCACAGATGAAAGA
HvPP2AA2-Ex3Rv CCAAGATTTGATGCAGCTGCCCTT UBC21 HvUBC-Ex3Fw AGTACAAGGAGGTGCAGCGAGAAA
HvUBC-Ex4Rv CTGCTCGGGAATTGAGAATGCAAG PPDH1 HvPpdH1-5UTRfw TTCCAGGAGACGATTCATTCCGCT
HvPpdH1-Ex4Fw CAACAGCAATGATCGCAACGACGA HvPpdH1-Ex6fwB TGCCATATCTTGAGCTGAGCCTGA HvPpdH1-Ex7Fw TCCAGTGTTGTCAATCCTTCGGGT HvPpdH1-Ex1Rv GGATGGTCTTCCTGTGTAGGAACT HvPpdH1-Ex6Rv AAGTCAGCAGCTCGAACAATTGGC HvPpdH1-Ex7Rv ACCCGAAGGATTGACAACACTGGA HvPpdH1-3UTRv TATAGCTAGGTGCGTGGCGGGA
GI HvGI-5UTRFw TTCGCCTCTGCCTCAGCCTC HvGI-Ex7Fw ACACCTCTGACCAGGCTACAACAA HvGI-Ex11Fw ACTGCAATGTCTATGAGGGCTGGT HvGI-Ex12FwB AACAGCACCAGCTCATCGGGTAAT HvGI-Ex4Rv CGCTGTCAGATGTGAACTGACCAA HvGI-Ex7Rv TTGTTGTAGCCTGGTCAGAGGTGT HvGI-Ex11Rv AGACATTGCAGTTCCAATCGCACG HvGI-Ex12RvB ATTACCCGATGAGCTGGTGCTGTT HvGI-Ex14Rv ACAAGCATCCCATCTGTAGCACGA HvGI-3UTRv AGACTGGGAATGGAAAGCCATCCT
PRR59 HvPRR59-Ex3Fw CACGGTGCTAAAGTGCATGCAGAA HvPRR59-Ex5Fw TAATGTGGCAAGCTCACCCAGAGA HvPRR59-Ex5RvB TCTCTGGGTGAGCTTGCCACATTA HvPRR59-Ex6Rv ACGTTGCTGCTTCCCTAAGTTGAC HvPRR59-Ex7RvB CAAAGGAGCCTGAGCTTGCATTGT
PRR95 HvPRR95-5UTRFw TGGTGGCTACTTGATCTGCGAGT HvPRR95-Ex4Fw AAGAGAATGTCGCAGAACAGCACG HvPRR95-Ex4Rv CGTGCTGTTCTGCGACATTCTCTT HvPRR95-Ex6Rv GAGCCGCCCAATTTCCATTCTTGT
PRR73 HvPRR73-5UTRFw AAACATCCACGGCTACTTTCACGC HvPRR73-Ex5Fw AGTGTTCCAAACCAAAGACTGGTG HvPRR73-Ex7Fw ACACAGAATCGGAACAGGCTGCTA HvPRR73-Ex8Fw TCCAGCATCACCATCATGGACACT HvPRR73-Ex3Rv CAAGGCATGGCGACCTCAGTTAAT HvPRR73-Ex7Rv TAGCAGCCTGTTCCGATTCTGTGT HvPRR73-Ex8RvB TCCATCTTGCAGGTGGAGTTCGTT HvPRR73-3UTRv TGGCTACTGGCTTGCTCCTTCTTA
FKF1 HvFKF1-Ex2Fw ATTCCTGCTTGACTTGACGAA HvFKF1-Ex2RvB TAACTCTACATGGGACGTCG

259 Appendix A A6 - Glasshouse: environment and treatment
Supplementary lighting units were activated when light intensity was below 200 watts per square meter, which was provided by using Philips SGR 140 with 400w SONT agro bulbs. Shading, activated when light intensity was above 450 watts per square meter, was carried out with internal, horizontal Ludvig Svensson environmental screens. Temperature control was carried out by wall-mounted variable speed fans and heating was available from hot water pip-ing. Overall cubicle environment was controlled by a Van Vliet Automation 'Synopta' comput-er system.
Soil containing growing barley plants was watered frequently (daily or every other day) until seeds were set and plants were left to dry. Plants grown for bulking seeds that were not being phenotyped or used in clock experiments received liquid feeding (1:1:1 N:P:K) every two weeks. Plants were equally sprayed with fungicides and insecticides, when needed, for disease control. Fungicides were Opus®Steam, Land Gold and Intercept, whereas insecticides were Conserve®SC and Savona Insecticidal Soap.
A7 - Experiments to detect novel AS events
A7.1 Growth conditions
To detect novel AS events, grains from three barley lines were germinated for 1 week in the dark at 4 °C on sterile water-soaked filter papers and transferred to medium square plastic pots (10 cm3) filled with cereal compost (Appendix A1). Each pot contained 4 grains from the same line. Plants were grown in two different environments: glasshouse (20 °C with LD treatment) or growth cabinet (4 °C with SD treatment). No crop protection treatment was applied. Harvesting of plants was carried out at GS12 (Zadoks et al., 1974) with 4 h intervals for a total of 24 hours. Sampling started at 1 hour after the start of the dark period (Figure A7.1). For collections under dark conditions, samples were quickly collected in low, indirect light. The second leaves of two independent plants, grown in dif-ferent pots, was taken for each time point. Leaf material was pooled and rapidly frozen in liquid nitrogen and stored at -80 °C.
Figure A7.1: Sampling regime for AS discovery experiments. Red arrows represent time points when sampling occurred. Black boxes are for dark, white boxes are for light. Sam-pling started one hour after the dark period.
A7.2 PCR conditions
Each PCR was carried out in individual 0.2 mL polypropylene PCR tubes (Axy-gen®, Corning®, USA) and contained 3 µL cDNA template, 20 μM of each primer, 4 µL

260 Appendix A of 5 × GoTaq® reaction buffer (Promega, USA), 0.2 µL GoTaq® DNA Polymerase (5 U/µL, Promega, USA), 1 µL dNTP (5 mM of each dNTP, Invitrogen, Life Technologies, USA) and SDW up to a final volume of 20 μL. The general PCR programme included an initial 2 min step at 94 °C, followed by 25 cycles of: 1) 15 sec at 94 °C; 2) 15 sec at 50 °C; and 3) 1 min and 30 sec at 72 °C. At the end of cycling, a final extension step of 10 min at 72 °C was performed. For all experiments with a primer pair, negative controls containing RNA template and one positive control containing gDNA were subjected to the same pro-cedure to exclude any possible contamination or to detect PCR inhibitors. Once amplifica-tion of the required PCR product had been achieved, 10 μL of the final PCR product was run on a 1.5% agarose, 1 x TBE gel to detect bands of the expected (FS) and unexpected sizes (AS isoforms).
A8 - Luria-Bertani (LB) liquid broth and solid agar
10 g Select peptone (Sigma-Aldrich, UK) 5 g Select yeast extract (Sigma-Aldrich, UK) 10 g NaCl 900 mL SDW
All components were mixed. For solid LB agar, 15 g of Select agar (Sigma-Aldrich, UK) was added. pH was adjusted to 7.5 with NaOH pellets. Final volume was adjusted to 1 L with SDW and the solution was autoclaved and stored at room temperature.
A9 - Ampicillin
Stock solution (200 mg/mL): 1.0 g ampicillin (Sigma-Aldrich, UK) was dissolved in 5 mL SDW. After solubilisation, the antibiotic solution was filter-sterilised via a 0.2 μm mem-brane (Nalgene®, Thermo Fisher Scientific, USA) and stored in the freezer (-20 °C). In LB growth medium (100 μg/mL): 50 μL ampicillin (stock solution) was diluted in 100 mL LB me-dium (liquid broth or solid agar).
A10 - Blue-white screening
Colour screening of recombinant clones is possible due to a vector-based molecular cloning technique involving the enzyme β-galactosidase. In the presence of X-gal substrate and IPTG de-repressor, cells transformed with the empty vector grow into blue colonies. The blue colour is a visual indication that the α-peptide (present in the pGEM-T easy vec-tor) of the β-galactosidase is expressed. Cells transformed with plasmids where the insert interrupts the coding sequence of the α-peptide produce white, and sometimes light-blue, colonies.

261 Appendix B
Chapter 8. Appendix B. Results
B1 - Barley clock mutants
Bowman WT Hvelf3
Figure B1: Bowman, WT and Hvelf3 28-day old plants grown in LD conditions (n=1).
B2 - Awn length of barley clock mutants
Figure B2: Awn sizes of Bowman, WT and Hvelf3 plants in LDs. Plotted data represent mean values (n=4) and standard deviations (error bars) relative to Bowman. No signifi-cant differences between Bowman or WT or Hvelf3 lines were observed.
0
20
40
60
80
100
120
Bowman WT Hvelf3
%re
lativ
eto
Bow
man
Awn size

B3 - Array design for clock experiments
Table B3: Random array design of barley samples grown for clock experiments. Randomisation was performed using Microsoft Excel 2000 and manual ed-
iting.
8w LD1 T6
1d LD1 T3
1d LL2 T7
1d LD2 T6
8w LD1 T5
1d LL3 T9
1d LD2 T2
1d LL3 T3
8w LD2 T0
1d LL1 T6
B LL3 T3
8w LL2 T3
8w LL3 T4
8w LL2 T4
B LD2 T2
8w LD2 T9
8w LL3 T3
B LD1 T2
B LD1 T6
8w LD2 T6
B LL3 T9
1d LL1 T3
B LD2 T4
1d LL3 T0
1d LD1 T6
8w LD1 T8
8w LD1 T6
8w LD2 T5
8w LD1 T0
8w LL1 T8
1d LD1 T9
B LL1 T9
1d LL2 T6
B LD2 T4
1d LD2 T3
8w LD2 T5
B LL1 T7
8w LL1 T3
B LD2 T7
8w LD1 T4
8w LL2 T7
B LL3 T0
B LL2 T6
B LD1 T0
8w LL2 T5
1d LL1 T4
B LL3 T6
8w LD1 T3
B LL1 T3
B LL3 T4
B LL2 T4
8w LL3 T6
1d LD2 T3
8w LL2 T5
1d LD1 T0
B LD2 T0
B LL2 T5
8w LD2 T3
B LL2 T4
8w LD1 T8
1d LL1 T2
B LL1 T0
1d LL1 T0
1d LL3 T0
1d LD1 T9
8w LL3 T5
B LD1 T9
1d LL1 T5
8w LL3 T9
B LL2 T5
B LL1 T5
1d LL2 T3
B LD2 T3
1d LL1 T9
1d LL3 T8
8w LL1 T9
8w LL2 T2
1d LL2 T4
B LD1 T7
8w LL1 T4
B LD1 T3
8w LD1 T3
B LD2 T7
1d LL2 T3
B LD2 T0
1d LL1 T9
B LL1 T2
1d LL3 T5
8w LD2 T0
B LL2 T8
8w LL3 T5
8w LL3 T7
B LL1 T6
1d LL1 T3
B LL1 T0
1d LL2 T5
B LD2 T9
1d LD1 T8
1d LL3 T8
1d LL2 T6
1d LD1 T0
1d LL1 T0
1d LD1 T4
B LD1 T7
1d LL2 T8
8w LL2 T0
1d LD2 T5
B LD2 T2
B LL2 T0
8w LD1 T2
1d LL2 T0
B LL3 T8
8w LD1 T0
1d LL2 T8
8w LL3 T6
B LD2 T8
1d LL2 T9
8w LL1 T6
8w LL3 T4
8w LL3 T8
B LL3 T8
8w LD2 T8
B LL2 T2
B LD2 T6
B LL1 T8
B LL2 T9
B LL1 T2
B LL3 T2
1d LD2 T2
1d LD2 T8
1d LL3 T4
8w LL1 T7
B LD1 T5
1d LL2 T2
8w LD1 T2
8w LL1 T8
1d LL1 T4
B LD1 T9
B LL2 T3
1d LD1 T4
B LL3 T9
8w LL3 T2
8w LL1 T0
1d LL3 T6
8w LL2 T8
B LL1 T5
8w LL2 T7
B LL1 T9
1d LL3 T5
B LD1 T8
8w LD1 T9
1d LL2 T2
8w LD1 T7
B LD2 T6
B LL1 T4
B LL3 T6
8w LL2 T9
B LL1 T8
1d LL1 T8
8w LL3 T2
1d LL2 T9
1d LD2 T0
B LL2 T7
B LL2 T2
1d LL2 T5
1d LL3 T2
1d LD2 T4
1d LD2 T5
1d LL3 T4
8w LD2 T8
8w LL3 T3
1d LL1 T6
8w LL1 T3
B LD2 T8
B LD2 T9
B LL3 T4
1d LD1 T8
1d LD1 T6
B LD2 T5
8w LL1 T9
8w LL1 T7
B LD1 T5
8w LL3 T0
8w LD2 T2
8w LL3 T0
B LL2 T8
1d LD1 T7
1d LD1 T5
8w LL2 T6
1d LL2 T4
8w LL1 T4
8w LD1 T7
1d LL3 T7
8w LD T4
B LD T0
B LD2 T3
1d LL T3
B LL3 T5
8w LL1 T6
B LL3 T7
8w LL3 T9
1d LD2 T6
8w LD1 T9
B LL2 T6
B LL3 T7
B LL3 T3
B LL2 T7
8w LL3 T8
1d LL3 T6
B LL1 T4
1d LD2 T4
1d LD1 T2
1d LL3 T2
B LL3 T5
B LD1 T3
1d LD2 T7
B LD2 T5
B LL1 T7
B LL1 T6
8w LD2 T7
1d LD1 T2
1d LD1 T3
1d LD2 T7
B LD1 T2
8w LL2 T4
1d LL2 T0
1d LD1 T7
1d LL1 T8
8w LD2 T7
B LL3 T2
8w LL3 T7
B LL1 T3
1d LL1 T7
8w LL2 T3
B LL2 T0
8w LD2 T2
8w LL1 T2
1d LD2 T9
8w LD2 T6
1d LD1 T5
B LL3 T0
1d LD2 T9
1d LL1 T7
1d LL1 T2
8w LL2 T6
B LD1 T4
B LL2 T3
8w LD T4
B LD1 T6
8w LL1 T2
8w LD2 T4
B LL2 T9
1d LL3 T9
8w LL2 T9
1d LL1 T5
B LD1 T8
B LD1 T4
8w LD2 T3
1d LD2 T0
8w LL1 T0
8w LD2 T9
8w LL1 T5
1d LD2 T8
8w LL2 T8
8w LD1 T5
1d LL3 T7
8w LL2 T0
8w LL2 T2
1d LL2 T7
8w LL1 T5
1d: eam1.d NIL; 8w: eam8.w NIL; B: Bowman. LD: long day; LL: light-light. T: time point.
262
A
ppendix B

B4 - Barley plants from clock experiments
Figure B4: Barley plants at stage 11 used in clock experiments. Photograph was taken on day 1 of sampling (LD1).
263
A
ppendix B

264 Appendix B
B5 - Clock gene expression
Figure B5: Transcript levels of HvELF4-likeA, HvLUX and HvZTLa from WT, Bowman
(ppdh1) and Hvelf3 plants. A, C and E represent light/dark conditions. Light and dark
periods are shown with white and dark grey backgrounds, respectively. B, D and F rep-
resent transfer to continuous light. Subjective nights are on light grey backgrounds. Er-
ror bars: SEM. P values represent statistical comparisons of WT against each mutant
(colour coded). *, P ≤ 0.05; **, P ≤ 0.01; ***, P ≤ 0.001.

265 Appendix B
B6 - Phase differences in clock gene expression
Figure B6: Shifted analysis of HvFKF1, HvPRR59, HvFT1 and HvCO1 transcript levels in Bowman and Hvelf3 plants, compared to WT. A) and B) Expression data of HvFKF1 from WT and Bowman (ppdh1) or Hvelf3 plants. Time points were plotted differently for the two plants analysed: expression of Bowman and Hvelf3 plants was shifted 1.5 h later. C) Expression data comparison of HvPRR59 from WT and Bowman plants shifted 1 h later. D) Expression data comparison of HvFT1 from WT and Hvelf3 plants shifted 5.5 h earlier. E) Expression data of HvCO1 from WT and Bowman (ppdh1) plants. Time points were plot-ted differently for the two plants analysed: expression of Bowman plants was shifted 1.5 h earlier. Error bars: SEM.

266 Appendix B
B7 - Temperature-dependent AS of barley clock genes
Figure B7.1: Temperature (red line) and humidity (blue line) information measured inside growth cabinet over harvesting period (Day 7 to 13) of temperature-dependent AS experi-ment. Black boxes, below the graph, are for dark, white boxes are for light. Black arrows indicate time points when sampling occurred.

Figure B7.2: HvLHY genomic structure of 5’ UTR, FS and AS transcript isoforms. RT-PCR analysis used primers spanning exons 1 and 4 (approximate primer positions shown by arrowheads). Exons are numbered on the genomic structure; 5’ and 3’ UTRs are open boxes; coding sequences are dark boxes; introns are straight black lines. Diagonal lines represent splicing events, where putative intron sizes are listed nearby in most cases. AS events are shown in red. *, uAUG. Putative CDS length, in amino acid (aa), are shown below the IR1/2/3 transcript; in frame uAUGs are connected by a small box.
267
A
ppendix B

268 Appendix B
Figure B7.3: Relative abundances of LHY FS and AS transcripts containing E6a. The lat-ter, in particular, is very low abundant (< 0.7% of total transcripts) and is present on sam-ples pointed by red arrow heads. Plants were assessed using HR RT-PCR primers spanning Exons 6 and 7 (green arrow heads). Error bars are SEM of three biological replicates. Ex-ons 6, 6a and 7 are labelled; 5’ and 3’ UTRs are open boxes; coding sequences are dark boxes, except E6a, which is shaded red.

269 Appendix B
B8 - Analysis of publicly available transcript data for AS discovery
Figure B8: Evidence of an alternative 3’ ss event in HvLHY (contig_1667295) intron 1, adding 80 nt. Similar AS discovery analyses were carried out using the Tablet program, which aligned barley genomic contigs against transcript data (reads) (Consortium, 2012). Print screen of the analysis is shown in the middle of the figure, which is further clarified with diagrams of the genomic structure and AS events (shown in red) above and below the print screen (zoom of intron 1 and exon 2). Exons are numbered; 5’ and 3’ UTRs are open boxes; coding sequences are dark boxes, except MYB-encoding ex-ons, which are shaded grey. Alt, alternative; ss, splice site; I, intron. Small black line on the top right of the gene structure represents a scale of 200 bases.

270 Appendix B
B9 - Rhythmic AS in barley clock genes
Figure B9.1: Rhythmic AS in 5’ UTR of HvGI. Levels of HvGI alternative transcripts in WT plants under light-dark and light-light conditions. Expression data were obtained through HR RT-PCR experiments carried out with primers HvGI-5UTRFw (FAM) and HvGI-Ex4Rv. Dark boxes represent dark and white boxes are for light. Subjective nights are light grey backgrounds. Each time point shows data for one biological repli-cate. Two ZT0 are indicated, at the start of sampling and the beginning of effective free-running condition. E, exon; S, skipping; Alt, alternative; ss, splice site; I, intron; R, re-tention.
Figure B9.2: Rhythmic AS of the HvCO2 locus. Levels of HvCO2 alternative transcripts were analysed by HR RT-PCR in WT plants under light-dark conditions. Dark box represents dark and white box is for light. Each time point shows mean data of four bi-ological replicates. Error bars: SEM. ZT0 indicated the start of sampling. Alt, alterna-tive; ss, splice site; IR, intron retention; CrIn, cryptic intron.

271 Appendix B
B10 - Genomic structure and AS events of core clock homologues in Ara-
bidopsis and barley
Figure B10.1: Genomic structure and AS events of LHY homologues in Arabidopsis and barley. Arabidopsis data are taken from James et al. (2012). Exons are numbered; 5’ and 3’ UTRs are open boxes; coding sequences are dark boxes, except MYB-encoding exons, which are shaded grey. AS events of Arabidopsis (James et al., 2012) and barley genes significantly associated with temperature-dependent AS are labelled with asterisks. AS events are represented in red. Alt, alternative; ss, splice site; I, intron; R, retention; E, exon. The approximate positions of primer pairs used in barley AS studies are shown by green arrows joined by a dotted line. Small black line on the top right of each gene structures represents a scale of 200 bases.

Figure B10.2: Genomic structure and AS events of GI orthologues in Arabidopsis and barley. Arabidopsis data are taken from James et al. (2012). Exons are numbered; 5’ and 3’ UTRs are open boxes; coding sequences are dark boxes. AS events are represented in red. Alt, alternative; ss, splice site; I, intron; R, retention; E, exon. Small black lines on the top right of each gene structures represent a scale of 200 bases.
272
A
ppendix B

273 Appendix B
Figure B10.3: Genomic structure and AS events of TOC1 orthologues in Arabidopsis and barley. Arabidopsis data are taken from James et al. (2012). Exons are numbered; 5’ and 3’ UTRs are open boxes; coding sequences are dark boxes, except domain-encoding exons, which are shaded grey (PRR domain) or green (CT domain). AS events are represented in red and the ones in Arabidopsis significantly associated with temperature (James et al., 2012) are labelled with asterisks. Alt, alternative; ss, splice site; I, intron; R, retention; E, exon. Small black lines on the top right of each gene structures represent a scale of 200 bases.

Figure B10.4: Genomic structure and AS events of PRR5(9)/9(5) orthologues in Arabidopsis and barley. Arabidopsis data are taken from James et al. (2012). Exons are numbered; 5’ and 3’ UTRs are open boxes; coding sequences are dark boxes, except domain-encoding exons, which are shaded grey (PRR domain) or green (CT domain). AS events are represented in red and the ones in Arabidopsis significantly associated with temperature (James et al., 2012) are labelled with asterisks. Alt, alternative; ss, splice site; I, intron; R, retention; E, exon; ES, exon skipping; CrIn, cryptic intron. Small black lines on the top right of each gene structures represent a scale of 200 bases.
274
A
ppendix B

Figure B10.5: Genomic structure and AS events of PRR3(7)/7(3) orthologues in Arabidopsis and barley. Arabidopsis data are taken from James et al. (2012) and TAIR database. Exons are numbered; 5’ and 3’ UTRs are open boxes; coding sequences are dark boxes, except domain-encoding exons, which are shaded grey (PRR domain) or green (CT domain). AS events of Arabidopsis (James et al., 2012) and barley genes significantly associated with temperature-dependent AS are labelled with asterisks. AS events are represented in red. Alt, alternative; ss, splice site; I, intron; R, retention; E, exon; ES, exon skipping; CrIn, cryptic intron. Small black lines on the top right of each gene structures represent a scale of 200 bases.
275
A
ppendix B

B11 - AS analyses of HvPPDH1
Figure B11.1: Relative abundances of PPDH1 FS and AS transcripts. Bowman (ppdh1) and Hvelf3 plants were assessed using HR RT-PCR primers spanning exons 5 and 7 (Appendix B7.4). Error bars are SEM of three biological replicates.
276
A
ppendix B

277 Appendix B
Figure B11.2: Relative abundance of PPDH1 FS and AS transcripts containing I1. WT plants were assessed using HR RT-PCR primers spanning the A) 5’ UTR and B) Exons 2 through 5. Error bars are SEM of three biological replicates. I1R/FS ratios compared with 20 °C data were not highly significantly different (P values > 0.004).

B12 - AS analyses of HvPRR73
Figure B12: Relative abundance of PRR73 FS and AS transcripts. Plants were assessed using HR RT-PCR primers spanning most of the gene se-quence. Error bars are SEM of three biological replicates. Exons are labelled; 5’ and 3’ UTRs are open boxes; coding sequences are dark boxes, except domain-encoding exons, which are shaded grey (PRR domain) or green (CT domain). AS events are represented in red. Alt, alterna-tive; ss, splice site; I, intron; R, retention; E, exon; ES, exon skipping; CrIn, cryptic intron. Small black lines on the top right of each gene structures represent a scale of 200 bases. The approximate positions of four primer pairs used in HR RT-PCR studies are shown by green arrows joined by a dotted line and correspondent results are shown below each dotted line.
278
A
ppendix B

BX. References
Consortium, T. I. B. G. S. (2012). "A physical, genetic and functional sequence assembly of the
barley genome." Nature 491: 711-716.
James, A. B.; Syed, N. H.; Bordage, S.; Marshall, J.; Nimmo, G. A.; Jenkins, G. I.; Herzyk, P.; Brown, J.
W. S. and Nimmo, H. G. (2012). "Alternative splicing mediates responses of the
Arabidopsis circadian clock to temperature changes." The Plant Cell 24 (3): 961-981.
Zadoks, J. C.; Chang, T. T. and Konzak, C. F. (1974). "A decimal code for the growth stages of
cereals." Weed Research 14 (6): 415-421.