university of groningen ferroelectric phase diagram of ... fileferroelectric phase diagram of...
TRANSCRIPT

University of Groningen
Ferroelectric Phase Diagram of PVDFLi, Mengyuan; Stingelin, Natalie; Michels, Jasper J.; Spijkman, Mark-Jan; Asadi, Kamal;Feldman, Kirill; Blom, Paul W. M.; de Leeuw, Dago M.Published in:Macromolecules
DOI:10.1021/ma301460h
IMPORTANT NOTE: You are advised to consult the publisher's version (publisher's PDF) if you wish to cite fromit. Please check the document version below.
Document VersionPublisher's PDF, also known as Version of record
Publication date:2012
Link to publication in University of Groningen/UMCG research database
Citation for published version (APA):Li, M., Stingelin, N., Michels, J. J., Spijkman, M-J., Asadi, K., Feldman, K., ... de Leeuw, D. M. (2012).Ferroelectric Phase Diagram of PVDF: PMMA. Macromolecules, 45(18), 7477-7485.https://doi.org/10.1021/ma301460h
CopyrightOther than for strictly personal use, it is not permitted to download or to forward/distribute the text or part of it without the consent of theauthor(s) and/or copyright holder(s), unless the work is under an open content license (like Creative Commons).
Take-down policyIf you believe that this document breaches copyright please contact us providing details, and we will remove access to the work immediatelyand investigate your claim.
Downloaded from the University of Groningen/UMCG research database (Pure): http://www.rug.nl/research/portal. For technical reasons thenumber of authors shown on this cover page is limited to 10 maximum.
Download date: 26-02-2019
Ferroelectric Phase Diagram of PVDF:PMMAMengyuan Li,*,† Natalie Stingelin,⊥,∥ Jasper J. Michels,§ Mark-Jan Spijkman,† Kamal Asadi,‡
Kirill Feldman,○ Paul W. M. Blom,†,§ and Dago M. de Leeuw†,‡
†Zernike Institute for Advanced Materials, University of Groningen, Nijenborgh 4, 9747 AG, Groningen, The Netherlands‡High Tech Campus 4, Philips Research Laboratories, 5656AE, Eindhoven, The Netherlands§High Tech Campus 31, Holst Centre, 5605 KN Eindhoven, The Netherlands⊥Department of Materials and Centre for Plastic Electronics, Imperial College London, Exhibition Road, London, SW7 2AZ, U.K.∥FRIAS, School of Soft Matter Research, University of Freiburg, 79104 Freiburg, Germany○Department of Materials, Eidgenossische Technische Hochschule (ETH) Zurich, Wolfgang-Pauli Strasse CH-8093 Zurich,Switzerland
ABSTRACT: We have investigated the ferroelectric phase diagram of poly(vinylidene fluoride)(PVDF) and poly(methyl methacrylate) (PMMA). The binary nonequilibrium temperaturecomposition diagram was determined and melting of α- and β-phase PVDF was identified.Ferroelectric β-PVDF:PMMA blend films were made by melting, ice quenching, and subsequentannealing above the glass transition temperature of PMMA, close to the melting temperature ofPVDF. Addition of PMMA suppresses the crystallization of PVDF and, as a consequence, theroughness of blend films was found to decrease with increasing PMMA content. Using time-dependent 2D numerical simulations based on a phase−field model, we qualitatively reproducedthe effect of PMMA on the crystallization rate and the spherulite shape of PVDF. The remnantpolarization scaled with the degree of crystallinity of PVDF. The thermal stability of the polarization is directly related to theCurie temperature. We show that, at high temperature, the commodity ferroelectric PVDF:PMMA blends outperform thecommonly employed specialty copolymer poly(vinylidene fluoride−trifluoroethylene) (P(VDF−TrFE)).
1. INTRODUCTIONFerroelectric polymers are ideal candidates for data storageapplications as they exhibit an intrinsic bistable, remnantpolarization that can repeatedly be switched by an electricfield.1 Memories based on capacitors,2 field-effect transistors,3,4
and ferroelectric-blend diodes5−7 have been reported. The mostcommonly used macromolecular ferroelectric is the randomcopolymer poly(vinylidene fluoride-trifluoroethylene) (P-(VDF−TrFE)). Its chemical structure is presented in the insetof Figure 1. This copolymer is widely applied for its ease ofprocessing; thin films can be made from solution by spin-coating,wire-bar coating8 and patterned by, e.g., nanoembossing.9 Incomparison to other organic ferroelectrics, the copolymerP(VDF−TrFE) exhibits advantageous properties such as arelatively large remnant polarization, low leakage currents due toa high electrical resistivity and switching times as short as 1 μs.However, large-scale integration of P(VDF−TrFE) in ferro-electric devices is hampered by the limited thermal stability of theremnant polarization due to its low Curie temperature, therelative large surface roughness of ferroelectric films and the stackintegrity.First, to demonstrate the limited thermal budget we fabricated
capacitors with P(VDF−TrFE) (65−35 mol %). The remnantpolarization as a function of temperature is presented in Figure 1.At room temperature the polarization is about 7 μC/cm2 in goodagreement with literature data.10,11 However, already at 50 °C,the polarization decreases notably and rapidly deteriorates atmore elevated temperatures. This limited thermal stability12−14 is
due to the low Curie temperature of P(VDF−TrFE) which, ofcourse, severely hampers applications at higher temperatures.Second, the coercive field of P(VDF−TrFE) is about 50 MV/
m. To achieve operation at low voltage, the ferroelectric filmshould be as thin as possible. As-deposited thin films are typicallyamorphous, and in order to generate the ferroelectric phase, thefilms have to be annealed above the Curie temperature. Thisannealing protocol causes crystal growth and an increase insurface roughness, which for very thin filmsmay hamper the yieldof ferroelectric capacitors, and which deteriorates the chargecarrier mobility in ferroelectric field-effect transistors.Finally, P(VDF−TrFE) is soluble in common organic solvents
which encumbers the stack integrity of multilayer devices such asfield-effect transistors. Hence, upon spin coating an organicsemiconductor, the already deposited P(VDF−TrFE) film maydissolve. Orthogonal solvents to substantially prevent intermix-ing are not readily available.An alternative ferroelectric polymer that may provide
improved thermal stability and multilayer stack integrity is thehomopolymer poly(vinylidene fluoride) (PVDF). Neat PVDFfilms, however, cannot be applied as thin films generallycrystallize in the paraelectric α-phase. Recently, blend films ofPVDF and poly(methyl methacrylate) (PMMA) have beeninvestigated for their ferroelectric properties and application as
Received: July 13, 2012Revised: August 22, 2012Published: September 4, 2012
Article
pubs.acs.org/Macromolecules
© 2012 American Chemical Society 7477 dx.doi.org/10.1021/ma301460h | Macromolecules 2012, 45, 7477−7485

energy storage medium.15,16 Also, a method to fabricateferroelectric PVDF films with low surface roughness has recentlybeen reported.17 PVDF:PMMA blend films were spin coated andafter melting quenched in ice water. The amorphous films thusproduced were subsequently annealed for 2 h at 150 °C. ThePMMA retards the crystallization of PVDF yielding nanocrystal-line β-phase PVDF crystals and smooth ferroelectric films. Thepolarization was found to monotonically decrease with PMMAcontent. A polarization of 4 μC/cm2 was reported when using 20wt % PMMA.
Here we investigate in depth the blend films of PVDF:PMMA.We varied the molecular weight of the PMMA, the blendcomposition and the processing conditions. The phaseidentification and microstructure of the films was investigatedby X-ray diffraction (XRD), Fourier-transform infrared micros-copy (FTIR) and atomic force microscopy (AFM). We find thatthe solidification behavior and the film roughness correlate withthe phase diagram, determined in this work. The time andtemperature evolution of the topology have been reproduced by2D numerical calculations using a phase-field model. Thedisplacement current as a function of bias is measured incapacitors. The reported polarization and surface roughness17
could be reproduced. In an assessment of the thermal stability wedemonstrate that blending of PVDF with PMMA leads tosmooth ferroelectric thin films that outperform the standardP(VDF−TrFE) films at high temperature.
2. PHASE DIAGRAM OF PVDF−PMMAPolymer blends, due to their long-chain nature, generally phaseseparate. Miscibility between polymers can, however, bepromoted by dipole or van der Waals interactions and hydrogenbonding. Themonomeric unit of PVDF has a large electric dipolemoment, and it is therefore not surprising that PVDF is misciblewith a number of polymers which also exhibit a large dipolemoment, such as poly(methyl methacrylate), poly(vinyl acetate)and poly(tetramethylene adipate). Blends of PVDF:PMMA havebeen the standard system for the study of mixing of polymersbecause of its availability and interesting structural andthermodynamic phenomena occurring in a thermally accessibletemperature range. These blends are miscible and thermody-namically stable at all compositions due to the dipole/dipoleinteraction between the >CF2 groups of PVDF and the >COgroups of PMMA and to the hydrogen bonding between thedouble bonded oxygen of the carbonyl group and the acidic
hydrogen of the−CH2−CF2− group.18,19 A review of PVDF andits blends has been reported by Jungnickel.20
We constructed the PVDF:PMMA temperature/composition(phase) diagram from differential scanning calorimetry (DSC)first-heating thermograms using PVDF with a molecular weightof 180 kg/mol and PMMA of 91 kg/mol. The binarynonequilibrium diagram is presented in Figure 2. Similar data
were obtained for melt-extruded blends and films cast fromDMF. The diagram in Figure 2 is in good agreement with thoseearlier reported.20,21 The melting point of PVDF and a singleglass transition temperature of PVDF:PMMA that bothmonotonically change with composition, confirm that PVDFand PMMA are miscible over the entire composition range bothin the melt and when quenched into a vitreous solid solution.The thermogram of neat α-PVDF shows a single melting peak
at 166 °C. With increasing PMMA content a second meltingpeak at slightly lower temperature is observed. We ascribe theadditional melting peak to the presence of β-PVDF, based on acombined FTIR, electron diffraction and DSC investigation onhighly oriented neat PVDF films that has shown that these twopeaks can be ascribed to melting of the α-phase and β-phase ofPVDF.22 We confirmed this identification with DSC measure-ments on neat α-PVDF and on neat β-PVDF prepared bydrawing a PVDF film at 70 °C to a draw ratio of 6. The meltingpoints of both phases are reported to be depressed upon additionof PMMA.23 In the diagram, we also have included therecrystallization temperatures of PVDF upon cooling (solid,blue circles). For blends comprising 40 wt % PMMA or more,PVDF does not recrystallize and the films remain amorphous.The open circles represent a very weak low-temperatureendothermic peak, which has previously been ascribed to meltingof some small, imperfect PVDF crystallites.24,25 This peakdisappears in the second heating.26
We note that the Curie temperature of neat PVDF has not yetunambiguously been identified. However, thermograms of the
Figure 1. Remnant polarization, Pr, of ferroelectric capacitors based onthe random copolymer poly(vinylidene fluoride-trifluoroethylene)(P(VDF−TrFE)) (65−35 mol %) as a function of temperature. Theinset presents the capacitor layout with the chemical structure ofP(VDF−TrFE) and the Sawyer−Tower circuit used for the measure-ment. The solid line is a guide to the eye.
Figure 2. Binary nonequilibrium temperature/composition diagram ofPVDF:PMMA as obtained for melt-extruded blends. The diagram wasconstructed with peak melting transition temperatures of PVDFrecorded during the first heating scan in differential scanningcalorimetry. Black and red circles represent melting of the α-PVDFand β-PVDF respectively. The blue circles correspond to the exothermicrecrystallization temperature, Tc, of PVDF upon cooling. The glasstransition temperature, Tg, is shown in green. The open circles, Tm*,represent a very weak low-temperature endothermic peak, which haspreviously been ascribed to melting of some small, imperfect PVDFcrystallites,20,21,26 typically disappears in a DSC second heating scan.
Macromolecules Article
dx.doi.org/10.1021/ma301460h | Macromolecules 2012, 45, 7477−74857478
commonly used random copolymer P(VDF−TrFE) show aferroelectric-paraelectric transition depending on composition.The Curie temperature increases with increasing VDF content.Extrapolation then suggests that the Curie temperature of neatPVDF is about 172 °C.27 In the DSC measurements of thePVDF:PMMA blends we could not detect any feature that couldbe ascribed to the Curie temperature of PVDF, which suggeststhat the Curie temperature of the blends is higher than themelting temperature.
3. MICROSTRUCTURE AND PHASE IDENTIFICATIONOF THIN BLEND FILMS
Further information on the PVDF:PMMA microstructuredevelopment was obtained from wide-angle X-ray diffractionmeasurements. As-cast blend films were found to be amorphous.In a first set of experiments, these films were molten and slowly
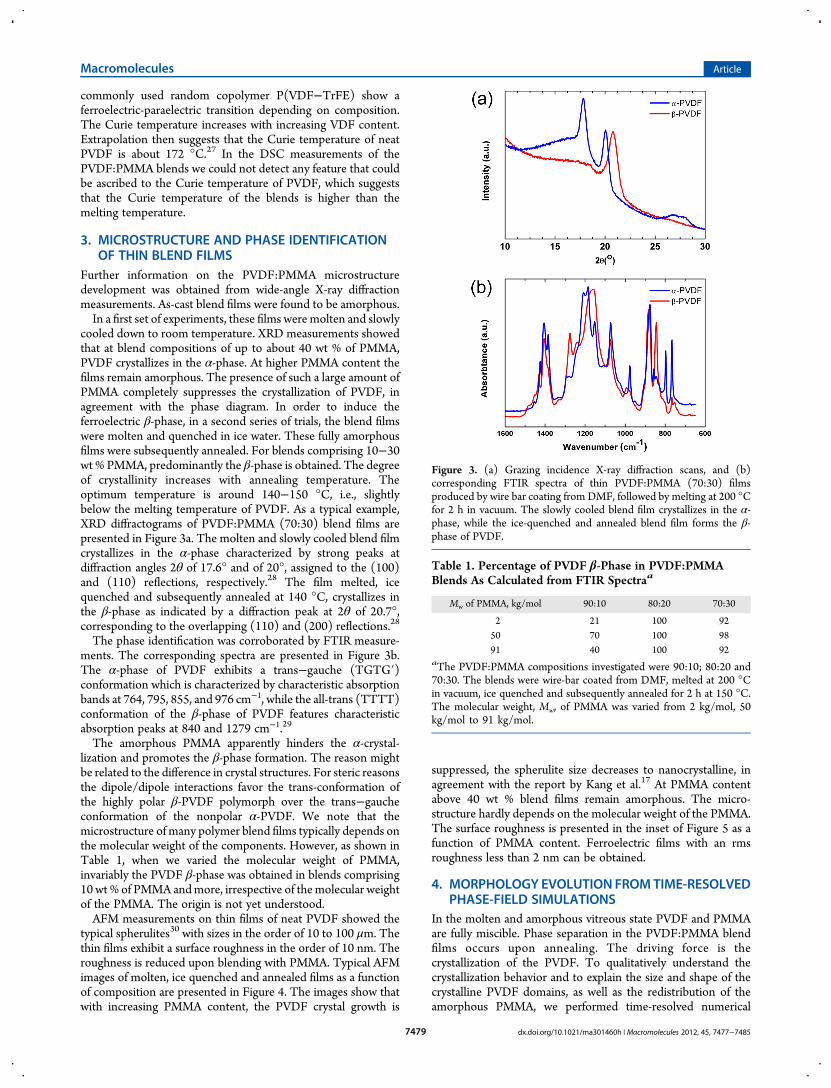
cooled down to room temperature. XRD measurements showedthat at blend compositions of up to about 40 wt % of PMMA,PVDF crystallizes in the α-phase. At higher PMMA content thefilms remain amorphous. The presence of such a large amount ofPMMA completely suppresses the crystallization of PVDF, inagreement with the phase diagram. In order to induce theferroelectric β-phase, in a second series of trials, the blend filmswere molten and quenched in ice water. These fully amorphousfilms were subsequently annealed. For blends comprising 10−30wt % PMMA, predominantly the β-phase is obtained. The degreeof crystallinity increases with annealing temperature. Theoptimum temperature is around 140−150 °C, i.e., slightlybelow the melting temperature of PVDF. As a typical example,XRD diffractograms of PVDF:PMMA (70:30) blend films arepresented in Figure 3a. The molten and slowly cooled blend filmcrystallizes in the α-phase characterized by strong peaks atdiffraction angles 2θ of 17.6° and of 20°, assigned to the (100)and (110) reflections, respectively.28 The film melted, icequenched and subsequently annealed at 140 °C, crystallizes inthe β-phase as indicated by a diffraction peak at 2θ of 20.7°,corresponding to the overlapping (110) and (200) reflections.28
The phase identification was corroborated by FTIR measure-ments. The corresponding spectra are presented in Figure 3b.The α-phase of PVDF exhibits a trans−gauche (TGTG′)conformation which is characterized by characteristic absorptionbands at 764, 795, 855, and 976 cm−1, while the all-trans (TTTT)conformation of the β-phase of PVDF features characteristicabsorption peaks at 840 and 1279 cm−1.29
The amorphous PMMA apparently hinders the α-crystal-lization and promotes the β-phase formation. The reason mightbe related to the difference in crystal structures. For steric reasonsthe dipole/dipole interactions favor the trans-conformation ofthe highly polar β-PVDF polymorph over the trans−gaucheconformation of the nonpolar α-PVDF. We note that themicrostructure of many polymer blend films typically depends onthe molecular weight of the components. However, as shown inTable 1, when we varied the molecular weight of PMMA,invariably the PVDF β-phase was obtained in blends comprising10 wt % of PMMA andmore, irrespective of themolecular weightof the PMMA. The origin is not yet understood.AFM measurements on thin films of neat PVDF showed the
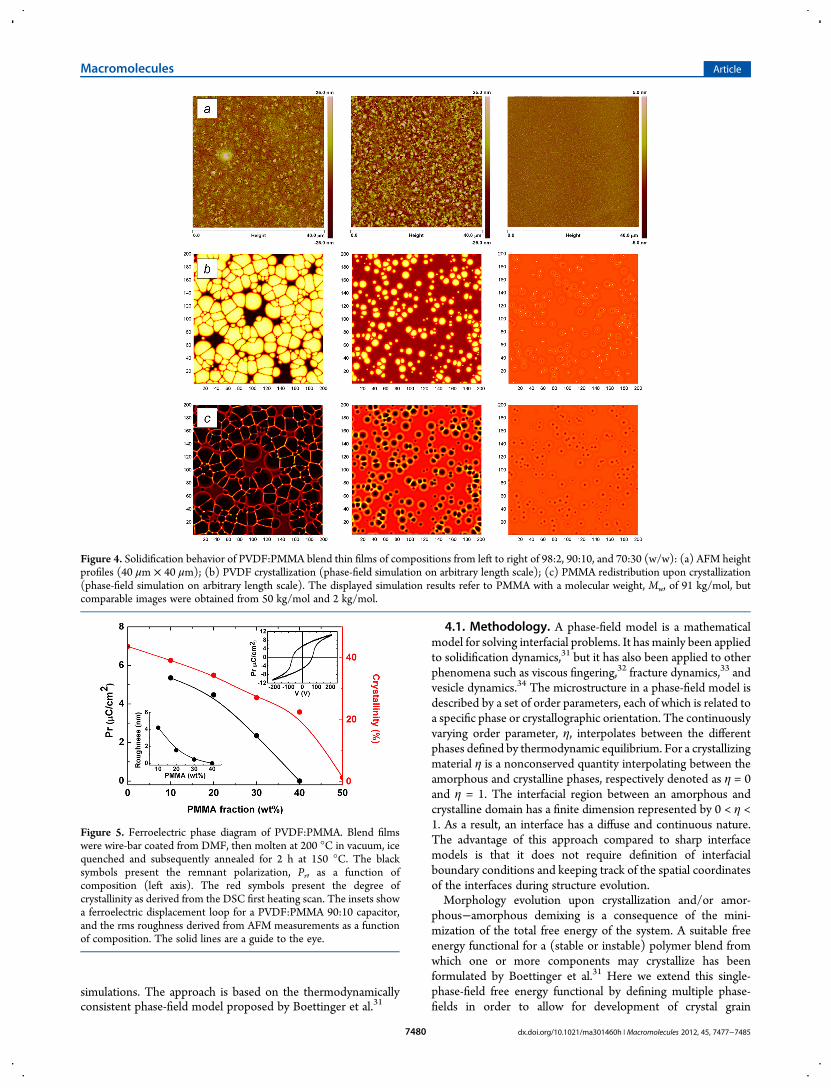
typical spherulites30 with sizes in the order of 10 to 100 μm. Thethin films exhibit a surface roughness in the order of 10 nm. Theroughness is reduced upon blending with PMMA. Typical AFMimages of molten, ice quenched and annealed films as a functionof composition are presented in Figure 4. The images show thatwith increasing PMMA content, the PVDF crystal growth is
suppressed, the spherulite size decreases to nanocrystalline, inagreement with the report by Kang et al.17 At PMMA contentabove 40 wt % blend films remain amorphous. The micro-structure hardly depends on the molecular weight of the PMMA.The surface roughness is presented in the inset of Figure 5 as afunction of PMMA content. Ferroelectric films with an rmsroughness less than 2 nm can be obtained.
4. MORPHOLOGY EVOLUTION FROMTIME-RESOLVEDPHASE-FIELD SIMULATIONS
In the molten and amorphous vitreous state PVDF and PMMAare fully miscible. Phase separation in the PVDF:PMMA blendfilms occurs upon annealing. The driving force is thecrystallization of the PVDF. To qualitatively understand thecrystallization behavior and to explain the size and shape of thecrystalline PVDF domains, as well as the redistribution of theamorphous PMMA, we performed time-resolved numerical
Figure 3. (a) Grazing incidence X-ray diffraction scans, and (b)corresponding FTIR spectra of thin PVDF:PMMA (70:30) filmsproduced by wire bar coating from DMF, followed by melting at 200 °Cfor 2 h in vacuum. The slowly cooled blend film crystallizes in the α-phase, while the ice-quenched and annealed blend film forms the β-phase of PVDF.
Table 1. Percentage of PVDF β-Phase in PVDF:PMMABlends As Calculated from FTIR Spectraa
Mw of PMMA, kg/mol 90:10 80:20 70:30
2 21 100 9250 70 100 9891 40 100 92
aThe PVDF:PMMA compositions investigated were 90:10; 80:20 and70:30. The blends were wire-bar coated from DMF, melted at 200 °Cin vacuum, ice quenched and subsequently annealed for 2 h at 150 °C.The molecular weight, Mw, of PMMA was varied from 2 kg/mol, 50kg/mol to 91 kg/mol.
Macromolecules Article
dx.doi.org/10.1021/ma301460h | Macromolecules 2012, 45, 7477−74857479
simulations. The approach is based on the thermodynamicallyconsistent phase-field model proposed by Boettinger et al.31
4.1. Methodology. A phase-field model is a mathematicalmodel for solving interfacial problems. It has mainly been appliedto solidification dynamics,31 but it has also been applied to otherphenomena such as viscous fingering,32 fracture dynamics,33 andvesicle dynamics.34 The microstructure in a phase-field model isdescribed by a set of order parameters, each of which is related toa specific phase or crystallographic orientation. The continuouslyvarying order parameter, η, interpolates between the differentphases defined by thermodynamic equilibrium. For a crystallizingmaterial η is a nonconserved quantity interpolating between theamorphous and crystalline phases, respectively denoted as η = 0and η = 1. The interfacial region between an amorphous andcrystalline domain has a finite dimension represented by 0 < η <1. As a result, an interface has a diffuse and continuous nature.The advantage of this approach compared to sharp interfacemodels is that it does not require definition of interfacialboundary conditions and keeping track of the spatial coordinatesof the interfaces during structure evolution.Morphology evolution upon crystallization and/or amor-
phous−amorphous demixing is a consequence of the mini-mization of the total free energy of the system. A suitable freeenergy functional for a (stable or instable) polymer blend fromwhich one or more components may crystallize has beenformulated by Boettinger et al.31 Here we extend this single-phase-field free energy functional by defining multiple phase-fields in order to allow for development of crystal grain
Figure 4. Solidification behavior of PVDF:PMMA blend thin films of compositions from left to right of 98:2, 90:10, and 70:30 (w/w): (a) AFM heightprofiles (40 μm × 40 μm); (b) PVDF crystallization (phase-field simulation on arbitrary length scale); (c) PMMA redistribution upon crystallization(phase-field simulation on arbitrary length scale). The displayed simulation results refer to PMMA with a molecular weight, Mw, of 91 kg/mol, butcomparable images were obtained from 50 kg/mol and 2 kg/mol.
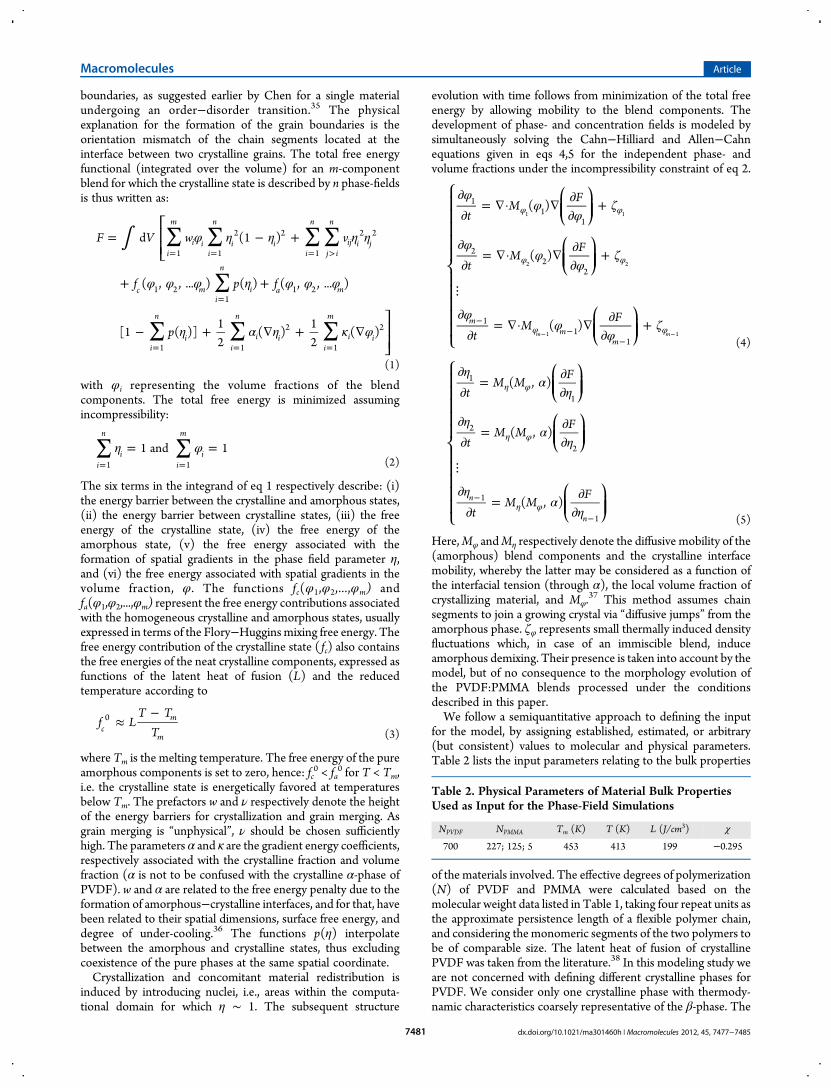
Figure 5. Ferroelectric phase diagram of PVDF:PMMA. Blend filmswere wire-bar coated from DMF, then molten at 200 °C in vacuum, icequenched and subsequently annealed for 2 h at 150 °C. The blacksymbols present the remnant polarization, Pr, as a function ofcomposition (left axis). The red symbols present the degree ofcrystallinity as derived from the DSC first heating scan. The insets showa ferroelectric displacement loop for a PVDF:PMMA 90:10 capacitor,and the rms roughness derived from AFM measurements as a functionof composition. The solid lines are a guide to the eye.
Macromolecules Article
dx.doi.org/10.1021/ma301460h | Macromolecules 2012, 45, 7477−74857480
boundaries, as suggested earlier by Chen for a single materialundergoing an order−disorder transition.35 The physicalexplanation for the formation of the grain boundaries is theorientation mismatch of the chain segments located at theinterface between two crystalline grains. The total free energyfunctional (integrated over the volume) for an m-componentblend for which the crystalline state is described by n phase-fieldsis thus written as:
∫ ∑ ∑ ∑ ∑
∑
∑ ∑ ∑
φ η η η η
φ φ φ η φ φ φ
η α η κ φ
= − +
+ +
− + ∇ + ∇
= = = >
=
= = =
⎡⎣⎢⎢
⎤⎦⎥⎥
F V w v
f p f
p
d (1 )
( , , ... ) ( ) ( , , ... )
[1 ( )]12
( )12
( )
i
m
i ii
n
i ii
n
j i
n
ij i j
c mi
n
i a m
i
n
ii
n
i ii
m
i i
1 1
2 2
1
2 2
1 21
1 2
1 1
2
1
2
(1)
with φi representing the volume fractions of the blendcomponents. The total free energy is minimized assumingincompressibility:
∑ ∑η φ= == =
1 and 1i
n
ii
m
i1 1 (2)
The six terms in the integrand of eq 1 respectively describe: (i)the energy barrier between the crystalline and amorphous states,(ii) the energy barrier between crystalline states, (iii) the freeenergy of the crystalline state, (iv) the free energy of theamorphous state, (v) the free energy associated with theformation of spatial gradients in the phase field parameter η,and (vi) the free energy associated with spatial gradients in thevolume fraction, φ. The functions fc(φ1,φ2,...,φm) andfa(φ1,φ2,...,φm) represent the free energy contributions associatedwith the homogeneous crystalline and amorphous states, usuallyexpressed in terms of the Flory−Hugginsmixing free energy. Thefree energy contribution of the crystalline state ( fc) also containsthe free energies of the neat crystalline components, expressed asfunctions of the latent heat of fusion (L) and the reducedtemperature according to
≈−
f LT T
Tcm
m
0
(3)
where Tm is the melting temperature. The free energy of the pureamorphous components is set to zero, hence: fc
0 < fa0 for T < Tm,
i.e. the crystalline state is energetically favored at temperaturesbelow Tm. The prefactors w and ν respectively denote the heightof the energy barriers for crystallization and grain merging. Asgrain merging is “unphysical”, ν should be chosen sufficientlyhigh. The parameters α and κ are the gradient energy coefficients,respectively associated with the crystalline fraction and volumefraction (α is not to be confused with the crystalline α-phase ofPVDF). w and α are related to the free energy penalty due to theformation of amorphous−crystalline interfaces, and for that, havebeen related to their spatial dimensions, surface free energy, anddegree of under-cooling.36 The functions p(η) interpolatebetween the amorphous and crystalline states, thus excludingcoexistence of the pure phases at the same spatial coordinate.Crystallization and concomitant material redistribution is
induced by introducing nuclei, i.e., areas within the computa-tional domain for which η ∼ 1. The subsequent structure
evolution with time follows from minimization of the total freeenergy by allowing mobility to the blend components. Thedevelopment of phase- and concentration fields is modeled bysimultaneously solving the Cahn−Hilliard and Allen−Cahnequations given in eqs 4,5 for the independent phase- andvolume fractions under the incompressibility constraint of eq 2.
φφ
φζ
φφ
φζ
φφ
φζ
∂∂
= ∇· ∇ ∂∂
+
∂∂
= ∇· ∇ ∂∂
+
⋮
∂∂
= ∇· ∇ ∂∂
+
φ φ
φ φ
φ φ−
−−
− −
⎧
⎨
⎪⎪⎪⎪⎪
⎩
⎪⎪⎪⎪⎪
⎛⎝⎜⎜
⎞⎠⎟⎟
⎛⎝⎜⎜
⎞⎠⎟⎟
⎛⎝⎜⎜
⎞⎠⎟⎟
tM
F
tM
F
tM
F
( )
( )
( )mm
m
11
1
22
2
11
1m m
1 1
2 2
1 1(4)
ηα
η
ηα
η
ηα
η
∂∂
= ∂∂
∂∂
= ∂∂
⋮
∂∂
= ∂∂
η φ
η φ
η φ−
−
⎧
⎨
⎪⎪⎪⎪⎪
⎩
⎪⎪⎪⎪⎪
⎛⎝⎜⎜
⎞⎠⎟⎟
⎛⎝⎜⎜
⎞⎠⎟⎟
⎛⎝⎜⎜
⎞⎠⎟⎟
tM M
F
tM M
F
tM M
F
( , )
( , )
( , )n
n
1
1
2
2
1
1 (5)
Here,Mφ andMη respectively denote the diffusive mobility of the(amorphous) blend components and the crystalline interfacemobility, whereby the latter may be considered as a function ofthe interfacial tension (through α), the local volume fraction ofcrystallizing material, and Mφ.
37 This method assumes chainsegments to join a growing crystal via “diffusive jumps” from theamorphous phase. ζφ represents small thermally induced densityfluctuations which, in case of an immiscible blend, induceamorphous demixing. Their presence is taken into account by themodel, but of no consequence to the morphology evolution ofthe PVDF:PMMA blends processed under the conditionsdescribed in this paper.We follow a semiquantitative approach to defining the input
for the model, by assigning established, estimated, or arbitrary(but consistent) values to molecular and physical parameters.Table 2 lists the input parameters relating to the bulk properties
of the materials involved. The effective degrees of polymerization(N) of PVDF and PMMA were calculated based on themolecular weight data listed in Table 1, taking four repeat units asthe approximate persistence length of a flexible polymer chain,and considering the monomeric segments of the two polymers tobe of comparable size. The latent heat of fusion of crystallinePVDF was taken from the literature.38 In this modeling study weare not concerned with defining different crystalline phases forPVDF. We consider only one crystalline phase with thermody-namic characteristics coarsely representative of the β-phase. The
Table 2. Physical Parameters of Material Bulk PropertiesUsed as Input for the Phase-Field Simulations
NPVDF NPMMA Tm (K) T (K) L (J/cm3) χ
700 227; 125; 5 453 413 199 −0.295
Macromolecules Article
dx.doi.org/10.1021/ma301460h | Macromolecules 2012, 45, 7477−74857481
processing temperature (T = 413K) is the annealing temperatureof the ice quenched amorphous layers. The lower critical solutiontemperature (LCST) bahavior of the PVDF:PMMA blend ischaracterized by a negative Flory−Huggins interaction param-eter. In our simulations we adopt a value of χ of −0.295, asdetermined for 160 °C by Nishi and Wang.21
The assignment of w, α, and κ is less straightforward, as(experimental) physical data on gradient energy coefficients arescarce and often lacking. Furthermore, the usual definitions for κbased on the random phase approximation39−41 cannot be used,as they assume the components being at least partiallyimmiscible. Hence, although inspired on physical data appliedpreviously in phase-field simulations of blends of organicmaterials,42 their attribution is essentially arbitrary. Nevertheless,the parameters were treated in a fully consistent manner, thusallowing internal comparison between simulations performed fordifferent PVDF:PMMA ratios. The spatial characteristics of αand κ, together with all simulation length and time scales, weremade dimensionless by defining a characteristic length, λ, and atime, τ. Table 3 lists the dimensionless and arbitrary inputparameters.
4.2. Simulation of Crystallization.Row a in Figure 4 showsthe experimentally observed morphology of PVDF:PMMAblend films with composition ratios of 98:2, 90:10, and 70:30.Rows b and c present the corresponding morphology as obtainedfrom the 2D numerical phase-field simulations. PMMAs of allthree molecular weights yielded very comparable morphologies,in agreement with experimental observations. For this reason,only the results obtained for a molecular weight of 91 kg/mol,corresponding to NPMMA of 227, are shown. In Figure 4, rows band c, respectively, show the regions of crystalline PVDF andamorphous PMMA as a function of spatial coordinates. Allsimulations started from a homogeneous amorphous situation,running for the same number of cycles (n ≈ 30.000) and usingthe same arbitrary nucleation attempt probability for each timestep. The results, although representing a simplified version ofphysical reality, quantitatively reproduce the crystallizationbehavior of PVDF as a function of PMMA content: the largestcrystalline fraction is observed for the 98:2 PVDF:PMMA blendand virtually no crystallization is observed for mixture of aPMMA content of ∼30 wt %.As the nucleation probability per time step is equal for all
simulations, the decrease in crystallinity with PMMA content inthe simulated blends is a result of a decrease in the growth rate ofthe crystals.43 Consequently, it takes longer, and eventually toolong, for the growing crystals to become sufficiently large toprevent the nucleus form “re-dissolving” into the amorphousblend. In other words, at a high PMMA fraction the free energygain per time step as a result of crystal growth becomes too smallto overcompensate for the penalty associated with the formationof interface regions around the nucleus. In blends of anintermediate PMMA fraction (i.e., the 90:10 blend) nucleationis still successful but the growth is retarded due to a decrease ininterface mobility and flux of amorphous PVDF material towardthe crystalline interface. Crystal growth is also thermodynami-
cally retarded due to the formation of pronounced gradients inthe amorphous PMMA regions surrounding the spherulites.These effects explain the decrease in growth rate atPVDF:PMMA ratio’s for which the crystallization temperatureof the β-phase is still considerably higher than the glass transitiontemperature (see phase diagram in Figure 2). Naturally, for ablend with a very high PMMA fraction (e.g., 40 wt %)crystallization will be further hindered by kinetic effectsassociated with the increase of the glass transition temperatureof the blend, which is not considered by the simulations aspolymer chain mobility is kept constant.We further note that the tightly connected spherulitic grain
morphology of the crystalline regions observed for the 98:2blend (row a, left) is reproduced by the corresponding simulation(row b, left). The morphology is characterized by relatively sharpangles between the grain boundaries, despite the formation ofPMMA enriched regions between the grains due to expulsionand accumulation in the boundary regions (row c). Thesimulation of the behavior of the 90:10 blend shows that ahigher PMMA content may cause the grain boundary angles tobecome more “rounded”, if more material is expelled andaccumulated during spherulite growth (cf. row c, middle).
5. FERROELECTRICITY OF PVDF:PMMA BLEND FILMSThe displacement current of PVDF:PMMA blend films as afunction of bias voltage was measured in capacitors. A typicalhysteresis loop for a thin film capacitor of a PVDF:PMMA(90:10) blend is shown in the inset of Figure 5. Contrary to theP(VDF−TrFE) copolymer which always displayed a square loop,for the blend films always slim hysteresis loops were recorded,irrespective of the experimental conditions such as appliedvoltage and number of cycles. As leakage currents could be ruledout, we attribute this response to their nanocrystalline micro-structure. The coercive field is about 110 MV/m, comparable tothat reported for PVDF,44 and higher than that reported for theferroelectric P(VDF−TrFE). The remnant polarization ispresented as a function of PMMA content in Figure 5. Thepolarization decreases with PMMA content from 5.4 μC/cm2 at10 wt % PMMA to a negligible polarization at 40 wt % PMMA.The polarization depends on the annealing temperature after
ice quenching. We investigated blend films after ice quenchingannealed at a low temperature of only 120 °C. According to XRDmeasurements the PVDF still crystallized in the ferroelectric β-phase, but the degree of crystallinity of the films was low. Pristinecapacitors were not ferroelectric. A propeller-like slim para-electric loop was observed. A remnant polarization up to 5 μC/cm2 for PVDF:PMMA 90:10 could, however, be induced atelevated temperature, around 100 °C, by repeated cycling atvoltages far above the coercive field. The polarization is notpermanent but disappears upon cooling down to roomtemperature. The origin therefore is different than for therecently reported electric-field induced polarization of ultrathinfilms of P(VDF−TrFE).45 XRD measurements have demon-strated that for those films the changes are permanent and due toelectric-field induced crystallization.The dependence of the remnant polarization on PMMA
content in the blend films is plotted in Figure 5 together with thedegree of the crystallinity as calculated from the enthalpy offusion deduced from thermal analysis; see Experimental Section.Neat PVDF is a semicrystalline polymer for which we calculated adegree of crystallinity of 45%. The crystallinity monotonicallydecreases with increasing PMMA content. At 40 wt % PMMAand above content, the crystallinity is negligible; i.e., these blend
Table 3. Physical Parameters of Interfacial Properties andMaterial Motion, Used as Input for the Phase-FieldSimulations
w (J/cm3) α/λ2 (J/cm3) κ/λ2 (J/cm3) Dτ/λ2
40 50 20 1600
Macromolecules Article
dx.doi.org/10.1021/ma301460h | Macromolecules 2012, 45, 7477−74857482

films are essentially amorphous. The crystallization is kineticallyhampered as the crystallization temperature approaches the glasstransition temperature, as can be seen in the phase diagram(Figure 2). Comparable values for the crystallinity as a functionof PMMA content have been reported previously.38,46,47 Theremnant polarization is due to a permanent induced surfacecharge density. Not surprisingly, therefore, Figure 5 shows thatthe remnant polarization of the PVDF:PMMA unambiguouslyscales with the crystallinity. A similar relation has been reportedfor blend films of P(VDF−TrFE) with PMMA48 albeit that thechange in entropy was plotted rather than degree of crystallinity.Considering the apparently high transition temperatures
observed in our thermal analysis, we set out to investigate thethermal stability of blend-capacitors. The remnant polarizationand coercive field are presented as a function of temperature inFigure 6 for three PVDF:PMMA blend ratios of 90:10, 80:20,
and 70:30. Interestingly, for all blends the polarization is constantup to 120 °C. As a matter of fact, it very slightly increases. Thecoercive field decreases with temperature. The activation energyis in the order of 10meV. For comparison data of the polarizationas a function of temperature for the copolymer P(VDF−TrFE)as taken from Figure 1 are included as well. The polarization ofPVDF:PMMA is much more stable than that of P(VDF−TrFE).The thermal stability is directly related to the Curie temperature.The ferroelectric to paraelectric phase transition of P(VDF−TrFE) occurs around 100 °C. The phase diagram of Figure 2indicates that this transition temperature in PVDF:PMMAblends is much higher, even above the melting temperature of β-PVDF. As a consequence, above about 80 °C PVDF:PMMAblends outperform the copolymer P(VDF−TrFE).
6. SUMMARY AND CONCLUSIONHere we have investigated the ferroelectric phase diagram ofPVDF:PMMA. To this end, we first determined the binarynonequilibrium temperature/composition diagram by DSCmeasurements. The melting point and glass transition temper-ature monotonically change with composition, which reconfirmsthat the two polymers are fully miscible in the melt over thewhole composition range. In PVDF:PMMA blends films, madefrom solution or melt, PVDF crystallizes in the paraelectric α-phase. However, when the blend films were molten, icequenched, and subsequently annealed close to its meltingtemperature, PVDF crystallizes in the ferroelectric β-phase.PMMA promotes formation of the β-phase over the α-phase forsteric reasons; the dipole/dipole interactions favor the trans−trans conformation of the highly polar β-PVDF over the trans−gauche conformation of the nonpolar α-PVDF.The presence of PMMA suppresses the crystallization of
PVDF and, hence, the roughness of blend films notably decreaseswith increasing PMMA content. Above 40 wt %PMMA, the filmsare amorphous. The crystallization is then kinetically hamperedas evidenced in the phase diagram by the crystallizationtemperature being close to the glass transition temperature.Phase-field simulations of the crystallization of PVDF from themiscible vitreous blends show that crystal growth at high PMMAfractions is retarded thermodynamically due the formation ofgradients in the amorphous polymer regions with associated freeenergy penalty. The simulations further show that the PMMAcontent may also influence the shape of the PVDF spherulitesdue to expulsion and accumulation of PMMA toward the crystalgrain boundaries.The remnant polarization decreases with increasing PMMA
content from 5.5 μF/cm2 at 10 wt % to negligible values at 40 wt%. We have shown that the polarization unambiguously scaleswith the degree of crystallinity of the PVDF. The thermal stabilityof the polarization is directly related to the Curie temperature,which for the PVDF:PMMA blends is higher than the meltingtemperature of β-PVDF. Hence above 100 °C, thePVDF:PMMA blends outperform the standard copolymerP(VDF−TrFE), which renders these blends ideal candidatesfor applications that require high operating temperatures.
■ EXPERIMENTAL SECTIONMaterials and Film Preparation. The random copolymer of
P(VDF−TrFE) (65−35mol %) was purchased from Solvay. PVDF (Mw180 kg/mol) and PMMA (Mw 2, 50, and 91 kg/mol), were purchasedfrom Sigma-Aldrich. All materials were used as received. The solubilityof PVDF in a number of solvents as well as the Hansen solubilityparameters extracted have been reported.49 PVDF has a limitedsolubility in common organic solvents as alcohols, chlorinated solventsand acids. Good solvents are, e.g., N,N-dimethylformamide (DMF),dimethyl sulfoxide and N-methyl-2-pyrrolidone. We prepared blendsolutions by codissolving PVDF and PMMA in DMF, typically 10% byweight total solids. Thin films were prepared by wire-bar (Meyer rod)coating with a K202 control coater (RK Print) at 50 °C. Meyer rod-coating is well-established technique used in the coating industry tomake liquid thin films in a continuous and controlled manner.50 Aftercoating the films were molten at 200 °C for 2 h in a vacuum oven,followed by quenching in ice water to achieve an amorphous state. Asubsequent annealing step of 140−150 °C close to the meltingtemperature of PVDF was then applied to achieve the ferroelectric β-phase.
Thin Film Characterization. Differential scanning calorimetry(DSC) was conducted under N2 atmosphere, on as-cast films, at a scanrate of 10 °C/min, with a Mettler Toledo DSC 822e instrument. Thedegree of crystallinity was calculated using ΔHfusion for neat PVDF of
Figure 6. Temperature budget. Remnant polarization, Pr (a), and thecorresponding coercive field, Ec (b), as a function of temperature. In blueare the measurements for PVDF:PMMA blends with compositions of90:10 (●), 80:20 (▲), and 70:30 (⧫) wt %. The films were wirebarcoated from DMF, melted at 200 °C in vacuum, ice quenched, andsubsequently annealed for 2 h at 150 °C. The red dots representmeasurements on the copolymer P(VDF−TrFE). The solid lines are aguide to the eye.
Macromolecules Article
dx.doi.org/10.1021/ma301460h | Macromolecules 2012, 45, 7477−74857483
102.5 J/g.51 The glass transition temperature was determined employingMettler-Toledo Stare software version 9.1. The nonequilibriumcomposition/temperature phase diagram was established with thosethermal analysis data: melting and crystallizing transitions were deducedfrom the peak maxima of the corresponding endo- and exotherm in therespective thermograms. Glass transition temperatures were taken to bethe inflection points. The film thickness was measured with a Dektakprofilometer. The surface morphology of the films was characterized byatomic force microscopy (AFM) (Nanoscope Dimension 3100 Bruker).To ascertain the crystal phases of the films, both grazing incidence X-raydiffraction (XRD) and Fourier-transform infrared spectroscopy (FTIR)were used. XRD scans were obtained with a Philips X’pert MPDdiffractometer, using the line focus of a Cu-anode X-ray tube. For thegrazing incidence setup we used a divergence slit of 0.03° and a parallelplate collimator in front of the detector. The incidence angle was fixedduring the measurement at an angle of 0.23° just above the critical angleof total diffraction. Infrared spectra of crystallized PVDF:PMMA blendswere recorded using a Bruker Vertex spectrometer attached to aHyperion FT-IR microscope. The scans were performed with aresolution of 4 cm−1. For a sample containing both α- and β-polymorphPVDF, the relative fraction of α-phase, F(α), was calculated by a methodproposed by Gregorio and Cestari.52 On the basis of Lambert−Beer,F(α) is given by
α =+
=+
=+
α
α β
α
α α α β β β
α
α βF
XX X
AA K C K C A
AA A
( )( / ) 0.8
(6)
for a sample with average total monomer concentration C of 0.0305mol/cm3. X is the degree of crystallinity of the α- or β-phase. Aα and Aβ
refer to the absorbencies at 763 and 840 cm−1, respectively, associatedwith the α- and β-phases. K represents the absorbances at thecorresponding wavenumber; Kα is 6.1 × 104 cm2 mol−1 and Kβ is 7.7× 104 cm2 mol−1.Device Fabrication and Characterization. Capacitors were
fabricated on thermally oxidized silicon monitor wafers on which 50nm thick Au bottom electrodes on a 2 nm Ti adhesion layer werephotolithographically defined. The blend films were applied andannealed. Au was evaporated through a shadow mask and used as topelectrode. The device area varied from 0.059 to 1.38 mm2. Electricdisplacement loops versus electric field for the capacitors were measuredusing a Sawyer−Tower circuit, consisting of a Tektronix AFG3102function generator, a TektronixTDS3032B oscilloscope and a Krohn-Hite 7600 wide band amplifier. The capacitors were measured with acontinuous triangular wave signal, to reduce the time at maximum bias,at a frequency of 100 Hz and using a reference capacitor of 216 nF.
■ AUTHOR INFORMATIONCorresponding Author*E-mail: [email protected] authors declare no competing financial interest.
■ ACKNOWLEDGMENTSWe would like to acknowledge Jan Harkema for technicalassistance, Rene Beerends for AFM measurements, Rene Bakkerfor FTIR measurements and Harry Wondergem for XRDmeasurements. We acknowledge Solvay for supply of theferroelectric polymers. We acknowledge financial support byZernike Institute for AdvancedMaterials, and by the EC Program(FP7/2007-2013) under grant Agreement No. 248092 of theMOMA Project.
■ REFERENCES(1) Scott, J. F., Ferroelectric Memories: Springer-Verlag: Berlin, 2000.(2) Naber, R. C. G.; Asadi, K.; Blom, P. W. M.; de Leeuw, D. M.; deBoer, B. Adv. Mater. 2010, 22, 933.
(3) Naber, R. C. G.; Tanase, C.; Blom, P. W. M.; Gelinck, G. H.;Marsman, A. W.; Touwslager, F. J.; Setayesh, S.; de Leeuw, D. M. Nat.Mater. 2005, 4, 243.(4) Khan, M. A.; Bhansali, U. S.; Alshareef, H. N. Adv. Mater. 2012, 24,2165.(5) Asadi, K.; de Leeuw, D. M.; de Boer, B.; Blom, P. W. M.Nat. Mater.2008, 2, 547.(6) Asadi, K.; Li, M.; Stingelin, N.; Blom, P. W. M.; de Leeuw, D. M.Appl. Phys. Lett. 2010, 97, 193308.(7) Asadi, K.; Li, M.; Blom, P. W. M.; Kemerink, M.; de Leeuw, D. M.Mater. Today 2011, 14, 592.(8) Li, M.; Stingelin, N.; Michels, J. J.; Spijkman, M.; Asadi, K.;Beerends, R.; Biscarini, F.; Blom, P. W. M.; de Leeuw, D. M. Adv. Funct.Mat. 2012, 22, 2750.(9) Hu, Z.; Tian, M.; Nysten, B.; Jonas, A. M. Nat. Mater. 2009, 8, 62.(10) Lovinger, A. J. Science 1983, 220, 1115.(11) Furukawa, T. Adv. Colloid Interface Sci. 1997, 183, 71.(12) Park, Y. J.; Bae, I.; Kang, S. J.; Chang, J.; Park, C. IEEE Trans.Dielectr. Electr. Insul. 2010, 17, 1135.(13) Xu, H.; Zhong, J.; Liu, X.; Chen, J.; Shen, D. Appl. Phys. Lett. 2007,90, 092903.(14) Zhang, Q. M.; Bharti, V.; Zhao, X. Science 1998, 280, 2101.(15) Ma, W.; Zhang, J.; Chen, S.; Wang, X. Appl. Surf. Sci. 2008, 254,5635.(16) Sun, J.; Yao, L.; Zhao, Q.; Huang, J.; Song, R.; Ma, Z.; He, L.;Huang, W.; Hao, Y. Front. Mater. Sci. 2011, 5, 388.(17) Kang, S. J.; Park, Y. J.; Bae, I.; Kim, K. J.; Kim, H. C.; Bauer, S.;Thomas, E. L.; Park, C. Adv. Funct. Mater. 2009, 19, 2812.(18) Roerdink, E.; Challa, G. Polymer 1980, 21, 509.(19) Belke, R. E.; Cabasso, I. Polymer 1988, 29, 183.(20) Juncknickel, B.-J., Ferroelectric Polymers: Marcel Dekker: NewYork, 1995.(21) Nishi, T.; Wang, T. T. Macromolecules 1975, 8, 909.(22) Yang, D. C.; Thomas, E. L. J. Mater. Sci. Lett. 1984, 3, 929.(23) Yang, D. C.; Thomas, E. L. J. Mater. Sci. Lett. 1987, 6, 593.(24) Hourston, D. J.; Hughes, I. D. Polymer 1977, 18, 1175.(25) Peterlin, A.; Houlbrook, J. J. Mater. Sci. 1967, 2, 1.(26) Teyssedre, G.; Bernes, A.; Lacabanne, C. J. Polym. Sci., Part B:Polym. Phys. 1993, 31, 2027.(27) Tashiro, K.; Takano, K.; Kobayashi, M.; Chatani, Y.; Tadokoro, H.Polymer 1983, 24, 199.(28) Gregorio, R., Jr. J. Appl. Polym. Sci. 2006, 4, 3272.(29) Kim, K. J.; Cho, Y. J.; Kim, Y. H. Vibr. Spectrosc. 1995, 9, 147.(30) Braun, D.; Jakobs, M.; Hellmann, G. P. Polymer 1994, 35, 706.(31) Boettinger, W. J.; Warren, J. A.; Beckermann, C.; Karma, A. Annu.Rev. Mater. Res. 2002, 32, 163.(32) Folch, R.; Casademunt, J.; Hernandez-Machado, A.; Ramírez-Piscina, L. Phys. Rev. E 1999, 60, 1734.(33) Karma, A.; Kessler, D. A.; Levine, H. Phys. Rev. Lett. 2001, 87,045501.(34) Biben, T.; Kassner, K.; Misbah, C. Phys. Rev. E 2005, 72, 041921.(35) Chen, L-. Q. Scr. Metall. Mater. 1995, 32, 115.(36) Wheeler, A. A.; Boettinger, W. J.; McFadden, G. B. Phys. Rev. A.1992, 45, 7424.(37) Warren, J.; Boettinger, W. Acta Metall. Mater. 1995, 43, 689.(38) Morra, B. S.; Stein, R. S. J. Polym. Sci., Polym. Phys. Ed. 1982, 20,2243.(39) P. G. de Gennes, Scaling Concepts in Polymer Physics; CornellUniversity Press: Ithaca, NY, 1979.(40) Binder, K. J. Chem. Phys. 1983, 79, 6387.(41) Roe, R. J. Macromolecules 1986, 19, 728.(42) Saylor, D. M.; Kim, C. S.; Patwardhan, D. V.; Warren, J. A. ActaBiomater. 2007, 3, 851.(43) This does, however, not nullify the influence of PMMA contenton the physical nucleation rate, but it is not considered here.(44) Kepler, R. G. Org. Coat. Plast. Chem. 1978, 38, 706.(45) Nakajima, T.; Mabuchi, Y.; Morimoto, T.; Furukawa, T.;Okamura, S. IEEE 2011, 978−1-4577−1025−4/11.
Macromolecules Article
dx.doi.org/10.1021/ma301460h | Macromolecules 2012, 45, 7477−74857484

(46) Schaffner, F.; Wellscheid, R.; Jungnickel, B.-J. IEEE Trans. Elect.Insul. 1991, 26, 78.(47) Hahn, B. R.; Herrmann-Schonherr, O.; Wendorff, J. H. Polymer1987, 28, 201.(48) Moreira, R. L.; Faria, L. O.; Marini, G.; Wisniewski, C.;Giacometti, J. A. Ferroelectrics 2002, 268, 101.(49) Bowino, A.; Capannelli, G.; Munari, S.; Turturro, A. J. Polym. Sci.,Part B: Polym. Phys. 1988, 26, 785.(50) MacLeod, D. M. in Coatings Technology: Fundamentals, Testingand Processing Technique; Tracton, A.A., Ed.; CRC Press: Boca Raton,FL, 2007; Chapter 19(51) Mead, W. T.; Zachariades, A. E.; Shimada, T.; Porter, R. S.Macromolecules 1979, 12, 473.(52) Gregorio, R., Jr.; Cestari, M. J. Polym. Sci., Part B: Polym. Phys.1994, 32, 859.
Macromolecules Article
dx.doi.org/10.1021/ma301460h | Macromolecules 2012, 45, 7477−74857485