university of groningen organic-inorganic hybrid ... · pdf fileorganic-inorganic hybrid...
TRANSCRIPT

University of Groningen
Organic-inorganic hybrid nanostructured materials for photovoltaics and solar fuelsLai, Lai-Hung
IMPORTANT NOTE: You are advised to consult the publisher's version (publisher's PDF) if you wish to cite fromit. Please check the document version below.
Document VersionPublisher's PDF, also known as Version of record
Publication date:2016
Link to publication in University of Groningen/UMCG research database
Citation for published version (APA):Lai, L-H. (2016). Organic-inorganic hybrid nanostructured materials for photovoltaics and solar fuels[Groningen]: University of Groningen
CopyrightOther than for strictly personal use, it is not permitted to download or to forward/distribute the text or part of it without the consent of theauthor(s) and/or copyright holder(s), unless the work is under an open content license (like Creative Commons).
Take-down policyIf you believe that this document breaches copyright please contact us providing details, and we will remove access to the work immediatelyand investigate your claim.
Downloaded from the University of Groningen/UMCG research database (Pure): http://www.rug.nl/research/portal. For technical reasons thenumber of authors shown on this cover page is limited to 10 maximum.
Download date: 24-05-2018
Chapter 3High Performance Photoelectrochemical Hydrogen Generation and Solar Cells with a Double Type II Heterojunction
In this chapter, we report the fabrication of CdSe quantum dot (QD) sensitized electrodes by direct adsorption of colloidal QDs on mesoporous TiO2 followed by 3‐mercaptopropionic acid (MPA) ligands exchange. High efficiency photoelectrochemical hydrogen generation is demonstrated by mean of these electrodes. The deposition of ZnS on the TiO2/CdSe further improves the external quantum efficiency from 63% to 85% at 440 nm under ‐0.5 V vs SCE. With the same photoelectrodes, solar cells with internal quantum efficiency approaching 100% are fabricated. Time‐resolved photoluminescence (TRPL) and impedance spectroscopy measurements were performed to clarify the effect of ZnS coating on the photoanode performance.*
* Lai‐Hung Lai, Widianta Gomulya, Loredana Protesescu, Maksym V. Kovalenkobc and Maria A. Loi,Phys. Chem. Chem. Phys., 2014, 16, 7531‐7537.
3

High performance PEC hydrogen generation and solar cells
54
Introduction 3.1
Owing to the wide band gap characteristic of TiO2, the solar energy to fuel conversion efficiency is rather low. In the last 40 years, myriads of researchers tried to improve the efficiency of water splitting by different approaches. For example, N‐doped TiO2 photoanodes were used to extend the absorption towards the visible region[1] but the doping induce defects,[2] which are the origin of performances degradation. Another route, which has been largely investigated, is to harvest the visible light by introducing narrow band gap semiconductors as absorbers on mesoporous TiO2.[3‐6] Narrow band gap nanoparticles seem ideal due to their tunable band gap, high extinction coefficient, and stability. Recently, the use of semiconducting nanoparticles, mostly growth by chemical bath deposition (CBD) or similar techniques, has emerged as a viable and simple method to enhance the performance of photoelectrochemical H2 generation.[3, 5, 7‐9] For instance, CdSe nanoparticles deposited by atomic layer deposition and ion exchange reaction (ALDIER) on electrodes of TiO2 inverse opals show a remarkable current density of about 15.7 mA cm‐2 for photoelectrochemical H2 generation in three electrodes configuration.[8] Mesoporous TiO2 electrodes sensitized with PbS/CdS deposited by successive ionic layer adsorption and reaction (SILAR) show current density of 6 mA cm‐2 in two electrodes configuration.[5] Compared to the great number of works, which use CBD or similar in‐situ growth techniques, a limited number of articles report photocatalytic water splitting devices sensitized by ex‐situ synthesized quantum dots of controlled size and shape (monodispersed colloidal quantum dots). ZnO nanowires photoelectrodes sensitized with CdTe colloidal nanocrystals linked with MPA showed 2 mA cm‐2 in non‐sacrificial electrolyte.[10] Photoelectrodes made of InP nanocrystals crosslinked by 1,4‐benzenedithiol (BDT) were reported to show photocatalytic water reduction properties.[11] Looking at the homologous solar cell devices, the efficiency of devices fabricated by CBD was significantly enhanced in recent years. CdSe0.45Te0.55 alloyed nanoparticles‐sensitized solar cells exhibit record power conversion efficiency of 6.36%.[12] CdSe and CdS co‐sensitized nanoparticles[3, 4, 7, 13, 14] and PbS nanoparticles[6, 15] fabricated by CBD and SILAR were used as absorbers for sensitized solar cells, owing to their narrower band gaps and appropriate band alignment with respect to TiO2 and ZnO. However, the in‐situ deposition methods produce polydispersed nanoparticles, which due to the variation of the bandgap may give rise to charge trapping. Ex‐situ nanocrystals sensitization, such as electrophoretic deposition[16, 17] and direct
Chapter 3
55
adsorption10 on metal oxide, should in principle allow a better‐controlled energy landscape. Between the many heterostructures proposed, CdSe and CdS sensitized electrodes are the ones more systematically studied.[13, 17, 18] In particular, a CdS interlayer deposited between TiO2 and CdSe has been found to help charge separation.[13] The alignment of the Fermi level after the contact between CdS and CdSe results in downward and upward shift of CdS and CdSe band position, respectively. This has been reported to allow the formation of a type II heterostructure, which drives the charge separation upon illumination.[13, 18] Here, we report on the fabrication of efficient photocatalytic electrodes composed of TiO2 and colloidal CdSe QDs. The CdSe QD sensitized electrodes are made by direct adsorption of colloidal QDs on mesoporous TiO2 followed by MPA ligands exchange. External quantum efficiency (EQE) of 63% at 440 nm under ‐0.5 V vs SCE is obtained. Significant improvement of the quantum efficiency, EQE, from 63% to 85% at 440nm under ‐0.5 V vs SCE, is achieved upon deposition of ZnS on the electrodes. By using the same semiconductor heterostructure, solar cells with internal quantum efficiency approaching 100% are obtained. The photophysics and carrier transport dynamics of CdSe QDs sensitized electrodes in photoelectrochemical hydrogen generation and solar cells are studied to elucidate the device functioning mechanism. Time‐resolved spectroscopy shows a reduction of the exciton lifetime for the samples coated with ZnS (from ~11 ps (τ1) and ~150 ps (τ2) for the TiO2/CdSe to ~8 ps (τ1) and ~41 ps (τ2) for the TiO2/CdSe/ZnS(2L)), demonstrating the formation of a type II heterojunction between ZnS and the CdSe QDs. These data are confirmed by impedance spectroscopy, which shows that ZnS enhances the charge injection (separation) efficiency.
Sensitized solar cell with CdSe/ZnS QDs 3.2
Figure 3.1 reports the structures of the CdSe QD‐sensitized electrodes for solar cells (Figure 3.1(a)) and photocatalytic water splitting (Figure 3.1(b)). The solar cells are composed by the mesoporous TiO2 sensitized with QDs, the polysulfide electrolyte, and a CuxS counter electrode. The photocatalytic water splitting devices (detail in Figure 3.1(b)) are composed by a QDs sensitized mesoporous TiO2 photoelectrode, the electrolyte, a saturated calomel electrode (SCE) as reference, and a Pt coil as counter electrode. In both devices ZnS is deposited on top of the QDs.

High performance PEC hydrogen generation and solar cells
56
Figure 3.1. Schematic diagrams illustrating (a) the QDSSCs: QD‐sensitized mesoporous TiO2 electrode, polysulfide electrolyte, and CuxS counter electrode. (b) The photoelectrochemical cells: QDs sensitized mesoporous TiO2 photoelectrodes, electrolyte, reference electrode, and counter
electrode.
Table 3.1. Electrochemical reactions of PEC water splitting and QDSSC
PEC H2 generation QDSSCReaction at the photoanode 2S2‐ + 2hvb+ Æ S22‐ S22‐ + SO32‐ Æ S2O32‐ + S2‐ S2‐ + SO32‐ + 2hvb+ Æ S2O32‐ SO32‐ + 2OH‐ + 2hvb+ Æ SO42‐ + H2O 2SO32‐ + 2hvb+ Æ S2O62‐ Reaction at the cathode 2H+ + 2e‐ Æ H2
Reaction at the photoanode TiO2 + CdSe + hν → TiO2 + CdSe(e‐+h+) → TiO2(e‐) + CdSe(h+) TiO2(e‐) + CdSe(h+) → TiO2 + CdSe CdSe(h+) + S2‐ → CdSe + S‐∙ S‐∙ + Sn2‐ → (Sn+1)‐∙ Sn + S2‐ → (Sn+1)2‐ TiO2(e‐) + (Sn+1)‐∙ → TiO2 + (Sn+1)2‐ TiO2(e‐) + Sn2‐ → (Sn‐1)2‐ + S‐ Reaction at the cathode e‐ + (Sn+1)‐∙ → (Sn+1)2‐ e‐ + Sn2‐ → (Sn‐1)2‐ + S‐∙
Glass
FTO
TiO2/QD
CuxS
(a)
(b)
FTO/TiO2/QD/ZnS
SCE Pt
Potentiostat
S2O32‐
S22‐
S2‐
H2
H2
H2

Chapter 3
57
The electrochemical reactions for both the water splitting and the solar cells devices are reported in Table 3.1. The main difference between the two device structures is the electrolyte. The polysulfide electrolyte (Na2S/S) is used for QDSSC while the sacrificial electrolyte (Na2S/Na2SO3) is used for the photoelectrochemical device. The J‐V characteristics and EQE of the CdSe QD‐sensitized solar cells with different number of ZnS layers are shown in Figure 3.2(a) and Figure 3.2(b), respectively. The CdSe QDs sensitized electrodes with on top 5L ZnS coating made with the SILAR procedure show 1.6 times higher photocurrent and 6.3% higher photovoltage than the samples without ZnS coating. The energy conversion efficiency enhanced from 1.21% to 1.93% (2L ZnS) and 2.04% (5L ZnS) upon ZnS coating. All the device parameters, obtained as averaged value of the fabricated devices, are reported in Table 3.2. From the EQE data and the reflection and transmission measurements performed on the devices, we derived the internal quantum efficiency (IQE) of our solar cells (Figure 3.3(a)). Figure 3.3(a) shows that 2L ZnS coating is sufficient to increase IQE from 61% to 100% at 440nm. Nevertheless, the highest power conversion efficiency of the devices is obtained with 5L ZnS, which seems to be due to the extended low energy tail of the EQE spectra of the sample. Similar red‐shift is observed in the absorption measurements Table 3.2. Summary of device parameters. The standard deviations are reported in the round
brackets.
Sample Isc (mA cm‐2)
Voc (V)
FF Efficiency (%)
0L ZnS 4.81(0.36) ‐0.48(0.01) 0.53(0.01) 1.21(0.15) 2L ZnS 6.65(0.04) ‐0.52(0.01) 0.56(0.02) 1.93(0.11) 5L ZnS 7.52(0.44) ‐0.51(0.01) 0.53(0.02) 2.04(0.15)
Figure 3.2. (a) J‐V curves of CdSe QD‐sensitized solar cell with 0, 2, and 5 layers of ZnS measured under 100 mW cm‐2 at AM1.5. (b) EQE of CdSe QD‐sensitized solar cells as in panel (a).

High performance PEC hydrogen generation and solar cells
58
which are reported in Figure 3.3(b). A similar effect upon ZnS deposition was reported by other authors[19] and explained as due to the larger delocalization of the carriers wave function in the presence of ZnS. We believe that the reason for this phenomenon should be found in interfacial effects occurring between CdSe and ZnS and in particular in the heterostructure formation between the two semiconductors, which will be discussed in detail later. The same photoelectrodes are used to demonstrate photoelectrochemical hydrogen generation. The main difference respects to the QDSSC are the electrolyte and counter electrodes as shown schematically in Figure 3.1(b). The J‐V characteristics and EQE of the photocatalytic CdSe QD‐sensitized electrodes for water splitting are shown in Figure 3.4(a) and Figure 3.4(b), respectively. The three electrodes configuration is used to characterize the properties of the photoanodes. In this configuration, the H2 generation rate is proportional to the current density. Similar to what shown by the QDSSC,
Figure 3.3. (a) Internal quantum efficiency of QDSSC and (b) absorption spectra of QD‐sensitized electrodes (TiO2/QDs) with different number of layers of ZnS.
Figure 3.4. (a) J‐V curves of CdSe QD sensitized electrodes in 0.25 M Na2S and 0.35 M Na2SO3 aqueous electrolyte measured under 100 mW cm‐2 at AM1.5. (b) EQE of CdSe QD sensitized
electrodes measured at ‐0.5V vs. SCE.
Chapter 3
59
the CdSe QD‐sensitized electrodes with 2L and 5L ZnS coating show 1.38 and 1.7 times higher photocurrent at ‐0.5 V vs SCE, respectively, compared to that without ZnS coating. Current density up to ~10 mA cm‐2 under ‐0.5 V vs SCE was achieved for CdSe QD‐sensitized electrodes with 5L ZnS coating. The EQE spectra (Figure 3.4(b)) measured at ‐0.5 V vs SCE show significantly enhanced photocurrent from 63% till 84% at 440 nm wavelength, upon 5L ZnS deposition. Moreover, also here the onset of the EQE spectra shows, similarly to the solar cells, a broadening at around 620 nm.
Exciton dynamics measurement 3.3
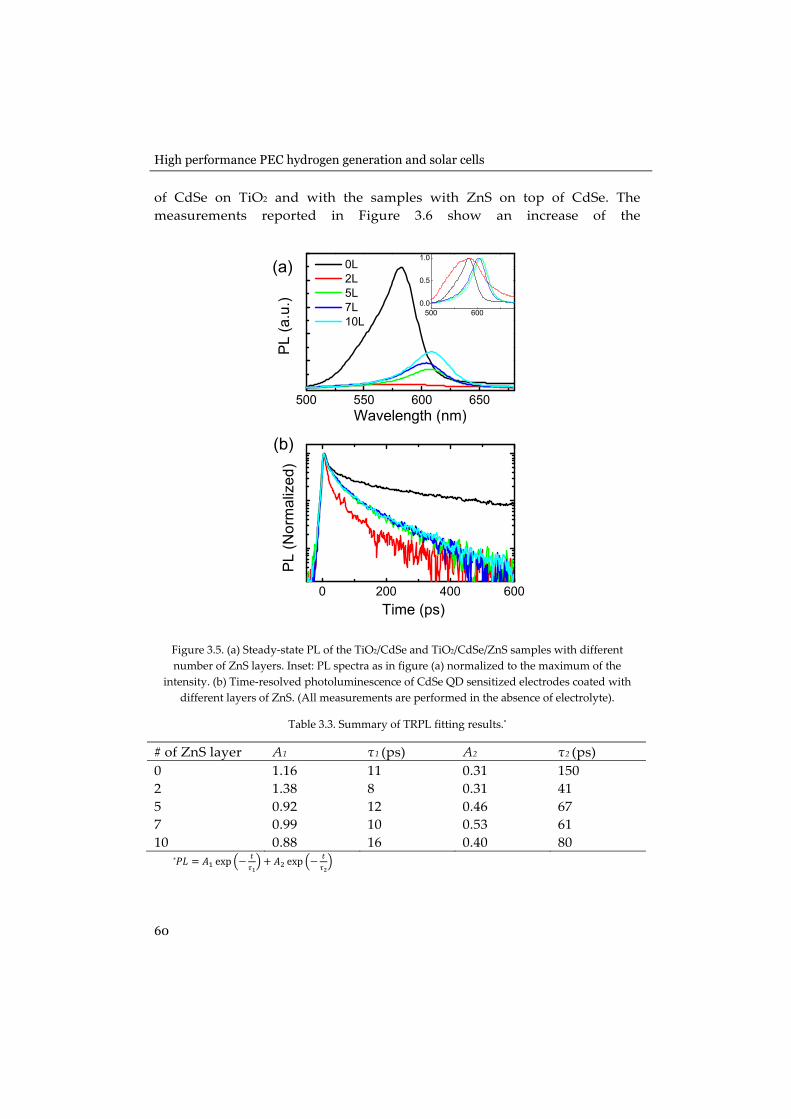
Many authors of recent literatures believe that ZnS coating acts as barrier, which suppresses the recombination of electrons (in either TiO2 or CdSe) with the electrolyte; others reported that ZnS has the role to passivate defects at the quantum dot surface and to prevent photocorrosion.[19, 20] To further investigate the working mechanism of ZnS coating in the colloidal quantum dot‐sensitized electrodes using MPA as crosslinker, steady state and time‐resolved photoluminescence are measured. Figure 3.5(a) shows the steady state PL spectra of the TiO2/CdSe electrode with different amount of layers of ZnS. Upon deposition of 2L of ZnS, the photoluminescence signal is strongly quenched and becomes very broad (inset of Figure 3.5(a)). The further deposition of ZnS layers on the same sample red‐shift the photoluminescence signal (peak from 581 nm to 607 nm) while the intensity partially recovers (Figure 3.5(a)). Time‐resolved photoluminescence measurements allow gaining a clearer picture of the physics at the interface between CdSe and ZnS. Figure 3.5(b) shows the PL lifetimes of samples of TiO2/CdSe and TiO2/CdSe with on top 2, 5, 7, and 10 layers of ZnS. The lifetimes fitted with a bi‐exponential function are ~11 ps (τ1) and ~150 ps (τ2) for the TiO2/CdSe, and are quenched to ~8 ps (τ1) and ~41 ps (τ2) for the TiO2/CdSe/ZnS (2L). With 5L of ZnS coating, the exciton lifetimes increase to 12 ps (τ1) and 67 ps (τ2). The fitting results of the time‐resolved PL are summarized in Table 3.3. It is worth noting that the measurements were performed in the absence of the electrolyte on a single sample, on top of which subsequent layers of ZnS were deposited. The faster decay of the photoluminescence suggests the formation of a type II heterojunction between the CdSe QDs and ZnS as shown in the schematic in Figure 3.7(b) in which ZnS acts as a hole transporting layer. In addition, PL measurements of samples in which ZnS (2L) is deposited between TiO2 and CdSe were performed and compared with the reference samples composed
High performance PEC hydrogen generation and solar cells
60
of CdSe on TiO2 and with the samples with ZnS on top of CdSe. The measurements reported in Figure 3.6 show an increase of the
Figure 3.5. (a) Steady‐state PL of the TiO2/CdSe and TiO2/CdSe/ZnS samples with different number of ZnS layers. Inset: PL spectra as in figure (a) normalized to the maximum of the
intensity. (b) Time‐resolved photoluminescence of CdSe QD sensitized electrodes coated with different layers of ZnS. (All measurements are performed in the absence of electrolyte).
Table 3.3. Summary of TRPL fitting results.*
# of ZnS layer A1 τ1 (ps) A2 τ2 (ps) 0 1.16 11 0.31 150 2 1.38 8 0.31 41 5 0.92 12 0.46 67 7 0.99 10 0.53 61 10 0.88 16 0.40 80
* exp exp
Chapter 3
61
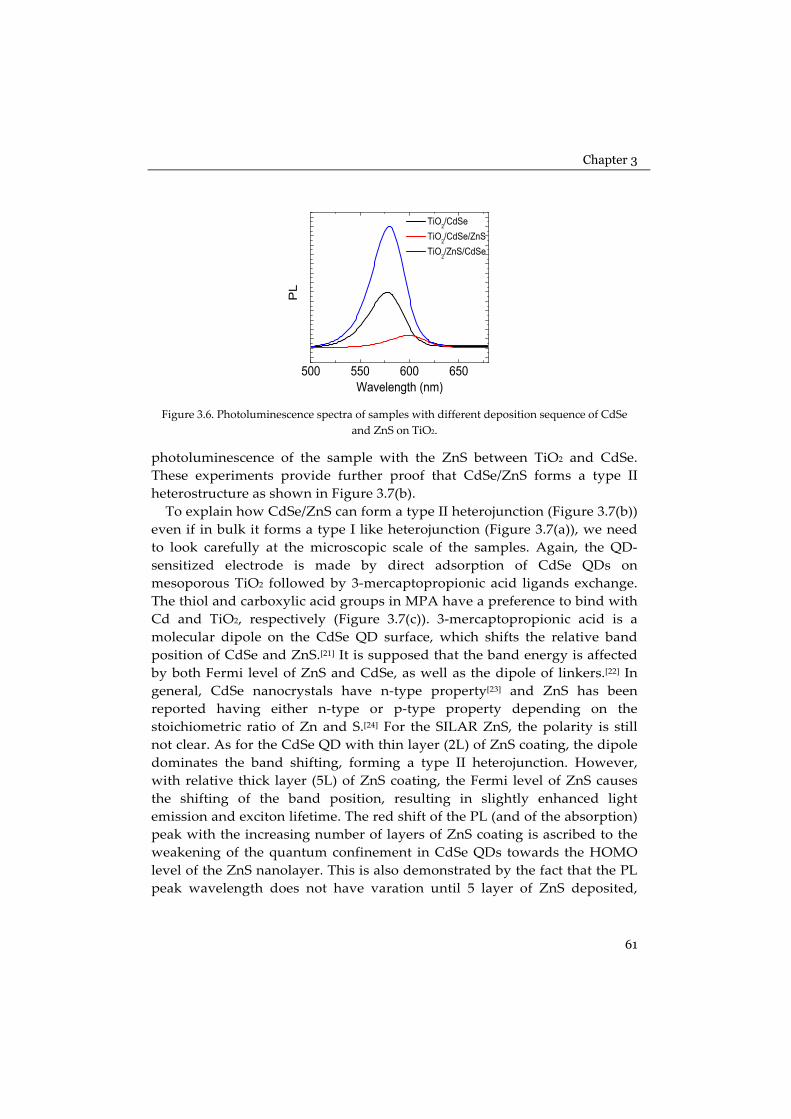
Figure 3.6. Photoluminescence spectra of samples with different deposition sequence of CdSe and ZnS on TiO2.
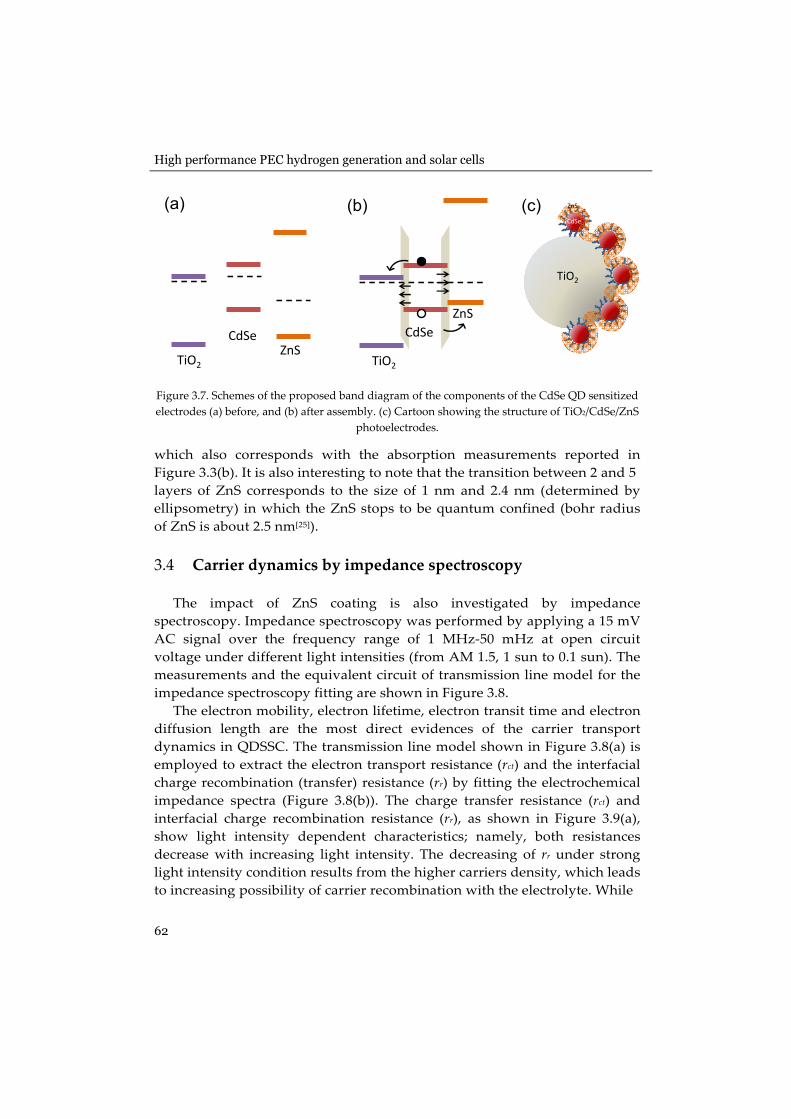
photoluminescence of the sample with the ZnS between TiO2 and CdSe. These experiments provide further proof that CdSe/ZnS forms a type II heterostructure as shown in Figure 3.7(b). To explain how CdSe/ZnS can form a type II heterojunction (Figure 3.7(b)) even if in bulk it forms a type I like heterojunction (Figure 3.7(a)), we need to look carefully at the microscopic scale of the samples. Again, the QD‐sensitized electrode is made by direct adsorption of CdSe QDs on mesoporous TiO2 followed by 3‐mercaptopropionic acid ligands exchange. The thiol and carboxylic acid groups in MPA have a preference to bind with Cd and TiO2, respectively (Figure 3.7(c)). 3‐mercaptopropionic acid is a molecular dipole on the CdSe QD surface, which shifts the relative band position of CdSe and ZnS.[21] It is supposed that the band energy is affected by both Fermi level of ZnS and CdSe, as well as the dipole of linkers.[22] In general, CdSe nanocrystals have n‐type property[23] and ZnS has been reported having either n‐type or p‐type property depending on the stoichiometric ratio of Zn and S.[24] For the SILAR ZnS, the polarity is still not clear. As for the CdSe QD with thin layer (2L) of ZnS coating, the dipole dominates the band shifting, forming a type II heterojunction. However, with relative thick layer (5L) of ZnS coating, the Fermi level of ZnS causes the shifting of the band position, resulting in slightly enhanced light emission and exciton lifetime. The red shift of the PL (and of the absorption) peak with the increasing number of layers of ZnS coating is ascribed to the weakening of the quantum confinement in CdSe QDs towards the HOMO level of the ZnS nanolayer. This is also demonstrated by the fact that the PL peak wavelength does not have varation until 5 layer of ZnS deposited,
High performance PEC hydrogen generation and solar cells
62
Figure 3.7. Schemes of the proposed band diagram of the components of the CdSe QD sensitized electrodes (a) before, and (b) after assembly. (c) Cartoon showing the structure of TiO2/CdSe/ZnS
photoelectrodes.
which also corresponds with the absorption measurements reported in Figure 3.3(b). It is also interesting to note that the transition between 2 and 5 layers of ZnS corresponds to the size of 1 nm and 2.4 nm (determined by ellipsometry) in which the ZnS stops to be quantum confined (bohr radius of ZnS is about 2.5 nm[25]).
Carrier dynamics by impedance spectroscopy 3.4
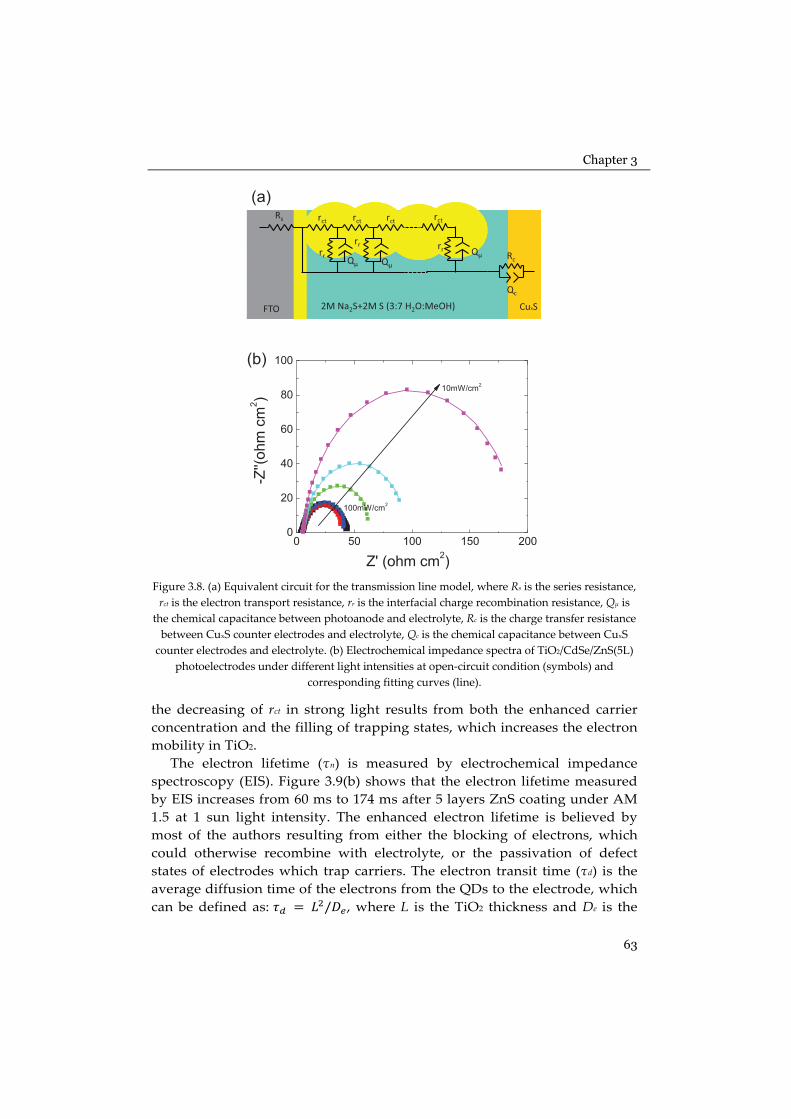
The impact of ZnS coating is also investigated by impedance spectroscopy. Impedance spectroscopy was performed by applying a 15 mV AC signal over the frequency range of 1 MHz‐50 mHz at open circuit voltage under different light intensities (from AM 1.5, 1 sun to 0.1 sun). The measurements and the equivalent circuit of transmission line model for the impedance spectroscopy fitting are shown in Figure 3.8. The electron mobility, electron lifetime, electron transit time and electron diffusion length are the most direct evidences of the carrier transport dynamics in QDSSC. The transmission line model shown in Figure 3.8(a) is employed to extract the electron transport resistance (rct) and the interfacial charge recombination (transfer) resistance (rr) by fitting the electrochemical impedance spectra (Figure 3.8(b)). The charge transfer resistance (rct) and interfacial charge recombination resistance (rr), as shown in Figure 3.9(a), show light intensity dependent characteristics; namely, both resistances decrease with increasing light intensity. The decreasing of rr under strong light intensity condition results from the higher carriers density, which leads to increasing possibility of carrier recombination with the electrolyte. While
TiO2
CdSeZnS
TiO2
CdSeZnS
(a) (b) (c)
TiO2
CdSe
ZnS
Chapter 3
63
Figure 3.8. (a) Equivalent circuit for the transmission line model, where Rs is the series resistance, rct is the electron transport resistance, rr is the interfacial charge recombination resistance, Qμ is
the chemical capacitance between photoanode and electrolyte, Rc is the charge transfer resistance between CuxS counter electrodes and electrolyte, Qc is the chemical capacitance between CuxS counter electrodes and electrolyte. (b) Electrochemical impedance spectra of TiO2/CdSe/ZnS(5L)
photoelectrodes under different light intensities at open‐circuit condition (symbols) and corresponding fitting curves (line).
the decreasing of rct in strong light results from both the enhanced carrier concentration and the filling of trapping states, which increases the electron mobility in TiO2. The electron lifetime (τn) is measured by electrochemical impedance spectroscopy (EIS). Figure 3.9(b) shows that the electron lifetime measured by EIS increases from 60 ms to 174 ms after 5 layers ZnS coating under AM 1.5 at 1 sun light intensity. The enhanced electron lifetime is believed by most of the authors resulting from either the blocking of electrons, which could otherwise recombine with electrolyte, or the passivation of defect states of electrodes which trap carriers. The electron transit time (τd) is the average diffusion time of the electrons from the QDs to the electrode, which can be defined as: / , where L is the TiO2 thickness and De is the
Rs rct rct rct rct
rr
rr
Qμ Qμ
rr Qμ Rc
Qc
FTO 2M Na2S+2M S (3:7 H2O:MeOH) CuxS
(a)
(b)

High performance PEC hydrogen generation and solar cells
64
electron diffusion coefficient, which can be derived from / , where fp is the peak frequency of the low frequency arc in the Nyquist impedance plot. Figure 3.9(b) shows that the electron transit time is not affected by the ZnS coating. In both devices (0L and 5L ZnS), electron lifetime is more than 2.5 times higher than the electron transit time under different light intensities. Figure 3.9(c) shows that the charge collection efficiencies of both devices are over 90% under variable light intensity. The charge collection efficiency
Figure 3.9. Light intensity dependent (a) charge transfer resistance (Rct) and charge
recombination resistance (Rr), (b) electron lifetime (τn) and transit time (τd), (c) electron diffusion
length (Ld) and charge collection efficiency (ηc).
dττ
η

Chapter 3
65
increases under weak light intensity. After the charge collection efficiency is obtained, the charge injection efficiency can be calculated. Briefly, the charge injection (separation) efficiency (Φinj) and the charge collection efficiency (ηc) can be derived according to equation (3.1).
. (Eq. 3.1)
Since the EQE measurement was done under weak light intensity (~1 mW cm‐2), Figure 3.9(c) indicates that the charge collection efficiencies (ηc) of both devices under low light intensity are approaching 100%; therefore, the
can be estimated to have the same value as the IQE shown in Figure 3.3(a). The main reason for the enhanced performance of the samples coated with ZnS is the increased charge injection efficiency. It is important to underline that the impedance spectroscopy, the optical measurements, and the electrical measurements performed on the device point to the same interpretation of the role of the ZnS in our device architecture; namely, TiO2/CdSe and the CdSe/ZnS heterojunctions drive the charge separation upon illumination.
Table 3.4. Equivalent circuit fitting results and other parameters of cells
Light Intensity
cμ’ a rct’ b rr’ c σ d τn e De f μe g n h Ld i ηc j
mWcm‐2 μFcm‐2
μm‐1
Ω cm2
μm‐1 Ω cm2
μm Sm‐1 ms m2s‐1 cm2V‐1s‐1 #cm‐3 μm %
Without ZnS100.0 686.92 0.28 86.32 3.52E‐02 59.3 8.2E‐10 3.1E‐04 6.98E+18 7.0 91.7
91.2 744.03 0.34 100.24 2.92E‐02 74.6 6.3E‐10 2.4E‐04 7.56E+18 6.8 91.2
79.4 747.89 0.39 108.56 2.60E‐02 81.2 5.5E‐10 2.1E‐04 7.60E+18 6.7 91.0
50.1 729.09 0.45 166.40 2.24E‐02 121.3 4.9E‐10 1.9E‐04 7.41E+18 7.7 93.0
31.6 709.66 0.46 229.60 2.17E‐02 162.9 4.9E‐10 1.9E‐04 7.21E+18 8.9 94.6
10.0 598.47 0.58 654.00 1.73E‐02 391.4 4.6E‐10 1.8E‐04 6.08E+18 13.4 97.5
5L ZnS
100.0 1125.25 0.15 154.56 6.65E‐02 173.9 9.4E‐10 3.6E‐04 1.14E+19 12.8 97.3
91.2 1046.29 0.31 141.28 3.18E‐02 147.8 4.8E‐10 1.9E‐04 1.06E+19 8.5 94.1
79.4 1030.43 0.31 155.92 3.19E‐02 160.7 4.9E‐10 1.9E‐04 1.05E+19 8.9 94.6
50.1 1048.90 0.33 246.00 3.07E‐02 258.0 4.7E‐10 1.8E‐04 1.07E+19 11.0 96.4
31.6 987.02 0.35 363.68 2.85E‐02 359.0 4.6E‐10 1.8E‐04 1.00E+19 12.9 97.3
10.0 904.05 0.37 740.08 2.69E‐02 669.1 4.7E‐10 1.8E‐04 9.19E+18 17.8 98.6
High performance PEC hydrogen generation and solar cells
66
a Chemical capacitance. b Charge transfer resistance. c Interfacial charge recombination resistance. d Electrical conductivity. e Electron lifetime. f Electron diffusion coefficient. g Electron mobility. h Free electron concentration. i Electron diffusion length. j The charge collection efficiency is calculated based on:
, where α is the extinction coefficient of
quantum dot‐sensitized TiO2 film. Here we assume the αL equals to 1 for the calculation. Another well‐adopted formula for the charge collection efficiency is 1 / . However, it is only valid when the cell active layer is thin enough so that the photo‐generated electrons either immediately are transported to the electrodes or recombine. In the case
results in 0, indicating that this formula obviously deviates from the real physical situation of the quantum dot‐sensitized solar cells.
Sensitized photoelectrodes stability 3.5
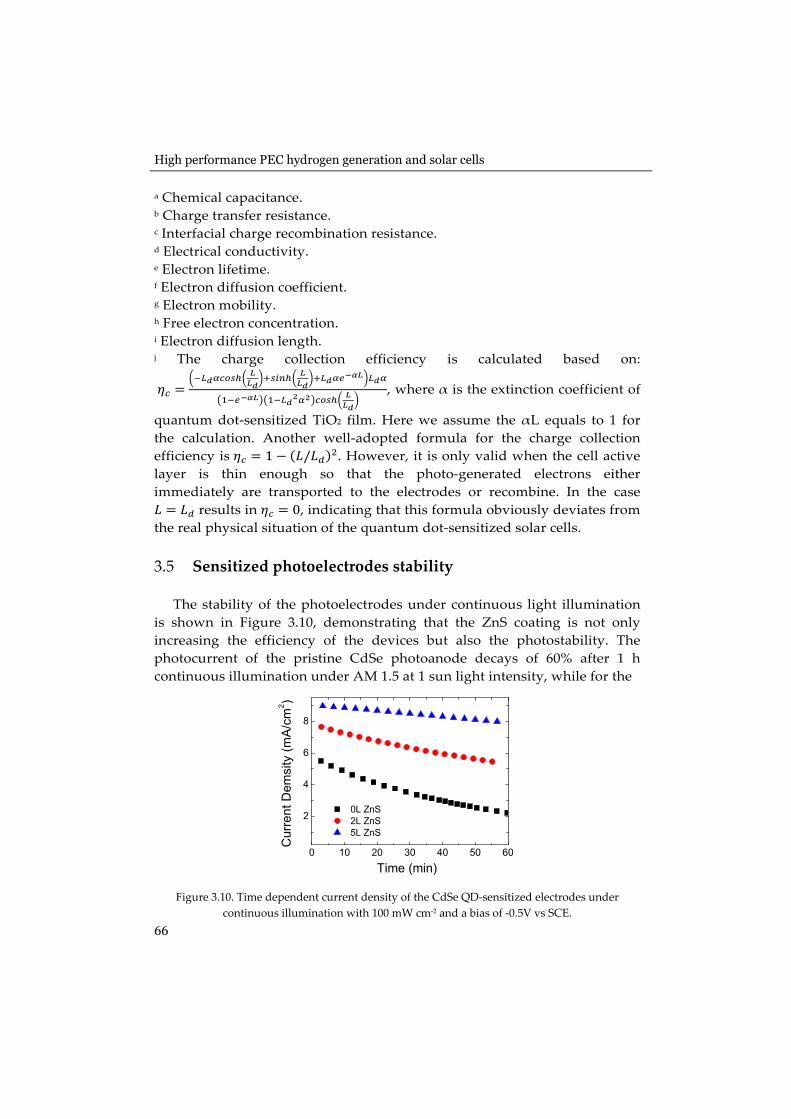
The stability of the photoelectrodes under continuous light illumination is shown in Figure 3.10, demonstrating that the ZnS coating is not only increasing the efficiency of the devices but also the photostability. The photocurrent of the pristine CdSe photoanode decays of 60% after 1 h continuous illumination under AM 1.5 at 1 sun light intensity, while for the
Figure 3.10. Time dependent current density of the CdSe QD‐sensitized electrodes under continuous illumination with 100 mW cm‐2 and a bias of ‐0.5V vs SCE.
Chapter 3
67
same electrode with 2L and 5L of ZnS coating, the photocurrent decays of 33% and 10%, respectively.
Conclusions 3.6
We demonstrated highly efficient water splitting and sensitized solar cells fabricated using direct adsorption of colloidal CdSe QDs on mesoporous TiO2 followed by 3‐mercaptopropionic acid ligands exchange. The QDSSC with 5L ZnS coating shows the best performance with internal quantum efficiency approaching 100% and energy conversion efficiency over 2%, while for photoelectrochemical H2 generation the current of ~10 mA cm‐2 under ‐0.5 V vs SCE was achieved with the same electrode. Moreover, by correlating results from different experimental techniques, we explained the role of the ZnS coating in the improved performance of the photoelectrode. Time‐resolved photoluminescence indicates the formation of a type II heterojunction in CdSe/ZnS QDs, which together with the other type II heterojunction formed with the TiO2 allows a more efficient carrier separation. Carrier dynamic measurements performed with impedance spectroscopy indicate that the enhanced efficiency of the device with ZnS coating is caused by the higher carrier injection efficiency. Finally, the device results, the impedance spectroscopy, and the optical measurements all point to the same interpretation of the role of the ZnS in our device architecture.
Methods 3.7
CdSe nanocrystal synthesis.
The synthesis of CdSe QDs was adopted from Ref. [26]. To prepare Cd‐myristate precursor, Cadmium nitrate (1.542 g, 5 mmol, in 150 mL methanol) was added drop wise to sodium hydroxide (0.6 g, 15 mmol) and myristic acid (3.42 g, 15 mmol) in methanol (500 mL). The resulting white precipitate was washed with methanol three times, and then dried at ~60oC under vacuum overnight. CdSe QDs were then synthesized by combining cadmium myristate 1.132 g (2 mmol), SeO2 (2 mmol) and ODE (128 mL) in a 500 mL three‐neck flask. The resulting mixture was degassed under vacuum (~50 mTorr, 10 min) at room temperature. Under argon flow and with stirring, the mixture was heated to the reaction temperature (240 oC) at a rate of 20 oC.min‐1. After 3 minutes at 240 oC, 4 mL of oleic acid was injected and the mixture was cooled down to RT. ODE was distilled from crude solution at 155oC under vacuum until 20 mL of solvent was left in the flask. The particles were washed 3 times with hexane as solvent and ethanol as

High performance PEC hydrogen generation and solar cells
68
nonsolvent. A quantum yield of about 1.7% is measured for CdSe/oleate (reference Rhodamine 26).
Preparation of the photoanode.
The FTO substrates (Sigma‐Aldrich, sheet resistivity ~7 Ω sq‐1) were cleaned with soap water and sonicated in deionized (DI) water, aceton and isopropyl alcohol in ultrasonic bath for 10 min for each cleaning step. A thin and compact TiO2 layer was coated on FTO by immersing the substrates into 40mM TiCl4 at 70 oC for 30 min. Mesoporous TiO2 films were prepared with TiO2 paste (Solaronix D/SP) by doctor blading. Samples were annealed at 450oC for 30 min to remove organics and make the film porous. Another thin TiO2 layer was formed using TiCl4 as the procedure before. Further annealing process was done at 450oC for 30 min. The final TiO2 thickness is ~4 μm measured by a step profiler (Veeco DEKTAK 150). The QDs colloidal solution (5 mg∙ml‐1) was drop‐casted on the TiO2 photoelectrodes and let drying for 20 min. After colloidal deposition samples were washed with hexane to remove residual QDs not absorbed on the TiO2 surface. Ligand exchange was done by immersing QDs‐sensitized TiO2 into 10% (v/v) 3‐mercaptopropionic acid (3‐MPA)(99%, Sigma‐Aldrich) in methanol solution for 10 min. Samples were again washed with methanol followed by annealing at 90 oC for 10 min to remove the solvent. ZnS was deposited by two SILAR half cycle reactions. First, samples were dipped into 0.1M aqueous Zn(NO3)2 (Zn(NO3)2∙6H2O, 98%, Sigma‐Aldrich) for 1 min, followed by rinsing with DI water and drying with a N2 gun. For the second cycle, samples were dipped into 0.1M aqueous Na2S (Na2S∙9H2O, 98%, Sigma‐Aldrich) for 1 min, followed by rinsing with DI water and drying with a N2 gun. These two half cycle reactions are named one SILAR layer.
Assembly of CdSe QDSSCs.
The photoanode (active area is 1 cm2) and the CuxS counter electrode were sandwiched together with a Teflon spacer (~2 mm thickness), the 2 M Na2S/2 M S in H2O‐MeOH (7:3, v/v) polysulfide electrolyte was injected into the cell.
Assembly of photoelectrochemical cell.
The three electrodes electrochemical cell is composed of QD sensitized electrode, Pt counter electrode, saturated calomel electrode (SCE) and 0.35M Na2SO3/0.25 M Na2S aqueous electrolyte.
Characterization.

Chapter 3
69
Absorbance, reflectance and transmittance are measured by UV‐3600 UV‐Vis‐NIR spectrophotometer (Shimadzu Scientific Instruments) equipped with 3 detectors (PMT, InGaAs and PbS) and an integrating sphere. The ZnS thickness is measured by Ellipsometer (V‐VASE, J. A. Woollam Co., Inc.), in which the ZnS was deposited on Si substrates with 300 nm SiO2 on the top. I‐V curves were measured by SP‐200, Bio‐Logic potentiostat equipped with electrochemical impedance spectroscopy analyzer. Solar cells measurements are performed under 100 mW cm‐2 AM 1.5G conditions obtained with a solar simulator (SF150 class A, Sciencetech) calibrated by a Si reference cell (SRC‐1000‐RTD‐QZ, VLSI Standards Incorporated). External quantum efficiencies (EQE) measurements are performed with a 250 W quartz tungsten halogen lamp (6334NS, Newport with lamp housing 67009, Newport), wavelength selection is obtained with a set of band pass filters (Thorlabs) with full width half max (FWHM)= 10 ± 2 nm from 400 nm to 740 nm. PD300 (Ophir Optics) is used as calibrated photodiodes. Impedance spectroscopy was performed by applying a 15 mV ac signal over the frequency range 1 MHz‐50 mHz at open circuit voltage under different light intensity (from AM 1.5, 1 sun to 0.1 sun). Photoluminescence measurements were performed by exciting the samples at 380 nm by the second harmonic of a mode‐locked Ti:Sapphire laser delivering pulses of 150 fs and repetition frequency of 76 MHz. The steady state PL was recorded using a Si CCD detector, while the time‐resolved PL was recorded by a Hamamatsu streak camera working in synchroscan mode. All PL spectra are corrected for the spectral response of the setup. The measurements are done in transmission mode.
References 3.8
[1] S. Hoang, S. Guo, N. T. Hahn, A. J. Bard, C. B. Mullins, Nano Lett. 2012, 12, 26‐32. [2] M. Batzill, E. H. Morales, U. Diebold, Phys. Rev. Lett. 2006, 96, 026103. [3] J. Luo, S. K. Karuturi, L. Liu, L. T. Su, A. I. Tok, H. J. Fan, Sci Rep 2012, 2, 451. [4] J. Hensel, G. Wang, Y. Li, J. Z. Zhang, Nano Lett. 2010, 10, 478‐483. [5] R. Trevisan, P. Rodenas, V. Gonzalez‐Pedro, C. Sima, R. S. Sanchez, E. M. Barea, I. Mora‐Sero, F.
Fabregat‐Santiago, S. Gimenez, J. Phys. Chem. Lett. 2013, 4, 141‐146. [6] J. W. Lee, D. Y. Son, T. K. Ahn, H. W. Shin, I. Y. Kim, S. J. Hwang, M. J. Ko, S. Sul, H. Han, N. G.
Park, Sci Rep 2013, 3, 1050. [7] H. Kim, M. Seol, J. Lee, K. Yong, J. Phy. Chem. C 2011, 115, 25429‐25436. [8] J. Luo, S. K. Karuturi, L. Liu, L. T. Su, A. I. Tok, H. J. Fan, Sci rep 2012, 2, 451. [9] P. Rodenas, T. Song, P. Sudhagar, G. Marzari, H. Han, L. Badia‐Bou, S. Gimenez, F. Fabregat‐
Santiago, I. Mora‐Sero, J. Bisquert, U. Paik, Y. S. Kang, Adv. Energy Mater. 2013, 3, 176‐182; K. Shin, S. I. Seok, S. H. Im, J. H. Park, Chem. Commun. 2010, 46, 2385‐2387.
[10] H. M. Chen, C. K. Chen, Y. C. Chang, C. W. Tsai, R. S. Liu, S. F. Hu, W. S. Chang, K. H. Chen, Angew. Chem. Int. Ed. 2010, 49, 5966‐5969.

High performance PEC hydrogen generation and solar cells
70
[11] T. Nann, S. K. Ibrahim, P. M. Woi, S. Xu, J. Ziegler, C. J. Pickett, Angew. Chem. Int. Ed. 2010, 49, 1574‐1577.
[12] Z. Pan, K. Zhao, J. Wang, H. Zhang, Y. Feng, X. Zhong, ACS Nano 2013, 7, 5215‐5222. [13] Y.‐L. Lee, C.‐F. Chi, S.‐Y. Liau, Chem. Mater. 2010, 22, 922‐927. [14] G. Wang, X. Yang, F. Qian, J. Z. Zhang, Y. Li, Nano Lett. 2010, 10, 1088‐1092; M. Seol, J.‐W. Jang, S.
Cho, J. S. Lee, K. Yong, Chem. Mater. 2013, 25, 184‐189. [15] L. H. Lai, L. Protesescu, M. V. Kovalenko, M. A. Loi, PCCP 2013, 16, 736‐742. [16] A. Salant, M. Shalom, I. Hod, A. Faust, A. Zaban, U. Banin, ACS Nano 2010, 4, 5962‐5968; A. Salant,
M. Shalom, Z. Tachan, S. Buhbut, A. Zaban, U. Banin, Nano Lett 2012, 12, 2095‐2100. [17] X. Y. Yu, J. Y. Liao, K. Q. Qiu, D. B. Kuang, C. Y. Su, ACS nano 2011, 5, 9494‐9500. [18] K.‐H. Lin, C.‐Y. Chuang, Y.‐Y. Lee, F.‐C. Li, Y.‐M. Chang, I. P. Liu, S.‐C. Chou, Y.‐L. Lee, J. Phy.
Chem. C 2012, 116, 1550‐1555. [19] N. Guijarro, J. M. Campina, Q. Shen, T. Toyoda, T. Lana‐Villarreal, R. Gomez, PCCP 2011, 13,
12024‐12032. [20] S.‐m. Yang, C.‐h. Huang, J. Zhai, Z.‐s. Wang, L. Jiang, J. Mater. Chem. 2002, 12, 1459‐1464; L. J.
Diguna, Q. Shen, J. Kobayashi, T. Toyoda, Appl. Phys. Lett. 2007, 91, 023116; Y.‐L. Lee, Y.‐S. Lo, Adv. Funct. Mater. 2009, 19, 604‐609; X. Wang, R. Liu, T. Wang, B. Wang, Y. Xu, H. Wang, ACS Appl. Mat. Interfaces 2013, 5, 3312‐3316.
[21] M. Soreni‐Harari, N. Yaacobi‐Gross, D. Steiner, A. Aharoni, U. Banin, O. Millo, N. Tessler, Nano Lett. 2008, 8, 678‐684.
[22] M. Shalom, S. Ruhle, I. Hod, S. Yahav, A. Zaban, J. Am. Chem. Soc. 2009, 131, 9876‐9877. [23] J. S. Lee, M. V. Kovalenko, J. Huang, D. S. Chung, D. V. Talapin, Nat. Nanotechnol. 2011, 6, 348‐352. [24] O. K. Echendu, A. R. Weerasinghe, D. G. Diso, F. Fauzi, I. M. Dharmadasa, J. Electron. Mater. 2013,
42, 692‐700. [25] B. Bhattacharjee, D. Ganguli, K. IakoubovskIi, A. Stesmans, S. Chaudhuri, Bull. Mater. Sci. 2002, 25,
175‐180. [26] O. Chen, X. Chen, Y. Yang, J. Lynch, H. Wu, J. Zhuang, Y. C. Cao, Angew. Chem. Int. Ed. 2008, 47,
8638‐8641.