university of groningen starch modifications in
TRANSCRIPT

University of Groningen
Starch modifications in supercritical CO2Muljana, Henky
IMPORTANT NOTE: You are advised to consult the publisher's version (publisher's PDF) if you wish to cite fromit. Please check the document version below.
Document VersionPublisher's PDF, also known as Version of record
Publication date:2010
Link to publication in University of Groningen/UMCG research database
Citation for published version (APA):Muljana, H. (2010). Starch modifications in supercritical CO2. Groningen: s.n.
CopyrightOther than for strictly personal use, it is not permitted to download or to forward/distribute the text or part of it without the consent of theauthor(s) and/or copyright holder(s), unless the work is under an open content license (like Creative Commons).
Take-down policyIf you believe that this document breaches copyright please contact us providing details, and we will remove access to the work immediatelyand investigate your claim.
Downloaded from the University of Groningen/UMCG research database (Pure): http://www.rug.nl/research/portal. For technical reasons thenumber of authors shown on this cover page is limited to 10 maximum.
Download date: 12-11-2019
CORE Metadata, citation and similar papers at core.ac.uk
Provided by University of Groningen
27
Chapter 2
Green Starch Conversions : Studies on Starch
Acetylation in Densified CO2
Abstract
The acetylation of potato starch with acetic anhydride (AAH) and sodium acetate (NaOAc)
as catalyst in densified CO2 was explored in a batch reactor setup. The effects of process
variables such as pressure (6 – 9.8 MPa), temperature (40 – 90 °C), AAH to starch ratio (2
– 5 mole/mole AGU), NaOAc to starch ratio (0.1 - 0.8 mole/mole AGU) and water content
(1 % - 15.2 %-wt/wt) on the degree of substitution (DS), the anhydride conversion (XAAH)
and the selectivity of the reaction (SSA) were explored. At these conditions, acetylated
potato starch with a range of DS values (0.01 - 0.46) is accessible in densified CO2. The
XAAH varied between 10 % - 80%, whereas the SSA is relatively low (2 % –18 %).
Empirical models were developed to quantify the effects of the process variables on DS,
XAAH and SSA. The temperature, water content and NaOAc to starch ratio have the highest
effect on the DS, XAAH and SSA values. For comparison, a number of experiments were
performed in water and the results confirm that densified CO2 is a good solvent for the
starch acetylation reaction.
Keywords: acetylation, potato starch, starch acetate, densified CO2

Chapter 2
28
H3C O CH3
OO
H2OH3C OH
O
2
H3C ONa
O
H3C OH
O
o
OH
o
OHH
HO
H
n
o
OH
o
O-Na+H
HO
H
n
2
H3C O CH3
OO
H3C ONa
O
o
OH
o
H
HO
H
n
CH3
O
O
o
OH
o
O-Na+H
HO
H
n
2.1 Introduction
The properties of native starch sources are not always sufficient for the foreseen
applications and often physical or chemical modifications are required. Esterification of
starch is a well known chemical modification reaction to improve the gelatinization
temperature, thermal stability and to reduce the tendency for retrogradation [1-5]. Starch
acetates are used in many applications. Examples are the use as thickening agents in a
variety of food products, as sizing agents for textile (wrap sizing) and paper (surface sizing)
and as gummed tape adhesives [3, 6-11]. For most applications, relatively low DS products
are required (DS range from 0.01 – 0.2). Acetylated starch with DS values higher than 2
are of interest because of possible applications as packaging material. However, the poor
mechanical properties of the acetylated starches, such as the pronounced brittleness, still
constitute a major shortcoming for further application of the products as packaging
materials [12].
Starch acetates are commonly produced in water as the solvent, by using acetic
anhydride (AAH) as reactant and an alkaline base like NaOAc as the catalyst (Scheme 2.1).
The starch source is activated with the base to form a starch alkoxide (ST-O-) which is
more reactive than native starch (Scheme 2.1.1) [13]. Subsequently, the starch alkoxide
will react with AAH to form the acetylated product and NaOAc (Scheme 2.1.2). An
undesired side reaction is the hydrolysis of AAH to form acetic acid (AA) (Scheme 2.1.3).
Scheme 2.1. Representative scheme of the starch acetylation reaction using AAH as
reagent and a basic catalyst (NaOAc).
2
(2.1.2)
(2.1.3)
(2.1.1)

Studies on Starch Acetylation in Densified CO2
29
In commercial starch acetylation processes, starch is suspended in water at
concentrations ranging between 35 and 42% [5] and then the reagents are added with a
given dose rate. A high water concentration is required to avoid mixing problems in the
reactor. As a consequence, the selectivity of the reaction towards the desired starch acetate
product (SSA) is reduced due to the simultaneous hydrolysis of AAH to AA. To improve
the selectivity, organic solvents such as pyridine and DMSO may be used. However, these
solvents have a much higher environmental impact than water. Hence, there is a strong
incentive to develop green, environmentally friendly solvents for starch esterifications.
A possible solution is the use of densified CO2. CO2 is considered to be a ‘green’
solvent, it is non-flammable, relatively non toxic and inert. In the supercritical state
(critical temperature, Tc, of 31 oC and pressure, Pc, of 7.38 MPa), CO2 has shown to be a
good solvent for a range of polymers, a useful processing aid for polymer processing and
an attractive medium for chemical reactions. Another advantage is the ease of separation
of CO2 from the reaction mixture by a simple reduction of the pressure [14-18].
Recently, Harris et al. (1999) showed that acetylated starch with DS values ranging
from 0.2 – 2.4 could be synthesized in densified and supercritical CO2 [19]. High amylose
starch (Hylon RTM VII, 70% amylose content) was used and only a limited number of
experiments were performed with other starch sources. Furthermore, systematic studies
covering the effects of the process conditions were not reported. Here, we report our
research activities on the synthesis of acetylated potato starch in densified CO2. The effects
of process variables on the reaction were determined. The experimental data were modeled
using non-linear multivariable regression to quantify the effects of process variables on the
DS, XAAH and SSA. These models will be valuable input for further process design and
optimization purposes.
2.2 Materials and methods
2.2.1 Materials
Potato starch was kindly supplied by AVEBE (The Netherlands). The water content
was 15.2 % wt/wt as determined by drying the potato starch in a vacuum oven at 50oC until
constant weight. Analytical grade acetic anhydride (AAH) and sodium acetate (NaOAc)
were purchased from Merck (Germany). High purity CO2 (≥ 99.7% volume) and N2 (≥
99.9% volume) were used. All chemicals were used without further purification.

Chapter 2
30
2.2.2 Reactor setup
The high pressure setup consists of a double walled stirred reactor (Buchi, 500 mL), an
oil bath with a temperature controller, a high pressure pump unit and CO2 and N2 feeding
bottles (Fig. 2.1). The maximum reactor temperature is 250 oC, the maximum pressure 10
MPa. The reactor is equipped with an overhead stirrer and a Rushton type impeller. The
high pressure pump unit consists of a membrane pump (Lewa) with a capacity of 60 kg/hr
at a maximum pressure of 35 MPa. To prevent cavitation in the pump, the CO2 is first
cooled to 0 oC in a heat exchanger (Huber, The Netherlands). A heat exchanger with an oil
bath is located after the pump and is used to heat the CO2 to the desired temperature.
Figure 2.1. High pressure reactor setup.
2.2.3 Experimental procedure for the acetylation of starch
2.2.3.1 Reactions in densified CO2
Native starch (10 g, 0.062 mole AGU), AAH (2 – 5 mole/mole AGU) and NaOAc (0.1
– 0.8 mole/mole AGU) were added to the reactor. The reactor was flushed with the N2 to
remove traces of air. The autoclave was pressurized with CO2 and heated to the desired
reaction temperature. If required, additional CO2 was added to reach the pre-determined
reaction pressure (Table 2.1). After reaction, the reactor was cooled to room temperature,
depressurized and the liquid phase was separated from the solid product. The solid product
were further washed with water (1.5 liter), filtered and dried in a vacuum oven at 50 oC
Studies on Starch Acetylation in Densified CO2
31
until constant weight. The dried product was used for further analyses. The amount of
unreacted AAH in the liquid phase was determined using gas chromatography (GC).
2.2.3.2 Reactions in water
For the starch acetylation in water, native starch (10 g, dry basis), AAH (4.35
mole/mole AGU), and NaOAc (0.1 mole/mole AGU) were added to the reactor.
Subsequently, water (purified by reverse osmosis, 14 mL) was added to obtain a 40%
wt/wt starch-water suspension. After flushing with N2, the autoclave was heated to the
desired reaction temperature. After the pre-determined reaction time (typically 1 h), the
reactor was cooled to room temperature. Product work-up was performed using the
procedure described above for the densified CO2 experiments.
2.2.4 Analytical equipment
The DS of the products was routinely determined using a hydrolysis method (section
2.2.5). For comparison, the DS of some selected samples was also determined using 1H-
NMR on an Oxford NMR AS 400 spectrometer operated at 400 MHz. The product (25 mg)
was dissolved in DMSO-d6 (2 g). 1H-NMR spectra were acquired at 60
oC (64 scans) using
a relaxation time of 1.0 s.
The composition of the liquid phase was determined using GC. A GC- HP 5890 series
II equipped with an FID detector and a HP 5 column (length = 30 m and I.D. = 0.25 mm)
was applied. The GC was operated at the following conditions: injector temperature 280 oC,
oven temperature 100 oC, detector temperature 300
oC and an inlet pressure of 86 kPa.
Helium was used as the carrier gas with a flow rate of 2.2 ml/min.
Fourier Transform Infrared (FT-IR) spectra were acquired on a FT-IR (Spectrum 2000,
Perkin-Elmer, UK) ATR (attenuated total reflectance) golden gate apparatus (Graseby-
Specac Ltd, Orpington, UK). A total of 50 scans with a resolution of 4 cm-1
were measured.
The morphology of native starch and acetylated products were determined using field
emission scanning electron microscope (FESEM) on a JEOL 6320F.
2.2.5 Determination of the degree of substitution (DS)
2.2.5.1 Hydrolysis method
Determination of the DS by the hydrolysis method involves complete basic hydrolysis
of the ester linkages and titration of the excess alkali with acid [8]. A powdered sample
(0.5 g) was weighed accurately and placed in a 250 ml erlenmeyer flask with stopper.

Chapter 2
32
Reverse osmosis water (10 ml), 0.1 N NaOH (25 ml) and a few drops of phenolphtalein
were added. The mixture was stirred gently with a magnetic stirrer at room temperature for
2 h. Subsequently, the excess alkali was titrated with 0.1 N (HCl) until the red color of
phenolphtalein disappeared. The same procedure was carried out for the native starch. The
DS was calculated using the following equation [8, 9]:
( )
( ) 42)xNx)V((Vmx1000
162xNxVVDS
HCl1oM
HCl1o
−−
−= (2.1)
where Vo is the titration volume of acid for the native starch (ml), V1 the titration volume
of acid for the acetylated sample (ml), NHCl normality of used HCl and mM the mass of the
acetylated sample (g).
2.2.5.2 1H-NMR method
The DS of the acetylated products was calculated by comparing the unit area of the
acetate protons (AH-ace, at δ 1.9 – 2.1 ppm) with the unit area of the starch protons (AH-agu,
at δ 3.6 – 5.6 ppm) using the following equation [8, 20, 21]:
agu
ace
3A
7ADS = (2.2)
where AH-ace is the area of the methyl signals and AH-agu is the area of the proton signals of
the anhydroglucose unit.
2.2.5.3 Comparison between the hydrolysis and 1H-NMR method
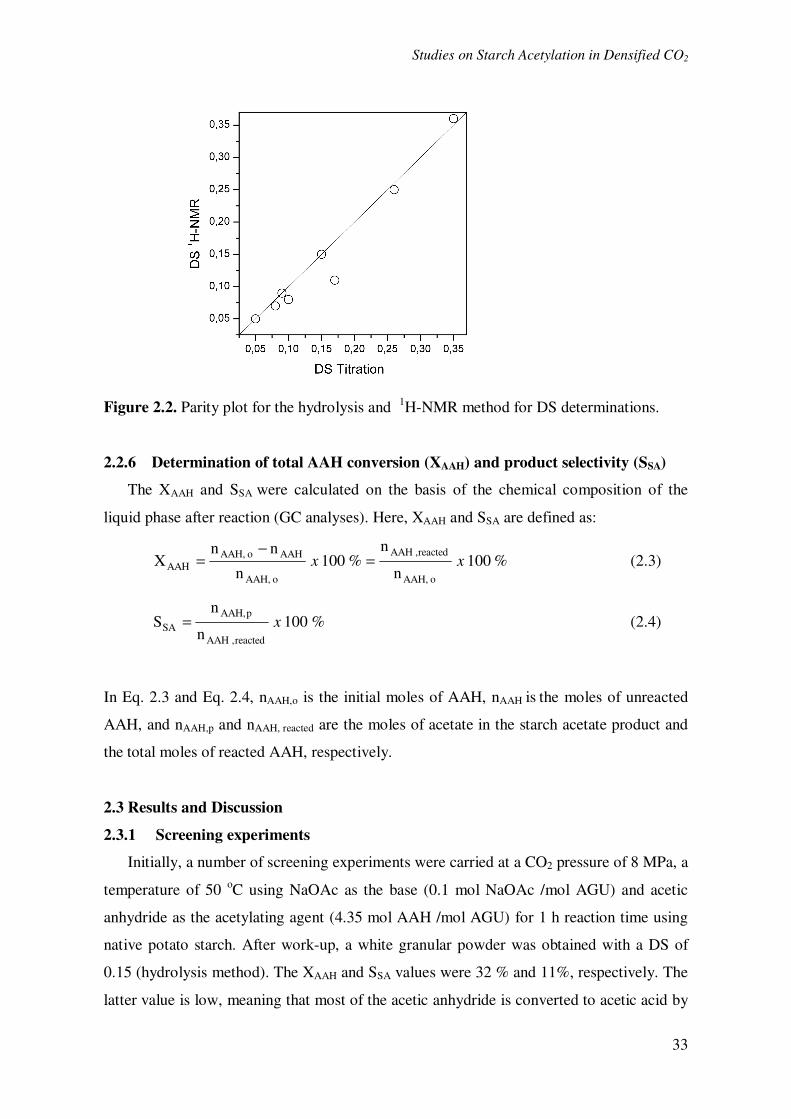
Figure 2.2 depicts a parity plot of the DS values measured with the hydrolysis and 1H-
NMR method for a number of samples. Evidently, agreement is good (R2 of 0.98) which
suggests that both methods may be applied for determination of the DS.
Studies on Starch Acetylation in Densified CO2
33
Figure 2.2. Parity plot for the hydrolysis and 1H-NMR method for DS determinations.
2.2.6 Determination of total AAH conversion (XAAH) and product selectivity (SSA)
The XAAH and SSA were calculated on the basis of the chemical composition of the
liquid phase after reaction (GC analyses). Here, XAAH and SSA are defined as:
%100n
n%100
n
nnX
o AAH,
reacted,AAH
o AAH,
AAHo AAH,
AAH xx =−
= (2.3)
%100n
nS
reacted,AAH
pAAH,
SA x= (2.4)
In Eq. 2.3 and Eq. 2.4, nAAH,o is the initial moles of AAH, nAAH is the moles of unreacted
AAH, and nAAH,p and nAAH, reacted are the moles of acetate in the starch acetate product and
the total moles of reacted AAH, respectively.
2.3 Results and Discussion
2.3.1 Screening experiments
Initially, a number of screening experiments were carried at a CO2 pressure of 8 MPa, a
temperature of 50 oC using NaOAc as the base (0.1 mol NaOAc /mol AGU) and acetic
anhydride as the acetylating agent (4.35 mol AAH /mol AGU) for 1 h reaction time using
native potato starch. After work-up, a white granular powder was obtained with a DS of
0.15 (hydrolysis method). The XAAH and SSA values were 32 % and 11%, respectively. The
latter value is low, meaning that most of the acetic anhydride is converted to acetic acid by
Chapter 2
34
hydrolysis (see Scheme 2.1). This aspect is further discussed in section 2.3.2. The product
was characterized by FT-IR and 1H-NMR and SEM.
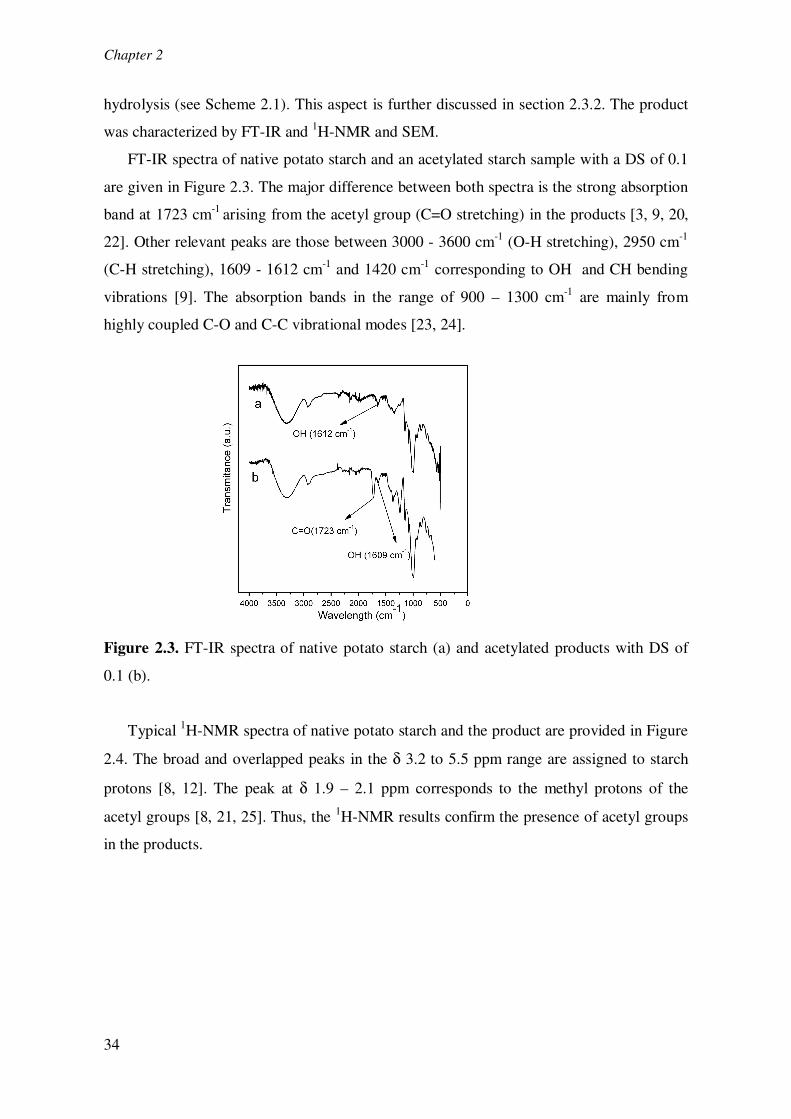
FT-IR spectra of native potato starch and an acetylated starch sample with a DS of 0.1
are given in Figure 2.3. The major difference between both spectra is the strong absorption
band at 1723 cm-1
arising from the acetyl group (C=O stretching) in the products [3, 9, 20,
22]. Other relevant peaks are those between 3000 - 3600 cm-1
(O-H stretching), 2950 cm-1
(C-H stretching), 1609 - 1612 cm-1
and 1420 cm-1
corresponding to OH and CH bending
vibrations [9]. The absorption bands in the range of 900 – 1300 cm-1
are mainly from
highly coupled C-O and C-C vibrational modes [23, 24].
Figure 2.3. FT-IR spectra of native potato starch (a) and acetylated products with DS of
0.1 (b).
Typical 1H-NMR spectra of native potato starch and the product are provided in Figure
2.4. The broad and overlapped peaks in the δ 3.2 to 5.5 ppm range are assigned to starch
protons [8, 12]. The peak at δ 1.9 – 2.1 ppm corresponds to the methyl protons of the
acetyl groups [8, 21, 25]. Thus, the 1H-NMR results confirm the presence of acetyl groups
in the products.

Studies on Starch Acetylation in Densified CO2
35
Figure 2.4. 1H NMR spectra of native potato starch (a) and acetylated product with a DS
of 0.1 (b).
Figure 2.5. SEM images of native potato starch (a) and the acetylated products with DS
0.15 (b),(c).
The morphology of the product was studied using SEM. Typical SEM images of
native starch and an acetylated product with a DS of 0.15 are given in Figure 2.5. The
morphology of the starch granules appears to be altered by the modification reaction. It

Chapter 2
36
seems that the starch granules agglomerate upon acetylation (Figure 2.5b and 2.5(c)), a
feature also commonly observed for acetylated starch products with a low DS value (0.1-
0.2) prepared in water [3, 7, 9, 26]. According to Singh et al. (2004), the introduction of
acetyl groups on the starch molecules results in an increase in intermolecular hydrogen
bonding and leads to the fusion of starch granules [7].
2.3.2 Systematic studies
The effects of process variables like temperature, pressure, AAH and NaOAc intakes,
and the water content of starch on the product DS, XAAH and SSA were studied in detail by
varying one of the variables while keeping the other variables at a constant value. The CO2
pressure was varied between 6 and 9.8 MPa. This pressure range is of particular interest as
most changes in physical properties (such as density and viscosity) of solvents occur near
the critical point. A detailed overview of the experimental conditions and results are given
in Table 2.1. The effects of the individual process variables on product DS and reaction
parameters will be discussed in the following sections. When relevant, the product DS and
the XAAH and SSA will be compared with reactions carried out in water instead of densified
CO2. Similar reagent intakes and temperatures were applied for these experiments.
Table 2.1. Overview of experimental results on the effect of process conditions, reagent
intake (AAH, NaOAc) and starch water content on the DS, XAAH and SSA in densified CO2a.
No Pressure (MPa)
Temperature (oC)
AAH : AGU (mol/mol)b
NaOAc : AGU (mol/mol)c
Water content (% wt/wt)
DS XAAH
(%) SSA
(%)
1 8 40 4.35 0.1 15.2 0.08 15 11 2 8 50 4.35 0.1 15.2 0.15 32 11 3 8 60 4.35 0.1 15.2 0.2 44 11 4 8 70 4.35 0.1 15.2 0.27 53 12 5 8 90 4.35 0.1 15.2 0.41 57 16 6 9 40 4.35 0.1 15.2 0.07 18 9 7 9 50 4.35 0.1 15.2 0.15 33 11 8 9 60 4.35 0.1 15.2 0.22 44 12 9 9 70 4.35 0.1 15.2 0.29 53 13 10 9 90 4.35 0.1 15.2 0.39 63 14 11 9.8 40 4.35 0.1 15.2 0.04 13 8 12 9.8 50 4.35 0.1 15.2 0.15 32 11 13 9.8 60 4.35 0.1 15.2 0.23 42 13 14 9.8 70 4.35 0.1 15.2 0.24 49 11 15 9.8 90 4.35 0.1 15.2 0.43 62 16
16 6 50 4.35 0.1 15.2 0.14 36 9 17 7 50 4.35 0.1 15.2 0.15 37 9 18 8 50 4.35 0.1 15.2 0.15 32 11 19 9 50 4.35 0.1 15.2 0.15 33 11

Studies on Starch Acetylation in Densified CO2
37
Table 2.1. (continued)
a. All experiments were performed at 1 h reaction time b. mol ratio of acetic anhydride AAH to AGU units of starch c. mol ratio of sodium acetate (NaOAc) to AGU units of starch
d. no catalyst use in the experiment
2.3.2.1 Temperature effects on reaction performance
With the dataset available, the effect of temperature on the DS, XAAH and SSA may be
evaluated. The results are provided in Figures 2.6a-2.6c. As expected, the highest reaction
rates are observed at the highest temperatures, leading to the highest DS values in the range.
At 90 oC, the DS was 0.43 at a pressure of 9.8 MPa. A similar temperature dependency was
reported by Harris et al. (1999), though these experiments were performed at higher
pressure (17.2 MPa). Here, the DS increased from 0.08 to 1.11 when the temperature was
raised from 90 oC to 115
oC [19]. As expected, the XAAH also increases at higher
temperatures. The highest conversion (63 %) was observed at 90 oC. Thus the AAH
conversion is not yet complete, indicating that higher DS values are possible at longer
reaction times.
No Pressure (MPa)
Temperature (oC)
AAH : AGU (mol/mol)b
NaOAc : AGU (mol/mol)c
Water content (% wt/wt)
DS XAAH
(%) SSA
(%)
20 9.8 50 4.35 0.1 15.2 0.15 32 11 21 6 70 4.35 0.1 15.2 0.29 53 13 22 7 70 4.35 0.1 15.2 0.29 48 14 23 8 70 4.35 0.1 15.2 0.27 53 12 24 9 70 4.35 0.1 15.2 0.29 53 13 25 9.8 70 4.35 0.1 15.2 0.24 49 11
26 6 90 4.35 0.1 15.2 0.43 59 17 27 7 90 4.35 0.1 15.2 0.46 58 18 28 8 90 4.35 0.1 15.2 0.39 57 16 29 9 90 4.35 0.1 15.2 0.39 63 14 30 9.8 90 4.35 0.1 15.2 0.43 62 16
31 8 50 4.35 0.1 2.5 0.01 6 4 32 8 50 4.35 0.1 6.3 0.02 12 4 33 8 50 4.35 0.1 9.1 0.02 17 3 34 8 50 4.35 0.1 15.2 0.15 32 11
35 8 50 2 0.1 15.2 0.16 80 10 36 8 50 3 0.1 15.2 0.15 50 10 37 8 50 4.35 0.1 15.2 0.15 32 11 38 8 50 5 0.1 15.2 0.12 28 9
39 8 50 4.35 0d 15.2 0.03 19 4 40 8 50 4.35 0.1 15.2 0.15 32 11 41 8 50 4.35 0.2 15.2 0.15 39 9 42 8 50 4.35 0.4 15.2 0.13 39 8 43 8 50 4.35 0.6 15.2 0.14 42 8 44 8 50 4.35 0.8 15.2 0.14 47 7

Chapter 2
38
Figure 2.6. The influence of temperature on DS (a), XAAH (b), and SSA (c) values at
different pressures. Data for reactions in water are also included for comparison.
The SSA values are all below 18 %, indicating that the hydrolysis reaction is favored
over the starch acetylation reaction. The SSA increase at higher temperature (see Fig. 2.6c)
and suggests that the rate of the desired acetylation reaction is enhanced to a larger extent
at higher temperatures than the rate of the hydrolysis reaction. This implies that the
activation energy for the desired acetylation reaction in densified CO2 is higher than for the
hydrolysis reaction.
To gain insights in the potential of densified CO2 for the acetylation reaction, a number
of reactions were also performed in water as the solvent. Similar starch-water (40 % wt/wt),
NaOAc (0.1 mol/mol AGU) and AAH intakes (4.35 mol/mol AGU) were applied and the

Studies on Starch Acetylation in Densified CO2
39
reactions were conducted in the experimental setup used for the high pressure experiments.
The results are given in Table 2.2.
Table 2.2. The effect of temperature on the DS, XAAH, and SSA using water as the solvent.
T (oC) DS XAAH (%) SSA (%)
40 0.06 100 1
50 0.08 100 2
60 0.08 100 2
70 0.08 100 2
90 0.12 100 3
The DS values as well as the SSA in water are always lower than for densified CO2, see
Figure 2.6 for details. Furthermore, the XAAH is always quantitative. Thus, the undesired
hydrolysis reaction occurs to a considerably higher extent in water than in densified CO2,
leading to lower DS and SSA values.
2.3.2.2 Pressure effects on reaction performance
The pressure (6 – 9.8 MPa) has only a slight influence on DS, SSA, and XAAH values,
see Figs. 2.7a-2.7c for details. These findings are in contrast with the results reported by
Harris et al. (1999). A decrease in the DS from 2.3 to 1.6 was found in these studies when
increasing the pressure from 10.3 MPa to 17.2 MPa [19]. However, considerably higher
temperatures were applied in this study (140 oC), making a proper comparison
cumbersome.
When using supercritical solvents, large pressure effects on the reaction rates are
expected near the critical point [15]. For instance, Savage et al. (1996) reported a 2-fold
increase in the k-values for the reaction between maleic anhydride and isoprene when
going from just below the critical point of CO2 to 9 MPa [15]. These trends are not
observed for the acetylation of starch (Figure 2.7). This raises the question whether the
supercritical state was achieved within the experimental ranges of this study. The reagents,
particularly when present in higher amounts, can affect the critical properties of CO2
considerably. For the system CO2 and AAH, the critical point for an AAH mole fraction
(2COAAH
x−
) of 0.0972 was at 14.84 MPa and 87.12 oC [27], thus considerably higher than
pure CO2. The 2COHAA
x−
in our experiments is in the same range (0.11 – 0.14), and it is thus
most likely that the reactions reported here were carried out at sub-critical instead of
supercritical conditions.

Chapter 2
40
2.3.2.3 The effect of water intake on reaction performance
The effect of water in the reaction mixture was studied by varying the water content of
the native starch feed. As given in Table 2.1 (no 31-34), the DS, XAAH, and SSA values drop
significantly at lower water content. The DS trend is in line with literature data from Harris
et al. (1999), where a significant decrease in DS values (from 2.47 to 0.08) was found
when lowering the water content from 15 to 2.5 % [19]. Apparently, water plays a major
role in the reactions and has a positive effect on the rate of the desired starch acetylation
reaction.
To gain insights in the role of water in the reaction, the water intake was compared
with the AAH intake and the AAH consumed in both the desired starch acetylation
reaction and the undesired hydrolysis reaction. The data are given in Table 2.3.
Figure 2.7. The influence of pressure on DS (a), XAAH (b), and SSA (c) values at different
temperatures.

Studies on Starch Acetylation in Densified CO2
41
Table 2.3. Reactivity of AAH for the starch acetylation and hydrolysis reaction.
In all cases, AAH is present in excess and water is the limiting reactant. It is
particularly evident that most of the AAH is consumed by the hydrolysis reaction and that
the water conversion by this reaction is in all cases higher than 80 %. This implies that the
hydrolysis reaction is much faster than the reaction of AAH with starch. Thus, on average
less AAH is available for the reaction with starch leading to lower reaction rates for the
desired starch acetylation reaction. In addition, the hydrolysis reaction leads to the
formation of acetic acid (Scheme 2.1) which has a negative effect on the starch acetylation
reaction by driving the first equilibrium step (activation of starch by the base, see Scheme
2.1) to the left side.
These arguments to explain the effects of water on the reaction rate of the two parallel
reactions occurring in the system (starch acetylation and anhydride hydrolysis) are based
on single phase kinetic arguments only. The system under study is far more complex and
should either be regarded as a solid/scCO2 system or maybe also a solid/liquid/liquid
system or a combination thereof. The actual state will be depending on whether the
CO2/anhydride/acetic acid/water combination is actually in the supercritical state or present
as separate liquid phases. Furthermore, there is indication that the reaction does not occur
in scCO2 but in densified CO2 (vide supra). In such a multiphase system, not only the
intrinsic kinetics of the reactions determine the selectivity but also mass transfer and
solubility effects may play a major and even decisive role. The latter also determines the
locus of reaction (surface or also inside particle). It is clear that the locus of the desired
acetylation reaction of starch will take place in or at the surface of the starch particle,
whereas the hydrolysis reaction may also take place in the liquid phase outside a starch
particle and this further complicates the analyses.
No Water content in starch source (% wt/wt)
Water intake
(x 10-3 mol)
AAH Intake (x 10-3 mol)
AAH reacted with water (x 10-3 mol)
AAH reacted with starch (x 10-3 mol)
31 2.5 16.33 270 15.58 0.62
32 6.3 37.31 270 31.17 1.23
33 9.1 55.61 270 44.67 1.23
34 15.2 99.31 270 77.14 9.26
Chapter 2
42
2.3.2.4 The effect of acetic anhydride (AAH) intake on reaction performance
The effect of the AAH intake on reaction performance was probed for 4 different AAH
to starch ratios. The experimental results are given in Table 2.1 (no 35 – 38). Clearly, the
DS and XAAH values decrease at a higher AAH ratio while the SSA values were almost
constant for all cases. Apparently, a higher AAH intake does not lead to a higher reaction
rate for the desired reaction with starch. The results can be rationalized by considering the
higher reaction rate of the undesired hydrolysis reaction compared to the starch acetylation
reaction in combination with the formation of acetic acid which further lowers the rate of
the starch acetylation reaction. Again, other effects related to the multi-phase nature of the
system cannot be excluded.
2.3.2.5 The effect of catalyst intake on reaction performance
The effect of the NaOAc intakes on DS, XAAH and SSA are shown at Table 2.1 (no 39 –
44). The DS values are relatively constant while the SSA values tend to decrease with
higher catalyst intake. In contrast with the DS and SSA trends, XAAH increases with higher
catalyst intake. Apparently, the AAH hydrolysis reaction is favored at higher NaOAc ratio.
The opposite trend is reported in literature. Harris et al. (1999) showed that the DS
increases from 0.2 to 2.4 when the catalyst ratio increases from 0.05 to 0.2 (mol / mol
AGU) [19]. These differences in the trends may be due to the higher catalyst intake in our
experiments (up to 0.8 mol/mol AGU). Another possible explanation is the established
observation that the rate of the AAH hydrolysis reaction is a function of the NaOAc intake,
with higher NaOAc concentrations leading to higher reaction rates [28-31]. Thus, the basic
catalyst not only affects the rate of the desired starch acetylation reaction but also the
undesired hydrolysis reaction.
The acetylation reaction is also occurring without the NaOAc catalyst (Table 2.1).
However, the DS value is much lower than in the presence of NaOAc, indicating that the
addition of a catalyst is crucial to improve the starch reactivity. These findings are in
agreement with the work of Dicke (2004) on the acetylation of starch using acetic
anhydride and vinyl acetate in DMSO [32]. Here acetylation was also observed in the
absence of a catalyst, though the reactivity was lower than in the presence of the catalyst.

Studies on Starch Acetylation in Densified CO2
43
2.3.2.6 Quantification of the effects of process conditions on reaction performance
using empirical models.
To quantify the effects of the process variables (temperature, pressure, AAH intake,
NaOAC intake, and starch water content) on the DS, XAAH and SSA, the experimental data
were modelled using an expression given in Equation 2.5. All regression coefficients (bi, bii,
and bij) and the intercept (bo) were calculated using Mathcad® software package.
A t-test (for statistical significance) was performed for the regression coefficients and
the non significant terms were deleted from the model [33]. The calculated regression
coefficients are given in Table 2.4. Empirical models with a good R2 and R
2adjusted values
(0.9 – 0.98) were obtained which imply that these models correctly describe and fit the
experimental data.
Table 2.4. Regression coefficients of DS, XAAH, and SSA models.
DS XAAH SSA
Coefficients to Coefficients to Coefficients to
Variable (xi) Intercept (bo)
-0.298 -2.064 8.072 10.189 -1.467 1.304
Pressure (x1) b1 -3.068 x 10⁻⁴ -0.847 -0.034 -0.762 -0.013 -0.786
Temperature (x2) b2 6.806 x 10⁻³ 28.702 3.134 10.741 0.132 11.712
AAH intake (x3) b3 -0.01 -1.133 -43.946 -4.546 0.397 0.946
NaOAc intake (x4) b4 -0.011 -0.547 53.167 4.386 -15.763 -3.343
Water content (x5) b5 0.011 9.184 2.032 14.004 -0.627 -1.669
x22 b22 - - -0.017 -8.101 - -
x33 b33 - - 3.668 2.59 - -
x44 b44 - - -44.206 -3.569 11.971 2.483
x55 b55 - - - - 0.067 3.269
R2 0.97 0.98 0.91
R2 adjusted 0.96 0.97 0.90
R2 PRESS 0.96 0.94 0.84
(2.5) ∑∑∑∑= ===
+++=3
1i
3
1j
jiij
3
1i
2
iii
3
1i
i iok xxbxbxbby

Chapter 2
44
Figure 2.8. Parity plot between predicted and experimental values of DS (a), XAAH (b) and
SSA (c).
The parity plots of the three models are given in Figure 2.8 and confirm these
observations. Internal validation was performed using PRESS calculations [33] and
relatively high R2
PRESS values (0.84 – 0.96) were observed, indicative for good predictive
capability of the models.
(a) (b)
(c)
Studies on Starch Acetylation in Densified CO2
45
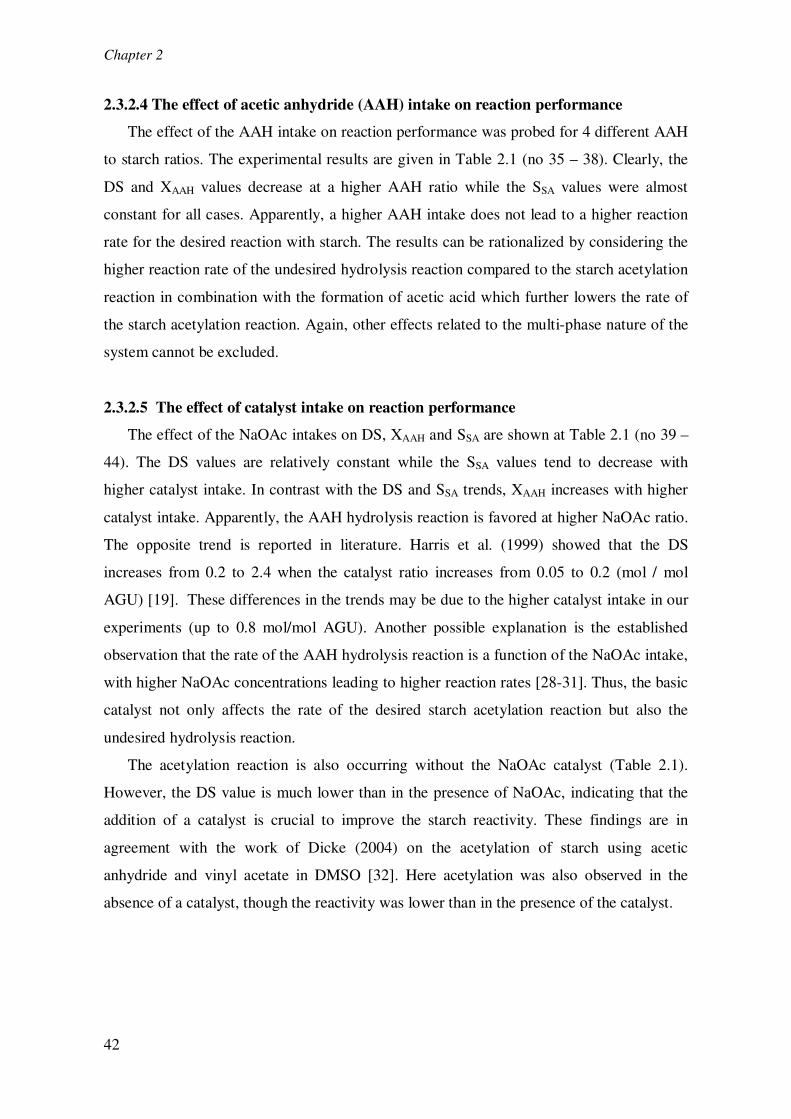
Figure 2.9. Optimisation studies using the empirical model on DS (a), XAAH (b), and SSA
(c). (Data for DS and XAAH: 8 MPa, 0.1 mol NaOAc/mol AGU, and 4.35 mol/molAGU.
For SSA 8 MPa, 4.35 mol AAH/mol AGU and 15.2 % water intake).
Temperature and water content have the most significant effect on the DS and XAAH
values of the product (based on the to values), while the NaOAc ratio and temperature have
the highest influence on the SSA. It is clearly shown by all models that pressure only has a
limited effect on DS, XAAH and SSA values. Figs. 2.9a-2.9c illustrate the model predictions
of the effects of various process parameters on the DS, XAAH and SSA using the empirical
models. The highest DS (0.43) and XAAH (67 %) values are obtained at the highest
temperature in the range (90 oC) and highest initial water content of the starch (15.2 %).
The highest SSA value (15 %) is obtained at a low NaOAc ratio (0.1 mol/ mol AGU) and
highest temperature (90 oC). These models may be applied to determine the process
conditions to obtain a product with a pre-defined DS value at the highest XAAH values.
(a) (b)
(c)

Chapter 2
46
2.4 Conclusions
In this work, the starch acetylation reaction with AAH as the reagent and NaOAc as the
base catalyst using densified CO2 as the solvent was investigated. Acetylated potato
starches with a range of DS (0.01 - 0.46) values could be obtained. The effects of process
variables on the acetylation reaction was examined and quantified with empirical models.
Temperature, water content and NaOAc ratio were shown to have the largest influence on
the DS, XAAH and SSA values while the influence of pressure within the observed pressure
window (6 – 9.8 MPa) is rather limited. This study shows the potential of densified CO2 as
the solvent for starch modifications and particularly for starch acetate synthesis. We are
currently conducting an in-depth study with higher CO2 pressures (above 150 MPa) on the
starch acetylation reaction. These results will be provided in the upcoming papers.
Acknowledgements
The authors thank Harry Nijland (Polymer Department, University of Groningen) for
the SEM analyses. We also acknowledge AVEBE for providing the potato starch and
stimulating discussions. Henky Muljana acknowledges the University of Groningen for
providing an Ubbo Emmius scholarship to carry out this research.
References
1. A. D. Betancur, G. L. Chel, and H. E. Canizares, J. Agric. Food Chem., 45, 378
(1997).
2. Z. Gonzalez, and E. Perez, Starch-Starke, 54, 148 (2002).
3. N. Singh, D. Chawla, and J. Singh, Food Chem., 86, 601 (2004).
4. S. Saartrat, C. Puttanlek, V. Rungsardthong, and D. Uttapap, Carbohydr. Polym.,
61, 211 (2005).
5. W. Jarowenko, Acetylated starch and miscellaneous organic esters. In Modified
starches : properties and uses, O. B. Wurzburg Ed. CRC Press, Inc.: Boca Raton,
Florida (1986).
6. R. A. de Graaf, A. Broekroelofs, and L. Janssen, Starch-Starke, 50, 198 (1998).
7. J. Singh, L. Kaur, and N. Singh, Starch-Starke, 56, 586 (2004).
8. M. Elomaa, T. Asplund, P. Soininen, R. Laatikainen, S. Peltonen, S. Hyvarinen,
and A. Urtti, Carbohydr. Polym., 57, 261 (2004).
9. Y. X. Xu, V. Miladinov, and M. A. Hanna, Cereal Chem., 81, 735 (2004).
Studies on Starch Acetylation in Densified CO2
47
10. C. S. Raina, S. Singh, A. S. Bawa, and D. C. Saxena, Eur. Food Res. Technol., 223,
561 (2006).
11. K. J. Shon, and B. Yoo, Starch-Starke, 58, 177 (2006).
12. L. Junistia, A. K. Sugih, R. Manurung, F. Picchioni, L. Janssen, and H. J. Heeres,
Starch-Starke, 60, 667 (2008).
13. C. J. Tijsen, H. J. Kolk, E. J. Stamhuis, and A. Beenackers, Carbohydr. Polym., 45,
219 (2001).
14. M. Yalpani, Polymer, 34, 1102 (1993).
15. P. E. Savage, S. Gopalan, T. I. Mizan, C. J. Martino, and E. E. Brock, AIChE J., 41,
1723 (1995).
16. C. A. Eckert, B. L. Knutson, and P. G. Debenedetti, Nature, 383, 313 (1996).
17. E. J. Beckman, J. Supercrit. Fluids, 28, 121 (2004).
18. M. F. Kemmere, Supercritical Carbon Dioxide for Sustainable Polymer Processes.
In Supercritical Carbon Dioxide : in Polymer Reaction Engineering, M. F.
Kemmere, and T. Meyer, Eds. Wiley - VCH: Weinheim (2005).
19. R. Harris, S. H. Jureller, J. L. Kerschner, P. T. Trzasko, and R. W. Humphreys, U.S.
Patent, 5977348 (1999).
20. R. L. Shogren, Carbohydr. Polym., 52, 319 (2003).
21. Y. X. Xu, V. Miladinov, and M. A. Hanna, Cereal Chem., 82, 336 (2005).
22. J. M. Fang, P. A. Fowler, C. Sayers, and P. A. Williams, Carbohydr. Polym., 55,
283 (2004).
23. P. Rubens, and K. Heremans, High Pressure Res., 19, 551 (2000).
24. J. J. G. vanSoest, H. Tournois, D. deWit, and J. F. G. Vliegenthart, Carbohydrate
Research, 279, 201 (1995).
25. B. Laignel, C. Bliard, G. Massiot, and J. M. Nuzillard, Carbohydr. Res., 298, 251
(1997).
26. N. S. Sodhi, and N. Singh, J. Food Eng., 70, 117 (2005).
27. L. Calvo, and T. W. de Loos, Fluid Phase Equilib., 244, 179 (2006).
28. A. R. Butler, and V. Gold, J. Chem. Soc., 2305 (1961).
29. C. A. Bunton, I. H. Pitman, N. A. Fuller, and S. G. Perry, J. Chem. Soc., 4478
(1962).
30. Oakenful.Dg, Aust. J. Chem., 24, 2547 (1971).
31. Oakenful.Dg, Aust. J. Chem., 27, 1423 (1974).
32. R. E. Dicke, Cellulose, 11, 255 (2004).
Chapter 2
48
33. D. C. Montgomery, Design and Analysis of Experiments. John Wiley and Sons, Inc:
New York (2001).