university of groningen the pediatric acenocoumarol dosing ... · to cite this article: maagdenberg...
TRANSCRIPT

University of Groningen
The pediatric acenocoumarol dosing algorithmMaagdenberg, Hedy; Bierings, Marc B; van Ommen, C Heleen; van der Meer, Felix J M;Appel, Inge M; Tamminga, Rienk Y J; le Cessie, Saskia; Swen, Jesse J; van der Straaten,Tahar; de Boer, AnthoniusPublished in:JOURNAL OF THROMBOSIS AND HAEMOSTASIS
DOI:10.1111/jth.14211
IMPORTANT NOTE: You are advised to consult the publisher's version (publisher's PDF) if you wish to cite fromit. Please check the document version below.
Document VersionPublisher's PDF, also known as Version of record
Publication date:2018
Link to publication in University of Groningen/UMCG research database
Citation for published version (APA):Maagdenberg, H., Bierings, M. B., van Ommen, C. H., van der Meer, F. J. M., Appel, I. M., Tamminga, R.Y. J., ... Maitland-van der Zee, A. H. (2018). The pediatric acenocoumarol dosing algorithm: The ChildrenAnticoagulation and Pharmacogenetics Study. JOURNAL OF THROMBOSIS AND HAEMOSTASIS, 16(9),1732-1742. https://doi.org/10.1111/jth.14211
CopyrightOther than for strictly personal use, it is not permitted to download or to forward/distribute the text or part of it without the consent of theauthor(s) and/or copyright holder(s), unless the work is under an open content license (like Creative Commons).
Take-down policyIf you believe that this document breaches copyright please contact us providing details, and we will remove access to the work immediatelyand investigate your claim.
Downloaded from the University of Groningen/UMCG research database (Pure): http://www.rug.nl/research/portal. For technical reasons thenumber of authors shown on this cover page is limited to 10 maximum.
Download date: 18-03-2019
ORIGINAL ARTICLE
The pediatric acenocoumarol dosing algorithm: the ChildrenAnticoagulation and Pharmacogenetics Study
H. MAAGDENBERG ,* M. B . B I ER INGS ,† C. H . VAN OMMEN,‡ F . J . M . VAN DER MEER ,§I . M . APPEL ,‡ R . Y . J . TAMMINGA, ¶ S . LE CESS I E , **†† J . J . SWEN,‡‡ T . VAN DER STRAATEN ,‡‡A. DE BOER* and A . H . MAITLAND-VAN DER ZEE*§§*Division of Pharmacoepidemiology and Clinical Pharmacology, Faculty of Science, Utrecht Institute for Pharmaceutical Sciences, Utrecht
University; †Department of Pediatric Hematology and Stem Cell Transplantation, Wilhelmina Children’s Hospital, University Medical Center
Utrecht, Utrecht; ‡Department of Pediatric Oncology/Hematology, Sophia Children’s Hospital, Erasmus University Medical Center,
Rotterdam; §Department of Thrombosis and Hemostasis, Leiden University Medical Center, Leiden; ¶Department of Pediatric Hematology,
University Medical Center Groningen, Groningen; **Department of Medical Statistics, Leiden University Medical Center; ††Department of
Clinical Epidemiology, Leiden University Medical Center; ‡‡Department of Clinical Pharmacy and Toxicology, Leiden University Medical
Center, Leiden; and §§Department of Respiratory Medicine, Amsterdam Medical Center, University of Amsterdam, Amsterdam, the
Netherlands
To cite this article: Maagdenberg H, Bierings MB, van Ommen CH, van der Meer FJM, Appel IM, Tamminga RYJ, le Cessie S, Swen JJ,
van der Straaten T, de Boer A, Maitland-van der Zee AH. The pediatric acenocoumarol dosing algorithm: the Children Anticoagulation and
Pharmacogenetics Study. J Thromb Haemost 2018; https://doi.org/10.1111/jth.14211.
Essentials
• A pediatric pharmacogenetic dosing algorithm for
acenocoumarol has not yet been developed.
• We conducted a multicenter retrospective follow-up
study in children in the Netherlands.
• Body surface area and indication explained 45.0% of
the variability in dose requirement.
• Adding the genotypes of VKORC1, CYP2C9 and
CYP2C18 to the algorithm increased this to 61.8%.
Summary. Background: The large variability in dose require-
ment of vitamin K antagonists is well known. For warfarin,
pediatric dosing algorithms have been developed to predict the
correct dose for a patient; however, this is not the case for
acenocoumarol. Objectives: To develop dosing algorithms
for pediatric patients receiving acenocoumarol with and
without genetic information. Methods: The Children Anti-
coagulation and Pharmacogenetics Study was designed as a
multicenter retrospective follow-up study in Dutch antico-
agulation clinics and children’s hospitals. Pediatric patients
who used acenocoumarol between 1995 and 2014 were
selected for inclusion. Clinical information and saliva sam-
ples for genotyping of the genes encoding cytochrome P450
(CYP) 2C9, vitamin K epoxide reductase complex sub-
unit 1 (VKORC1), CYP4F2, CYP2C18 and CYP3A4 were
collected. Linear regression was used to analyze their associ-
ation with the log mean stable dose. A stable period was
defined as three or more consecutive International Normal-
ized Ratio measurements within the therapeutic range over
a period of ≥ 3 weeks. Results: In total, 175 patients were
included in the study, of whom 86 had a stable period and
no missing clinical information (clinical cohort; median age
8.9 years, and 49% female). For 80 of these 86 patients,
genetic information was also available (genetic cohort). The
clinical algorithm, containing body surface area and indica-
tion, explained 45.0% of the variability in dose requirement
of acenocoumarol. After addition of the VKORC1,
CYP2C9, and CYP2C18 genotypes to the algorithm, this
increased to 61.8%. Conclusions: These findings show that
clinical factors had the largest impact on the required dose
of acenocoumarol in pediatric patients. Nevertheless,
genetic factors, and especially VKORC1, also explained a
significant part of the variability.
Keywords: acenocoumarol; adolescent; child; coumarins;
infant; pharmacogenetics.
Introduction
Vitamin K antagonists (VKAs) can be used to treat or
prevent thromboembolic events in pediatric patients.
Correspondence: Anthonius de Boer, Division of Pharmacoepidemi-
ology and Clinical Pharmacology, Utrecht Institute for Pharmaceuti-
cal Sciences, Faculty of Science, Utrecht University, PO Box 80.082,
3508 TB, Utrecht, the Netherlands
Tel.: +31 6 027 9938
E-mail: [email protected]
Received: 14 March 2018
Manuscript handled by: J. Douketis
Final decision: F. R. Rosendaal, 8 June 2018
© 2018 The Authors. Journal of Thrombosis and Haemostasis published by Wiley Periodicals, Inc. on behalf of International Society on Throm-bosis and Haemostasis.This is an open access article under the terms of the Creative Commons Attribution-NonCommercial License, which permits use, distributionand reproduction in any medium, provided the original work is properly cited and is not used for commercial purposes.
Journal of Thrombosis and Haemostasis, 16: 1–11 DOI: 10.1111/jth.14211

Dosing of VKAs in pediatric patients is complex, partly
because of the developing hemostatic system in these
patients. In this population, VKA pharmacokinetics are
age-dependent, with younger patients requiring a higher
dose per kilogram of body weight [1]. A limited number
of studies have investigated the dosing of acenocoumarol
in pediatric patients. Therefore, current pediatric guideli-
nes generally use extrapolations of adult dosing recom-
mendations [2–4]. Only one study has investigated the
initial acenocoumarol doses needed to achieve the target
International Normalized Ratio (INR) in pediatric
patients [5]. These initial doses are based on weight and
age group, and are incorporated in the guideline of the
Dutch Federation of Anticoagulation Clinics [6]. In 2009,
Spoor et al. studied the initial and maintenance doses in
pediatric patients for acenocoumarol and phenprocoumon
in the Netherlands. The doses recommended in the guide-
lines seem to be safe, but are not yet optimal, with per-
centages of time in which the INR is within the
therapeutic range (time in therapeutic range [TTR]) of
around⁓ 50% during the first year of treatment [7]. Within
the cohort of the Children Anticoagulation and Pharma-
cogenetics Study, we obtained similar results within the
first 3 months of acenocoumarol use (54.6%), and higher
percentages after the first 3 months of use (> 64%) [8].
There is large interindividual and intraindividual vari-
ability in VKA dose requirements. The dose is influenced
by many factors, such as height, weight, age, sex, indica-
tion for VKA treatment, concurrent drug therapy, and
vitamin K intake. Besides these factors, variations in cer-
tain genes can influence the dose requirement. The genes
that are now known to have the largest influence are
those encoding cytochrome P450 (CYP) 2C9 and vita-
min K epoxide reductase complex subunit 1 (VKORC1).
Single-nucleotide polymorphisms (SNPs) in CYP2C9
(CYP2C9*2 and CYP2C9*3; rs1799853 and rs1057910,
respectively) reduce the metabolism of VKAs, and an
SNP in VKORC1 (rs9934438) increases sensitivity to
VKAs. In both cases, the required dose is lower for
patients with the variant than for those with the wild-type
genotype, to prevent overanticoagulation [9]. The fre-
quency of carrying one or two variant alleles (CYP2C9*2
or CYP2C9*3) in CYP2C9 is 35.1% in the European
population [10]. For VKORC1, 61.8% of the European
population has one or two variant alleles [10]. Polymor-
phisms in or flanking CYP4F2 (rs2108622), CYP2C18
(rs1998591) and CYP3A4 (CYP3A4*1B and CYP3A4*22;rs2740574 and rs35599367, respectively) have also been
shown to explain part of the variation in adults [11–14].For warfarin, a dosing algorithm was constructed for
adults by the International Warfarin Pharmacogenetics
Consortium [15]. In a study by Biss et al., the mainte-
nance dose in pediatric patients was correlated with the
calculated doses by the use of this algorithm; however,
there was a continuous non-linear overestimation of the
dose [16]. This indicated that there is a need for a specific
algorithm for pediatric patients. Up to now, several stud-
ies have been carried out to create a warfarin pharmaco-
genetic dosing algorithm for pediatric patients [16–23].However, to the best of our knowledge, no studies have
been carried out to establish an algorithm for aceno-
coumarol in pediatric patients.
The aim of this study was to develop two dosing algo-
rithms for acenocoumarol in pediatric patients: one algo-
rithm with genetic information, and one without genetic
information. The latter can be applied when genotyping
is not (yet) available.
Methods
Study design and patient collection
We performed a retrospective follow-up study in four
academic pediatric hospitals (Emma Children’s Hospital
Amsterdam, Wilhelmina Children’s Hospital Utrecht,
Sophia Children’s Hospital Rotterdam, and Beatrix Chil-
dren’s Hospital Groningen) and the Leiden anticoagula-
tion clinic in the Netherlands. Patients who used
acenocoumarol for > 1 month between January 1995
and December 2014 and who were aged ≤ 18 years at
the time of acenocoumarol use were eligible for partici-
pation. The follow-up of a patient ended at the end date
of data collection at the anticoagulation clinic (between
11 January 2014 and 10 March 2016), when they
reached 19 years of age, when they stopped receiving
acenocoumarol therapy, or when they were lost to fol-
low-up. A sample size of 110 patients was required to be
able to detect a difference of 1 mg daily between the
CYP2C9*2 and CYP2C9*3 genotypes (a = 0.05 [two-
sided]; power = 80%; standard deviation of 2.1 mg in
the outcome [16]).
The Medical Ethics Review Committee of the Univer-
sity Medical Center Utrecht decided that the study did
not need ethical approval, because non-invasive DNA
collection was used. The UPPER Institutional Review
Board of the Division of Pharmacoepidemiology and
Clinical Pharmacology of Utrecht University approved
the study protocol. All participants (and/or their parents
or legal guardians) provided informed consent before tak-
ing part.
Data collection
Participants and/or their parents were asked to fill in a
questionnaire. They were asked for their ethnicity,
whether breastfeeding had occurred during therapy, and,
if applicable, whether the breastfeeding was combined
with vitamin K use by the mother.
To obtain complete data for all patients, data were col-
lected at both the hospital where they were treated and at
their anticoagulation clinic. Information on the therapeu-
tic INR range (TR), INR values and acenocoumarol
© 2018 The Authors. Journal of Thrombosis and Haemostasis published by Wiley Periodicals, Inc. on behalf of International Society on Throm-
bosis and Haemostasis.
2 H. Maagdenberg et al

doses was collected at the anticoagulation clinics. Infor-
mation on the indication for acenocoumarol therapy, date
of birth, sex, TR, INR and acenocoumarol doses was col-
lected at the hospital. Furthermore, information on height
and weight was collected at the hospital at the start of
and during acenocoumarol therapy.
Genotyping
Saliva was used for collection of DNA. Saliva collection
packages were sent to the participants after they had
signed informed consent forms. The Oragene�DNA
(DNA Genotek, Ottawa, Canada) (OG-575) kit for
Assisted Collection was used for participants aged
between 0 years and 4 years, and the Oragene�DNA
(OG-250) kit was used for participants aged > 4 years.
Genotyping was performed by the laboratory of the Lei-
den University Medical Center by use of a
LightCycler 480 with a TaqMan SNP genotyping assay
(ThermoFisher, Waltham, MA, USA). The following
SNPs were genotyped: VKORC1 rs9934438, CYP2C9
rs1799853 and rs1057910, CYP4F2 rs2108622, CYP3A4
rs35599367 and rs2740574, and CYP2C18 rs1998591.
Only genotypes of the SNPs that were in Hardy–Wein-
berg equilibrium (P ≥ 0.05) were included in the analysis.
Outcome and determinants
The outcome of interest was the stable maintenance dose
(in mg daily) defined as the mean dose during the first
stable period after initiation without missing information
on dose and INRs. A stable period was defined as three or
more consecutive INR measurements within the patient-
specific TR over a period of ≥ 3 weeks. Patients who did
not reach a stable period were excluded from the analysis.
For the development of the algorithm, the following
determinants were used: age at start of stable period, sex,
indication for anticoagulation, TR, weight, height, and
body surface area (BSA) calculated with the formula of
Haycock. For the genotype-guided algorithm, the
VKORC1, CYP2C9, CYP4F2, CYP3A4 and CYP2C18
genotypes were also used as determinants (number of
variant alleles).
Height and weight change continuously in pediatric
patients; hence, the last available measurement could be
outdated at the start of the stable period. Therefore, we
constructed time windows by using the World Health
Organization growth tables of height and weight for age
[24–27]. For each age, the duration of time in which the
mean height increased by ≤ 5 cm and the mean weight by
≤ 2 kg was determined. We considered height and weight
to be still valid when measured within the time window.
The applied time windows per age at the start of the
stable period are shown in Table S1. Only weight and
height values that were valid according to the above time
windows were used.
Statistical analysis and algorithm development
Two algorithms were generated for acenocoumarol: one
with genetic information (genetic model) and one without
genetic information (clinical model). Linear regression was
used to model the relationships between stable dose as out-
come and determinants. Determinants that were univari-
ately associated with outcome (P < 0.2) were used as
candidate variables for the algorithm. Two transformations
of the outcome were considered, i.e. 10-log and square root
transformation, to establish whether transformation
would, by visual inspection, improve the normal distribu-
tion. If this was the case, the transformation by which the
outcome was visually most normally distributed was used.
A forward stepwise selection procedure was used for the
multivariate analysis, in which all determinants with a P-
value of < 0.05 were entered into the model.
To analyze differences in mean dose between categories
of a determinant, a Student’s t-test or a one-way ANOVA
was used.
A sensitivity analysis was conducted in which, instead
of a forward stepwise selection procedure, a backward
selection procedure was used. A second sensitivity analy-
sis was conducted to check whether defining the stable
period more strictly (three or more consecutive INR mea-
surements within the TR over a period of ≥ 4 weeks and
no dose changes of > 10%) would lead to different results
with regard to R2, covariates entered in the model, and
the b estimates.
The observed mean stable dose was compared with the
doses predicted by the genetic model and the doses calcu-
lated on the basis of weight and age group as described
in the guideline of the Dutch Federation of Anticoagula-
tion Clinics [6]. They were compared by use of a Wil-
coxon signed rank test.
Statistical analysis was carried out with SPSS ver-
sion 23.0.
Results
Patient characteristics
In total, 175 patients were included in the study, of whom
123 had a stable period and dose information available.
The patients with valid weight and height information were
included in the clinical cohort (n = 86). Of these 86
patients, genetic analysis failed in one, and no saliva sample
was collected for five. Therefore, for 80 patients, genetic
information was available, and these were included in the
genetic cohort (Fig. 1). An overview of the characteristics
of the cohorts (including indications for anticoagulation) is
shown in Table 1. The cohorts consisted of similar num-
bers of females and males, with median ages of 8.9 years
(clinical cohort) and 9.7 years (genetic cohort). Most
patients were treated with the standard-intensity (2.5–3.5)or high-intensity (3.0–4.0) TRs that were used at the time
© 2018 The Authors. Journal of Thrombosis and Haemostasis published by Wiley Periodicals, Inc. on behalf of International Society on Throm-
bosis and Haemostasis.
The pediatric acenocoumarol dosing algorithm 3

of the study in the Netherlands. No patients were breastfed
during the stable period.
Genetic characteristics
The genotype distribution of the SNPs in the five studied
genes with the observed mean stable doses are shown in
Table 2. Almost all genotypes showed a trend of decreas-
ing dose with an increase in number of variant alleles,
except for CYP3A4*1B, for which a trend in the opposite
direction was shown. All genotypes were in Hardy–Wein-
berg equilibrium, and all SNPs had call rates of ≥ 99.5%.
Association of clinical and genetic variables with
acenocoumarol dose
From the tested transformations, the 10-log transforma-
tion of the mean stable dose resulted in the visually most
normal distribution, and was therefore used.
High associations existed between log mean stable dose
and age (R2 = 30.5; P < 0.001), height (R2 = 36.9;
P < 0.001), weight (R2 = 36.5; P < 0.001), and BSA
(R2 = 40.4; P < 0.001). Patients with a Fontan circulation
required a statistically significantly lower log mean stable
dose than the other patients (mean difference of 1.10 mg;
95% confidence interval (CI) [ 0.60–1.60]; P < 0.001), as
shown in Fig. 2. This could not be explained by the fact
that Fontan patients in general have a lower TR. When
Fontan patients were compared with non-Fontan patients
stratified per TR group, the mean dose was always lower
in Fontan patients than in non-Fontan patients
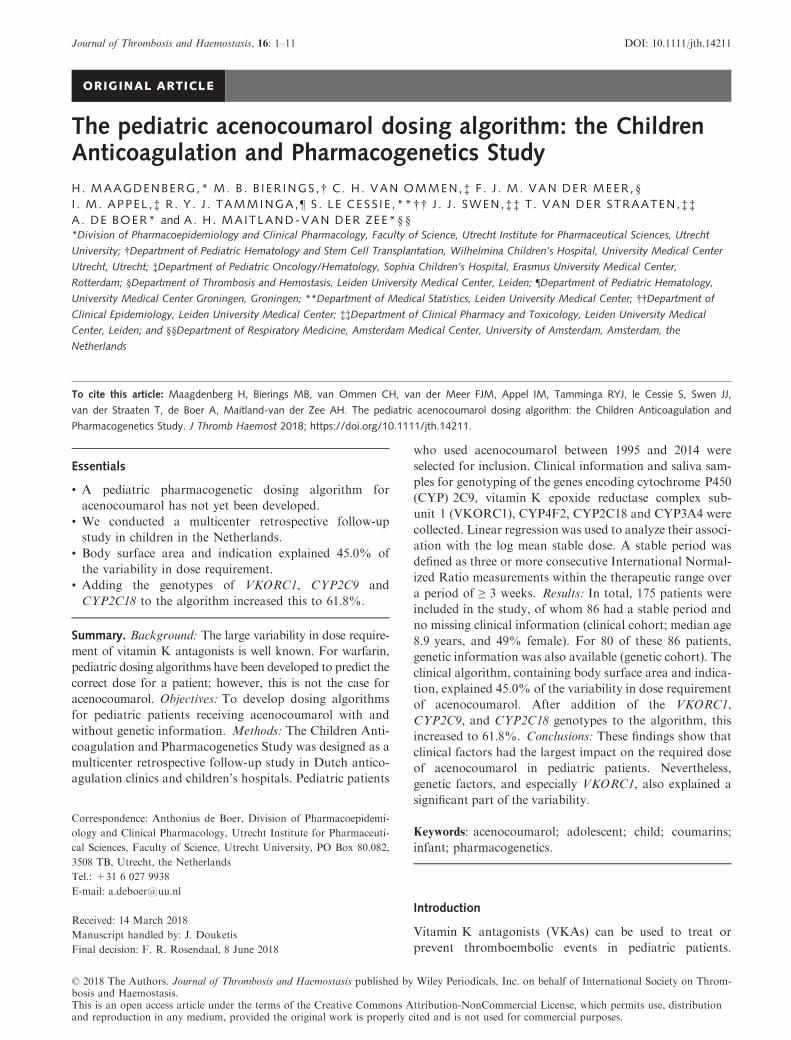
(Table S3). The TR was not statistically significantly asso-
ciated with the log mean stable dose (R2 = 4.2%;
P = 0.058). The median of the individual mean observed
doses per TR seemed to increase when the TR increased,
as shown in Fig. 3. However, the observed mean stable
doses of patients with a TR of 2.0–3.5 reached from the
lowest to the highest observed mean stable dose in all
patients in the cohort.
VKORC1, CYP2C9*2/CYP2C9*3 and CYP3A4*22 were
associated with a lower log mean stable dose when the number
of variant alleles increased (VKORC1, R2 = 19.2%, P < 0.001;
CYP2C9*2/CYP2C9*3, R2 = 3.9%, P = 0.080; CYP3A4*22,
R2 = 4.2%, P = 0.067). The log mean stable dose was statisti-
cally significantly higher in patientswith theVKORC1GGgeno-
type than in patients with the AG genotype (mean difference of
0.93 mg; 95%CI [0.29–1.58];P = 0.010) orAAgenotype (mean
difference of 1.35 mg; 95%CI [0.48–2.21];P < 0.001), as shown
in Fig. 2. For CYP2C9*2/CYP2C9*3 and CYP3A4*22, there
were no statistically significant differences in mean stable dose
between the genotypes.
No associations with P-values of < 0.2 were found for
ethnicity, sex, CYP4F2, or CYP3A4*1B.
Multivariate linear regression
From the univariate analysis, BSA, Fontan circulation, TR,
VKORC1, CYP2C18, CYP3A4*22 and CYP2C9*2/
CYP2C9*3 were used as candidate variables in the multi-
variate regression analysis (because P < 0.2). For the
Total cohort(n = 175)
(n = 128)*
(n = 123)
(n = 86)
(n = 81)
(n = 80)
Stable period present
Dose information available
availableValid weight and height values
Salivary sample collected
Clinical cohort
Genetic cohort
All SNP genotypes available
Fig. 1. Flowchart of patients included in the cohort for the clinical algorithm and genetic algorithm. *More information on the 47 patients
who were excluded because of missing a stable period can be found in Table S2. SNP, single-nucleotide polymorphism.
© 2018 The Authors. Journal of Thrombosis and Haemostasis published by Wiley Periodicals, Inc. on behalf of International Society on Throm-
bosis and Haemostasis.
4 H. Maagdenberg et al

clinical model, all variables except for the genetic ones were
used.
High correlation existed between age, height, weight,
and BSA (all r > 0.872), which resulted in multicollinearity
when more than one was entered into the model. BSA had
the highest univariate R2 of these four variables, and incor-
porates all variables. Therefore, only BSA was used as a
candidate variable in the multivariate linear model.
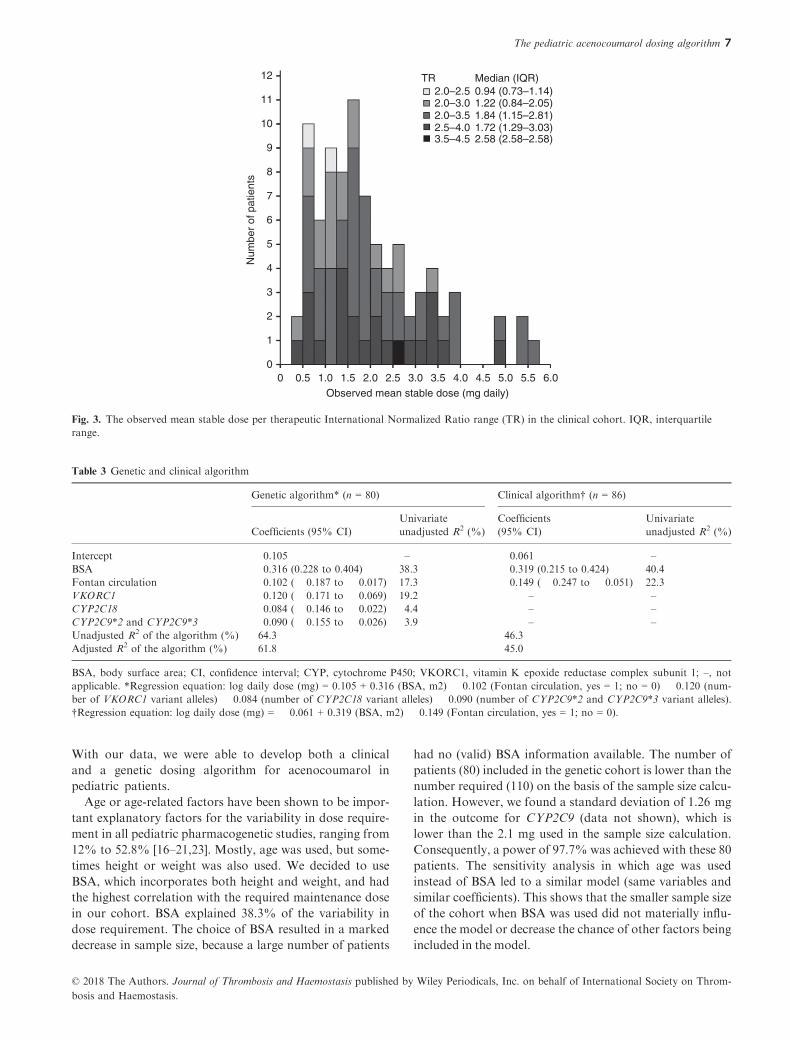
BSA, Fontan circulation, VKORC1, CYP2C18 and
CYP2C9*2/CYP2C9*3 were entered into the genetic model
(adjusted R2 = 61.8%; Table 3). The clinical model con-
taining BSA and Fontan circulation explained 45.0% of
the variability in the dose requirement of acenocoumarol.
Sensitivity analysis
Changing the selection procedure to backward selection
resulted in exactly the same models.
When the stricter definition of a stable period was used,
47 patients could be included in the analysis. Multivari-
able analysis resulted in a genetic algorithm consisting of
BSA, VKORC1 genotype, and CYP2C9 genotype (ad-
justed R2 = 62.2%). The coefficients were similar to those
generated with the cohort with the less strict definition.
The clinical algorithm consisted only of BSA and
explained 42.6% of the variability in the dose require-
ment. Data are shown in Tables S4–S6.When age was used instead of BSA, 116 patients could
be included in the genetic cohort. The same variables with
comparable coefficients were found, with an adjusted R2 of
54.4%. The clinical algorithm (n = 123) with age and Fon-
tan circulation explained only 37.9% of the variability in
the dose requirement. Data are shown in Tables S7–S9.
Guideline versus the genetic algorithm
Overall, the current guideline of the Dutch Federation of
Anticoagulation Clinics shows a slight trend of underesti-
mating the dose for homozygous wild-type genotypes and
overestimating the dose for homozygous variant geno-
types (Table 2). For the VKORC1 AA genotype, homozy-
gous variant type, there was a statistically significant
overestimation of the dose according to the guideline as
compared with the required observed stable dose (median
difference of 0.44 mg; interquartile range [IQR] 0.28–0.98; P = 0.019). Furthermore, for the CYP2C18 GG
genotype, homozygous wild-type, a statistically significant
underestimation of the dose was observed (median differ-
ence of � 0.20 mg; IQR � 0.88 to 0.25; P = 0.025).
Figure 4 shows that the difference between the predicted
and the observed dose was small for most patients (median
differences of 0.38 mg [genetic model] and 0.54 mg [clinical
model and current guideline]). With the genetic model,
82.5% of the patients had a predicted dose that was ≤ 1 mg
higher or lower than the observed dose. For the clinical
model and the current guideline, these proportions were
77.5% and 75%, respectively. Two patients (cases 6 and 11)
had large overestimations of the dose by the genetic model
(differences of > 2 mg). Neither patient had a Fontan circu-
lation or variant VKORC1, CYP2C9 and CYP2C18 geno-
types. However, they had obesity (body mass index
[BMI] > 30) and had a distinctively higher BSA than other
patients of the same age (Fig. S1). Four patients (cases 16,
55, 62, and 68) had large underestimations of the dose
(> 2 mg) by the clinical model and the guideline (and for
case 68, also the genetic model). These patients did not have
variant VKORC1, CYP2C9 and CYP2C18 genotypes or a
Fontan circulation. However, they had higher observed
doses than other patients of similar age (Fig. S2).
Discussion
To the best of our knowledge, this is the first pediatric
cohort in which the effects of clinical and genetic
Table 1 Patient characteristics at start of stable period
Clinical cohort* Genetic cohort*
(n = 86) (n = 80)
Female sex, n (%) 42 (48.8) 40 (50.0)
Age (years),
median (IQR)
8.9 (4.2–13.3) 9.7 (4.2–14.0)
<1, n (%) 2 (2.4) 2 (2.5)
1–3, n (%) 16 (18.8) 15 (19.0)
4–6, n (%) 18 (21.2) 15 (19.0)
7–9, n (%) 10 (11.8) 9 (11.4)
10–12, n (%) 12 (14.1) 12 (15.2)
13–15, n (%) 13 (15.3) 12 (15.2)
16–18, n (%) 14 (16.5) 14 (17.7)
Ethnicity, n (%)
European 73 (84.9) 68 (85.0)
Asian 2 (2.3) 2 (2.5)
African 2 (2.3) 2 (2.5)
Others 4 (4.7) 4 (5.0)
Unknown 5 (5.8) 4 (5.0)
Indication for anticoagulation, n (%)
Fontan circulation 26 (30.2) 21 (26.3)
Prosthetic heart valve 24 (27.9) 23 (28.7)
Dilated cardiomyopathy 9 (10.5) 9 (11.3)
Deep vein thrombosis/
pulmonary embolism
18 (20.9) 18 (22.5)
Aneurysm 1 (1.2) 1 (1.3)
Pulmonary hypertension 3 (3.5) 3 (3.8)
Other cardiac indication† 3 (3.5) 3 (3.8)
Cerebral 2 (2.3) 2 (2.5)
TR, n (%)
Extra-low (2.0–2.5) 2 (2.3) 2 (2.5)
Low (2.0–3.0) 18 (20.9) 15 (16.9)
Standard (2.5–3.5) 43 (50.0) 42 (54.5)
High (3.0–4.0) 22 (25.6) 20 (24.7)
Extra high (3.5–4.5) 1 (1.2) 1 (1.3)
BSA‡, median (IQR) 0.98 (0.67–1.38) 1.00 (0.68–1.38)
BSA, body surface area; IQR, interquartile range; TR, therapeutic
International Normalized Ratio range. *The genetic cohort is
derived from the clinical cohort, with exclusion of six patients with-
out genetic information available. †Consists of supraventricular
tachycardia and an unspecified arrhythmia. ‡Calculated with the for-
mula of Haycock.
© 2018 The Authors. Journal of Thrombosis and Haemostasis published by Wiley Periodicals, Inc. on behalf of International Society on Throm-
bosis and Haemostasis.
The pediatric acenocoumarol dosing algorithm 5

factors on the acenocoumarol dose requirement have
been studied. It shows that almost two-thirds of the
variability in acenocoumarol dose requirement can be
explained by BSA, Fontan circulation, and VKORC1,
CYP2C9 and CYP2C18 genotypes. Almost half of the
total variability can be explained by clinical factors.
Table 2 Distribution of genotypes and observed, predicted and guideline-based daily dose
n (%) Observed dose, median (IQR)* Predicted dose, median (IQR)* Guideline-based dose, median (IQR)*†
VKORC1
GG‡ 33 (41.3) 2.52 (1.70–3.64) 2.34 (1.56–3.11) 1.89 (1.47–2.50)AG 34 (42.5) 1.66 (1.14–2.29) 1.38 (1.22–2.21) 1.44 (1.02–1.95)AA 13 (16.3) 1.00 (0.71–1.68) 1.35 (0.95–1.48) 1.63 (1.56–2.03)§
CYP2C9*2/CYP2C9*3
CC/AA‡ 50 (62.5) 1.88 (1.29–2.83) 1.63 (1.35–2.5) 1.66 (1.32–2.10)CC/CA 10 (12.5) 1.21 (0.71–2.55) 1.05 (0.91–2.15) 1.71 (1.30–2.35)CT/AA 17 (21.3) 1.70 (1.14–2.64) 1.64 (1.4–2.05) 1.63 (1.30–2.30)CT/CA 2 (2.5) 1.51 (0.81–2.22) 1.71 (0.9–2.53) 2.38 (1.55–3.2)TT/AA 1 (1.3) 1.44 (1.44–1.44) 1.10 (–) 0.90 (–)
CYP2C18
GG‡ 46 (57.5) 1.85 (1.15–3.24) 1.64 (1.35–2.50) 1.56 (1.18–2.04)§AG 29 (36.3) 1.62 (1.12–2.37) 1.48 (1.07–2.29) 1.76 (1.43–2.50)AA 5 (6.3) 1.83 (0.71–1.89) 1.56 (0.95–1.87) 2.08 (1.70–2.15)
CYP4F2
CC‡ 40 (50.0) 1.80 (1.29–3.13 – –CT 37 (46.3) 1.68 (1.14–2.37) – –TT 3 (3.8) 2.27 (0.81–3.02) – –
CYP3A4*22
GG‡ 67 (83.8) 1.84 (1.15–2.83) – –GA 13 (16.3) 1.28 (0.81–1.83) – –
CYP3A4*1B
TT‡ 74 (92.5) 1.70 (1.14–2.63) – –TC 6 (7.5) 1.98 (1.84–2.64) – –
CYP, cytochrome P450; IQR, interquartile range; VKORC1, vitamin K epoxide reductase complex subunit 1; –, not applicable. *Doses are
shown as mg daily. †The dose is calculated on the basis of the dosing information of the guideline of the Dutch Federation of Anticoagulation
Clinics [6]. ‡Wild-type genotype. §Difference between observed and guideline-based dose, P < 0.05.
7.9 P = 0.010
P < 0.001 P < 0.001
P = 0.198
6.3
5.0
4.0
3.2
2.5
2.0
1.6
1.3
1.0Mea
n st
able
dos
e (m
g da
ily)
Mea
n st
able
dos
e (m
g da
ily)
0.8
0.6
0.5
0.4
7.9
6.3
5.0
4.0
3.2
2.5
2.0
1.6
1.3
1.0
0.8
0.6
0.5
0.4GG AG
VKORC1 genotypeAA No
Fontan circulation
Yes
A B
Fig. 2. Differences in mean stable dose between vitamin K epoxide reductase complex subunit 1 (VKORC1) genotypes and patients with or with-
out a Fontan circulation. (A) A boxplot of the mean stable dose in mg daily per VKORC1 genotype in the genetic cohort. (B) A boxplot of patients
with and without a Fontan circulation in the clinical cohort (B). The P-values shown were calculated by use of the log mean stable dose.
© 2018 The Authors. Journal of Thrombosis and Haemostasis published by Wiley Periodicals, Inc. on behalf of International Society on Throm-
bosis and Haemostasis.
6 H. Maagdenberg et al
With our data, we were able to develop both a clinical
and a genetic dosing algorithm for acenocoumarol in
pediatric patients.
Age or age-related factors have been shown to be impor-
tant explanatory factors for the variability in dose require-
ment in all pediatric pharmacogenetic studies, ranging from
12% to 52.8% [16–21,23]. Mostly, age was used, but some-
times height or weight was also used. We decided to use
BSA, which incorporates both height and weight, and had
the highest correlation with the required maintenance dose
in our cohort. BSA explained 38.3% of the variability in
dose requirement. The choice of BSA resulted in a marked
decrease in sample size, because a large number of patients
had no (valid) BSA information available. The number of
patients (80) included in the genetic cohort is lower than the
number required (110) on the basis of the sample size calcu-
lation. However, we found a standard deviation of 1.26 mg
in the outcome for CYP2C9 (data not shown), which is
lower than the 2.1 mg used in the sample size calculation.
Consequently, a power of 97.7% was achieved with these 80
patients. The sensitivity analysis in which age was used
instead of BSA led to a similar model (same variables and
similar coefficients). This shows that the smaller sample size
of the cohort when BSA was used did not materially influ-
ence the model or decrease the chance of other factors being
included in the model.
12 TR2.0–2.5 0.94 (0.73–1.14)2.0–3.0 1.22 (0.84–2.05)2.0–3.5 1.84 (1.15–2.81)2.5–4.0 1.72 (1.29–3.03)3.5–4.5 2.58 (2.58–2.58)
Median (IQR)
11
10
9
8
7
6
Num
ber
of p
atie
nts
5
4
3
2
1
00 0.5 1.0 1.5
Observed mean stable dose (mg daily)2.0 2.5 3.0 3.5 4.0 4.5 5.0 6.05.5
Fig. 3. The observed mean stable dose per therapeutic International Normalized Ratio range (TR) in the clinical cohort. IQR, interquartile
range.
Table 3 Genetic and clinical algorithm
Genetic algorithm* (n = 80) Clinical algorithm† (n = 86)
Coefficients (95% CI)
Univariate
unadjusted R2 (%)
Coefficients
(95% CI)
Univariate
unadjusted R2 (%)
Intercept 0.105 – � 0.061 –BSA 0.316 (0.228 to 0.404) 38.3 0.319 (0.215 to 0.424) 40.4
Fontan circulation � 0.102 (� 0.187 to � 0.017) 17.3 � 0.149 (� 0.247 to � 0.051) 22.3
VKORC1 � 0.120 (� 0.171 to � 0.069) 19.2 – –CYP2C18 � 0.084 (� 0.146 to � 0.022) 4.4 – –CYP2C9*2 and CYP2C9*3 � 0.090 (� 0.155 to � 0.026) 3.9 – –Unadjusted R2 of the algorithm (%) 64.3 46.3
Adjusted R2 of the algorithm (%) 61.8 45.0
BSA, body surface area; CI, confidence interval; CYP, cytochrome P450; VKORC1, vitamin K epoxide reductase complex subunit 1; –, notapplicable. *Regression equation: log daily dose (mg) = 0.105 + 0.316 (BSA, m2) � 0.102 (Fontan circulation, yes = 1; no = 0) � 0.120 (num-
ber of VKORC1 variant alleles) � 0.084 (number of CYP2C18 variant alleles) � 0.090 (number of CYP2C9*2 and CYP2C9*3 variant alleles).
†Regression equation: log daily dose (mg) = � 0.061 + 0.319 (BSA, m2) � 0.149 (Fontan circulation, yes = 1; no = 0).
© 2018 The Authors. Journal of Thrombosis and Haemostasis published by Wiley Periodicals, Inc. on behalf of International Society on Throm-
bosis and Haemostasis.
The pediatric acenocoumarol dosing algorithm 7

Patients with a Fontan circulation required a lower
acenocoumarol dose than patients without a Fontan cir-
culation. The presence of a Fontan circulation explained
17.3% of the variability. This is substantially higher than
the 3.2% and 2.4% found in two other studies [16,21].
Patients with a Fontan circulation were, on average,
younger than the other patients and had therefore a
lower BSA. Adding Fontan circulation to the model next
to BSA resulted in only a minor change in the unad-
justed R2 (6%). Furthermore, the TR could have influ-
enced the dose in patients with a Fontan circulation. In
the Netherlands, the range between 2.0 and 3.0 is mostly
used for patients with a Fontan circulation (in our
genetic cohort, 60% of the patients with this TR had a
Fontan circulation). However, we showed that patients
with a Fontan circulation required a lower dose even
when stratified on the TR. The remaining dose-lowering
effect of a Fontan circulation can probably be explained
by abnormalities in these patients in liver function and
coagulation [28,29].
In line with other studies, VKORC1 is the most impor-
tant genetic factor, and explains a larger part of the vari-
ability (19.2%) than CYP2C9*2 and CYP2C9*3 (3.9%).
The percentages of the explained variability fluctuate
between the different studies, from 2.8% to 47% [18,20]
for VKORC1, and from 0.3% to 26.6% for CYP2C9
[16,18]. The reasons for this fluctuation could be the dif-
ferences in patient characteristics and the small sample
sizes of many studies.
In line with the findings of Teichert et al. in adults, we
showed an association with the SNP (rs1998591) flanking
CYP2C18 and the acenocoumarol dose [12]. We found
that patients with the variant allele needed a lower aceno-
coumarol dose. The role of this SNP in the metabolism
of acenocoumarol is still unclear, which makes interpret-
ing these results difficult.
The ontogeny of the associated CYP450 enzymes and
that of the target enzyme of acenocoumarol are similar.
They already approach adult levels in early childhood. After
birth, the concentration of CYP2C9 quickly increases, and
adult values are already approached in the early years of life
[30,31]. However, there is variation in expression levels at
every age. Little is known about the ontogeny of CYP2C18,
but it seems to have a similar ontogeny to that of CYP2C9
[32]. VKORC1 shows low activity in liver tissue in the early
prenatal period. After the postnatal period, the activity sta-
bilizes at adult values [33]. Therefore, the influences of onto-
geny on the results are most likely minimal.
We did not find a statistically significant association for
CYP4F2, CYP3A4*22, and CYP3A4*1B, which is in line
with all other pediatric studies [17,21–23]. Furthermore,
there was no statistically significant association between
the TR and dose requirement. This is in line with the results
of three other pediatric studies with warfarin [16,18,21].
Only two studies showed an association between dose and
the TR, explaining 4.4% and 18% of the variation in war-
farin dose requirement [17,20]. We showed that the
observed doses per TR were overlapping substantially
3.0
2.5
2.0
1.5
1.0
0.5
–0.5
–1.0
–1.5
–2.0
–2.5
–3.0
–3.5
–4.00 0.5 1.0 1.5 2.0 2.5
68
62
16
55
611
3.0 3.5 4.0
Predicted dose (mg daily)
4.5 5.0 5.5 6.0 6.5
Genetic modelClinical modelCurrent guideline
7.0
Und
eres
timat
ion
Diff
eren
ce b
etw
een
pred
icte
d an
d ob
serv
ed d
oses
(m
g da
ily)
Ove
rest
imat
ion
0
Fig. 4. The differences between predicted and observed doses within the genetic cohort. The differences of the predicted doses with the genetic
model (dots), clinical model (triangles) and current guideline (crosses) from the observed mean stable doses are plotted against the predicted
dose. There was a large overestimation (> 2 mg) of the dose by the genetic model for cases 6 and 11, and large underestimations (> 2 mg) of
the dose by, especially, the clinical model and the guideline for cases 16, 55, 62, and 68.
© 2018 The Authors. Journal of Thrombosis and Haemostasis published by Wiley Periodicals, Inc. on behalf of International Society on Throm-
bosis and Haemostasis.
8 H. Maagdenberg et al

(Fig. 3). Our study was probably underpowered to make a
distinction between the overlapping TRs. However, we do
not think that the absence of the TR from the model is a
problem, because the effect seems to be small. Further-
more, the current guideline also does not use the TR as a
factor to determine the dose for a patient [6].
The limitations of our study mainly concern the retro-
spective data collection. The information on the doses and
INRs might be incorrect or incomplete. Furthermore, infor-
mation on concurrent (interacting) drug therapy was not
taken into account. This information was often incomplete
or missing from the patient records. No information on the
patients’ diet (vitamin K intake) was available. Incorporat-
ing concurrent drug therapy and diet in the model could
have increased the percentage of explained variability in
dose requirement. The lack of this information could possi-
bly reduce the external validity. This could also have
explained the large underestimation of the predicted doses
by the clinical model and the guideline, which was seen in
four patients. Furthermore, the number of patients aged
< 1 year was very low, which possibly reduces the validity
of this model for these patients. The genetic model overesti-
mated the dose for obese patients with a BMI of > 30.
The next step towards clinical use would preferably be
the validation of the model in another cohort. However,
the low number of pediatric patients using acenocoumarol
makes this highly challenging. Therefore, we suggest that
the genetic model could also be implemented and evaluated
in a clinical setting. We believe that the model can help to
get patients more quickly in the TR, allowing the number
of INR measurements to be reduced and the TTR to be
increased. Using the model without validation does not
increase risks. Most pediatric patients start with aceno-
coumarol in inpatient settings, and dose adjustments can
still be made on the basis of INR measurements. Further-
more, we showed a trend for the current guideline to over-
estimate the dose for patients with a homozygous variant-
type genotype of VKORC1, CYP2C9*2/CYP2C9*3, and
CYP2C18, and to underestimate the dose for patients with
a homozygous wild-type genotype for these genes. On the
other hand, implementing and evaluating the algorithm
in clinical setting costs money for genotyping. Verhoef
et al. showed that pharmacogenetic dosing of aceno-
coumarol in adults could slightly increase health, but
would only be cost-effective when the costs of genotyping
decreased to €30 or less [34]. Furthermore, the costs of
genotyping are rapidly decreasing, so prices in this range
might be possible in the near future.
For application of the dosing algorithm in clinical prac-
tice, tablets of lower strength than the current 1-mg
acenocoumarol tablets would be required for young
patients needing low doses. In this study, we found that
some pharmacies were already manufacturing capsules
with lower amounts of acenocoumarol (e.g. 0.5 mg) to
meet the dose requirement of the patient. Furthermore,
van Schie et al. have described how the calculated mean
maintenance dose can be achieved with the current avail-
able tablets of 1 mg [35]. This method can also be used
for tablets of lower strength.
We have provided two dosing algorithms; however, we
recommend using the genetic algorithm. When it is not pos-
sible to perform genotyping, the clinical model can be used.
In Table S9, we also show a model with only age instead of
BSA, which could be used when weight and height are
unknown. However, the percentage of variability that was
explained by the clinical model with age instead of BSA was
7.1% lower (37.9% versus 45.0%). This is a high percent-
age, which makes it worthwhile to determine height and
weight in clinical practice before starting acenocoumarol.
In conclusion, we have shown that clinical factors
explain a large proportion of the variability in dose
requirement of acenocoumarol in pediatric patients. Fur-
thermore, we have demonstrated that polymorphisms in
or flanking VKORC1, CYP2C9 and CYP2C18 all
increase the explained variability. Together, clinical and
genetic factors were able to explain 61.8% of the variabil-
ity. Both the clinical model and the genetic model are
expected to improve acenocoumarol therapy in pediatric
patients, as compared with the dosing method used today,
which is based only on age group and weight.
Addendum
H. Maagdenberg performed the statistical analysis and
wrote the manuscript. S. le Cessie supervised the statisti-
cal analysis. H. Maagdenberg, M. B. Bierings, A. H.
Maitland-van der Zee, and A. de Boer interpreted the
results. H. Maagdenberg purified the saliva samples. T.
van der Straaten analyzed the saliva samples. All authors
critically reviewed the manuscript.
Acknowledgements
The authors thank N. Spoor, J. van der Zee, Z.
S€og€utoglu, C. de Roon and D. van Bergeijk for all their
help with selection of patients eligible for participation
and collection of the data. We would also like to thank
S. Belitser for her help with the sample size calculation.
The authors also thank all of the patients and their par-
ents/legal guardians who participated in this study.
Disclosure of Conflict of Interests
The authors state that they have no conflict of interest.
Supporting Information
Additional supporting information may be found online
in the Supporting Information section at the end of the
article
© 2018 The Authors. Journal of Thrombosis and Haemostasis published by Wiley Periodicals, Inc. on behalf of International Society on Throm-
bosis and Haemostasis.
The pediatric acenocoumarol dosing algorithm 9

Table S1. Applied time windows for height and weight
per age at start of stable period.
Table S2. Information on the patients without a stable –distribution of genotypes.
Table S3. Mean stable dose for patients with and without
a Fontan circulation stratified per TR within the genetic
cohort.
Table S4. Patient characteristics of patients included using
a stricter definition of a stable period.
Table S5. Distribution of genotypes within patients
included using a stricter definition of a stable period –distribution of genotypes.
Table S6. Genotype-guided algorithm and clinical algo-
rithm using a stricter definition of a stable period.
Table S7. Patient characteristics of patients included using
age instead of BSA.
Table S8. Distribution of genotypes within patients
included using age instead of BSA.
Table S9. Genotype-guided algorithm and clinical algo-
rithm using age instead of BSA.
Fig. S1. BSA per age.
Fig. S2. Observed mean stable dose per age.
References
1 Bonduel MM. Oral anticoagulation therapy in children. Thromb
Res 2006; 118: 85–94.2 Monagle P, Chan AKC, Goldenberg NA, Ichord RN, Journ-
eycake JM, Nowak-G€ottl U, Vesely SK; American College of
Chest Physicians. . Antithrombotic therapy in neonates and
children: Antithrombotic Therapy and Prevention of Thrombo-
sis, 9th ed: American College of Chest Physicians Evidence-
Based Clinical Practice Guidelines. Chest 2012; 141: e737S–801S.
3 Chalmers E, Ganesen V, Liesner R, Maroo S, Nokes T, Saun-
ders D, Williams M. Guideline on the investigation, management
and prevention of venous thrombosis in children. Br J Haematol
2011; 154: 196–207.4 Giglia TM, Massicotte MP, Tweddell JS, Barst RJ, Bauman
M, Erickson CC, Feltes TF, Foster E, Hinoki K, Ichord RN,
Kreutzer J, McCrindle BW, Newburger JW, Tabbutt S, Todd
JL, Webb CL; American Heart Association Congenital Heart
Defects Committee of the Council on Cardiovascular Disease
in the Young, Council on Cardiovascular and Stroke Nursing,
Council on Epidemiology and Prevention, and Stroke Council.
Prevention and treatment of thrombosis in pediatric and con-
genital heart disease: a scientific statement from the American
Heart Association. Circulation 2013; 128: 2622–703.5 Bonduel M, Sciuccati G, Hepner M, Torres AF, Pieroni G,
Frontroth JP, Serviddio RM. Acenocoumarol therapy in pedi-
atric patients. J Thromb Haemost 2003; 1: 1740–3.6 Federatie van Nederlandse Trombosediensten. De kunst van het
doseren – Richtlijn, leidraad en informatie voor het doseren van
vitamine K-antagonisten, 8th edn. Leiden: Federatie van Neder-
landse Trombosediensten, 2017.
7 Spoor N, Smiers FJ, van der Meer FJM, Hutten BA, van
Ommen CH. Phenprocoumon and acenocoumarol treatment in
paediatric patients. Thromb Haemost 2012; 108: 1238–41.8 Maagdenberg H, Bierings MB, van Ommen CH, van der Meer
FJM, Appel IM, Tamminga RYJ, de Boer A, Maitland-van der
Zee AH. Characteristics and quality of oral anticoagulation
treatment in pediatric patients in the Netherlands based on the
CAPS cohort. J Thromb Haemost 2018; 16: 116–24.9 Schalekamp T, de Boer A. Pharmacogenetics of oral anticoagu-
lant therapy. Curr Pharm Des 2010; 16: 187–203.10 EMBL-EBI. Ensembl human genome browser. Population genet-
ics. 1000 Genomes Project Phase 3. Available at: http://www.e
nsembl.org/Homo_sapiens (accessed 5 July 2017).
11 Wang D, Guo Y, Wrighton SA, Cooke GE, Sadee W. Intronic
polymorphism in CYP3A4 affects hepatic expression and
response to statin drugs. Pharmacogenomics J 2011; 11: 274–86.12 Teichert M, Eijgelsheim M, Rivadeneira F, Uitterlinden AG, van
Schaik RHN, Hofman A, De Smet PAGM, van Gelder T, Visser
LE, Stricker BHC. A genome-wide association study of aceno-
coumarol maintenance dosage. Hum Mol Genet 2009; 18: 3758–68.
13 van Schie RMF, Aoussar A, van der Meer FJM, de Boer A,
Maitland-van der Zee AH. Evaluation of the effects of single-
nucleotide polymorphisms in CYP3A4 and CYP4F2 on stable
phenprocoumon and acenocoumarol maintenance doses. J
Thromb Haemost 2013; 11: 1200–3.14 Daly AK. Optimal dosing of warfarin and other coumarin anti-
coagulants: the role of genetic polymorphisms. Arch Toxicol
2013; 87: 407–20.15 International Warfarin Pharmacogenetics Consortium, Klein
TE, Altman RB, Eriksson N, Gage BF, Kimmel SE, Lee M-
TM, Limdi NA, Page D, Roden DM, Wagner MJ, Caldwell
MD, Johnson JA. Estimation of the warfarin dose with clini-
cal and pharmacogenetic data. N Engl J Med 2009; 360: 753–64.
16 Biss TT, Avery PJ, Brand~ao LR, Chalmers EA, Williams MD,
Grainger JD, Leathart JBS, Hanley JP, Daly AK, Kamali F.
VKORC1 and CYP2C9 genotype and patient characteristics
explain a large proportion of the variability in warfarin dose
requirement among children. Blood 2012; 119: 868–73.17 Moreau C, Bajolle F, Siguret V, Lasne D, Golmard J-L, Elie C,
Beaune P, Cheurfi R, Bonnet D, Loriot M-A. Vitamin K antag-
onists in children with heart disease: height and VKORC1 geno-
type are the main determinants of the warfarin dose requirement.
Blood 2012; 119: 861–7.18 Nowak-G€ottl U, Dietrich K, Schaffranek D, Eldin NS, Yasui Y,
Geisen C, Mitchell LG. In pediatric patients, age has more
impact on dosing of vitamin K antagonists than VKORC1 or
CYP2C9 genotypes. Blood 2010; 116: 6101–5.19 Kato Y, Ichida F, Saito K, Watanabe K, Hirono K, Miyawaki
T, Yoshimura N, Horiuchi I, Taguchi M, Hashimoto Y. Effect
of the VKORC1 genotype on warfarin dose requirements in
Japanese pediatric patients. Drug Metab Pharmacokinet 2011; 26:
295–9.20 Nguyen N, Anley P, Yu MY, Zhang G, Thompson AA, Jen-
nings LJ. Genetic and clinical determinants influencing warfarin
dosing in children with heart disease. Pediatr Cardiol 2013; 34:
984–90.21 Shaw K, Amstutz U, Hildebrand C, Rassekh SR, Hosking M,
Neville K, Leeder JS, Hayden MR, Ross CJ, Carleton BC.
VKORC1 and CYP2C9 genotypes are predictors of warfarin-
related outcomes in children. Pediatr Blood Cancer 2014; 61:
1055–62.22 Wakamiya T, Hokosaki T, Tsujimoto S-I, Kadota K, Nakano
Y, Watanabe S, Iwamoto M, Yanagimachi M, Ito S. Effect of
VKORC1, CYP2C9, CFP4F2, and GGCX gene polymorphisms
on warfarin dose in Japanese pediatric patients. Mol Diagn Ther
2016; 20: 393–400.23 Vear SI, Ayers GD, Van Driest SL, Sidonio RF, Stein CM, Ho
RH. The impact of age and CYP2C9 and VKORC1 variants on
stable warfarin dose in the paediatric population. Br J Haematol
2014; 165: 832–5.
© 2018 The Authors. Journal of Thrombosis and Haemostasis published by Wiley Periodicals, Inc. on behalf of International Society on Throm-
bosis and Haemostasis.
10 H. Maagdenberg et al

24 World Health Organization. Weight-for-age. Available at: http://
www.who.int/childgrowth/standards/weight_for_age/en/ (accessed
8 August 2016).
25 World Health Organization. Length/height-for-age. Available at:
http://www.who.int/childgrowth/standards/height_for_age/en/
(accessed 8 August 2016).
26 World Health Organization. Weight-for-age (5–10 years). Avail-
able at: http://www.who.int/growthref/who2007_weight_for_age/
en/ (accessed 8 August 2016).
27 World Health Organization. Height-for-age (5–19 years). Avail-
able at: http://www.who.int/growthref/who2007_height_for_age/
en/ (accessed 8 August 2016).
28 Kaulitz R, Luhmer I, Bergmann F, Rodeck B, Hausdorf G.
Sequelae after modified Fontan operation: postoperative haemo-
dynamic data and organ function. Heart 1997; 78: 154–9.29 van Nieuwenhuizen RC, Peters M, Lubbers LJ, Trip MD,
Tijssen JG, Mulder BJ. Abnormalities in liver function and
coagulation profile following the Fontan procedure. Heart 1999;
82: 40–6.30 Hines RN. Ontogeny of human hepatic cytochromes P450. J
Biochem Mol Toxicol 2007; 21: 169–75.
31 Koukouritaki SB, Manro JR, Marsh SA, Stevens JC, Rettie AE,
McCarver DG, Hines RN. Developmental expression of human
hepatic CYP2C9 and CYP2C19. J Pharmacol Exp Ther 2004;
308: 965–74.32 Treluyer JM, Gueret G, Cheron G, Sonnier M, Cresteil T.
Developmental expression of CYP2C and CYP2C-dependent
activities in the human liver: in-vivo/in-vitro correlation and
inducibility. Pharmacogenetics 1997; 7: 441–52.33 Itoh S, Onishi S. Developmental changes of vitamin K epoxidase
and reductase activities involved in the vitamin K cycle in human
liver. Early Hum Dev 2000; 57: 15–23.34 Verhoef TI, Redekop WK, de Boer A, Maitland-van der Zee
AH; EU-PACT group. Economic evaluation of a pharmacoge-
netic dosing algorithm for coumarin anticoagulants in The
Netherlands. Pharmacogenomics 2015; 16: 101–14.35 van Schie RMF, Wessels JAM, le Cessie S, de Boer A, Schale-
kamp T, van der Meer FJM, Verhoef TI, van Meegen E, Rosen-
daal FR, Maitland-van der Zee A-H. Loading and maintenance
dose algorithms for phenprocoumon and acenocoumarol using
patient characteristics and pharmacogenetic data. Eur Heart J
2011; 32: 1909–17.
© 2018 The Authors. Journal of Thrombosis and Haemostasis published by Wiley Periodicals, Inc. on behalf of International Society on Throm-
bosis and Haemostasis.
The pediatric acenocoumarol dosing algorithm 11