university of hawai’i at hilo survey of incoming students report fall 2005 · university of...
TRANSCRIPT

University of Hawai’i at Hilo
Survey of Incoming Students Report
Fall 2005
Includes Results from Fall 2002, Fall 2003, Fall 2004 and Fall 2005

Executive Summary
The percentage of incoming students who say UH Hilo is their college of first choice increased between Fall of 2002 and Fall of 2005.
77.8% of incoming students in Fall of 2005 said UH Hilo was their first choice, compared to only 72.7% in Fall of 2002. In Fall 2005, 72% of the first time freshmen and 85% of the transfer students said UH Hilo
was their college of first choice. The proportion of incoming students who say their primary objective for enrolling at UH Hilo is to get prepared for graduate or professional school increased between Fall of 2002 and Fall of 2005.
31.4% of students entering Fall of 2005 said their primary objective was preparation for graduate or professional school, compared to only 25.1% of those students who entered in Fall of 2002.
The most usual ways for new students to learn about UH Hilo are from relatives, friends or acquaintances; from people at the students’ previous schools; and from the UH Hilo website. Learning about the university from relatives, friends or acquaintances has declined slightly over four years; learning from people at the students’ previous schools has remained fairly stable; and learning about the university from the UH Hilo website peaked in 2003, only to return in 2005 to a level equivalent to 2002. About one third of all incoming students say their primary reason for choosing UH Hilo is because it is close to home, followed by its academic reputation, low tuition and size. Between Fall of 2002 and Fall of 2005, the percentage of incoming students who chose UH Hilo because it has a “very good” academic reputation has declined from 17% of entering freshmen and 19% of entering transfer students to 13% of freshmen and 15% of transfer students.
In Fall 2005, 36% of entering freshmen and 33% of entering transfer students said their primary reason for choosing UH Hilo was that it was near home. 13% of the freshmen and 15% of the transfer students said their primary reason was UH
Hilo’s “very good” academic reputation. 13% of the freshmen and 11% of the transfer students said their primary reason for choosing
UH Hilo was its low tuition. 11% of new freshmen and 9.2% of new transfers said it was UH Hilo’s size that was its
primary attraction. About four out of ten incoming students say they plan to complete their higher education with a baccalaureate degree. In Fall of 2005…
41.7% of entering students said the highest degree they planned to earn was a baccalaureate degree, 17.2% said they planned to earn a Master or Arts or Master of Science, and 13.5% said they planned to complete a doctorate or professional degree. Students who said they were undecided about what was the highest degree they planned to
earn increased from .9% in Fall of 2002 to 18.4% in Fall of 2005. Students who said they planned to complete their higher education with a Certificate in
Education declined from 15.1% in 2002 to only 4.7% in 2005. The percentage of UH Hilo incoming freshmen who say they plan to complete a degree at UH Hilo, as opposed to transferring to another school, has declined from 43% in Fall of 2002 to 36% in Fall of 2005.
Lynne Stamoulis, Ed.D. 2

TRIO eligibility is determined by a combination of information: annual household income (150% of less of the national poverty level determined by income and number of people living in the household), and level of parental education. TRIO eligibility is determined by a student having neither parent graduate from college and/or having an annual household income of 150% or less than the national poverty level. Because the Incoming Student Survey does not ask about disability, the TRIO figures here do not include students who are TRIO eligible according to disability status only. Although there was an apparent dip in TRIO-Eligible incoming students in Fall 2003, in the other years since Fall 2002, almost six out of ten of students entering UH Hilo were TRIO eligible. The dip in TRIO- eligible incoming students in 2003 appears to be largely due to a lower percentage of TRIO-eligible transfer students entering in Fall 2003. In Fall 2005, 56.9% of the entering freshmen and 57% of the entering transfer students were eligible to be served by TRIO-sponsored programs. Over half (55.5%) of UH Hilo entering students are first generation college students. Over two thirds of entering students (64.7%) are say they are currently reported as dependents by their parents or guardians. The percentage of entering students who say their annual household income is below $32,000 has decreased from 47.1% in 2002 to 38.9% in 2005. The percentage of incoming students who say they are native speakers of English has declined from 91.2% in 2002 to 86.5% in 2005. The percentage of incoming students who say they plan to live in on-campus residence halls or university-sponsored off-campus housing has increased from 34.5% in 2002 to 41.8% in 2005. In Fall 2005, 53.3% of the incoming first-time freshmen and 34.5% of the incoming transfer students said they planned to live in on-campus residence halls or university-sponsored off-campus housing. The incoming student survey includes several questions about a student’s activities during the year before he or she came to UH Hilo. Items were included in the Incoming Student Survey because they showed some ability, alone or with other variables, to differentiate between students who continued at UH Hilo after a year, and those students who left. Although the frequency with which incoming students participated in most of these activities has remained relatively stable since Fall of 2002, incoming students have more frequently used the Internet for homework and discussed politics, and have less frequently engaged in smoking cigarettes.
In Fall of 2005, 75.4% of incoming students had frequently used the Internet for homework in the year before entering UH Hilo, compared to 65.5% of incoming students in Fall of 2002, and 23.3% had frequently discussed politics, compared to 17.3% in Fall of 2002. In Fall of 2005, only 6.2% of incoming students said they had smoked frequently in the year
before coming to UH Hilo, compared to 17.3% of students entering Fall of 2002. Consistently over the last four years, about six out of ten (60.7% in 2005) incoming students have taken four or more years of mathematics in high school. In 2005, 30.1% of incoming students had taken three years, and 9.2% had taken two or fewer years. Compared to Fall 2002, incoming students are putting more research into choosing a major. In 2005, 37% of incoming students said they had put a lot of research into choosing their major, compared to 29.2% in 2002.
In Fall 2005, 37% of the incoming students said they put a lot of research into choosing a major, 34.9% said they did some research, and 28.1% said they had done little or no research related to choosing a major.
Lynne Stamoulis, Ed.D. 3

Typically, incoming transfer students report doing more research directed at choosing a major than incoming first-year freshmen.
In Fall 2005, 43.2% of incoming transfer students said they did a lot of research related to choosing a major, compared to 31.9% of incoming first-year freshmen.
In Fall 2005, a higher proportion of incoming students said they planned to go to graduate school, compared to incoming students in Fall 2002.
In Fall 2005, 48.3% of incoming students said they planned to go to graduate school--either right after graduation or somewhat later--compared to 43.2% in Fall 2002. In Fall 2005, 28.8% of incoming students said they planned to work full time after graduation,
29.7% said they planned to go to graduate or professional school right after graduation, and 18.6% said they planned to go to graduate school later.
As might be expected, incoming transfer students tend to have a clearer idea of what they plan to do after graduation than incoming first-time freshmen.
Only 15.5% of incoming transfer students are undecided about their after-graduation plans, compared to 27.7% of incoming first-year freshmen.
A higher proportion of incoming transfer students say they plan to attend graduate school--not directly after graduation but later--than incoming first-year freshmen.
24% of incoming transfer students said they planned graduate school later, compared to only 14.7% of incoming first-time freshmen.
About a quarter of UH Hilo incoming students (23.3%) report their reading ability to be only fair or poor.
In 2005, 29.7% of incoming students said their reading ability was excellent, 47% said it was good, and 23.3% said it was fair or poor.
In Fall 2005, incoming transfer students rated their reading ability higher than incoming first-time freshmen did.
36.9% of incoming transfer students rated their reading ability as excellent in Fall of 2005, compared to only 24.6% of entering first-time freshmen.
Consistently over the last four years, incoming students from Hawai’i public schools have rated their reading ability much lower than students from mainland public schools. In addition, the proportion of incoming students from both types of schools (Hawai’i and mainland public) who rate their reading ability to be excellent declined between Fall 2002 and Fall 2005.
In Fall 2002, 25.5% of incoming students from Hawai’i public schools rated their reading ability to be excellent, compared to 20.1% in Fall 2005. In Fall 2005, 51.3% of incoming students from mainland schools rated their reading ability as
excellent, compared to 45.6% in Fall 2005. More than twice the percentage of mainland students tend to rate their reading ability to be
excellent, when compared to students from Hawai’i: In Fall 2005, 45.6% of incoming mainland students rated their reading ability to be excellent, compared to only 20.1% of students from Hawai’i.
Consistently over four years, about six out of ten incoming first-time freshmen report that their average grade in high school was a B+ or higher. In Fall of 2002, the proportion of first time freshmen reporting B+ or higher average high school grades was significantly higher than the proportion of
Lynne Stamoulis, Ed.D. 4

incoming transfer students. However, the gap between the high school grades of incoming freshmen and incoming transfer students narrowed to insignificance by Fall of 2005.
In Fall of 2002, 58.8% of incoming first-time freshmen reported their average high school grade to be a B+ or higher, compared to only 48.1% of incoming transfer students. In Fall of 2005, 57.1% of incoming first-time freshmen said their average high school grade
was a B+ or higher, compared to 54.3% of incoming transfer students. There is no significant difference in the self-reported high school grade averages of students from Hawai’i public schools and of those that come from mainland public schools.
In Fall 2005, 54% of incoming students from Hawai’i public schools said they had average high school grades of B+ or higher; 53.5% of incoming students from mainland public schools reported high school grades of B+ or higher.
In Fall of 2005, incoming transfer students claimed higher grades in high school English classes than incoming first-time freshmen.
63.4% of incoming transfer students said their average grade in high school English was a B+ or higher, compared to 56.7% of incoming first-time freshmen.
In 2005, just over half of both incoming first-time freshmen and incoming transfer students claimed an average grade in high school English of B+ or higher. However, almost twice as many incoming transfer students claimed to have gotten an average English grade of A.
In 2005, 53.5% of incoming first-time freshmen and 53.7% of incoming transfer students said
they had average high school English grades of B+ or higher. 27.5% of incoming transfer students claimed an A-average in English, compared to only
15.7% of incoming first-time freshmen.
In Fall 2002, there were significant differences between first-time freshmen and transfer students in the writing skills they developed in high school. By Fall 2005, that gap had narrowed.
In Fall 2002, 90.5% of first time freshmen said they had learned to write a research paper in high school English, compared to 81.8% of incoming transfer students; 94.7% of first-time freshmen said they had learned to write essays, compared to 85.5% of incoming transfer students. By Fall 2005 the differences between first-time freshmen and incoming transfer students had
narrowed: 88.6% of first time freshmen said they had learned to write research papers, compared to 83% of incoming transfers, and 94.8% of first-time freshmen said they learned to write essays, compared to 91.8% of incoming transfers.
Consistently over the last four years, incoming transfer students report reading more books on their own than incoming first-time freshmen. In Fall 2005, more than three out of ten first-time freshmen and two out of ten transfer students said they read no books on their own in an average month.
In Fall 2005, 26.1% of incoming transfer students said they read at least three books on their own in an average month, compared to only 18.1% of incoming first-time freshmen. 34.2% of incoming freshmen and 21.6% of incoming transfer students said they didn’t read
any books on their own in an average month. Overall, the life goals valued most by UH Hilo incoming students are being well off financially, helping others who are in difficulty and raising a family. The goals given least importance are influencing the political structure, becoming a community leader, and helping to clean up the environment.
In Fall 2005, 82.4% of incoming students said being financially well-off was very important or essential,
Lynne Stamoulis, Ed.D. 5

76.2% said that helping others who were in difficulty was very important or essential, and 68.8% said it was a very important or essential life goal for them to raise a family.
Only 24% of incoming students said it was very important or essential to influence the political
structure, Only 36.3% said it was very important or essential to become a community leader, and Only 39.3% said it was very important or essential to help clean up the environment.
However, incoming first-time freshmen and transfer students differ significantly in the importance they assign to various life goals. Incoming transfer students are less interested than incoming freshmen in being financially well-off and raising a family (perhaps some of them already have families), and more interested in doing creative work, helping to clean up the environment, developing a meaningful philosophy, promoting racial understanding and becoming more spiritual.
76.3% of incoming transfer students said it was very important or essential to them to be financially well off, compared to 86.9% of incoming first-time freshmen. 65.1% of incoming transfer students said raising a family was very important or essential to
them, compared to 70.7% of incoming first-time freshmen. 53.8% of incoming transfer students said it was very important or essential to do creative
work, compared to 37.9% of incoming first-time freshmen, 42.4% of incoming transfer students said it was very important or essential to help clean up
the environment, compared to 37.1% of incoming first-time freshmen, 66% of incoming transfer students said it was very important or essential to develop a
meaningful philosophy of life, compared to 54.8% of first-time freshmen, 60% said it was very important or essential to promote racial understanding, compared to
49.7% of first-time freshmen, and 57.5% of incoming transfer students said it was very important or essential to become more
spiritual, compared to 48.6% of incoming first-time freshmen. Eight out of ten incoming students say they would have access to a computer at the place they planned to live while attending UH Hilo, leaving about two out of ten who say they either do not have such access or they do not know if they will have access. In Fall 2005, a greater proportion of incoming first-time freshmen than incoming transfer students said there was a good chance they would change their major, transfer to another college and become close with other students. A higher proportion of incoming transfer students said there was a good chance they would earn at least a B average, need more time to finish school, get a bachelors degree and be satisfied with their college.
41.9% of incoming first-time freshmen said there was some or a good chance of changing their major, compared to 31.8% of incoming transfer students, 53.1% of first-time freshmen said there was some or a good chance of transferring to another
college, compared to 31.3% of incoming transfer students, and 67.2% of incoming freshmen said there was a good chance of their becoming close with other
students, compared to only 50.8% of incoming transfer students.
66.2% of incoming transfer students said there was a good chance of their earning at least a B average, compared to 43.7% of incoming first-time freshmen, 64.7% said there was some or a good chance they would need more time to finish school,
compared to 52.7% of incoming first-time freshmen, 83.8% said there was a good chance they would get a bachelors degree, compared to 69.7%
of first-time freshmen, and 56.2% said there was a good chance they would be satisfied with their college, compared to
42.6% of incoming first-time freshmen.
Lynne Stamoulis, Ed.D. 6

A majority of incoming first-time freshmen (55.6% in Fall 2005) say their primary means of paying their expenses at UH Hilo are their own or family resources; a majority of incoming transfer students (57.9%) report that their primary means of paying their expenses are loans and/or grants. Although it is more accurate to calculate demographic variables of an entering class from the student information system than a survey, it is interesting to note the changing character of transfer students entering UH Hilo. In Fall 2002, 54.7% of the incoming transfer students were from Hawai’i, compared to only 29.8% from the U.S. mainland or Alaska. By Fall of 2005, incoming transfer students from Hawai’I had dropped by 14%.
In Fall 2002, 54.7% of incoming transfer students were from the state of Hawai’i, compared to only 40.6% in the Fall of 2005.
Lynne Stamoulis, Ed.D. 7

Introduction
The University of Hawai’i at Hilo Survey of Incoming Students was developed in 2002 to provide information about the changing character of entering classes, as well as to help the university understand what characteristics of incoming students might predispose them to being at high risk of leaving the university sometime prior to earning their degree. A great deal of work has been done with the variables of this instrument, including the development of a predictive model that can alert the university to students at high risk of attrition so appropriate interventions can be made to increase their chances of persisting to a degree. The Survey of Incoming Students is typically administered at new student orientation in the Fall. Surveys are handed out to students arriving to the orientation and some time is provided at the beginning of the program for students to complete and hand in their surveys. Although the size of incoming classes has been increasing over the last four years, the number of completed surveys collected from incoming students has not increased. In fact, in Fall of 2005, more than 25% fewer surveys were collected than were in the previous fall. When numbers decline and cell sizes become smaller, it is more difficult to show statistical significance, especially when there are a lot of subgroups in a variable, such as there are in ethnicity. In order to maintain the usefulness of this informative survey, the university needs to take steps to insure that as many incoming students as possible take the survey before entering the university. Numbers of completed surveys: Fall 2002 – 373 Fall 2003 – 426 Fall 2004 – 406 Fall 2005 – 296 The findings to follow include results from all four years this survey has been administered to date to UH Hilo incoming students. This report focuses on differences over time and differences between first-time freshmen and transfer incoming students. The Fall 2002 survey, available at https://uhh.hawaii.edu/~iro/ , looks at several other groups of students in addition to first-time and transfer students: Hawaiian vs. non-Hawaiian, local vs. mainland, and traditional vs. non-traditional students.
Lynne Stamoulis, Ed.D. 8

Findings The percentage of incoming students who say UH Hilo is their college of first choice increased between Fall of 2002 and Fall of 2005.
77.8% of incoming students in Fall of 2005 said UH Hilo was their first choice, compared to only 72.7% in Fall of 2002. In Fall 2005, 72% of the first time freshmen and 85% of the transfer students said UH Hilo
was their college of first choice.
Is UH Hilo your college of...
155 70% 101 79% 170 75% 128 78% 160 75% 115 74% 134 72% 99 85%
53 24% 24 19% 40 18% 29 18% 31 15% 27 17% 39 21% 15 13%
8 3.6% 2 1.6% 11 4.8% 2 1.2% 10 4.7% 2 1.3% 8 4.3% 1 .9%
7 3.1% 1 .8% 6 2.6% 6 3.6% 11 5.2% 11 7.1% 4 2.2% 2 1.7%
First choice
Second Choice
Third choice
Less than third choice
Is UH Hiloyourcollegeof...
#Col%
First-timefreshman
#Col%
Transferstudent
Are you a first timefreshman or a transfer
student?
Fall 2002
#Col%
First-timefreshman
#Col%
Transferstudent
Are you a first timefreshman or a transfer
student?
Fall 2003
#Col%
First-timefreshman
#Col%
Transferstudent
Are you a first timefreshman or a transfer
student?
Fall 2004
#Col%
First-timefreshman
#Col%
Transferstudent
Are you a first timefreshman or a transfer
student?
Fall 2005
Entering Student Cohort
The proportion of incoming students who say their primary objective for enrolling at UH Hilo is to get prepared for graduate or professional school increased between Fall of 2002 and Fall of 2005.
31.4% of students entering Fall of 2005 said their primary objective was preparation for graduate or professional school, compared to only 25.1% of those students who entered in Fall of 2002. In Fall of 2005, 72% of entering first time freshmen and 85% of entering transfer students said
that UH Hilo was their college of first choice.
Lynne Stamoulis, Ed.D. 9
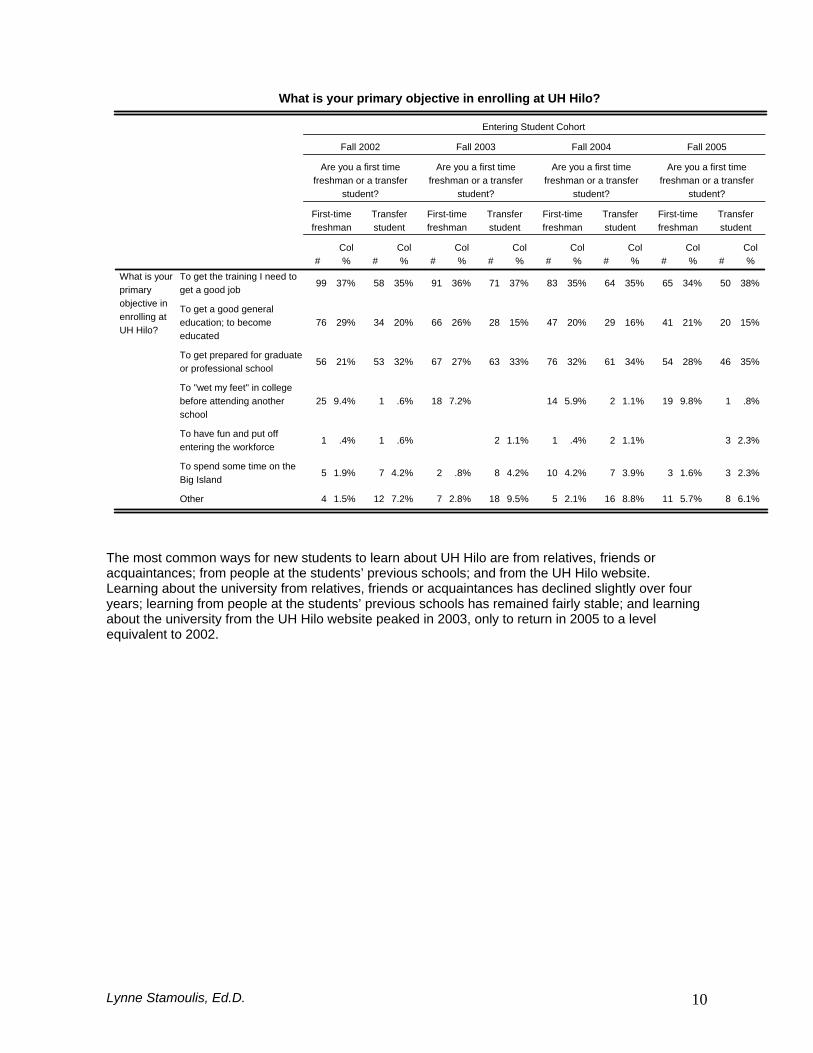
What is your primary objective in enrolling at UH Hilo?
99 37% 58 35% 91 36% 71 37% 83 35% 64 35% 65 34% 50 38%
76 29% 34 20% 66 26% 28 15% 47 20% 29 16% 41 21% 20 15%
56 21% 53 32% 67 27% 63 33% 76 32% 61 34% 54 28% 46 35%
25 9.4% 1 .6% 18 7.2% 14 5.9% 2 1.1% 19 9.8% 1 .8%
1 .4% 1 .6% 2 1.1% 1 .4% 2 1.1% 3 2.3%
5 1.9% 7 4.2% 2 .8% 8 4.2% 10 4.2% 7 3.9% 3 1.6% 3 2.3%
4 1.5% 12 7.2% 7 2.8% 18 9.5% 5 2.1% 16 8.8% 11 5.7% 8 6.1%
To get the training I need toget a good job
To get a good generaleducation; to becomeeducated
To get prepared for graduateor professional school
To "wet my feet" in collegebefore attending anotherschool
To have fun and put offentering the workforce
To spend some time on theBig Island
Other
What is yourprimaryobjective inenrolling atUH Hilo?
#Col%
First-timefreshman
#Col%
Transferstudent
Are you a first timefreshman or a transfer
student?
Fall 2002
#Col%
First-timefreshman
#Col%
Transferstudent
Are you a first timefreshman or a transfer
student?
Fall 2003
#Col%
First-timefreshman
#Col%
Transferstudent
Are you a first timefreshman or a transfer
student?
Fall 2004
#Col%
First-timefreshman
#Col%
Transferstudent
Are you a first timefreshman or a transfer
student?
Fall 2005
Entering Student Cohort
The most common ways for new students to learn about UH Hilo are from relatives, friends or acquaintances; from people at the students’ previous schools; and from the UH Hilo website. Learning about the university from relatives, friends or acquaintances has declined slightly over four years; learning from people at the students’ previous schools has remained fairly stable; and learning about the university from the UH Hilo website peaked in 2003, only to return in 2005 to a level equivalent to 2002.
Lynne Stamoulis, Ed.D. 10

How did you learn about UH Hilo?
51 19% 25 15% 39 15% 23 12% 43 18% 22 12% 33 17% 23 18%
123 46% 70 42% 94 37% 54 29% 92 39% 62 34% 80 41% 44 34%
3 1.1% 2 1.2% 6 2.4% 5 2.7% 8 3.4% 4 2.2% 6 3.1% 1 .8%
7 2.6% 3 1.8% 7 2.7% 10 5.4% 7 3.0% 8 4.4% 10 5.2% 4 3.1%
10 3.7% 3 1.8% 6 2.4% 1 .5% 5 2.1% 1 .6% 1 .8%
5 1.9% 3 1.8% 10 3.9% 11 5.9% 15 6.4% 4 2.2% 2 1.0% 5 3.9%
21 7.9% 25 15% 44 17% 47 25% 18 7.6% 38 21% 20 10% 21 16%
1 .4% 1 .4% 1 .6% 1 .5%
4 1.5% 5 3.0% 3 1.2% 2 1.1% 4 1.7% 3 1.7% 7 3.6% 2 1.6%
11 4.1% 2 1.2% 14 5.5% 2 1.1% 10 4.2% 6 3.3% 10 5.2% 1 .8%
9 3.5% 3 1.3% 2 1.1% 5 2.6% 1 .8%
31 12% 28 17% 23 9.0% 31 17% 30 13% 29 16% 19 9.8% 26 20%
From people at my previousschool
From relatives, friends oracquaintances
From a UH Hilo admissionsoffice representative
From a UH Hilo professor, staff,or student
From UH Hilo material mailedto me
From a college guide catalog
From the UH Hilo website
From the US News and WorldReport website
From the public media (e.g.radio, television or newspapers)
At a college fair or publicdisplay
From Upward Bound
Other'
Howdid youlearnaboutUHHilo?
#Col%
First-timefreshman
#Col%
Transferstudent
Are you a first timefreshman or a transfer
student?
Fall 2002
#Col%
First-timefreshman
#Col%
Transferstudent
Are you a first timefreshman or a transfer
student?
Fall 2003
#Col%
First-timefreshman
#Col%
Transferstudent
Are you a first timefreshman or a transfer
student?
Fall 2004
#Col%
First-timefreshman
#Col%
Transferstudent
Are you a first timefreshman or a transfer
student?
Fall 2005
Entering Student Cohort
About one third of all incoming students say their primary reason for choosing UH Hilo is because it is close to home, followed by its academic reputation, low tuition, and size. Between Fall of 2002 and Fall of 2005, the percentage of incoming students who chose UH Hilo because it has a “very good” academic reputation has declined from 17% of entering freshmen and 19% of entering transfer students to 13% of freshmen and 15% of transfer students.
In Fall 2005, 36% of entering freshmen and 33% of entering transfer students said their primary reason for choosing UH Hilo was that it was near home. 13% of the freshmen and 15% of the transfer students said their primary reason was UH
Hilo’s “very good” academic reputation. 13% of the freshmen and 11% of the transfer students said their primary reason for choosing
UH Hilo was its low tuition. 11% of new freshmen and 9.2% of new transfers said it was UH Hilo’s size that primary
attracted them.
Lynne Stamoulis, Ed.D. 11

What was your primary reason for choosing UH Hilo?
44 17% 32 19% 52 24% 40 25% 47 22% 29 22% 26 13% 20 15%
7 2.6% 3 1.8% 12 5.5% 2 1.3% 4 1.9% 3 1.5% 2 1.5%
22 8.3% 5 3.0% 23 11% 3 1.9% 16 7.5% 8 6.0% 10 5.2% 3 2.3%
41 15% 22 13% 31 14% 30 19% 41 19% 23 17% 25 13% 15 11%
85 32% 51 31% 59 27% 40 25% 73 34% 46 34% 70 36% 43 33%
27 10% 14 8.5% 32 15% 31 19% 29 14% 23 17% 21 11% 12 9.2%
3 1.1% 3 1.4% 1 .5% 2 1.5% 7 3.6%
3 1.1% 2 1.5% 2 1.5%
6 2.3% 3 1.8% 3 1.4% 3 1.9% 3 1.4% 1 .7% 4 2.1% 7 5.3%
28 11% 35 21% 3 1.4% 11 6.9% 28 14% 27 21%
This college has a very goodacademic reputation
This college has a goodreputation for its socialactivities
I was offered financialassistance
This college has low tuition
I wanted to live near home
I wanted to go to a schoolabout the size of this college
Not accepted anywhere else
Rankings in nationalmagazines
My friends are attending
Other
What wasyourprimaryreason forchoosingUH Hilo?
#Col%
First-timefreshman
#Col%
Transferstudent
Are you a first timefreshman or a transfer
student?
Fall 2002
#Col%
First-timefreshman
#Col%
Transferstudent
Are you a first timefreshman or a transfer
student?
Fall 2003
#Col%
First-timefreshman
#Col%
Transferstudent
Are you a first timefreshman or a transfer
student?
Fall 2004
#Col%
First-timefreshman
#Col%
Transferstudent
Are you a first timefreshman or a transfer
student?
Fall 2005
Entering Student Cohort
About four out of ten incoming students say they plan to complete their higher education with a baccalaureate degree. In Fall of 2005…
41.7% of entering students said the highest degree they planned to earn was a baccalaureate degree, 17.2% said they planned to earn a Master or Arts or Master of Science, and 13.5% said they planned to complete a doctorate or professional degree. Students who said they were undecided about what was the highest degree they planned to
earn increased from .9% in Fall of 2002 to 18.4% in Fall of 2005. Students who said they planned to complete their higher education with a Certificate in
Education declined from 15.1% in 2002 to only 4.7% in 2005.
Lynne Stamoulis, Ed.D. 12

What is the highest degree you intend to earn at this or another college or university?
7 2.6% 3 1.8% 2 .8% 5 2.7% 1 .4% 6 3.3% 2 1.0% 3 2.2%
2 .8% 8 4.8% 1 .4% 7 3.7% 4 1.7% 5 2.8% 9 6.7%
114 43% 87 52% 109 43% 82 44% 96 40% 88 49% 74 38% 63 47%
42 16% 25 15% 13 5.2% 10 5.3% 20 8.3% 14 7.8% 7 3.6% 8 6.0%
20 7.5% 14 8.4% 32 13% 42 22% 42 18% 28 16% 26 13% 29 22%
25 9.4% 13 7.8% 21 8.4% 8 4.3% 14 5.8% 5 2.8% 12 6.2% 5 3.7%
52 20% 16 9.6% 27 11% 21 11% 21 8.8% 21 12% 22 11% 7 5.2%
3 1.1% 46 18% 12 6.4% 42 18% 13 7.2% 52 27% 10 7.5%
Not seeking degree orcertificate
Associate degree or Certificatof achievement
Bachelors degree
Certificate in EducationMasters
Master of Arts or Master ofScience
Professional degree;medicine, law, or business
Doctoral degree
Undecided
What is thehighestdegree youintend toearn at thisor anothercollege oruniversity?
#Col%
First-timefreshman
#Col%
Transferstudent
Are you a first timefreshman or a transfer
student?
Fall 2002
#Col%
First-timefreshman
#Col%
Transferstudent
Are you a first timefreshman or a transfer
student?
Fall 2003
#Col%
First-timefreshman
#Col%
Transferstudent
Are you a first timefreshman or a transfer
student?
Fall 2004
#Col%
First-timefreshman
#Col%
Transferstudent
Are you a first timefreshman or a transfer
student?
Fall 2005
Entering Student Cohort
The percentage of UH Hilo incoming freshmen who say they plan to complete a degree at UH Hilo, as opposed to transferring to another school, has declined from 43% in Fall of 2002 to 36% in Fall of 2005.
If you are a Bachelor's degree candidate, do you intend to...
110 43% 115 70% 108 46% 124 70% 87 39% 126 76% 63 36% 89 71%
47 18% 15 9.1% 33 14% 18 10% 33 15% 11 6.7% 36 21% 13 10%
100 39% 35 21% 92 39% 35 20% 103 46% 28 17% 75 43% 23 18%
Complete degree atUH Hilo
Transfer to anotherinstitution to completedegree
Do not know
If you are aBachelors degreecandidate, do youintend to
#Col%
First-timefreshman
3.00Col%
Transferstudent
Are you a first timefreshman or a transfer
student?
Fall 2002
#Col%
First-timefreshman
#Col%
Transferstudent
Are you a first timefreshman or a transfer
student?
Fall 2003
#Col%
First-timefreshman
#Col%
Transferstudent
Are you a first timefreshman or a transfer
student?
Fall 2004
#Col%
First-timefreshman
#Col%
Transferstudent
Are you a first timefreshman or a transfer
student?
Fall 2005
Entering Student Cohort
Lynne Stamoulis, Ed.D. 13

TRIO eligibility is determined by a combination of information: annual household income (150% of less of the national poverty level determined by income and number of people living in the household), and level of parental education. TRIO eligibility is determined by a student having neither parent graduate from college and/or having an annual household income of 150% or less than the national poverty level. Because the Incoming Student Survey does not ask about disability, the TRIO figures here do not include students who are TRIO eligible according to disability status only. Although there was an apparent dip in TRIO-Eligible incoming students in Fall 2003, in the other years since Fall 2002, almost six out of ten of students entering UH Hilo are TRIO eligible. The dip in TRIO- eligible incoming students in 2003 appears to be largely due to a lower percentage of TRIO-eligible transfer students entering in Fall 2003.
Eligibility of Incoming Students for TRIO-Sponsored Programs
263 58.2% 259 51.7% 279 56.6% 196 57.0%
89 19.7% 130 25.9% 110 22.3% 49 14.2%
100 22.1% 112 22.4% 104 21.1% 99 28.8%
452 100.0% 501 100.0% 493 100.0% 344 100.0%
Yes
Unknown
No
Eligibility forTRIO-sponsoredPrograms
Total
Count Col %
Fall 2002
Count Col %
Fall 2003
Count Col %
Fall 2004
Count Col %
Fall 2005
Entering Student Cohort
In Fall 2005, 56.9% of entering first-time freshmen and 57% of entering transfer students were eligible to be served by TRIO-sponsored programs.
Are you a First-Time Freshman or a Transfer Student?
156 47 64
58.4% 17.6% 24.0%
98 35 33
59.0% 21.1% 19.9%
149 36 72
58.0% 14.0% 28.0%
100 53 38
52.4% 27.7% 19.9%
146 28 69
60.1% 11.5% 28.4%
111 47 26
60.3% 25.5% 14.1%
111 14 70
56.9% 7.2% 35.9%
77 30 28
57.0% 22.2% 20.7%
Count
Col %
First-time freshman
Count
Col %
Transfer student
Are you a firsttime freshmanor a transferstudent?
Fall2002
Count
Col %
First-time freshman
Count
Col %
Transfer student
Are you a firsttime freshmanor a transferstudent?
Fall2003
Count
Col %
First-time freshman
Count
Col %
Transfer student
Are you a firsttime freshmanor a transferstudent?
Fall2004
Count
Col %
First-time freshman
Count
Col %
Transfer student
Are you a firsttime freshmanor a transferstudent?
Fall2005
EnteringStudentCohort
Yes Unknown No
Eligibility for TRIO-sponsoredPrograms
Lynne Stamoulis, Ed.D. 14

Over half (55.5%) of UH Hilo entering students are first generation college students.
Parental Education of Incoming Students Fall 2002 to Fall 2005
35 7.7% 67 13.4% 51 10.3% 23 6.7%
25 5.5% 25 5.0% 27 5.5% 24 7.0%
73 16.2% 67 13.4% 82 16.6% 59 17.2%
27 6.0% 19 3.8% 22 4.5% 22 6.4%
96 21.2% 113 22.6% 108 21.9% 63 18.3%
150 33.2% 160 31.9% 159 32.3% 119 34.6%
46 10.2% 50 10.0% 44 8.9% 34 9.9%
Unknown
Neither parent graduatedfrom High School
At least one parentgraduated from HighSchool
At least one parentexperienced some collegeor vocational s
At least one parent earnedan associate degree
At least one parentgraduated with a four-yearbaccalaureate
At least one parent earneda post-Baccalaureatedegree (Mast
Highestlevel ofeducationof parents
Count Col %
Fall 2002
Count Col %
Fall 2003
Count Col %
Fall 2004
Count Col %
Fall 2005
Entering Student Cohort
Over two thirds of entering students (64.7%) are say they are currently reported as dependents by their parents or guardians.
Dependency Status of Incoming Students Fall 2002 to Fall 2005
292 67.0% 291 64.1% 254 59.1% 216 64.7%
144 33.0% 163 35.9% 176 40.9% 118 35.3%
Yes
No
Are you currentlyreported as a dependentfor income tax purposesby a parent or guardian?
Count Col %
Fall 2002
Count Col %
Fall 2003
Count Col %
Fall 2004
Count Col %
Fall 2005
Entering Student Cohort
Lynne Stamoulis, Ed.D. 15

Dependency Status of Incoming Students Fall 2002 to Fall 2005
213 48
81.6% 18.4%
74 88
45.7% 54.3%
195 52
78.9% 21.1%
89 98
47.6% 52.4%
178 49
78.4% 21.6%
68 106
39.1% 60.9%
156 31
83.4% 16.6%
55 79
41.0% 59.0%
Count
Col %
First-time freshman
Count
Col %
Transfer student
Are you a firsttime freshmanor a transferstudent?
Fall2002
Count
Col %
First-time freshman
Count
Col %
Transfer student
Are you a firsttime freshmanor a transferstudent?
Fall2003
Count
Col %
First-time freshman
Count
Col %
Transfer student
Are you a firsttime freshmanor a transferstudent?
Fall2004
Count
Col %
First-time freshman
Count
Col %
Transfer student
Are you a firsttime freshmanor a transferstudent?
Fall2005
EnteringStudentCohort
Yes No
Are youcurrently
reported as adependent for
income taxpurposes by a
parent orguardian?
The percentage of incoming students who say their annual household income is below $32,000 has decreased from 47.1% in 2002 to 38.9% in 2005.
Lynne Stamoulis, Ed.D. 16

Annual Household Income of Incoming Students Fall 2002 to Fall 2005
96 25.7% 99 25.4% 88 22.1% 52 18.4%
33 8.8% 25 6.4% 30 7.5% 20 7.1%
25 6.7% 25 6.4% 21 5.3% 21 7.4%
22 5.9% 25 6.4% 33 8.3% 17 6.0%
18 4.8% 16 4.1% 19 4.8% 10 3.5%
25 6.7% 27 6.9% 26 6.5% 19 6.7%
15 4.0% 26 6.7% 21 5.3% 9 3.2%
24 6.4% 27 6.9% 26 6.5% 23 8.2%
16 4.3% 14 3.6% 17 4.3% 3 1.1%
8 2.1% 10 2.6% 7 1.8% 7 2.5%
36 9.7% 43 11.1% 44 11.0% 43 15.2%
34 9.1% 23 5.9% 36 9.0% 31 11.0%
21 5.6% 29 7.5% 31 7.8% 27 9.6%
$15,300 or less
$15,301-20,610
$20,611-25,920
$25,921-31,230
$31,231-36,540
$36,541-44,550
$44,551-47,160
$47,161-52470
$52,471-56,010
$56,011-59,550
$59,551-75,000
$75,001-100,000
Over $100,000
AnnualHouseholdIncome ofIncomingStudents
Count Col %
Fall 2002
Count Col %
Fall 2003
Count Col %
Fall 2004
Count Col %
Fall 2005
Entering Student Cohort
The percentage of incoming students who say they are native speakers of English has declined from 91.2% in 2002 to 86.5% in 2005.
Are you a native English Speaker?
404 91.2% 394 85.3% 402 90.7% 294 86.5%
39 8.8% 68 14.7% 41 9.3% 46 13.5%
Yes
No
Count Col %
Fall 2002
Count Col %
Fall 2003
Count Col %
Fall 2004
Count Col %
Fall 2005
Entering Student Cohort
The percentage of incoming students who say they plan to live in on-campus residence halls or university-sponsored off-campus housing has increased from 34.5% in 2002 to 41.8% in 2005.
Lynne Stamoulis, Ed.D. 17

Where will you be living this coming semester?
125 28.4% 164 35.3% 149 33.3% 118 34.5%
27 6.1% 55 11.9% 28 6.3% 25 7.3%
97 22.0% 128 27.6% 119 26.6% 71 20.8%
113 25.7% 80 17.2% 87 19.4% 87 25.4%
56 12.7% 30 6.5% 54 12.1% 31 9.1%
22 5.0% 7 1.5% 11 2.5% 10 2.9%
On campus residence hall
University sponsored offcampus housing
Other off campus housing
At home with my parents
In my own home
Other
Where will yoube living thissemester?
Count Col %
Fall 2002
Count Col %
Fall 2003
Count Col %
Fall 2004
Count Col %
Fall 2005
Entering Student Cohort
In Fall 2005, 53.3% of the incoming first-time freshmen and 34.5% of the incoming transfer students said they planned to live in on-campus residence halls or university-sponsored off-campus housing.
Where will you be living this coming semester?
103 11 34 90 13 11
39.3% 4.2% 13.0% 34.4% 5.0% 4.2%
19 16 61 22 35 11
11.6% 9.8% 37.2% 13.4% 21.3% 6.7%
123 26 31 64 6 3
48.6% 10.3% 12.3% 25.3% 2.4% 1.2%
33 28 89 12 21 4
17.6% 15.0% 47.6% 6.4% 11.2% 2.1%
102 14 40 62 13 5
43.2% 5.9% 16.9% 26.3% 5.5% 2.1%
38 13 67 24 32 5
21.2% 7.3% 37.4% 13.4% 17.9% 2.8%
88 16 17 62 6 6
45.1% 8.2% 8.7% 31.8% 3.1% 3.1%
28 9 47 23 23 4
20.9% 6.7% 35.1% 17.2% 17.2% 3.0%
Count
Col %
First-timefreshman
Count
Col %
Transferstudent
Are you a first timefreshman or atransfer student?
Fall2002
Count
Col %
First-timefreshman
Count
Col %
Transferstudent
Are you a first timefreshman or atransfer student?
Fall2003
Count
Col %
First-timefreshman
Count
Col %
Transferstudent
Are you a first timefreshman or atransfer student?
Fall2004
Count
Col %
First-timefreshman
Count
Col %
Transferstudent
Are you a first timefreshman or atransfer student?
Fall2005
EnteringStudentCohort
Oncampus
residencehall
Universitysponsored
offcampushousing
Otheroff
campushousing
Athome
with myparents
In myown
home Other
Where will you be living this semester?
The incoming student survey includes several questions about a student’s activities during the year before they came to UH Hilo. Items were included in the Survey of Incoming Students because they showed some ability, alone or with other variables, to differentiate between students who continued at UH Hilo after a year, and those students who left. These variables were used to develop a predictive
Lynne Stamoulis, Ed.D. 18

model, which could predict which students were at a high risk of attrition. Although the frequency with which incoming students in general participated in most of these activities has remained relatively stable since Fall of 2002, incoming students have more frequently used the Internet for homework and discussed politics, and engaged in smoking cigarettes with less frequency.
In Fall of 2005, 75.4% of incoming students had frequently used the Internet for homework in the year before entering UH Hilo, compared to 65.5% of incoming students in Fall of 2002, and 23.3% had frequently discussed politics, compared to 17.3% in Fall of 2002. In Fall of 2005, only 6.2% of incoming students said they had smoked frequently in the year
before coming to UH Hilo, compared to 17.3% of students entering Fall of 2002. .
Lynne Stamoulis, Ed.D. 19

167 38.0% 181 39.3% 182 40.6% 124 36.6%
171 38.9% 160 34.7% 177 39.5% 127 37.5%
102 23.2% 120 26.0% 89 19.9% 88 26.0%
90 20.5% 93 20.4% 98 21.9% 63 18.6%
235 53.5% 233 51.2% 246 55.0% 177 52.4%
114 26.0% 129 28.4% 103 23.0% 98 29.0%
351 80.3% 355 77.9% 342 77.2% 281 82.9%
37 8.5% 56 12.3% 63 14.2% 37 10.9%
49 11.2% 45 9.9% 38 8.6% 21 6.2%
217 49.8% 215 46.8% 205 46.1% 178 52.7%
173 39.7% 191 41.6% 204 45.8% 136 40.2%
46 10.6% 53 11.5% 36 8.1% 24 7.1%
110 25.1% 109 24.0% 87 19.6% 70 20.6%
253 57.6% 247 54.4% 249 56.0% 190 56.0%
76 17.3% 98 21.6% 109 24.5% 79 23.3%
19 4.3% 18 4.0% 17 3.8% 12 3.5%
102 23.2% 118 25.9% 113 25.6% 76 22.4%
318 72.4% 319 70.1% 312 70.6% 252 74.1%
86 19.6% 95 20.7% 105 23.6% 70 20.6%
240 54.8% 231 50.3% 213 47.9% 181 53.4%
112 25.6% 133 29.0% 127 28.5% 88 26.0%
46 10.5% 33 7.3% 35 8.0% 19 5.6%
140 32.0% 125 27.5% 146 33.3% 117 34.4%
252 57.5% 296 65.2% 258 58.8% 204 60.0%
20 4.6% 18 4.0% 15 3.4% 11 3.2%
131 29.9% 120 26.4% 99 22.8% 73 21.4%
287 65.5% 316 69.6% 321 73.8% 257 75.4%
19 4.3% 30 6.7% 22 5.0% 16 4.7%
73 16.7% 82 18.3% 56 12.7% 48 14.1%
346 79.0% 336 75.0% 364 82.4% 276 81.2%
Not at all
Occasionally
Frequently
Attended a religiousservice
Not at all
Occasionally
Frequently
Studied with otherstudents
Not at all
Occasionally
Frequently
Smoked cigarettes
Not at all
Occasionally
Frequently
Drank alcohol
Not at all
Occasionally
Frequently
Discussed politics
Not at all
Occasionally
Frequently
Socialized with someoneof another ethnic group
Not at all
Occasionally
Frequently
Discussed religion
Not at all
Occasionally
Frequently
Communicated by email
Not at all
Occasionally
Frequently
Used the Internet forhomework
Not at all
Occasionally
Frequently
Used a PC
Count Col %
Fall 2002
Count Col %
Fall 2003
Count Col %
Fall 2004
Count Col %
Fall 2005
Entering Student Cohort
Lynne Stamoulis, Ed.D. 20

87 33.0% 75 46.3% 85 33.9% 84 45.2% 86 36.9% 78 44.1% 63 32.5% 56 42.1%
109 41.3% 57 35.2% 96 38.2% 57 30.6% 99 42.5% 65 36.7% 72 37.1% 52 39.1%
68 25.8% 30 18.5% 70 27.9% 45 24.2% 48 20.6% 34 19.2% 59 30.4% 25 18.8%
38 14.4% 45 27.8% 33 13.3% 54 29.2% 41 17.5% 45 25.7% 26 13.5% 31 23.3%
149 56.7% 81 50.0% 142 57.0% 82 44.3% 137 58.5% 90 51.4% 109 56.5% 64 48.1%
76 28.9% 36 22.2% 74 29.7% 49 26.5% 56 23.9% 40 22.9% 58 30.1% 38 28.6%
221 84.7% 119 73.5% 204 82.3% 135 73.0% 195 84.8% 113 64.6% 171 88.1% 99 74.4%
17 6.5% 19 11.7% 21 8.5% 31 16.8% 20 8.7% 42 24.0% 21 10.8% 15 11.3%
23 8.8% 24 14.8% 23 9.3% 19 10.3% 15 6.5% 20 11.4% 2 1.0% 19 14.3%
159 60.9% 52 32.3% 145 57.3% 60 32.6% 140 60.3% 49 28.0% 134 69.1% 40 30.3%
82 31.4% 85 52.8% 84 33.2% 99 53.8% 78 33.6% 105 60.0% 53 27.3% 76 57.6%
20 7.7% 24 14.9% 24 9.5% 25 13.6% 14 6.0% 21 12.0% 7 3.6% 16 12.1%
82 31.2% 27 16.7% 72 28.9% 31 16.8% 53 22.9% 29 16.5% 49 25.3% 17 12.9%
139 52.9% 102 63.0% 134 53.8% 104 56.5% 122 52.8% 98 55.7% 107 55.2% 77 58.3%
42 16.0% 33 20.4% 43 17.3% 49 26.6% 56 24.2% 49 27.8% 38 19.6% 38 28.8%
11 4.2% 8 4.9% 7 2.8% 8 4.3% 8 3.5% 7 4.0% 4 2.1% 6 4.5%
50 19.0% 48 29.6% 63 25.3% 52 28.1% 49 21.5% 52 29.5% 44 22.7% 31 23.3%
202 76.8% 106 65.4% 179 71.9% 125 67.6% 171 75.0% 117 66.5% 146 75.3% 96 72.2%
57 21.7% 26 16.0% 54 21.5% 36 19.4% 60 25.8% 38 21.6% 44 22.8% 22 16.5%
142 54.0% 91 56.2% 131 52.2% 96 51.6% 114 48.9% 79 44.9% 103 53.4% 75 56.4%
64 24.3% 45 27.8% 66 26.3% 54 29.0% 59 25.3% 59 33.5% 46 23.8% 36 27.1%
35 13.3% 8 4.9% 25 10.1% 6 3.2% 23 10.1% 10 5.7% 16 8.2% 3 2.3%
92 35.0% 43 26.5% 74 29.8% 43 23.2% 86 37.9% 48 27.4% 73 37.6% 40 30.1%
136 51.7% 111 68.5% 149 60.1% 136 73.5% 118 52.0% 117 66.9% 105 54.1% 90 67.7%
10 3.8% 6 3.7% 11 4.4% 6 3.2% 7 3.0% 7 4.1% 6 3.1% 3 2.2%
77 29.3% 51 31.5% 72 29.0% 42 22.6% 47 20.4% 42 24.7% 44 22.7% 25 18.7%
176 66.9% 105 64.8% 165 66.5% 138 74.2% 176 76.5% 121 71.2% 144 74.2% 106 79.1%
13 4.9% 5 3.1% 14 5.7% 14 7.7% 13 5.7% 7 4.0% 10 5.2% 5 3.7%
43 16.3% 27 16.7% 50 20.2% 29 15.9% 29 12.6% 18 10.3% 24 12.4% 22 16.4%
207 78.7% 130 80.2% 183 74.1% 139 76.4% 188 81.7% 149 85.6% 159 82.4% 107 79.9%
Not at all
Occasionally
Frequently
Attended a religiousservice
Not at all
Occasionally
Frequently
Studied with otherstudents
Not at all
Occasionally
Frequently
Smoked cigarettes
Not at all
Occasionally
Frequently
Drank alcohol
Not at all
Occasionally
Frequently
Discussed politics
Not at all
Occasionally
Frequently
Socialized with someoneof another ethnic group
Not at all
Occasionally
Frequently
Discussed religion
Not at all
Occasionally
Frequently
Communicated by email
Not at all
Occasionally
Frequently
Used the Internet forhomework
Not at all
Occasionally
Frequently
Used a PC
Count Col %
First-timefreshman
Count Col %
Transferstudent
Are you a first time freshman or atransfer student?
Fall 2002
Count Col %
First-timefreshman
Count Col %
Transferstudent
Are you a first time freshman or atransfer student?
Fall 2003
Count Col %
First-timefreshman
Count Col %
Transferstudent
Are you a first time freshman or atransfer student?
Fall 2004
Count Col %
First-timefreshman
Count Col %
Transferstudent
Are you a first time freshman or atransfer student?
Fall 2005
Entering Student Cohort
Consistently over the last four years, about six out of ten (60.7% in 2005) incoming students have taken four or more years of mathematics in high school. In 2005, 30.1% of incoming students had taken three years, and 9.2% had taken two or fewer years.
High School Mathematics Study
4 .9% 2 .4% 1 .2% 1 .3%
3 .7% 2 .4% 1 .2%
6 1.4% 5 1.1% 3 .7% 5 1.5%
30 6.8% 31 6.8% 30 6.9% 25 7.4%
119 26.9% 127 27.8% 120 27.6% 101 30.1%
258 58.4% 256 56.0% 260 59.9% 195 58.0%
22 5.0% 34 7.4% 19 4.4% 9 2.7%
None
One half
One
Two
Three
Four
Five or more
During highschool, howmany yearsdid you studymathematics?
Count Col %
Fall 2002
Count Col %
Fall 2003
Count Col %
Fall 2004
Count Col %
Fall 2005
Entering Student Cohort
Lynne Stamoulis, Ed.D. 21

Compared to Fall 2002, incoming students are putting more time into researching what major to choose. In 2005, 37% of incoming students said they had put a lot of research into choosing their major, compared to 29.2% in 2002.
In Fall 2005, 37% of the incoming students said they put a lot of research into choosing a major, 34.9% said they did some research, and 28.1% said they had done little or no research related to choosing a major.
How much research did you put into choosing a major?
26 6.0% 22 4.7% 18 3.8% 15 4.5%
28 6.5% 38 8.1% 41 8.6% 18 5.4%
73 16.9% 66 14.0% 86 18.1% 61 18.2%
179 41.4% 181 38.3% 163 34.4% 117 34.9%
126 29.2% 165 35.0% 166 35.0% 124 37.0%
None at all
Very little
Not too much
Some
A lot
How muchresearch didyou put intothe choosingof a major
Count Col %
Fall 2002
Count Col %
Fall 2003
Count Col %
Fall 2004
Count Col %
Fall 2005
Entering Student Cohort
Typically, incoming transfer students report doing more research directed at choosing a major than incoming first-year freshmen.
In Fall 2005, 43.2% of incoming transfer students said they did a lot of research related to choosing a major, compared to 31.9% of incoming first-year freshmen.
How much research did you put into choosing a major?
13 20 60 113 47
5.1% 7.9% 23.7% 44.7% 18.6%
12 7 12 56 76
7.4% 4.3% 7.4% 34.4% 46.6%
9 18 42 98 77
3.7% 7.4% 17.2% 40.2% 31.6%
9 14 17 69 72
5.0% 7.7% 9.4% 38.1% 39.8%
8 26 56 83 62
3.4% 11.1% 23.8% 35.3% 26.4%
8 10 21 56 83
4.5% 5.6% 11.8% 31.5% 46.6%
12 13 44 61 61
6.3% 6.8% 23.0% 31.9% 31.9%
3 4 15 53 57
2.3% 3.0% 11.4% 40.2% 43.2%
Count
Col %
First-timefreshman
Count
Col %
Transferstudent
Are you a first timefreshman or atransfer student?
Fall2002
Count
Col %
First-timefreshman
Count
Col %
Transferstudent
Are you a first timefreshman or atransfer student?
Fall2003
Count
Col %
First-timefreshman
Count
Col %
Transferstudent
Are you a first timefreshman or atransfer student?
Fall2004
Count
Col %
First-timefreshman
Count
Col %
Transferstudent
Are you a first timefreshman or atransfer student?
Fall2005
EnteringStudentCohort
None at all Very little Not too much Some A lot
How much research did you put into the choosing of a major
Lynne Stamoulis, Ed.D. 22

In Fall 2005, a higher proportion of incoming students said they planned to go to graduate school, compared to incoming students in Fall 2002.
In Fall 2005, 48.3% of incoming students said they planned to go to graduate school either right after graduation or somewhat later, compared to 43.2% in Fall 2002. In Fall 2005, 28.8% of incoming students said they planned to work full time after graduation,
29.7% said they planned to go to graduate or professional school right after graduation, and 18.6% said they planned to go to graduate school later.
What do you plan to do after you graduate?
150 34.6% 132 28.3% 142 30.7% 96 28.8%
99 22.9% 156 33.4% 127 27.4% 99 29.7%
88 20.3% 89 19.1% 93 20.1% 62 18.6%
96 22.2% 90 19.3% 101 21.8% 76 22.8%
Work full time
Go to graduate orprofessional school
Go to graduateschool later
Do not know
What do youplan to doaftergraduation?
Count Col %
Fall 2002
Count Col %
Fall 2003
Count Col %
Fall 2004
Count Col %
Fall 2005
Entering Student Cohort
As might be expected, incoming transfer students tend to have a clearer idea of what they plan to do after graduation than incoming freshmen.
Only 15.5% of incoming transfer students are undecided about their after-graduation plans, compared to 27.7% of incoming first-year freshmen.
A higher proportion of incoming transfer students say they plan to attend graduate school—not right after graduation, but later--than incoming first-year freshmen.
24% of incoming transfer students said they planned graduate school later, compared to only 14.7% of incoming first-time freshmen.
Lynne Stamoulis, Ed.D. 23

What do you plan to do after you graduate?
76 55 51 72
29.9% 21.7% 20.1% 28.3%
63 41 36 23
38.7% 25.2% 22.1% 14.1%
66 79 42 55
27.3% 32.6% 17.4% 22.7%
53 61 44 22
29.4% 33.9% 24.4% 12.2%
77 60 37 56
33.5% 26.1% 16.1% 24.3%
54 49 40 32
30.9% 28.0% 22.9% 18.3%
53 57 28 53
27.7% 29.8% 14.7% 27.7%
40 38 31 20
31.0% 29.5% 24.0% 15.5%
Count
Col %
First-timefreshman
Count
Col %
Transferstudent
Are you a first timefreshman or atransfer student?
Fall2002
Count
Col %
First-timefreshman
Count
Col %
Transferstudent
Are you a first timefreshman or atransfer student?
Fall2003
Count
Col %
First-timefreshman
Count
Col %
Transferstudent
Are you a first timefreshman or atransfer student?
Fall2004
Count
Col %
First-timefreshman
Count
Col %
Transferstudent
Are you a first timefreshman or atransfer student?
Fall2005
EnteringStudentCohort
Work full time
Go to graduateor professional
schoolGo to graduate
school later Do not know
What do you plan to do after graduation?
About a quarter of UH Hilo incoming students (23.3%) report their reading ability to be only fair or poor.
In 2005, 29.7% of incoming students said their reading ability was excellent, 47% said it was good, and 23.3% said it was fair or poor.
How would you describe your reading ability?
147 34.3% 162 34.4% 165 35.3% 98 29.7%
182 42.5% 204 43.3% 200 42.8% 155 47.0%
90 21.0% 95 20.2% 90 19.3% 69 20.9%
9 2.1% 10 2.1% 12 2.6% 8 2.4%
Excellent
Good
Fair
Poor
How is yourreadingability
Count Col %
Fall 2002
Count Col %
Fall 2003
Count Col %
Fall 2004
Count Col %
Fall 2005
Entering Student Cohort
In Fall 2005, incoming transfer students rated their reading ability higher than incoming first-time freshmen did.
36.9% of incoming transfer students rated their reading ability as excellent, compared to only 24.6% of entering first-time freshmen.
Lynne Stamoulis, Ed.D. 24

How would you describe your reading ability?
70 117 60 3
28.0% 46.8% 24.0% 1.2%
72 60 25 5
44.4% 37.0% 15.4% 3.1%
73 111 54 3
30.3% 46.1% 22.4% 1.2%
76 70 31 3
42.2% 38.9% 17.2% 1.7%
73 103 51 5
31.5% 44.4% 22.0% 2.2%
73 68 33 3
41.2% 38.4% 18.6% 1.7%
46 95 39 7
24.6% 50.8% 20.9% 3.7%
48 56 25 1
36.9% 43.1% 19.2% .8%
Count
Col %
First-timefreshman
Count
Col %
Transferstudent
Are you a first timefreshman or atransfer student?
Fall2002
Count
Col %
First-timefreshman
Count
Col %
Transferstudent
Are you a first timefreshman or atransfer student?
Fall2003
Count
Col %
First-timefreshman
Count
Col %
Transferstudent
Are you a first timefreshman or atransfer student?
Fall2004
Count
Col %
First-timefreshman
Count
Col %
Transferstudent
Are you a first timefreshman or atransfer student?
Fall2005
EnteringStudentCohort
Excellent Good Fair Poor
How is your reading ability
Consistently over the last four years, incoming students from Hawai’i public schools have rated their reading ability much lower than students from mainland public schools. In addition, the proportion of incoming students from both types of schools (Hawai’i or mainland public) who rate their reading ability to be excellent declined between Fall 2002 and Fall 2005.
In Fall 2002, 25.5% of incoming students from Hawai’i public schools rated their reading ability to be excellent, compared to 20.1% in Fall 2005. In Fall 2002, 51.3% of incoming students from mainland schools rated their reading ability as
excellent, compared to 45.6% in Fall 2005. More than twice the percentage of mainland students tend to rate their reading ability to be
excellent, when compared to students from Hawai’i: In Fall 2005, 45.6% of incoming mainland students rated their reading ability to be excellent, compared to only 20.1% of students from Hawai’i.
Lynne Stamoulis, Ed.D. 25

How would you describe your reading ability?
55 104 55 2
25.5% 48.1% 25.5% .9%
14 22 4
35.0% 55.0% 10.0%
58 37 16 2
51.3% 32.7% 14.2% 1.8%
8 7 2 1
44.4% 38.9% 11.1% 5.6%
6 8 8 1
26.1% 34.8% 34.8% 4.3%
6 4 5 3
33.3% 22.2% 27.8% 16.7%
40 79 34 1
26.0% 51.3% 22.1% .6%
9 13 1
39.1% 56.5% 4.3%
80 69 25 1
45.7% 39.4% 14.3% .6%
10 10
50.0% 50.0%
10 14 19 2
22.2% 31.1% 42.2% 4.4%
5 4 7 2
27.8% 22.2% 38.9% 11.1%
3 7 7 1
16.7% 38.9% 38.9% 5.6%
41 85 39 3
24.4% 50.6% 23.2% 1.8%
13 15 11 1
32.5% 37.5% 27.5% 2.5%
92 62 20 3
52.0% 35.0% 11.3% 1.7%
12 11 3
46.2% 42.3% 11.5%
1 12 6 1
5.0% 60.0% 30.0% 5.0%
2 1 2
40.0% 20.0% 40.0%
4 10 4 3
19.0% 47.6% 19.0% 14.3%
28 80 30 1
20.1% 57.6% 21.6% .7%
8 20 7 1
22.2% 55.6% 19.4% 2.8%
47 37 15 4
45.6% 35.9% 14.6% 3.9%
3 3 2
37.5% 37.5% 25.0%
4 6 7 1
22.2% 33.3% 38.9% 5.6%
3 2 5
30.0% 20.0% 50.0%
2 6 3 1
16.7% 50.0% 25.0% 8.3%
Count
Col %
Hawaiipublic
Count
Col %
Hawaiiprivate
Count
Col %
Mainlandpublic
Count
Col %
Mainlandprivate
Count
Col %
International
Count
Col %
Other
Whattype ofhighschooldid youattend?
Fall2002
Count
Col %
Hawaiipublic
Count
Col %
Hawaiiprivate
Count
Col %
Mainlandpublic
Count
Col %
Mainlandprivate
Count
Col %
International
Count
Col %
Homeschool
Count
Col %
Other
Whattype ofhighschooldid youattend?
Fall2003
Count
Col %
Hawaiipublic
Count
Col %
Hawaiiprivate
Count
Col %
Mainlandpublic
Count
Col %
Mainlandprivate
Count
Col %
International
Count
Col %
Homeschool
Count
Col %
Other
Whattype ofhighschooldid youattend?
Fall2004
Count
Col %
Hawaiipublic
Count
Col %
Hawaiiprivate
Count
Col %
Mainlandpublic
Count
Col %
Mainlandprivate
Count
Col %
International
Count
Col %
Homeschool
Count
Col %
Other
Whattype ofhighschooldid youattend?
Fall2005
EnteringStudentCohort
Excellent Good Fair Poor
How is your reading ability
Lynne Stamoulis, Ed.D. 26

Consistently over four years, about six out of ten incoming first-time freshmen report that their average grade in high school was a B+ or higher. In Fall of 2002, the proportion of first time freshmen reporting B+ or higher average high school grades was significantly higher than the proportion of incoming transfer students. However, the gap between the high school grades of incoming freshmen and incoming transfer students narrowed to insignificance by Fall of 2005.
In Fall of 2002, 58.8% of incoming first-time freshmen reported their average high school grade to be a B+ or higher, compared to only 48.1% of incoming transfer students. In Fall of 2005, 57.1% of incoming first-time freshmen said their average high school grade
was a B+ or higher, compared to 54.3% of incoming transfer students.
What was your average grade in high school?
2 3 14 17 67 61 48 38
.8% 1.2% 5.6% 6.8% 26.8% 24.4% 19.2% 15.2%
8 15 15 43 36 17 22
5.1% 9.6% 9.6% 27.6% 23.1% 10.9% 14.1%
1 3 9 32 48 52 59 33
.4% 1.3% 3.8% 13.5% 20.3% 21.9% 24.9% 13.9%
1 11 14 11 41 35 27 36
.6% 6.3% 8.0% 6.3% 23.3% 19.9% 15.3% 20.5%
1 7 29 63 48 56 24
.4% 3.1% 12.7% 27.6% 21.1% 24.6% 10.5%
1 9 21 13 45 38 29 21
.6% 5.1% 11.9% 7.3% 25.4% 21.5% 16.4% 11.9%
2 12 26 39 42 38 25
1.1% 6.5% 14.1% 21.2% 22.8% 20.7% 13.6%
1 8 5 16 29 33 22 15
.8% 6.2% 3.9% 12.4% 22.5% 25.6% 17.1% 11.6%
Count
Col %
First-timefreshman
Count
Col %
Transferstudent
Are you a first timefreshman or atransfer student?
Fall2002
Count
Col %
First-timefreshman
Count
Col %
Transferstudent
Are you a first timefreshman or atransfer student?
Fall2003
Count
Col %
First-timefreshman
Count
Col %
Transferstudent
Are you a first timefreshman or atransfer student?
Fall2004
Count
Col %
First-timefreshman
Count
Col %
Transferstudent
Are you a first timefreshman or atransfer student?
Fall2005
EnteringStudentCohort
D C C+ B- B B+ A- A
What was your average grade in high school?
There is no significant difference in the self-reported high school grade averages of students from Hawai’i public schools and of those that come from mainland public schools.
In Fall 2005, 54% of incoming students from Hawai’i public schools said they had average high school grades of B+ or higher; 53.5% of incoming students from mainland public schools reported high school grades of B+ or higher.
Lynne Stamoulis, Ed.D. 27

What was your average grade in high school?
2 6 15 18 59 46 33 33
.9% 2.8% 7.1% 8.5% 27.8% 21.7% 15.6% 15.6%
1 3 3 4 11 6 9 3
2.5% 7.5% 7.5% 10.0% 27.5% 15.0% 22.5% 7.5%
1 9 7 31 26 19 20
.9% 8.0% 6.2% 27.4% 23.0% 16.8% 17.7%
1 1 3 2 7 2 1
5.9% 5.9% 17.6% 11.8% 41.2% 11.8% 5.9%
2 6 9 3 3
8.7% 26.1% 39.1% 13.0% 13.0%
1 3 7 1 5
5.9% 17.6% 41.2% 5.9% 29.4%
3 9 19 38 29 31 22
2.0% 6.0% 12.6% 25.2% 19.2% 20.5% 14.6%
1 2 4 5 8 2 2
4.2% 8.3% 16.7% 20.8% 33.3% 8.3% 8.3%
2 6 7 16 30 34 47 30
1.2% 3.5% 4.1% 9.3% 17.4% 19.8% 27.3% 17.4%
1 2 6 3 3 4
5.3% 10.5% 31.6% 15.8% 15.8% 21.1%
1 1 8 11 7 5 12
2.2% 2.2% 17.8% 24.4% 15.6% 11.1% 26.7%
2 1 6 2 6
11.8% 5.9% 35.3% 11.8% 35.3%
2 1 4 6 2 3
11.1% 5.6% 22.2% 33.3% 11.1% 16.7%
4 11 16 43 39 33 21
2.4% 6.6% 9.6% 25.7% 23.4% 19.8% 12.6%
2 3 13 8 5 6 2
5.1% 7.7% 33.3% 20.5% 12.8% 15.4% 5.1%
1 4 15 13 46 43 36 19
.6% 2.3% 8.5% 7.3% 26.0% 24.3% 20.3% 10.7%
5 6 5 6 4
19.2% 23.1% 19.2% 23.1% 15.4%
2 1 3 6 4 2
11.1% 5.6% 16.7% 33.3% 22.2% 11.1%
3 1
75.0% 25.0%
1 8 6 4 1
5.0% 40.0% 30.0% 20.0% 5.0%
4 11 19 28 33 30 10
3.0% 8.1% 14.1% 20.7% 24.4% 22.2% 7.4%
4 5 9 9 5 4
11.1% 13.9% 25.0% 25.0% 13.9% 11.1%
1 4 3 14 25 25 16 13
1.0% 4.0% 3.0% 13.9% 24.8% 24.8% 15.8% 12.9%
2 2 4
25.0% 25.0% 50.0%
1 1 1 4 5 6
5.6% 5.6% 5.6% 22.2% 27.8% 33.3%
1 1 5 3
10.0% 10.0% 50.0% 30.0%
1 3 2 3 1 3
7.7% 23.1% 15.4% 23.1% 7.7% 23.1%
Count
Col %
Hawaiipublic
Count
Col %
Hawaiiprivate
Count
Col %
Mainlandpublic
Count
Col %
Mainlandprivate
Count
Col %
International
Count
Col %
Other
Whattype ofhighschooldid youattend?
Fall2002
Count
Col %
Hawaiipublic
Count
Col %
Hawaiiprivate
Count
Col %
Mainlandpublic
Count
Col %
Mainlandprivate
Count
Col %
International
Count
Col %
Homeschool
Count
Col %
Other
Whattype ofhighschooldid youattend?
Fall2003
Count
Col %
Hawaiipublic
Count
Col %
Hawaiiprivate
Count
Col %
Mainlandpublic
Count
Col %
Mainlandprivate
Count
Col %
International
Count
Col %
Homeschool
Count
Col %
Other
Whattype ofhighschooldid youattend?
Fall2004
Count
Col %
Hawaiipublic
Count
Col %
Hawaiiprivate
Count
Col %
Mainlandpublic
Count
Col %
Mainlandprivate
Count
Col %
International
Count
Col %
Homeschool
Count
Col %
Other
Whattype ofhighschooldid youattend?
Fall2005
EnteringStudentCohort
D C C+ B- B B+ A- A
What was your average grade in high school?
Lynne Stamoulis, Ed.D. 28

In Fall of 2005, incoming transfer students claimed higher grades in high school English classes than incoming first-time freshmen.
63.4% of incoming transfer students said their average grade in high school English was a B+ or higher, compared to 56.7% of incoming first-time freshmen.
What was your average grade in your high school English classes?
10 8 12 23 48 42 60 59
3.8% 3.1% 4.6% 8.8% 18.3% 16.0% 22.9% 22.5%
1 9 12 11 28 29 34 39
.6% 5.5% 7.4% 6.7% 17.2% 17.8% 20.9% 23.9%
1 10 15 15 49 53 55 41
.4% 4.2% 6.3% 6.3% 20.5% 22.2% 23.0% 17.2%
1 6 9 14 29 36 34 49
.6% 3.4% 5.1% 7.9% 16.3% 20.2% 19.1% 27.5%
1 1 7 30 55 42 49 45
.4% .4% 3.0% 13.0% 23.9% 18.3% 21.3% 19.6%
2 14 15 9 32 43 36 31
1.1% 7.7% 8.2% 4.9% 17.6% 23.6% 19.8% 17.0%
9 10 18 46 34 35 40
4.7% 5.2% 9.4% 24.0% 17.7% 18.2% 20.8%
6 11 8 24 27 25 33
4.5% 8.2% 6.0% 17.9% 20.1% 18.7% 24.6%
Count
Col %
First-timefreshman
Count
Col %
Transferstudent
Are you a first timefreshman or atransfer student?
Fall2002
Count
Col %
First-timefreshman
Count
Col %
Transferstudent
Are you a first timefreshman or atransfer student?
Fall2003
Count
Col %
First-timefreshman
Count
Col %
Transferstudent
Are you a first timefreshman or atransfer student?
Fall2004
Count
Col %
First-timefreshman
Count
Col %
Transferstudent
Are you a first timefreshman or atransfer student?
Fall2005
EnteringStudentCohort
D C C+ B- B B+ A- A
What was your average grade in your high school English classes?
Lynne Stamoulis, Ed.D. 29

What was your average grade in your high school English classes?
3 11 14 20 50 31 46 41
1.4% 5.1% 6.5% 9.3% 23.1% 14.4% 21.3% 19.0%
2 2 1 4 9 7 8 7
5.0% 5.0% 2.5% 10.0% 22.5% 17.5% 20.0% 17.5%
2 6 8 13 23 28 36
1.7% 5.2% 6.9% 11.2% 19.8% 24.1% 31.0%
2 1 1 1 2 4 3 3
11.8% 5.9% 5.9% 5.9% 11.8% 23.5% 17.6% 17.6%
1 1 2 6 5 7
4.5% 4.5% 9.1% 27.3% 22.7% 31.8%
2 1 2 1 3 8
11.8% 5.9% 11.8% 5.9% 17.6% 47.1%
6 12 14 37 32 28 24
3.9% 7.8% 9.2% 24.2% 20.9% 18.3% 15.7%
1 1 3 5 6 3 4
4.3% 4.3% 13.0% 21.7% 26.1% 13.0% 17.4%
2 4 8 12 21 36 47 40
1.2% 2.4% 4.7% 7.1% 12.4% 21.2% 27.6% 23.5%
1 1 5 3 4 6
5.0% 5.0% 25.0% 15.0% 20.0% 30.0%
2 3 5 4 8 7 15
4.5% 6.8% 11.4% 9.1% 18.2% 15.9% 34.1%
1 2 2 2 7
7.1% 14.3% 14.3% 14.3% 50.0%
1 1 5 3 5 3
5.6% 5.6% 27.8% 16.7% 27.8% 16.7%
6 9 15 42 33 37 24
3.6% 5.4% 9.0% 25.3% 19.9% 22.3% 14.5%
1 2 4 8 9 8 7 2
2.4% 4.9% 9.8% 19.5% 22.0% 19.5% 17.1% 4.9%
1 6 7 10 34 37 39 45
.6% 3.4% 3.9% 5.6% 19.0% 20.7% 21.8% 25.1%
1 1 2 9 6 7
3.8% 3.8% 7.7% 34.6% 23.1% 26.9%
1 3 1 3 4 7
5.3% 15.8% 5.3% 15.8% 21.1% 36.8%
1 2 2
20.0% 40.0% 40.0%
1 1 2 5 7 1 1
5.6% 5.6% 11.1% 27.8% 38.9% 5.6% 5.6%
4 12 20 29 30 23 22
2.9% 8.6% 14.3% 20.7% 21.4% 16.4% 15.7%
3 2 3 7 10 8 4
8.1% 5.4% 8.1% 18.9% 27.0% 21.6% 10.8%
7 4 3 23 18 19 28
6.9% 3.9% 2.9% 22.5% 17.6% 18.6% 27.5%
3 3 2
37.5% 37.5% 25.0%
1 3 1 6 7
5.6% 16.7% 5.6% 33.3% 38.9%
2 1 3 4
20.0% 10.0% 30.0% 40.0%
4 2 2 5
30.8% 15.4% 15.4% 38.5%
Count
Col %
Hawaiipublic
Count
Col %
Hawaiiprivate
Count
Col %
Mainlandpublic
Count
Col %
Mainlandprivate
Count
Col %
International
Count
Col %
Other
Whattype ofhighschooldid youattend?
Fall2002
Count
Col %
Hawaiipublic
Count
Col %
Hawaiiprivate
Count
Col %
Mainlandpublic
Count
Col %
Mainlandprivate
Count
Col %
International
Count
Col %
Homeschool
Count
Col %
Other
Whattype ofhighschooldid youattend?
Fall2003
Count
Col %
Hawaiipublic
Count
Col %
Hawaiiprivate
Count
Col %
Mainlandpublic
Count
Col %
Mainlandprivate
Count
Col %
International
Count
Col %
Homeschool
Count
Col %
Other
Whattype ofhighschooldid youattend?
Fall2004
Count
Col %
Hawaiipublic
Count
Col %
Hawaiiprivate
Count
Col %
Mainlandpublic
Count
Col %
Mainlandprivate
Count
Col %
International
Count
Col %
Homeschool
Count
Col %
Other
Whattype ofhighschooldid youattend?
Fall2005
EnteringStudentCohort
D C C+ B- B B+ A- A
What was your average grade in your high school English classes?
Lynne Stamoulis, Ed.D. 30

In 2005, just over half of both incoming first-time freshmen and incoming transfer students claimed an average grade in high school English of B+ or higher. However, almost twice as many incoming transfer students claimed to have gotten an average English grade of A.
In 2005, 53.5% of incoming first-time freshmen and 53.7% of incoming transfer students said
they had average high school English grades of B+ or higher. 27.5% of incoming transfer students claimed an A-average in English, compared to only
15.7% of incoming first-time freshmen.
In Fall 2002, there were significant differences between first-time freshmen and transfer students in the writing skills they developed in high school. By Fall 2005, that gap had narrowed.
In Fall 2002, 90.5% of first time freshmen said they had learned to write a research paper in high school English, compared to 81.8% of incoming transfer students; 94.7% of first-time freshmen said they had learned to write essays, compared to 85.5% of incoming transfer students. By Fall 2005 the differences between first-time freshmen and incoming transfer students had
narrowed: 88.6% of first time freshmen said they had learned to write research papers, compared to 83% of incoming transfers, and 94.8% of first-time freshmen said they learned to write essays, compared to 91.8% of incoming transfers.
What did you learn in high school English?
237 25 248 14
90.5% 9.5% 94.7% 5.3%
135 30 142 24
81.8% 18.2% 85.5% 14.5%
209 28 224 13
88.2% 11.8% 94.5% 5.5%
141 36 154 23
79.7% 20.3% 87.0% 13.0%
209 17 223 6
92.5% 7.5% 97.4% 2.6%
155 26 165 13
85.6% 14.4% 92.7% 7.3%
171 22 183 10
88.6% 11.4% 94.8% 5.2%
112 23 123 11
83.0% 17.0% 91.8% 8.2%
Count
Col %
First-timefreshman
Count
Col %
Transferstudent
Are you a first timefreshman or atransfer student?
Fall2002
Count
Col %
First-timefreshman
Count
Col %
Transferstudent
Are you a first timefreshman or atransfer student?
Fall2003
Count
Col %
First-timefreshman
Count
Col %
Transferstudent
Are you a first timefreshman or atransfer student?
Fall2004
Count
Col %
First-timefreshman
Count
Col %
Transferstudent
Are you a first timefreshman or atransfer student?
Fall2005
EnteringStudentCohort
Yes No
Did you learnhow to write a
researchpaper in high
schoolEnglish?
Yes No
Did you learnto write essaysin high school
English?
Consistently over the last four years, incoming transfer students report reading more books on their own than incoming first-time freshmen. In Fall 2005, more than three out of ten first-time freshmen and two out of ten transfer students said they read no books on their own in average month.
Lynne Stamoulis, Ed.D. 31

In Fall 2005, 26.1% of incoming transfer students said they read at least three books on their own in an average month, compared to only 18.1% of incoming first-time freshmen. 34.2% of incoming freshmen and 21.6% of incoming transfer students said they didn’t read
any books on their own in an average month.
About how many books do you read on your own in an average month?
74 130 40 18
28.2% 49.6% 15.3% 6.9%
27 94 28 17
16.3% 56.6% 16.9% 10.2%
56 130 33 18
23.6% 54.9% 13.9% 7.6%
31 110 31 12
16.8% 59.8% 16.8% 6.5%
69 121 28 16
29.5% 51.7% 12.0% 6.8%
35 104 29 13
19.3% 57.5% 16.0% 7.2%
66 92 28 7
34.2% 47.7% 14.5% 3.6%
29 70 21 14
21.6% 52.2% 15.7% 10.4%
Count
Col %
First-timefreshman
Count
Col %
Transferstudent
Are you a first timefreshman or atransfer student?
Fall2002
Count
Col %
First-timefreshman
Count
Col %
Transferstudent
Are you a first timefreshman or atransfer student?
Fall2003
Count
Col %
First-timefreshman
Count
Col %
Transferstudent
Are you a first timefreshman or atransfer student?
Fall2004
Count
Col %
First-timefreshman
Count
Col %
Transferstudent
Are you a first timefreshman or atransfer student?
Fall2005
EnteringStudentCohort
None One to two Three to five More than five
About how many books do you read on your own in anaverage month?
Overall, the life goals valued most by UH Hilo incoming students are being well off financially, helping others who are in difficulty and raising a family. The goals given least importance are influencing the political structure, becoming a community leader, and helping to clean up the environment.
In Fall 2005, 82.4% of incoming students said being financially well-off was very important or essential, 76.2% said that helping others who were in difficulty was very important or essential, and 68.8% said it was a very important or essential life goal for them to raise a family.
Only 24% of incoming students said it was very important or essential to influence the political
structure, Only 36.3% said it was very important or essential to become a community leader, and Only 39.3% said it was very important or essential to help clean up the environment.
Lynne Stamoulis, Ed.D. 32

How important are the following life goals to you?
46 10.6% 34 7.1% 41 8.6% 33 9.9%
149 34.2% 157 32.8% 153 32.2% 108 32.4%
145 33.3% 176 36.8% 166 34.9% 117 35.1%
96 22.0% 111 23.2% 115 24.2% 75 22.5%
145 33.1% 165 34.6% 150 31.8% 100 29.9%
204 46.6% 209 43.8% 185 39.2% 154 46.1%
67 15.3% 69 14.5% 93 19.7% 56 16.8%
22 5.0% 34 7.1% 44 9.3% 24 7.2%
42 9.6% 55 11.6% 59 12.5% 41 12.2%
87 19.8% 90 18.9% 110 23.4% 64 19.0%
130 29.6% 140 29.5% 124 26.3% 87 25.9%
180 41.0% 190 40.0% 178 37.8% 144 42.9%
13 3.0% 11 2.3% 17 3.6% 6 1.8%
77 17.5% 75 15.9% 78 16.4% 53 15.8%
147 33.4% 166 35.1% 149 31.3% 111 33.1%
203 46.1% 221 46.7% 232 48.7% 165 49.3%
6 1.4% 3 .6% 8 1.7% 8 2.4%
104 23.7% 121 25.6% 127 27.0% 71 21.3%
205 46.7% 194 41.1% 183 38.9% 157 47.1%
124 28.2% 154 32.6% 152 32.3% 97 29.1%
76 17.3% 83 17.6% 71 14.9% 50 14.9%
172 39.2% 176 37.3% 175 36.8% 136 40.6%
110 25.1% 128 27.1% 116 24.4% 91 27.2%
81 18.5% 85 18.0% 113 23.8% 58 17.3%
87 19.8% 100 21.3% 95 20.2% 61 18.1%
153 34.9% 122 26.0% 147 31.2% 117 34.7%
111 25.3% 131 27.9% 114 24.2% 77 22.8%
88 20.0% 116 24.7% 115 24.4% 82 24.3%
53 12.1% 37 7.9% 47 9.9% 37 11.0%
220 50.1% 206 44.1% 202 42.7% 167 49.7%
114 26.0% 143 30.6% 149 31.5% 91 27.1%
52 11.8% 81 17.3% 75 15.9% 41 12.2%
33 7.5% 47 10.1% 28 6.0% 23 6.9%
148 33.8% 124 26.6% 112 23.8% 110 32.8%
123 28.1% 148 31.7% 141 30.0% 123 36.7%
134 30.6% 148 31.7% 189 40.2% 79 23.6%
41 9.4% 46 9.8% 40 8.5% 28 8.4%
174 39.7% 154 32.9% 151 32.1% 126 37.7%
130 29.7% 176 37.6% 166 35.2% 128 38.3%
93 21.2% 92 19.7% 114 24.2% 52 15.6%
104 23.7% 108 23.0% 97 20.5% 69 20.5%
176 40.2% 186 39.7% 200 42.3% 145 43.2%
95 21.7% 131 27.9% 108 22.8% 79 23.5%
63 14.4% 44 9.4% 68 14.4% 43 12.8%
86 19.7% 79 16.9% 77 16.6% 58 17.3%
135 30.9% 156 33.3% 143 30.8% 102 30.4%
96 22.0% 111 23.7% 84 18.1% 93 27.7%
120 27.5% 122 26.1% 160 34.5% 83 24.7%
Not important
Somewhat important
Very important
Essential
Become anauthority inmy field
Not important
Somewhat important
Very important
Essential
Influence thepoliticalstructure
Not important
Somewhat important
Very important
Essential
Raise a family
Not important
Somewhat important
Very important
Essential
Be financiallywell off
Not important
Somewhat important
Very important
Essential
Help otherswho are indifficulty
Not important
Somewhat important
Very important
Essential
Do creativework
Not important
Somewhat important
Very important
Essential
Becomesuccessful inmy ownbusiness
Not important
Somewhat important
Very important
Essential
Help clean uptheenvironment
Not important
Somewhat important
Very important
Essential
Developing ameaningfulphilosophy
Not important
Somewhat important
Very important
Essential
Promote racialunderstanding
Not important
Somewhat important
Very important
Essential
Become acommunityleader
Not important
Somewhat important
Very important
Essential
Become morespiritual
Count Col %
Fall 2002
Count Col %
Fall 2003
Count Col %
Fall 2004
Count Col %
Fall 2005
Entering Student Cohort
Lynne Stamoulis, Ed.D. 33

However, incoming first-time freshmen and transfer students differ significantly in the importance they assign to various life goals. Incoming transfer students are less interested than incoming freshmen in being financially well-off and raising a family (perhaps some of them already have families), and more interested in doing creative work, helping to clean up the environment, developing a meaningful philosophy, promoting racial understanding and becoming more spiritual.
76.3% of incoming transfer students said it was very important or essential to them to be financially well off, compared to 86.9% of incoming first-time freshmen. 65.1% of incoming transfer students said raising a family was very important or essential to
them, compared to 70.7% of incoming first-time freshmen. 53.8% of incoming transfer students said it was very important or essential to do creative
work, compared to 37.9% of incoming first-time freshmen, 42.4% of incoming transfer students said it was very important or essential to help clean up
the environment, compared to 37.1% of incoming first-time freshmen, 66% of incoming transfer students said it was very important or essential to develop a
meaningful philosophy of life, compared to 54.8% of first-time freshmen, 60% said it was very important or essential to promote racial understanding, compared to
49.7% of first-time freshmen, and 57.5% of incoming transfer students said it was very important or essential to become more
spiritual, compared to 48.6% of incoming first-time freshmen.
How important are the following life goals to you?
31 12.1% 13 8.0% 15 6.1% 15 8.2% 21 8.9% 14 7.8% 16 8.5% 14 10.7%
97 37.7% 47 28.8% 84 34.1% 58 31.7% 80 33.9% 57 31.8% 57 30.2% 45 34.4%
86 33.5% 55 33.7% 95 38.6% 62 33.9% 92 39.0% 57 31.8% 75 39.7% 40 30.5%
43 16.7% 48 29.4% 52 21.1% 48 26.2% 43 18.2% 51 28.5% 41 21.7% 32 24.4%
101 39.0% 38 23.3% 90 36.6% 56 30.8% 84 35.6% 50 28.4% 59 31.1% 35 26.7%
120 46.3% 81 49.7% 110 44.7% 85 46.7% 97 41.1% 64 36.4% 84 44.2% 63 48.1%
30 11.6% 31 19.0% 33 13.4% 24 13.2% 33 14.0% 47 26.7% 39 20.5% 17 13.0%
8 3.1% 13 8.0% 13 5.3% 17 9.3% 22 9.3% 15 8.5% 8 4.2% 16 12.2%
23 8.8% 19 11.7% 26 10.6% 22 12.0% 28 11.9% 22 12.5% 17 8.9% 24 18.2%
64 24.6% 21 12.9% 38 15.5% 39 21.3% 63 26.8% 35 19.9% 39 20.4% 22 16.7%
81 31.2% 47 28.8% 77 31.4% 54 29.5% 63 26.8% 44 25.0% 54 28.3% 30 22.7%
92 35.4% 76 46.6% 104 42.4% 68 37.2% 81 34.5% 75 42.6% 81 42.4% 56 42.4%
8 3.1% 5 3.0% 3 1.2% 5 2.8% 7 3.0% 9 5.1% 3 1.6% 3 2.3%
37 14.2% 38 23.2% 24 9.9% 44 24.3% 34 14.3% 36 20.2% 22 11.5% 28 21.4%
91 35.0% 53 32.3% 86 35.4% 61 33.7% 78 32.9% 47 26.4% 54 28.3% 52 39.7%
124 47.7% 68 41.5% 130 53.5% 71 39.2% 118 49.8% 86 48.3% 112 58.6% 48 36.6%
4 1.5% 1 .6% 1 .4% 2 1.1% 4 1.7% 2 1.1% 3 1.6% 5 3.8%
72 27.8% 29 17.7% 52 21.4% 51 28.3% 67 28.6% 49 28.0% 43 22.8% 24 18.3%
120 46.3% 81 49.4% 107 44.0% 68 37.8% 92 39.3% 62 35.4% 93 49.2% 61 46.6%
63 24.3% 53 32.3% 83 34.2% 59 32.8% 71 30.3% 62 35.4% 50 26.5% 41 31.3%
55 21.2% 21 12.9% 37 15.2% 37 20.4% 42 17.9% 22 12.3% 29 15.3% 18 13.6%
107 41.2% 59 36.2% 104 42.8% 58 32.0% 90 38.3% 65 36.3% 89 46.8% 43 32.6%
67 25.8% 37 22.7% 60 24.7% 53 29.3% 55 23.4% 43 24.0% 47 24.7% 42 31.8%
31 11.9% 46 28.2% 42 17.3% 33 18.2% 48 20.4% 49 27.4% 25 13.2% 29 22.0%
Not important
Somewhat important
Very important
Essential
Become anauthority inmy field
Not important
Somewhat important
Very important
Essential
Influence thepoliticalstructure
Not important
Somewhat important
Very important
Essential
Raise a family
Not important
Somewhat important
Very important
Essential
Be financiallywell off
Not important
Somewhat important
Very important
Essential
Help otherswho are indifficulty
Not important
Somewhat important
Very important
Essential
Do creativework
Count Col %
First-timefreshman
Count Col %
Transferstudent
Are you a first time freshman ora transfer student?
Fall 2002
Count Col %
First-timefreshman
Count Col %
Transferstudent
Are you a first time freshman ora transfer student?
Fall 2003
Count Col %
First-timefreshman
Count Col %
Transferstudent
Are you a first time freshman ora transfer student?
Fall 2004
Count Col %
First-timefreshman
Count Col %
Transferstudent
Are you a first time freshman ora transfer student?
Fall 2005
Entering Student Cohort
Lynne Stamoulis, Ed.D. 34

How important are the following life goals to you?
54 20.8% 31 19.0% 54 22.2% 36 20.1% 43 18.3% 43 24.4% 36 18.8% 23 17.3%
97 37.3% 52 31.9% 60 24.7% 46 25.7% 71 30.2% 52 29.5% 62 32.5% 49 36.8%
62 23.8% 43 26.4% 64 26.3% 57 31.8% 68 28.9% 33 18.8% 44 23.0% 31 23.3%
47 18.1% 37 22.7% 65 26.7% 40 22.3% 53 22.6% 48 27.3% 49 25.7% 30 22.6%
40 15.4% 13 8.0% 21 8.8% 11 6.1% 25 10.6% 16 9.1% 23 12.0% 11 8.3%
135 51.9% 75 46.0% 116 48.7% 70 38.7% 109 46.4% 68 38.6% 97 50.8% 65 49.2%
61 23.5% 48 29.4% 70 29.4% 62 34.3% 69 29.4% 59 33.5% 52 27.2% 35 26.5%
24 9.2% 27 16.6% 31 13.0% 38 21.0% 32 13.6% 33 18.8% 19 9.9% 21 15.9%
24 9.3% 8 4.9% 28 11.7% 12 6.7% 17 7.2% 8 4.6% 17 8.9% 6 4.5%
104 40.2% 40 24.5% 74 30.8% 42 23.5% 64 27.2% 39 22.3% 69 36.3% 39 29.5%
73 28.2% 47 28.8% 77 32.1% 56 31.3% 75 31.9% 48 27.4% 63 33.2% 53 40.2%
58 22.4% 68 41.7% 61 25.4% 69 38.5% 79 33.6% 80 45.7% 41 21.6% 34 25.8%
31 12.0% 9 5.5% 25 10.5% 16 8.8% 23 9.8% 15 8.5% 17 8.9% 10 7.7%
113 43.6% 55 33.7% 80 33.5% 62 34.1% 83 35.5% 48 27.1% 79 41.4% 42 32.3%
74 28.6% 51 31.3% 94 39.3% 62 34.1% 74 31.6% 71 40.1% 70 36.6% 52 40.0%
41 15.8% 48 29.4% 40 16.7% 42 23.1% 54 23.1% 43 24.3% 25 13.1% 26 20.0%
70 27.0% 29 17.8% 56 23.0% 42 23.5% 50 21.1% 34 19.3% 41 21.5% 24 18.2%
106 40.9% 67 41.1% 99 40.7% 66 36.9% 103 43.5% 76 43.2% 83 43.5% 57 43.2%
58 22.4% 32 19.6% 68 28.0% 53 29.6% 51 21.5% 40 22.7% 43 22.5% 33 25.0%
25 9.7% 35 21.5% 20 8.2% 18 10.1% 33 13.9% 26 14.8% 24 12.6% 18 13.6%
64 24.8% 21 12.9% 42 17.5% 24 13.4% 40 17.4% 26 14.9% 35 18.3% 21 15.9%
88 34.1% 44 27.0% 83 34.6% 62 34.6% 88 38.3% 42 24.1% 63 33.0% 35 26.5%
54 20.9% 38 23.3% 56 23.3% 41 22.9% 39 17.0% 33 19.0% 57 29.8% 32 24.2%
52 20.2% 60 36.8% 59 24.6% 52 29.1% 63 27.4% 73 42.0% 36 18.8% 44 33.3%
Not important
Somewhat important
Very important
Essential
Becomesuccessful inmy ownbusiness
Not important
Somewhat important
Very important
Essential
Help clean uptheenvironment
Not important
Somewhat important
Very important
Essential
Developing ameaningfulphilosophy
Not important
Somewhat important
Very important
Essential
Promoteracialunderstanding
Not important
Somewhat important
Very important
Essential
Become acommunityleader
Not important
Somewhat important
Very important
Essential
Become morespiritual
Count Col %
First-timefreshman
Count Col %
Transferstudent
Are you a first time freshman ora transfer student?
Fall 2002
Count Col %
First-timefreshman
Count Col %
Transferstudent
Are you a first time freshman ora transfer student?
Fall 2003
Count Col %
First-timefreshman
Count Col %
Transferstudent
Are you a first time freshman ora transfer student?
Fall 2004
Count Col %
First-timefreshman
Count Col %
Transferstudent
Are you a first time freshman ora transfer student?
Fall 2005
Entering Student Cohort
Eight out of ten incoming students say they would have access to a computer at the place they planned to live while attending UH Hilo, leaving about two out of ten who say either they do not have such access or that they do not know if they will have access.
Lynne Stamoulis, Ed.D. 35

Will you have access to a home computer at the place you plan to live?
193 21 42
75.4% 8.2% 16.4%
129 23 9
80.1% 14.3% 5.6%
176 23 40
73.6% 9.6% 16.7%
126 30 28
68.5% 16.3% 15.2%
164 14 32
78.1% 6.7% 15.2%
124 22 22
73.8% 13.1% 13.1%
156 17 20
80.8% 8.8% 10.4%
106 12 12
81.5% 9.2% 9.2%
Count
Col %
First-time freshman
Count
Col %
Transfer student
Are you a firsttime freshmanor a transferstudent?
Fall2002
Count
Col %
First-time freshman
Count
Col %
Transfer student
Are you a firsttime freshmanor a transferstudent?
Fall2003
Count
Col %
First-time freshman
Count
Col %
Transfer student
Are you a firsttime freshmanor a transferstudent?
Fall2004
Count
Col %
First-time freshman
Count
Col %
Transfer student
Are you a firsttime freshmanor a transferstudent?
Fall2005
EnteringStudentCohort
Yes No Do not know
Will you have access to ahome computer at the place
you will be living?
In Fall 2005, a greater proportion of incoming first-time freshmen than incoming transfer students said there was a good chance they would change their major, transfer to another college and become close with other students. A higher proportion of incoming transfer students said there was a good chance they would earn at least a B average, need more time to finish school, get a bachelors degree and be satisfied with their college.
41.9% of incoming first-time freshmen said there was some or a good chance of changing their major, compared to 31.8% of incoming transfer students, 53.1% of first-time freshmen said there was some or a good chance of transferring to another
college, compared to 31.3% of incoming transfer students, and 67.2% of incoming freshmen said there was a good chance of their becoming close with other
students, compared to only 50.8% of incoming transfer students.
66.2% of incoming transfer students said there was a good chance of their earning at least a B average, compared to 43.7% of incoming first-time freshmen, 64.7% said there was some or a good chance they would need more time to finish school,
compared to 52.7% of incoming first-time freshmen, 83.8% said there was a good chance they would get a bachelors degree, compared to 69.7%
of first-time freshmen, and 56.2% said there was a good chance they would be satisfied with their college, compared to
42.6% of incoming first-time freshmen.
Lynne Stamoulis, Ed.D. 36

What is the likelihood that you will...
25 9.8% 51 31.9% 34 15.0% 43 25.6% 30 14.2% 49 31.4% 26 13.6% 35 27.1%
93 36.6% 69 43.1% 84 37.2% 76 45.2% 77 36.5% 57 36.5% 85 44.5% 53 41.1%
96 37.8% 31 19.4% 75 33.2% 32 19.0% 77 36.5% 39 25.0% 59 30.9% 32 24.8%
40 15.7% 9 5.6% 33 14.6% 17 10.1% 27 12.8% 11 7.1% 21 11.0% 9 7.0%
24 9.5% 39 24.4% 36 15.1% 33 18.8% 27 12.2% 30 18.3% 19 9.9% 25 19.4%
87 34.5% 63 39.4% 81 33.9% 66 37.5% 75 33.8% 65 39.6% 82 42.9% 48 37.2%
106 42.1% 49 30.6% 98 41.0% 61 34.7% 95 42.8% 60 36.6% 67 35.1% 45 34.9%
35 13.9% 9 5.6% 24 10.0% 16 9.1% 25 11.3% 9 5.5% 23 12.0% 11 8.5%
15 5.9% 11 6.9% 15 6.2% 10 5.6% 9 4.0% 15 8.9% 3 1.6% 5 3.8%
26 10.2% 27 16.9% 33 13.6% 22 12.2% 38 16.8% 17 10.1% 22 11.5% 14 10.7%
77 30.3% 42 26.3% 79 32.6% 49 27.2% 69 30.5% 45 26.8% 57 29.8% 43 32.8%
136 53.5% 80 50.0% 115 47.5% 99 55.0% 110 48.7% 91 54.2% 109 57.1% 69 52.7%
4 2.5% 2 .8% 1 .6% 1 .4% 4 2.4% 2 1.1% 2 1.5%
11 4.4% 6 3.8% 11 4.5% 9 5.0% 15 6.6% 6 3.6% 8 4.2% 4 3.1%
109 43.3% 48 30.0% 117 48.1% 54 30.2% 92 40.7% 43 25.4% 97 51.1% 38 29.2%
132 52.4% 102 63.8% 113 46.5% 115 64.2% 118 52.2% 116 68.6% 83 43.7% 86 66.2%
18 7.2% 9 5.6% 21 8.5% 14 7.9% 28 12.4% 13 7.6% 14 7.4% 8 6.2%
95 37.8% 47 29.4% 96 39.0% 48 27.0% 95 42.2% 47 27.5% 75 39.9% 38 29.2%
117 46.6% 69 43.1% 106 43.1% 87 48.9% 81 36.0% 78 45.6% 80 42.6% 60 46.2%
21 8.4% 35 21.9% 23 9.3% 29 16.3% 21 9.3% 33 19.3% 19 10.1% 24 18.5%
1 .4% 5 3.1% 4 1.6% 1 .6% 4 1.8% 3 1.7% 2 1.5%
6 2.4% 8 5.0% 8 3.3% 4 2.2% 12 5.3% 9 5.2% 8 4.3% 5 3.8%
67 26.6% 13 8.1% 49 19.9% 29 16.1% 44 19.5% 26 15.1% 49 26.1% 14 10.8%
178 70.6% 134 83.8% 185 75.2% 146 81.1% 166 73.5% 134 77.9% 131 69.7% 109 83.8%
30 11.9% 65 40.6% 46 18.7% 53 29.6% 33 14.4% 63 36.6% 23 12.1% 51 39.8%
75 29.8% 50 31.3% 75 30.5% 60 33.5% 73 31.9% 60 34.9% 66 34.7% 37 28.9%
93 36.9% 26 16.3% 80 32.5% 36 20.1% 84 36.7% 28 16.3% 58 30.5% 23 18.0%
54 21.4% 19 11.9% 45 18.3% 30 16.8% 39 17.0% 21 12.2% 43 22.6% 17 13.3%
1 .4% 4 2.5% 2 .8% 6 2.6% 5 2.9% 1 .5% 3 2.3%
16 6.3% 9 5.6% 12 4.8% 8 4.5% 23 10.1% 8 4.6% 8 4.3% 5 3.8%
132 52.4% 67 41.9% 115 46.2% 75 41.9% 99 43.4% 67 38.7% 99 52.7% 49 37.7%
103 40.9% 80 50.0% 120 48.2% 96 53.6% 100 43.9% 93 53.8% 80 42.6% 73 56.2%
3 1.9% 2 1.1% 4 1.7% 3 1.7% 1 .8%
9 3.6% 11 6.9% 6 2.4% 3 1.7% 9 3.9% 10 5.7% 3 1.6% 13 10.0%
94 37.3% 62 38.8% 79 31.6% 67 37.2% 80 34.5% 62 35.6% 59 31.2% 50 38.5%
149 59.1% 84 52.5% 165 66.0% 108 60.0% 139 59.9% 99 56.9% 127 67.2% 66 50.8%
1 .4% 3 1.9% 1 .4% 2 1.1% 1 .6% 2 1.6%
8 3.2% 6 3.8% 6 2.4% 1 .6% 11 4.7% 2 1.1% 6 3.2% 6 4.7%
49 19.4% 30 18.8% 43 17.2% 31 17.2% 44 19.0% 31 17.7% 30 15.9% 20 15.5%
194 77.0% 121 75.6% 200 80.0% 146 81.1% 177 76.3% 141 80.6% 153 81.0% 101 78.3%
No chance
Little chance
Some chance
Good chance
Change yourmajor
No chance
Little chance
Some chance
Good chance
Change yourcareer
No chance
Little chance
Some chance
Good chance
Get a job topay for school
No chance
Little chance
Some chance
Good chance
Earn at leasta B average
No chance
Little chance
Some chance
Good chance
Need moretime to finishschool
No chance
Little chance
Some chance
Good chance
Get abachelorsdegree
No chance
Little chance
Some chance
Good chance
Transfer toanothercollege
No chance
Little chance
Some chance
Good chance
Be satisfiedwith yourcollege
No chance
Little chance
Some chance
Good chance
Become closewith otherstudents
No chance
Little chance
Some chance
Good chance
Socialize withother racial orethnic groups
Count Col %
First-timefreshman
Count Col %
Transferstudent
Are you a first time freshman ora transfer student?
Fall 2002
Count Col %
First-timefreshman
Count Col %
Transferstudent
Are you a first time freshman ora transfer student?
Fall 2003
Count Col %
First-timefreshman
Count Col %
Transferstudent
Are you a first time freshman ora transfer student?
Fall 2004
Count Col %
First-timefreshman
Count Col %
Transferstudent
Are you a first time freshman ora transfer student?
Fall 2005
Entering Student Cohort
The majority of incoming first-time freshmen (55.6% in Fall 2005) say their primary means of paying their expenses at UH Hilo are their own or family resources. The majority of incoming transfer students (57.9%) report that their primary means of paying their expenses are loans and/or grants.
Lynne Stamoulis, Ed.D. 37

How will you pay for your expenses at UH Hilo?
39 113 70 24 8
15.4% 44.5% 27.6% 9.4% 3.1%
35 48 37 37 4
21.7% 29.8% 23.0% 23.0% 2.5%
17 90 59 49 12
7.5% 39.6% 26.0% 21.6% 5.3%
29 44 37 55 9
16.7% 25.3% 21.3% 31.6% 5.2%
20 91 63 49 3
8.8% 40.3% 27.9% 21.7% 1.3%
31 35 34 63 5
18.5% 20.8% 20.2% 37.5% 3.0%
13 90 44 32 6
7.0% 48.6% 23.8% 17.3% 3.2%
22 25 30 40 4
18.2% 20.7% 24.8% 33.1% 3.3%
Count
Col %
First-timefreshman
Count
Col %
Transferstudent
Are you a first timefreshman or atransfer student?
Fall2002
Count
Col %
First-timefreshman
Count
Col %
Transferstudent
Are you a first timefreshman or atransfer student?
Fall2003
Count
Col %
First-timefreshman
Count
Col %
Transferstudent
Are you a first timefreshman or atransfer student?
Fall2004
Count
Col %
First-timefreshman
Count
Col %
Transferstudent
Are you a first timefreshman or atransfer student?
Fall2005
EnteringStudentCohort
My own resourcesSupport
from family Grants Loans Other
How will you pay for your expenses at UHH?
Although it is more accurate to calculate demographic variables of an entering class from the student information system than a survey, it is interesting to note the changing character of transfer students entering UH Hilo. In Fall 2002, 54.7% of the incoming transfer students were from Hawai’i, compared to only 29.8% from the U.S. mainland or Alaska. By Fall of 2005, incoming transfer students from Hawai’I had dropped by 14%.
In Fall 2002, 54.7% of incoming transfer students were from the state of Hawai’i, compared to only 40.6% in the Fall of 2005.
Lynne Stamoulis, Ed.D. 38

How will you pay for your expenses at UH Hilo?
128 58.4% 91 64.5% 157 70.1% 92 56.8% 106 53.0% 101 62.7% 102 58.6% 66 59.5%
91 41.6% 50 35.5% 67 29.9% 70 43.2% 94 47.0% 60 37.3% 72 41.4% 45 40.5%
242 95.3% 126 78.8% 233 97.1% 155 85.6% 203 91.4% 133 76.0% 191 99.5% 104 80.0%
7 2.8% 25 15.6% 4 1.7% 17 9.4% 18 8.1% 30 17.1% 16 12.3%
1 .4% 1 .4% 1 .5% 2 1.5%
1 .4% 1 .6% 2 .8% 1 .6% 1 .5% 2 1.1% 2 1.5%
3 1.2% 8 5.0% 8 4.4% 10 5.7% 6 4.6%
48 19.1% 30 18.6% 31 12.8% 25 14.0% 29 12.8% 24 13.8% 30 16.1% 18 14.3%
37 14.7% 21 13.0% 18 7.4% 12 6.7% 27 11.9% 14 8.0% 29 15.6% 8 6.3%
72 28.7% 63 39.1% 109 45.0% 76 42.7% 72 31.9% 79 45.4% 61 32.8% 54 42.9%
14 5.6% 9 5.6% 13 5.4% 18 10.1% 12 5.3% 9 5.2% 9 4.8% 8 6.3%
4 1.6% 2 1.2% 21 8.7% 6 3.4% 21 9.3% 8 4.6% 16 8.6% 5 4.0%
48 19.1% 22 13.7% 2 .8% 1 .6% 5 2.2% 1 .6% 2 1.1% 1 .8%
27 10.8% 14 8.7% 31 12.8% 17 9.6% 41 18.1% 27 15.5% 27 14.5% 17 13.5%
1 .4% 17 7.0% 23 12.9% 19 8.4% 12 6.9% 12 6.5% 15 11.9%
166 65.9% 88 54.7% 107 44.8% 67 36.4% 116 51.3% 69 39.2% 125 65.4% 52 40.6%
65 25.8% 48 29.8% 77 32.2% 68 37.0% 76 33.6% 79 44.9% 43 22.5% 52 40.6%
15 6.0% 12 7.5% 39 16.3% 15 8.2% 27 11.9% 17 9.7% 14 7.3% 8 6.3%
6 2.4% 13 8.1% 16 6.7% 34 18.5% 7 3.1% 11 6.3% 9 4.7% 16 12.5%
Male
Female
What is yourgender?
Never married
Married
Widowed
Separated
Divorced
What is yourmaritalstatus?
Hawaiian or part Hawaiian
Japanese
Caucasian/Portuguese
Pacific Islander
Fillipino
Chinese
Mixed
Other
What is yourethnicbackground?
US citizen from Hawaii
US citizen from other state
Permanent US resident
International student
Which bestdescribesyour currentstatus?
Count Col %
First-timefreshman
Count Col %
Transferstudent
Are you a first time freshman ora transfer student?
Fall 2002
Count Col %
First-timefreshman
Count Col %
Transferstudent
Are you a first time freshman ora transfer student?
Fall 2003
Count Col %
First-timefreshman
Count Col %
Transferstudent
Are you a first time freshman ora transfer student?
Fall 2004
Count Col %
First-timefreshman
Count Col %
Transferstudent
Are you a first time freshman ora transfer student?
Fall 2005
Entering Student Cohort
Lynne Stamoulis, Ed.D. 39Lynne Stamoulis, Ed.D. 39
How will you pay for your expenses at UH Hilo?
128 58.4% 91 64.5% 157 70.1% 92 56.8% 106 53.0% 101 62.7% 102 58.6% 66 59.5%
91 41.6% 50 35.5% 67 29.9% 70 43.2% 94 47.0% 60 37.3% 72 41.4% 45 40.5%
242 95.3% 126 78.8% 233 97.1% 155 85.6% 203 91.4% 133 76.0% 191 99.5% 104 80.0%
7 2.8% 25 15.6% 4 1.7% 17 9.4% 18 8.1% 30 17.1% 16 12.3%
1 .4% 1 .4% 1 .5% 2 1.5%
1 .4% 1 .6% 2 .8% 1 .6% 1 .5% 2 1.1% 2 1.5%
3 1.2% 8 5.0% 8 4.4% 10 5.7% 6 4.6%
48 19.1% 30 18.6% 31 12.8% 25 14.0% 29 12.8% 24 13.8% 30 16.1% 18 14.3%
37 14.7% 21 13.0% 18 7.4% 12 6.7% 27 11.9% 14 8.0% 29 15.6% 8 6.3%
72 28.7% 63 39.1% 109 45.0% 76 42.7% 72 31.9% 79 45.4% 61 32.8% 54 42.9%
14 5.6% 9 5.6% 13 5.4% 18 10.1% 12 5.3% 9 5.2% 9 4.8% 8 6.3%
4 1.6% 2 1.2% 21 8.7% 6 3.4% 21 9.3% 8 4.6% 16 8.6% 5 4.0%
48 19.1% 22 13.7% 2 .8% 1 .6% 5 2.2% 1 .6% 2 1.1% 1 .8%
27 10.8% 14 8.7% 31 12.8% 17 9.6% 41 18.1% 27 15.5% 27 14.5% 17 13.5%
1 .4% 17 7.0% 23 12.9% 19 8.4% 12 6.9% 12 6.5% 15 11.9%
166 65.9% 88 54.7% 107 44.8% 67 36.4% 116 51.3% 69 39.2% 125 65.4% 52 40.6%
65 25.8% 48 29.8% 77 32.2% 68 37.0% 76 33.6% 79 44.9% 43 22.5% 52 40.6%
15 6.0% 12 7.5% 39 16.3% 15 8.2% 27 11.9% 17 9.7% 14 7.3% 8 6.3%
6 2.4% 13 8.1% 16 6.7% 34 18.5% 7 3.1% 11 6.3% 9 4.7% 16 12.5%
Male
Female
What is yourgender?
Never married
Married
Widowed
Separated
Divorced
What is yourmaritalstatus?
Hawaiian or part Hawaiian
Japanese
Caucasian/Portuguese
Pacific Islander
Fillipino
Chinese
Mixed
Other
What is yourethnicbackground?
US citizen from Hawaii
US citizen from other state
Permanent US resident
International student
Which bestdescribesyour currentstatus?
Count Col %
First-timefreshman
Count Col %
Transferstudent
Are you a first time freshman ora transfer student?
Fall 2002
Count Col %
First-timefreshman
Count Col %
Transferstudent
Are you a first time freshman ora transfer student?
Fall 2003
Count Col %
First-timefreshman
Count Col %
Transferstudent
Are you a first time freshman ora transfer student?
Fall 2004
Count Col %
First-timefreshman
Count Col %
Transferstudent
Are you a first time freshman ora transfer student?
Fall 2005
Entering Student Cohort