university of helsinki faculty of science career
TRANSCRIPT

1
Eric CarverStrategic Services for Teaching
Tuukka KangasInstitutional Research and Analysis
UNIVERSITY OF HELSINKI FACULTY OF SCIENCE
CAREER MONITORING REPORT –MASTER’S GRADUATES OF
2003–2014

• Accessibility of the report
• Basic information on the career tracking surveys of Finnish universities
• Description of the report
• Results of the career tracking surveys of the University of Helsinki’s graduates in 2003–2014:
• Respondents to the career tracking surveys
• Job market situation of graduates of 2014 five years after graduation
• Key figures after five years in the job market (description of career, entrepreneurial activity, unemployment)
• Correlation between education and employment (association between employment and education level, satisfaction with degree)
• Factors affecting employment as well as professional skills needs
• Thematic analysis: Development of sufficient skills
• Analysis of open-ended responses
• Data supporting the analysis: basic information on the development of the academic job market in the 2000s
• Register-based tracking of employment and the job market situation (Statistics Finland)
2
CONTENTS

ACCESSIBILITY OF THE REPORT
• The graphs in the report are not accessible. However, the data behind all graphs are appended to the final section of the report.
3

CAREER MONITORING AT FINNISH UNIVERSITIES
• Nationwide career monitoring surveys:
• Surveys of master’s graduates five years after graduation
• Surveys of doctoral graduates two or three years after graduation (three years in the most recent surveys)
• The career monitoring group of the Aarresaari network of university career services is responsible for the surveys, while universities are responsible for utilising their data.
• The data on the töissä.fi website are based on career monitoring: https://toissa.fi/home-en-us/.
• Further information on career monitoring: https://www.aarresaari.net/career_monitoring
• The latest career monitoring data on master’s graduates: 2014 graduates (responses October–November 2019)
• The latest career monitoring data on doctoral graduates: 2016 graduates (responses October–November 2019)
30/09/2020 4

Eric Carver
University of Helsinki
Strategic Services for Teaching 5
Assessed against
forecasts
1. Megatrends
2. Future scenarios
3. University´s
own vision for
education
To be analysed in the changing context:Trends in academic education, economic and job market developments, etc.
Cf. course feedback, National Bachelor’s Graduate Survey, HowULearn
2014–2019
Early career of master’s
graduates
(five years after graduation)
200X–2014
Studies at the
University
Autumn
2019
survey
USE OF CAREER MONITORING IN THE DEVELOPMENT OF EDUCATION (E.G., MASTER’S GRADUATE CAREER TRACKING)

DATA COLLECTION IN CAREER MONITORING SURVEYS
• Career monitoring surveys are sent to all graduates in the relevant target group.
• The target group for master’s graduate career monitoring includes all master’s graduates as well as all those with a Bachelor of Science (Pharmacy) degree or a Bachelor of Arts (Education) degree in kindergarten teacher education.
• Doctoral graduate career monitoring surveys are sent to all graduates in the relevant target group.
• Information on the target group is obtained from the national VIRTA database (which combines data from the student records of Finnish universities).
• The background variables of respondents are supplemented with information from the student records (major subject, degree programme, department, faculty).
• Address details are retrieved from the Population Register.
• The 2019 surveys were sent to respondents by text message (to those whose phone number was known) or by mail (all others). Additionally, the universities distributed the survey by email to those in the target group whose details were found in alumni registers.
• The data were collected in a nationwide and central manner by Research Stats Service TUPA of the University of Tampere and CSC – the IT Centre for Science, in collaboration with the career monitoring group of the Aarresaarinetwork.
• Responses are always processed confidentially and so that individual respondents cannot be identified.
6

CAREER MONITORING AT THE UNIVERSITY OF HELSINKI
• The University of Helsinki uses the data obtained from career monitoring surveys, for example, to develop education, guide and counsel students, provide career guidance and conduct research.
• Since 2016, career monitoring surveys have been conducted at the University through cooperation between several units. Career Services was previously responsible for coordinating the surveys, but this responsibility shifted to Strategic Services for Teaching at the beginning of 2019.
• Composition of the University’s project group for career monitoring in the 2019–2020 academic year:
• Eric Carver, Strategic Services for Teaching
• Tuukka Kangas, Institutional Research and Analysis
• Miika Mertanen, Career Services
• Erkki Raulo, Research Services
• Kati Salmivaara, Communications
• Riikka Sarasjärvi, Research Services
• Tarja Tuononen, Centre for University Teaching and Learning
• Minnis Vierikko, Alumni Relations
7

CONTENT OF THE CAREER MONITORING REPORT
• The report focuses on the latest career monitoring survey, conducted in autumn 2019.
• The target group of the nationwide survey consisted of the master’s graduates of 2014 as well as those who completed a Bachelor of Science (Pharmacy) degree or a Bachelor of Arts (Education) degree in kindergarten teacher education in 2014.
• The report also uses the results of previous career monitoring surveys (graduates of 2003–2013) to enable a temporal comparison.
• The results of the University of Helsinki are reported in accordance with the faculty structures that have been in place since early 2017. In practice, this means that psychology and logopedics graduates are included in the results for the Faculty of Medicine, and phonetics and cognition science graduates are included in the results for the Faculty of Arts.
• In comparing faculties, it should also be borne in mind that those who completed a Bachelor of Science (Pharmacy) degree or a Bachelor of Arts (Education) degree in kindergarten teacher education are included in their respective faculties’ results.
• The University-level report compares faculties, while faculty reports compare groups of disciplines within each faculty.
• There were significant differences in the response rates between those who graduated in 2014 from different faculties.
8
NOTES ON THE GRAPHS USED IN THE REPORT
• The graduates’ employer sector and the primary nature of employment are reported using a model in which only the major response options 4–6 are displayed. All other responses are categorised under ‘Other’. This solution makes it easier to interpret the graphs and identify the key response options.
• The University-level report on the career monitoring of master’s graduates mainly uses the results of the latest survey. The faculty reports add up the responses from 2012, 2013 and 2014. This enables more detailed reporting of results in fields with fewer graduates and survey respondents each year.
• In the career-tracking report for doctoral graduates, the graphs for the University and doctoral school levels focus on the responses of the graduates of 2016. The reporting of faculty-level results mainly incorporates the responses of the graduates of 2015–2016.
• In the case of questions with six or seven response options, the responses are reported by classifying them so that options 4-6 (fully agree, agree, slightly agree) are added up. This same principle has also been used for the breakdown of responses to compare faculties and disciplines.
30/09/2020Presentation Name / Firstname Lastname 9

CATEGORIZATION OF RESPONSES
First level categories Second level categories Educational codes Old majors
Physical sciences Physical sciences 742301, 742302, 742303,
742304
Physics, Geophysics, Meteorology,
Space sciences, Astronomy, Theoretical
Philosophy
Chemistry Chemistry 742401 Chemistry
Geography and geology Geology 742501 Geology, Geology and Mineralogy,
Geology and Palaeontology
Geography 742601 Regional Studies, Geography,
Geoinformatics, Planning Geography
Mathematics and statistics
Mathematics 742101 Mathematics, Applied Mathematics,
Mathematics, Subject Teacher Line
Statistics1 742102 Statistics
Computer science Computer science 742201 Bioinformatics, Computer science
Second level categories are only used when responses from several surveys are summed together,1 Also includes Statistics graduates from Faculty of Social Sciences
UNIVERSITY OF HELSINKI CAREER MONITORING REPORT – MASTER’S
GRADUATES OF 2003–2014
Tuukka Kangas
Institutional Research and Analysis
11

LEGEND
Symbol Meaning
Increase, statistically significant
Increase, statistically insignificant
No change
Decrease, statistically insignificant
Decrease, statistically significant

RESPONSE RATES 1/2Year of
graduation(survey conducted)
Biological and
Environmental
Sciences
Veterinary
Medicine Pharmacy Medicine Science
Agriculture and
Forestry
University
total
2003(2008) 83 (71 %) 33 (56 %) 131 (53 %) 116 (63 %) 117 (53 %) 149 (58 %) 1478 (56 %)
2005(2010) 72 (52 %) 30 (63 %) 104 (55 %) 96 (54 %) 83 (43 %) 153 (53 %) 1305 (51 %)
2007(2012) 69 (48 %) 26 (63 %) 100 (47 %) 110 (49 %) 107 (51 %) 170 (53 %) 1425 (50 %)
2009(2014) 29 (54 %) 32 (53 %) 70 (40 %) 75 (38 %) 40 (44 %) 72 (42 %) 794 (45 %)
2011(2016) 39 (36 %) 21 (55 %) 47 (26 %) 63 (30 %) 75 (39 %) 120 (44 %) 917 (38 %)
2012
(2017/18) 65 (52 %) 21 (47 %) 71 (32 %) 68 (32 %) 86 (38 %) 131 (42 %) 1109 (40 %)
2013
(2018) 72 (58 %) 28 (42 %) 70 (34 %) 91 (38 %) 116 (43 %) 132 (42 %) 1242 (42 %)
2014
(2019) 59 (44 %) 26 (44 %) 63 (34 %) 70 (32 %) 106 (43 %) 121 (45 %) 1202 (42 %)
Total489 217 656 689 730 1048 9473
13

RESPONSE RATES 2/2
Year of
graduation(survey conducted) Arts
Educational
Sciences Law Theology Social Sciences University total
2003(2008) 261 (49 %) 243 (63 %) 110 (50 %) 62 (56 %) 173 (52 %) 1478 (56 %)
2005(2010) 217 (48 %) 187 (51 %) 90 (45 %) 85 (52 %) 188 (53 %) 1305 (51 %)
2007(2012) 244 (48 %) 216 (52 %) 111 (42 %) 85 (50 %) 187 (54 %) 1425 (50 %)
2009(2014) 149 (47 %) 115 (48 %) 76 (42 %) 43 (43 %) 93 (48 %) 794 (45 %)
2011(2016) 162 (40 %) 119 (39 %) 82 (34 %) 52 (42 %) 137 (41 %) 917 (38 %)
2012
(2017/18) 214 (43 %) 176 (46 %) 68 (29 %) 65 (42 %) 144 (40 %) 1109 (40 %)
2013
(2018) 239 (42 %) 169 (45 %) 89 (34 %) 70 (42 %) 166 (47 %) 1242 (42 %)
2014
(2019) 248 (47 %) 169 (41 %) 77 (28 %) 80 (45 %) 183 (46 %) 1202 (42 %)
Total1734 1393 704 542 1271 9473
14

RESPONSE RATESYear of
graduation
(survey
conducted)
Faculty of
Science
Physical
sciencesChemistry
Geography and
geology
Mathematics
and statistics
Computer
science
University of
Helsinki
2003(2008) 149 (58 %) 28 (55 %) 26 (52 %) 31 (67 %) 28 (58 %) 36 (60 %) 1478 (56 %)
2005(2010) 153 (53 %) 18 (35 %) 32 (63 %) 26 (53 %) 32 (58 %) 45 (55 %) 1305 (51 %)
2007(2012) 170 (53 %) 27 (46 %) 27 (44 %) 29 (66 %) 36 (58 %) 51 (53 %) 1425 (50 %)
2009(2014) 72 (42 %) 18 (40 %) 5 (28 %) 15 (54 %) 22 (49 %) 12 (34 %) 794 (45 %)
2011(2016) 120 (44 %) 18 (42 %) 9 (21 %) 30 (52 %) 29 (54 %) 34 (46 %) 917 (38 %)
2012
(2017/18) 131 (42%) 22 (39 %) 20 (45 %) 38 (56 %) 30 (42 %) 21 (29 %) 1109 (40%)
2013
(2018) 132 (42 %) 21 (42 %) 16 (31 %) 35 (56 %) 34 (44 %) 26 (36 %) 1242 (42 %)
2014(2011) 121 (45 %) 23 (44 %) 16 (41 %) 28 (51 %) 36 (55 %) 18 (33 %) 1202 (42 %)
Total1048 175 151 232 247 243 9473
15

RESPONDENTS
• 51 % of the respondents were women (46 % of graduates)
• 95 % of the respondents were Finnish citizens (88 % of graduates)
• The average age of the respondents upon graduation was 29 (that of graduates was also 29)

JOB MARKET SITUATION OF2014 GRADUATES
FIVE YEARS AFTER GRADUATION
• 93 % employed, 3 % unemployed and 4 % outside the workforce
• Share of employed in the workforce 97 %
• Most common employer sectors1
Companies 40 %
Municipality/joint municipal authority 29 %
University 15 %
State 12 %
• Most common primary nature of work1
Teaching or education 26 %
Research 23 %
Administration, planning and development 20 %
• Median monthly salary: €3,5001 Response options with at least
10 % of respondents

JOB MARKET SITUATION OF 2014 GRADUATES AT THE TIME OF THE SURVEY
Share [%] Faculty (N = 120) UH (N = 1194) All universities (N = 6117) Other universities (N =
4923)
All universities, natural
sciences (N = 622)
Permanent full-time job 63 % 58 % 64 % 66 % 57 %
Fixed-term full-time job 15 % 21 % 16 % 14 % 20 %
Part-time job 4 % 3 % 3 % 3 % 3 %
Self-
employed/entrepreneur/freelancer8 % 4 % 3 % 3 %
2 %
Several parallel employment
contracts0 % 1 % 1 % 1 %
1 %
Grant-funded work 1 % 1 % 1 % 1 % 3 %
Family leave (with employment
contract)2 % 4 % 4 % 4 %
3 %
Subsidised employment/practical
training0 % 0,1 % 0,05 % 0,04 %
0 %
Total employed 92 % 92 % 93 % 93 % 90 %
Unemployed jobseeker 5 % 2 % 2 % 2 % 3 %
Labour market training or equivalent 0 % 0,3 % 0,1 % 0,06 % 0 %
Total unemployed 5 % 2 % 2 % 2 % 3 %
Full-time study 0 % 2 % 2 % 2 % 5 %
Family leave (without employment
contract)0 % 2 % 1 % 1 %
1 %
Outside the workforce 0 % 0 % 0,07 % 0,08 % 0,2 %
Other 3 % 2 % 2 % 1 % 1 %
Total outside the workforce 3 % 6 % 5 % 5 % 7 % 18

JOB MARKET SITUATION OF 2014 GRADUATES
AT THE TIME OF THE SURVEYShare [%] Biol. &
Env.
Sc.
(59)
Vet.
Med
(26)
Phar.
(63)
Arts
(247)
Educ.
Sc.
(167)
Med.
(69)
Agr. &
For.
(105)
Sc.
(120)
Law
(77)
Theo.
(79)
Soc.
Sc.
(182)
UH
(1194)
Permanent full-time job 48 % 58 % 71 % 46 % 67 % 48 % 63 % 71 % 77 % 48 % 52 % 58 %
Fixed-term full-time job 29 % 23 % 10 % 26 % 17 % 30 % 15 % 18 % 9 % 33 % 23 % 21 %
Part-time job 5 % 0 % 8 % 7 % 2 % 6 % 4 % 0 % 1 % 0 % 2 % 3 %
Self-employed/entrepreneur/freelancer2 % 12 % 2 % 5 % 2 % 3 % 8 % 2 % 4 % 1 % 3 % 4 %
Several parallel employment contracts 0 % 0 % 2 % 2 % 0 % 4 % 0 % 0 % 0 % 5 % 1 % 1 %
Grant-funded work 2 % 0 % 2 % 2 % 0,6 % 0 % 1 % 0,8 % 1 % 0 % 2 % 1 %
Family leave (with employment contract) 3 % 8 % 0 % 2 % 7 % 7 % 2 % 3 % 5 % 0 % 7 % 4 %
Subsidised employment/practical training 0 % 0 % 0 % 0,4 % 0 % 0 % 0 % 0 % 0 % 0 % 0 % 0,1 %
Total employed 88 % 100 % 94 % 90 % 95 % 99 % 92 % 93 % 97 % 87 % 90 % 92 %
Unemployed jobseeker 3 % 0 % 0 % 2 % 0 % 0 % 5 % 3 % 1 % 3 % 1 % 2 %
Labour market training or equivalent 0 % 0 % 0 % 0,8 % 0 % 0 % 0 % 0 % 0 % 0 % 0,5 % 0,3 %
Total unemployed 3 % 0 % 0 % 3 % 0 % 0 % 5 % 3 % 1 % 3 % 2 % 2 %
Full-time study 5 % 0 % 2 % 2 % 2 % 0 % 0 % 2 % 0 % 3 % 3 % 2 %
Family leave (without employment contract) 2 % 0 % 5 % 2 % 1 % 0 % 0 % 0,8 % 1 % 6 % 3 % 2 %
Outside the workforce 0 % 0 % 0 % 0 % 0 % 0 % 0 % 0 % 0 % 0 % 0 % 0 %
Other 2 % 0 % 0 % 3 % 2 % 1 % 3 % 2 % 0 % 1 % 2 % 2 %
Total outside the workforce 9 % 0 % 6 % 7 % 5 % 1 % 3 % 4 % 1 % 10 % 8 % 6 % 19
VASTAUSHETKEN PÄÄTYÖNANTAJASEKTORI VALMISTUMISVUOSITTAIN
20

VASTAUSHETKEN PÄÄTYÖNANTAJASEKTORI OPPIALOITTAIN
21

VASTAUSHETKEN TYÖN LUONNE VALMISTUMISVUOSITTAIN
22

VASTAUSHETKEN TYÖN LUONNE OPPIALOITTAIN
23
PALKKA VASTAUSHETKELLÄ OPPIALOITTAIN
24

• Options best describing employment after graduation:
• Consecutive employment with the same employer or as an entrepreneur since graduation: 34 %
• Several employers, fixed-term contracts or commissions or grant-funded work, few gaps: 33 %
• Various employers and duties, interspersed with gaps, studying or periods of unemployment: 18 %
• Has been unemployed at some point after graduation: 38 %
• Has been an entrepreneur, freelancer or self-employed 18 %
25
KEY FIGURES CONCERNING 2014GRADUATES WHO HAVE BEEN EMPLOYED FOR FIVE YEARS

TYÖURAN KOKONAISUUS VALMISTUMISVUOSITTAIN
26
TYÖURAN KOKONAISUUS OPPIALOITTAIN
27
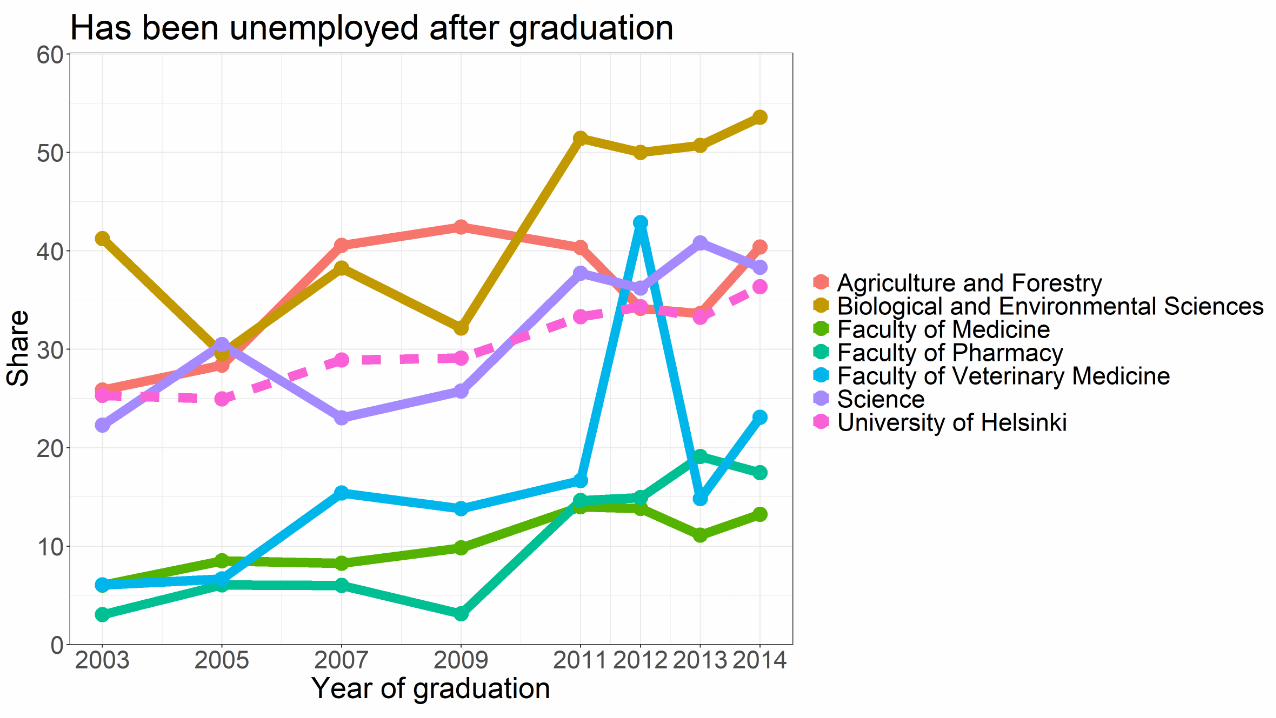
ON OLLUT TYÖTTÖMÄNÄ VALMISTUMISEN JÄLKEEN, MUUT KUIN KESKUSTAKAMPUS
28

ON TOIMINUT YRITTÄJÄNÄ TAI FREELANCERINA VALMISTUMISEN JÄLKEEN,
MUUT KUIN KESKUSTAKAMPUS
29
SUORITTANUT TIETEELLISIÄ JATKO-OPINTOJA VALMISTUMISEN JÄLKEEN, MUUT
KUIN KESKUSTAKAMPUS
30

SUORITTANUT OPINTOJA TÄHTÄIMESSÄ TOINEN KORKEAKOULUTUTKINTO, MUUT
KUIN KESKUSTAKAMPUS
31

Faculty, number of
respondents in brackets
Has been
unemployed
Has been an entrepreneur/a
freelancer/self-employed
Has done doctoral
studies
Has pursued another
master´s level
university degreeBiological and Environmental
Sciences (56-59) 54 % 12 % 31 % 20 %
Veterinary Medicine (26) 23 % 73 % 26 % 0 %
Pharmacy (62-63) 18 % 8 % 11 % 8 %
Arts (242-248) 50 % 32 % 16 % 11 %
Educational Sciences (163-169) 22 % 11 % 7 % 12 %
Medicine (68-70) 13 % 23 % 20 % 6 %
Agriculture and Forestry (104-106) 40 % 24 % 14 % 6 %
Science (120-121) 38 % 18 % 16 % 10 %
Law (75-77) 27 % 12 % 10 % 10 %
Theology (78-80) 55 % 25 % 13 % 18 %
Social Sciences (172-183) 36 % 21 % 10 % 13 %
University of Helsinki (1,169-
1,202) 36 % 22 % 14 % 11 %
FIVE YEARS IN THE JOB MARKET, 2014GRADUATES BY FACULTY
32

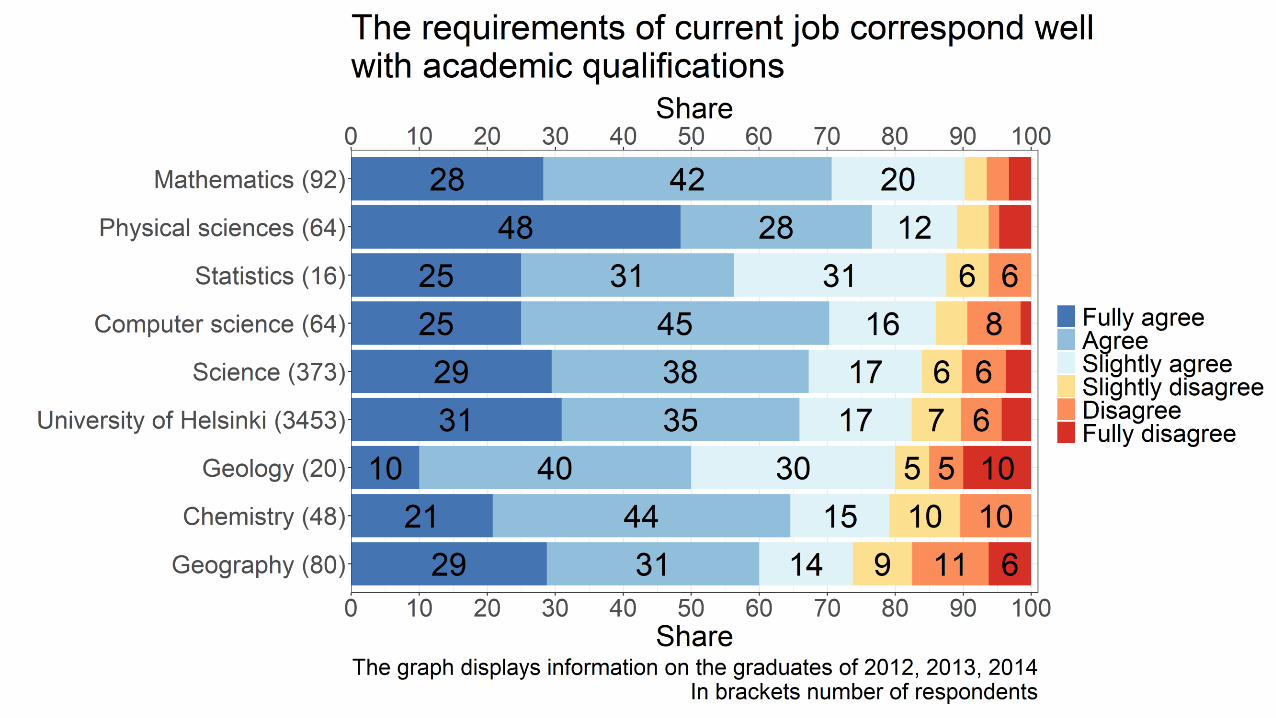
Respondents used a six-level scale. The figures include response options 4–6 (fairly satisfied-very satisfied/slightly agree-fully agree).
• Requirements of current job matches well with academic qualifications: 83 % of respondents
• Ability to use the knowledge and skills acquired at the University in current job: 85 %
• Studies equipped sufficiently for working life: 65 %
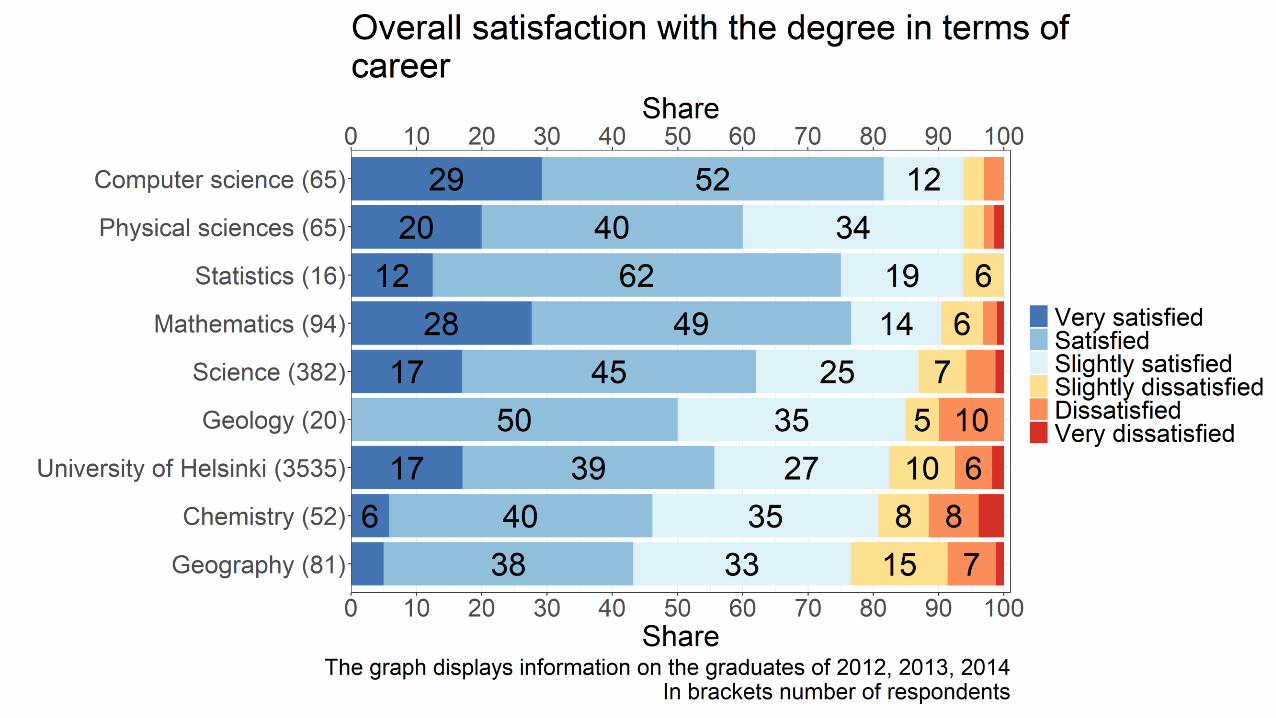
• Satisfied with the degree from the career perspective: 89 %
33
CORRELATION BETWEEN EDUCATIONAND EMPLOYMENT AMONG 2014 GRADUATES

TYÖNI VASTAA VAATIVUUSTASOLTAAN HYVIN YLIOPISTOLLISTA KOULUTUSTANI
OPPIALOITTAIN
34

PYSTYN HYÖDYNTÄMÄÄN YLIOPISTOSSA OPPIMIANI TIETOJA JA TAITOJA NYKYISESSÄ TYÖSSÄNI HYVIN
OPPIALOITTAIN
35

KOULUTUS ANTOI RIITTÄVÄT VALMIUDET TYÖELÄMÄÄN TIEDEKUNNITTAIN
36

SUOSITTELISIN KOULUTUSTANI MUILLE
37

TYÖNANTAJAT ARVOSTAVAT TUTKINTOANI TIEDEKUNNITTAIN
38
TUTKINTOONSA TYÖURAN KANNALTA TYYTYVÄISET
39

TUTKINTOONSA TYÖURAN KANNALTA TYYTYVÄISTEN OSUUS VASTAAJISTA, MUU
KUIN KESKUSTAKAMPUS
40

Faculty, number of
respondents in brackets
Requirements of current
job matches well with
academic qualifications*
Able to use the knowledge and
skills acquired at the University
in the current job*
Studies equipped
sufficiently for working
life*
Satisfied with the
degree from a career
perspective*
Biological and Environmental
Sciences (57-59) 76 % 88 % 58 % 73 %
Veterinary Medicine (26) 96 % 96 % 77 % 100 %
Pharmacy (62-63) 86 % 92 % 90 % 89 %
Arts (240-248) 73 % 78 % 54 % 73 %
Educational Sciences (167-169) 85 % 88 % 76 % 90 %
Medicine (70) 97 % 97 % 80 % 91 %
Agriculture and Forestry (101-
106) 77 % 74 % 63 % 81 %
Science (119-120) 83 % 85 % 65 % 89 %
Law (76-77) 93 % 86 % 69 % 91 %
Theology (79-80) 84 % 78 % 59 % 78 %
Social Sciences (180-183) 83 % 79 % 55 % 83 %
University of Helsinki (1,181-
1,198) 82 % 83 % 64 % 83 %
CORRELATION BETWEEN EDUCATION AND EMPLOYMENT, 2014 GRADUATES BY FACULTY
41

• Most important factors affecting employment*
• Ability to describe one’s knowledge and skills 82 %
• Subject combination of degree 74 %
• Other work experience 62 %
• Most important skill areas in current job:
• Ability to learn and take in new information
• Self-direction/initiative
• Problem-solving skills
• Analytical and systematic thinking skills
• Communication in Finnish
30/09/2020
*Options 4–6 (fairly important/important/very important) on a six-level scale
42
FACTORS AFFECTING EMPLOYMENT AND PROFESSIONAL SKILLS NEEDS, 2014 GRADUATES

TYÖLLISTYMISEEN VAIKUTTAVAT TEKIJÄT
43

FACTORS AFFECTING EMPLOYMENT, 2014 GRADUATES
Biol. &
Env.
Sc.
Vet.
Med.
Phar. Arts Edu.
Sc.
Med. Agr. &
For.
Sc. Law Theo. Soc.
Sc.
UH
Ability to describe one’s
knowledge and skills85 % 73 % 78 % 86 % 84 % 57 % 88 % 82 % 88 % 88 % 86 % 83 %
Other work experience 55 % 54 % 57 % 70 % 70 % 41 % 69 % 62 % 86 % 73 % 72 % 67 %
Contacts/networks 50 % 81 % 51 % 56 % 37 % 31 % 67 % 51 % 42 % 65 % 61 % 53 %
Subject combination of
degree66 % 39 % 33 % 57 % 59 % 29 % 55 % 74 % 47 % 39 % 46 % 52 %
Practical training 50 % 58 % 64 % 37 % 41 % 54 % 45 % 36 % 47 % 45 % 50 % 45 %
Other studies/training 40 % 19 % 36 % 43 % 46 % 17 % 43 % 33 % 25 % 45 % 38 % 38 %
International experience 41 % 19 % 11 % 34 % 14 % 9 % 32 % 28 % 42 % 25 % 34 % 28 %
Organisational
work/hobbies26 % 23 % 14 % 24 % 23 % 13 % 26 % 17 % 13 % 50 % 31 % 24 %
Activity/profile in social
media17 % 12 % 8 % 14 % 12 % 1 % 19 % 11 % 11 % 18 % 19 % 14 %
Share of options 4–6 total (fairly important/important/very important) on a six-level scale.
Color map criteria: the difference to the university share total is 10 % (if the university total
share is over 50%) or 20 % (if the university total share is under 50 %). 44

FACTORS AFFECTING EMPLOYMENT, 2012-2014 GRADUATES*
Faculty of
SciencePhysical
sciencesGeology Chemistry Geography
Mathema-
tics
Computer
scienceStatistics UH
Ability to describe one’s
knowledge and skills84 % 80 % 80 % 83 % 84 % 87 % 86 % 88 % 82 %
Other work experience 58 % 38 % 50 % 60 % 65 % 58 % 74 % 62 % 66 %
Subject combination of
degree73 % 80 % 65 % 59 % 67 % 88 % 66 % 75 % 54 %
Contacts/networks 45 % 51 % 55 % 35 % 52 % 34 % 54 % 25 % 50 %
Practical training 42 % 38 % 45 % 41 % 51 % 42 % 32 % 50 % 45 %
Other studies/training 30 % 40 % 30 % 29 % 25 % 24 % 35 % 25 % 37 %
International experience 22 % 33 % 30 % 14 % 35 % 12 % 17 % 25 % 25 %
Organisational work/hobbies 18 % 12 % 10 % 16 % 21 % 23 % 18 % 19 % 23 %
Activity/profile in social media 14 % 6 % 25 % 19 % 17 % 8 % 18 % 14 % 13 %
*Share of options 4–6 total (fairly important/important/very important) on a six-level scale.
Color map criteria: the difference to the faculty share total is 15 % (if the faculty total share is over
50%) or 25 % (if the faculty total share is under 50 %). 45

DEVELOPMENT OF SUFFICIENT SKILLS
Tuukka Kangas
Johdon tieto- ja analytiikkapalvelut
47

GENERAL
• This section analyses the statement ‘The studies equipped me sufficiently for working life’.
• Responses on a six-level scale, from fully disagree to fully agree
• If not otherwise indicated, the responses slightly agree, agree and fully agree have been merged into a single category.
• Question has been included in the past four surveys, i.e., graduates of 2011–2014 are included
• If the year of graduation is not used as a variable for statistical classification, all responses (regardless of the year of graduation) are included by default.
48

AJALLINEN MUUTOS
49

JAKAUMA OPPIALOITTAIN
50

CONNECTION BETWEEN THE DEVELOPMENT OF SUFFICIENT SKILLS AND OTHER QUESTIONS
51
Variable Response1 Has acquired
sufficient skills2
All responses
Job requirements correspond with academic
qualifications3
Yes 91 % 84 %
No 9 % 16 %
Can apply the skills and knowledge learned
at university in current job
Yes 94 % 87 %
No 6 % 13 %
Share of those satisfied with their degree in
terms of their career
Yes 96 % 87 %
No 4 % 13 %
Would recommend studies to othersYes 93 % 87 %
No 7 % 13 %
Employers value degreeYes 94 % 87 %
No 6 % 13 %
Studies equipped them sufficiently for working life 68 %
1 Response options 4–6 (fairly satisfied/satisfied/very satisfied; slightly agree/agree/fully agree) 2 Only includes those who stated that their studies had equipped them sufficiently for working life3 Graduation years of 2012–2014

CONNECTION BETWEEN THE DEVELOPMENT OF SUFFICIENT SKILLS AND OTHER QUESTIONS
52
Variable Response Has acquired
sufficient skills1
All responses
Has been unemployed
Yes 33 % 38 %
No 67 % 62 %
Has studied towards another academic
degree
Yes 9 % 10 %
No 91 % 90 %
Has completed scientific postgraduate
studies
Yes 24 % 23 %
No 76 % 77 %
Studies equipped them sufficiently for working life 68 %
1 Only includes those who stated that their studies had equipped them sufficiently for working life

PERCEIVED LEARNING DURING UNIVERSITY STUDIES
• Comparison of respondents who chose the option fully agree or agree with other respondents
• Those who agreed with the statement felt that their university education developed, in particular, the following professional skills:
• Analyt. and systematic thinking, practical knowledge, problem-solving, theoretical knowledge, ability to learn. adopt, teaching and guidance skills and self-direction/initiative.
• In general, those who agreed with the statement considered their professional skills to have developed more compared to the other respondents. The difference to those who fully disagreed or disagreed was even more marked.
53

ANALYSIS OF OPEN-ENDED RESPONSES
Tuukka Kangas
Institutional Research and Analysis
54
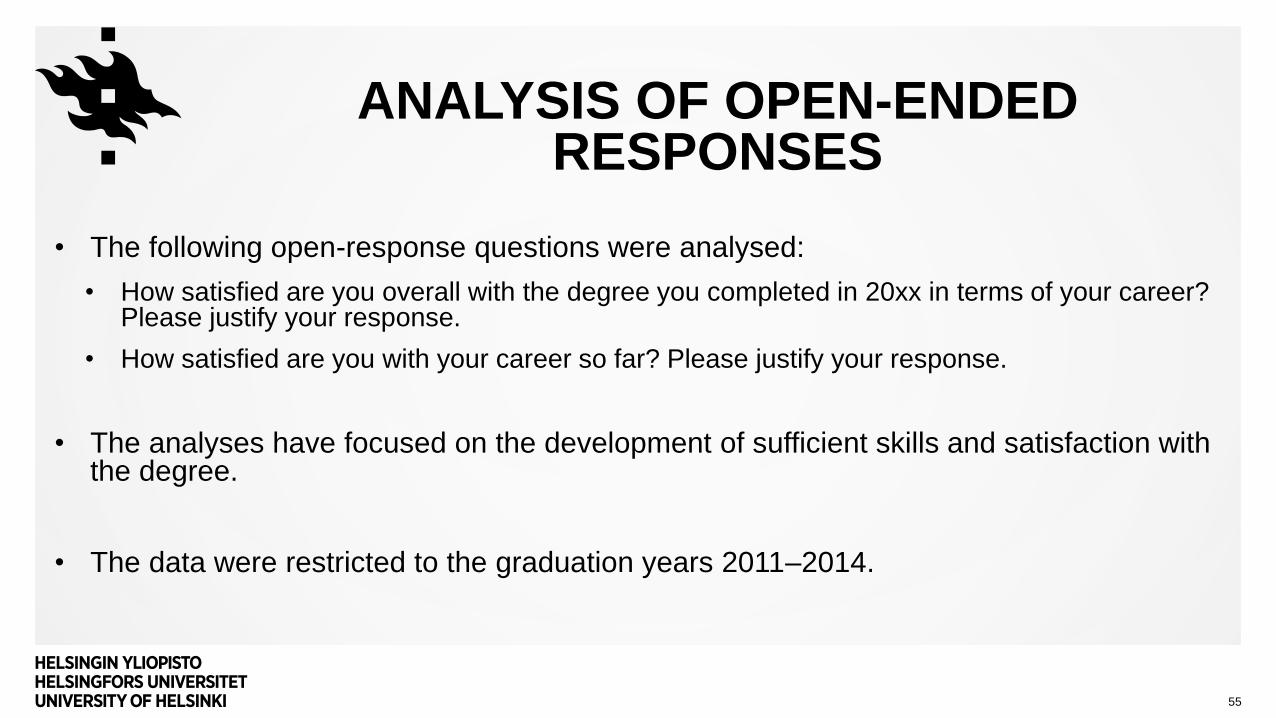
ANALYSIS OF OPEN-ENDED RESPONSES
• The following open-response questions were analysed:
• How satisfied are you overall with the degree you completed in 20xx in terms of your career? Please justify your response.
• How satisfied are you with your career so far? Please justify your response.
• The analyses have focused on the development of sufficient skills and satisfaction with the degree.
• The data were restricted to the graduation years 2011–2014.
55

• The most common themes highlighted by respondents included practical skills, research/a postgraduate degree, and the job market.
• The respondents who were both satisfied with their degree and felt that they had been sufficiently equipped for the job market emphasised in their responses that they had acquired basic skills/a solid foundation, and sought to pursue a research career. They also stated that they had acquired sufficient practical skills.
• In addition, the satisfied respondents stressed that their degree had qualified them for their current job.
56
ANALYSIS OF OPEN-ENDED RESPONSES

• The respondents who were dissatisfied with their degree cited the job market situation: too few jobs in relation to graduate numbers.
• The dissatisfied respondents emphasised that the studies were too research-oriented and mainly intended for those pursuing a research career or postgraduate education.
• They felt that they had not received sufficient practical skills or the kinds of skills that could be utilised in the job market outside academia.
• Subject teachers stressed that they had problems with subject choices (other teaching subjects).
57
ANALYSIS OF OPEN-ENDED RESPONSES

58
SATISFACTION WITH THE DEGREE OR CAREER AS WELL AS SUFFICIENT PROFESSIONAL SKILLS– SEVERAL EXPLANATORY FACTORS FOR THE DISTRIBUTION OF RESPONSES IN THE LIGHT OF OPEN-ENDED RESPONSES
200X–2014
University studies
Autumn
2019
survey
2014–2019
Early career of master’s
graduates
(five years
after graduation)
6. Different experiences of work and workloads
1. Different
expectations
for education
and
employment
5. Job market situation
7. Lack of practical professional skills provided by studies
2. Individual activity,
work experience and
networks created
during studies
8. Lack of entrepreneurship skills (those working as
entrepreneurs)
3. Different experiences of studies, the skills developed
and the correlation between studies and employer needs
4. More support for studying and career planning
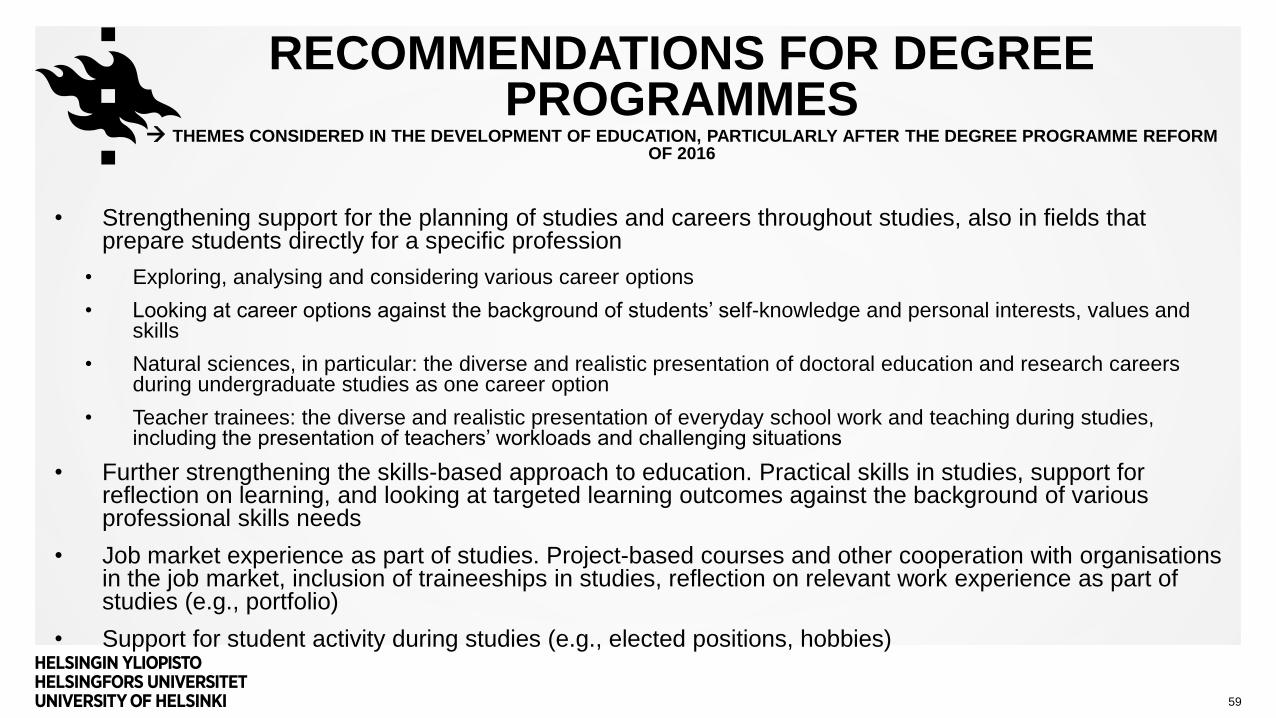
RECOMMENDATIONS FOR DEGREE PROGRAMMES
THEMES CONSIDERED IN THE DEVELOPMENT OF EDUCATION, PARTICULARLY AFTER THE DEGREE PROGRAMME REFORM OF 2016
• Strengthening support for the planning of studies and careers throughout studies, also in fields that prepare students directly for a specific profession
• Exploring, analysing and considering various career options
• Looking at career options against the background of students’ self-knowledge and personal interests, values and skills
• Natural sciences, in particular: the diverse and realistic presentation of doctoral education and research careers during undergraduate studies as one career option
• Teacher trainees: the diverse and realistic presentation of everyday school work and teaching during studies, including the presentation of teachers’ workloads and challenging situations
• Further strengthening the skills-based approach to education. Practical skills in studies, support for reflection on learning, and looking at targeted learning outcomes against the background of various professional skills needs
• Job market experience as part of studies. Project-based courses and other cooperation with organisations in the job market, inclusion of traineeships in studies, reflection on relevant work experience as part of studies (e.g., portfolio)
• Support for student activity during studies (e.g., elected positions, hobbies)
59

REGISTER-BASED TRACKING OF EMPLOYMENT AND THE JOB
MARKET SITUATION
60
Tuukka Kangas
Institutional Research and Analysis

JOB MARKET SITUATION OF GRADUATES OF 2011 AND 2012 ONE,
THREE AND FIVE YEARS AFTER GRADUATION
Job market situation One year after
graduation
Three years after
graduation
Five years after
graduation
Employed 55 % 50 % 57 %
Employed students 26 % 29 % 19 %
Unemployed 4 % 5 % 4 %
Share of employed
in the workforce
95 % 94 % 95 %
Full-time study 2 % 2 % 2 %
Other or not known 7 % 4 % 6 %
Emigrated 7 % 9 % 12 %
Number: 570
61

JOB MARKET SITUATION ONE YEAR AFTER GRADUATION, BY FACULTY, GRADUATION YEARS OF 2015 AND 2016
Discipline Employed Employed
students
Unemployed Full-time
study
Other or not
known
Emigrated
Physical Sciences
(N = 110)
25 % 55 % 6 % 2 % 8 % 5 %
Geology
(N = 48)
75 % 6 % 15 % 2 % 0 % 2 %
Chemistry (N = 76) 36 % 32 % 5 % 7 % 3 % 18 %
Geography
(N = 110)
67 % 12 % 11 % 4 % 4 % 3 %
Mathematics (N =
141)
62 % 10 % 9 % 3 % 8 % 9 %
Computer science
(N = 152)
60 % 15 % 3 % 1 % 12 % 9 %
Statistics (N = 19) 32 % 32 % 16 % 0 % 16 % 5 %
Faculty of
Science
(N = 637)
54 % 22 % 7 % 3 % 7 % 8 %
UH (N = 5868) 66 % 16 % 6 % 3 % 5 % 4 %62
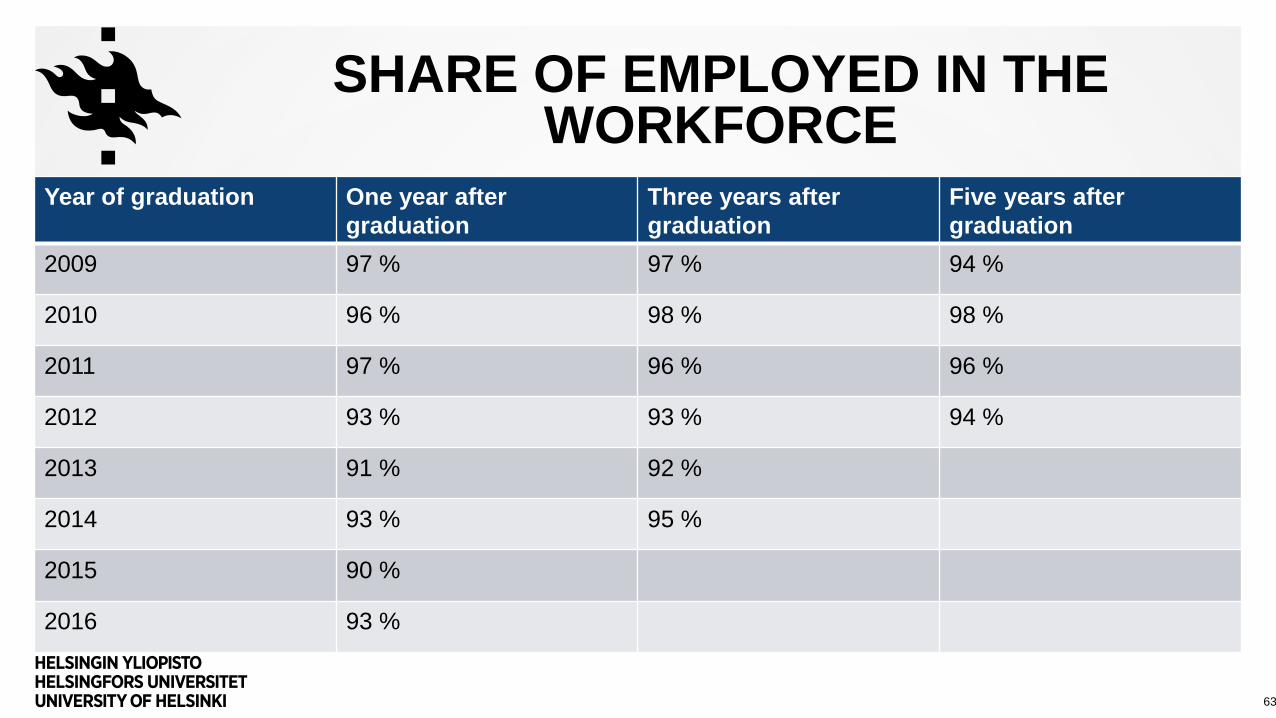
SHARE OF EMPLOYED IN THE WORKFORCE
63
Year of graduation One year after
graduation
Three years after
graduation
Five years after
graduation
2009 97 % 97 % 94 %
2010 96 % 98 % 98 %
2011 97 % 96 % 96 %
2012 93 % 93 % 94 %
2013 91 % 92 %
2014 93 % 95 %
2015 90 %
2016 93 %
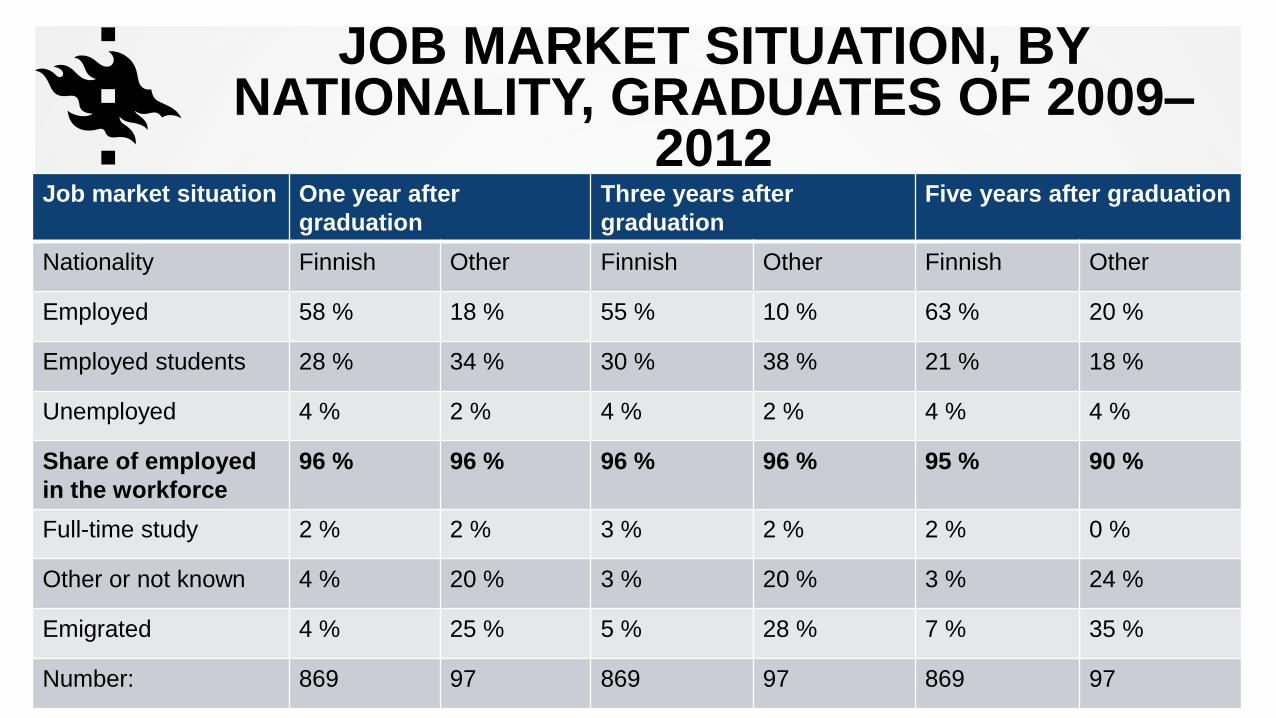
JOB MARKET SITUATION, BY NATIONALITY, GRADUATES OF 2009–
2012
64
Job market situation One year after
graduation
Three years after
graduation
Five years after graduation
Nationality Finnish Other Finnish Other Finnish Other
Employed 58 % 18 % 55 % 10 % 63 % 20 %
Employed students 28 % 34 % 30 % 38 % 21 % 18 %
Unemployed 4 % 2 % 4 % 2 % 4 % 4 %
Share of employed
in the workforce
96 % 96 % 96 % 96 % 95 % 90 %
Full-time study 2 % 2 % 3 % 2 % 2 % 0 %
Other or not known 4 % 20 % 3 % 20 % 3 % 24 %
Emigrated 4 % 25 % 5 % 28 % 7 % 35 %
Number: 869 97 869 97 869 97

ANNUAL INCOME (AVERAGE), BY FACULTY, GRADUATES OF 2012
Discipline One year after
graduation
Three years after
graduation
Five years after
graduation
Physical sciences (N = 69-84) 30 000 33 000 36 000
Geology (N = 14-15) 33 000 38 000 41 000
Chemistry (N = 59-65) 32 000 34 000 36 000
Geography (N = 82-87) 33 000 35 000 37 000
Mathematics (N = 93-100) 37 000 41 000 44 000
Computer science (N = 106-122) 40 000 47 000 53 000
Statistics (N = 22-23) 41 000 46 000 44 000
Faculty of Science (N = 434-458) 35 000 39 000 42 000
University of Helsinki (N = 4233-4319) 36 000 40 000 43 000
65

SUBSEQUENT DEGREES, BY FACULTY, DATA FOR 2017, GRADUATION YEARS
OF 2009–2012
66
Discipline No degree Bachelor degree Master Doctoral
Physical sciences (N = 189) 68 % 0 % 2 % 29 %
Geology (N = 36) 83 % 0 % 8 % 8 %
Chemistry (N = 138) 85 % 0 % 0 % 15 %
Geography (N = 164) 92 % 0 % 2 % 6 %
Mathematics (N = 201) 86 % 0 % 2 % 12 %
Computer science (N = 238) 87 % 0 % 1 % 11 %
Statistics (N = 32) 97 % 0 % 0 % 3 %
Faculty of Science (N = 966) 84 % 0 % 2 % 14 %
University of Helsinki (N =9439) 89 % 0,3 % 6 % 5 %

67
APPENDICES

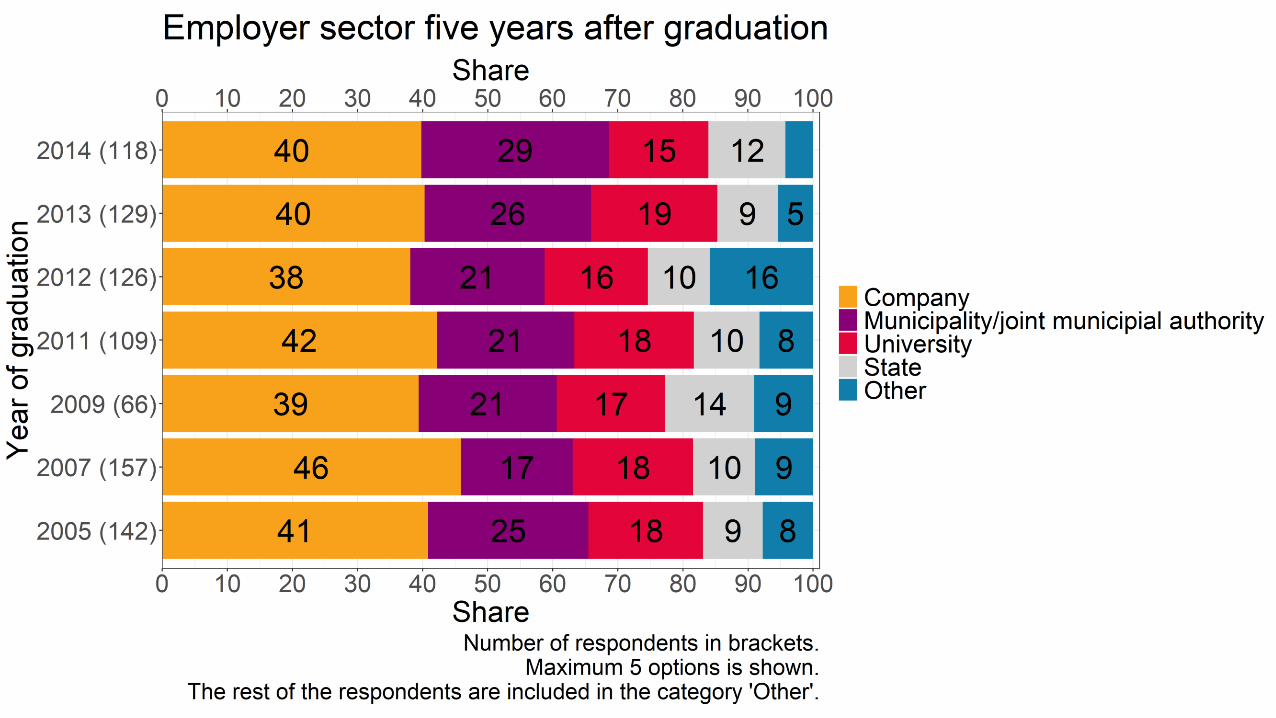
PRINCIPAL EMPLOYER AT THE TIME OF RESPONDING, BY GRADUATION YEAR
Company Municipality/j
oint
municipial
authority
Organisation
/foundation/c
ongregation/
similar
University State My own
company/sel
f-employed
University of
applied
science
Other
2014 40 29 1 15 12 3 0 1
2013 40 26 2 19 9 1 1 2
2012 38 21 8 16 10 2 2 4
2011 42 21 2 18 10 4 0 3
2009 39 21 5 17 14 3 0 2
2007 46 17 4 18 10 2 2 1
2005 41 25 4 18 9 1 1 1
68

Company Municipa
lity/joint
municipi
al
authority
Organisation
/foundation/
congregatio
n/similar
University State My own
company/sel
f-employed
University of
applied
science
Other
Physical sciences 19 21 5 35 16 2 2 0
Geology 45 10 5 15 15 0 5 5
Chemistry 40 27 0 33 0 0 0 0
Geography 35 28 9 10 14 1 0 4
Mathematics 34 44 3 11 2 1 1 3
Computer science 69 3 0 6 14 5 2 2
Statistics 19 0 19 6 50 6 0 0
Faculty of Science 39 25 4 17 10 2 1 2
University of Helsinki 31 29 12 11 10 3 1 3
69
PRINCIPAL EMPLOYER AT THE TIME OF RESPONDING, BY FIELD OF EDUCATION

TYPE OF EMPLOYMENT AT THE TIME OF RESPONDING, BY YEAR OF
GRADUATION
Work with
customers
/patients
Planning
/develop
ment/ad
ministrat
ive
duties
Manageme
nt/supervis
ory duties
Ecclesiastic
al work
Consulting/t
raining Legal work
Marketing/s
ales Other Education
Finances/fi
nancial
administrati
on
Artistic
work Office work Research
Communica
tions/media
20143 20 7 0 9 0 0 6 26 3 0 3 23 0.9
20133 24 2 0 11 0.8 0.8 6 20 0.8 0.8 2 26 2
20125 18 6 0 10 0 2 6 25 2 0 2 22 0.8
20112 23 5 0 8 0 0.9 11 17 0.9 0 0.9 30 2
20094 18 9 0 9 0 0 3 28 1 1 3 24 0
20073 28 6 0 11 0 3 8 19 0.6 0 1 19 2
20056 24 7 0 6 0 1 3 27 0 0 1 22 1
70

TYPE OF EMPLOYMENT AT THE TIME OF RESPONDING, BY FIELD OF
EDUCATION
Work with
customers
/patients
Planning
/develop
ment/ad
ministrat
ive
duties
Manageme
nt/supervis
ory duties
Ecclesiastic
al work
Consulting/t
raining Legal work
Marketing/s
ales Other Education
Finances/fi
nancial
administrati
on
Artistic
work Office work Research
Communica
tions/media
Physical
sciences 8 11 3 0 3 0 0 9 12 6 0 3 42 2
Geology 0 21 5 0 16 0 0 5 5 0 0 0 47 0
Chemistry 2 4 6 0 2 0 2 4 34 0 0 0 45 0
Geography 8 32 4 0 11 1 3 6 14 0 1 4 15 1
Mathematics0 10 1 0 12 0 0 4 53 4 0 2 12 1
Computer
science 3 41 12 0 17 0 0 8 5 0 0 3 9 2
Statistics 0 25 0 0 25 0 0 0 0 0 0 0 50 0
Faculty of
Science4 21 5 0 10 0.3 0.8 6 24 2 0.3 2 24 1
University of
Helsinki 15 14 5 2 5 6 3 5 21 0.9 0.7 4 14 5
71

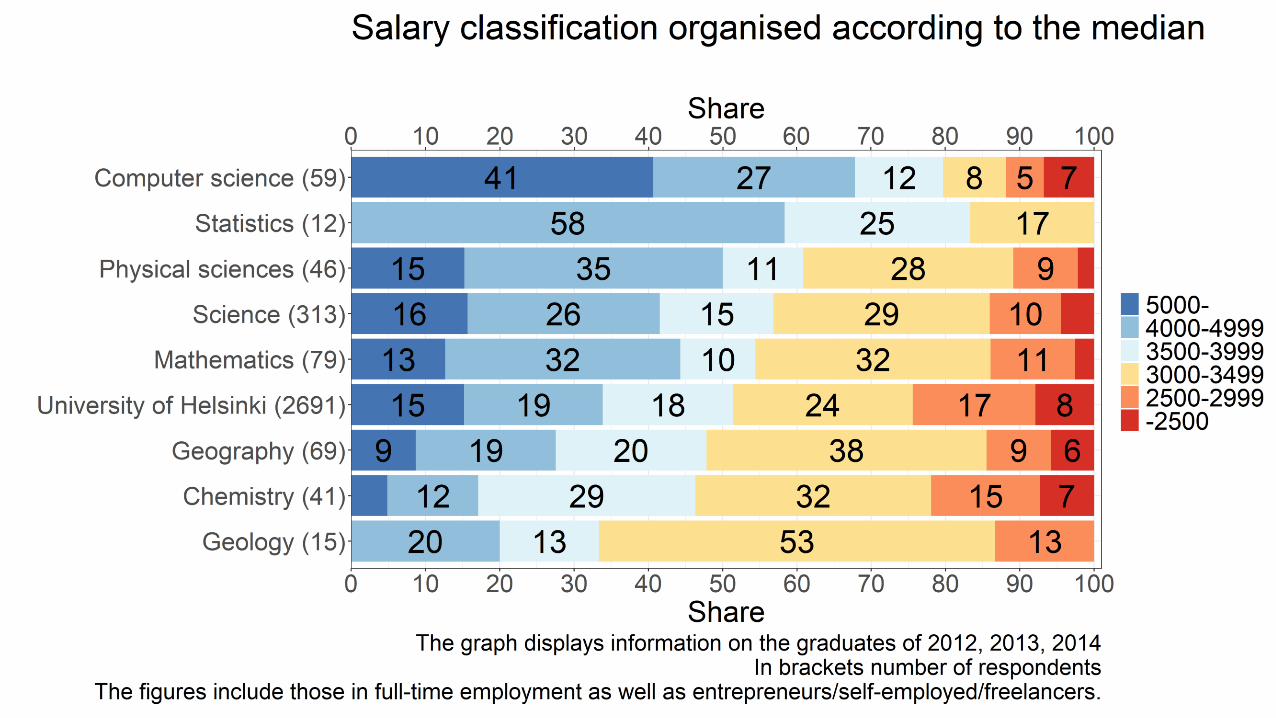
SALARY AT THE TIME OF RESPONDING, BY FIELD OF EDUCATION
-2500 2500-2999 3000-3499 3500-3999 4000-4999 5000-
Physical sciences2 9 28 11 35 15
Geology0 13 53 13 20 0
Chemistry7 15 32 29 12 5
Geography6 9 38 20 19 9
Mathematics3 11 32 10 32 13
Computer science7 5 8 12 27 41
Statistics0 0 17 25 58 0
Faculty of Science4 10 29 15 26 16
University of Helsinki8 17 24 18 19 15
72

OVERALL CAREER, BY YEAR OF GRADUATION
Other
Pääasiassa
työvoiman
ulkopuolella:
esim. opiskelua/
vanhempainvapa
ata valtaosan
ajasta
Unemployment
alternating with
occasional temporary
jobs, practical training
and contract or
freelance work
Working for several
different employers or
temporary jobs or
assignments or working
with a grant. Not many
breaks
Changing employers or
duties, with breaks,
studies or periods of
unemployment in
between
Continuously working
for the same employer
or as an entrepreneur
since graduation
201412 2 0.8 33 18 34
20137 5 0.8 39 12 36
20125 2 0.8 45 10 37
20112 0 2 48 12 36
73

OVERALL CAREER, BY FIELD OF EDUCATION
Other
Pääasiassa
työvoiman
ulkopuolella:
esim. opiskelua/
vanhempainvapa
ata valtaosan
ajasta
Unemployment
alternating with
occasional temporary
jobs, practical training
and contract or
freelance work
Working for several
different employers or
temporary jobs or
assignments or working
with a grant. Not many
breaks
Changing employers or
duties, with breaks,
studies or periods of
unemployment in
between
Continuously working
for the same employer
or as an entrepreneur
since graduation
Physical sciences 14 2 2 39 6 38
Geology 5 5 0 40 30 20
Chemistry 12 6 2 35 19 27
Geography 2 1 0 36 24 36
Mathematics 7 4 0 39 9 40
Computer science 8 2 2 45 6 38
Statistics 12 0 0 19 6 62
Faculty of Science8 3 0.8 39 13 36
University of Helsinki 8 3 2 39 16 33
74

SHARE OF RESPONDENTS WHO HAVE EXPERIENCED UNEMPLOYMENT, BY FACULTY
AND YEAR OF GRADUATION2003 2005 2007 2009 2011 2012 2013 2014
Biological and
Environmental Sciences 41 30 38 32 51 50 51 54
Veterinary Medicine6 7 15 14 17 43 15 23
Pharmacy3 6 6 3 15 15 19 18
Arts38 32 44 43 50 48 43 50
Educational Sciences26 23 29 26 26 30 20 22
Medicine6 8 8 10 14 14 11 13
Agriculture and Forestry26 28 41 42 40 34 34 40
Science22 30 23 26 38 36 41 38
Law31 27 30 29 13 19 33 27
Theology34 35 39 44 33 37 43 55
Social Sciences27 27 27 40 36 34 35 36
University of Helsinki25 25 29 29 33 34 33 36
75

SHARE OF ENTREPRENEURS/FREELANCERS, BY FACULTY AND YEAR OF GRADUATION
76
2003 2005 2007 2009 2011 2012 2013 2014
Biological and
Environmental Sciences 9 11 7 7 26 14 21 12
Veterinary Medicine56 69 52 56 71 90 75 73
Pharmacy2 3 2 1 4 8 4 8
Arts25 22 21 25 37 33 37 32
Educational Sciences8 9 8 8 15 11 15 11
Medicine28 25 28 27 24 21 20 23
Agriculture and Forestry19 15 19 8 15 22 23 24
Science7 8 10 12 19 14 11 18
Law12 8 6 8 19 15 21 12
Theology8 11 9 7 12 23 19 25
Social Sciences19 9 10 11 25 22 23 21
University of Helsinki16 14 13 15 23 21 23 22

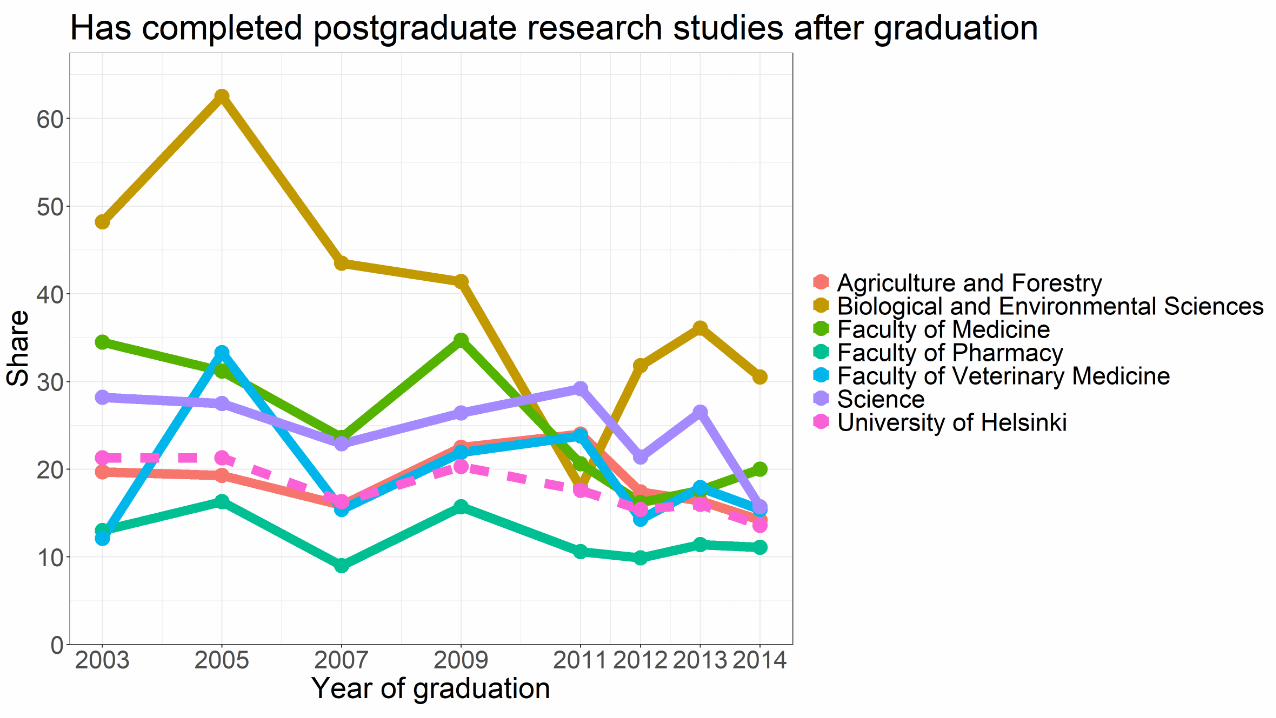
SHARE OF RESPONDENTS WHO HAVE PURSUED POSTGRADUATE RESEARCH STUDIES, BY
FACULTY AND YEAR OF GRADUATION
77
2003 2005 2007 2009 2011 2012 2013 2014
Biological and
Environmental Sciences 48 62 43 41 18 32 36 31
Veterinary Medicine12 33 15 22 24 14 18 15
Pharmacy13 16 9 16 11 10 11 11
Arts19 17 14 16 19 14 18 16
Educational Sciences13 14 9 10 11 11 6 7
Medicine34 31 24 35 21 16 18 20
Agriculture and Forestry20 19 16 22 24 17 16 14
Science28 27 23 26 29 21 27 16
Law14 12 8 11 10 9 9 10
Theology16 15 14 21 13 12 9 12
Social Sciences25 17 17 26 15 15 13 10
University of Helsinki21 21 16 20 18 15 16 14

SHARE OF RESPONDENTS WHO HAVE PURSUED STUDIES WITH THE AIM OF COMPLETING ANOTHER
HIGHER EDUCATION DEGREE, BY FACULTY AND YEAR OF GRADUATION
Bio- ja
ympäristötieteellinen
Eläinlääketieteellinen
Farmasian
Humanistinen
Kasvatustieteellinen
Lääketieteellinen
Maatalous-
metsätieteellinen
Matemaattis-
luonnontieteellinen
Oikeustieteellinen
Teologinen
Valtiotieteellinen
2003 2005 2007 2009 2011 2012 2013 2014
Biological and
Environmental Sciences 14 12 14 14 8 18 14 20
Veterinary Medicine0 10 8 9 0 0 7 0
Pharmacy25 21 22 27 13 11 17 8
Arts12 12 14 19 12 11 10 11
Educational Sciences17 14 12 17 9 7 11 12
Medicine5 6 5 11 0 3 4 6
Agriculture and Forestry16 14 8 10 9 13 13 6
Science13 8 9 12 8 8 13 10
Law12 16 16 22 13 10 11 10
Theology13 8 13 16 12 11 11 18
Social Sciences12 9 8 15 11 8 13 13
University of Helsinki14 12 12 17 10 9 11 1178
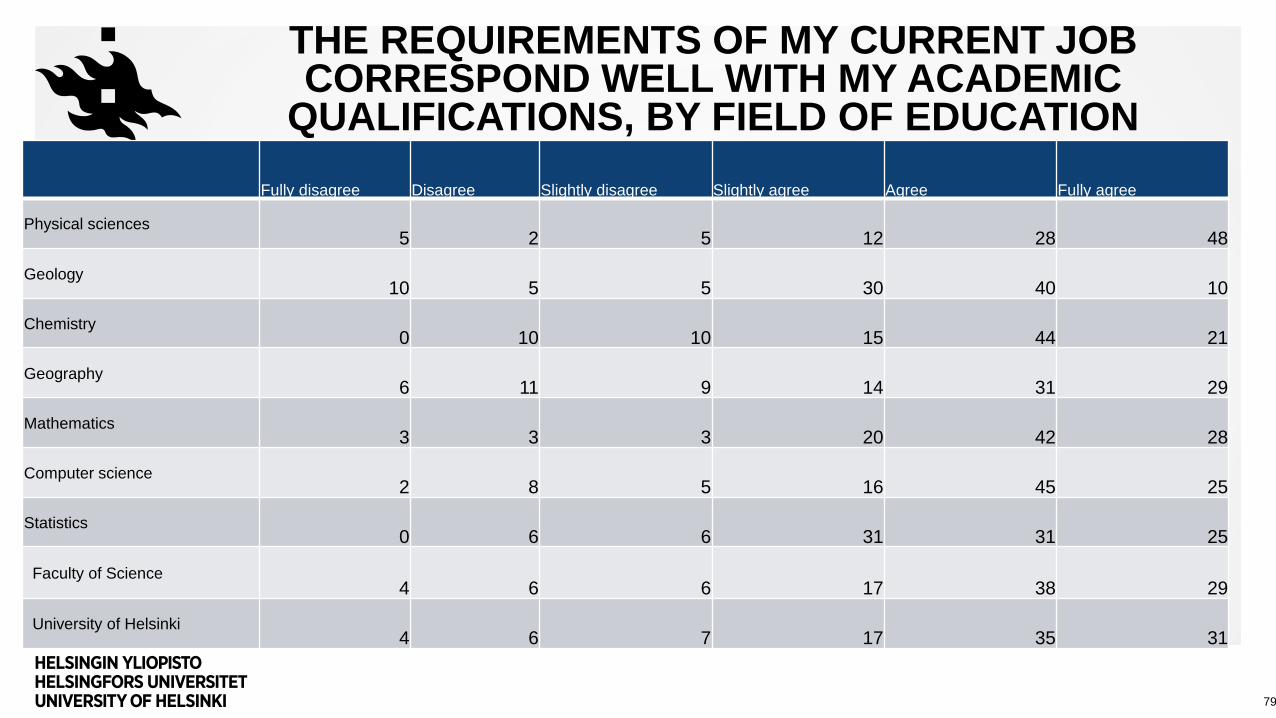
THE REQUIREMENTS OF MY CURRENT JOB CORRESPOND WELL WITH MY ACADEMIC
QUALIFICATIONS, BY FIELD OF EDUCATION
79
Fully disagree Disagree Slightly disagree Slightly agree Agree Fully agree
Physical sciences5 2 5 12 28 48
Geology10 5 5 30 40 10
Chemistry0 10 10 15 44 21
Geography6 11 9 14 31 29
Mathematics3 3 3 20 42 28
Computer science2 8 5 16 45 25
Statistics0 6 6 31 31 25
Faculty of Science4 6 6 17 38 29
University of Helsinki4 6 7 17 35 31

THE SKILLS AND KNOWLEDGE I LEARNED AT UNIVERSITY CAN BE APPLIED WELL IN MY CURRENT
JOB, BY FIELD OF EDUCATION
80
Fully disagree Disagree Slightly disagree Slightly agree Agree Fully agree
Physical sciences3 5 5 17 34 36
Geology5 5 5 30 50 5
Chemistry0 2 8 31 33 25
Geography0 11 11 25 31 21
Mathematics1 7 5 25 42 20
Computer science0 2 5 17 54 23
Statistics0 6 0 31 44 19
Faculty of Science1 6 7 24 40 23
University of Helsinki3 5 8 25 36 23

THE STUDIES EQUIPPED ME SUFFICIENTLY FOR WORKING LIFE, BY FIELD OF EDUCATION
81
Fully disagree Disagree Slightly disagree Slightly agree Agree Fully agree
Physical sciences2 14 17 29 34 5
Geology5 15 20 30 30 0
Chemistry4 15 19 23 38 0
Geography4 7 26 40 21 2
Mathematics3 9 19 34 31 4
Computer science0 8 9 34 40 9
Statistics0 6 6 44 44 0
Faculty of Science3 10 18 33 32 4
University of Helsinki4 12 20 33 26 6

I WOULD RECOMMEND MY STUDIES TO OTHERS, BY FIELD OF EDUCATION
82
Fully disagree Disagree Slightly disagree Slightly agree Agree Fully agree
Physical sciences0 5 3 26 40 26
Geology0 10 10 15 60 5
Chemistry6 2 15 29 44 4
Geography0 11 10 33 36 10
Mathematics1 0 4 15 51 29
Computer science0 2 3 9 45 42
Statistics0 0 6 19 38 38
Faculty of Science1 4 7 22 44 22
University of Helsinki2 5 11 23 37 22

EMPLOYERS VALUE MY DEGREE, BY FIELD OF EDUCATION
Fully disagree Disagree Slightly disagree Slightly agree Agree Fully agree
Physical sciences3 2 3 17 43 32
Geology0 11 5 21 53 11
Chemistry2 4 8 24 42 20
Geography1 8 11 27 41 13
Mathematics0 2 3 12 35 48
Computer science2 3 3 22 35 35
Statistics0 0 0 19 62 19
Faculty of Science1 4 6 20 40 30
University of Helsinki2 4 6 19 37 31
83
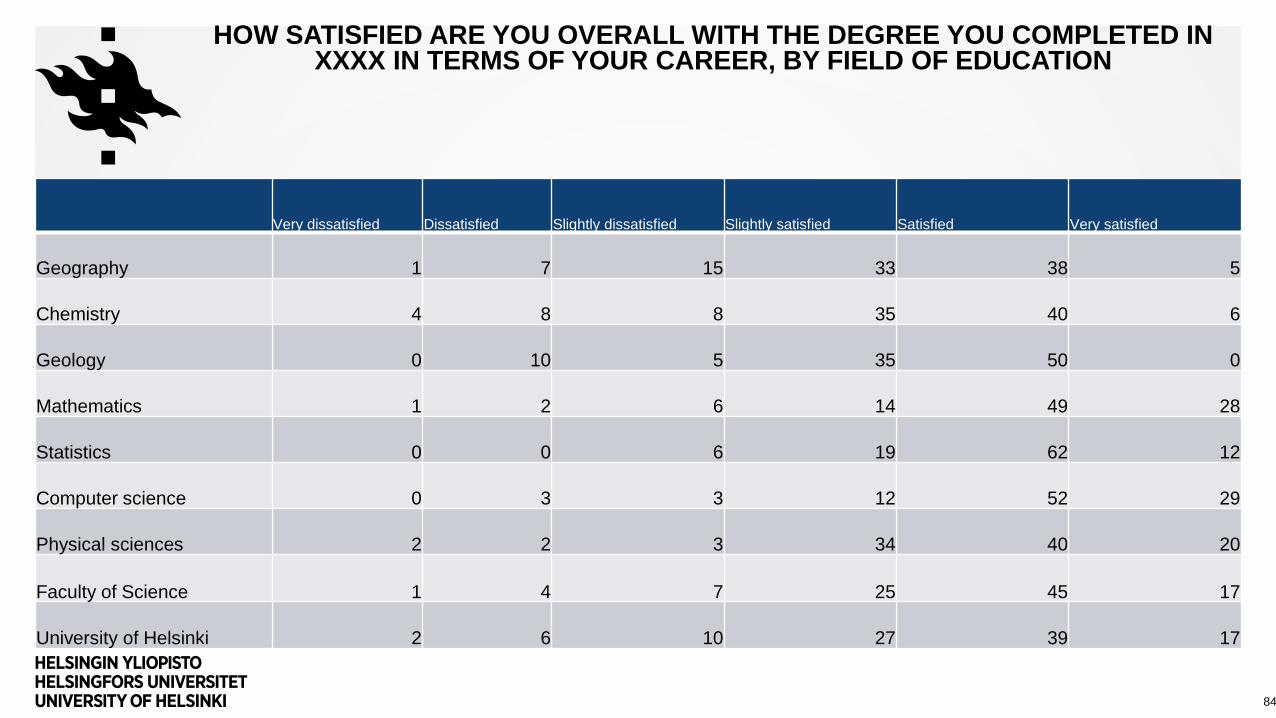
HOW SATISFIED ARE YOU OVERALL WITH THE DEGREE YOU COMPLETED IN XXXX IN TERMS OF YOUR CAREER, BY FIELD OF EDUCATION
Very dissatisfied Dissatisfied Slightly dissatisfied Slightly satisfied Satisfied Very satisfied
Geography 1 7 15 33 38 5
Chemistry 4 8 8 35 40 6
Geology 0 10 5 35 50 0
Mathematics 1 2 6 14 49 28
Statistics 0 0 6 19 62 12
Computer science 0 3 3 12 52 29
Physical sciences 2 2 3 34 40 20
Faculty of Science 1 4 7 25 45 17
University of Helsinki 2 6 10 27 39 17
84

HOW SATISFIED ARE YOU OVERALL WITH THE DEGREE YOU COMPLETED IN XXXX IN TERMS OF YOUR CAREER, SHARE OF SATISFIED RESPONDENTS BY
FACULTY AND YEAR OF GRADUATION
85
2003 2005 2007 2009 2011 2012 2013 2014
Biological and
Environmental Sciences 67 67 77 66 63 68 67 73
Veterinary Medicine97 93 96 84 81 90 96 100
Pharmacy92 96 87 93 89 92 91 89
Arts74 79 73 73 78 73 74 73
Educational Sciences84 85 89 86 88 87 82 90
Medicine93 91 95 97 98 94 95 91
Agriculture and Forestry72 79 79 80 79 85 76 81
Science84 87 84 83 87 86 85 89
Law92 92 96 92 93 91 97 91
Theology89 84 78 65 78 78 71 78
Social Sciences83 83 84 75 83 82 80 83
University of Helsinki83 85 84 82 84 83 81 83

FACTORS AFFECTING EMPLOYMENT, 2014 GRADUATES
Not applicable
Not important
at all
Only slightly
important Somewhat important
Moderately
important Important Very important
Activity and profiling in social
media 10 39 29 11 8 2 2
Practical training 19 19 12 13 8 19 9
Oganisational work hobbies 18 31 22 12 7 7 3
International experience 38 14 9 11 12 8 8
Contacts networks 4 9 19 17 18 17 16
Ability to tell people about your
skills 0 2 4 12 17 32 33
Other 72 11 1 4 3 3 7
Other work experience 3 10 12 12 18 21 23
Other studies training 15 22 19 10 5 14 14
Combination of subjects in your
degree 0 4 10 12 14 34 25
86