university of illinois student data bookuiuc).pdfuniversity of illinois student data book fall term...
TRANSCRIPT

University of Illinois Student Data Book
Fall Term 2004 With a Ten-Year Overview
Prepared by the University Office for Planning and Budgeting
March 2005

This report is available on the Internet (http://www.pb.uillinois.edu) and through the University Office for Planning and Budgeting, 506 S. Wright - Suite 338; Urbana, IL 61801; phone: 217-244-3174.

EXPLANATORY NOTES ON THE IMPACT OF THE UNIVERSITY STUDENT INFORMATION SYSTEM TRANSITION
ON STUDENT DATA REPORTING
Beginning in academic year 2003-04, the University began implementation of the Banner system for collecting and reporting student information at Chicago and Springfield. For the 2004-05 academic year, implementation of Banner across the three campuses was in place. The use of a new student information system as well as the transition between systems results in changes in the data reported in this book. Therefore, care must be taken in drawing conclusions based on comparisons of this year’s data and previous years’. In addition, the data reported in this book may not match data reported by the campuses or units who may have used different methodology or data extracted at a different point in the academic year. Under Banner, data are collected differently than they were in the past, the databases are created differently, and, in some cases, the definitions used to code the data were modified as well. Care was taken in rewriting the algorithms used in reporting to gather consistent data where possible, but differences may exist in spite of these efforts. Sources are noted and, where a different methodology is employed, the definitions are documented.
(i)

Urbana-Champaign Campus Table of Contents
List of Figures
UNIVERSITY OF ILLINOIS AT URBANA-CHAMPAIGN
TABLE OF CONTENTS LIST OF FIGURES CAMPUS ENROLLMENTS .......................Page CAMPUS ENROLLMENTS ..................... Page Highlights .......................................................................................81 Trend by Level ............................................................................82 By Level..........................................................................................82 Trend by New Student Category................................................83 Undergraduates by Admission Category......................................83 Change by Undergraduate College ...........................................84 Undergraduates by College...........................................................84 Trends by Gender.......................................................................86 Graduates by College and Level and Gender ..............................85 Undergraduate by College and Gender.....................................88 By Level and Gender ....................................................................86 Trends by Race/Ethnicity ...........................................................91 Undergraduates by College and Gender......................................87 Undergraduates by Geographic Origin......................................94 By Level and Race/Ethnicity..........................................................89 Professional/Graduate Students by Geographic Origin ............94 Percent Distribution by Race/Ethnicity..........................................90 Undergraduate by College, Sex, & Race/Ethnicity ......................92 Graduate & Professional by College, Sex, & Race/Ethnicity ......93 Geographic Origin of International Students.................................95 NEW STUDENT CHARACTERISTICS NEW STUDENT CHARACTERISTICS Highlights .......................................................................................97 Freshmen in Top Ten Percent of High School Class..............100 Beginning Freshmen by College of Entry .....................................98 Freshmen with ACT:C of 27 or Higher.....................................101 New Transfers by College of Entry ...............................................99 Freshmen by Illinois County of Origin......................................105 Beginning Freshmen by HSPR Distribution............................... 100 Transfers by Illinois Sending Community College...................106 Beginning Freshmen by ACT:C Scores..................................... 101 Freshmen by Geographic Origin..............................................107 Beginning Freshman Characteristics ......................................... 102 Professional/Graduate Students by Geographic Origin ..........107 New Transfer Student Characteristics ....................................... 103 New Professional/Graduate Student Characteristics ................ 104 ACADEMIC PERFORMANCE ACADEMIC PERFORMANCE Highlights .................................................................................... 109 One-Year Retention of Freshmen by College .........................110 Freshmen by Academic Status .................................................. 110 Retention Patterns....................................................................113 Transfer Student Performance................................................... 111 Retention of New Transfers .....................................................115 Retention Patterns for Beginning Freshmen ............................. 112 Retention Patterns by Gender.................................................... 113 Retention Patterns for New Transfer Students.......................... 114 DEGREES CONFERRED DEGREES CONFERRED Highlights .................................................................................... 117 Change by Level.......................................................................118 By Level....................................................................................... 118 Change in Bachelor's Degrees by College..............................119 Undergraduates by College........................................................ 119 By College and Gender .............................................................. 120 By Race/Ethnicity........................................................................ 121 By Race/Ethnicity and Level ...................................................... 122
(v)

EXPLANATORY NOTES FOR RETENTION AND GRADUATION
Graduation and retention rates are the result of many variables including academic performance, academic preparation, motivation, and academic integration. Other factors which seem to influence graduation and retention include part/full-time attendance, student age, family responsibilities, commuter/resident attendance, first-generation college attendance, socioeconomic status, employment, and indebtedness. The extent to which these factors combine and contribute to graduation and retention is not fully understood, but there is a considerable body of research documenting the complexities of the issue. Throughout recent history the graduation rate of students in the United States who enter a university as beginning freshmen and work toward bachelor's degrees from that same university four to six years later is approximately 50 percent. A freshman class with higher than average ability, motivation, preparation, and greater full-time attendance, etc., will graduate at higher rates than that average. The reverse is also true. However, there are no hard and fast prediction models. The intervening variables are numerous and interrelated. For example, high motivation certainly can overcome under-preparedness just as low motivation can negate high ability. Similarly, better academic preparation may be the result of high academic ability, or it may be the consequence of higher socioeconomic status, and thus a more positive high school environment. It is tempting to compare institution-wide graduation rates among universities without accounting for the makeup of the student body. The reader is cautioned not to make blanket comparisons, for example, in the graduation and retention rates provided in this Data Book for the University of Illinois campuses. The student bodies of the campuses are different, and thus comparisons among the three would parallel the proverbial apples-to-oranges relationship. One other caveat should be emphasized: Retention data presented in this and in previous Data Books were gathered from several different studies, each employing a slightly different methodology. The footnotes section of each table describes the definitions used for that table.
(vi)

Campus Enrollments UIUC
HIGHLIGHTS
• This fall, total enrollment at Urbana reached 39,545, the highest point in the decade, and after two falls at the highest enrollment up to that time. Undergraduate enrollment has risen steadily over the last ten years but moved sharply up in 2004 to 29,287, some 700 students more than last fall. Graduate enrollment fell during the 1990s, but has climbed since 2000 to number 9,188, a few students less than last year. Professional student enrollment has held steady over the decade, though this year’s enrollment (1,070) is slightly higher than last year’s. See Table 48 and Figure 39.
• New freshmen numbers rose sharply again this year, following last year’s large
increases. This year’s new freshmen class of 7,237 is a new high, larger by 25 percent than the 1994 class. New transfer numbers are again lower this fall. See Table 49 and Figure 40.
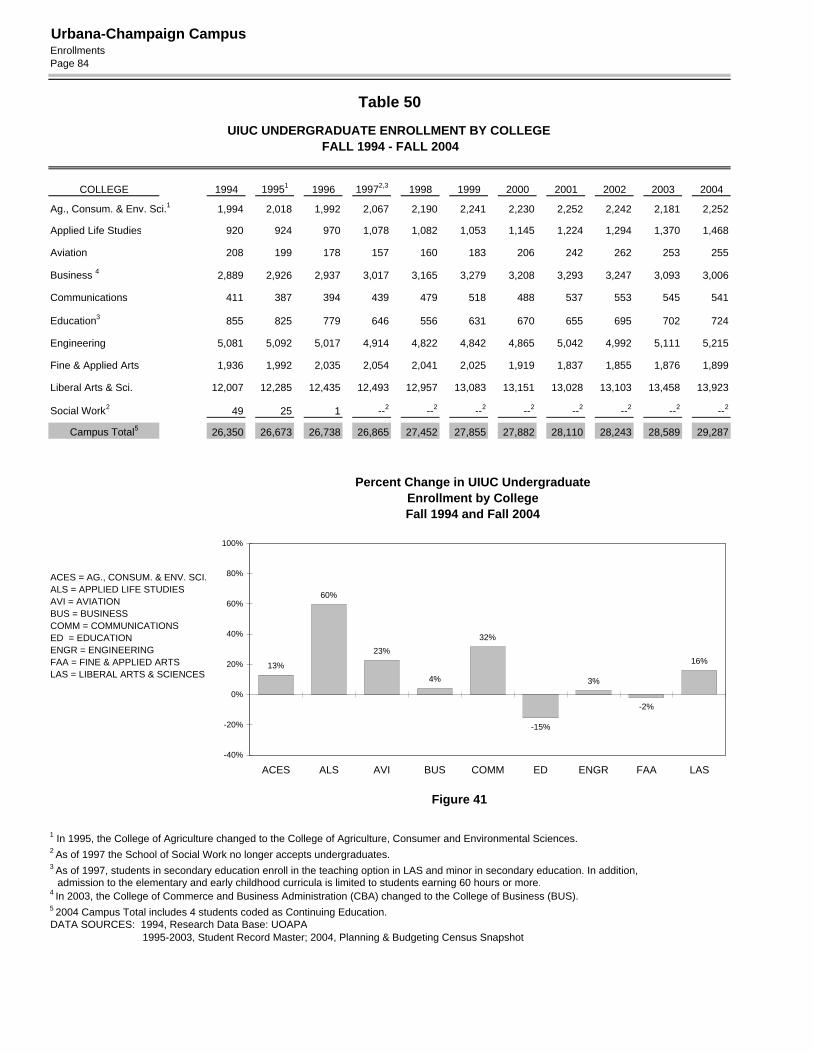
• Table 50 and Figure 41 show that fall 2004 undergraduate enrollment is higher
in most colleges than it was ten years ago. Table 51 displays fall 2004 graduate enrollment by college, level, and gender. In previous years, the College of Liberal Arts and Sciences enrolled the highest numbers of graduates, but this fall it was Engineering that enrolled the most students.
• Figures 42-45 and Tables 52-53 illustrate trends in enrollment by gender.
Males continue to outnumber females in the undergraduate and graduate populations; however, these gender gaps are smaller than they were ten years ago. Since the early nineties, Urbana has enrolled more female than male professional students, a gap that continued to widen until this year.
• In 2004, Black and Hispanic students represent 11.5 percent of all students —13.3 percent of undergraduates, 6.7 percent of graduate students, and 10.2 percent of professional students. While the representation of Black students was steady over the period and the percentage of Hispanic students rose slightly, International students are higher again by half. Asian professionals also increased dramatically. See Tables 54-55 and Figures 46-49.
• With over 18 percent Black and Hispanic students, Applied Life Studies and Liberal Arts and Sciences are the most diverse undergraduate colleges. Table 56 also shows that the College of Law enrolls a diverse student body with 15 percent Black and Hispanic students. Black and Hispanic graduate students enroll in Education predominately, at over 19 percent. See Table 57.
• Table 58 and Figures 50-51 show geographic origin. In-state students in 2004
represent 4 percentage points less than 1994 (92 to 88 percent).

Urbana-Champaign CampusEnrollmentsPage 82
Table 48UIUC FALL ENROLLMENT BY LEVEL
FALL 1994 - FALL 2004
LEVEL 1994 1995 1996 1997 1998 1999 2000 2001 2002 2003 2004
Undergraduate Freshman 6,982 7,351 7,254 6,872 7,396 7,728 7,142 7,010 7,000 7,413 7,603 Sophomore 5,490 5,554 5,815 5,851 5,602 5,860 6,238 5,963 5,875 5,947 6,402 Junior 6,278 6,193 6,215 6,473 6,567 6,427 6,794 7,100 6,972 6,845 6,705 Senior 7,050 7,078 6,981 7,137 7,441 7,424 7,342 7,634 8,002 8,005 8,219 Other 550 497 473 532 446 416 366 403 394 379 358
Subtotal 26,350 26,673 26,738 26,865 27,452 27,855 27,882 28,110 28,243 28,589 29,287
Graduate Grad I 4,193 4,542 4,440 4,332 4,104 4,000 3,796 3,844 3,965 3,820 3,863 Grad II 4,557 4,145 3,934 3,770 3,701 3,736 4,184 4,570 4,907 5,339 5,134 Nondegree 165 135 106 100 105 138 75 94 84 51 191
Subtotal 8,915 8,822 8,480 8,202 7,910 7,874 8,055 8,508 8,956 9,210 9,188
Professional 928 970 946 952 941 961 999 1,061 1,054 1,065 1,070
Campus Total 36,193 36,465 36,164 36,019 36,303 36,690 36,936 37,679 38,253 38,864 39,545
DATA SOURCES: 1994, Research Data Base: UOAPA 1995-2003, Student Record Master; 2004, Planning & Budgeting Census Snapshot
UIUC Fall Headcount Enrollment Fall 1994 - Fall 2004
0
5,000
10,000
15,000
20,000
25,000
30,000
35,000
Professional/Resident
Graduate
F2004F2004 F1994 F2004 Figure 39
F1994
Undergraduate
F1994

Urbana-Champaign CampusEnrollments
Page 83
Table 49UIUC FALL UNDERGRADUATE ENROLLMENT BY ADMISSION CATEGORY
FALL 1994 - FALL 2004
CATEGORY 1994 1995 1996 1997 1998 1999 2000 2001 2002 2003 2004 Beginning Freshmen 5,755 6,113 5,950 5,805 6,462 6,479 6,177 6,247 6,366 6,811 7,237
New Transfers 1,339 1,152 1,111 1,069 1,065 1,070 1,061 1,087 1,081 1,085 952
Readmits 541 466 452 427 449 361 378 396 391 391 335
Continuing Students 18,715 18,942 19,225 19,564 19,476 19,945 20,266 20,380 20,405 20,302 20,763
Total 26,350 26,673 26,738 26,865 27,452 27,855 27,882 28,110 28,243 28,589 29,287
Table 49.1
A COMPARISON OF FALL 1994 AND FALL 2004 UNDERGRADUATE ENROLLMENT AS A PERCENTAGE OF TOTAL ENROLLMENT
Change inLEVEL 1994 2004 % of Total
Beginning Freshmen 21.8% 24.7% 2.9
New Transfers 5.1% 3.3% (1.8)
Readmits 2.1% 1.1% (0.9)
Continuing Students 71.0% 70.9% (0.1)
TOTAL 100% 100%
Note: Totals may not equal 100.0% due to rounding.DATA SOURCES: 1994, Research Data Base: UOAPA 1995-2003, Student Record Master; 2004, Planning & Budgeting Census Snapshot
UIUC New Student Enrollment Fall 1994 - Fall 2004
0
1000
2000
3000
4000
5000
6000
7000
8000
F1994 F2004Figure 40
Beginning Freshmen
New Transfers
Readmits
Urbana-Champaign CampusEnrollmentsPage 84
Table 50
UIUC UNDERGRADUATE ENROLLMENT BY COLLEGE FALL 1994 - FALL 2004
COLLEGE 1994 19951 1996 19972,3 1998 1999 2000 2001 2002 2003 2004 Ag., Consum. & Env. Sci.1 1,994 2,018 1,992 2,067 2,190 2,241 2,230 2,252 2,242 2,181 2,252
Applied Life Studies 920 924 970 1,078 1,082 1,053 1,145 1,224 1,294 1,370 1,468
Aviation 208 199 178 157 160 183 206 242 262 253 255
Business 4 2,889 2,926 2,937 3,017 3,165 3,279 3,208 3,293 3,247 3,093 3,006
Communications 411 387 394 439 479 518 488 537 553 545 541
Education3 855 825 779 646 556 631 670 655 695 702 724
Engineering 5,081 5,092 5,017 4,914 4,822 4,842 4,865 5,042 4,992 5,111 5,215
Fine & Applied Arts 1,936 1,992 2,035 2,054 2,041 2,025 1,919 1,837 1,855 1,876 1,899
Liberal Arts & Sci. 12,007 12,285 12,435 12,493 12,957 13,083 13,151 13,028 13,103 13,458 13,923
Social Work2 49 25 1 --2 --2 --2 --2 --2 --2 --2 --2
Campus Total5 26,350 26,673 26,738 26,865 27,452 27,855 27,882 28,110 28,243 28,589 29,287
ACES = AG., CONSUM. & ENV. SCI.ALS = APPLIED LIFE STUDIESAVI = AVIATIONBUS = BUSINESSCOMM = COMMUNICATIONSED = EDUCATIONENGR = ENGINEERINGFAA = FINE & APPLIED ARTSLAS = LIBERAL ARTS & SCIENCES
1 In 1995, the College of Agriculture changed to the College of Agriculture, Consumer and Environmental Sciences.2 As of 1997 the School of Social Work no longer accepts undergraduates.3 As of 1997, students in secondary education enroll in the teaching option in LAS and minor in secondary education. In addition, admission to the elementary and early childhood curricula is limited to students earning 60 hours or more.4 In 2003, the College of Commerce and Business Administration (CBA) changed to the College of Business (BUS).5 2004 Campus Total includes 4 students coded as Continuing Education.DATA SOURCES: 1994, Research Data Base: UOAPA 1995-2003, Student Record Master; 2004, Planning & Budgeting Census Snapshot
Percent Change in UIUC UndergraduateEnrollment by CollegeFall 1994 and Fall 2004
13%
60%
23%
4%
32%
-15%
3%
-2%
16%
-40%
-20%
0%
20%
40%
60%
80%
100%
ACES ALS AVI BUS COMM ED ENGR FAA LAS
Figure 41

Urbana-Champaign CampusEnrollments
Page 85
Table 51
UIUC GRADUATE ENROLLMENT BY COLLEGE, LEVEL, AND GENDERFALL 2004
Grad I Grad II Non-DegreeCollege Num % Num % Num % Total %
Ag., Consum. & Env. Sci. Male 105 39.3 122 48.0 5 71.4 232 43.9Female 162 60.7 132 52.0 2 28.6 296 56.1Subtotal 267 254 7 528
Applied Life Studies Male 37 26.2 23 31.5 0 -- 60 28.0Female 104 73.8 50 68.5 0 -- 154 72.0Subtotal 141 73 0 214
Business Male 462 63.3 113 64.9 0 -- 575 63.6Female 268 36.7 61 35.1 0 -- 329 36.4Subtotal 730 174 0 904
Continuing Education Male 0 -- 0 -- 44 37.6 44 37.6Female 0 -- 0 -- 73 62.4 73 62.4Subtotal 0 0 117 117
Communications Male 16 27.6 24 48.0 0 -- 40 37.0Female 42 72.4 26 52.0 0 -- 68 63.0Subtotal 58 50 0 108
Education Male 19 29.2 225 29.6 2 66.7 246 29.7Female 46 70.8 535 70.4 1 33.3 582 70.3Subtotal 65 760 3 828
Engineering Male 629 83.0 1,417 83.7 19 90.5 2,065 83.5Female 129 17.0 276 16.3 2 9.5 407 16.5Subtotal 758 1,693 21 2,472
Fine & Applied Arts Male 315 47.4 51 42.5 2 25.0 368 46.4Female 350 52.6 69 57.5 6 75.0 425 53.6Subtotal 665 120 8 793
Law Male 15 46.9 2 66.7 0 -- 17 48.6Female 17 53.1 1 33.3 0 -- 18 51.4Subtotal 32 3 0 35
Liberal Arts & Sci. Male 189 39.9 1,037 54.8 19 61.3 1,245 51.9Female 285 60.1 855 45.2 12 38.7 1,152 48.1Subtotal 474 1,892 31 2,397
Veterinary Medicine Male 20 52.6 13 39.4 0 0.0 33 45.8Female 18 47.4 20 60.6 1 100.0 39 54.2Subtotal 38 33 1 72
School/InstituteAviation Male 2 50.0 0 -- 0 -- 2 50.0
Female 2 50.0 0 -- 0 -- 2 50.0Subtotal 4 0 0 4
Labor & Ind. Relations Male 53 39.3 3 21.4 0 -- 56 37.6Female 82 60.7 11 78.6 0 -- 93 62.4Subtotal 135 14 0 149
Library & Info. Science Male 64 28.8 15 33.3 0 -- 79 29.6Female 158 71.2 30 66.7 0 -- 188 70.4Subtotal 222 45 0 267
Social Work Male 26 9.5 4 17.4 0 -- 30 10.1Female 248 90.5 19 82.6 0 -- 267 89.9Subtotal 274 23 0 297
Total Male 1,952 50.5 3,049 59.4 91 47.6 5,092 55.4Female 1,911 49.5 2,085 40.6 100 1 52.4 4,096 44.6
Total1 3,863 5,134 191 9,188
In 2004 the definitions of Grad I and Grad II are based on the students' program, master's and doctoral, respectively. In previous years, the definitions were based on hours earned, fewer than eight units for Grad I and eight or more units for Grad II.1Three female non-degree students coded as Graudate College are included in the Campus Total.DATA SOURCE: Planning & Budgeting Census Snapshot

Urbana-Champaign CampusEnrollmentsPage 86
Table 52
UIUC FALL ENROLLMENT BY LEVEL AND GENDERFALL 1994 - FALL 2004
LEVEL 1994 1995 1996 1997 1998 1999 2000 2001 2002 2003 2004
UndergraduateMale 14,586 14,615 14,485 14,261 14,500 14,621 14,612 14,783 14,850 15,120 15,419
Female 11,764 12,058 12,253 12,604 12,952 13,234 13,270 13,327 13,393 13,469 13,868
Subtotal 26,350 26,673 26,738 26,865 27,452 27,855 27,882 28,110 28,243 28,589 29,287
GraduateMale 5,337 5,241 4,957 4,801 4,596 4,525 4,574 4,802 5,024 5,189 5,092
Female 3,578 3,581 3,523 3,401 3,314 3,349 3,481 3,706 3,932 4,021 4,096
Subtotal 8,915 8,822 8,480 8,202 7,910 7,874 8,055 8,508 8,956 9,210 9,188
ProfessionalMale 434 475 461 456 448 449 471 490 468 454 480
Female 494 495 485 496 493 512 528 571 586 611 590
Subtotal 928 970 946 952 941 961 999 1,061 1,054 1,065 1,070
Campus TotalMale 20,357 20,331 19,903 19,518 19,544 19,595 19,657 20,075 20,342 20,763 20,991
Female 15,836 16,134 16,261 16,501 16,759 17,095 17,279 17,604 17,911 18,101 18,554
Total 36,193 36,465 36,164 36,019 36,303 36,690 36,936 37,679 38,253 38,864 39,545
UIUC Enrollment Distribution by GenderFall 1994 - Fall 2004
DATA SOURCES: 1994, Research Data Base: UOAPA 1995-2003, Student Record Master 2004, Planning & Budgeting Census Snapshot
Undergraduate
20%
30%
40%
50%
60%
70%
80%
1994 1999 2004
Figure 42
Males
Females
53%
47%
Graduate
20%
30%
40%
50%
60%
70%
80%
1994 1999 2004
Figure 43
Males
Females
55%
45%
Professional
20%
30%
40%
50%
60%
70%
80%
1994 1999 2004
Figure 44
Males
Females 55%
45%

Urbana-Champaign CampusEnrollments
Page 87
Table 53
UIUC UNDERGRADUATE ENROLLMENT BY COLLEGE AND GENDERFALL 1994 - FALL 2004
COLLEGE 19941 19952 1996 19973,4 1998 1999 2000 2001 2002 2003 2004 Ag., Consum. Male 970 971 896 895 915 941 885 909 905 898 927& Env. Sci.2 Female 1,027 1,047 1,096 1,172 1,275 1,300 1,345 1,343 1,337 1,283 1,325
Subtotal 1,997 2,018 1,992 2,067 2,190 2,241 2,230 2,252 2,242 2,181 2,252
Applied Life Male 334 312 316 350 372 367 379 418 474 471 500Studies Female 587 612 654 728 710 686 766 806 820 899 968
Subtotal 921 924 970 1,078 1,082 1,053 1,145 1,224 1,294 1,370 1,468
Aviation Male 173 157 146 131 131 155 181 216 236 232 235Female 35 42 32 26 29 28 25 26 26 21 20Subtotal 208 199 178 157 160 183 206 242 262 253 255
Business 5 Male 1,588 1,607 1,620 1,677 1,758 1,831 1,768 1,816 1,826 1,759 1,740Female 1,294 1,319 1,317 1,340 1,407 1,448 1,440 1,477 1,421 1,334 1,266Subtotal 2,882 2,926 2,937 3,017 3,165 3,279 3,208 3,293 3,247 3,093 3,006
Communications Male 144 152 175 181 167 173 143 155 151 154 155Female 267 235 219 258 312 345 345 382 402 391 386Subtotal 411 387 394 439 479 518 488 537 553 545 541
Education4 Male 173 169 155 105 57 50 67 72 64 61 61Female 683 656 624 541 499 581 603 583 631 641 663Subtotal 856 825 779 646 556 631 670 655 695 702 724
Engineering Male 4,327 4,324 4,184 4,070 4,023 4,020 4,064 4,257 4,180 4,294 4,421Female 750 768 833 844 799 822 801 785 812 817 794Subtotal 5,077 5,092 5,017 4,914 4,822 4,842 4,865 5,042 4,992 5,111 5,215
Fine & Male 958 977 1,022 997 985 945 876 820 856 830 859Applied Arts Female 982 1,015 1,013 1,057 1,056 1,080 1,043 1,017 999 1,046 1,040
Subtotal 1,940 1,992 2,035 2,054 2,041 2,025 1,919 1,837 1,855 1,876 1,899
Liberal Arts Male 5,905 5,942 5,971 5,855 6,092 6,139 6,249 6,120 6,158 6,421 6,517& Sciences Female 6,101 6,343 6,464 6,638 6,865 6,944 6,902 6,908 6,945 7,037 7,406
Subtotal 12,006 12,285 12,435 12,493 12,957 13,083 13,151 13,028 13,103 13,458 13,923
Social Work3 Male 7 4 -- -- -- -- -- -- -- -- --Female 43 21 1 -- -- -- -- -- -- -- --Subtotal 50 25 1 -- -- -- -- -- -- -- --
CAMPUS Male 14,579 14,615 14,485 14,261 14,500 14,621 14,612 14,783 14,850 15,120 15,419Female 11,769 12,058 12,253 12,604 12,952 13,234 13,270 13,327 13,393 13,469 13,868
TOTAL6 26,348 26,673 26,738 26,865 27,452 27,855 27,882 28,110 28,243 28,589 29,287
1 The source of Fall 1994 data is different from the source of data in other table, thus totals vary slightly.2 In 1995, the College of Agriculture changed to the College of Agriculture, Consumer and Environmental Sciences.3 As of 1997 the School of Social Work no longer accepts undergraduates.4 As of 1997, students in secondary education enroll in the teaching option in LAS and minor in secondary education. In addition, admission to the elementary and early childhood curricula is limited to students earning 60 hours or more.5 In 2003, the College of Commerce and Business Administration (CBA) changed to the College of Business (BUS).6 Campus total figures for 2004 include 4 male students coded as Continuing Education.DATA SOURCES: 1994-2003: Student Records Master; 2004: Planning & Budgeting Census Snapshot

Urbana-Champaign CampusEnrollmentsPage 88
ACES = AGRICULTURE, CONSUMER & ENVIRONMENTAL SCIENCES 1
ALS = APPLIED LIFE STUDIESAVI = AVIATIONBUS = BUSINESS2
COMM = COMMUNICATIONSEDU = EDUCATION3
ENG = ENGINEERINGFAA = FINE & APPLIED ARTSLAS = LIBERAL ARTS AND SCIENCES
1 In 1995, the College of Agriculture changed to the College of Agriculture, Consumer and Environmental Sciences.2 In 2003, the College of Commerce and Business Administration (CBA) changed to the College of Business (BUS).3 As of 1997, students in secondary education enroll in the teaching option in LAS and minor in secondary education. In addition, admission to the elementary and early childhood curricula is limited to students earning 60 hours or more.
DATA SOURCE: 1994, Research Data Base: UOAPA; 2004, Planning & Budgeting Census Snapshot
Percent Distribution of Undergraduate Enrollmentby College and Gender
1994 and 2004
0%
20%
40%
60%
80%
100%
19942004
19942004
19942004
19942004
19942004
19942004
19942004
19942004
19942004
Male Female
ACES ALS AVI BUS COMM EDU ENG LASFAA
Figure 45

Urbana-Champaign CampusEnrollments
Page 89
Table 54
UIUC FALL ENROLLMENT BY LEVEL AND RACE/ETHNICITYFALL 1994 - FALL 2004
RACE/ETHNICITY 1994 1995 1996 1997 1998 1999 2000 2001 2002 2003 2004
Undergraduate Am.Ind./Alaskan Nat. 43 51 58 57 63 61 51 54 58 73 73 Asian/Pac. Islander 3,321 3,349 3,379 3,423 3,576 3,606 3,686 3,696 3,685 3,614 3,763 Black 1,844 1,866 1,910 1,949 2,017 2,020 1,957 1,935 1,991 2,145 1,991 Hispanic 1,422 1,456 1,418 1,414 1,450 1,499 1,590 1,643 1,699 1,819 1,859 White 18,910 19,234 19,179 19,139 19,411 19,716 19,558 19,509 19,434 19,326 19,841 International 438 437 482 507 540 542 649 871 952 1,129 1,287 Unknown 372 280 312 376 395 411 391 402 424 483 473
Subtotal 26,350 26,673 26,738 26,865 27,452 27,855 27,882 28,110 28,243 28,589 29,287
Graduate Am.Ind./Alaskan Nat. 18 18 24 18 16 14 13 14 13 17 23 Asian/Pac. Islander 477 515 473 432 402 416 373 379 453 533 594 Black 299 349 342 301 269 301 311 271 284 315 337 Hispanic 178 189 199 197 209 178 208 187 198 242 278 White 4,995 4,924 4,630 4,368 4,135 3,966 3,760 3,866 4,046 4,185 4,347 International 2,642 2,643 2,630 2,702 2,693 2,863 3,102 3,394 3,588 3,613 3,446 Unknown 306 184 182 184 186 136 288 397 374 305 163
Subtotal 8,915 8,822 8,480 8,202 7,910 7,874 8,055 8,508 8,956 9,210 9,188
Professional Am.Ind./Alaskan Nat. 4 2 0 0 2 1 1 1 0 1 4 Asian/Pac. Islander 56 53 54 57 50 47 49 51 66 91 125 Black 73 80 68 67 65 61 56 59 60 62 53 Hispanic 36 43 45 53 53 58 58 50 45 47 56 White 743 756 736 731 718 721 748 785 780 767 738 International 4 11 12 4 5 5 14 17 11 13 15 Unknown 12 25 31 40 48 68 73 98 92 84 79
Subtotal 928 970 946 952 941 961 999 1,061 1,054 1,065 1,070
Campus Total Am.Ind./Alaskan Nat. 65 71 82 75 81 76 65 69 71 91 100 Asian/Pac. Islander 3,854 3,917 3,906 3,912 4,028 4,069 4,108 4,126 4,204 4,238 4,482 Black 2,216 2,295 2,320 2,317 2,351 2,382 2,324 2,265 2,335 2,522 2,381 Hispanic 1,636 1,688 1,662 1,664 1,712 1,735 1,856 1,879 1,942 2,108 2,193 White 24,648 24,914 24,545 24,238 24,264 24,403 24,066 24,161 24,260 24,278 24,926 International 3,084 3,091 3,124 3,213 3,238 3,410 3,765 4,282 4,551 4,755 4,748 Unknown 690 489 525 600 629 615 752 897 890 872 715
Total 36,193 36,465 36,164 36,019 36,303 36,690 36,936 37,679 38,253 38,864 39,545
DATA SOURCES: 1994, Research Data Base: UOAPA 1995-2003, Student Record Master 2004, Planning & Budgeting Census Snapshot

Urbana-Champaign CampusEnrollmentsPage 90
Table 55UIUC FALL ENROLLMENT
PERCENT DISTRIBUTION BY RACE/ETHNICITYFALL 1994 - FALL 2004
RACE/ETHNICITY 1994 1995 1996 1997 1998 1999 2000 2001 2002 2003 2004
UndergraduateAm.Ind./Alaskan Nat. 0.2 0.2 0.2 0.2 0.2 0.2 0.2 0.2 0.2 0.3 0.2Asian/Pac. Islander 12.6 12.6 12.6 12.7 13.0 12.9 13.2 13.1 13.0 12.6 12.8Black 7.0 7.0 7.1 7.3 7.3 7.3 7.0 6.9 7.0 7.5 6.8Hispanic 5.4 5.5 5.3 5.3 5.3 5.4 5.7 5.8 6.0 6.4 6.5White 71.8 72.1 71.7 71.2 70.7 70.8 70.1 69.4 68.8 67.6 67.7International 1.7 1.6 1.8 1.9 2.0 1.9 2.3 3.1 3.4 3.9 4.4Unknown 1.4 1.0 0.8 1.4 1.4 1.5 1.4 1.4 1.5 1.7 1.6
Subtotal 100.0% 100.0% 100.0% 100.0% 100.0% 100.0% 100.0% 100.0% 100.0% 100.0% 100.0%
GraduateAm.Ind./Alaskan Nat. 0.2 0.2 0.3 0.2 0.2 0.2 0.2 0.2 0.1 0.2 0.3Asian/Pac. Islander 5.4 5.8 5.6 5.3 5.1 5.3 4.6 4.5 5.1 5.8 6.5Black 3.4 4.0 4.0 3.7 3.4 3.8 3.9 3.2 3.2 3.4 3.7Hispanic 2.0 2.1 2.3 2.4 2.6 2.3 2.6 2.2 2.2 2.6 3.0White 56.0 55.8 54.6 53.3 52.3 50.4 46.7 45.5 45.2 45.4 47.3International 29.6 30.0 31.0 32.9 34.0 36.4 38.5 39.9 40.1 39.2 37.5Unknown 3.4 2.1 2.1 2.2 2.4 1.7 3.6 4.7 4.2 3.3 1.8
Subtotal 100.0% 100.0% 100.0% 100.0% 100.0% 100.0% 100.0% 100.0% 100.0% 100.0% 100.0%
ProfessionalAm.Ind./Alaskan Nat. 0.4 0.2 0.0 0.0 0.2 0.1 0.1 0.1 0.0 0.1 0.4Asian/Pac. Islander 6.0 5.5 5.7 6.0 5.3 4.9 4.9 4.8 6.3 8.5 11.7Black 7.9 8.2 7.2 7.0 6.9 6.3 5.6 5.6 5.7 5.8 5.0Hispanic 3.9 4.4 4.8 5.6 5.6 6.0 5.8 4.7 4.3 4.4 5.2White 80.1 77.9 77.8 76.8 76.3 75.0 74.9 74.0 74.0 72.0 69.0International 0.4 1.1 1.3 0.4 0.9 0.5 1.4 1.6 1.0 1.2 1.4Unknown 1.3 2.6 3.3 4.2 5.1 7.1 7.3 9.2 8.7 7.9 7.4
Subtotal 100.0% 100.0% 100.0% 100.0% 100.0% 100.0% 100.0% 100.0% 100.0% 100.0% 100.0%
Campus TotalAm.Ind./Alaskan Nat. 0.2 0.2 0.2 0.2 0.2 0.2 0.2 0.2 0.2 0.2 0.3Asian/Pac. Islander 10.6 10.7 10.8 10.9 11.1 11.1 11.1 11.0 11.0 10.9 11.3Black 6.1 6.3 6.4 6.4 6.5 6.5 6.3 6.0 6.1 6.5 6.0Hispanic 4.5 4.6 4.6 4.6 4.7 4.7 5.0 5.0 5.1 5.4 5.5White 68.1 68.3 67.9 67.3 66.8 66.5 65.2 64.1 63.4 62.5 63.0International 8.5 8.5 8.6 8.9 8.9 9.3 10.2 11.4 11.9 12.2 12.0Unknown 1.9 1.3 1.5 1.7 1.7 1.7 2.0 2.4 2.3 2.2 1.8
Total 100.0% 100.0% 100.0% 100.0% 100.0% 100.0% 100.0% 100.0% 100.0% 100.0% 100.0%
Note: Totals may not equal 100.0% due to rounding.DATA SOURCES: 1994, Research Data Base: UOAPA 1995-2003, Student Record Master 2004, Planning & Budgeting Census Snapshot

Urbana-Champaign CampusEnrollments
Page 91
UIUC Minority Enrollment as a Percentage of Total EnrollementFall 1994 - Fall 2004
Graduate
0%
2%
4%
6%
8%
10%
12%
1994 2004
Asian
Black
Hispanic
American Indian/Alaskan Native
Figure 480%
2%
4%
6%
8%
10%
12%
1994 2004
Black
Asian
Hispanic
American Indian/Alaskan Native
Figure 49
Professional
Undergraduate
0%
5%
10%
15%
1994 2004
Asian/Pacific Islander
Black
Hispanic
American Indian/Alaskan Native
Figure 47
Campus Total
0%
5%
10%
15%
1994 2004
Asian/Pacific Islander
Black
Hispanic
American Indian/Alaskan Native
Figure 46

Urbana-Champaign CampusEnrollmentsPage 92
Table 56
UIUC UNDERGRADUATE AND PROFESSIONAL ENROLLMENTBY COLLEGE, SEX, AND RACE/ETHNICITY
FALL 2004
Race/Ethnicity
Undergraduate College SexAm. Ind./ AlaskNat.
Asian/ Pac. Isl. Black Hisp. White Int'l Unknown Total
Ag, Consum. & Env. Sci. Male 0 54 16 28 806 7 16 927
Female 1 68 63 43 1,101 28 21 1,325Subtotal 1 122 79 71 1,907 35 37 2,252
Applied Life Studies Male 1 23 58 27 382 4 5 500Female 4 37 134 55 723 11 4 968Subtotal 5 60 192 82 1,105 15 9 1,468
Aviation Male 0 11 6 8 204 3 3 235Female 0 1 1 4 13 0 1 20Subtotal 0 12 7 12 217 3 4 255
Business Male 3 231 55 98 1,187 143 23 1,740Female 2 236 60 70 782 101 15 1,266Subtotal 5 467 115 168 1,969 244 38 3,006
Communications Male 0 14 8 9 118 4 2 155Female 0 40 36 26 275 3 6 386Subtotal 0 54 44 35 393 7 8 541
Education Male 1 8 4 4 43 0 1 61Female 1 49 29 29 549 2 4 663Subtotal 2 57 33 33 592 2 5 724
Engineering Male 10 862 73 173 2,879 338 86 4,421Female 0 161 25 26 483 91 8 794Subtotal 10 1,023 98 199 3,362 429 94 5,215
Fine & Applied Arts Male 0 58 37 49 655 36 24 859Female 3 104 42 36 788 47 20 1,040Subtotal 3 162 79 85 1,443 83 44 1,899
Liberal Arts & Sci. Male 22 854 522 574 4,168 247 130 6,517Female 25 952 822 600 4,683 222 102 7,406Subtotal 47 1,806 1,344 1,174 8,851 469 232 13,923
Subtotal, Undergraduate1 73 3,763 1,991 1,859 19,841 1,287 473 29,287
Professional CollegeLaw Male 3 55 24 21 258 8 22 391
Female 1 55 27 29 143 5 22 282Subtotal 4 110 51 50 401 13 44 673
Veterinary Medicine Male 0 3 1 2 77 1 5 89Female 0 12 1 4 260 1 30 308Subtotal 0 15 2 6 337 2 35 397
Subtotal, Professional 4 125 53 56 738 15 79 1,070
1 Subtotal includes four students coded as Continuing Education; two are White and two are Unknown race/ethnicity.DATA SOURCE: Planning & Budgeting Census Snapshot

Urbana-Champaign CampusEnrollments
Page 93
Table 57UIUC GRADUATE ENROLLMENT
BY COLLEGE, SEX, AND RACE/ETHNICITYFALL 2004
Race/Ethnicity
College SexAm. Ind./ AlaskNat.
Asian/ Pac. Isl. Black Hisp. White Int'l Unknown Total
Ag, Consum. & Env. Sci. Male 0 7 1 3 131 85 5 232
Female 0 18 8 10 159 96 5 296Subtotal 0 25 9 13 290 181 10 528
Applied Life Studies Male 0 3 6 1 39 11 0 60Female 0 10 13 5 91 34 1 154Subtotal 0 13 19 6 130 45 1 214
Business Male 0 36 8 5 169 335 22 575Female 1 44 6 2 80 185 11 329Subtotal 1 80 14 7 249 520 33 904
Communications Male 0 1 1 0 23 13 2 40Female 0 3 4 7 37 17 0 68Subtotal 0 4 5 7 60 30 2 108
Continuing Education Male 2 4 2 1 33 0 2 44Female 0 6 4 1 50 0 12 73Subtotal 2 10 6 2 83 0 14 117
Education Male 2 7 40 15 121 50 11 246Female 3 23 67 36 274 164 15 582Subtotal 5 30 107 51 395 214 26 828
Engineering Male 2 172 25 35 794 1,019 18 2,065Female 0 39 7 15 111 229 6 407Subtotal 2 211 32 50 905 1,248 24 2,472
Fine & Applied Arts Male 2 16 10 17 252 62 9 368Female 2 27 13 12 231 134 6 425Subtotal 4 43 23 29 483 196 15 793
Law Male 0 0 0 0 0 17 0 17Female 0 1 0 0 0 17 0 18Subtotal 0 1 0 0 0 34 0 35
Liberal Arts & Sci. Male 2 79 25 38 670 415 16 1,245Female 3 71 29 47 541 456 5 1,152Subtotal 5 150 54 85 1,211 871 21 2,397
Veterinary Medicine Male 0 0 0 2 11 20 0 33Female 0 1 3 2 20 13 0 39Subtotal 0 1 3 4 31 33 0 72
School/InstituteAviation Male 0 0 0 0 1 1 0 2
Female 0 1 0 0 1 0 0 2Subtotal 0 1 0 0 2 1 0 4
Labor & Industrial Science Male 0 3 8 1 36 8 0 56Female 0 5 8 1 60 17 2 93Subtotal 0 8 16 2 96 25 2 149
Library & Information Science Male 1 3 2 2 59 12 0 79Female 1 11 8 10 125 26 7 188Subtotal 2 14 10 12 184 38 7 267
Social Work Male 0 0 1 2 26 1 0 30Female 1 3 38 8 200 9 8 267Subtotal 1 3 39 10 226 10 8 297
Subtotal, Graduate1 23 594 337 278 4,347 3,446 163 9,188
1 Graduate Subtotal includes three students coded as Graduate College; one American Indian/Alaskan Native and two White.DATA SOURCE: Planning & Budgeting Census Snapshot

GEOGRAPHICAL DISTRIBUTION OF UIUC STUDENT RESIDENCY
FALL 2004
2 - District of Columbia
UNDERGRADUATES
19 - District of Columbia
PROFESSIONAL & GRADUATE STUDENTS
SummaryUnited States
International
Total
SummaryUnited States
International
Total
6,602
3,461
10,258
8 - Rhode Island
4 - Delaware
3 - Rhode Island
4 - Delaware
Figure 51
27,790
1,287Other 205
29,287
Other 161
18
2418
185 33
26 - Connecticut
56
31
3
97
39
43 28
11
6
100 - Maryland
74
62
3
265
3
199
7
164 - New Jersey
11
113
25
142
30
20
58
12
5
44
104
11
3
68
33
5
60
3
17
25,628
27
39 20
329 46
39 - Connecticut
98
55
14
159
92
48 43
35
6
87 - Maryland
80 - Massachusetts184
102
14
148
13
318
11
89 - New Jersey
35
168
74
6
157
29
29
128
13
3
47
135
64
7
89
51
12
1135
11
9
3,569
3
Puerto Rico 34
2
Urbana-Champaign Campus
Page 94Enrollments
“Other” includes U.S. residents using foreign addresses, armed forces addresses, and unknown and not reported.DATA SOURCE: Planning & Budgeting Census Snapshot
GuamPuerto Rico
14
60 – Massachusetts
Figure 50

Urbana-Champaign CampusEnrollments
Page 95
Table 58GEOGRAPHICAL ORIGIN OF INTERNATIONAL STUDENTS
FALL 2004
Continent Country UG G/PR Total Continent Country UG G/PR TotalNorth/Central Belize -- 3 3 Africa Botswana -- 2 2America Barbados -- 1 1 (cont.) Burundi -- 1 1& W. Indies Canada 20 80 100 Burkina Faso -- 2 2
Costa Rica -- 3 3 Cameroon -- 3 3Dominican Republic -- 1 1 Congo, Dem. Rep. 1 -- 1El Salvador -- 1 1 Cote d'Ivoire -- 2 2Guatemala 1 4 5 Egypt 1 10 11Haiti -- 2 2 Ethiopia -- 6 6Honduras 1 5 6 Gambia -- 1 1Jamaica 2 3 5 Ghana -- 7 7Mexico 10 34 44 Kenya 2 11 13Nicaragua -- 1 1 Liberia -- 3 3Panama -- 3 3 Malawi -- 1 1St. Vincent & Grenadines -- 1 1 Mali 1 -- 1Trinidad & Tobago 1 4 5 Mauritius -- 1 1
South Argentina 2 57 59 Morocco -- 2 2America Bolivia -- 5 5 Niger -- 1 1
Brazil 5 54 59 Nigeria 3 6 9Chile -- 14 14 Senegal -- 2 2Colombia 1 38 39 Sierra Leone -- 2 2Ecuador 11 17 28 South Africa 2 9 11Guyana -- 2 2 Tunisia -- 1 1Peru -- 12 12 Tanzania 2 1 3Uruguay 1 5 6 Uganda -- 1 1Venezuela 3 11 14 Asia Bangladesh 2 11 13
Europe Albania -- 3 3 Cambodia -- 1 1Armenia -- 2 2 China, People's Rep. 51 793 844Austria 20 4 24 Hong Kong 54 21 75Azerbaijan 1 1 2 India 186 414 600Belarus -- 5 5 Indonesia 43 21 64Belgium 5 3 8 Iran 1 43 44Bulgaria -- 9 9 Israel 4 7 11Croatia -- 5 5 Japan 47 55 102Cyprus 2 8 10 Jordan 4 4 8Czech Republic 1 5 6 Kazakhstan 1 2 3Denmark 2 4 6 Kuwait -- 1 1Estonia -- 1 1 Lebanon -- 15 15Finland -- 1 1 Macau 5 2 7France 20 28 48 Malaysia 87 10 97Georgia -- 3 3 Mongolia -- 2 2Germany, Dem. Rep. of 24 36 60 Myanmar 3 2 5Greece -- 25 25 Nepal 2 5 7Iceland 1 -- 1 Oman 1 -- 1Ireland 1 7 8 Pakistan 17 17 34Italy 4 11 15 Palestinian Authority 1 1 2Lithuania 1 2 3 Philippines 2 10 12Netherlands 5 4 9 Saudi Arabia 1 7 8Norway 4 -- 4 Singapore 60 36 96Poland 4 8 12 South Korea 373 694 1,067Portugal 2 2 4 Sri Lanka 2 7 9Russia 6 23 29 Syria -- 3 3Romania 1 38 39 Taiwan 45 277 322Serbia and Montenegro 1 16 17 Thailand 6 65 71Slovakia -- 1 1 Turkey 12 129 141Spain 3 30 33 United Arab Emirates 1 -- 1Sweden 3 3 6 Uzbekistan -- 3 3Switzerland 2 1 3 Vietnam 11 33 44Ukraine 1 12 13 Oceania Australia 13 6 19United Kingdom 60 19 79 Fiji -- 1 1
Africa Algeria -- 1 1 New Zealand 8 6 14
TOTAL 1,287 3,461 4,748
DATA SOURCE: Planning & Budgeting Census Snapshot

Page 96
This page intentionally left blank.

New Student Characteristics UIUC HIGHLIGHTS
• At 7,237, the 2004 freshman class is the largest of the past ten years, some 1,000 students larger than 2001 and 26 percent greater than ten years ago. See Table 59.
• Beginning freshman enrollment in 2004 compared to ten years ago is
higher in most colleges. The largest college, Liberal Arts and Sciences -- almost half again as large as in 1994 -- has added more than 300 students per year for the last three years. The second largest college, Engineering, enrolled virtually the same number of new freshmen as last year. See Table 59.
• Table 60 and 60.1 show that 2004 new transfer enrollment (952
students) is almost 30 percent lower than 1994, dropping below 1,000 for the first time in the period.
• UIUC continues to attract top high school graduates, as illustrated in
Tables 61 and 62 and Figures 52 and 53. However, the reader is warned that a new methodology and data collection was used this year, so the data may not be comparable across years. The mean high school percentile rank for new freshmen in 2004 is 86.6 after three years above 87.0. The mean ACT composite score for 2004 freshman is 27.5, which, like the last two years, is higher than earlier years in the period and more than seven points above the state average.
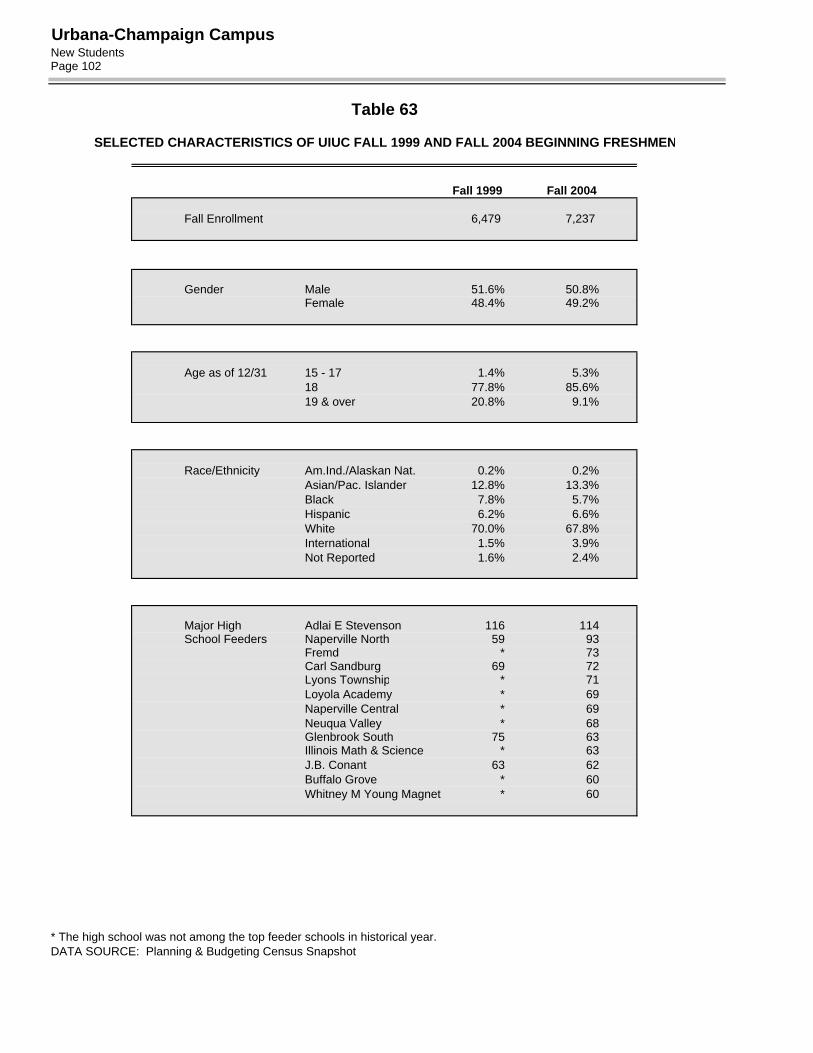
• Tables 63-65 present selected demographics of the fall 1999 and 2004
new students. Parkland College (207) and the College of DuPage (45) send the largest numbers of transfer students to UIUC.
• Geographic characteristics such as origin, residency, and transfer
institution are mapped in Figures 54-56. Cook County (2,496) and the five collar counties of the Chicago metropolitan area (2,169) provide the largest number of beginning freshmen; however, large numbers of students come from several downstate counties—Champaign (250); McLean (109); Peoria (99); Sangamon (94); and Madison and St. Clair (171 combined). Only five counties did not send students to UIUC.
• Geographic origin in the U.S. is illustrated in the maps of Figure 56.
Eighty-nine percent of new freshmen in 2004 came from Illinois compared to 36 percent of new graduate and professional students.

Urbana-Champaign CampusNew StudentsPage 98
Table 59UIUC BEGINNING FRESHMEN BY COLLEGE OF ENTRY
FALL 1994 - FALL 2004
COLLEGE 1994 19951 1996 19972 1998 1999 2000 2001 2002 2003 2004 Ag., Consum. & Env. Sci.1 495 538 489 524 579 603 574 550 568 552 604
Applied Life Studies 176 170 171 177 169 165 181 163 171 181 233
Aviation 52 64 58 56 76 77 73 61 65 57 61
Business3 575 640 598 624 637 612 634 650 578 587 621
Education2 188 157 180 124 112 155 148 134 166 159 155
Engineering 1,149 1,139 1,112 1,001 1,054 1,128 1,050 1,356 1,105 1,229 1,221
Fine & Applied Arts 446 453 471 469 466 445 403 404 463 466 419
Liberal Arts & Sci. 2,674 2,952 2,871 2,830 3,369 3,294 3,114 2,929 3,250 3,580 3,923
Total 5,755 6,113 5,950 5,805 6,462 6,479 6,177 6,247 6,366 6,811 7,237
Table 59.1
CHANGE IN UIUC BEGINNING FRESHMAN ENROLLMENTS BY COLLEGE OF ENTRY BETWEEN FALL 1994 AND FALL 2004
COLLEGE 1994 2004 % Change
Ag., Consum. & Env. Sci.1 495 604 22.0
Applied Life Studies 176 233 32.4
Aviation 52 61 17.3
Business3 575 621 8.0
Education2 188 155 (17.6)
Engineering 1,149 1,221 6.3
Fine & Applied Arts 446 419 (6.1)
Liberal Arts & Sci. 2,674 3,923 46.7
5,755 7,237 25.8
1 In 1995, the College of Agriculture changed to the College of Agriculture, Consumer and Environmental Sciences.2 As of 1997, students in secondary education enroll in the teaching option in LAS and minor in secondary education. In addition, admission to the elementary and early childhood curricula is limited to students earning 60 hours or more. 3 In 2003, the College of Commerce and Business Administration (CBA) changed to the College of Business (BUS).DATA SOURCES: 1994, Research Data Base: UOAPA 1995-2003, Student Record Master 2004, Planning & Budgeting Census Snapshot

Urbana-Champaign CampusNew Students
Page 99
Table 60UIUC NEW TRANSFERS BY COLLEGE OF ENTRY
FALL 1994 - FALL 2004
COLLEGE 1994 1995 1996 1997 1998 1999 2000 2001 2002 2003 2004Ag., Consum. & Env. Sci.1 122 118 108 95 108 108 100 110 95 78 84
Applied Life Studies 43 51 53 53 38 55 54 53 51 66 56
Aviation 22 17 19 12 17 15 11 3 7 14 16
Business2 102 105 106 100 103 118 118 127 119 98 102
Communications 24 25 21 18 24 34 22 30 21 25 17
Education3 50 56 36 27 16 32 30 23 34 18 20
Engineering 303 266 263 250 235 221 231 215 218 205 210
Fine & Applied Arts 128 119 119 89 92 118 90 94 92 84 72
Lib. Arts & Sciences 530 395 386 425 432 369 405 432 444 497 375
Social Work4 15 -- -- -- -- -- -- -- -- -- --
Total 1,339 1,152 1,111 1,069 1,065 1,070 1,061 1,087 1,081 1,085 952
Table 60.1CHANGE IN UIUC NEW TRANSFER ENROLLMENT BY COLLEGE OF ENTRY
BETWEEN FALL 1994 AND FALL 2004
COLLEGE 1994 2004 % Change
Ag., Consum. & Env. Sci.1 122 84 (31.1)
Applied Life Studies 43 56 30.2
Aviation 22 16 (27.3)
Business4 102 102 0.0
Communications 24 17 (29.2)
Education2 50 20 (60.0)
Engineering 303 210 (30.7)
Fine & Applied Arts 128 72 (43.8)
Lib. Arts & Sciences 530 375 (29.2)
Social Work3 15 -- --
1,339 952 (28.9)
1 In 1995, the College of Agriculture changed to the College of Agriculture, Consumer and Environmental Sciences.2 In 2003, the College of Commerce and Business Administration (CBA) changed to the College of Business (BUS).3 As of 1997, students in secondary education enroll in the teaching option in LAS and minor in secondary education. In addition, admission to the elementary and early childhood curricula is limited to students earning 60 hours or more.4 As of 1995, The School of Social Work no longer accepts undergraduates.DATA SOURCES: 1994, Research Data Base: UOAPA 1995-2003, Student Record Master 2004, Planning & Budgeting Census Snapshot

Urbana-Champaign CampusNew StudentsPage 100
Table 61UIUC BEGINNING FRESHMEN BY
HIGH SCHOOL PERCENTILE RANK DISTRIBUTION AND MEANSFALL 1994 - FALL 2004
QUARTILE 1994 1995 1996 1997 1998 1999 2000 2001 2002 2003 2004* Upper Quartile 85.2 85.4 86.9 87.2 85.9 86.1 85.5 86.3 87.3 86.2 86.3
Second Quartile 13.6 13.5 11.9 12.0 13.1 12.5 13.1 12.4 11.5 12.5 12.7
Third Quartile 1.1 1.0 1.1 0.8 1.0 1.2 1.4 1.2 1.0 1.2 0.9
Fourth Quartile 0.0 0.1 0.1 0.0 0.0 0.1 0.1 0.0 0.1 0.0 0.1
Total 100.0% 100.0% 100.0% 100.0% 100.0% 100.0% 100.0% 100.0% 100.0% 100.0% 100.0%
Mean HSPR 86.4 86.4 86.9 87.3 86.5 86.4 86.9 87.5 87.6 87.6 86.6
ACES = AG., CONSUM. AND ENV. SCI.ALS = APPLIED LIFE STUDIESAVI = AVIATIONBUS = BUSINESSED = EDUCATIONENGR = ENGINEERINGFAA = FINE & APPLIED ARTSLAS = LIBERAL ARTS & SCIENCES
Note: Totals may not equal 100.0% due to rounding.* Data are not comparable to previous reports due to differences in the source and methodology. This report includes all freshman with high school percentile ranks while previous reports included only students with both high school rank and ACT score.
DATA SOURCES: Freshman Class Profile, 1994-2003: UOAPA 2004, Planning & Budgeting Census Snapshot
Percent of Fall 2004 Beginning Freshmenfrom Top Ten Percent of H.S. Class
by College of Entry*
25.3%
52.6%
20.3%
65.4%60.4%
65.8%
35.8%
48.5%
0%
20%
40%
60%
80%
100%
ACES ALS AVI BUS ED ENGR FAA LAS
Figure 52

Urbana-Champaign CampusNew Students
Page 101
Table 62
UIUC BEGINNING FRESHMEN BYACT COMPOSITE SCORE DISTRIBUTION AND GROUP MEAN
FALL 1994 - FALL 2004
COMPOSITE SCORE 1994 1995 1996 1997 1998 1999 2000 2001 2002 2003 2004* Above 32 3.5 2.5 3.7 4.0 4.1 4.1 5.3 6.3 7.1 8.3 6.8
30 - 32 18.7 14.2 18.8 19.8 20.0 19.2 20.6 22.9 23.3 25.3 22.1
27 - 29 32.7 29.9 33.0 33.7 34.0 34.2 33.8 31.8 31.7 31.7 34.9
24 - 26 27.9 29.9 28.0 26.2 25.8 26.3 24.9 23.4 23.8 20.3 24.3
21 - 23 11.9 13.9 10.0 10.8 10.9 10.7 9.7 9.6 9.0 8.6 8.1
18 - 20 4.3 6.4 4.9 4.0 3.8 4.0 4.1 4.6 3.7 4.3 2.9
Below 18 1.0 3.1 1.6 1.5 1.4 1.4 1.4 1.4 1.4 1.4 1.0
Total 100.0% 100.0% 100.0% 100.0% 100.0% 100.0% 100.0% 100.0% 100.0% 100.0% 100.0%
Mean ACT:C 26.7 26.6 26.7 26.8 26.9 26.8 27.1 27.2 27.4 27.6 27.5
Illinois Mean ACT:C1 21.1 21.1 21.2 21.2 21.4 21.4 21.5 21.6 20.1 20.2 20.3
ACES = AG., CONSUM. & ENV. SCIENCESALS = APPLIED LIFE STUDIESAVI = AVIATIONBUS = BUSINESSED = EDUCATIONENGR = ENGINEERINGFAA = FINE & APPLIED ARTSLAS = LIBERAL ARTS & SCIENCES
* Data are not comparable to previous reports due to differences in the source and methodology. This report includes all freshman bringing an ACT score -- no SAT equivalents -- while prior reports included only students with both high school rank and ACT score. 1 Starting with the 2002 graduating class, all Illinois high school students are required to take the Prairie State Assessment Exam, which included the ACT; therefore, Illinois mean scores may not be comparable across years. Note: Totals may not equal 100.0% due to roundingDATA SOURCES: Freshman Class Profile, 1994-2003: UOAPA 2004, Planning & Budgeting Census Snapshot
Percent of Fall 2004 Beginning Freshmenwith ACT:C Score of 27 or Higher
by College of Entry*
50.4%47.4%
77.7%
55.6%
93.9%
54.3%59.3%
42.9%
0%
20%
40%
60%
80%
100%
ACES ALS AVI BUS ED ENGR FAA LAS
Figure 53
Urbana-Champaign CampusNew StudentsPage 102
Table 63
SELECTED CHARACTERISTICS OF UIUC FALL 1999 AND FALL 2004 BEGINNING FRESHMEN
Fall 1999 Fall 2004
Fall Enrollment 6,479 7,237
Gender Male 51.6% 50.8%Female 48.4% 49.2%
Age as of 12/31 15 - 17 1.4% 5.3%18 77.8% 85.6%19 & over 20.8% 9.1%
Race/Ethnicity Am.Ind./Alaskan Nat. 0.2% 0.2%Asian/Pac. Islander 12.8% 13.3%Black 7.8% 5.7%Hispanic 6.2% 6.6%White 70.0% 67.8%International 1.5% 3.9%Not Reported 1.6% 2.4%
Major High Adlai E Stevenson 116 114School Feeders Naperville North 59 93
Fremd * 73Carl Sandburg 69 72Lyons Township * 71Loyola Academy * 69Naperville Central * 69Neuqua Valley * 68Glenbrook South 75 63Illinois Math & Science * 63J.B. Conant 63 62Buffalo Grove * 60Whitney M Young Magnet * 60
* The high school was not among the top feeder schools in historical year.DATA SOURCE: Planning & Budgeting Census Snapshot

Urbana-Champaign CampusNew Students
Page 103
Table 64
SELECTED CHARACTERISTICS OF UIUC TRANSFER STUDENTS
Fall 1999 Fall 2004
Fall Enrollment 1,010 952
Transfer GPA1 3.26 - 4.00 56.0% 69.0%2.76 - 3.25 33.8% 24.4%2.26 - 2.75 8.5% 4.6%Below 2.26 1.7% 2.0%
Gender Male 56.7% 60.9%Female 43.3% 39.1%
Age as of 12/31 Less than 20 9.3% 12.7%20 - 21 68.6% 62.6%22 - 23 11.4% 10.9%24 - 29 8.1% 10.4%30 and over 2.6% 3.4%
Race/Ethnicity Am.Ind./Alaskan Nat. 0.4% 0.1%Asian/Pac. Islander 9.0% 10.9%Black 2.4% 2.7%Hispanic 3.8% 3.6%White 82.1% 68.7%International 0.2% 9.2%Not Reported 2.2% 4.7%
Class Level Advanced Freshman 3.4% 6.1%at Transfer1 Sophomore2 21.2% 22.0%
Junior 69.1% 63.5%Senior 6.3% 8.4%
Current Parkland College 165 207Major Feeder College of DuPage 64 45Institutions W. R. Harper College 27 32
Illinois Central College 37 30U I at Chicago 44 27Joliet Junior College 15 22Illinois State University 18 20Black Hawk College 18 19Moraine Valley CC 31 18Lincoln Land CC 15 17
1 Unknown/not reported are not included in the distribution2 Most transfers at the sophomore level (30-59 credits earned), transfer 55 to 59 hours.DATA SOURCE: Planning & Budgeting Census Snapshot

Urbana-Champaign CampusNew StudentsPage 104
Table 65
SELECTED CHARACTERISTICS OF UIUC FALL 2004 NEW PROFESSIONAL AND GRADUATE STUDENTS 1
Grad I Grad II ProfFall Enrollment 1,355 812 330
Gender Male 52.2% 58.9% 52.4%Female 47.8% 41.1% 47.6%
Age Less than 23 40.4% 31.2% 40.9%23 - 24 23.2% 26.2% 29.7%25 - 29 22.3% 29.6% 20.9%30 - 39 12.0% 10.3% 7.3%40 & over 2.1% 2.7% 1.2%
Race/Ethnicity Am.Ind./Alaskan Nat. 0.4% 0.5% 0.6%Asian/Pac. Islander 8.0% 4.9% 17.0%Black 3.8% 4.1% 3.3%Hispanic 2.7% 3.0% 6.4%White 55.2% 41.6% 56.7%International 27.7% 44.0% 2.1%Unknown 2.1% 2.0% 13.9%
In 2004, the definitions of Grad I and Grad II are based on a student's program, master's and doctoral, respectively In previous years, the definitions were based on hours earned, fewer than eight units for Grad I and eight or more units for Grad II.Profesional includes students in the Colleges of Law and Veterinary Medicine1 Excludes non-degree students.DATA SOURCE: Planning & Budgeting Census Snapshot

BOONE McHENRY LAKEWINNEBAGOSTEPHENSONJO DAVIESS
CARROLL OGLEDEKALB KANE COOK
WHITESIDELEE
DU PAGE
KENDALL WILL
ROCK ISLAND
HENRY BUREAULA SALLE
GRUNDY
MERCERKANKAKEE
HENDER-SON
WARREN
KNOX STARKMARSHALL LIVINGSTON
PEORIAWOODFORD
IROQUOIS
HANCOCK McDONOUGH
FULTON
TAZEWELL
McLEAN
FORD
ADAMS
SCHUYLER
MASON
LOGANDEWITT PIATT
CHAMPAIGN
VERMILION
BROWN CASS
DOUGLAS EDGAR
COLES
CLARK
CUMBERLAND
2EFFINGHAM JASPER
CRAWFORD
RICHLAND LAWRENCE
WABASH
ED
WAR
DS
WHITE
SALINE GALLATIN
2POPE HARDIN
WILLIAMSON
FRANKLIN
JEFFERSON
MARION
FAYETTE
WAYNE
HAMILTONRANDOLPH PERRY
JACKSON
UNION JOHNSON
ALEX-ANDER
1
PULASKI
1MASSAC
PIKEMORGAN
MONROE
ST. CLAIR
WASHINGTON
CLINTON
BOND
MONTGOMERY
SHELBY
MOULTRIE
CHRISTIAN
MACON
SANGAMON
MACOUPINGREENE
SCOTT
1
JERSEY
CAL-HOUN
MADISON
MENARD
PUTNAM
CLAY
Figure 54
24
3
21
1
14
3
4
250
8
5
13
19
2,496
5
35
11
14
907
5
175
12
5
4
4
34
4
24
13
15
5
6
7
5
173
40
31
19
550
52
13
22
14
6
174
109
41
6
89
6
9
7
4
6
2
20
8
18 9
15
99
5
15
4
5
7
1
51
82
1
94
4
3
2
12
55
3
29
3
3
53
4
21
365
90
20
10
2
Urbana-Champaign CampusNew Students
Page 105
UIUC First-Time FreshmenBy Illinois County of Origin
Fall 2004
Total = 6,449
DATA SOURCE: Planning & Budgeting Census Snapshot
Summary – All FreshmenIL Freshmen 6,449
(incl.county not avail.)Out-of-State & Int’l. 788
Total 7,237
1
1
1

HighlandRock Valley
McHenryLake County
Sauk Valley Kishwaukee
Black Hawk
Carl Sandburg
Spoon River
John Wood
Illinois Central
Illinois Valley
Lewis & Clark
Southwestern
Shawnee
John A. LoganSoutheastern
Rend Lake
Kaskaskia
Lake Land
Lincoln Land
Richland
Parkland Danville
Kankakee
Prairie StateJoliet
South Suburban
Du Page Moraine ValleyWaubonsee
MortonTriton
Elgin
Harper
Oakton010
8
6
2111
1
2
2 17
15
2
11
0
64
2
5
9
5
3
4
18
0835
458
22
4
16
16
6
207
30
City Colleges of Chicago
9
Summary - All Transfers
IL Community CollegesIL Public UniversitiesIL Private InstitutionsOut of State/Unknown
Total
591112
45204
952
6
WabashValley
1
Olney11
Lincoln
5
Heartland3
Trail
Lincoln1
Urbana-Champaign CampusNew StudentsPage 106
Illinois Community College TransfersFirst-Time Undergraduate Transfers to UIUC
FALL 2004
Total = 591
DATA SOURCE: Planning & Budgeting Census Snapshot
Figure 55
Frontier
0
Note: One private, lower-division institution, Lincoln, is included in the display.
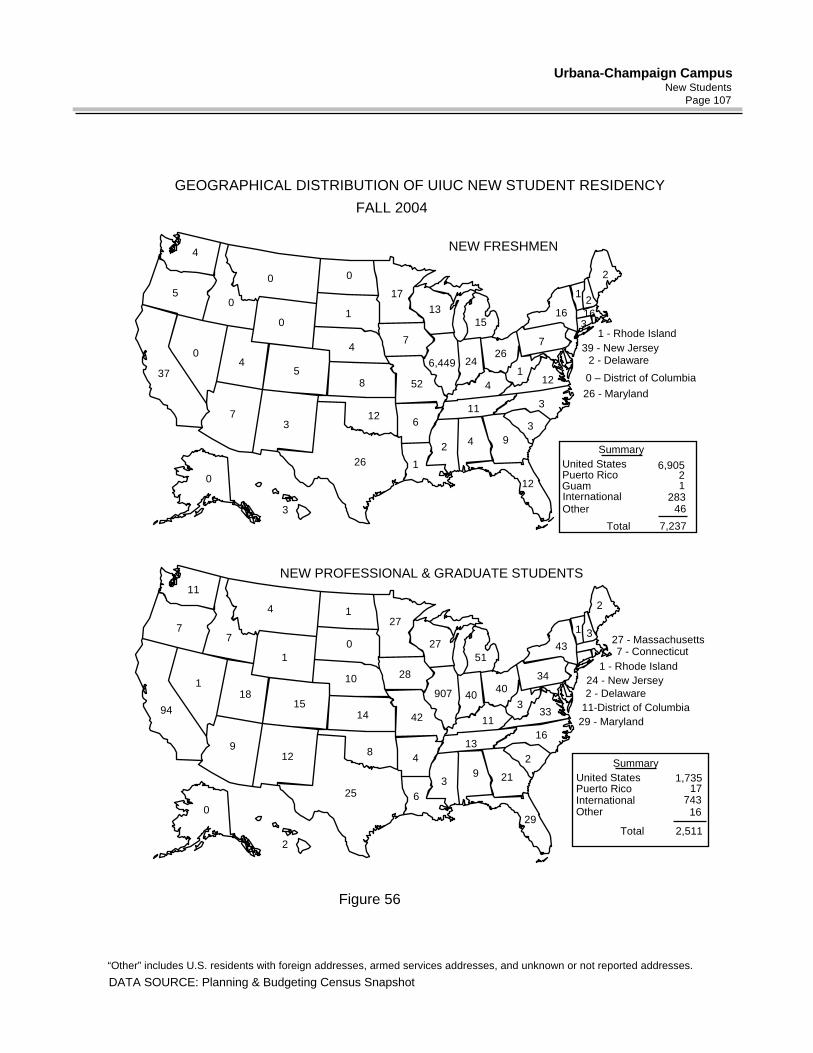
GEOGRAPHICAL DISTRIBUTION OF UIUC NEW STUDENT RESIDENCYFALL 2004
NEW FRESHMEN
NEW PROFESSIONAL & GRADUATE STUDENTS
Figure 56
0
0
11-District of Columbia
4
76
37 5
16
12
6,449 24
7
8 4
1
26 - Maryland
315
17
2
52
4
2
39 - New Jersey
3
16
3
26
12
5
71 - Rhode Island
3
1
11
26
4
1
12
0
3
94
94 15
29
21
907 40
28
14 11
6
2
29 - Maryland
27 - Massachusetts
51
27
3
42
4
101
3
24 - New Jersey
12
43
16
40
8
7
341 - Rhode Island
2
0
13
25
18
1
33
11
271
0
2
0
0
1
1
3
0
4
2
United StatesSummary
Puerto Rico
International
Total
6,90521
Other283
United StatesSummary
Puerto RicoInternational
Total
1,73517
743
2,511
Other 16
7,237
Urbana-Champaign CampusNew Students
Page 107
DATA SOURCE: Planning & Budgeting Census Snapshot
7
0 – District of Columbia
13
9
2 - Delaware
9
7 - Connecticut
2 - Delaware
Guam
46
“Other” includes U.S. residents with foreign addresses, armed services addresses, and unknown or not reported addresses.

Page 108
This page intentionally left blank.

Academic Performance UIUC HIGHLIGHTS
• One-year retention rates by college are reported in Table 66 and Figure 57. Overall, over 92 percent of the 2003 freshman class returned after the first year.
• Table 67 tracks the mean grade point averages for the 1987
transfers from community colleges and four-year institutions for six semesters after transfer. The community college transfers dropped over one-half of a grade point the first semester, but the group average improved in the succeeding terms.
• Graduation and retention patterns are reported in Tables 68-
69 and Figure 58 for beginning freshmen. The seven-year graduation rate for the 1997 cohort, 81 percent, is higher than that of any of the five immediately previous cohorts. The five-year trend has moved higher for several years; at approximately 78 percent, the most recent cohorts (1997-1999) are as much as 4 percentage points higher than those that entered in the early nineties. The percentage graduated in five years for the 1999 cohort exceeds the seven-year graduation rate for some earlier cohorts.
• Table 69 demonstrates that women succeed at a higher rate
than men and on average men are enrolled longer than women. For the cohort that started in 1999, women graduated at 82 percent five years after matriculation, compared to a rate of less than 75 percent for men. However, almost 4 percent of men were still enrolled compared to just over 1 percent of women.
• For transfers, the graduation rate after four years for the fall
1991 cohort is almost 70 percent including about 1 percent still enrolled. See Table 70.

Urbana-Champaign CampusAcademic PerformancePage 110
Table 66
ACADEMIC STATUS FOR UIUC BEGINNING FRESHMENPERCENT DISTRIBUTION AFTER FIRST YEAR*
FALL 2003 COHORT
ACADEMIC STATUS CAMPUS ACES ALS AVI BUS ED ENGR FAA LAS Clear Status 86.1 87.5 93.4 82.5 91.8 95.6 85.2 86.5 85.7
Probation Status 5.7 6.4 1.7 1.8 3.7 0.6 6.0 4.5 6.7
Dropped Status 0.5 0.2 0.0 1.8 1.0 0.6 0.5 2.1 0.3
Not Enrolled Fall '04 7.7 6.0 5.0 14.0 3.5 3.1 8.3 6.9 7.2
Total 100% 100% 100% 100% 100% 100% 100% 100% 100%
PERCENT RETURNED 92.3 94.0 95.0 86.0 96.5 96.9 91.7 93.1 92.8
ACES = AG., CONSUM. & ENV. SCIENCESALS = APPLIED LIFE STUDIESAVI = AVIATIONBUS = BUSINESSED = EDUCATIONENGR = ENGINEERINGFAA = FINE & APPLIED ARTSLAS = LIBERAL ARTS & SCIENCES
* Academic status is as of the end of the Summer 2004. The methodology and source is different than previous databooks.Note: Totals may not equal 100% due to rounding.DATA SOURCES: Research Database and Planning & Budgeting Census Snapshot
Retention Rates for Beginning FreshmenOne Year After Matriculation*
Fall 2003 Cohort
0%
20%
40%
60%
80%
100%
ACES ALS AVI BUS ED ENGR FAA LAS
Clear Probation Dropped
Figure 57

Urbana-Champaign CampusAcademic Performance
Page 111
Table 67UIUC COMMUNITY COLLEGE AND FOUR-YEAR COLLEGE TRANSFER STUDENT
PERFORMANCE AS MEASURED BY CUMULATIVE GRADE POINT AVERAGESFALL 1987 COHORT
Number in GPA At End Of TermCohort Transfer GPA 1 2 3 4 5 6
Two-Year Transfers 741 3.26 2.72 2.83 2.86 2.97 2.92 2.76
Number in GPA At End Of TermCohort Transfer GPA 1 2 3 4 5 6
Four-Year Transfers 466 3.15 2.86 2.98 3.01 3.08 2.99 3.03
Reported above are enrollments and mean cumulative grade point averages for the fall 1987 cohort of newtransfers to UIUC. This cohort was tracked for three years after transfer.
In fall 1987, 741 students from community colleges transferred to UIUC entering with a mean cumulative GPAof 3.26. After one semester, the mean GPA for this cohort dropped to 2.72. At the end of four semesters, or twoyears after transfer, the mean GPA for this cohort had increased to 2.97.
In fall 1987, 466 students from four-year colleges and universities transferred to UIUC, entering with a meancumulative GPA of 3.15. At the end of one semester, this cohort's mean GPA dropped to 2.86, a smallerdecrease than experienced by the community college cohort. At the end of four semesters, or two years aftertransfer, the mean GPA for this cohort increased to 3.08.
DATA SOURCE: Summary of Progress, Fall 1987 Cohort: UOAPA

Urbana-Champaign CampusAcademic PerformancePage 112
Table 68RETENTION PATTERNS FOR UIUC BEGINNING FULL-TIME FRESHMEN
PERCENT GRADUATED OR ENROLLED BY YEARS SINCE MATRICULATION
Fall Number Year of EnrollmentEntering Term in Cohort 2 3 4 5 6 7
1992 5,462 91.3 84.4 30.4 4.1 0.4 0.41993 5,637 90.8 83.6 30.4 4.4 0.1 0.31994 5,732 91.1 83.1 29.0 3.8 0.2 0.31995 6,085 91.3 83.1 27.3 3.1 0.2 0.41996 5,944 92.0 84.5 27.0 2.8 0.0 0.41997 5,764 91.9 84.6 26.0 1.9 0.0 0.31998 6,427 92.0 84.7 25.3 1.8 0.01999 6,464 92.0 85.0 25.0 2.5 PERCENT2000 6,174 92.0 84.8 23.5 ENROLLED2001 6,247 91.2 84.4 AND NOT 2002 6,363 91.6 GRADUATED2003 6,810 --
1992 0.0 1.4 52.8 74.2 77.4 78.61993 0.0 1.3 51.4 73.2 76.8 77.81994 0.0 0.8 51.5 73.6 76.4 77.31995 0.0 1.7 54.4 75.3 77.7 78.41996 0.0 1.5 56.3 76.9 79.5 80.41997 0.0 1.2 57.4 78.0 80.4 81.11998 0.0 1.4 58.2 78.2 80.41999 0.0 1.1 59.1 78.2 CUMULATIVE2000 0.0 1.7 59.6 PERCENT2001 0.0 1.7 GRADUATED2002 0.0
1992 91.3 85.7 83.2 78.3 77.8 79.01993 90.8 84.9 81.7 77.5 76.9 78.11994 91.1 83.9 80.6 77.4 76.6 77.61995 91.3 84.7 81.7 78.4 77.9 78.81996 92.0 86.1 83.3 79.7 79.5 80.81997 91.9 85.8 83.4 79.9 80.4 81.41998 92.0 86.1 83.5 80.0 80.41999 92.0 86.1 84.0 80.72000 92.0 86.5 83.0 PERCENT2001 91.2 86.1 RETENTION2002 91.6
Fall beginning freshmen include full-time freshmen entering in the summer preceding the fall term. The percentages in column "Year Two," and so on, reflect the percentage of students enrolled but not graduated during the second year, the cumulative percentage of degrees conferred through that year, and the retention for the second year -- the sum of enrolled and graduated students. These data might incur rounding error. The data used in the table are taken from the statistics used to compile the AAUDE Retention and Graduation Survey. Students not enrolled in Fall term but who received a degree during the AY will not show in the top table; this is particularly noticeable comparing year 6 to year 7.
Year-to-year retention for the 1997 cohort is displayed in Figure 58 on the next page. Of those freshmen who entered UIUC in fall 1997, less than one-half percent were still enrolled and over 81 percent had graduated after seven years, to yield a retention rate of 81.4 percent.

Urbana-Champaign CampusAcademic Performance
Page 113
Table 69UIUC Five-Year Retention by Gender
Cohort Still Enrolled Graduated RetentionWomen 1991 3.7 79.0 82.7
1992 2.4 77.2 79.61993 1.9 76.6 78.51994 2.5 77.8 80.31995 1.9 78.9 80.81996 3.3 80.5 83.81997 0.5 80.3 80.81998 0.3 81.0 81.31999 1.3 81.8 83.1
Men 1991 8.1 71.1 79.21992 5.6 71.6 77.21993 6.4 70.4 76.81994 4.9 69.8 74.71995 4.3 72.0 76.31996 5.2 73.6 78.81997 3.3 75.6 78.91998 3.2 75.6 78.81999 3.7 74.8 78.4
DATA SOURCE: Research Data Base.
UIUC Beginning FreshmenRetention Patterns for 1997 Cohort (Table 61)
0%
20%
40%
60%
80%
100%
2 3 4 5 6 7
Enrolled Graduated Non-Persisters
Year of Enrollment
Figure 58

Urbana-Champaign CampusAcademic PerformancePage 114
Table 70
RETENTION PATTERNS FOR UIUC NEW TRANSFERSPERCENT GRADUATED OR ENROLLED BY YEARS SINCE MATRICULATION
Fall Number Years After MatriculationEntering Term in Cohort 1 2 3 4
1989 1,072 79.2 39.9 6.4 1.61990 1,552 80.7 45.4 11.0 1.91991 1,253 76.2 43.1 8.5 0.91992 1,170 74.0 41.1 8.51993 1,279 75.3 41.51994 1,325 78.0 PERCENT
ENROLLED
1989 0.3 36.4 67.8 72.91990 0.3 31.5 63.8 73.11991 0.6 30.7 63.6 69.81992 0.6 29.1 60.01993 0.5 28.4 CUMULATIVE1994 0.4 PERCENT
GRADUATED
1989 79.5 76.3 74.2 74.51990 81.0 76.9 74.8 75.01991 76.8 73.8 72.1 70.71992 74.6 70.2 68.51993 75.8 69.91994 78.4 PERCENT
RETENTION
Fall new transfers include full-time transfers entering in the fall term. Summer degrees are counted with the previous spring. The percentages in column "Year Two," and so on, reflect thepercentage of students enrolled (those who did not graduate and did not drop out) during the secondyear and the cumulative percentage of degrees conferred through the second year. Retention for the second year is the sum of enrolled and graduated students. These data might incur rounding errors.

Urbana-Champaign CampusAcademic Performance
Page 115
1 Major Feeder Cohort includes new transfers from Parkland, Illinois Central, DuPage, Moraine Valley, and Wm. R. Harper. The transfers from these schools comprise slightly less than one quarter of all new transfers.DATA SOURCE: 1997, Summary of Progress: UOAPA
UIUC New TransfersRetention Patterns for 1990 Total Cohort
0%
10%
20%
30%
40%
50%
60%
70%
80%
90%
100%
1 2 3 4
GRADUATED ENROLLED
Years Since Matriculation
Figure 59
UIUC New Transfers Retention Patterns for 1990 Major Feeder Cohort1
0%
10%
20%
30%
40%
50%
60%
70%
80%
90%
100%
1 2 3 4
GRADUATED ENROLLED
Years Since Matriculation
Figure 60

Page 116
This page intentionally left blank.

Degrees Conferred UIUC HIGHLIGHTS
• In FY 2004, the campus conferred 10,342 total degrees, an increase of over 700 from ten years ago, though some 300 less than one year ago. At 6,763 bachelor’s degrees, FY 2004 is higher than 1994 by 12 percent. Master’s were awarded to nearly the same number of students as last year. The number of doctoral degrees granted has declined compared to ten years ago, now at the lowest point in the ten year period, while the number of professional degrees is higher in recent years than the earlier in the period. See Table 71 and Figure 61.
• As presented in Table 72 and Figure 62, most colleges awarded larger
numbers of undergraduate degrees in FY 2004 compared to ten years earlier. Though most colleges show increases versus a decade ago, they awarded fewer degrees than last year.
• The percentage of undergraduate degrees earned by females has
increased over the decade. For several years, about 45 percent of undergraduate degrees went to female students. Six years ago the rate increased to 46 percent, and three years ago it went to 47 percent. Last year 49 percent of undergraduate degrees were awarded to females, then this year the percentage fell back to 48 percent. See Table 73.
• Tables 74 and 74.1 report undergraduate degrees conferred by
race/ethnicity. The percentage distribution of undergraduate degrees conferred to underrepresented students has increased over the last ten years. The proportion of degrees conferred to minorities (American Indian, Black and Hispanic students combined) moved up from 9.2 percent of total bachelor’s degrees ten years ago to 10.8 percent in FY 2004.
• Data are also presented showing the number of degrees conferred by
level and race/ethnic category with international students displayed in a separate category (See Tables 75 and 75.1). In FY 2004, minority students received 10.8 percent of bachelor’s degrees, 5.3 percent of Master’s degrees, 4.9 percent of doctoral degrees, and 12.3 percent of professional degrees.

Urbana-Champaign CampusDegrees ConferredPage 118
Table 71NUMBER OF UIUC DEGREES CONFERRED BY LEVEL
FY 1994 - FY 2004
DEGREE 1994 1995 1996 1997 1998 1999 2000 2001 2002 2003 2004
Pre-Baccalaureate1 34 19 49 31 24 21 18 10 12 14 9
Bachelor's 6,026 5,996 5,895 5,868 5,919 6,301 6,385 6,259 6,723 6,978 6,763
Master's 2,578 2,513 2,450 2,393 2,412 2,259 2,293 2,170 2,438 2,707 2,683
Doctorate 664 760 698 735 706 646 600 667 603 617 574
Advanced Certificate 8 12 6 15 17 12 11 14 14 11 5
Professional 286 269 271 275 291 267 278 266 319 301 308
Campus Total 9,596 9,569 9,369 9,317 9,369 9,506 9,585 9,386 10,109 10,628 10,342
Degrees Bach. Master's Doct. Prof.
% Change 12% 4% -14% 8%
1 The decline in the number of certificates in Aviation occurred because beginning in Fall 1999, the Institute of Aviation began offering a baccalaureate degree in Aviation Human Factors.2 The percent changes are not shown for the pre-baccalaureate and advanced certificate degrees because the small numbers awarded may result in large percent changes that are not meaningful.DATA SOURCES: 1994-2003, Research Data Base, Degree File: UOAPA 2004, Planning & Budgeting Census Snapshot
Percent Change in UIUC Degrees Conferred by Level2
FY 1994 and FY 2004
Master's
Doct.
Bach.
Prof.
-15%
-5%
5%
15%
Figure 61

Urbana-Champaign CampusDegrees Conferred
Page 119
Table 72
NUMBER OF UIUC UNDERGRADUATE DEGREES CONFERRED BY COLLEGEFY 1994 - FY 2004
COLLEGE 1994 1995 1996 1997 1998 1999 2000 2001 2002 2003 2004 Pre-BaccalaureateAviation1 34 19 49 31 24 21 18 10 12 14 9BaccalaureateAg, Consum. & Env. Sci.2 408 430 451 437 436 517 511 491 535 545 498
Applied Life Studies 200 212 240 201 271 298 324 275 339 371 348
Aviation1 -- -- -- -- -- -- -- 2 21 33 42
Business 3 873 838 802 835 835 928 1,014 976 1,023 1,030 1,057
Communications 177 209 194 169 183 210 242 238 253 272 247
Education 240 226 232 207 190 183 153 146 176 184 172
Engineering 1,000 1,068 1,099 1,085 1,016 1,105 1,059 1,133 1,052 1,024 1,065
Fine & Applied Arts 399 394 381 387 414 416 423 437 432 406 396
Liberal Arts & Sciences 2,616 2,551 2,407 2,459 2,492 2,565 2,587 2,476 2,805 3,015 2,848
Social Work4 25 22 25 5 -- -- -- -- -- -- --
Veterinary Medicine (Bacc.) 88 46 64 83 82 79 72 85 87 98 90
Subtotal (Bacc.) 6,026 5,996 5,895 5,868 5,919 6,301 6,385 6,259 6,723 6,978 6,763
Total, Pre-baccaulareate and Baccalaureate 6,060 6,015 5,944 5,899 5,943 6,322 6,403 6,269 6,735 6,992 6,772
AVI = AVIATION (Bacc. & Pre-Bacc.)1
ACES = AG, CONSUM. & ENV. SCI.ALS = APPLIED LIFE STUDIESBUS = BUSINESSCOMM = COMMUNICATIONSED = EDUCATIONENGR = ENGINEERINGFAA = FINE & APPLIED ARTSLAS = LIBERAL ARTS & SCIENCESVET = VETERINARY MEDICINE
1 In 1999, the Institute of Aviation received approval of a baccalaureate program in Aviation Human Factors. 2 In 1995, the College of Agriculture changed to the College of Agriculture, Consumer and Environmental Sciences.3 In 2003, the College of Commerce and Business Administration (CBA) changed to the College of Business (BUS).4 The School of Social Work no longer grants a baccalaureate degree.DATA SOURCES: 1994-2003, Research Data Base, Degree File: UOAPA 2004, Planning & Budgeting Census Snapshot
Percentage Change in UIUC UndergraduateDegrees Conferred by College4
FY 1994 and FY 2004
22% 21%
40%
7% 9%
-1%
50%
74%
2%
-28%-35%
-15%
5%
25%
45%
65%
85%
AVI ACES ALS BUS COMM ED ENGR FAA LAS VET
Figure 62

Urbana-Champaign CampusDegrees ConferredPage 120
Table 73
NUMBER OF UIUC UNDERGRADUATE DEGREES CONFERRED BY COLLEGE AND GENDERFY 1994 - FY 2004
COLLEGE 1994 1995 1996 1997 1998 1999 2000 2001 2002 2003 2004
Pre-BaccalaureateAVIATION1 Male 32 11 39 27 21 19 12 10 11 14 8
Female 2 8 10 4 3 2 6 -- 1 -- 1Subtotal 34 19 49 31 24 21 18 10 12 14 9
BaccalaureateAG., CONSUM. Male 199 197 202 211 199 217 215 181 199 195 195& ENV. SCI.2 Female 209 233 249 226 237 300 296 310 336 350 303
Subtotal 408 430 451 437 436 517 511 491 535 545 498
APPLIED LIFE Male 75 76 70 59 82 89 99 96 78 111 116STUDIES Female 125 136 170 142 189 209 225 179 261 260 232
Subtotal 200 212 240 201 271 298 324 275 339 371 348
AVIATION1 Male -- -- -- -- -- -- -- 2 16 31 40Female -- -- -- -- -- -- -- -- 5 2 2Subtotal -- -- -- -- -- -- -- 2 21 33 42
BUSINESS 4 Male 485 466 450 460 449 511 575 538 547 564 577Female 388 372 352 375 386 417 439 438 476 466 480Subtotal 873 838 802 835 835 928 1,014 976 1,023 1,030 1,057
COMMUNICATIONS Male 55 76 70 65 84 74 76 83 75 71 67Female 122 133 124 104 99 136 166 155 178 201 180Subtotal 177 209 194 169 183 210 242 238 253 272 247
EDUCATION Male 50 45 38 43 37 26 15 15 9 9 15Female 190 181 194 164 153 157 138 131 167 175 157Subtotal 240 226 232 207 190 183 153 146 176 184 172
ENGINEERING Male 854 921 949 929 851 945 876 945 898 868 904Female 146 147 150 156 165 160 183 188 154 156 161Subtotal 1,000 1,068 1,099 1,085 1,016 1,105 1,059 1,133 1,052 1,024 1,065
FINE & Male 191 195 178 203 178 190 205 208 186 192 174APPLIED ARTS Female 208 199 203 184 236 226 218 229 246 214 222
Subtotal 399 394 381 387 414 416 423 437 432 406 396
LIBERAL ARTS Male 1,363 1,289 1,248 1,250 1,180 1,237 1,197 1,137 1,316 1,435 1,385& SCIENCES Female 1,253 1,262 1,159 1,209 1,312 1,328 1,390 1,339 1,489 1,580 1,463
Subtotal 2,616 2,551 2,407 2,459 2,492 2,565 2,587 2,476 2,805 3,015 2,848
SOCIAL WORK Male 2 2 4 -- -- -- -- -- -- -- --Female 23 20 21 5 -- -- -- -- -- -- --Subtotal 25 22 25 5 -- -- -- -- -- -- --
VET MED (Bacc.) Male 25 9 10 29 15 26 10 25 10 8 9Female 63 37 13 54 67 53 62 60 36 29 32Subtotal 88 46 64 3 83 82 79 72 85 87 3 98 3 90 3
Campus Total Male 3,331 3,287 3,258 3,276 3,096 3,334 3,280 3,240 3,345 3,498 3,490Female 2,729 2,728 2,645 2,623 2,847 2,988 3,123 3,029 3,349 3,433 3,233Total 6,060 6,015 5,944 3 5,899 5,943 6,322 6,403 6,269 6,735 3 6,992 3 6,772 3
1 In 1999, the Institute of Aviation received approval of a baccalaureate program in Aviation Human Factors. 2 In 1995, the College of Agriculture changed to the College of Agriculture, Consumer and Environmental Sciences.3 Totals for both 1996 and 2002 in Veterinary Medicine include 41 students for whom gender is not recorded; in 2003 and 2004, 61 and 49, respectively, baccalaureates in Veterinary Medicine were awarded to students for whom gender is not recorded.4 In 2003, the College of Commerce and Business Administration (CBA) changed to the College of Business (BUS).DATA SOURCES: 1994-2003, Research Data Base, Degree File: UOAPA 2004, Planning & Budgeting Census Snapshot

Urbana-Champaign CampusDegrees Conferred
Page 121
Table 74
NUMBER OF UIUC BACCALAUREATE DEGREES CONFERRED BY RACE/ETHNICITY1
FY 1994 - FY 2004
RACE/ETHNICITY 1994 1995 1996 1997 1998 1999 2000 2001 2002 2003 2004 Am.Ind./Alaskan Nat. 9 9 7 7 14 10 10 16 12 9 14
Black 328 357 297 308 309 352 342 376 395 390 379
Asian/Pac. Islander 675 757 751 789 737 818 795 826 919 954 974
Hispanic 220 250 251 264 283 289 246 295 318 339 340
White 4,739 4,557 4,502 4,425 4,470 4,676 4,691 4,505 4,885 5,084 4,809
Unknown 55 66 87 75 106 156 301 241 194 202 247
Campus Total 6,026 5,996 5,895 5,868 5,919 6,301 6,385 6,259 6,723 6,978 6,763
Table 74.1
PERCENT OF UIUC BACCALAUREATE DEGREES CONFERRED BY RACE/ETHNICITY1
FY 1994 - FY 2004
RACE/ETHNICITY 1994 1995 1996 1997 1998 1999 2000 2001 2002 2003 2003
Am.Ind./Alaskan Nat. 0.1 0.2 0.1 0.1 0.2 0.2 0.2 0.3 0.2 0.1 0.2
Black 5.4 6.0 5.0 5.2 5.2 5.6 5.4 6.0 5.9 5.6 5.6
Asian/Pac. Islander 11.2 12.6 12.7 13.4 12.5 13.0 12.5 13.2 13.7 13.7 14.4
Hispanic 3.7 4.2 4.3 4.5 4.8 4.6 3.9 4.7 4.7 4.9 5.0
White 78.6 76.0 76.4 75.4 75.5 74.2 73.5 72.0 72.7 72.9 71.1
Unknown 0.9 1.1 1.5 1.3 1.8 2.5 4.7 3.9 2.9 2.9 3.7
Campus Total 100.0 100.0 100.0 100.0 100.0 100.0 100.0 100.0 100.0 100.0 100.0
Note: Totals may not equal 100.0% due to rounding.1 Does not include pre-baccalaureate certificates in Aviation. International students are included in the race/ethnic categories.DATA SOURCES: 1994-2003, Research Data Base, Degree File: UOAPA 2004, Planning & Budgeting Census Snapshot

Urbana-Champaign CampusDegrees ConferredPage 122
Table 75
NUMBER OF UIUC DEGREES CONFERRED BY RACE/ETHNICITY AND LEVELFY 2004
Am. Ind./ Asian/LEVEL Alask.Nat. Pac. Isl. Black Hispanic White Int'l Unknown Total
Pre-Baccalaureate1 -- -- -- -- 9 -- -- 9
Bachelor's 14 927 379 338 4,805 177 123 6,763
Master's 6 169 79 58 1,398 899 74 2,683
Doctorate 1 23 18 9 254 258 11 574
Advanced Certificate -- -- -- -- 5 -- -- 5
Professional2 -- 22 22 16 230 6 12 308
Campus Total 21 1,141 498 421 6,701 1,340 220 10,342
Table 75.1PERCENT OF UIUC DEGREES CONFERRED BY RACE/ETHNICITY AND LEVEL
FY 2004
Am. Ind./ Asian/LEVEL Alask.Nat. Pac. Isl. Black Hispanic White Int'l Unknown Total
Pre-Baccalaureate1 0.0% 0.0% 0.0% 0.0% 100.0% 0.0% 0.0% 100.0% Bachelor's 0.2% 13.7% 5.6% 5.0% 71.0% 2.6% 1.8% 100.0%
Master's 0.2% 6.3% 2.9% 2.2% 52.1% 33.5% 2.8% 100.0%
Doctorate 0.2% 4.0% 3.1% 1.6% 44.3% 44.9% 1.9% 100.0%
Advanced Certificate 0.0% 0.0% 0.0% 0.0% 100.0% 0.0% 0.0% 100.0%
Professional2 0.0% 7.1% 7.1% 5.2% 74.7% 1.9% 3.9% 100.0%
Campus Total 0.2% 11.0% 4.8% 4.1% 64.8% 13.0% 2.1% 100.0%
Note: Totals may not equal 100.0% due to rounding. In this display, international students are shown in a separate category.1 Certificate in Aviation2 Professional degrees include Veterinary Medicine and Law.DATA SOURCE: Research Data Base: UOAPA

Page 123
This page intentionally left blank.

Page 124
This page intentionally left blank.