university of ljubljana faculty of economics · 2016-01-05 · 3 introducing a mandatory second...
TRANSCRIPT

UNIVERSITY OF LJUBLJANA
FACULTY OF ECONOMICS
MASTER’S THESIS
DRAGAN JOVANOVIĆ


UNIVERSITY OF LJUBLJANA
FACULTY OF ECONOMICS
MASTER’S THESIS
AN ANALYSIS OF THE MANDATORY SECOND PILLAR
INTRODUCTION IN THE SLOVENIAN PENSION SYSTEM
Ljubljana, September 2015 DRAGAN JOVANOVIĆ


AUTHORSHIP STATEMENT
The undersigned DRAGAN JOVANOVIĆ, a student at the University of Ljubljana, Faculty of Economics,
(hereafter: FELU), declare that I am the author of the bachelor thesis / master’s thesis / doctoral dissertation
entitled AN ANALYSIS OF THE MANDATORY SECOND PILLAR INTRODUCTION IN THE
SLOVENIAN PENSION SYSTEM, written under supervision of izr. prof. dr. Aleš Berk Skok and co-
supervision of izr. prof. dr. Jože Sambt.
.
In accordance with the Copyright and Related Rights Act (Official Gazette of the Republic of Slovenia, Nr.
21/1995 with changes and amendments) I allow the text of my bachelor thesis / master’s thesis / doctoral
dissertation to be published on the FELU website.
I further declare
the text of my bachelor thesis / master’s thesis / doctoral dissertation to be based on the results of my own
research;
the text of my bachelor thesis / master’s thesis / doctoral dissertation to be language-edited and technically
in adherence with the FELU’s Technical Guidelines for Written Works which means that I
o cited and / or quoted works and opinions of other authors in my bachelor thesis / master’s thesis /
doctoral dissertation in accordance with the FELU’s Technical Guidelines for Written Works and
o obtained (and referred to in my bachelor thesis / master’s thesis / doctoral dissertation) all the
necessary permits to use the works of other authors which are entirely (in written or graphical
form) used in my text;
to be aware of the fact that plagiarism (in written or graphical form) is a criminal offence and can be
prosecuted in accordance with the Criminal Code (Official Gazette of the Republic of Slovenia, Nr. 55/2008
with changes and amendments);
to be aware of the consequences a proven plagiarism charge based on the submitted bachelor thesis /
master’s thesis / doctoral dissertation could have for my status at the FELU in accordance with the relevant
FELU Rules on Bachelor Thesis / Master’s Thesis / Doctoral Dissertation.
Ljubljana, September 9th
, 2015 Author’s signature: ________________________


i
TABLE OF CONTENTS
INTRODUCTION .................................................................................................................... 1
1 SLOVENIAN PENSION SYSTEM ................................................................................ 4
1.1 PAYG pillar ................................................................................................................. 4
1.1.1 Reform in 1992 ..................................................................................................... 5
1.1.2 Reform in 1999 ..................................................................................................... 5
1.1.3 Reform in 2012 ..................................................................................................... 5
1.1.4 Taxation of Pensions ............................................................................................ 7
1.1.5 Financing of the PAYG pillar .............................................................................. 7
1.2 Second Pillar ................................................................................................................ 8
1.3 Third pillar ................................................................................................................. 12
1.4 The impact of demographic changes on benefits from PAYG pillar ........................ 13
1.4.1 Demographic shifts in Slovenia and European Union ....................................... 13
1.4.2 Projecting future public pension expenditures based on EUROPOP 2013 and
expected level of pensions from the PAYG pillar ............................................................ 16
2 INTRODUCING A MANDATORY SECOND PILLAR PENSION SYSTEM ....... 20
2.1 Economic benefits of introducing a mandatory second pillar ................................... 20
2.1.1 Benefits of funding ............................................................................................. 21
2.1.2 Costs of moving to a funded system .................................................................. 25
2.2 How to effectively implement the mandatory second pillar? .................................... 27
2.2.1 Size of the second pillar and financing the transition ........................................ 27
2.2.2 Participation requirement in the new system ..................................................... 33
2.2.3 Adjusting the PAYG pillar ................................................................................. 34
2.2.4 Second pillar pension funds ............................................................................... 35
2.2.5 Administration .................................................................................................... 36
2.2.6 Government supervision of second pillar fund managers .................................. 38
2.2.7 Second pillar retirement age and payment options ............................................ 39
2.3 Lessons from the past ................................................................................................ 41
3 INTRODUCING A MANDATORY SECOND PILLAR PENSION SYSTEM: THE
CASE OF SLOVENIA ........................................................................................................... 44
3.1 Slovenian multipillar pension reform ........................................................................ 44
3.2 Age-profiles-based model.......................................................................................... 45

ii
3.3 Yield model and second pillar individual accounts ................................................... 48
3.4 Results ....................................................................................................................... 52
3.4.1 Participation requirement ................................................................................... 60
3.4.2 Long-term fiscal sustainability of the reformed system ..................................... 63
CONCLUSION ....................................................................................................................... 65
REFERENCE LIST ............................................................................................................... 68
LIST OF FIGURES
Figure 1. Structure of Slovenian Population Divided into Three Age Groups Based on
EUROPOP2013 Projections for 2014-2080. ............................................................................ 15
Figure 2. Projections of PAYG Pension Expenditures and PAYG Pension Contributions in
Slovenia in 2015-2060 as a Share of GDP under Different Indexation Scenarios .................. 17
Figure 3. Projections of Net Replacement Rates at Retirement in Slovenia in the period 2015-
2060 for Scenario with no Limitations and Different Scenarios if Limiting Public Pension
Expenditures to Certain % of GDP, Zero Indexation is Assumed until the End of 2018. ....... 18
Figure 4. Projections of Net Replacement Rates at Retirement in Slovenia in the period 2015-
2060 for Scenario with no Limitations and Different Scenarios if Limiting Public Pension
Expenditures to Certain % of GDP, Zero Indexation is Assumed until the End of 2015 ........ 19
Figure 5. Reduction of PAYG Promises .................................................................................. 31
Figure 6. Financing the Second Pillar Transition and Welfare Trade-Offs ............................. 32
Figure 7. Combined Collection and Clearinghouse System (Poland and Croatia) .................. 37
Figure 8. Decentralized Funded Pillar (Chile, Hungary) ......................................................... 38
Figure 9. Second Pillar Account of a Typical Male Pension Beneficiary That Chooses to
Invest into a Moderate Fund ..................................................................................................... 50
Figure 10. Projections of the PAYG Pension Contributions under Different Second Pillar
Sizes in the Period 2015-2060, One-Step Scenario .................................................................. 52
Figure 11. Projections of the PAYG Pension Contributions under Different Second Pillar
Sizes in the Period 2015-2060, Phase-in Scenario ................................................................... 53
Figure 12. Projections of the PAYG Pension Expenditures under Different Second Pillar
Sizes in the Period 2015-2060, One-Step Scenario .................................................................. 54
Figure 13. Projections of the PAYG Pension Expenditures under Different Second Pillar
Sizes in the Period 2015-2060, Phase-in Scenario ................................................................... 54
Figure 14. Difference between the PAYG Pension Contributions and the PAYG Pension
Expenditures under Different Second Pillar Sizes in the Period 2015-2060, One-Step Scenario
.................................................................................................................................................. 55
Figure 15. Difference between the PAYG Pension Contributions and the PAYG Pension
Expenditures under Different Second Pillar Sizes in the Period 2015-2060, Phase-in Scenario
.................................................................................................................................................. 56

iii
Figure 16. Cumulative Difference between PAYG Pension Contributions and PAYG Pension
Expenditures for Unreformed PAYG System and Reformed PAYG System under Different
Second Pillar Sizes (2-10%) and One with no Second Pillar (0%) in the Period 2016-2060 .. 57
Figure 17. Projections of Net Replacement Rates at Retirement for Typical Male Pension
Beneficiaries Choosing a Conservative Fund in the Period 2016-2065 under Different Second
Pillar Sizes ................................................................................................................................ 58
Figure 18. Projections of Net Replacement Rates at Retirement for Typical Male Pension
Beneficiaries Choosing a Moderate Fund in the Period 2016-2065 under Different Second
Pillar Sizes ................................................................................................................................ 59
Figure 19. Projections of Net Replacement Rates at Retirement for Typical Male Pension
Beneficiaries Choosing an Aggressive Fund in the Period 2016-2065 under Different .......... 59
Figure 20. Decomposition of the Net Replacement Rates at Retirement for Typical Male
Pension Beneficiaries Paying 6% of Gross Wage into the Second Pillar in the Period
2016-2065, One-Step Scenario ................................................................................................ 60
Figure 21. Projections of Net Replacement Rates at Retirement According to Different
Transaction Costs for Typical Male Pension Beneficiaries Choosing a Moderate Fund in the
Period 2016-2065 and Paying 6% of Gross Wage into the Second Pillar, One-Step Scenario 60
Figure 22. Difference between the PAYG Pension Contributions and the PAYG Pension
Expenditures for Age Limit of 35 and 55 Years under different Second Pillar Sizes in the
Period 2015-2060, One-Step Scenario ..................................................................................... 61
Figure 23. Cumulative Difference between the PAYG Pension Contributions and the PAYG
Pension Expenditures for Age Limit of 35, 45 and 55 Years under Different Second Pillar
Sizes in the Period 2016-2060, One-Step Scenario .................................................................. 62
Figure 24. Projections of Net Replacement Rates at Retirement for Age Limit of 35 and 55
Years under Different Second Pillar Sizes for Typical Male Pension Beneficiaries Choosing a
Moderate Fund in the Period 2015-2065, One-Step Scenario ................................................. 62
Figure 25. Annual Fiscal Deficits/Surpluses of Unreformed PAYG System and Reformed
PAYG System without (0%) and with Second Pillar (10%) in the Period 2016-2090, One-Step
Scenario .................................................................................................................................... 64
Figure 26. Total Fiscal Deficits/Surpluses of Unreformed PAYG System and Reformed
PAYG System under Different Second Pillar Sizes (2-10%) and One with No Second Pillar
(0%) in the Period 2016-2090, One-Step Scenario .................................................................. 65
LIST OF TABLES
Table 1. Characteristics of the Previous Pension System (PDIA-1999) in Slovenia ................. 6
Table 2. Characteristics of the Current Pension System (PDIA-2012) in Slovenia ................... 7
Table 3. Mandatory and Voluntary Supplementary Pension Schemes: Insured Persons and
Assets, 31st of December 2013 ................................................................................................ 11
Table 4. Breakdown of Total Assets (%) at the End of 2013 ................................................... 12
Table 5. Old-Age Dependency Ratio Based on EUROPOP 2013 Projections for EU-28
Divided into Old and New Member States. ............................................................................. 16

iv
Table 6. Mandatory Pension Contribution Rates in Regional Transition Economies ............. 30
Table 7. Key Characteristics of Private Pension Schemes in East European EU Member States
(Averages for the Given Time Period) and Pension Reform Reversals Affecting Second Pillar
Funds in the Wake of Financial Crisis. .................................................................................... 43
Table 8. Adjustment of Age for Male Individuals According to the Date of Birth ................. 51

1
INTRODUCTION
The pay-as-you-go pension system has a long tradition in Slovenia and is firmly embedded in
the overall social security system as one of the key subsystems, providing security for older
generations (MDDSZ, 2009). However, demographic changes in European societies require
downscaling of traditional Pay as you go (hereinafter: PAYG) systems. Namely, Projections
of age-related expenditures from the European Commission (DG ECFIN) and Economic
Policy Committee (AWG) (2012) point toward a significant risk to the sustainability of
PAYG systems as a consequence of increasing longevity and declining fertility. By 2060, the
life expectancy at birth is projected to increase by 7.9 and 6.5 years for males and females
respectively, when compared to 2010 (European Commission, 2012).
In order to maintain the sustainability of its social security systems many countries, including
Slovenia, have reformed their pension systems in 1990’s. With its last two reforms, which
were enacted in 1999 and 2012, Slovenia was able to keep its existing pension expenditures
from PAYG system under control by gradually reducing pension benefits and increasing the
eligibility requirements. However, in the following decades the so-called baby boom
generations will start retiring. This process, supported by increasing life expectancy and
falling fertility, is expected to increase the old-age dependency ratio by more than two-fold to
54.6 until 2053. As a result, pension expenditures as a share of GDP are set to increase from
11.5% in 2015 to 15.7% in 2053, potentially imposing major fiscal costs on the central
government budget, which already generously subsidizes the state pension fund.
These worrisome results call for another pension reform in the next few years, which should
include a move towards substantial funded pension pillar as a supplement to the traditional
PAYG pillar. Garrett and Rhine (2005) use USA case to demonstrate that private pension
systems deliver higher pension benefits than PAYG systems with the same level of
contributions, while Du, Muysken and Sleijpen (2011) argue that second and third pillars act
as stabilizers when economy is affected by an ageing society. Multipillar systems provide
more security against economic, demographic and political risks than monopillar systems
through risk diversification (Holzmann, & Hinz, 2005; The World Bank Pension Conceptual
Framework, 2008).
In the last three decades many countries have followed Chilean example by introducing a
mandatory second pillar pension scheme. Transferring of retirement income provisions from
the public sector to the private sector was mostly done in order to address the fiscal
unsustainability due to the projected population aging and in order to accelerate financial
market development. This process caught on in 29 countries around the world, among which
were also many East, Central and South European countries (Holzmann, 2012). However, the
introduction of second pillar is accompanied with potentially high transition cost, which
brings up some difficult questions, such as how to allocate the implicit debt of the currently
unsustainable PAYG system among different generations (Lindeman, Rutkowski, &
2
Sluchynskyy, 2000). Furthermore, the recent economic crisis and related market meltdowns
have seen assets under the management of private pension schemes substantially reduced,
which makes moves towards funded pillars less politically viable (Ferber, & Simpson, 2009).
The recent economic crisis has highlighted the need for improved risk management
(automatic shift to less risky portfolio as an individual approaches retirement), efficient
administration, better regulation and broad population coverage (OECD, 2009b; Bertranou,
Calvo, & Bertranou, 2009).
Slovenia legislated fully funded second pillar and a voluntary fully funded third pillar back in
the year 2000. However, for the vast majority of employees the participation in the second
pillar was not mandatory and rules about guaranteed return of the second pillar scheme made
this system even less attractive. Consequently, the total assets under management of the
second pillar institutions in Slovenia amounted to only 1.8 billion EUR in 2013, which
accounted for 5% of Slovenian GDP compared to an average value of 73.8% of GDP held by
pension funds in other OECD countries in 2011 (OECD, 2013; Bank of Slovenia, 2014).
According to OECD (2013) the most developed countries in the world in terms of GDP per
capita already deliver a significant part of pension benefits from private funded pension
systems. Moreover, these results show that Slovenia’s net replacement rate of 59% falls
below the OECD average, which is 66% for an average earner. However, Slovenian
pensioners enjoy above average net replacement rates from public pensions (Slovenia: 59%;
OECD average: 49%) but since the second pillar is undeveloped, an average Slovenian
pensioner falls well below the target net replacement rate of 70% suggested by OECD
(OECD, 2009a).
Having in mind the unfavorable demographic forces and its influence on pension
expenditures, it is quite likely that people will have to work longer for a lower public pension.
One of the key solutions for future pensioners is to save for the retirement by themselves. But
having in mind the lack of awareness of the current situation, myopic behavior and financial
illiteracy of an average citizen, it is hard to believe that majority of the population is likely to
make a viable saving plan for retirement. Therefore, one of the key goals of every government
in order to prevent widespread old-age poverty should be to design a second pillar, which
would compensate for the fall in replacement rates coming from PAYG systems.
Unfortunately, under current circumstances Slovenian second pillar scheme will not be able to
sufficiently supplement the falling PAYG pension.
The topic of the master’s thesis is therefore concentrated around designing a pension system
for Slovenia, which will overcome demographic challenges and other problems listed above
while enhancing, or at least preserving, pension adequacy at the current levels. In particular,
the main purpose of the master’s thesis is to design an efficient pension system framework,
which will provide for a decent life of future pensioners (net replacement rates above 70%) on
a long term basis, while at the same time mitigating rapidly growing pension expenditures and
additionally reducing the contingent liabilities of the central government budget towards the

3
state pension fund. Hopefully, the policy makers will find these results useful when
conceiving a future reform of the pension system in Slovenia.
We seek to explore the option of supplementing the existing PAYG system with a mandatory
fully funded pension scheme. The main goal is to re-direct part of the current PAYG pension
contributions into a mandatory fully funded second pillar pension system, which is assumed
to deliver higher pension benefits, without an increase in contributions. The transition costs of
introducing a mandatory second pillar scheme will be offset by a parametric reform of the
existing PAYG system. This will be achieved by postponing the retirement (by five years
until 2055), increasing the number of years for calculating pension base (from 24 to 34) and
by reducing the indexation formula for growth of pensions to the growth of wages after
retirement (100% indexed to inflation).
The master thesis is composed of three sections, two of which are mostly theoretical, while
the last part is based on empirical examination. In particular, the first section is devoted to
analyzing and critically examining the evolution of Slovenian pension system and its
underlying pillars. Projections of future pension expenditures and the resulting future net
replacement rates are also included. We assess the fiscal sustainability and identify the main
drawbacks of the existing Slovenian pension system.
In the second section we analyze the main advantages as well as the potential pitfalls and
difficulties that arise from the introduction of the mandatory second pillar. We provide
answers to the questions why and how should the second mandatory pillar be implemented in
the multipillar pension system in the first and the second part of the section. We conclude the
section with a short overview of the existing pension systems with mandatory second pillars
and their experience with the recent economic crisis.
In the last section we build a theoretical framework for the introduction of the mandatory
second pillar, which is ultimately tested under varying assumptions. In particular, we analyze
the sensitivity of financial structure and the generosity of the multipillar system to different
second pillar sizes, implementation scenarios and participation requirements. The results are
provided for different asset allocation decisions stemming from individuals’ different risk
preferences. Additionally, we take care of the fact that future pensioners might be concerned
that their retirement income will be predominantly delivered through second pillar accounts,
which are exposed to market risks. Finally, we take into account that pension fund managers
might charge different transaction costs for managing the second pillar accounts.
The first two sections are covered with a descriptive method. We base our findings on a
comprehensive overview of scientific discussions, scientific work papers and other literature
on discussed topic. The first section also includes empirical evidences from the literature and
the most recent projections of future pension expenditures. Finally, the third section is
centered around empirical examination of the implementation of the mandatory second pillar

4
into the Slovenian pension system. The results presented in this section are generated by two
different models. The first one is the age-profiles-based model used for projecting future
PAYG pension expenditures and pension contributions, while the second one is the yield
model which is used for calculating the exact amount of assets accumulated on the second
pillar accounts.
1 SLOVENIAN PENSION SYSTEM
Since its independency in 1991 the Slovenian pension system has undergone 3 major reforms.
In this section we describe the results of these reforms and the main characteristics of the
current Slovenian pension system and its underlying pillars. In the end of the section we
present demographic projections and related pension expenditures, which without changes are
expected to create unsustainably huge deficits in the state pension budget. We conclude this
section with our projections of the future net replacement rates, if no changes to the current
PAYG system are made.
Slovenian pension system is composed of three pillars:
● The predominant part of the pension income is distributed through the state-run public
pension pillar that is part of the social security system and is based on solidarity. It is
financed on a pay-as-you-go basis (hence the PAYG pillar), which in practice means that
there is a “contract” between generations. Namely, the working generation always
finances the pensions of the current pensioners to the same extent as these pensioners
previously financed the previous generations of pensioners when they were once part of
the workforce.
● The voluntary second pillar, which in large part falls under the domain of employers, is
essentially an individual savings account, whose main purpose is to compensate for the
falling PAYG pension. The second pillar savings are collected and managed by the private
sector and are transformed into life-time annuities upon retirement.
● In Slovenia third pillar is generally considered to encompass all the savings put aside by
an individual for his retirement. However, since it is not systematically regulated we argue
that the third pillar does not exist in Slovenia. Ideally, the third pillar should offer tax
incentives and should be designed to stimulate individuals to save for retirement by
making payments to an individual savings account, where assets are accumulated and
capitalized according to the chosen investment policy.
1.1 PAYG pillar
After the disintegration of Yugoslavia in 1991, Slovenia inherited its PAYG system. Since
then the Slovenian pension system has undergone 3 major reforms, which are discussed in
detail further below. With its last two reforms, which were enacted in 1999 and 2012,

5
Slovenia was able to keep its existing pension expenditures from PAYG system under control
by gradually reducing pension benefits and increasing the eligibility requirements.
1.1.1 Reform in 1992
The first reform was passed in 1992 in the form of Pension and Disability Insurance Act
(hereinafter: PDIA), which introduced several new elements to the pension system such as the
introduction of a statutory retirement age. The pension system, however, remained fully under
the state’s domain and was managed by the state pension fund, i.e. the Pension and Disability
Insurance Institute of the Republic of Slovenia. The new legislation also transferred the
payment of the pensioner health contributions to the state pension fund and is therefore
partially responsible for the large increase of its pension expenditures (Čok, Sambt, Berk, &
Košak, 2008).
1.1.2 Reform in 1999
In 1999 a second pension reform was adopted (hereinafter: PDIA-1999), which came into
effect in 2000. In general, this reform tightened up retirement conditions and decreased
benefits deriving from the PAYG system, although it did so in a very gradualist manner since
the transitional periods of the new parameters were very lengthy. Nonetheless, it increased the
statutory retirement age from 58 to 63 for men and from 53 to 61 for women. The full pension
qualifying period was set to 40 years for men and 38 years for women, enabling an individual
that fulfills this period to retire already at the age of 58 (for both genders) and receive a full
pension without negative accruals. The pension base calculation increased gradually (by 1
year annually) from the previous 10 years to the 18 best consecutive years of service.
Compared to the previous reform PDIA-1999 narrowed the gender differences and introduced
number of elements of “horizontal equality”, which severely added to the complexity of the
system. In addition to the mandatory PAYG pillar, which remained the cornerstone of the
pension system, PDIA-1999 introduced a semi-mandatory fully-funded second pillar and a
voluntary fully funded third pillar, which are presented in the next section (Stanovnik, 2002;
Stanovnik, 2004; Majcen, & Verbič, 2009).
1.1.3 Reform in 2012
At the end of 2012 the last pension reform was accepted (hereinafter: PDIA-2012), which
came into effect in 2013. Its most important feature is the increase of statutory retirement age
from 61 (women) and 63 (men) to 65 years (by 2016 for men and 2020 for women), while the
pension qualifying period remained the same for men (40 years), for women it is gradually
increasing (by 4 months annually) from 38 to 40 years in 2018. Additionally, pension base
calculation is set to increase until 2018 from the previous 18 best consecutive to the 24 best
consecutive years of service (during the transitional period one year is added to the beginning
of each new calendar year).

6
Table 1. Characteristics of the Previous Pension System (PDIA-1999) in Slovenia
Men Women
Retirement age 63 61
Minimum insurance period at ages
63 (M) and 61 (W)
20 20
Minimum conditions for early
retirement
Age 58 with 40 years of
insurance*
Age 58 with 38 years of
insurance*
Minimum conditions for early
retirement without negative accruals
Age 58 with 40 years of
insurance
Age 58 with 38 years of
insurance
Pension assessment base Best 18 years of net wages (wages valorized with valorization
coefficients)
Computation of pension Pension assessment base multiplied by accumulated accrual rates
Accrual rates 35% for first 15 years, 1.5% for
each additional year
38% for first 15 years, 1.5% for
each additional year
Pension indexation Growth of wages**
Minimum pension assessment base Set nominally
Maximum pension assessment base 4 times minimum pension assessment base
Incentives and disincentives Higher accrual rates for later retirement and negative accrual rates for
early retirement
Note. *The years of insurance can also include the so-called added period; ** the indexation mechanism for
pensions was very complex and was actually never equal to the growth of wages.
Source: T. Stanovnik, & V. Prevolnik Rupel, Country Document Update 2014: Pensions, health and long-term
care – Slovenia, 2014, p. 5, Table 1.
According to the current system the old-age pension is calculated in the following way.
Initially, individual’s “net” wages by years received during the working career are calculated
by deducting the rate of social contributions and the average personal income tax rate from
the gross wages. Those “net” wages are then multiplied with the vector of valorization
coefficients1 to calculate the pension assessment base, which is computed by taking into
account the 24 best consecutive years (21 in 2015 when transition period is still ongoing).
Finally, accrual rate is applied to the pension assessment base in order to calculate the amount
of the first pension. Total accrual rate for women with full retirement conditions amounts to
60.25% (29% for the first 15 working years + 1.25% for each additional working year) and
for men it amounts to 57.25% (26% for the first 15 working years + 1.25% for each additional
working year). By assuming his wage was growing in line with the average Slovenian wage,
the net replacement rate, which is calculated as the ratio between the first pension and the last
pre-retirement wage, amounts to 57.25% as well (Berk Skok, Čok, Košak, & Sambt, 2013b;
Stanovnik, & Prevolnik Rupel, 2014; European Commission, 2014).
1 Calculation of these coefficients under the previous act (PDIA-1999) was very complex and it was based on the
past growth of pensions relative to wages from October 1990. The most recent values of these coefficients
contained downward correction because of cumulative growth of pension being lower than cumulative growth of
wages in October 1990 to 2012 period. Thus, high accrual rates presented in Table 1 actually give a false
impression of the generosity of the system because they should be multiplied by approximately 0.73 first.
However, with the implementation of the new reform (PDIA-2012) the computation of valorization coefficients
was simplified, since they are equal to the growth of nominal wages.
7
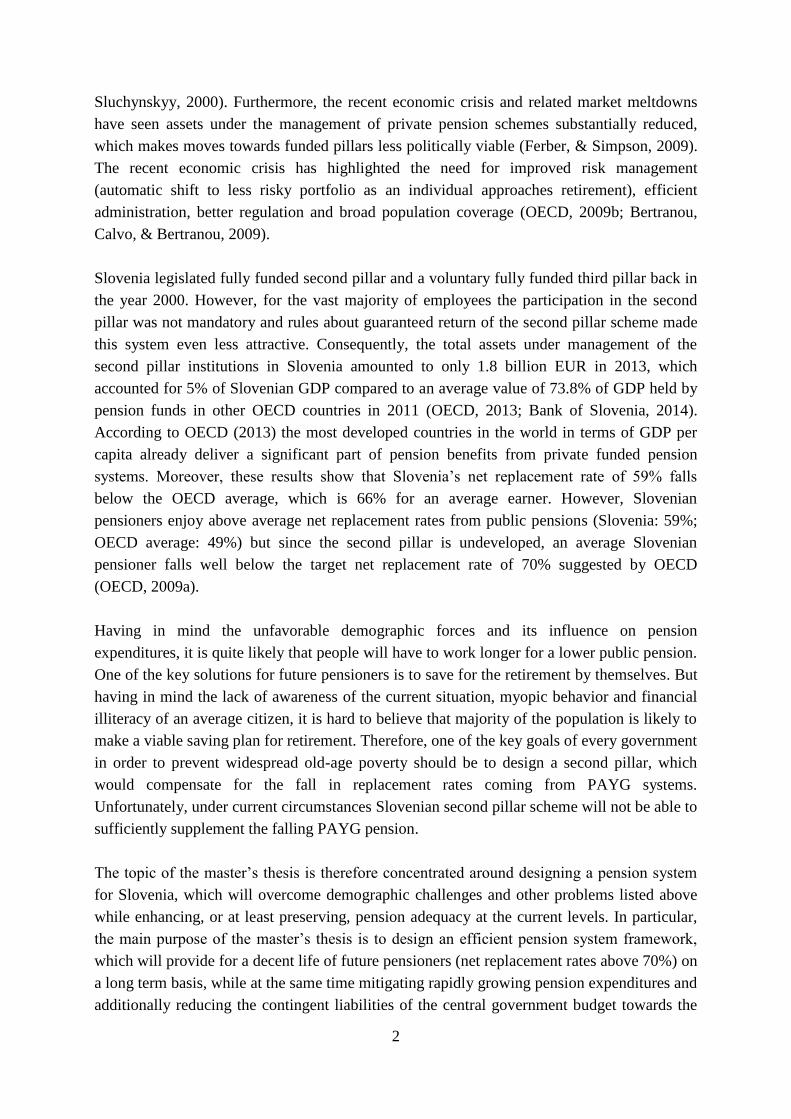
Table 2. Characteristics of the Current Pension System (PDIA-2012) in Slovenia
Men Women
Retirement age 65 65
Minimum insurance period at age 65 15 15
Minimum conditions for early
retirement
Age 60 with 40 years of insurance Age 60 with 40 years of insurance
Minimum conditions for early
retirement without negative accruals
Age 60 with 40 years of insurance* Age 60 with 40 years of insurance*
Pension assessment base Best 24 years of net wages (wages valorized with valorization
coefficients)
Computation of pension Pension assessment base multiplied by accumulated accrual rates
Accrual rates 26% for first 15 years, 1.25% for
each additional year
29% for first 15 years, 1.25% for
each additional year
Pension indexation 60% of wage growth and 40% of price growth (inflation rate)
Minimum pension assessment base 76.5% of average net wage
Maximum pension assessment base 4 times minimum pension assessment base
Incentives and disincentives Later retirement is awarded with up to 12% higher pension, early
retirement is penalized with up to 18% lower pension
Note. * The years of insurance without purchased period.
Source: T. Stanovnik, & V. Prevolnik Rupel, Country Document Update 2014: Pensions, health and long-term
care – Slovenia, 2014, p. 6, Table 2.
1.1.4 Taxation of Pensions
The basis for the pension’s taxation from the PAYG pillar is in general the same as for the
other taxpayers. However, pensioners residing in Slovenia are entitled to pension tax relief in
the amount of 13.5% of pension. Under this favorable tax-credit system the vast majority of
pension benefits (approximately 97%) is tax-free, while the remainder is taxed at a relatively
low tax rate. Compulsory pension contributions are entirely deductible from the personal
income tax base (Berk Skok et al., 2013b).
1.1.5 Financing of the PAYG pillar
PAYG pillar is financed through the compulsory pension contributions which are paid out of
the gross wage without any ceiling at the rate of 24.35% (employers pay 8.85% and
employees pay 15.5%), while the self-employed pay the same rate of pension contributions
out of the base which is a function of annual income from self-employment with the ceiling
equal to average national gross wage multiplied by 2.4.
In 2013 the state pension fund collected pension contributions in the total amount of 3.27
billion EUR or 9.37% of GDP. This was insufficient to cover the total pension expenditures
of the PAYG pillar which amounted to 4.25 billion EUR (or 12.19% of GDP), while the total
expenditures of the state pension fund totaled to almost 5 billion EUR or 14.18% of GDP. In
order to maintain the financial stability of the pension system, the current legislation stipulates

8
that central government budget and other sources cover the difference between the state’s
pension fund revenues from pension contributions and its expenditures (Zavod za
pokojninsko in invalidsko zavarovanje Slovenije, 2014a).
In 1990’s the state pension fund became financially dependent on the transfers from the
central government budget. Namely, the large increase in pension expenditures, which
followed the introduction of the first reform (PDIA) was financed by increasing the pension
contribution rate. As a result this rate increased from 22.55% in 1989 to 31% in 1995.
However, in order to increase Slovenia’s international competitiveness in 1996 its
government decided to lower the employer pension contribution rate from 15.5% to 8.85%,
which resulted in the reduction of the overall contribution rate from 31% to the current rate of
24.35%. This marked the end of the financial autonomy of the state pension fund. Namely, in
1996 the pension fund demonstrated a deficit for the first time, which has thereafter been
covered with the so called “generalized” transfers from the central budget in order to cover its
expenditures. In 2013 the difference between the aggregate pension expenditures and the
pension contributions amounted to almost 1 billion EUR or equivalently 2.82% of GDP,
while the total liabilities of the central government budget towards the state pension fund
totaled to 1.53 billion EUR or 4.39% of GDP. This means that almost 1/3 of the state’s
pension fund total expenditures in 2013 were financed directly through central government
(Bole, 1998; Majcen, & Verbič, 2009; Zavod za pokojninsko in invalidsko zavarovanje
Slovenije, 2014a).
Indeed, before 1996 the state pension fund also received transfers from the central
government budget, but these funds were intended exclusively for financing additional
obligations of the government, such as pensions for farmers, policemen, customs officers and
World War II veterans, which were not covered by the pension insurance. The insolvency of
the pension state fund passed unnoticed by the general public since the fiscal position of
Slovenia was relatively favorable at that time. However, since the beginning of the economic
crisis in 2008 the central government budget has been producing high deficits which are in a
large proportion a mirror image of the state pension fund’s deficits. In the period from 2008 to
2013 Slovenian taxpayers have financed PAYG system in the amount of 9.5 billion EUR (in
addition to paying the compulsory pension contributions, which are the main source of the
state pension fund’s revenue), which is twice as much as taxpayers invested in the
recapitalization of the Slovenian banks at the end of 2013. These figures clearly demonstrate
that the current Slovenian pension system is already a heavy burden for its economy (Majcen,
& Verbič, 2009; Zavod za pokojninsko in invalidsko zavarovanje Slovenije, 2009, 2011,
2013, 2014a).
1.2 Second Pillar
The second pillar is a fully-funded supplementary pension scheme, whose main purpose is to
compensate for the falling PAYG pension. Participation in the second pillar is, therefore,

9
conditioned with the participation in the PAYG pillar, while a person who does not fulfill this
criterion can participate only in the third pillar (see next section). The second pillar was
effectively introduced in Slovenia in 2000, when PDIA-1999 came into effect. However,
strictly speaking, the second pillar was introduced already in the early 90’s with the
implementation of PDIA, but due to the lack of tax incentives the number of enrolled
employees did not exceed several hundred.
Today participation in the second pillar is obligatory for public employees and persons
employed in “health risk” jobs, which are enrolled in two closed pension funds managed by
government–sponsored institution. The latter group is part of Sklad obveznega dodatnega
pokoninskega zavarovanja (hereinafter: SODPZ), while public employees are part of Zaprti
vzajemni pokojninski sklad za javne uslužbencev (hereinafter: ZVPSJU).
The inclusion of public sector employees into the second pillar occurred in April 2004 and
was a noteworthy example of seizing the opportunity. Namely, the wages of public sector
employees were set to increase in 2003 by 2.4%. Instead, the government, fearful of potential
inflationary effects2, proposed a conversion of this wage increase into premium for the second
pillar. This explains the relatively small accumulated assets per employee in ZVPSJU (see
Table 3). For employees in “health risk” jobs, on the other hand, employers are forced to pay
a compulsory contribution rate of 10.55% out of gross wages into to SODPZ. The amount
accumulated in this fund is therefore much bigger and should suffice for an adequate
occupational pension, which is considered to be a “bridging” pension until a person reaches
the retirement conditions for the PAYG pension (Stanovnik, & Prevolnik Rupel, 2014).
For all the other employees the enrollment in the second pillar is voluntary but it is promoted
by tax incentives. This voluntary part of the second pillar is further divided into collective and
individual pension scheme. This means that either an employee (individual scheme) or an
employer (collective scheme) can make a contribution, but the total amount of tax relief
cannot surpass either the maximum of 5.844% of an employee’s annual gross wage or a cap
that is set annually3. When an employee pays a second-pillar contribution, it is deducted from
her personal income tax base, while in case an employer makes a second-pillar contribution
for an employee, this contribution can be deducted from the company’s corporate income tax
base. In case an employee is part of an individual and collective second pillar scheme
simultaneously, the employer has the advantage in claiming the tax incentives (Berk Skok et
al., 2013b).
There were 541 thousand participants in the second pillar by the end of 2013, which
represents 68.3% of the total number of persons in employment. If we take into account only
2 In 2004 Slovenia was about to join the European Union and was particularly concerned about reaching the
inflation target defined by Maastricht criteria. 3 The cap was 2,646.2 EUR in 2010, 2,683.3 EUR in 2011, 2,755.71 EUR in 2012, 2,819.09 EUR in 2013 and
2014.

10
persons enrolled in voluntary supplementary pension schemes this percentage is reduced to
53.7%. Although these figures seem quite high, there is an obvious downward trend present in
this field. Namely, the number of people enrolled in voluntary pension schemes decreased by
almost 15% (50.000 people) since the end of 2010. What is even more frightening is the fact
that the amount of accumulated assets under the management of voluntary pension schemes
has been decreasing since 2010. This is a consequence of a provision in the PDIA-1999 which
allowed withdrawals of assets from voluntary pension accounts after 10 years of enrollment.
This provision has been effectively abolished by PDIA-2012, but the consequence of these
actions will have a lasting negative effect on the level of future pension benefits.
The amount of second pillar funds (mandatory and voluntary) increased by 10% in 3 years
and totaled to 2.4 billion EUR by the end of 2013. However, the assets under the management
of voluntary pension funds decreased by 15.5% in the same period and amounted to 1.1
billion EUR. As can be seen from Table 3, the assets per insured person are quite low (3.558
EUR) as the average annual contribution is only around 400 EUR4. The low value of
accumulated assets, even taking into account that these funds have been in operation at most
some thirteen years, indicates that pensions from the second pillar will not be able to
compensate for the fall in the pensions from PAYG pillar. We take an example of a
theoretical individual with average earnings who has been making additional annual
contributions in the amount of 400 EUR to second pillar account throughout his whole career
(40 years) and plans to retire at the age of 65 in year 2040 with full retirement conditions.
Assuming an average annual real yield of second pillar fund in the amount of 2% (which is
twice as much as was recorded in the past decade), this individual is expected to improve his
net replacement rate by merely 5% due to the additional pension stemming from the second
pillar.
A notable characteristic of the Slovenian pension system is inappropriate asset allocation that
is driven by the rules about guarantees in voluntary pension system (Pravilnik o izračunu…,
2005). Namely, these rules force the pension managers to reach at least 40% of the average
annual yield to maturity of the long term bonds (maturity above 1 year) issued by the
Treasury of the Republic of Slovenia on a single member contribution. In case the pension
asset managers do not reach this so-called minimum guaranteed return, they must provide
additional capital from their own reserves. As a result, pension managers do not take much
risk. Even though participants in the pension fund have long investment horizons, which for
some of them extend even beyond 40 years, less than 10% of their assets are invested in
stocks (see Table 4). Fixed-income instruments together with cash and deposits represent
approximately 90% of total assets. This is inconsistent with asset allocation in other
developed countries, where stocks represent roughly half of the assets allocated5 (Berk Skok
et al., 2013b).
4 Mandatory contributions to SODPZ are not included in this figure.
5 For the end of 2014, a Towers Watson study reported the following stock allocations: Australia, 51%; Canada,

11
Table 3. Mandatory and Voluntary Supplementary Pension Schemes: Insured Persons and
Assets, 31st of December 2013
Number of insured persons Assets (in million EUR) Assets per
insured
person in
2013 (in
EUR)
2013 % change in
2010 – 2013 2013
% change in
2010 – 2013
ZVPSJU (mandatory) 205,531 3.33 646.7 39.80 3,146
SODPZ (mandatory) 44,862 6.10 539.3 67.33 12,021
VOLUNTARY PENSION
SCHEMES: 290,461 -14.62 1117.9 -15.53 3,849
Pension companies 131,754 -16.41 505.3 -22.01 3,835
- Skupna 61,183 -17.96 217.8 -31.94 3,560
- Pokojninska družba A 39,577 -17.55 186.5 -10.77 4,712
- Moja naložba 30,994 -11.56 101.0 -15.05 3,259
Mutual pension funds 44,047 -19.04 227.8 -22.78 5,172
- KVPS 27,725 -22.99 149.6 -29.57 5,396
- Banka Koper 5,305 -16.39 28.4 -17.68 5,353
- Generali 4,432 -7.16 25.2 10.04 5,686
- A Banka 3,058 2.69 18.8 12.57 6,148
- Probanka 3,527 -18.07 5.8 -31.76 1,644
Insurance companies 114,660 -10.53 384.8 1.10 3,356
- Prva osebna zavarovalnica 78,521 -2.03 227.5 11.79 2,897
- Triglav 33,842 -25.71 151.4 -11.46 4,474
- Adriatic Slovenica 2,297 -6.47 5.9 -3.28 2,569
2nd
PILLAR 540,854 -6.97 2303.9 9.27 4,260
2nd
PILLAR without SODPZ 495,992 -8.00 1764.7 -1.20 3,558
Source: SKUPNA pokojninska družba d.d., Ljubljana, Revidirano letno poročilo za poslovno leto 2013, 2014, p.
3; SKUPNA pokojninska družba d.d., Ljubljana, Revidirano letno poročilo za poslovno leto 2010, 2011, p. 3;
Prva osebna zavarovalnica, d.d., Revidirano letno poročilo za 2013, 2014, p. 13.
As can be seen from Table 3 and Table 4, different second pillar institutions manage the
individual pension accounts: insurance companies (ICs), pension companies (PCs) and mutual
pension funds (MPFs). In the period 2003-2012 Slovenian mutual pension funds and pension
companies recorded only 1.05% and 0.87% of real average real annual yield respectively.
However, due to the economic crisis, other developed countries’ pension products (that are
much more exposed to stock market crashes) did not have much better performance.
Nevertheless, there is a conceptual difference between private pension products in Slovenia
and those in the developed world. Antolin (2008) reports performance between 6% and 8% in
real terms (geometrical averages) since introduction of private pension systems, while
ultraconservative asset allocation typical for Slovenia, characterized by investment policy
unification regardless of the age of the members enrolled in the second pillar, can yield only
meager performance (Berk Skok et al., 2013b).
41%; Japan, 33%; Netherlands, 30%; Switzerland, 29%; United Kingdom, 44%; and United States, 44% (Towers Watson, 2015).

12
Table 4. Breakdown of Total Assets (%) at the End of 2013
MPFs PCs ICs
Cash 0.5 4.9 n.a.
Deposits 13.9 13.3 n.a.
Stocks 1.0 9.9 n.a.
Bonds: other 25.0 27.5 n.a.
Government bonds 33.7 44.5 n.a.
Investment funds 25.9 0.0 n.a.
Total assets 100.0 100.0 n.a.
Source: Agencija za zavarovalni nadzor, Poročilo Agencije za zavarovalni nadzor za leto 2013, 2014, p. 55,
figure 11; Agencija za trg vrednostnih papirjev, ATVP sestava premoženja vzajemnih pokojninskih skladov,
2014.
However, the ultraconservative asset allocation typical for Slovenian pension products is
about to change. Namely, the last reform (PDIA-2012), which became effective on Jan 1
2013, enabled an investment policy design of pension funds according to life-cycle
investment policy. These new pension products, which are still in the preparation phase, will
enable individuals to choose among three different sub-funds which have different exposure
to stocks and therefore different expected returns. The idea is that individuals move to a more
conservative sub-fund as they get closer to their retirement.
1.3 Third pillar
Third pillar is a system of pension insurance, which includes voluntary pension insurance
based on individual accounts of insured persons. However, unlike second pillar, where the
majority of the contributions are paid in by the employers, the third pillar is exclusively
individual and there are virtually no conditions, which would limit the participation in the
third pillar. According to Holzmann and Hinz (2005) third-pillar arrangements should be
characterized by their flexible and discretionary nature in order to compensate for rigidities in
the first two pillars.
Since third pillar is not systematically regulated in Slovenia Berk Skok and Simoneti (2010)
propose an introduction of a third-pillar system similar to an USA system of individual
retirement accounts, which allows individuals to arbitrarily choose between
saving in three different forms:
Pension account opened in a bank (bank trust), which enables investments in deposits and
other banking products.
Pension account opened in a management company (trust), which enables investments in
investment and mutual funds.
Individual trading account (self-directed account) opened with brokerage companies,
which enables direct purchases of equities.

13
The system should offer tax incentives for payments dedicated to individual accounts in order
to stimulate participation in the third pillar. For the same reason, individuals should be
allowed to use the assets accumulated on their third-pillar accounts as collateral for a bank
credit. In order to enable efficient tracking of payments and tax control a central register
should be implemented. The register would cover all three pillars and would include all the
necessary information needed to calculate tax reliefs and other important information for
individual members (Berk Skok, & Simoneti, 2010; Berk Skok, 2012).
1.4 The impact of demographic changes on benefits from PAYG pillar
For decades scholars have been warning the public about forthcoming radical demographic
changes, but unfortunately this has not received much attention among policymakers.
Resolving these issues means elevating taxes or cutting benefits to individuals, which does
not appeal to the public and especially to politicians, whose planning horizons stretch only
until the next elections. In the meantime, demographic situation has become so aggravated
that taking immediate action is necessary. Therefore, it comes to no surprise that the issue of
population ageing is becoming one of the central issues facing not only Slovenia but the
whole European Union and many other countries around the globe as well. Lately,
international organizations have been pressuring countries to act in a timely manner in order
to facilitate change and many countries have already taken various measures (Sambt, & Čok,
2008; Berk et al., 2013b).
1.4.1 Demographic shifts in Slovenia and European Union
The 20th
century was an era of explosive population growth, with the world population
increasing from 1.6 to 6.1 billion. However, the 21st century is likely to see the end of world
population growth since many of the world’s most developed countries are facing rapid
population ageing (Lutz, Sanderson, & Schebrov, 2013). In particular, demographic dynamics
in the European Union are projected to result in a 10-year increase in the median age of
population, from 38 to 48 years of age, until 2050 (Muenz, 2007). According to European
Union (2012) the European workforce will start shrinking from 2022 onwards due to the
dominating effect of ageing over increasing employment rates. This process will put pressure
on the expenditures for health care and pensions, which are especially vulnerable to
population ageing.
The size and the structure of population are determined by three elements: mortality, fertility
and migration. Sambt (2008) using a sensitivity analysis on a case of Slovenia reveals that the
projected population ageing is mainly driven by the current population structure and future
mortality rates, which are much easier to forecast than fertility or migration rates. Even if a
combination of very optimistic assumptions (from an economic point of view) are taken into

14
account (high fertility, high net migration and low variant of life expectancy at birth) the
process of population ageing largely remains present.
This can be mainly explained by the fact that the large baby-boom generations born after
World War II are now starting to retire. In the coming decade these people are going to shift
from employment to retirement status, rapidly increasing the old-age dependency ratio. The
main problem is the discrepancy in size between the generations born after 1980’s and the
baby-boom generations. Namely, during 1980’s total fertility rate (hereinafter: TFR)6
plummeted from 2.1, which is regarded as replacement-level of fertility, and reached its
bottom in 2003 at the level of 1.2. As a consequence, the number of newborns was almost
halved in this period since only 17,321 children were born in 2003 compared to 29,920
children born in 1980. Recently TFR has stabilized around 1.5, however, even if these rates
were to increase even more, which Eurostat projections assume, the absolute number of
newborns is expected to fall considerably since there will be fewer women of reproductive
age. Furthermore, from an economic point of view, increased fertility rates do not have
positive economic effects for about 20 to 25 years, as cohorts of newborns start to enter the
labor market. In the meantime, the effect of increased fertility can have negative economic
effects in the form of increased education, child allowances and health care expenses (Sambt,
2008; Berk et al., 2013b).
On the other hand, net migration can yield positive economic effects much faster than
increased fertility since the majority of immigrants are young people. But this effect, without
assuming unreasonably high net migration flows into the country, can be only moderate.
Logically, immigrants also get older with time and eventually become a burden for social
security system (Bonin, Raffelhuschen, & Walliser, 2000; Sambt, 2008).
Furthermore, the persistent trend of decreasing mortality rates has put additional pressure on
demographic structure since people are expected to live longer. In Slovenia the life
expectancy at birth has been increasing rapidly in the past few decades. In the period from
1960 (1961) to 2013 the life expectancy has increased by 10.8 years for males (66.1 to 76.9)
and by 11.2 years for females (72 to 83.1 years), while the past decade alone (2002-2003 to
2013) saw an increase of 3.8 years for males and 2.4 years for females. Some European
countries such as Switzerland7 and Sweden already have considerably higher life expectancy
than Slovenia, and they are expected to increase even more in the future (Statistical Office of
the Republic of Slovenia, n.d.).
In our analysis, we apply the Eurostat population projections (EUROPOP 2013) for the period
from 2014 to 2080. These projections were prepared for the countries of the European Union
(hereinafter: EU-28) and the European Free Trade Association countries8 based on gradual
6 TFR is the average number of children a woman gives birth to, during her fertility period.
7 E.g., in Switzerland the life expectancy at birth in 2013 was 80.6 and 84.7 for males and females respectively.
8 Iceland, Liechtenstein, Norway and Switzerland.

15
convergence of mortality and fertility rates, with 2150 set as the convergence year. Figure 1
presents future dynamics of the age structure of the Slovenian population by three age groups
which are related to economic activity: 0-14, 15-64, 65 and older.
Figure 1. Structure of Slovenian Population Divided into Three Age Groups Based on
EUROPOP2013 Projections for 2014-2080.
Source: Eurostat, EUROPOP 2013 – Population projections at national level, 2015.
According to EUROPOP 2013 Slovenian population is expected to shrink by 54.000 (2.6%)
people to 2,006,508 by the year 2080, while the number of people living in Slovenia is
expected to persist above 2 million throughout the whole period. What is much more
worrying than declining population is the change in its age structure. Namely, the percentage
of people aged 65 and older in the total population is expected to increase from 17.5% to
29.8% in 2050. After 2060 and up until 2080 this percentage is expected to decrease only
moderately to levels around 28%. Conversely, the size of the working age population (15-64)
is expected to decrease from the current levels of 67.9% to 56.6% in 2080. These two
processes will undoubtedly have adverse effects on the public finance systems since there will
be fewer workers to support the growing number of old people.
This unfavorable economic development can be clearly demonstrated by old-age dependency
ratio, which is calculated as the ratio between the elderly (65 and older) and the working-age
population (15-64), multiplied by 100. As can be seen from Table 5, the old-age dependency
ratio in Slovenia is expected to almost double in the 2014-2080 period, from 25.7 to 49.7,
indicating an increasing demographic burden on the productive part of the population in order
to maintain the living standard of the economically dependent. In a similar fashion, old-age
dependency ratio is expected to increase from 28.2 to 51.0 in the same period at an aggregate
EU-28 level. Therefore, the analysis can be generalized to almost all developed countries
16
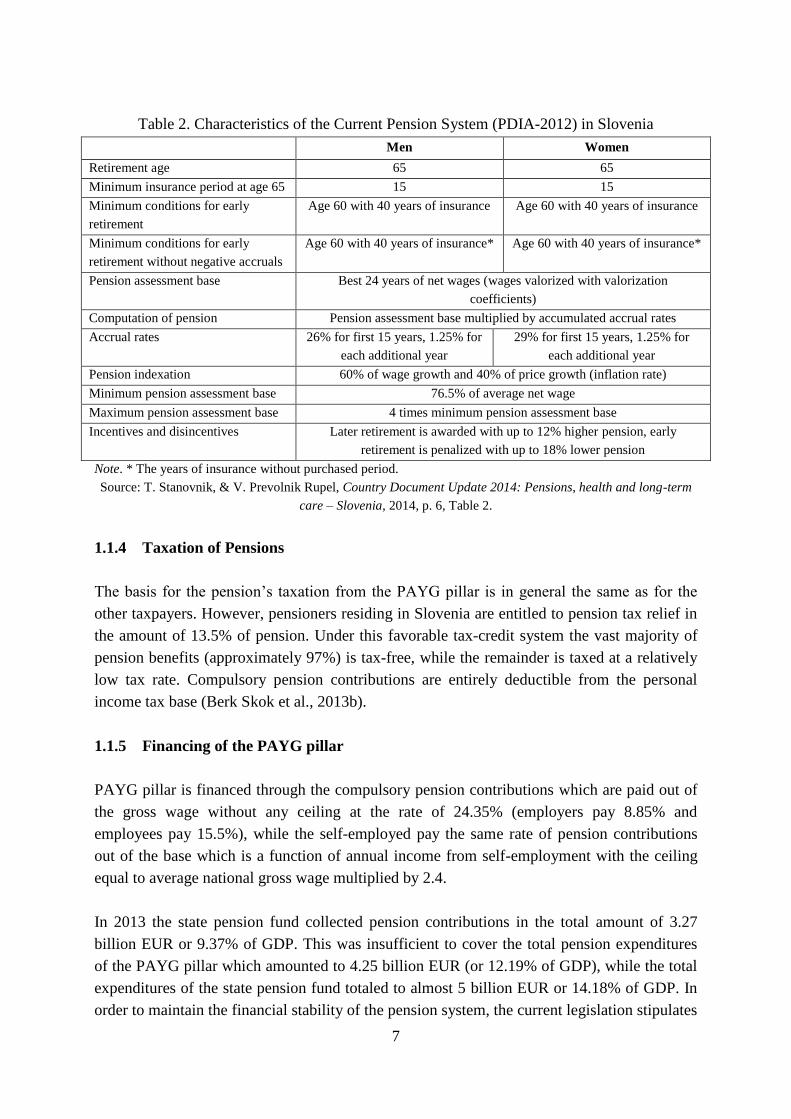
around the world since they experience population ageing in similar extent. This demographic
shift is expected to be evenly distributed among the old and the new EU member states since
there are virtually no differences in the projected old-age dependency ratios between the two
groups (see Table 5). However, there are huge differences within the two groups of EU
member states. For example Slovakia’s (68.7) old-age dependency ratio is expected to be
more than double than that of Lithuania (34.0) by the year 2080.
Table 5. Old-Age Dependency Ratio Based on EUROPOP 2013 Projections for EU-28
Divided into Old and New Member States.
Old member states New member states
2014 2030 2080 2014 2030 2080
Ireland 19.2 30.3 36.9 Lithuania 27.5 47.3 34.0
Luxembourg 20.4 25.6 44.0 Latvia 28.6 41.9 40.2
Sweden 30.6 35.5 44.5 Cyprus 19.5 31.8 42.5
United Kingdom 26.9 34.9 44.7 Czech Republic 25.7 35.2 47.8
Belgium 27.3 34.5 45.1 Malta 26.4 40.5 49.0
France 28.4 39.0 46.4 Romania 24.3 32.7 49.6
Denmark 28.3 36.5 47.2 Slovenia 25.7 40.6 49.7
Spain 27.2 39.6 48.3 Estonia 27.9 39.6 50.8
Finland 30.2 41.3 49.8 Hungary 25.8 34.4 52.9
Netherlands 26.4 40.1 52.3 Bulgaria 29.3 38.9 53.4
Austria 27.2 37.4 54.2 Croatia 27.5 39.1 54.6
Greece 31.4 41.2 56.8 Poland 20.9 35.4 59.6
Italy 32.9 40.8 56.8 Slovakia 19.0 32.6 68.7
Germany 32.2 46.8 59.9
Portugal 30.2 43.1 68.2
AVERAGE* 27.9 37.8 50.3 AVERAGE* 25.2 37.7 50.2
Note. *Calculation is based on simple average.
Source: Eurostat, EUROPOP 2013 – Population projections at national level, 2015.
1.4.2 Projecting future public pension expenditures based on EUROPOP 2013 and
expected level of pensions from the PAYG pillar
The model used for projecting future PAYG pension expenditures and compulsory social
contributions for Slovenia is an age-profile based model (for more information about this
model see section 3.2). The model rests on the age profiles from the year 2013, which is
regarded as the base year. The projections are made for the period from 2014 to 2060 and
EUROPOP2013 projections presented earlier are used in the model. The effects of the current
pension reform (PDIA-2012) are taken into account. Nevertheless, the model assumes zero
nominal indexation of pensions in the period 2014-2018, which is consistent with the
budgetary plan laid out by the Ministry of finance, whereas from 2019 onwards stipulations
from PDIA-2012 are taken into account for determining the level of pension indexation, i.e.

17
60% indexation to the nominal growth of wages and 40% to the growth of consumer price.
However, according to the recent speculations in the media, the Slovenian prime minister has
made an informal commitment to the pensioners’ party (DeSUS) that the pensions will be
indexed in 2016 (Cerarjeva zaveza o uskladitvi pokojnin leta 2016, 2015). Therefore, we
present additional projections of the public pension expenditures in Figure 2, where “normal”
pension indexation (according to PDIA-2012) is assumed from 2016 onwards.
Figure 2. Projections of PAYG Pension Expenditures and PAYG Pension Contributions in
Slovenia in 2015-2060 as a Share of GDP under Different Indexation Scenarios
The results presented in Figure 2 indicate that, without further changes to the current pension
system, population ageing would largely translate to the unsustainably high public pension
expenditures as a share of GDP in the long run. The more optimistic scenario in terms of
pension expenditures, which assumes zero indexation of pensions until the end of 2018,
predicts that public pension expenditures will exceed 12% of GDP in 2029 and reach its
maximum level at 15.66% in 2053. The more pessimistic scenario on the other hand, which
assumes zero indexation until the end of 2015, predicts that public pension expenditures will
exceed the limit of 12% already in 2026, while the maximum share in GDP is to be reached in
2052 at 15.70%. More importantly, the pension contributions are expected to remain stable at
a level below 9.5% of GDP regardless of the indexation scenario. Thus, the projected rising
disparity between the contributions and the expenditures of state pension fund will eventually
manifest in unsustainably high deficits, a burden that would be financed through the central
government budget. The projections indicate that the taxpayers will have to provide additional
assets in the amount of 204% of GDP throughout the period 2015-2060. Furthermore, this
figure increases to 218% of GDP if the more pessimistic scenario is taken into account.
6%
8%
10%
12%
14%
16%
2015 2020 2025 2030 2035 2040 2045 2050 2055 2060
PA
YG
pe
nsi
on
exp
en
dit
ure
s a
nd
co
ntr
ibu
tio
ns
as a
sh
are
of
GD
P
Year
PAYG expenditures (zero nominal indexation until 2015)
PAYG expenditures (zero nominal indexation until 2018)
PAYG contributions

18
If no evident changes to the system are made, the government would have to prevent further
increases in the public pension expenditures by reducing the pension benefits. Below we
present projections of net replacement rates for different scenarios in case the government
decides to prevent increases in the public pension expenditures above some percentage of
GDP. We set tolerated maximum percentage of public pension in the share of GDP,
alternatively, at rates of 11%, 12%, 13%, 14% and 15% and assume that this expenditure
capping will be achieved in a way that all pensions will be cut proportionally, regardless of
the type and level of pension.
Under the current pension law (PDIA-2012) the net replacement rate for a male individual
with full retirement conditions is 57.25% (assuming his wage was growing in line with the
average wage in Slovenia) and it is expected to stay this way in the future only in case the
government does not prevent further increases in the public pension expenditures. However,
capping the pension expenditures at 11% of GDP has an immediate negative effect on the net
replacement rates, while in the long run the net replacement rates are expected to decrease by
a third to 40.2% in 2053 (Figure 3). Moreover, assuming “normal” pension indexation from
2016 onwards, the projected fall in replacement rates is even more pronounced, especially in
the initial period of the forecast horizon (Figure 4). Namely, in case the pension expenditures
are capped at 11% of GDP, the net replacement rate would drop to 52.6% already in 2019.
Figure 3. Projections of Net Replacement Rates at Retirement in Slovenia in the period 2015-
2060 for Scenario with no Limitations and Different Scenarios if Limiting Public Pension
Expenditures to Certain % of GDP, Zero Indexation is Assumed until the End of 2018.
Furthermore, these results show that even a simple measure such as postponing the indexation
of pensions by 3 years can contribute to a more even distribution of burdens among different
0%
10%
20%
30%
40%
50%
60%
70%
2015 2020 2025 2030 2035 2040 2045 2050 2055 2060
Ne
t re
pla
cee
mn
t ra
te o
f P
AY
G p
en
sio
ns
Year
15%
14%
13%
12%
11%
no limitations

19
generations since the reductions in net replacement rates occur later and to a lesser extent in
case the indexation is postponed. This is consistent with findings of Sambt and Čok (2008, p.
108) that also use a Slovenian case to emphasize that: “(…) the timing of measures for
mitigating the pressure of an ageing population on pension expenditures decisively
determines the distribution of burdens across different cohorts.” This is an important result
since pensioners and people approaching retirement will prefer delaying measures in the form
of cutting pensions as long as possible at the cost of much more painful cuts that will be
experienced by younger generations.
Figure 4. Projections of Net Replacement Rates at Retirement in Slovenia in the period 2015-
2060 for Scenario with no Limitations and Different Scenarios if Limiting Public Pension
Expenditures to Certain % of GDP, Zero Indexation is Assumed until the End of 2015
Altogether, if no evident changes to the system are made, one should expect that already low
net replacement rates will be much lower in the future. According to the results presented
above, many of the future pensioners are expected to fall below the poverty threshold, while
achieving the 70% net replacement rate suggested by OECD will be possible only with
substantial voluntary pension savings, which should fill the PAYG shortfall. But having in
mind the lack of awareness of the current situation, myopic behavior and financial illiteracy
of an average citizen it is hard to believe that the majority of the population is likely to make a
viable saving plan for retirement. Furthermore, results presented in previous subsections
clearly indicate that the pensions from the second pillar will not be able to compensate for the
shortfall in the PAYG pension. Therefore, we argue that the Slovenian government should
introduce a mandatory second pillar which would “force” people to save for their retirement.
0%
10%
20%
30%
40%
50%
60%
70%
2015 2020 2025 2030 2035 2040 2045 2050 2055 2060
Ne
t re
pla
cem
en
t ra
te o
f P
AY
G p
en
sio
ns
Year
15%
14%
13%
12%
11%
no limitations

20
2 INTRODUCING A MANDATORY SECOND PILLAR PENSION
SYSTEM
In the light of forthcoming population ageing a number of Central and Eastern European
countries (hereinafter: CEECs) decided to reform their pension systems and Slovenia was no
exception. In many of these countries the direction of pension reforms was strongly impacted
by paradigmatic change advocated by the World Bank, which included the introduction of
second pillar at the cost of privatizing the part of the PAYG pillar. In the first part of this
section we describe the advantages of such changes as well as potential pitfalls and
difficulties that arise from the privatization of the PAYG pillar, while in the second part we
present an efficient framework for the introduction of the mandatory second pillar. Therefore,
we provide answers to the questions why and how should the second mandatory pillar be
implemented in the multipillar pension system in the first two parts of the section. We
conclude this section with lessons from the past which includes a short overview of the
existing pension systems with mandatory second pillars among CEECs and their experience
with the recent economic crisis.
2.1 Economic benefits of introducing a mandatory second pillar
Pension systems provide mechanisms for consumption smoothing to older individuals that are
eventually unable to remain economically productive. Therefore we can consider pension
systems as methods for addressing and managing the risks of ageing. In order to efficiently
manage these risks, the optimization of expected returns can be achieved through
diversification of the underlying elements of the system as in any other portfolio. Particularly,
in the case of pension system the diversification can be achieved through a multipillar system
(Holzmann, & Hinz, 2005).
The World Bank's three-pillar pension system presented in the famous work of the mid-
1990's, Averting the old age crisis, eventually evolved into a five-pillar system, which was
introduced in the 2005 report: Old-Age Income Support in the 21st Century: The World
Bank’s Perspective on Pension Systems and Reform. The recommended pension system is
comprised of some combination of five pension pillars (The World Bank, 1994; Holzmann,
Hinz, & Dorfman, 2008):
● a noncontributory or “zero pillar” that provides a minimal level of protection with the
poverty alleviation objective;
● a “first pillar” contributory system that is linked to varying degrees to earnings and seeks
to replace some portion of lifetime pre-retirement income, typically financed on a PAYG
basis;
● a mandatory “second pillar” that is essentially an individual savings account with wide set
of design options, choice parameters for selecting investment plans and options for
withdrawal phase;

21
● voluntary “third-pillar” arrangements that can take many forms (individual, employer
sponsored, defined benefit, defined contribution) and are usually characterized by their
flexible and discretionary nature, which compensate for rigidities in the other pillars;
● informal “fourth-pillar” which includes intra-family or intergenerational sources of both
financial and non-financial support to the elderly, including access to health care and
housing.
Each of the pillars both address, and are exposed to, its own specific type of risks. For
instance zero pillar is usually introduced for poverty alleviation objectives, while first pillar
addresses, among others, financial market risk, risk of individual myopia, low earnings even
within the formal economy, and inappropriate planning horizons due to uncertainties of life
expectancies. Zero and first pillars typically depend on budgetary and PAYG financial
resources and are thereby characterized by demographic and political risks. Mandatory second
pillar, on the other hand, also addresses myopia and, if properly designed and managed, can
better insulate individuals from political risks. However, they subject participants to financial
market volatility and partially demographic risks if they entail a requirement for some
mandatory annuitization. Third pillar compensates for rigidities in the design of other pillars
but entails financial and agency risks associated with the private management of assets
(Holzmann, & Hinz, 2005).
Combining all these pillars into a well-designed system means that, through diversification,
any given level of expected retirement income, or “return,” can be achieved at a lower “risk”.
Basically, the rationale behind this statement is that the drivers of pension benefits in different
pillars are not perfectly correlated. The simplest example of diversification benefits is to
compare the relationship between the earnings-based, defined-benefit system, typical for
PAYG pillar with the individual accounts typical for second or third pillars. The PAYG
pillars usually provide pensions based on wage histories and are consequently subject to the
risks of variation in individual or average wages, while second and third pillar accounts are
invested in financial assets and are thus exposed to risks associated with the return on
financial securities, i.e. stock and bond returns. Holzmann (2002) confirms the diversification
benefits of multipillar systems by reporting very low correlation coefficients between wages
and stock returns (in the range between -0.077 and 0.202) and between wages and interest
rates (in the range between -0.197 and 0.238), while other authors also report similar figures
in this area of diversification (Knell, 2010). Since the underlying drivers of different pillars
move in different directions, Holzmann and Hinz (2005) strongly argue in favor of multipillar
pension structure in which not all savings are put into one basket and a risk floor is provided.
2.1.1 Benefits of funding
According to Holzmann and Hinz (2005) the potential economic benefits of a multipillar
pension scheme with a mandatory second and/or voluntary third pillar can be summarized in
22
three main areas: enhancing output, handling population aging, and enhancing individual
welfare.
Enhancing output
According to empirical evidence funding can have a positive effect on output through higher
aggregate saving, lower labor market distortions and through more efficient financial markets.
However, these effects are conditioned on proper institutional environment and may not occur
automatically.
Since it is financed through social contributions of contemporaneous working generations,
monopillar PAYG system provides no impetus to individuals to save privately for retirement,
while a mandatory second pillar, by contrast, compels individuals to save by themselves for
the retirement period. However, there is also ample empirical evidence which show that
private pillars can crowd out voluntary savings (including informal savings of friends and
family), which are an important source for development of SMEs in transition countries.
Namely, the institutionalization of substantial share of private savings through mandated
second pillar might have damaging effects on the level of entrepreneurship in a country, if
entrepreneurs are otherwise credit constrained (Volz, 2004). Nevertheless, some other cross-
country studies argue that funding of pensions increases national saving in case of a
introduction of a mandatory pension program, a difference that might be accounted for by
credit constraints and restricted savings substitution in mandated compared to voluntary
schemes (Murphy, & Musalem, 2004). This can be explained by the life-cycle model of
consumption which suggests that (Nickel, & Almenberg, 2006, p. 18): “…in the absence of
credit constraints, the introduction of forced savings would be offset as households incur more
debt to finance current consumption, thus making up for the reduction in disposable income.
If, however, households are credit constrained or capable of only limited forward-looking
behavior, then aggregate savings can be expected to increase as a result of such reform.”
Additionally, behavioral evidence points to an “awareness effect”, which can be triggered by
the introduction of forced savings by simply increasing awareness of the need to save for
retirement, thus spurring further savings. The bottom line is that the introduction of funded
pillar by itself is not a guarantee for an increase in aggregate saving. Instead this relationship
is largely dependent on efficient institutional framework. Empirical evidence suggests that
centralizing the administration of a multipillar system in a form of clearinghouse model can
increase aggregate saving and thus national output (Holzmann, & Hinz, 2005; Nickel, &
Almenberg, 2006).
Although the effect of funding on national savings is largely dubious and is probably
conditioned on proper institutional set-up, the positive influence of funding on the structure of
aggregate saving and financial market development seems to be well accepted within the
World Bank research. Empirical evidence suggests a positive influence of funding on the
financial market development, which is crucial for sustainable and high economic growth.

23
Funding can contribute to the financial market development through multiple mechanisms.
According to Impavido, Musalem and Tressel (2003) the evolution of pension funds increases
the share of contractual savings in the economy which leads to development of stocks and
bonds market by making them more liquid and deeper, especially if pension fund
contributions are mandatory. Development of contractual savings implies transferring
resources from short-term to long-term projects, which in turn improves the financial
structure of enterprises and banks by favoring equity over debt finance and by increasing the
maturity of debts, which improves the resilience of an economy to various shocks (Impavido,
Musalem, & Tressel, 2001; Holzmann, & Hinz, 2005).
Pension schemes that impose a major tax on wages can have negative influence on the
development of an economy by distorting labor markets and impairing labor mobility.
Furthermore, some contribution and benefit formulas can provide incentives to leave the labor
market early and thus magnify the increased financial burden caused by aging populations
(Gruber, & Wise, 2007). Prescott (2004) argues that the difference in labor supply between
US and Europe can be largely explained by the detrimental effects of tax wedge on labor
force participation. Moreover, according to Corsetti and Schmidt-Hebbel (1997) highly taxed
labor can lead to development of technologically inferior gray economy, which ultimately
lowers the growth path of the country. A funded system can, however, through more direct
linkage between contributions and benefits lead to lower market distortions, which in turn
positively affects national output. Naturally, a more direct contribution-benefit link can also
be established within a PAYG system, but the implicit tax element potentially remains larger
(Holzmann, & Hinz, 2005).
Handling population aging
Funding of pension liabilities is not a magical solution for population ageing. At the most
basic level there are no main advantages of funded pillars in regard to population aging since
both unfunded and funded pension schemes need the next generation of workers, either to pay
contributions or to purchase the accumulated assets. Nonetheless, funded pillars are more
likely to be more effective in coping with population aging for three key reasons. Primarily,
funding forces the current working generations to co-finance their increase in life expectancy
by limiting their ability to pass the bill on to the next generations. Secondly, access to funded
pension schemes can provide flexibility to individuals to split the increase in life expectancy
between additional work and retirement leisure according to their preferences and career
paths. Finally, while the rate of return for both forms of financing will be negatively
influenced by forthcoming population aging, the capacity of the funded pension schemes to
invest overseas allows it to diversify demographic risks internationally as aging is asymmetric
across different regions (Holzmann, 2002; Holzmann, & Hinz, 2005).

24
Improving individual welfare
Aside from diversification effects, which were already discussed above, multipillar schemes
with funded pillars can have positive effects on individual welfare also in the form of better
political isolation, improved individual choice, higher rate of return and lower excess
taxation.
Holzmann and Hinz (2005) claim that better isolation of benefits against political risk under
fully-funded pillar goes beyond risk diversification since in a decentralized and market-based
structure with well-defined property rights and functioning courts, governments’ discretion to
reduce benefits is considerably smaller than under unfunded and centralized structures where
pension liabilities are not backed by securities, which are protected by legal property rights.
However, the recent events in Hungary, where conservative government “nationalized” the
second pillar in 2011, clearly demonstrate that funding is not a panacea against political risks
(Simonovits, 2011).
As already stated above, access to funded pension schemes creates more flexible retirement
arrangements that enable individuals to choose arbitrarily among varying retirement options
according to their preferences and career paths, which in turn facilitates labor mobility across
professions and countries. However, the value of this benefit is often doubted since empirical
evidence suggests that there is a tradeoff between individual choice and costs resulting from
high financial illiteracy of individuals across the globe (James, Smalhout, & Vittas, 2001;
Holzmann, & Hinz 2005).
A funded scheme should also provide a higher rate of return compared with an unfunded
system. Namely, there is ample empirical evidence that demonstrate clear dominance of
funded over unfunded systems in terms of efficiency. Garrett and Rhine (2005) use the USA
case to demonstrate that funded systems deliver higher pension benefits than PAYG systems
with the same level of contributions. This is even more the case when there is no additional
tax burden due to the transition costs of privatizing a part of PAYG pillar. However, some
claim that the higher return only reflects higher risks and hence a risk-adjusted return will not
manifest in a welfare improvement (Werner, 2000; Mora, 2005), while others claim that in a
dynamically efficient economy, return on capital must outpace output growth, independent of
risk (Valdes-Prieto, 2000). In general there is a prevalence of empirical evidence which
supports the hypothesis that markets are dynamically efficient, which in turn means that the
rate of return on a well-diversified portfolio of investments and insurance contracts is above
the growth rate of wages in most countries most of the time (Abel, Mankiw, Summers, &
Zeckhauser, 1989). This is supported by long-run data for major developed economies, which
confirms that the rate of return of stocks and to some extent bonds exceeds the growth rate of
wages (Thompson, 1998). However, Holzmann and Hinz (2005) conclude that the difference
in the gross rate of return becomes unimportant, if it is offset by high transaction costs of
funded schemes.

25
Funding can, as already explained above, through lower labor taxation reduce market
distortions. However, this implication is not to be taken lightly. Namely, some forms of
funded defined-benefit plans can be more distortionary than an unfunded defined-benefit plan
based on career earnings. On the other hand, funded defined-contribution schemes are the
closest to an actuarially fair system, so the labor market distortions should be low since
contributions are perceived as savings rather than taxes. This view is supported by empirical
evidence from Latin America, which indicates that introducing individual retirement
accounts, which are based on funded defined-contribution plans, stimulates participation in
the formal economy of the reformed system. However, this benefit typically occurs gradually
as system matures and employees and employers get comfortable with the new set of rules put
in place by the reform (Packard, 2001; Ooghe, Schokkaert, & Flechet 2003; Holzmann, &
Hinz, 2005).
2.1.2 Costs of moving to a funded system
While funding provides many benefits in many circumstances, it also introduces new or
additional costs. For example, assets which are under the management of pension funds are
exposed to financial risks and are also burdened with transaction costs, usually in the of
management and entry fees. However, for most reforming countries the transition costs play a
pivotal role in evaluating the net benefits of moving toward more funded provisions.
Pension systems of many developed economies in Europe (such as France, Germany and
Italy) and also transition economies in Central and Eastern Europe (which includes Slovenia)
are characterized by developed and dominant pay-as-you-go pillars with comprehensive
coverage. Consequently, a transition toward a partially-funded multi-pillar system in case of
these countries would be accompanied by substantial fiscal costs resulting from the current
pension obligations to retirees and workers. Therefore, Holzmann and Hinz (2005, p. 50)
warn that: “The optimal degree of funding in these circumstances is derived largely through
cost-benefit analysis that needs to weigh the benefits, and their probability, against the
anticipated fiscal costs, keeping in mind that not all costs are economic.”
Implicit pension debt
The crucial transition cost of moving from a PAYG to a funded system is perceived in the
form of implicit pension debt (hereinafter: IPD). Namely, when establishing an unfunded
PAYG pension scheme, the government actually mandates the payment of pension
contributions to the current generation, while, at the same time, promising to pay future
pension benefits. When a PAYG pension system is substituted completely or at least partially
by a funded pension scheme, pension contributions previously used to finance PAYG
liabilities are diverted to the funded pillars and the government has to find a way to finance
these pension promises. Furthermore, if the resulting deficit is financed by increased

26
borrowing on capital markets, and if the mandatory pension funds are large buyers of these
domestic government bonds then multipillar reform may simply amount to exchanging
implicit debt for explicit debt, without producing the net benefits of funding. However, the
real cost of transition should not be perceived as the increase of an explicit public debt which
happens due to the implementation of the mandatory second pillar. The real cost of transition
actually equals the difference between the market interest rate (interest rate on the explicit
debt) and the growth rate of wages (interest rate on the implicit debt). If these real costs of
transition are lower than the discounted gains of the mandatory second pillar (higher real
income), such transition can be welfare enhancing for all generations (Bole, 1998; Holzmann,
Palacios, & Zviniene, 2004; Nickel, & Almenberg, 2006).
According to Holzmann (1997) the relevant implicit debt definition (accrued-to-date liability)
in mature pension systems amounts to 20 to 30 times the annual public pension expenditures,
which are generally in the range of 5 to 15% of GDP translating to an implicit debt of 100 to
450% of GDP. In Slovenia the total pension expenditures in 2014 amounted to 11.5% of
GDP, which is equivalent to an implicit debt in the range of 230 to 345% of GDP (Zavod za
pokojninsko in invalidsko zavarovanje Slovenije, 2015). Debt repayments of this size, which
would in case of a move towards a mandated funded system at least partially become explicit,
create a major cost barrier for current and future generations. However, looking from a
different perspective one can conclude that a gradual move to funding is unavoidable and is
already happening since demographic pressures force governments across the globe to reduce
PAYG pension benefits and to tighten eligibility requirements. At the same time this forces
individuals to offset these reductions by increasing their savings in financial and non-financial
retirement products (such as housing). Therefore, governments in many developed countries
around the world have implicitly decided that individual savings in the third pillar, or in
Slovenian case also in the second pillar, are preferable to expanding or retaining PAYG
pension benefits at current levels (Holzmann, & Hinz, 2005).
Implicit debt and its accompanying economic costs may be smaller than the figures listed
above suggest. Namely, move towards a multipillar system is usually accompanied with
parametric reforms of existing PAYG pillar. Moreover, reforms such as a reduction in benefit
levels and an increase in retirement age are typically required in order to reduce the
corresponding IPD. The magnitudes of recent reforms in OECD and some others countries
amounted to cuts in IPD of 25 percent or more. Another mechanism to reduce the economic
burden of the fiscal transition costs is through positive externalities of the funded pillars,
which manifest themselves in the form of lower labor market distortions and higher growth
path, which can be achieved through improved national saving structure and boosted financial
markets (Bole, 1998; Impavido, Musalem, & Tressel, 2001; Holzmann, & Hinz, 2005).
Furthermore, the move from a PAYG-only system to a multipillar system is also likely to
increase the capacity to undertake a reform due to the enhanced credibility of a new
multipillar system. Namely, the reforms of the PAYG pillars are essentially not credible

27
because they never advance to a point at which they become sustainable. Such situation,
which is typical for Slovenia, is characterized by the series of small parametric reforms with
no clear reform direction, which is ultimately manifested in reform resistance as individuals
react rationally to oppose a small reform that will be followed by another unknown reform in
the future. Conversely, a move toward a multipillar paradigm, which incorporates a mandated
fully-funded defined-contribution scheme, which is the closest to an actuarially fair system,
improves the long-term sustainability of the pension system and increases the credibility of
the political process (Müller, 2003; Holzmann, & Hinz, 2005).
In summary, the optimal degree of funding needs to be assessed through a cost-benefit
analysis, which needs to take into account the specifics of a particular reforming country, its
existing pension system and its institutional, economic and political environment. In any case,
the concept of a mandated second pillar scheme can be used as a benchmark for the analysis
of the results of the suggested reform rather than as any type of universal model that would
define or limit possible alternatives.
2.2 How to effectively implement the mandatory second pillar?
The necessary condition for positive benefits of funding to actually materialize is a well-
designed institutional set-up on which we elaborate in this sub-section. In particular, we
examine the possibilities for a new mandatory second pillar in regard to its size, organization,
administration, guarantees, transition arrangements, participation requirements, role of the
Government, annuitization etc.
2.2.1 Size of the second pillar and financing the transition
When conceiving a pension reform which aims to introduce a mandatory second pillar, one of
the key dilemmas that need to be accounted for is to determine its optimal size. The size of
the second pillar, measured as percentage points of the payroll, positively influences the
potential benefits of a funded pillar but simultaneously increases the transition costs of such a
move. Therefore the preferred size of any mandatory funded second pillar should be
determined based on objectives and benefits expected from the pension reform as well as the
economic and institutional constraints on achieving these objectives (Lindeman, Rutkowski,
& Sluchynskyy, 2000).
According to past experience with European countries which introduced the mandatory
second pillar in their pension systems, the lower bound of the second pillar size is perceived
to be around 4-6% of the payroll, while the upper bound is perceived to be in the range of
7-10%. The lower bound exists due to the issue of cost effectiveness. Namely, the assets
going into the second pillar arrangements need to be invested according to market signals,
which in most cases require some kind of insulation from political influence. In order to
achieve this, many countries have enabled their workers to choose among competing fund

28
managers, which is usually associated with substantial transaction cost mostly in the form of
management fees. The transaction costs, therefore, caution against going below the lower
bound of 4-6% of the payroll (Lindeman et al., 2000; Dorfman, Hinz, & Robalino, 2008).
On the other hand, determining the upper bound of the second pillar size is much more
complex and is largely influenced by the potential transition costs related to privatizing the
part of the PAYG pillar. Since the majority of social security systems in Europe are
characterized by the developed and dominant PAYG pillars, a large proportion of pension
contributions must be reserved for financing PAYG pillar even within a newly reformed
multipillar system. Namely, diverting a part of the pension contributions, which were
previously used to finance the PAYG pillar, to second pillar funds creates a deficit in the state
pension fund because government still needs to deliver on its promises and finance the
existing and future pensioners within PAYG pillar, which have contributed to the state
pension fund in the past. In countries with high implicit pension debt these deficits can be
potentially huge, which requires special treatment by the government that needs to find an
effective way to finance this transition. This is not an easy task since numerous political,
social and economic considerations need to be taken into account. As discussed further below,
the government has many options at its disposal, such as financing the transition “within” the
existing pension system through introduction of parametric reform of PAYG pillar or by
means of tax and debt financing. One of the key elements that dictate second pillar size are
the rules which determine who shall participate in the newly introduced mandatory second
pillar or who should be excluded and what are the incentives offered to those whose
participation in the second pillar is optional (Lindeman et al., 2000; Holzmann et al., 2004).
In the context of mitigating the transition costs some countries have contemplated phasing-in
rather than instantly implementing second pillar in its full size, i.e. start at some low level,
such as two percent, and then increase the second pillar contributions to a level in the range of
7-10% of the payroll over some extended period (10-20 years). Such strategy immensely
reduces the initial transition costs of the reform but on the other hand also complicates design
options and makes the second pillar’s target size susceptible to ever-changing political
influence. For example, in 1997 a newly elected government in Hungary, unsympathetic to
the pension reform enacted under the previous government, postponed further increases of
pension contribution percentage going into the second pillar arrangements. This policy change
disrupted both the expectations of workers and business plans of fund managers. Furthermore,
phasing-in the second pillar postpones the potential benefits from capital market development
as the second pillar contributions are negligible in the initial phase. Altogether, a one-step
strategy appears preferable (Lindeman et al., 2000; Impavido, & Rocha, 2006).
Financing the transition
As already explained above, a move towards the mandated second pillar transforms a part of
the implicit pension debt into an explicit debt instantaneously, while the magnitude of this

29
transformation increases with the second pillar size. The government can pay for this newly
created explicit debt by simply borrowing money either domestically or internationally in
order to finance ongoing PAYG liabilities, while at the same time freeing up equivalent
amounts in form of pension contributions for workers to purchase second pillar financial
assets. However, borrowing and high explicit debt are associated with higher annual debt
service, which can quickly lead to an unsustainable spiral of borrowing to pay ever-higher
interest amounts. Thus higher debt service must be largely offset by higher taxes or decreased
government spending elsewhere, which ultimately imposes a limit on how much a country
can finance the transition through debt financing. Additionally, countries which are members
of EU or aspire to become one need to take into account the Maastricht’s criteria. For example
Slovenia already strongly exceeds the total explicit debt limit of 60% of GDP, which implies
that there is little room for additional debt financing (Lindeman et al., 2000; Holzmann,
Palacios, & Zviniene, 2004).
Notwithstanding, a move towards a mandatory second pillar is almost necessarily
accompanied by debt financing at least in the initial period of the reform, which enables
countries to spread the higher initial transition costs over an extended period. According to
Lindeman et al. in most of the European and Central Asian countries (hereinafter: ECAs), a
second pillar financed by a contribution rate of 8% of gross wage would require resources
equal to around 2.5% to 3.2% of GDP during the initial years of the reform in case the entire
workforce is covered. In the first years of the reform such amounts cannot be covered by a
parametric PAYG reform or with the combination of increased taxes and reduced government
spending. Debt financing enables such measures to be gradual, which makes them politically
more acceptable and altogether less painful for the economy (Nickel, & Almenberg, 2006).
Dedicating privatization proceeds from the sale of state owned enterprises is a particularly
attractive from of debt financing which can help countries to cover high transition costs. By
selling an existing asset the government reduces the amount of explicit debt it must incur but
at the same time it creates a stock of capital assets that can be bought by the newly established
second pillar pension funds. This stimulates the efficient allocation of existing capital that can
help raise a country’s growth rate, while at the same time keeping the formerly state owned
enterprises at least partially in the hands of domestic funds. According to data published on
the web site of Slovenian Sovereign Holding (SDH) the carrying value of the assets of state
enterprises owned directly or indirectly by Slovenian state as of 31st of December 2013 was
just over 11 billion EUR, which amounts to approximately 30% of its GDP. This figure
provides the Slovenian government with additional room to mitigate the potentially high
transition costs associated with a move towards the mandated second pillar (Lindeman et al.,
2000; Slovenski državni holding, d.d., n.d.).
Aside from debt financing, a country can also recourse to tax financing in order to finance the
transition costs, which can include subvention from the budget to the state pension fund.
Given that Slovenian central budget is already covering 1/3 of the state pension fund expenses

30
this scenario seems unlikely. Nevertheless, in the wake of a pension reform the government
should reassess the structure of its budget by paring down the budget to the core functions of
the state, which would almost necessarily include a reduction in subsidies to large state
companies and utilities. In this way at least a portion of the budget can be freed to alleviate
the transition costs. In order to balance transition costs a government can also recourse to
raising the overall contribution rate. But as it is evident from the table below, the pension
contribution rate in Slovenia is already high in comparison to other transition countries, which
indicates that the potential transition costs should be squeezed within the existing contribution
rate of 24.35%. However, a reform of the pension system may, through greater linkage
between lifetime earnings and pensions, improve compliance which would in turn increase
pension contributions in a completely painless way (Lindeman et al., 2000; Barr, 2002; Zavod
za pokojninsko in invalidsko zavarovanje Slovenije, 2014a; European Commission, 2014).
Table 6. Mandatory Pension Contribution Rates in Regional Transition Economies
Country Employee rate Employer rate Overall contribution rate
Slovakia 4.00% 14.00% 18.00%
Poland 9.76% 9.76% 19.52%
Croatia 20.00% / 20.00%
Estonia / 20.00% 20.00%
Latvia / 20.00% 20.00%
Slovenia 15.50% 8.85% 24.35%
Lithuania 3.00% 23.30% 26.30%
The Czech Republic 6.50% 21.50% 28.00%
Hungary 10.00% 27.00% 37.00%
Source: European Commission, The 2015 Ageing Report, 2014, p. 389 – 421.
Debt and tax financing can be very useful in financing the transition costs. However, a move
towards a mandatory second pillar must almost necessarily be accompanied with parametric
reform of existing PAYG pillar. The reduction of existing PAYG promises can be
decomposed to three different layers, as can be seen in Figure 5. Due to the population aging,
there are policy adjustments that would have to occur even if the mandatory second pillar was
not being introduced (A area in Figure 5). These adjustments can include the reduction of
accrual rates, increase in retirement age and less generous post-retirement indexation
mechanisms. Additionally, some adjustment of the existing PAYG pillar needs to be made to
offset the future second pillar benefits (B area in Figure 5). This requires a reduction in the
PAYG accruals in relation to accruals in the second pillar. This reduction, however, does not
mature for two or more decades and there should be no welfare losses imposed. Furthermore,
the reduction to “balanced PAYG promises” (the A area) is politically much easier to achieve
together with the reduction depicted in the B area since the implementation of mandatory
second pillar increases the credibility of the reform. However, the reduction of PAYG
promises has been more painful than that necessary to balance PAYG pillar expenditures
alone (with no second pillar) or to only offset the future benefits from the second pillar. This

31
reduction, shown as C in Figure 5, typically includes additional increase in retirement age and
reduction of post-retirement indexing and thus is borne by older workers and retirees. This
final reduction can be viewed as reducing the country’s implicit pension debt in order to make
the reform plausible. Therefore it can be also viewed as a form of debt financing (Lindeman et
al., 2000).
Figure 5. Reduction of PAYG Promises
Source: D. Lindeman et al., The Evolution of Pension Systems in Eastern Europe and Central Asia, 2000, p. 20.
Balancing the transition costs among different sources in a most effective way is a very
important and also a very difficult process. Shifting the burdens of transition on any single
source can undermine the credibility and viability of the reform:
● First, excessive reliance on debt financing could lead to a rapid accumulation of
government debt to unsustainable levels. Who bears this extra burden depends on how the
impact of higher financing costs is allocated within the nation’s central budget, but it
usually means deferring the cost of transition to younger generations.
● Second, full reliance on tax financing could lead to an excessive taxation of the economy
in the short-run usually in the form of social contribution increases, further distorting
labor markets and compliance incentives and thus putting too much pressure on workers
and employers.
● Finally, excessive reliance on cutting PAYG expenditures could result in unacceptably
low pension replacement rates, particularly in the initial phase of the reform. This could

32
impose large welfare losses to retirees and older workers, while younger generations
should be compensated with an additional second pillar pension, although they are likely
to face an increase in retirement ages.
We can visualize these trade-offs as three points of a triangle, as is shown in Figure 6. The
important dimension of the figure is also the size of the triangle, which symbolizes the second
pillar size. Naturally, the smaller triangle implies smaller transition costs that need to be borne
by society but at the same time it also implies smaller potential benefits of the mandatory
second pillar. Therefore it is critical to carefully consider the generosity and distribution of all
benefits, as well as costs and risks when deciding the size and financing of the second pillar.
It is of utmost importance to strike an intergenerational balance so that the benefits as well as
costs of transition are evenly distributed among different generations (Lindeman et al., 2000;
Barr, 2002).
Figure 6. Financing the Second Pillar Transition and Welfare Trade-Offs
Source: D. Lindeman et al., The Evolution of Pension Systems in Eastern Europe and Central Asia, 2000, p. 21.

33
2.2.2 Participation requirement in the new system
When resolving issues regarding the participation requirement for any multipillar system
aside from the transition cost issues, policymakers need to take into account that they need to
protect individuals from harmful choices, while simultaneously keeping system design simple
as possible.
Multipillar systems are usually designed so that replacement rates are relatively constant
across generations, although younger cohorts are typically required to work longer due to the
gradual phase-in of the retirement age increase. However, defined benefit (PAYG) and
defined contribution schemes have different accrual patterns. In other words, second pillar in
the form of defined contribution scheme needs a longer time period to mature. It is highly
unlikely that the standard individual capitalized accounts will substitute the lower pensions
coming from a downsized PAYG pillar for cohorts that have 10-15 years to retirement.
Therefore multipillar reforms should offer PAYG-only schemes for those whom switching to
a mixed system with combination of reduced PAYG pillar and defined contribution second
pillar would be injurious. The PAYG-only option should attract older generations but since
individuals have different risk-reward preferences it is likely that at least some portion of the
younger generation will be tempted to stay in the PAYG-only regime. As a result, policies
determining participation requirement in multipillar systems can become quite complicated
(Lindeman et al., 2000).
In Poland, for example, where the new multipillar system came into effect in the beginning of
1999, an old PAYG system was retained for the cohorts aged over 50, while those who were
aged between 31 and 50 could choose between staying in a new PAYG-only system (that is
based on a notional account contributions) or switching to a multipillar system with a smaller
version of a new PAYG scheme and a funded defined contribution second pillar scheme.
Those aged 30 or less at the time of the reform, as well as new entrants, had no choice and
were automatically enrolled in a new multipillar system. The reform package in Poland was
named “Security through diversity” which points to the fact that the underlying drivers in the
first and the second pillar are not perfectly correlated. In contrast the Hungarian reform,
which became effective in January 1998, gave the freedom to all workers regardless of their
age to choose between staying in a reformed PAYG-only or switching to a new multipillar
system, while new entrants were required to participate in the latter. (Palacios, & Rocha,
1998; Chlon, Góra, & Rutkowski, 1999).
The experience with the Polish and Hungarian pension reforms have clearly highlighted the
public affection towards the multipillar systems at the time of introduction since the majority
of the workforce between the lower age bound (entry or age 30) and the age of 50 have
chosen to enroll in a newly established multipillar system. This does not come merely as a
public affirmation of the reform but also makes a subsequent reversal of the reform less
likely. Ultimately, allowing choice regarding the enrollment into the system that includes a

34
mandatory second pillar can substantially reduce the transition costs of a reform compared to
a scenario where everybody is required to participate in a multipillar scheme. However, such
policy decisions are accompanied with higher uncertainty in estimating the transition cost.
Additionally, allowing choice also requires that a government conducts a carefully designed
educational campaign in order to assist individuals in making informed switching decisions
(Chlon et al., 1999; Lindeman et al., 2000; Impavido, & Rocha, 2006).
2.2.3 Adjusting the PAYG pillar
As discussed above, a move towards a mandatory second pillar must almost necessarily be
accompanied with a parametric reform of the existing PAYG pillar, which leaves the existing
structure unchanged but adjusts its parameters to improve the delivery of social and economic
objectives. Such move should include adjustment of benefit formulas, increase in retirement
ages and modification of the valorization and indexation rules. Altogether the reform should
strive for a more predictable and transparent PAYG pillar (Bole, 1998; Holzmann, & Hinz,
2005).
In the light of a second pillar introduction benefit formulas need to be adjusted within the
PAYG pillar. This usually includes the reduction of accrual rates (for an example, from 2
percent to 1.5% a year) but at the same time it raises a host of issues mostly regarding the
problem of redistribution towards those with low lifetime earnings, the treatment of women,
credit for schooling and periods of unemployment etc. This is a complicated matter that goes
beyond the scope of this thesis. Nevertheless, it is noteworthy that such issues are typically
addressed within the PAYG pillar since the second pillar is usually characterized as having
features of a private property (Lindeman et al., 2000; Holzmann, & Hinz, 2005).
Due to the increasing life expectancy, the only option to evade either higher pension
contribution rates or lower pension benefits is to increase the effective retirement age. This
applies to funded as well as PAYG schemes and can be done by introducing actuarially
neutral factors for early and delayed retirement or by simply increasing the minimum
statutory retirement age. Having actuarially neutral factors in the PAYG pillar should
theoretically encourage work among the older population. This can be done by introducing
decrements for earlier and increments for later retirement, for example from typically 0 or 2
percent to 6 percent a year. However, international experience suggests that the vast majority
of workers will begin to draw benefits as early as possible no matter what incentives exist for
postponing the retirement after the first year of eligibility. The most straightforward way to
increase retirement age, therefore, is to increase the minimum statutory age at which benefits
can be first withdrawn. Since some physically demanding or hazardous jobs are not suitable
for older workers such changes should be combined with introduction of specially designed
funded account schemes as is already case in Slovenia, where employers are forced to pay a
compulsory contribution rate of 10.55% out of gross wages for employees involved in
hazardous jobs. The contributions are invested into a special fund which should provide a

35
“bridging” pension until a person reaches the retirement conditions for the PAYG pension
(Lindeman et al., 2000; Gruber, & Wise, 2005; Holzmann, & Hinz, 2005; Stanovnik, &
Prevolnik Rupel, 2014).
Rules regarding benefit calculation from the PAYG pillar need to have some form of
predictability in respect to lifetime earnings. A country can lower pension benefits and thus
pension expenditures by simply lengthening the assessment period necessary for pension base
calculation. For example pension base calculation period in Slovenia is set to increase until
2018 from the previous 18 best consecutive to the 24 best consecutive years of service by
adding one additional year to pension base calculation at the beginning of each calendar year.
However, in order to avert abuses in the setting of wages and to achieve equity across workers
with the same wage histories, it is best to determine pension base according to lifetime
earnings, an objective towards which most ECAs are moving. Furthermore, lifetime earnings
need to be adjusted to reflect at least inflation over one’s career. This mechanism is labeled
“valorization” and, as is the case in Slovenia, wage histories are usually adjusted according to
nominal wage growth over a worker’s life thereby taking into account productivity gains over
that period (Berk Skok et al., 2013b; Stanovnik, & Prevolnik Rupel, 2014).
Adjustment of pensions during the retirement period is conventionally called “indexing”.
Assuming finances permit, pensions ought to be indexed at least in line with inflation. If not,
benefits can seriously erode in real terms, which can compromise the adequacy objectives and
simultaneously reduce the motivation for participating in such a system. Pension indexing can
combine price growth rate with average nominal wage growth or wage sum growth depending
on how much the society wishes pensioners to share downside risks (productivity and
compliance decreases) as well as upside gains (productivity and compliance increases). In
general, a society can choose between lower initial replacement rates with wage indexing at
one end, and higher initial replacement rates with inflation-only indexing at the other end. The
former alternative has the virtue of giving the elderly a lower initial pension that increases in
real terms over the retirement period during which other parts of retirement portfolio may be
eroding or are being spent unexpectedly (Lindeman et al., 2000).
2.2.4 Second pillar pension funds
In general, countries moving to a mandatory second pillar have chosen a model in which the
pension funds are independent financial entities, not associated by a union membership or
employers. Each worker has an option to choose between privately-owned second pillar
funds, similar to choosing one’s bank. Such model is thought to be good at establishing
insulation from political influence, which is usually imperative to use pension assets as the
means to develop a country's internal capital markets and associated institutions. Having
state-managed funds in such a model is possible but not recommendable since they, even if
embedded in an environment of competing funds, usually succumb to partial interests of
political agenda (Chlon et al., 1999; Lindeman et al., 2000; Impavido, & Rocha, 2006).

36
It is important to have distinct legal separation between the property rights and assets of fund
managers and those of fund members. In case of insurance companies, which are generally
appropriate for managing second pillar funds, this is usually done by establishing a legally
separate affiliate that is managed by the insurance company (Lindeman et al., 2000).
Additionally, rules need to be adopted for those for whom the participation in the second
pillar is mandatory but fail to choose a specific second pillar fund. First alternative is to
simply assign workers randomly to different funds, the approach chosen in Poland and
Croatia. Another option is to allocate 100% of the worker’s contributions to a special fund
(preferably a passive holding fund, within a central bank) invested entirely in government
bonds. Once these funds mature to a reasonable size, the assets of this holding would be
allocated among existing pension funds in accordance to their market share (Lindeman et al.,
2000).
2.2.5 Administration
Regarding the administration of the multipillar system, the recent experience suggests
centralizing the flow of both data and money at the national level, in a form of clearinghouse
model. The arguments for such system design include the following (Holzmann, & Hinz,
2005, p.13):
● Economies of scale gained as a result of centralizing the flow of both data and money
through a single transfer agent.
● Reduction of burden on employers since they are required to deal with only one collection
entity.
● Information barrier between pension funds and employers. By funneling the worker’s
contribution through a collection entity to different funds, employers are unaware to
which funds their workers are subscribed to, therefore, minimizing the danger that funds
might use employers in order to pressure their workers to change the pension fund.
● Such system enables participants to allocate their assets among different funds without
administrative difficulty, which implies greater investment flexibility.
● In such model fund managers are typically unaware of their fund members’ identity as
they handle the aggregate amount of assets accumulated within the central agency. This
information barrier between managers and participants is associated with lower marketing
costs, which in turn manifests in lower management fees and ultimately in a higher rate of
return of the pension funds.
A unified revenue and data collection system, combined with integrated second pillar
clearinghouse is illustrated in Figure 7. For countries that operate only with PAYG pillar, a
combined collection scheme can be implemented without a second pillar clearinghouse
(represented on the left-hand side of Figure 7). There are many variants of this system design

37
all of which require very lengthy and careful planning and subsequent implementation
(Lindeman et al., 2000).
Figure 7. Combined Collection and Clearinghouse System (Poland and Croatia)
Source: D. Lindeman et al., The Evolution of Pension Systems in Eastern Europe and Central Asia, 2000, p. 35.
Another policy option, which is depicted in Figure 8, is to implement a decentralized model
with direct flows of information between the participants and the pension funds. This model is
much easier to put into practice but is accompanied with greater transaction burden on the
employers since they are required to allocate pension contributions between many different
second-pillar funds. Such system could, therefore, lead to a higher level of noncompliance,
especially in terms of intra-year transmittal of contributions and data. Additionally, employers
could try to influence workers’ choices of funds, a situation that undermines the credibility of
the system (Lindeman et al., 2000; Impavido, & Rocha, 2006).

38
Figure 8. Decentralized Funded Pillar (Chile, Hungary)
Source: D. Lindeman et al., The Evolution of Pension Systems in Eastern Europe and Central Asia, 2000, p. 36.
2.2.6 Government supervision of second pillar fund managers
Mandatory second pillar funds can be viewed as a type of social insurance since they aim at
replacing the fall in PAYG pensions. Second pillar contributions are managed by the
privately-owned second pillar funds and thus should be subjected to a higher level of
supervision compared to third pillar funds. Therefore it is crucial to create an agency that will
adequately protect the rights and interests of second pillar participants by: monitoring
membership issues, supervision of licensing and marketing activities of fund managers as
well as cross checking of asset valuation and return calculation of individual accounts. In any
case, the supervisory body should employ professional staff and it should be operationally
independent, proactive and well-financed. A government can designate supervision to existing
agency or create a new one. In Slovenia a task of monitoring the voluntary second pillar is
divided among three different institutions: Ministry of Labor (MDDSZ), Insurance
supervision Agency (AZN) and Securities Market Agency (ATVP) (Lindeman et al., 2000;
Holzmann, & Hinz, 2005).
Additionally, there are many unresolved issues concerning financial regulation of the second
pillar funds, for which there are still no best practices established. These complex issues
usually include specific rules regarding asset allocation decisions, portability rules and
minimum return guarantees. At the turn of the millennium when many ECAs were reforming
their pension systems their financial markets were undeveloped. Therefore the successful
market efforts have normally begun with the application of strict regulations, which were later

39
relaxed as the markets matured. These strict initial rules included a limited choice for
participants, uniform pricing and limited forms of fees, detailed investment limits (which
limited foreign and equity investments), extensive disclosure, minimum return rules and state
guarantees, as well as proactive supervision. In the initial phase of the reform such strict rules
can be beneficial since they minimize the probability of early failures and help overcoming
reform resistance. However, as the financial market matures, second pillar funds should be
allowed to diversify its portfolio by allowing higher investments in stocks, foreign securities,
corporate bonds, asset-backed securities and small investments in venture capital companies
(Lindeman et al., 2000; Holzmann, & Hinz, 2005).
2.2.7 Second pillar retirement age and payment options
The general practice is to enable second pillar withdrawals simultaneously with the retirement
in the PAYG pillar. The exception to this rule might be the case where the second pillar assets
exceed a predefined measure such as 130% of what would be one’s benefits payable at normal
retirement age. Such arrangement enables individuals’ early access to their accumulated
assets – for example, at the age of 62 instead of 65 – in case the combination of the PAYG
and second pillar benefits is large enough. Despite the fact that this introduces a complication
into the system, such arrangement may be necessary in bull market periods when people wish
to consume their unanticipated wealth in the form of early retirement (Lindeman et al., 2000).
A much more complex issue is the choice between different payment options of second pillar
funds, which basically comes down to phased withdrawals or life annuities. Phased
withdrawals are problematic for two reasons. First, if a pensioner lives up to an age when all
the assets from his retirement account have been depleted, the government will find itself
obliged to supplement retirement income up to some minimum replacement rate creating
large contingent liabilities for future governments. Second, if annuities are not mandated,
annuity providers will face the risk of "adverse selection" where only the relatively long lived
will choose to buy such arrangements. Hedging against such risks usually adds to the price
that annuity providers charge for their products. On the other hand, mandating annuities
brings with it the following question: when is the right time to convert second pillar
accumulation into life annuities? Namely, from an economic point of view it is ill-advised to
force a retiring cohort to purchase annuities in a down market. This problem can be addressed
by allowing grace periods in which individuals can defer the purchase of annuities, a solution
which reintroduces adverse selection costs and can lead to leakage due to inheritance
(Lindeman et al., 2000).
Creating a “single annuity pool” might solve some of these problems. Namely, creating just
one pool of annuitants irrespective of their health status would enable risk sharing between
different cohorts. Risk pooling implies that those who die early subsidize the long lived. Since
mandatory second pillar systems strongly emphasize the link between contribution and
benefits, use of a single annuity pool is difficult to defend. Therefore the preferable option is

40
to allow a very small number of separate pools for large groups of people with clearly
identifiable characteristics and expected outcomes. Additionally, annuities can be designed to
provide financial security for survivors. Namely, annuity providers usually provide payments
for the life of the annuitant but with a provision that benefits will be paid out for a minimum
number of years (usually 10-15) to a designated beneficiary in the event of a premature death
of the annuitant (Lindeman et al., 2000; Holzmann, & Hinz, 2005; Rocha, Vittas, & Rudolph,
2011).
Pricing of annuities is another complex issue that requires additional attention. Namely,
annuity providers price these contracts by making predictions of longevity of pensioners and
of future rates of investment returns, both of which are very difficult to forecast. Therefore,
insurance companies tend to be conservative in making these estimates which ultimately
lowers the attractiveness of these products. In Slovenia, the Deutsche Aktuarvereinigung
annuity tables DAV 1994 R (hereinafter: DAV 1994) are set as the minimum standard for
determining liabilities of insurance companies. These tables were also used in the German
insurance industry until the DAV 2004 R tables were introduced in 2005, which resulted in a
substantial increase in premiums for deferred annuities in Germany. (Lindeman et al., 2000;
Holzmann, & Hinz, 2005; Ahčan, Medved, Pitacco, Sambt, & Sraka, 2012).
Determining the right investment return for pricing of the annuities is even more difficult than
making longevity forecasts. Annuity products are long-term and complex arrangements
through which individuals seek fixed rate annuity amounts for many years into the future and
where the underlying funds are being gradually depleted throughout the retirement period.
Consequently, it is very difficult to find an investment that would match this kind of a liability
profile. The annuity provider must forecast the investment returns for 20 years or more into
the future in order to price an annuity contract. A possible solution for this is to allow variable
annuities whose value varies annually depending on the actual investment returns and
mortality outcomes. Such arrangements provide annuitants with a higher return than in case of
fixed rate annuities, but they also bear some of the risk, which may be difficult for low-
income pensioners (Lindeman et al., 2000; Holzmann, & Hinz, 2005).
In order to provide real consumption smoothing to pensioners, annuities should be price-
indexed. Namely, annuities can seriously erode in real terms even if small inflation is
assumed over a longer retirement period. However, these so-called "indexed annuities" can be
offered only in countries where there is ample supply of price-indexed government bonds.
United States, United Kingdom, Sweden and Chile offer such bonds, but these are far from
universal and often not long-term. Additionally, there is a tradeoff between the higher payouts
of older pensioners versus the lower payouts they will receive at the time they retire. Due to
their complex nature, indexed annuities are currently unavailable in the EU marketplace
(Lindeman et al., 2000; Holzmann, & Hinz, 2005; Lundbergh, Laros, & Rebel, 2013).

41
Aside from issuing price-indexed bonds, a government can help insurance companies to deal
with the uncertainties regarding annuity pricing by offering a minimum pension guarantee or
alternatively by providing annuities directly in exchange for handing over the accumulated
assets (as is the case in Sweden). Such arrangements enable the broadest possible
intergenerational risk sharing, but at the same time create potentially large liabilities for future
governments. Altogether the issue regarding the payment options of second pillar funds
remains an unresolved and controversial issue (Holzmann, & Hinz, 2005; Holzmann, 2012;
OECD, 2014).
2.3 Lessons from the past
In CEECs the move from central planning to market economy was accompanied by
subsequent changes of the pension system. Many policy makers believed that addressing
fiscal unsustainability and projected population aging should be handled by introducing a
second pillar at the cost of privatizing the part of the PAYG pillar, a move that would
simultaneously elevate financial market development and trigger higher economic growth.
This policy vision was further enforced by the successful Chilean pension reform and similar
reform attempts in Latin America. As a result, twenty-nine countries followed Chile’s
example between 1988 and 2008, which included a significant shift from publicly managed,
unfunded defined-benefit schemes to privately managed, fully-funded defined-contribution
schemes (Holzmann, 2012).
However, the recent financial crisis has put the existence of the mandatory second pillar into
question by amplifying the accompanying transition costs, which manifested in the form of
increased social security deficits and increased public debt. Additionally, it was revealed that
this growing public debt was mostly financed by the newly created second pillar pension
funds that invested a very large part of their assets in government bonds. The situation is
further exacerbated due to the Maastricht criteria, which takes insufficient account of the fact
that with the multipillar reform, part of the increased explicit debt merely reflects a reduced
implicit pension debt. Altogether, this led to reform reversals in many economies around the
world, where the incentives to nationalize private accounts’ assets strongly depended on the
level of country’s sovereign debt and the size of second pillar funds’ assets that had been
invested in domestic government bonds as opposed to other instruments such as foreign
securities or equities. Hungary, Argentina and Bolivia nationalized second pillar funds for
public debt reduction purposes, while some other countries dramatically decreased the level
of contributions paid into them permanently – as in Poland and Russia, or initially on a more
temporary basis – as in Estonia, Latvia and Lithuania (Holzmann, 2012; Naczyk, &
Domonkos, 2014).
Furthermore, the financial crisis reinforced the already sober expectations for the rates of
return of funded schemes, which were dampened by the bursting of the dot.com bubble in the
early 2000s. Low real asset return, which is lately labeled as the “new normal”, coupled with

42
sharp fluctuations in asset prices and the possible non-existence of a risk-free asset (i.e.,
government bonds) all beg the question of the future of the size of funded pension pillars and
possibly even about their very existence. The unfavorable economic developments in the last
decade gave plenty of ammunition to the opponents of the second pillar reform, but on the
other hand they also led reform supporters to review some of the design components and to
propose improvements. One of the most important innovations include more flexibility
around mandated annuitization to avoid a locking-in of losses and the introduction of life-
cycle investment policy which mandates a move from an aggressive to a more conservative
portfolio as an individual approaches retirement, as is done in Chile and more recently also in
Slovenia. The crisis has also strengthened the need for diversified multi-pillar pension
systems with strong and transparent management of financial risks and mechanisms to control
the high costs and management fees (Dorfman, Hinz, & Robalino, 2008; Holzmann, 2012).
Altogether the trend towards funded pensions is still present, which is supported by the fact
that Czech Republic, Israel and the United Kingdom recently implemented defined-
contribution pension pillars. However, the financial crisis has led policymakers to nudge
rather than force people to save for retirement. For example, many governments have
instituted automatic enrolment in private voluntary schemes. For example Italy and New
Zealand have done so in 2007, while the recent example includes United Kingdom, which
introduced an automatic enrolment in 2012 for all employees that are not already enrolled in a
private pension system. Other policy shifts also include the introduction of funded minimum
pensions (i.e. using a sovereign fund-type mechanism) as well as the rise of the notional
defined contribution scheme, which was introduced in Poland with the combination of
mandatory second pillar (Orenstein, 2011; OECD, 2013).

43
Table 7. Key Characteristics of Private Pension Schemes in East European EU Member States (Averages for the Given Time Period) and Pension
Reform Reversals Affecting Second Pillar Funds in the Wake of Financial Crisis.
Structural pressures (% of
GDP)
Portfolio composition (% of total private pension assets)
Country Reform reversals
of 2nd pillar
2nd pillar
contribution
Government
debt
Domestic
sovereign bonds
Domestic and
foreign sovereign
bonds*
Domestic and
foreign equities*
Total foreign
investments*
2002-2010 2008-
2010
2011-
2012
2008-
2010
2011-
2012
2008-
2010
2011-
2012
2008-
2010
2011-
2012
2008-
2010
2011-
2012
Hungary full nationalization 1.1 78.3 81.0 49.3 52.2 58.8 10.7 5.6 0.2
Poland partial nation. and
reduced contrib.
1.4 51.0 55.9 62.5 48.9 64.2 51.9 29.3 32.8 0.5
Slovakia reduced contrib. 1.0 34.8 48.2 27.1 32.0 42.3 40.6 1.4 0.7 46.5 44.6
Latvia reduced contrib. 0.8 33.7 41.4 17.0 18.5 0.9 0.4 58.6 64.1
Lithuania reduced contrib. 0.6 27.5 39.4 64.6 35.1 68.6
Romania temporarily
reduced
contributions
0.2 22.5 36.4 25.6 71.8 7.8 11.1 17.6 8.5
Bulgaria no reversal 0.7 14.8 17.4 34.2 12.2 11.4 32.7 39.4
Estonia temporarily
reduced
contributions
0.6 6.1 8.0 4.4 4.4 78.7 75.9
Note: *Data refers to 2nd
and 3rd
pillar funds.
Source: M. Naczyk, & S. Domonkos, The Global Financial Crisis and Changing Coalitional Dynamics in East European Pension Privatization, 2014, p. 32.

44
3 INTRODUCING A MANDATORY SECOND PILLAR PENSION
SYSTEM: THE CASE OF SLOVENIA
The results presented in this section are generated by two different models. The first one is the
age-profiles-based model used for projecting future PAYG pension expenditures and pension
contributions, while the second one is the yield model which is used for calculating the exact
amount of assets accumulated on the second pillar accounts. The combination of the two
provides us with the projections regarding the financial structure (pension expenditures and
pension contributions in relation to GDP) and the generosity (net replacement rates) of the
multipillar system. However, we start the section with the presentation of the multipillar
reform and its underlying assumptions. The age-profiles-based model and the yield model are
then presented in the second and the third part respectively. Finally, in the last part of the
section we present the results as well as main findings and insights related to the
implementation of a mandatory second pillar in the Slovenian pension system.
3.1 Slovenian multipillar pension reform
The main idea of the multipillar reform is to re-direct part of the current PAYG social
contributions into a mandatory fully-funded second pillar pension scheme, which is assumed
to deliver higher pension benefits with the same level of contributions. In order to mitigate the
transition costs of such a move we propose a parametric reform of the current PAYG pillar.
We introduce 3 crucial changes to the existing PAYG pillar scheme which are expected to
substantially reduce its implicit pension debt. These changes include:
1. Gradual increase of employment rates. We assume that the age profile of employment
rates will shift towards higher ages in the future. In particular, we assume that workers
will gradually postpone their retirement by 5 years in the period from 2031 to 2055 (2.4
months per year). We presume that such an effect could be achieved by a simultaneous
increase of both the statutory retirement age and the contributory period for early pension
by a similar margin.
2. Gradual increase in the number of years for determining the pension base. The current
pension act (PDIA-2012) assumes increase in the pension base calculation from the
previous 18 best consecutive to the 24 best consecutive years in the transitional period
from 2012 to 2018, during which one year is added to the beginning of each new calendar
year. We extend this transitional period until 2028 when 34 best consecutive years of
service would be used for calculating the pension base.
3. Reduction of the post-retirement pension indexation from the current formula, where the
growth of pensions is 60% indexed to the nominal growth of wages and 40% to the
inflation rate, to the formula, where growth of pension is 100% indexed to the inflation
rate. However, in line with the austerity measures proposed by the government the model
assumes zero nominal indexation of pensions in the period 2015-2018, whereas from 2019
onwards new parameters are taken into account.

45
In the transitional period two different pension system regimes would be in force. We assume
the age limit of 45 years as a participation requirement for the mandatory second pillar. In
particular, cohorts that are aged 44 or less (the new entrants are automatically enrolled in a
new multipillar system) on January 1st 2016 are required to participate in the mandatory
multipillar system while those aged 45 years or older will be retained in the old but less
generous PAYG system. Namely, they will receive a full PAYG pension, albeit according to
new legislation rules and will therefore be impacted by the less generous indexation system
and longer pension base calculation period, while only small fraction of this group will be
impacted by the gradual increase in retirement age. In addition, all the participants of the new
multipillar system will be affected by the increased retirement age (as they are younger and
impacted by additional gradual increase in the retirement age), and will be entitled to a
reduced PAYG pension only due to the lower amount of PAYG contributions paid. However,
they will be awarded with an additional pension benefit based on assets accumulated on the
second pillar accounts, which will be transformed into a life-time annuity at the point of
retirement. We assume equal tax treatment for both PAYG pensions and life-time annuities,
which implies zero taxation of total pension benefits for an average earner.
One of the principle goals of the proposed reform is to balance the transition costs among all
living generations, including the existing retirees as well as the current working generations.
The generosity of the PAYG system will be reduced in a very gradualist manner since the
transitional periods of the new parameters are very lengthy, which has the benefit of giving
the current working generations plenty of time to adapt to the new system. Nevertheless, the
proposed system is deliberately designed to put more pressure on the younger generations
since they are expected to live longer lives and enjoy the benefits of the fully implemented
mandatory second pillar.
3.2 Age-profiles-based model
The model presented here is used by the Ministry of finance for projecting pension
expenditures for Slovenia published in “The Ageing reports” by the European Commission.
We borrow this model from Sambt and Čok (2008) for simulating the future pension
expenditures and social contributions for Slovenia for the period from 2015 to 2060.
Technically, the model builds on three types of matrices: the age profiles matrix (hereinafter:
PROF), the population matrix (hereinafter: P) and the coefficient matrix (hereinafter: C). The
age profiles matrix, which is the central part of the model, includes average values of
projected categories (pensions or social contributions) by age groups or cohorts. It rests on the
age profiles from the base year (2013), hence the age-profiles-based model. It is assumed that
next generations “inherit” the situation of the previous ones in the base year. However, these
age profiles are adjusted in each following year according to pension growth, which depends
on the valorization (100% of nominal wage growth) and indexation (100% of inflation)

46
mechanism of the pension system. We use standard macroeconomic assumption that the
wages grow in line with the labor productivity growth.
In particular, the age profile matrix is composed of two matrices multiplied with each other.
For the purpose of the pension expenditures calculation, the first matrix contains age profiles
of average pension benefits per receiver, whereas the second matrix includes the share of
pensioners in the total population by age group (i.e., retirement rates). Multiplying retirement
rate of a specific cohort with the population of the corresponding cohort yields the exact
number of pensioners. By multiplying this number with the average pension per receiver we
get the total pension expenditures for the entire cohort. Taking care of all age groups in such a
fashion gives us the total pension expenditure for a particular calendar year.
The matrices have age (a) in their rows and calendar years (t) in their columns. The pension
expenditures on individuals aged k in year t are thus calculated as (matrices are multiplied in
an element-by-element manner):
𝑃𝐸𝑁𝑆𝐸𝑋𝑃 𝑎,𝑡 = 𝑃𝑅𝑂𝐹𝑎,𝑡𝑃𝑎,𝑡𝐶𝑎,𝑡𝐺𝑎,𝑡, (1)
where the population matrix (P) contains the EUROPOP2013 population projections
presented in the first section, while the G matrix contains coefficients of the cumulative
growth of pensions from the base year. The coefficient matrix (C) summarizes the effects of
the future departures from the basic age profile, which is assumed in the age profiles matrix.
In particular, it includes the effects of gradual increase in the number of years necessary for
calculating the pension base (from 21 years in 2015 to 34 years in 2028). These coefficients
are obtained from simulations on micro-data on pensioners which have already retired, where
their pensions are simulated under new pension parameters. Weighted averages of these
results by age groups enter the coefficient matrix. Total pension expenditures from PAYG
pillar are calculated as the sum of projected expenditures by all age groups:
PENSEXP t = ∑ PENSEXPa,tDa=0 , (2)
where index a runs from 0 to D, and D denotes the maximum length of life, which is in our
model represented by the age group of 100 and older. Set of macroeconomic assumptions
prepared by the European Commission in 2014 is included in the model, including
assumptions on productivity growth, GDP, employment and unemployment rates.
Additionally, we assume that the age profile of employment rates will shift into higher ages.
This effect is modeled through the changes in the future employment rates, which are linked
to the retirement rates using a sub-model of the Institute of Macroeconomic Analysis and
Development9. The effect of decreasing the retirement rates enters the model through the
9 For the detailed description of the model see Kraigher (2005).

47
second of the age profiles matrices (PROF), which is manifested in lower pension
expenditures. Furthermore, the increase in employment rates also increases the overall
employment in the economy which in turn has a positive impact on GDP since the GDP
growth in the model consists of the labor productivity growth and the employment growth.
The age-profiles-based model is linked to this GDP module since pension expenditures are
expressed as a share of GDP.
Pension expenditures projected by this model include old-age, disability and survivor
pensions as well as pensions of farmers, police officers, World War II veterans, state
pensioners etc. However, health insurance contributions paid by the state pension fund on the
behalf of pensioners are not included in the projections.
Reduction of PAYG pensions expenditures and pension contributions
The age-profiles-based model is used for projecting future pension expenditures for PAYG
pillar and pension contributions of the entire multipillar system. Namely, we need to take into
account that the PAYG pillar in our case is part of a multipillar system with the mandatory
second pillar, which implies that a portion of the pension contributions previously used to
finance PAYG pension expenditures is funneled into the second pillar funds. Therefore we
use the age-profiles-based model for projecting the future pension contributions of the first
and second pillar combined.
In order to calculate the PAYG-only pension contributions we simply reduce the annual
pension contributions projected by the age-profiles-based model according to the % of payroll
earmarked for second pillar funds and according to the rules that determine the participation
in the second pillar system (projections of the working population are used). For example, if
in the initial year of the reform (in our case 2016) half of the working population is mandated
to pay 6% out of their gross wage, which is approximately ¼ of total pension contributions,
into the second pillar funds, the pension contributions used for financing the PAYG pillar
would be approximately 12.5% lower compared to a situation without a mandatory second
pillar. The 12.5% being the transition cost of the reformed system. We use the same approach
throughout the entire forecast period. Additionally, we assume that the average wages across
different cohorts are equal throughout the whole forecasting period, which simplifies the
underlying calculation while it does not fundamentally change the results.
In a similar fashion we also take care of the fact that the PAYG pension expenditures
eventually start to decline as pensioners that were part of the mandatory second pillar start to
retire. Namely, these pensioners dedicated a portion of their gross wages into the second pillar
funds instead of the PAYG pillar and are therefore entitled to a proportionally lower PAYG
pension. We employ an exogenous model that reduces the annual pension expenditures
projected by the age-profiles-based model according to the lifetime record of the pension
contributions paid into different pillars. In particular, we use a moving average of ratios

48
between PAYG contributions and total pension contributions paid on an annual basis
expressed as percentages of gross wages, which are calculated for the entire working career of
every cohort. For example, a person that has contributed ¾ of the total pension contributions
into the PAYG pillar throughout his entire career will have its PAYG pillar pension cut by
25%. Careers are not explicitly modeled, instead we assume that all individuals that are part
of the same cohort (for example individuals that are aged 40) start working and retire at the
same time.
3.3 Yield model and second pillar individual accounts
In order to calculate the exact amount of assets accumulated in the second pillar individual
accounts at the point of retirement we build a yield model. “The home bias in equities”, which
implies that individuals and institutions in most countries hold disproportionally low amounts
of foreign equity, is still largely present all over the world despite better financial integration
(French, & Poterba, 1991; Coeurdacier, & Rey, 2013). Home bias has a positive effect on the
development of domestic capital market, however, there is substantial empirical evidence
which indicates that foreign equities provide great diversification opportunities for investors
(Levy, & Sarnat, 1970). Although we expect that Slovenian pension funds’ will invest a
significant portion of their assets in domestic equities, we nevertheless assume that their
investment policies should be global and diversified. Therefore, we base our approach on
historical yields, which we draw from different global historical datasets similar to Čok,
Košak, Berk Skok and Sambt (2010):
● Siegel (2002) - US data for the period 1802-2001,
● Siegel (2002) - US data for the period 1946-2001,
● Bodie, Kane and Marcus (2009) – world data for the period 1926-2005,
● Bodie, Kane and Marcus (2009) – US large-cap data for the period 1926-2005,
● Dimson, Marsh and Staunton (2002) - world data for the period 1900-2000,
● Dimson, Marsh and Staunton (2002) - US data for the period 1900-2000,
● Malkiel (2007) - US large-cap data for the period 1926-2005 and
● MSCI (2015) – MSCI stock indices for the period 1969-2015.
We calculated 2 to 30-year yields according to the geometrical and arithmetical yields
reported in different data sources. Yields were calculated according to the formula in Bodie,
Kane and Marcus (2009), which takes into account that geometric average yield becomes
more realistic than the arithmetic average yield over the longer investment horizon. We did
this for every single data source and finally averaged these yields across different sources.
The yields are calculated separately for different asset classes (stocks, treasury bonds and
treasury bills).
Additionally, we take into account that the second pillar pension funds charge management
fees as a percentage of their net asset value. In Slovenia the management fees are legally

49
limited up to 1% annually. In particular, we assume that the pension funds charge
management fees in the amount of 1/250% daily for 250 days per year. Therefore, the average
yields presented here are net of management fees, which are assumed to be 1% on an annual
level irrespective of the asset class (stocks or bills and bonds). We deem this assumption
conservative since the majority of European countries with mandated second pillars have even
stricter limits imposed on management fees. For example, Poland and Croatia have legally
limited management fees in the amount of 0.45% (Tapia, & Yermo, 2008; Zakon o obveznim
mirovinskim fondovima, 2014).
We assume that the workers’ contributions are invested according to life-cycle investment
policy. Workers have the option to choose between three different funds (conservative,
moderate and aggressive fund) characterized by different average yields and different risk
profile. Each of these three funds is comprised of three sub-funds. The idea is that an
individual that is a member of a particular fund moves from a risky (in terms of % of assets
invested in stocks) to a less risky sub-fund as he approaches retirement. We assume that every
individual moves from the most risky sub-fund to the less risky and least risky sub-fund 15
and 5 years from retirement respectively. As it can be seen from the figure below, an
individual that chooses to participate in the moderate fund is expected to enjoy an average real
yield of 4.72% for 30 years (70% of his assets being invested in stocks and 30% in bonds and
bills), 3.13% for 10 years and 1.26% for 5 years.
Contributions earmarked for the second pillar accounts are levied as a percentage of average
annual gross wage, which is calculated based on information on the average monthly gross
wage published by the Statistical Office of Slovenia for 2014. We assume the average annual
gross wage to grow annually in line with the productivity growth rate, which is assumed to be
1.65% in real terms. These pension contributions which are net of entry fees (legally limited
up to 3%) are then invested at the investment rate, which depends on the chosen pension fund
(conservative, moderate and aggressive) and age (sub-model yield). The whole process is
graphically depicted in Figure 9.
Finally, the total amount of assets accumulated on the individual second pillar account is
converted into a life-time annuity according to male life expectations at the age of retirement,
which are calculated using DAV 1994. In particular, the exact amount of monthly life-time
annuity is calculated by dividing the total assets accumulated in the second pillar account with
the factor for annuity pricing which is calculated in the following way:
𝐹𝐴𝑃10 = ∑ 𝑣𝑡 𝑝𝑡,𝑥𝜔𝑡=0 [1 + (𝑣 × 𝑝𝑥+1 )
1
12 + ⋯ + (𝑣 × 𝑝𝑥+1 )11
12], where 𝑣 =1
1+𝑖, (3)
where 𝑖 is the real discount rate in the amount of 0.5%11
and where 𝑝𝑡,𝑥 is the probability of
survival for 𝑡 years for a person aged 𝑥 years.
10
Factor for annuity pricing.

50
Figure 9. Second Pillar Account of a Typical Male Pension Beneficiary That Chooses to
Invest into a Moderate Fund
Note: * mix of treasury bills and bonds.
11
Such low Figure reflects the need to minimize risk exposure once the individual is retired and is consistent
with the annuity industry practice.
stocks b&b* yield stocks b&b* yield stocks b&b* yield
A 40% 60% 2.94% 70% 30% 4.72% 100% 0% 6.49%
B 20% 80% 1.87% 40% 60% 3.13% 60% 40% 4.38%
C 0% 100% 0.63% 10% 90% 1.26% 20% 80% 1.90%
year age
2016 5% 18,525 € 926 € 970 € 23
2017 5% 18,831 € 942 € 2,002 € 24
2018 5% 19,141 € 957 € 3,098 € 25
2019 5% 19,457 € 973 € 4,263 € 26
2020 5% 19,778 € 989 € 5,500 € 27
2021 5% 20,105 € 1,005 € 6,812 € 28
2022 5% 20,436 € 1,022 € 8,203 € 29
2023 5% 20,774 € 1,039 € 9,678 € 30
2024 5% 21,116 € 1,056 € 11,240 € 31
2025 5% 21,465 € 1,073 € 12,894 € 32
2026 5% 21,819 € 1,091 € 14,644 € 33
2027 5% 22,179 € 1,109 € 16,496 € 34
2028 5% 22,545 € 1,127 € 18,455 € 35
2029 5% 22,917 € 1,146 € 20,525 € 36
2030 5% 23,295 € 1,165 € 22,713 € 37
2031 5% 23,679 € 1,184 € 25,024 € 38
2032 5% 24,070 € 1,204 € 27,465 € 39
2033 5% 24,467 € 1,223 € 30,041 € 40
2034 5% 24,871 € 1,244 € 32,760 € 41
2035 5% 25,281 € 1,264 € 35,629 € 42
2036 5% 25,698 € 1,285 € 38,655 € 43
2037 5% 26,122 € 1,306 € 41,846 € 44
2038 5% 26,553 € 1,328 € 45,210 € 45
2039 5% 26,992 € 1,350 € 48,756 € 46
2040 5% 27,437 € 1,372 € 52,492 € 47
2041 5% 27,890 € 1,394 € 56,428 € 48
2042 5% 28,350 € 1,417 € 60,574 € 49
2043 5% 28,818 € 1,441 € 64,940 € 50
2044 5% 29,293 € 1,465 € 69,536 € 51
2045 5% 29,776 € 1,489 € 74,375 € 52
2046 5% 30,268 € 1,513 € 78,261 € 53
2047 5% 30,767 € 1,538 € 82,295 € 54
2048 5% 31,275 € 1,564 € 86,480 € 55
2049 5% 31,791 € 1,590 € 90,823 € 56
2050 5% 32,315 € 1,616 € 95,329 € 57
2051 5% 32,849 € 1,642 € 100,003 € 58
2052 5% 33,391 € 1,670 € 104,852 € 59
2053 5% 33,942 € 1,697 € 109,880 € 60
2054 5% 34,502 € 1,725 € 115,095 € 61
2055 5% 35,071 € 1,754 € 120,501 € 62
2056 5% 35,650 € 1,782 € 123,831 € 63
2057 5% 36,238 € 1,812 € 127,232 € 64
2058 5% 36,836 € 1,842 € 130,706 € 65
2059 5% 37,443 € 1,872 € 134,255 € 66
2060 5% 38,061 € 1,903 € 137,880 € 67
2061 - year of retirement: FAP (DAV 1994) 266.6 68
monthly life-time annuity 517.18 €
average monthly net wage in 2060 2,134 €
net replacement rate of annuity 24.2%
size of the
2nd pillar - as
% of gross
wage
average
gross annual
wage net of
entry fee
assets
accumulated at
the end of year
Conservative fund Moderate fund Agressive fund
annual
payments
into the
2nd pillar
x 0.05.
. .
x 0.05
..
.
x 0.05
..
.
x 1.0472
x 1.0313
..
.
x 1.0126
4.72%3.13%
1.26%

51
We also take into consideration the fact that people are expected to live longer lives in the
future. This is taken into account by characterizing the future retirees as being younger than
they really are at the point of retirement. This so-called “adjustment of age” is taken into
account according to the figures presented in the table below. For example, the factor for
annuity pricing for individuals born between 1.1.1982 and 31.12.1988 will be calculated as if
they were 64 (68-4=64) years old instead of 68 years at the point of retirement, which will
manifest in a larger factor and consequently lower life-time annuity since they are expected to
receive pension benefits for a longer period than the individuals born before them.
Table 8. Adjustment of Age for Male Individuals According to the Date of Birth
Date of birth Adjustment of age
01.01.1967 - 31.12.1973 -2
01.01.1974 - 31.12.1981 -3
01.01.1982 - 31.12.1988 -4
01.01.1989 - 31.12.1996 -5
01.01.1997 - 31.12.2003 -6
01.01.2004 - 31.12.2010 -7
Source: Banka Koper, Pokojninski načrt odprtega vzajemnega
pokojninskega sklada Banke Koper d.d. za individualno
zavarovanje, 2010, p. 27.
We follow the second pillar individual accounts of typical male pension beneficiaries that
start working and retire at different points in time. For example individuals that are aged 34
and 24 at the time of the enactment of the reform (2016) will have different second pillar
account dynamics throughout their careers since they are bound to have different participation
periods in the second pillar. Consequently, we follow these individuals separately since they
retire at different points in time and have different net replacement levels of pensions. We
assume that a typical male pension beneficiary starts working at the age of 23 and retires at
the age of 68, while receiving an economy average wage throughout his entire 45 years long
career. This implies that his net replacement rate from PAYG pillar is equal to the accrual
rate, which for a male that has worked for 45 years totals to 63.5%. Naturally, this net
replacement rate from the PAYG pillar is proportionally reduced in accordance to the lifetime
participation in the PAYG pillar (in terms of % of contributions paid) but is enhanced with
annual life-time annuity based on assets accumulated in the second pillar funds which is
determined at the point of retirement. We assume that both PAYG pensions and life-time
annuities are indexed 100% to inflation on annual basis, which implies that the total pension
is constant in real terms throughout one’s entire retirement period. The alternative option
would be to assume 0% indexation of life-time annuities, which would yield a substantially
higher initial replacement rate (𝑖 would be much higher than 0.5%) that would eventually
seriously erode in real terms. Therefore, we argue that the first option is much more realistic
since the net replacement rate reflects the purchasing power of the total pension (PAYG and
second pillar combined) throughout one’s entire retirement period.

52
3.4 Results
We present the results under varying assumptions. Namely, we explore how the financial
structure (PAYG pension expenditures and PAYG pension contributions in relation to GDP)
and the generosity (net replacement rates) of the reformed multipillar system changes in
relation to the size of the mandatory second pillar, which is measured as percentage points of
gross wage dedicated to the second pillar funds. Therefore, we decided to work with six
different hypothetical situations which assume five different second pillar sizes (2%, 4%, 6%,
8% and 10% of gross wage) and one with no second pillar (0% of gross wage). Additionally
we assume that a country might choose to implement a mandatory second pillar gradually.
Therefore we assume two different scenarios. The first one, labeled as one-step scenario,
assumes an immediate implementation of second pillar in its full size, while the second
scenario assumes phasing-in the second pillar, in which case the second pillar starts at 0.5%
of gross wage and is gradually expanded by 0.5 percentage points annually until it reaches its
target level.
Figure 10. Projections of the PAYG Pension Contributions under Different Second Pillar
Sizes in the Period 2015-2060, One-Step Scenario
As previously explained, the introduction of mandatory second pillar is accompanied by
transition costs since the portion of PAYG pension contributions previously used to finance
PAYG pension expenditures are funneled into second pillar funds and part of the old-system
obligations cannot be serviced from the current contributions. This reduction of PAYG
pension contributions is displayed in Figure 10 and Figure 11, which clearly indicate that in
0%
1%
2%
3%
4%
5%
6%
7%
8%
9%
10%
2015 2020 2025 2030 2035 2040 2045 2050 2055 2060
PA
YG
pe
nsi
on
co
ntr
ibu
tio
ns
as
a s
har
e o
f G
DP
Year
0%
2%
4%
6%
8%
10%

53
the initial phase of the reform the transition costs are higher in the one-step scenario due to
the higher percentage of gross wage going into the second pillar funds compared to the phase-
in scenario. In both cases the reduction of PAYG pension contributions is proportionally
increased with the size of the second pillar.
Figure 11. Projections of the PAYG Pension Contributions under Different Second Pillar
Sizes in the Period 2015-2060, Phase-in Scenario
Due to the reduction of the PAYG pension contributions, however, PAYG pension
expenditures also start to decline as pensioners that were part of the mandatory second pillar
start to retire. As it can be seen from the Figure 12 and Figure 13, this happens with a
substantial time lag since the cohorts, which were 44 years old at the time of the enactment of
the reform, need some 20 years to retire. As expected the decline of PAYG pension
expenditures is more pronounced in the one-step scenario due to the higher share of
contributions dedicated to the second pillar compared to the phase-in scenario. By the same
token, notwithstanding the underlying scenario, the larger second pillar sizes translate into
lower PAYG pension expenditures towards the end of the forecast horizon.
0%
1%
2%
3%
4%
5%
6%
7%
8%
9%
10%
2015 2020 2025 2030 2035 2040 2045 2050 2055 2060
PA
YG
pe
nsi
on
co
ntr
ibu
tio
ns
as
a s
har
e o
f G
DP
Year
0%
2%
4%
6%
8%
10%

54
Figure 12. Projections of the PAYG Pension Expenditures under Different Second Pillar
Sizes in the Period 2015-2060, One-Step Scenario
Figure 13. Projections of the PAYG Pension Expenditures under Different Second Pillar
Sizes in the Period 2015-2060, Phase-in Scenario
Furthermore, we analyze the fiscal costs of introducing a mandatory multipillar pension
system. We observe the annual differences between PAYG pension contributions and PAYG
pension expenditures under different second pillar sizes and implementation scenarios, which
in fact represent the state pension fund’s deficits by year. We label such deficits as additional
annual fiscal burden of the pension system. The total fiscal burden of the system is calculated
6%
7%
8%
9%
10%
11%
12%
2015 2020 2025 2030 2035 2040 2045 2050 2055 2060
PA
YG
pe
nsi
on
exp
en
dit
ure
s a
s a
sh
are
of
GD
P
Year
0%
2%
4%
6%
8%
10%
6%
7%
8%
9%
10%
11%
12%
2015 2020 2025 2030 2035 2040 2045 2050 2055 2060
PA
YG
pe
nsi
on
exp
en
dit
ure
s a
s a
shar
e o
f G
DP
Year
0%
2%
4%
6%
8%
10%

55
as the sum of annual differences between PAYG pension contributions and PAYG pension
expenditures throughout the forecast horizon. Each annual difference is expressed as a share
of contemporaneous GDP, which is assumed to grow in average by 3.67% nominally. This
implies that the annual fiscal burdens are dicounted by the same factor, which is in the range
of the risk free rate usually used in corporate evaluation indutry practice (3-4%). Total fiscal
burden of the system, however, is not equal to the transition cost of introducing a mandatory
second pillar. Namely, the transition cost is calculated by subtracting the total fiscal burden of
a system without the mandatory second pillar (0% of gross wage) from total fiscal burden of
the system with the implemented mandatory second pillar (2, 4, 6, 8 or 10% of gross wage).
In such a manner, we eliminate the costs which would have occurred even if the mandatory
second pillar had not been introduced.
The differences between PAYG pension contributions and PAYG pension expenditures are
graphically depicted in Figure 14 and Figure 15 for one-step and phase-in scenario
respectively. These figures clearly show that the burden borne by the central state budget
increases immensely with the second pillar size. In the period from 2016 to about 2035, the
annual fiscal burdens of the pension system are much lower in the phase-in scenario;
however, as the second pillar starts to mature towards the end of the forecast period the
one-step scenario becomes fiscally favorable as compared to the phase-in scenario. Although
the phasing-in strategy immensely reduces the initial transition costs of the reform it also
complicates design options and makes the second pillar’s target size susceptible to changing
political constellations. It is also noteworthy that the economic benefits of the one-step
scenario are potentially larger, which is shown in the figures further below.
Figure 14. Difference between the PAYG Pension Contributions and the PAYG Pension
Expenditures under Different Second Pillar Sizes in the Period 2015-2060, One-Step Scenario
-6%
-5%
-4%
-3%
-2%
-1%
0%
2015 2020 2025 2030 2035 2040 2045 2050 2055 2060
Dif
fere
nce
as
a sh
are
of
GD
P
Year
0%
2%
4%
6%
8%
10%

56
Figure 15. Difference between the PAYG Pension Contributions and the PAYG Pension
Expenditures under Different Second Pillar Sizes in the Period 2015-2060, Phase-in Scenario
Figure 16 displays the total fiscal burden of the reformed pension system under different
implementation scenarios and second pillar sizes. Obviously, the total fiscal burden of the
pension system is smaller under the phase-in scenario. The difference between the one-step
and phase-in scenario is negligible for the smallest second pillar size (2% of gross wage),
whereas in case we assume the largest second pillar size (10% of gross wage), this difference
amounts to 23% of GDP. More precisely, the total fiscal burden of introducing the second
mandatory pillar in its largest size under the one-step scenario would amount to 190% of GDP
throughout the 45 year long forecast period, a fiscal burden that is hard to reconcile with.
Nevertheless, this figure is lower than the anticipated total fiscal burden of the current PAYG
system presented in the first section in Figure 2 (in Figure 16 labeled as unreformed PAYG),
which is projected to exceed the limit of 200% of GDP in the same period. However, even if
we assume that the government decides not to introduce the mandatory second pillar but
nevertheless implements the parametric reform of the PAYG system presented in this thesis,
the total fiscal burden of such system (0% of gross wage) would still be substantial (77% of
GDP). Altogether, assuming one-step scenario, the transition cost of introducing the
mandatory second pillar in the form of 10% of gross wage would translate to 113% of GDP
(190-77=113). However, it is important to stress that the introduction of mandatory second
pillar results in a substantial increase in net replacement rates on which we elaborate further
below.
-6%
-5%
-4%
-3%
-2%
-1%
0%
2015 2020 2025 2030 2035 2040 2045 2050 2055 2060
Dif
fere
nce
as
a s
har
e o
f G
DP
Year
0%
2%
4%
6%
8%
10%

57
Figure 16. Cumulative Difference between PAYG Pension Contributions and PAYG Pension
Expenditures for Unreformed PAYG System and Reformed PAYG System under Different
Second Pillar Sizes (2-10%) and One with no Second Pillar (0%) in the Period 2016-2060
It is also important to note that this is not the total transition cost of introducing the mandatory
second pillar. Namely, the transition period lasts over many generations and ends when the
last member of the switching generation dies. In our case we assume that this happens way
beyond our forecast horizon, in the year 2080. At the same time this means that the projected
PAYG pension expenditures will continue to decrease until 2080 when the vast majority of
the pensioners that were part of the PAYG-only system for at least a year are expected to die.
We elaborate on this issue in the final part of this section, where we explore the issue of fiscal
sustainability in detail.
Figures 17 to 19 show the projections of the net replacement rates at retirement for typical
male pension beneficiaries choosing between three different funds (conservative, moderate
and aggressive fund) characterized by different average yields and different risk profile.
Individuals who enter the labor force for the first time in 2016 are assumed to be 23 years old
and are expected to work for 45 years until 2061. Therefore, in order to present the net
replacement rates of individuals that were part of the second pillar throughout their entire
working careers (individuals entering retirement from 2061 onwards) we extend the forecast
period until 2065.
Despite the fact that we assume that pension funds charge management fees (1% annually)
and entry fees (3%) up to the maximum legal limit, the results are nevertheless staggering.
For example, assuming a mid-sized second pillar (6% of gross wage) and one-step scenario, a
typical male pension beneficiary that chooses a moderate fund is expected to enjoy a net
replacement rate of 77% from 2061 onwards, whereas in case he chooses an aggressive fund
his net replacement rate is set to exceed 90%. These differences are significant, and one can
-77% -99% -121%
-141% -160%
-177%
-77% -99%
-122% -145%
-168%
-190%
-202%
-250%
-200%
-150%
-100%
-50%
0%
0% 2% 4% 6% 8% 10%Unreformed
PAYG
Cu
mu
lati
ve d
iffe
ren
ce a
s a
shar
e o
f G
DP
Second pillar size
Phase-in scenario One-step scenario

58
clearly observe how important it is to decide on a proper investment strategy in terms of a
portfolio structure.
Figure 17. Projections of Net Replacement Rates at Retirement for Typical Male Pension
Beneficiaries Choosing a Conservative Fund in the Period 2016-2065 under Different Second
Pillar Sizes
Figure 18. Projections of Net Replacement Rates at Retirement for Typical Male Pension
Beneficiaries Choosing a Moderate Fund in the Period 2016-2065 under Different Second
Pillar Sizes
In all cases, regardless of the second pillar size or the chosen fund, the multipillar net
replacement rates are higher than those of the reformed PAYG-only system (0% of gross
wage) throughout the entire forecast period. As expected, the net replacement rates under the
one-step scenario are higher than under the phase-in scenario, where the magnitude of this
difference is positively influenced by the riskiness of the chosen fund. Having in mind that
individuals’ main motivation is to reach the net replacement rate of 70% suggested by the

59
OECD, a government should be inclined to implement a mandatory second pillar larger than
2% (measured as % of gross wage) assuming individuals predominantly choose a moderate
fund. Finally, it should be noted that the wave-like shapes of the net replacement rate curves
are caused by the use of the adjustment of age factors which account for the increasing
longevity of future retirees.
Figure 19. Projections of Net Replacement Rates at Retirement for Typical Male Pension
Beneficiaries Choosing an Aggressive Fund in the Period 2016-2065 under Different
Second Pillar Sizes
We also take into account that the future retirees might be concerned that their total pension
benefits will be predominantly delivered through second pillar accounts, which are exposed to
market risks. However, the sensitivity analysis (varying fund choice and second pillar size)
shows that in most cases the predominant part of the pension is delivered through PAYG
pillar irrespective of the implementation scenario. Assuming a mid-sized second pillar (6% of
gross wage), a typical male pension beneficiary that chooses to participate in the moderate
fund throughout his entire career will have approximately 2/3 of its total pension delivered
through the PAYG system, whereas in case he chooses an aggressive fund this share is
reduced to almost ½ of the total pension (see Figure 20).
Additionally, we verify the sensitivity of the net replacement rates to different costs which are
charged by the investment funds. In particular, we explore what happens in case investment
funds decide to increase or decrease management or entry fees. As it is evident from
Figure 21 the net replacement rates are much more sensitive to management fees. Namely,
entry fees in the amount of 1-6% have very limited influence on the net replacement rates,
whereas the management fee in the amount of 3% almost completely offsets the benefits of
the second pillar accounts assuming a moderate fund yield. Such outcome is expected since
management fees effectively reduce the fund’s yield, while entry fees on the other hand
merely reduce the value of the payments earmarked for the second pillar accounts. Having in
mind the importance of this issue we argue that the government should be motivated to lower

60
the legal limit below the rate of 1% currently allowed for charging the management fees in
case of introduction of the mandatory second pillar.
Figure 20. Decomposition of the Net Replacement Rates at Retirement for Typical Male
Pension Beneficiaries Paying 6% of Gross Wage into the Second Pillar in the Period
2016-2065, One-Step Scenario
Figure 21. Projections of Net Replacement Rates at Retirement According to Different
Transaction Costs for Typical Male Pension Beneficiaries Choosing a Moderate Fund in the
Period 2016-2065 and Paying 6% of Gross Wage into the Second Pillar, One-Step Scenario
3.4.1 Participation requirement
Finally, we take into consideration that the government might contemplate setting a different
age limit as a participation requirement for the mandatory second pillar, which we initially
assumed to be 45 years of age. We alternate this assumption by changing the age limit to 35
and 55 years of age and observe the differences in relation to the results presented above.
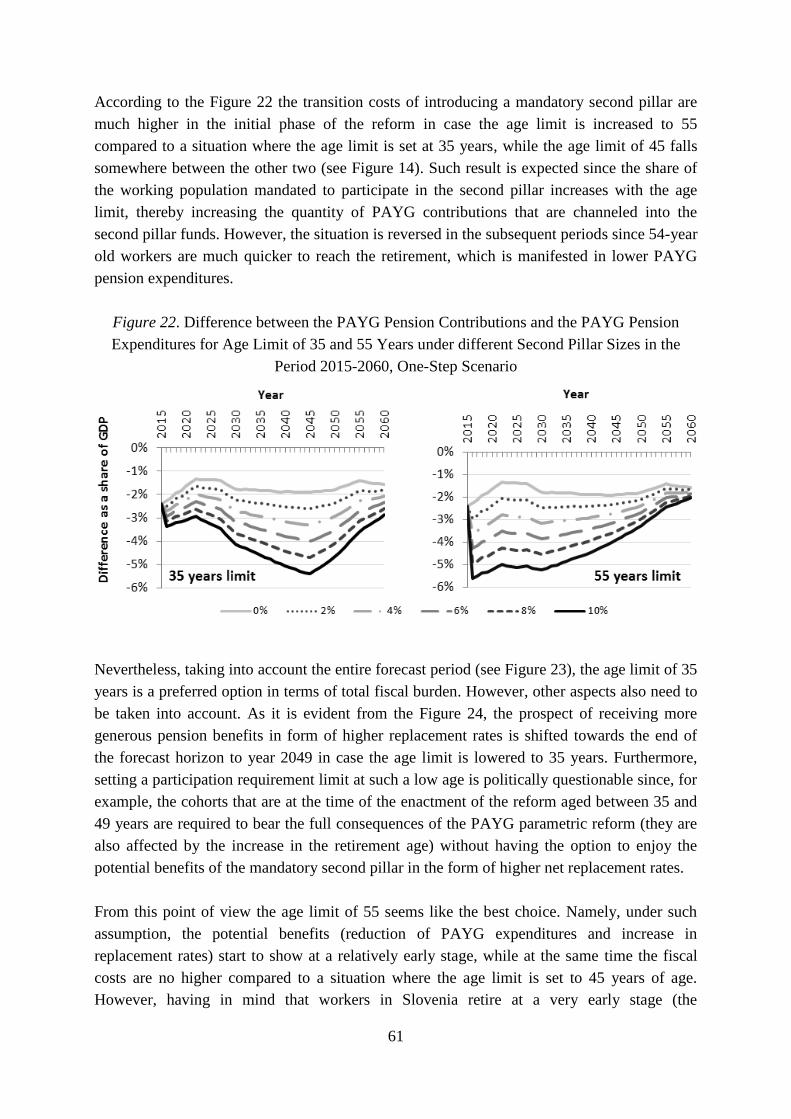
61
According to the Figure 22 the transition costs of introducing a mandatory second pillar are
much higher in the initial phase of the reform in case the age limit is increased to 55
compared to a situation where the age limit is set at 35 years, while the age limit of 45 falls
somewhere between the other two (see Figure 14). Such result is expected since the share of
the working population mandated to participate in the second pillar increases with the age
limit, thereby increasing the quantity of PAYG contributions that are channeled into the
second pillar funds. However, the situation is reversed in the subsequent periods since 54-year
old workers are much quicker to reach the retirement, which is manifested in lower PAYG
pension expenditures.
Figure 22. Difference between the PAYG Pension Contributions and the PAYG Pension
Expenditures for Age Limit of 35 and 55 Years under different Second Pillar Sizes in the
Period 2015-2060, One-Step Scenario
Nevertheless, taking into account the entire forecast period (see Figure 23), the age limit of 35
years is a preferred option in terms of total fiscal burden. However, other aspects also need to
be taken into account. As it is evident from the Figure 24, the prospect of receiving more
generous pension benefits in form of higher replacement rates is shifted towards the end of
the forecast horizon to year 2049 in case the age limit is lowered to 35 years. Furthermore,
setting a participation requirement limit at such a low age is politically questionable since, for
example, the cohorts that are at the time of the enactment of the reform aged between 35 and
49 years are required to bear the full consequences of the PAYG parametric reform (they are
also affected by the increase in the retirement age) without having the option to enjoy the
potential benefits of the mandatory second pillar in the form of higher net replacement rates.
From this point of view the age limit of 55 seems like the best choice. Namely, under such
assumption, the potential benefits (reduction of PAYG expenditures and increase in
replacement rates) start to show at a relatively early stage, while at the same time the fiscal
costs are no higher compared to a situation where the age limit is set to 45 years of age.
However, having in mind that workers in Slovenia retire at a very early stage (the

62
employment rate of workers aged 55-59 was only 50% in 2014), switching to the mandatory
second pillar for those that are few years away from retirement might be harmful. Namely,
mandating participation at 55 years of age might prove to be injurious for a portion of the
population since the second pillar accounts need longer time to mature and the transaction
costs caution against operating second pillar accounts that are worth only few thousand euros.
Figure 23. Cumulative Difference between the PAYG Pension Contributions and the PAYG
Pension Expenditures for Age Limit of 35, 45 and 55 Years under Different Second Pillar
Sizes in the Period 2016-2060, One-Step Scenario
Figure 24. Projections of Net Replacement Rates at Retirement for Age Limit of 35 and 55
Years under Different Second Pillar Sizes for Typical Male Pension Beneficiaries Choosing a
Moderate Fund in the Period 2015-2065, One-Step Scenario
-98% -120%
-141% -162%
-184%
-77% -99% -122%
-144%
-167%
-189%
-202%
-99% -122%
-145% -168%
-190%
-250%
-200%
-150%
-100%
-50%
0%
0% 2% 4% 6% 8% 10%Unreformed
PAYG
Cu
mu
lati
ve d
iffe
ren
ce a
s a
sh
are
of
GD
P Second pillar size
35 years 55 years 45 years

63
Altogether, we argue that the government should set an age limit at 45 years as a participation
requirement of the new system. Those aged 44 years or less should be automatically enrolled
in the multipillar system, while those aged between 45 and 54 years should be given a choice
between staying in a reformed PAYG-only system and switching to a multipillar system. By
doing so the government would strike a right balance between transition costs and economic
benefits of the multipillar reform, while simultaneously giving the option to older individuals
to participate in the new system.
3.4.2 Long-term fiscal sustainability of the reformed system
The analysis presented above clearly shows, that total fiscal burden caused by the introduction
of the mandatory second pillar would be very high. Below, we analyze exactly how much of
this fiscal burden would actually translate into fiscal deficits of the central government
budget. We analyze the fiscal sustainability of the reformed multipillar system compared to
the existing PAYG pension system of Slovenia, which is labeled as unreformed PAYG
system further below.
As already explained above, we assume that the transition period of introducing the
mandatory second pillar extends to year 2080, when the last member of the switching
generation is expected to die. Therefore, in order to analyze full effects of such introduction,
we extend the forecast period until 2090. We assume PAYG pension expenditures and PAYG
pension contributions to remain constant as a share of GDP from 2060 onwards (10.87% and
9.32% of GDP respectively in case of a reformed PAYG system; 15.28% and 9.07% of GDP
under the unreformed PAYG system). In simulating financial position we assume that the
central government budget is capable of subsidizing the state pension fund in the amount of
2.5% of GDP annually throughout the whole forecast horizon (actual difference between
PAYG pension expenditures and PAYG pension contributions in 2014). The annual excess of
PAYG expenditures over the combination of PAYG contributions and general government
subsidy is interpreted as the annual fiscal deficit of the pension system.
We compare the current (unreformed) PAYG pension system of Slovenia with the reformed
PAYG system, proposed in the thesis, for which we assume five different second pillar sizes
(2%, 4%, 6%, 8% and 10% of gross wage) and one with no second pillar (0% of gross wage).
According to Figure 25 the current PAYG system is expected to negatively influence the
fiscal position of Slovenia from 2028 onwards. If no changes to the current pension system
are made the total cumulative fiscal deficit of the unreformed PAYG system would amount to
200% of GDP until 2090 (see Figure 26). On the other hand, reforming the PAYG system
without implementing the mandatory second pillar (0%) would completely restore the fiscal
sustainability of the PAYG pension system. Moreover, the projections predict that the
reformed system is set to generate substantial surpluses throughout the whole forecast
horizon, which would accumulate to the total fiscal surplus in the amount of 64% of GDP by
2090. Even the implementation of the mandatory second pillar in the size of 10% of gross

64
wage, which is accompanied by substantial transition costs, beats the unreformed PAYG
system in terms of total cumulative fiscal deficit by a substantial margin (-42% compared
to -200% of GDP; see Figure 26). Furthermore, Figure 25 clearly indicates that the
introduction of the mandatory second pillar (combined with reformed PAYG pillar) in the
size of 10% of gross wage becomes fiscally favorable compared to a reformed PAYG system
without the mandatory second pillar (0%) from 2071 onwards. Coupled with previous results,
which clearly indicate that introduction of mandatory second pillar vastly improves net
replacement rates, we can conclude that such system would ultimately become superior both
in terms of fiscal sustainability and generosity of the pension system. Such long-term benefit,
however, comes at a price manifested in the form of high transition cost, which is represented
as the space between the 0% and 10% line in Figure 25.
Figure 25. Annual Fiscal Deficits/Surpluses of Unreformed PAYG System and Reformed
PAYG System without (0%) and with Second Pillar (10%) in the Period 2016-2090, One-Step
Scenario
-5%
-4%
-3%
-2%
-1%
0%
1%
2%
20
16
20
19
20
22
20
25
20
28
20
31
20
34
20
37
20
40
20
43
20
46
20
49
20
52
20
55
20
58
20
61
20
64
20
67
20
70
20
73
20
76
20
79
20
82
20
85
20
88A
nn
ual
fis
cal d
efi
cit/
surp
lus
as a
sh
are
of
GD
P
Year
0%
10%
Unreformed PAYG

65
Figure 26. Cumulative Fiscal Deficits/Surpluses of Unreformed PAYG System and Reformed
PAYG System under Different Second Pillar Sizes (2-10%) and One with No Second Pillar
(0%) in the Period 2016-2090, One-Step Scenario
CONCLUSION
For decades scholars have been warning the public about forthcoming radical demographic
changes, but unfortunately this did not receive much attention among policymakers.
Resolving these issues means elevating taxes or cutting benefits to individuals, which does
not appeal to the public and especially to politicians, whose planning horizons stretch only
until the next elections. In the meantime, demographic situation has become so aggravated
that taking immediate action is necessary. Therefore, it comes to no surprise that the issue of
population ageing is becoming one of the central issues facing not only Slovenia but the
whole European Union and many other countries around the globe as well.
Realizing that single-pillar PAYG pension systems will become unsustainable over the
coming decades as a consequence of imminent population ageing, a number of European
countries decided to reform their pension systems and Slovenia was no exception. However,
taking into account the current pension system of Slovenia and forthcoming demographic
dynamics, PAYG pension expenditures are expected to increase to almost 16% of GDP until
2050, which is fiscally unsustainable. Furthermore, we believe that under the current
circumstances the supplementary second pillar will not be able to offset the projected fall in
PAYG pensions. Therefore, in order to prevent the widespread old-age poverty we argue that
the Slovenian government should consider implementing a mandatory second pillar.
64%
43%
21%
0%
-21%
-42%
-200%
-250%
-200%
-150%
-100%
-50%
0%
50%
100%
0% 2% 4% 6% 8% 10% UnreformedPAYG
Cu
mu
lati
ve f
isca
l de
fici
t/su
rplu
s as
a s
har
e o
f G
DP
Second pillar size

66
In the master thesis we have provided reasons and methods for successful implementation of
the mandatory second pillar in the multipillar pension system. Aside from boosting retirement
income, the introduction of mandatory second pillar can have positive effects on output
through higher aggregate saving, lower labor market distortions and through more efficient
financial markets. However, the materialization of these positive externalities depends heavily
on a proper institutional set-up. We argue in favor of centralizing the administration of
multipillar system in a clearinghouse model with independent privately-owned second pillar
funds. Additionally, we have examined the choices for a new mandatory second pillar with
respect to its size, implementation methods, annuitization of accumulated assets,
administration and participation requirements.
However, the introduction of mandatory second pillar is accompanied with substantial
transition costs as the portion of the PAYG pension contributions used for financing current
pension benefits is funneled into second pillar funds. Therefore, we have paid special
attention to the relationship between the benefits and the corresponding transition costs
related to the second pillar implementation. In particular, we have analyzed the sensitivity of
financial structure and the generosity of the multipillar system to different second pillar sizes,
implementation scenarios and participation requirements.
We have found out that the transition costs represent a major obstacle for the introduction of
the mandatory second pillar in the Slovenian pension system. In particular, the transition cost
of implementing the mandatory second pillar in its largest size under the one-step scenario
would amount to 113% of GDP throughout the 45 year long forecast period, a fiscal burden
that is hard to reconcile with. Nevertheless, the transition costs are substantially reduced if we
consider smaller second pillar sizes and phasing-in rather than instantly implementing second
pillar in its full size. Naturally, such measures immensely reduce the potential benefits of the
system, emphasizing the trade-off relationship between the high replacement rates at one end
and the low transition costs at the other. Therefore, we stress the importance of conducting a
thorough cost-benefit analysis which needs to weigh the benefits, and their probability,
against the anticipated fiscal costs of such implementation.
We have also compared the long term fiscal sustainability of the proposed multipillar system
with the unreformed PAYG system currently at force. We have confirmed our presumption
that the fiscal sustainability of the multipillar reform increases as we extend the forecast
horizon further into the future (in our case to year 2090). The results clearly show that the
unreformed PAYG system is expected to negatively influence the fiscal position of Slovenia
from 2028 onwards, resulting in an aggregate deficit of 200% of GDP throughout 75 years
long forecast period, while reforming the PAYG system without implementing the mandatory
second pillar completely restores the fiscal sustainability of the PAYG pension system.
Moreover, the introduction of the mandatory second pillar in its largest size becomes fiscally
favorable compared to a reformed PAYG system without the mandatory second pillar from
2071 onwards. At the same time, having in mind the beneficial effects of mandatory second

67
pillar introduction on net replacement rates, we can conclude that such system would
ultimately become superior both in terms of fiscal sustainability and generosity of the pension
system. Such long-term benefit, however, comes at a price in the form of high transition cost.
In addition, we have revealed the significant upside in yield potential when choosing among
different portfolio structures. Namely, the results are also provided for different asset
allocation decisions stemming from individuals’ different risk preferences. The impact of the
second pillar on net replacement rates is staggering irrespective of the fact that we use
conservative assumptions regarding transaction costs charged by management funds.
Assuming a mid-sized second pillar (6% of gross wage) and one-step scenario, an individual
that chooses a moderate fund is expected to enjoy a net replacement rate of 77%, whereas an
individual that chooses an aggressive fund is expected to see its net replacement rate boosted
to 91%. The differences are significant, and one can clearly observe how important it is to
decide on a proper investment strategy in terms of a portfolio structure. Additionally, we
acknowledge that the higher yield potential should be associated with higher risk. However,
due to the complexity of implementing the volatility model in the life-cycle investment
portfolio, we consider this complicated manner to go beyond the scope of this thesis.
We also bear in mind that individuals’ main motivation is to reach the net replacement rate of
70% suggested by the OECD and that their primary concern might be that the future pension
benefits will be predominantly delivered through the second pillar accounts, which are
exposed to market risks. Taking the two issues into account and assuming that individuals
predominantly choose a moderate fund, we argue that the government should be inclined to
implement a mandatory second pillar in the size of 4-8% of gross wage. Additionally, we
suggest setting the participation requirement at 45 years of age, while simultaneously
enabling older cohorts to choose between staying in a reformed PAYG-only system and
switching to a newly established multipillar system. Such regulation, in our opinion, strikes an
optimal balance between the transition costs and the economic benefits of the multipillar
reform, while simultaneously giving the option to older individuals to participate in the new
system.

68
REFERENCE LIST
1. Abel, A. B., Mankiw, N. G., Summers, L. H., & Zeckhauser, R. J. (1989). Assessing
dynamic efficiency: Theory and evidence. The Review of Economic Studies, 56(1), 1-19.
2. Agencija za trg vrednostnih papirjev. (2014, January 1). ATVP sestava premoženja
vzajemnih pokojninskih skladov [ATVP asset structure of mutual pension funds].
Retrieved May 30, 2015, from http://www.a-
tvp.si/Documents/PodatkovnoOgledalo/VPS.pdf
3. Agencija za zavarovalni nadzor. (2014). Poročilo Agencije za zavarovalni nadzor za leto
2013 [Report of the Insurance supervision Agency for 2013]. Ljubljana: Agencija za
zavarovalni nadzor.
4. Ahčan, A., Medved, D., Pitacco, E., Sambt, J., & Sraka, R. (2012). Slovenian Annuity
Tables. ECONOMIC AND BUSINESS REVIEW, 13(4), 251-272.
5. Antolin, P. (2008, August 1). Pension Fund Performance. OECD Working Papers on
Insurance and Private Pension, no. 20, OECD Publishing. Retrieved May 30, 2015, from
http://www.oecd-ilibrary.org/finance-and-investment/pension-fund-
performance_240401404057
6. Augusztinovics, M. (2002). Issues in pension system design. International Social Security
Review, 55(1), 21-35.
7. Bank of Slovenia (2014). Financial Stability Review 2014. Ljubljana: Bank of Slovenia.
8. Banka Koper (2010). Pokojninski načrt odprtega vzajemnega pokojninskega sklada Banke
Koper d.d. za individualno zavarovanje [Pension plan for mutual pension fund of Banka
Koper for individual insurance]. Retrived May 30, 2015, from http://www.banka-
koper.si/Doc/pdf-
ji/POKOJNINSKI%20NA%C4%8CRT%20OVPS%2001_oktober%202010.pdf
9. Barr, N. (2002). Reforming pensions: myths, truths, and policy choices. International
Social Security Review, 55(2), 3-36.
10. Berk Skok, A. (2012). Predlog zasnove in uvedbe P-računov v tretjem pokojninskem
stebru [Proposal for the design and introduction of P-accounts in the third pension pillar].
Ljubljana: Ekonomska fakulteta.
11. Berk Skok, A., & Simoneti, M. (2010). Pokojninsko varčevanje in razvojne priložnosti
trga kapitala v Sloveniji. In M., Simoneti, Razvojne priložnosti trga kapitala v Sloveniji po
finančni krizi [Developing capital markets after the financial crisis in Slovenia] (pp. 195-
224). Ljubljana: Institute for Economic Research.
12. Berk Skok, A., Čok, M., Košak, M., & Sambt, J. (2013a). CEE Transition from PAYG to
Private Pensions: Income Gaps and Asset Allocation. Czech Journal of Economics and
Finance, 63(4), 360-381.
13. Berk Skok, A., Čok, M., Košak, M., & Sambt, J. (2013b). The Role of Asset Allocation
Decisions in Planning for a Private Pension: The Case of Slovenia. Economic and
Business Review, 15(2), 79-112.
14. Bertranou, F., Calvo, E., & Bertranou, E. (2009). Is Latin America Retreating from
Individual Retirement Accounts? MPRA Paper No. 17422.

69
15. Bodie, Z., Kane, A., & Marcus, J.A. (2009). Investments (8th ed.). New York: McGraw-
Hill.
16. Bole, V. (1998). Financing the transition of the public pension system in Slovenia.
Ljubljana: Ekonomski institut Pravne fakultete.
17. Bonin, H., Raffelhüschen, B., & Walliser, J. (2000). Can immigration alleviate the
demographic burden? FinanzArchiv: Public Finance Analysis, 57(1), 1-21.
18. Cerarjeva zaveza o uskladitvi pokojnin leta 2016 [Cerar’s commitment on the indexation
of pensions in 2016]. (2015, March 30). Delo. Retrieved May 30, 2015, from
http://www.delo.si/novice/politika/cerarjeva-zaveza-o-uskladitvi-pokojnin-leta-2016.html
19. Chlon, A., Góra, M., & Rutkowski, M. (1999). Shaping pension reform in Poland:
Security through Diversity (No. 20852). Washington: The World Bank.
20. Coeurdacier, N., & Rey, H. (2013). Home bias in open economy financial
macroeconomics. Journal of Economic Literature, American Economic Association,
51(1), 63-115.
21. Corsetti, G., & Schmidt-Hebbel, K. (1997). Pension Reform and Growth. In Salvador
Valdes-Prieto, ed., The Economics of Pensions: Principles, Policies, and International
Experience. Cambridge: Cambridge University Press.
22. Čok, M., Košak, M., Berk Skok, A., & Sambt, J. (2010). Dolgoročni pomen 2.
pokojninskega stebra [The long-term significance of second pension pillar]. Ljubljana:
Ekonomska fakulteta.
23. Čok, M., Sambt, J., Berk, A. S., & Košak, M. (2008). Long-term sustainability of the
Slovenian pension system. Economic and business review, 10(4), 271-288.
24. Dimson, E., Marsh, P., & Staunton, M. (2002). Triumph of the Optimists. 101 Years of
Global Investment Returns. Princeton: Princeton University Press.
25. Dorfman, M., Hinz, R., & Robalino, D. (2008, December 18). The Financial Crisis and
Mandatory Pension Systems in Developing Countries: Short-and Medium-term
Responses. MPRA Paper No. 12254. Retrieved May 30, 2015, from http://mpra.ub.uni-
muenchen.de/12254/
26. Du, C. C., Muysken, J., & Sleijpen, O. (2011, October 29). Economy wide risk
diversification in a three-pillar pension system. Retrieved May 30, 2015, from
http://econpapers.repec.org/paper/unmumamet/2010055.htm
27. Égert, B. (2012). The Impact of Changes in Second Pension Pillars on Public Finances in
Central and Eastern Europe. OECD Economics Department Working Papers, No. 942.
OECD Publishing.
28. European Commission (DG ECFIN), & Economic Policy Committee (AWG) (2012). The
2012 Ageing Report: Economic and budgetary projections for the 27 EU Member States
(2010-2060). Brussels: European Commission.
29. European Commission. (2012, February 16). WHITE PAPER: An Agenda for Adequate,
Safe and Sustainable Pensions. Retrieved May 30, 2015, from: http://eur-
lex.europa.eu/LexUriServ/LexUriServ.do?uri=COM:2012:0055:FIN:EN:PDF
30. European Commission. (2014). The 2015 Ageing Report: Underlying Assumptions and
Projection Methodologies. Brussels: European Commission.

70
31. Eurostat. (n.d.). EUROPOP 2013 – Population projections at national level. Retrieved
May 30, 2015, from
http://appsso.eurostat.ec.europa.eu/nui/show.do?dataset=proj_13npms&lang=en
32. Ferber, M. A., & Simpson, P. (2009). Whither systemic reform? A critical review of the
literature on the distributional and income adequacy effects of systemic pension
reforms. Management Revue, 20(3), 254-267.
33. French, K. R., & Poterba, J. M. (1991). Investor diversification and international equity
markets. American Economic Review, 81(2), 222–226.
34. Garrett, A. T., & Rhine, M. R. (2005). Social Security versus Private Retirement
Accounts: A historical Analysis. Federal Reserve of St. Louis Review, 87 (2, Part 1), 103-
121.
35. Gruber, J., & Wise, D. A. (1999). Social security and retirement around the world.
University of Chicago Press.
36. Gruber, J., & Wise, D. A. (2005). Social Security programs and retirement around the
world: Micro-estimation. ILR Review, 58(2), 86.
37. Gruber, J., & Wise, D. A. (2007). Social security programs and retirement around the
world: Fiscal implications of reform. University of Chicago Press.
38. Holzmann, R. (1997). On the Economic Benefits and Fiscal Requirements of Moving
from Unfunded to Funded Pensions. In The Future of the Welfare State: Challenges and
Reforms (pp. 121–63). Brussels: European Commission.
39. Holzmann, R. (2002). Can Investments in Emerging Markets Help to Solve the Ageing
Problem? Journal of Emerging Market Finance, 1(2), 215-241.
40. Holzmann, R. (2012). Global pension systems and their reform: Worldwide drivers, trends
and challenges. International Social Security Review, 66(2), 1-29.
41. Holzmann R., & Hinz R. (2005). Old-Age Income Support in the 21st Century: An
International Perspective on Pension Systems and Reform. Washington: World Bank.
42. Holzmann, R., Hinz, R. P., & Dorfman, M. (2008). Pension systems and reform
conceptual framework. SP Discussion Paper, No. 0824. Washington: The World Bank.
43. Holzmann, R., Palacios, R. J., & Zviniene, A. (2004). Implicit pension debt: Issues,
measurement and scope in international perspective (Vol. 403). Washington: The World
Bank.
44. Impavido, G., Musalem, A. R., & Tressel, T. (2001). Contractual savings institutions and
banks' stability and efficiency. World Bank Policy Research Working Paper, (2751).
Washington: The World Bank.
45. Impavido, G., Musalem, A. R., & Tressel, T. (2003). The impact of contractual savings
institutions on securities markets. World Bank Policy Research Working Paper, (2948).
Washington: The World Bank.
46. Impavido, G., & Rocha, R. D. R. (2006). Competition and performance in the Hungarian
second pillar. World Bank Policy Research Working Paper, (3876). Washington: The
World Bank.
47. Jacquier, E., Kane, A., & Marcus, A. J. (2003). Geometric or arithmetic mean: A
reconsideration. Financial Analysts Journal, 59(6), 46-53.

71
48. James, E., Smalhout, J., & Vittas, D. (2001). Administrative Costs and the Organization of
Individual Account Systems: A Comparative Perspective. Private Pension Systems:
Administrative Costs and Reforms, 17-83.
49. Knell M. (2010). The Optimal Mix Between Funded and Unfunded Pension Systems
When People Care About Relative Consumption. Economica, 77, 710-733.
50. Kraigher, T. (2005). Srednjeročna in dolgoročna projekcija demografskega razvoja
Slovenije in njegovih socialno- ekonomskih komponent [Middle- and Long Term
Projection of Demographic Development of Slovenia and its Socio-economic
Components]. Ljubljana: Institute of Macroeconomic Analysis and Development.
51. Levy, H., & Sarnat, M. (1970). International diversification of investment portfolios. The
American Economic Review, 60(4), 668-675.
52. Lindeman, D. C., Rutkowski, M., & Sluchynskyy, O. (2000). The Evolution of Pension
Systems in Eastern Europe and Central Asia: Opportunities, Constraints, Dilemmas and
Emerging Practices. Washington: The World Bank.
53. Lundbergh, S., Laros, R., & Rebel, L. (2013, October). Developments in European
Pension Regulation: Risks and Challenges. Pension Research Council Working Paper No.
2013-2. Retrived May 30, 2015, from
http://papers.ssrn.com/sol3/papers.cfm?abstract_id=2337230
54. Lusardi, A., & Mitchell, S. O. (2007). Baby Boomer retirement security: The roles of
planning, financial literacy, and housing wealth. Journal of Monetary Economics, 54 (1),
205-224.
55. Lutz, W., Schebrov, S., & Sanderson, W. C. (2013). The end of world population growth
in the 21st century: New challenges for human capital formation and sustainable
development. New York: Routledge.
56. Majcen, B., & Verbič, M. (2009). The Slovenian pension system in the context of
upcoming demographic developments. In Pension Reform in Southeastern Europe (p.
73-87). Washington: The World Bank.
57. Malkiel, G.B. (2007). A Random Walk Down Wall Street. New York: Norton.
58. MDDSZ. (2009). Modernization of the pension system in the republic of Slovenia: safe
age for all generations. Ljubljana: Ministrstvo za delo, družino in socialne zadeve.
59. MDDSZ. (2014, April 18). Učinki pokojninske reforme in nadaljnji koraki [The effects of
the pension reform and further steps]. Retrieved May 30, 2015, from
http://www.mddsz.gov.si/fileadmin/mddsz.gov.si/pageuploads/dokumenti__pdf/dpd/Anali
za.PIZ.pdf
60. Mora, M. (2005). Pension reform in the Czech Republic: ageing rapidly, reforming
slowly. ECFIN Country Focus, 2(7), 1-6.
61. MSCI. (2015). MSCI world stock indices. Retrived February 30, 2015, from:
http://www.mscibarra.com/products/indices/
62. Muenz, R. (2007). Aging and Demographic Change in European Societies: Main Trends
and Alternative Policy Options. Washington: The World Bank.
63. Müller, K. (2003). Privatising old-age security: Latin America and Eastern Europe
compared. Northampton: Edward Elgar Publishing.

72
64. Murphy, P. L., & Musalem, A. R. (2004). Pension funds and national saving (Vol. 3410).
World Bank Publications.
65. Naczyk, M., & Domonkos, S. (2014, December 14). The Global Financial Crisis and
Changing Coalitional Dynamics in East European Pension Privatization. SSRN. Retrieved
May 30, 2015, from http://papers.ssrn.com/sol3/papers.cfm?abstract_id=2549715
66. Nickel, C., & Almenberg, J. (2006). Ageing, pension reforms and capital market
development in transition countries (No. 99). European Bank for Reconstruction and
Development.
67. OECD. (2009a). OECD Private Pensions Outlook 2008. OECD Publishing, Paris.
68. OECD. (2009b). Pensions at a Glance 2009: Retirement-Income Systems in OECD
Countries. Paris: OECD Publishing.
69. OECD. (2013). Pensions at a Glance 2013: OECD and G20 Indicators. Paris: OECD
Publishing.
70. OECD. (2014). OECD Pensions Outlook 2014. Paris: OECD Publishing.
71. Ooghe, E., Schokkaert, E., & Flechet, J. (2003). The incidence of social security
contributions: An empirical analysis. Empirica, 30(2), 81-106.
72. Orenstein, M. A. (2011). Pension privatization in crisis: Death or rebirth of a global policy
trend? International Social Security Review, 64(3), 65-80.
73. Packard, T. (2002). Is There a Positive Incentive Effect from Privatization Social
Security? – A Panel Evidence from Latin America. Journal of Pensions Economics and
Finance, 1(2).
74. Palacios, R., & Rocha, R. (1998). The Hungarian Pension System in Transition. Social
Protection Discussion Paper No. 9805. Washington: The World Bank.
75. Pension and Disability Insurance Act (PDIA-1999). Official Gazette of the RS no.
106/1999.
76. Pension and Disability Insurance Act (PDIA-2012). Official Gazette of the RS no.
96/2012.
77. Pravilnik o izračunu povprečne donosnosti do dospetja državnih vrednostnih papirjev
[Rules on the calculation of the average yield to maturity of government securities].
(2005). Uradni list RS [Official Gazette of the RS] št. 120/05 in 66/08.
78. Prescott, E. C. (2004). Why Do Americans Work So Much More Than Europeans? FRB
Minneaplis - Quarterly Review, 28(1), 2-14.
79. Prva osebna zavarovalnica, d.d. (2014). Revidirano letno poročilo za 2013 [Audited
annual report for 2013]. Ljubljana: Prva osebna zavarovalnica.
80. Rocha, R. R., Vittas, D., & Rudolph, H. P. (2011). Annuities and other retirement
products: Designing the payout phase. Washington: The World Bank.
81. Sambt, J. (2008). Analiza občutljivosti demografskih projekcij za Slovenijo na
predpostavke glede rodnosti, smrtnosti in migracij [Sensitivity analysis of the Slovenian
population projections on assumptions about fertility, mortality and migrations].
In Slovenian Demographic Challenges in the 21st Century: Proceedings of the 11th
International Multiconference Information Society-IS 2008, October 13th-14th, 2008:
volume B.

73
82. Sambt, J., & Čok, M. (2008). Demographic Pressure on the Public Pension
System. Informatica (Slovenia), 32(2), 103-109.
83. Siegel, J. J. (2002). Stocks for the Long Run (3rd ed). New York: McGraw-Hill.
84. Simonovits, A. (2011). The Mandatory Private Pension Pillar in Hungary: An Obituary.
International Social Security Review, 64(3): 81–98.
85. SKUPNA pokojninska družba d.d., Ljubljana. (2011). Revidirano letno poročilo za
poslovno leto 2010 [Audited annual report for the financial year 2010]. Ljubljana: Skupna
pokojninska družba.
86. SKUPNA pokojninska družba d.d., Ljubljana. (2014). Revidirano letno poročilo za
poslovno leto 2013 [Audited annual report for the financial year 2013]. Ljubljana: Skupna
pokojninska družba.
87. Slovenski državni holding, d.d. (n.d.). Upravljanje naložb – sestava portfelja [Investment
management - the composition of the portfolio]. Retrieved March 10, 2015, from:
http://www.sdh.si/sl-si/upravljanje-nalozb/sestava-portfelja
88. Stanovnik, T. (2002). “The Political Economy of Pension Reform in Slovenia.” In
Pension Reform in Central and Eastern Europe. Volume 2: Restructuring of Public
Pension Schemes: Case Studies of the Czech Republic and Slovenia, ed. E. Fultz, 19-74.
Budapest: International Labour Organization, Central and Eastern European Team.
89. Stanovnik, T. (2004). “The Pension System of Slovenia after the 1999 Reform:
Developments and Challenges.” Paper prepared for the tripartite conference Recent
Developments in Pension Restructuring in Central and Eastern Europe. International
Labour Organization, Budapest.
90. Stanovnik, T., & Prevolnik Rupel, V. (2014, March). Country Document Update 2014:
Pensions, health and long-term care – Slovenia. Retrieved May 30, 2015, from
file:///C:/Users/6910p/Downloads/SI_asisp_CD14%20(3).pdf
91. Statistical Office of the Republic of Slovenia. (n.d.). Average monthly earnings and index
of average monthly earnings by activities (NACE Rev. 2), Slovenia, monthly. Retrieved
May 30, 2015, from
http://pxweb.stat.si/pxweb/Dialog/varval.asp?ma=0701011S&ti=&path=../Database/Dem
_soc/07_trg_dela/10_place/01_07010_place/&lang=2
92. Statistical Office of the Republic of Slovenia. (n.d.). Gross domestic product, Slovenia,
annually. Retrived December 22, 2014, from
http://pxweb.stat.si/pxweb/Database/Ekonomsko/03_nacionalni_racuni/05_03019_BDP_l
etni/05_03019_BDP_letni.asp
93. Statistical Office of the Republic of Slovenia. (n.d.). Life expectancy at birth by sex,
Slovenia, annually. Retrieved May 30, 2015, from
http://pxweb.stat.si/pxweb/dialog/varval.asp?ma=H141E&ti=&path=..%2FDatabase%2F
Hitre_Repozitorij%2F&xu=&yp=&lang=1
94. Tapia, W., & Yermo, J. (2008, September). Fees in Individual Account Pension Systems:
A Cross-Country Comparison. OECD Working Papers on Insurance and Private
Pensions, No. 27, OECD Publishing. Retrieved May 30, 2015, from http://www.oecd-

74
ilibrary.org/finance-and-investment/fees-in-individual-account-pension-
systems_236114516708
95. The World Bank Pension Conceptual Framework. (2008). Word Bank Pension Reform
Primer. Washington: The World Bank.
96. The World Bank. (1994). Averting the old age crisis: Policies to protect the old and
promote growth. New York: Oxford University Press.
97. Thompson, L. H. (1998). Older and wiser: The economics of public pensions.
Washington: The Urban Institute.
98. Towers Watson (2015, February). Global Pension Assets Study 2015. Retrieved May 30,
2015, from file:///C:/Users/6910p/Downloads/Global-Pensions-Asset-Study-2015.pdf
99. Valdes‐Prieto, S. (2000). The financial stability of notional account pensions. The
Scandinavian Journal of Economics, 102(3), 395-417.
100. Van Rooij, M. C., Lusardi, A., & Alessie, R. J. (2012). Financial Literacy, Retirement
Planning and Household Wealth. The Economic Journal, 122(560), 449-478.
101. Volz, U. (2004). European financial integration and the financing of local businesses
in the new EU member states (No 89). European Bank for Reconstruction and
Development.
102. Werner, S. H. (2000). Why a funded pension system is useful and why it is not useful.
International Tax and Public Finance, 7(4), 389-410.
103. Zakon o obveznim mirovinskim fondovima. (2014). Narodne novine, Urbroj: 71-05-
03/1-14-2.
104. Zavod za pokojninsko in invalidsko zavarovanje Slovenije. (2009). Letno poročilo
2008 [Annual report 2008]. Ljubljana: Zavod za pokojninsko in invalidsko zavarovanje
Slovenije.
105. Zavod za pokojninsko in invalidsko zavarovanje Slovenije. (2011). Letno poročilo
2010 [Annual report 2010]. Ljubljana: Zavod za pokojninsko in invalidsko zavarovanje
Slovenije.
106. Zavod za pokojninsko in invalidsko zavarovanje Slovenije. (2013). Letno poročilo
2012 [Annual report 2012]. Ljubljana: Zavod za pokojninsko in invalidsko zavarovanje
Slovenije.
107. Zavod za pokojninsko in invalidsko zavarovanje Slovenije. (2014a). Letno poročilo
2013 [Annual report 2013]. Ljubljana: Zavod za pokojninsko in invalidsko zavarovanje
Slovenije.
108. Zavod za pokojninsko in invalidsko zavarovanje Slovenije. (2014b). Pokojninsko in
invalidsko zavarovanje v številkah [Pension and Disability insurance in numbers].
Ljubljana: Zavod za pokojninsko in invalidsko zavarovanje Slovenije.
109. Zavod za pokojninsko in invalidsko zavarovanje Slovenije. (2015). Letno poročilo
2014 [Annual report 2014]. Ljubljana: Zavod za pokojninsko in invalidsko zavarovanje
Slovenije.